The City of New York The City of New York Michael R. Bloomberg, Mayor Michael R. Bloomberg, Mayor Financial Plan Financial Plan Summary Summary Fiscal Years 2009 Fiscal Years 2009 — — 2013 2013 Office of Management and Budget Office of Management and Budget Mark Page, Director Mark Page, Director May 1, 2009 May 1, 2009

Welcome message from author
This document is posted to help you gain knowledge. Please leave a comment to let me know what you think about it! Share it to your friends and learn new things together.
Transcript

The City of New YorkThe City of New YorkMichael R. Bloomberg, MayorMichael R. Bloomberg, Mayor
Financial Plan Financial Plan SummarySummaryFiscal Years 2009 Fiscal Years 2009 —— 20132013
Office of Management and BudgetOffice of Management and BudgetMark Page, DirectorMark Page, Director
May 1, 2009May 1, 2009

TABLE OF CONTENTS
Financial Plan SummaryFiscal Years 2009 - 2013
I. Economic Update . . . . . . . . . . . . . . . . . . . . . . . . . . . . . . . . . . . . . . . . . . . . . . . . . . . 6
II. Budget Update . . . . . . . . . . . . . . . . . . . . . . . . . . . . . . . . . . . . . . . . . . . . . . . . . . . . . 12
III. Federal Stimulus . . . . . . . . . . . . . . . . . . . . . . . . . . . . . . . . . . . . . . . . . . . . . . . . . . . . 24
IV. Capital . . . . . . . . . . . . . . . . . . . . . . . . . . . . . . . . . . . . . . . . . . . . . . . . . . . . . . . . . . . . 28
V. Tables . . . . . . . . . . . . . . . . . . . . . . . . . . . . . . . . . . . . . . . . . . . . . . . . . . . . . . . . . . . . . 34

Exec10
OverviewOverview
New York City’s budget is balanced for the current Fiscal Year, FY 2009, and we are presenting a plan for balance for next Fiscal Year, FY 2010, which begins on July 1, 2009. Budget balance in FY 2009 and FY 2010 is supported by the boom year surpluses which we rolled forward, knowing that the boom times do not last forever. These boom year resources will come to an end with FY 2010 (See page 13).
The City’s economy continues to struggle along with the U.S. and world economies. We are forecasting that the City will lose 328,000 jobs during this recession, which is up from our forecast of 294,000 job losses just a few months ago. This includes the loss of 47,000 securities sector jobs (See pages 7-8). The real estate market has weakened in the City and the tourism sector of our economy is slower as well.
Our plan for balance in FY 2010 and to begin to address the gap in FY 2011 requires at least $1.4 billion of actions by the State and the City’s labor unions (See page 3). We have been taking actions to balance the FY 2010 budget since January 2008, when “irrational exuberance” started to cause concern. Since that time, City agencies have taken gap closing actions of over $3 billion to help budget balance in FY 2010 (See page 17), reducing headcount in FY 2010 by over 13,000 Citywide (See page 18). It also has been necessary to raise additional revenue from the City’s tax base because City revenues have dropped by almost $5 billion between FY 2008 and FY 2010 (See page 15). Our tax revenue forecast for FY 2010 has fallen by another $680 million since January.
The budget gap we are facing in FY 2011, even assuming that we get the help we need from Albany and organized labor, and assuming that the economy begins to recover next year, is $4.6 billion(See pages 13-14).

Exec10
OverviewOverview
Although uniform police headcount has fallen by approximately 3,400, crime has dropped nearly 40% since 2002, including by 13% year-to-date this year.
Fire deaths are at the lowest seven-year total in history.
High School graduation rates have increased by 22% since 2002.
Public school students have made double digit gains in reading and math since 2002, and the longstanding achievement gap between black and Hispanic students and their white peers is narrowing.
Major in-school crime is down more than 30%.
Our streets are the cleanest they have been in more than 30 years.
More than 500 acres of new parkland has been added to the City since 2002.
Average life expectancy is longer than ever.
Street homelessness is down 47% since the first-ever citywide count in 2005. In NYC, one in every 3,554 people is unsheltered. That compares to 1 in 282 in San Francisco.
Although City agencies have taken $3.4 billion of gap closing actions for FY 2010, we continue to provide the services which New Yorkers demand and deserve.

Exec10
Anticipated State and Labor ActionsAnticipated State and Labor Actions
Increase Sales Tax By 0.5% $552 $572
Repeal Sales Tax Clothing Exemption 394 409
Consumer Plastic Bag Use Fee 100 160
Subtotal – State Actions $1,046 $1,141
New Pension Tier for New Employees (Tier 5)* $200 $200
Health Care Cost Containment 200 200
10% Premium Contribution for Health Insurance - - - 357
Subtotal – Labor Actions $400 $757
Total $1,446 $1,898
FY 2010State Actions
Labor Actions
$ in Millions
*Also requires State action
FY 2011
3

Exec10
Measures for Slowing the Growth of the Uncontrollable Expenses RMeasures for Slowing the Growth of the Uncontrollable Expenses Require equire the Assistance of Our Partners in Organized Labor and the Statethe Assistance of Our Partners in Organized Labor and the State
Pensions – We continue to ask Albany (with the cooperation of the City’s Unions) for a new Tier 5 for new City employees which would eventually save the City cumulatively $7 billion by FY 2030. Annual savings of $200 million are included in the Financial Plan beginning in FY 2010.
Employee Health Benefits – Our plan relies on $200 million of savings annually from health care cost containment beginning in FY 2010. In addition, we will work with our partners in organized labor to secure a contribution from City employees toward the increasing cost of health benefits. A 10% contribution would generate over $350million in savings to the City beginning in FY 2011.
To date, we have not achieved these savings from Albany and the City’s Unions.
4

I. Economic Update
6

Exec10
The U.S. Is Now Expected to Lose a Total of 7.3 Million Jobs,2 Million More Than Our January Forecast
126
128
130
132
134
136
138
140
Q1 Q2 Q3 Q4 Q1 Q2 Q3 Q4 Q1 Q2 Q3 Q4 Q1 Q2 Q3 Q4
2007 2008 2009 2010
138.0
133.1
130.7
U.S. Total Employment in Millions of Jobs
Mill
ions
of J
obs
f f f f f f f
January 2009 Forecast
May 2009 Forecast
Source: U.S. Bureau of Labor Statistics, forecast OMBf = forecast
Calendar Year
7

Exec10
-120
-100
-80
-60
-40
-20
0
20
40
60
2000 2001 2002 2003 2004 2005 2006 2007 2008 2009 2010
Calendar Year
Q/Q
Cha
nge
- Tho
usan
dsThe City Is Now Expected to Lose 328,000 Jobs Through
the 3rd Quarter of CY 2010 (Including the Loss of 47,000 Securities Sector Jobs), Up from Our January Forecast of 294,000 Jobs
Source: NYS Department of Labor, OMBf = forecast
f f
Forecast
Change in NYC Total Employment
8
Exec10
-2.0%
0.0%
2.0%
4.0%
6.0%
8.0%
10.0%
12.0%
14.0%
1959 1966 1973 1980 1987 1994 2001 2008
U.S. Savings Rate
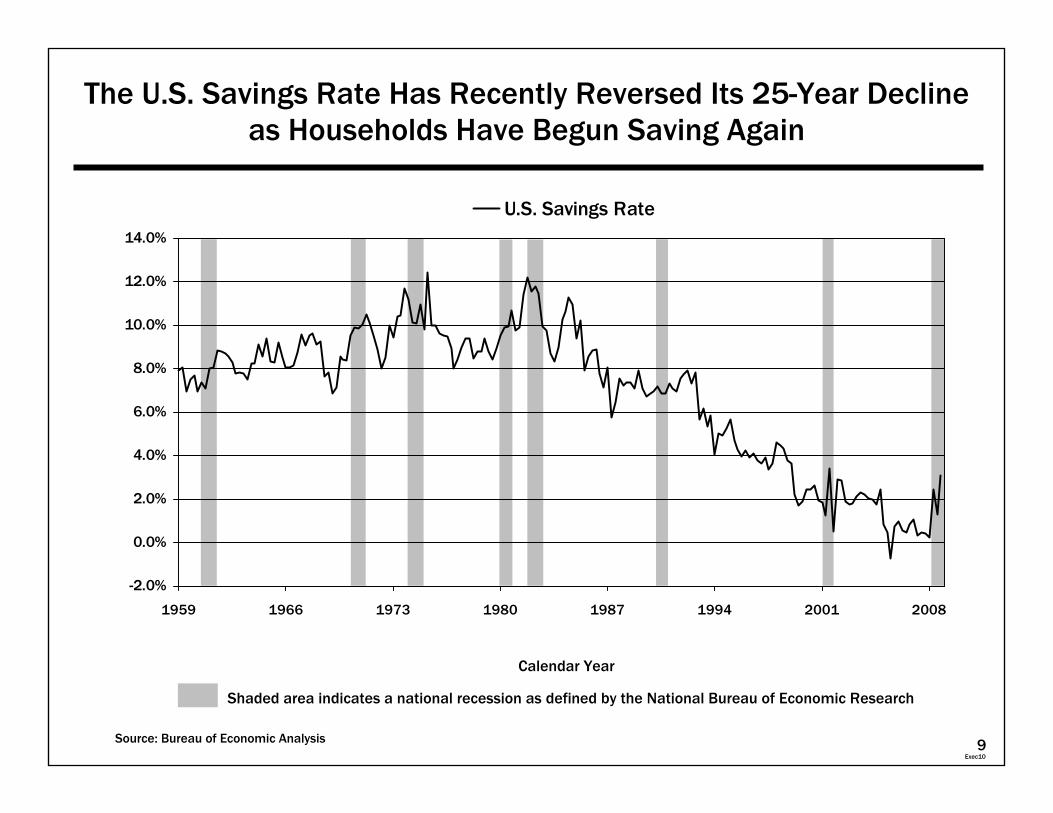
The U.S. Savings Rate Has Recently Reversed Its 25The U.S. Savings Rate Has Recently Reversed Its 25--Year DeclineYear Declineas Households Have Begun Saving Againas Households Have Begun Saving Again
Source: Bureau of Economic Analysis
Shaded area indicates a national recession as defined by the National Bureau of Economic Research
Calendar Year
9

Exec10
Consumer Sentiment Has Dropped Sharply,Consumer Sentiment Has Dropped Sharply,Resulting in a Decline in Retail SalesResulting in a Decline in Retail Sales
-12%
-10%
-8%
-6%
-4%
-2%
0%
2%
4%
6%
8%
Jan 07 Mar 07 May 07 Jul 07 Sep 07 Nov 07 Jan 08 Mar 08 May 08 Jul 08 Sep 08 Nov 08 Jan 09 Mar 09
Y/Y
Per
cent
Cha
nge
40
50
60
70
80
90
100
Index
Retail Sales - Left Scale
Consumer Sentiment - Right Scale
Source: Retail Sales-U.S. Census Bureau; Consumer Sentiment-University of Michigan 10

Exec10
Hotel Room Rates and Occupancy Rates Have Hotel Room Rates and Occupancy Rates Have Been Falling Since Last SummerBeen Falling Since Last Summer
50%
55%
60%
65%
70%
75%
80%
85%
90%
95%
100%
Jan 08 Feb 08 Mar 08 Apr 08 May 08 Jun 08 Jul 08 Aug 08 Sep 08 Oct 08 Nov 08 Dec 08 Jan 09 Feb 09
Occ
upan
cy R
ate
$200
$220
$240
$260
$280
$300
$320
$340
$360
$380
$400
$ P
er Night
Occupancy Rate - Left Scale Average Room Rate - Right Scale
Source: PKF Consulting, Data seasonally adjusted by OMB11

II. Budget Update
12

Exec10
$25
$30
$35
$40
$45
$50
$55
2001 2002 2003 2004 2005 2006 2007 2008 2009 2010 2011 2012 2013
Excluding the impact of rolls and debt defeasances
Revenue w/o Anticipated State Actions $27.4 $26.1 $29.4 $31.8 $36.1 $37.1 $42.0 $42.8 $40.3 $37.9 $40.4 $42.4 $44.2Expenses w/o Anticipated Labor Actions $27.7 $28.4 $28.7 $31.3 $34.4 $36.5 $39.9 $41.2 $42.6 $44.5 $47.4 $49.5 $51.7Operating Surplus / (Deficit) ($0.3) ($2.3) $0.7 $0.5 $1.7 $0.6 $2.1 $1.6 ($2.3) ($6.6) ($7.0) ($7.1) ($7.5)
Benefit of Anticipated State and Labor Actions (see page 3) $0.1 $1.5 $1.9 $2.0 $2.1Operating Surplus / (Deficit) ($2.2) ($5.1) ($5.1) ($5.1) ($5.4)Cumulative Surplus / (Deficit) $2.9 $0.6 $1.3 $1.8 $3.5 $4.1 $6.2 $7.8 $5.6 $0.5 ($4.6) ($9.7) ($15.1)
Revenue without Anticipated State Actions Expenses without Anticipated Labor Actions
Revenue and Expenses Without AnticipatedRevenue and Expenses Without AnticipatedState and Labor ActionsState and Labor Actions
May 2009 PlanMay 2009 Plan
City
Fun
ds -
$ in
Bill
ions
f = forecastFiscal Year
f f f f f
FY 01 FY 02 FY 03 FY 04 FY 05 FY 06 FY 07 FY 08 FY 09 FY 10 FY 12FY 11 FY 13
13

Exec10
June 2008Plan
May 2009Plan
ChangesSince
June 2008June 2008
PlanMay 2009
PlanJune 2008
PlanMay 2009
Plan
FY 2009 FY 2010 FY 2011
(1) Excludes the impact of prepayments and debt defeasances.(2) Includes current debt defeasance of $530 million.(3) Includes prior debt defeasances of $350 million, $1.254 billion, and $1.986 billion in FY 06 to FY 08 respectively, which impacts FY 07 to FY 10.
City Funds Changes Between June 2008 Plan City Funds Changes Between June 2008 Plan and May 2009 Planand May 2009 Plan
City Funds City Funds -- $ in Millions$ in Millions
RevenueWithout Anticipated State Actions(1) $39,877 $40,317 $440 $41,251 $37,926 ($3,325) $43,739 $40,416 ($3,323)(see page 15) Year-to-Year (2,959) (2,519) 1,374 (2,391) 2,488 2,490
Change: (6.9%) (5.9%) 3.4% (5.9%) 6.0% 6.6%
Expenditures(1)
Controllable Agency Expenses $20,971 $20,558 ($413) $22,048 $20,913 ($1,135) $23,351 $21,861 ($1,490)(see page 20) Year-to-Year 1,636 1,223 1,077 355 1,303 948
Change: 8.5% 6.3% 5.1% 1.7% 5.9% 4.5%
Debt Service 3,745 3,557 (188) 4,221 4,174 (47) 4,660 4,530 (130)Year-to-Year 153 (35) 476 617 439 356
Change: 4.3% (1.0%) 12.7% 17.3% 10.4% 8.5%
Non-Controllable Expenses 19,625 18,540 (1,085) 20,683 19,476 (1,207) 21,436 21,031 (405)(see page 21) Year-to-Year 1,323 238 1,058 936 753 1,555
Change: 7.2% 1.3% 5.4% 5.0% 3.6% 8.0%
Total ExpendituresWithout Anticipated Labor Actions $44,341 $42,655 ($1,686) $46,952 $44,563 ($2,389) $49,447 $47,422 ($2,025)
Year-to-Year 3,112 1,426 2,611 1,908 2,495 2,859Change: 7.5% 3.5% 5.9% 4.5% 5.3% 6.4%
Operating Surplus/(Deficit)Without Anticipated State and Labor Actions ($4,464) ($2,338) $2,126 ($5,701) ($6,637) ($936) ($5,708) ($7,006) ($1,298)
Current Year Roll (Cost)(2) (812) (3,026) (2,214) (350) (530) (180) - - - - - - - - -Prior Year Roll – Benefit(2) 4,635 4,635 - - - 812 3,026 2,214 350 530 180Net Impact of Prior Debt Defeasances(3) 641 641 - - - 2,695 2,695 - - - - - - - - - - - -
Benefit of Anticipated State and Labor Actions - - - 88 88 200 1,446 1,246 200 1,898 1,698(see page 3)Gap to be Closed $ - - - $ - - - $ - - - ($2,344) $ - - - $2,344 ($5,158) ($4,578) $580
ChangesSince
June 2008
ChangesSince
June 2008
14

Exec10
FY 2007(1) FY 2008 FY 2009f FY 2010f FY 2011f
Property Tax $12,958 $13,062 $14,408 $16,127 $17,173Year-to-Year 487 104 1,346 1,719 1,046
Change: 3.9% 0.8% 10.3% 11.9% 6.5%
Economically Sensitive Taxes $24,871 $24,602 $21,142 $17,202 $18,790Without Anticipated State Actions Year-to-Year 4,078 (269) (3,460) (3,940) 1,588(see next page) Change: 19.6% (1.1%) (14.1%) (18.6%) 9.2%
Subtotal - Tax Revenue $37,829 $37,664 $35,550 $33,329 $35,963Without Anticipated State Actions Year-to-Year 4,565 (165) (2,114) (2,221) 2,634
Change: 13.7% (0.4%) (5.6%) (6.2%) 7.9%
Non-Tax Revenue $4,175 $5,172 $4,767 $4,597 $4,453Without Anticipated State Actions Year-to-Year 361 997 (405) (170) (144)
Change: 9.5% 23.9% (7.8%) (3.6%) (3.1%)
Subtotal - City Revenue $42,004 $42,836 $40,317 $37,926 $40,416Without Anticipated State Actions Year-to-Year 4,926 832 (2,519) (2,391) 2,490
Change: 13.3% 2.0% (5.9%) (5.9%) 6.6%
Anticipated State Actions $88 $1,046 $1,141
Total Revenue $42,004 $42,836 $40,405 $38,972 $41,557Year-to-Year 4,926 832 (2,431) (1,433) 2,585
Change: 13.3% 2.0% (5.7%) (3.5%) 6.6%
City Revenue
Notes: Excludes the impact of prepayments and debt defeasances(1) Change from FY 2006 – data not shown.f = forecast
$ in Millions
15

Exec10
FY 2007(1) FY 2008 FY 2009f FY 2010f FY 2011f
Personal Income $7,920 $8,760 $7,146 $5,578 $6,409Year-to-Year 1,210 840 (1,614) (1,568) 831
Change: 18.0% 10.6% (18.4%) (21.9%) 14.9%
Sales 4,619 4,868 4,593 4,069 4,205Year-to-Year 201 249 (275) (524) 136
Change: 4.5% 5.4% (5.6%) (11.4%) 3.3%
Business $6,013 5,412 5,012 3,957 4,448Year-to-Year 1,670 (601) (400) (1,055) 491
Change: 38.5% (10.0%) (7.4%) (21.0%) 12.4%
Real Estate Transaction Taxes 3,293 2,546 1,346 1,088 1,200Year-to-Year 645 (747) (1,200) (258) 112
Change: 24.4% (22.7%) (47.1%) (19.2%) 10.3%
Other* 3,026 3,016 3,045 2,510 2,528Year-to-Year 352 (10) 29 (535) 18
Change: 13.2% (0.3%) 1.0% (17.6%) 0.7%
Total Economically Sensitive Taxes $24,871 $24,602 $21,142 $17,202 $18,790Year-to-Year 4,078 (269) (3,460) (3,940) 1,588
Change: 19.6% (1.1%) (14.1%) (18.6%) 9.2%
Note: Excludes the impact of prepayments, debt defeasances, and tax programs*Includes Tax Audits, Commercial Rent, Utility, Hotel, Cigarette and RPT STAR(1) Change from FY06 – data not shown.f = forecast
Economically Sensitive TaxesEconomically Sensitive TaxesDrop a Combined $7.4 Billion in FY 09 and FY 10Drop a Combined $7.4 Billion in FY 09 and FY 10
$ in Millions
16

Exec10
Since January 2008, We Have Taken $1.7 Billion of Agency ActionsSince January 2008, We Have Taken $1.7 Billion of Agency Actions for FY 2009, and for FY 2009, and $3.4 Billion of Agency Actions for FY 2010 to Help Close the Bud$3.4 Billion of Agency Actions for FY 2010 to Help Close the Budget Gap for FY 2010get Gap for FY 2010(1)(1)
Increases the Gap / (Decreases the Gap)Increases the Gap / (Decreases the Gap)
Uniformed ForcesPolice ($163) ($10) ($173) (4.6%) ($340) ($76) ($416) (10.9%)Fire (54) (11) (65) (4.8%) (103) (37) (140) (10.2%)Correction (30) - - - (30) (3.2%) (79) - - - (79) (8.4%)Sanitation (89) (23) (112) (8.6%) (114) (37) (151) (11.2%)
Health and WelfareAdministration for Children’s Services (77) - - - (77) (9.3%) (170) - - - (170) (20.7%)Social Services (65) (1) (66) (10.9%) (135) (1) (136) (22.1%)Homeless Services (32) - - - (32) (10.4%) (67) - - - (67) (21.4%)Youth & Community Development (13) - - - (13) (6.8%) (44) - - - (44) (22.8%)Health & Mental Hygiene (30) (9) (39) (11.3%) (66) (19) (85) (24.1%)
Other MayoralHousing Preservation & Development (8) (3) (11) (16.4%) (14) (3) (17) (25.0%)Finance (7) (40) (47) (22.4%) (22) (51) (73) (35.0%)Transportation (27) (29) (56) (13.5%) (47) (57) (104) (24.8%)Parks & Recreation (14) (17) (31) (11.3%) (41) (24) (65) (23.9%)Libraries (17) - - - (17) (5.4%) (72) - - - (72) (22.2%)Cultural Affairs (11) - - - (11) (7.1%) (34) - - - (34) (22.3%)Citywide Administrative Services (8) (27) (35) (19.8%) (15) (32) (47) (26.6%)All Other Agencies (216) (69) (285) (20.9%) (309) (72) (381) (28.5%)
Major OrganizationsEducation (479) - - - (479) (6.4%) (1,045) - - - (1,045) (13.3%)CUNY (10) - - - (10) (6.1%) (27) (9) (36) (22.3%)HHC - - - (5) (5) (5.8%) (9) (16) (25) (29.5%)
OtherProcurement Savings (56) - - - (56) (111) - - - (111)Consumer Plastic Bag Use Fee - - - - - - - - - - - - (84) (84)Data Mining to Improve Billing and Collection - - - (2) (2) - - - (25) (25)
Total Agency Programs ($1,406) ($246) ($1,652) (8.1%) ($2,864) ($543) ($3,407) (16.4%)
Fiscal Year 2009City Funds - $ in Millions
Fiscal Year 2010City Funds - $ in Millions
Expense Revenue Total Expense Revenue TotalPercentage Percentage
(1) vs. Budget.17

Exec10
Uniform ForcesPolice - Uniform - - - (2,067) (2,067) - - - - - - - - - - - - (2,067) (2,067)
- Civilian - - - (469) (469) (395) (125) (520) (395) (594) (989)Fire - Uniform - - - (451) (451) - - - - - - - - - - - - (451) (451)
- Civilian (3) (198) (201) - - - - - - - - - (3) (198) (201)Sanitation - Uniform - - - (222) (222) - - - - - - - - - - - - (222) (222)
- Civilian - - - (18) (18) - - - - - - - - - - - - (18) (18)Correction - Uniform - - - (832) (832) - - - - - - - - - - - - (832) (832)
- Civilian - - - (16) (16) - - - (72) (72) - - - (88) (88)Subtotal (3) (4,273) (4,276) (395) (197) (592) (398) (4,470) (4,868)
Health and Welfare:Social Services - - - (489) (489) - - - (164) (164) - - - (653) (653)Admin. For Children Services (608) (361) (969) - - - - - - - - - (608) (361) (969)Homeless Services (222) 7 (215) (88) (17) (105) (310) (10) (320)Health and Mental Hygiene (57) (2) (59) - - - (50) (50) (57) (52) (109)
Subtotal (887) (845) (1,732) (88) (231) (319) (975) (1,076) (2,051)Other Agencies:
Housing Preservation and Development - - - (51) (51) (28) (5) (33) (28) (56) (84)Environmental Protection - - - 12 12 - - - (3) (3) - - - 9 9Finance (17) 35 18 (26) - - - (26) (43) 35 (8)Transportation - - - - - - - - - - - - (104) (104) - - - (104) (104)Parks - - - (490) (490) - - - (115) (115) - - - (605) (605)Citywide Administrative Services - - - 64 64 - - - - -- - - - - - - 64 64All Other (52) (474) (526) (102) (140) (242) (154) (614) (768)
Subtotal (69) (904) (973) (156) (367) (523) (225) (1,271) (1,496)Department of Education:
Pedagogical* - - - (1,440) (1,440) - - - - - - - - - - - - (1,440) (1,440)Civilian (344) (131) (475) - - - - - - - - - (344) (131) (475)
Subtotal (344) (1,571) (1,915) - - - - - - - - - (344) (1,571) (1,915)Enhanced Agencies
Libraries (702) (148) (850) (241) - - - (241) (943) (148) (1,091)Cultural Institutions (321) - - - (321) (93) - - - (93) (414) - - - (414)Health and Hospitals Corporation - - - - - - - - - (130) (270) (400) (130) (270) (400)NYCHA (318) (888) (1,206) (12) (88) (100) (330) (976) (1,306)
Subtotal (1,341) (1,036) (2,377) (476) (358) (834) (1,817) (1,394) (3,211)
Total (2,644) (8,629) (11,273) (1,115) (1,153) (2,268) (3,759) (9,782) (13,541)
FY 2010 Headcount ReductionFY 2010 Headcount ReductionMay 2009 PlanNov 2008 and Jan 2009 Plans Total
Layoffs TotalAttrition Layoffs TotalAttrition Layoffs TotalAttrition
November and January Plan values restated to include reductions in Cultural Institutions, Libraries, NYCHA, and FTE’s for the Department of Parks and Recreation*Excludes January Plan reduction of 14,190 State funded positions that have been restored with Federal stimulus funds 18

Exec10
Police: Reduction of 125 Traffic “Management” Enforcement Agents ($5.0)
Fire: Reduction in Uniformed Administrative Overtime ($3.4)
Parks: Reduction in Seasonal Staff Equivalent to 115 Positions ($4.4)
DCAS: Renegotiation of City Leases ($2.0)
Libraries: 4% Reduction in Subsidies Equivalent to 241 Positions ($11.2)
DoITT: Renegotiation of Vendor Contracts ($4.8)
Sanitation: Reduced Waste Export Contract Costs ($6.5)
ACS: Eliminate 1,100 Low Priority Childcare Slots ($9.1)
Examples of New Agency Programs to Examples of New Agency Programs to Eliminate the Gap in FY 2010 in May 2009 PlanEliminate the Gap in FY 2010 in May 2009 Plan
Increase the Gap /(Decrease the Gap)
City Funds - $ In Millions
FY 2010Agency Programs
19

Exec10
Controllable Agency ExpensesControllable Agency Expenses(1)(1)
May 2009 PlanMay 2009 PlanCity Funds City Funds -- $ in Millions$ in Millions
FY 2007(2) FY 2008 FY 2009f FY 2010f FY 2011f
Uniformed ForcesPolice Department $3,461 $3,735 $4,027 $4,033 $4,146Fire Department 1,272 1,323 1,396 1,414 1,425Department of Correction 913 927 989 967 988Sanitation Department 1,145 1,206 1,244 1,272 1,376
Subtotal: Uniformed Forces $6,791 $7,191 $7,656 $7,686 $7,935Year- To-Year: 231 400 465 30 249
Change: 3.5% 5.9% 6.5% 0.4% 3.2%Health and Welfare
Social Services $512 $438 $566 $587 $592Children's Services 901 830 805 702 703Homeless Services 348 360 344 303 312Health and Mental Hygiene 589 570 660 610 620HHC Subsidy 80 128 95 86 86
Subtotal: Health and Welfare $2,430 $2,326 $2,470 $2,288 $2,313Year- To-Year: (121) (104) 144 (182) 25
Change: (4.7%) (4.3%) 6.2% (7.4%) 1.1%Other Mayoral
Housing Preservation & Development $74 $75 $82 $63 $57Environmental Protection 808 850 945 965 906Finance 201 210 216 224 222Transportation 358 422 473 446 446Parks and Recreation 250 277 278 256 254Citywide Administrative Services 179 196 213 223 228Labor Reserve 346 529 433 969 1,335All Other Mayoral 1,364 1,572 1,712 1,549 1,572Subtotal: Other Mayoral $3,580 $4,131 $4,352 $4,695 $5,020
Year -To-Year: 332 551 221 343 325Change: 10.2% 15.4% 5.3% 7.9% 6.9%
EducationDepartment of Education (see below) $4,852 $4,780 $5,160 $5,374 $5,762CUNY 411 445 457 418 408
Subtotal: Education $5,263 $5,225 $5,617 $5,792 $6,170Year -To-Year: 386 (38) 392 175 378
Change: 7.9% (0.7%) 7.5% 3.1% 6.5%Elected Officials
Mayoralty $63 $64 $68 $64 $64All Other Elected 378 398 395 388 359
Subtotal: Elected Officials $441 $462 $463 $452 $423Year- To-Year: 22 21 1 (11) (29)
Change: 5.3% 4.8% 0.2% (2.4%) (6.4%)
Total Controllable Agency Spending $18,505 $19,335 $20,558 $20,913 $21,861Year -To-Year: 850 830 1,223 355 948
Change: 4.8% 4.5% 6.3% 1.7% 4.5%
Department of Education $13,400 $14,311 $14,820 $15,242 $16,076(including State and Federal Funds) Year- To-Year: 790 911 509 422 834
Change: 6.3% 6.8% 3.6% 2.8% 5.5%
Note: Excludes the impact of prepayments; (1) Actual Change. (2) Change from FY 2006 – data not shown. f = forecast20

Exec10
FY 2002 FY 2007(1) FY 2008 FY 2009f FY 2010f FY 2011f
Non-Controllable Agency ExpensesPensions $1,334 $4,689 $5,571 $6,224 $6,535 $7,053
Excludes Anticipated Labor Actions Year-to-Year $3,355 $882 $653 $311 $518Change: 251.5% 18.8% 11.7% 5.0% 7.9%
Fringe Benefits $3,790 $5,340 $5,642 $5,810 $5,990 $6,462 Excludes Anticipated Labor Actions Year-to-Year $1,550 $302 $168 $180 $472
Change: 40.9% 5.7% 3.0% 3.1% 7.9%
Retiree Health Benefits Trust $1,500 $ - - - $ - - - ($82) ($395)
Employee-Related Costs $5,124 $11,529 $11,213 $12,034 $12,443 $13,120Year-to-Year $6,405 ($316) $821 $409 $677
Change: 125.0% (2.7%) 7.3% 3.4% 5.4%
Medicaid $3,537 $5,016 $5,621 $5,015 $4,773 $5,487Includes Federal Matching Percent Year-to-Year $1,479 $605 ($606) ($242) $714
for Medicaid Change: 41.8% 12.1% (10.8%) (4.8%) 15.0%
Re-estimate of Prior Year Expenses ($413) ($515) ($399) ($500) $ - - - $ - - -Year-to-Year ($102) $116 ($101) $500 $ - - -
Change: (24.7%) 22.5% (25.3%) 100.0% 0.0%
General Reserve $ - - - $ - - - $ - - - $40 $300 $300Year-to-Year $ - - - $ - - - $40 $260 $ - - -
Change: 0.0% 0.0% 0.0% 650.0% 0.0%
All Other(2) $1,560 $1,919 $1,867 $1,951 $1,960 $2,124Year-to-Year $359 ($52) $84 $9 $164
Change: 23.0% (2.7%) 4.5% 0.5% 8.4%
Subtotal Non-Controllable Expenses $9,808 $17,949 $18,302 $18,540 $19,476 $21,031Year-to-Year $8,141 $353 $238 $936 $1,555
Change: 83.0% 2.0% 1.3% 5.0% 8.0%
Anticipated Labor Actions $ - - - ($400) ($757)
Total Non-Controllable Expenses $9,808 $17,949 $18,302 $18,540 $19,076 $20,274Year-to-Year $8,141 $353 $238 $536 $1,198
Change: 83.0% 2.0% 1.3% 2.9% 6.3%
Debt Service $3,327 $3,454 $3,592 $3,557 $4,174 $4,530Includes Capital Reduction Year-to-Year $127 $138 ($35) $617 $356
Change: 3.8% 4.0% (1.0%) 17.3% 8.5%
Total Non-Controllable and Debt Service $13,135 $21,403 $21,894 $22,097 $23,250 $24, 804Year-to-Year $8,268 $491 $203 $1,153 $1,554
Change: 62.9% 2.3% 0.9% 5.2% 6.7%
NonNon--Controllable Agency Expenses and Debt ServiceControllable Agency Expenses and Debt ServiceCity Funds City Funds -- $ in Millions$ in Millions
(1) Change is 2002-2007 change. (2) Includes Public Assistance, Judgments & Claims, Indigent Defense Service, Contractual, Criminal Justice and Water & Sewer for City Facilities.
Note: Excludes the impact of prepayments and debt defeasances; f = forecast21

Exec10
$0
$2
$4
$6
$8
$10
$12
$14
$16
1997 1998 1999 2000 2001 2002 2003 2004 2005 2006 2007 2008 2009 2010 2011 2012 2013 2014 2015 2016
If the Current 20% Loss in Asset Value Continues, NYC RetirementIf the Current 20% Loss in Asset Value Continues, NYC Retirement SystemsSystems’’Employer Contributions (Direct City Budget Expense) Will IncreasEmployer Contributions (Direct City Budget Expense) Will Increase by $7.9 e by $7.9
Billion Through FY 2016 to Cover the Loss in Corpus ValueBillion Through FY 2016 to Cover the Loss in Corpus Value
Fiscal Year
f
$ in
Bill
ions
(1)Assumes 8% gains in each of the following years.Note: Includes all five systemsf = forecast
Additional NYC Pension Contribution Required if 20% Loss is Recognized as of June 30, 2009(1)
NYC Pension Contribution Based on Asset Value as of June 30, 2008(1)
Retiree Health Benefits
$6.4 $6.5 $6.5 $6.4$6.7$6.5$6.3$6.3
f f f f f f f
$1.6 $1.7$2.1 $2.3
$2.8$3.2
$1.9$2.6
$0.4$0.7
$1.1$1.4
$1.9
$2.4Payments to Retirees for Pensions(Not Direct City Budget Expense)
22

III. Federal Stimulus
24

Exec10
Federal Stimulus Has Enabled Us to Avoid the Teacher Layoffs Federal Stimulus Has Enabled Us to Avoid the Teacher Layoffs Associated with the Reduction in State Funding and Reduced the Associated with the Reduction in State Funding and Reduced the
CityCity’’s Cost for Medicaids Cost for Medicaid
*Subject to State FY 2010-2011 Appropriation
Federal Stimulus Funding FY 2009 – FY 2011
FY 2009 FY 2010 FY 2011
Education* - - - $952 $961
Medicaid - FMAP (based on State Allocation Formula) $447 $850 $295
Medicaid - FMAP (as intended in the Federal Stimulus) $614 $1,007 $514
Medicaid - FMAP Better / (Worse) ($167) ($157) ($219)
The City is receiving $543 million less in Medicaid - FMAP funding than intended in the Federal Stimulus
$ in Millions
25

Exec10
The New York City Housing Authority will benefit from $423 million of federal stimulus funding, which will support replacing and upgrading an additional 145 elevators across 11 developments, renovate and reconfigure 1,610 apartments at Whitman-Ingersoll Houses in Brooklyn, and create or preserve 2,399 jobs for New Yorkers
The Department of Homeless Services will benefit from almost $6 million of federal stimulus funding for shelters and services
The Department of Housing Preservation and Development will benefit from $26 million of federal stimulus funding for emergency building repairs, unsafe building demolitions and neighborhood preservation activities
An additional $278 million of federal stimulus funding is being used to support City capital projects, including $175 million for the reconstruction of ramps at the St. George Ferry Terminal
Federal Stimulus Funding Has Preserved and Augmented Other Programs in New York City
Examples of Programs Funded with Federal Stimulus
26

IV. Capital
28

Exec10
$0
$2
$4
$6
$8
$10
$12
$14
$16
$18
2002 2003 2004 2005 2006 2007 2008 2009 2010 2011 2012 2013 2014 2015 2016 2017 2018 2019
FY 2002 – 2019 Capital Commitments – All Funds
Note: Excludes the impact of prepayments and debt defeasancesf = forecast
f f f
Actuals Plan
f ff f f f f
Commitments Ten-Year Capital Strategy
Fiscal Year
$ in
Bill
ions
Historically, approximately 35% of City-funded capital projects are
rolled over from the current year to the next year.
The Capital Plan Includes a 27% Reduction in New York City General Obligationand New York City TFA Funded Capital Projects in FY 2010-2019
f
Capital Spending
29

Exec10
January 2009 Capital Plan Before Reduction 4.8% 3.4%
May 2009 Capital Plan After Reduction 3.5% 3.5%
Annual Average % Growth in
Debt Service Cost
Annual Average % Growth in
City Revenue
The Reduction in the TenThe Reduction in the Ten--Year Capital Plan FY 2010 Year Capital Plan FY 2010 –– FY 2019 Will ReduceFY 2019 Will Reducethe Longthe Long--Term Average Annual Growth in Debt ServiceTerm Average Annual Growth in Debt ServiceCosts to the Level of Forecast Growth in City RevenuesCosts to the Level of Forecast Growth in City Revenues
30
Exec10
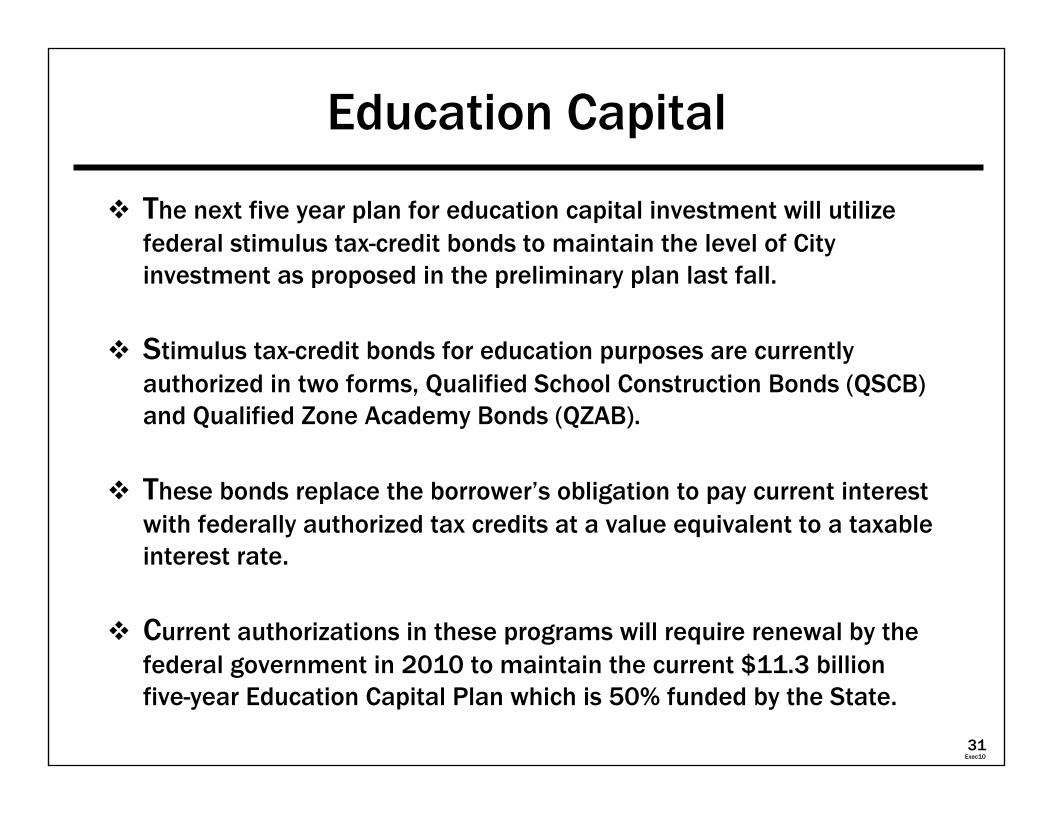
Education CapitalEducation Capital
The next five year plan for education capital investment will utilize federal stimulus tax-credit bonds to maintain the level of City investment as proposed in the preliminary plan last fall.
Stimulus tax-credit bonds for education purposes are currently authorized in two forms, Qualified School Construction Bonds (QSCB) and Qualified Zone Academy Bonds (QZAB).
These bonds replace the borrower’s obligation to pay current interest with federally authorized tax credits at a value equivalent to a taxable interest rate.
Current authorizations in these programs will require renewal by the federal government in 2010 to maintain the current $11.3 billionfive-year Education Capital Plan which is 50% funded by the State.
31

Exec10
The TenThe Ten--Year Capital Strategy 2010Year Capital Strategy 2010--20192019Totals $61.7 Billion in All FundsTotals $61.7 Billion in All Funds
Housing and Development $4.6
Mass Transit $0.6
Sanitation $2.1
Education $22.0(1)
21%
14% 3%
Environmental Protection $12.9
Bridges & Highways $8.9
Administration of Justice $3.1
Technology $2.7 Culturals & Libraries $0.6
Parks $1.4 Fire $0.6
Public Buildings $0.9 Social Services $0.5
Health & Hospitals $0.8
Other City Services $7.5
1%
5%
$ in Billions
8%
Infrastructure39%
GovernmentOperations
25%
Schools36%
12%
(1) 50% funded by the State. 32

Exec10
Highlights of the Capital Plan 2010Highlights of the Capital Plan 2010--20132013$ in Millions$ in Millions
New School Construction (25,000 seats in classrooms) $3,500
911/Emergency Communications Transformation Project 1,400
Street Resurfacing (2,800 lane miles) and Street Reconstruction (173 lane miles) 1,265
Continued Reconstruction of the Newtown Water Pollution Control Plant 738
Reconstruction of seven Belt Parkway Bridges (Mill Basin, Bay Ridge Avenue, Fresh Creek,Paerdegat Basin, Rockaway Parkway, Gerritsen Avenue & Nostrand Avenue) 773
Reconstruction of the Schoharie Reservoir/Gilboa Dam 480
Catskill/Delaware Ultra Violet Light Treatment Facility 402
Construction of the Hamilton Avenue, East 91st Street & Southwest Brooklyn Marine Transfer Stations 350
Willets Point Redevelopment 302
Energy Retrofit Projects in City Building 199
Modernization of Harlem Hospital Campus 170
Construction of the new Public Health Laboratory 133
Reconstruction of the City Island Bridge 120
Reconstruction of the Roosevelt Avenue Bridge over the Van Wyck Expressway 114
33

V. Tables
34

Exec10
UNIFORM AGENCIESPolice Department $4,033 $1,436 $2,058 $7,527 $456 - - - $43 $124 $67 $690 $8,217 $7,991 $7,651Fire Department 1,456 510 913 2,879 182 - - - 7 24 75 288 3,167 3,156 2,864Dept. of Correction 868 323 278 1,469 134 - - - 7 20 148 309 1,778 1,778 1,738Dept. of Sanitation 729 304 209 1,242 528 - - - 6 31 194 759 2,001 1,998 1,952
Subtotal $7,086 $2,573 $3,458 $13,117 $1,300 - - - $63 $199 $484 $2,046 $15,163 $14,923 $14,205HEALTH AND WELFARE
Administration for Children’s Services $404 $116 $52 $572 $2,411 - - - $3 $2 - - - $2,416 $2,988 $2,956 $924
Department of Social Services 717 270 106 1,093 1,052 6,503 6 4 59 7,624 8,717 8,709 6,319
Department of Homeless Services 121 37 16 174 751 - - - 1 1 - - - 753 927 805 387
Department of Health and Mental Hygiene 425 111 46 582 1,333 - - - 1 3 27 1,364 1,946 1,925 824
Health and Hospitals Corporation (1) - - - 22 - - - 22 217 - - - 5 190 124 536 558 453 226
Subtotal $1,667 $556 $220 $2,443 $5,764 $6,503 $16 $200 $210 $12,693 $15,136 $14,848 $8,680EDUCATION
Dept. of Education $9,708 $2,803 $2,313 $14,824 $5,248 - - - $21 $39 $852 $6,160 $20,984 $20,848 $10,462City University 377 83 46 506 258 - - - - - - 1 49 308 814 769 555
Subtotal $10,085 $2,886 $2,359 $15,330 $5,506 - - - $21 $40 $901 $6,468 $21,798 $21,617 $11,017OTHER AGENCIES $2,224 $691 $297 $3,212 $4,544 - - - $83 $198 $1,658 $6,483 $9,695 $8,720 $6,768ELECTED OFFICIALS $452 $108 $58 $618 $104 - - - $7 $1 - - - $112 $730 $726 $648MISC. BUDGET $433 - - - - - - $433 - - - $1,358 - - - - - - $283 $1,641 $2,074 $2,073 $1,742DEBT SERVICE COSTS
(unallocated) - - - - - - - - - - - - - - - - - - - - - - - - $114 $114 $114 $114 $95RE-ESTIMATE OF PRIOR
YEAR’S EXPENSES - - - - - - - - - - - - ($500) - - - - - - - - - - - - ($500) ($500) ($500) ($500)
TOTAL (3) $21,947 $6,814 $6,392 $35,153 $16,718 $7,861 $190 $638 $3,650 $29,057 $64,210 $62,521 $42,655
City Funds $12,389 $5,810 $6,224 $24,423 $7,509 $6,537 $181 $448 $3,557 $18,232 $42,655
Less: Prepayments - - - $460 - - - $460 ($54) ($1,076) - - - - - - $2,012 $882 $1,342 $1,342 $1,342Total After Prepayments $21,947 $6,354 $6,392 $34,693 $16,772 $8,937 $190 $638 $1,638 $28,175 $62,868 $61,179 $41,313
Other Than Personal Service CostsPersonal Service Costs
Fiscal Year 2009 BudgetFiscal Year 2009 Budget$ in Millions$ in Millions
Salaries & Wages
FringeBenefits Pensions
PSSubtotals
AgencyOTPS
PA, MA& Other
MandatesLegal
ServicesJudgments& Claims
DebtService
OTPSSubtotal
Gross Total
(IncludingIntra-City)
NetTotal
(ExcludingIntra-City)
AGENCY City FundsTotal
(1)Only reflects funding appropriated in the City’s Budget.(2)Includes subsidies to the MTA, General Reserve, Indigent Defense Services and Other Contractual Services.(3)Excludes the impact of prepayments and debt defeasances.
(2)
35

Exec10
Personal Service Costs Other Than Personal Service Costs
UNIFORM AGENCIESPolice Department $4,015 $1,440 $2,017 $7,472 $263 - - - $42 $131 $84 $520 $7,992 $7,764 $7,651Fire Department 1,450 511 910 2,871 129 - - - 7 25 82 243 3,114 3,103 2,901Dept. of Correction 845 326 261 1,432 125 - - - 7 21 172 325 1,757 1,757 1,724Dept. of Sanitation 742 315 201 1,258 527 - - - 6 33 232 798 2,056 2,054 2,015
Subtotal $7,052 $2,592 $3,389 $13,033 $1,044 - - - $62 $210 $570 $1,886 $14,919 $14,678 $14,291HEALTH AND WELFARE
Administration for Children’s Services $371 $116 $39 $526 $2,245 - - - $3 $2 - - - $2,250 $2,776 $2,770 $812
Department of Social Services 721 280 109 1,110 960 6,206 6 5 67 7,244 8,354 8,394 6,175
Department of Homeless Services 113 38 15 166 659 - - - 1 1 - - - 661 827 719 347
Department of Health and Mental Hygiene 406 112 49 567 1,192 - - - 1 3 35 1,231 1,798 1,795 787
Health and Hospitals Corporation (1) - - - 25 - - - 25 174 - - - 5 190 143 512 537 457 230
Subtotal $1,611 $571 $212 $2,394 $5,230 $6,206 $16 $201 $245 $11,898 $14,292 $14,090 $8,351EDUCATION
Dept. of Education $10,011 $2,967 $2,480 $15,458 $5,364 - - - $19 $40 $1,024 $6,447 $21,905 $21,773 $10,810City University 373 84 50 507 189 - - - - - - 1 52 242 749 736 521
Subtotal $10,384 $3,051 $2,530 $15,965 $5,553 - - - $19 $41 $1,076 $6,689 $22,654 $22,509 $11,331OTHER AGENCIES $2,154 $679 $310 $3,143 $4,070 - - - $73 $210 $1,847 $6,200 $9,343 $8,332 $6,764ELECTED OFFICIALS $420 $108 $59 $587 $88 - - - $5 $1 - - - $94 $681 $679 $635MISC. BUDGET $969 - - - - - - $969 - - - $1,873 - - - - - - $386 $2,259 $3,228 $3,228 $2,636DEBT SERVICE COSTS
(unallocated) - - - - - - - - - - - - - - - - - - - - - - - - $189 $189 $189 $189 $155RE-ESTIMATE OF PRIOR
YEAR’S EXPENSES - - - - - - - - - - - - - - - - - - - - - - - - - - - - - - - - - - - - - - -
TOTAL (3) $22,590 $7,001 $6,500 $36,091 $15,985 $8,079 $175 $663 $4,313 $29,215 $65,306 $63,705 $44,163
City Funds $12,787 $5,708 $6,335 $24,830 $7,962 $6,556 $168 $473 $4,174 $19,333 $44,163
Less: Prepayments - - - - - - - - - - - - $278 $275 - - - - - - $3,709 $4,262 $4,262 $4,262 $4,262
Total After Prepayments $22,590 $7,001 $6,500 $36,091 $15,707 $7,804 $175 $663 $604 $24,953 $61,044 $59,443 $39,901
Fiscal Year 2010 BudgetFiscal Year 2010 Budget$ in Millions$ in Millions
(1) Only reflects funding in the City’s Budget.(2) Includes subsidies to MTA, general reserve, indigent defense services and other contractual services.(3) Excludes the impact of prepayments and debt defeasances.
(2)
Salaries & Wages
FringeBenefits Pensions
PSSubtotals
AgencyOTPS
PA, MA& Other
MandatesLegal
ServicesJudgments& Claims
DebtService
OTPSSubtotal
Gross Total
(IncludingIntra-City)
NetTotal
(ExcludingIntra-City)
AGENCY City FundsTotal
36

Exec10
UNIFORM AGENCIESPolice Department ($18) $4 ($41) ($55) ($193) - - - ($1) $7 $17 ($170) ($225) ($227) - - -Fire Department (6) 1 (3) (8) (53) - - - - - - 1 7 (45) (53) (53) 37Dept. of Correction (23) 3 (17) (37) (9) - - - - - - 1 24 16 (21) (21) (14)Dept. of Sanitation 13 11 (8) 16 (1) - - - - - - 2 38 39 55 56 63
Subtotal ($34) $19 ($69) ($84) ($256) - - - ($1) $11 $86 ($160) ($244) ($245) $86HEALTH AND WELFARE
Administration for Children’s Services ($33) - - - ($13) ($46) ($166) - - - - - - - - - - - - ($166) ($212) ($186) ($112)
Department of Social Services 4 10 3 17 (92) (297) - - - 1 8 (380) (363) (360) (144)
Department of Homeless Services (8) 1 (1) (8) (92) - - - - - - - - - - - - (92) (100) (86) (40)
Department of Health and Mental Hygiene (19) 1 3 (15) (141) - - - - - - - - - 8 (133) (148) (130) (37)
Health and Hospitals Corporation (1) - - - 3 - - - 3 (43) - - - - - - - - - 19 (24) (21) 4 4
Subtotal ($56) $15 ($8) ($49) ($534) ($297) - - - $1 $35 ($795) ($844) ($758) ($329)EDUCATION
Dept. of Education $303 $164 $167 $634 $116 - - - ($2) $1 $172 $287 $921 $925 $348City University (4) 1 4 1 (69) - - - - - - - - - 3 (66) (65) (33) (34)
Subtotal $299 $165 $171 $635 $47 - - - ($2) $1 $175 $221 $856 $892 $314OTHER AGENCIES ($70) ($12) $13 ($69) ($474) - - - ($10) $12 $189 ($283) ($352) ($388) ($4)ELECTED OFFICIALS ($32) - - - $1 ($31) ($16) - - - ($2) - - - - - - ($18) ($49) ($47) ($13)MISC. BUDGET $536 - - - - - - $536 - - - $515 - - - - - - $103 $618 $1,154 $1,155 $894DEBT SERVICE COSTS
(unallocated) - - - - - - - - - - - - - - - - - - - - - - - - $75 $75 $75 $75 $60REESTIMATE OF PRIOR
YEAR’S EXPENSES - - - - - - - - - - - - $500 - - - - - - - - - - - - $500 $500 $500 $500
TOTAL (3) $643 $187 $108 $938 ($733) $218 ($15) $25 $663 $158 $1,096 $1,184 $1,508
City Funds $398 ($102) $111 $407 $453 $19 ($13) $25 $617 $1,101 $1,508
Less: Prepayments - - - ($460) - - - ($460) $332 $1,351 - - - - - - $1,697 $3,380 $2,920 $2,920 $2,920Total After Prepayments $643 $647 $108 $1,398 ($1,065) ($1,133) ($15) $25 ($1,034) ($3,222) ($1,824) ($1,736) ($1,412)
Other Than Personal Service CostsPersonal Service Costs
Changes Between FY 2009 and FY 2010 BudgetsChanges Between FY 2009 and FY 2010 Budgets$ in Millions$ in Millions
Salaries & Wages
FringeBenefits Pensions
PSSubtotals
AgencyOTPS
PA, MA& Other
MandatesLegal
ServicesJudgments& Claims
DebtService
OTPSSubtotal
Gross Total
(IncludingIntra-City)
NetTotal
(ExcludingIntra-City)
AGENCY City FundsTotal
(1)Only reflects funding appropriated in the City’s Budget.(2)Includes subsidies to the MTA, General Reserve, Indigent Defense Services and Other Contractual Services.(3)Excludes the impact of prepayments and debt defeasances.
(2)
37

Exec10
FY 2009 FY 2010 FY 2011 FY 2012
Gap To Be Closed – June 2008 Plan $ - - - ($2,344) ($5,158) ($5,108)Revenue Changes
Tax Revenue Forecast (448) (4,121) (3,812) (4,099)State Budget Revenue Impact - - - 17 13 13Non-Tax Revenue 84 111 (49) (7)DA Restitution 125 - - - - - - - - -
Total Revenue Changes ($239) ($3,993) ($3,848) ($4,093)Expense Changes
Pension ($96) $110 ($348) ($615)Retiree Health Benefit Trust Fund - - - 82 395 672State Budget Expense Impact (44) (162) (112) (116)Energy 94 134 63 13Reduce General Reserve 260 - - - - - - - - -Re-estimate of Prior Year Expenses 500 - - - - - - - - -Debt Service 188 47 130 232Surplus Rolls 104 (104) - - - - - -Other Expense Changes (171) (381) (249) (255)
Total Expense Changes $835 ($274) ($121) ($69)
Total Changes Since June 2008 Plan $596 ($4,267) ($3,969) ($4,162)
Surplus / (Gap) to be Closed – May 2009 Plan $596 ($6,611) ($9,127) ($9,270)Gap Closing Programs
Agency Programs $507 $2,225 $2,120 $2,079Mid-Year Property Tax Increase and End Rebate 576 256 256 256Federal Matching Percent for Medicaid 447 850 295 - - -Anticipated Labor Actions (Health Benefits Savings and New Pension Tier) - - - 200 557 586Anticipated State Actions (Sales Tax and Consumer Plastic Bag Use Fee) 88 1,046 1,141 1,187
Total Gap Closing Programs $1,618 $4,577 $4,369 $4,108Remaining Gap $2,214 ($2,034) ($4,758) ($5,162)Net Impact of Prepayments and Debt Defeasances ($2,214) $2,034 $180 $ - - -Gap to be Closed – May 2009 Plan $ - - - $ - - - ($4,578) ($5,162)
Changes Since the Beginning of FY 2009 (June 2008 Plan)Changes Since the Beginning of FY 2009 (June 2008 Plan)(Increase Gap) / Decrease Gap(Increase Gap) / Decrease Gap
City Funds City Funds -- $ in Millions$ in Millions
38

Exec10
(1) Fiscal Year 2008 Budget Stabilization and Discretionary Transfers total $4.635 billion, including prepayments of subsidies of $500 million, Budget Stabilization of $3.073 billion, Retiree Health Benefits of $460 million, lease debt service of $46 million, net equity contribution in bond refunding of $10 million, and a TFA grant which increases FY2009 revenues by $546 million.
(2) Fiscal Year 2009 Budget Stabilization and Discretionary Transfers total $2.496 billion, including Budget Stabilization of $1.286 billion, lease debt service of $110 million, subsidies of $554 million and a TFA Grant which increases FY2010 revenue by $546 million.(3) FY2007 GO Debt Defeasance of $536 million reduced debt service by $27 million, $279 million and $277 million in FY2008 through FY2010, respectively. FY2008 GO Debt Defeasance of $1.986 billion reduces debt service by $2.036 billion
in FY2010. FY2007 TFA Debt defeasance of $718 million increases revenues by $33 million, $362 million and $382 million in FY2008 through FY2010, respectively. FY2009 TFA debt defeasance increases revenue by $530 million in FY2011.
Revenues FY 2009 FY 2010 FY 2011 FY 2012 FY 2013Taxes
General Property Tax $14,408 $16,127 $17,173 $17,762 $18,150Other Taxes 20,162 16,606 18,194 19,565 20,925Discretionary Transfers(1) (2) 546 546 - - - - - - - - -Debt Defeasance(3) 362 382 530 - - - - - -Tax Audit Revenue 980 596 596 595 594Subtotal: Taxes without Anticipated State Actions $36,458 $34,257 $36,493 $37,922 $39,669
Miscellaneous Revenues without Anticipated State Actions 6,131 5,874 5,653 5,685 5,723Anticipated State Actions 88 1,046 1,141 1,187 1,248Unrestricted Intergovernmental Aid 340 340 340 340 340Less: Intra-City Revenue (1,689) (1,601) (1,525) (1,524) (1,524)
Disallowances Against Categorical Grants (15) (15) (15) (15) (15)Subtotal: City Funds $41,313 $39,901 $42,087 $43,595 $45,441
Other Categorical Grants 1,113 1,028 1,029 1,033 1,031Inter-Fund Revenues 472 475 449 439 439Total City, Capital IFA & Other Categorical Funds $42,898 $41,404 $43,565 $45,067 $46,911Federal Categorical Grants 6,198 6,422 6,327 5,360 5,349State Categorical Grants 12,083 11,617 12,015 12,359 13,010
Total Revenues $61,179 $59,443 $61,907 $62,786 65,270
Expenditures
Personal ServiceSalaries and Wages $21,947 $22,590 $23,563 $23,109 23,677Pensions without Anticipated Labor Actions 6,392 6,700 7,234 7,558 7,831Fringe Benefits without Anticipated Labor Actions (1) 6,814 7,201 7,370 7,450 8,432Anticipated Labor Actions - - - (400) (757) (786) (818)Subtotal: Personal Service $35,153 $36,091 $37,410 $37,331 $39,122
Other Than Personal ServiceMedical Assistance $5,191 $4,907 $5,621 $6,090 $6,271Public Assistance 1,313 1,299 1,299 1,299 1,299All Other (1) (2) 18,862 18,397 18,713 19,357 19,846Subtotal: Other Than Personal Service $25,366 $24,603 $25,633 $26,746 $27,416
General Obligation and Lease Debt Service (1) (2) (3) 3,650 4,313 4,667 5,095 5,373General Obligation and TFA Debt Defeasances (Net) (3) 252 (2,313) - - - - - - - - -FY 2008 Budget Stabilization & Discretionary Transfers (1) (4,089) - - - - - - - - - - - -FY 2009 Budget Stabilization & Discretionary Transfers (2) 2,496 (1,950) - - - - - - - - -General Reserve 40 300 300 300 300
Subtotal $62,868 $61,044 $68,010 $69,472 $72,211Less: Intra-City Expenses (1,689) (1,601) (1,525) (1,524) (1,524)
Total Expenditures $61,179 $59,443 $66,485 $67,948 $70,687Gap To Be Closed $ - - - $ - - - ($4,578) ($5,162) ($5,417)
FiveFive--Year Financial Plan Year Financial Plan Revenues and ExpendituresRevenues and Expenditures
(All Funds)(All Funds)$ in Millions
39
Related Documents