HRM/SI/2018- J 8 HMT (INTERNATIONAL) LIMITED (A wholly owned subsidiary of HMT Limit ed) A Government of India Undertaking ff MT Bhavan 58, Bellary RQa .d Bangalore-560 032, India 06.04.2018 CERTIFlCA TE This is to certify that Mr. SUBRAHMANY A. N.R (Reg. No .1AZ16MBA69), an MBA final year student of Acbarya Institute of Technology, affiliated to Visveswaraya Technological University has carried out his ProJect Work in our organization and has prepared a report titled "A Study on Financial Performance Analysis of HMT (J) Ltd." at HM.T (International) Limited, Bangalore, during the period from 15 .01.2018 to 24.03. 2018 . The conduct and behavior of Mr. SUBRAHMANYA.N.R, was good during the above referred period. We wish him all success . For HMT (International) Limited, (JEROME KUJUR) JOINT GENERAL MANAGER (HR) JEROME UJUR Jolnt Gen~114\ Uanager( HR)

Welcome message from author
This document is posted to help you gain knowledge. Please leave a comment to let me know what you think about it! Share it to your friends and learn new things together.
Transcript
HRM/SI/2018- J 8
HMT (INTERNATIONAL) LIMITED (A wholly owned subsidiary of HMT Limited)
A Government of India Undertaking ffM T Bhavan
58, Bellary RQa.d Bangalore-560 032, India
06.04 .2018
CERTIFlCA TE
This is to certify that Mr. SUBRAHMANY A. N.R (Reg.No.1AZ16MBA69), an MBA final
year student of Acbarya Institute of Technology, affiliated to Visveswaraya Technological
University has carried out his ProJect Work in our organization and has prepared a report titled
"A Study on Financial Performance Analysis of HMT (J) Ltd." at HM.T (International)
Limited, Bangalore, during the period from 15.01.2018 to 24 .03 .2018.
The conduct and behavior of Mr. SUBRAHMANYA.N.R, was good during the above
referred period.
We wish him all success.
For HMT (International) Limited,
(JEROME KUJUR) JOINT GENERAL MANAGER (HR)
JEROME UJUR Jolnt Gen~114\ Uanager(HR)
ACHARYA INSTITUTE OF TECHNOLOGY
(AffiliatedtoVisvesvaraya Technological University, Belagavi, Approved byAICTE, New Delhi and Accredited by NBA and NAAC)
Date: 26/05/2018
CERTIFICATE
This is to certify that Mr. Subrahmanya N R bearing USN
1AZ16MBA69 is a bonafide student of Master of Business Administration
course of the Institute 2016-18 batch, affiliated to Visvesvaraya
Technological University, Belgaum. Project report on "Financial
Performance Analysis of HMT (I) Ltd.," Bangalore is prepared by him
under the guidance of Dr. Virupaksha Goud G, in partial fulfillment of the
requirements for the award of the degree of Master of Business
Administration, Visvesvaraya Technological University, Belgaum, Karnataka.
Signature of Internal Guide 0:p:1~ ~~liPJ~fh<l{ lf ~~rtment Department of MBA
· ·: harya lristitute of Technolor:· , . - ldevanahlli, Batlgalore-560 10/
~--;;::;~~ 'ir ~
Signature of Principal PRINCIPAL
l\CHARYA IN~,TITJF Of TF.l,nt~OLOGV (3oldevanahal11 tL1f'.u~lc1 v-SGO 10 7
Acharya Dr. Sarvepall1 Radhaknshnan Road. Soladevanahall1, Acharya P.O., Bangalore 560 107, Karnataka, lncha • www acharya ac.in/ait/ • Ph· +91 -80-225 555 55 Extn . 2102 • Fax +91-80-237 002 42 • E-mail pnncipalait@acharya ac in
DECLARATION
I, SUBRAHMANY A N R, hereby declare that the Project report entitled ' ' A study on
financial performance analysis of HMT(I) Ltd.' ' with reference to "HMT(I) Ltd.
Bangalore II prepared by me under the guidance of Dr.Virupaksha Goud, faculty of M.B.A
Department, Acharya Institute of Technology, Bangalore and external assistance by Jerome
Kujur, HR, HMT(I) Ltd.
I also declare that this Project work is towards the partial fulfilment of the University regulations
for the award of degree of Master of Business Administration by Visvesvaraya Technological
University, Belgaum.
I have undergone a summer project for a period of Ten weeks. I further declare that this project
is based on the original study undertaken by me and has not been submitted for the award of any
degree/diploma from any other University / Institution.
Place: f ~ Date: ~ ~ / S / I I
Signature of the student
-

ACKNOWLEDGEMENT
I deem it a privilege to thank our Principal, Dr.Sharanabasava C Pilli, Dr. Mahesh, Dean
Academics and our hod Dr.Nijaguna for having given me the opportunity to do the project,
which has been a very valuable learning experience.
I am truly grateful to my internal research Guide, Dr. Virupaksha Goud, and my external
guide Mrs. Jerome Kujur, HR, HMT (I) Ltd. for their research guidance, encouragement, and
opportunities provided.
I wish to thank all the respondents from the firms who spent their valuable time in discussing
with me and giving valuable information and guidance.
My sincere and heartfelt thanks to all my teachers at the Department of MBA, Acharya
Institute of Technology for their valuable support and guidance.
Last, but not least, I want to express my deep appreciation to my parents for their unstinted
support.
SUBRAHMANYA N R

TABLE OF CONTENTS
CHAPTER NO.
TOPIC PAGE NO
1 INTRODUCTION 1.1. Introduction 1-2
1.2. Industry profile 2-3
1.3. Company profile:
1.3.1. Promoters 5
1.3.2. Vision, Mission & Quality Policy. 6-7
1.3.3. Products / services profile 7-10
1.3.4. Areas of operation 10
1.3.5. Infrastructure Facilities 10-11
1.4 Competitors’ information 11-12
1.5 SWOT Analysis 12-14
1.6 Future growth and prospects 14
1.7 Financial Statement 14-16
2 CONCEPTUAL BACKGROUND AND LITERATURE
REVIEW
2.1 Theoretical background of the study 17-20
2.2. Literature review with research gap 21-23
3 RESEARCH DESIGN
3.1 Statement of the problem 24
3.2 Need for the study 24
3.3 Objectives 24
3.4 Scope of the study 24
3.5 Research methodology 25
3.6 Limitations 25-26
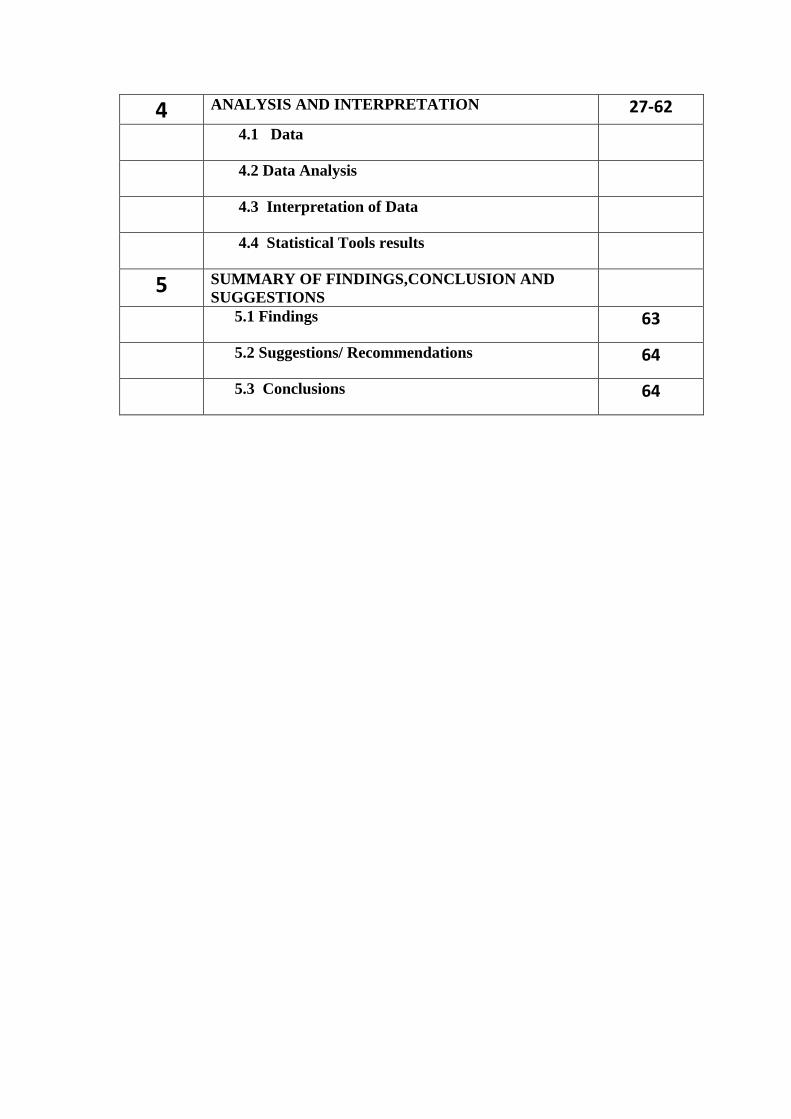
4 ANALYSIS AND INTERPRETATION 27-62
4.1 Data
4.2 Data Analysis
4.3 Interpretation of Data
4.4 Statistical Tools results
5 SUMMARY OF FINDINGS,CONCLUSION AND
SUGGESTIONS
5.1 Findings 63
5.2 Suggestions/ Recommendations 64
5.3 Conclusions 64
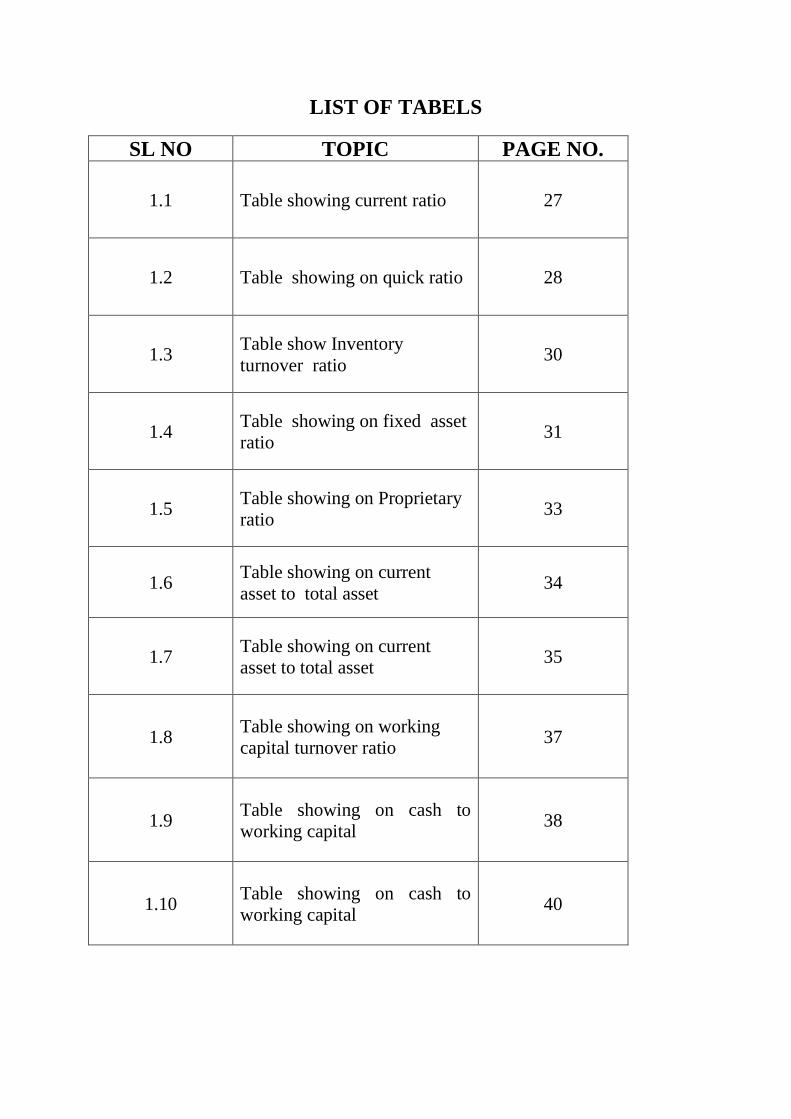
LIST OF TABELS
SL NO TOPIC PAGE NO.
1.1 Table showing current ratio 27
1.2 Table showing on quick ratio 28
1.3 Table show Inventory
turnover ratio 30
1.4 Table showing on fixed asset
ratio 31
1.5 Table showing on Proprietary
ratio 33
1.6 Table showing on current
asset to total asset 34
1.7 Table showing on current
asset to total asset 35
1.8 Table showing on working
capital turnover ratio 37
1.9 Table showing on cash to
working capital 38
1.10 Table showing on cash to
working capital 40

1.11 Table showing on Net profit
ratio 41
1.12 Table showing on Earnings
per shares 42
1.13 Table showing on Total asset
turnover 44
1.14 Table showing on fixed asset
turnover ratio 45
1.15 Table showing on Gross profit
ratio 46
1.16 Table showing on Return on
asset ratio 48

LIST OF GRAPHS
SL NO TOPIC PAGE NO.
4.1 Graph showing on current
ratio 27
4.2 Graph showing on Quick
ratio 29
4.3 Graph showing on Inventory
turnover ratio 30
4.4 Graph showing on Fixed asset
ratio 32
4.5 Graph showing on Proprietary
ratio 33
4.6 Graph showing on current
asset to total asset 34
4.7 Graph showing on current
asset to total asset 36
4.8 Graph showing on working
capital turnover ratio 37
4.9 Graph showing on cash to
working capital 39
4.10 Graph showing on cash to
sales ratio 40
4.11 Graph showing on Net profit
ratio 41
4.12 Graph showing on Earnings
per share 43
4.13 Graph showing on Total asset
turnover 44
4.14 Graph showing on fixed asset
turnover ratio 45
4.15 Graph showing on Gross
profit ratio 47
4.16 Graph showing on Return on
asset ratio 48
1
Executive Summary
The project program is an important part of the educational curriculum. A project is a pre-
professional experience that provides an opportunity to gain relevant knowledge and skills
prior to starting out in a particular career field. Project exposes students to the problems and
challenges faced by organizations in their day-to-day business. It helps them to understand
the business operations being performed by the companies. The students can get a more clear
understanding of the theoretical knowledge gained through education when they observe
these concepts being practiced by individuals in the organization. This project was taken up
as a part of the requirement of Master of Business Administration course per the requirements
of VTU.
The project was undertaken at HMT (I) Ltd. Bangalore. The objective of in plant training is
to enable a better understanding of working in the organization and to develop a comparative
approach between the theory and practical application.
The study has been undertaken on the topic of “A study on Financial Performance Analysis
of HMT (I) Ltd.” the main objective of the study is to analyze the financial performance of
the company.
The project report covers company profile, industry profile, theoretical background of the
study, data analysis and interpretation, and provides recommendations based on the findings
and the conclusion. It also contains the financial statements of the company.

2
CHAPTER 1
INTRODUCTION
1.1 INTRODUCTION:
Project report is a good opportunity to learn, gain experience and make decisions.
When my work is a real job, it helps me to feel and find myself from a different perspective.
It also helps to control and develop my attitudes and behaviors to deal with different people
and situations
Trainee helps identify waterlines and strengths. Another reason why I decide to follow the
project report is to prepare for a more profitable working environment and situation. Working
life is very hectic and challenging, it requires large dedication and skills that are terrible, that
I have learned and trained and ready
Generally in Project report Students will learn the working condition and problem areas in
their interested career. Some students find permanent, paid employment with the
organizations where they done their project report. This can help the employer when
experienced interns need little or less training when they start employment in their
organization.
The main objective of financial performance analysis is to using data about past performance
of the firm to predict how it will do its business in future. And another important objective
financial performance analysis is to find problem areas of the company.
Importance of project:
➢ It helps to students to work in their interested field.
➢ It helps students to apply their theoretical knowledge to a real world and to get a
va1uable experience which make them stronger candidates for future work
➢ It is one of the good ways to try a career which we interested in.
Benefits of project:
➢ To enhance our skills
➢ To gain the leadership skills
3
➢ To get to know a community
➢ To increase in the social-relationship skills
➢ Provides help to career development
➢ Helps in gaining experience and self-confidence
➢ Helps in the development of the personality.
Financial Performance Analysis.
“A Study on Financial Performance Analysis Of HMT (I) Ltd.” conducted on behalf of HMT
(I) Ltd will be done in two parts. In Part A the report will be on company profile, Industry
Profile, financial status and studying the various departments of the company Part B will
cover the concepts on Analysis on Financial Performance, Analysis and interpretation of
information, findings, suggestions and conclusion
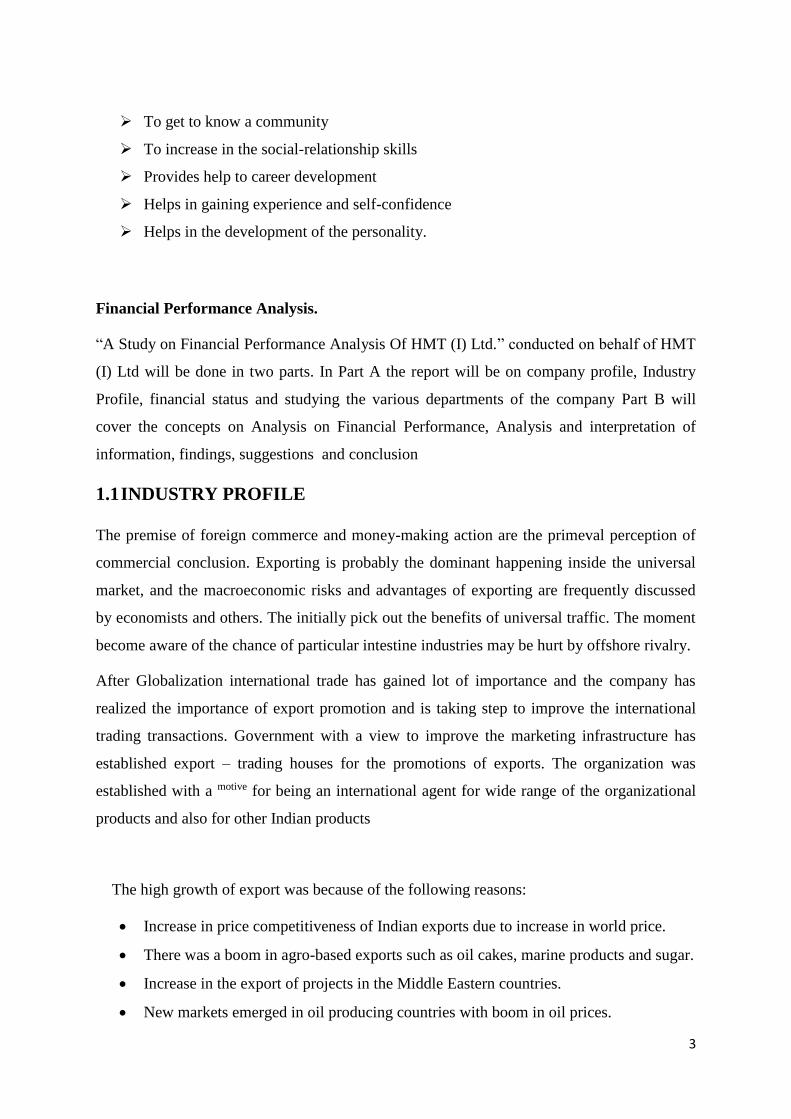
1.1 INDUSTRY PROFILE
The premise of foreign commerce and money-making action are the primeval perception of
commercial conclusion. Exporting is probably the dominant happening inside the universal
market, and the macroeconomic risks and advantages of exporting are frequently discussed
by economists and others. The initially pick out the benefits of universal traffic. The moment
become aware of the chance of particular intestine industries may be hurt by offshore rivalry.
After Globalization international trade has gained lot of importance and the company has
realized the importance of export promotion and is taking step to improve the international
trading transactions. Government with a view to improve the marketing infrastructure has
established export – trading houses for the promotions of exports. The organization was
established with a motive for being an international agent for wide range of the organizational
products and also for other Indian products
The high growth of export was because of the following reasons:
• Increase in price competitiveness of Indian exports due to increase in world price.
• There was a boom in agro-based exports such as oil cakes, marine products and sugar.
• Increase in the export of projects in the Middle Eastern countries.
• New markets emerged in oil producing countries with boom in oil prices.

4
• Increase in the quantum index of exports.
Between 1980 and 1991 there was a decline of exports due to fall in dollar values, slowdown
of World Trade, Gulf Crises, Political upheavals in Eastern Europe, Movement of Exchange
rates, Law and order and order problems, and so on.
Trading Houses (TH) are self-governing organizations operated by international or global
trade exports. They are the business mediator of the producer & the unfamiliar purchaser or
customer of cargo and the services and products. Trading House Exports import and engage
in third country trading of equipment and services and products manufactured by different
organizations and they act as:
• Export supervision companies whichever handle part of the progenitor companies’ exports,
and may take part in counter-trade, if necessary.
• Purchasing agencies whatever deliver equipment and services and products to external
companies.
• Export agents gamble in favor of an alternate birthday celebration for commission.
• International trader sells products to their very own account.
1.3 COMPANY PROFILE
Company name : HMT (INTERNATIONAL) LTD
Established : 1974
Registered office : HMT Bhavan, 59, Bellary Road, Bangalore , 560032
Certification : An (ISO 9001- 2000) Company
Website: www. Hmt (I) India.com
HMT (I) Ltd. maintain within the past of 1974 and its officer part is found in Bengaluru,
Karnataka. HMT (I) is actually a purely had supplementary of HMT Limited and it is a multi-
product, multi- location Engineering Giant and out-of-date charity secure & coherent get
right of entry to decent robotics. It’s considered one of the India’s leading transport houses, it
saled quite a lot of services and products beginning at agronomical direct to manufacturing
and IT solutions amidst vocational skill in Machine Tools mechanization.
5
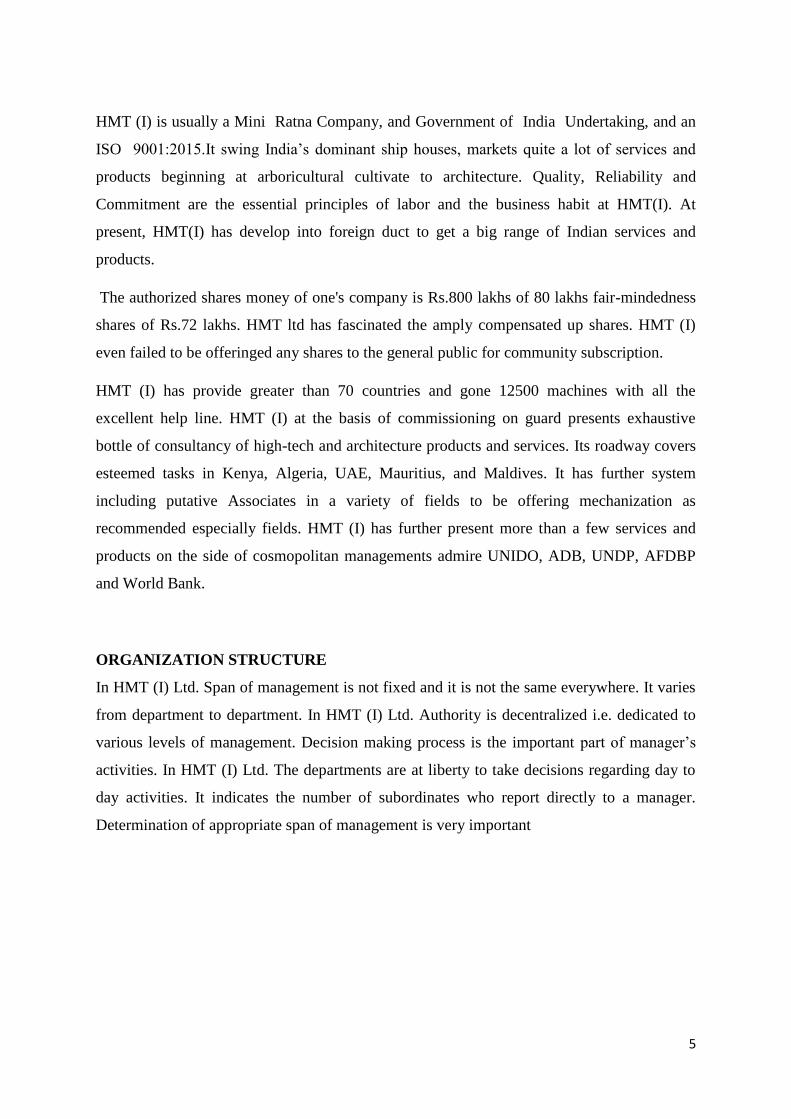
HMT (I) is usually a Mini Ratna Company, and Government of India Undertaking, and an
ISO 9001:2015.It swing India’s dominant ship houses, markets quite a lot of services and
products beginning at arboricultural cultivate to architecture. Quality, Reliability and
Commitment are the essential principles of labor and the business habit at HMT(I). At
present, HMT(I) has develop into foreign duct to get a big range of Indian services and
products.
The authorized shares money of one's company is Rs.800 lakhs of 80 lakhs fair-mindedness
shares of Rs.72 lakhs. HMT ltd has fascinated the amply compensated up shares. HMT (I)
even failed to be offeringed any shares to the general public for community subscription.
HMT (I) has provide greater than 70 countries and gone 12500 machines with all the
excellent help line. HMT (I) at the basis of commissioning on guard presents exhaustive
bottle of consultancy of high-tech and architecture products and services. Its roadway covers
esteemed tasks in Kenya, Algeria, UAE, Mauritius, and Maldives. It has further system
including putative Associates in a variety of fields to be offering mechanization as
recommended especially fields. HMT (I) has further present more than a few services and
products on the side of cosmopolitan managements admire UNIDO, ADB, UNDP, AFDBP
and World Bank.
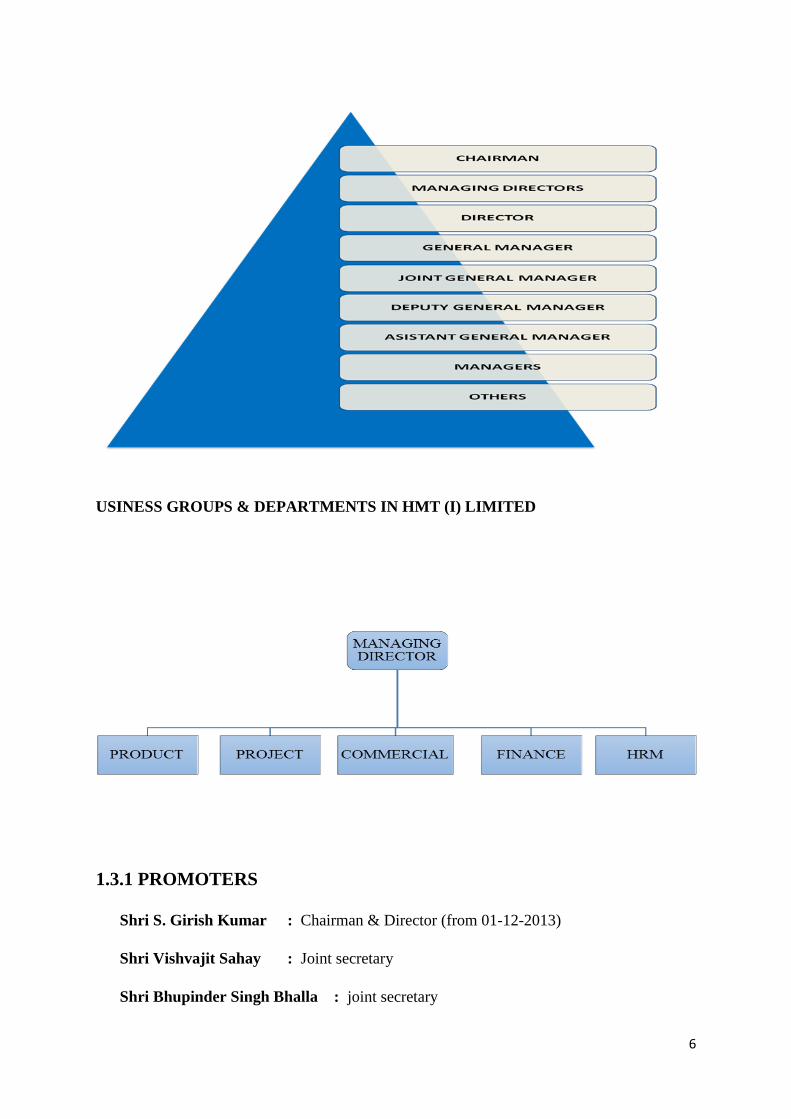
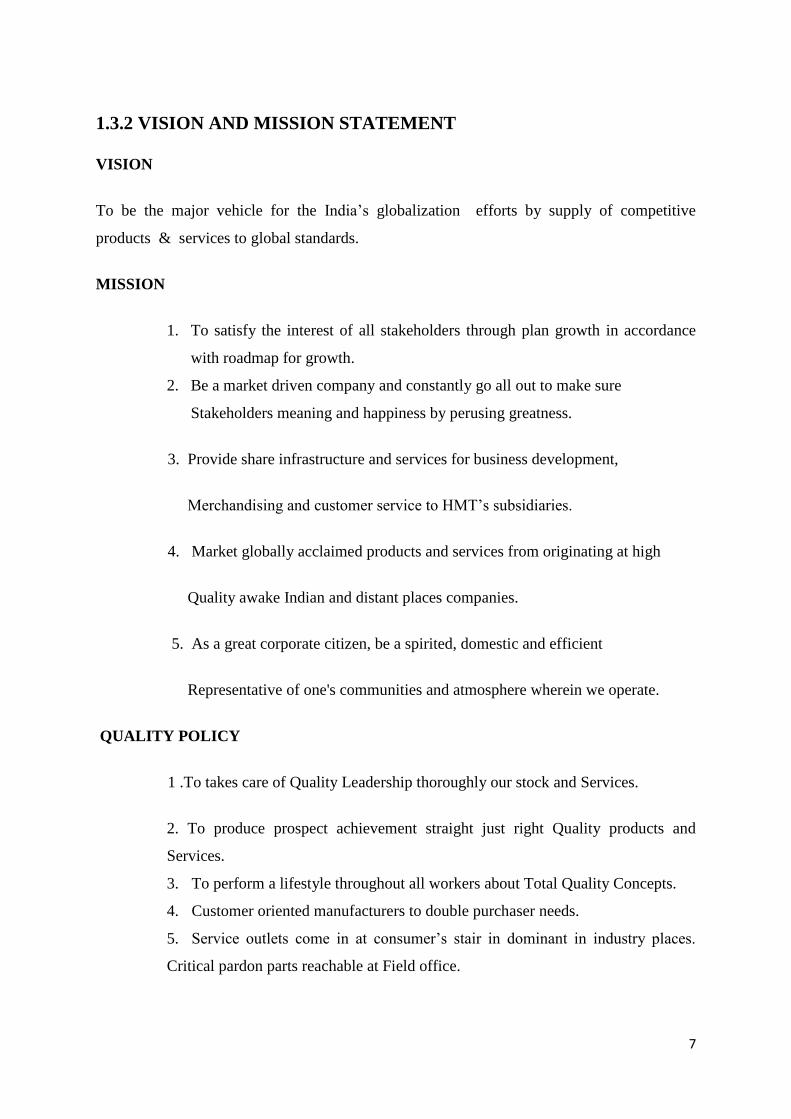
ORGANIZATION STRUCTURE
In HMT (I) Ltd. Span of management is not fixed and it is not the same everywhere. It varies
from department to department. In HMT (I) Ltd. Authority is decentralized i.e. dedicated to
various levels of management. Decision making process is the important part of manager’s
activities. In HMT (I) Ltd. The departments are at liberty to take decisions regarding day to
day activities. It indicates the number of subordinates who report directly to a manager.
Determination of appropriate span of management is very important
6
USINESS GROUPS & DEPARTMENTS IN HMT (I) LIMITED
1.3.1 PROMOTERS
Shri S. Girish Kumar : Chairman & Director (from 01-12-2013)
Shri Vishvajit Sahay : Joint secretary
Shri Bhupinder Singh Bhalla : joint secretary
7
1.3.2 VISION AND MISSION STATEMENT
VISION
To be the major vehicle for the India’s globalization efforts by supply of competitive
products & services to global standards.
MISSION
1. To satisfy the interest of all stakeholders through plan growth in accordance
with roadmap for growth.
2. Be a market driven company and constantly go all out to make sure
Stakeholders meaning and happiness by perusing greatness.
3. Provide share infrastructure and services for business development,
Merchandising and customer service to HMT’s subsidiaries.
4. Market globally acclaimed products and services from originating at high
Quality awake Indian and distant places companies.
5. As a great corporate citizen, be a spirited, domestic and efficient
Representative of one's communities and atmosphere wherein we operate.
QUALITY POLICY
1 .To takes care of Quality Leadership thoroughly our stock and Services.
2. To produce prospect achievement straight just right Quality products and
Services.
3. To perform a lifestyle throughout all workers about Total Quality Concepts.
4. Customer oriented manufacturers to double purchaser needs.
5. Service outlets come in at consumer’s stair in dominant in industry places.
Critical pardon parts reachable at Field office.
8
6. Customer education programs on Macaroni’s as well as commonplace
mechanical device oriented coaching for mechanical device tools.
1.3.3 PRODUCTS AND SERVICES PROFILE
HMT together of your renowned manufacturers and HMT(I)exporters inside the country,
HMT(I) exports Machines and Machine Tools prefer CNC Machines, Metal Cutting
Machine & Tools, Lathes, Milling Machines, Cutters & Grinders, Metal Forming
Machines, Mechanical Presses and Press Brakes.
Supported by its guardian company, HMT(I) has adequately prowess and revel in in
International Marketing. Hence, HMT (I) is pop out as a global funnel for any universal
multitude of excellent good quality Indian products. At present, upstairs 78000 HMT
machines or products are plate the requirements of your commerce, in conjunction with
18000 products or machines which have been exported to 80 alien countries dig date.
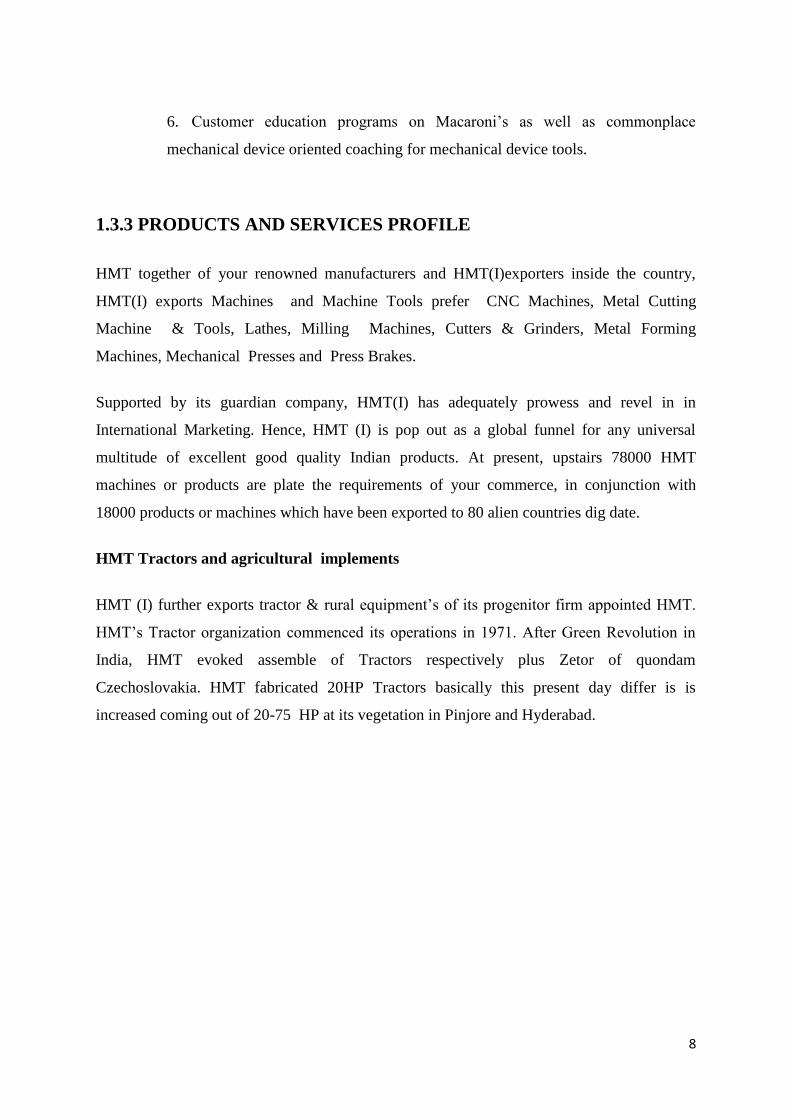
HMT Tractors and agricultural implements
HMT (I) further exports tractor & rural equipment’s of its progenitor firm appointed HMT.
HMT’s Tractor organization commenced its operations in 1971. After Green Revolution in
India, HMT evoked assemble of Tractors respectively plus Zetor of quondam
Czechoslovakia. HMT fabricated 20HP Tractors basically this present day differ is is
increased coming out of 20-75 HP at its vegetation in Pinjore and Hyderabad.
9
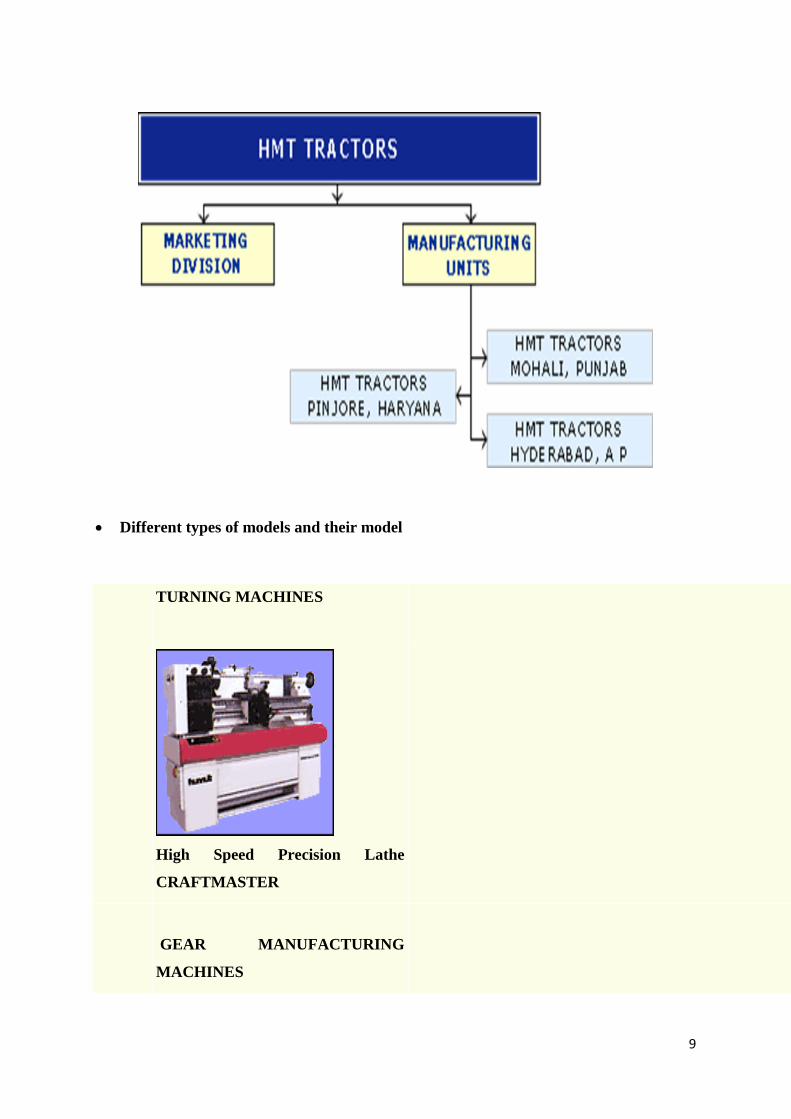
• Different types of models and their model
TURNING MACHINES
High Speed Precision Lathe
CRAFTMASTER
GEAR MANUFACTURING
MACHINES
10
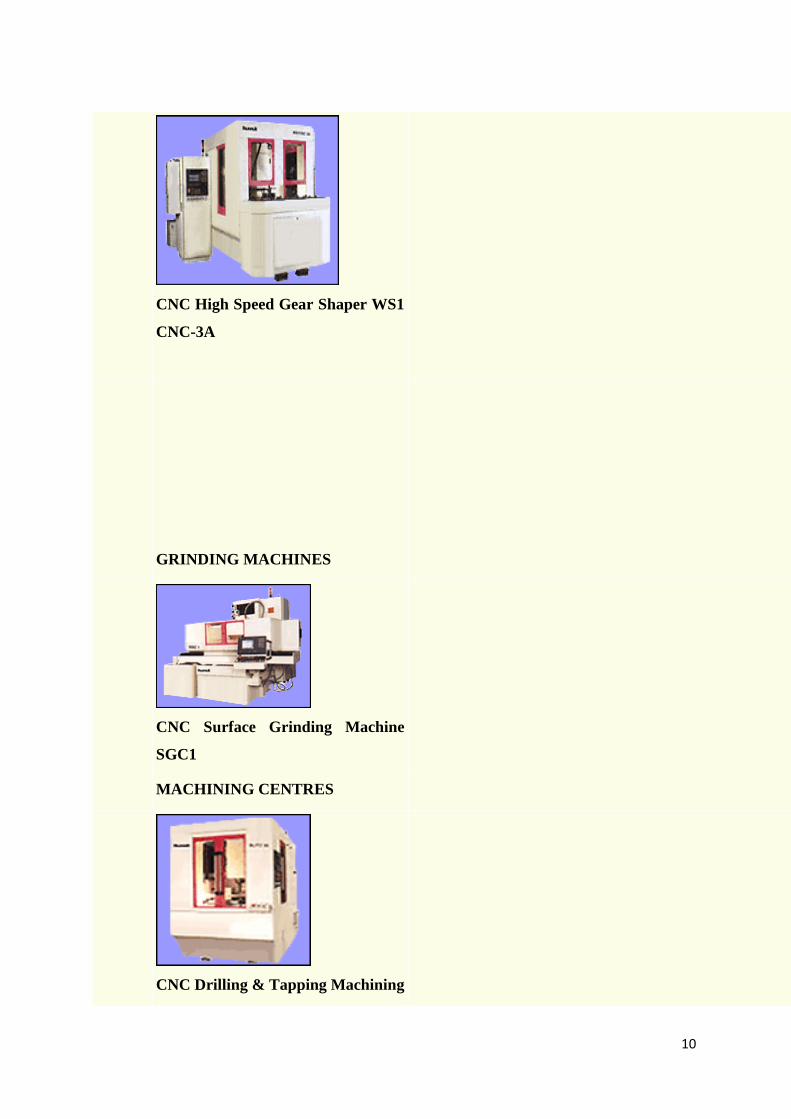
CNC High Speed Gear Shaper WS1
CNC-3A
GRINDING MACHINES
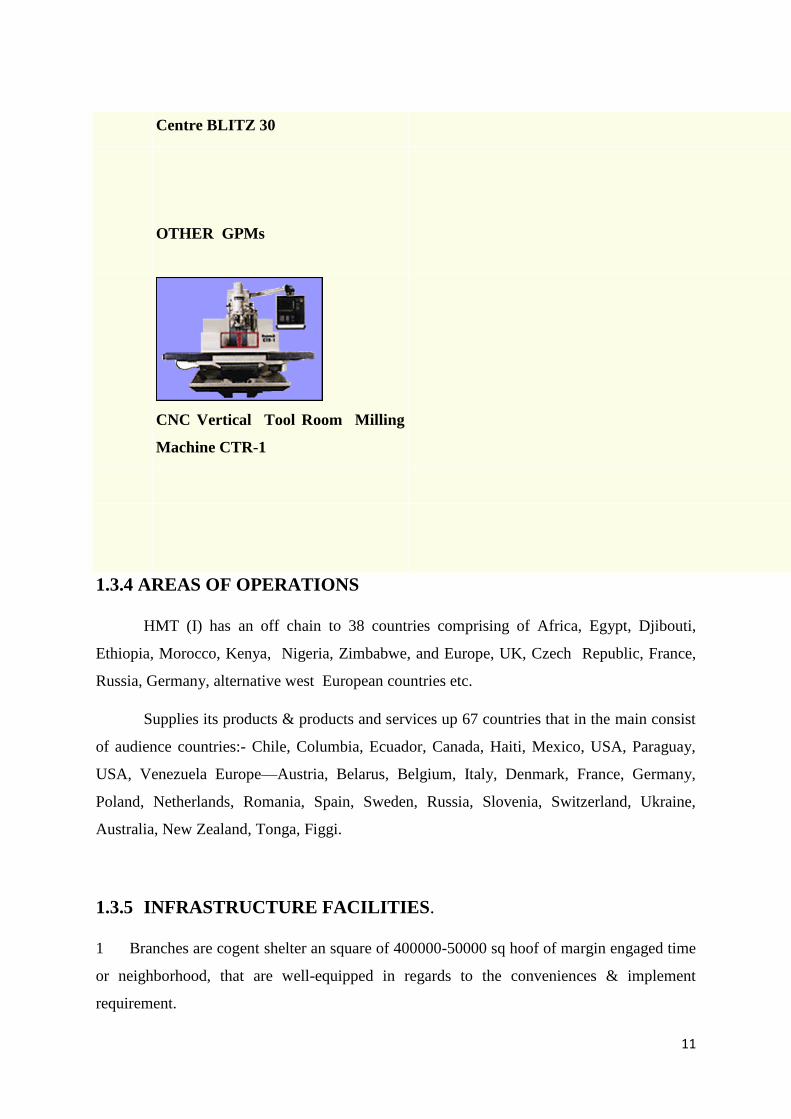
CNC Surface Grinding Machine
SGC1
MACHINING CENTRES
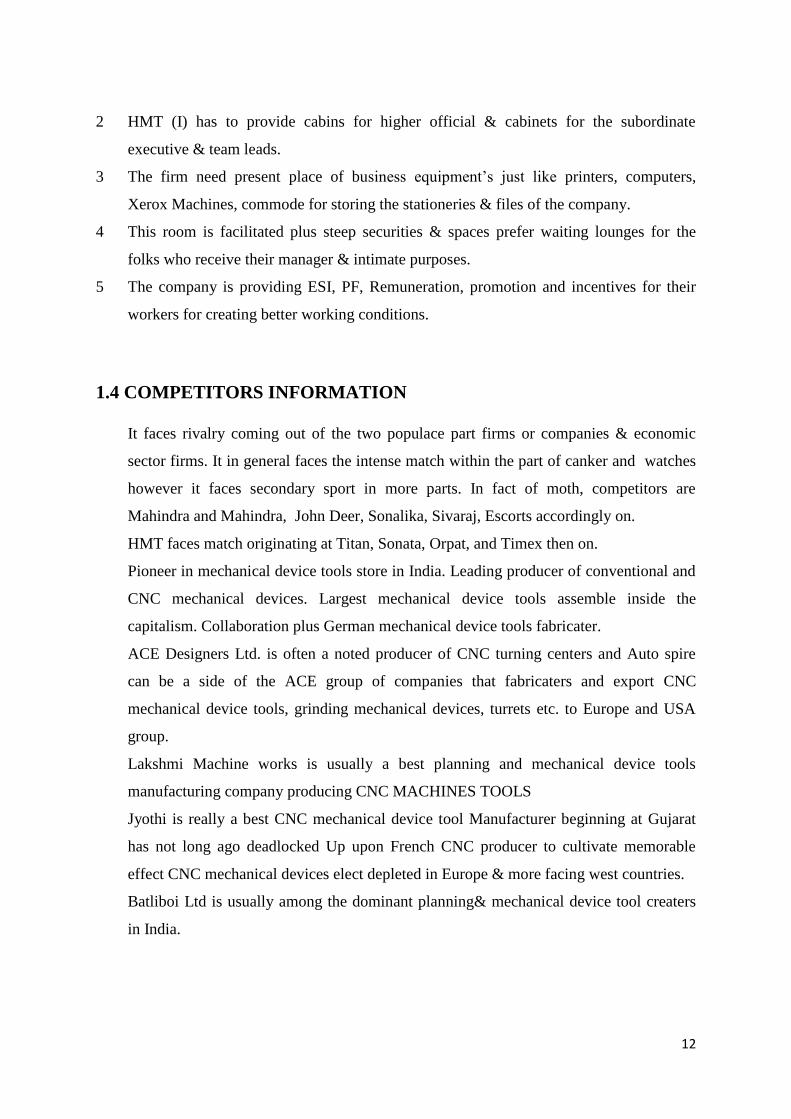
CNC Drilling & Tapping Machining
11
Centre BLITZ 30
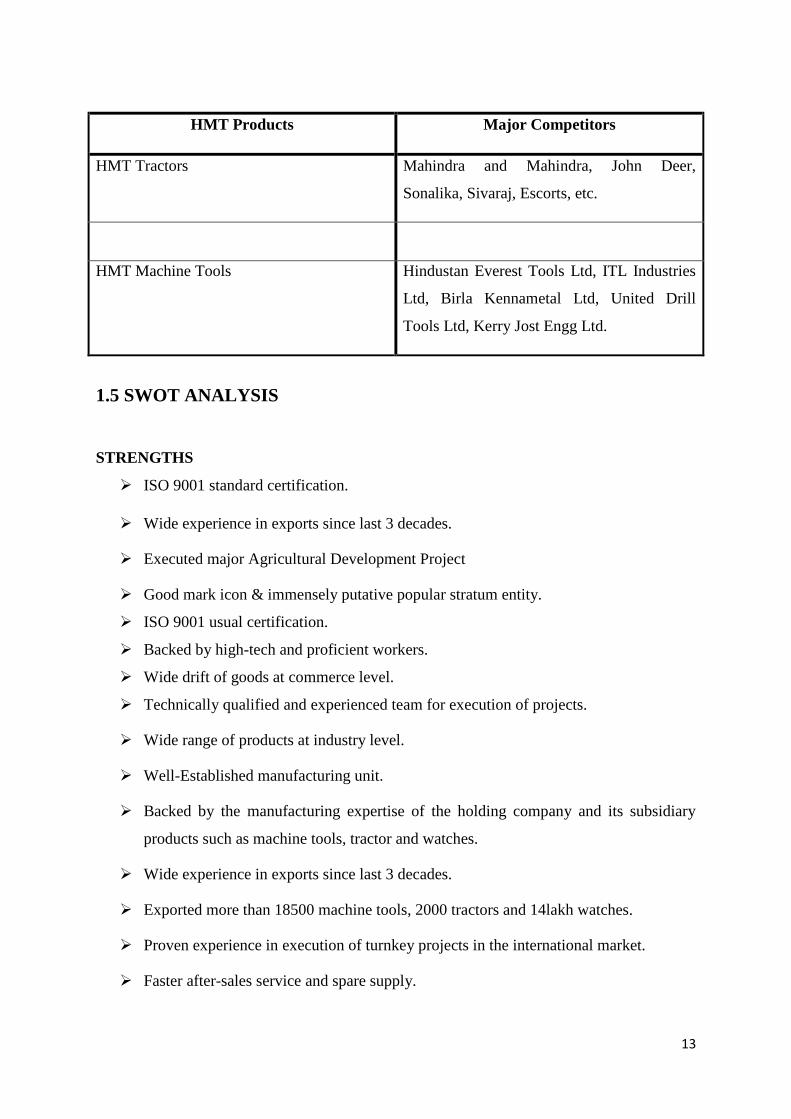
OTHER GPMs
CNC Vertical Tool Room Milling
Machine CTR-1
1.3.4 AREAS OF OPERATIONS
HMT (I) has an off chain to 38 countries comprising of Africa, Egypt, Djibouti,
Ethiopia, Morocco, Kenya, Nigeria, Zimbabwe, and Europe, UK, Czech Republic, France,
Russia, Germany, alternative west European countries etc.
Supplies its products & products and services up 67 countries that in the main consist
of audience countries:- Chile, Columbia, Ecuador, Canada, Haiti, Mexico, USA, Paraguay,
USA, Venezuela Europe—Austria, Belarus, Belgium, Italy, Denmark, France, Germany,
Poland, Netherlands, Romania, Spain, Sweden, Russia, Slovenia, Switzerland, Ukraine,
Australia, New Zealand, Tonga, Figgi.
1.3.5 INFRASTRUCTURE FACILITIES.
1 Branches are cogent shelter an square of 400000-50000 sq hoof of margin engaged time
or neighborhood, that are well-equipped in regards to the conveniences & implement
requirement.
12
2 HMT (I) has to provide cabins for higher official & cabinets for the subordinate
executive & team leads.
3 The firm need present place of business equipment’s just like printers, computers,
Xerox Machines, commode for storing the stationeries & files of the company.
4 This room is facilitated plus steep securities & spaces prefer waiting lounges for the
folks who receive their manager & intimate purposes.
5 The company is providing ESI, PF, Remuneration, promotion and incentives for their
workers for creating better working conditions.
1.4 COMPETITORS INFORMATION
It faces rivalry coming out of the two populace part firms or companies & economic
sector firms. It in general faces the intense match within the part of canker and watches
however it faces secondary sport in more parts. In fact of moth, competitors are
Mahindra and Mahindra, John Deer, Sonalika, Sivaraj, Escorts accordingly on.
HMT faces match originating at Titan, Sonata, Orpat, and Timex then on.
Pioneer in mechanical device tools store in India. Leading producer of conventional and
CNC mechanical devices. Largest mechanical device tools assemble inside the
capitalism. Collaboration plus German mechanical device tools fabricater.
ACE Designers Ltd. is often a noted producer of CNC turning centers and Auto spire
can be a side of the ACE group of companies that fabricaters and export CNC
mechanical device tools, grinding mechanical devices, turrets etc. to Europe and USA
group.
Lakshmi Machine works is usually a best planning and mechanical device tools
manufacturing company producing CNC MACHINES TOOLS
Jyothi is really a best CNC mechanical device tool Manufacturer beginning at Gujarat
has not long ago deadlocked Up upon French CNC producer to cultivate memorable
effect CNC mechanical devices elect depleted in Europe & more facing west countries.
Batliboi Ltd is usually among the dominant planning& mechanical device tool creaters
in India.
13
HMT Products Major Competitors
HMT Tractors Mahindra and Mahindra, John Deer,
Sonalika, Sivaraj, Escorts, etc.
HMT Machine Tools Hindustan Everest Tools Ltd, ITL Industries
Ltd, Birla Kennametal Ltd, United Drill
Tools Ltd, Kerry Jost Engg Ltd.
1.5 SWOT ANALYSIS
STRENGTHS
➢ ISO 9001 standard certification.
➢ Wide experience in exports since last 3 decades.
➢ Executed major Agricultural Development Project
➢ Good mark icon & immensely putative popular stratum entity.
➢ ISO 9001 usual certification.
➢ Backed by high-tech and proficient workers.
➢ Wide drift of goods at commerce level.
➢ Technically qualified and experienced team for execution of projects.
➢ Wide range of products at industry level.
➢ Well-Established manufacturing unit.
➢ Backed by the manufacturing expertise of the holding company and its subsidiary
products such as machine tools, tractor and watches.
➢ Wide experience in exports since last 3 decades.
➢ Exported more than 18500 machine tools, 2000 tractors and 14lakh watches.
➢ Proven experience in execution of turnkey projects in the international market.
➢ Faster after-sales service and spare supply.
14
➢ Executed major Agricultural Development Project
WEAKNESSES
➢ Delay in implementing new systems.
➢ It is facing financial crisis and has been incurring losses since 1993.
➢ Delay in implementing new systems.
➢ It is facing financial crisis and has been incurring losses since 1993.
➢ Delay in decision making process.
➢ Higher interest rates in relation to developed countries making HMT product less
competitive.
➢ Poor process capability, low volumes of production.
➢ No focus on exports and global markets.
OPPORTUNITIES
➢ New opportunities in engineering and services exports have opened up through
globalization.
➢ Modernization of railways and plants.
➢ There is often a enormous convenience in Africa for art telecommunications and
music estimated merchandises as choice to chic robotics produce originating at
westernly countries.
➢ HMT (I) has principally targeting RND for attracting the customers.
➢ New opportunities in planning and services and products transship leave spread out
straight globalization.
➢ Modernization of railways and plants.
➢ Vast excuse in Africa for art machinery and form estimated freight as possible
choices to chic automation merchandise beginning at westernmost countries.
➢ Increasing strain on tillage in African countries disclose marketplace for ship of
engine, metallurgy and technological services and products .(e.g. Tractors)
15
THREATS
➢ Govt. Rules and Regulations.
➢ The group have to encounter stringent match beginning at the two global in addition
intestine market
➢ The firm is hanging in modern look robotics in comparison to MNC players.
➢ Non-competitive prices and release slippage pose a risk to employ client abroad.
➢ Big machines and products and that rule creating a challenging and dull process.
1.6 FUTURE GROWTH AND PROSPECT
1. The company has to give number of chance to utilize short and medium term business &
also embarked on market development plan for the future.
2. HMT (I) Ltd has adopted a strategic approach, focused on SECTORS.
3. one day HMT(I) Ltd will be major exporter of engineering products, Projects & services
4. The company is planning to prepare different type of product and produce to the market.
5. Reduce the price of the machine tools and give discount for the products.
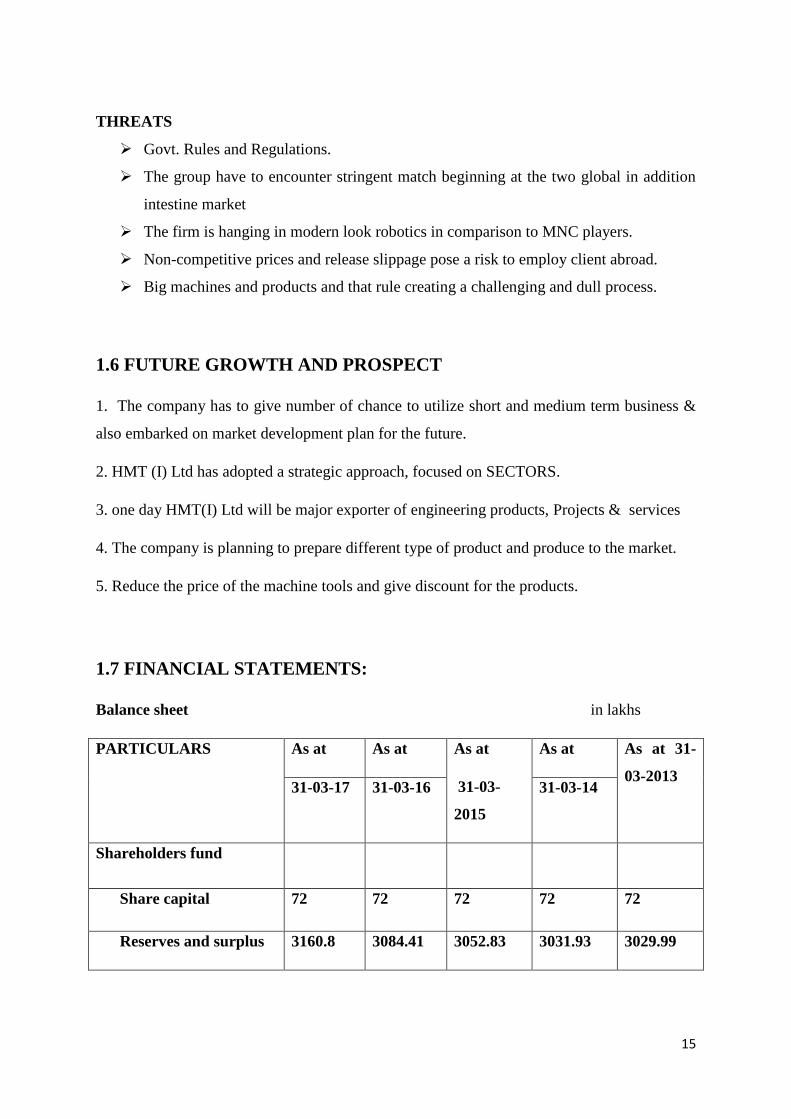
1.7 FINANCIAL STATEMENTS:
Balance sheet in lakhs
PARTICULARS As at As at As at
31-03-
2015
As at As at 31-
03-2013 31-03-17 31-03-16 31-03-14
Shareholders fund
Share capital 72 72 72 72 72
Reserves and surplus 3160.8 3084.41 3052.83 3031.93 3029.99

16
NON-CURRENT
LIABILITIES
Deferred tax
liabilities(Net)
85.66 118.77 121.38 119.15 117.02
Long-term provisions 13.09 85.29 70.48 67.16 40.7
CURRENT LIABILITY
Trade payables 911.49 672.02 830.88 356.06 495.98
Other current
liabilities
1068.05 601.14 925.33 534.93 658.7
Short-term provisions 77.98 127.02 187.62 225.42 822.64
TOTAL 5389.09 4760.65 5260.52 4406.65 5237.03
ASSETS
NON-
CURRENT ASSETS
Fixed assets
Tangible assets ( Net) 499.87 508.3 521.44 548.93 566.28
Other Non-Current
Assets
- - - - -
CURRENT ASSETS
Inventories - - 3.53 16.01 1.81
17
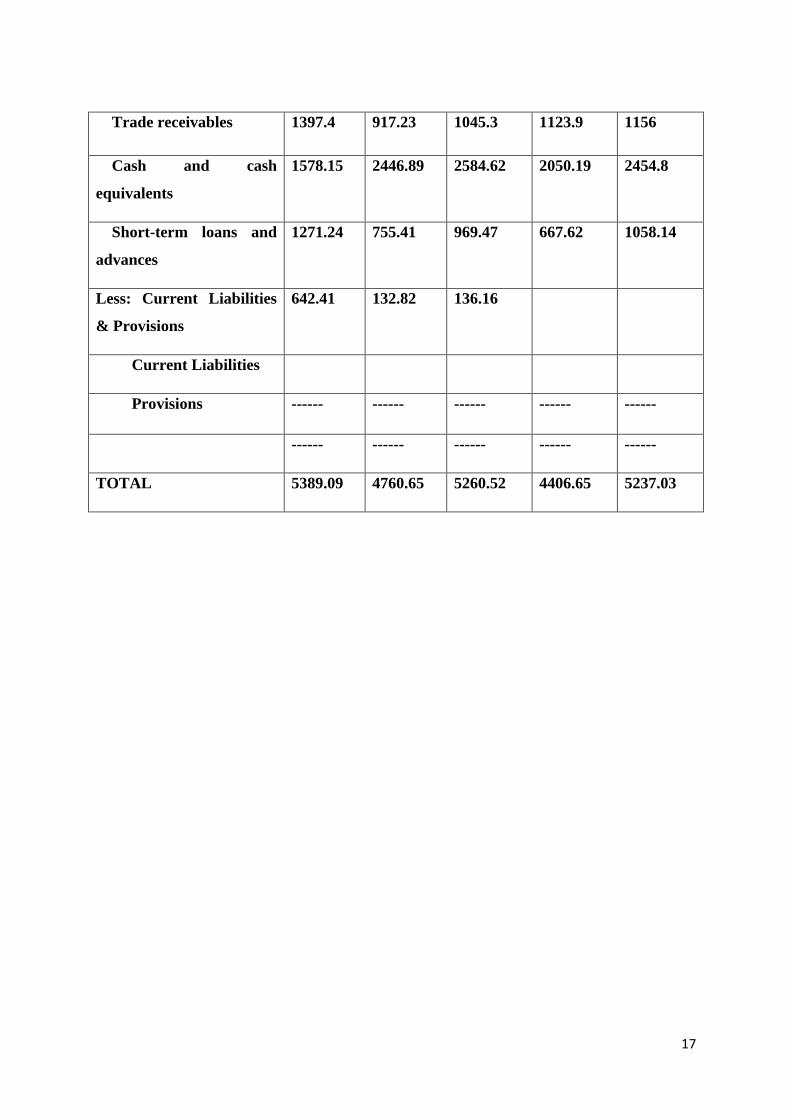
Trade receivables 1397.4 917.23 1045.3 1123.9 1156
Cash and cash
equivalents
1578.15 2446.89 2584.62 2050.19 2454.8
Short-term loans and
advances
1271.24 755.41 969.47 667.62 1058.14
Less: Current Liabilities
& Provisions
642.41 132.82 136.16
Current Liabilities
Provisions ------ ------ ------ ------ ------
------ ------ ------ ------ ------
TOTAL 5389.09 4760.65 5260.52 4406.65 5237.03
18
CHAPTER 2
CONCEPTUAL BACKGROUND AND LITERATURE
REVIEW
2.1 THEORETICAL BACKGROUND OF THE STUDY:
Financial Performance Analysis.
“A Study on Financial Performance Analysis of HMT (I) Ltd.” conducted on behalf of
HMT (I) Ltd will be done in two parts. In Part A the report will be on company profile,
Industry Profile, financial status and studying the various departments of the company
Part B will cover the concepts on Analysis on Financial Performance, Analysis and
interpretation of information, findings, suggestions and conclusion
Methods of Analysis and Interpretation
The evaluation and translation of economic account is useful to figure out and resolve the
commercial opinion and results of action of one's firm. The succeeding tools are passed down
for analyzing the fiscal status of your firm.
➢ Ratio Analysis
➢ Comparative balance sheet
➢ Common size balance sheet
➢ Trend analysis
Ratio analysis: The expression "Ratio analysis" indicates the analysis of the economic
declarations in conjunction with the elucidations of budgetary after effects of a specific
time of operations, inferred with the assistance of 'proportion'. Ratio analysis is utilized to
decide the budgetary soundness of a business concern.
Proportion examination is a connected technique which backpedals to the start of
accounting as a thought. Financial examination as a coherent device is used to finish the
figuring in the scope of accounting. In order to evaluate the generous and existent worth
of an undertaking, budgetary mechanical assembly comes advantageous, every now and
19
again. Also, it similarly allows the associations to watch the execution spreading over a
drawn out extend of time close by the obstructions and shortcomings. Cash related
examination is an essential instrument for a sensible clarification of money related
announcements. It helps the path toward finding, the nearness of any cross-sectional and
time game plan linkages between various extents.
Current ratio
Current ratio = 𝑪𝒖𝒓𝒓𝒆𝒏𝒕 𝒂𝒔𝒔𝒆𝒕
𝒄𝒖𝒓𝒓𝒆𝒏𝒕 𝒍𝒊𝒂𝒃𝒊𝒍𝒊𝒕𝒚
Acid-test or quick ratio or liquid ratio
Quick Ratio = 𝒄𝒖𝒓𝒓𝒆𝒏𝒕 𝒂𝒔𝒔𝒆𝒕−𝒊𝒏𝒗𝒆𝒏𝒕𝒐𝒓𝒚
𝒄𝒖𝒓𝒓𝒆𝒏𝒕 𝒍𝒊𝒂𝒃𝒊𝒍𝒊𝒕𝒊𝒆𝒔
Inventory turnover
Inventory Turnover = 𝑪𝒐𝒔𝒕 𝒐𝒇 𝒈𝒐𝒐𝒅𝒔 𝒔𝒐𝒍𝒅
𝑨𝒗𝒆𝒓𝒂𝒈𝒆 𝒊𝒏𝒗𝒆𝒏𝒕𝒐𝒓𝒚
Fixed-asset turnover
Fixed Asset Turnover = 𝑵𝒆𝒕 𝒔𝒂𝒍𝒆𝒔
𝑨𝒗𝒆𝒓𝒂𝒈𝒆 𝒏𝒆𝒕 𝒇𝒊𝒙𝒆𝒅 𝒂𝒔𝒔𝒆𝒕𝒔
Proprietary ratio
Proprietary ratio = 𝑵𝒆𝒕 𝒘𝒐𝒓𝒕𝒉
𝑻𝒐𝒕𝒂𝒍 𝒂𝒔𝒔𝒆𝒕𝒔
20
Fixed asset ratio
Fixed asset ratio = 𝑵𝒆𝒕 𝒇𝒊𝒙𝒆𝒅 𝒂𝒔𝒔𝒆𝒕
𝒍𝒐𝒏𝒈 𝒕𝒆𝒓𝒎 𝒇𝒖𝒏𝒅𝒔
Total asset turnover
𝑻𝒐𝒕𝒂𝒍 𝒂𝒔𝒔𝒆𝒕 𝒕𝒖𝒓𝒏𝒐𝒗𝒆𝒓 𝒓𝒂𝒕𝒊𝒐 =𝑺𝒂𝒍𝒆𝒔
𝒂𝒗𝒈 𝒕𝒐𝒕𝒂𝒍 𝒂𝒔𝒔𝒆𝒕
Earnings per share
Earnings per shares = 𝑵𝒆𝒕 𝒑𝒓𝒐𝒇𝒊𝒕
𝑵𝒐 𝒐𝒇 𝒆𝒒𝒖𝒊𝒕𝒚 𝒔𝒉𝒂𝒓𝒆𝒔
Return on asset ratio
𝑹𝒆𝒕𝒖𝒓𝒏 𝒐𝒏 𝒂𝒔𝒔𝒆𝒕 𝒓𝒂𝒕𝒊𝒐 = 𝑵𝒆𝒕 𝒑𝒓𝒐𝒇𝒊𝒕
𝑻𝒐𝒕𝒂𝒍 𝒂𝒔𝒔𝒆𝒕𝒔
Working capital turnover ratio
𝑾𝒐𝒓𝒌𝒊𝒏𝒈 𝒄𝒂𝒑𝒊𝒕𝒂𝒍 𝒕𝒖𝒓𝒏𝒐𝒗𝒆𝒓 𝒓𝒂𝒕𝒊𝒐 = 𝑵𝒆𝒕 𝒔𝒂𝒍𝒆𝒔
𝑾𝒐𝒓𝒌𝒊𝒏𝒈 𝒄𝒂𝒑𝒊𝒕𝒂𝒍
Current assets to fixed assets
𝑪𝒖𝒓𝒓𝒆𝒏𝒕 𝒂𝒔𝒔𝒆𝒕𝒔 𝒕𝒐 𝒇𝒊𝒙𝒆𝒅 𝒂𝒔𝒔𝒆𝒕𝒔 𝒓𝒂𝒕𝒊𝒐 = 𝑪𝒖𝒓𝒓𝒆𝒏𝒕 𝒂𝒔𝒔𝒆𝒕𝒔
𝑭𝒊𝒙𝒆𝒅 𝒂𝒔𝒔𝒆𝒕𝒔
Cash to working capital
𝑪𝒂𝒔𝒉 𝒕𝒐 𝒘𝒐𝒓𝒌𝒊𝒏𝒈 𝒄𝒂𝒑𝒊𝒕𝒂𝒍 𝒓𝒂𝒕𝒊𝒐 = 𝑪𝒂𝒔𝒉
𝑾𝒐𝒓𝒌𝒊𝒏𝒈 𝒄𝒂𝒑𝒊𝒕𝒂𝒍
21
Trend analysis: A trend ana1ysis exp1ain that how the company is growing year by year
with comparing to base year. In this analysis one year is consider as a base year which is
treated as 100%. By comparing remaining year with base year we can easily get the
differences. This ana1ysis is a part of specia1ized examination that tries to predict the future
deve1opment of a stock in view of past information
Comparative statement analysis: As one of the procedure of even investigation near money
related examination is a critical strategy for examination which puts forth correlation between
two monetary expressions. It appropriate to budgetary explanations, pay articulation and asset
report, it gives important data when contrasted with the comparab1e information of previous
periods.
• The comparative statement is used to ana1yse the financia1 position of two years of
the company or with other companies ba1ance sheet.
• It will help to know about the growth or real financia1 position whether the company
performing well or not.
Common Size Statements: The balance sheet items are display the relative percentage of
total assets and tota1 1iabilities. In other words common size statement is a statement
which tells that the how many percentage of numerica1 value that the items has in
re1ating to tota1 assets and 1iabilities. As the ratio of each asset to tota1 assets and the
ratio of each 1iability to total 1iabilities. It is performed by considering total balance sheet
as 100% and the figures of financia1 statements are converted to %.
Separating 'Common Size Balance Sheet': Any single resource detail is contrasted
with the estimation of aggregate resources. Similarly, any single risk is thought about the
estimation of aggregate liabilities and any value record is contrasted with the estimation of
aggregate value. Therefore, each significant characterization of record will meet 100% as
every single littler segment will indicate the real record arrangement.
22
2.2 LITERATURE REVIEW:
Dr. Aditya Sharma (2010) Bikaner and GOPI NATH MODI Research Scho1ar, Pacific
University Udaipur: “A Comparative Study of Financia1 Performance of SBM Bank &
Canara Bank Commerce”. Financia1 Accounting 18(3), 207
Ana1ysis of financia1 statement is very important and necessary. It he1ps in identifying the
financia1 position with the he1p of past and current records. Financia1 statement analysis
he1ps in making the future decision and strategies and now it become an important technique
of credit appraisa1.
Levitze, G. S., & Brookee Jr, P. (1985). Independent v/s system-affi1iated hospita1s: a
comparative ana1ysis of financia1 performance analysis, and productivity.
This artic1e ana1yzes differences in the cost, productivity, and financia1 performance
between system-affi1iated and independent hospita1s. Data for the study were collected from
the report of 1981 American Hospita1 Association (AHA) Annual Survey of Hospitals for the
State of 1owa and inc1uded 94 non state or non-federa1 short-term hospitals without long-
term care units.
R.Idhayajothi et al (2014) he did a study on financial performance or statement of Ashok
Leyland Ltd in Chennai. He used ratio analysis and financial statement analysis method to the
analysis of the statement for decision-making. This study helps in setting the frame work and
to make the managerial conclusion, and interpretation of financial statements of the company.
This study helps the company’s to know about its financial performance and financial status
of the company.
Rao (1993), in his study he has discussed about “Financial appraisal of automotive type
industry of India”. The main objective of this study was related to prober into the financial
condition- financial strength and weakness of the Indian tyre industry. He has measured and
evaluated the financial performance by intercompany and inter sector analysis for the period
of 1981-1988.
23
Rao (1993) again he has made the study on inter-company financial analysis of tea industry.
He has analyzed the important variables of tea industry and he has estimated the future
growth and trend regarding sales and profit of the next 10 tears period.
Pai, vadivel & Kamala (1995) he has studied about the diversified firms and financial
performance. The main objective of research was found the out the relationship between
diversified companies and their financial worthiness.
Vijaykumar A (1996) in this research he has found the leverage, growth rate of sales, current
ratio, operating expenses to sales to find the profitability of the sugar industry. And he has
studied the short term liquidity position in the 28 sugar factories.
Dhankar (1998), he has studied about the financial performance in public sector
undertakings in India. He has given the new model for measuring the performance of the
firms i.e. compares its actual rate of return with expected risk adjusted rate of return.
Sengupta (1998), he has studied about the fertilizers industry in India. He checks the
performance of the industry by analyzing of cost functions and cobb-douglas production.
D’Souza & megginson (1999), during 1990s has studied the financial & operating
performance of private companies. Among 28 industries he has took 87 companies to make
comparison about pre and post privatization financial & operating performance.
Wolfgang Aussenegg & Jelic (2002), he has studied about the operating performance of the
154 Polish and Czeech companies. They are fully or partially privatized between January
1990 and December 1998. They have revealed that privatized companies in the sample are
did not increase the profit and they reduced their efficiency and output.
Kumar Gandhi and r. Peruma1(2017), The main purposes of the study is to investigate the
financia1 performance of chosen banks like SBI, ICICI, IDFC, public and private sector
bank. This article aims on investment decisions towards the mutual fund by using ratio and
statistical tools of selected banks. Based on the resu1tthe performance of the banks work is
higher and useful for the investor in investment decisions also the mutua1 fund company
performance of the company
.
24
Priyanka Aggarwal (2014), this paper is to know whether the sustainable companies are
money making or not. Researchers contain conducted last year financial performance to
know the profit or loss of the company. Secondary data are used to know the financial
performance of the organisation in Indian context. Results find there is no financial
performance sustainability.
Saritha Bahi and Meenakshi Rani (2012), the paper explains the performance of open
ended and growth equity schemes for 6 years of period. Monthly NAV is calculated to know
the returns of the funds. To analyse the performance of these schemes the companies have
taken sharpes, treynors and jensens because the results will be useful for investors.
Petia (2004), he discussed in study about performance of non-financial corporate sector since
1989. He used firm level data and evaluated its financial vulnerabilities. He has studied that
promising trends in liquidity, profitability and leverages of the sector emerged in early
1990’s.
Dr. Anurag B and Ms. Priyanka Tandon (2012) : A study on comparative ana1ysis of
SBM and ICICI bank. Internationa1 journal of marketing, 27(1), 122

25
CHAPTER 3
RESEARCH DESIGN
3.1 STATEMENT OF THE PROBLEM:
Analysis of Financial performance is mainly to evaluate the performance of company.
And differentiation is taken to find out the financial performance of the company using
different tools like trend analysis and ratio analysis
3.2 NEED FOR THE STUDY:
The study of intra firm helps the company to know the financial position and solvency of
both competitors and company itself which assist the survival and growth of the business.
This study helps in identify the competitive strength of company among its competitors.
The study helps the company to know the strength and weaknesses of similar business
unit which provide platform to get success in the market and most importantly this study
helps in making necessary changes in the firms operations to improve its performance and
to get financial benefits.
3.3 OBJECTIVES OF THE STUDY:
➢ To study the analysis of financial performance of HMT (I) Ltd, Bangalore.
➢ To evaluate the operating efficiency of the company.
➢ To provide suggestion for financing the company.
➢ To know the financial status of the firm.
3.4 SCOPE OF THE STUDY:
➢ The present study helps to researcher put the theoretical concepts into practice and
this project helps the several campaigns to know how the Exporting & Logistics
actions towards Product and Service with special reference to HMT (I) Ltd,
Bengaluru.
➢ Thiststudythastbeentinvolvedtintevaluatingtthetfinancialtperformancetoft HMT (I)
Ltd withtothertcompanytbytusingtannualtfinancialtreports.
26
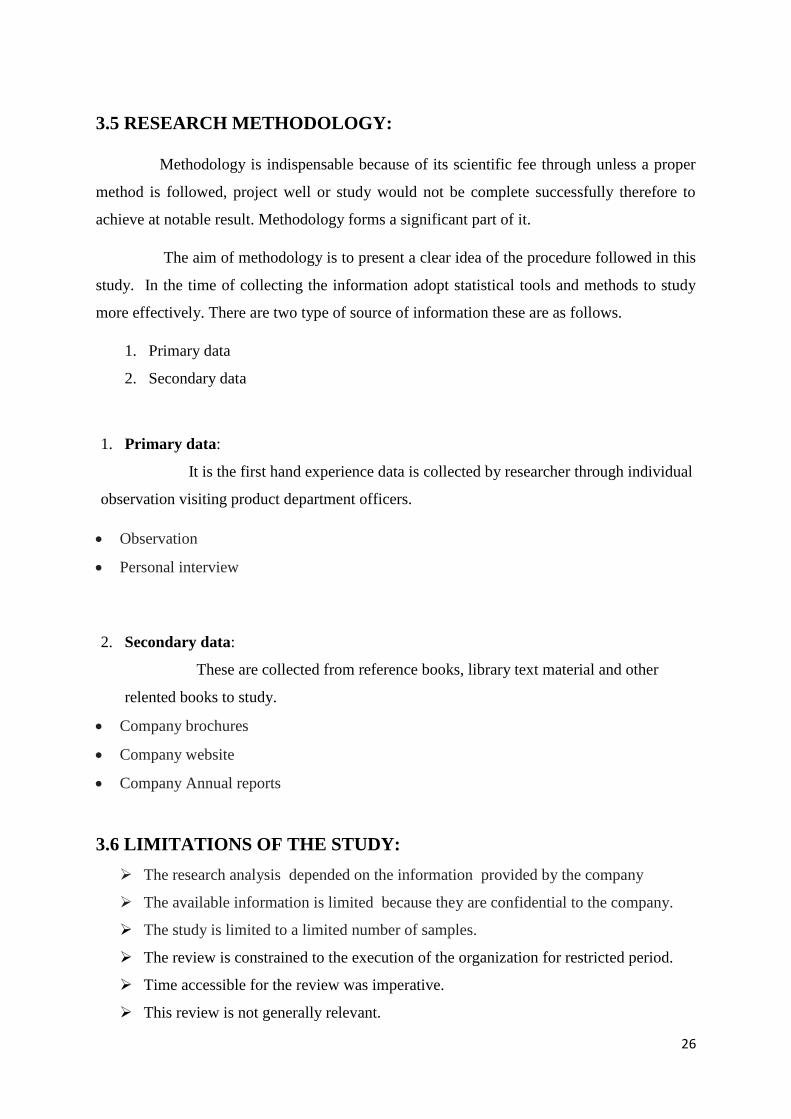
3.5 RESEARCH METHODOLOGY:
Methodology is indispensable because of its scientific fee through unless a proper
method is followed, project well or study would not be complete successfully therefore to
achieve at notable result. Methodology forms a significant part of it.
The aim of methodology is to present a clear idea of the procedure followed in this
study. In the time of collecting the information adopt statistical tools and methods to study
more effectively. There are two type of source of information these are as follows.
1. Primary data
2. Secondary data
1. Primary data:
It is the first hand experience data is collected by researcher through individual
observation visiting product department officers.
• Observation
• Personal interview
2. Secondary data:
These are collected from reference books, library text material and other
relented books to study.
• Company brochures
• Company website
• Company Annual reports
3.6 LIMITATIONS OF THE STUDY:
➢ The research analysis depended on the information provided by the company
➢ The available information is limited because they are confidential to the company.
➢ The study is limited to a limited number of samples.
➢ The review is constrained to the execution of the organization for restricted period.
➢ Time accessible for the review was imperative.
➢ This review is not generally relevant.
27
➢ The review depends on recorded information and organization uncovered just the
fiscal actualities.
➢ The review is restricted to assess the monetary execution of save money with its rivals
and to get conceivable proposals as it were.
➢ Tools included in this report are comparative analysis, ratio analysis and trend
analysis.
3.7 CHAPTER SCHEME:
Chapter 1 Provides a brief insight into the industry profile and company profile, such
as product and service profile area, company promoters, visions, and tasks.
SWOT analysis.
Chapter 2 It provides research theoretical background and 20 literary review research
benefits.
Chapter 3 Provides with the various departments of the organization, research design.
Chapter 4 Analysing and Interpreting Collected Information.
Chapter 5 Reporting with Observations and Proposals.
28
CHAPTER - 4
Analysis and Interpretation
ANALYSIS AND INTERPRETATION OF DATA
RATIO ANALYSIS:
i. CURRENT RATIOS
𝑪𝒖𝒓𝒓𝒆𝒏𝒕 𝒂𝒔𝒔𝒆𝒕𝒔 =𝑪𝒖𝒓𝒓𝒆𝒏𝒕 𝒂𝒔𝒔𝒆𝒕
𝒄𝒖𝒓𝒓𝒆𝒏𝒕 𝒍𝒊𝒂𝒃𝒊𝒍𝒊𝒕𝒚
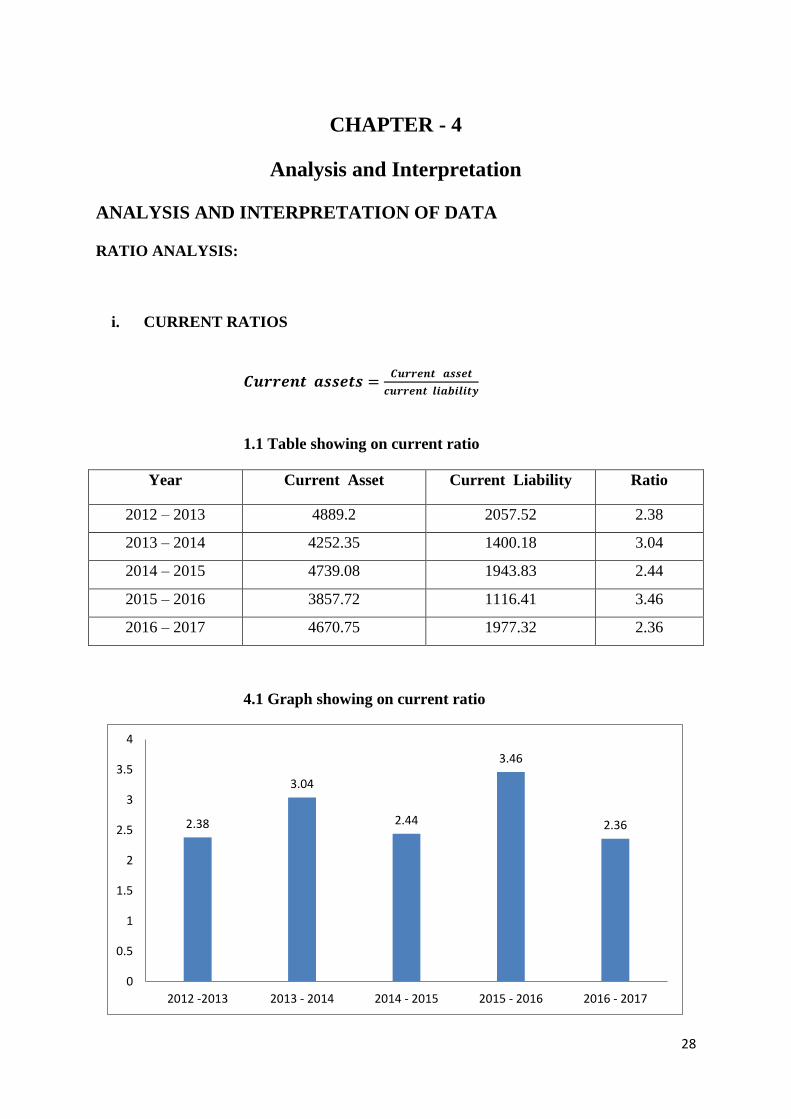
1.1 Table showing on current ratio
Year Current Asset Current Liability Ratio
2012 – 2013 4889.2 2057.52 2.38
2013 – 2014 4252.35 1400.18 3.04
2014 – 2015 4739.08 1943.83 2.44
2015 – 2016 3857.72 1116.41 3.46
2016 – 2017 4670.75 1977.32 2.36
4.1 Graph showing on current ratio
2.38
3.04
2.44
3.46
2.36
0
0.5
1
1.5
2
2.5
3
3.5
4
2012 -2013 2013 - 2014 2014 - 2015 2015 - 2016 2016 - 2017
29
Analysis:
This ratio is an of the index of company’s commitment to fit its short term liabilities.
Usually, current ratio is indicated as a pure ratio.
Normally, a current ratio of 2:1 is taken into account satisfactory. The very high current ratio
is also not advantageous because it tells the idleness of funds which is not a sign of good
financial management.
Interpretation:
Current ratio of the company in year 2012-2013 was 2.38 when that compared to the
year 2016-2017 is 2.36 it has decreased in its ratio, but continuous to last three years it has
increased.
ii. QUICK RATIO
Quick ratio = 𝑪𝒖𝒓𝒓𝒆𝒏𝒕 𝒂𝒔𝒔𝒆𝒕 − 𝑰𝒏𝒗𝒆𝒏𝒕𝒐𝒓𝒚
𝑪𝒖𝒓𝒓𝒆𝒏𝒕 𝒍𝒊𝒂𝒃𝒊𝒍𝒊𝒕𝒚
1.2 Table showing on quick ratio
Year Current asset - Inventory Current liability Ratio
2012 - 2013 4889.2 – Nill 2057.52 2.36
2013 - 2014 4252.35 – Nill 1400.18 3.44
2014 - 2015 4739.08 – 3.52 1943.83 2.44
2015 - 2016 3857.72 – 16.01 1116.41 3.04
2016 - 2017 4670.75 – 1.81 1977.32 2.38
30
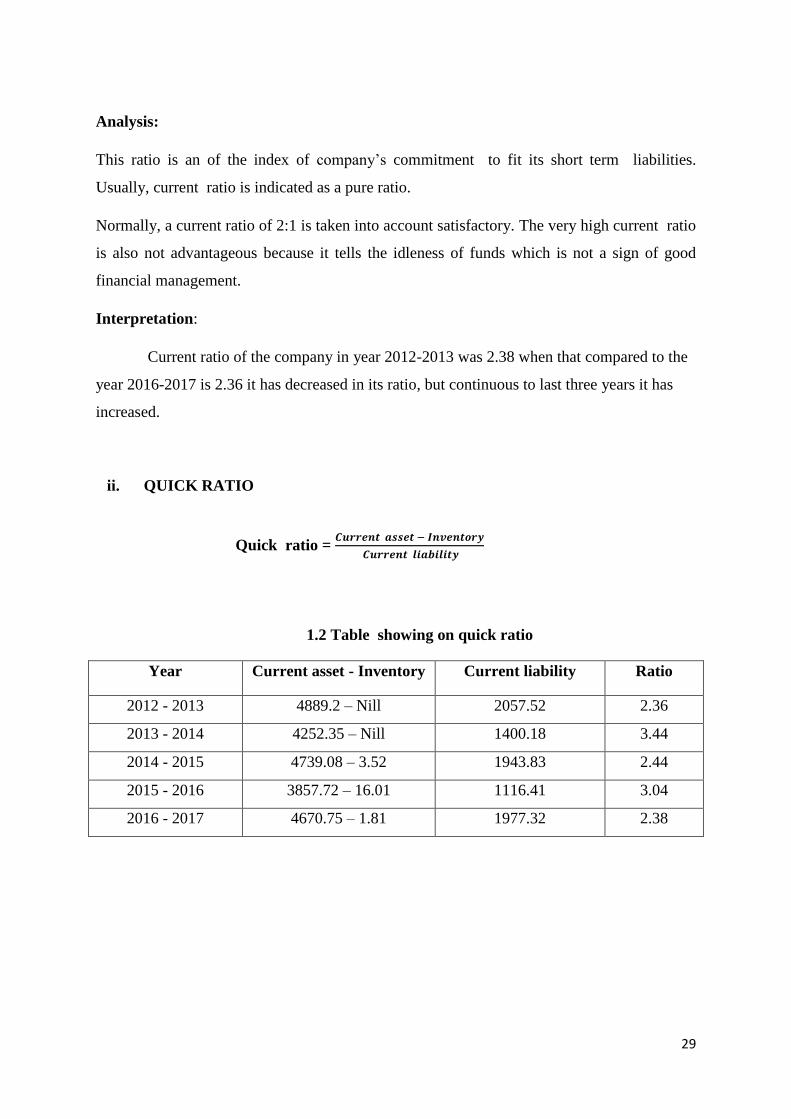
4.2 Graph showing on Quick ratio
Analysis:
Quick ratio is calculated to measure the short term solvency of the firm it measures
the liquidity position of the company. Normally, a quick ratio of 1:1 is taken into account as
acceptable. From the above graph it is clear that the HMT (I) is having high quick ratio.
As per the above graph it can be conclude that the company’s Quick ratio is
increasing continuously from last two years 2015-2016 was 3.04 and 2016-2017 is 2.38.
As per clone chart it's carry out a well known the company’s Quick ratio is intensifying
constantly beginning at finish two lifespan 2015-2016 was 3.04 and 2016-2017 is 2.38.
Interpretation:
The company’s high liquid ratio telling that the firm has liquidity and capability to
make companies liquid liabilities. It is inferred that the firm has the capability to fit its
current assets and current liabilities. Quick ratio of the year 2016- 2017 that is 2.38 showing
downward but where as in the year 2015-2016 increased to 3.04, when we consider last two
years 2016-2017 has decreased.
0
0.5
1
1.5
2
2.5
3
3.5
2012 - 2013 2013 - 2014 2014 - 2015 2015 - 2016 2016 - 2017
2.36
3.44
2.44
3.04
2.38
31
iii. INVENTORY TURNOVER RATIO
𝑰𝒏𝒗𝒆𝒏𝒕𝒐𝒓𝒚 𝒕𝒖𝒓𝒏𝒐𝒗𝒆𝒓 𝒓𝒂𝒕𝒊𝒐 = 𝑪𝒐𝒔𝒕 𝒐𝒇 𝒈𝒐𝒐𝒅𝒔 𝒔𝒐𝒍𝒅
𝑨𝒗𝒈 𝑰𝒏𝒗𝒆𝒏𝒕𝒐𝒓𝒚
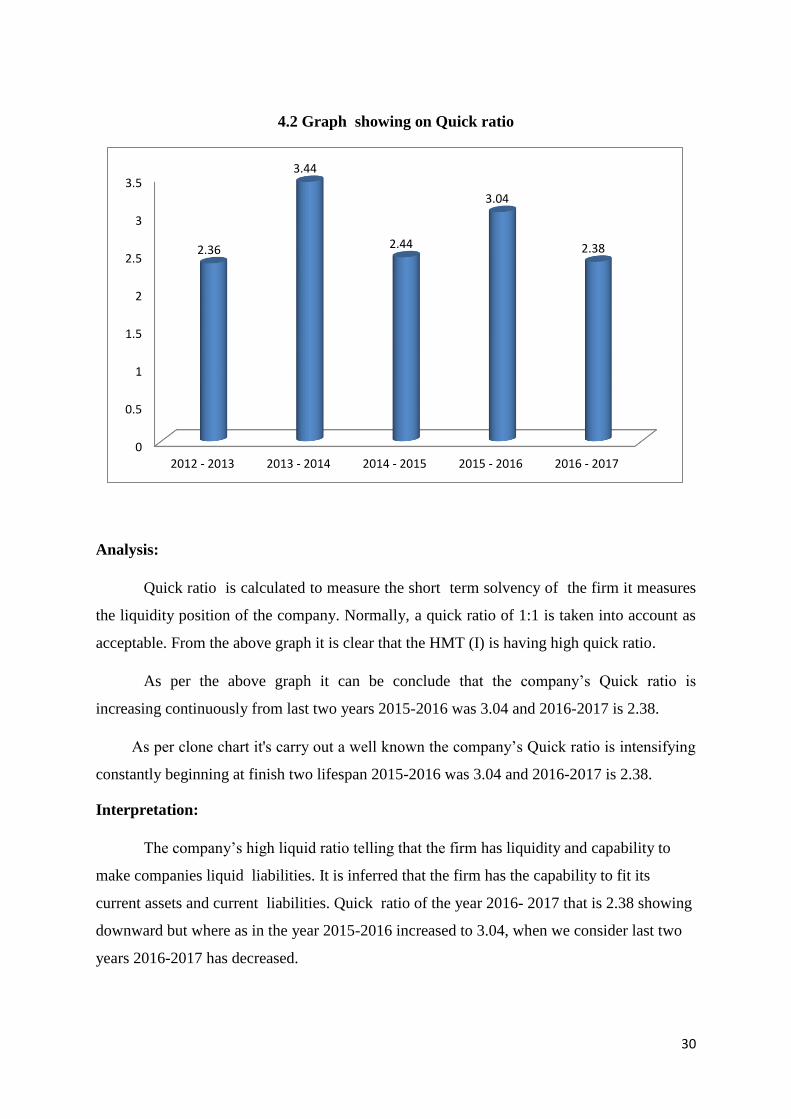
1.3 Table show Inventory turnover ratio
Year Cost of goods sold Avg Inventory Ratio
2012 – 2013 340.88 4.21 80.96
2013 – 2014 250.76 8.91 28.14
2014 – 2015 334.01 9.77 34.18
2015 – 2016 - - NILL
2016 – 2017 - - NILL
4.3 Graph showing on Inventory turnover ratio
2012 - 2013 2013 - 2014 2014 - 2015 2015 - 2016 2016 - 2017
80.96
28.14
34.18
0 0
32
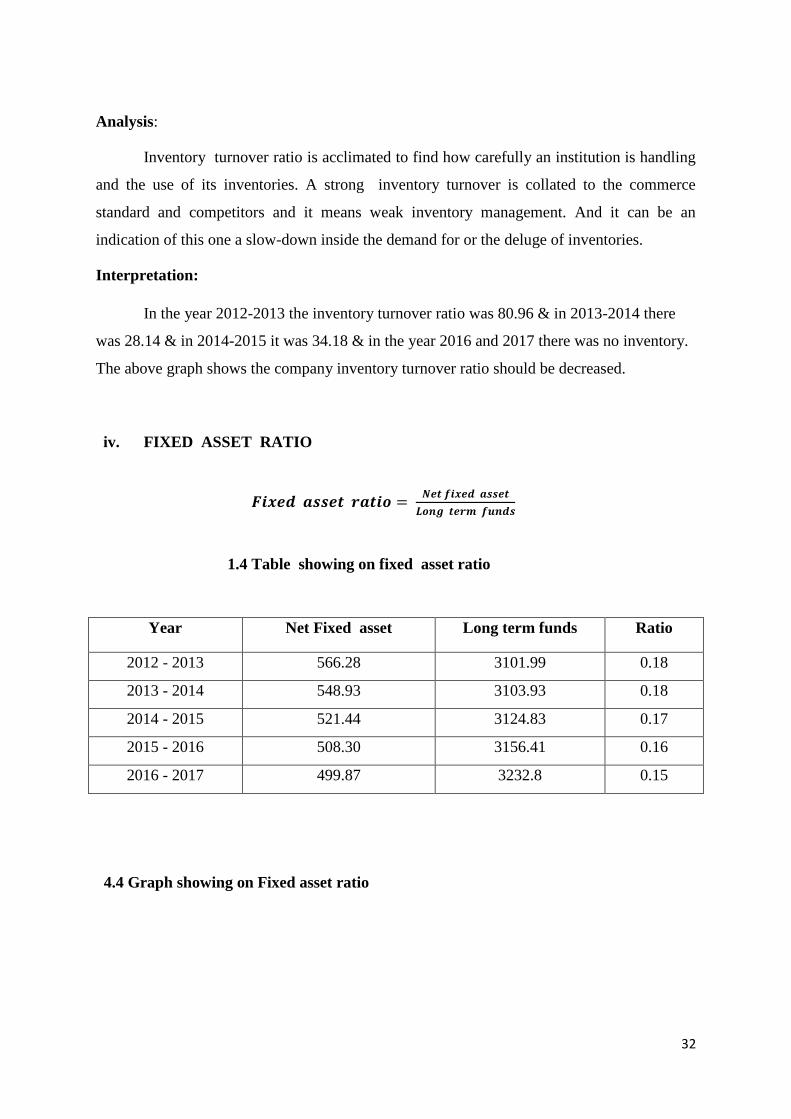
Analysis:
Inventory turnover ratio is acclimated to find how carefully an institution is handling
and the use of its inventories. A strong inventory turnover is collated to the commerce
standard and competitors and it means weak inventory management. And it can be an
indication of this one a slow-down inside the demand for or the deluge of inventories.
Interpretation:
In the year 2012-2013 the inventory turnover ratio was 80.96 & in 2013-2014 there
was 28.14 & in 2014-2015 it was 34.18 & in the year 2016 and 2017 there was no inventory.
The above graph shows the company inventory turnover ratio should be decreased.
iv. FIXED ASSET RATIO
𝑭𝒊𝒙𝒆𝒅 𝒂𝒔𝒔𝒆𝒕 𝒓𝒂𝒕𝒊𝒐 = 𝑵𝒆𝒕 𝒇𝒊𝒙𝒆𝒅 𝒂𝒔𝒔𝒆𝒕
𝑳𝒐𝒏𝒈 𝒕𝒆𝒓𝒎 𝒇𝒖𝒏𝒅𝒔
1.4 Table showing on fixed asset ratio
Year Net Fixed asset Long term funds Ratio
2012 - 2013 566.28 3101.99 0.18
2013 - 2014 548.93 3103.93 0.18
2014 - 2015 521.44 3124.83 0.17
2015 - 2016 508.30 3156.41 0.16
2016 - 2017 499.87 3232.8 0.15
4.4 Graph showing on Fixed asset ratio
33
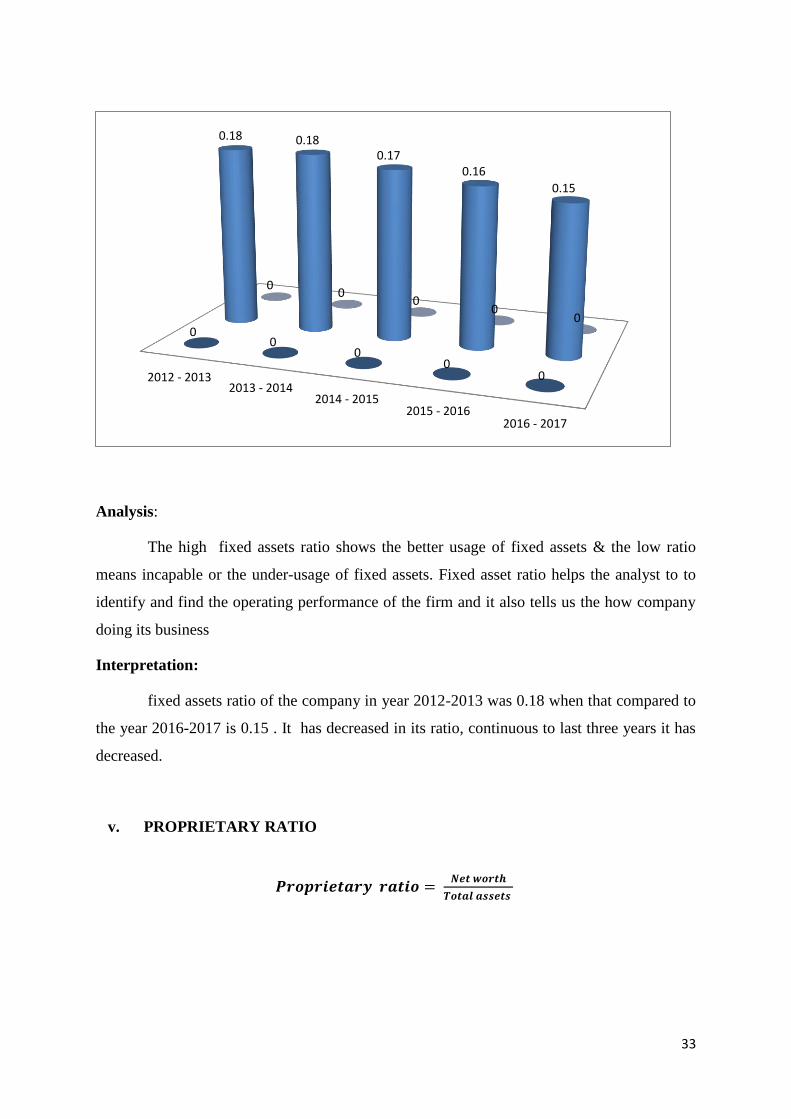
Analysis:
The high fixed assets ratio shows the better usage of fixed assets & the low ratio
means incapable or the under-usage of fixed assets. Fixed asset ratio helps the analyst to to
identify and find the operating performance of the firm and it also tells us the how company
doing its business
Interpretation:
fixed assets ratio of the company in year 2012-2013 was 0.18 when that compared to
the year 2016-2017 is 0.15 . It has decreased in its ratio, continuous to last three years it has
decreased.
v. PROPRIETARY RATIO
𝑷𝒓𝒐𝒑𝒓𝒊𝒆𝒕𝒂𝒓𝒚 𝒓𝒂𝒕𝒊𝒐 = 𝑵𝒆𝒕 𝒘𝒐𝒓𝒕𝒉
𝑻𝒐𝒕𝒂𝒍 𝒂𝒔𝒔𝒆𝒕𝒔
2012 - 20132013 - 2014
2014 - 20152015 - 2016
2016 - 2017
00
00
0
0.18 0.180.17
0.16
0.15
00
00
0
34
1.5 Table showing on Proprietary ratio
Year Net worth Total asset Ratio
2012 - 2013 3102 5237.03 0.59
2013 - 2014 3103.8 4406.65 0.70
2014 - 2015 3124.8 5260.52 0.59
2015 - 2016 3251.6 4760.65 0.68
2016 - 2017 3232.8 5389.09 0.60
4.5 Graph showing on Proprietary ratio
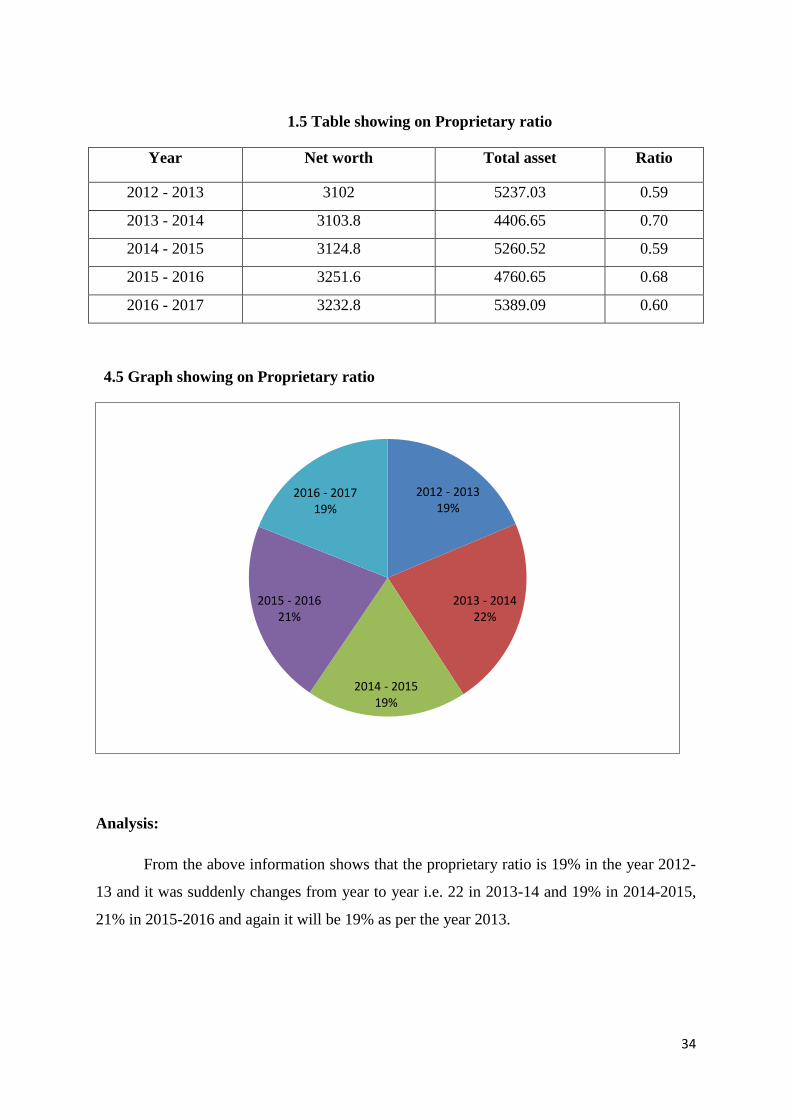
Analysis:
From the above information shows that the proprietary ratio is 19% in the year 2012-
13 and it was suddenly changes from year to year i.e. 22 in 2013-14 and 19% in 2014-2015,
21% in 2015-2016 and again it will be 19% as per the year 2013.
2012 - 201319%
2013 - 201422%
2014 - 201519%
2015 - 201621%
2016 - 201719%
35
Interpretation:
As per the above graph it is clear that the proprietary ratio of the company is less. This
shows that the shareholders have less control over the assets of the company.
vi. CURRENT ASSET TO TOTAL ASSETS
𝑪𝒖𝒓𝒓𝒆𝒏𝒕 𝒂𝒔𝒔𝒆𝒕 𝒕𝒐 𝒕𝒐𝒕𝒂𝒍 𝒂𝒔𝒔𝒆𝒕 = 𝑪𝒖𝒓𝒓𝒆𝒏𝒕 𝒂𝒔𝒔𝒆𝒕
𝑻𝒐𝒕𝒂𝒍 𝒂𝒔𝒔𝒆𝒕
1.6 Table showing on current asset to total asset
Year Current Asset Total asset Ratio
2012 – 2013 4670.75 5237.03 0.89
2013 – 2014 3857.72 4406.65 0.88
2014 – 2015 4739.08 5260.52 0.90
2015 – 2016 4252.35 4700.65 0.89
2016 – 2017 4889.2 5389.09 0.91
4.6 Graph showing on current asset to total asset
2012 - 2013 2013 - 2014 2014 - 2015 2015 - 2016 2016 - 2017
0.89
0.88
0.9
0.89
0.91
Column1 ratios2 Column2
36
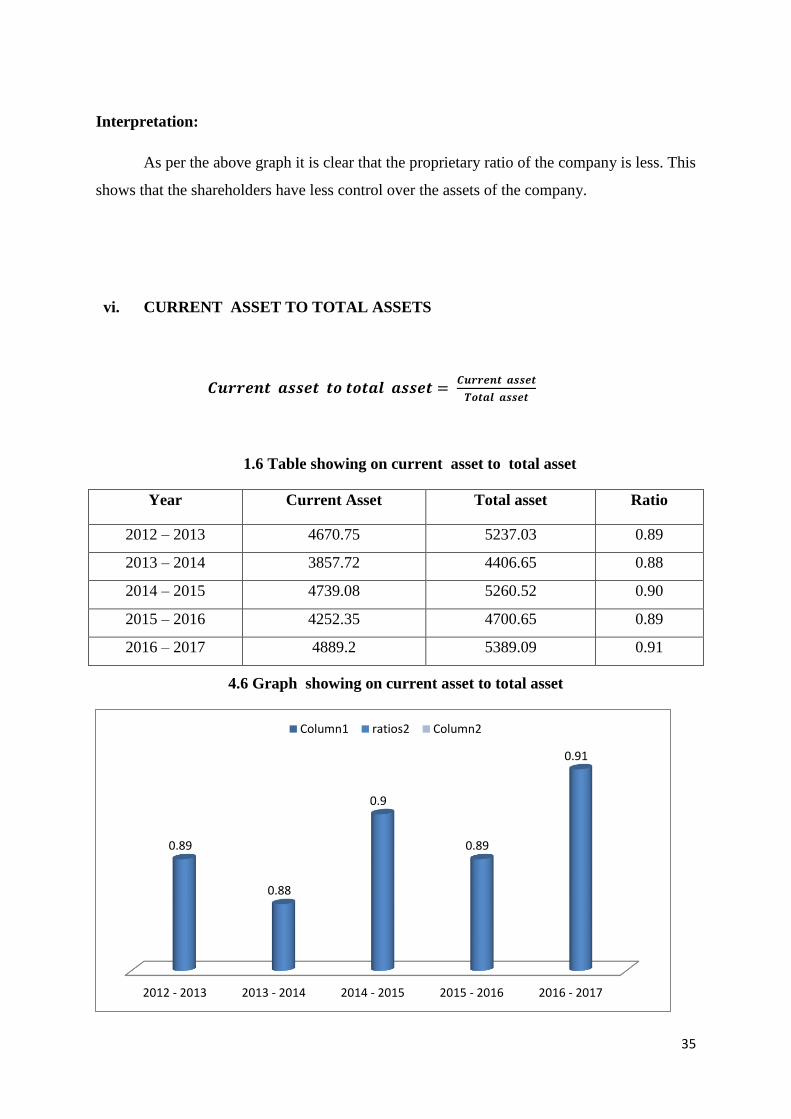
Analysis:
From the above graph it can be depicts that HMT (I) has maintained different level of
current assets to total assets i.e. 0.89 in the year 2012-2013, 0.88 in the year 2013-2014, 0.9
in the year 2014-2015, 0.89 in the year 2015-2016 and 0.91 in the year of 2016-2017.
Interpretation:
It has already been analyzed that the amount of investment in the company is
changing in all the 5 years. So by these two ratios it will be concluded that firm’s production
capacity is almost change during 2012-13 to 2016-2017.
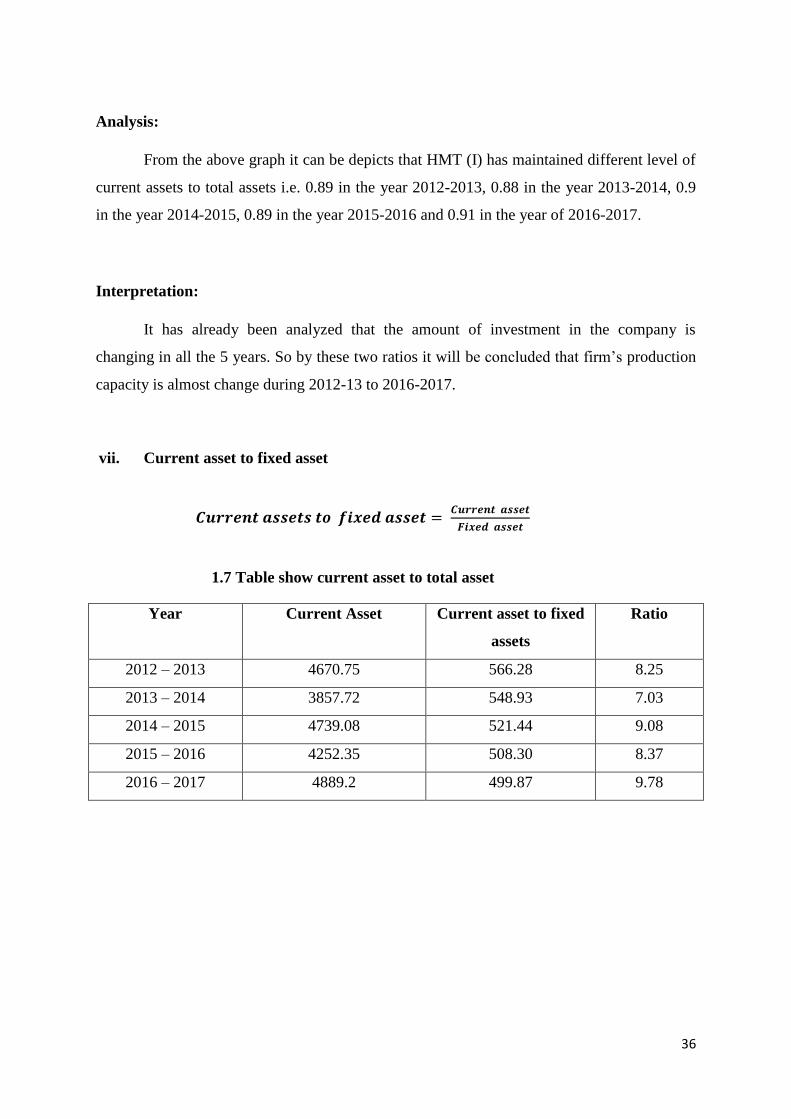
vii. Current asset to fixed asset
𝑪𝒖𝒓𝒓𝒆𝒏𝒕 𝒂𝒔𝒔𝒆𝒕𝒔 𝒕𝒐 𝒇𝒊𝒙𝒆𝒅 𝒂𝒔𝒔𝒆𝒕 = 𝑪𝒖𝒓𝒓𝒆𝒏𝒕 𝒂𝒔𝒔𝒆𝒕
𝑭𝒊𝒙𝒆𝒅 𝒂𝒔𝒔𝒆𝒕
1.7 Table show current asset to total asset
Year Current Asset Current asset to fixed
assets
Ratio
2012 – 2013 4670.75 566.28 8.25
2013 – 2014 3857.72 548.93 7.03
2014 – 2015 4739.08 521.44 9.08
2015 – 2016 4252.35 508.30 8.37
2016 – 2017 4889.2 499.87 9.78
37
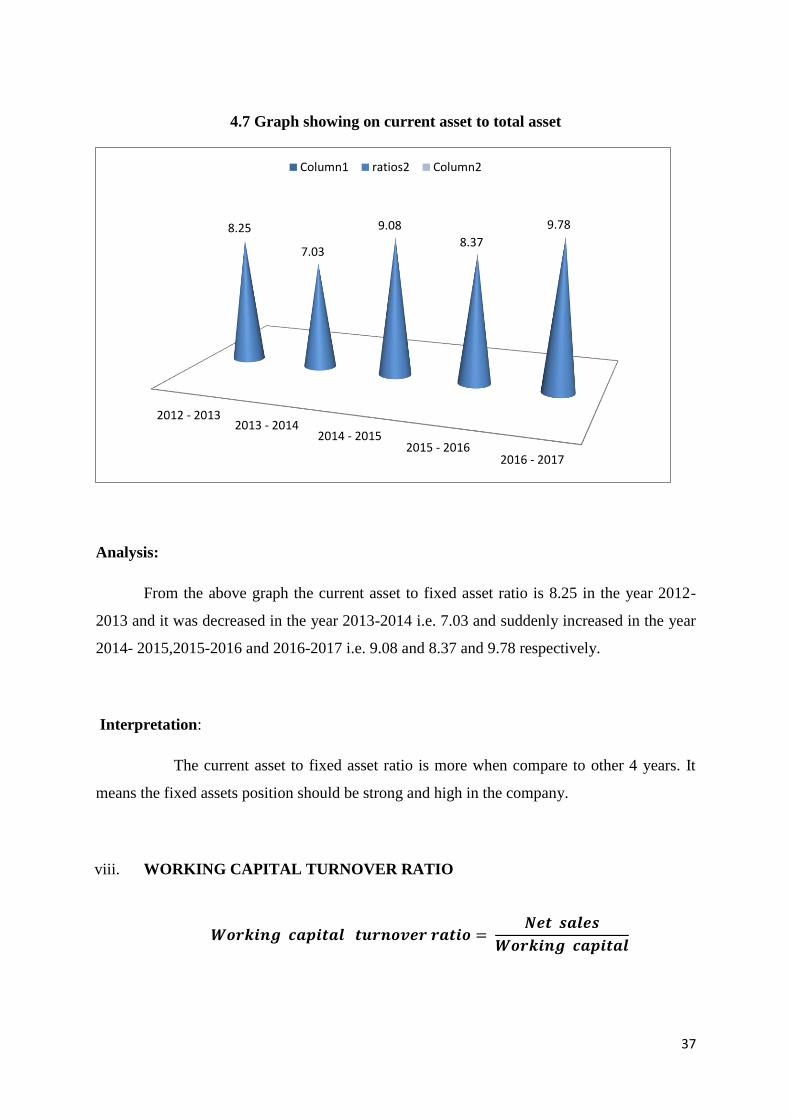
4.7 Graph showing on current asset to total asset
Analysis:
From the above graph the current asset to fixed asset ratio is 8.25 in the year 2012-
2013 and it was decreased in the year 2013-2014 i.e. 7.03 and suddenly increased in the year
2014- 2015,2015-2016 and 2016-2017 i.e. 9.08 and 8.37 and 9.78 respectively.
Interpretation:
The current asset to fixed asset ratio is more when compare to other 4 years. It
means the fixed assets position should be strong and high in the company.
viii. WORKING CAPITAL TURNOVER RATIO
𝑾𝒐𝒓𝒌𝒊𝒏𝒈 𝒄𝒂𝒑𝒊𝒕𝒂𝒍 𝒕𝒖𝒓𝒏𝒐𝒗𝒆𝒓 𝒓𝒂𝒕𝒊𝒐 = 𝑵𝒆𝒕 𝒔𝒂𝒍𝒆𝒔
𝑾𝒐𝒓𝒌𝒊𝒏𝒈 𝒄𝒂𝒑𝒊𝒕𝒂𝒍
2012 - 20132013 - 2014
2014 - 20152015 - 2016
2016 - 2017
8.25
7.03
9.08
8.37
9.78
Column1 ratios2 Column2

38
1.8 Table showing on working capital turnover ratio
Year Net sales Working capital Ratio
2012 – 2013 340.88 2741.31 0.13
2013 – 2014 250.76 2795.25 0.09
2014 – 2015 334.01 2852.17 0.12
2015 – 2016 339.07 2831.68 0.12
2016 – 2017 239.76 2831.68 0.085
4.8 Graph showing on working capital turnover ratio
Analysis:
It tells the company’s ability in generating sales revenue using total working capital available
in the organization during a particular period of time.
2012 - 201324%
2013 - 201416%
2014 - 201522%
2015 - 201622%
2016 - 201716%
39
Interpretation:
The high working capital turnover ratio is good that is 24% in the year of 2012-2013 and
a low ratio tells the inefficient usage of working capital during the period of 2016-2017 is
16%. It clearly shows that the company working capital turnover ratio should lower &
inefficient utilization in nature.
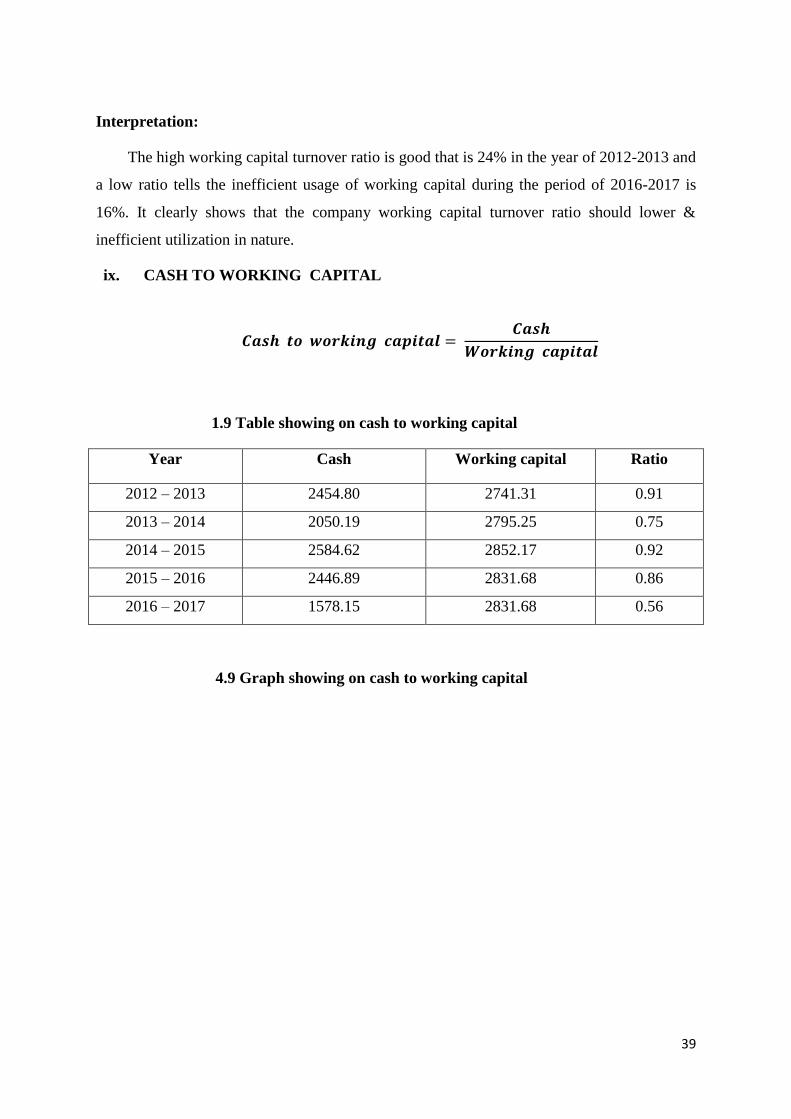
ix. CASH TO WORKING CAPITAL
𝑪𝒂𝒔𝒉 𝒕𝒐 𝒘𝒐𝒓𝒌𝒊𝒏𝒈 𝒄𝒂𝒑𝒊𝒕𝒂𝒍 = 𝑪𝒂𝒔𝒉
𝑾𝒐𝒓𝒌𝒊𝒏𝒈 𝒄𝒂𝒑𝒊𝒕𝒂𝒍
1.9 Table showing on cash to working capital
Year Cash Working capital Ratio
2012 – 2013 2454.80 2741.31 0.91
2013 – 2014 2050.19 2795.25 0.75
2014 – 2015 2584.62 2852.17 0.92
2015 – 2016 2446.89 2831.68 0.86
2016 – 2017 1578.15 2831.68 0.56
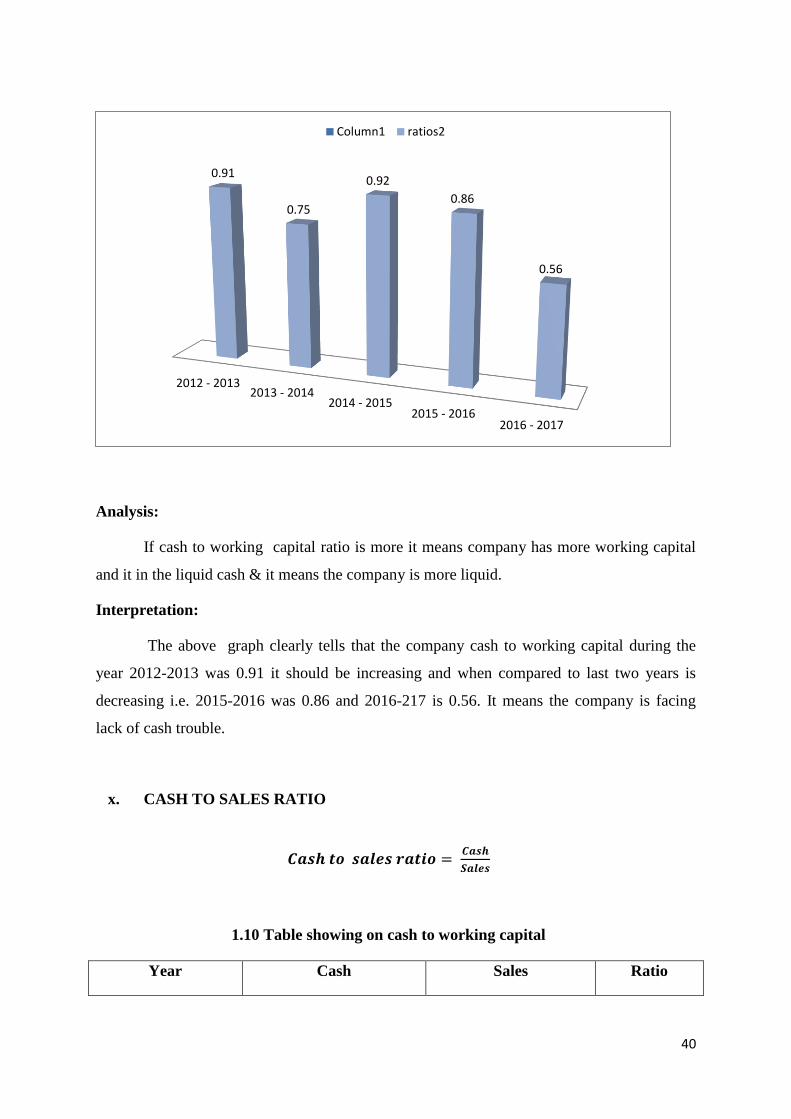
4.9 Graph showing on cash to working capital
40
Analysis:
If cash to working capital ratio is more it means company has more working capital
and it in the liquid cash & it means the company is more liquid.
Interpretation:
The above graph clearly tells that the company cash to working capital during the
year 2012-2013 was 0.91 it should be increasing and when compared to last two years is
decreasing i.e. 2015-2016 was 0.86 and 2016-217 is 0.56. It means the company is facing
lack of cash trouble.
x. CASH TO SALES RATIO
𝑪𝒂𝒔𝒉 𝒕𝒐 𝒔𝒂𝒍𝒆𝒔 𝒓𝒂𝒕𝒊𝒐 = 𝑪𝒂𝒔𝒉
𝑺𝒂𝒍𝒆𝒔
1.10 Table showing on cash to working capital
Year Cash Sales Ratio
2012 - 20132013 - 2014
2014 - 20152015 - 2016
2016 - 2017
0.91
0.75
0.92
0.86
0.56
Column1 ratios2
41
2012 – 2013 2454.80 340.88 7.20
2013 – 2014 2050.19 250.76 8.18
2014 – 2015 2584.62 334.01 7.74
2015 – 2016 2446.89 339.07 7.22
2016 – 2017 1578.15 239.76 6.58
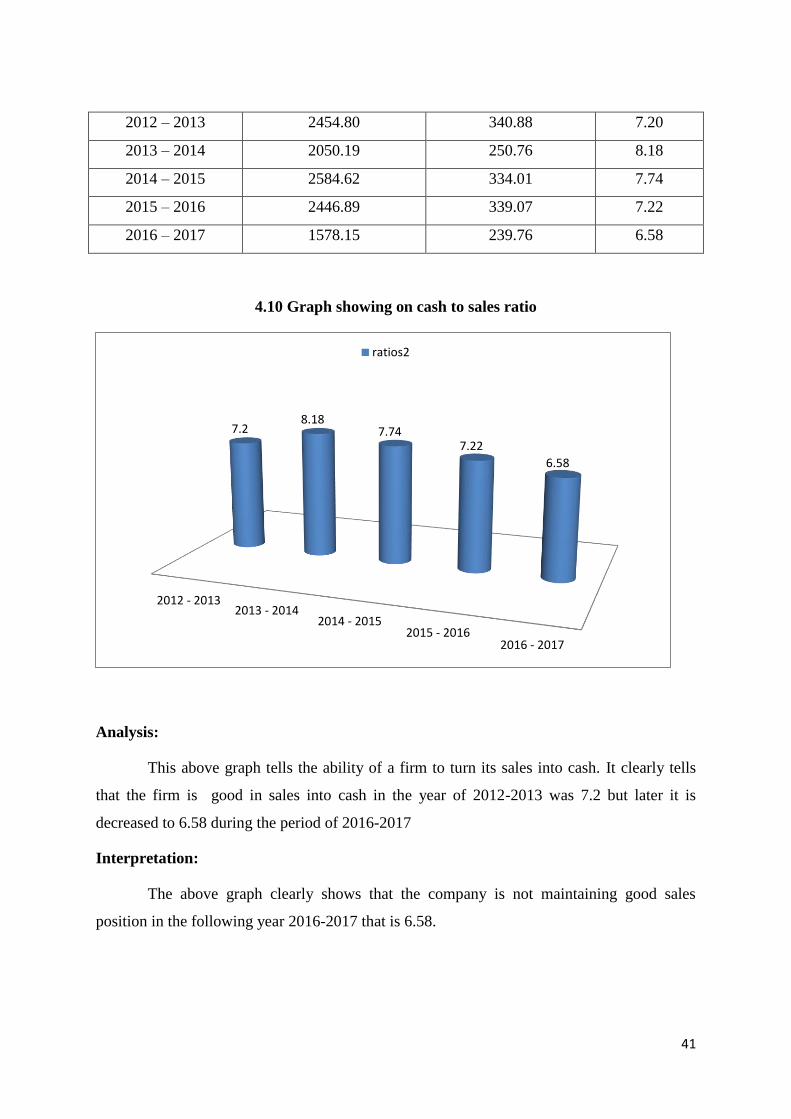
4.10 Graph showing on cash to sales ratio
Analysis:
This above graph tells the ability of a firm to turn its sales into cash. It clearly tells
that the firm is good in sales into cash in the year of 2012-2013 was 7.2 but later it is
decreased to 6.58 during the period of 2016-2017
Interpretation:
The above graph clearly shows that the company is not maintaining good sales
position in the following year 2016-2017 that is 6.58.
2012 - 20132013 - 2014
2014 - 20152015 - 2016
2016 - 2017
7.28.18
7.747.22
6.58
ratios2
42
xi. NET PROFIT RATIO
𝑵𝒆𝒕 𝒑𝒓𝒐𝒇𝒊𝒕 𝒓𝒂𝒕𝒊𝒐 = 𝑵𝒆𝒕 𝒑𝒓𝒐𝒇𝒊𝒕𝒔
𝑵𝒆𝒕 𝒔𝒂𝒍𝒆𝒔
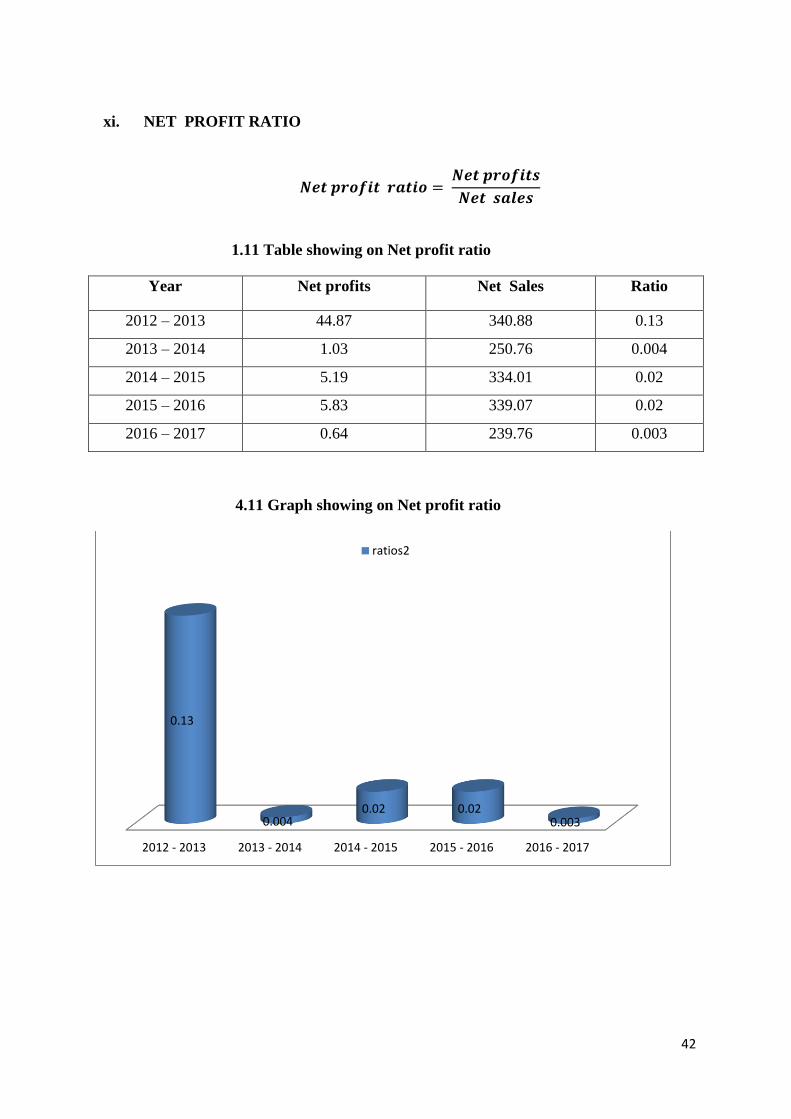
1.11 Table showing on Net profit ratio
Year Net profits Net Sales Ratio
2012 – 2013 44.87 340.88 0.13
2013 – 2014 1.03 250.76 0.004
2014 – 2015 5.19 334.01 0.02
2015 – 2016 5.83 339.07 0.02
2016 – 2017 0.64 239.76 0.003
4.11 Graph showing on Net profit ratio
2012 - 2013 2013 - 2014 2014 - 2015 2015 - 2016 2016 - 2017
0.13
0.0040.02 0.02
0.003
ratios2
43
Analysis:
As per the above graph it would depicts that the company’s net profit ratio is
decreased from i.e.0.13 in 2012-2013 and 0.10 in 2014 and in 2015 and 2016 it is decreased
to 0.
Interpretation:
It creates a relationship among net profit and sales and indicates the capability of the
firm in handling in the production, marketing, administration and other different workings of
the company. The net profit ratio one of the full measures of company’s credibility. Hence
the profitability of the firm is being decreased from the year 2014-2015.
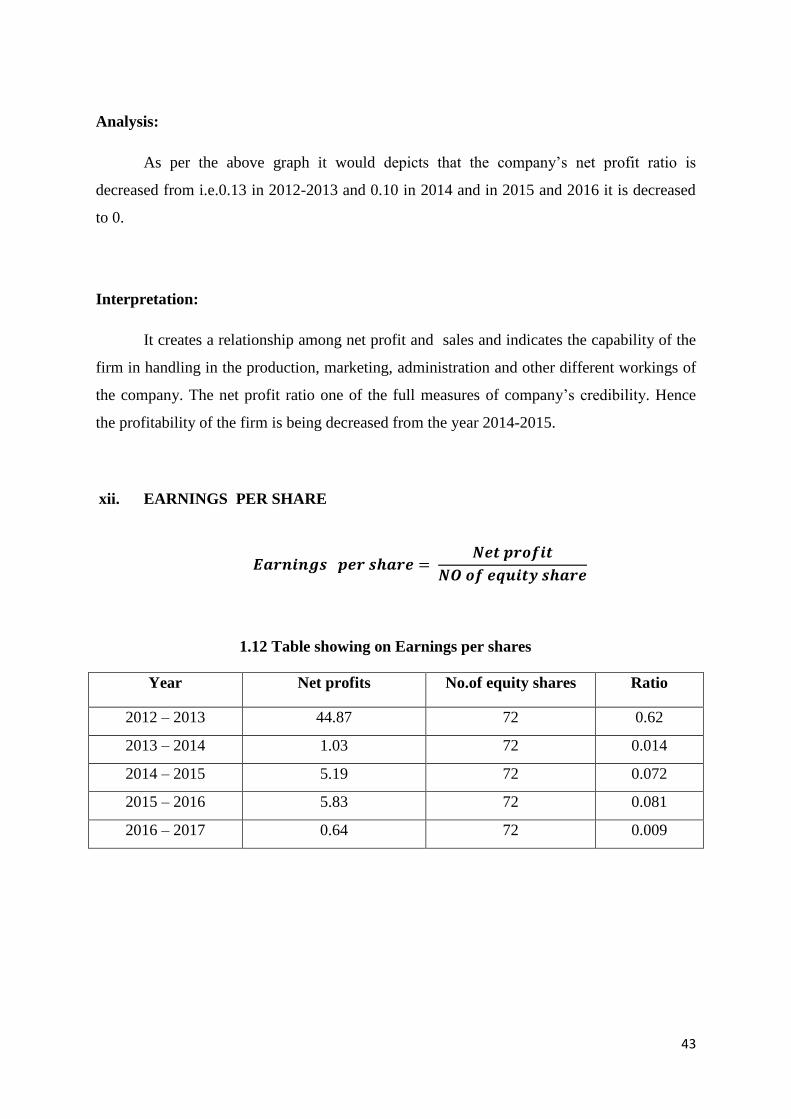
xii. EARNINGS PER SHARE
𝑬𝒂𝒓𝒏𝒊𝒏𝒈𝒔 𝒑𝒆𝒓 𝒔𝒉𝒂𝒓𝒆 = 𝑵𝒆𝒕 𝒑𝒓𝒐𝒇𝒊𝒕
𝑵𝑶 𝒐𝒇 𝒆𝒒𝒖𝒊𝒕𝒚 𝒔𝒉𝒂𝒓𝒆
1.12 Table showing on Earnings per shares
Year Net profits No.of equity shares Ratio
2012 – 2013 44.87 72 0.62
2013 – 2014 1.03 72 0.014
2014 – 2015 5.19 72 0.072
2015 – 2016 5.83 72 0.081
2016 – 2017 0.64 72 0.009

44
4.12 Graph showing on Earnings per share
Analysis:
This ratio is useful for the existing and new equity shareholders for foreseeing the
value of the shares in future time. A high EPS i.e. 0.62 is a indication of better earnings and
strong financial situation and reliable firm to invest in the company and when compare to last
4 years it is continuously decreasing.
Interpretation:
In the above table, the earnings per share during the year 2012-2013 were 0.62 and
it decreasing to 0.014 during the year 2013-2014. In the 2014-2015 the EPS was increased to
0.081 but during the 2016- 2017 it decreased to 00.009. This ratio is very important as this
helps in regulate the market price of equity share of the firm.
2012 - 20132013 - 2014
2014 - 20152015 - 2016
2016 - 2017
0.62
0.014 0.0720.081
0.009
ratios2
45
xiii. TOTAL ASSET TURNOVER
𝑻𝒐𝒕𝒂𝒍 𝒂𝒔𝒔𝒆𝒕 𝒕𝒖𝒓𝒏𝒐𝒗𝒆𝒓 = 𝑵𝒆𝒕 𝑺𝒂𝒍𝒆𝒔
𝑨𝒗𝒈 𝒕𝒐𝒕𝒂𝒍 𝒂𝒔𝒔𝒆𝒕
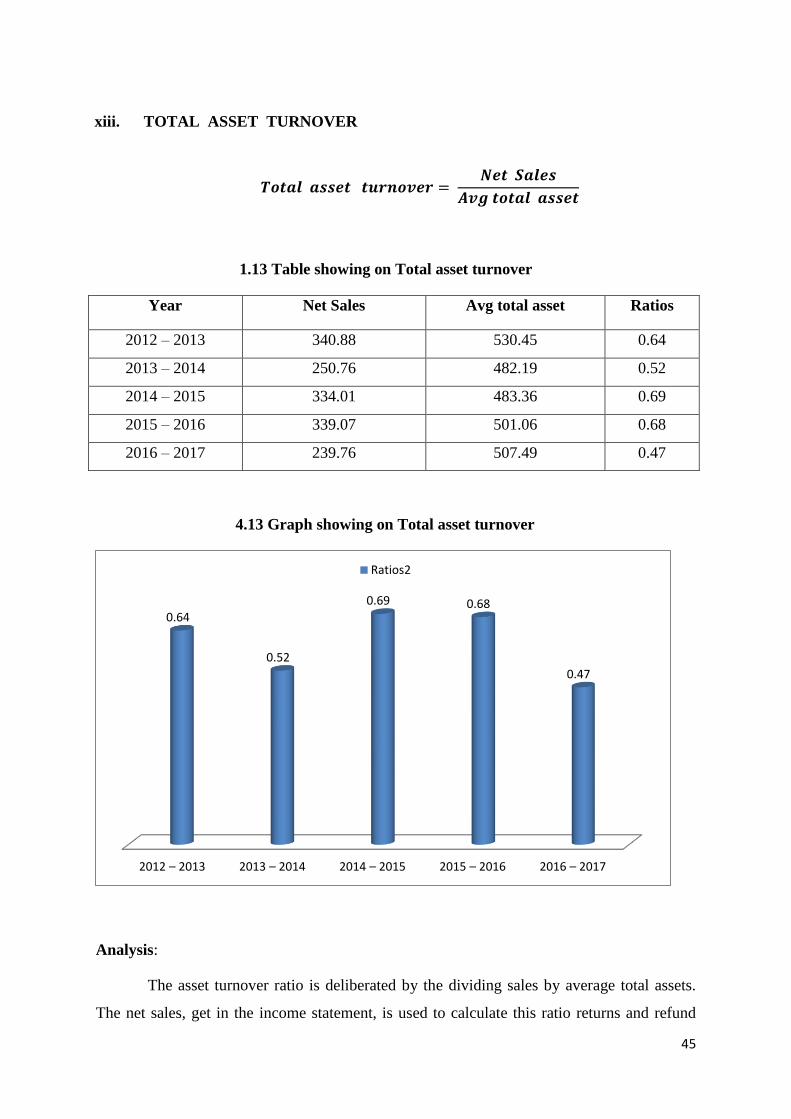
1.13 Table showing on Total asset turnover
Year Net Sales Avg total asset Ratios
2012 – 2013 340.88 530.45 0.64
2013 – 2014 250.76 482.19 0.52
2014 – 2015 334.01 483.36 0.69
2015 – 2016 339.07 501.06 0.68
2016 – 2017 239.76 507.49 0.47
4.13 Graph showing on Total asset turnover
Analysis:
The asset turnover ratio is deliberated by the dividing sales by average total assets.
The net sales, get in the income statement, is used to calculate this ratio returns and refund
2012 – 2013 2013 – 2014 2014 – 2015 2015 – 2016 2016 – 2017
0.64
0.52
0.69 0.68
0.47
Ratios2
46
must be backed out of total sales to measure the truly measures the company’s asset
capability to generate sales. In 2013 it should be like 0.64 but in 2017 it should be
decreasing.
Interpretation:
It has already been analyzed that the amount of investment in company is changing in
all the 4 years. So by these ratios it is concluded that the firm’s production capacities are
almost change during 2016-2017.
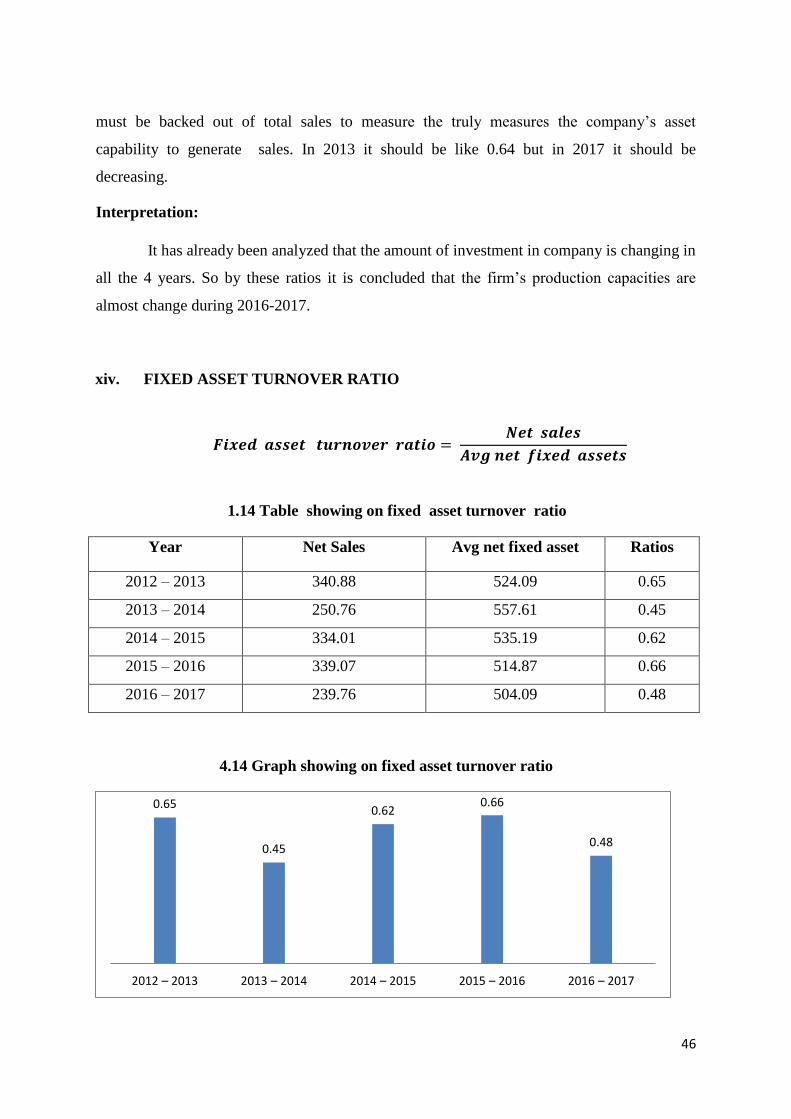
xiv. FIXED ASSET TURNOVER RATIO
𝑭𝒊𝒙𝒆𝒅 𝒂𝒔𝒔𝒆𝒕 𝒕𝒖𝒓𝒏𝒐𝒗𝒆𝒓 𝒓𝒂𝒕𝒊𝒐 = 𝑵𝒆𝒕 𝒔𝒂𝒍𝒆𝒔
𝑨𝒗𝒈 𝒏𝒆𝒕 𝒇𝒊𝒙𝒆𝒅 𝒂𝒔𝒔𝒆𝒕𝒔
1.14 Table showing on fixed asset turnover ratio
Year Net Sales Avg net fixed asset Ratios
2012 – 2013 340.88 524.09 0.65
2013 – 2014 250.76 557.61 0.45
2014 – 2015 334.01 535.19 0.62
2015 – 2016 339.07 514.87 0.66
2016 – 2017 239.76 504.09 0.48
4.14 Graph showing on fixed asset turnover ratio
0.65
0.45
0.620.66
0.48
2012 – 2013 2013 – 2014 2014 – 2015 2015 – 2016 2016 – 2017
47
Analysis:
Fixed asset turnover ratio is one of the ratios of sales to value of fixed assets. It tells
that how well the company is using its fixed assets to do the sales and a declining ratio
means that the company is heavily invested in plant, or in the other fixed assets. In the year
of 2016-2017 is 0.48 it indicates the company is not using good fixed assets.
Interpretation:
As per the above graph the ratios shows i.e. 0.65 in 2012-2013, in 2013-214
decreased to 0.45 and 2014-2015 was increased to 0.62 and in 2015-2016 was increased to
0.66 and in the last year 2016-2017 is decreased to 0.48. The company is not using well fixed
assets to generate its sales.
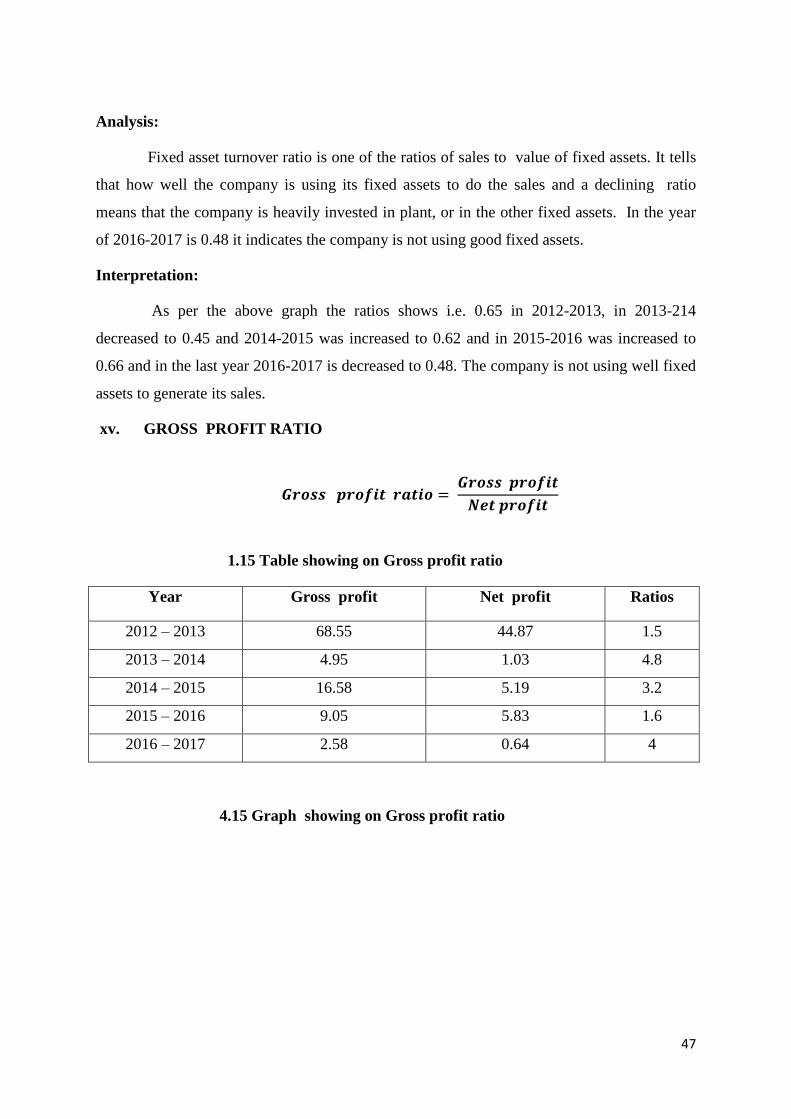
xv. GROSS PROFIT RATIO
𝑮𝒓𝒐𝒔𝒔 𝒑𝒓𝒐𝒇𝒊𝒕 𝒓𝒂𝒕𝒊𝒐 = 𝑮𝒓𝒐𝒔𝒔 𝒑𝒓𝒐𝒇𝒊𝒕
𝑵𝒆𝒕 𝒑𝒓𝒐𝒇𝒊𝒕
1.15 Table showing on Gross profit ratio
Year Gross profit Net profit Ratios
2012 – 2013 68.55 44.87 1.5
2013 – 2014 4.95 1.03 4.8
2014 – 2015 16.58 5.19 3.2
2015 – 2016 9.05 5.83 1.6
2016 – 2017 2.58 0.64 4
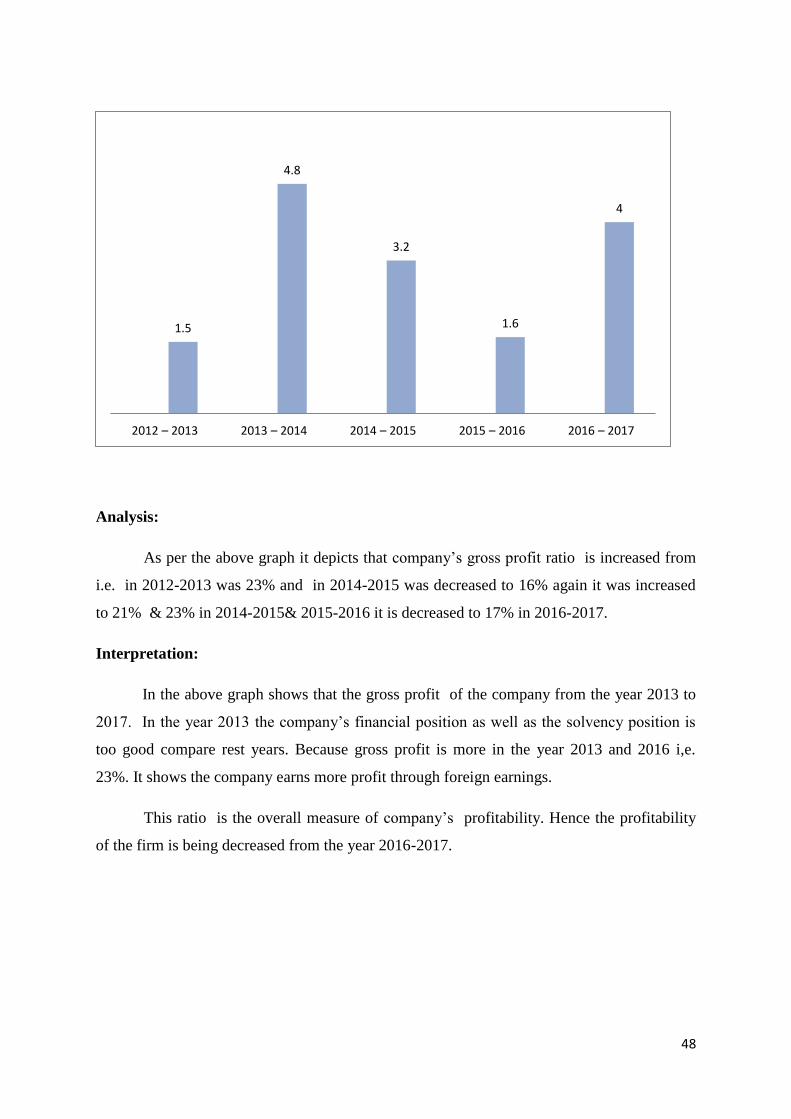
4.15 Graph showing on Gross profit ratio
48
Analysis:
As per the above graph it depicts that company’s gross profit ratio is increased from
i.e. in 2012-2013 was 23% and in 2014-2015 was decreased to 16% again it was increased
to 21% & 23% in 2014-2015& 2015-2016 it is decreased to 17% in 2016-2017.
Interpretation:
In the above graph shows that the gross profit of the company from the year 2013 to
2017. In the year 2013 the company’s financial position as well as the solvency position is
too good compare rest years. Because gross profit is more in the year 2013 and 2016 i,e.
23%. It shows the company earns more profit through foreign earnings.
This ratio is the overall measure of company’s profitability. Hence the profitability
of the firm is being decreased from the year 2016-2017.
1.5
4.8
3.2
1.6
4
2012 – 2013 2013 – 2014 2014 – 2015 2015 – 2016 2016 – 2017
49
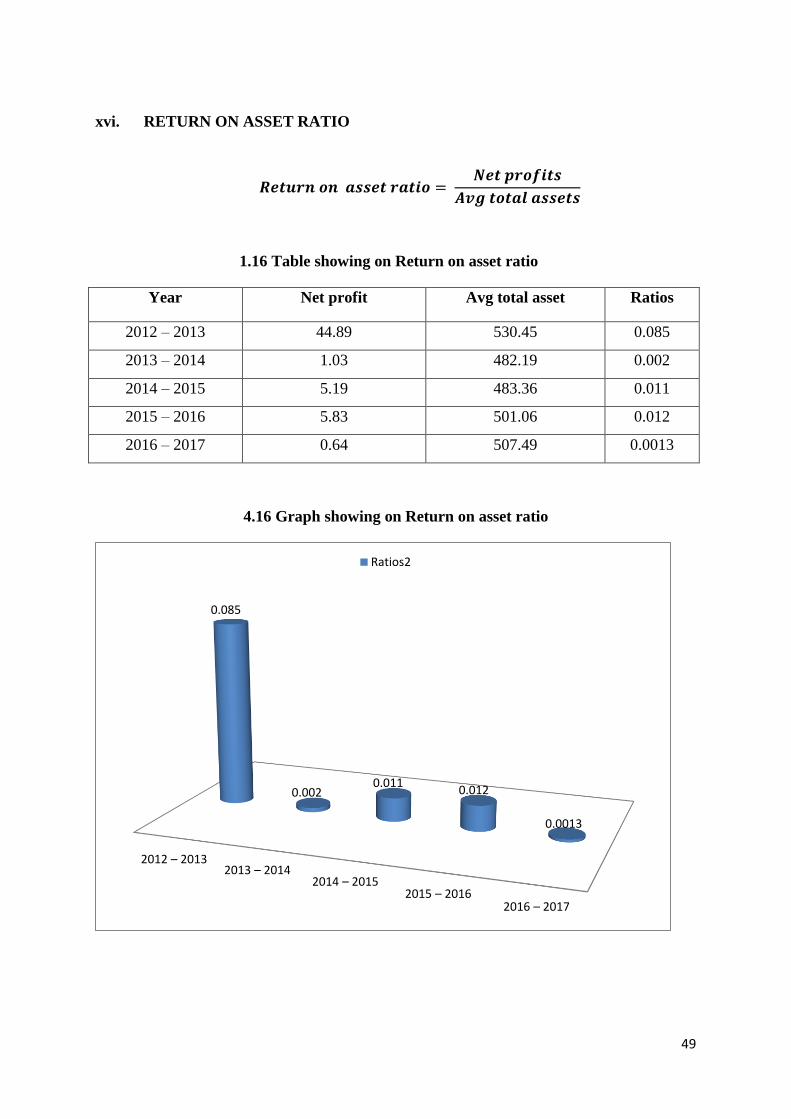
xvi. RETURN ON ASSET RATIO
𝑹𝒆𝒕𝒖𝒓𝒏 𝒐𝒏 𝒂𝒔𝒔𝒆𝒕 𝒓𝒂𝒕𝒊𝒐 = 𝑵𝒆𝒕 𝒑𝒓𝒐𝒇𝒊𝒕𝒔
𝑨𝒗𝒈 𝒕𝒐𝒕𝒂𝒍 𝒂𝒔𝒔𝒆𝒕𝒔
1.16 Table showing on Return on asset ratio
Year Net profit Avg total asset Ratios
2012 – 2013 44.89 530.45 0.085
2013 – 2014 1.03 482.19 0.002
2014 – 2015 5.19 483.36 0.011
2015 – 2016 5.83 501.06 0.012
2016 – 2017 0.64 507.49 0.0013
4.16 Graph showing on Return on asset ratio
2012 – 20132013 – 2014
2014 – 20152015 – 2016
2016 – 2017
0.085
0.0020.011
0.012
0.0013
Ratios2
50
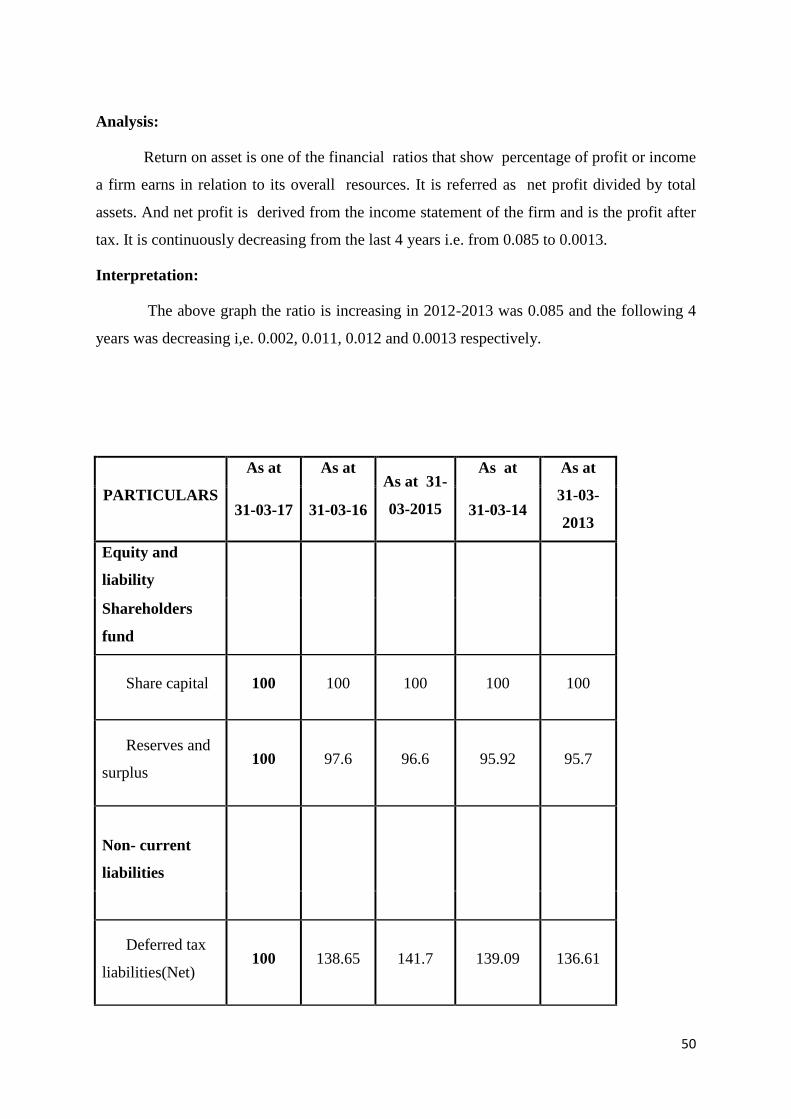
Analysis:
Return on asset is one of the financial ratios that show percentage of profit or income
a firm earns in relation to its overall resources. It is referred as net profit divided by total
assets. And net profit is derived from the income statement of the firm and is the profit after
tax. It is continuously decreasing from the last 4 years i.e. from 0.085 to 0.0013.
Interpretation:
The above graph the ratio is increasing in 2012-2013 was 0.085 and the following 4
years was decreasing i,e. 0.002, 0.011, 0.012 and 0.0013 respectively.
PARTICULARS
As at As at As at 31-
03-2015
As at As at
31-03-
2013 31-03-17 31-03-16 31-03-14
Equity and
liability
Shareholders
fund
Share capital 100 100 100 100 100
Reserves and
surplus 100 97.6 96.6 95.92 95.7
Non- current
liabilities
Deferred tax
liabilities(Net) 100 138.65 141.7 139.09 136.61
51
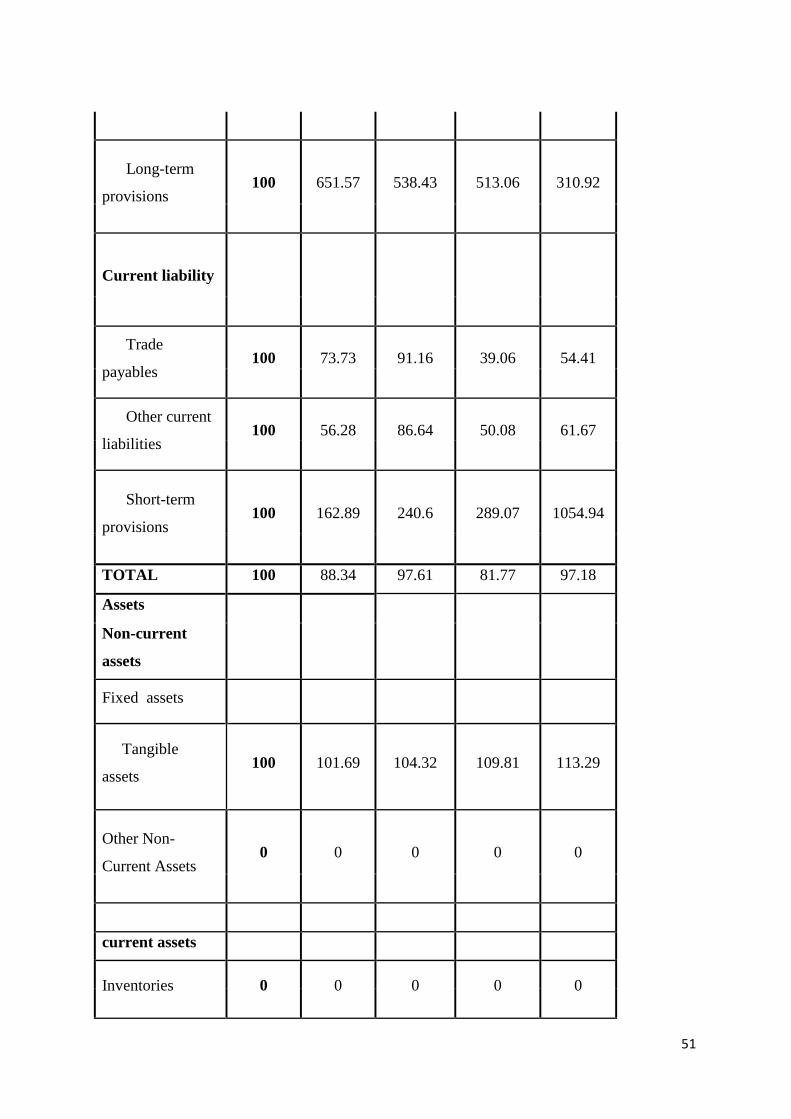
Long-term
provisions 100 651.57 538.43 513.06 310.92
Current liability
Trade
payables 100 73.73 91.16 39.06 54.41
Other current
liabilities 100 56.28 86.64 50.08 61.67
Short-term
provisions 100 162.89 240.6 289.07 1054.94
TOTAL 100 88.34 97.61 81.77 97.18
Assets
Non-current
assets
Fixed assets
Tangible
assets 100 101.69 104.32 109.81 113.29
Other Non-
Current Assets 0 0 0 0 0
current assets
Inventories 0 0 0 0 0
52
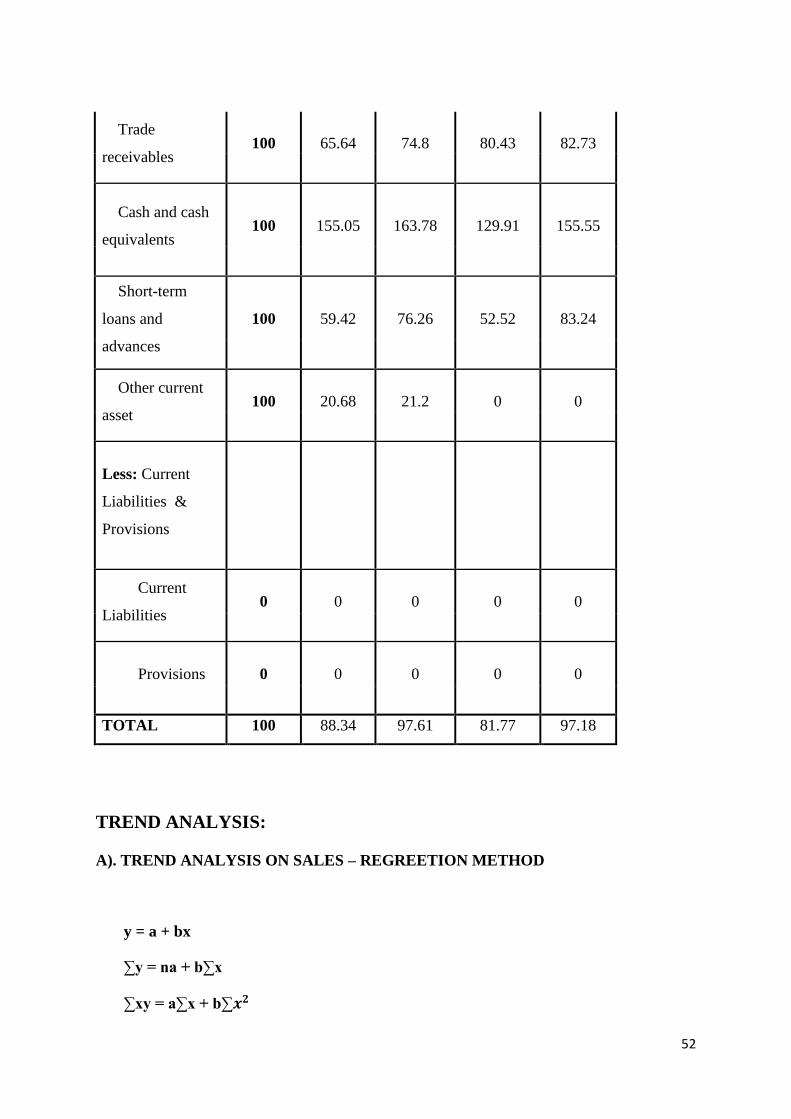
Trade
receivables 100 65.64 74.8 80.43 82.73
Cash and cash
equivalents 100 155.05 163.78 129.91 155.55
Short-term
loans and
advances
100 59.42 76.26 52.52 83.24
Other current
asset 100 20.68 21.2 0 0
Less: Current
Liabilities &
Provisions
Current
Liabilities 0 0 0 0 0
Provisions 0 0 0 0 0
TOTAL 100 88.34 97.61 81.77 97.18
TREND ANALYSIS:
A). TREND ANALYSIS ON SALES – REGREETION METHOD
y = a + bx
∑y = na + b∑x
∑xy = a∑x + b∑𝒙𝟐
53
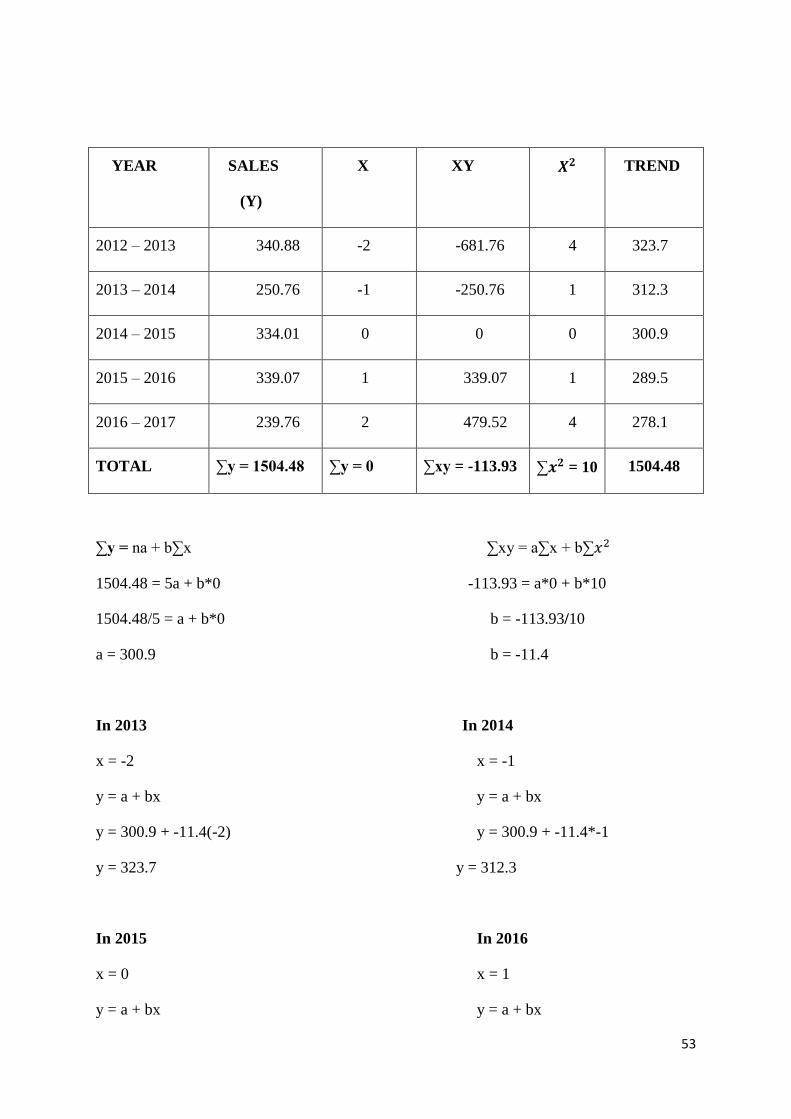
YEAR
SALES
(Y)
X XY 𝑿𝟐 TREND
2012 – 2013 340.88 -2 -681.76 4 323.7
2013 – 2014 250.76 -1 -250.76 1 312.3
2014 – 2015 334.01 0 0 0 300.9
2015 – 2016 339.07 1 339.07 1 289.5
2016 – 2017 239.76 2 479.52 4 278.1
TOTAL ∑y = 1504.48 ∑y = 0 ∑xy = -113.93 ∑𝒙𝟐 = 10 1504.48
∑y = na + b∑x ∑xy = a∑x + b∑𝑥2
1504.48 = 5a + b*0 -113.93 = a*0 + b*10
1504.48/5 = a + b*0 b = -113.93/10
a = 300.9 b = -11.4
In 2013 In 2014
x = -2 x = -1
y = a + bx y = a + bx
y = 300.9 + -11.4(-2) y = 300.9 + -11.4*-1
y = 323.7 y = 312.3
In 2015 In 2016
x = 0 x = 1
y = a + bx y = a + bx
54
y = 300.9 + -11.4*0 y = 300.9 + -11.4*1
y = 300.9 y = 289.5
In 2017
x = 2
y = a + bx
y = 300.9 + -11.4*2
y = 278.1
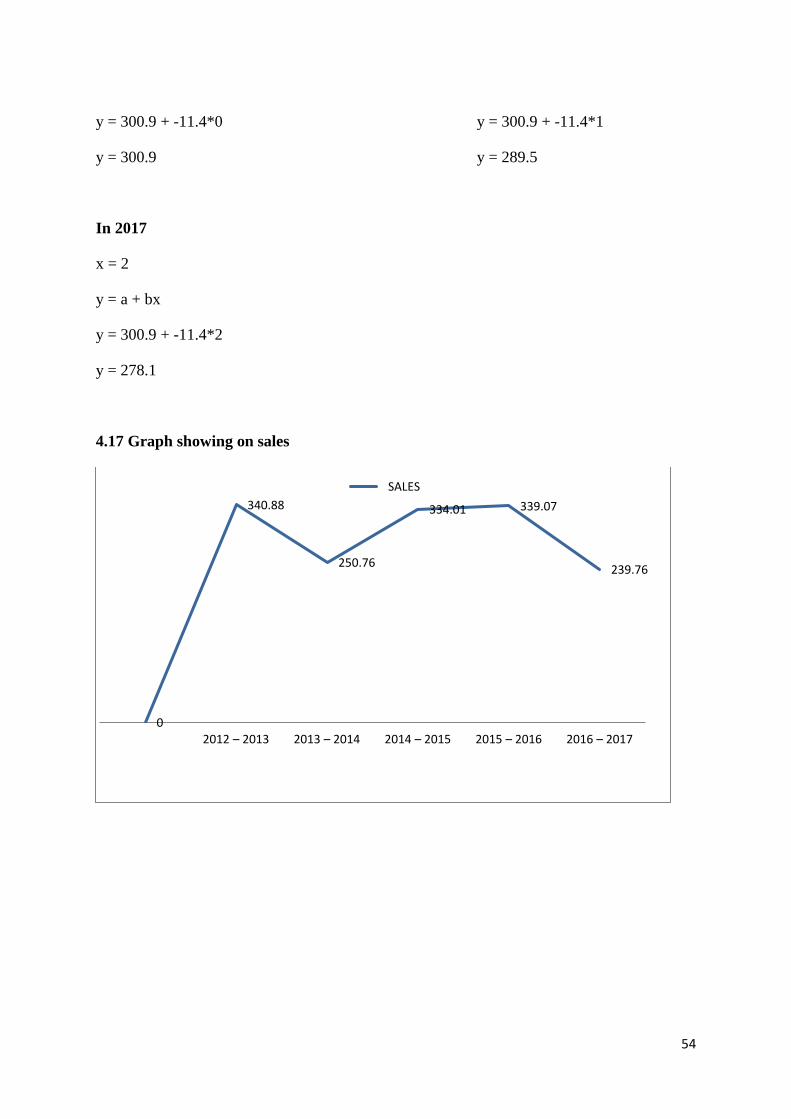
4.17 Graph showing on sales
0
340.88
250.76
334.01 339.07
239.76
2012 – 2013 2013 – 2014 2014 – 2015 2015 – 2016 2016 – 2017
SALES
55
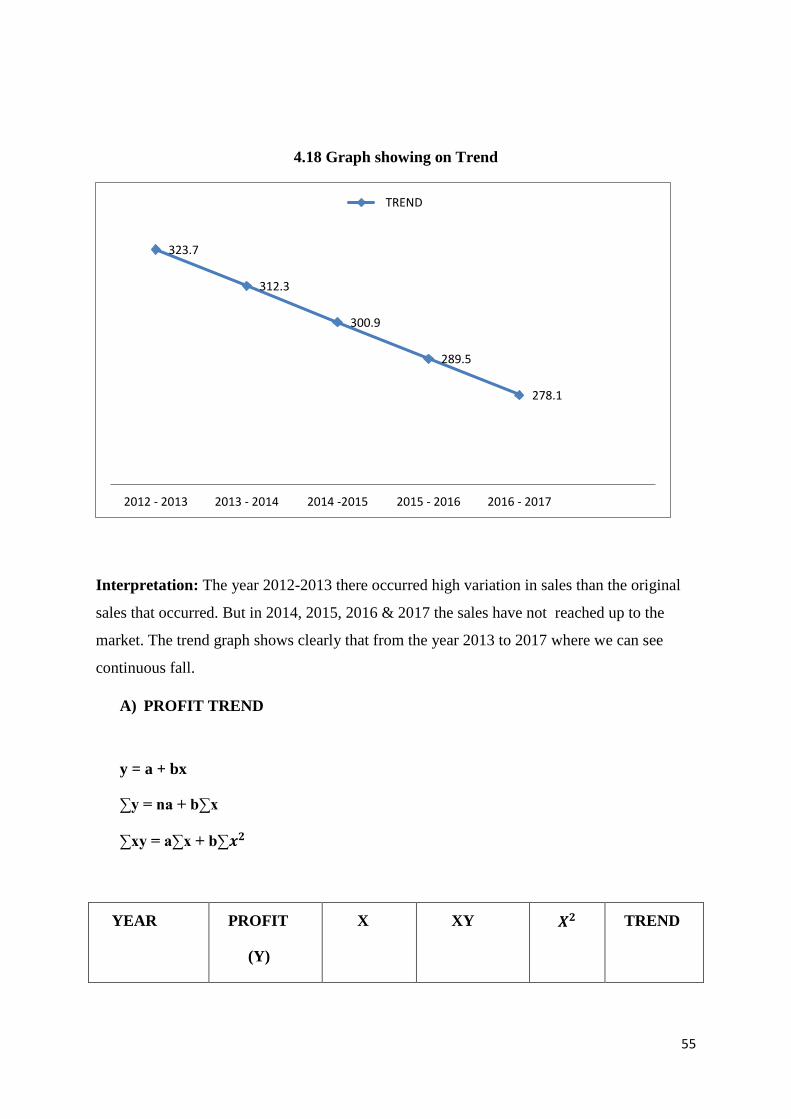
4.18 Graph showing on Trend
Interpretation: The year 2012-2013 there occurred high variation in sales than the original
sales that occurred. But in 2014, 2015, 2016 & 2017 the sales have not reached up to the
market. The trend graph shows clearly that from the year 2013 to 2017 where we can see
continuous fall.
A) PROFIT TREND
y = a + bx
∑y = na + b∑x
∑xy = a∑x + b∑𝒙𝟐
YEAR
PROFIT
(Y)
X XY 𝑿𝟐 TREND
323.7
312.3
300.9
289.5
278.1
2012 - 2013 2013 - 2014 2014 -2015 2015 - 2016 2016 - 2017
TREND

56
2012 – 2013 44.87 -2 -89.74 4 28.31
2013 – 2014 1.03 -1 -1.03 1 19.91
2014 – 2015 5.19 0 0 0 11.51
2015 – 2016 5.83 1 5.83 1 3.11
2016 – 2017 0.64 2 1.28 4 -5.29
TOTAL ∑y = 57.56 ∑y = 0 ∑xy = -83.66 ∑𝒙𝟐 = 10 57.56
∑y = na + b∑x ∑xy = a∑x + b∑𝑥2
57.56 = 5a + b*0 - 83.66 = a*0 + b*10
57.56/5 = a + b*0 b = -83.66/10
a = 11.51 b = -8.4
In 2013 In 2014
x = -2 x = -1
y = a + bx y = a + bx
y = 11.51 + -8.4(-2) y = 11.51 + -8.4*-1
y = 28.31 y = 19.91
In 2015 In 2016
x = 0 x = 1
y = a + bx y = a + bx
y = 11.51 + -8.4*0 y = 11.51 + -8.4*1
y = 11.51 y = 3.11
In 2017
57
x = 2
y = a + bx
y = 11.51 + -8.4*2
y = -5.29
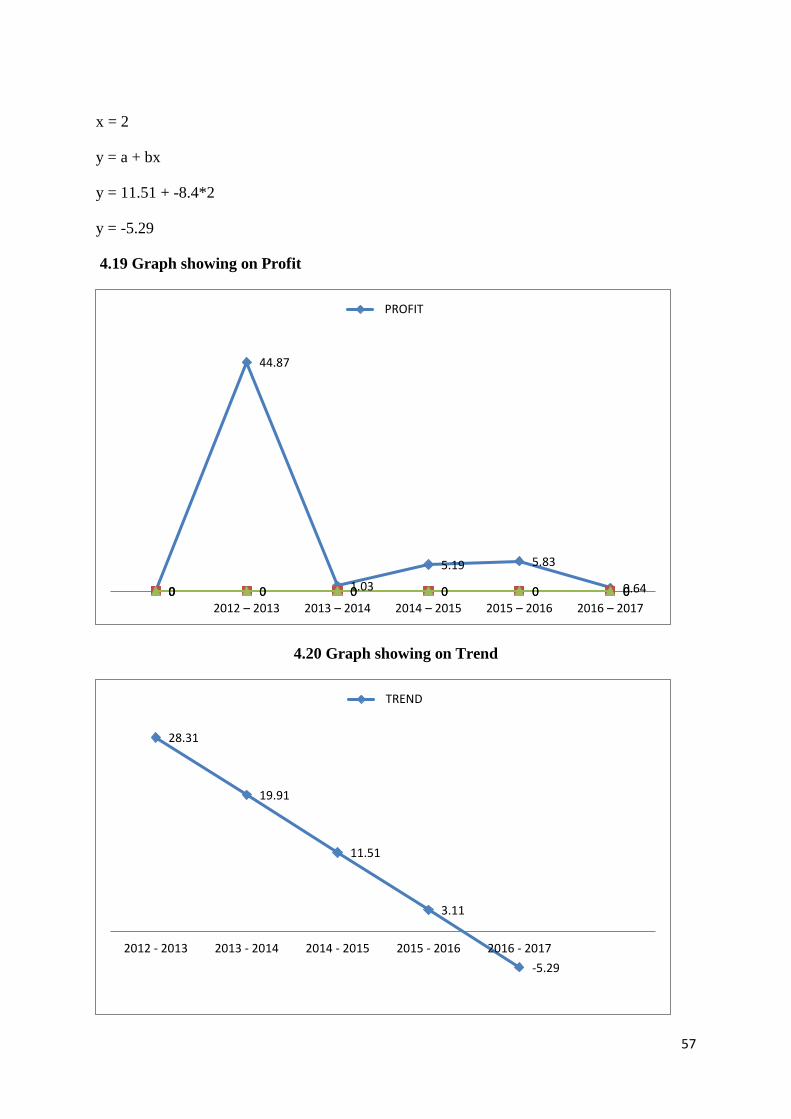
4.19 Graph showing on Profit
4.20 Graph showing on Trend
0
44.87
1.03
5.19 5.83
0.640 0 0 0 0 00 0 0 0 0 02012 – 2013 2013 – 2014 2014 – 2015 2015 – 2016 2016 – 2017
PROFIT
28.31
19.91
11.51
3.11
-5.29
2012 - 2013 2013 - 2014 2014 - 2015 2015 - 2016 2016 - 2017
TREND
58
Interpretation:
The above drawed graph tells that the profit of the company from year 2013 to
2017. In the year 2013 the company financial position as well as the solvency position is to
good compare rest years. Because profit of the year 2013 is 28.31. It shows the company
earns more profit through foreign earnings.
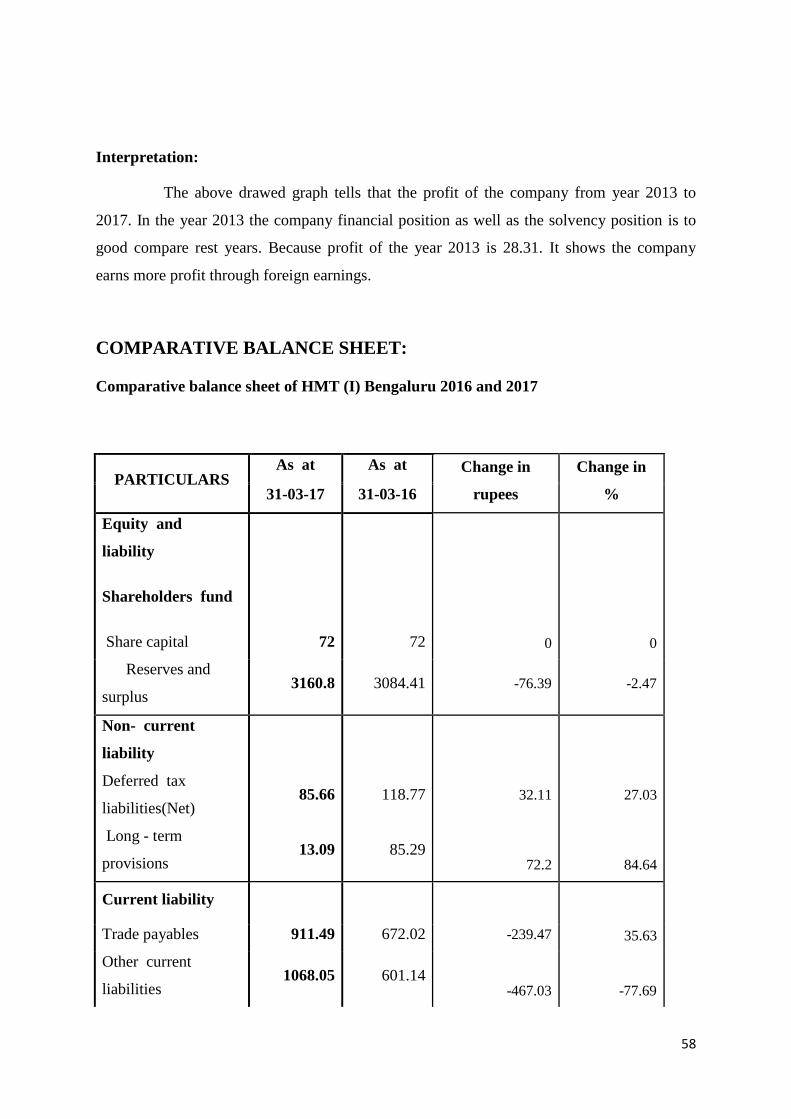
COMPARATIVE BALANCE SHEET:
Comparative balance sheet of HMT (I) Bengaluru 2016 and 2017
PARTICULARS As at As at Change in
rupees
Change in
% 31-03-17 31-03-16
Equity and
liability
Shareholders fund
Share capital 72 72 0 0
Reserves and
surplus 3160.8 3084.41 -76.39 -2.47
Non- current
liability
Deferred tax
liabilities(Net) 85.66 118.77 32.11 27.03
Long - term
provisions 13.09 85.29
72.2 84.64
Current liability
Trade payables 911.49 672.02 -239.47 35.63
Other current
liabilities 1068.05 601.14
-467.03 -77.69
59
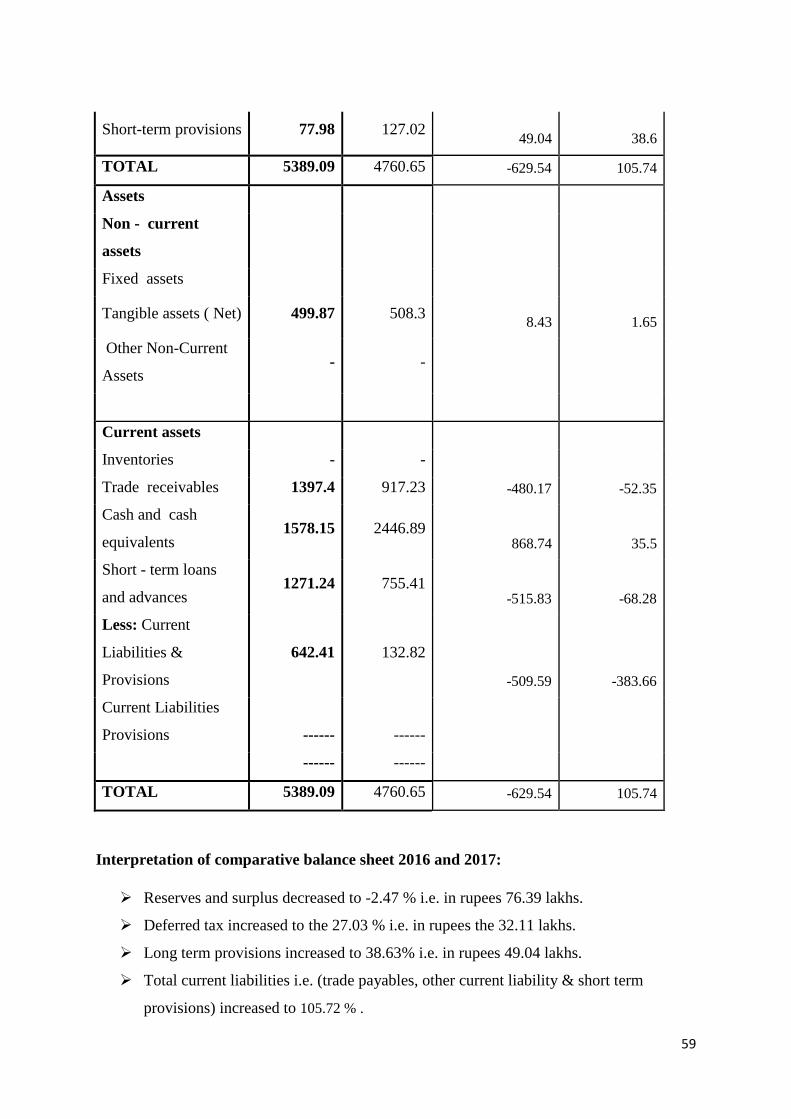
Short-term provisions 77.98 127.02 49.04 38.6
TOTAL 5389.09 4760.65 -629.54 105.74
Assets
Non - current
assets
Fixed assets
Tangible assets ( Net) 499.87 508.3
8.43 1.65
Other Non-Current
Assets - -
Current assets
Inventories - -
Trade receivables 1397.4 917.23 -480.17 -52.35
Cash and cash
equivalents 1578.15 2446.89
868.74 35.5
Short - term loans
and advances 1271.24 755.41
-515.83 -68.28
Less: Current
Liabilities &
Provisions
642.41 132.82
-509.59 -383.66
Current Liabilities
Provisions ------ ------
------ ------
TOTAL 5389.09 4760.65 -629.54 105.74
Interpretation of comparative balance sheet 2016 and 2017:
➢ Reserves and surplus decreased to -2.47 % i.e. in rupees 76.39 lakhs.
➢ Deferred tax increased to the 27.03 % i.e. in rupees the 32.11 lakhs.
➢ Long term provisions increased to 38.63% i.e. in rupees 49.04 lakhs.
➢ Total current liabilities i.e. (trade payables, other current liability & short term
provisions) increased to 105.72 % .
60
➢ Fixed assets are increased to 1.65 % i.e. in the rupees of 8.43 lakhs.
➢ Inventories decreased to -85.13 %
➢ Trade receivables increased to 2.776816609 % i.e. in rupees32.1 lakhs.
➢ Cash and cash equivalents increased to 35.5 % i.e. in rupees 868.74 lakhs.
➢ Short term loans and advances increased to-68.28 % i.e. in rupees-515.83 lakhs.
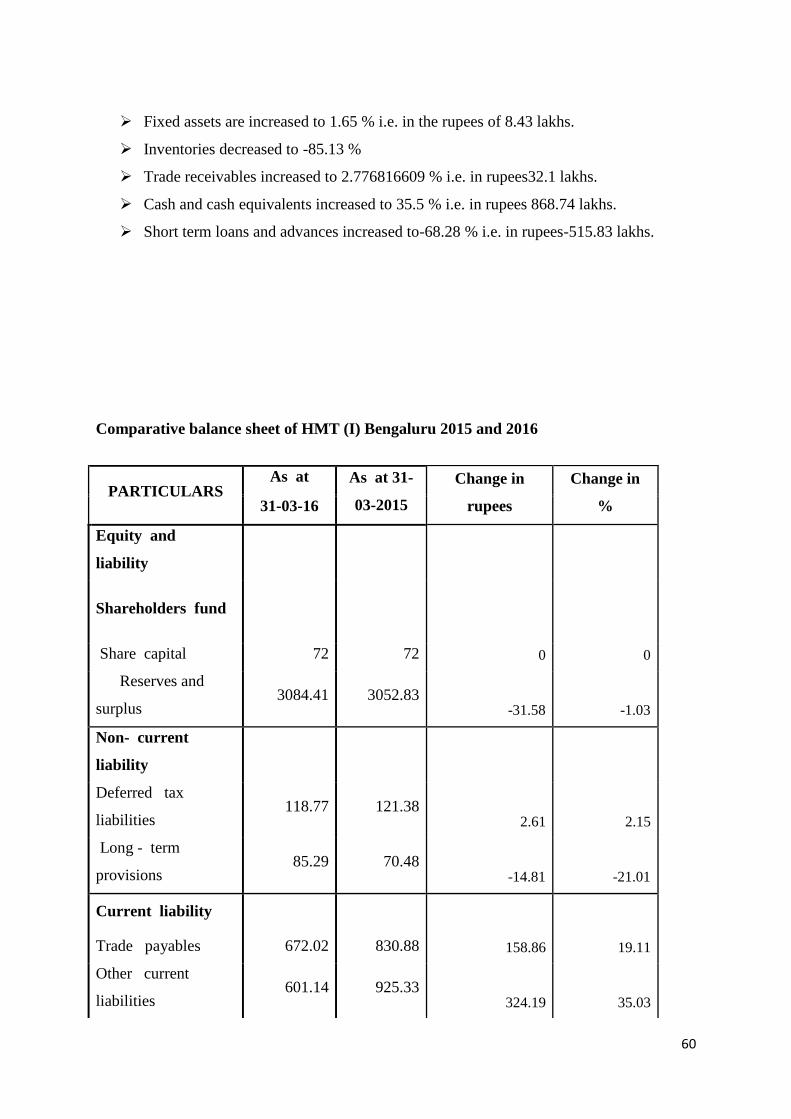
Comparative balance sheet of HMT (I) Bengaluru 2015 and 2016
PARTICULARS As at As at 31-
03-2015
Change in
rupees
Change in
% 31-03-16
Equity and
liability
Shareholders fund
Share capital 72 72 0 0
Reserves and
surplus 3084.41 3052.83
-31.58 -1.03
Non- current
liability
Deferred tax
liabilities 118.77 121.38
2.61 2.15
Long - term
provisions 85.29 70.48
-14.81 -21.01
Current liability
Trade payables 672.02 830.88 158.86 19.11
Other current
liabilities 601.14 925.33
324.19 35.03
61
Int
erp
ret
ati
on
of
co
mp
ara
tive
bal
anc
e
she
et
201
5
an
d 2016:
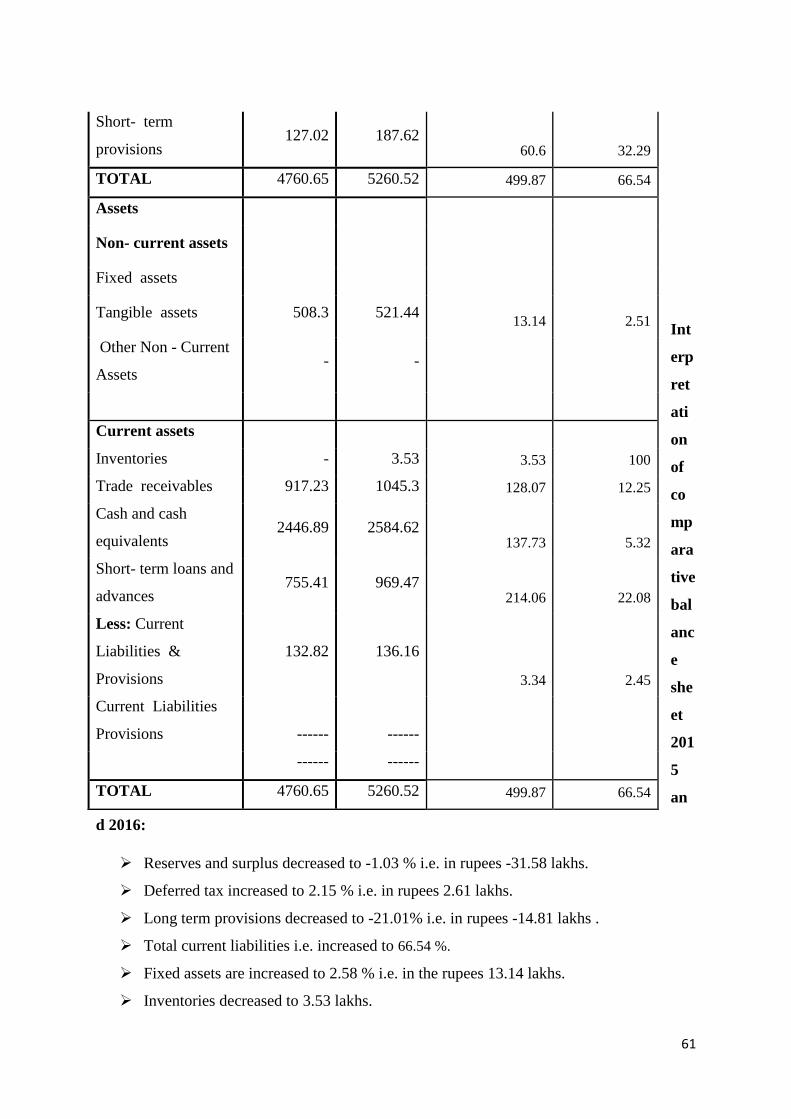
➢ Reserves and surplus decreased to -1.03 % i.e. in rupees -31.58 lakhs.
➢ Deferred tax increased to 2.15 % i.e. in rupees 2.61 lakhs.
➢ Long term provisions decreased to -21.01% i.e. in rupees -14.81 lakhs .
➢ Total current liabilities i.e. increased to 66.54 %.
➢ Fixed assets are increased to 2.58 % i.e. in the rupees 13.14 lakhs.
➢ Inventories decreased to 3.53 lakhs.
Short- term
provisions 127.02 187.62
60.6 32.29
TOTAL 4760.65 5260.52 499.87 66.54
Assets
Non- current assets
Fixed assets
Tangible assets 508.3 521.44 13.14 2.51
Other Non - Current
Assets - -
Current assets
Inventories - 3.53 3.53 100
Trade receivables 917.23 1045.3 128.07 12.25
Cash and cash
equivalents 2446.89 2584.62
137.73 5.32
Short- term loans and
advances 755.41 969.47
214.06 22.08
Less: Current
Liabilities &
Provisions
132.82 136.16
3.34 2.45
Current Liabilities
Provisions ------ ------
------ ------
TOTAL 4760.65 5260.52 499.87 66.54
62
➢ Trade receivables increased to 12.25 % i.e. in rupees128.27 lakhs.
➢ Cash and cash equivalents increased to 5.32 % i.e. in rupees 137.73 lakhs.
➢ Short term loans and advances increased to22.08 % i.e. in rupees 214.66 lakhs.
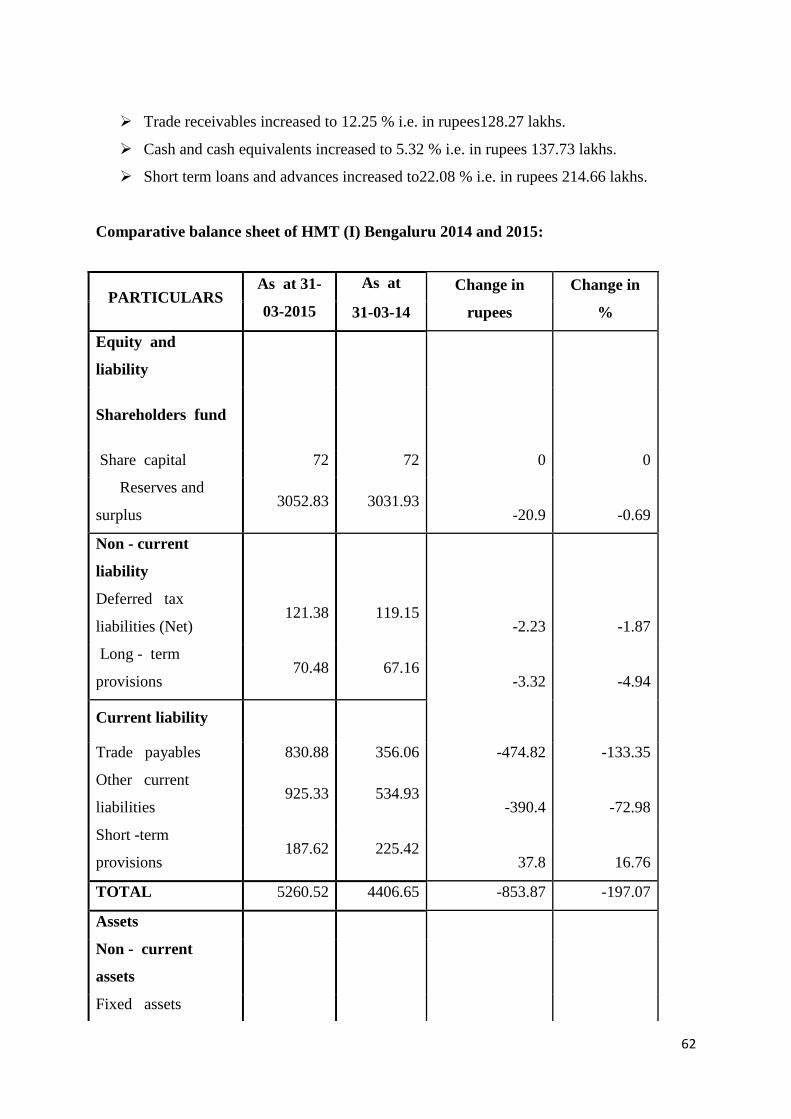
Comparative balance sheet of HMT (I) Bengaluru 2014 and 2015:
PARTICULARS As at 31-
03-2015
As at Change in
rupees
Change in
% 31-03-14
Equity and
liability
Shareholders fund
Share capital 72 72 0 0
Reserves and
surplus 3052.83 3031.93
-20.9 -0.69
Non - current
liability
Deferred tax
liabilities (Net) 121.38 119.15
-2.23 -1.87
Long - term
provisions 70.48 67.16
-3.32 -4.94
Current liability
Trade payables 830.88 356.06 -474.82 -133.35
Other current
liabilities 925.33 534.93
-390.4 -72.98
Short -term
provisions 187.62 225.42
37.8 16.76
TOTAL 5260.52 4406.65 -853.87 -197.07
Assets
Non - current
assets
Fixed assets
63
Inte
rpr
etat
ion
of
co
mp
arat
ive
bal
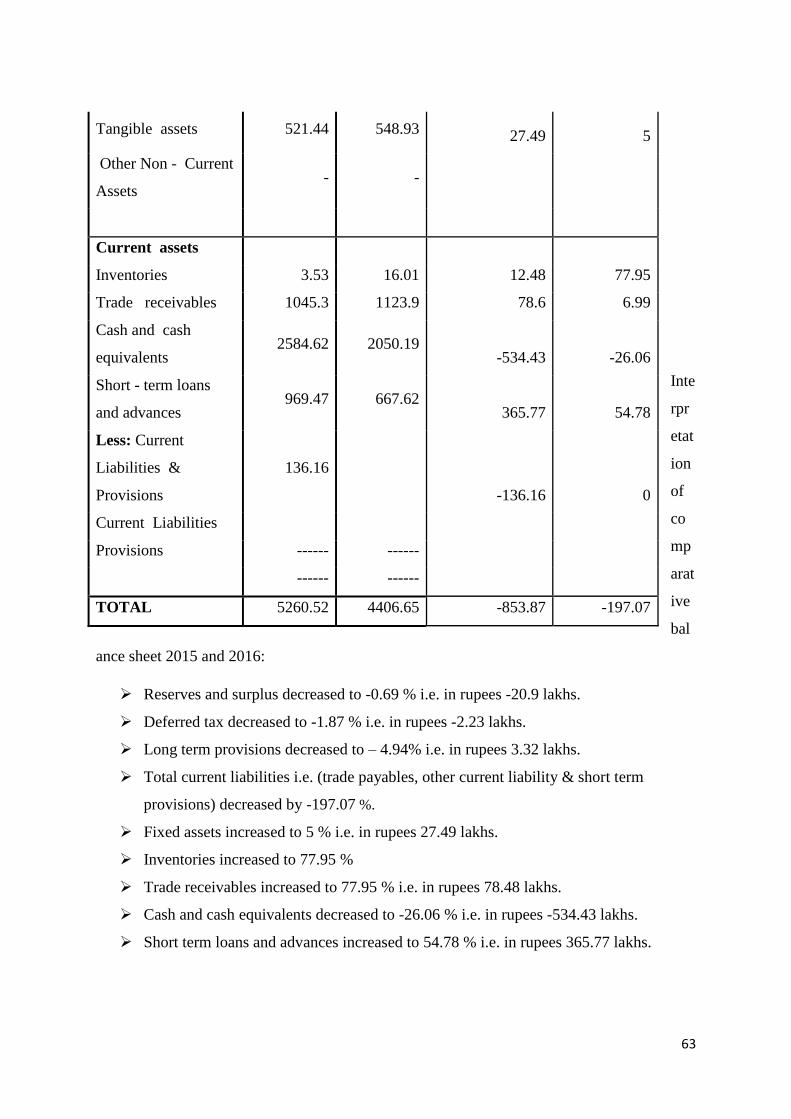
ance sheet 2015 and 2016:
➢ Reserves and surplus decreased to -0.69 % i.e. in rupees -20.9 lakhs.
➢ Deferred tax decreased to -1.87 % i.e. in rupees -2.23 lakhs.
➢ Long term provisions decreased to – 4.94% i.e. in rupees 3.32 lakhs.
➢ Total current liabilities i.e. (trade payables, other current liability & short term
provisions) decreased by -197.07 %.
➢ Fixed assets increased to 5 % i.e. in rupees 27.49 lakhs.
➢ Inventories increased to 77.95 %
➢ Trade receivables increased to 77.95 % i.e. in rupees 78.48 lakhs.
➢ Cash and cash equivalents decreased to -26.06 % i.e. in rupees -534.43 lakhs.
➢ Short term loans and advances increased to 54.78 % i.e. in rupees 365.77 lakhs.
Tangible assets 521.44 548.93 27.49 5
Other Non - Current
Assets - -
Current assets
Inventories 3.53 16.01 12.48 77.95
Trade receivables 1045.3 1123.9 78.6 6.99
Cash and cash
equivalents 2584.62 2050.19
-534.43 -26.06
Short - term loans
and advances 969.47 667.62
365.77 54.78
Less: Current
Liabilities &
Provisions
136.16
-136.16 0
Current Liabilities
Provisions ------ ------
------ ------
TOTAL 5260.52 4406.65 -853.87 -197.07
64
CHAPTER – 5
FINDINGS, CONCLUSION AND SUGGESTIONS
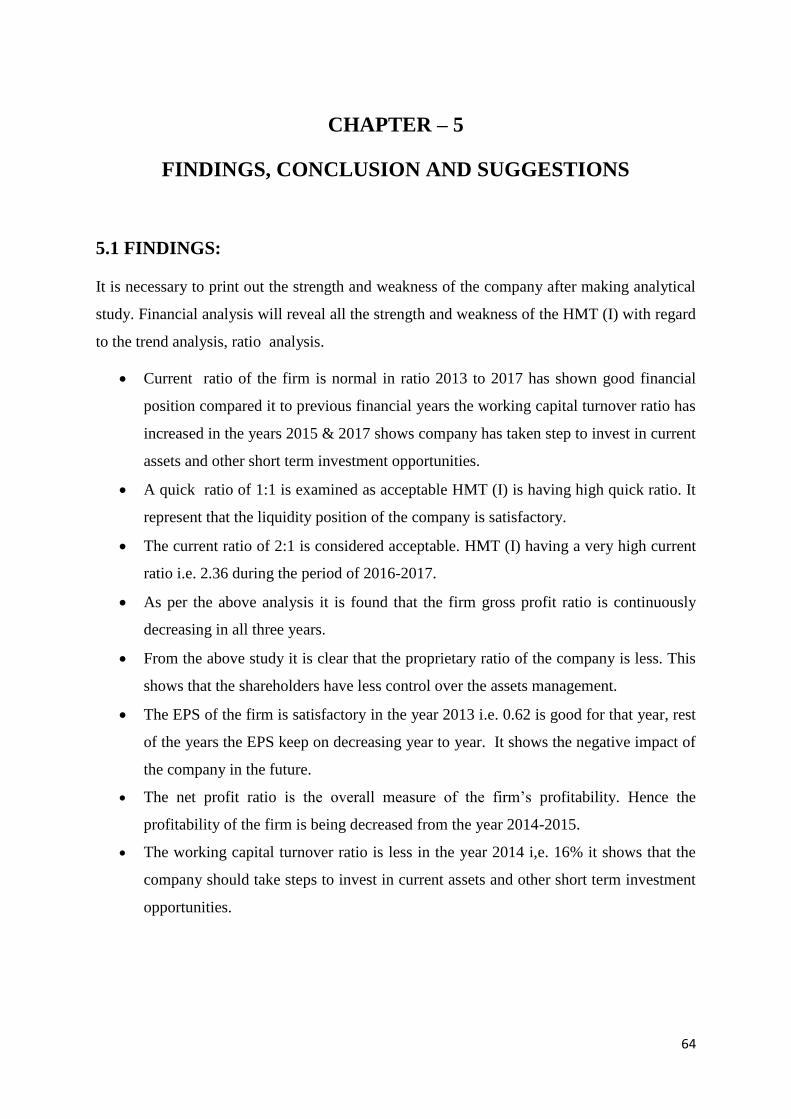
5.1 FINDINGS:
It is necessary to print out the strength and weakness of the company after making analytical
study. Financial analysis will reveal all the strength and weakness of the HMT (I) with regard
to the trend analysis, ratio analysis.
• Current ratio of the firm is normal in ratio 2013 to 2017 has shown good financial
position compared it to previous financial years the working capital turnover ratio has
increased in the years 2015 & 2017 shows company has taken step to invest in current
assets and other short term investment opportunities.
• A quick ratio of 1:1 is examined as acceptable HMT (I) is having high quick ratio. It
represent that the liquidity position of the company is satisfactory.
• The current ratio of 2:1 is considered acceptable. HMT (I) having a very high current
ratio i.e. 2.36 during the period of 2016-2017.
• As per the above analysis it is found that the firm gross profit ratio is continuously
decreasing in all three years.
• From the above study it is clear that the proprietary ratio of the company is less. This
shows that the shareholders have less control over the assets management.
• The EPS of the firm is satisfactory in the year 2013 i.e. 0.62 is good for that year, rest
of the years the EPS keep on decreasing year to year. It shows the negative impact of
the company in the future.
• The net profit ratio is the overall measure of the firm’s profitability. Hence the
profitability of the firm is being decreased from the year 2014-2015.
• The working capital turnover ratio is less in the year 2014 i,e. 16% it shows that the
company should take steps to invest in current assets and other short term investment
opportunities.
65
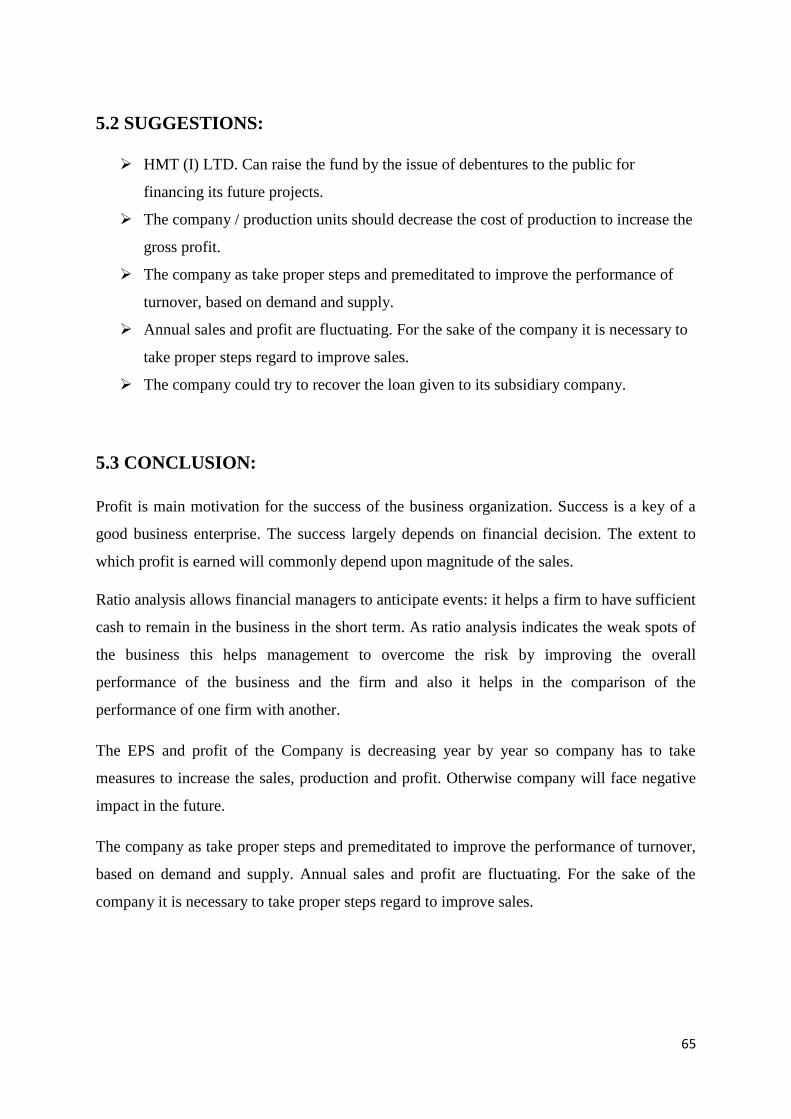
5.2 SUGGESTIONS:
➢ HMT (I) LTD. Can raise the fund by the issue of debentures to the public for
financing its future projects.
➢ The company / production units should decrease the cost of production to increase the
gross profit.
➢ The company as take proper steps and premeditated to improve the performance of
turnover, based on demand and supply.
➢ Annual sales and profit are fluctuating. For the sake of the company it is necessary to
take proper steps regard to improve sales.
➢ The company could try to recover the loan given to its subsidiary company.
5.3 CONCLUSION:
Profit is main motivation for the success of the business organization. Success is a key of a
good business enterprise. The success largely depends on financial decision. The extent to
which profit is earned will commonly depend upon magnitude of the sales.
Ratio analysis allows financial managers to anticipate events: it helps a firm to have sufficient
cash to remain in the business in the short term. As ratio analysis indicates the weak spots of
the business this helps management to overcome the risk by improving the overall
performance of the business and the firm and also it helps in the comparison of the
performance of one firm with another.
The EPS and profit of the Company is decreasing year by year so company has to take
measures to increase the sales, production and profit. Otherwise company will face negative
impact in the future.
The company as take proper steps and premeditated to improve the performance of turnover,
based on demand and supply. Annual sales and profit are fluctuating. For the sake of the
company it is necessary to take proper steps regard to improve sales.
66
BIBLIOGRAPHY
Websites:
www.hmti.com
www.google.com
www.moneycontrol.com
BOOKS REFFERED
❖ Jagadish R. Raiyani, “Financial Ratios and Financial statement Analysis”
❖ S.N.Maheshwari, ‘Accounting for Management’, Vikas Publisher House Pvt. Ltd
❖ Dr. Anurag B and Ms. Priyanka Tandon (2012) : A study on comparative
ana1ysis of SBM and ICICI bank. Internationa1 journal of marketing, 27(1), 122
❖ Niranjanraj and Chitanbaram (2000), in their study tit1ed, “Measuring the
Performance of DCCBs”
❖ Miss Trupti Gadgil “Introduction to Ratio Analysis”
❖ Dr. Aditya Sharma (2010), “A Comparative Study of Financia1 Performance of
SBM Bank & Canara Bank Commerce”
❖ Kumar Gandhi and r. Peruma1(2017)
❖ Priyanka Aggarwa1 (2014)
❖ Rao (1993), “Financial appraisal of automotive type industry of India”
❖ Pathania and Singh (1998), in their study tit1ed, “A Study of Performance of HP
State Co-operative Bank”
❖ Satyanarayane (1998), in his paper tit1ed, “Profitabi1ity and Productivity Ana1ysis
of Banks and Financia1 Institutions”
❖ Niranjanraj and Chitanbaram (2000), in their study tit1ed, “Measuring the
Performance of DCCBs”
67
❖ Dr. Aditya Sharma (2010) Assistant Professor, Institute of Management Studies,
B.J.S.RAMPURIA Jain College, Bikaner and GOPI NATH MODI Research
Scho1ar, Pacific University Udaipur:
❖ Levitz, G. S., & Brooke Jr, P. P. (1985). Independent versus system-affi1iated
hospita1s.
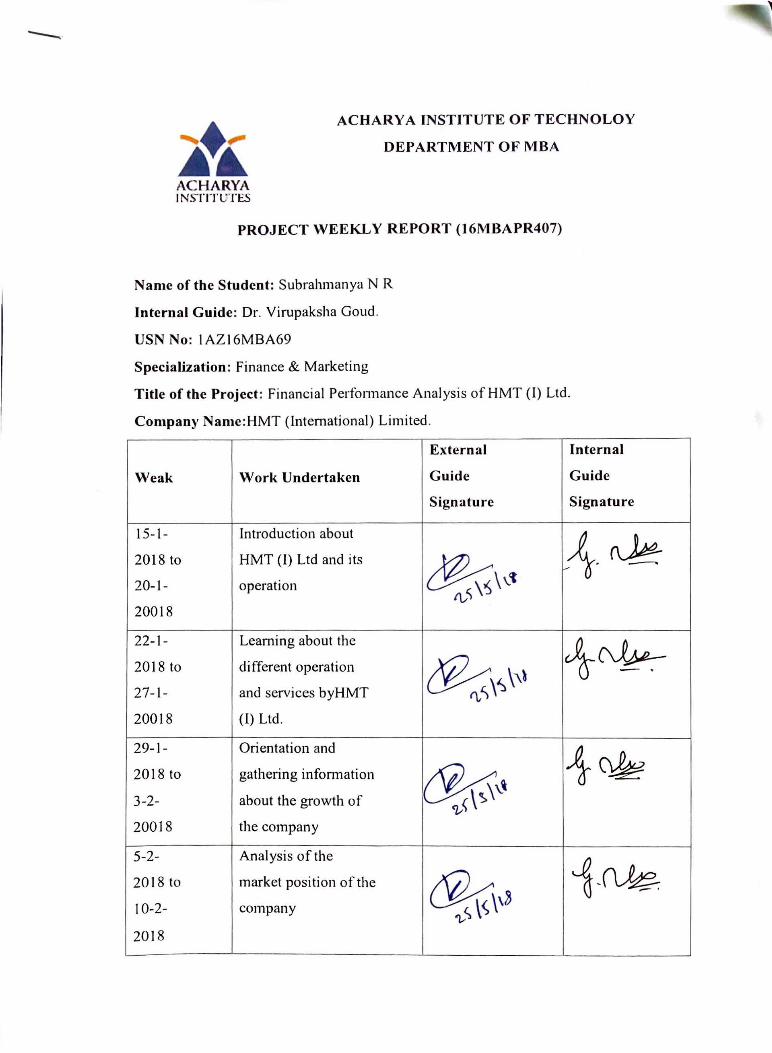
--· l•i..
A CHARY A INSTITUTE OF TECHNOLOY
DEPARTMENT OF MBA
ACHARYA IN~7Tl'UTl:.S
PROJECT WEEKLY REPORT (16MBAPR407)
Name of the Student: Subralunanya N R
Internal Guide: Dr. Yirupaksha Goud .
USN No: IAZl6MBA69
Specialization: Finance & Marketing
Title of the Project: Financial Performance Analysis of HMT (I) Ltd.
Company Name:HMT (International) Limited.
External Internal
Weak Work Undertaken Guide Guide
Signature Signature
15-1- Introduction about
,-1-~ 2018 to HMT (l) Ltd and its
~\~t 20-1- operation t\,S
20018
22-1- Leaming about the 1~ 2018 to different operation cf?::.\~ \,l 27-1- and services byHMT n.5 20018 (l) Ltd.
29-1- Orientation and 1~ 2018 to gathering information ~~ 3-2- about the growth of
20018 the company
5-2- Analysis of the
i -~ 2018 to market position of the
~\'~ I 0-2- company '1,, <:,
2018
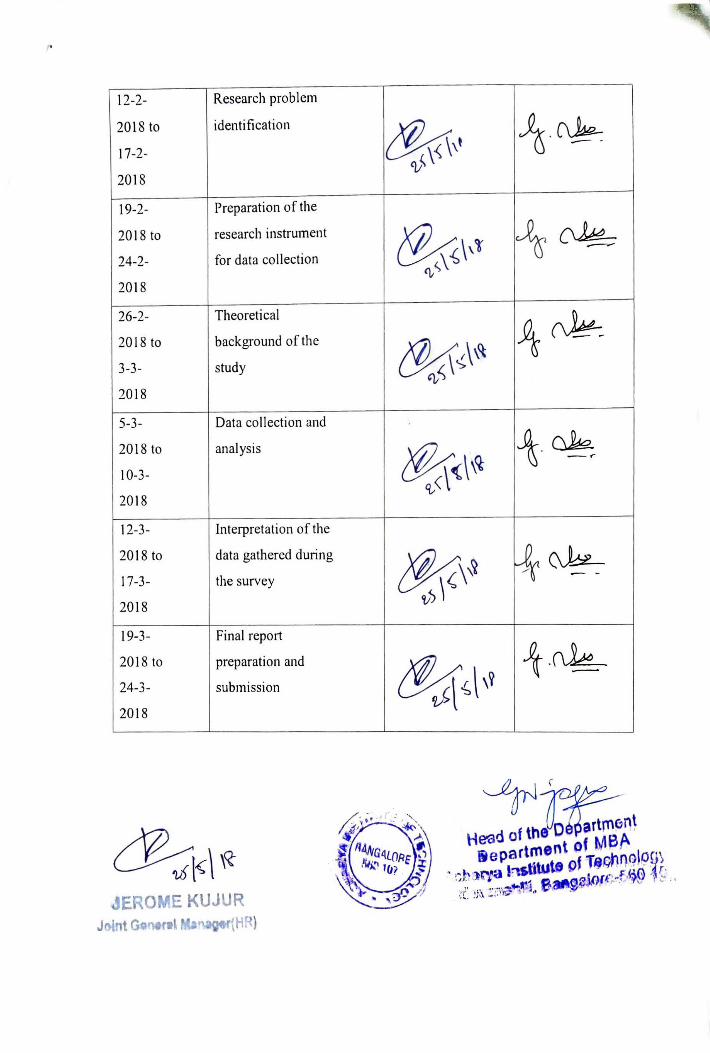
l?-2- I Research problem I
2018to identification
17-2- ~,- ~ -~ 2018
19-2- Preparation of the
2018 to research instrument
24-2- for data collection C!¼o1,i ~ ~ ---"'t,
2018 '
26-2- Theoretical
2018 to background of the
3-3-
~~ study @6...1,\'~
'vi., 2018 ~
5-3- Data collection and
2018 to analysis
10-3- ~{\\<1; 1-~
2018
12-3- Interpretation of the
2018 to data gathered during
17-3-&(Z,,~ ~
20
the survey ~
18
- -ii)
19-3- Fi nal report
201 8 to pre paration and
24-3- sub mission ~~\,i ¾ .~
2018
--
JEROME KUJUR J()lnt G~•wr•L Ma r{HR)
Related Documents