0 Financial Overview for Fiscal Year ended December 2017 Akihiro Kobayashi President & Chief Operating Officer Kobayashi Pharmaceutical Co., Ltd. February 6, 2018

Welcome message from author
This document is posted to help you gain knowledge. Please leave a comment to let me know what you think about it! Share it to your friends and learn new things together.
Transcript
0
Financial Overview for Fiscal Year ended December 2017
Akihiro Kobayashi
President & Chief Operating Officer
Kobayashi Pharmaceutical Co., Ltd.
February 6, 2018
11Table of Contents
Consolidated Results for Fiscal Year
Ended December 31, 2017
Forecasts for Year Ending December 2018
Returns to Shareholders
Progress of the Medium-Term
Management Plan for 2017 to 2019
New Growth Investments
Activities for ESG
1/37

2
Consolidated Results for Fiscal Year Ended December 31, 2017
2/37
33
FY2017
(Jan. to Dec. 2017)
Comparable period in 2016
(Jan. to Dec. 2016)
Amount
(million yen)
Margin
(%)
Amount
(million yen)
Percentage
(%)
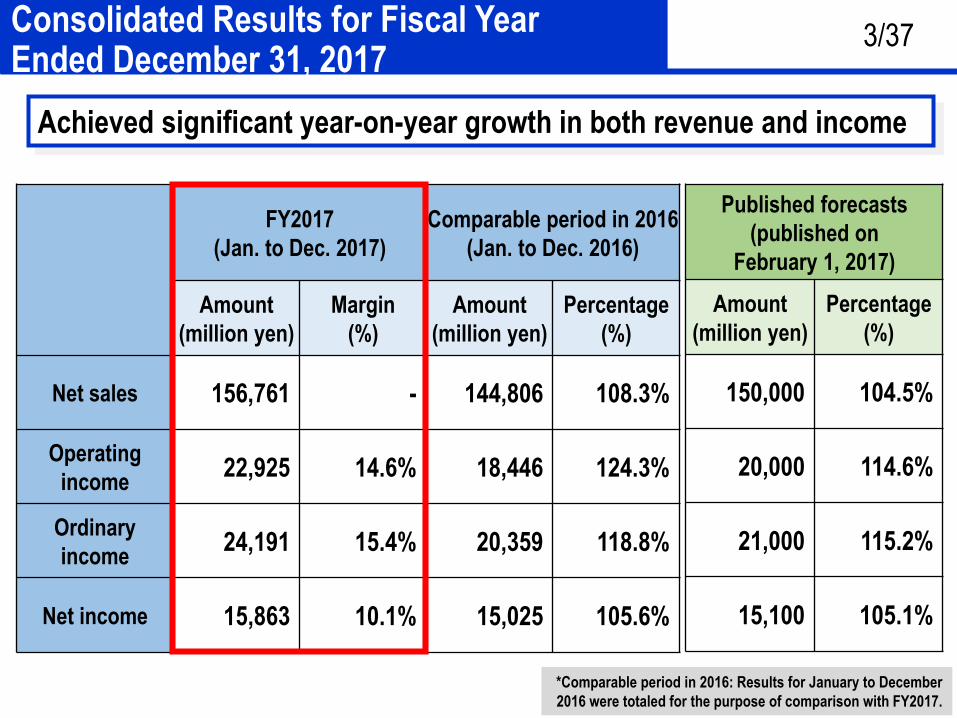
Net sales 156,761 - 144,806 108.3%
Operating
income22,925 14.6% 18,446 124.3%
Ordinary
income24,191 15.4% 20,359 118.8%
Net income 15,863 10.1% 15,025 105.6%
Achieved significant year-on-year growth in both revenue and income
Published forecasts
(published on
February 1, 2017)
Amount
(million yen)
Percentage
(%)
150,000 104.5%
20,000 114.6%
21,000 115.2%
15,100 105.1%
Consolidated Results for Fiscal Year Ended December 31, 2017
*Comparable period in 2016: Results for January to December
2016 were totaled for the purpose of comparison with FY2017.
3/37
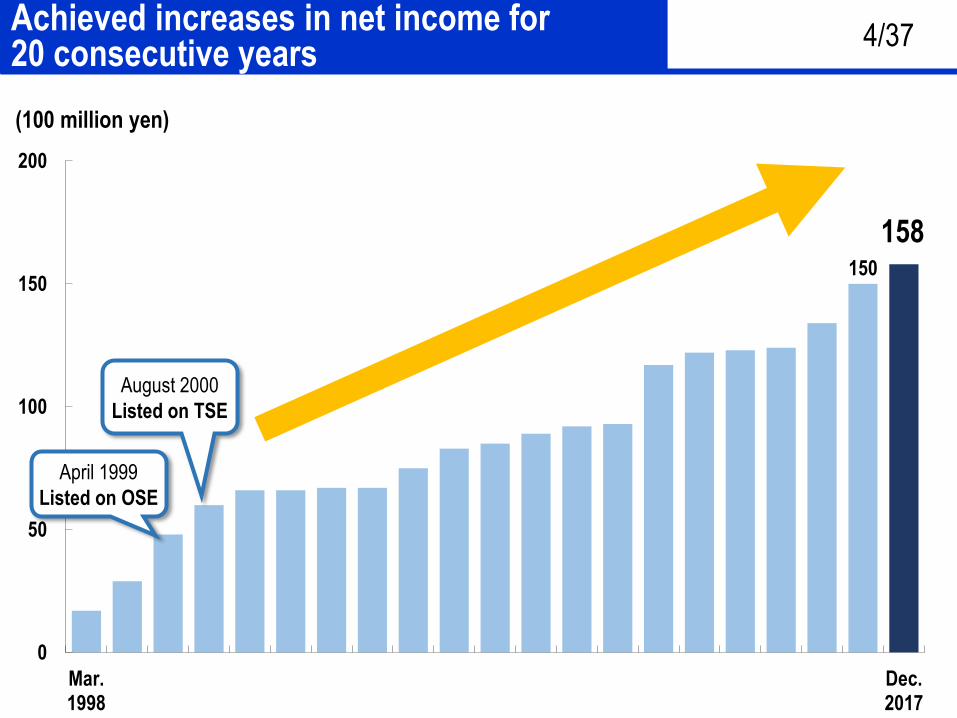
44Achieved increases in net income for 20 consecutive years
150
158
0
50
100
150
200
Mar.1998
Dec.2017
(100 million yen)
August 2000
Listed on TSE
April 1999
Listed on OSE
4/37
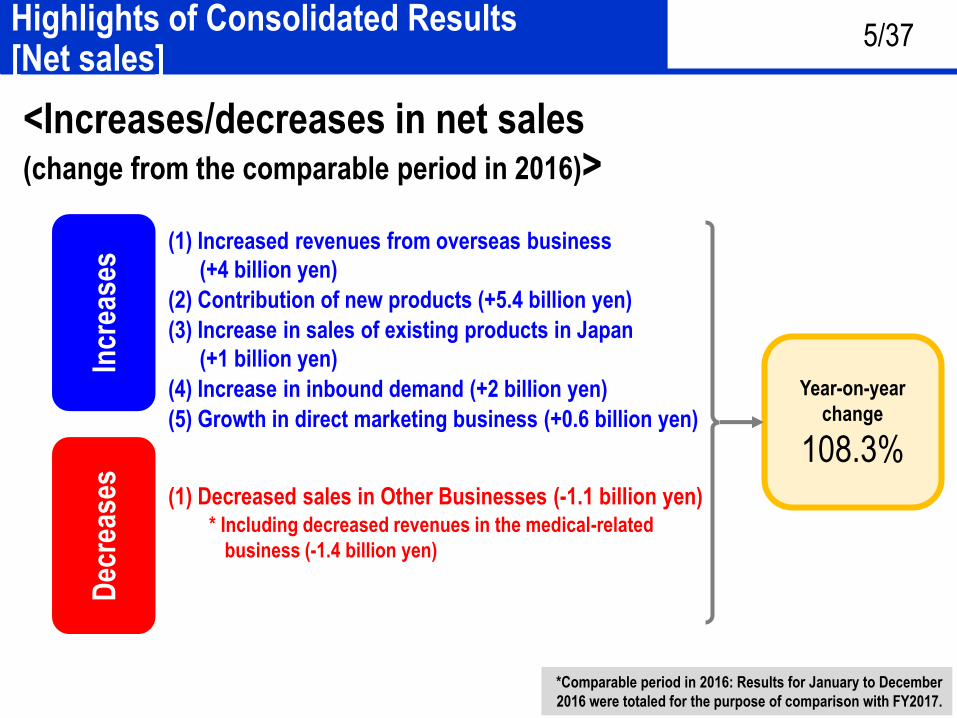
55Highlights of Consolidated Results [Net sales]
(1) Increased revenues from overseas business
(+4 billion yen)
(2) Contribution of new products (+5.4 billion yen)
(3) Increase in sales of existing products in Japan
(+1 billion yen)
(4) Increase in inbound demand (+2 billion yen)
(5) Growth in direct marketing business (+0.6 billion yen)
Incr
ease
sD
ecre
ases (1) Decreased sales in Other Businesses (-1.1 billion yen)
* Including decreased revenues in the medical-related
business (-1.4 billion yen)
<Increases/decreases in net sales(change from the comparable period in 2016)>
Year-on-year
change
108.3%
5/37
*Comparable period in 2016: Results for January to December
2016 were totaled for the purpose of comparison with FY2017.
66
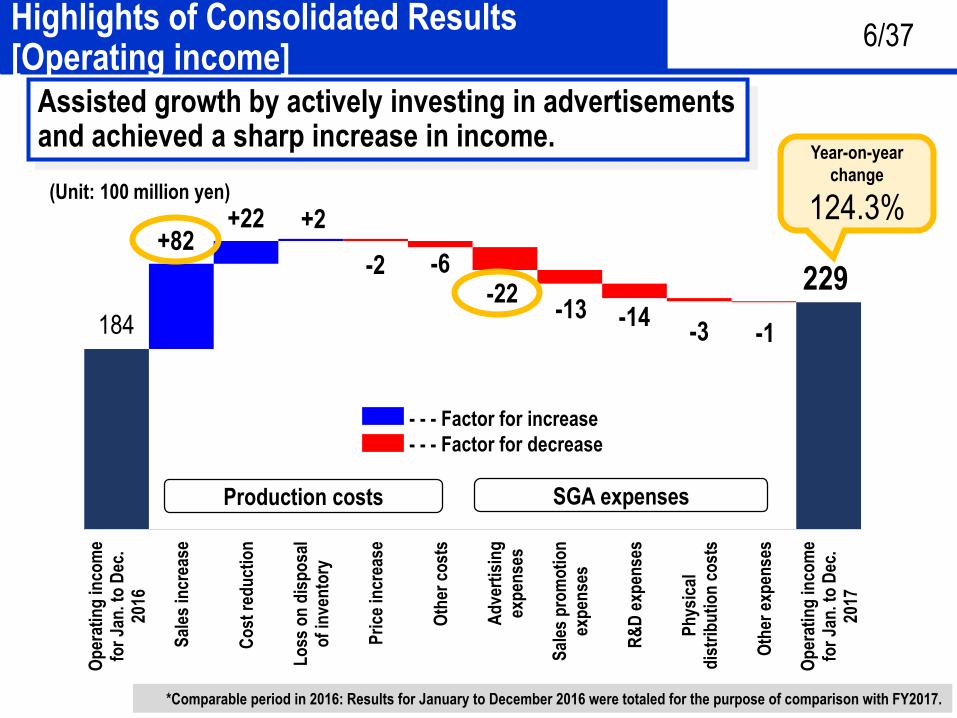
184
229
+82 +22 +2
-2 -6 -22
-13 -14 -3 -1
Op
erat
ing
inco
me
for
Jan
. to
Dec
.20
16
Sal
es in
crea
se
Co
st r
edu
ctio
n
Lo
ss o
n d
isp
osa
lo
f in
ven
tory
Pri
ce in
crea
se
Oth
er c
ost
s
Ad
vert
isin
gex
pen
ses
Sal
es p
rom
oti
on
exp
ense
s
R&
D e
xpen
ses
Ph
ysic
ald
istr
ibu
tio
n c
ost
s
Oth
er e
xpen
ses
Op
erat
ing
inco
me
for
Jan
. to
Dec
.20
17
- - - Factor for increase
- - - Factor for decrease
Production costs SGA expenses
Highlights of Consolidated Results [Operating income]
(Unit: 100 million yen)
Assisted growth by actively investing in advertisements and achieved a sharp increase in income.
Year-on-year
change
124.3%
6/37
*Comparable period in 2016: Results for January to December 2016 were totaled for the purpose of comparison with FY2017.
77
Domestic Consumer
Products Business
(Sales at stores in Japan
and Kiribai Chemical)
Overseas Consumer
Products Business
Direct Marketing
Business
Amount
(million yen)
Year-on-year
change
(%)
Amount
(million yen)
Year-on-year
change
(%)
Amount
(million yen)
Year-on-year
change
(%)
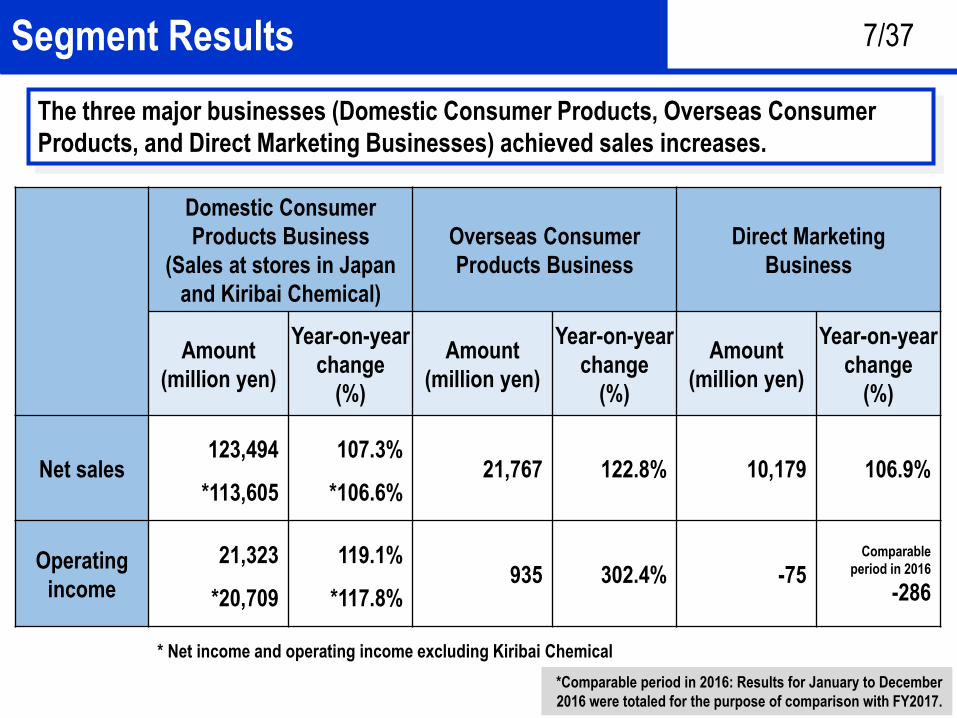
Net sales123,494
*113,605
107.3%
*106.6%21,767 122.8% 10,179 106.9%
Operating
income
21,323
*20,709
119.1%
*117.8%935 302.4% -75
Comparable
period in 2016
-286
Segment Results
* Net income and operating income excluding Kiribai Chemical
The three major businesses (Domestic Consumer Products, Overseas Consumer
Products, and Direct Marketing Businesses) achieved sales increases.
7/37
*Comparable period in 2016: Results for January to December
2016 were totaled for the purpose of comparison with FY2017.
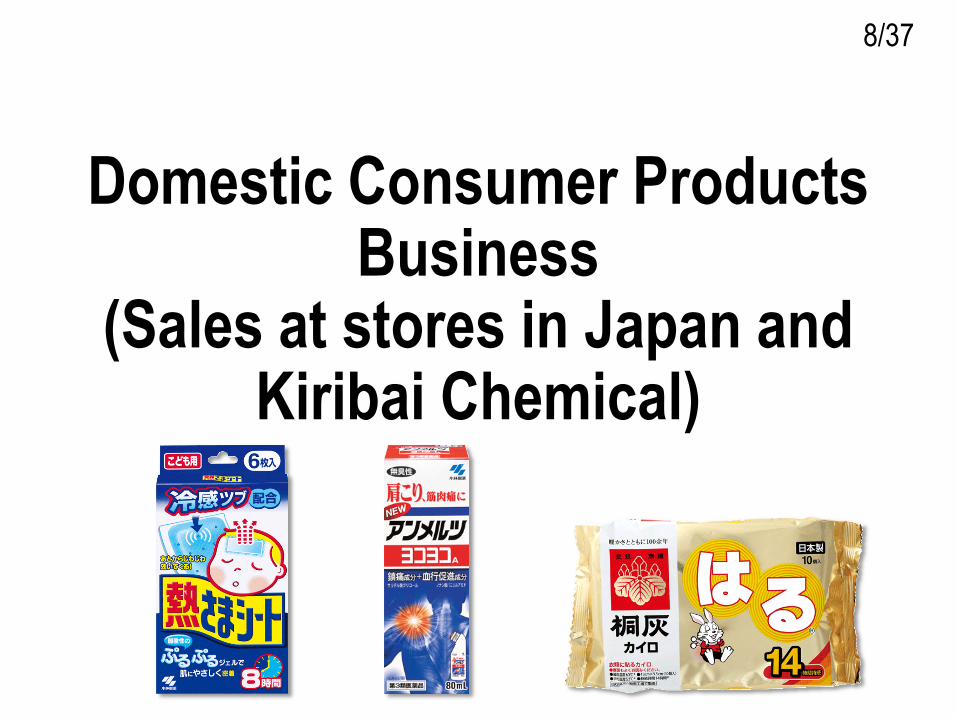
8
Domestic Consumer Products Business
(Sales at stores in Japan and Kiribai Chemical)
8/37
99
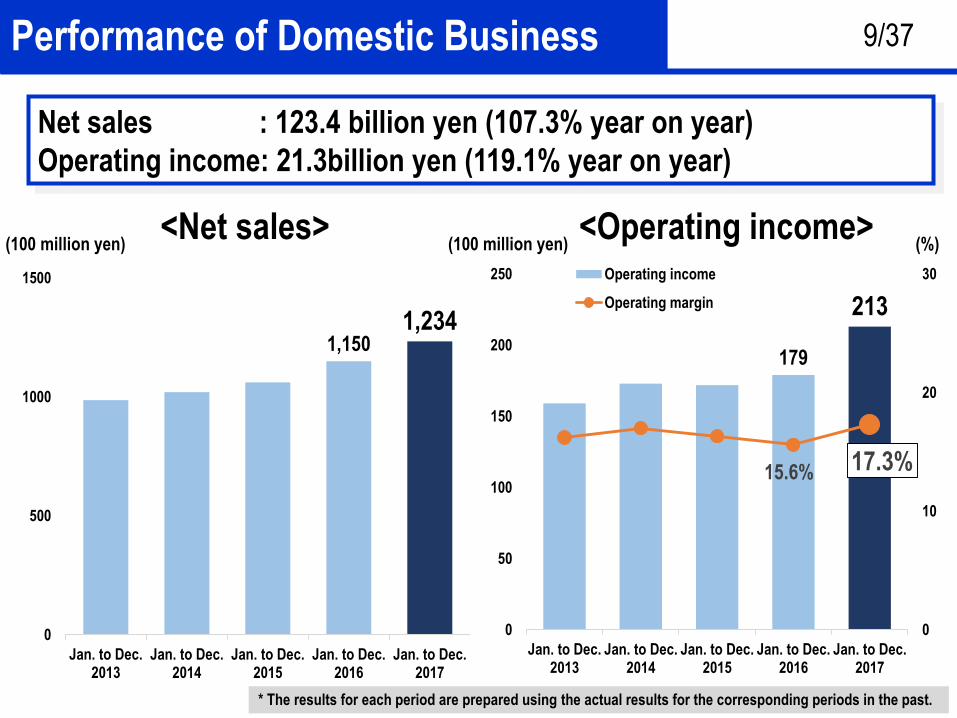
1,150 1,234
0
500
1000
1500
Jan. to Dec.2013
Jan. to Dec.2014
Jan. to Dec.2015
Jan. to Dec.2016
Jan. to Dec.2017
<Net sales>(100 million yen)
Performance of Domestic Business
Net sales : 123.4 billion yen (107.3% year on year)
Operating income: 21.3billion yen (119.1% year on year)
* The results for each period are prepared using the actual results for the corresponding periods in the past.
179
213
15.6% 17.3%
0
10
20
30
0
50
100
150
200
250
Jan. to Dec.2013
Jan. to Dec.2014
Jan. to Dec.2015
Jan. to Dec.2016
Jan. to Dec.2017
Operating income
Operating margin
<Operating income>(100 million yen) (%)
9/37
1010
FY2017(Jan. to Dec. 2017)
Comparable period in 2016(Jan. to Dec. 2016)
Amount
(million yen)
Amount
(million yen)
Difference
(million yen)
Percentage
(%)
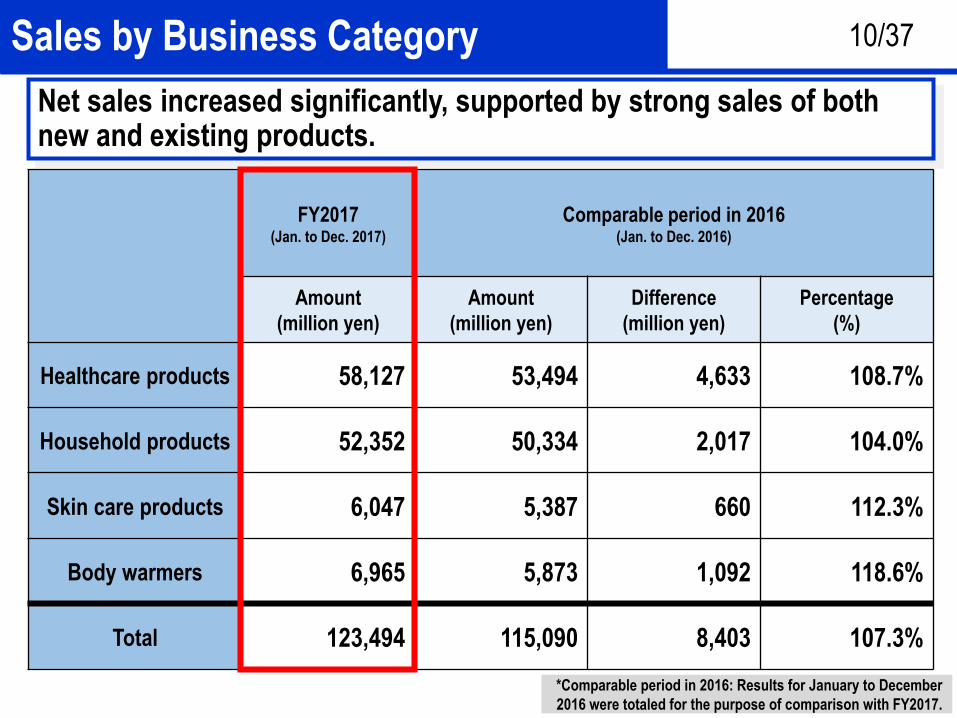
Healthcare products 58,127 53,494 4,633 108.7%
Household products 52,352 50,334 2,017 104.0%
Skin care products 6,047 5,387 660 112.3%
Body warmers 6,965 5,873 1,092 118.6%
Total 123,494 115,090 8,403 107.3%
Sales by Business Category
Net sales increased significantly, supported by strong sales of both new and existing products.
10/37
*Comparable period in 2016: Results for January to December
2016 were totaled for the purpose of comparison with FY2017.
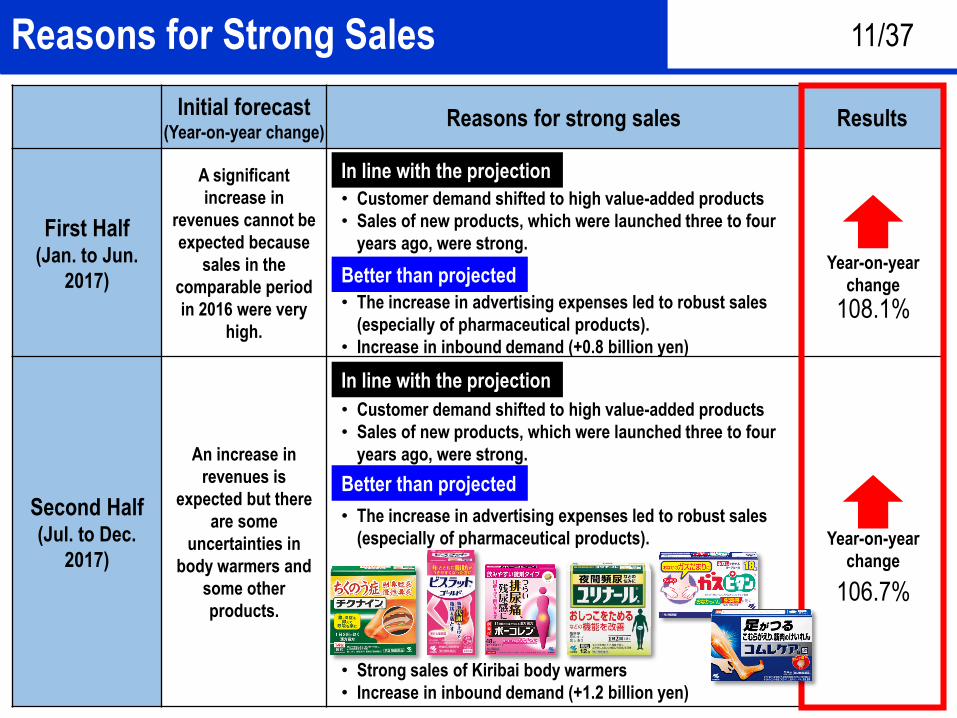
1111Reasons for Strong Sales
Initial forecast(Year-on-year change)
Reasons for strong sales Results
First Half(Jan. to Jun.
2017)
A significant
increase in
revenues cannot be
expected because
sales in the
comparable period
in 2016 were very
high.
Second Half(Jul. to Dec.
2017)
An increase in
revenues is
expected but there
are some
uncertainties in
body warmers and
some other
products.
Better than projected
In line with the projection
Better than projected
• The increase in advertising expenses led to robust sales
(especially of pharmaceutical products).
• Increase in inbound demand (+0.8 billion yen)
• The increase in advertising expenses led to robust sales
(especially of pharmaceutical products).
• Strong sales of Kiribai body warmers
• Increase in inbound demand (+1.2 billion yen)
108.1%
Year-on-year
change
106.7%
Year-on-year
change
• Customer demand shifted to high value-added products
• Sales of new products, which were launched three to four
years ago, were strong.
In line with the projection
• Customer demand shifted to high value-added products
• Sales of new products, which were launched three to four
years ago, were strong.
11/37
1212
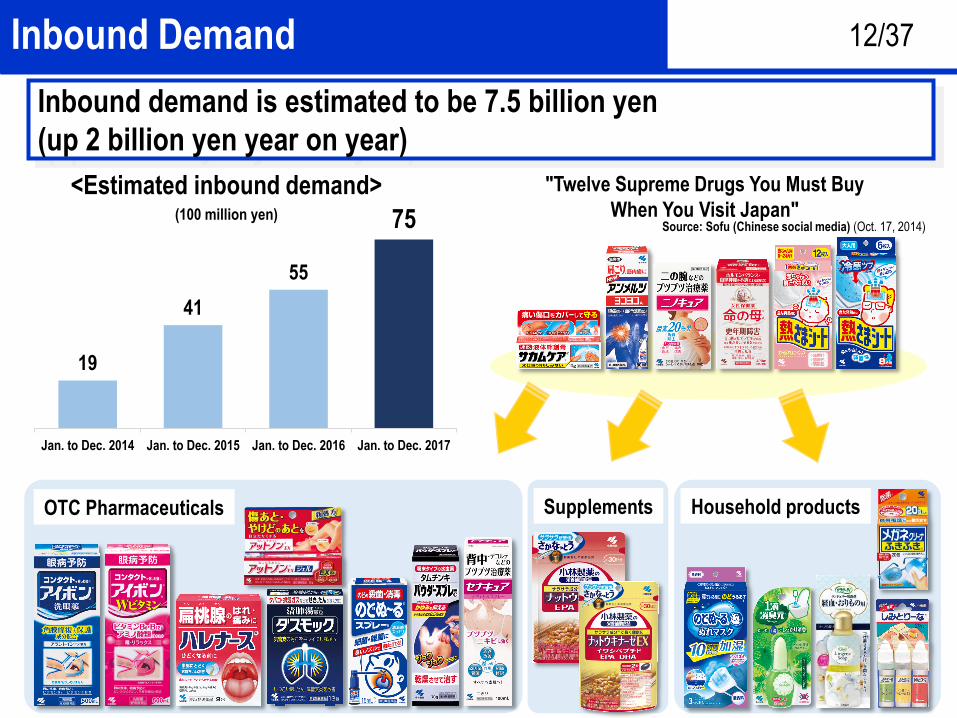
Supplements
Inbound Demand
Inbound demand is estimated to be 7.5 billion yen
(up 2 billion yen year on year)
"Twelve Supreme Drugs You Must Buy
When You Visit Japan"Source: Sofu (Chinese social media) (Oct. 17, 2014)
19
41
55
75
Jan. to Dec. 2014 Jan. to Dec. 2015 Jan. to Dec. 2016 Jan. to Dec. 2017
(100 million yen)
<Estimated inbound demand>
OTC Pharmaceuticals Household products
12/37
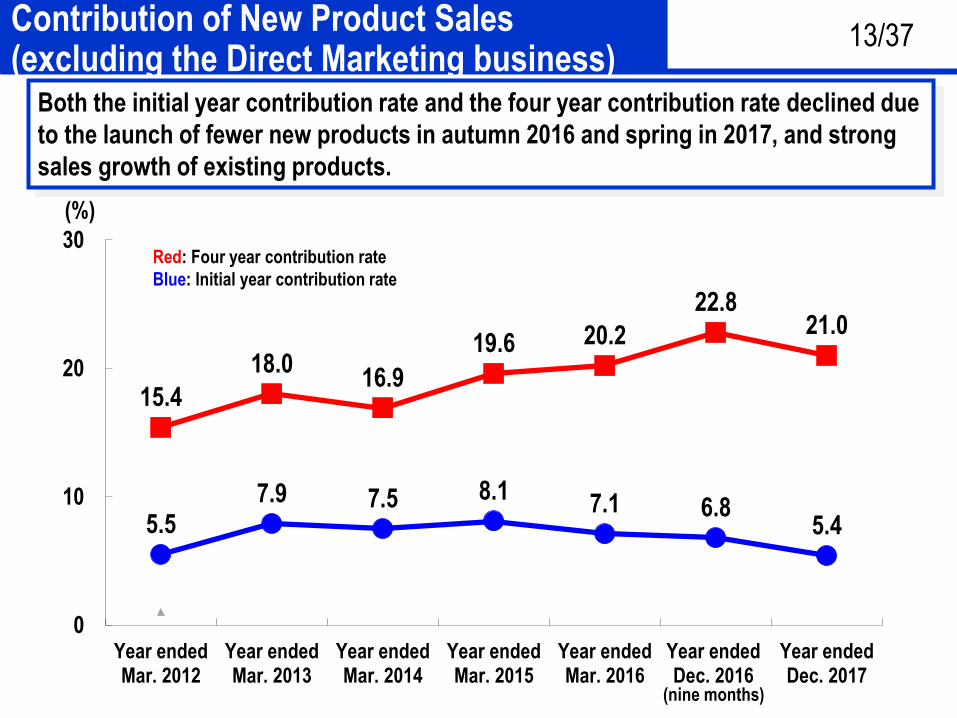
1313Contribution of New Product Sales(excluding the Direct Marketing business)
(%)
5.5 7.9 7.5 8.1
7.1 6.8 5.4
15.4
18.0 16.9
19.6 20.2
22.8 21.0
0
10
20
30
Year endedMar. 2012
Year endedMar. 2013
Year endedMar. 2014
Year endedMar. 2015
Year endedMar. 2016
Year endedDec. 2016
Year endedDec. 2017
(nine months)
Both the initial year contribution rate and the four year contribution rate declined due
to the launch of fewer new products in autumn 2016 and spring in 2017, and strong
sales growth of existing products.
Red: Four year contribution rate
Blue: Initial year contribution rate
13/37
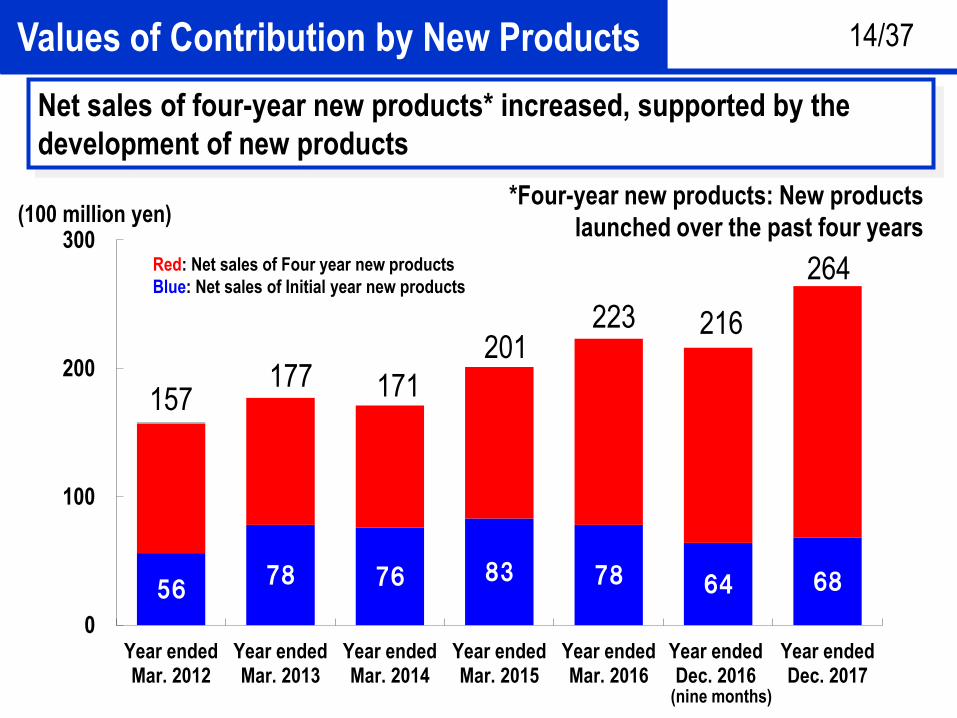
1414Values of Contribution by New Products
Net sales of four-year new products* increased, supported by the
development of new products
14/37
5678 76 83 78 64 68
0
100
200
300
Year endedMar. 2012
Year endedMar. 2013
Year endedMar. 2014
Year endedMar. 2015
Year endedMar. 2016
Year endedDec. 2016
Year endedDec. 2017
(nine months)
(100 million yen)
157177 171
201223 216
264
*Four-year new products: New products
launched over the past four years
Red: Net sales of Four year new products
Blue: Net sales of Initial year new products
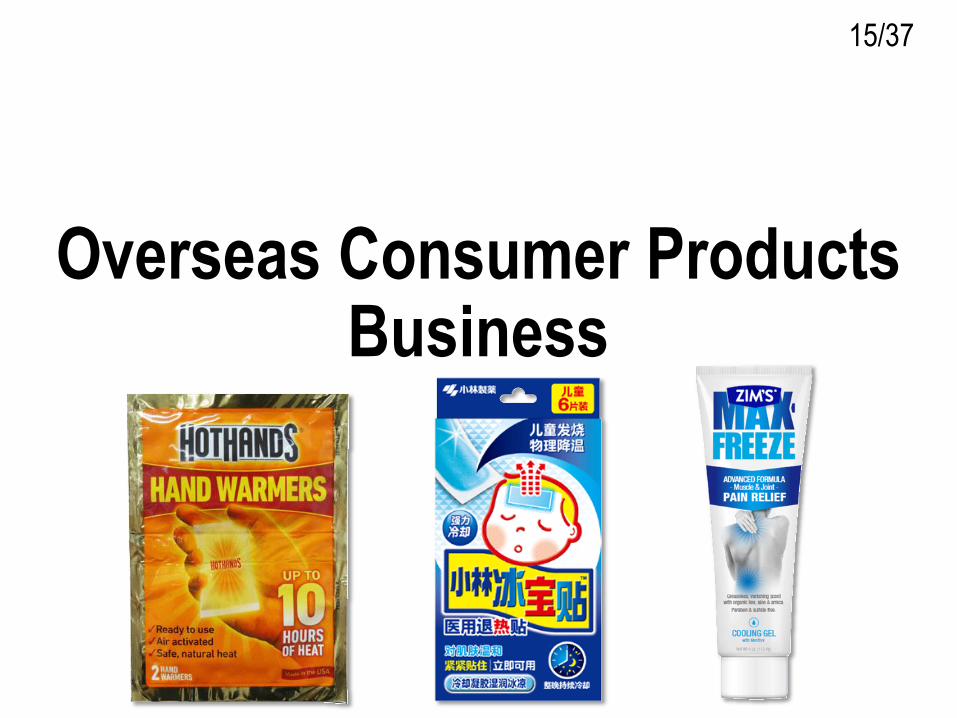
15
Overseas Consumer Products Business
15/37
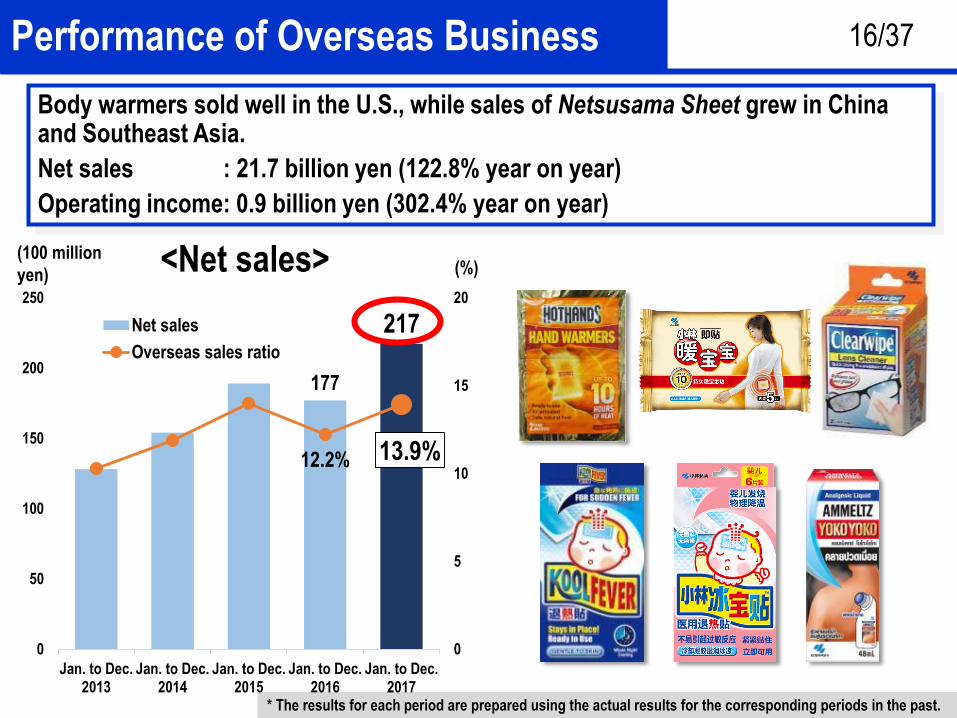
1616Performance of Overseas Business
* The results for each period are prepared using the actual results for the corresponding periods in the past.
177
217
12.2% 13.9%
0
5
10
15
20
0
50
100
150
200
250
Jan. to Dec.2013
Jan. to Dec.2014
Jan. to Dec.2015
Jan. to Dec.2016
Jan. to Dec.2017
Net sales
Overseas sales ratio
(100 million
yen)<Net sales>
Body warmers sold well in the U.S., while sales of Netsusama Sheet grew in China and Southeast Asia.
Net sales : 21.7 billion yen (122.8% year on year)
Operating income: 0.9 billion yen (302.4% year on year)
(%)
16/37

17
Direct Marketing Business
17/37
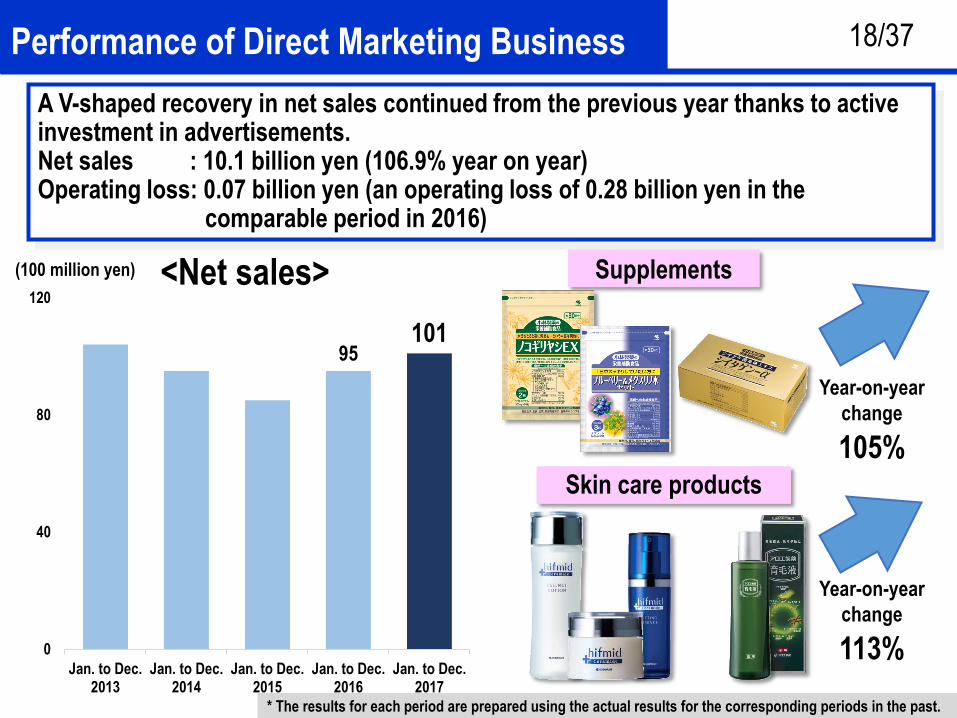
1818Performance of Direct Marketing Business
Year-on-year
change
105%
Year-on-year
change
113%
95 101
0
40
80
120
Jan. to Dec.2013
Jan. to Dec.2014
Jan. to Dec.2015
Jan. to Dec.2016
Jan. to Dec.2017
<Net sales>(100 million yen)
A V-shaped recovery in net sales continued from the previous year thanks to active investment in advertisements.Net sales : 10.1 billion yen (106.9% year on year)Operating loss: 0.07 billion yen (an operating loss of 0.28 billion yen in the
comparable period in 2016)
Supplements
Skin care products
* The results for each period are prepared using the actual results for the corresponding periods in the past.
18/37

19
Forecasts for Year Ending December 2018
19/37
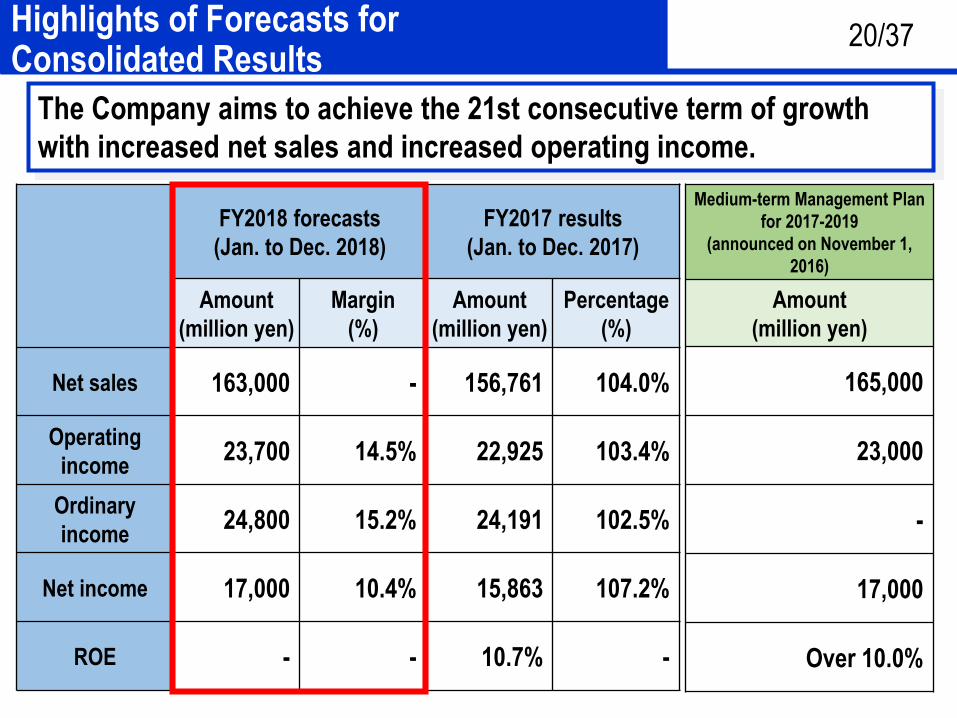
2020
FY2018 forecasts
(Jan. to Dec. 2018)
FY2017 results
(Jan. to Dec. 2017)
Amount
(million yen)
Margin
(%)
Amount
(million yen)
Percentage
(%)
Net sales 163,000 - 156,761 104.0%
Operating
income23,700 14.5% 22,925 103.4%
Ordinary
income24,800 15.2% 24,191 102.5%
Net income 17,000 10.4% 15,863 107.2%
ROE - - 10.7% -
Medium-term Management Plan
for 2017-2019
(announced on November 1,
2016)
Amount
(million yen)
165,000
23,000
-
17,000
Over 10.0%
Highlights of Forecasts for Consolidated Results
The Company aims to achieve the 21st consecutive term of growth
with increased net sales and increased operating income.
20/37

21
Returns to Shareholders
21/37
2222
52
58 60
28.8%27.9%
0
10
20
30
40
50
0
10
20
30
40
50
60
70
Mar
. 199
9
Dec
. 201
7
Dec
. 201
8fo
reca
st
Dividend amount
Dividend pay-out ratio
(%)(yen)
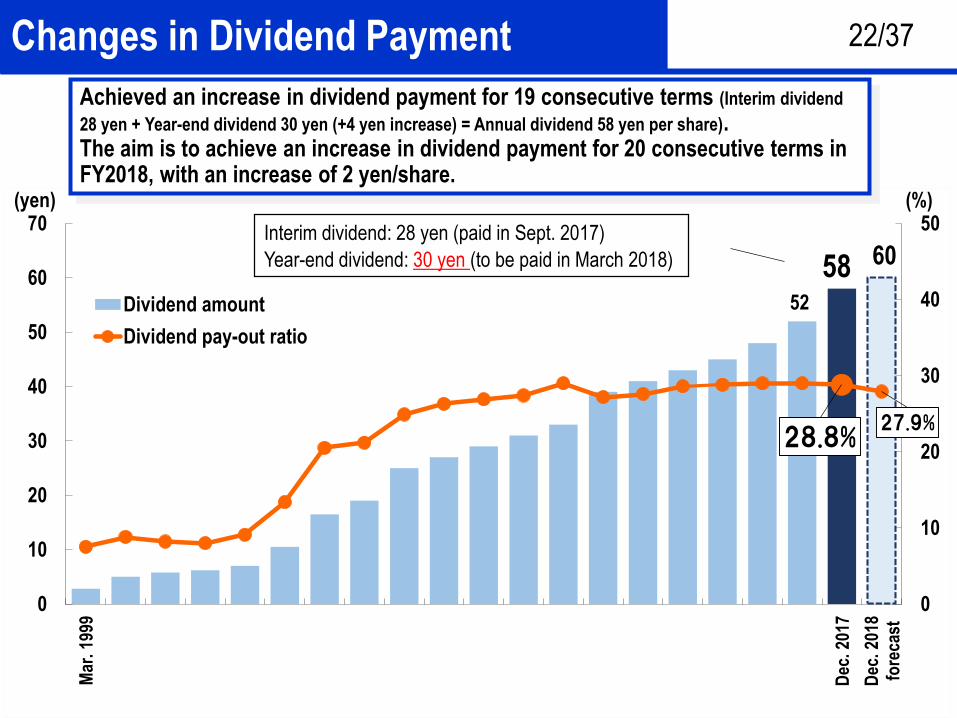
Changes in Dividend Payment
Achieved an increase in dividend payment for 19 consecutive terms (Interim dividend
28 yen + Year-end dividend 30 yen (+4 yen increase) = Annual dividend 58 yen per share).The aim is to achieve an increase in dividend payment for 20 consecutive terms in FY2018, with an increase of 2 yen/share.
22/37
Interim dividend: 28 yen (paid in Sept. 2017)
Year-end dividend: 30 yen (to be paid in March 2018)

23
Progress of the Medium-Term Management Plan for 2017 to 2019
23/37
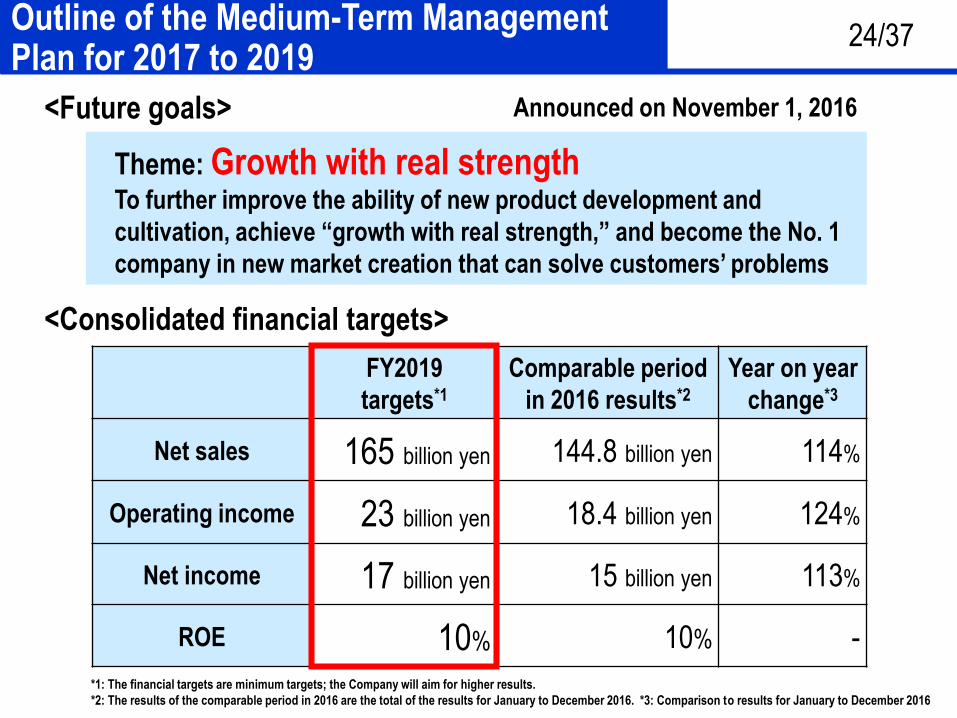
2424
FY2019
targets*1
Comparable period
in 2016 results*2
Year on year
change*3
Net sales 165 billion yen 144.8 billion yen 114%
Operating income 23 billion yen 18.4 billion yen 124%
Net income 17 billion yen 15 billion yen 113%
ROE 10% 10% -
<Consolidated financial targets>
*1: The financial targets are minimum targets; the Company will aim for higher results.
*2: The results of the comparable period in 2016 are the total of the results for January to December 2016. *3: Comparison to results for January to December 2016
<Future goals>
Theme: Growth with real strengthTo further improve the ability of new product development and
cultivation, achieve “growth with real strength,” and become the No. 1
company in new market creation that can solve customers’ problems
Outline of the Medium-Term Management Plan for 2017 to 2019
Announced on November 1, 2016
24/37
2525
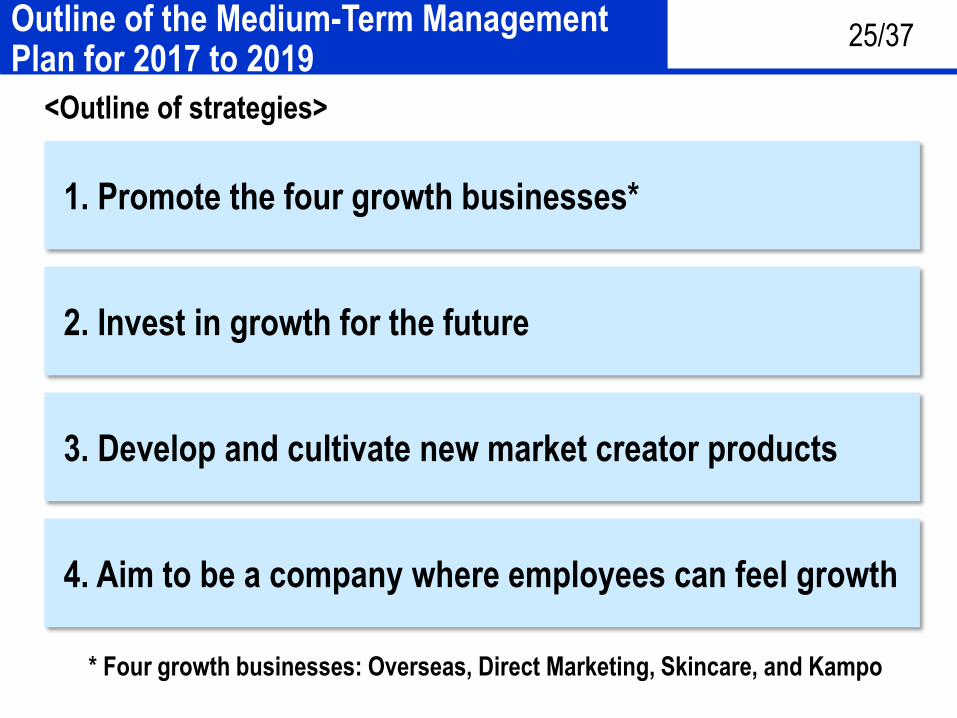
<Outline of strategies>
1. Promote the four growth businesses*
3. Develop and cultivate new market creator products
4. Aim to be a company where employees can feel growth
2. Invest in growth for the future
* Four growth businesses: Overseas, Direct Marketing, Skincare, and Kampo
Outline of the Medium-Term Management Plan for 2017 to 2019
25/37
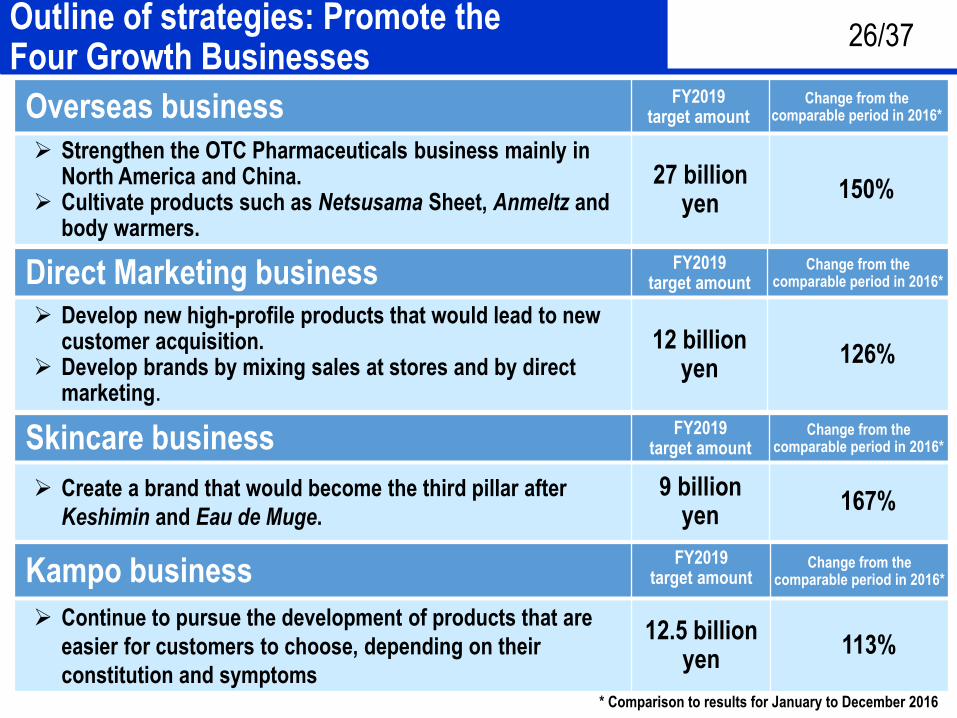
2626Outline of strategies: Promote the Four Growth Businesses
Overseas business FY2019 target amount
Change from the comparable period in 2016*
Strengthen the OTC Pharmaceuticals business mainly in North America and China.
Cultivate products such as Netsusama Sheet, Anmeltz and body warmers.
27 billion yen
150%
Direct Marketing business FY2019 target amount
Change from the comparable period in 2016*
Develop new high-profile products that would lead to new customer acquisition.
Develop brands by mixing sales at stores and by direct marketing.
12 billion yen
126%
Skincare business FY2019 target amount
Change from the comparable period in 2016*
Create a brand that would become the third pillar after
Keshimin and Eau de Muge.
9 billionyen
167%
Kampo businessFY2019
target amountChange from the
comparable period in 2016*
Continue to pursue the development of products that are
easier for customers to choose, depending on their
constitution and symptoms
12.5 billion yen
113%
* Comparison to results for January to December 2016
26/37
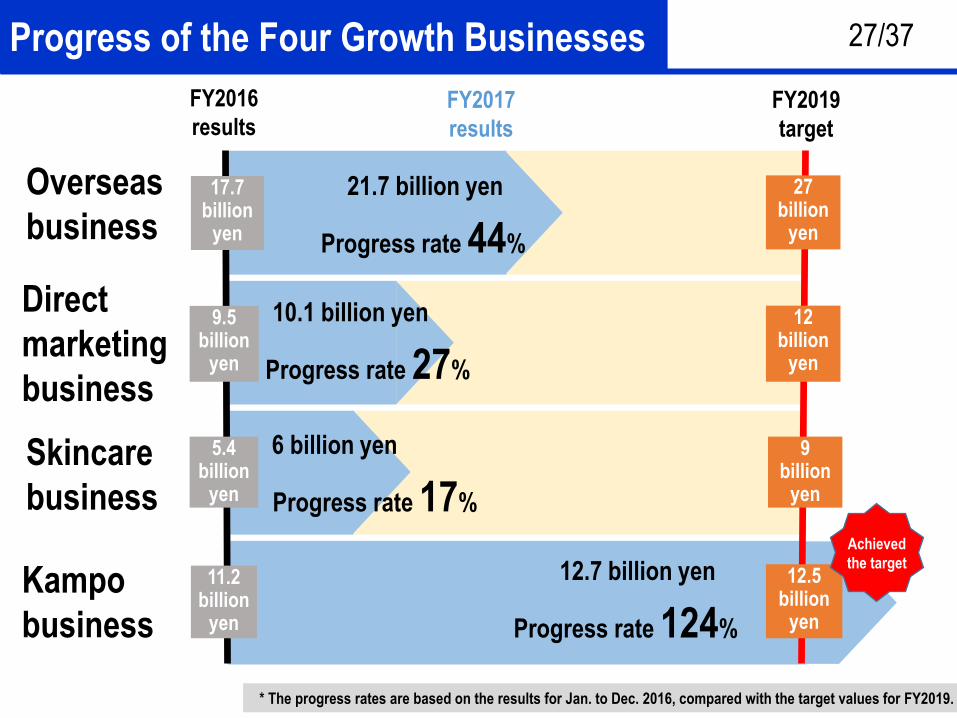
2727Progress of the Four Growth Businesses 27/37
* The progress rates are based on the results for Jan. to Dec. 2016, compared with the target values for FY2019.
Overseas
business
Direct
marketing
business
Skincare
business
Kampo
business
FY2017
results
17.7 billion
yen
5.4 billion
yen
9.5 billion
yen
11.2 billion
yen
Progress rate 17%
6 billion yen
Progress rate 27%
10.1 billion yen
Progress rate 44%
21.7 billion yen
Progress rate 124%
12.7 billion yen
FY2019
target
27 billion
yen
12 billion
yen
9 billion
yen
12.5 billion
yen
Achieved
the target
FY2016
results
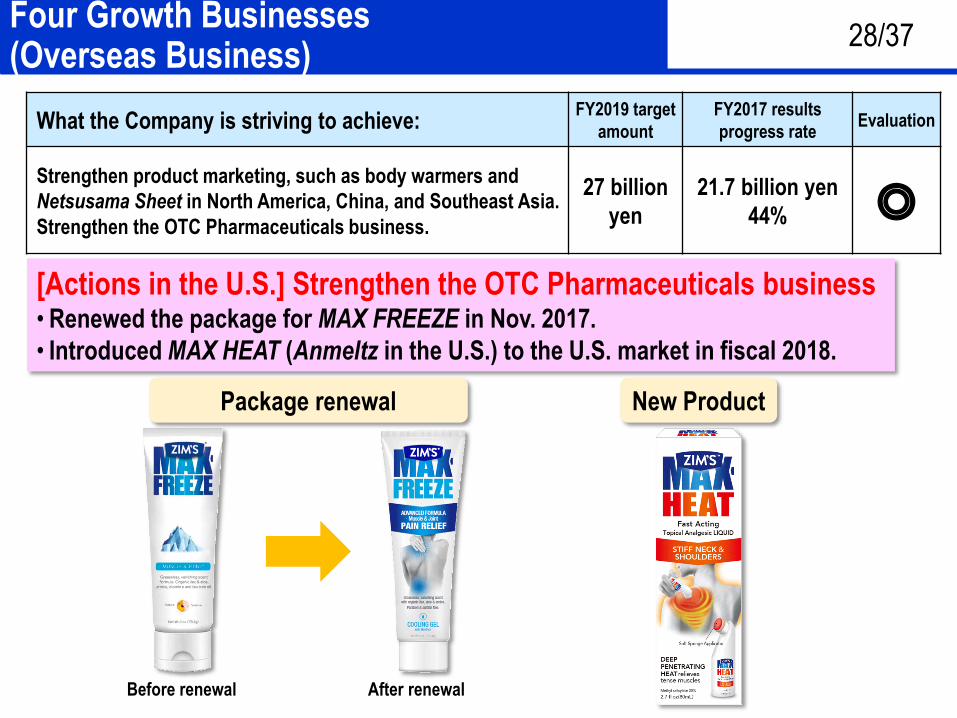
2828
What the Company is striving to achieve:FY2019 target
amount
FY2017 results
progress rate Evaluation
Strengthen product marketing, such as body warmers and
Netsusama Sheet in North America, China, and Southeast Asia.
Strengthen the OTC Pharmaceuticals business.
27 billion
yen
21.7 billion yen
44% ◎
Four Growth Businesses (Overseas Business)
[Actions in the U.S.] Strengthen the OTC Pharmaceuticals business• Renewed the package for MAX FREEZE in Nov. 2017.
• Introduced MAX HEAT (Anmeltz in the U.S.) to the U.S. market in fiscal 2018.
After renewalBefore renewal
Package renewal New Product
28/37
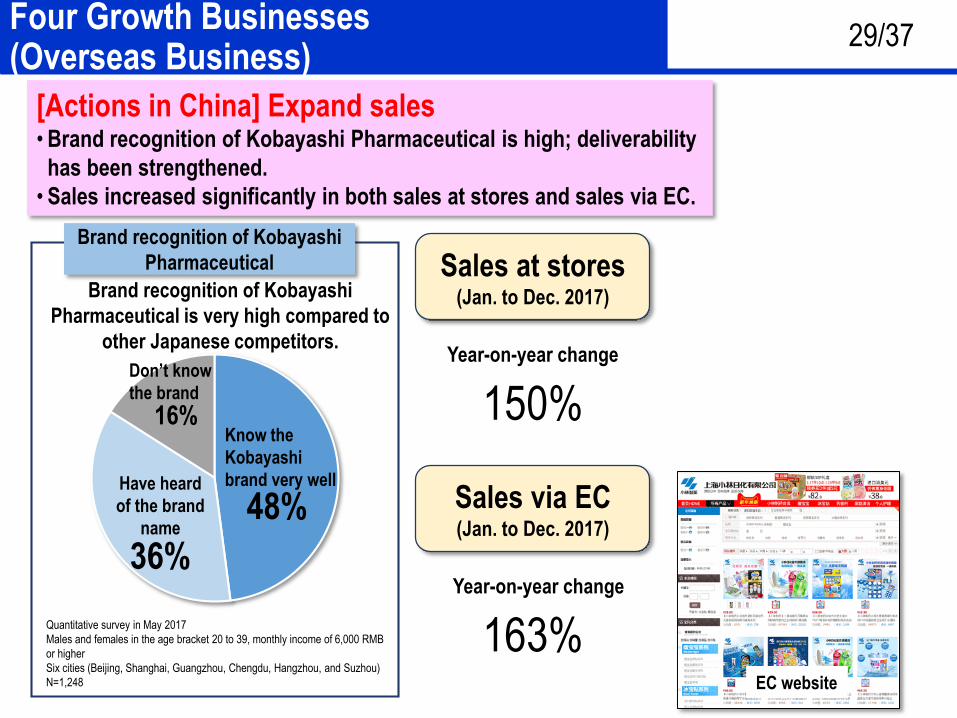
2929Four Growth Businesses (Overseas Business)
Quantitative survey in May 2017
Males and females in the age bracket 20 to 39, monthly income of 6,000 RMB
or higher
Six cities (Beijing, Shanghai, Guangzhou, Chengdu, Hangzhou, and Suzhou)
N=1,248
Know the
Kobayashi
brand very wellHave heard
of the brand
name
Don’t know
the brand
48%
36%
16%
Brand recognition of Kobayashi
Pharmaceutical
Brand recognition of Kobayashi
Pharmaceutical is very high compared to
other Japanese competitors.
Sales at stores(Jan. to Dec. 2017)
Year-on-year change
150%
Sales via EC(Jan. to Dec. 2017)
Year-on-year change
163%
[Actions in China] Expand sales•Brand recognition of Kobayashi Pharmaceutical is high; deliverability
has been strengthened.
• Sales increased significantly in both sales at stores and sales via EC.
EC website
29/37
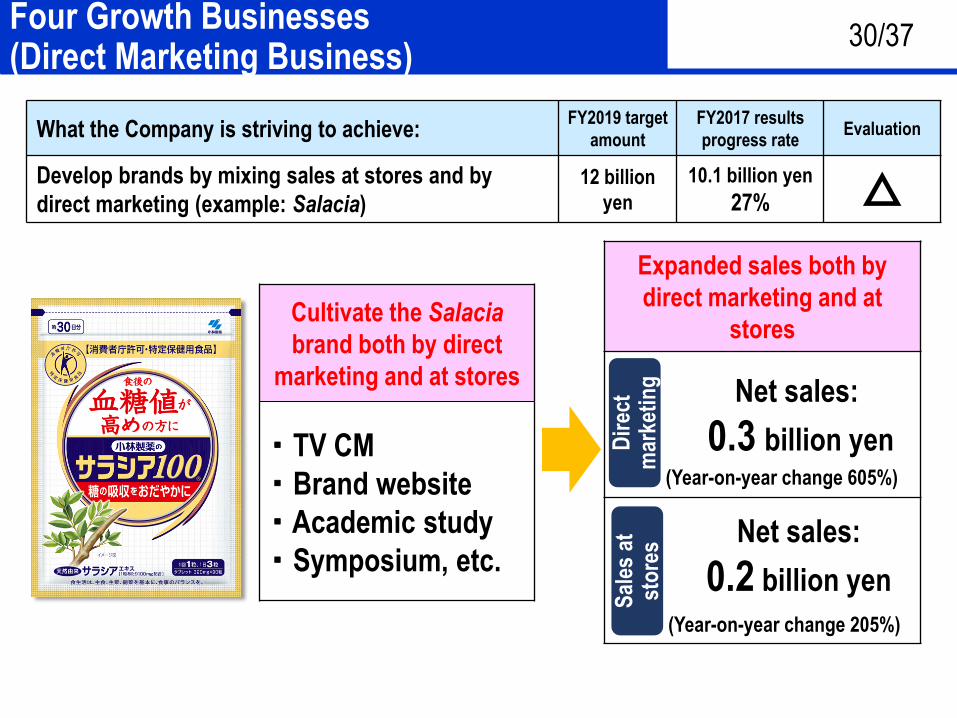
3030Four Growth Businesses(Direct Marketing Business)
Cultivate the Salacia
brand both by direct
marketing and at stores
・ TV CM
・ Brand website
・ Academic study
・ Symposium, etc.
Expanded sales both by
direct marketing and at
stores
Dir
ect
mar
keti
ng Net sales:
0.3 billion yen(Year-on-year change 605%)
Sal
es a
t st
ore
s Net sales:
0.2 billion yen
(Year-on-year change 205%)
What the Company is striving to achieve:FY2019 target
amount
FY2017 results
progress rate Evaluation
Develop brands by mixing sales at stores and by
direct marketing (example: Salacia)
12 billion
yen
10.1 billion yen
27% △
30/37
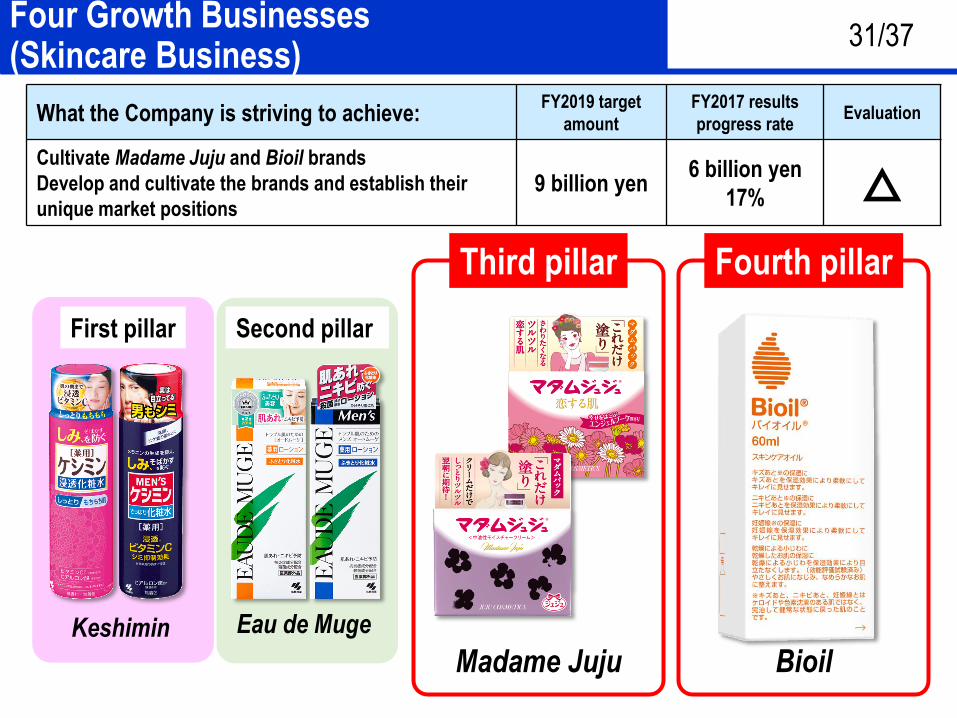
3131Four Growth Businesses(Skincare Business)
Keshimin Eau de Muge
First pillar Second pillar
Madame Juju Bioil
Third pillar Fourth pillar
What the Company is striving to achieve:FY2019 target
amount
FY2017 results
progress rate Evaluation
Cultivate Madame Juju and Bioil brands
Develop and cultivate the brands and establish their
unique market positions9 billion yen
6 billion yen
17% △
31/37
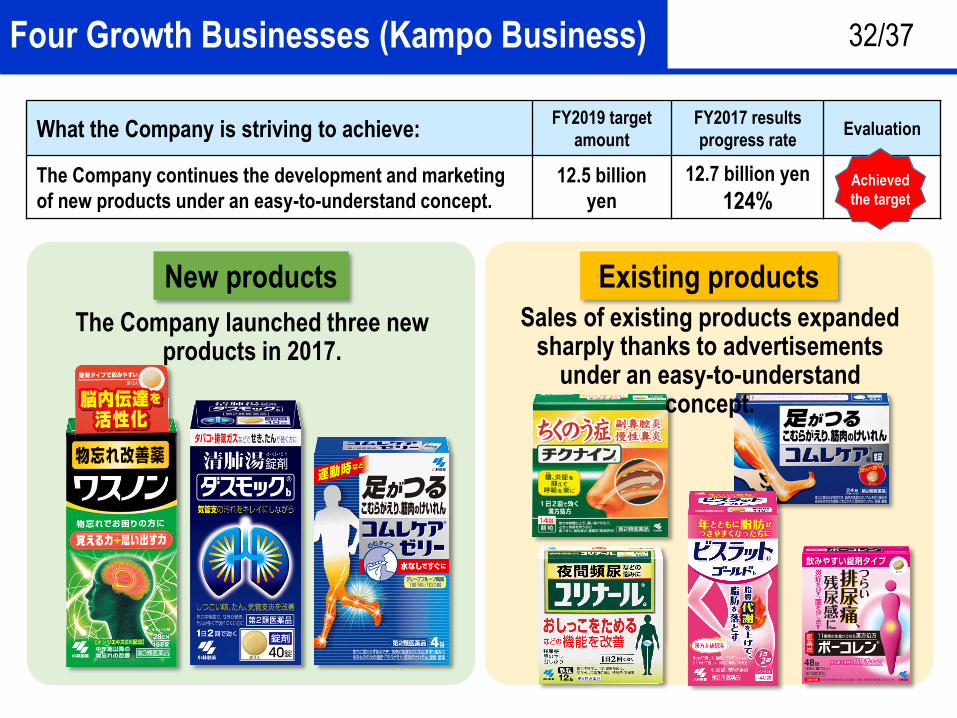
3232Four Growth Businesses (Kampo Business)
Existing productsNew products
Sales of existing products expanded sharply thanks to advertisements
under an easy-to-understand concept.
The Company launched three new products in 2017.
What the Company is striving to achieve:FY2019 target
amount
FY2017 results
progress rate Evaluation
The Company continues the development and marketing
of new products under an easy-to-understand concept.
12.5 billion
yen
12.7 billion yen
124%
32/37
Achieved
the target
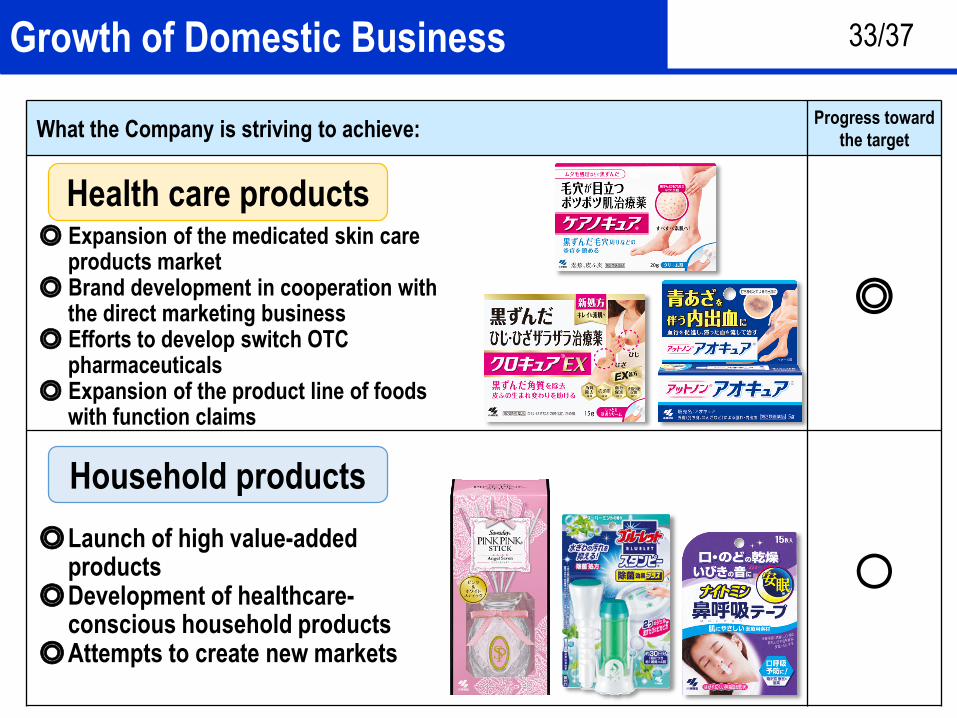
3333Growth of Domestic Business
What the Company is striving to achieve:Progress toward
the target
◎
○
◎ Expansion of the medicated skin care products market
◎ Brand development in cooperation with the direct marketing business
◎ Efforts to develop switch OTC pharmaceuticals
◎ Expansion of the product line of foods with function claims
Health care products
Household products
◎Launch of high value-added products
◎Development of healthcare-conscious household products
◎Attempts to create new markets
33/37

34
New Growth Investments
34/37
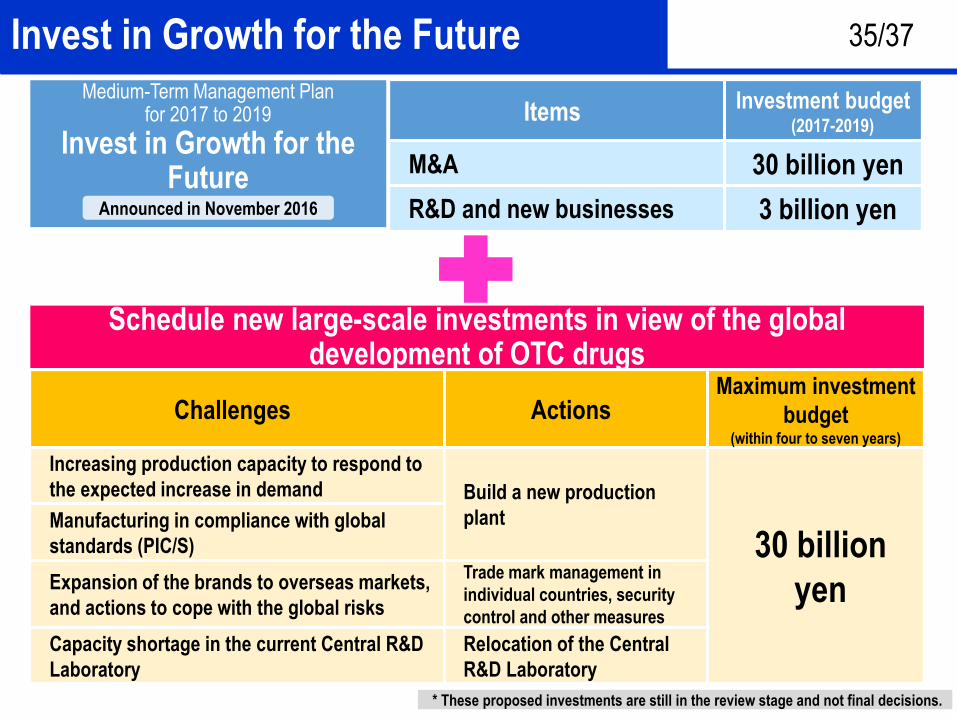
3535Invest in Growth for the FutureMedium-Term Management Plan
for 2017 to 2019
Invest in Growth for the Future
Items Investment budget(2017-2019)
M&A 30 billion yen
R&D and new businesses 3 billion yenAnnounced in November 2016
Challenges ActionsMaximum investment
budget(within four to seven years)
Increasing production capacity to respond to
the expected increase in demand Build a new production
plant
30 billion
yen
Manufacturing in compliance with global
standards (PIC/S)
Expansion of the brands to overseas markets,
and actions to cope with the global risks
Trade mark management in
individual countries, security
control and other measures
Capacity shortage in the current Central R&D
Laboratory
Relocation of the Central
R&D Laboratory
Schedule new large-scale investments in view of the global development of OTC drugs
35/37
* These proposed investments are still in the review stage and not final decisions.
36
Activities for ESG
36/37
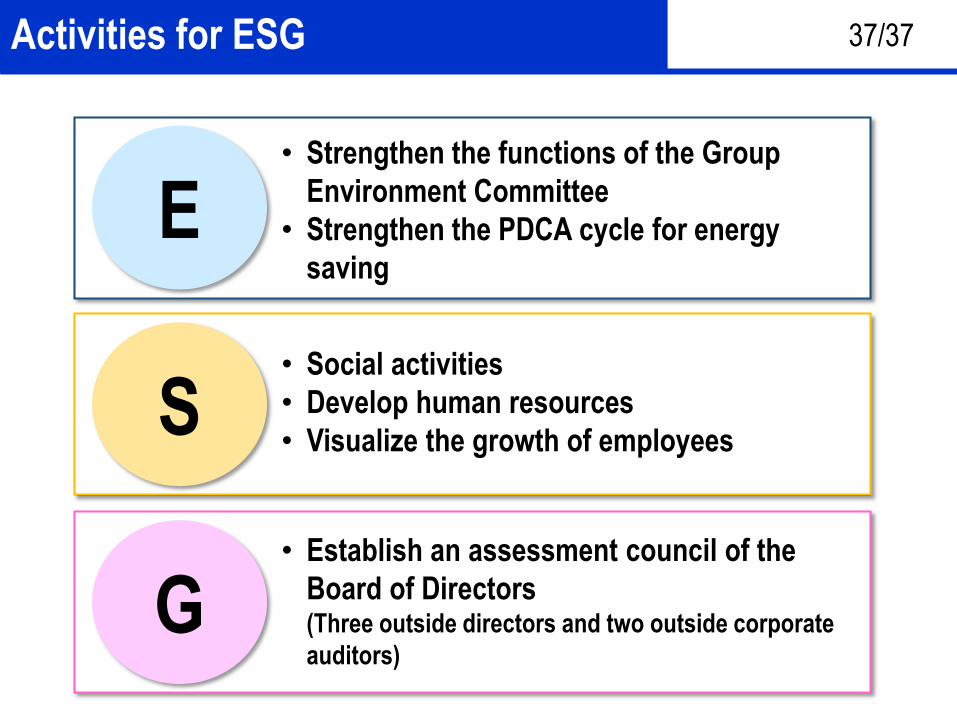
3737Activities for ESG
E
S
G
• Strengthen the functions of the Group
Environment Committee
• Strengthen the PDCA cycle for energy
saving
• Social activities
• Develop human resources
• Visualize the growth of employees
• Establish an assessment council of the
Board of Directors(Three outside directors and two outside corporate
auditors)
37/37
38
<Note>
Of the Company’s current business performance, plans and strategies included in this material,
items that are not historical facts are outlooks on future performance, which are based on the
judgment of the Company’s management according to currently available information.
Therefore, please note that actual performance may differ significantly from the future outlook
described in this material due to changes in various factors.
Related Documents


![For the fiscal year ended December 31, 2009 · For the fiscal year ended December 31, 2009 OR [ ] TRANSITION REPORT PURSUANT TO SECTION 13 OR 15(d) OF THE SECURITIES EXCHANGE ACT](https://static.cupdf.com/doc/110x72/5bb9083609d3f2333b8ddbd7/for-the-fiscal-year-ended-december-31-for-the-fiscal-year-ended-december-31.jpg)


