Financial Management – I Project Report Risk Analysis - Hindalco vs Nalco Submitted to: Prof. V.NARENDAR Submitted by: GROUP No – 15, SEC - A MADHUSUDAN MOHAPATRA (09BSHYD0419) Page 1 of 12

Welcome message from author
This document is posted to help you gain knowledge. Please leave a comment to let me know what you think about it! Share it to your friends and learn new things together.
Transcript
8/9/2019 Financial Management I Report Hindalco Nalco Group-15
http://slidepdf.com/reader/full/financial-management-i-report-hindalco-nalco-group-15 1/12
Financial Management – I ProjectReport
Risk Analysis - Hindalco vs Nalco
Submitted to:
Prof. V.NARENDAR
Submitted by:
GROUP No – 15,SEC - A
MADHUSUDAN MOHAPATRA(09BSHYD0419)
Page 1 of 12
8/9/2019 Financial Management I Report Hindalco Nalco Group-15
http://slidepdf.com/reader/full/financial-management-i-report-hindalco-nalco-group-15 2/12
SANTOSH ANAND DHARWAR(09BSHYD0736)
MADAN SINGH (09BSHYD0417)DEEPTI
(09BSHYD0249)
OBJECTIVE:
To calculate risk & return, weighted average cost of capital ( cost of equity and cost of debt ), of two companies: Hindalco & Nalco and thereby determine the riskier company of the twocompanies and find the factors influencing the risk in the two companies.
INTRODUCTION:
Aluminum Industries in India is one of the leading industries in the Indian economy. The growthof the aluminum Metal industry in India would be sustained by the diversification andexploration of new horizons for the industry. India has huge deposits of natural resources in formof minerals like copper, chromite, iron ore, manganese, bauxite, gold, etc. The India aluminumindustry falls under the category of non iron based which include the production of copper, tin, brass, lead, zinc, aluminum, and manganese.
The main operations of the of the India aluminum industry is mining of ores, refining of the ore, casting, alloying, sheet, and rolling into foils. At present, Hindalco and Nalco are one of the most economical in the production of aluminum in the world. For the sustenance of thegrowth the aluminum industry in India has to develop research and development units to assistthe production and improve on the quality measures to keep a stringent quality control.
The India aluminum Metal Industries sector in the previous decade experienced substantialsuccess among the other industries. The India aluminum industry is developing fast and theadvancement in its technologies is boosting the growth even faster. The utilization of bothinternational and domestic resources was significant in the rapid development of the Indiaaluminum industry. This rapid development has made the India aluminum industry prominentamong the investors. The India aluminum industry has a bright future as it can become one of thelargest players in the global aluminum market as in India the consumption is fairly low, theindustry may use the surplus production to cater the international need for aluminum which isused all over the world for several applications such as aircraft manufacturing, automobilemanufacturing, utensils, etc.
The companies under the India aluminum industry:Hindalco (Hindalco Industries Ltd)Indal (Indian Aluminum Co Ltd) Nalco (National Aluminum Co Ltd)Balco (Bharat Aluminum Co Ltd)Malco (Madras Aluminum Co Ltd)
Page 2 of 12

8/9/2019 Financial Management I Report Hindalco Nalco Group-15
http://slidepdf.com/reader/full/financial-management-i-report-hindalco-nalco-group-15 3/12
Methodology:
The assignment involves calculation of risk & return, cost of capital of two companies: Hindalcoand Nalco. All the values of share prices of both the companies were taken from Bombay Stock Exchange (BSE). Their respective returns are compared with returns from SENSEX. Theanalysis is done taking into consideration share prices for 4 years and 4 months years i.e. fromApril, 2005 to August, 2009.
Calculation of Beta:
Beta value is calculated for the entire period for both the companies. Return of market andsecurity is calculated using the formulas given below:
BETA (β): A measure of the volatility, or systematic risk, of a security or a portfolio incomparison to the market as a whole. Beta is used in the capital asset pricing model (CAPM), amodel that calculates the expected return of an asset based on its beta and expected marketreturns. It is also known as "beta coefficient".
β=COVAR(security,market)/Var(market)
• The covariance between the market return and that of the companies was calculateddirectly using Microsoft Excel.
• The market returns of each day of respective months were used to arrive at theMarket Variance.
• Returns for all the months are also calculated in a separate table and also plotted tosee the graphical comparison of returns on stock with the market.
Cost of Capital:
Page 3 of 12
8/9/2019 Financial Management I Report Hindalco Nalco Group-15
http://slidepdf.com/reader/full/financial-management-i-report-hindalco-nalco-group-15 4/12
Calculation of Cost of Equity (Ke)
Cost of equity is calculated using two approaches: Dividend Growth Model and Capital AssetPricing Model (CAPM).
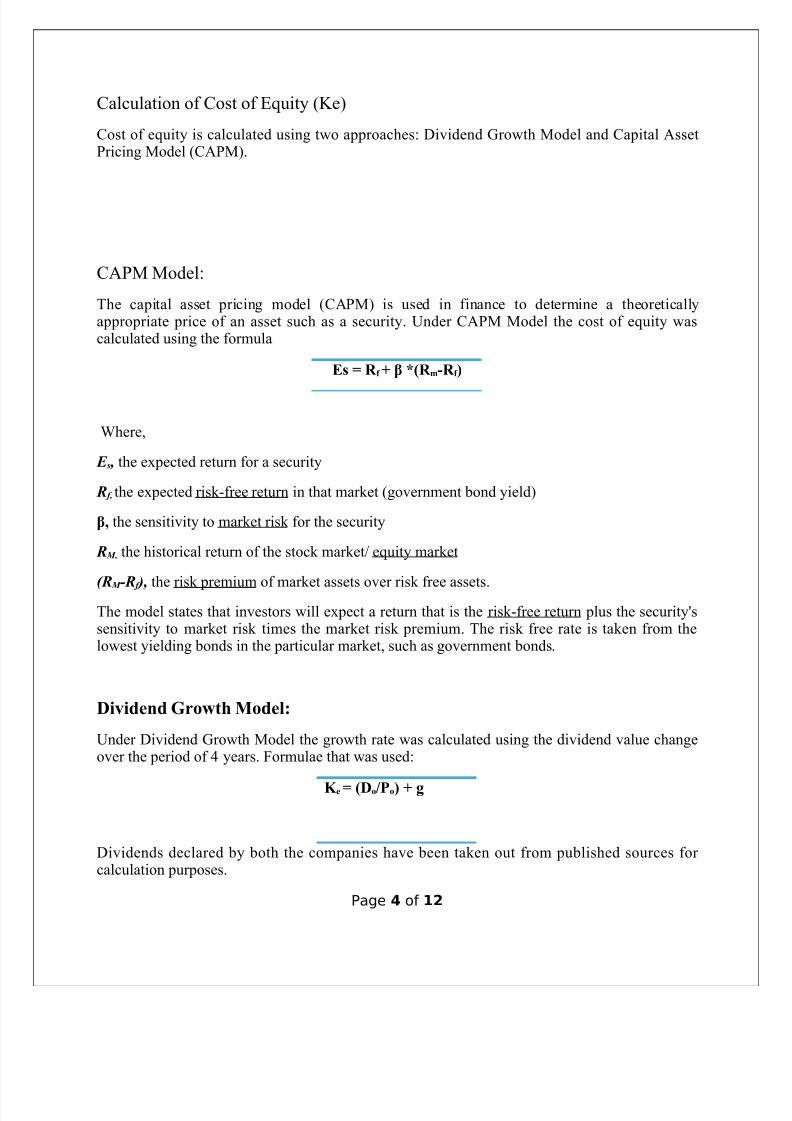
CAPM Model:
The capital asset pricing model (CAPM) is used in finance to determine a theoreticallyappropriate price of an asset such as a security. Under CAPM Model the cost of equity wascalculated using the formula
Es = R f + β *(R m-R f )
Where,
E s , the expected return for a security
R f, the expected risk-free return in that market (government bond yield)
β, the sensitivity to market risk for the security
R M, the historical return of the stock market/ equity market
(R M -R f ), the risk premium of market assets over risk free assets.The model states that investors will expect a return that is the risk-free return plus the security'ssensitivity to market risk times the market risk premium. The risk free rate is taken from thelowest yielding bonds in the particular market, such as government bonds.
Dividend Growth Model:
Under Dividend Growth Model the growth rate was calculated using the dividend value changeover the period of 4 years. Formulae that was used:
K e = (Do/Po) + g
Dividends declared by both the companies have been taken out from published sources for calculation purposes.
Page 4 of 12
8/9/2019 Financial Management I Report Hindalco Nalco Group-15
http://slidepdf.com/reader/full/financial-management-i-report-hindalco-nalco-group-15 5/12
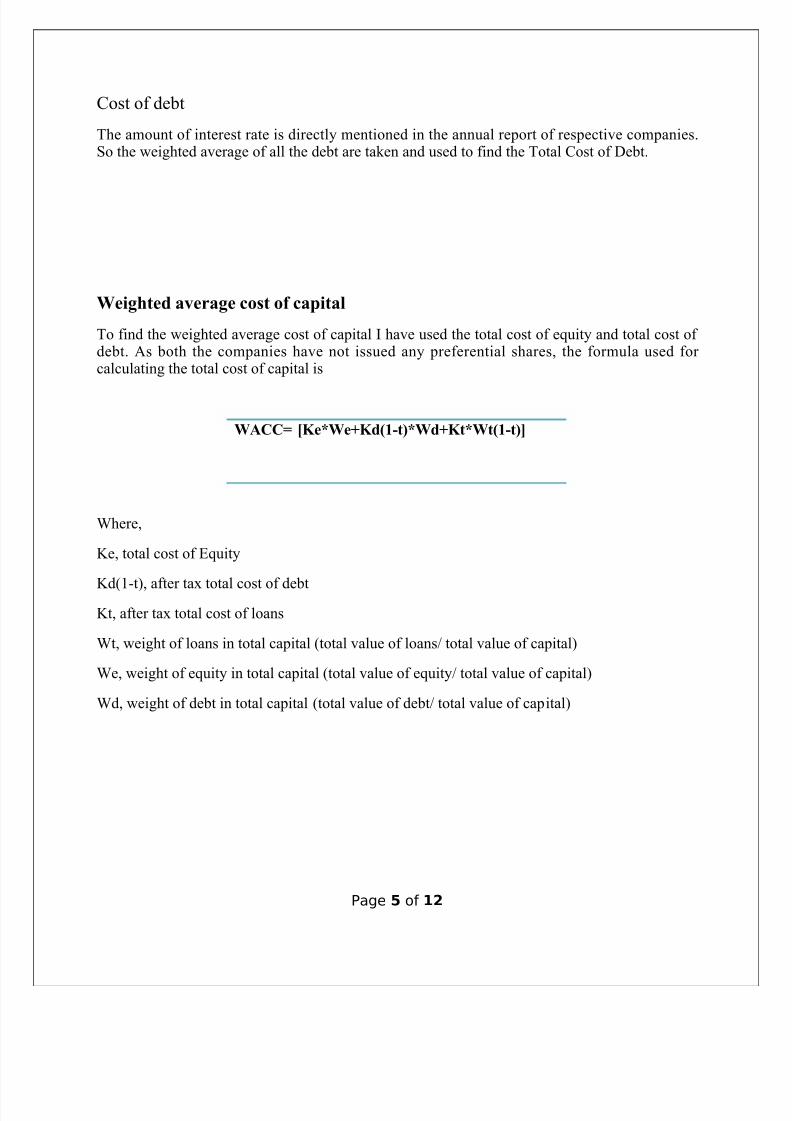
Cost of debt
The amount of interest rate is directly mentioned in the annual report of respective companies.So the weighted average of all the debt are taken and used to find the Total Cost of Debt.
Weighted average cost of capital
To find the weighted average cost of capital I have used the total cost of equity and total cost of debt. As both the companies have not issued any preferential shares, the formula used for calculating the total cost of capital is
WACC= [Ke*We+Kd(1-t)*Wd+Kt*Wt(1-t)]
Where,
Ke, total cost of Equity
Kd(1-t), after tax total cost of debtKt, after tax total cost of loans
Wt, weight of loans in total capital (total value of loans/ total value of capital)
We, weight of equity in total capital (total value of equity/ total value of capital)
Wd, weight of debt in total capital (total value of debt/ total value of capital)
Page 5 of 12
8/9/2019 Financial Management I Report Hindalco Nalco Group-15
http://slidepdf.com/reader/full/financial-management-i-report-hindalco-nalco-group-15 6/12
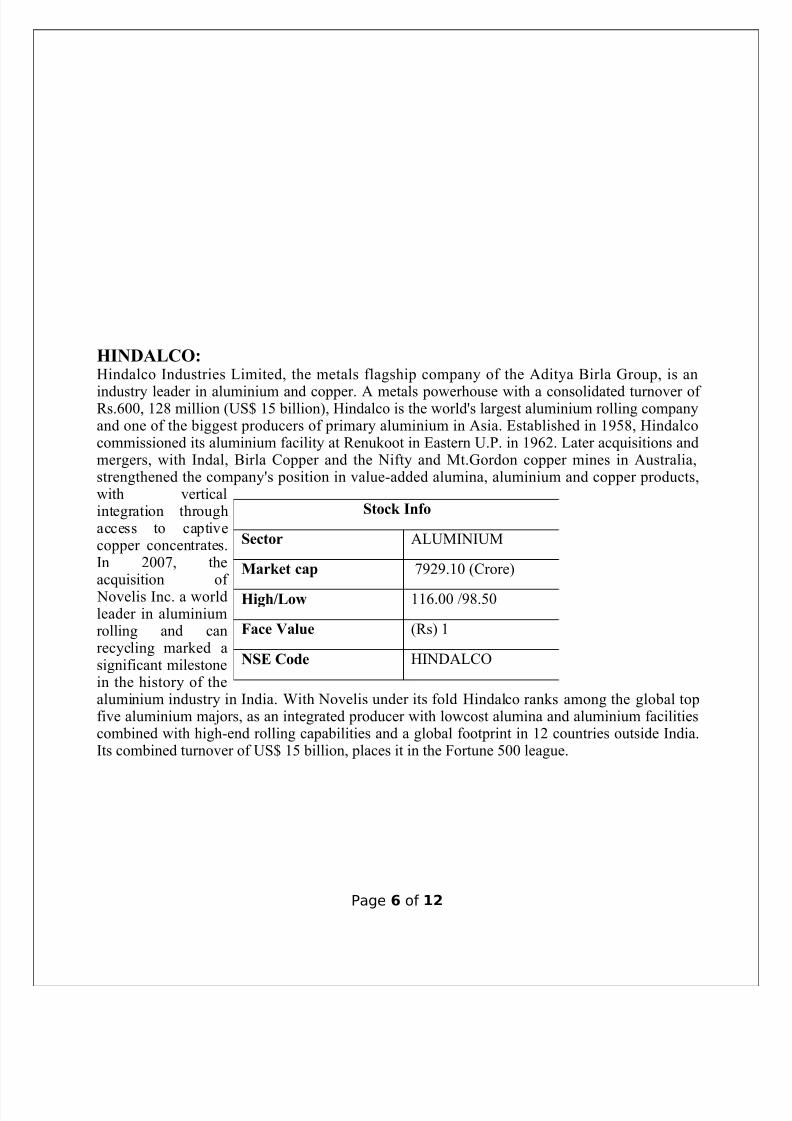
HINDALCO:Hindalco Industries Limited, the metals flagship company of the Aditya Birla Group, is an
industry leader in aluminium and copper. A metals powerhouse with a consolidated turnover of Rs.600, 128 million (US$ 15 billion), Hindalco is the world's largest aluminium rolling companyand one of the biggest producers of primary aluminium in Asia. Established in 1958, Hindalcocommissioned its aluminium facility at Renukoot in Eastern U.P. in 1962. Later acquisitions andmergers, with Indal, Birla Copper and the Nifty and Mt.Gordon copper mines in Australia,strengthened the company's position in value-added alumina, aluminium and copper products,with verticalintegration throughaccess to captivecopper concentrates.In 2007, theacquisition of Novelis Inc. a worldleader in aluminiumrolling and canrecycling marked asignificant milestonein the history of thealuminium industry in India. With Novelis under its fold Hindalco ranks among the global topfive aluminium majors, as an integrated producer with lowcost alumina and aluminium facilitiescombined with high-end rolling capabilities and a global footprint in 12 countries outside India.Its combined turnover of US$ 15 billion, places it in the Fortune 500 league.
Page 6 of 12
Stock Info
Sector ALUMINIUM
Market cap 7929.10 (Crore)
High/Low 116.00 /98.50
Face Value (Rs) 1
NSE Code HINDALCO
8/9/2019 Financial Management I Report Hindalco Nalco Group-15
http://slidepdf.com/reader/full/financial-management-i-report-hindalco-nalco-group-15 7/12
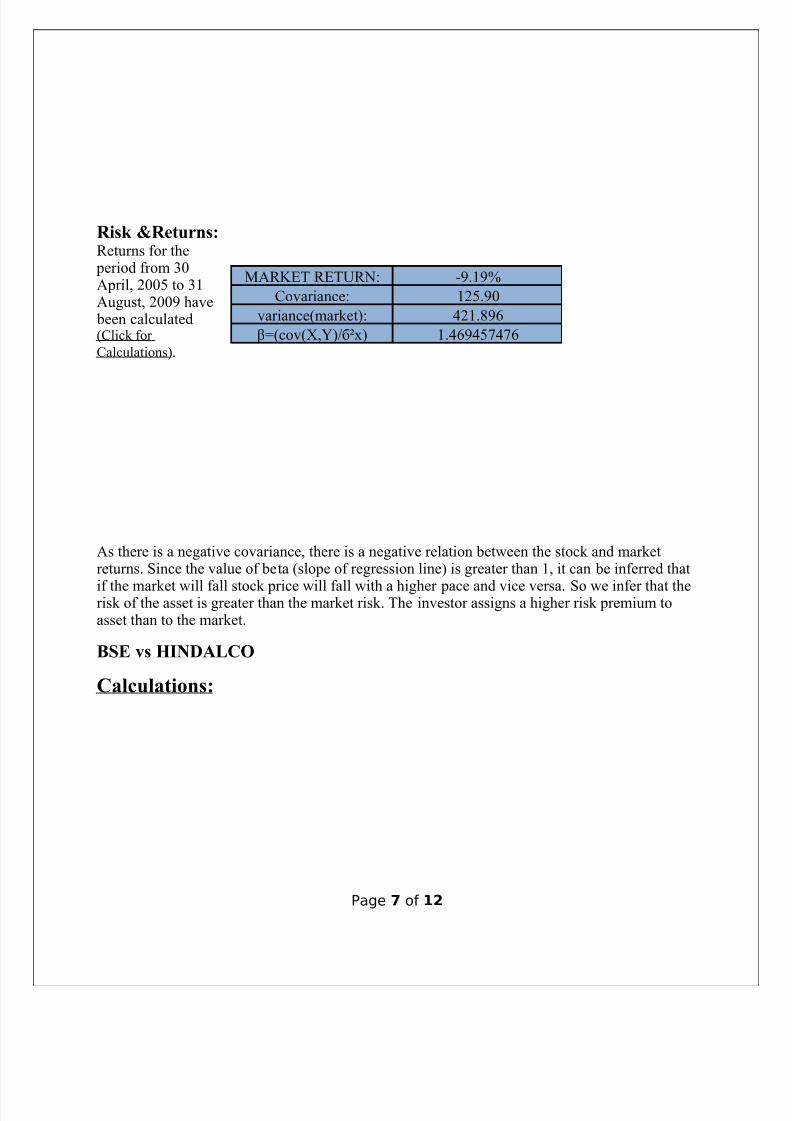
Risk &Returns:Returns for the period from 30April, 2005 to 31August, 2009 have been calculated(Click for
Calculations).
As there is a negative covariance, there is a negative relation between the stock and marketreturns. Since the value of beta (slope of regression line) is greater than 1, it can be inferred that
if the market will fall stock price will fall with a higher pace and vice versa. So we infer that therisk of the asset is greater than the market risk. The investor assigns a higher risk premium toasset than to the market.
BSE vs HINDALCO
Calculations:
Page 7 of 12
MARKET RETURN: -9.19%
Covariance: 125.90
variance(market): 421.896
β=(cov(X,Y)/б²x) 1.469457476

8/9/2019 Financial Management I Report Hindalco Nalco Group-15
http://slidepdf.com/reader/full/financial-management-i-report-hindalco-nalco-group-15 8/12
CAPM Model
R f 4.5842%
R m -9.19%
beta(β) 1.469457476
Cost of Equity(K e) -15.655%
Dividend Growth Model
Average growth rate: 10.0%
Expected dividend: 203.5
Market price of stock on 31st August'09: 107.15
Cost of equity (K e)= -15.655%
Page 8 of 12

8/9/2019 Financial Management I Report Hindalco Nalco Group-15
http://slidepdf.com/reader/full/financial-management-i-report-hindalco-nalco-group-15 9/12
NALCOIncorporated in 1981, as a public sector enterprise of the Government of India, NationalAluminium Company Limited (Nalco) is Asia's largest integrated aluminium complex,encompassing bauxite mining, alumina refining, aluminium smelting and casting, power generation, rail and port operations.
Commissionedduring 1985-87, Nalco has emergedto be a star performer in production, exportof alumina andaluminium, andmore significantly,in propelling a self-sustained growth.
Risk & Returns:
Returns for the period from 30 April, 2005 to 31 August, 2009 have been calculated.
Page 9 of 12
Stock Info
Sector ALUMINIUM
Market cap 21407.0 (Crore)
High/Low 352.00 /298.25
Face Value 10.00
NSE Code NATIONALUM
8/9/2019 Financial Management I Report Hindalco Nalco Group-15
http://slidepdf.com/reader/full/financial-management-i-report-hindalco-nalco-group-15 10/12
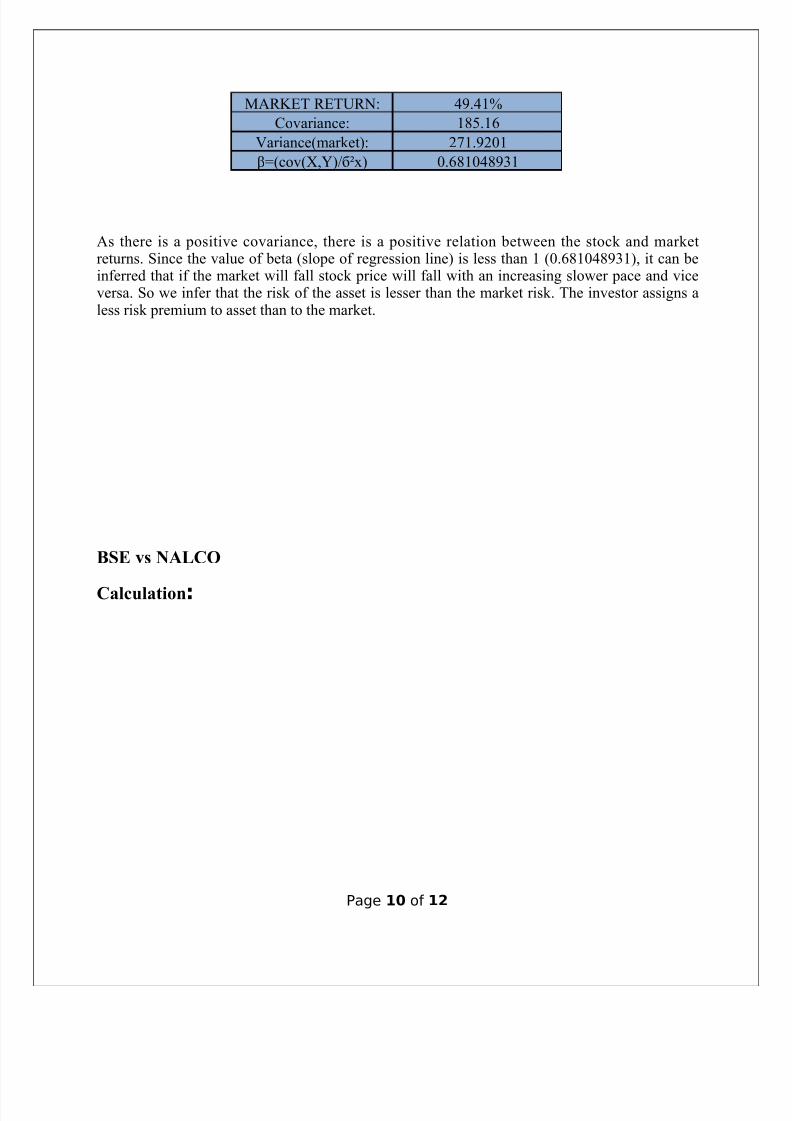
As there is a positive covariance, there is a positive relation between the stock and marketreturns. Since the value of beta (slope of regression line) is less than 1 (0.681048931), it can beinferred that if the market will fall stock price will fall with an increasing slower pace and viceversa. So we infer that the risk of the asset is lesser than the market risk. The investor assigns aless risk premium to asset than to the market.
BSE vs NALCO
Calculation:
Page 10 of 12
MARKET RETURN: 49.41%
Covariance: 185.16
Variance(market): 271.9201
β=(cov(X,Y)/б²x) 0.681048931
8/9/2019 Financial Management I Report Hindalco Nalco Group-15
http://slidepdf.com/reader/full/financial-management-i-report-hindalco-nalco-group-15 11/12
Calculations :
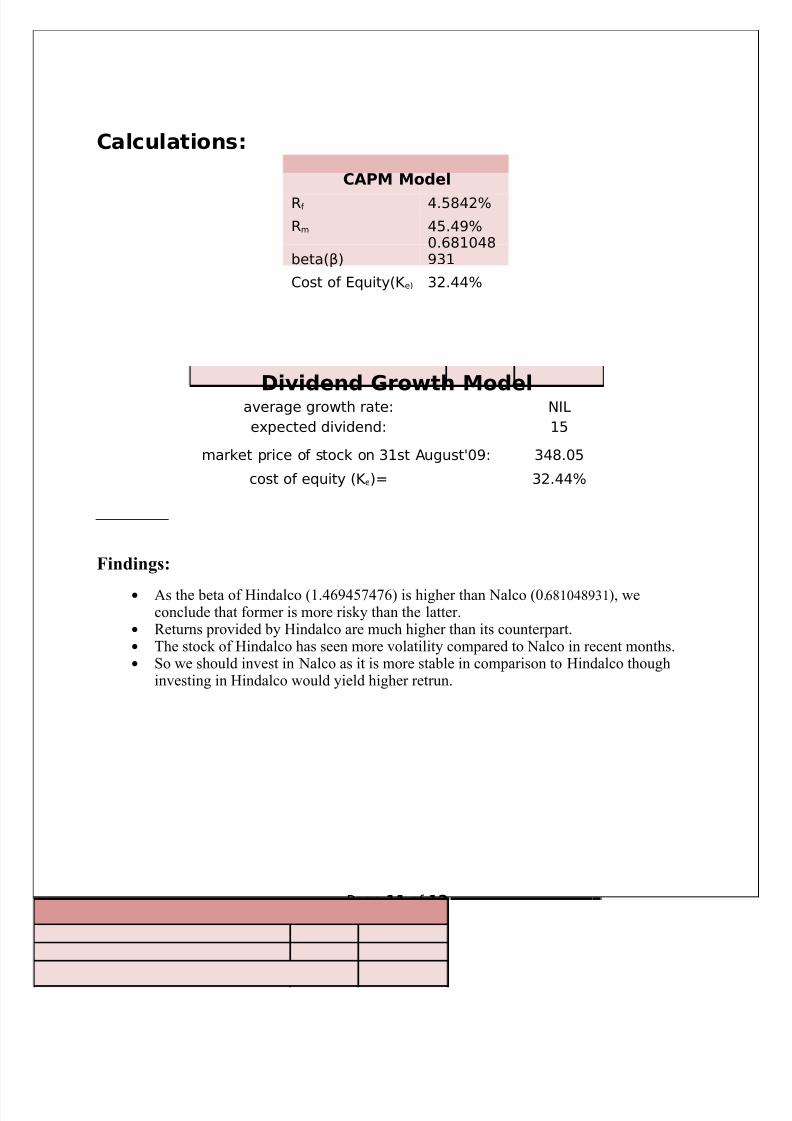
Dividend Growth Modelaverage growth rate: NIL
expected dividend: 15
market price of stock on 31st August'09: 348.05
cost of equity (K e)= 32.44%
Findings:
• As the beta of Hindalco (1.469457476) is higher than Nalco (0.681048931), weconclude that former is more risky than the latter.
• Returns provided by Hindalco are much higher than its counterpart.• The stock of Hindalco has seen more volatility compared to Nalco in recent months.• So we should invest in Nalco as it is more stable in comparison to Hindalco though
investing in Hindalco would yield higher retrun.
Page 11 of 12
CAPM Model
Rf 4.5842%
Rm 45.49%
beta(β)0.681048931
Cost of Equity(K e) 32.44%
8/9/2019 Financial Management I Report Hindalco Nalco Group-15
http://slidepdf.com/reader/full/financial-management-i-report-hindalco-nalco-group-15 12/12
Bibliography:
Books-
Financial management by Chandra, PrasannaFinancial management by IUPFinancial management by Pandey, I MFinancial management by Khan, Y K & Jain, P K
Web Links-www.nseindia.comhttp://www.hindalco.com/about_us/index.htmhttp://www.nalcoindia.com/home.html
www.finance.yahoo.comwww.money.rediff.comwww.rbi.org.inwww.investopedia.comwww.wikipedia.orghttp://www.finance30.com/forum/topics/calculating-wacc-in-the-real
Page 12 of 12
Related Documents