Knowing what not to do: financial literacy and consumer credit choices * Christian D. Dick Lena M. Jaroszek ** October 31, 2013 * We are grateful to Stefan Ruenzi, Zwetelina Iliewa, Ulrich Seubert and participants of SMYE 2013, IFABS 2013 and FDIC’s Consumer Research Symposium 2013 for valuable comments. We thank Philipp Jamscikov for able research assistance. This paper has been partly derived from an analysis made in the context of a project report by ZEW on behalf of the German Federal Ministry of Food, Agriculture and Consumer Protection. ** Centre for European Economic Research (ZEW) Mannheim and University of Mannheim, Germany, Email: [email protected]

Welcome message from author
This document is posted to help you gain knowledge. Please leave a comment to let me know what you think about it! Share it to your friends and learn new things together.
Transcript
Knowing what not to do: financial literacy and consumer
credit choices∗
Christian D. Dick Lena M. Jaroszek∗∗
October 31, 2013
∗We are grateful to Stefan Ruenzi, Zwetelina Iliewa, Ulrich Seubert and participants of SMYE 2013, IFABS 2013 andFDIC’s Consumer Research Symposium 2013 for valuable comments. We thank Philipp Jamscikov for able researchassistance. This paper has been partly derived from an analysis made in the context of a project report by ZEW onbehalf of the German Federal Ministry of Food, Agriculture and Consumer Protection.
∗∗Centre for European Economic Research (ZEW) Mannheim and University of Mannheim, Germany, Email:[email protected]
Knowing what not to do: financial literacy and consumer
credit choices.
Abstract
Based on a rich panel of household data, we investigate the determinants of the use of consumer
credit in Germany. We find that the usage frequency of an easily accessible, but relatively expensive
source of consumer credit is not only related to individuals’ self-control but decreases with financial
literacy. This result is robust to household structure, income, wealth, age, formal education, and
occupational status. We document that impulsive people, with a tendency to choose intuitive
but incorrect answers on a test in the survey, use (expensive) overdraft credits less frequently if
they possess financial literacy skills. Hence, financial education plays an important role improving
consumer choices.
JEL-Classification: D12, D14
Keywords: Household finance, cognitive reflection, financial literacy, self-control
1 Introduction
Economic theory assumes that households save, consume and take out loans according to the life-
cycle hypothesis (Modigliani and Brumberg, 1954). This normative framework predicts that younger
households borrow in expectation of increasing future income in order to smooth their consumption
over time. The model presumes that households act rationally in the sense that they maximize their
lifetime utility according to their time- consistent preferences. However, empirical studies reveal sub-
stantial limitations of traditional finance theory in explaining financial decisions by private households
(Campbell, 2006; Bernheim, Skinner, and Weinberg, 2001).
We consider two explanations for households’ systematic deviations from the normative framework.
First, individuals’ behavior may be influenced by myopia; in credit decisions, short-sighted behavior
will lead to an overvaluation of immediate benefits and an undervaluation of future costs. Such
hyperbolic discounting will drive households to demand higher levels of consumer credit when they
have to decide whether to consume on credit. Secondly, few households will be able to correctly
conduct the present value calculations necessary to determine the optimal consumption path in the
life-cycle theory and few will know enough about the functioning of financial markets and appropriate
financial products (Lusardi and Mitchell, 2011). The idea that a lack of self-control as opposed to poor
financial literacy is responsible for suboptimal financial decisions challenges the claim that financial
education has a beneficial impact on consumer behavior. We therefore study the interplay between
consumers’ self-control and financial literacy for credit decisions taken in their daily lives.
In order to explain the behavior of consumers, normative theory is enriched by behavioral aspects.
In their seminal paper Shefrin and Thaler (1988) incorporate myopic behavior into their behavioral
life-cycle theory. In order to capture formally the internal conflict between the rational and emotional
aspects of an individual’s personality they model the individual’s optimization problem by a dual
preference structure. In such dual preference models the decision process is described as a conflict
between two coexisting selves with mutually inconsistent preferences: a far-sighted planner concerned
with the long term and a pathologically myopic doer.1 Since the doer strives for immediate gratifica-
1Dual processing theory is backed by neuroeconomic evidence that short-term impulsive behavior is associated withactivity of different areas of the brain than long-term planned behavior (McClure, Laibson, Loewenstein, and Cohen,2004). It has recently also become a topic in popular scientific discourse thanks to Kahneman (2011) ”Thinking, Fastand Slow”.
1
tion, the planner has to exert self-control in order to reduce the consumption level suggested by the
doer and to assure future benefits. Theoretical models such as Laibson (1997), Gul and Pesendorfer
(2001, 2004), Benhabib and Bisin (2005) or Bertaut, Haliassos, and Reiter (2009) predict that present
bias or temptation increase households’ desire for immediate consumption and therefore will increase
borrowing. It is important to stress that in these theoretical models irrational decisions are usually
made despite agents’ ability to rationally judge that the level of debt taken out is unsustainable in
consideration of future income. However, they are tempted to deviate from the ideal strategy. In this
way, short-sighted behavior can distract people from realizing the consequences of their consumption
decisions for the sustainability of personal debt.
From an empirical side, Bucciol (2012) demonstrates that models incorporating temptation come
closer to reality than previous normative approaches. Meier and Sprenger (2010) document that
present-biased individuals who prefer immediate gratification in experimental choices are more likely
to have credit-card debt as well as higher amounts outstanding. Present-biased preferences have also
been linked to impulsivity (Zermatten, Van der Linden, d’Acremont, Jermann, and Bechara, 2005)
and correspondingly, impulsive individuals are found to be biased towards immediate rewards and
less sensitive to the negative consequences of their decisions (Martin and Potts, 2009). Accordingly,
Ottaviani and Vandone (2011) analyze impulsivity as a determinant of households’ participation in
the credit market. Their study of employees of international asset management companies provides
evidence that impulsivity is a significant predictor of the probability that households hold unsecured
debt. Furthermore, Ottaviani and Vandone (2011) carve out that the effect of behavioral factors on
household debt demand is different for secured and unsecured debt. While secured debt cannot be
taken out ad hoc and the process is usually professionally consulted and includes an assessment of
the loan’s sustainability, it follows the life-cycle more closely. On the contrary, unsecured debt can
be taken out without any consultation and the decision may be determined by short-term benefits,
such as financing daily shopping, so that short term credit decisions are more likely to be prone to
behavioral aspects such as a lack of self-control. 2
The second strand of literature abstracts from behavioral aspects and assumes that a poor under-
standing of products and mechanisms in financial markets (i.e., low financial literacy) spurs suboptimal
2The aspect of temptation is also included formally in the behavioral life-cycle theory by Shefrin and Thaler (1988)who postulate that the temptation to spend is greatest for current income and least for future wealth. This argument isparticularly interesting, given that we analyze overdraft credit on current income accounts.
2
financial decisions.3 This notion is widely acknowledged in the investment domain where financial illit-
eracy is associated with inadequate saving decisions (Lusardi and Mitchell, 2007; Bucher-Koenen and
Lusardi, 2011; van Rooij, Lusardi, and Alessie, 2012), with lower stock market participation (van Rooij,
Lusardi, and Alessie, 2011) and with lower portfolio diversification (Guiso and Jappelli, 2009). More
recently, research on financial literacy has extended its focus to credit-related issues, such as credit
conditions and in particular high cost credit (Disney and Gathergood, 2013), usage behavior of credit
cards and over-indebtedness (Lusardi and Tufano, 2009), the delinquency on (general) debt (Disney
and Gathergood, 2011) and subprime mortgages (Gerardi, Goette, and Meier, 2010). Evidence from
this research suggests that financial literacy, i.e. the understanding of simple economic concepts and
the ability to perform computations necessary for most financial choices, enhances financial decision
making.
This study contributes to the field of consumers’ debt demand, which has so far been much less
investigated than the investment side. Furthermore, it aims at identifying whether mainly behavioral
aspects, namely a lack of self-control, or consumers’ financial illiteracy should be held accountable
for consumers’ credit decisions. The conclusions provide implications for regulatory actions aiming at
increasing individuals’ welfare or at consumer protection.
Identifying determinants of credit usage decisions is important due to the availability of consumer
credit: it is available to the vast majority of the adult population in almost all developed countries,
either by means of credit cards, or (as in the case of Germany considered here) by credit facilities
associated with current accounts. As households typically make such decisions without consulting
financial advisers, our study determines the role of financial education in the improvement of credit
decisions.4 Taking into account that overdraft limits or limits on credit card accounts usually amount
to a multiple of the consumer’s net monthly income, the influence of lacking self-control or sophistica-
tion raises concerns that affected individuals will be unable to fully conceive the consequences of their
debt decision. They are likely to roll over their outstanding balances from month-to-month which may
lead to over-indebtedness in the long-run.
Our results show that self-control elicited by a three-item performance test correlates with the usage
3For a discussion of the relation between cognitive ability and character traits, see Borghans, Duckworth, Heckman, andter Weel (2008).
4Complementarily, Clark, Morrill, and Allen (2012) demonstrate that external influences affect retirement savings deci-sions.
3
frequency of overdraft credit lines (H1). In our sample, individuals who exhibit low self-control are
about 20 percent (around 4 percentage points) more likely to overly rely on overdraft accounts than
their more patient counterparts.5 However, we find a mitigating effect of financial literacy, which com-
pensates for the effect of lacking self-control (H2). According to our evidence mainly the knowledge
of financial products and understanding of financial markets rather than numeracy lead to a change
in credit usage behavior. This result is reassuring given the concerns by Smith, McArdle, and Willis
(2010), who argue that a lack of numeracy is a more fundamental issue than a lack of financial literacy,
and by Banks (2010), who highlights the importance of disentangling financial literacy and numeracy.
On the one hand, our results on self-control may raise concerns that impulsive individuals take out
unsustainable levels of debt and that this may lead to over-indebtedness. On the other hand, financial
literacy remains a crucial determinant of the use of credit products. Therefore, financial education
programs could substantially improve households’ financial decisions.6
Our analysis seems related to a recent theoretical model by Heidhues and Koszegi (2010) in which
non-sophisticated consumers with a taste for immediate gratification will over-borrow and are hood-
winked by unfavorable contract terms such that they suffer considerable welfare losses. However, in
the model sophistication does not relate to the concept of financial literacy, i.e. understanding the
features of the financial products, but to the notion that unsophisticated individuals only partially
understand their taste for immediate gratification. In empirical work, Gathergood (2012) examines
the relation between individuals’ self-control issues, financial illiteracy and use of quick-access, high-
cost credit products such as in-store credit cards, mail order catalogues, home credit and pay day
loans. The credit product we analyze - overdraft lines on current accounts - can be accessed with even
greater ease simply by withdrawals from the current account or by cashless payments. Furthermore,
while Gathergood (2012) relies on a measure of self-control based on the self-assessments of survey
participants’ impulsiveness, our proxy is derived from a performance test. In line with Gathergood
(2012) we find that consumers with self-control issues make more frequent use of quick-access credit.
Contrary to his evidence on over-indebtedness we find a more pronounced effect of financial literacy
than of lack of self-control on consumer credit decisions. In another recent contribution Hastings and
5A comparison with an alternative form of consumer credit (installment credit) shows differences in line with the resultsby Ottaviani and Vandone (2011) in their analysis of unsecured and secured credit products.
6Similar arguments in favor of financial education have been made in different contexts by van Rooij, Lusardi, andAlessie (2011), Guiso and Jappelli (2009) or Bucher-Koenen and Lusardi (2011).
4
Mitchell (2011) analyze present-bias and financial illiteracy as competing explanations for Chilean
consumers making suboptimal financial decisions. However, their proxy for present-biased preferences
may capture other behavioral aspects than self-control.7 The relevance of our analysis is backed by
evidence on the negative correlation between present-biased preferences and financial literacy by Al-
menberg and Gerdes (2012), who point out that controlling for financial literacy is necessary when
analyzing the impact of a present-bias on financial decision making in order to avoid biased results.
The remainder of this study is organized as follows: Section 2 introduces the dataset and the insti-
tutional background of consumer credit in Germany. Section 3 describes the details of the regression
strategies and discusses the results. Section 4 presents the results of various robustness exercises,
whereas Section 5 concludes.
2 Data
Our empirical analysis relies on a micro dataset from a household panel study (SAVE Study), which
has been conducted among households in Germany by the Munich Research Institute for the Eco-
nomics of Aging (MEA) since 2001. The data are representative for the German population and cover
information on demographic and economic characteristics focusing on savings and old-age provisions.
The sampling unit of the panel is the household. For the purposes of our analysis, we mainly rely
on data collected in the survey year 2009 because this survey questionnaire is the only one includ-
ing the Cognitive Reflection Test suggested by Fredrick (2005) on which we will base our proxy for
self-control. The survey of 2009 also contains a comprehensive module of financial literacy questions
which is broader than the set of questions in previous survey waves. Also, for the first time the re-
spondents can actively refrain from answering financial literacy questions by choosing the option ”I
cannot/do not want to answer”. This option reduces the probability that individuals try to guess the
correct answer and therefore allows for a cleaner definition of the proxy for financial literacy. The
7Hastings and Mitchell (2011) deduct impatience from survey participants’ decision to fill out a short questionnaireimmediately after the end of the survey and receive a gift card of a certain value right away or to delay the reply ofthe questionnaire. In the latter situation the questionnaire needs to be completed at home and sent back in a pre-paidenvelope. The participant would then receive a gift card with a higher but uncertain value. However, survey participantsmay be aware of their tendency to ”forget” to send back the letter in time. Or they may mistrust that they will receivethe gift card later or that it may get lost while in transit by mail. Furthermore, although the uncertain amount ofthe gift card will in any case be higher than the value of the gift card obtained when completing the questionnaireimmediately, respondents may want to circumvent ambiguity. Therefore, a study design in which the questionnaireneeds to be completed right away and only the decision about the gratification is at choice would have yielded a cleanermeasure for impatience.
5
data has also been used for research on financial literacy by, e.g., Bucher-Koenen and Lusardi (2011),
Bucher-Koenen and Ziegelmeyer (2011) and Glaser and Klos (2012), and is particularly well suited to
link individual traits such as financial knowledge to detailed information about the household balance
sheet and socio-demographic characteristics. Contrary to earlier studies, we do not rely on imputed
values in the SAVE data but instead reconstruct missing values using the indicator file provided by
MEA which identifies imputed values.8
Concerning consumer credit, we primarily focus on data on overdraft facilities on checking ac-
counts (”Dispokredite”). Due to the specific institutional setup in Germany (credit limits are based
on current accounts instead of credit cards), the use of consumer credit lines is independent from
the method of payment. Hence, unlike most literature on the use of credit cards (e.g., Klee, 2008;
Koulayev, Rysman, Schuh, and Stavins, 2012), we unambiguously measure credit decisions rather
than a mixture of credit decisions and transaction method choices. Furthermore, due to the broad
availability of overdraft credit lines among the German population a differentiation between usage of
this credit form and access to it is not an important hurdle. As documented by the household survey,
about 80 percent of all households in Germany are eligible to use a credit line on their current account,
and in fact, half of them do so at least occasionally. The size of these credit lines is substantial (on
average three times the monthly net income), and the interest rates charged at between 10 and 20
percent p.a. are considered to be rather expensive.9 Unlike consumer installment credit (which we
consider in this study for comparison), the credit line is meant to be used on a short-term basis, and it
is not associated with a specified purpose (as opposed to e.g., an installment credit for a car purchase).
In this sense, a credit line is a convenient, but also costly way to smooth consumption in the face of
temporary liquidity gaps.
In 2009, 2,176 out of 2,222 respondents (98 percent) indicate whether their checking accounts possess
an overdraft credit facility. Of the 1,733 households with an available overdraft facility, 97 percent
indicate the frequency of consumer credit use. The panelists can choose among the four predefined
answers ”never”, ”1 to 3 times a year”, ”4 to 6 times a year”, ”more often or constantly”; hence, the
variable of interest regarding the usage of overdraft is of categorial nature and censored on both sides
8In Section 4 we include a robustness test, verifying that our result are not driven by non response bias.
9Although a subjective, this judgment is the prevailing view in the political debate in which, e.g., the German FederalMinistry of Consumer Protection (BMELV) has appealed to credit institutions to decrease interest charges on creditlimits.
6
(naturally censored by zero on the lower bound and by questionnaire design on the upper bound). The
distribution of answers on usage frequency is displayed in Table 1. The largest share of 46.8 percent
of respondents indicate to never use overdraft credit, but there is also a considerable fraction of 17
percent who answer that they use overdraft credit more than six times a year or constantly (we will
refer to this group as frequent usage group).
[Insert Table 1 here.]
Since we ask whether self-control determines credit usage, we construct a proxy for this unob-
servable trait, derived from the cognitive reflection test (CRT) introduced by Fredrick (2005).10 The
CRT is comprised of three tasks. The tasks are constructed in a way to trigger an automatic response
which comes to mind effortlessly but is incorrect. An individual with higher self-control is likely to
question the automatic response and eventually to detect the mistake. The CRT allows measuring
this tendency to exert self-control and dismiss the intuitive but incorrect answer. We hypothesize
that respondents will behave analogically in everyday financial decision making. Speaking in terms of
planner and doer, we expect that low scores on the CRT correspond to a strong doer whereas high
CRT scores correspond to a strong planner. The CRT has proven to predict a wide sample of tasks
from the literature on heuristics and biases (see Toplak, West, and Stanovich, 2012, and the overview
therin). One advantage of the CRT as a measure of self-control stems from the fact that it is a perfor-
mance measure. Self-control is otherwise often deducted from respondents’ self-assessed impulsivity
(e.g. Gathergood, 2012). Social desirability of self-control may bias the self-reported results, which is
not an issue in the case of CRT.
Responses to the questions are reported in Table 2, Panel A. While two out of the three exercises
were answered correctly by about 40 percent of respondents in each case, the prominent ”bat and ball”
problem triggered the intuitive wrong answer in two thirds of responses. Strikingly, the number of
refusals is lowest for this problem, indicating that respondents are vastly unaware of the question’s
difficulty. Nearly one half of survey participants answer all three questions incorrectly (see Table
2, Panel B). The proportion of respondents answering all questions correctly amounts to only 13.9
percent. On average 1.26 questions are answered correctly. The results compare closest to those of
web-based studies reported in Fredrick (2005). This is plausible, given that the resemblance between
10The questions are provided in Appendix A.
7
our sample and the online participants is probably higher compared to students of US universities
who formed the other test groups.
[Insert Table 2 here.]
As common in the literature on financial literacy we deduct our proxy from survey data.11 We
rely on responses to a set of questions which comes closest to the questions of van Rooij, Lusardi,
and Alessie (2011). The questions aim at evaluating the ability to solve basic mathematical problems
occurring in financial markets (interest rate compounding, real vs. nominal quantities), and to test the
intuition behind specific financial products. In this way, our measure of financial literacy aggregates
information from mathematical and institutional questions, as is common in the literature. 12 The
subset of four questions which capture basic financial concepts which do not go much beyond pure
percentage calculus numerical skills are also used in Lusardi and Mitchell (2008) and Bucher-Koenen
and Lusardi (2011). These skills are certainly necessary in the context of financial decision making and
compounding interest as well as inflation considerations. Since the questions do not demand much
financial markets specific knowledge, we will refer to them as basic financial literacy or numeracy
as also suggested by Lusardi (2012). Five advanced questions assess more innate financial concepts
regarding knowledge of financial assets’ characteristics, the stock market, risk-return relationship and
diversification.13
The empirical distribution of responses is reported in Table 3. Panel A shows that some basic and
advanced financial concepts are conceived better or worse than others. Very broadly speaking, each
question is answered correctly by about 50 to 80 percent of respondents. Especially the concepts of
interest compounding when a realistic interest rate for a savings account is assumed (basic question
1) and return volatility of different assets (advanced question 1) are well understood. However, one
more difficult advanced question about the relation between interest rate and fixed coupon bonds is
answered correctly by only 9.4 percent of respondents. For advanced questions respondents indicated
much more frequently that they cannot or do not want to answer a question instead of answering
11An exception is Carlin and Robinson (2012), who take a direct approach and conduct an experiment in which theyprovide only some participants with financial training, or Bernheim and Garrett (2003), who conduct a field study.
12In the context of investment decisions financial literacy is often suspected to be an endogenous variable. However, itis highly unlikely that people can learn about the principles of stock, bond and fund investments from their experiencewith short-term consumer credit products. We therefore decided to consider financial literacy an exogenous variable inour analysis.
13A translation of the original questions in multiple choice format is provided in Appendix B.
8
incorrectly than for the basic questions. Panel B reports the fractions of respondents who were able to
answer a specified number of answers correctly. If the number of correct answers is zero, respondents
answered either incorrectly, indicated that they do not know the correct answer or completely refused
to answer questions. About 40 percent of respondents answer at least 4 questions correctly. The mean
of correct answers is 5. Close to 60 percent of panelists indicate at least once that they do not know
the correct answer, which is evidence for the importance to provide this answering option.
[Insert Table 3 here.]
The analysis takes into account several demographic characteristics of the respondent and the
household as a whole which potentially play a role in the context of overdraft credit usage. These char-
acteristics include the quartile of household net wealth14, monthly net income, respondent age, family
status, education, occupation and employment status. More specifically, the family status is captured
by a dummy variable indicating whether the household is a single person or lives together with a part-
ner and we consider the number of children in the household. For the occupational status, respondents
indicate whether they are blue- or white-collar worker, civil servant, self-employed, retired or others
(e.g. student). Education is measured by respondents’ schooling experience: as in Germany at least
a lower secondary education (”Hauptschulabschluss”) is compulsory, we capture higher education by
mid-level education (”Mittlere Reife” or equivalent) and A-level education (”(Fach-)Hochschulreife”).
We furthermore include the self-assessed extent of respondents economics education at school or during
an apprenticeship (measured by a seven point Likert scale). For descriptive statistics of demographic
control variables please refer to Bucher-Koenen and Lusardi (2011).
3 Empirical Analysis
Empirical approach. We take a systematic look at the determinants of the usage frequency of short-
term consumer credit (”Dispokredite”), Creditfreq?. We first focus on the role of cognitive reflection,
CRT , and include (depending on the specification) a battery of control variables Φ on the RHS of the
equation, i.e.
Creditfreq?i = βCRT i + γ′Φi + εi (1)
14Since the values of asset and debt positions do not need to be reported from documents, the figures reported may beestimated imprecisely. We include quartiles of net log wealth in order to reduce noise.
9
The vector of control variables Φ includes (log) income, wealth quartiles, age, gender, family status,
dummy variables for the occupational status (with white-collar employees being the base group), for
the educational status (with a lower secondary degree being the base group), respondents’ self-assessed
extent of economic education, as well as a dummy variable capturing unemployment of the respondent
and/or the respondent’s spouse. As the data about the usage of consumer credit is of categorical
nature (there are four subgroups), Creditfreq? is not directly observable; hence, we consider Eq. (1)
a latent variable model and run ordered probit regressions. By means of the latter approach, we are
able to compute, e.g., P [(Creditfreq i = ”Never”)|CRT i,Φi], i.e., the probability of not using short-
term credit depending on cognitive reflection and other control variables. Likewise, we are also able to
compute P [(Creditfreq i = ”More often than six times or constantly”)|CRT i,Φi], i.e., the probability
of using short-term credit relatively frequently.
Self-control and consumer credit. We conclude from theoretical models that individuals with
low self-control may not be able to resist the temptation to consume right away instead of after the
next payroll, even though they are aware that overdraft credit is expensive. If this is the case, their
credit decisions are driven by a lack of self-control. We analyze this hypothesis (H1 ) by taking Eq.
(1) to the SAVE data. The results of our baseline analysis are displayed in Table 4.
[Insert Table 4 here.]
The first two rows include the measures based on the CRT. The measure ”CRT score” (columns ii
to iv) corresponds to the measure used by Fredrick (2005) and counts the number of correct answers.
Its counterpart, ”TF score” (colums v to vii), records the number of automatic (i.e. intuitive but
incorrect) answers.15 ”TF” stands for ”thinking fast” in the spirit of Kahneman (2011). The two
measures differ in the way they treat incorrect but non-automatic responses. While for CRT score
all incorrect responses are grouped together no matter whether they were intuitive or incorrect after
reflection, TF score focuses on the automatic responses and otherwise does not consider whether the
respondent failed in the task. We therefore presume TF score to be a better measure of self-control.
The regression results confirm our hypotheses concerning self-control and credit decisions: CRT
enters the regression with a negative coefficient and TF score is positively correlated with the frequency
15For both scores we require that there all three CRT items are answered. In case of refusals the scores will turn tomissing values.
10
of overdraft credit usage frequency. I.e. when the planner in an individual is strong (high CRT score)
the individual is likely to use short-term credit facilities seldom and when the doer in an individual
is more distinct (high TF score) the individual is likely to use overdraft credit frequently or even
permanently. The relation between overdraft credit usage frequency and both CRT measures is highly
significant in all regression specifications. This finding speaks in favor of the hypothesis that subjects
with low levels of self-control use credit lines more often (H1 ). The results indicate that the tendency
to fall back on overdraft facilities more frequently is driven by individuals who fail to consider the
longer-term consequences of their consumption decisions.
In our analyses we control for different sets of household characteristics. As we can see from columns
(ii) and (v) wealth and age are the most important control variables determining credit decisions, which
is in line with normative theory. The coefficient estimates on the CRT measures remain stable when
adding control variables accounting for household structure and occupational status (columns iii and
vi) or education (columns iv and vii).
In order to interpret the magnitude of coefficient estimates, Table 5 presents predicted probabili-
ties for a subject with certain characteristics to be in each of the four usage frequency groups when
varying the level of self-control (TF score), e.g. P [(Creditfreq i = ”Never”)|TF scorei,Φi]. Probabilities
are calculated based on specification (v) of the baseline analysis (Table 4), which does not require to
determine characteristics with respect to household structure, respondents’ occupation or education.
This simplification is reasonable since coefficient estimates on the self-control measure, log income and
age vary modestly between the full specification (column vii) and the reduced specification. Three
exemplary households are analyzed for differing levels of self-control. Regarding household specifica-
tions, in the upper panel households in the second wealth quartile with average age and average (log)
income are analyzed.
In our sample, the average probability for an individual to fall into the frequent overdraft usage
group amounts to 17.0 percent. However, if a person is likely to exert high self-control, i.e. if none
of the CRT questions is answered intuitively this probability decreases to 13.4 percent for a typical
household. To the contrary, for individuals with low self-control who always answer automatically
the probability for frequently using the overdraft limit rises to 19.6 percent. This picture reverses for
the group which never uses overdraft credit: While the average probability for a household in our
sample to be in this group amounts to 46.8 percent, the probability increases for highly self-controlled
11
individuals and decreases for people with low self-control. The difference in predicted probabilities
for self-controlled and impulsive individuals is even higher for the group which never uses overdraft
facilities than for the group that frequently relies on short-term credit. Being highly self-controlled
increases the probability to never use the credit line to 50.7 percent, whereas the probability for people
with weak self-control amounts to only 40.8 percent.
As expected from regression results and theory, for younger households (results in the second panel)
the probabilities to use credit more frequently rises for all individuals abstracting from their level of
self-control. Overdraft facilities are used by low-wealth households with higher probability. Our results
provide evidence that a lack of self-control is particularly severe for low-wealth households, since being
poor particularly increases the predicted probability to be in the group of frequent users of short-term
credit. This finding is in line with the behavioral life-cycle theory by Shefrin and Thaler (1988) who
postulate that exerting self-control will be particularly painful for poorer individuals.
[Insert Table 5 here.]
Further demographic determinants. While the role of self-control remains unaffected when
adding demographic characteristics to the RHS, it is interesting to look at these control variables
in detail: Somewhat surprisingly, household income itself is not significant in explaining overdraft
credit use frequency. Still, it enters with a negative sign which seems reasonable. This finding may be
connected to the evidence that household wealth is a very important predictor for short-term credit
usage. Although the effect of increasing wealth is non-monotonic, not being in the lowest wealth group
significantly reduces the probability to frequently rely on overdraft credit, which is reflected in the
negative coefficients of the indicators for wealth quartiles 2 to 4. Furthermore, age plays an important
role in determining credit usage which is in line with the life cycle hypothesis. While the coefficient on
age is positive, that of squared age is negative. In unreported results we observe a hump shape for the
predicted probabilities for frequent overdraft users with a peak at around age 40. This means, that
households around 40 years of age are most likely to frequently overdraw their current accounts. The
situation is inverted for the group which never uses overdraft facilities. Children increase the frequency
of overdraft credit usage. This argument is plausible in light of unexpected expenses in connection
with children. Unexpected expenses are all the more a problem for single parents who cannot balance
their budget with their partner internally. The coefficient on the variable indicating whether a person
12
lives in a relationship is not significant, but enters with the hypothesized negative sign.
Taking into account subjects’ occupation can be important because of two different aspects: on
the one hand banks could prefer certain occupations when granting credit, especially installment
credit. Overdraft facilities can then work as a substitute for consumer credit. On the other hand,
households with irregular income may especially be forced to bridge short-term liquidity shortages by
using overdraft credit. However, we find no clear pattern for the relationship between occupational
situation and overdraft credit usage when controlling for age and wealth. Alike, neither general
education nor self-assessed economics education have significant effects on credit decisions.
Interplay between self-control and financial literacy. Since short-term credit decisions are
shaped by consumers’ self-control or their lack thereof, we can question whether financial literacy will
have any further impact on credit taking behavior (H2 ). We analyze the interplay between financial
literacy and self-control in Table 6. To facilitate presentation and interpretation, the explanatory
variables are included as indicator variables. ”Lack of self-control” corresponds to the TF score in
Table 4 and indicates whether at least one of the CRT tasks was answered intuitively. The dummy on
”Financial literacy” turns to 1 when the respondent answered at least 7 out of 9 questions correctly
(i.e. more than the median number in the sample which is 6 correct answers).
[Insert Table 6 here.]
The regression of overdraft credit usage frequency on financial literacy and control variables without
the inclusion of self-control effects (column ii) confirms a significant role of financial literacy for credit
taking decisions. This finding speaks in favor of the hypothesis that subjects with higher levels of
financial literacy better understand financial concepts such as compound interest. Since they are
more likely to be aware of high costs of overdraft credit usage they fall back on it less frequently.
The evidence which confirms a relation between credit decisions and financial literacy is in line with
findings by Disney and Gathergood (2011, 2013), Lusardi and Tufano (2009), and Gerardi, Goette, and
Meier (2010). Since we include information on schooling in our control variables we can conclude that
neither general education nor self-assessed economics education or knowledge gained in the workplace
can account for the effect of financial literacy. This result is in line with earlier research reporting
that financial literacy covers concepts different from general knowledge and that education is only an
13

imperfect proxy for financial literacy (van Rooij, Lusardi, and Alessie, 2011).
Turning to the question whether it is a lack of self-control or a lack of knowledge which leads
individuals to consume excessively on overdraft facilities, we simultaneously include both explanatory
variables into our estimation model (column iii). We observe that both effects remain statistically
significant and the coefficient estimates are only slightly decreased compared to the estimations when
only considering one of the two factors. The stability of the coefficient estimate confirms that self-
control and financial literacy cover different aspects of personal traits and have explanatory power on
their own. This finding is particularly relevant for undermining the role of financial education, since
it is easily imaginable that impulsive spending is not at all influenced by better knowledge.
In order to evaluate whether financial literacy or lacking self-control matter more for the usage
of overdraft credits in economic terms Figure 1 displays predicted probabilities for households to fall
into the group of people who never use overdraft credit, or to the other extreme, frequently use short-
term credit. More specifically, we calculate the probabilities by considering specification (iv) from the
ordered probit regression of overdraft usage on self-control, financial literacy, household wealth, net
income and age presented in Table 6 column (iv). Since the coefficient estimates for the explanatory
variables are smaller in absolute terms when not controlling for the full set of household characteristics,
we consider the results on the economic significance as conservative estimates. We analyze predicted
probabilities for a household in the second wealth quartile with average age and average monthly
income over the life-cycle. In the figures we term individuals with low self-control ”impulsive” and
those with high self-control ”controlled”.
[Insert Figure 1 here.]
Generally, the shape of the curves shows that credit demand is highest for households around
the age of 40. While the probability to be in the group that never uses overdraft credit is at its
global minimum at this age (upper figure) it peaks for the frequent credit user group (lower panel).
Probabilities for impulsive households are displayed in solid ocher lines, whereas those of households
with high self-control are in blue dashed lines. Low financial literacy is indicated by a darker color
and high financial literacy by a light shade. For the group of frequent overdraft users (lower panel)
the graph reveals that individuals who lack self-control are more likely to use their overdraft accounts
frequently (by comparison of the upper two curves for illiterate individuals or the lower two curves
14
for financially literate households). However, we can infer that financial literacy can compensate for
a lack of self-control, since an impulsive but knowledgable individual (light solid curve) is less likely
to be in the group of frequent short-term credit users, than one which has high self-control but low
literacy (dark dashed curve). The effects of self-control and financial literacy are most pronounced
at the age when credit demand is highest. The picture is inverted for people who never use their
overdraft credit (upper panel).
Financial literacy and numeracy. In order to deepen our understanding of the aspects of financial
literacy, we analyze its components in Table 7. The explanatory variables are again defined as indicator
variables. ”Numeracy” and ”Advanced literacy” take a value of 1 if the numbers of correct answers are
above the sample median. ”Numeracy”denotes the subgroup of basic financial literacy questions which
refer to basic mathematical problems occurring in financial markets. Lusardi (2012) gives a review
of numeracy questions included in financial literacy surveys in different countries. The numeracy
indicator variable marks if a person was able to correctly answer all 4 questions. ”Advanced literacy”
indicates whether at least 4 out of 5 advanced financial literacy questions (pertaining to knowledge
about financial products and markets) are answered correctly.
[Insert Table 7 here.]
The regression results confirm the significant impact of advanced financial literacy on consumers’
credit decisions (column i). Although numeracy (basic financial literacy) enters with the expected
negative sign, the coefficient estimates are not significant. This is in line with evidence provided by
van Rooij, Lusardi, and Alessie (2011) who include basic financial literacy as a control variable and
focus on advanced financial literacy as their explanatory variable for households’ decision to participate
in the stock market. At first, our evidence seems to stand in contradiction to Gerardi, Goette, and
Meier (2010) who provide evidence that borrowers’ numerical ability predicts subprime mortgage
delinquency and default. However, their measure of financial literacy does not include any advanced
literacy questions at all, such that a potential impact of advanced financial literacy is omitted in their
analysis. The relevance of advanced financial literacy for short-term credit decisions also persists when
incorporating self-control in the analysis (column ii). The coefficient estimate on advanced literacy
remains stable and significant, whereas self-control is only a weakly significant predictor of short-term
15
credit usage when we control for financial literacy.
In order to compare the magnitude of the effects, in Figure 2 we again turn to the analysis of
predicted probabilities. The assumptions about the characteristics of the exemplary household are
unchanged compared to Figure 1. We base the analysis on regression specification (iii) in Table 7 in
order to avoid further inputs concerning household characteristics. The curves show the probabilities
for a consumer to never (upper panel) or frequently (lower panel) rely on overdraft facilities depending
on age (x-axis) and personal traits (self-control (SC is the counterpart to ”TF” and indicates whether
more than one CRT item was answered intuitively), numeracy (num) and financial literacy (FL) as
indicated in the graph’s legend).
[Insert Figure 2 here.]
Figure 2 confirms our previous findings: a lack of self-control is associated with a higher probability
for frequent overdraft usage. Furthermore, financial literacy and numeracy have a diminishing effect
on the probability for extensive short-term credit demand. Curves for households that are literate at
least in one dimension (numeracy and/or financial literacy) are depicted in light shades. Some curves
indicating different household traits overlap closely: An individual who is impulsive (low self-control)
but possesses advanced financial knowledge has a similar probability to frequently use overdraft credit
as a self-controlled individual lacking both kinds of literacy. We conclude that advanced financial
literacy can compensate for lacking self-control. This conclusion also pertains to impulsive but literate
individuals (with both numeracy skills and financial knowledge) who are as likely as a self-controlled
individual that lacks financial literacy (but has numeracy skills) to often rely on overdraft credit. The
situation for people who never use their overdraft credit (upper panel) can be explained analogously.
This evidence provides a strong argument in favor of financial education as opposed to attempts
fostering mathematical skills.
Consumer installment credit. So far, we have argued that impulsive people or those with lower
financial literacy make use of a relatively expensive source of credit. For comparison, we also investigate
the determinants of a cheaper, albeit less accessible and less liquid form of credit: consumer installment
credit. Generally, consumer installment credit comes relatively close to overdraft credit in terms of
purchasing goals (SAVE explicitly cites purposes such as buying clothes, electronic devices, cars or
16

vacation trips as examples for what was funded with the loan). However, compared to overdraft credit
facilities to which close to 80 percent of respondents have access, there can be groups of people who are
credit constrained in the sense that they will not be granted consumer credit by credit providers. I.e.,
even if these groups would like to take out a consumer loan in order to cover a financing need, they
are not able to do so. In order to disentangle consumer credit access and credit demand we estimate
a bivariate probit model with partial observability. This approach is necessary to determine factors
shaping consumer credit demand, since it is difficult to distinguish the reason why a household does
not have outstanding consumer credit. We cannot observe those cases in which a consumer would like
to take out a loan but is not granted one by the bank or those cases in which the bank would agree to
provide credit but the household does not request a loan. However, we include information from the
SAVE survey, which provides a direct indicator capturing credit constraints: In the survey participants
are asked whether in the past five years they were fully or partly denied credit requests, and whether
they actually did request a loan. Furthermore, respondents can state whether they refrained from
requesting credit for fear of denial. Close to half of the respondents indicate to have requested credit
during the five years preceding the survey, while 8 percent did not dare to ask for credit.
Table 8 documents the results of the bivariate probit. On the household side, income, wealth, age,
and family structure will matter for the decision to take out a loan. Besides, it may matter whether an
individual is self-employed and we control for the volume of overdraft credit. Furthermore, we include
the information on credit demand. A ”Desire for credit” indicates whether an individual has requested
a loan (abstracting from whether it was granted) or refrained from asking for credit for fear of denial.
On the side of the bank, we control for customer’s age, assets and outstanding loans (including the
volume of overdraft facilities),16 monthly income and rent as well as marital status and number of
children. We also consider whether the ”Bank received (a) request” for credit, which indicates whether
the individual has requested a loan.
[Insert Table 8 here.]
The results of the bivariate probit regression indicate that wealthier households have a lower de-
mand for consumer installment credit and that those with higher income are more likely to have credit
16On the bank’s side we do not include total net wealth, since not all items may be observable for the bank, e.g. companypension schemes or loans from family and friends.
17
outstanding. As for the results on overdraft credit usage, the probability to have installment credit
outstanding depends on household age. The same factors also play a role in the decision of the bank
to grant credit, with income being the most important determinant. Unsurprisingly, households that
requested credit are also more likely to have consumer installment credit outstanding. Turning to
personal traits, self-control is a factor increasing credit demand, however coefficient estimate are small
and the significance of self-control vanishes when financial literacy is included in the regressions. We
also include a probit model as a mini robustness test in column (v). The results from the probit
regressions also indicate that behavioral traits do not shape the process of taking out consumer in-
stallment credit. We see two possible explanations: (i) customers with low self-control may want to
consume more by the means of consumer installment credit, but banks’ credit counselors can restrict
customers’ credit demand when the requested level of debt is unsustainable, (ii) requesting consumer
installment credit is a much more deliberate decisions which involves paperwork and communication
with the bank, compared to financing consumption by overdraft accounts. Either way we conclude
that accessibility and liquidity are features of overdraft credit lines which are particularly inviting for
behavioral biases.
4 Robustness
As robustness exercises, we demonstrate that the results in the main part are not driven by our proxy
for self-control, by the simplicity of the measure of financial literacy, by the choice of our econometric
approach or by some households that are credit-constrained and have to rely on overdraft credit
because they do not have access to consumer credit.
Alternative proxy for self-control. We construct an alternative measure of self-control which
is unrelated to current consumption and saving decisions and, hence, exogenous to current credit
decisions: we use information regarding the respondents’ childhood behavior (spending or saving their
pocket money) to determine the level of self-control of the adult person. This approach relies on the
validity of the assumption that character traits (in particular patience and self-control) are relatively
stable for an individual person. An influential line in psychological literature backs our argumentation:
Mischel and Peake (1988), Mischel and Rodriguez (1989) and Mischel and Peake (1990) demonstrate
18
that individual differences in self-control measured at the pre-school stage predict the same persons’
behavior more than a decade later. Coming to similar conclusions, Moffitta, Arseneault, Belsky,
Dickson, Hancox, Harrington, Houts, Poulton, Roberts, Ross, Sears, Thomson, and Caspi (2011)
present a longitudinal study which demonstrates that self-control in childhood predicts personal finance
(among other criteria) at the age of 32. Therefore, our childhood-based measure of self-control is an
imperfect, but valid proxy for self-control of the adult respondent which is not caused by current
spending behavior. To the best of our knowledge, this approach to identify determinants of decisions
has not been used before.
Concretely, we asses respondents’ self-control by considering participants’ agreement to the state-
ment ”[As a child] I used to spend my pocket money immediately” as the alternative proxy. For this
purpose we enrich cross-sectional data from the 2009 SAVE survey with two additional variables from
the 2008 questionnaire. Respondents can indicate their agreement to the statement on a scale ranging
from 0 (”strongly disagree”) to 10 (”agree completely”). Low values therefore imply higher levels of
self-control. In our regressions we also include respondents’ agreement to the statement ”As a child I
regularly received pocket money”. The respondents answer question by indicating higher agreement
on an 11 point Likert-Scale (0-10).
The results of the regression analysis including our self-control proxy are presented in Table 9.
[Insert Table 9 here.]
Columns (i) and (ii) provide regression results when explanatory variables are of categorical nature
whereas columns (iii) and (iv) show results for dummy variable specifications. As in our earlier analyses
lacking self-control, which is approximated by immediately having spent pocket money in childhood,
is associated negatively with overdraft usage frequency. Whether a respondent received pocket money
regularly does not impact the results. In order to analyze the results we can compared closest column
(iii) (or column iv) to evidence presented Table 6 columns (iii). Both model specifications employ
indicators for the explanatory variables and the measure of financial literacy is based on all nine
(basic and advanced) financial literacy questions. While the coefficient estimate on the proxy for
self-control is a little higher for the pocket money spending variable compared to the measure based
on the cognitive reflection test the estimate for financial literacy remains remarkably stable.
19
[Insert Table 10 here.]
According to the correlations between the different explanatory variables provided in Table 10 there
is no overlap in our different proxies for self-control. This finding is not very surprising given that
they cover very different aspects: While our alternative proxy is a self-assessed measure capturing
an individuals’ behavior in childhood from which we draw conclusions about current self-control, the
cognitive reflection test is a performance based measure eliciting respondents’ tendency to exert self-
control and dismiss the intuitive but incorrect answer. We see a low positive correlation between
the financial literacy measures and the cognitive reflection test which is plausible given that both
measures are related to individuals’ cognitive abilities. The correlation between the self-assessed extent
of financial education at school is also very little positively correlated with the performance measures
of financial literacy. The correlation is a little higher for advanced financial literacy compared to basic
financial literacy. The fact that self-assessed financial literacy proxies are only mildly correlated with
performance based measures underlines the importance of quiz questions for approximating financial
literacy. From the robustness analysis we can infer that our conclusions drawn so far hold true, when
employing a completely different proxy for self-control.
Alternative measurement of financial literacy. In the following, we document that the results
of our study are not driven by the way we define our baseline financial literacy measure. As described
above, this measure is derived from nine questions on financial literacy contained in the 2009 SAVE
survey, which are aggregated into a score measure (counting the number of correct answers) or a
dummy variable (indicating whether more than the median number of answers were given correctly).
While ”I cannot/do not want to answer” is counted as a wrong answer, a missing answer turns the
score to missing. In addition to this relatively simple and straightforward measure of financial literacy,
we also follow van Rooij, Lusardi, and Alessie (2011) who use an iterated principal factor analysis to
construct an index for financial literacy from the quiz questions. When applying factor analysis we
assume that financial literacy (which we cannot observe directly) is not mirrored equally well in the
answers to the quiz questions. For each question, we construct a dummy variable which indicates
correct answers, such that we obtain 9 items which enter the factor analysis (missing values remain in
the coding of the binary variables). Furthermore we construct 9 items indicating whether a respondent
decided to admit that he does not know the correct answer.
20
An indicative principal component analysis leads us to retain two main factors when analyzing all
nine financial literacy items. Given the factor loadings from the iterative principal factor analysis
of all nine items, we find that one of the factors loads stronger on the basic financial literacy items
whereas the other factor loads on the advanced items. We follow the approach by van Rooij, Lusardi,
and Alessie (2011) and conduct two separate iterated factor analyses for basic and advanced financial
literacy questions. We first only consider items based on correct answers to basic and advanced
questions. In a second step we also include ”Do not know” answers into the set of items for the
iterated principal factor analysis.
[Insert Table 11 here.]
Columns (i) and (ii) reproduce the results when measuring financial literacy (and the proxy indi-
cating a lack of self-control) by dummy variables or scores. In columns (iii) and (iv) the results for
the analysis of financial literacy measures obtained from principal factor analysis are displayed. The
coefficient estimates on different financial literacy proxies are always negative. While basic financial
literacy is not significant in any of the specifications the coefficient estimates for the advanced financial
literacy measures remain significant for the different specifications. We conclude that our results are
not driven by the relatively simple approach we employ in our main regressions to measure financial
literacy.
Alternative econometric approaches. As the SAVE data on overdraft credit usage frequency
are of categorical nature and censored on both sides, ordered probit estimation is the natural choice.
However, to make sure that the results on the negative relations between self-control or financial
literacy and overdraft credit usage frequency are not due to the ordered probit approach, we also
conduct three other regression models, reported in Table 12. Columns (i) and (ii) display the coefficient
estimates obtained in an OLS regression. In columns (iii) and (iv) we reduce the information on
overdraft usage frequency to a dummy variable indicating whether the credit line has been used at
least 4 times in the preceding year (i.e. usage groups 3 and 4). We are now able to run probit
regressions instead of ordered probit estimation. In columns (v) and (vi) we analyze whether our
results are prone to an item non-response bias. For this purpose, we make use of five imputed data
sets provided by MEA. While we do not rely on imputed values for our dependent and explanatory
21
variables, we use the imputed values for the control variables. We run ordered probit regressions on
all five imputed data sets. The results are obtained by using Rubin’s Method (Rubin, 1987).
[Insert Table 12 here.]
Our results turn out to be qualitatively similar to those from the baseline approach reported in
Tables 4 and 6. Fort the OLS results it is remarkable that coefficient estimates are of similar magni-
tude as in the ordered probit but are now much more straightforward to interpret. Interestingly the
intercept turns out to be very high, considering that the dependent variable can only take on values
between 1 (never use overdraft credit) and 4 (more frequently than six times a year or constantly in
overdraft use). However, this fact becomes plausible when taking into account that wealth enters the
regression negatively. Considering the average respondent age of 55 years further reduces the starting
level of the intercept. The OLS regression results once more confirm the compensational effect of
advanced financial literacy for a lack of self-control.
Statistical significance stays unaffected compared to the ordered probit approach and coefficient es-
timates are also similar. We also analyze, whether our results are influenced by a non-response bias
stemming from the control variables. We can reject this skepticism since the results from repeating
our analysis with imputed data are very similar to our estimations when excluding observations with
missing data. The value added by the comparably extensive analysis therefore appears to be negligible.
Potentially credit-constrained groups. Credit-constrained people, who do not have access to
consumer credit can be forced to rely on overdraft credit lines when they experience financing needs.
We explicitly take into account two measures for objective and subjective credit constraints in Table
13. These measures rely on the information whether a household has previously been partly or fully
denied credit or refrained from requesting credit for fear of denial. While this aspect influences the
results for self-control it does not affect the relation between financial literacy and overdraft usage
frequency. Additional to these direct measures we also take a more indirect approach: since for
credit providers one important aspect in their decision to grant credit is regular income streams such
that future interest and repayments can be covered (also compare our results in Table 8), groups
with irregular or low incomes may be denied credit. As such groups we identify the unemployed,
self-employed and retired.
22
[Insert Table 13 here.]
According to the results in Table 13 column (ii), access to consumer credit is an important aspect
in the overdraft usage decision: constrained households use overdraft credit lines significantly more
often compared to unconstrained households. In these cases, overdraft credit serves as a substitute for
consumer credit. Especially respondents fearing credit denial use overdraft credits more frequently,
probably for convenience and ease. Excluding potentially credit constrained groups in columns (iii)
to (v), does not impact the relation between self-control or financial literacy and overdraft credit use.
5 Conclusion
Our analysis aims at extending our knowledge about households’ financial decisions. By connecting
two strands of literature, academic research on self-control and recent studies on financial literacy,
we investigate whether determinants of credit decisions can be explained by a lack of self-control or
a lack of understanding of financial products. More specifically, we focus on an easily accessible, but
expensive credit form (overdraft credit) which is available to a vast majority of German households.
Based on a micro dataset on German households, we test several hypotheses: we test whether
self-control is central to credit decisions, whether there is role for financial education when individuals
are impulsive, and whether education in the field is more promising for expanding numerical skills or
financial knowledge.
Financial literacy is in fact a crucial determinant of the use of credit products even after controlling
for self-control issues. Financial literacy is a qualification on its own which cannot be substituted by
general education or cognitive training (i.e. numeracy). Our findings suggest that, while financial
literacy is certainly not the unique determinant of credit decisions, financial education programs could
substantially improve households’ financial decisions.
23
References
Almenberg, J., and C. Gerdes (2012): “Exponential growth bias and financial literacy,” AppliedEconomics Letters, 19(17), 1693–1696.
Banks, J. (2010): “Cognitive Function, Financial Literacy and Financial Outcomes at Older Ages:Introduction,” Economic Journal, 120(548), 357–362.
Benhabib, J., and A. Bisin (2005): “Modeling internal commitment mechanisms and self-control: Aneuroeconomics approach to consumption-saving decisions,” Games and Economic Behavior, 52(2),460–492.
Bernheim, B. D., and D. M. Garrett (2003): “The Effects of Financial Education in the Work-place: Evidence From a Survey of Households,” Journal of Public Economics, 87(7-8), 1487–1519.
Bernheim, B. D., J. Skinner, and S. Weinberg (2001): “What Accounts for the Variation inRetirement Wealth among U.S. Households?,” American Economic Review, 91(4), 832–857.
Bertaut, C. C., M. Haliassos, and M. Reiter (2009): “Credit Card Debt Puzzles and DebtRevolvers for Self Control,” Review of Finance, 13(4), 657–692.
Borghans, L., A. L. Duckworth, J. J. Heckman, and B. ter Weel (2008): “The Economicsand Psychology of Personality Traits,” Journal of Human Resources, 43(4), 972–1059.
Bucciol, A. (2012): “Measuring Self-Control Problems: A Structural Estimation,” Journal of theEuropean Economic Association, 10(5), 1084–1115.
Bucher-Koenen, T., and A. Lusardi (2011): “Financial Literacy and Retirement Planning inGermany,” Journal of Pension Economics and Finance, 10(4), 565–584.
Bucher-Koenen, T., and M. Ziegelmeyer (2011): “Who Lost the Most? Financial Literacy,Cognitive Abilities, and the Financial Crisis,” European Central Bank Working Paper Series No.1299.
Campbell, J. Y. (2006): “Household Finance,” Journal of Finance, 61(4), 1553–1604.
Carlin, B. I., and D. T. Robinson (2012): “Financial Education and Timely Decision Support:Lessons from Junior Achievement,” American Economic Review, 102(3), 305–308.
Clark, R. L., M. S. Morrill, and S. G. Allen (2012): “Effectiveness of Employer-ProvidedFinancial Information: Hiring to Retiring,” American Economic Review, 102(3), 314–318.
Disney, R., and J. Gathergood (2011): “Financial Literacy and Indebtedness: New Evidence forUK Consumers,” University of Nottingham Working Paper.
(2013): “Financial literacy and consumer credit portfolios,” Journal of Banking and Finance,37(7), 2246–2254.
Fredrick, S. (2005): “Cognitive Reflection and Decision Making,” Journal of Economic Perspectives,19(4), 25–42.
Gathergood, J. (2012): “Self-Control, Financial Literacy and Consumer Over-Indebtedness,” Jour-nal of Economic Psychology, 33(3), 590–602.
Gerardi, K., L. Goette, and S. Meier (2010): “Financial Literacy and Subprime MortgageDelinquency: Evidence From a Survey Matched to Administrative Data,” Federal Reserve Bank ofAtlanta Working Paper 2010-10.
24
Glaser, M., and A. Klos (2012): “Causal Evidence on Regular Internet Use and Stock MarketParticipation,” Working Paper, SAVE-PHF Conference 2012.
Guiso, L., and T. Jappelli (2009): “Financial Literacy and Portfolio Diversification,” WorkingPaper.
Gul, F., and W. Pesendorfer (2001): “Temptation and Self-Control,” Econometrica, 69(6), 1403–1435.
(2004): “Self-Control and the Theory of Consumption,” Econometrica, 72(1), 119–158.
Hastings, J. S., and O. S. Mitchell (2011): “How Financial Literacy and Impatience ShapeRetirement Wealth and Investment Behaviors,” NBER Working Paper No. 16740.
Heidhues, P., and B. Koszegi (2010): “Exploiting Naivete about Self-Control in the Credit Market,”American Economic Review, 100(5), 2279–2303.
Kahneman, D. (2011): Thinking, Fast and Slow. Farrar, Straus and Giroux, New York.
Klee, E. (2008): “How People Pay: Evidence From Grocery Store Data,” Journal of MonetaryEconomics, 55(3), 526–541.
Koulayev, S., M. Rysman, S. Schuh, and J. Stavins (2012): “Explaining Adoption and Use ofPayment Instruments by U.S. Consumers,” Working Paper.
Laibson, D. (1997): “Golden Eggs and Hyperbolic Discounting,” Quarterly Journal of Economics,112(2), 443–77.
Lusardi, A. (2012): “Numeracy, Financial Literacy, and Financial Decion-Making,” NBER WorkingPaper No. 17821.
Lusardi, A., and O. S. Mitchell (2007): “Baby Boomer Retirement Security: The Roles ofPlanning, Financial Literacy, and Housing Wealth,” Journal of Monetary Economics, 54(1), 205–224.
(2008): “Planning and Financial Literacy: How Do Women Fare?,” American EconomicReview, 98(2), 413–417.
(2011): “Financial literacy around the world: an overview,” Journal of Pension Economicsand Finance, 10(4), 497–508.
Lusardi, A., and P. Tufano (2009): “Debt Literacy, Financial Experiences, and Overindebtedness,”CeRP Working Paper 83/09, (83).
Martin, L. E., and G. F. Potts (2009): “Impulsivity in decision-making: An event-related potentialinvestigation,” Personality and Individual Differences, 46(3), 303–308.
McClure, S. M., D. I. Laibson, G. Loewenstein, and J. D. Cohen (2004): “Separate NeuralSystems Value Immediate and Delayed Monetary Rewards,” Science, 306(5695), 503–507.
Meier, S., and C. Sprenger (2010): “Present-Biased Preferences and Credit Card Borrowing,”American Economic Journal: Applied Economics, 2(1), 193–210.
Mischel, W., Y. S., and P. K. Peake (1988): “The Nature of Adolescent Competencies Predictedby Preschool Delay of Gratification,” Journal of Personality and Social Psychology, 54(4), 687–696.
(1990): “Predicting Adolescent Cognitive and Self-Regulatory Competencies from PreschoolDelay of Gratification: Identifying Diagnostic Conditions,” Developmental Psychology, 26(6), 978–986.
25
Mischel, W., Y. S., and M. L. Rodriguez (1989): “Delay of Gratification in Children,” Science,233(4907), 933–938.
Modigliani, F., and R. Brumberg (1954): “Utility Analysis and the Consumption Function: AnInterpretation of Cross-section Data,” in Post-Keynesian Economics, ed. by K. K. Kurihara. NewBrunswick.
Moffitta, T. E., L. Arseneault, D. Belsky, N. Dickson, R. J. Hancox, H. Harrington,R. Houts, R. Poulton, B. W. Roberts, S. Ross, M. R. Sears, W. M. Thomson, andA. Caspi (2011): “A Gradient of Childhood Self-Control Predicts Health, Wealth, and PublicSafety,” Proceedings of the National Academy of Sciences of the United States of America, 108(7),2693–2698.
Ottaviani, C., and D. Vandone (2011): “Impulsivity and household indebtedness: Evidence fromreal life,” Journal of Economic Psychology, 32(1), 754–761.
Poirier, D. (1980): “Partial Observabilit in Bivariate Probit Models,” Journal of Econometrics, 12,210–217.
Rubin, D. (1987): Multiple Imputation for Nonresponse in Surveys. Wiley, New York.
Shefrin, H., and R. H. Thaler (1988): “The Behavioral Life-Cycle Hypothesis,” Economic Inquiry,26(4), 609–643.
Smith, J. P., J. J. McArdle, and R. Willis (2010): “Financial Decision Making and Cognitionin a Family Context,” Economic Journal, 120(548), 363–380.
Toplak, M. E., R. F. West, and K. E. Stanovich (2012): “The Cognitive Reflection Test as apredictor of performance on heuristics-and-biases tasks,” Memory and Cognition, 39(7), 1275–1289.
van Rooij, M., A. Lusardi, and R. Alessie (2011): “Financial Literacy and Stock Market Partic-ipation,” Journal of Financial Economics, 101(2), 449–472.
van Rooij, M. C., A. Lusardi, and R. J. Alessie (2012): “Financial Literacy, Retirement Planningand Household Wealth,” Economic Journal, 122, 449–478.
Zermatten, A., M. Van der Linden, M. d’Acremont, F. Jermann, and A. Bechara (2005):“Impulsivity and decision making,” The Journal of Nervous and Mental Disorders, 193(10), 647–650.
26
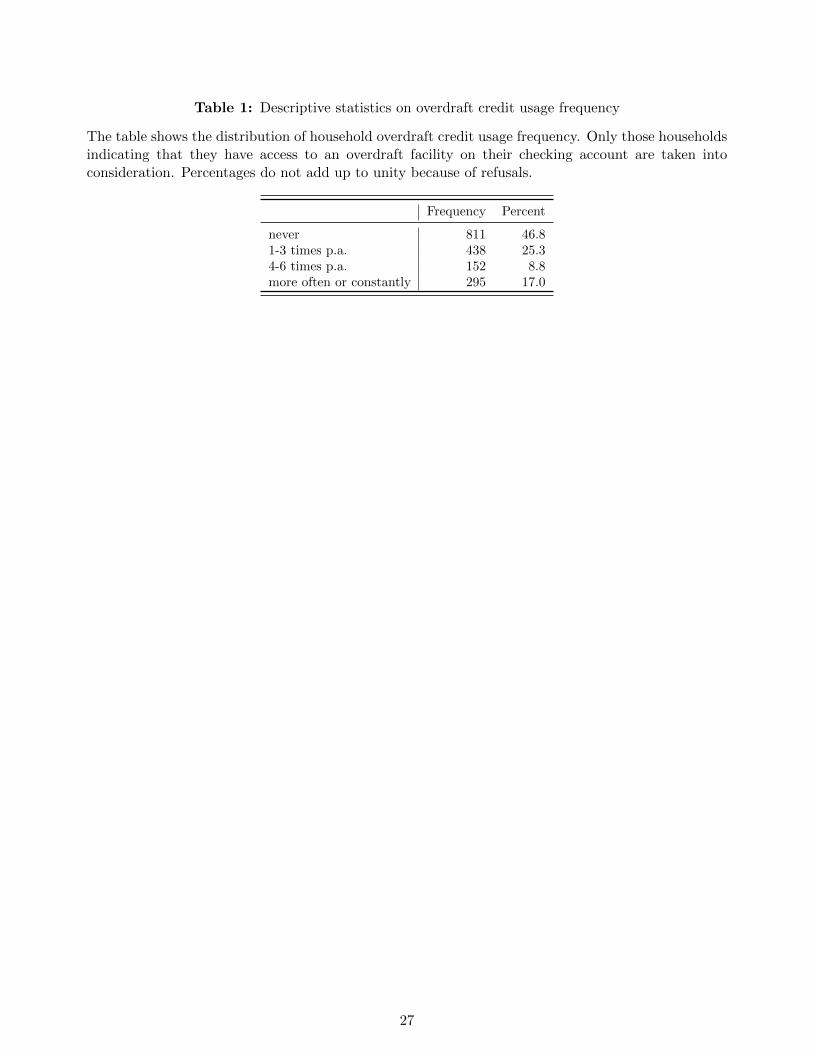
Table 1: Descriptive statistics on overdraft credit usage frequency
The table shows the distribution of household overdraft credit usage frequency. Only those householdsindicating that they have access to an overdraft facility on their checking account are taken intoconsideration. Percentages do not add up to unity because of refusals.
Frequency Percent
never 811 46.81-3 times p.a. 438 25.34-6 times p.a. 152 8.8more often or constantly 295 17.0
27
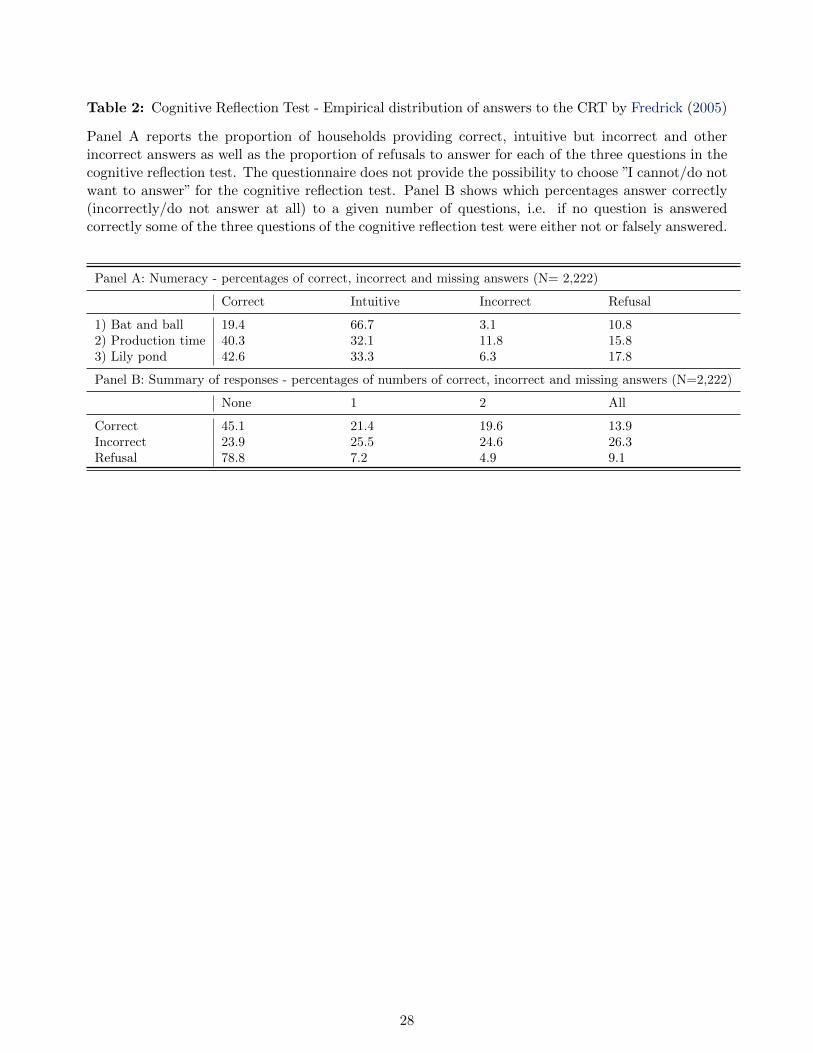
Table 2: Cognitive Reflection Test - Empirical distribution of answers to the CRT by Fredrick (2005)
Panel A reports the proportion of households providing correct, intuitive but incorrect and otherincorrect answers as well as the proportion of refusals to answer for each of the three questions in thecognitive reflection test. The questionnaire does not provide the possibility to choose ”I cannot/do notwant to answer” for the cognitive reflection test. Panel B shows which percentages answer correctly(incorrectly/do not answer at all) to a given number of questions, i.e. if no question is answeredcorrectly some of the three questions of the cognitive reflection test were either not or falsely answered.
Panel A: Numeracy - percentages of correct, incorrect and missing answers (N= 2,222)
Correct Intuitive Incorrect Refusal
1) Bat and ball 19.4 66.7 3.1 10.82) Production time 40.3 32.1 11.8 15.83) Lily pond 42.6 33.3 6.3 17.8
Panel B: Summary of responses - percentages of numbers of correct, incorrect and missing answers (N=2,222)
None 1 2 All
Correct 45.1 21.4 19.6 13.9Incorrect 23.9 25.5 24.6 26.3Refusal 78.8 7.2 4.9 9.1
28
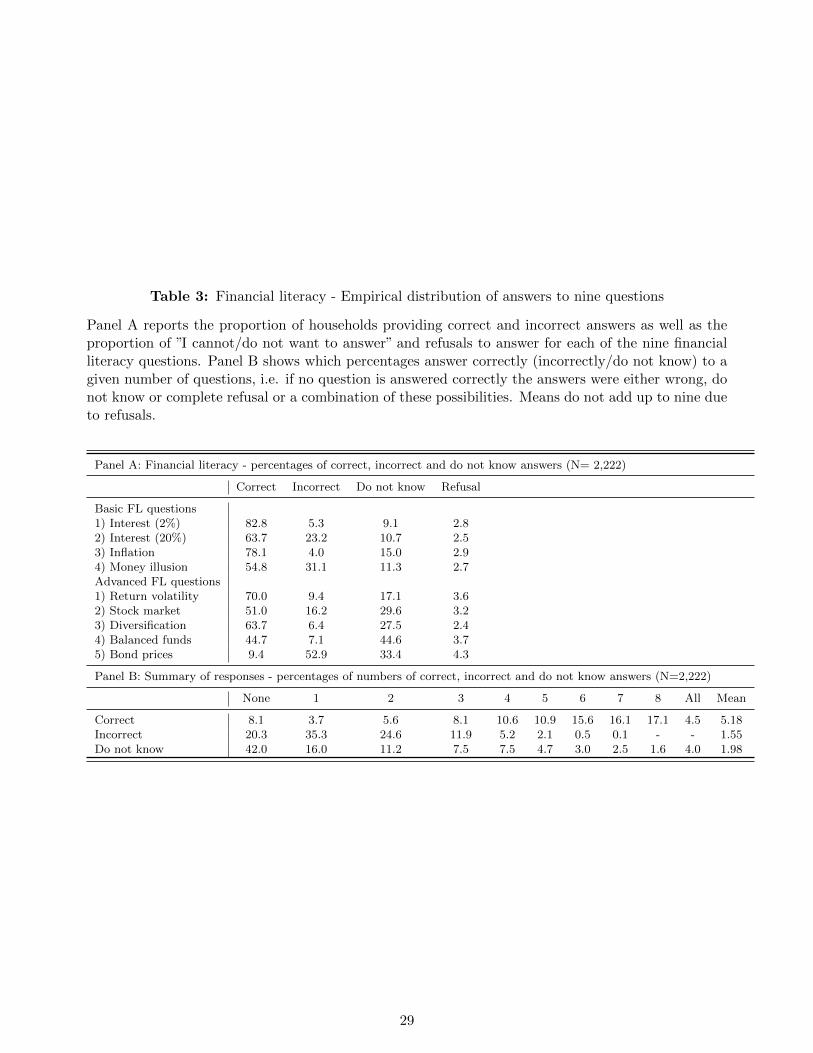
Table 3: Financial literacy - Empirical distribution of answers to nine questions
Panel A reports the proportion of households providing correct and incorrect answers as well as theproportion of ”I cannot/do not want to answer” and refusals to answer for each of the nine financialliteracy questions. Panel B shows which percentages answer correctly (incorrectly/do not know) to agiven number of questions, i.e. if no question is answered correctly the answers were either wrong, donot know or complete refusal or a combination of these possibilities. Means do not add up to nine dueto refusals.
Panel A: Financial literacy - percentages of correct, incorrect and do not know answers (N= 2,222)
Correct Incorrect Do not know Refusal
Basic FL questions1) Interest (2%) 82.8 5.3 9.1 2.82) Interest (20%) 63.7 23.2 10.7 2.53) Inflation 78.1 4.0 15.0 2.94) Money illusion 54.8 31.1 11.3 2.7Advanced FL questions1) Return volatility 70.0 9.4 17.1 3.62) Stock market 51.0 16.2 29.6 3.23) Diversification 63.7 6.4 27.5 2.44) Balanced funds 44.7 7.1 44.6 3.75) Bond prices 9.4 52.9 33.4 4.3
Panel B: Summary of responses - percentages of numbers of correct, incorrect and do not know answers (N=2,222)
None 1 2 3 4 5 6 7 8 All Mean
Correct 8.1 3.7 5.6 8.1 10.6 10.9 15.6 16.1 17.1 4.5 5.18Incorrect 20.3 35.3 24.6 11.9 5.2 2.1 0.5 0.1 - - 1.55Do not know 42.0 16.0 11.2 7.5 7.5 4.7 3.0 2.5 1.6 4.0 1.98
29
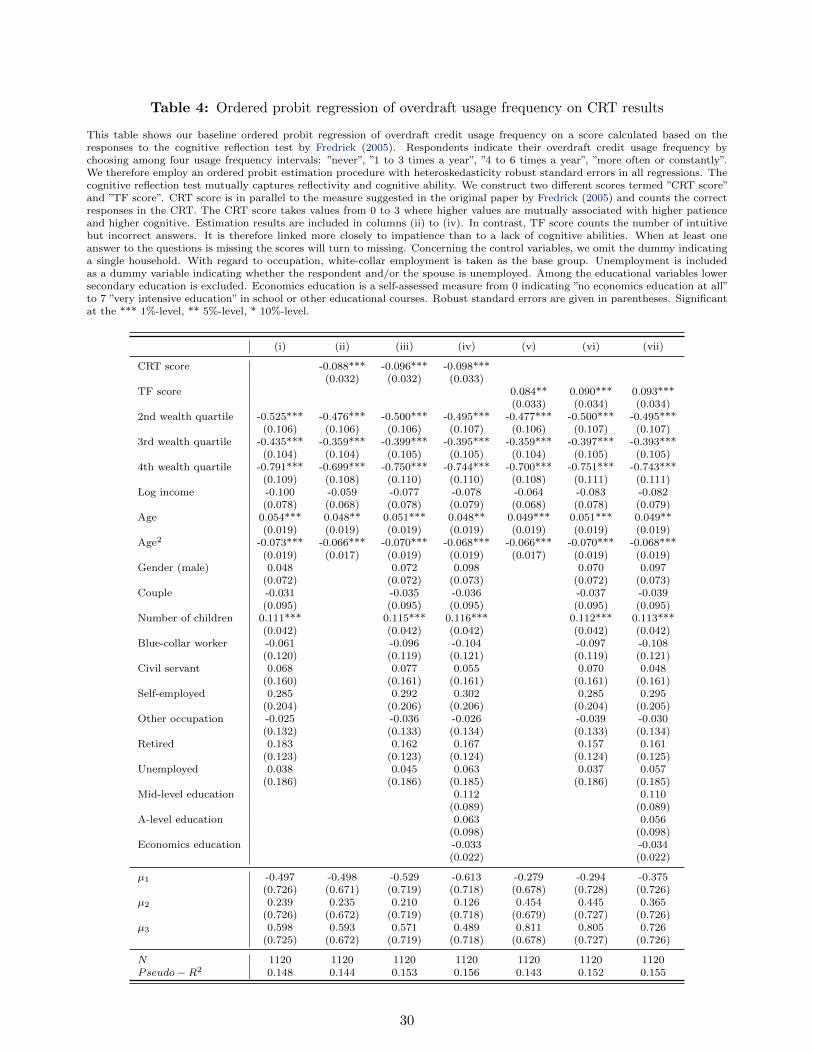
Table 4: Ordered probit regression of overdraft usage frequency on CRT results
This table shows our baseline ordered probit regression of overdraft credit usage frequency on a score calculated based on theresponses to the cognitive reflection test by Fredrick (2005). Respondents indicate their overdraft credit usage frequency bychoosing among four usage frequency intervals: ”never”, ”1 to 3 times a year”, ”4 to 6 times a year”, ”more often or constantly”.We therefore employ an ordered probit estimation procedure with heteroskedasticity robust standard errors in all regressions. Thecognitive reflection test mutually captures reflectivity and cognitive ability. We construct two different scores termed ”CRT score”and ”TF score”. CRT score is in parallel to the measure suggested in the original paper by Fredrick (2005) and counts the correctresponses in the CRT. The CRT score takes values from 0 to 3 where higher values are mutually associated with higher patienceand higher cognitive. Estimation results are included in columns (ii) to (iv). In contrast, TF score counts the number of intuitivebut incorrect answers. It is therefore linked more closely to impatience than to a lack of cognitive abilities. When at least oneanswer to the questions is missing the scores will turn to missing. Concerning the control variables, we omit the dummy indicatinga single household. With regard to occupation, white-collar employment is taken as the base group. Unemployment is includedas a dummy variable indicating whether the respondent and/or the spouse is unemployed. Among the educational variables lowersecondary education is excluded. Economics education is a self-assessed measure from 0 indicating ”no economics education at all”to 7 ”very intensive education” in school or other educational courses. Robust standard errors are given in parentheses. Significantat the *** 1%-level, ** 5%-level, * 10%-level.
(i) (ii) (iii) (iv) (v) (vi) (vii)
CRT score -0.088*** -0.096*** -0.098***(0.032) (0.032) (0.033)
TF score 0.084** 0.090*** 0.093***(0.033) (0.034) (0.034)
2nd wealth quartile -0.525*** -0.476*** -0.500*** -0.495*** -0.477*** -0.500*** -0.495***(0.106) (0.106) (0.106) (0.107) (0.106) (0.107) (0.107)
3rd wealth quartile -0.435*** -0.359*** -0.399*** -0.395*** -0.359*** -0.397*** -0.393***(0.104) (0.104) (0.105) (0.105) (0.104) (0.105) (0.105)
4th wealth quartile -0.791*** -0.699*** -0.750*** -0.744*** -0.700*** -0.751*** -0.743***(0.109) (0.108) (0.110) (0.110) (0.108) (0.111) (0.111)
Log income -0.100 -0.059 -0.077 -0.078 -0.064 -0.083 -0.082(0.078) (0.068) (0.078) (0.079) (0.068) (0.078) (0.079)
Age 0.054*** 0.048** 0.051*** 0.048** 0.049*** 0.051*** 0.049**(0.019) (0.019) (0.019) (0.019) (0.019) (0.019) (0.019)
Age2 -0.073*** -0.066*** -0.070*** -0.068*** -0.066*** -0.070*** -0.068***(0.019) (0.017) (0.019) (0.019) (0.017) (0.019) (0.019)
Gender (male) 0.048 0.072 0.098 0.070 0.097(0.072) (0.072) (0.073) (0.072) (0.073)
Couple -0.031 -0.035 -0.036 -0.037 -0.039(0.095) (0.095) (0.095) (0.095) (0.095)
Number of children 0.111*** 0.115*** 0.116*** 0.112*** 0.113***(0.042) (0.042) (0.042) (0.042) (0.042)
Blue-collar worker -0.061 -0.096 -0.104 -0.097 -0.108(0.120) (0.119) (0.121) (0.119) (0.121)
Civil servant 0.068 0.077 0.055 0.070 0.048(0.160) (0.161) (0.161) (0.161) (0.161)
Self-employed 0.285 0.292 0.302 0.285 0.295(0.204) (0.206) (0.206) (0.204) (0.205)
Other occupation -0.025 -0.036 -0.026 -0.039 -0.030(0.132) (0.133) (0.134) (0.133) (0.134)
Retired 0.183 0.162 0.167 0.157 0.161(0.123) (0.123) (0.124) (0.124) (0.125)
Unemployed 0.038 0.045 0.063 0.037 0.057(0.186) (0.186) (0.185) (0.186) (0.185)
Mid-level education 0.112 0.110(0.089) (0.089)
A-level education 0.063 0.056(0.098) (0.098)
Economics education -0.033 -0.034(0.022) (0.022)
µ1 -0.497 -0.498 -0.529 -0.613 -0.279 -0.294 -0.375(0.726) (0.671) (0.719) (0.718) (0.678) (0.728) (0.726)
µ2 0.239 0.235 0.210 0.126 0.454 0.445 0.365(0.726) (0.672) (0.719) (0.718) (0.679) (0.727) (0.726)
µ3 0.598 0.593 0.571 0.489 0.811 0.805 0.726(0.725) (0.672) (0.719) (0.718) (0.678) (0.727) (0.726)
N 1120 1120 1120 1120 1120 1120 1120Pseudo−R2 0.148 0.144 0.153 0.156 0.143 0.152 0.155
30
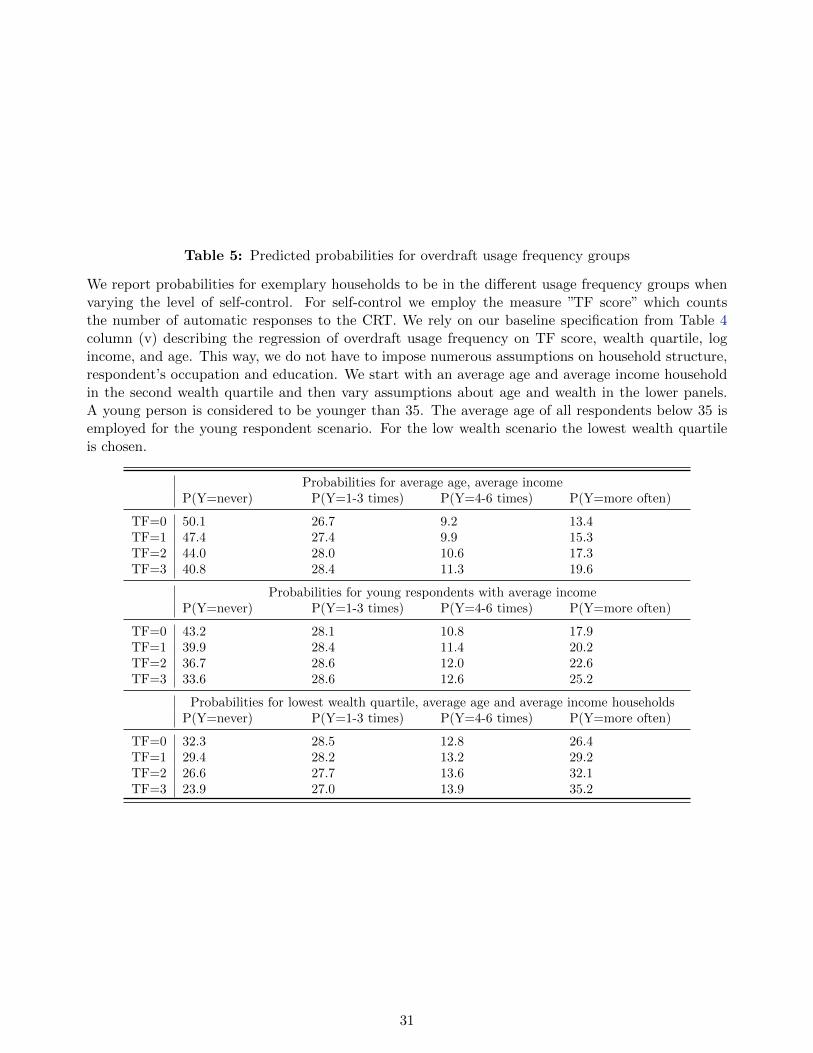
Table 5: Predicted probabilities for overdraft usage frequency groups
We report probabilities for exemplary households to be in the different usage frequency groups whenvarying the level of self-control. For self-control we employ the measure ”TF score” which countsthe number of automatic responses to the CRT. We rely on our baseline specification from Table 4column (v) describing the regression of overdraft usage frequency on TF score, wealth quartile, logincome, and age. This way, we do not have to impose numerous assumptions on household structure,respondent’s occupation and education. We start with an average age and average income householdin the second wealth quartile and then vary assumptions about age and wealth in the lower panels.A young person is considered to be younger than 35. The average age of all respondents below 35 isemployed for the young respondent scenario. For the low wealth scenario the lowest wealth quartileis chosen.
Probabilities for average age, average incomeP(Y=never) P(Y=1-3 times) P(Y=4-6 times) P(Y=more often)
TF=0 50.1 26.7 9.2 13.4TF=1 47.4 27.4 9.9 15.3TF=2 44.0 28.0 10.6 17.3TF=3 40.8 28.4 11.3 19.6
Probabilities for young respondents with average incomeP(Y=never) P(Y=1-3 times) P(Y=4-6 times) P(Y=more often)
TF=0 43.2 28.1 10.8 17.9TF=1 39.9 28.4 11.4 20.2TF=2 36.7 28.6 12.0 22.6TF=3 33.6 28.6 12.6 25.2
Probabilities for lowest wealth quartile, average age and average income householdsP(Y=never) P(Y=1-3 times) P(Y=4-6 times) P(Y=more often)
TF=0 32.3 28.5 12.8 26.4TF=1 29.4 28.2 13.2 29.2TF=2 26.6 27.7 13.6 32.1TF=3 23.9 27.0 13.9 35.2
31
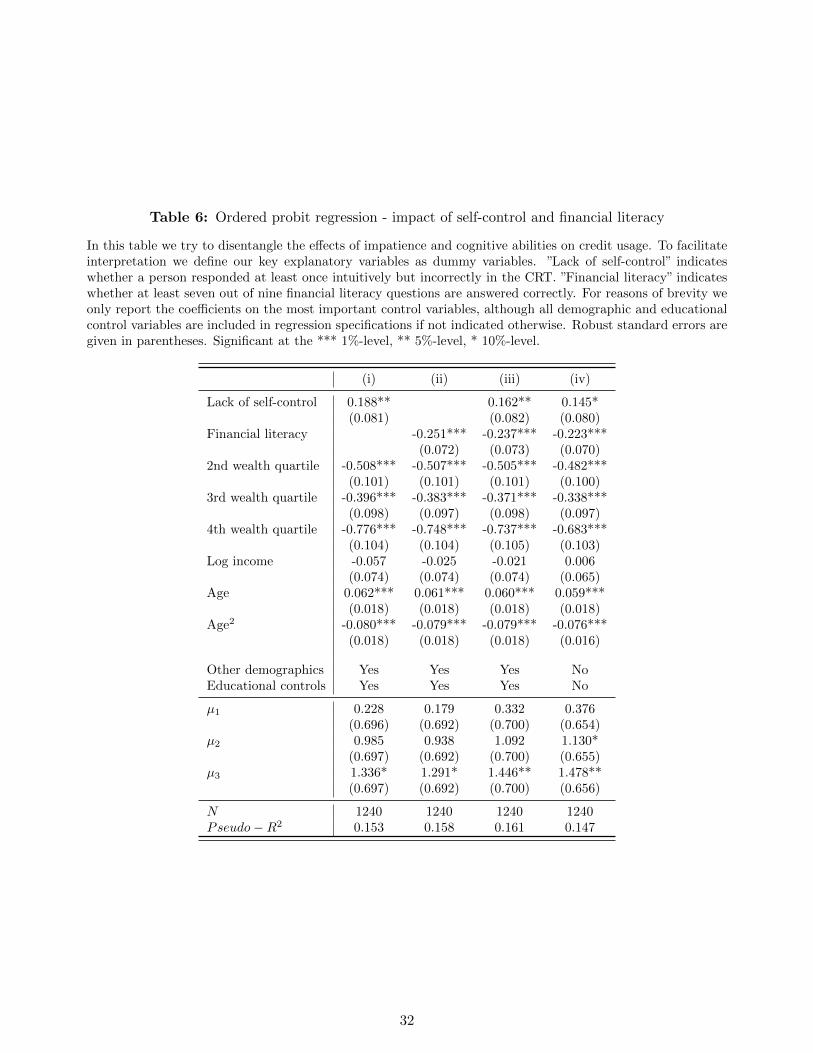
Table 6: Ordered probit regression - impact of self-control and financial literacy
In this table we try to disentangle the effects of impatience and cognitive abilities on credit usage. To facilitateinterpretation we define our key explanatory variables as dummy variables. ”Lack of self-control” indicateswhether a person responded at least once intuitively but incorrectly in the CRT. ”Financial literacy” indicateswhether at least seven out of nine financial literacy questions are answered correctly. For reasons of brevity weonly report the coefficients on the most important control variables, although all demographic and educationalcontrol variables are included in regression specifications if not indicated otherwise. Robust standard errors aregiven in parentheses. Significant at the *** 1%-level, ** 5%-level, * 10%-level.
(i) (ii) (iii) (iv)
Lack of self-control 0.188** 0.162** 0.145*(0.081) (0.082) (0.080)
Financial literacy -0.251*** -0.237*** -0.223***(0.072) (0.073) (0.070)
2nd wealth quartile -0.508*** -0.507*** -0.505*** -0.482***(0.101) (0.101) (0.101) (0.100)
3rd wealth quartile -0.396*** -0.383*** -0.371*** -0.338***(0.098) (0.097) (0.098) (0.097)
4th wealth quartile -0.776*** -0.748*** -0.737*** -0.683***(0.104) (0.104) (0.105) (0.103)
Log income -0.057 -0.025 -0.021 0.006(0.074) (0.074) (0.074) (0.065)
Age 0.062*** 0.061*** 0.060*** 0.059***(0.018) (0.018) (0.018) (0.018)
Age2 -0.080*** -0.079*** -0.079*** -0.076***(0.018) (0.018) (0.018) (0.016)
Other demographics Yes Yes Yes NoEducational controls Yes Yes Yes No
µ1 0.228 0.179 0.332 0.376(0.696) (0.692) (0.700) (0.654)
µ2 0.985 0.938 1.092 1.130*(0.697) (0.692) (0.700) (0.655)
µ3 1.336* 1.291* 1.446** 1.478**(0.697) (0.692) (0.700) (0.656)
N 1240 1240 1240 1240Pseudo−R2 0.153 0.158 0.161 0.147
32
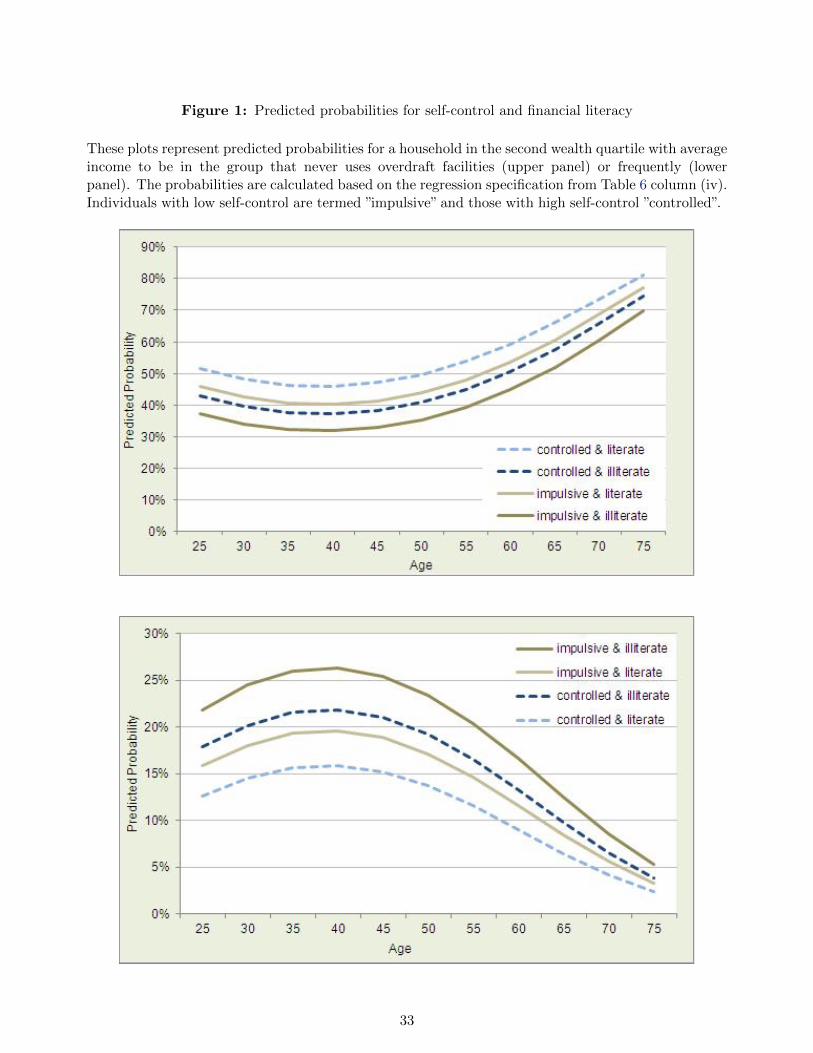
Figure 1: Predicted probabilities for self-control and financial literacy
These plots represent predicted probabilities for a household in the second wealth quartile with averageincome to be in the group that never uses overdraft facilities (upper panel) or frequently (lowerpanel). The probabilities are calculated based on the regression specification from Table 6 column (iv).Individuals with low self-control are termed ”impulsive” and those with high self-control ”controlled”.
33
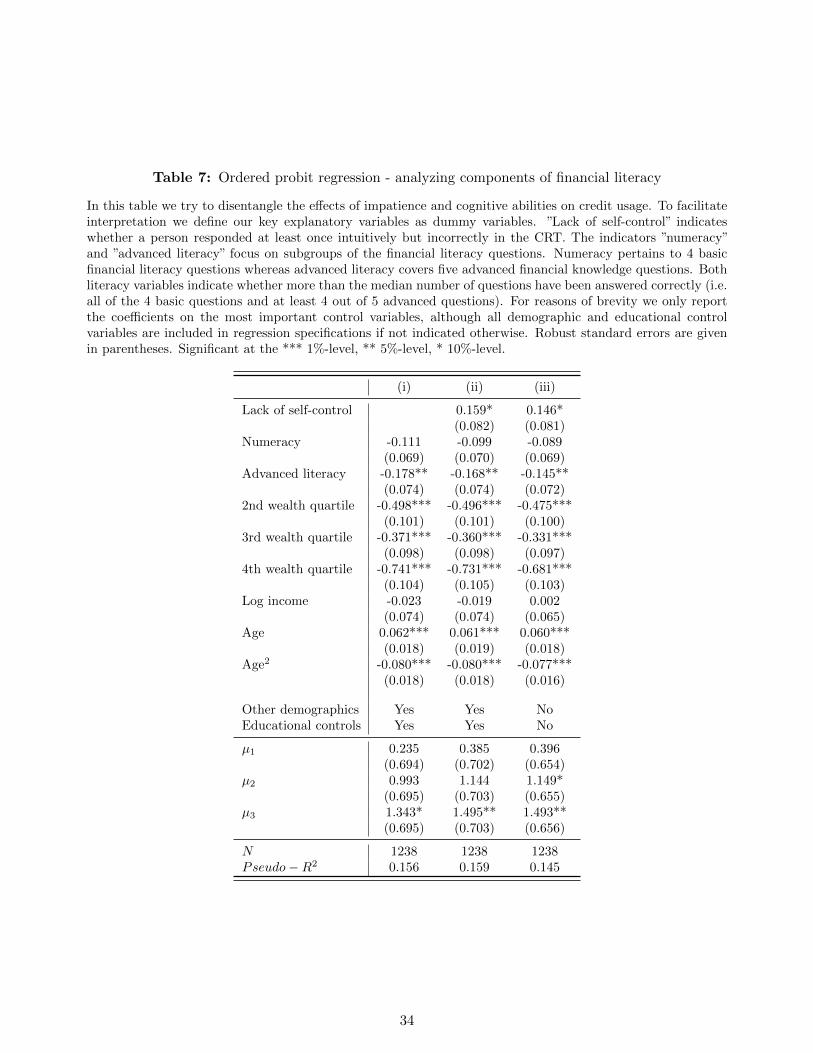
Table 7: Ordered probit regression - analyzing components of financial literacy
In this table we try to disentangle the effects of impatience and cognitive abilities on credit usage. To facilitateinterpretation we define our key explanatory variables as dummy variables. ”Lack of self-control” indicateswhether a person responded at least once intuitively but incorrectly in the CRT. The indicators ”numeracy”and ”advanced literacy” focus on subgroups of the financial literacy questions. Numeracy pertains to 4 basicfinancial literacy questions whereas advanced literacy covers five advanced financial knowledge questions. Bothliteracy variables indicate whether more than the median number of questions have been answered correctly (i.e.all of the 4 basic questions and at least 4 out of 5 advanced questions). For reasons of brevity we only reportthe coefficients on the most important control variables, although all demographic and educational controlvariables are included in regression specifications if not indicated otherwise. Robust standard errors are givenin parentheses. Significant at the *** 1%-level, ** 5%-level, * 10%-level.
(i) (ii) (iii)
Lack of self-control 0.159* 0.146*(0.082) (0.081)
Numeracy -0.111 -0.099 -0.089(0.069) (0.070) (0.069)
Advanced literacy -0.178** -0.168** -0.145**(0.074) (0.074) (0.072)
2nd wealth quartile -0.498*** -0.496*** -0.475***(0.101) (0.101) (0.100)
3rd wealth quartile -0.371*** -0.360*** -0.331***(0.098) (0.098) (0.097)
4th wealth quartile -0.741*** -0.731*** -0.681***(0.104) (0.105) (0.103)
Log income -0.023 -0.019 0.002(0.074) (0.074) (0.065)
Age 0.062*** 0.061*** 0.060***(0.018) (0.019) (0.018)
Age2 -0.080*** -0.080*** -0.077***(0.018) (0.018) (0.016)
Other demographics Yes Yes NoEducational controls Yes Yes No
µ1 0.235 0.385 0.396(0.694) (0.702) (0.654)
µ2 0.993 1.144 1.149*(0.695) (0.703) (0.655)
µ3 1.343* 1.495** 1.493**(0.695) (0.703) (0.656)
N 1238 1238 1238Pseudo−R2 0.156 0.159 0.145
34
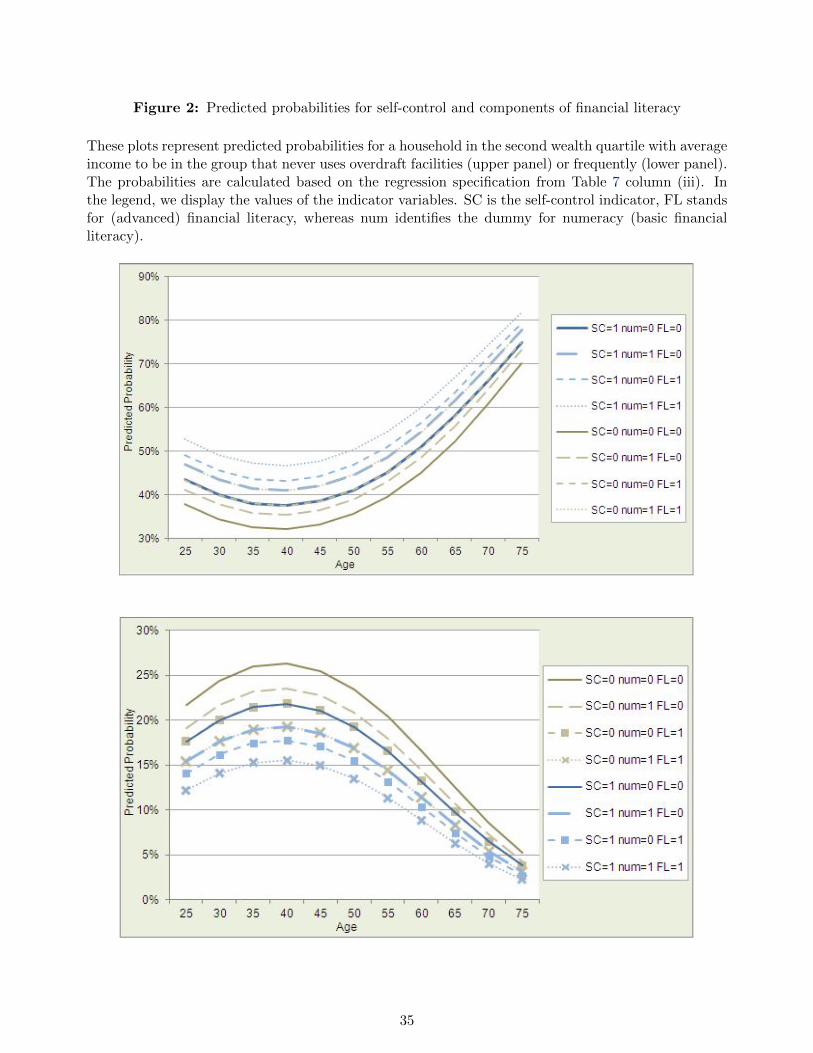
Figure 2: Predicted probabilities for self-control and components of financial literacy
These plots represent predicted probabilities for a household in the second wealth quartile with averageincome to be in the group that never uses overdraft facilities (upper panel) or frequently (lower panel).The probabilities are calculated based on the regression specification from Table 7 column (iii). Inthe legend, we display the values of the indicator variables. SC is the self-control indicator, FL standsfor (advanced) financial literacy, whereas num identifies the dummy for numeracy (basic financialliteracy).
35
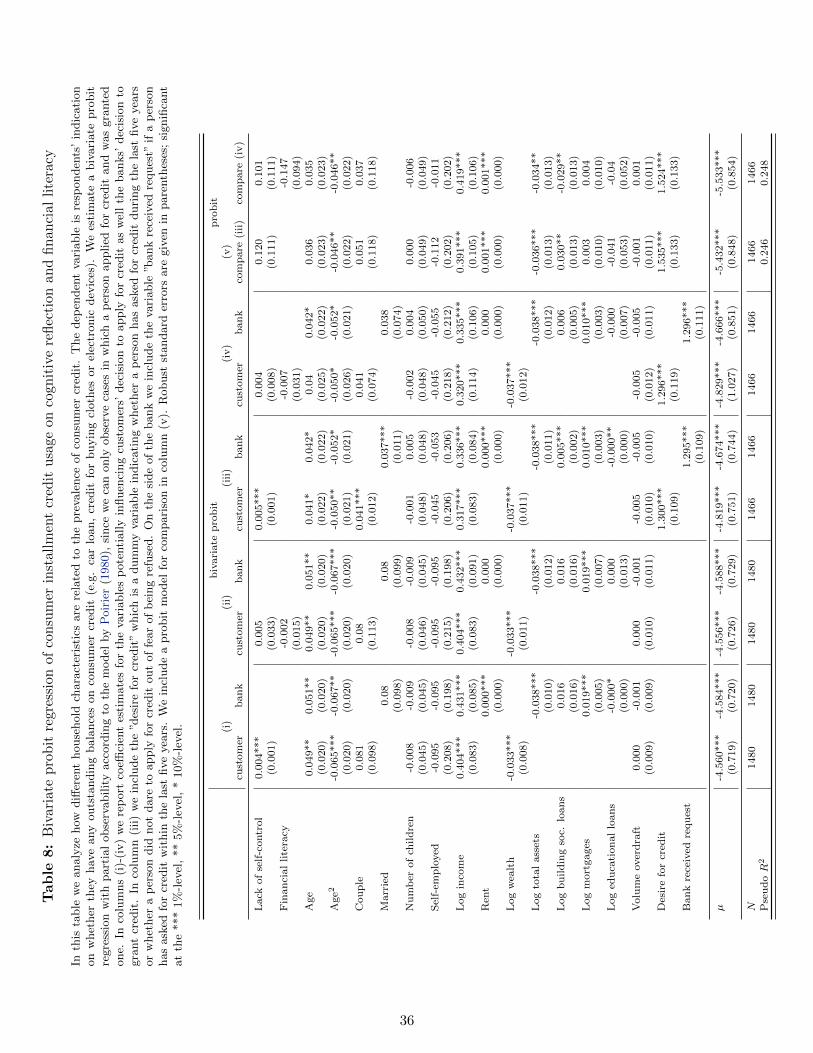
Table
8:
Biv
ari
ate
pro
bit
regr
essi
onof
consu
mer
inst
allm
ent
cred
itusa
geon
cogn
itiv
ere
flec
tion
and
finan
cial
lite
racy
Inth
ista
ble
we
analy
zehow
diff
eren
thouse
hold
chara
cter
isti
csare
rela
ted
toth
epre
vale
nce
of
consu
mer
cred
it.
The
dep
enden
tva
riable
isre
sponden
ts’
indic
ati
on
on
whet
her
they
hav
eany
outs
tandin
gbala
nce
son
consu
mer
cred
it(e
.g.
car
loan,
cred
itfo
rbuyin
gcl
oth
esor
elec
tronic
dev
ices
).W
ees
tim
ate
abiv
ari
ate
pro
bit
regre
ssio
nw
ith
part
ial
obse
rvabilit
yacc
ord
ing
toth
em
odel
by
Poir
ier
(1980),
since
we
can
only
obse
rve
case
sin
whic
ha
per
son
applied
for
cred
itand
was
gra
nte
done.
Inco
lum
ns
(i)-
(iv)
we
rep
ort
coeffi
cien
tes
tim
ate
sfo
rth
eva
riable
sp
ote
nti
ally
influen
cing
cust
om
ers’
dec
isio
nto
apply
for
cred
itas
wel
lth
ebanks’
dec
isio
nto
gra
nt
cred
it.
Inco
lum
n(i
ii)
we
incl
ude
the
”des
ire
for
cred
it”
whic
his
adum
my
vari
able
indic
ati
ng
whet
her
ap
erso
nhas
ask
edfo
rcr
edit
duri
ng
the
last
five
yea
rsor
whet
her
ap
erso
ndid
not
dare
toapply
for
cred
itout
of
fear
of
bei
ng
refu
sed.
On
the
side
of
the
bank
we
incl
ude
the
vari
able
”bank
rece
ived
reques
t”if
ap
erso
nhas
ask
edfo
rcr
edit
wit
hin
the
last
five
yea
rs.
We
incl
ude
apro
bit
model
for
com
pari
son
inco
lum
n(v
).R
obust
standard
erro
rsare
giv
enin
pare
nth
eses
;si
gnifi
cant
at
the
***
1%
-lev
el,
**
5%
-lev
el,
*10%
-lev
el.
biv
ari
ate
pro
bit
pro
bit
(i)
(ii)
(iii)
(iv)
(v)
cust
om
erban
kcu
stom
erb
an
kcu
stom
erb
ank
cust
om
erban
kco
mp
are
(iii)
com
pare
(iv)
Lack
of
self
-contr
ol
0.0
04***
0.0
05
0.0
05***
0.0
04
0.1
20
0.1
01
(0.0
01)
(0.0
33)
(0.0
01)
(0.0
08)
(0.1
11)
(0.1
11)
Fin
an
cial
lite
racy
-0.0
02
-0.0
07
-0.1
47
(0.0
15)
(0.0
31)
(0.0
94)
Age
0.0
49**
0.0
51**
0.0
49**
0.0
51**
0.0
41*
0.0
42*
0.0
40.0
42*
0.0
36
0.0
35
(0.0
20)
(0.0
20)
(0.0
20)
(0.0
20)
(0.0
22)
(0.0
22)
(0.0
25)
(0.0
22)
(0.0
23)
(0.0
23)
Age2
-0.0
65***
-0.0
67**
-0.0
65***
-0.0
67***
-0.0
50**
-0.0
52*
-0.0
50*
-0.0
52*
-0.0
46**
-0.0
46**
(0.0
20)
(0.0
20)
(0.0
20)
(0.0
20)
(0.0
21)
(0.0
21)
(0.0
26)
(0.0
21)
(0.0
22)
(0.0
22)
Cou
ple
0.0
81
0.0
80.0
41***
0.0
41
0.0
51
0.0
37
(0.0
98)
(0.1
13)
(0.0
12)
(0.0
74)
(0.1
18)
(0.1
18)
Marr
ied
0.0
80.0
80.0
37***
0.0
38
(0.0
98)
(0.0
99)
(0.0
11)
(0.0
74)
Nu
mb
erof
child
ren
-0.0
08
-0.0
09
-0.0
08
-0.0
09
-0.0
01
0.0
05
-0.0
02
0.0
04
0.0
00
-0.0
06
(0.0
45)
(0.0
45)
(0.0
46)
(0.0
45)
(0.0
48)
(0.0
48)
(0.0
48)
(0.0
50)
(0.0
49)
(0.0
49)
Sel
f-em
plo
yed
-0.0
95
-0.0
95
-0.0
95
-0.0
95
-0.0
45
-0.0
53
-0.0
45
-0.0
55
-0.1
12
-0.0
11
(0.2
08)
(0.1
98)
(0.2
15)
(0.1
98)
(0.2
06)
(0.2
06)
(0.2
18)
(0.2
12)
(0.2
02)
(0.2
02)
Log
inco
me
0.4
04***
0.4
31***
0.4
04***
0.4
32***
0.3
17***
0.3
36***
0.3
20***
0.3
35***
0.3
91***
0.4
19***
(0.0
83)
(0.0
85)
(0.0
83)
(0.0
91)
(0.0
83)
(0.0
84)
(0.1
14)
(0.1
06)
(0.1
05)
(0.1
06)
Ren
t0.0
00***
0.0
00
0.0
00***
0.0
00
0.0
01***
0.0
01***
(0.0
00)
(0.0
00)
(0.0
00)
(0.0
00)
(0.0
00)
(0.0
00)
Log
wea
lth
-0.0
33***
-0.0
33***
-0.0
37***
-0.0
37***
(0.0
08)
(0.0
11)
(0.0
11)
(0.0
12)
Log
tota
lass
ets
-0.0
38***
-0.0
38***
-0.0
38***
-0.0
38***
-0.0
36***
-0.0
34**
(0.0
10)
(0.0
12)
(0.0
11)
(0.0
12)
(0.0
13)
(0.0
13)
Log
bu
ild
ing
soc.
loan
s0.0
16
0.0
16
0.0
05***
0.0
06
0.0
30**
-0.0
29**
(0.0
16)
(0.0
16)
(0.0
02)
(0.0
05)
(0.0
13)
(0.0
13)
Log
mort
gages
0.0
19***
0.0
19***
0.0
10***
0.0
10***
0.0
03
0.0
04
(0.0
05)
(0.0
07)
(0.0
03)
(0.0
03)
(0.0
10)
(0.0
10)
Log
edu
cati
onal
loan
s-0
.000*
0.0
00
-0.0
00**
-0.0
00
-0.0
41
-0.0
4(0
.000)
(0.0
13)
(0.0
00)
(0.0
07)
(0.0
53)
(0.0
52)
Volu
me
over
dra
ft0.0
00
-0.0
01
0.0
00
-0.0
01
-0.0
05
-0.0
05
-0.0
05
-0.0
05
-0.0
01
0.0
01
(0.0
09)
(0.0
09)
(0.0
10)
(0.0
11)
(0.0
10)
(0.0
10)
(0.0
12)
(0.0
11)
(0.0
11)
(0.0
11)
Des
ire
for
cred
it1.3
00***
1.2
96***
1.5
35***
1.5
24***
(0.1
09)
(0.1
19)
(0.1
33)
(0.1
33)
Bank
rece
ived
requ
est
1.2
95***
1.2
96***
(0.1
09)
(0.1
11)
µ-4
.560***
-4.5
84***
-4.5
56***
-4.5
88***
-4.8
19***
-4.6
74***
-4.8
29***
-4.6
66***
-5.4
32***
-5.5
33***
(0.7
19)
(0.7
20)
(0.7
26)
(0.7
29)
(0.7
51)
(0.7
44)
(1.0
27)
(0.8
51)
(0.8
48)
(0.8
54)
N1480
1480
1480
1480
1466
1466
1466
1466
1466
1466
Pse
udoR
20.2
46
0.2
48
36
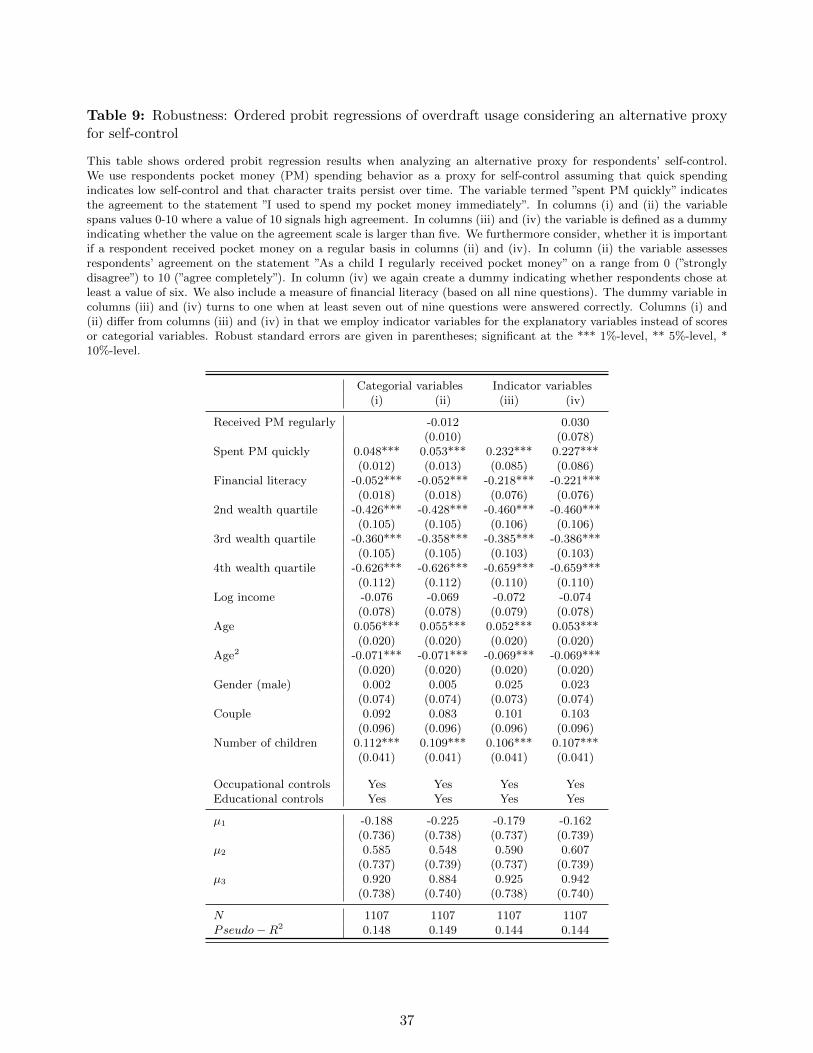
Table 9: Robustness: Ordered probit regressions of overdraft usage considering an alternative proxyfor self-control
This table shows ordered probit regression results when analyzing an alternative proxy for respondents’ self-control.We use respondents pocket money (PM) spending behavior as a proxy for self-control assuming that quick spendingindicates low self-control and that character traits persist over time. The variable termed ”spent PM quickly” indicatesthe agreement to the statement ”I used to spend my pocket money immediately”. In columns (i) and (ii) the variablespans values 0-10 where a value of 10 signals high agreement. In columns (iii) and (iv) the variable is defined as a dummyindicating whether the value on the agreement scale is larger than five. We furthermore consider, whether it is importantif a respondent received pocket money on a regular basis in columns (ii) and (iv). In column (ii) the variable assessesrespondents’ agreement on the statement ”As a child I regularly received pocket money” on a range from 0 (”stronglydisagree”) to 10 (”agree completely”). In column (iv) we again create a dummy indicating whether respondents chose atleast a value of six. We also include a measure of financial literacy (based on all nine questions). The dummy variable incolumns (iii) and (iv) turns to one when at least seven out of nine questions were answered correctly. Columns (i) and(ii) differ from columns (iii) and (iv) in that we employ indicator variables for the explanatory variables instead of scoresor categorial variables. Robust standard errors are given in parentheses; significant at the *** 1%-level, ** 5%-level, *10%-level.
Categorial variables Indicator variables(i) (ii) (iii) (iv)
Received PM regularly -0.012 0.030(0.010) (0.078)
Spent PM quickly 0.048*** 0.053*** 0.232*** 0.227***(0.012) (0.013) (0.085) (0.086)
Financial literacy -0.052*** -0.052*** -0.218*** -0.221***(0.018) (0.018) (0.076) (0.076)
2nd wealth quartile -0.426*** -0.428*** -0.460*** -0.460***(0.105) (0.105) (0.106) (0.106)
3rd wealth quartile -0.360*** -0.358*** -0.385*** -0.386***(0.105) (0.105) (0.103) (0.103)
4th wealth quartile -0.626*** -0.626*** -0.659*** -0.659***(0.112) (0.112) (0.110) (0.110)
Log income -0.076 -0.069 -0.072 -0.074(0.078) (0.078) (0.079) (0.078)
Age 0.056*** 0.055*** 0.052*** 0.053***(0.020) (0.020) (0.020) (0.020)
Age2 -0.071*** -0.071*** -0.069*** -0.069***(0.020) (0.020) (0.020) (0.020)
Gender (male) 0.002 0.005 0.025 0.023(0.074) (0.074) (0.073) (0.074)
Couple 0.092 0.083 0.101 0.103(0.096) (0.096) (0.096) (0.096)
Number of children 0.112*** 0.109*** 0.106*** 0.107***(0.041) (0.041) (0.041) (0.041)
Occupational controls Yes Yes Yes YesEducational controls Yes Yes Yes Yes
µ1 -0.188 -0.225 -0.179 -0.162(0.736) (0.738) (0.737) (0.739)
µ2 0.585 0.548 0.590 0.607(0.737) (0.739) (0.737) (0.739)
µ3 0.920 0.884 0.925 0.942(0.738) (0.740) (0.738) (0.740)
N 1107 1107 1107 1107Pseudo−R2 0.148 0.149 0.144 0.144
37
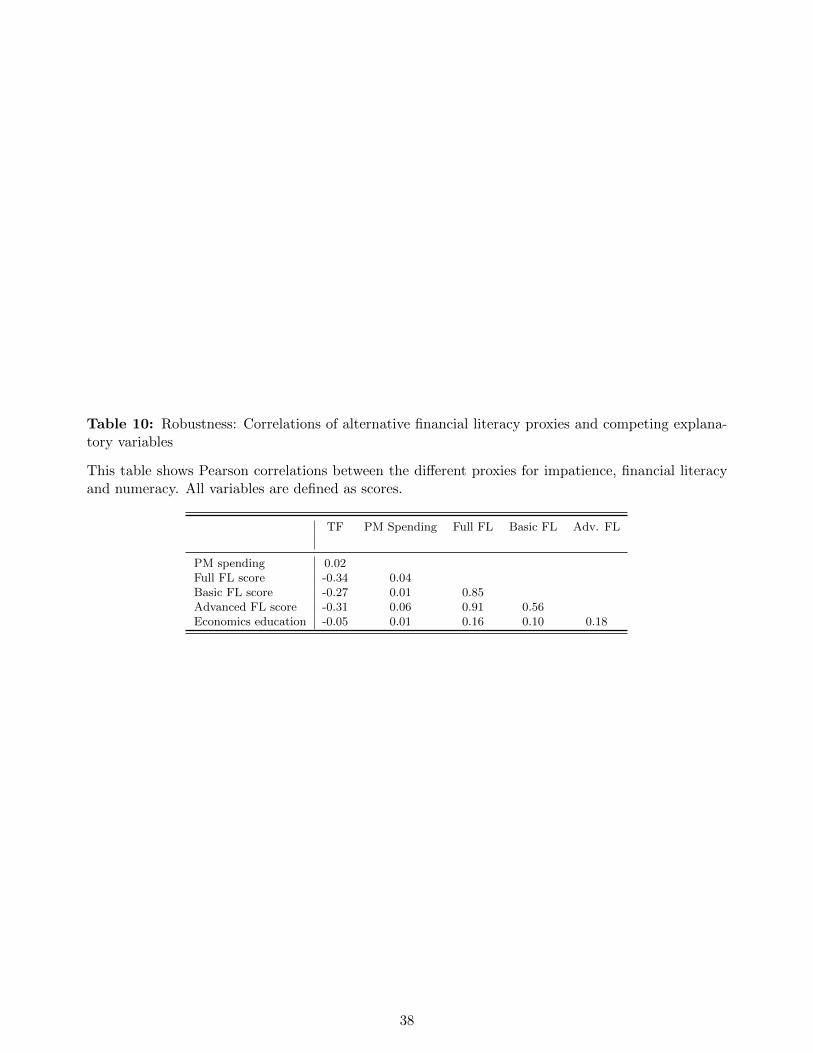
Table 10: Robustness: Correlations of alternative financial literacy proxies and competing explana-tory variables
This table shows Pearson correlations between the different proxies for impatience, financial literacyand numeracy. All variables are defined as scores.
TF PM Spending Full FL Basic FL Adv. FL
PM spending 0.02Full FL score -0.34 0.04Basic FL score -0.27 0.01 0.85Advanced FL score -0.31 0.06 0.91 0.56Economics education -0.05 0.01 0.16 0.10 0.18
38
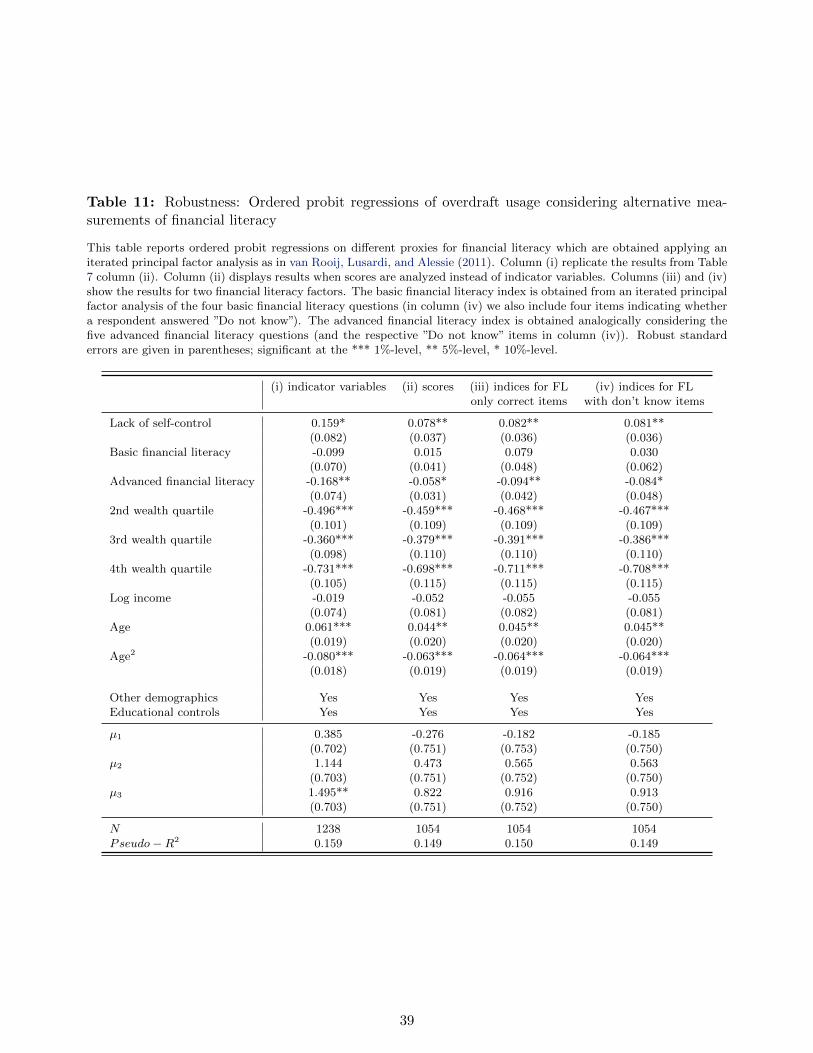
Table 11: Robustness: Ordered probit regressions of overdraft usage considering alternative mea-surements of financial literacy
This table reports ordered probit regressions on different proxies for financial literacy which are obtained applying aniterated principal factor analysis as in van Rooij, Lusardi, and Alessie (2011). Column (i) replicate the results from Table7 column (ii). Column (ii) displays results when scores are analyzed instead of indicator variables. Columns (iii) and (iv)show the results for two financial literacy factors. The basic financial literacy index is obtained from an iterated principalfactor analysis of the four basic financial literacy questions (in column (iv) we also include four items indicating whethera respondent answered ”Do not know”). The advanced financial literacy index is obtained analogically considering thefive advanced financial literacy questions (and the respective ”Do not know” items in column (iv)). Robust standarderrors are given in parentheses; significant at the *** 1%-level, ** 5%-level, * 10%-level.
(i) indicator variables (ii) scores (iii) indices for FL (iv) indices for FLonly correct items with don’t know items
Lack of self-control 0.159* 0.078** 0.082** 0.081**(0.082) (0.037) (0.036) (0.036)
Basic financial literacy -0.099 0.015 0.079 0.030(0.070) (0.041) (0.048) (0.062)
Advanced financial literacy -0.168** -0.058* -0.094** -0.084*(0.074) (0.031) (0.042) (0.048)
2nd wealth quartile -0.496*** -0.459*** -0.468*** -0.467***(0.101) (0.109) (0.109) (0.109)
3rd wealth quartile -0.360*** -0.379*** -0.391*** -0.386***(0.098) (0.110) (0.110) (0.110)
4th wealth quartile -0.731*** -0.698*** -0.711*** -0.708***(0.105) (0.115) (0.115) (0.115)
Log income -0.019 -0.052 -0.055 -0.055(0.074) (0.081) (0.082) (0.081)
Age 0.061*** 0.044** 0.045** 0.045**(0.019) (0.020) (0.020) (0.020)
Age2 -0.080*** -0.063*** -0.064*** -0.064***(0.018) (0.019) (0.019) (0.019)
Other demographics Yes Yes Yes YesEducational controls Yes Yes Yes Yes
µ1 0.385 -0.276 -0.182 -0.185(0.702) (0.751) (0.753) (0.750)
µ2 1.144 0.473 0.565 0.563(0.703) (0.751) (0.752) (0.750)
µ3 1.495** 0.822 0.916 0.913(0.703) (0.751) (0.752) (0.750)
N 1238 1054 1054 1054Pseudo−R2 0.159 0.149 0.150 0.149
39
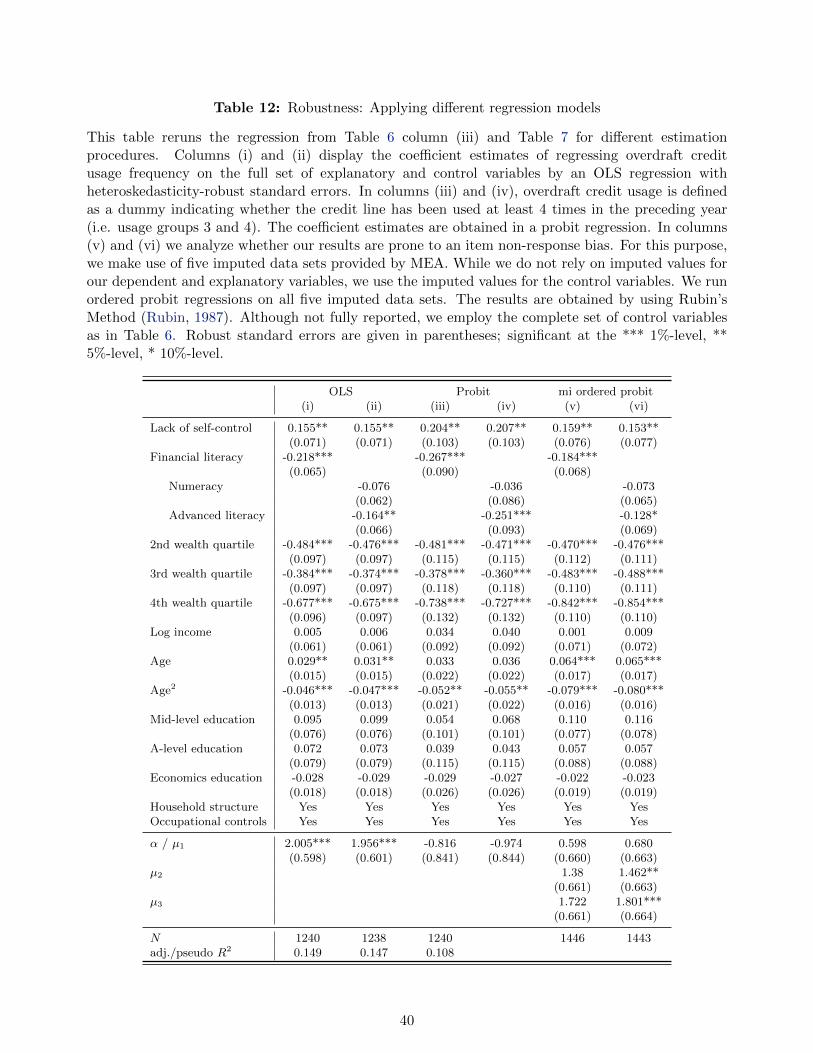
Table 12: Robustness: Applying different regression models
This table reruns the regression from Table 6 column (iii) and Table 7 for different estimationprocedures. Columns (i) and (ii) display the coefficient estimates of regressing overdraft creditusage frequency on the full set of explanatory and control variables by an OLS regression withheteroskedasticity-robust standard errors. In columns (iii) and (iv), overdraft credit usage is definedas a dummy indicating whether the credit line has been used at least 4 times in the preceding year(i.e. usage groups 3 and 4). The coefficient estimates are obtained in a probit regression. In columns(v) and (vi) we analyze whether our results are prone to an item non-response bias. For this purpose,we make use of five imputed data sets provided by MEA. While we do not rely on imputed values forour dependent and explanatory variables, we use the imputed values for the control variables. We runordered probit regressions on all five imputed data sets. The results are obtained by using Rubin’sMethod (Rubin, 1987). Although not fully reported, we employ the complete set of control variablesas in Table 6. Robust standard errors are given in parentheses; significant at the *** 1%-level, **5%-level, * 10%-level.
OLS Probit mi ordered probit(i) (ii) (iii) (iv) (v) (vi)
Lack of self-control 0.155** 0.155** 0.204** 0.207** 0.159** 0.153**(0.071) (0.071) (0.103) (0.103) (0.076) (0.077)
Financial literacy -0.218*** -0.267*** -0.184***(0.065) (0.090) (0.068)
Numeracy -0.076 -0.036 -0.073(0.062) (0.086) (0.065)
Advanced literacy -0.164** -0.251*** -0.128*(0.066) (0.093) (0.069)
2nd wealth quartile -0.484*** -0.476*** -0.481*** -0.471*** -0.470*** -0.476***(0.097) (0.097) (0.115) (0.115) (0.112) (0.111)
3rd wealth quartile -0.384*** -0.374*** -0.378*** -0.360*** -0.483*** -0.488***(0.097) (0.097) (0.118) (0.118) (0.110) (0.111)
4th wealth quartile -0.677*** -0.675*** -0.738*** -0.727*** -0.842*** -0.854***(0.096) (0.097) (0.132) (0.132) (0.110) (0.110)
Log income 0.005 0.006 0.034 0.040 0.001 0.009(0.061) (0.061) (0.092) (0.092) (0.071) (0.072)
Age 0.029** 0.031** 0.033 0.036 0.064*** 0.065***(0.015) (0.015) (0.022) (0.022) (0.017) (0.017)
Age2 -0.046*** -0.047*** -0.052** -0.055** -0.079*** -0.080***(0.013) (0.013) (0.021) (0.022) (0.016) (0.016)
Mid-level education 0.095 0.099 0.054 0.068 0.110 0.116(0.076) (0.076) (0.101) (0.101) (0.077) (0.078)
A-level education 0.072 0.073 0.039 0.043 0.057 0.057(0.079) (0.079) (0.115) (0.115) (0.088) (0.088)
Economics education -0.028 -0.029 -0.029 -0.027 -0.022 -0.023(0.018) (0.018) (0.026) (0.026) (0.019) (0.019)
Household structure Yes Yes Yes Yes Yes YesOccupational controls Yes Yes Yes Yes Yes Yes
α / µ1 2.005*** 1.956*** -0.816 -0.974 0.598 0.680(0.598) (0.601) (0.841) (0.844) (0.660) (0.663)
µ2 1.38 1.462**(0.661) (0.663)
µ3 1.722 1.801***(0.661) (0.664)
N 1240 1238 1240 1446 1443adj./pseudo R2 0.149 0.147 0.108
40
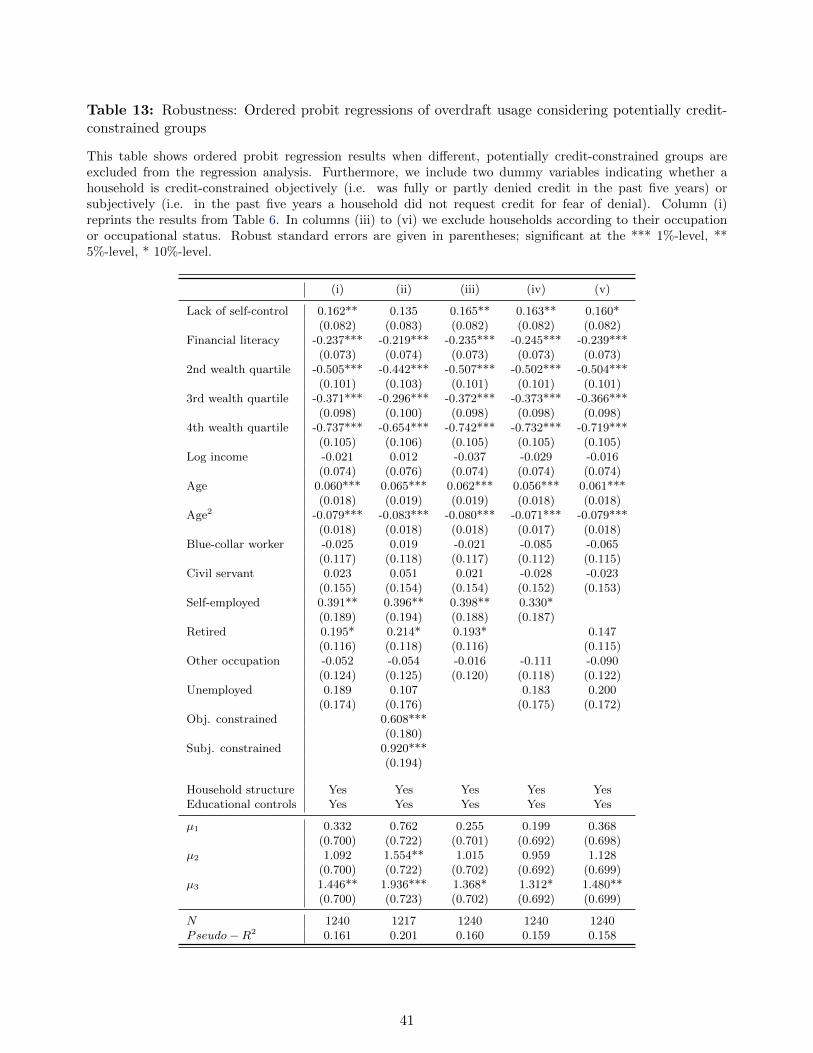
Table 13: Robustness: Ordered probit regressions of overdraft usage considering potentially credit-constrained groups
This table shows ordered probit regression results when different, potentially credit-constrained groups areexcluded from the regression analysis. Furthermore, we include two dummy variables indicating whether ahousehold is credit-constrained objectively (i.e. was fully or partly denied credit in the past five years) orsubjectively (i.e. in the past five years a household did not request credit for fear of denial). Column (i)reprints the results from Table 6. In columns (iii) to (vi) we exclude households according to their occupationor occupational status. Robust standard errors are given in parentheses; significant at the *** 1%-level, **5%-level, * 10%-level.
(i) (ii) (iii) (iv) (v)
Lack of self-control 0.162** 0.135 0.165** 0.163** 0.160*(0.082) (0.083) (0.082) (0.082) (0.082)
Financial literacy -0.237*** -0.219*** -0.235*** -0.245*** -0.239***(0.073) (0.074) (0.073) (0.073) (0.073)
2nd wealth quartile -0.505*** -0.442*** -0.507*** -0.502*** -0.504***(0.101) (0.103) (0.101) (0.101) (0.101)
3rd wealth quartile -0.371*** -0.296*** -0.372*** -0.373*** -0.366***(0.098) (0.100) (0.098) (0.098) (0.098)
4th wealth quartile -0.737*** -0.654*** -0.742*** -0.732*** -0.719***(0.105) (0.106) (0.105) (0.105) (0.105)
Log income -0.021 0.012 -0.037 -0.029 -0.016(0.074) (0.076) (0.074) (0.074) (0.074)
Age 0.060*** 0.065*** 0.062*** 0.056*** 0.061***(0.018) (0.019) (0.019) (0.018) (0.018)
Age2 -0.079*** -0.083*** -0.080*** -0.071*** -0.079***(0.018) (0.018) (0.018) (0.017) (0.018)
Blue-collar worker -0.025 0.019 -0.021 -0.085 -0.065(0.117) (0.118) (0.117) (0.112) (0.115)
Civil servant 0.023 0.051 0.021 -0.028 -0.023(0.155) (0.154) (0.154) (0.152) (0.153)
Self-employed 0.391** 0.396** 0.398** 0.330*(0.189) (0.194) (0.188) (0.187)
Retired 0.195* 0.214* 0.193* 0.147(0.116) (0.118) (0.116) (0.115)
Other occupation -0.052 -0.054 -0.016 -0.111 -0.090(0.124) (0.125) (0.120) (0.118) (0.122)
Unemployed 0.189 0.107 0.183 0.200(0.174) (0.176) (0.175) (0.172)
Obj. constrained 0.608***(0.180)
Subj. constrained 0.920***(0.194)
Household structure Yes Yes Yes Yes YesEducational controls Yes Yes Yes Yes Yes
µ1 0.332 0.762 0.255 0.199 0.368(0.700) (0.722) (0.701) (0.692) (0.698)
µ2 1.092 1.554** 1.015 0.959 1.128(0.700) (0.722) (0.702) (0.692) (0.699)
µ3 1.446** 1.936*** 1.368* 1.312* 1.480**(0.700) (0.723) (0.702) (0.692) (0.699)
N 1240 1217 1240 1240 1240Pseudo−R2 0.161 0.201 0.160 0.159 0.158
41

A Cognitive Reflection Test
This appendix provides the cognitive reflection test introduced by Fredrick (2005) which is translated
into German in the 2009 SAVE survey. In the questionnaire the questions of the cognitive reflection
test are captioned ”brain teasers” and are provided in fill in format. We indicate correct answers in
brackets.
1. A bat and a ball cost 110 cents in total. The bat costs 100 cents more than the ball. How much
does the ball cost? - Price of the ball: cents (please fill in) [5]
2. If it takes 5 machines 5 minutes to make 5 widgets, how long would it take 100 machines to
make 100 widgets? - Time required: minutes (please fill in). [5]
3. In a lake, there is a patch of lily pads. Every day, the patch doubles in size. If it takes 48 days
for the patch to cover the entire lake, how long would it take for the patch to cover half of the
lake? - Duration, until lake is covered half with water lilies: days (please fill in). [47]
42
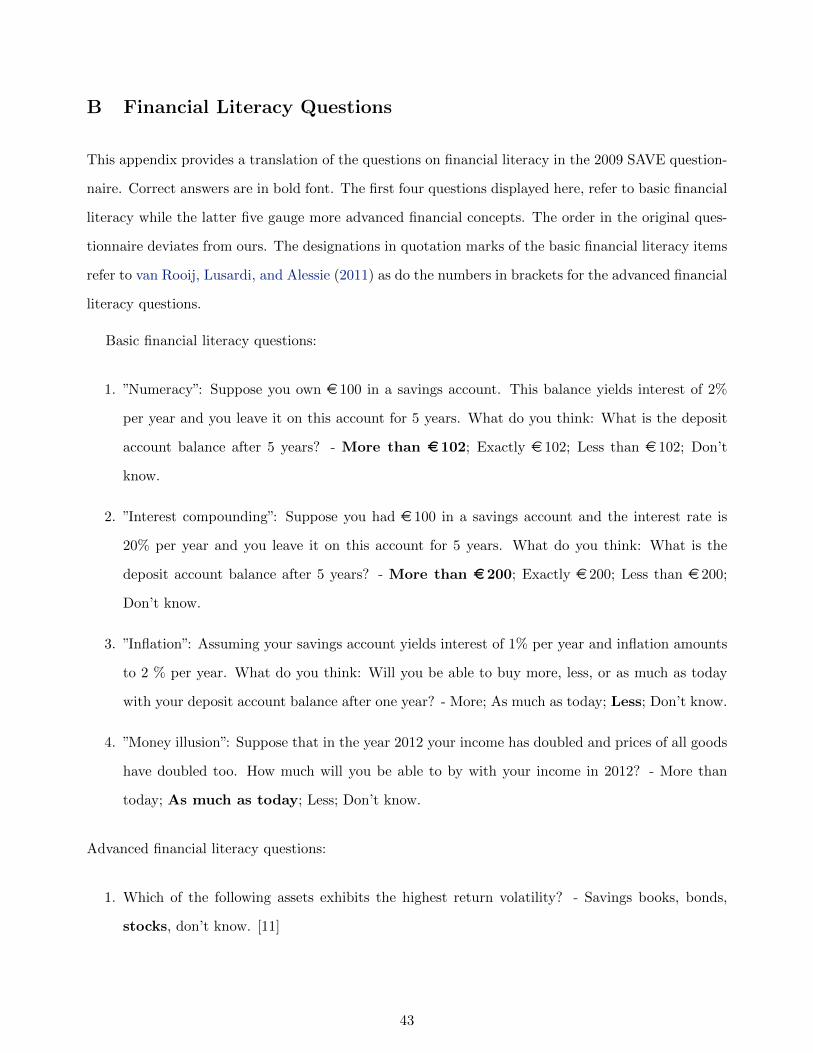
B Financial Literacy Questions
This appendix provides a translation of the questions on financial literacy in the 2009 SAVE question-
naire. Correct answers are in bold font. The first four questions displayed here, refer to basic financial
literacy while the latter five gauge more advanced financial concepts. The order in the original ques-
tionnaire deviates from ours. The designations in quotation marks of the basic financial literacy items
refer to van Rooij, Lusardi, and Alessie (2011) as do the numbers in brackets for the advanced financial
literacy questions.
Basic financial literacy questions:
1. ”Numeracy”: Suppose you own e 100 in a savings account. This balance yields interest of 2%
per year and you leave it on this account for 5 years. What do you think: What is the deposit
account balance after 5 years? - More than e 102; Exactly e 102; Less than e 102; Don’t
know.
2. ”Interest compounding”: Suppose you had e 100 in a savings account and the interest rate is
20% per year and you leave it on this account for 5 years. What do you think: What is the
deposit account balance after 5 years? - More than e 200; Exactly e 200; Less than e 200;
Don’t know.
3. ”Inflation”: Assuming your savings account yields interest of 1% per year and inflation amounts
to 2 % per year. What do you think: Will you be able to buy more, less, or as much as today
with your deposit account balance after one year? - More; As much as today; Less; Don’t know.
4. ”Money illusion”: Suppose that in the year 2012 your income has doubled and prices of all goods
have doubled too. How much will you be able to by with your income in 2012? - More than
today; As much as today; Less; Don’t know.
Advanced financial literacy questions:
1. Which of the following assets exhibits the highest return volatility? - Savings books, bonds,
stocks, don’t know. [11]
43

2. Which is the main function of the stock market? - The stock market predicts stock earnings;
results in an increase in the price of stocks; The stock market brings people who want to
buy stocks together with those who want to sell stocks;; None of the above; Don’t know.
[6]
3. Is the following statement true or false: An investment in a single stock is less risky than an
investment in an equity mutual fund? - True; False; Don’t know. [15]
4. Which of the following statements is correct? - If you invest in a balanced fund, you cannot
withdraw money within the first year of your investment; Balanced funds invest in several
asset classes like stocks and bonds; Balanced funds guarantee a fixed interest rate which is
based on past performance; None of the above statements is correct; Don’t know. [8]
5. How does a fixed-coupon bond price react to decreasing interest rates? - Bond price increases;
Bond price remains constant; Bond price decreases; Don’t know. [16]
44
Related Documents