py or Post Copying or posting is an infringement of copyright. [email protected] or 617.783.7860. KAREN BERMAN + JOE KNIGHT With JOHN CASE HARVARD BUSINESS REVIEW PRESS A Manager’s Guide to Knowing What the Numbers Really Mean REVISED EDITION Financial Intelligence

Welcome message from author
This document is posted to help you gain knowledge. Please leave a comment to let me know what you think about it! Share it to your friends and learn new things together.
Transcript
Do Not Copy or Post
This document is authorized for use only by Liudmyla Feurstein at EBCM - European University of Munich until October 2014. Copying or posting is an infringement of copyright. [email protected] or 617.783.7860.
Inc. magazine calls it one of “the best, clearest guides to the numbers” on the market. Since its original release, Financial Intelligence has become a favorite among leaders and managers who need a guided tour through financial statements and financial concepts and analysis—an explanation not only of what it all really means, but also why it matters.
This new updated edition brings the data up to date and continues to teach the basics of finance, and its art, to anyone who ever wanted to “talk numbers” confidently with their colleagues. It also addresses issues that have become even more important in recent years—including questions about the financial crisis and those concerning broader financial and accounting literacy.
Accessible, jargon-free, and filled with entertaining stories of real companies, Financial Intelligence gives nonfinancial managers and leaders the confidence to understand the nuance beyond the numbers—and helps bring everyday work to a new level.
You’ll learn about:
Who the financial players are in your organization and what they do
The many peculiarities of the income statement
The basics of balance sheets
The particulars of return on investment and how to calculate it jacket design: stephani f inks
stay informed. join the discussion. Visit hbr.org/books follow @harVardbiz on twitter find us on facebook, linkedin, youtube, and google+ hbr.org/books
man agement us$27 .00 / can$30 .00
Praise for the first edition of Financial Intelligence
“It’s like The Elements of Style of finance.”
—CFO.com
“[One of ] the best, clearest guides to the numbers that I know of.”
—Inc. magazine
“On any given subject, it’s safe to say that most people don’t know what they’re talking about. That goes double for finance and accounting,
a subject that leaves many nonprofessionals trembling. Take pity, and give them a copy of Financial Intelligence.”
—Accounting Today
“There is no shortage of books explaining the financial aspects of a company, but I have not come across one as useful as this for support people.
Rather than simply presenting the usual basics of financial measurement— the income statement, balance sheet, and cash flow statement—
as if they were science, the authors show why these are art as well.”
—The Times (South Africa)
“Authors Karen Berman and Joe Knight don’t want to turn managers into accountants; they just want managers
at all levels to become financially literate.”
—HR Magazine
karen berman and joseph knight are the founders of the Los Angeles–based Business Literacy Institute. They train managers and leaders at organizations such as Electronic Arts, Goodrich, Gulfstream, and Visa. They have been interviewed in a wide range of media including the Wall Street Journal, Inc. magazine, and businessweek.com.
karen berman + joe knight With john case
h a r V a r d b u s i n e s s r e V i e w p r e s s
A Manager’s Guide to Knowing What the Numbers Really Mean
reVisededition
FinancialIntelligence
bermanknight
case
Financial Intelligence
reVisededition
ISBN-13: 978-1-4221-4411-4
9 7 8 1 4 2 2 1 4 4 1 1 4
9 0 0 0 0
To learn more, visit financialintelligencebook.com

Do
Not
Cop
y or
Pos
t
This document is authorized for use only by Liudmyla Feurstein at EBCM - European University of Munich until October 2014. Copying or posting is an infringement of
copyright. [email protected] or 617.783.7860.
FinancialIntelligence
H6061.indb iH6061.indb i 11/21/12 8:25:25 AM11/21/12 8:25:25 AM

Do
Not
Cop
y or
Pos
t
This document is authorized for use only by Liudmyla Feurstein at EBCM - European University of Munich until October 2014. Copying or posting is an infringement of
copyright. [email protected] or 617.783.7860.H6061.indb iiH6061.indb ii 11/21/12 8:25:25 AM11/21/12 8:25:25 AM
Do
Not
Cop
y or
Pos
t
This document is authorized for use only by Liudmyla Feurstein at EBCM - European University of Munich until October 2014. Copying or posting is an infringement of
copyright. [email protected] or 617.783.7860.
FinancialIntelligence
A Manager’s Guide to Knowing What the Numbers Really Mean
KAREN BERMAN JOE KNIGHTwith JOHN CASE
H A R V A R D B U S I N E S S R E V I E W P R E S S
B O S T O N , M A S S A C H U S E T T S
REVISED EDITION
H6061.indb iiiH6061.indb iii 11/21/12 8:25:25 AM11/21/12 8:25:25 AM

Do
Not
Cop
y or
Pos
t
This document is authorized for use only by Liudmyla Feurstein at EBCM - European University of Munich until October 2014. Copying or posting is an infringement of
copyright. [email protected] or 617.783.7860.
Copyright 2013 Business Literacy Institute, Inc.
All rights reserved
The web addresses referenced in this book were live and correct at the time of the book’s
publication but may be subject to change.
No part of this publication may be reproduced, stored in or introduced into a retrieval sys-
tem, or transmitted, in any form, or by any means (electronic, mechanical, photocopying,
recording, or otherwise), without the prior permission of the publisher. Requests for per-
mission should be directed to [email protected], or mailed to Permissions,
Harvard Business School Publishing, 60 Harvard Way, Boston, Massachusetts 02163.
Library of Congress Cataloging-in-Publication Data
Berman, Karen, 1962–
Financial intelligence : a manager’s guide to knowing what the numbers really mean /
Karen Berman and Joe Knight ; with John Case. — 2nd ed., rev. and expanded.
p. cm.
ISBN 978-1-4221-4411-4 (alk. paper)
1. Financial statements. 2. Cash management. 3. Corporations—Finance.
I. Knight, Joe, 1963– II. Case, John, 1944– III. Title.
HG4028.B2B422 2013
658.15′11—dc23
2012039043
H6061.indb ivH6061.indb iv 11/21/12 8:25:25 AM11/21/12 8:25:25 AM
Find more digital content or join the discussion on www.hbr.org.
The web addresses referenced and linked in this book were live and correct at the time of the book’s publication but may be subject to change.

Do
Not
Cop
y or
Pos
t
This document is authorized for use only by Liudmyla Feurstein at EBCM - European University of Munich until October 2014. Copying or posting is an infringement of
copyright. [email protected] or 617.783.7860.
Karen dedicates this book to her husband, her daughter,
and her circle of family and friends.
Joe dedicates this book to his wife, Donielle, and to the
seven Js—Jacob, Jordan, Jewel, Jessica,
James, Jonah, and Joseph Christian (JC).
H6061.indb vH6061.indb v 11/21/12 8:25:25 AM11/21/12 8:25:25 AM

Do
Not
Cop
y or
Pos
t
This document is authorized for use only by Liudmyla Feurstein at EBCM - European University of Munich until October 2014. Copying or posting is an infringement of
copyright. [email protected] or 617.783.7860.H6061.indb viH6061.indb vi 11/21/12 8:25:25 AM11/21/12 8:25:25 AM
Do
Not
Cop
y or
Pos
t
This document is authorized for use only by Liudmyla Feurstein at EBCM - European University of Munich until October 2014. Copying or posting is an infringement of
copyright. [email protected] or 617.783.7860.
C O N T E N T S
Preface: What Is Financial Intelligence? xi
PART ONETHE ART OF FINANCE (AND WHY IT MATTERS)
1. You Can’t Always Trust the Numbers 3
2. Spotting Assumptions, Estimates, and Biases 10
3. Why Increase Your Financial Intelligence? 17
4. The Rules Accountants Follow—and
Why You Don’t Always Have To 26
Part One Toolbox: 36
Getting What You Want; The Players and What
They Do; Reporting Obligations of Public Companies
PART TWOTHE (MANY) PECULIARITIES OF THE INCOME STATEMENT
5. Profi t Is an Estimate 43
6. Cracking the Code of the Income Statement 48
7. Revenue: The Issue Is Recognition 56
8. Costs and Expenses: No Hard-and-Fast Rules 63
H6061.indb viiH6061.indb vii 11/21/12 8:25:25 AM11/21/12 8:25:25 AM
Do
Not
Cop
y or
Pos
t
This document is authorized for use only by Liudmyla Feurstein at EBCM - European University of Munich until October 2014. Copying or posting is an infringement of
copyright. [email protected] or 617.783.7860.
viiiContents
9. The Many Forms of Profi t 75
Part Two Toolbox: 83
Understanding Variance; Profi t at Nonprofi ts;
A Quick Review: “Percent of” and “Percent Change”
PART THREETHE BALANCE SHEET REVEALS THE MOST
10. Understanding Balance Sheet Basics 89
11. Assets: More Estimates and Assumptions (Except for Cash) 95
12. On the Other Side: Liabilities and Equity 106
13. Why the Balance Sheet Balances 111
14. The Income Statement Affects the Balance Sheet 114
Part Three Toolbox: 119
Expense? Or Capital Expenditure?;
The Impact of Mark-to-Market Accounting
PART FOURCASH IS KING
15. Cash Is a Reality Check 125
16. Profi t ≠ Cash (and You Need Both) 129
17. The Language of Cash Flow 135
18. How Cash Connects with Everything Else 139
19. Why Cash Matters 148
Part Four Toolbox: 152
Free Cash Flow; Even the Big Guys Can Run Out of Cash
H6061.indb viiiH6061.indb viii 11/21/12 8:25:25 AM11/21/12 8:25:25 AM
Do
Not
Cop
y or
Pos
t
This document is authorized for use only by Liudmyla Feurstein at EBCM - European University of Munich until October 2014. Copying or posting is an infringement of
copyright. [email protected] or 617.783.7860.
ixContents
PART FIVERATIOS: LEARNING WHAT THE NUMBERS ARE REALLY TELLING YOU
20. The Power of Ratios 157
21. Profi tability Ratios: The Higher the Better (Mostly) 164
22. Leverage Ratios: The Balancing Act 172
23. Liquidity Ratios: Can We Pay Our Bills? 176
24. Effi ciency Ratios: Making the Most of Your Assets 179
25. The Investor’s Perspective: The “Big Five” Numbers
and Shareholder Value 185
Part Five Toolbox: 191
Which Ratios Are Most Important to Your Business?;
The Power of Percent of Sales; Ratio Relationships;
Different Companies, Different Calculations
PART SIXHOW TO CALCULATE (AND REALLY UNDERSTAND) RETURN ON INVESTMENT
26. The Building Blocks of ROI 197
27. Figuring ROI: The Nitty-Gritty 203
Part Six Toolbox: 216
A Step-by-Step Guide to Analyzing Capital Expenditures;
Calculating the Cost of Capital; Economic Value Added
and Economic Profi t—Putting It All Together
PART SEVENAPPLIED FINANCIAL INTELLIGENCE: WORKING CAPITAL MANAGEMENT
28. The Magic of Managing the Balance Sheet 225
29. Your Balance Sheet Levers 229
H6061.indb ixH6061.indb ix 11/21/12 8:25:25 AM11/21/12 8:25:25 AM
Do
Not
Cop
y or
Pos
t
This document is authorized for use only by Liudmyla Feurstein at EBCM - European University of Munich until October 2014. Copying or posting is an infringement of
copyright. [email protected] or 617.783.7860.
xContents
30. Homing In on Cash Conversion 234
Part Seven Toolbox: 239
Accounts Receivable Aging
PART EIGHTCREATING A FINANCIALLY INTELLIGENT COMPANY
31. Financial Literacy and Corporate Performance 243
32. Financial Literacy Strategies 249
33. Financial Transparency: Our Ultimate Goal 257
Part Eight Toolbox: 259
Understanding Sarbanes-Oxley
Appendix: Sample Financials 261
Notes 265
Acknowledgments 267
Index 271
About the Authors 285
H6061.indb xH6061.indb x 11/21/12 8:25:25 AM11/21/12 8:25:25 AM
Do
Not
Cop
y or
Pos
t
This document is authorized for use only by Liudmyla Feurstein at EBCM - European University of Munich until October 2014. Copying or posting is an infringement of
copyright. [email protected] or 617.783.7860.
P R E FA C E
WHAT IS FINANCIAL INTELLIGENCE?
We have worked with thousands of employees, managers, and leaders in
companies all over the world, teaching them about the fi nancial side of
business. Our philosophy is that everyone in a company does better when
they understand how fi nancial success is measured and how they have an
impact on the company’s performance. Our term for that understanding
is fi nancial intelligence. Greater fi nancial intelligence, we’ve learned, helps
people feel more committed and involved. They understand better what
they are a part of, what the organization is trying to achieve, and how they
affect results. Trust increases, turnover decreases, and fi nancial results
improve.
We came to this philosophy by different routes. Karen took the aca-
demic path. Her PhD dissertation focused on the question of whether in-
formation sharing and fi nancial understanding on the part of employees
and managers positively affects a company’s fi nancial performance. (It
does.) Karen went on to become a fi nancial trainer and started an orga-
nization, the Business Literacy Institute, devoted to helping others learn
about fi nance. Joe earned an MBA in fi nance, but most of his experience
with fi nancial training in organizations has been on the practical side. Af-
ter stints at Ford Motor Company and several small companies, he joined a
start-up business, Setpoint Systems and Setpoint Inc., which manufactures
roller coasters and factory-automation equipment. As chief fi nancial of-
fi cer (CFO) and owner of Setpoint, he learned fi rsthand the importance
of training engineers and other employees in how the business worked.
In 2003 Joe joined Karen as co-owner of the Business Literacy Institute
H6061.indb xiH6061.indb xi 11/21/12 8:25:25 AM11/21/12 8:25:25 AM
Do
Not
Cop
y or
Pos
t
This document is authorized for use only by Liudmyla Feurstein at EBCM - European University of Munich until October 2014. Copying or posting is an infringement of
copyright. [email protected] or 617.783.7860.
xiiPreface
and since then has worked with dozens of companies, facilitating fi nancial
intelligence courses.
What do we mean by fi nancial intelligence? It isn’t some innate abil-
ity that you either have or don’t have. Granted, some people are better at
numbers than others, and a few legendary folks seem to have an intuitive
grasp of fi nance that eludes the rest of us. But that’s not what we’re talk-
ing about here. For most businesspeople—ourselves included—fi nancial
intelligence is no more than a set of skills that can be learned. People who
work in fi nance acquire these skills early on, and for the rest of their careers
are able to talk with one another in a specialized language that can sound
like Greek to the uninitiated. Most senior executives (not all) either come
out of fi nance or pick up the skills during their rise to the top, just because
it’s tough to run a business unless you know what the fi nancial folks are
saying. Managers who don’t work in fi nance, however, too often have been
out of luck. They never picked up the skills, and so in some ways they’ve
been relegated to the sidelines.
Fundamentally, fi nancial intelligence boils down to four distinct skill
sets, and when you fi nish the book, you should be competent in all of
them. They are:
• Understanding the foundation. Managers who are fi nancially intel-
ligent understand the basics of fi nancial measurement. They can read
an income statement, a balance sheet, and a cash fl ow statement. They
know the difference between profi t and cash. They understand why the
balance sheet balances. The numbers neither scare nor mystify them.
• Understanding the art. Finance and accounting are an art as well as
a science. The two disciplines must try to quantify what can’t always
be quantifi ed, and so must rely on rules, estimates, and assumptions.
Financially intelligent managers are able to identify where the artful
aspects of fi nance have been applied to the numbers, and they know
how applying them differently might lead to different conclusions.
They thus are prepared to question and challenge the numbers when
appropriate.
• Understanding analysis. Once you have the foundation and an appre-
ciation of the art of fi nance, you can use the information to analyze
H6061.indb xiiH6061.indb xii 11/21/12 8:25:25 AM11/21/12 8:25:25 AM
Do
Not
Cop
y or
Pos
t
This document is authorized for use only by Liudmyla Feurstein at EBCM - European University of Munich until October 2014. Copying or posting is an infringement of
copyright. [email protected] or 617.783.7860.
xiiiPreface
the numbers in greater depth. Financially intelligent managers don’t
shrink from ratios, return on investment (ROI) analysis, and the like.
They use these analyses to inform their decisions, and they make bet-
ter decisions for doing so.
• Understanding the big picture. Finally, although we teach fi nance, and
although we think that everyone should understand the numbers side
of business, we are equally fi rm in our belief that numbers can’t and
don’t tell the whole story. A business’s fi nancial results must always
be understood in context—that is, within the framework of the big
picture. Factors such as the economy, the competitive environment,
regulations, changing customer needs and expectations, and new
technologies all affect how you should interpret numbers and make
decisions.
But fi nancial intelligence doesn’t stop with book learning. Like most
disciplines and skill sets, it must not only be learned, it must also be prac-
ticed and applied. On the practical side, we hope and expect the book will
prepare you to take actions such as the following:
• Speak the language. Finance is the language of business. Whether
you like it or not, the one thing every organization has in common
is numbers and how those numbers are tabulated, analyzed, and
reported. You need to use the language to be taken seriously and to
communicate effectively. As with any new language, you can’t expect
to speak it fl uently at fi rst. Never mind—jump in and try something.
You’ll gain confi dence as you go.
• Ask questions. We want you to look at fi nancial reports and analysis
with a questioning eye. It’s not that we think anything is necessarily
wrong with the numbers you see. We merely believe it is tremendously
important to understand the what, why, and how of the numbers
you are using to make decisions. Since every company is different,
sometimes the only way to fi gure out all those parameters is to ask
questions.
• Use the information in your job. After reading this book, you should
know a lot. So use it! Use it to improve cash fl ow. Use it to analyze the
H6061.indb xiiiH6061.indb xiii 11/21/12 8:25:26 AM11/21/12 8:25:26 AM
Do
Not
Cop
y or
Pos
t
This document is authorized for use only by Liudmyla Feurstein at EBCM - European University of Munich until October 2014. Copying or posting is an infringement of
copyright. [email protected] or 617.783.7860.
xivPreface
next big project. Use it to assess your company’s results. Your job will
be more fun, and your impact on the company’s performance will be
greater. From our vantage point, we love to see employees, managers,
and leaders who can see the link between fi nancial results and their
job. Suddenly, they seem to have a better idea of why they are carrying
out a particular set of tasks.
Why This Second Edition?
Financial concepts don’t change much from one year to the next, or even
from one decade to the next. The fundamental concepts and ideas we dis-
cussed in the fi rst edition of this book, published in 2006, are exactly the
same in the current edition. But there are good reasons for presenting you
with this revised and expanded version of the original text.
For one thing, the fi nancial landscape has changed—and in a big way.
Since the fi rst edition of Financial Intelligence appeared, the world under-
went a major crisis directly related to our topic. Suddenly more people
than ever were talking about balance sheets, mark-to-market accounting,
and liquidity ratios. The crisis also changed what was discussed inside
companies: how the company was doing fi nancially, how it could best be
evaluated, and what fi nancial issues managers and employees as individu-
als needed to consider.
To help facilitate these conversations, we added many new subjects, in-
cluding the following:
• A chapter on GAAP versus non-GAAP numbers. Today, many compa-
nies are reporting both GAAP and non-GAAP results. (You can fi nd
out what GAAP and non-GAAP numbers are, and why they matter, in
chapter 4.)
• A chapter (chapter 25) that examines how the marketplace evaluates
companies. The fi nancial crisis, like other bubbles and meltdowns,
provided new insights into which measures are most (and least) help-
ful in understanding a company’s fi nancial performance.
• Lots of additional information about return on investment (ROI),
including a section on the profi tability index, a discussion of cost of
capital, and an example of ROI analysis.
H6061.indb xivH6061.indb xiv 11/21/12 8:25:26 AM11/21/12 8:25:26 AM

Do
Not
Cop
y or
Pos
t
This document is authorized for use only by Liudmyla Feurstein at EBCM - European University of Munich until October 2014. Copying or posting is an infringement of
copyright. [email protected] or 617.783.7860.
xvPreface
We also gathered up feedback from the thousands of people around the
world who read the book, and from our clients who used it in their training
classes. Thanks to that feedback, we have added several new concepts, such
as contribution margin, the impact of exchange rates on profi tability, and
economic value added (EVA). We discuss bookings and backlog, deferred
revenue, and return on net assets, or RONA. We think you’ll fi nd the book
more useful as a result.
Finally, we added additional information about how to increase fi nan-
cial intelligence throughout your company. In our training business, we
work with many companies, including dozens in the Fortune 500, who see
this as a necessary part of employee, manager, and leader education.
So this book will support the development of your fi nancial intelligence.
We hope readers will fi nd our experience and advice valuable. We hope it
will enable you to achieve greater success, both personally and profession-
ally. We hope it helps your company be more successful as well. But most
of all, we think, after reading this book, you’ll be just a bit more motivated,
a bit more interested, and a bit more excited to understand a whole new
aspect of business.
H6061.indb xvH6061.indb xv 11/21/12 8:25:26 AM11/21/12 8:25:26 AM

Do
Not
Cop
y or
Pos
t
This document is authorized for use only by Liudmyla Feurstein at EBCM - European University of Munich until October 2014. Copying or posting is an infringement of
copyright. [email protected] or 617.783.7860.H6061.indb xviH6061.indb xvi 11/21/12 8:25:26 AM11/21/12 8:25:26 AM
Do
Not
Cop
y or
Pos
t
This document is authorized for use only by Liudmyla Feurstein at EBCM - European University of Munich until October 2014. Copying or posting is an infringement of
copyright. [email protected] or 617.783.7860.
Part One
The Art of Finance (and Why It Matters)
H6061.indb 1H6061.indb 1 11/21/12 8:25:26 AM11/21/12 8:25:26 AM

Do
Not
Cop
y or
Pos
t
This document is authorized for use only by Liudmyla Feurstein at EBCM - European University of Munich until October 2014. Copying or posting is an infringement of
copyright. [email protected] or 617.783.7860.H6061.indb 2H6061.indb 2 11/21/12 8:25:26 AM11/21/12 8:25:26 AM
Do
Not
Cop
y or
Pos
t
This document is authorized for use only by Liudmyla Feurstein at EBCM - European University of Munich until October 2014. Copying or posting is an infringement of
copyright. [email protected] or 617.783.7860.
1
You Can’t Always Trust the Numbers
IF YOU READ THE NEWS REGULARLY, you have learned a good deal in recent
years about all the wonderful ways people fi nd to cook their companies’
books. They record phantom sales. They hide expenses. They sequester
some of their properties and debts in a mysterious place known as off bal-
ance sheet. Some of the techniques are pleasantly simple, like the software
company a few years back that boosted revenues by shipping its customers
empty cartons just before the end of a quarter. (The customers sent the
cartons back, of course—but not until the following quarter.) Other tech-
niques are complex to the point of near-incomprehensibility. (Remember
Enron? It took years for accountants and prosecutors to sort out all of that
ill-fated company’s spurious transactions.) As long as there are liars and
thieves on this earth, some of them will no doubt fi nd ways to commit
fraud and embezzlement.
But maybe you have also noticed something else about the arcane
world of fi nance; namely, that many companies fi nd perfectly legal ways
to make their books look better than they otherwise would. Granted, these
legitimate tools aren’t quite as powerful as outright fraud: they can’t make
a bankrupt company look like a profi table one, at least not for long. But it’s
amazing what they can do. For example, a little technique called a one-time
H6061.indb 3H6061.indb 3 11/21/12 8:25:26 AM11/21/12 8:25:26 AM
Do
Not
Cop
y or
Pos
t
This document is authorized for use only by Liudmyla Feurstein at EBCM - European University of Munich until October 2014. Copying or posting is an infringement of
copyright. [email protected] or 617.783.7860.
4THE ART OF F INANCE
charge allows a company to take a whole bunch of bad news and cram it
into one quarter’s fi nancial results, so that future quarters will look better.
Alternatively, some shuffl ing of expenses from one category into another
can pretty up a company’s quarterly earnings picture and boost its stock
price. A while ago, the Wall Street Journal ran a front-page story on how
companies fatten their bottom lines by reducing retirees’ benefi t accruals—
even though they may not spend a nickel less on those benefi ts.
Anybody who isn’t a fi nancial professional is likely to greet such maneu-
vers with a certain amount of mystifi cation. Everything else in business—
marketing, research and development, human resource management,
strategy formulation, and so on—is obviously subjective, a matter depen-
dent on experience and judgment as well as data. But fi nance? Accounting?
Surely, the numbers produced by these departments are objective, black
and white, indisputable. Surely, a company sold what it sold, spent what it
spent, earned what it earned. Even where fraud is concerned, unless a com-
pany really does ship empty boxes, how can its executives so easily make
things look so different than they really are? And short of fraud, how can
they so easily manipulate the business’s bottom line?
THE ART OF FINANCE
The fact is, accounting and fi nance, like all those other business disciplines,
really are as much art as they are science. You might call this the CFO’s or
the controller’s hidden secret, except that it isn’t really a secret, it’s a widely
acknowledged truth that everyone in fi nance knows. Trouble is, the rest of
us tend to forget it. We think that if a number shows up on the fi nancial
statements or the fi nance department’s reports to management, it must
accurately represent reality.
In fact, of course, that can’t always be true, if only because even the
numbers jockeys can’t know everything. They can’t know exactly what ev-
eryone in the company does every day, so they don’t know exactly how
to allocate costs. They can’t know exactly how long a piece of equipment
will last, so they don’t know how much of its original cost to record in any
given year. The art of accounting and fi nance is the art of using limited data
to come as close as possible to an accurate description of how well a company
H6061.indb 4H6061.indb 4 11/21/12 8:25:26 AM11/21/12 8:25:26 AM
Do
Not
Cop
y or
Pos
t
This document is authorized for use only by Liudmyla Feurstein at EBCM - European University of Munich until October 2014. Copying or posting is an infringement of
copyright. [email protected] or 617.783.7860.
5You Can’t Always Trust the Numbers
is performing. Accounting and fi nance are not reality, they are a refl ection
of reality, and the accuracy of that refl ection depends on the ability of ac-
countants and fi nance professionals to make reasonable assumptions and
to calculate reasonable estimates.
It’s a tough job. Sometimes they have to quantify what can’t easily be
quantifi ed. Sometimes they have to make diffi cult judgments about how
to categorize a given item. None of these complications necessarily means
that the accountants and fi nancial folks are trying to cook the books or
that they are incompetent. The complications arise because they must
make educated guesses relating to the numbers side of the business all
day long.
The result of these assumptions and estimates is, typically, a bias in the
numbers. Please don’t get the idea that by using the word bias we are im-
pugning anybody’s integrity. (Some of our best friends are accountants—
no, really—and one of us, Joe, actually carries the title CFO on his busi-
ness card.) Where fi nancial results are concerned, bias means only that the
numbers might be skewed in one direction or another, depending on the
background or experience of the people who compiled and interpreted
them. It means only that accountants and fi nance professionals have used
certain assumptions and estimates rather than others when they put their
reports together. Enabling you to understand this bias, to correct for it
where necessary, and even to use it to your own (and your company’s)
advantage is one objective of this book. To understand it, you must know
what questions to ask. Armed with the information you gather, you can
make informed, well-considered decisions.
Box Defi nitions
We want to make fi nance as easy as possible. Most fi nance books make us fl ip back and forth between the page we’re on and the glossary to learn the defi nition of a word we don’t know. By the time we fi nd it and get back to our page, we’ve lost our train of thought. So here, we are going to give you the defi nitions right where you need them, next to the fi rst time we use the word.
H6061.indb 5H6061.indb 5 11/21/12 8:25:26 AM11/21/12 8:25:26 AM
Do
Not
Cop
y or
Pos
t
This document is authorized for use only by Liudmyla Feurstein at EBCM - European University of Munich until October 2014. Copying or posting is an infringement of
copyright. [email protected] or 617.783.7860.
6THE ART OF F INANCE
JUDGMENT CALLS
For example, let’s look at one of the variables that is frequently estimated—
one that you wouldn’t think needed to be estimated at all. Revenue or sales
refers to the value of what a company sold to its customers during a given
period. You’d think that would be an easy matter to determine. But the
question is, When should revenue be recorded (or “recognized,” as accoun-
tants like to say)? Here are some possibilities:
• When a contract is signed
• When the product or service is delivered
• When the invoice is sent out
• When the bill is paid
If you said, “When the product or service is delivered,” you’re correct.
As we’ll see in chapter 7, that’s the fundamental rule that determines when
a sale should show up on the income statement. Still, the rule isn’t simple.
Implementing it requires making a number of assumptions, and in fact the
whole question of “When is a sale a sale?” is a hot topic in many fraud cases.
According to a 2007 study by the Deloitte Forensic Center, 41 percent of
fraud cases pursued by the Securities and Exchange Commission between
2000 and 2006 involved revenue recognition.1
Income Statement
The income statement shows revenues, expenses, and profi t for a period of time, such as a month, quarter, or year. It’s also called a profi t and loss statement, P&L, statement of earnings, or statement of operations. Sometimes the word consolidated is thrown in front of those phrases, but it’s still just an income statement. The bottom line of the income statement is net profi t, also known as net income or net earnings.
H6061.indb 6H6061.indb 6 11/21/12 8:25:26 AM11/21/12 8:25:26 AM
Do
Not
Cop
y or
Pos
t
This document is authorized for use only by Liudmyla Feurstein at EBCM - European University of Munich until October 2014. Copying or posting is an infringement of
copyright. [email protected] or 617.783.7860.
7You Can’t Always Trust the Numbers
Imagine, for instance, that a company sells a customer a copying ma-
chine, complete with a maintenance contract, all wrapped up in one fi nan-
cial package. Suppose the machine is delivered in October, but the mainte-
nance contract is good for the following twelve months. Now: How much
of the initial purchase price should be recorded on the books for October?
After all, the company hasn’t yet delivered all the services that it is respon-
sible for during the year. Accountants can make estimates of the value of
those services, of course, and adjust the revenue accordingly. But this re-
quires a big judgment call.
Nor is this example merely hypothetical. Witness Xerox, which several
years ago played the revenue-recognition game on such a massive scale that
it was later found to have improperly recognized a whopping $6 billion of
sales. The issue? Xerox was selling equipment on four-year leases, includ-
ing service and maintenance. So how much of the price covered the cost
of the equipment, and how much was for the subsequent services? Fearful
that the company’s sagging profi ts would cause its stock price to plummet,
Xerox’s executives at the time decided to book ever-increasing percentages
of the anticipated revenues—along with the associated profi ts—up front.
Before long, nearly all the revenue on these contracts was being recognized
at the time of the sale.
Xerox had clearly lost its way and was trying to use accounting to cover
up its business failings. But you can see the point here: there’s plenty of
room, short of outright book-cooking, to make the numbers look one way
or another.
A second example of the artful work of fi nance—and another one that
often plays a role in fi nancial scandals—is determining whether a given
Operating Expenses
Operating expenses are the costs required to keep the business going from day to day. They include salaries, benefi ts, and insurance costs, among a host of other items. Operating expenses are listed on the income statement and are subtracted from revenue to determine profi t.
H6061.indb 7H6061.indb 7 11/21/12 8:25:27 AM11/21/12 8:25:27 AM
Do
Not
Cop
y or
Pos
t
This document is authorized for use only by Liudmyla Feurstein at EBCM - European University of Munich until October 2014. Copying or posting is an infringement of
copyright. [email protected] or 617.783.7860.
8THE ART OF F INANCE
cost is a capital expenditure or an operating expense. (The Deloitte study
notes that this issue accounted for 11 percent of fraud cases between 2000
and 2006.) We’ll get to all the details later; for the moment, all you need to
know is that an operating expense reduces the bottom line immediately,
and a capital expenditure spreads the hit out over several accounting pe-
riods. You can see the temptation here: Wait. You mean if we take all those
offi ce supply purchases and call them “capital expenditures,” we can increase
our profi t accordingly? This is the kind of thinking that got WorldCom—
the big telecommunications company that went bankrupt in 2002—into so
much trouble (see the part 3 toolbox for details). To prevent such tempta-
tion, both the accounting profession and individual companies have rules
about what must be classifi ed where. But the rules leave a good deal up to
individual judgment and discretion. Again, those judgments can affect a
company’s profi t, and hence its stock price, dramatically.
Now, we are writing this book primarily for people in companies, not for
investors. So why should these readers worry about any of this? The reason,
of course, is that they use numbers to make decisions. You yourself make
judgments about budgets, capital expenditures, staffi ng, and a dozen other
matters—or your boss does—based on an assessment of the company’s or
your business unit’s fi nancial situation. If you aren’t aware of the assump-
tions and estimates that underlie the numbers and how those assumptions
and estimates affect the numbers in one direction or another, your deci-
sions may be faulty. Financial intelligence means understanding where the
numbers are “hard”—well supported and relatively uncontroversial—and
Capital Expenditures
A capital expenditure is the purchase of an item that’s considered a long-term investment, such as computer systems and equipment. Most companies follow the rule that any purchase over a certain dollar amount counts as a capital ex-penditure, while anything less is an operating expense. Operating expenses show up on the income statement, and thus reduce profi t. Capital expenditures show up on the balance sheet; only the depreciation of a piece of capital equipment appears on the income statement. More on this in chapters 5 and 11.
H6061.indb 8H6061.indb 8 11/21/12 8:25:27 AM11/21/12 8:25:27 AM

Do
Not
Cop
y or
Pos
t
This document is authorized for use only by Liudmyla Feurstein at EBCM - European University of Munich until October 2014. Copying or posting is an infringement of
copyright. [email protected] or 617.783.7860.
9You Can’t Always Trust the Numbers
where they are “soft”—that is, highly dependent on judgment calls. What’s
more, outside investors, bankers, vendors, customers, and others will be
using your company’s numbers as a basis for their own decisions. If you
don’t have a good working understanding of the fi nancial statements and
know what they’re looking at or why, you are at their mercy.
H6061.indb 9H6061.indb 9 11/21/12 8:25:27 AM11/21/12 8:25:27 AM
Do
Not
Cop
y or
Pos
t
This document is authorized for use only by Liudmyla Feurstein at EBCM - European University of Munich until October 2014. Copying or posting is an infringement of
copyright. [email protected] or 617.783.7860.
2
Spotting Assumptions, Estimates, and Biases
SO LET’S PLUNGE A L ITTLE DEEPER into this element of fi nancial intelli-
gence—understanding the “artistic” aspects of fi nance. Even though
you’re just at the beginning of the book, this will give you a valuable
perspective on the concepts and practices that you’ll learn later on. We’ll
look at three examples and ask some simple but critical questions:
• What were the assumptions in this number?
• Are there any estimates in the numbers?
• What is the bias those assumptions and estimates lead to?
• What are the implications?
The examples we’ll look at are accruals, depreciation, and valuation.
If these words sound like part of that strange language the fi nancial folks
speak, don’t worry. You’ll be surprised how quickly you can pick up enough
to get around.
H6061.indb 10H6061.indb 10 11/21/12 8:25:27 AM11/21/12 8:25:27 AM
Do
Not
Cop
y or
Pos
t
This document is authorized for use only by Liudmyla Feurstein at EBCM - European University of Munich until October 2014. Copying or posting is an infringement of
copyright. [email protected] or 617.783.7860.
11Spotting Assumptions, Estimates, and Biases
ACCRUALS AND ALLOCATIONS: LOTS OF ASSUMPTIONS AND ESTIMATES
At a certain time every month, you know that your company’s controller
is busy “closing the books.” Here, too, is a fi nancial puzzle: Why on earth
does it take as long as it does? If you haven’t worked in fi nance, you might
think it could take a day to add up all the end-of-the-month fi gures. But
two or three weeks?
Well, one step that takes a lot of time is fi guring out all the accruals
and allocations. There’s no need to understand the details now—we’ll get
to that in chapters 11 and 12. For the moment, read the defi nitions in the
boxes and focus on the fact that the accountants use accruals and alloca-
tions to try to create an accurate picture of the business for the month.
After all, it doesn’t help anybody if the fi nancial reports don’t tell us how
much it cost us to produce the products and services we sold last month.
That is what the controller’s staff is trying so hard to do, and that is one
reason why it takes as long as it does.
Determining accruals and allocations nearly always entails making as-
sumptions and estimates. Take your salary as an example. Say that you
worked in June on a new product line and that the new line was intro-
duced in July. Now the accountant determining the allocations has to es-
timate how much of your salary should be matched to the product cost
(because you spent much of your time on those initial products) and how
much should be charged to development costs (because you also worked
on the original development of the product). She must also decide how
to accrue for June versus July. Depending on how she answers questions
Accruals
An accrual is the portion of a revenue or expense item that is recorded in a particular time span. Product development costs, for instance, are likely to be spread out over several accounting periods, and so a portion of the total cost will be accrued each month. The purpose of accruals is to match costs to revenues in a given time period as accurately as possible.
H6061.indb 11H6061.indb 11 11/21/12 8:25:27 AM11/21/12 8:25:27 AM
Do
Not
Cop
y or
Pos
t
This document is authorized for use only by Liudmyla Feurstein at EBCM - European University of Munich until October 2014. Copying or posting is an infringement of
copyright. [email protected] or 617.783.7860.
12THE ART OF F INANCE
such as these, she can dramatically change the appearance of the income
statement. Product cost goes into cost of goods sold. If product costs go
up, gross profi t goes down—and gross profi t is a key measure for assessing
product profi tability. Development costs, however, go into R&D, which is
included in the operating expense section of the income statement and
doesn’t affect gross profi t at all.
So let’s say the accountant determined that all of your salary should go
into the development cost in June, rather than the product cost in July. Her
assumption is that your work wasn’t directly related to the manufacturing
of the product and therefore shouldn’t be categorized as product cost. But
there’s a twofold bias that results:
• First, development costs are larger than they otherwise would be. An
executive who analyzes those costs later on may decide that product
development is too expensive and that the company shouldn’t take
that risk again. If that’s what happens, the company might do less
product development, thereby jeopardizing its future.
• Second, the product cost is smaller than it otherwise would be. That,
in turn, will affect key decisions such as pricing and hiring. Maybe the
product will be priced too low. Maybe more people will be hired to
put out what looks like a profi table product—even though the profi t
refl ects some dubious assumptions.
Of course, any individual’s salary won’t make much of a difference in
most companies. But the assumptions that govern one person are likely to
be applied across the board. To paraphrase a familiar saying in Washing-
ton, DC, a salary here and a salary there and pretty soon you’re talking real
money. At any rate, this case is simple enough that you can easily see the
Allocations
Allocations are apportionments of costs to different departments or activities within a company. For instance, overhead costs such as the CEO’s salary are often allocated to the company’s operating units.
H6061.indb 12H6061.indb 12 11/21/12 8:25:27 AM11/21/12 8:25:27 AM
Do
Not
Cop
y or
Pos
t
This document is authorized for use only by Liudmyla Feurstein at EBCM - European University of Munich until October 2014. Copying or posting is an infringement of
copyright. [email protected] or 617.783.7860.
13Spotting Assumptions, Estimates, and Biases
answers to the questions we posed earlier. The assumptions in the num-
bers? Your time was spent in development and didn’t really have much to
do with the production of the product that was sold in July. The estimates?
How your salary should be split, if at all, between development and prod-
uct cost. The bias? Higher development costs and lower product costs. And
the implications? Concern about the high cost of development; product
pricing that may be too low.
Whoever said there is no poignancy or subtlety in fi nance? The accoun-
tant and fi nance professional labor to give the most accurate picture pos-
sible of the company’s performance. All the while they know that they will
never, ever capture the exact numbers.
DISCRETION ABOUT DEPRECIATION
A second example is the use of depreciation. The notion of depreciation
isn’t complicated. Say a company buys some expensive machinery or ve-
hicles that it expects to use for several years. Accountants think about such
an event like this: rather than subtract the entire cost from one month’s
revenues—perhaps plunging the company or business unit into the red
for that month—we should spread the cost out over the equipment’s use-
ful life. If we think a machine will last three years, for instance, we can
record (“depreciate”) one-third of the cost per year, or one-thirty-sixth
per month, using a simple method of depreciation. That’s a better way of
estimating the company’s true costs in any given month or year than if we
Depreciation
Depreciation is the method accountants use to allocate the cost of equipment and other assets to the total cost of products and services as shown on the income statement. It is based on the same idea as accruals: we want to match as closely as possible the costs of our products and services with what was sold. Most capital investments other than land are depreciated. Accountants attempt to spread the cost of the expenditure over the useful life of the item. There’s more about depreciation in parts 2 and 3.
H6061.indb 13H6061.indb 13 11/21/12 8:25:27 AM11/21/12 8:25:27 AM
Do
Not
Cop
y or
Pos
t
This document is authorized for use only by Liudmyla Feurstein at EBCM - European University of Munich until October 2014. Copying or posting is an infringement of
copyright. [email protected] or 617.783.7860.
14THE ART OF F INANCE
recorded it all at once. Furthermore, it better matches the expenses of the
equipment to the revenue that it is used to generate—an important idea
that we will explore at length in chapter 5.
The theory makes perfect sense. In practice, however, accountants have
a good deal of discretion as to exactly how a piece of equipment is depreci-
ated. And that discretion can have a considerable impact. Take the airline
industry. Some years back, airlines realized that their planes were lasting
longer than anticipated. So the industry’s accountants changed their de-
preciation schedules to refl ect that longer life. As a result, they subtracted
less depreciation from revenue each month. And guess what? The indus-
try’s profi ts rose signifi cantly, refl ecting the fact that the airlines wouldn’t
have to be buying planes as soon as they had thought. But note that the
accountants had to assume that they could predict how long a plane would
be useful. On that judgment—and a judgment it is—hung the resulting
upward bias in the profi t numbers. On that judgment, too, hung all the im-
plications: investors deciding to buy more stock, airline executives fi guring
they could afford to give out better raises, and so on.
THE MANY METHODS OF VALUATION
A fi nal example of the art of fi nance has to do with the valuation of a com-
pany—that is, fi guring out how much a company is worth. Publicly traded
companies, of course, are valued every day by the stock market. They are
worth whatever their stock price is times the number of shares outstand-
ing, a fi gure known as their market capitalization, or just market cap. But
even that doesn’t necessarily capture their value in certain circumstances. A
competitor bent on takeover, for instance, might decide to pay a premium
for the company’s shares, because the target company is worth more to that
competitor than it is on the open market. And of course, the millions of
companies that are privately held aren’t valued at all on the market. When
they are bought or sold, the buyers and sellers must rely on other methods
of valuation.
Talk about the art of fi nance: much of the art here lies in choosing the
valuation method. Different methods produce different results—which, of
course, means that each method injects a bias into the numbers.
H6061.indb 14H6061.indb 14 11/21/12 8:25:27 AM11/21/12 8:25:27 AM
Do
Not
Cop
y or
Pos
t
This document is authorized for use only by Liudmyla Feurstein at EBCM - European University of Munich until October 2014. Copying or posting is an infringement of
copyright. [email protected] or 617.783.7860.
15Spotting Assumptions, Estimates, and Biases
Suppose, for example, your company proposes to acquire a closely held
manufacturer of industrial valves. It’s a good fi t with your business—it’s a
“strategic” acquisition—but how much should your company pay? Well,
you could look at the valve company’s earnings (another word for prof-
its), then go to the public markets and see how the market values similar
companies in relation to their earnings. (This is known as the price-to-
earnings ratio method.) Or you could look at how much cash the valve
company generates each year, and fi gure that you are, in effect, buying that
stream of cash. Then you would use some interest rate to determine what
that stream of future cash is worth today. (This is the discounted cash fl ow
method.) Alternatively, you could simply look at the company’s assets—its
plant, equipment, inventory, and so on, along with intangibles such as its
reputation and customer list—and make estimates about what those assets
are worth (the asset valuation method).
Needless to say, each method entails a whole passel of assumptions and
estimates. The price-to-earnings method, for example, assumes that the
stock market is somehow rational and that the prices it sets are therefore
accurate. But of course the market isn’t wholly rational; if the market is
high, the value of your target company will be higher than when the mar-
ket is low. And besides, that “earnings” number, as we’ll see in part 2, is itself
an estimate. So maybe, you might think, we should use the discounted cash
fl ow method. The question with this method is, What is the right interest
or “discount” rate to use when we’re calculating the value of that stream of
cash? Depending on how we set it, the price could vary enormously. And
of course, the asset valuation method itself is merely a collection of guesses
as to what each asset might be worth.
As if these uncertainties weren’t enough, think back to that delight-
ful, outrageous, nervous-making period, known as the dot-com boom, at
the end of the twentieth century. Ambitious young Internet companies
were springing up all over, fed and watered by a torrent of enthusiastic
venture capital. But when investors such as venture capitalists (VCs) put
their money into something, they like to know what their investment—
and hence what the company—is worth. When a company is just starting
up, that’s tough to know. Earnings? Zero. Operating cash fl ow? Also zero.
Assets? Negligible. In ordinary times, that’s one reason VCs shy away from
H6061.indb 15H6061.indb 15 11/21/12 8:25:27 AM11/21/12 8:25:27 AM

Do
Not
Cop
y or
Pos
t
This document is authorized for use only by Liudmyla Feurstein at EBCM - European University of Munich until October 2014. Copying or posting is an infringement of
copyright. [email protected] or 617.783.7860.
16THE ART OF F INANCE
early-stage investments. But in the dot-com era, they were throwing cau-
tion to the winds and so were relying on what we can only call unusual
methods of valuation. They looked at the number of engineers on a com-
pany’s payroll. They counted the number of hits (“eyeballs”) a company
got every month on its website. One energetic young CEO of our acquain-
tance raised millions of dollars based almost entirely on the fact that he
had hired a large staff of software engineers. Unfortunately, we observed a
“For Lease” sign in front of this company’s offi ce less than a year later.
The dot-com methods of valuation look foolish now, even though back
then they didn’t seem so bad, given how little we knew about what the
future held. But the other methods described earlier are all reasonable.
Trouble is, each has a bias that leads to different results. And the impli-
cations are far-reaching. Companies are bought and sold on the basis of
these valuations. They get loans based on them. If you hold stock in your
company, the value of that stock is dependent on an appropriate valuation.
It seems reasonable to us that your fi nancial intelligence should include an
understanding of how those numbers are calculated.
H6061.indb 16H6061.indb 16 11/21/12 8:25:27 AM11/21/12 8:25:27 AM
Do
Not
Cop
y or
Pos
t
This document is authorized for use only by Liudmyla Feurstein at EBCM - European University of Munich until October 2014. Copying or posting is an infringement of
copyright. [email protected] or 617.783.7860.
3
Why Increase Your Financial Intelligence?
SO FAR OUR D ISCUSSION HAS BEEN PRETTY ABSTRACT. We have been intro-
ducing you to the art of fi nance and explaining why understanding
it is an essential ingredient of fi nancial intelligence. Now let’s revisit
the issue we posed in the preface: the benefi ts of fi nancial intelligence. With
a little art-of-fi nance discussion under your belt, you can understand in
greater depth what this book can teach you and what you will gain from
reading it.
For starters, we want to emphasize that this book is different from other
fi nance books. It doesn’t presuppose any fi nancial knowledge. But neither is
it another version of Accounting for Dummies. We will never mention debits
and credits. We won’t ever refer to the general ledger or trial balances. This
book is about fi nancial intelligence, or, as the subtitle says, knowing what
the numbers really mean. It’s written not for would-be accountants but for
people in organizations—leaders, managers, employees—who need to un-
derstand what is happening in their company from a fi nancial perspective
and who can use that information to work and manage more effectively. In
it, you’ll learn how to decipher the fi nancial statements, how to identify po-
tential biases in the numbers, and how to use the information in the state-
ments to do your job better. You’ll learn how to calculate ratios. You’ll learn
about return on investment (ROI) and working capital management, two
H6061.indb 17H6061.indb 17 11/21/12 8:25:27 AM11/21/12 8:25:27 AM
Do
Not
Cop
y or
Pos
t
This document is authorized for use only by Liudmyla Feurstein at EBCM - European University of Munich until October 2014. Copying or posting is an infringement of
copyright. [email protected] or 617.783.7860.
18THE ART OF F INANCE
concepts that you can use to improve your decision making and impact on
the organization. In short, you will boost your fi nancial intelligence.
If you boost your fi nancial intelligence, moreover, you will very likely
stand out from the crowd. Not long ago, we conducted a national study,
giving a twenty-one-question fi nance exam to a representative sample of
nonfi nancial managers in the United States. The questions were all based
on concepts that any company executive or junior fi nance person would
know. Unfortunately, the managers scored an average of only 38 percent—a
failing grade by any standard. To judge by their answers, a majority were
unable to distinguish profi t from cash. Many didn’t know the difference be-
tween an income statement and a balance sheet. About 70 percent couldn’t
pick the correct defi nition of free cash fl ow, now the measure of choice
for many Wall Street investors.1 By the time you fi nish this book, you will
know all that material, and a good deal more besides. That’s what we mean
by standing out from the crowd.
THE BENEFITS OF FINANCIAL INTELLIGENCE
But it isn’t just a matter of scoring well on a test; fi nancial intelligence
brings with it a host of practical benefi ts. Here’s a short list of the advan-
tages you’ll gain.
Increased Ability to Critically Evaluate Your Company
Do you really know if your employer has enough cash to make payroll?
Do you know how profi table the products or services you work on really
are? When it comes to capital-expenditure proposals, is the ROI analysis
based on solid data? Boost your fi nancial intelligence, and you’ll gain more
insight into questions like these. Or maybe you’ve had nightmares in which
you worked at AIG, Lehman Brothers, or maybe Washington Mutual.
Many of the people at those companies had no inkling of their precarious
situation.
Suppose, for instance, you worked at the big telecommunications com-
pany WorldCom (later known as MCI) during the late 1990s. WorldCom’s
strategy was to grow through acquisition. Trouble was, the company wasn’t
generating enough cash for the acquisitions it wanted to make. So it used
stock as its currency and paid for the companies it acquired partly with
H6061.indb 18H6061.indb 18 11/21/12 8:25:28 AM11/21/12 8:25:28 AM
Do
Not
Cop
y or
Pos
t
This document is authorized for use only by Liudmyla Feurstein at EBCM - European University of Munich until October 2014. Copying or posting is an infringement of
copyright. [email protected] or 617.783.7860.
19Why Increase Your Financial Intelligence?
WorldCom shares. That meant it absolutely had to keep its share price
high; otherwise, the acquisitions would be too expensive. And if you want
to keep your share price high, you’d better keep your profi ts high. More-
over, WorldCom paid for the acquisitions through borrowing. A company
doing a lot of borrowing also has to keep its profi ts up; otherwise, the banks
will stop lending it money. So on two fronts, WorldCom was under severe
pressure to report high profi ts.
That, of course, was the source of the fraud that was ultimately uncov-
ered. The company artifi cially boosted profi ts “with a variety of account-
ing tricks, including understating expenses and treating operating costs
as capital expenditures,” as Business Week summarized the Justice Depart-
ment’s indictment.2 When everybody learned that WorldCom was not as
profi table as it had claimed to be, the house of cards came tumbling down.
But even if there hadn’t been fraud, WorldCom’s ability to generate cash
was out of step with its growth-by-acquisitions strategy. It could live on
borrowing and stock for a while, but not forever.
Or look at Tyco International. For a while, Tyco was another big ac-
quirer of companies. In fact, it bought some six hundred companies in
just two years, or more than one every working day. With all those acquisi-
tions, the goodwill number on Tyco’s balance sheet grew to the point where
bankers began to get nervous. Bankers and investors don’t like to see too
much goodwill on a balance sheet; they prefer assets that you can touch
(and in a pinch, sell off). So when word spread that there might be some
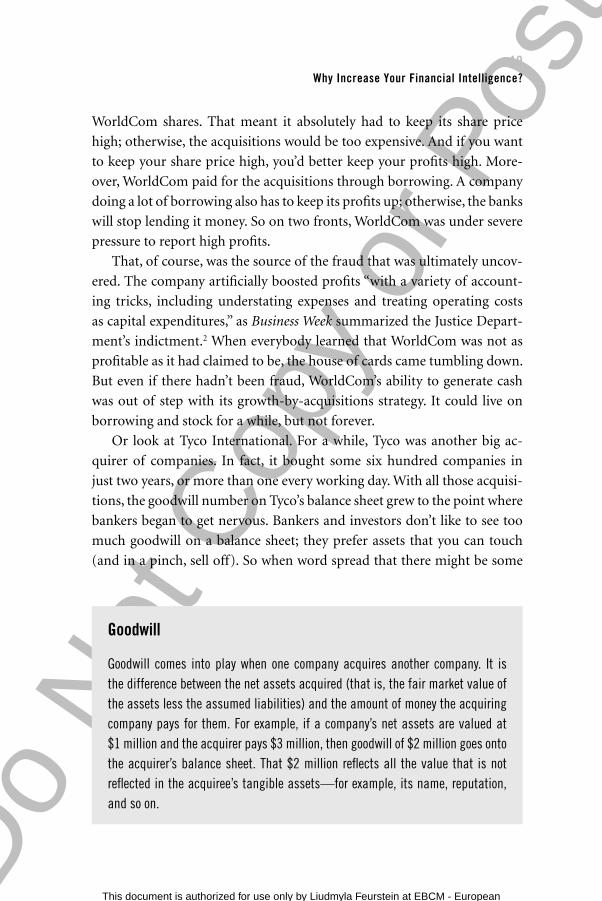
Goodwill
Goodwill comes into play when one company acquires another company. It is the difference between the net assets acquired (that is, the fair market value of the assets less the assumed liabilities) and the amount of money the acquiring company pays for them. For example, if a company’s net assets are valued at $1 million and the acquirer pays $3 million, then goodwill of $2 million goes onto the acquirer’s balance sheet. That $2 million refl ects all the value that is not refl ected in the acquiree’s tangible assets—for example, its name, reputation, and so on.
H6061.indb 19H6061.indb 19 11/21/12 8:25:28 AM11/21/12 8:25:28 AM
Do
Not
Cop
y or
Pos
t
This document is authorized for use only by Liudmyla Feurstein at EBCM - European University of Munich until October 2014. Copying or posting is an infringement of
copyright. [email protected] or 617.783.7860.
20THE ART OF F INANCE
accounting irregularities at Tyco, the bankers effectively shut the company
off from further acquisitions immediately. Today Tyco is focusing on or-
ganic growth and operational excellence rather than on acquisitions; its
fi nancial picture matches its strategy.
Now, we’re not arguing that every fi nancially intelligent manager would
have been able to spot AIG’s or Tyco’s precarious situation. Plenty of seem-
ingly savvy Wall Street types were fooled by the two companies. Still, a little
more knowledge will give you the tools to watch trends at your company
and understand more of the stories behind the numbers. While you might
not have all of the answers, you should know what questions to ask when
you don’t. It’s always worth your while to assess your company’s perfor-
mance and prospects. You’ll learn to gauge how it’s doing and to fi gure out
how you can best support those goals and be successful yourself.
Better Understanding of the Bias in the Numbers
We’ve already discussed the bias that is built into many numbers. But
so what? What will understanding the bias do for you? One very big
thing: it will give you the knowledge and the confi dence—the fi nancial
intelligence—to question the data provided by your fi nance and accounting
department. You will be able to identify the hard data, the assumptions, and
the estimates. You will know—and others will, too—when your decisions
and actions are on solid ground.
Let’s say you work in operations, and you are proposing the purchase of
some new equipment. Your boss says he’ll listen, but he wants you to justify
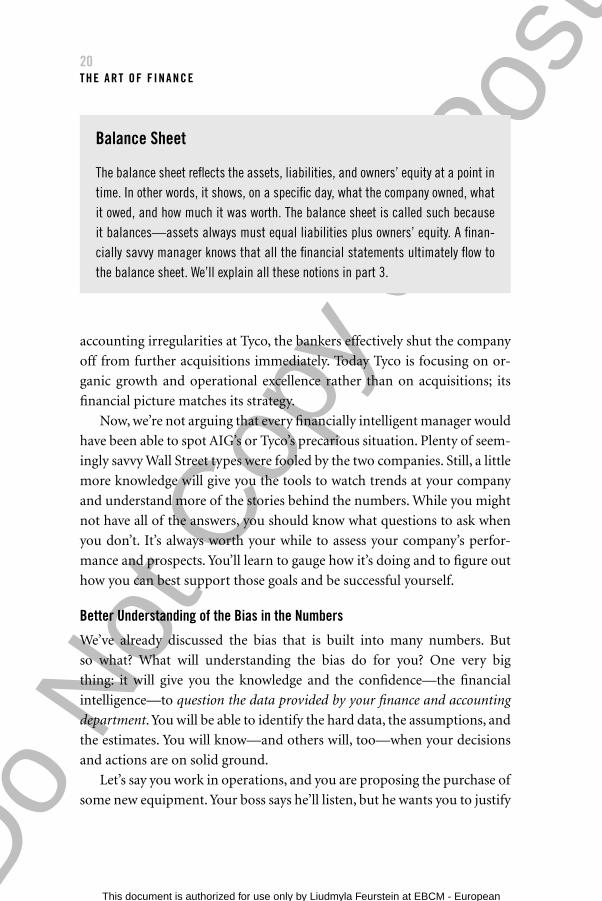
Balance Sheet
The balance sheet refl ects the assets, liabilities, and owners’ equity at a point in time. In other words, it shows, on a specifi c day, what the company owned, what it owed, and how much it was worth. The balance sheet is called such because it balances—assets always must equal liabilities plus owners’ equity. A fi nan-cially savvy manager knows that all the fi nancial statements ultimately fl ow to the balance sheet. We’ll explain all these notions in part 3.
H6061.indb 20H6061.indb 20 11/21/12 8:25:28 AM11/21/12 8:25:28 AM
Do
Not
Cop
y or
Pos
t
This document is authorized for use only by Liudmyla Feurstein at EBCM - European University of Munich until October 2014. Copying or posting is an infringement of
copyright. [email protected] or 617.783.7860.
21Why Increase Your Financial Intelligence?
the purchase. That means digging up data from fi nance, including cash
fl ow analysis for the machine, working capital requirements, and deprecia-
tion schedules. All these numbers—surprise!—are based on assumptions
and estimates. If you know what they are, you can examine them to see if
they make sense. If they don’t, you can change the assumptions, modify
the estimates, and put together an analysis that is realistic and that (hope-
fully) supports your proposal. Joe, for example, likes to tell audiences that
a fi nancially savvy engineer could easily come up with an analysis showing
how his company should buy him a $5,000 CAD/CAM machine, complete
with the latest software. The engineer would assume that he could save an
hour a day because of the new computer’s features and processing speed;
he would calculate the value of an hour per day of his time over a year;
and—presto!—he would show that buying the machine is a no-brainer. A
fi nancially intelligent boss, however, would take a look at those assump-
tions and posit some alternatives, such as that the engineer might actually
lose an hour a day of work while he played with all the cool features on the
new machine.
It’s amazing, in fact, how easily a fi nancially knowledgeable manager
can change the terms of discussion so that better decisions get made. When
he worked for Ford Motor Company, Joe had an experience that underlined
just that lesson. He and several other fi nance folks were presenting fi nan-
cial results to a senior marketing director. After they sat down, the direc-
tor looked straight at them and said, “Before I open these fi nance reports,
I need to know . . . for how long and at what temperature?” Joe and the
others had no idea what he was talking about. Then the light went on and
Joe replied, “Yes, sir, they were in for two hours at 350°.” The director said,
“OK, now that I know how long you cooked ’em, let’s begin.” He was telling
the fi nance people that he knew there were assumptions and estimates in
the numbers and that he was going to ask questions. When he asked in the
meeting how solid a given number was, the fi nancial people were comfort-
able explaining where the number came from and the assumptions, if any,
they had to make. The director could then take the numbers and use them
to make decisions he felt comfortable with.
Absent such knowledge, what happens? Simple: the people from ac-
counting and fi nance control the decisions. We use the word control
H6061.indb 21H6061.indb 21 11/21/12 8:25:28 AM11/21/12 8:25:28 AM
Do
Not
Cop
y or
Pos
t
This document is authorized for use only by Liudmyla Feurstein at EBCM - European University of Munich until October 2014. Copying or posting is an infringement of
copyright. [email protected] or 617.783.7860.
22THE ART OF F INANCE
because when decisions are based on numbers, and when the numbers are
based on accountants’ assumptions and estimates, then the accountants
and fi nance folks have effective control (even if they aren’t trying to control
anything). That’s why you need to know what questions to ask.
The Ability to Use Numbers and Financial Tools to Make and Analyze Decisions
What is the ROI of that project? Why can’t we spend money when our
company is profi table? Why do I have to focus on accounts receivable when
I am not in the accounting department? You ask yourself these and other
questions every day (or someone else asks them—and assumes you know
the answers!). You are expected to use fi nancial knowledge to make deci-
sions, to direct your subordinates, and to plan the future of your depart-
ment or company. We will show you how to do this, give you examples, and
discuss what to do with the results. In the process, we’ll try to use as little
fi nancial jargon as possible.
For example, let’s look at why the fi nance department might tell you
not to spend any money, even though the company is profi table.
We’ll start with the basic fact that cash and profi t are different. In chap-
ter 16 we’ll explain why, but right now let’s just focus on the basics. Profi t
is based on revenue. Revenue, remember, is recognized when a product or
service is delivered, not when the bill is paid. So the top line of the income
statement, the line from which we subtract expenses to determine profi t, is
often no more than a promise. Customers have not paid yet, so the revenue
number does not refl ect real money and neither does the profi t line at the
bottom. If everything goes well, the company will eventually collect its re-
ceivables and will have cash corresponding to that profi t. In the meantime,
it doesn’t.
Now suppose you’re working for a fast-growing business services com-
pany. The company is selling a lot of services at a good price, so its revenues
and profi ts are high. It is hiring people as fast as it can, and of course it has
to pay them as soon as they come on board. But all the profi t that these
people are earning won’t turn into cash until thirty days or maybe sixty
days after it is billed out! That’s one reason why even the CFO of a highly
profi table company may sometimes say, don’t spend any money right now
because cash is tight.
H6061.indb 22H6061.indb 22 11/21/12 8:25:28 AM11/21/12 8:25:28 AM
Do
Not
Cop
y or
Pos
t
This document is authorized for use only by Liudmyla Feurstein at EBCM - European University of Munich until October 2014. Copying or posting is an infringement of
copyright. [email protected] or 617.783.7860.
23Why Increase Your Financial Intelligence?
Although this book focuses on increasing your fi nancial intelligence in
business, you can also apply what you’ll learn in your personal life. Con-
sider your decisions to purchase a house, a car, or a boat. The knowledge
you’ll gain can apply to those decisions as well. Or consider how you plan
for the future and decide how to invest. This book is not about investing,
but it is about understanding company fi nancials, which will help you ana-
lyze possible investment opportunities.
HOW IT BENEFITS A COMPANY
Our day job is teaching fi nancial literacy, thereby (we hope) increasing the
fi nancial intelligence of the leaders, managers, and employees who are our
students. So naturally, we think it’s an important subject for our students
to learn. But what we have also seen in our work is how increasing fi nancial
intelligence benefi ts companies. Again, here is a short list of advantages.
Strength and Balance Throughout the Organization
Do the fi nance folks dominate decisions? They shouldn’t. The strength of
their department should be balanced by the strength of operations, of mar-
keting, of human resources, of customer service, of information technol-
ogy, and so on. If managers in those other departments are not fi nancially
savvy, if they don’t understand how fi nancial results are measured and how
to use those results to critically evaluate the company, then accounting and
fi nance necessarily have the upper hand. The bias they inject into the num-
bers affects and can even determine decision making.
Cash
Cash as presented on the balance sheet means the money a company has in the bank, plus anything else (like stocks and bonds) that can readily be turned into cash. Really, it’s that simple. Later we’ll discuss measures of cash fl ow. For now, just know that when companies talk about cash, it really is the cold, hard stuff.
H6061.indb 23H6061.indb 23 11/21/12 8:25:28 AM11/21/12 8:25:28 AM
Do
Not
Cop
y or
Pos
t
This document is authorized for use only by Liudmyla Feurstein at EBCM - European University of Munich until October 2014. Copying or posting is an infringement of
copyright. [email protected] or 617.783.7860.
24THE ART OF F INANCE
Better Decisions
Managers routinely incorporate what they know about the marketplace,
the competition, the customers, and so on into their decisions. When they
also incorporate fi nancial analysis, their decisions are better. We are not
big believers in making decisions solely on the basis of the numbers. But
we do think that ignoring what the numbers tell you is pretty silly. Good
fi nancial analysis gives managers a window into the future and helps them
make smarter, more informed choices.
Greater Alignment
Imagine the power in your organization if everyone understood the fi nan-
cial side of the business. Everyone might actually work in alignment with
the strategy and goals. Everyone might work as a team to achieve healthy
profi tability and cash fl ow. Everyone might communicate in the language
of business instead of jockeying for position through offi ce politics. Wow.
ROADBLOCKS TO FINANCIAL SAVVY
We have worked with enough people and companies to know that while the
results everyone wants might be great, they aren’t so easy to attain. In fact,
we run into several predictable obstacles, both personal and organizational.
One obstacle might be that you hate math, fear math, and don’t want
to do math. Well, join the club. It might surprise you to know that, for the
most part, fi nance involves addition and subtraction. When fi nance people
get really fancy, they multiply and divide. We never have to take the second
derivative of a function or determine the area under a curve (sorry, engi-
neers). So have no fear: the math is easy. And calculators are cheap. You
don’t need to be a rocket scientist to be fi nancially intelligent.
A second possible obstacle: the accounting and fi nance departments
hold on tightly to all the information. Are your fi nance folks stuck in the
old approach to their fi eld—keepers and controllers of the numbers, re-
luctant participants in the communication process? Are they focused on
control and compliance? If so, that means you may have a diffi cult time
getting access to data. But you can still use what you learn to talk about the
numbers at your management meetings. You can use the tools to help you
H6061.indb 24H6061.indb 24 11/21/12 8:25:28 AM11/21/12 8:25:28 AM

Do
Not
Cop
y or
Pos
t
This document is authorized for use only by Liudmyla Feurstein at EBCM - European University of Munich until October 2014. Copying or posting is an infringement of
copyright. [email protected] or 617.783.7860.
25Why Increase Your Financial Intelligence?
make a decision, or to ask questions about the assumptions and estimates
in the numbers. In fact, you’ll probably surprise and maybe delight your
accountants and fi nance people. We love to see it when it happens.
A third possibility is that your boss doesn’t want you to question the
numbers. If that’s the case, he himself may not be comfortable with fi -
nancials. He probably doesn’t know about the assumptions, estimates, and
resulting bias. Your boss is a victim of the numbers! Our advice is to keep
going; eventually, bosses usually see the benefi t to themselves, their depart-
ments, and their companies. You can help them along. The more people
who do so, the more fi nancially intelligent the entire organization will be.
You can also begin to take some risks. Your fi nancial knowledge will give
you newfound power, and you can ask some probing questions.
A fourth possibility: you don’t have time. Just give us the time it takes
you to read this book. If you fl y for business, take it with you on a trip or
two. In just a few hours, you will become a lot more knowledgeable about
fi nance than you have ever been in the past. Alternatively, keep it someplace
handy. The chapters are deliberately short, and you can read one whenever
you have a few spare moments. Incidentally, we’ve included some stories
about the fancy fi nancial shenanigans pulled by some of the corporate vil-
lains in the 1990s and 2000s just to make it a little more entertaining—and
to show you how slippery some of these slopes can be. We don’t mean to
imply that every company is like them; on the contrary, most are doing
their best to present a fair and honest picture of their performance. But it’s
always fun to read about the bad guys.
So don’t let these obstacles get in your way. Read the book, and learn
what you can about your own company. Soon you will have a healthy ap-
preciation of the art of fi nance, and you will increase your fi nancial intel-
ligence. You won’t magically acquire an MBA in fi nance, but you will be an
appreciative consumer of the numbers, someone who’s capable of under-
standing and assessing what the fi nancial folks are showing you and asking
them appropriate questions. The numbers will no longer scare you. It won’t
take long, it’s relatively painless, and it will mean a lot to your career.
H6061.indb 25H6061.indb 25 11/21/12 8:25:28 AM11/21/12 8:25:28 AM
Do
Not
Cop
y or
Pos
t
This document is authorized for use only by Liudmyla Feurstein at EBCM - European University of Munich until October 2014. Copying or posting is an infringement of
copyright. [email protected] or 617.783.7860.
4
The Rules Accountants Follow—and Why You Don’t
Always Have To
WE DON’T PLAN TO INCLUDE more than a smattering of accounting pro-
cedures in this book. But we do think it’s a good idea to have a
broad grasp of the rules accountants are supposed to follow. That
will help you understand why they choose to rely on certain estimates and
assumptions and not others. Besides, some companies prepare fi nancials
for their own use that do not follow these rules—and those documents can
be valuable, too.
So let’s begin at the beginning. Accountants in the United States rely on
a set of guidelines known as Generally Accepted Accounting Principles, or
GAAP (pronounced gap) for short. GAAP includes all the rules, standards,
and procedures that companies use when preparing their fi nancial state-
ments. GAAP rules are established and administered by the Financial Ac-
counting Standards Board, or FASB (pronounced fasby) and the American
Institute of Certifi ed Public Accountants (AICPA, pronounced A-I-C-P-A).
The Securities and Exchange Commission requires publicly traded compa-
nies to adhere to GAAP standards. Most privately held companies, non-
profi ts, and governments also use GAAP. Strictly speaking, we should use
H6061.indb 26H6061.indb 26 11/21/12 8:25:28 AM11/21/12 8:25:28 AM
Do
Not
Cop
y or
Pos
t
This document is authorized for use only by Liudmyla Feurstein at EBCM - European University of Munich until October 2014. Copying or posting is an infringement of
copyright. [email protected] or 617.783.7860.
27The Rules Accountants Follow
the phrase US GAAP, because these rules apply only to American compa-
nies. (We’ll have more to say in a moment on international standards.)
If you were to lay out all the GAAP pronouncements on paper, page by
page, some people estimate they would run to more than 100,000 pages.
Accountants who use GAAP to prepare fi nancial statements typically are
experts in one area of the rules, such as depreciation. We haven’t yet met
anyone who has read and is an expert on the entire code.
RULES THAT AREN’T REALLY RULES
The purpose of GAAP is to make fi nancial information useful to investors,
creditors, and others who make decisions based on a company’s fi nancial
reporting. GAAP reporting is also supposed to provide helpful informa-
tion to company executives and managers—information that will lead to
improving the business’s performance and will be useful in maintaining
company records.
But GAAP rules are not what most people might think of as “rules.”
They don’t take the form of imperatives, such as “Count this expense ex-
actly this way” or “Count this revenue exactly that way.” They are guide-
lines and principles, and so are open to interpretation and judgment calls.
A company’s accountants must fi gure out how a given principle applies to
their business. This is a big part of the art of fi nance. Remember, the ac-
countants and fi nance professionals are attempting to create a picture of
reality through the numbers. It will never be exact or perfect, but it does
need to be tailored to their own individual situation. GAAP allows that.
If you look at the footnotes of public company’s fi nancials, you’ll often
see that some of the notes explain how the company’s accountants inter-
preted GAAP guidelines. For example, one of the footnotes on Ford’s 2010
fi nancials reads as follows:
We are required by US GAAP to aggregate the assets and liabilities of all
held-for-sale disposal groups on the balance sheet for the period in which
the disposal group is held for sale. To provide comparative balance sheets,
we also aggregate the assets and liabilities for signifi cant held-for-sale dis-
posal groups on the prior-period balance sheet.
H6061.indb 27H6061.indb 27 11/21/12 8:25:28 AM11/21/12 8:25:28 AM
Do
Not
Cop
y or
Pos
t
This document is authorized for use only by Liudmyla Feurstein at EBCM - European University of Munich until October 2014. Copying or posting is an infringement of
copyright. [email protected] or 617.783.7860.
28THE ART OF F INANCE
Wow. How’s that for fi nancial jargon? But at least the accountants are
explaining their GAAP-related practices in terms other fi nancial profes-
sionals can understand.
Sometimes it happens that the accountants have to restate their fi nan-
cials. Maybe they identifi ed new information, or perhaps they discovered
an error. Maybe the GAAP rules changed. Apple, for example, restated its
2009 results, as announced in a press release on January 5, 2010:
*Retrospective Adoption of Amended Accounting Standards
The new accounting principles result in the Company’s recognition of
substantially all of the revenue and product cost for iPhone and Apple
TV when those products are delivered to customers. Under historical ac-
counting principles, the Company was required to account for sales of
both iPhone and Apple TV using subscription accounting because the
Company indicated it might from time to time provide future unspecifi ed
software upgrades and features for those products free of charge. Under
subscription accounting, revenue and associated product cost of sales for
iPhone and Apple TV were deferred at the time of sale and recognized
on a straight-line basis over each product’s estimated economic life. This
resulted in the deferral of signifi cant amounts of revenue and cost of sales
related to iPhone and Apple TV.
Because Apple began selling both iPhone and Apple TV in fi scal 2007,
the Company retrospectively adopted the new accounting principles as if
the new accounting principles had been applied in all prior periods . . .
Again, this is more than any nonfi nancial person probably wants to
know. But if you’re an investor trying to assess Apple’s performance from
year to year, you need to understand exactly why and how the company
restated its fi nancials. Otherwise you’re comparing pears to peaches.
WHY GAAP MATTERS
A common set of accounting rules provides several benefi ts. It gives inves-
tors and others a reliable way to compare fi nancial results between compa-
nies, between industries, and from one year to another. If every company
H6061.indb 28H6061.indb 28 11/21/12 8:25:29 AM11/21/12 8:25:29 AM
Do
Not
Cop
y or
Pos
t
This document is authorized for use only by Liudmyla Feurstein at EBCM - European University of Munich until October 2014. Copying or posting is an infringement of
copyright. [email protected] or 617.783.7860.
29The Rules Accountants Follow
assembled its fi nancials differently, using whatever rules it felt were ap-
propriate, the results would be like the United Nations without transla-
tors. Nobody could understand anybody else, and nobody could compare
Ford with GM or Microsoft with Apple. You wouldn’t know, for example, if
the companies counted sales and costs the same way, and you could never
really know which was more profi table.
GAAP also attempts to ensure that everything is on the up-and-up. To
be sure, people are always fi guring out ways to get around the rules. And
Warren Buffett, the legendary investor, is famous for the warnings he has
issued, such as this classic one from his 1988 letter to his shareholders:
There are managers who actively use GAAP to deceive and defraud. They
know that many investors and creditors accept GAAP results as gospel.
So these charlatans interpret the rules “imaginatively” and record busi-
ness transactions in ways that technically comply with GAAP but actually
display an economic illusion to the world. As long as investors—including
supposedly sophisticated institutions—place fancy valuations on reported
“earnings” that march steadily upward, you can be sure that some manag-
ers and promoters will exploit GAAP to produce such numbers, no mat-
ter what the truth may be. Over the years, [my partner] Charlie Munger
and I have observed many accounting-based frauds of staggering size.
Few of the perpetrators have been punished; many have not even been
[c]ensured. It has been far safer to steal large sums with a pen than small
sums with a gun.
Despite such malfeasance, GAAP provides a touchstone, a body of
guidelines that most companies, if not all, follow closely. FASB and the
AICPA continually revise and update the rules to refl ect new issues and
concerns, so GAAP is a living entity that evolves with the times.
THE KEY PRINCIPLES
There are several principles that form the foundation of GAAP and GAAP-
based fi nancial statements. Knowing these principles will help you under-
stand what can and cannot be found in the fi nancials.
H6061.indb 29H6061.indb 29 11/21/12 8:25:29 AM11/21/12 8:25:29 AM
Do
Not
Cop
y or
Pos
t
This document is authorized for use only by Liudmyla Feurstein at EBCM - European University of Munich until October 2014. Copying or posting is an infringement of
copyright. [email protected] or 617.783.7860.
30THE ART OF F INANCE
Monetary Units and Historical Cost
This principle states that all items in fi nancial statements are expressed
in monetary units, such as dollars, euros, or whatever. It also says that the
price a company paid for an asset, which accountants call historical cost,
is the basis for determining its value. (Assets are what a company owns.)
We’re getting into some art-of-fi nance issues here. For example, a building
may be worth far more today than when it was built, yet its valuation on
the books will be what it originally cost the company. However, companies
do not typically value fi nancial assets such as stocks and bonds at historical
cost. The accountants are required to value fi nancial assets at their current
market value. This is known as mark-to-market accounting, and we discuss
it in the toolbox following part 3.
You can see why the footnotes to the fi nancial statements often come
in handy. The footnotes tell you how assets are valued, and you may be
able to see whether the company’s assets might be worth more or less than
indicated on the fi nancials.
Conservatism
GAAP requires accountants to be conservative. No, we don’t mean in their
politics or their lifestyle, only in their accounting—although maybe that
explains why the stereotypical accountant is conservative in other areas of
life. Conservatism in accounting means, for example, that when a company
expects a loss, the loss must show up in the fi nancial statements as soon as
it can be quantifi ed—that is, as soon as the amounts involved are known.
Accountants call this recognizing a loss.
It’s the opposite with gains. When a company expects a gain, the ac-
countants can’t record it until they know for sure that the gain actually
happened. Let’s imagine, for instance, that a company makes a sale. Can
the accountants put it in the books? Only, says GAAP, if they are satisfi ed
that at least four conditions hold:
• There is persuasive evidence that an arrangement exists. This just
means the company is confi dent that a sale really did happen.
• Delivery has occurred or services have been rendered. What was sold is
somehow delivered to the customer.
H6061.indb 30H6061.indb 30 11/21/12 8:25:29 AM11/21/12 8:25:29 AM
Do
Not
Cop
y or
Pos
t
This document is authorized for use only by Liudmyla Feurstein at EBCM - European University of Munich until October 2014. Copying or posting is an infringement of
copyright. [email protected] or 617.783.7860.
31The Rules Accountants Follow
• The seller’s price to the buyer is fi xed or determinable. The price must
be known.
• Collectability is reasonably assured. You can’t count it as a sale if you
don’t think you can collect.
In most cases, of course, all these conditions are easily met. Accoun-
tants have to make judgment calls only on the margins.
Consistency
GAAP offers guidelines rather than rules, so companies can make choices
about the accounting methods and assumptions they use. Once a company
selects a particular method or assumption, however, it should continue to
use that method or assumption unless something in the business warrants
a change. In other words, you can’t alter your methods or assumptions
every year without good reason. If the accountants decided on different
assumptions every year, nobody could compare results year to year, and
you as a manager wouldn’t know what the numbers were really telling
you. Then, too, companies might change methods and assumptions just to
make the numbers look better each year.
Full Disclosure
Full disclosure relates to the previous guideline, consistency. If a company
changes an accounting method or assumption and the change has a mate-
rial impact (more on “material” in a minute), then it must disclose both
the change and the fi nancial effects of that change. You can see the logic.
Those of us reading the reports need to know about changes and their
impact to fully understand what the numbers mean. Companies take this
requirement seriously. In the example below, Ford disclosed a change in its
2010 fi nancials even though it did not have a material impact—an appro-
priately conservative approach.
Transfers of Financial Assets. During the fi rst quarter of 2010, we adopted
the new accounting standard related to transfers of fi nancial assets. The
standard requires greater transparency about transfers of fi nancial assets
and a company’s continuing involvement in the transferred fi nancial as-
sets. The standard also removes the concept of a qualifying special-purpose
H6061.indb 31H6061.indb 31 11/21/12 8:25:29 AM11/21/12 8:25:29 AM
Do
Not
Cop
y or
Pos
t
This document is authorized for use only by Liudmyla Feurstein at EBCM - European University of Munich until October 2014. Copying or posting is an infringement of
copyright. [email protected] or 617.783.7860.
32THE ART OF F INANCE
entity from US GAAP and changes the requirements for derecognizing
fi nancial assets. The new accounting standard did not have a material
impact on our fi nancial condition, results of operations, or fi nancial state-
ment disclosures.
Materiality
Material in accountant-speak means something signifi cant—something
that would affect the judgment of an informed investor about the com-
pany’s fi nancial situation. Every material event or piece of information
must be disclosed, typically in the footnotes of fi nancial statements. For ex-
ample, Apple’s fi nancials for fi scal year 2011 include the following caveat:
As of September 24, 2011, the end of the annual period covered by this
report, the Company was subject to the various legal proceedings and
claims discussed below, as well as certain other legal proceedings
and claims that have not been fully resolved and that have arisen in
the ordinary course of business. In the opinion of management, there
was not at least a reasonable possibility the Company may have incurred
a material loss, or a material loss in excess of a recorded accrual, with
respect to loss contingencies. However, the outcome of legal proceedings
and claims brought against the Company are subject to signifi cant un-
certainty. Therefore, although management considers the likelihood of
such an outcome to be remote, if one or more of these legal matters were
resolved against the Company in the same reporting period for amounts
in excess of management’s expectations, the Company’s consolidated fi -
nancial statements of a particular reporting period could be materially
adversely affected.
In other words, we don’t expect any losses from lawsuits, but we might
be wrong.
These fi ve principles aren’t the only ones in GAAP, but in our view they
are among the most important.
INTERNATIONAL STANDARDS
The rest of the world—more than one hundred countries—uses standards
that are different from GAAP. They are called International Financial Re-
H6061.indb 32H6061.indb 32 11/21/12 8:25:29 AM11/21/12 8:25:29 AM
Do
Not
Cop
y or
Pos
t
This document is authorized for use only by Liudmyla Feurstein at EBCM - European University of Munich until October 2014. Copying or posting is an infringement of
copyright. [email protected] or 617.783.7860.
33The Rules Accountants Follow
porting Standards, or IFRS. Like GAAP, IFRS lays down guidelines and
rules that organizations follow when putting together their fi nancial state-
ments. The goal of IFRS is to make company comparisons from one coun-
try to another as easy as possible. The IFRS rules are generally somewhat
simpler than GAAP’s.
And as this book goes to press—guess what?—the United States may
join IFRS. The AICPA has recommended that it do so, and the SEC is
promising a decision soon. However, it is likely to be several years before
US companies are required to abide by IFRS rules. Meanwhile, companies
themselves disagree about the proposed changeover. For instance, in July
2011, a Wall Street Journal article reported a clash between big and small
companies. Larger companies, which often do business internationally,
generally want the IFRS implementation; smaller companies, often with
no business outside of the United States, don’t see any value.1 From our
perspective, moving to IFRS would mean that every fi nancial statement
used the same language, something we always think is a good thing.
NON-GAAP REPORTING
Remember we said at the beginning of this chapter that some companies
prepare not only their regular GAAP fi nancials but another set of state-
ments that do not follow GAAP rules? Well, it’s true. Many companies re-
port numbers that do not fall under the rules and guidelines of GAAP.
These are called—hold your breath—non-GAAP numbers. Companies
often use them for internal management purposes.
Does this mean that the companies are keeping the proverbial two
sets of books? Not really. They use non-GAAP numbers to understand
their business, without worrying about matters such as onetime events or
changes in GAAP guidelines that are irrelevant to running the company.
Many companies even report non-GAAP numbers (along with their GAAP
numbers) to Wall Street analysts and the public. They may believe that the
non-GAAP numbers more accurately portray the company’s performance,
or that certain non-GAAP numbers are important measures of perfor-
mance. Or they may just want to present the company’s fi nancial situation
without certain numbers that are irrelevant to the long-term prospects of
the business. In general, they present the non-GAAP results because they
H6061.indb 33H6061.indb 33 11/21/12 8:25:29 AM11/21/12 8:25:29 AM
Do
Not
Cop
y or
Pos
t
This document is authorized for use only by Liudmyla Feurstein at EBCM - European University of Munich until October 2014. Copying or posting is an infringement of
copyright. [email protected] or 617.783.7860.
34THE ART OF F INANCE
believe those numbers enhance outsiders’ understanding of the company’s
performance and facilitate year-to-year comparisons.
Here, for example, is what Starbucks had to say in its press release an-
nouncing its results for the third quarter of 2011:
• Consolidated operating margin was 13.7%, up 120 basis points over
prior-year period’s GAAP results and 40 basis points over prior-year
period’s non-GAAP results.
• US operating margin improved 300 basis points to 18.8% on a GAAP
basis and 210 basis points over the prior-year period’s non-GAAP
results.
• International operating margin improved 200 basis points to 12.2%
on a GAAP basis and 140 basis points over the prior-year period’s
non-GAAP results.
A “basis point,” incidentally, is one one-hundredth of a percentage
point. So 100 basis points equals 1 percent. As for operating margin, you’ll
learn about it later in chapter 21; for now, understand that it is a measure
of profi t. So Starbucks is reporting profi t in both GAAP and non-GAAP
terms.
Later in the press release, Starbucks explains how it calculated its non-
GAAP numbers:
The non-GAAP fi nancial measures provided in this release exclude
2010 restructuring charges, primarily related to previously announced
company-operated store closures. The company’s management believes
that providing these non-GAAP fi nancial measures better enables inves-
tors to understand and evaluate the company’s historical and prospec-
tive operating performance. More specifi cally, for historical non-GAAP
fi nancial measures, management excludes restructuring charges because
it believes that these costs do not refl ect expected future operating expenses
and do not contribute to a meaningful evaluation of the company’s future
operating performance or comparisons to the company’s past operating
performance.
Ironically, GAAP rules have a requirement that governs the reporting
of non-GAAP numbers. Companies usually show how they got, mathe-
H6061.indb 34H6061.indb 34 11/21/12 8:25:29 AM11/21/12 8:25:29 AM

Do
Not
Cop
y or
Pos
t
This document is authorized for use only by Liudmyla Feurstein at EBCM - European University of Munich until October 2014. Copying or posting is an infringement of
copyright. [email protected] or 617.783.7860.
35The Rules Accountants Follow
matically, from the GAAP number to the non-GAAP number. This is often
called a bridge statement. We aren’t going to get into that here—too many
details!—but feel free to look into companies’ fi nancial statement notes or
supplemental documents if you’re interested.
OK, enough on GAAP. Now let’s plunge into the nitty-gritty of fi nan-
cial intelligence, beginning with the three fi nancial statements.
H6061.indb 35H6061.indb 35 11/21/12 8:25:29 AM11/21/12 8:25:29 AM
Do
Not
Cop
y or
Pos
t
This document is authorized for use only by Liudmyla Feurstein at EBCM - European University of Munich until October 2014. Copying or posting is an infringement of
copyright. [email protected] or 617.783.7860.
Part OneToolbox
GETTING WHAT YOU WANT
Imagine the shock on your boss’s face if you made a case for a raise—and
part of your case included a detailed analysis of the company’s fi nancial
picture, showing exactly how your unit has contributed.
Far-fetched? Not really. Once you read this book, you’ll know how to
gather and interpret data such as the following:
• The company’s revenue growth, profi t growth, and margin improvements
over the past year. If the business is doing well, senior managers may
be thinking about new plans and opportunities. They’ll need experi-
enced people—like you.
• The company’s remaining fi nancial challenges. Could inventory turns
be improved? What about gross margins or receivable days? If you can
suggest specifi c ways to better the business’s fi nancial performance,
both you and your boss will look smart.
• Your company’s cash fl ow position. Maybe you’ll be able to show that
your company has lots of free cash fl ow for raises for its hardworking
employees.
The same goes for when you apply for that next job. The experts always
tell job seekers to ask questions of the interviewer—and if you ask fi nancial
questions, you’ll show that you understand the fi nancial side of the busi-
ness. Try questions like these:
H6061.indb 36H6061.indb 36 11/21/12 8:25:29 AM11/21/12 8:25:29 AM
Do
Not
Cop
y or
Pos
t
This document is authorized for use only by Liudmyla Feurstein at EBCM - European University of Munich until October 2014. Copying or posting is an infringement of
copyright. [email protected] or 617.783.7860.
37Part One Toolbox
• Is the company profi table?
• Does it have positive equity?
• Does it have a current ratio that can support payroll?
• Are revenues growing or declining?
If you don’t know how to assess all these, read the rest of this book—you’ll
learn.
THE PLAYERS AND WHAT THEY DO
Who’s really in charge of fi nance and accounting? Titles and responsibili-
ties differ from one company to another, but here’s an overview of who
usually does what in the upper echelons of these departments:
• Chief fi nancial offi cer (CFO). The CFO is involved in the manage-
ment and strategy of the organization from a fi nancial perspective.
He or she oversees all fi nancial functions; the company controller and
treasurer report to the CFO. The CFO is usually part of the executive
committee and often sits on the board of directors. For fi nancial mat-
ters, the buck stops here.
• Treasurer. The treasurer focuses outside the company as well as inside.
He or she is responsible for building and maintaining banking rela-
tionships, managing cash fl ow, forecasting, and making equity and
capital-structure decisions. The treasurer is also responsible for inves-
tor relations and stock-based equity decisions. Some would say that
the ideal treasurer is a fi nance professional with a personality.
• Controller. The focus of the controller—sometimes spelled
comptroller—is purely internal. His or her job is providing reliable and
accurate fi nancial reports. The controller is responsible for general ac-
counting, fi nancial reporting, business analysis, fi nancial planning, as-
set management, and internal controls. He or she ensures that day-to-
day transactions are recorded accurately and correctly. Without good,
consistent data from the controller, the CFO and the treasurer can’t
H6061.indb 37H6061.indb 37 11/21/12 8:25:29 AM11/21/12 8:25:29 AM
Do
Not
Cop
y or
Pos
t
This document is authorized for use only by Liudmyla Feurstein at EBCM - European University of Munich until October 2014. Copying or posting is an infringement of
copyright. [email protected] or 617.783.7860.
38THE ART OF F INANCE
do their jobs. The controller is sometimes called a bean counter. It’s
wise to use this term correctly; some CFOs and treasurers get annoyed
when it is used to describe them, as they do not consider themselves
bean counters but fi nancial professionals.
REPORTING OBLIGATIONS OF PUBLIC COMPANIES
Publicly traded companies—companies whose stocks anyone can buy on
an exchange—must ordinarily fi le a number of reports with a government
agency. In the United States, that agency is the Securities and Exchange
Commission (SEC). Of the forms required by the SEC, the most com-
monly known and utilized is the annual report, known as Form 10-K or
just a 10-K. This is not the same thing as the glossy brochure many compa-
nies distribute to their shareholders, which is also called an annual report.
The glossy version usually features a letter from the CEO and chairman; it
may also include promotional information about the company’s products
and services, pie charts and colored graphs, and other marketing-related
content. The SEC version—the 10-K—is usually drab black and white,
with pages upon pages of text and data, all required by SEC regulations.
It includes items such as company history, executive compensation, risks
in the business, legal proceedings, management discussion of the business,
fi nancial statements (prepared according to GAAP, as described in chap-
ter 4), notes to the fi nancial statements, and fi nancial controls and proce-
dures. You can learn a lot from it.
Public companies also must fi le a report known as a 10-Q every three
months. The 10-Q is much shorter than the 10-K; most of it is devoted to
reporting a company’s fi nancial results for the most recent quarter. Com-
panies produce only three 10-Qs because they include the fi nal quarter in
their 10-Ks.
Note that quarter ends and year ends do not have to correspond to the
calendar. The end of a company’s fi scal year can be any date that the com-
pany establishes, and the quarters are calculated from that. For example, if
a company’s year end is January 31, then its quarters are February through
April, May through July, August through October, and November through
January.
H6061.indb 38H6061.indb 38 11/21/12 8:25:29 AM11/21/12 8:25:29 AM

Do
Not
Cop
y or
Pos
t
This document is authorized for use only by Liudmyla Feurstein at EBCM - European University of Munich until October 2014. Copying or posting is an infringement of
copyright. [email protected] or 617.783.7860.
39Part One Toolbox
You can fi nd 10-Ks, 10-Qs, and other forms that are required SEC fi l-
ings on the websites of individual companies and on the SEC’s website.
The latter uses a database called EDGAR and contains a tutorial on how
to use it.
H6061.indb 39H6061.indb 39 11/21/12 8:25:29 AM11/21/12 8:25:29 AM

Do
Not
Cop
y or
Pos
t
This document is authorized for use only by Liudmyla Feurstein at EBCM - European University of Munich until October 2014. Copying or posting is an infringement of
copyright. [email protected] or 617.783.7860.H6061.indb 40H6061.indb 40 11/21/12 8:25:29 AM11/21/12 8:25:29 AM

Do
Not
Cop
y or
Pos
t
This document is authorized for use only by Liudmyla Feurstein at EBCM - European University of Munich until October 2014. Copying or posting is an infringement of
copyright. [email protected] or 617.783.7860.
Part Two
The (Many) Peculiarities of
the Income Statement
H6061.indb 41H6061.indb 41 11/21/12 8:25:30 AM11/21/12 8:25:30 AM

Do
Not
Cop
y or
Pos
t
This document is authorized for use only by Liudmyla Feurstein at EBCM - European University of Munich until October 2014. Copying or posting is an infringement of
copyright. [email protected] or 617.783.7860.H6061.indb 42H6061.indb 42 11/21/12 8:25:30 AM11/21/12 8:25:30 AM
Do
Not
Cop
y or
Pos
t
This document is authorized for use only by Liudmyla Feurstein at EBCM - European University of Munich until October 2014. Copying or posting is an infringement of
copyright. [email protected] or 617.783.7860.
5
Profi t Is an Estimate
IN A FAMIL IAR PHRASE GENERALLY ATTR IBUTED to Peter Drucker, profi t is
the sovereign criterion of the enterprise. The use of the word sovereign
is right on the money. A profi table company charts its own course. Its
managers can run it the way they wish to. When a company stops be-
ing profi table, other people begin to poke their noses into the business.
Profi tability is also how you as a manager are likely to be judged. Are you
contributing to the company’s profi tability or detracting from it? Are you
fi guring out ways to increase profi tability every day, or are you just doing
your job and hoping everything will work out?
Another familiar saying, this one variously attributed to Laurence J.
Peter of The Peter Principle and to Yogi Berra, tells us that if we don’t know
where we’re going we’ll probably wind up somewhere else. If you don’t know
how to contribute to profi tability, you’re unlikely to do so effectively.
In fact, too many people in business don’t understand what profi t really
is, let alone how it is calculated. Nor do they understand that a company’s
profi t in any given period refl ects a whole host of estimates and assump-
tions. The art of fi nance might just as easily be termed the art of making
a profi t—or, in some cases, the art of making profi ts look better than they
really are. We’ll see in this part of the book how companies can do this,
both legally and illegally. Most companies play it pretty straight, though
there are always a few that end up pushing the limits.
H6061.indb 43H6061.indb 43 11/21/12 8:25:30 AM11/21/12 8:25:30 AM
Do
Not
Cop
y or
Pos
t
This document is authorized for use only by Liudmyla Feurstein at EBCM - European University of Munich until October 2014. Copying or posting is an infringement of
copyright. [email protected] or 617.783.7860.
44THE PECUL IARIT IES OF THE INCOME STATEMENT
We’ll focus on the basics of understanding an income statement, be-
cause “profi t” is no more and no less than what shows up there. Learn to
decipher this document, and you will be able to understand and evalu-
ate your company’s profi tability. Learn to manage the lines on the income
statement that you can affect, and you will know how to contribute to that
profi tability. Learn the art involved in determining profi t, and you will
defi nitely increase your fi nancial intelligence. You might even get where
you are going.
A (VERY) LITTLE ACCOUNTING
We promised in the previous chapter to include only a smattering of ac-
counting procedures in this book. There is one accounting idea, however,
that we will explain in this chapter, because once you understand it, you
will grasp exactly what the income statement is and what it is trying to tell
you. First, though, we want to back up one step and make sure there isn’t a
major misconception lurking in your mind.
You know that the income statement is supposed to show a company’s
profi t for a given period—usually a month, a quarter, or a year. It’s only a
short leap of imagination to conclude that the income statement shows
how much cash the company took in during that period, how much it
spent, and how much was left over. That “left over” amount would then be
the company’s profi t, right?
Alas, no. Except for some very small businesses that do their account-
ing this way—it’s called cash-based accounting—that notion of an income
statement and profi t is based on a fundamental misconception. In fact,
an income statement measures something quite different from cash in the
door, cash out the door, and cash left over. It measures sales or revenues,
costs or expenses, and profi t or income.
Any income statement begins with sales. When a business delivers a
product or a service to a customer, accountants say it has made a sale. Never
mind if the customer hasn’t paid for the product or service yet—the busi-
ness may count the amount of the sale on the top line of its income state-
ment for the period in question. No money at all may have changed hands.
Of course, for cash-based businesses such as retailers and restaurants, sales
and cash coming in are pretty much the same. But most businesses have to
H6061.indb 44H6061.indb 44 11/21/12 8:25:30 AM11/21/12 8:25:30 AM
Do
Not
Cop
y or
Pos
t
This document is authorized for use only by Liudmyla Feurstein at EBCM - European University of Munich until October 2014. Copying or posting is an infringement of
copyright. [email protected] or 617.783.7860.
45Profit Is an Estimate
wait thirty days or more to collect on their sales, and manufacturers of big
products such as airplanes may have to wait many months. (You can see
that managing a company such as Boeing would entail having a lot of cash
on hand to cover payroll and operating costs until the company is paid for
its work. We’ll get to a concept known as working capital, which helps you
assess such matters, in part 7 of the book.)
And the “cost” lines of the income statement? Well, the costs and ex-
penses a company reports are not necessarily the ones it wrote checks for
during that period. The costs and expenses on the income statement are those
it incurred in generating the sales recorded during that time period. Accoun-
tants call this the matching principle—all costs should be matched to the as-
sociated revenue for the period represented in the income statement—and
it’s the key to understanding how profi t is determined.
The matching principle is the little bit of accounting you need to learn.
For example:
• If an ink-and-toner supplier buys a truckload of cartridges in June to
resell to customers over the next several months, it does not record
the cost of all those cartridges in June. Rather, it records the cost of
each cartridge when the cartridge is sold. The reason is the matching
principle.
• And if a delivery company buys a truck in January that it plans to use
over the next three years, the cost of the truck doesn’t show up on the
income statement for January. Rather, the truck is depreciated over
the whole three years, with one-thirty-sixth of the truck’s cost appear-
ing as an expense on the income statement each month (assuming
The Matching Principle
The matching principle is a fundamental accounting rule for preparing an in-come statement. It simply states, “Match the cost with its associated revenue to determine profi ts in a given period of time—usually a month, quarter, or year.” In other words, one of the accountants’ primary jobs is to fi gure out and properly record all the costs incurred in generating sales.
H6061.indb 45H6061.indb 45 11/21/12 8:25:30 AM11/21/12 8:25:30 AM
Do
Not
Cop
y or
Pos
t
This document is authorized for use only by Liudmyla Feurstein at EBCM - European University of Munich until October 2014. Copying or posting is an infringement of
copyright. [email protected] or 617.783.7860.
46THE PECUL IARIT IES OF THE INCOME STATEMENT
simple straight-line methods of depreciation). Why? The matching
principle. The truck is one of the many costs associated with the work
performed during each of the thirty-six months—the work that shows
up in that month’s income statement.
• The matching principle even extends to items like taxes. A company
may pay its tax bill once a quarter—but every month the accountants
will tuck into the income statement a fi gure refl ecting the taxes owed
on that month’s profi ts.
• The matching principle applies to service companies as well as prod-
uct companies. A consulting fi rm, for example, sells billable hours,
meaning the time each consultant is working with a client. Accoun-
tants still need to match all the expenses associated with the time—
marketing costs, materials costs, research costs, and so on—to the
associated revenue.
You can see how far we are from cash in and cash out. Tracking the
fl ow of cash in and out the door is the job of another fi nancial document,
namely the cash fl ow statement (part 4). You can also see how far we are
from simple objective reality. Accountants can’t just tote up the fl ow of dol-
lars; they have to decide which costs are associated with the sales. They have
to make assumptions and come up with estimates. In the process, they may
introduce bias into the numbers.
THE PURPOSE OF THE INCOME STATEMENT
In principle, the income statement tries to measure whether the prod-
ucts or services that a company provides are profi table when everything
is added up. It’s the accountants’ best effort to show the sales the company
generated during a given time period, the costs incurred in making those
sales (including the costs of operating the business for that span of time),
and the profi t, if any, that is left over. Possible bias aside, this is a critically
important endeavor for nearly every manager in a business. A sales man-
ager needs to know what kind of profi ts she and her team are generating
so that she can make decisions about discounts, terms, which customers to
pursue, and so on. A marketing manager needs to know which products
H6061.indb 46H6061.indb 46 11/21/12 8:25:30 AM11/21/12 8:25:30 AM

Do
Not
Cop
y or
Pos
t
This document is authorized for use only by Liudmyla Feurstein at EBCM - European University of Munich until October 2014. Copying or posting is an infringement of
copyright. [email protected] or 617.783.7860.
47Profit Is an Estimate
are most profi table so that those can be emphasized in any marketing cam-
paigns. A human resources manager should know the profi tability of prod-
ucts so that he knows where the company’s strategic priorities are likely to
lie when he is recruiting new people.
Over time, the income statement and the cash fl ow statement in a well-
run company will track one another. Profi t will be turned into cash. As we
saw in chapter 3, however, just because a company is making a profi t in any
given time period doesn’t mean it will have the cash to pay its bills. Profi t is
always an estimate—and you can’t spend estimates.
With that lesson under our belts, let’s turn to the business of decoding
the income statement.
H6061.indb 47H6061.indb 47 11/21/12 8:25:30 AM11/21/12 8:25:30 AM
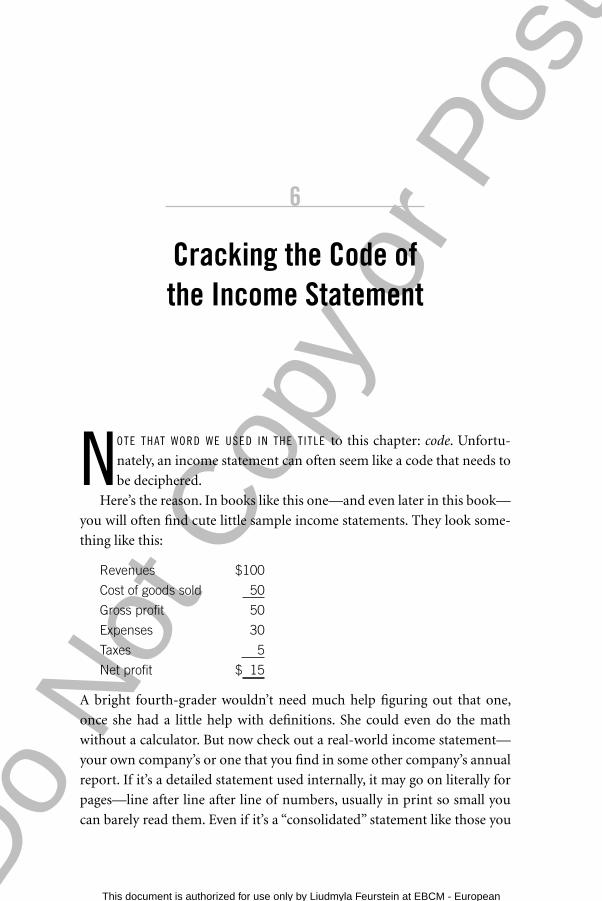
Do
Not
Cop
y or
Pos
t
This document is authorized for use only by Liudmyla Feurstein at EBCM - European University of Munich until October 2014. Copying or posting is an infringement of
copyright. [email protected] or 617.783.7860.
6
Cracking the Code of the Income Statement
NOTE THAT WORD WE USED IN THE T ITLE to this chapter: code. Unfortu-
nately, an income statement can often seem like a code that needs to
be deciphered.
Here’s the reason. In books like this one—and even later in this book—
you will often fi nd cute little sample income statements. They look some-
thing like this:
Revenues $100
Cost of goods sold 50
Gross profi t 50
Expenses 30
Taxes 5
Net profi t $ 15
A bright fourth-grader wouldn’t need much help fi guring out that one,
once she had a little help with defi nitions. She could even do the math
without a calculator. But now check out a real-world income statement—
your own company’s or one that you fi nd in some other company’s annual
report. If it’s a detailed statement used internally, it may go on literally for
pages—line after line after line of numbers, usually in print so small you
can barely read them. Even if it’s a “consolidated” statement like those you
H6061.indb 48H6061.indb 48 11/21/12 8:25:30 AM11/21/12 8:25:30 AM
Do
Not
Cop
y or
Pos
t
This document is authorized for use only by Liudmyla Feurstein at EBCM - European University of Munich until October 2014. Copying or posting is an infringement of
copyright. [email protected] or 617.783.7860.
49Cracking the Code of the Income Statement
fi nd in annual reports, it’s likely to contain a whole bunch of lines with
arcane labels like “income from equity affi liates” (that’s from Exxon Mobil)
or “amortization of purchased intangible assets” (from Hewlett-Packard).
It’s enough to make anybody but a fi nancial professional throw up his
hands in dismay (and many of the pros get confused, too).
So bear with us while we run through some simple procedures for
curling up with an income statement. Boosting your fi nancial intelligence
shouldn’t involve an attack of heartburn, and learning these steps may save
you from just that.
READING AN INCOME STATEMENT
Before you even start contemplating the numbers, you need some context
for understanding the document.
The Label
Does it say “income statement” at the top? It may not. It may instead say
“profi t and loss statement” or “P&L statement,” “operating statement” or
“statement of operations,” “statement of earnings” or “earnings statement.”
All these terms refer to the same document. Often the word consolidated
appears as part of the title. If it does, you are probably looking at an income
statement for a whole company, with totals for major categories rather than
highly detailed line items.
The many different names for an income statement could drive a per-
son nuts. We work with a client that calls the income statement in its an-
nual report the statement of earnings. Meanwhile, one of the company’s
major divisions calls its income statement an income statement—and an-
other major division calls it the profi t and loss statement! With all these
terms for the same thing, one might get the idea that our friends in fi nance
and accounting don’t want us to know what is going on. Or maybe they
just take it for granted that everybody knows that all the different terms
mean the same thing. However that may be, in this book we will always use
the term income statement.
Incidentally, if you see “balance sheet” or “statement of cash fl ows” at
the top, you have the wrong document. The label pretty much has to in-
clude one of those phrases we just mentioned.
H6061.indb 49H6061.indb 49 11/21/12 8:25:30 AM11/21/12 8:25:30 AM
Do
Not
Cop
y or
Pos
t
This document is authorized for use only by Liudmyla Feurstein at EBCM - European University of Munich until October 2014. Copying or posting is an infringement of
copyright. [email protected] or 617.783.7860.
50THE PECUL IARIT IES OF THE INCOME STATEMENT
What It’s Measuring
Is this income statement for an entire company? Is it for a division or busi-
ness unit? Is it for a region? Larger companies typically produce income
statements not just for the whole organization but also for various parts
of the business, right down to individual stores, plants, or product lines.
H. Thomas Johnson and Robert S. Kaplan, in their classic book Relevance
Lost, tell how General Motors developed the divisional system—with
income statements for each division—in the fi rst half of the twentieth
century.1 We can be glad it did. Creating income statements for smaller
business units has provided managers in large corporations with enormous
insights into their units’ fi nancial performance. Remember that these divi-
sion or business-unit fi nancial statements usually require allocations or
estimates for costs that apply to more than one division or unit.
Once you have identifi ed the relevant entity, you need to check the time
period. An income statement, like a report card in school, is always for
a span of time: a month, quarter, or year, or maybe year-to-date. Some
companies produce income statements for a time span as short as a week.
Incidentally, the fi gures on large companies’ income statements are usually
rounded off and the last zeros are left off. So look for a little note at the top:
“in millions” (add six zeros to the numbers) or “in thousands” (add three
zeros). This may sound like common sense, and indeed it is. But we have
found that seemingly trivial details such as this are often overlooked by
fi nancial newcomers.
“Actual” Versus “Pro Forma”
Most income statements are actual, and if there’s no other label, you can
assume that is what you’re looking at. They show what “actually” happened
to revenues, costs, and profi ts during that time period. If you are looking
at a public company’s statement, you can assume it has been compiled ac-
cording to the generally accepted principles of accounting (GAAP). If it is
a privately held company, one of the questions you’ll need to ask is whether
the numbers are based on GAAP principles. (We put “actually” in quotes
to remind you that any income statement has those built-in estimates, as-
sumptions, and biases, which we will discuss in more detail later in this
part of the book.)
H6061.indb 50H6061.indb 50 11/21/12 8:25:30 AM11/21/12 8:25:30 AM
Do
Not
Cop
y or
Pos
t
This document is authorized for use only by Liudmyla Feurstein at EBCM - European University of Munich until October 2014. Copying or posting is an infringement of
copyright. [email protected] or 617.783.7860.
51Cracking the Code of the Income Statement
There are also pro forma and non-GAAP income statements. Pro
forma means that the income statement is a projection. If you are drawing
up a plan for a new business, for instance, you might write down a pro-
jected income statement for the fi rst year or two—in other words, what
you hope and expect will happen in terms of sales and costs. That projec-
tion is called a pro forma. A non-GAAP income statement may exclude
any unusual or one-time charges, or it may relax some GAAP rules. (See
chapter 4 for more detail.) Say a company has to take a big write-off in
a particular year, resulting in a loss on the bottom line. (More on write-
offs later in this part.) Along with its actual income statement, it might
prepare one that shows what would have happened without the write-off.
To add to the confusion, many companies used to call these non-GAAP
statements pro forma income statements. Today that term is reserved for
projections.
Pro forma income statements—projections—are of course just that.
They are educated guesses about the future. Non-GAAP income state-
ments are different. They refl ect reality, but they have to be interpreted
with care. When companies prepare such documents for public consump-
tion, the ostensible purpose is to let you compare last year (when there
was no write-off) with this year (if there hadn’t been that ugly write-off).
But sometimes there is a subliminal message, something along the lines of,
“Hey, things aren’t really as bad as they look—we just lost money because
of that write-off.” Of course, the write-off really did happen, and the com-
pany really did lose money. Most of the time, you want to look at the GAAP
as well as the non-GAAP statements, and if you have to choose just one,
the GAAP statement is probably the better bet. Cynics sometimes describe
non-GAAP statements as income statements with all the bad stuff taken
out. That’s not always fair—but sometimes it is.
The Big Numbers
No matter whose income statement you’re looking at, there will be three
main categories. One is sales, which may be called revenue (it’s the same
thing). Sales or revenue is always at the top. When people refer to “top-line
growth,” that’s what they mean: sales growth. Costs and expenses are in
the middle, and profi t is at the bottom. (If the income statement you’re
looking at is for a nonprofi t, “profi t” may be called “surplus/defi cit” or “net
H6061.indb 51H6061.indb 51 11/21/12 8:25:31 AM11/21/12 8:25:31 AM
Do
Not
Cop
y or
Pos
t
This document is authorized for use only by Liudmyla Feurstein at EBCM - European University of Munich until October 2014. Copying or posting is an infringement of
copyright. [email protected] or 617.783.7860.
52THE PECUL IARIT IES OF THE INCOME STATEMENT
revenue.”) There are subsets of profi t that may be listed as you go along,
too—gross profi t, for example. We’ll explain all of these in chapter 9.
You can usually tell what’s important to a company by looking at the
biggest numbers relative to sales. For example, the sales line is usually fol-
lowed by “cost of goods sold,” or COGS. In a service business, the line is
often “cost of services,” or COS. Occasionally, you might also see “cost of
revenue.” If that line is a large fraction of sales, you can bet that manage-
ment in that company watches COGS or COS very closely. In your own
company, you will want to know exactly what is included in line items that
are relevant to your job. If you’re a sales manager, for instance, you’ll need
to fi nd out exactly what goes into the line labeled “selling expense.” As we’ll
see, accountants have some discretion as to how they categorize various
expenses.
By the way: unless you’re a fi nancial professional, you can usually ig-
nore items like “amortization of purchased intangible assets.” Most lines
with labels like that aren’t material to the bottom line anyway. And if they
are, they ought to be explained in the footnotes.
Comparative Data
The consolidated income statements presented in annual reports typically
have three columns of fi gures, refl ecting what happened during the past
three years. Internal income statements may have many more columns.
You may see something like this, for example:
Actual % of sales Budget % of sales Variance %
Or like this:
Actual previous period $ Change (+/–) % Change
Tables of numbers like these can be intimidating. But they don’t need
to be.
In the fi rst case, “% of sales” is simply a way of showing the magnitude
of an expense number relative to revenue. The revenue line is taken as a
given—a fi xed point—and everything else is compared with it. Many com-
panies set percent-of-sales targets for given line items, and then take action
if they miss the target by a signifi cant amount. For instance, maybe se-
H6061.indb 52H6061.indb 52 11/21/12 8:25:31 AM11/21/12 8:25:31 AM
Do
Not
Cop
y or
Pos
t
This document is authorized for use only by Liudmyla Feurstein at EBCM - European University of Munich until October 2014. Copying or posting is an infringement of
copyright. [email protected] or 617.783.7860.
53Cracking the Code of the Income Statement
nior executives have decided that selling expenses shouldn’t be more than
12 percent of sales. If the number creeps up much above 12 percent, the
sales organization had better watch out. It’s the same with the budget and
variance numbers. (“Variance” just means difference.) If the actual num-
ber is way off budget—that is, if the variance is high—you can be sure
that somebody will want to know why. Financially savvy managers always
identify variances to budget and fi nd out why they occurred.
In the second case, the statement simply shows how the company
is doing compared with last quarter or last year. Sometimes the point
of comparison will be “same quarter last year.” Again, if a number has
moved in the wrong direction by a sizable amount, someone will want to
know why.
In short, the point of these comparative income statements is to high-
light what is changing, which numbers are where they are supposed to be,
and which ones are not.
Footnotes
An internal income statement may or may not include footnotes. If it does,
we recommend reading them very carefully. They are probably going to tell
you something that the accountants think everybody should be aware of.
External income statements, like those found in annual reports, are a little
different. They usually include many, many footnotes. You may want to
scan them: some may be interesting, others not so much.
Why all the footnotes? In cases where there is any question, the rules of
accounting require the fi nancial folks to explain how they arrived at their
totals. So most of the notes are like windows into how the numbers were
determined. Some are simple and straightforward, such as the following
from Walmart’s Form 10-K (the annual report required by the Securities
and Exchange Commission) for the year ended January 31, 2011:
Cost of Sales
Cost of sales includes actual product cost, the cost of transportation to the
Company’s warehouses, stores and clubs from suppliers, the cost of trans-
portation from the Company’s warehouses to the stores and clubs and the
H6061.indb 53H6061.indb 53 11/21/12 8:25:31 AM11/21/12 8:25:31 AM
Do
Not
Cop
y or
Pos
t
This document is authorized for use only by Liudmyla Feurstein at EBCM - European University of Munich until October 2014. Copying or posting is an infringement of
copyright. [email protected] or 617.783.7860.
54THE PECUL IARIT IES OF THE INCOME STATEMENT
cost of warehousing for our Sam’s Club segment and import distribution
centers.
But other footnotes can be long and complex, such as the following foot-
note fragment from Hewlett-Packard’s Form 10-K for the fi scal year end-
ing October 31, 2010:
HP’s current revenue recognition policies, which were applied in fi scal
2010 and fi scal 2009, provide that, when a sales arrangement contains
multiple elements, such as hardware and software products, licenses and/
or services, HP allocates revenue to each element based on a selling price
hierarchy. The selling price for a deliverable is based on its vendor specifi c
objective evidence (“VSOE”) if available, third party evidence (“TPE”) if
VSOE is not available, or estimated selling price (“ESP”) if neither VSOE
nor TPE is available. In multiple element arrangements where more-than-
incidental software deliverables are included, revenue is allocated to each
separate unit of accounting for each of the non-software deliverables and
to the software deliverables as a group using the relative selling prices of
each of the deliverables in the arrangement based on the aforementioned
selling price hierarchy. If the arrangement contains more than one soft-
ware deliverable, the arrangement consideration allocated to the software
deliverables as a group is then allocated to each software deliverable using
the guidance for recognizing software revenue, as amended.
This is one of nine paragraphs describing revenue recognition, a topic
we discuss in chapter 7. Don’t get us wrong: it’s important that Hewlett-
Packard explain its approach to the issue. Decisions about when revenue is
recognized are a key element of the art of fi nance. Nor should you assume
that Walmart always has simple footnotes and Hewlett-Packard always
has complex ones. Our examples here merely illustrate the diversity of the
types of footnotes you’ll fi nd relating to the income statement in an annual
report. Sometimes you fi nd out some very interesting things about compa-
nies by reading the footnotes, so have fun! (Did we just say that footnotes
can be fun?) Incidentally, if you can’t fi nd the explanations you need in the
notes, ask your CFO. He ought to have the answers.
H6061.indb 54H6061.indb 54 11/21/12 8:25:31 AM11/21/12 8:25:31 AM

Do
Not
Cop
y or
Pos
t
This document is authorized for use only by Liudmyla Feurstein at EBCM - European University of Munich until October 2014. Copying or posting is an infringement of
copyright. [email protected] or 617.783.7860.
55Cracking the Code of the Income Statement
ONE BIG RULE
So those are the rules for reading. But don’t forget the one big rule that
should be in the forefront of your thinking whenever you confront an in-
come statement. That rule says:
Remember that many numbers on the income statement refl ect estimates
and assumptions. Accountants have decided to include some transac-
tions here and not there. They have decided to estimate one way and not
another.
That is the art of fi nance. If you remember this one point, we assure you
that your fi nancial intelligence already exceeds that of many managers.
So let’s take a more detailed look at some of the key categories. If you
don’t have another income statement handy, use the sample in the appen-
dix for reference. Sure, it will all seem complicated at fi rst. But you will
soon grow accustomed to the format and the terminology. As you do, you’ll
fi nd that you are beginning to understand what the income statement is
telling you.
H6061.indb 55H6061.indb 55 11/21/12 8:25:31 AM11/21/12 8:25:31 AM
Do
Not
Cop
y or
Pos
t
This document is authorized for use only by Liudmyla Feurstein at EBCM - European University of Munich until October 2014. Copying or posting is an infringement of
copyright. [email protected] or 617.783.7860.
7
RevenueThe Issue Is Recognition
WE’LL BEGIN AT THE TOP. We already noted that sales—the top line of
an income statement—is also often called revenue. So far so good:
only two words for the same thing isn’t too bad, and we’ll use both,
just because they’re so common. But watch out: some companies (and
many people) call that top line “income.” In fact, the popular accounting
software QuickBooks labels it income. Most banks and fi nancial institu-
tions also call it income. That’s really confusing because “income” more of-
ten means “profi t,” which is the bottom line. (Obviously, we have an uphill
battle here. Where are the language police when you need them?)
A company can record or recognize a sale when it delivers a product or
service to a customer. That’s a simple principle. But as we suggested earlier
in the book, when you put it into practice, you immediately run into com-
plexity. In fact, the issue of when a sale can be recorded is one of the more
artful aspects of the income statement. It’s the one where accountants have
the most discretion and that managers therefore must understand most
closely. So this is one place where your skills as an educated consumer of the
fi nancials will come in handy. If things don’t seem right, ask questions—
and if you can’t get satisfactory answers, it might be time to be concerned.
Revenue recognition is a common arena for fi nancial fraud.
H6061.indb 56H6061.indb 56 11/21/12 8:25:31 AM11/21/12 8:25:31 AM
Do
Not
Cop
y or
Pos
t
This document is authorized for use only by Liudmyla Feurstein at EBCM - European University of Munich until October 2014. Copying or posting is an infringement of
copyright. [email protected] or 617.783.7860.
57Revenue
MURKY GUIDELINES
The most important GAAP guideline that accountants rely on for record-
ing or recognizing a sale is that the revenue must have been earned. A prod-
ucts company must have shipped the product. A service company must
have performed the work. Fair enough—but what would you do about
these situations?
• Your company does systems integration for large customers. A typical
project requires six months to design and be approved by the cus-
tomer, then another twelve months to implement. The customer gets
no real value from the project until the whole thing is complete. When
have you earned the revenue that the project generates?
• Your company sells to retailers. Using a practice known as bill-and-
hold, you allow your customers to buy product (say, a popular Christ-
mas item) well in advance of the time they will actually need it. You
warehouse it for them and ship it out later. When have you earned the
revenue?
• You work for an architectural fi rm. The fi rm provides clients with
plans for buildings, deals with the local building authorities, and
supervises the construction or reconstruction. All these services are
included in the fi rm’s fee, which is generally fi gured as a percentage of
construction costs. How do you determine when the fi rm has earned
its revenue?
We can’t provide exact answers to these questions, because account-
ing practices differ from one company to another. But that’s precisely
the point: there are no hard-and-fast answers. Project-based companies
Sales
Sales or revenue is the dollar value of all the products or services a company provided to its customers during a given period of time.
H6061.indb 57H6061.indb 57 11/21/12 8:25:31 AM11/21/12 8:25:31 AM
Do
Not
Cop
y or
Pos
t
This document is authorized for use only by Liudmyla Feurstein at EBCM - European University of Munich until October 2014. Copying or posting is an infringement of
copyright. [email protected] or 617.783.7860.
58THE PECUL IARIT IES OF THE INCOME STATEMENT
typically have rules allowing partial revenue recognition when a project
reaches certain milestones. But the rules can vary. The “sales” fi gure on a
company’s top line always refl ects the accountants’ judgments about when
they should recognize revenue. And where there is judgment, there is room
for dispute—not to say manipulation.
POSSIBILITIES FOR MANIPULATION
In fact, the pressures for manipulation can be intense. Let’s take a soft-
ware company, for example. And let’s say that it sells software along with
maintenance-and-upgrade contracts extending over a period of fi ve years.
So it has to make a judgment about when to recognize revenue from a sale.
Now suppose this software company is actually a division of a large
corporation, one that makes earnings predictions to Wall Street. The folks
in the corporate offi ce want to keep Wall Street happy. This quarter, alas, it
looks as if the parent company is going to miss its earnings per share fore-
cast by just a little bit. If it does, Wall Street will not be happy. And when
Wall Street isn’t happy, the company’s stock gets hammered.
Aha! (You can hear the folks in the corporate offi ce thinking.) Here is
this software division. Suppose we change how its revenue is recognized?
Suppose we recognize 75 percent up front instead of 50 percent? The logic
might be that a sale in this business takes a lot of initial work, so they
should recognize the cost and effort of making the sale as well as the cost
of providing the product and delivering the service. Make the change—
recognize the extra revenue—and suddenly earnings per share are nudged
up to where Wall Street expects them to be.
Earnings per Share
Earnings per share (EPS) is a company’s net profi t divided by the number of shares outstanding. It’s one of the numbers that Wall Street watches most closely. Wall Street has “expectations” for many companies’ EPS, and if the expectations aren’t met, the share price is likely to drop.
H6061.indb 58H6061.indb 58 11/21/12 8:25:31 AM11/21/12 8:25:31 AM
Do
Not
Cop
y or
Pos
t
This document is authorized for use only by Liudmyla Feurstein at EBCM - European University of Munich until October 2014. Copying or posting is an infringement of
copyright. [email protected] or 617.783.7860.
59Revenue
Interestingly, such a change is not illegal. An explanation might appear
in a footnote to the fi nancial statements, but then again it might not. Maybe
you noticed in chapter 6 that the Hewlett-Packard footnote regarding rev-
enue recognition policy mentioned 2009 and 2010. That’s because later in
that same section the company describes what it did differently in 2008:
For fi scal 2008 . . . HP allocated revenue to each element based on its rela-
tive fair value, or for software, based on VSOE of fair value. In the absence
of fair value for a delivered element, HP fi rst allocated revenue to the fair
value of the undelivered elements and the residual revenue to the delivered
elements . . .
. . . And so on, for many more lines.
As we mentioned in chapter 4, any accounting change that is “material”
to the bottom line must be footnoted in this manner. But who decides what
is material and what isn’t? You guessed it: the accountants. In fact, it could
very well be that recognizing 75 percent up front presents a more accurate
picture of the software division’s reality. But was the change in accounting
method due to good fi nancial analysis, or did it refl ect the need to make
the earnings forecast? Could there be a bias lurking in here? Remember,
accounting is the art of using limited data to come as close as possible to
an accurate description of how well a company is performing. Revenue on
the income statement is an estimate, a best guess. This example shows how
estimates can introduce bias.
It isn’t just investors who have to be careful about bias; managers, too,
need to be aware of it because it can directly affect their jobs. Say you’re a
sales manager, and you and your staff focus on the revenue numbers every
month. You manage your people based on those numbers. You talk with
them about their performance. You make decisions about hiring and fi r-
ing, and you hand out rewards and recognition, all according to the num-
bers. Now your company does what the software company did: it changes
the way it recognizes revenue in order to achieve some corporate goal. Sud-
denly it looks as if your staff is doing great! Bonuses for everyone! But be
careful: the underlying revenue fi gures might not look so good if they were
recognized in the same way as before. If you didn’t know the policy had
changed and you began passing out bonuses, you’d be paying for no real
H6061.indb 59H6061.indb 59 11/21/12 8:25:31 AM11/21/12 8:25:31 AM
Do
Not
Cop
y or
Pos
t
This document is authorized for use only by Liudmyla Feurstein at EBCM - European University of Munich until October 2014. Copying or posting is an infringement of
copyright. [email protected] or 617.783.7860.
60THE PECUL IARIT IES OF THE INCOME STATEMENT
improvement. Financial intelligence in this case means understanding how
the revenue is recognized, analyzing the real variances in the sales fi gures,
and paying bonuses (or not) based on true changes in performance.
Just as an aside, the most common source of accounting fraud has been
and probably always will be in that top line: sales. Many companies play
with revenue recognition in questionable ways. The issue is particularly
acute in the software industry. Software companies often sell their prod-
ucts to resellers, who then sell the products to end users. Manufacturers,
under pressure from Wall Street to make their numbers, are frequently
tempted to ship unordered software to these distributors at the end of a
quarter. (The practice is known as channel stuffi ng.) And it isn’t just soft-
ware. Vitesse Semiconductor, for instance, was charged by the Securities
and Exchange Commission in 2010 for a series of practices conducted by its
then–executive team from 1995 to 2006. Among the charges: “an elaborate
channel stuffi ng scheme in order to improperly record revenue on product
shipments.” The distributor to which Vitesse shipped its wares had an “un-
conditional right” to send the goods back, a right established through “side
letters and oral agreements.” Vitesse and the executives settled the charges,
and the company later acknowledged that it had “utilized improper ac-
counting practices primarily related to revenue recognition and inventory,
and prepared or altered fi nancial records to conceal those practices.” A new
management team subsequently cleaned things up.1
One company that always took the high road in regard to this practice
was Macromedia, creators of the Internet Flash player and other products.
When channel stuffi ng was becoming a serious problem in the industry,
Macromedia voluntarily reported estimates of inventory held by its dis-
tributors, thereby showing that the channels for its products were not ar-
tifi cially loaded up. The message was clear to shareholders and employees
alike: Macromedia was not going to be dragged into this practice. (Macro-
media has since been acquired by Adobe.)
The next time you read about a fi nancial scandal, check fi rst to see
whether somebody was messing around with the revenue numbers. Un-
fortunately, it is all too common.
H6061.indb 60H6061.indb 60 11/21/12 8:25:31 AM11/21/12 8:25:31 AM
Do
Not
Cop
y or
Pos
t
This document is authorized for use only by Liudmyla Feurstein at EBCM - European University of Munich until October 2014. Copying or posting is an infringement of
copyright. [email protected] or 617.783.7860.
61Revenue
BACKLOG AND BOOKINGS
Fraud and manipulation aside, revenue shows the dollar volume of the
goods or services the company has delivered to its customers. But it’s not
the only signifi cant measure of a company’s sales success. Equally impor-
tant, in many cases, are the orders that have been signed but not yet started,
or the revenue not yet recognized on partially completed projects. This is
the value, in other words, of what’s in the pipeline. Companies variously
refer to these not-yet-recognized sales as backlog or bookings.
Many public companies report backlog or bookings to help keep ana-
lysts and shareholders informed about the companies’ future prospects.
They may publish the fi gures in a variety of ways. One of our clients, for
example, tracks both the total value of its contracts and the annual value.
Of course, bookings can change from one day to the next as new orders
come in, existing orders are canceled or amended, and work proceeds on
partially completed projects.
In some cases, you may have to ask questions to determine what a par-
ticular trend in backlog or bookings means. For example, a growing back-
log might indicate increasing sales—or it might mean that the company is
experiencing production problems. A falling backlog might indicate de-
clining sales or greater production capacity. One metric that can help you
fi gure out what’s going on is the company’s assessment of how much of the
backlog will convert to sales in a given period of time. A company might
say, for instance, that it expects approximately 75 percent of the backlog to
turn into sales in the following six months.
DEFERRED REVENUE
When you buy an airplane ticket, the airline charges your credit card im-
mediately, even if you are not planning to fl y for another three weeks. Ac-
countants call such funds deferred revenue.
Because of its name, deferred revenue sounds like something we should
discuss in this chapter. Deferred revenue is indeed related to revenue—it
will turn into revenue eventually—but it does not belong here. Remem-
ber the GAAP principle of conservatism? It says, in part, that revenue
should be recognized when (and only when) it is actually earned. Deferred
H6061.indb 61H6061.indb 61 11/21/12 8:25:31 AM11/21/12 8:25:31 AM

Do
Not
Cop
y or
Pos
t
This document is authorized for use only by Liudmyla Feurstein at EBCM - European University of Munich until October 2014. Copying or posting is an infringement of
copyright. [email protected] or 617.783.7860.
62THE PECUL IARIT IES OF THE INCOME STATEMENT
revenue is money that has come in but is as yet unearned. So it can’t go into
the income statement. Instead, accountants put deferred revenue on the
balance sheet as a liability—that is, an amount that the company owes to
somebody else. In the example, the airline owes you a fl ight. We’ll discuss
deferred revenue further in part 3.
H6061.indb 62H6061.indb 62 11/21/12 8:25:32 AM11/21/12 8:25:32 AM
Do
Not
Cop
y or
Pos
t
This document is authorized for use only by Liudmyla Feurstein at EBCM - European University of Munich until October 2014. Copying or posting is an infringement of
copyright. [email protected] or 617.783.7860.
8
Costs and ExpensesNo Hard-and-Fast Rules
MOST MANAGERS HAVE plenty of personal experience with expenses.
But did you know that there are plenty of estimates and potential
biases on those expense lines? Let’s examine the major line items.
COST OF GOODS SOLD OR COST OF SERVICES
As you probably do know, expenses on the income statement fall into two
basic categories. The fi rst is cost of goods sold, or COGS. As usual, there are
a couple of different names for this category—in a service company, for
instance, it may be called cost of services (COS). We’ve also frequently seen
cost of revenue and cost of sales. For simplicity’s sake, we’ll use the acro-
nyms COGS or COS. At any rate, what matters isn’t the label, it’s what’s
Cost of Goods Sold (COGS) and Cost of Services (COS)
Cost of goods sold or cost of services is one category of expenses. It includes all the costs directly involved in producing a product or delivering a service.
H6061.indb 63H6061.indb 63 11/21/12 8:25:32 AM11/21/12 8:25:32 AM
Do
Not
Cop
y or
Pos
t
This document is authorized for use only by Liudmyla Feurstein at EBCM - European University of Munich until October 2014. Copying or posting is an infringement of
copyright. [email protected] or 617.783.7860.
64THE PECUL IARIT IES OF THE INCOME STATEMENT
included. The idea behind COGS is to measure all the costs directly associ-
ated with making the product or delivering the service. The materials. The
labor. If you suspect that rule is open to a ton of interpretation, you’re on
the money. The accounting department has to make decisions about what
to include in COGS and what to put somewhere else.
Some of these decisions are easy. In a manufacturing company, for in-
stance, the following costs are defi nitely in:
• The wages of the people on the manufacturing line
• The cost of the materials that are used to make the product
And plenty of costs are defi nitely out, such as:
• The cost of supplies used by the accounting department (paper, etc.)
• The salary of the human resources manager in the corporate offi ce
Ah, but then there’s the gray area—and it’s enormous. For example:
• What about the salary of the person who manages the plant that
manufactures the product?
• What about the wages of the plant supervisors?
• What about sales commissions?
Are all of these directly related to the manufacturing of the product?
Or are they indirect expenses, like the cost of the HR manager? There’s
the same ambiguity in a service environment. COS in a service company
typically includes the labor associated with delivering the service. But
what about the group supervisor? You could argue that his salary is part
of general operations and therefore shouldn’t be included in the COS line.
You could also argue that he is supporting direct-service employees, so he
should be included with them in that line. These are all judgment calls.
There are no hard-and-fast rules.
The fact that there aren’t any, frankly, is a little surprising. GAAP runs
for many thousands of pages and spells out a lot of detailed rules. You’d
think GAAP would say, “The plant manager is out,” or “The supervisor is
in.” No such luck; GAAP only provides guidelines. Companies take those
H6061.indb 64H6061.indb 64 11/21/12 8:25:32 AM11/21/12 8:25:32 AM
Do
Not
Cop
y or
Pos
t
This document is authorized for use only by Liudmyla Feurstein at EBCM - European University of Munich until October 2014. Copying or posting is an infringement of
copyright. [email protected] or 617.783.7860.
65Costs and Expenses
guidelines and apply a logic that makes sense for their particular situations.
The key, as accountants like to say, is reasonableness and consistency. So
long as a company’s logic is reasonable, and so long as that logic is applied
consistently, whatever it wants to do is OK.
As to why a manager should care what’s in and what’s out, consider the
following scenarios:
• You run the engineering analysis department at an architectural fi rm,
and in the past your staff ’s salaries have been included in COS. Now
the fi nance folks are moving all those costs out of COS. It’s perfectly
reasonable—even though your department has a lot to do with com-
pleting an architectural design, a case can be made that it isn’t directly
related to any particular job. So does the change matter? You bet. You
and your staff are no longer part of what’s often called “above the
line.” That means you’re going to show up differently on the corporate
radar screen. If your company focuses on gross profi t, for instance,
management will be monitoring COS carefully. It will try to ensure
that departments affecting COS have everything they need to hit their
targets. Once you’re outside of COS—“below the line”—the level of
attention may be signifi cantly lower.
• You’re a plant manager charged with making a gross profi t of $1 mil-
lion per month. This month you’re $20,000 short. Then you realize
that $25,000 of your COGS is in a line item labeled “contract ad-
ministration on plant orders.” Does that really belong in COGS? You
Above the Line, Below the Line
The “line” generally refers to gross profi t. Above that line on the income state-ment, typically, are sales and COGS or COS. Below the line are operating ex-penses, interest, and taxes. What’s the difference? Items listed above the line tend to vary more (in the short term) than many of those below the line, and so tend to get more managerial attention.
H6061.indb 65H6061.indb 65 11/21/12 8:25:32 AM11/21/12 8:25:32 AM
Do
Not
Cop
y or
Pos
t
This document is authorized for use only by Liudmyla Feurstein at EBCM - European University of Munich until October 2014. Copying or posting is an infringement of
copyright. [email protected] or 617.783.7860.
66THE PECUL IARIT IES OF THE INCOME STATEMENT
petition the controller to move those costs to operating expenses.
Your controller agrees; the change is done. You hit your target, and
everyone is happy. An outsider might even look at what’s happening
and believe that gross margins are improving—all from a change you
made because you were trying to hit a target.
Again, these changes are legal, so long as they meet the reasonable-and-
consistent test. You can even take an expense out of COGS one month and
petition to put it back in next month. All you need is a reason good enough
to convince the controller (and the auditor, if the changes are material)—
and you need to disclose the change if it’s material. Of course, changing the
rules constantly from one period to the next would be bad form. One thing
we all need from our accountants is consistency.
OPERATING EXPENSES: WHAT’S NECESSARY?
And where do costs go when they are taken out of COGS? Where is “be-
low the line?” That’s the other basic category of costs, namely operating
expenses. Some companies refer to operating expenses as sales, general,
and administrative expenses (SG&A, or just G&A), while others treat
G&A as one subcategory and give sales and marketing its own line. Often
a company will base this distinction on the relative size of each. Microsoft
chooses to show sales and marketing on a separate line because sales and
marketing are a signifi cant portion of the company’s expenses. By contrast,
the biotech fi rm Genentech includes sales and marketing with G&A, the
more typical approach. Both companies separate out R&D costs because of
their relative importance. So pay attention to how your company organizes
these expenses.
Operating Expenses (Once More)
Operating expenses are the other major category of expenses. The category in-cludes costs that are not directly related to making the product or delivering a service.
H6061.indb 66H6061.indb 66 11/21/12 8:25:32 AM11/21/12 8:25:32 AM
Do
Not
Cop
y or
Pos
t
This document is authorized for use only by Liudmyla Feurstein at EBCM - European University of Munich until October 2014. Copying or posting is an infringement of
copyright. [email protected] or 617.783.7860.
67Costs and Expenses
Operating expenses are often thought of and referred to as “overhead.”
The category includes items such as rent, utilities, telephone, research, and
marketing. It also includes management and staff salaries—HR, account-
ing, IT, and so forth—plus everything else that the accountants have de-
cided does not belong in COGS.
You can think of operating expenses as the cholesterol in a business.
Good cholesterol makes you healthy, while bad cholesterol clogs your ar-
teries. Good operating expenses make your business strong, and bad op-
erating expenses drag down your bottom line and prevent you from tak-
ing advantage of business opportunities. (Another name for bad operating
expenses is “unnecessary bureaucracy.” Also “lard.” You can probably come
up with others.)
One more thing about COGS and operating expenses. You might think
that COGS is the same as “variable costs”—costs that vary with the volume
of production—and that operating expenses are fi xed costs. Materials, for ex-
ample, are a variable cost: the more you produce, the more material you have
to buy. And materials are included in COGS. The salaries of the people in the
HR department are fi xed costs, and they’re included in operating expenses.
Unfortunately, things aren’t so simple here, either. For example, if the super-
visors’ salaries are included in COGS, then that line item is fi xed in the short
run, whether you turn out one hundred thousand widgets or one hundred
fi fty thousand. Or take selling expenses, which are typically part of SG&A. If
you have a commissioned sales force, sales expenses are to some extent vari-
able, but they are included in operating expenses, rather than COGS.
THE POWER OF DEPRECIATION AND AMORTIZATION
Another part of operating expenses that is often buried in that SG&A line
is depreciation and amortization. How this expense is treated can greatly
affect the profi t on an income statement.
We described an example of depreciation earlier in this part—buying a
delivery truck and then spreading the cost over the three-year period that
we assume the truck will be used for. As we said, that’s an example of the
matching principle. In general, depreciation is the “expensing” of a physi-
cal asset, such as a truck or a machine, over its estimated useful life. All this
means is that the accountants fi gure out how long the asset is likely to be in
H6061.indb 67H6061.indb 67 11/21/12 8:25:32 AM11/21/12 8:25:32 AM
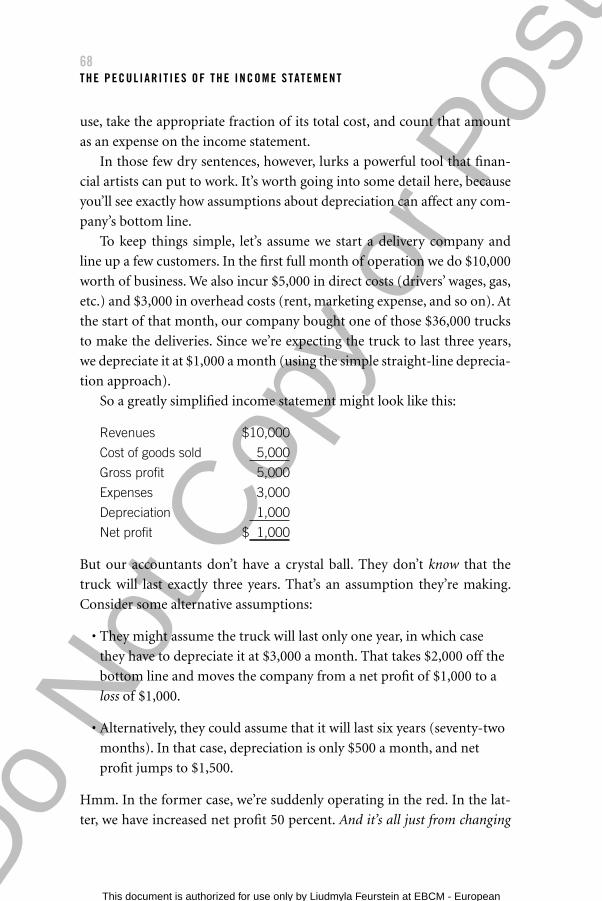
Do
Not
Cop
y or
Pos
t
This document is authorized for use only by Liudmyla Feurstein at EBCM - European University of Munich until October 2014. Copying or posting is an infringement of
copyright. [email protected] or 617.783.7860.
68THE PECUL IARIT IES OF THE INCOME STATEMENT
use, take the appropriate fraction of its total cost, and count that amount
as an expense on the income statement.
In those few dry sentences, however, lurks a powerful tool that fi nan-
cial artists can put to work. It’s worth going into some detail here, because
you’ll see exactly how assumptions about depreciation can affect any com-
pany’s bottom line.
To keep things simple, let’s assume we start a delivery company and
line up a few customers. In the fi rst full month of operation we do $10,000
worth of business. We also incur $5,000 in direct costs (drivers’ wages, gas,
etc.) and $3,000 in overhead costs (rent, marketing expense, and so on). At
the start of that month, our company bought one of those $36,000 trucks
to make the deliveries. Since we’re expecting the truck to last three years,
we depreciate it at $1,000 a month (using the simple straight-line deprecia-
tion approach).
So a greatly simplifi ed income statement might look like this:
Revenues $10,000
Cost of goods sold 5,000
Gross profi t 5,000
Expenses 3,000
Depreciation 1,000
Net profi t $ 1,000
But our accountants don’t have a crystal ball. They don’t know that the
truck will last exactly three years. That’s an assumption they’re making.
Consider some alternative assumptions:
• They might assume the truck will last only one year, in which case
they have to depreciate it at $3,000 a month. That takes $2,000 off the
bottom line and moves the company from a net profi t of $1,000 to a
loss of $1,000.
• Alternatively, they could assume that it will last six years (seventy-two
months). In that case, depreciation is only $500 a month, and net
profi t jumps to $1,500.
Hmm. In the former case, we’re suddenly operating in the red. In the lat-
ter, we have increased net profi t 50 percent. And it’s all just from changing
H6061.indb 68H6061.indb 68 11/21/12 8:25:32 AM11/21/12 8:25:32 AM
Do
Not
Cop
y or
Pos
t
This document is authorized for use only by Liudmyla Feurstein at EBCM - European University of Munich until October 2014. Copying or posting is an infringement of
copyright. [email protected] or 617.783.7860.
69Costs and Expenses
one assumption about depreciation. Accountants have to follow GAAP, of
course, but GAAP allows plenty of fl exibility. No matter what set of rules
the accountants follow, estimating will be required whenever an asset lasts
longer than a single accounting period. The job for the fi nancially intelli-
gent manager is to understand those estimates and to know how they affect
the fi nancials.
If you think this is purely an academic exercise, consider the famous
example of Waste Management Inc. (WMI). WMI was once a great corpo-
rate success story, a leader in the business of hauling trash. So it came as
a shock to everybody when the company announced that it would take a
pretax charge—a one-time write-off—of $3.54 billion against its earnings.
Sometimes one-time charges are taken in advance of a restructuring, as
we’ll discuss later in this chapter. But this was different. In effect, WMI was
admitting that it had been cooking its books on a previously unimaginable
scale. It had actually earned $3.54 billion less in the previous several years
than it had reported during that time.
What was going on? WMI had originally grown by buying up other
garbage companies. Its growth was rapid, and the company became a dar-
ling of Wall Street. When the supply of garbage companies to buy began to
dwindle, it bought companies in other industries. But while it was pretty
good at hauling trash, it didn’t know how to run those other companies
effectively. WMI’s profi t margins declined. Its share price plummeted. Des-
perate to prop up the stock, executives began looking for ways to increase
earnings.
Their gaze fell fi rst on their fl eet of twenty thousand garbage trucks,
for which they’d paid an average of $150,000 apiece. Up to that point, the
company had been depreciating the trucks over eight to ten years, which
was the standard practice in the industry. That period wasn’t long enough,
the executives decided. A good truck could last twelve, thirteen, even four-
teen years. When you add four years to your truck depreciation schedule,
you can do wonderful things to your bottom line; it’s like the little example
of the delivery company multiplied thousands of times over. But the ex-
ecutives didn’t stop there. They realized that they had other assets they
could do the same tricks with—about 1.5 million Dumpsters, for example.
You could extend each Dumpster’s depreciation period from the stan-
dard twelve years to, say, fi fteen, eighteen, or twenty years, and you’d pick
H6061.indb 69H6061.indb 69 11/21/12 8:25:32 AM11/21/12 8:25:32 AM
Do
Not
Cop
y or
Pos
t
This document is authorized for use only by Liudmyla Feurstein at EBCM - European University of Munich until October 2014. Copying or posting is an infringement of
copyright. [email protected] or 617.783.7860.
70THE PECUL IARIT IES OF THE INCOME STATEMENT
up another chunk of earnings per year. By fi ddling with the depreciation
numbers on the trucks and the Dumpsters, Waste Management’s execu-
tives were able to pump up pretax earnings by a whopping $716 million.
And this was just one of many tricks they used to make profi ts look larger
than they were, which is why the end total was so huge.
Of course, the whole tangled web eventually came unraveled, as fraud-
ulent schemes usually do. By then, however, it was too late to save the com-
pany. It was sold to a competitor, which kept the name but changed just
about everything else. As for the perpetrators of the fraud, no criminal
charges were ever fi led against them, although some civil penalties were
assessed.
Depreciation is a prime example of what accountants call a noncash
expense. Right here, of course, is where they often lose the rest of us. How
can an expense be other than cash? The key to that puzzling term is to
remember that the cash has probably already been paid. The company al-
ready bought the truck. But the expense wasn’t recorded that month, so it
has to be allocated over the truck’s life, a little at a time. No more money is
going out the door; rather, it’s just the accountant’s way of fi guring that this
month’s revenue depends on using that truck, so the income statement had
better have something in it that refl ects the truck’s cost. Incidentally, you
should know that there are many methods to determine how to depreciate
an asset. You don’t need to know what they are; you can leave that to the ac-
countants. All you need to know is whether the use of the asset is matched
appropriately to the revenue it is bringing in.
Amortization is the same basic idea as depreciation, but it applies to
intangible assets. These days, intangible assets are often a big part of com-
Noncash Expense
A noncash expense is one that is charged to a period on the income statement but is not actually paid out in cash. An example is depreciation: accountants deduct a certain amount each month for depreciation of equipment, but the com-pany isn’t obliged to pay out that amount, because the equipment was acquired in a previous period.
H6061.indb 70H6061.indb 70 11/21/12 8:25:32 AM11/21/12 8:25:32 AM

Do
Not
Cop
y or
Pos
t
This document is authorized for use only by Liudmyla Feurstein at EBCM - European University of Munich until October 2014. Copying or posting is an infringement of
copyright. [email protected] or 617.783.7860.
71Costs and Expenses
panies’ balance sheets. Items such as patents, copyrights, and goodwill (to
be explained in chapter 11) are all assets—they cost money to acquire, and
they have value—but they aren’t physical assets like real estate and equip-
ment. Still, they must be accounted for in a similar way. Take a patent. Your
company had to buy the patent, or it had to do the research and develop-
ment that lies behind it and then apply for it. Now the patent is helping to
bring in revenue. So the company must match the expense of the patent
with the revenue it helps to bring in, a little bit at a time. When an asset is
intangible, though, accountants call that process amortization rather than
depreciation. We’re not sure why—but whatever the reason, it’s a source of
confusion.
Incidentally, economic depreciation implies that an asset loses its value
over time. And indeed: a truck used in a delivery business does lose its
value as it get older. But accounting depreciation and amortization are
more about cost allocation than about loss of value. A truck, for example,
may be depreciated over three years so that its accounting value at the end
of that time is zero. But it may still have some value on the open market at
the end of that time. A patent may be amortized over its useful life, but if
technology has advanced beyond it, the patent’s value may be close to zero
after a couple of years, regardless of what the accountants say. So assets are
rarely worth what the books say they are worth. (We’ll discuss accounting
or “book” value in greater detail in part 3.)
ONE-TIME CHARGES: A YELLOW FLAG
Accounting is like life in at least one respect: there’s a lot of stuff that doesn’t
fall neatly into categories. So every income statement has a big group of ex-
penses that do not fall into COGS and are not operating expenses either.
Every statement is different, but typically you’ll see lines for “other income/
expense” (usually this is gain or loss from selling assets, or from transac-
tions unrelated to the everyday operations of the business) and of course
“taxes.” Most of these you don’t need to worry about. But there is one line
that often turns up after COGS and operating expenses (though it is some-
times included under operating expenses)—a line you should defi nitely
understand because it is often critical to profi tability. The most common
label for this line is “one-time charge.”
H6061.indb 71H6061.indb 71 11/21/12 8:25:32 AM11/21/12 8:25:32 AM
Do
Not
Cop
y or
Pos
t
This document is authorized for use only by Liudmyla Feurstein at EBCM - European University of Munich until October 2014. Copying or posting is an infringement of
copyright. [email protected] or 617.783.7860.
72THE PECUL IARIT IES OF THE INCOME STATEMENT
You may occasionally have seen the phrase taking the big bath or some-
thing similar in the Wall Street Journal. That’s a reference to these one-time
charges, which are also known as extraordinary items, write-offs, write-
downs, or restructuring charges. Sometimes write-offs occur, as in Waste
Management’s case, when a company has been doing something wrong
and wants to correct its books. More often, one-time charges occur when a
new CEO takes over a company and wants to restructure, reorganize, close
plants, and maybe lay people off. It’s the CEO’s attempt, right or wrong, to
improve the company based on his assessment of what the company needs.
(Sometimes it’s also an attempt to blame the company’s performance on
the previous CEO and thus to garner credit for performance improvements
in a subsequent year.) Normally, such a restructuring entails a lot of costs—
paying off leases, offering severance packages, disposing of facilities, selling
off equipment, and so on. GAAP requires accountants to record expenses
as soon as they know that expenses will be incurred, even if they have to es-
timate exactly what the fi nal fi gure will be. So when a restructuring occurs,
accountants need to estimate those charges and record them.
Here is a real yellow fl ag—a truly terrifi c place for bias in the numbers
to show up. After all, how do you really estimate the cost of restructuring?
Accountants have a lot of discretion, and they’re liable to be off the mark
in one direction or another. If their estimate is too high—that is, if the ac-
tual costs are lower than expected—then part of that one-time charge has
to be “reversed.” A reversed charge actually adds to profi t in the new time
period, so profi ts in that period wind up higher than they would otherwise
have been—and all because an accounting estimate in a previous period
was inaccurate! “Chainsaw Al” Dunlap, the notorious CEO of Sunbeam,
was said to regard his accounting department as a profi t center, and this
may suggest why. (Incidentally, if you ever hear a senior executive refer to
the accounting department in this manner, your company might have a
problem.)
Of course, maybe the restructuring charge is too small. Then another
charge has to be taken later. That clouds the numbers, because the charge
isn’t really matched to any revenue in the new time period. This time
around, profi ts are lower than they otherwise would be, again because
the accountants made the wrong estimate in an earlier time frame. Some
years ago, AT&T seemed to be taking “one-time” restructuring charges fre-
H6061.indb 72H6061.indb 72 11/21/12 8:25:32 AM11/21/12 8:25:32 AM
Do
Not
Cop
y or
Pos
t
This document is authorized for use only by Liudmyla Feurstein at EBCM - European University of Munich until October 2014. Copying or posting is an infringement of
copyright. [email protected] or 617.783.7860.
73Costs and Expenses
quently over an extended period. The company kept saying that earnings
before the restructuring charge were growing—but it didn’t make much
difference, because after all those restructuring charges, the company was
in pretty rough shape fi nancially. Besides, if a company takes extraordinary
one-time restructuring charges for several years in a row, how extraordi-
nary can those charges really be? Walter Schuetze, former chief accountant
for the Securities and Exchange Commission, said at the time that such
charges have the effect of “deluding the investor into thinking that things
are really better than they are.”1
TRACKING EXPENSES DIFFERENTLY DEPENDING ON WHO’S LOOKING
This section isn’t about fraud. It isn’t even about trying to make things
look better than they are within the rules. This is about who is looking at
the numbers and what the numbers are used for. Most companies track
expenses in at least two ways. Some track them in more than two, all for
the purpose of following rules and using fi nancial information to manage
the business.
How can this be? For one thing, GAAP guidelines do have something
to say about how expenses are shown on the income statement. The cat-
egories, and what goes into them, are based on guidelines that allow for
consistency, conservatism, matching, and the other GAAP principles and
guidelines. Companies then make determinations within the guidelines as
to how to show expenses in their public statements. For example, Coca-
Cola shows the following expenses in its public GAAP income statement:
• Cost of goods sold
• Selling, general, and administrative
• Other operating charges
• Interest expense
• Income taxes
All well and good, but would these categories really help a manager run
her unit? We aren’t privy to Coca-Cola’s internal income statements, but
H6061.indb 73H6061.indb 73 11/21/12 8:25:32 AM11/21/12 8:25:32 AM

Do
Not
Cop
y or
Pos
t
This document is authorized for use only by Liudmyla Feurstein at EBCM - European University of Munich until October 2014. Copying or posting is an infringement of
copyright. [email protected] or 617.783.7860.
74THE PECUL IARIT IES OF THE INCOME STATEMENT
here are a few of the categories we suspect many managers (both of the par-
ent corporation and the bottling units) would need to understand. They
would want to know, for instance, how much they were spending on:
• Each ingredient used to make the beverages, broken down by beverage
• All the costs related to delivering the product, in suffi cient detail so
that the costs could be managed
• Departmental costs, such as accounting, human resources, IT,
and so on
• Sales and marketing costs broken down by product, advertising cam-
paign, and more
Finally, some companies share what they reported to the government
on their tax returns. These numbers are probably the farthest away from
what is useful to a manager. Tax returns follow tax rules, which are not the
same as GAAP rules. The returns were probably prepared by tax accoun-
tants, a subspecialty of the profession. So tax returns look different from
conventional fi nancial statements. It isn’t fraud, it’s just different ways of
looking at the same reality.
H6061.indb 74H6061.indb 74 11/21/12 8:25:32 AM11/21/12 8:25:32 AM
Do
Not
Cop
y or
Pos
t
This document is authorized for use only by Liudmyla Feurstein at EBCM - European University of Munich until October 2014. Copying or posting is an infringement of
copyright. [email protected] or 617.783.7860.
9
The Many Forms of Profi t
SO FAR WE HAVE COVERED SALES OR REVENUE— the top line—and costs
and expenses. Revenue minus costs and expenses equals profi t.
Of course, it might also equal earnings, income, or even margin.
Amazingly enough, some companies use all these different terms for profi t,
sometimes in the same document. An income statement might have items
labeled “gross margin,” “operating income,” “net profi t,” and “earnings per
share.” All these are the different types of profi t typically seen on an income
statement—and the company could just as easily have said “gross profi t,”
“operating profi t,” “net profi t,” and “profi t per share.” When they use differ-
ent words right there in the same statement, it looks as if they are talking
about different concepts. But they aren’t.
So let’s always use the term profi t here, and look at its various in-
carnations.
GROSS PROFIT: HOW MUCH IS ENOUGH?
Gross profi t—revenue minus COGS or COS—is a key number for most
companies. It tells you the basic profi tability of your product or service. If
that part of your business is not profi table, your company is probably not
going to survive long. After all, how can you expect to pay below-the-line
expenses, including management salaries, if you aren’t generating a healthy
gross profi t?
H6061.indb 75H6061.indb 75 11/21/12 8:25:32 AM11/21/12 8:25:32 AM
Do
Not
Cop
y or
Pos
t
This document is authorized for use only by Liudmyla Feurstein at EBCM - European University of Munich until October 2014. Copying or posting is an infringement of
copyright. [email protected] or 617.783.7860.
76THE PECUL IARIT IES OF THE INCOME STATEMENT
But what does healthy mean? How much gross profi t is enough? That
varies substantially by industry, and it’s likely to vary from one company to
another even in the same industry. In the grocery business, gross profi t is
typically a small percentage of sales. In the jewelry business, it’s typically a
much larger percentage. Other things being equal, a company with larger
revenues can thrive with a lower gross profi t percentage than a smaller one.
(That’s one reason why Walmart can charge such low prices.) To gauge
your company’s gross profi t, you can compare it with industry standards,
particularly for companies of a similar size in your industry. You can also
look at year-to-year trends, examining whether your gross profi t is headed
up or headed down. If it’s headed down, you can ask why. Are production
costs rising? Is your company discounting its sales? Understanding why
gross profi t is changing, if it is, helps managers fi gure out where to focus
their attention.
Incidentally, though most income statements follow the format we de-
scribed, a small but signifi cant number of income statements put COGS or
COS under a subhead called operating expenses. These income statements
don’t show a gross profi t line at all. Microsoft is one company that uses
this format. The lesson here? Pay close attention to the line items, and use
Profi t
Profi t is the amount left over after expenses are subtracted from revenue. There are three basic types of profi t: gross profi t, operating profi t, and net profi t. Each one is determined by subtracting certain categories of expenses from revenue.
Gross Profi t
Gross profi t is sales minus cost of goods sold or cost of services. It is what is left over after a company has paid the direct costs incurred in making the product or delivering the service. Gross profi t must be suffi cient to cover a business’s operating expenses, taxes, fi nancing costs, and net profi t.
H6061.indb 76H6061.indb 76 11/21/12 8:25:33 AM11/21/12 8:25:33 AM
Do
Not
Cop
y or
Pos
t
This document is authorized for use only by Liudmyla Feurstein at EBCM - European University of Munich until October 2014. Copying or posting is an infringement of
copyright. [email protected] or 617.783.7860.
77The Many Forms of Profit
your own fi nancial intelligence to assess how a company has organized its
expenses, and therefore how you should assess the profi t lines.
Here too, however, you need to keep a sharp eye out for possible bias
in the numbers. Gross profi t can be greatly affected by decisions about when
to recognize revenue and by decisions about what to include in COGS. Sup-
pose you are HR director for a market research fi rm and you fi nd that
gross profi t is headed downward. You look into the numbers, and at fi rst
it appears that service costs have gone up. So you and your team begin
anticipating cuts in service costs, perhaps even including some layoffs. But
when you do some more digging, you fi nd that salaries that were previ-
ously in operating expenses have been moved into COGS. So service costs
did not go up, and laying off people would be a mistake. Now you have to
talk with the people in accounting. Why did they move those salaries? Why
didn’t they tell you? If those salaries are to remain in COGS, then maybe
the fi rm’s gross profi t targets need to be reduced. But nothing else needs
to change.
OPERATING PROFIT IS A KEY TO HEALTH
Operating profi t—gross profi t minus operating expenses or SG&A, in-
cluding depreciation and amortization—is also known by the peculiar ac-
ronym EBIT (pronounced EE-bit). EBIT stands for earnings before inter-
est and taxes. (Remember, earnings is just another name for profi t). What
has not yet been subtracted from revenue is interest and taxes. Why not?
Because operating profi t is the profi t a company earns from the business it is
in—from operations. Taxes don’t really have anything to do with how well
you are running your business. And interest expenses depend on whether
the company is fi nanced with debt or equity (we’ll explain this difference
Operating Profi t, or EBIT
Operating profi t is gross profi t minus operating expenses, which include depre-ciation and amortization. In other words, it shows the profi t made from running the business.
H6061.indb 77H6061.indb 77 11/21/12 8:25:33 AM11/21/12 8:25:33 AM
Do
Not
Cop
y or
Pos
t
This document is authorized for use only by Liudmyla Feurstein at EBCM - European University of Munich until October 2014. Copying or posting is an infringement of
copyright. [email protected] or 617.783.7860.
78THE PECUL IARIT IES OF THE INCOME STATEMENT
in chapter 12). But the fi nancial structure of the company doesn’t say any-
thing about how well it is run from an operational perspective.
So operating profi t, or EBIT, is a good gauge of how well a company is
being managed. It’s watched closely by all stakeholders because it measures
both overall demand for the company’s products or services (sales) and
the company’s effi ciency in delivering those products or services (costs).
Bankers and investors look at operating profi t to see whether the company
will be able to pay its debts and earn money for its shareholders. Vendors
look at it to see if the company will be able to pay its bills. (As we’ll see
later, however, operating profi t is not always the best gauge of this.) Large
customers examine operating profi t to ascertain whether the company is
doing an effi cient job and is likely to be around for a while. Even savvy
employees check out the operating profi t fi gures. A healthy and growing
operating profi t suggests that the employees are going to be able to keep
their jobs and may have opportunities for advancement.
However, remember that potential biases in the numbers can impact
operating profi t as well. Are there any one-time charges? What is the depre-
ciation line? As we have seen, depreciation can be altered to affect profi ts
one way or another. For a while, Wall Street analysts were watching com-
panies’ operating profi t, or EBIT, closely. But some companies that were
later revealed to have committed fraud turned out to be playing games
with depreciation (remember Waste Management), so their EBIT num-
bers were suspect. Before long, Wall Street began focusing on another
number—EBITDA (pronounced EE-bid-dah), or earnings before interest,
taxes, depreciation, and amortization. Some people feel EBITDA is a better
measure of a company’s operating effi ciency, because it ignores noncash
charges such as depreciation altogether. (More recently, another number—
free cash fl ow—has become the darling of Wall Street. You’ll learn about it
in the toolbox following part 4.)
NET PROFIT AND HOW TO FIX IT
Now, fi nally, let’s get to the bottom line. Net profi t. It is usually the last line
on the income statement. Net profi t is what is left over after everything
is subtracted—cost of goods sold or cost of services, operating expenses,
one-time charges, noncash expenses such as depreciation and amortiza-
H6061.indb 78H6061.indb 78 11/21/12 8:25:33 AM11/21/12 8:25:33 AM
Do
Not
Cop
y or
Pos
t
This document is authorized for use only by Liudmyla Feurstein at EBCM - European University of Munich until October 2014. Copying or posting is an infringement of
copyright. [email protected] or 617.783.7860.
79The Many Forms of Profit
tion, interest, and taxes. When someone asks, “What’s the bottom line?”
he or she is almost always referring to net profi t. Some of the key numbers
used to measure a company, such as earnings per share and price/earnings
ratio, are based on net profi t. Yes, it is strange that they don’t just call them
profi t per share and price/profi t ratio. But they don’t.
What if a company’s net profi t is lower than it ought to be? This can be
a big issue, particularly because executives’ bonuses may be tied to profi t
targets. On occasion, some decide to skirt accounting rules to improve
the profi t picture. Fannie Mae, for instance—the government-sponsored
enterprise that plays a signifi cant role in the US mortgage market—was
charged with “extensive fi nancial fraud” over the six-year period from 1998
to 2004. The goal of the fraud was to make it look as if earnings were right
on target so that its executives would receive incentive payouts worth mil-
lions of dollars.1
Aside from monkeying with the books, there are only three possible fi xes
for low profi tability. One, the company can increase profi table sales. This
solution almost always requires a good deal of time. You have to fi nd new
markets or new prospects, work through the sales cycle, and so on. Two, it
can fi gure out how to lower production costs and run more effi ciently—that
is, reduce COGS. This, too, takes time: you need to study the production
process, fi nd the ineffi ciencies, and implement changes. Three, it can cut
operating expenses, which almost always means reducing the headcount.
This is usually the only short-term solution available. That’s why so many
CEOs taking over troubled companies start by cutting the payroll in the
overhead expense areas. It makes earnings look better fast.
Of course, layoffs can backfi re. Morale suffers. Good people whom the
new CEO wants to keep may begin looking for jobs elsewhere. And that’s
Net Profi t
Net profi t is the bottom line of the income statement: what’s left after all costs and expenses are subtracted from revenue. It’s operating profi t minus interest expenses, taxes, one-time charges, and any other costs not included in operating profi t.
H6061.indb 79H6061.indb 79 11/21/12 8:25:33 AM11/21/12 8:25:33 AM
Do
Not
Cop
y or
Pos
t
This document is authorized for use only by Liudmyla Feurstein at EBCM - European University of Munich until October 2014. Copying or posting is an infringement of
copyright. [email protected] or 617.783.7860.
80THE PECUL IARIT IES OF THE INCOME STATEMENT
not the only danger. For example, “Chainsaw Al” Dunlap used the lay-
people-off strategy a number of times to pump up the earnings of com-
panies he took over, and Wall Street usually rewarded him for it. But the
strategy didn’t work when he got to Sunbeam. Yes, he slashed headcount,
and yes, earnings rose. In fact, Wall Street was so enthusiastic about the
company’s pumped-up profi tability that it bid Sunbeam’s shares way up.
But Dunlap’s strategy all along had been to sell the company at a profi t—
and now, with its shares selling at a premium, the company was too ex-
pensive for prospective buyers to consider. Without a buyer, Sunbeam was
forced to limp along until its problems became apparent and Chainsaw Al
was forced out by the board.
The moral? For most companies, it’s better to manage for the long haul
and to focus on increasing profi table sales and reducing costs. Sure, operat-
ing expenses may have to be trimmed. But if that’s your only focus, you’re
probably only postponing the day of reckoning.
CONTRIBUTION MARGIN—A DIFFERENT WAY OF LOOKING AT PROFIT
So far we have examined three different levels of profi t—gross profi t, op-
erating profi t, and net profi t. All refl ect the fact that an income statement
is organized in a certain sequence: you begin with revenue, subtract COGS
to get gross profi t, subtract operating expenses to get operating profi t, sub-
tract taxes and interest and everything else to get net profi t. If you cat-
egorized expenses differently, however, you would come up with a differ-
ent measure of profi t, and perhaps you could learn more about how well
you are managing. That’s the thinking behind a particular form of profi t
known as contribution margin.
Contribution Margin
Contribution margin indicates how much profi t you are earning on the goods or services you sell, without accounting for your company’s fi xed costs. To calculate it, just subtract variable costs from sales.
H6061.indb 80H6061.indb 80 11/21/12 8:25:33 AM11/21/12 8:25:33 AM
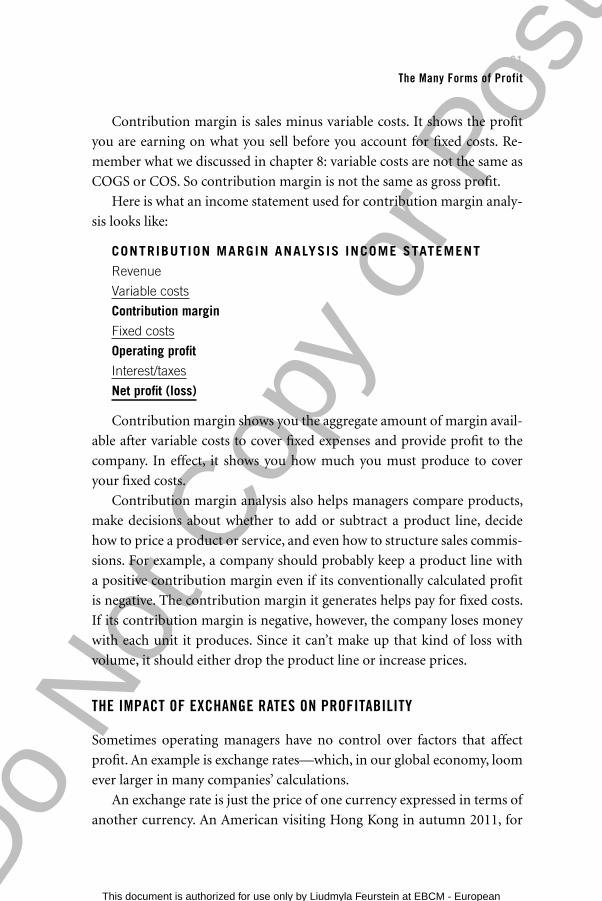
Do
Not
Cop
y or
Pos
t
This document is authorized for use only by Liudmyla Feurstein at EBCM - European University of Munich until October 2014. Copying or posting is an infringement of
copyright. [email protected] or 617.783.7860.
81The Many Forms of Profit
Contribution margin is sales minus variable costs. It shows the profi t
you are earning on what you sell before you account for fi xed costs. Re-
member what we discussed in chapter 8: variable costs are not the same as
COGS or COS. So contribution margin is not the same as gross profi t.
Here is what an income statement used for contribution margin analy-
sis looks like:
CONTRIBUTION MARGIN ANALYSIS INCOME STATEMENT
Revenue
Variable costs
Contribution margin
Fixed costs
Operating profi t
Interest/taxes
Net profi t (loss)
Contribution margin shows you the aggregate amount of margin avail-
able after variable costs to cover fi xed expenses and provide profi t to the
company. In effect, it shows you how much you must produce to cover
your fi xed costs.
Contribution margin analysis also helps managers compare products,
make decisions about whether to add or subtract a product line, decide
how to price a product or service, and even how to structure sales commis-
sions. For example, a company should probably keep a product line with
a positive contribution margin even if its conventionally calculated profi t
is negative. The contribution margin it generates helps pay for fi xed costs.
If its contribution margin is negative, however, the company loses money
with each unit it produces. Since it can’t make up that kind of loss with
volume, it should either drop the product line or increase prices.
THE IMPACT OF EXCHANGE RATES ON PROFITABILITY
Sometimes operating managers have no control over factors that affect
profi t. An example is exchange rates—which, in our global economy, loom
ever larger in many companies’ calculations.
An exchange rate is just the price of one currency expressed in terms of
another currency. An American visiting Hong Kong in autumn 2011, for
H6061.indb 81H6061.indb 81 11/21/12 8:25:33 AM11/21/12 8:25:33 AM
Do
Not
Cop
y or
Pos
t
This document is authorized for use only by Liudmyla Feurstein at EBCM - European University of Munich until October 2014. Copying or posting is an infringement of
copyright. [email protected] or 617.783.7860.
82THE PECUL IARIT IES OF THE INCOME STATEMENT
example, could have bought about 7.8 Hong Kong dollars (HKD) for one
US dollar. The price of those 7.8 HKD, in other words, is $1.00. However,
exchange rates vary signifi cantly over time. The fl uctuations depend on
trade fl ows, government budgets, relative interest rates, and a host of other
variables.
Whenever a company from one country does business in another, the
profi tability of its operations will be affected by fl uctuations in exchange
rates. In the simplest case, imagine that a US manufacturer sells machines
in Hong Kong for 780,000 HKD, or about $100,000 (in late 2011). Then
suppose that the US dollar declines in value relative to the HKD—that is,
you now need more than $1.00 to buy 7.8 HKD. Let’s say the new rate is
6.8 HKD to the dollar. The manufacturer receives the same 780,000 HKD
for its machines, but that money is now worth $114,706. Other things
equal, those sales are 14.7 percent more profi table than they used to be.
The manufacturer can pocket the difference, or it can decide to reduce
prices to increase demand. The opposite will hold true, of course, if the
US dollar increases in value relative to the HKD. In that case, people and
companies who buy from Hong Kong will gain, and those who sell there
will lose.
Many companies, of course, have highly complex overseas operations.
They produce some products at home and some in foreign countries. They
ship goods in both directions, and from one foreign country to another.
Every international transaction involves some risk that exchange rates will
fl uctuate in the wrong direction, and that profi ts on the transaction will be
less than expected.
Though operating managers can’t do much about exchange rates
themselves, the fi nancial folks can and do take action to protect themselves
against these risks, For example, they can purchase fi nancial instruments
that allow them to buy or sell certain currencies at predetermined prices,
thus locking in exchange rates. This kind of hedge, as it is known in the
fi nancial world, helps protect against unexpected rate changes. Of course,
hedges cost money, and they don’t always work perfectly. So while a com-
pany can reduce the effects of exchange rates on profi tability, it can rarely
eliminate them.
H6061.indb 82H6061.indb 82 11/21/12 8:25:33 AM11/21/12 8:25:33 AM
Do
Not
Cop
y or
Pos
t
This document is authorized for use only by Liudmyla Feurstein at EBCM - European University of Munich until October 2014. Copying or posting is an infringement of
copyright. [email protected] or 617.783.7860.
Part TwoToolbox
UNDERSTANDING VARIANCE
Variance just means difference. It might be the difference between budget
and actual for the month or year, between actual this month and actual last
month, and so on. It can be presented in dollars or percentages, or both.
Percentages are usually more useful, because they provide a quick and easy
basis of comparison between the two numbers.
The only diffi culty with variance when you are reading a fi nancial re-
port lies in determining whether a variance is favorable or unfavorable.
More revenue than expected, for instance, is favorable, while more expense
than expected is unfavorable. Sometimes the folks in fi nance are helpful
and let you know in a note that a variance enclosed in parentheses or a
variance preceded by a minus sign is unfavorable. But often you have to
fi gure it out on your own. We recommend doing a few calculations, fi gur-
ing out whether the indicated variances are bad or good, then checking to
see how they are displayed. Be sure to do the calculations for both a reve-
nue line item and an expense line item. Sometimes parentheses or negative
signs indicate the mathematical difference, not favorable or unfavorable. In
that case, parentheses for a revenue line item might mean favorable, while
parentheses for an expense line item might mean unfavorable.
PROFIT AT NONPROFITS
Nonprofi t organizations use the same fi nancial statements as for-profi t
companies, including the income statement. They also have a bottom
H6061.indb 83H6061.indb 83 11/21/12 8:25:33 AM11/21/12 8:25:33 AM
Do
Not
Cop
y or
Pos
t
This document is authorized for use only by Liudmyla Feurstein at EBCM - European University of Munich until October 2014. Copying or posting is an infringement of
copyright. [email protected] or 617.783.7860.
84THE PECUL IARIT IES OF THE INCOME STATEMENT
line indicating the difference between revenue and expenses, just like for-
profi t companies. Sometimes the bottom line has a different label, but it
is still a profi t or a loss. And the fact is, a nonprofi t organization needs to
earn a profi t. How can it survive over the long haul if it doesn’t bring in
more than it spends? It has to earn a surplus to invest in its future. The
only difference is that a nonprofi t can’t distribute the profi t to its own-
ers, because it doesn’t have owners. And of course it doesn’t pay taxes.
We often call nonprofi ts “nontaxed” organizations, which is really what
they are.
Over the years, several nonprofi ts have hired our company to train their
employees in fi nance. Why would a not-for-profi t hire us to teach fi nance?
The most common answer is that the organization is not making enough
money to survive, and management wants to boost everyone’s fi nancial
intelligence. It’s just as important in this context as it is in the for-profi t
business world.
A QUICK REVIEW: “PERCENT OF” AND “PERCENT CHANGE”
Two common ways to analyze income statements are “percent of” and
“percent change.” Everybody learns these calculations in school, but you
may have forgotten them. So take a quick look if you need to refresh your
memory.
A percent of calculation tells you what percentage one fi gure is of an-
other. For example, if you spent $60,000 on materials last year and the
year’s revenue was $500,000, you might want to know what percent of your
revenue went for materials. The calculation is as follows:
$60,000 = 0.12 = 12%
$500,000
Percent change, in contrast, is the percentage by which a fi gure changed
from one period to the next or from budget to actual. The formula for
percent change from one year to the next is as follows:
current year – prior year
prior year
H6061.indb 84H6061.indb 84 11/21/12 8:25:33 AM11/21/12 8:25:33 AM

Do
Not
Cop
y or
Pos
t
This document is authorized for use only by Liudmyla Feurstein at EBCM - European University of Munich until October 2014. Copying or posting is an infringement of
copyright. [email protected] or 617.783.7860.
85Part Two Toolbox
For example, if last year’s revenue was $300,000 and this year’s was
$375,000, then the percent change is as follows:
$375,000 – $300,000 = $75,000 = 0.25 = 25%
$300,000 $300,000
H6061.indb 85H6061.indb 85 11/21/12 8:25:33 AM11/21/12 8:25:33 AM

Do
Not
Cop
y or
Pos
t
This document is authorized for use only by Liudmyla Feurstein at EBCM - European University of Munich until October 2014. Copying or posting is an infringement of
copyright. [email protected] or 617.783.7860.H6061.indb 86H6061.indb 86 11/21/12 8:25:33 AM11/21/12 8:25:33 AM

Do
Not
Cop
y or
Pos
t
This document is authorized for use only by Liudmyla Feurstein at EBCM - European University of Munich until October 2014. Copying or posting is an infringement of
copyright. [email protected] or 617.783.7860.
Part Three
The Balance Sheet Reveals the Most
H6061.indb 87H6061.indb 87 11/21/12 8:25:33 AM11/21/12 8:25:33 AM

Do
Not
Cop
y or
Pos
t
This document is authorized for use only by Liudmyla Feurstein at EBCM - European University of Munich until October 2014. Copying or posting is an infringement of
copyright. [email protected] or 617.783.7860.H6061.indb 88H6061.indb 88 11/21/12 8:25:33 AM11/21/12 8:25:33 AM
Do
Not
Cop
y or
Pos
t
This document is authorized for use only by Liudmyla Feurstein at EBCM - European University of Munich until October 2014. Copying or posting is an infringement of
copyright. [email protected] or 617.783.7860.
1 0
Understanding Balance Sheet Basics
THERE’S A PUZZL ING FACT about fi nancial statements. Maybe you’ve no-
ticed it.
Give a company’s fi nancials to an experienced manager in the
business, and the fi rst thing he will turn to is the income statement. Most
managers have—or aspire to have—“P&L responsibility.” They’re account-
able for making the various forms of profi t turn out right. They know that
the income statement is where their performance is ultimately recorded. So
that’s what they look at fi rst.
Now try giving the same set of fi nancials to a banker, an experienced
Wall Street investor, or maybe a veteran board member. The fi rst statement
this person will turn to is invariably the balance sheet. In fact, she’s likely
to pore over it for some time. Then she’ll start fl ipping the pages, checking
out the income statement and the cash fl ow statement—but always going
back to the balance sheet.
Why don’t managers do what the pros do? Why do they limit their at-
tention to the income statement? We chalk it up to three factors:
• The balance sheet is a little harder to get your mind around than the
income statement. Income statements, after all, are pretty intuitive.
The balance sheet isn’t—at least not until you understand the basics.
H6061.indb 89H6061.indb 89 11/21/12 8:25:33 AM11/21/12 8:25:33 AM
Do
Not
Cop
y or
Pos
t
This document is authorized for use only by Liudmyla Feurstein at EBCM - European University of Munich until October 2014. Copying or posting is an infringement of
copyright. [email protected] or 617.783.7860.
90THE BALANCE SHEET REVEALS THE MOST
• Most companies’ budgeting processes focus on revenue and expenses.
In other words, the budget categories more or less align with the in-
come statement. You can’t be a manager without knowing something
about budgeting—which automatically means that you’re familiar
with many of the lines on the income statement. Balance sheet data,
by contrast, rarely fi gures in an operating manager’s budgeting process
(although the fi nance department certainly budgets the balance sheet
accounts).
• Managing the balance sheet requires a deeper understanding of
fi nance than managing an income statement. You not only have to
know what the various categories refer to, you have to know how they
fi t together. You also have to understand how changes in the balance
sheet affect the other fi nancial statements, and vice versa.
Our guess is that you, too, are a bit wary of the balance sheet. But re-
member: what we’re focusing on here is fi nancial intelligence—under-
standing how fi nancial results are measured and what you as a manager,
an employee, or a leader can do to improve results. We won’t get into the
esoteric elements of the balance sheet, just the ones you need to appreci-
ate the art of this statement and do the analyses that the statement makes
possible.
SHOWING WHERE THINGS STAND RIGHT NOW
So what is the balance sheet? It’s no more, and no less, than a statement of
what a business owns and what it owes at a particular point in time. The dif-
ference between what a company owns and what it owes represents equity.
Just as one of a company’s goals is to increase profi tability, another is to
increase equity. And as it happens, the two are intimately related.
What is this relationship? Consider an analogy. Profi tability is sort of
like the grade you receive for a course in college. You spend a semester
writing papers and taking exams. At the end of the semester, the instructor
tallies your performance and gives you an A– or a C+ or whatever. Equity
is more like your overall grade point average (GPA). Your GPA always re-
fl ects your cumulative performance, but at only one point in time. Any one
grade affects it, but doesn’t determine it. The income statement affects the
H6061.indb 90H6061.indb 90 11/21/12 8:25:33 AM11/21/12 8:25:33 AM
Do
Not
Cop
y or
Pos
t
This document is authorized for use only by Liudmyla Feurstein at EBCM - European University of Munich until October 2014. Copying or posting is an infringement of
copyright. [email protected] or 617.783.7860.
91Understanding Balance Sheet Basics
balance sheet much the way an individual grade affects your GPA. Make a
profi t in any given period, and the equity on your balance sheet will show
an increase. Lose money, and it will show a decrease. Over time, the equity
section of the balance sheet shows the accumulation of profi ts or losses left
in the business; the line is called retained earnings or sometimes accumu-
lated earnings. If the company has built up a net loss over time, then the
balance sheet will show a negative number called accumulated defi cit in
this section of the balance sheet.
Here, too, however, understanding the balance sheet means under-
standing all the assumptions, decisions, and estimates that go into it. Like
the income statement, the balance sheet is in many respects a work of art,
not just a work of calculation.
INDIVIDUALS AND BUSINESSES
Since the balance sheet is so important, we want to begin with some
simple lessons. Bear with us—it’s important in this case to crawl before
you walk.
Start by considering an individual’s fi nancial situation, or fi nancial
worth, again at a given point in time. You add up what the person owns,
subtract what she owes, and come up with her net worth:
owns – owes = net worth
Another way to state the same thing is this:
Equity
Equity is the shareholders’ “stake” in the company as measured by account-ing rules. It’s also called the company’s book value. In accounting terms, equity is always assets minus liabilities; it is also the sum of all capital paid in by shareholders plus any profi ts earned by the company since its inception minus dividends paid out to shareholders. That’s the accounting formula, anyway. Re-member that what a company’s shares are actually worth is whatever a willing buyer will pay for them.
H6061.indb 91H6061.indb 91 11/21/12 8:25:34 AM11/21/12 8:25:34 AM
Do
Not
Cop
y or
Pos
t
This document is authorized for use only by Liudmyla Feurstein at EBCM - European University of Munich until October 2014. Copying or posting is an infringement of
copyright. [email protected] or 617.783.7860.
92THE BALANCE SHEET REVEALS THE MOST
owns = owes + net worth
For an individual, the ownership category might include cash in the
bank, big-ticket items like a house and a car, and all the other property the
person can lay claim to. It also would include fi nancial assets such as stocks
and bonds or a retirement account. The “owing” category includes mort-
gage, car loan, credit card balances, and any other debt. Note that we’re
avoiding for the moment the question of how to calculate some of those
numbers. What’s the value of the house—what the person paid for it or
what it might bring today? How about the car or the TV? You can see the
art of fi nance peeking around the curtain here—but more on that in a
moment.
Now move from an individual to a business. Same concepts, different
language:
• What the company owns is called its assets.
• What it owes is called its liabilities.
• What it’s worth is called owners’ equity or shareholders’ equity.
And the basic equation now looks like this:
assets – liabilities = owners’ equity
or this:
assets = liabilities + owners’ equity
The latter formulation is one you might recognize from your Account-
ing 101 class years ago. It is the classic equation of the balance sheet. The
instructor probably called it the fundamental accounting equation. You also
learned that it refl ects the two sides of the balance sheet: assets on the one
side, liabilities and owners’ equity on the other. The sum on one side has
to equal the sum on the other side; the balance sheet has to balance. Before
you fi nish this part of the book, you will understand why.
READING A BALANCE SHEET
First, however, fi nd a sample balance sheet, either your own company’s or
one in an annual report. (Or just look at the sample in the appendix.) Since
H6061.indb 92H6061.indb 92 11/21/12 8:25:34 AM11/21/12 8:25:34 AM
Do
Not
Cop
y or
Pos
t
This document is authorized for use only by Liudmyla Feurstein at EBCM - European University of Munich until October 2014. Copying or posting is an infringement of
copyright. [email protected] or 617.783.7860.
93Understanding Balance Sheet Basics
the balance sheet shows the company’s fi nancial situation at a given point
in time, there should be a specifi c date at the top. It’s usually the end of a
month, quarter, year, or fi scal year. When you’re looking at fi nancial state-
ments together, you typically want to see an income statement for a month,
quarter, or year, along with the balance sheet for the end of the period
reported. Unlike income statements, balance sheets are almost always for
an entire organization. Sometimes a large corporation creates subsidiary
balance sheets for its operating divisions, but it rarely does so for a single
facility. As we’ll see, accounting professionals have to do some estimating
on the balance sheet, just the way they do with the income statement. Re-
member the delivery business we described when we were discussing de-
preciation in chapter 8? The way you depreciate the truck affects not only
the income statement but also the value of assets shown on the balance
sheet. It turns out that most of the assumptions and biases in the income
statement fl ow into the balance sheet one way or another.
Balance sheets come in two typical formats. The traditional model
shows assets on the left-hand side of the page and liabilities and owners’
equity on the right-hand side, with liabilities at the top. The less traditional
format puts assets on top, liabilities in the middle, and owners’ equity on the
bottom. Whatever the format, the “balance” remains the same: assets must
equal liabilities plus owners’ equity. (In the nonprofi t world, where organi-
zations do not have shareholders, owners’ equity is sometimes called “net
assets.”) Often a balance sheet shows comparative fi gures for, say, Decem-
ber 31 of the most recent year and December 31 of the previous year. Check
the column headings to see what points in time are being compared.
Fiscal Year
A fi scal year is any twelve-month period that a company uses for accounting purposes. Many companies use the calendar year, but some use other periods (October 1 to September 30, for example). Some retailers use a specifi c weekend, such as the last Sunday of the year, to mark the end of their fi scal year. You must know the company’s fi scal year to ascertain how recent the information you are looking at is.
H6061.indb 93H6061.indb 93 11/21/12 8:25:34 AM11/21/12 8:25:34 AM
Do
Not
Cop
y or
Pos
t
This document is authorized for use only by Liudmyla Feurstein at EBCM - European University of Munich until October 2014. Copying or posting is an infringement of
copyright. [email protected] or 617.783.7860.
94THE BALANCE SHEET REVEALS THE MOST
As with income statements, some organizations have unusual line items
on their balance sheets that you won’t fi nd discussed in this book. Remem-
ber, many of these items may be clarifi ed in the footnotes. In fact, balance
sheets are notorious for their footnotes. Coca-Cola’s 2010 annual report,
for example, contained sixty-one pages of notes, many of them pertaining
to the balance sheet. Companies often include a standard disclaimer in the
notes making the very point about the art of fi nance that we are making in
this book. Coca-Cola, for instance, says:
Management of the Company is responsible for the preparation and in-
tegrity of the consolidated fi nancial statements appearing in our annual
report on Form 10-K. The fi nancial statements were prepared in confor-
mity with generally accepted accounting principles appropriate in the cir-
cumstances and, accordingly, include certain amounts based on our best
judgments and estimates. Financial information in this annual report on
Form 10-K is consistent with that in the fi nancial statements.
If the notes don’t provide the necessary enlightenment, you can leave
the items to the fi nancial professionals. (If something you’re wondering
about is signifi cant, though, it makes sense to ask someone in your fi nance
organization about the item and the number that goes with it.)
Since the balance sheet is new to most managers, we want to walk you
through the most common line items. Some may look strange at fi rst,
but don’t worry: just keep in mind that distinction between “owned” and
“owed.” As with the income statement, we’ll pause along the way to see
which lines are most easily monkeyed with.
H6061.indb 94H6061.indb 94 11/21/12 8:25:34 AM11/21/12 8:25:34 AM
Do
Not
Cop
y or
Pos
t
This document is authorized for use only by Liudmyla Feurstein at EBCM - European University of Munich until October 2014. Copying or posting is an infringement of
copyright. [email protected] or 617.783.7860.
1 1
AssetsMore Estimates and Assumptions
(Except for Cash)
ASSETS ARE WHAT THE COMPANY OWNS: cash and securities, machinery
and equipment, buildings and land, whatever. Current assets, which
usually come fi rst on the balance sheet in the United States, include
anything that can be turned into cash in less than a year. Long-term assets
include physical assets that have a useful life of more than a year—usually
anything that is either depreciated or amortized. They can also include land,
goodwill, and long-term investments, none of which are depreciated.
TYPES OF ASSETS
Within those broad categories, of course, are many line items. We’ll list the
most common ones—those that appear on nearly every company’s balance
sheet.
Cash and Cash Equivalents
This is the hard stuff. Money in the bank. Money in money-market ac-
counts. Also publicly traded stocks and bonds—the kind you can turn into
cash in a day or less if you need to. Another name for this category is liquid
assets. This is one of the few line items that are not subject to accountants’
H6061.indb 95H6061.indb 95 11/21/12 8:25:34 AM11/21/12 8:25:34 AM
Do
Not
Cop
y or
Pos
t
This document is authorized for use only by Liudmyla Feurstein at EBCM - European University of Munich until October 2014. Copying or posting is an infringement of
copyright. [email protected] or 617.783.7860.
96THE BALANCE SHEET REVEALS THE MOST
discretion. When Microsoft says it has $56 billion in cash and short-term
investments, or whatever the latest number is, it means it really has that
much in banks, money funds, and publicly traded securities. Of course,
companies can lie. In 2003, the giant Italian company Parmalat reported
on its balance sheet that it had billions in an account with Bank of America.
It didn’t. In 2009, the CEO of a large Indian outsourcing company, Satyam
Computer Services, acknowledged that he had “infl ated the amount of
cash on the balance sheet . . . by nearly $1 billion.”1
Accounts Receivable, or A/R
This is the amount customers owe the company. Remember, revenue is a
promise to pay, so accounts receivable includes all the promises that haven’t
yet been collected. Why is this an asset? Because all or most of these com-
mitments will convert to cash and soon will belong to the company. It’s
like a loan from the company to its customers—and the company owns the
customers’ obligation. Accounts receivable is one line item that managers
need to watch closely, particularly since investors, analysts, and creditors
are likely to be watching it as well. We’ll say more on how to manage ac-
counts receivable in part 7, where we discuss working capital.
Sometimes a balance sheet includes an item labeled “allowance for bad
debt” that is subtracted from accounts receivable. This is the accountants’
estimate—usually based on past experience—of the dollars owed by cus-
tomers who don’t pay their bills. In many companies, subtracting a bad-
debt allowance provides a more accurate refl ection of the value of those
accounts receivable. But note well: estimates are already creeping in. In fact,
“Smoothing” Earnings
You might think that Wall Street would like a big spike in a company’s prof-its—more money for shareholders, right? But if the spike is unforeseen and unexplained—and especially if it catches Wall Street by surprise—investors are likely to react negatively, taking it as a sign that management isn’t in control of the business. So companies like to “smooth” their earnings, maintaining steady and predictable growth.
H6061.indb 96H6061.indb 96 11/21/12 8:25:34 AM11/21/12 8:25:34 AM
Do
Not
Cop
y or
Pos
t
This document is authorized for use only by Liudmyla Feurstein at EBCM - European University of Munich until October 2014. Copying or posting is an infringement of
copyright. [email protected] or 617.783.7860.
97Assets
many companies use the bad-debt reserve as a tool to “smooth” their earn-
ings. When you increase the bad-debt reserve on the balance sheet, you have
to record an expense against profi t on the income statement. That lowers
your reported earnings. When you decrease a reserve for bad debt, similarly,
the adjustment increases profi t on the income statement. Since the bad-
debt reserve is always an estimate, there is room here for subjectivity.
Inventory
Service companies typically don’t have much in the way of inventory, but
nearly every other company—manufacturers, wholesalers, retailers—does.
One part of the inventory fi gure is the value of the products that are ready
to be sold. That’s called fi nished goods inventory. A second part, usually
relevant only to manufacturers, is the value of products that are under
construction. Accountants dub that work-in-process inventory, or just WIP
(pronounced whip). Then, of course, there’s the inventory of raw materials
that will be used to make products. That’s called—stand back—raw mate-
rials inventory.
Accountants can (and do!) spend days on end talking about ways of
valuing inventory. We plan to spend no time at all, because it doesn’t re-
ally affect most managers’ jobs. (If your job is inventory management, of
course, the accountants’ discussion affects you greatly—and you should
fi nd a book on the topic.) However, different methods of inventory valu-
ation can often alter the assets side of a balance sheet signifi cantly. If the
company changes its method of valuing inventory during a given year, that
fact should appear in a footnote to the balance sheet. Many companies
detail how they accounted for their inventories in the footnotes, as Barnes
& Noble did in one recent annual report:
Merchandise inventories are stated at the lower of cost or market. Cost
is determined primarily by the retail inventory method under both the
fi rst-in, fi rst-out (FIFO) basis and the last-in, fi rst-out (LIFO) basis. The
Company uses the retail inventory method for 97% of the Company’s
merchandise inventories. As of April 30, 2011, and May 1, 2010, 87%
of the Company’s inventory on the retail inventory method was valued
under the FIFO basis. B&N College’s textbook and trade book invento-
ries are valued using the LIFO method, where the related reserve was not
H6061.indb 97H6061.indb 97 11/21/12 8:25:34 AM11/21/12 8:25:34 AM
Do
Not
Cop
y or
Pos
t
This document is authorized for use only by Liudmyla Feurstein at EBCM - European University of Munich until October 2014. Copying or posting is an infringement of
copyright. [email protected] or 617.783.7860.
98THE BALANCE SHEET REVEALS THE MOST
material to the recorded amount of the Company’s inventories or results
of operations.
What you do need to remember as a manager, however, is that all in-
ventory costs money. It is created at the expense of cash. (Maybe you’ve
heard the expression “All our cash is tied up in inventory,” though we hope
you don’t hear it too often.) In fact, this is one way companies can improve
their cash position. Decrease your inventory, other things being equal, and
you raise your company’s cash level. A company always wants to carry as
little inventory as possible, provided that it still has materials ready for its
manufacturing processes and products ready when customers come call-
ing. We’ll come back to this topic later in the book.
Property, Plant, and Equipment (PPE)
This line on the balance sheet includes buildings, machinery, trucks, com-
puters, and every other physical asset a company owns. The PPE fi gure is
the total number of dollars it cost to buy all the facilities and equipment
the company uses to operate the business. Note that the relevant cost here
is the purchase price. Without constant appraisals, nobody really knows
how much a company’s real estate or equipment might be worth on the
open market. So accountants, governed by the principle of conservatism,
say in effect, “Let’s use what we do know, which is the cost of acquiring
those assets.”
Another reason for using purchase price is to avoid more opportunities
to bias the numbers. Suppose an asset—land, for example—has actually in-
creased in value. If we wanted to “mark it up” on the balance sheet to its cur-
rent value, we would have to record a profi t on the income statement. But
that profi t would be based simply on someone’s opinion as to what the land
was worth today. This is not a good idea. Some companies go so far as to set
up corporate shells, often owned by a company executive or other insider,
and then sell assets to those shells. That allows them to record a profi t, just
the way they would if they were selling off assets. But it is not the kind of
profi t an investor or the Securities and Exchange Commission likes to see.
Later in this chapter we will discuss mark-to-market accounting, which
requires companies to value certain kinds of assets at their current mar-
ket value. For the moment, just remember that the basis for valuing most
H6061.indb 98H6061.indb 98 11/21/12 8:25:34 AM11/21/12 8:25:34 AM
Do
Not
Cop
y or
Pos
t
This document is authorized for use only by Liudmyla Feurstein at EBCM - European University of Munich until October 2014. Copying or posting is an infringement of
copyright. [email protected] or 617.783.7860.
99Assets
assets is their purchase price. Of course, the fact that companies rely on
purchase price to value their assets can create some striking anomalies.
Maybe you work for an entertainment company that bought land around
Los Angeles for $500,000 thirty years ago. The land could be worth $5 mil-
lion today—but it will still be valued at $500,000 on the balance sheet.
Sophisticated investors like to nose around in companies’ balance sheets in
hopes of fi nding such undervalued assets.
Less: Accumulated Depreciation
Land doesn’t wear out, so accountants don’t record any depreciation each
year. But buildings and equipment do. The point of accounting deprecia-
tion, however, isn’t to estimate what the buildings and equipment are worth
right now; the point is to allocate the investment in the asset over the time
it is used to generate revenue and profi t (remember the matching principle
discussed in chapter 5). The depreciation charge is a way of ensuring that
the income statement accurately refl ects the true cost of producing goods
or delivering services. To calculate accumulated depreciation, accountants
simply add up all the charges for depreciation they have taken since the day
an asset was bought.
We showed you in chapter 8 how a company can “magically” go from
unprofi table to profi table just by changing the way it depreciates its as-
sets. That art-of-fi nance magic extends to the balance sheet as well. If a
company decides its trucks can last six years rather than three, it will re-
cord a 50 percent smaller charge on its income statement year after year.
That means less accumulated depreciation on the balance sheet, a higher
fi gure for net PPE, and thus more assets. More assets, by the fundamental
accounting equation, translates into more owners’ equity in the form of
retained earnings.
Goodwill
Goodwill is found on the balance sheets of companies that have acquired
other companies. It’s the difference between what a company paid for an-
other company and what the physical assets of the acquired company are
worth.
OK, that was a mouthful. But it isn’t as complex as it sounds. Say you’re
the CEO of a company that is out shopping, and you spot a nice little
H6061.indb 99H6061.indb 99 11/21/12 8:25:34 AM11/21/12 8:25:34 AM
Do
Not
Cop
y or
Pos
t
This document is authorized for use only by Liudmyla Feurstein at EBCM - European University of Munich until October 2014. Copying or posting is an infringement of
copyright. [email protected] or 617.783.7860.
100THE BALANCE SHEET REVEALS THE MOST
warehousing business called MJQ Storage that fi ts your needs perfectly.
You agree to buy MJQ for $5 million. By the rules of accounting, if you pay
cash, the asset called cash on your balance sheet will decrease by $5 million.
That means other assets have to rise by $5 million. After all, the balance
sheet still has to balance. And you haven’t done anything so far that would
change liabilities or owners’ equity.
Now, watch closely. Since you are buying a collection of physical assets
(among other things), you will appraise those assets the way any buyer
would. Maybe you fi nd that MJQ’s buildings, shelving, forklifts, and com-
puters are worth $2 million. That doesn’t mean you made a bad deal. You
are buying a going concern with a name, talented and knowledgeable em-
ployees, and so on, and these so-called intangibles can in some cases be
much more valuable than the tangible assets. (How much would you pay
for the brand name Coca-Cola? Or for Dell Computer’s customer list?) In
our example, you’re buying $3 million worth of intangibles. Accountants
Acquisitions
An acquisition occurs when one company buys another. Often you’ll see in the newspaper the words merger or consolidation. Don’t be fooled: one company still bought the other. They just use a more neutral-sounding term to make the deal look better.
Intangibles
A company’s intangible assets include anything that has value but that you can’t touch or spend: employees’ skills, customer lists, proprietary knowledge, pat-ents, brand names, reputation, strategic strengths, and so on. Most of these assets are not found on the balance sheet unless an acquiring company pays for them and records them as goodwill. The exception is intellectual property, such as patents and copyrights. This can be shown on the balance sheet and amortized over its useful life.
H6061.indb 100H6061.indb 100 11/21/12 8:25:34 AM11/21/12 8:25:34 AM
Do
Not
Cop
y or
Pos
t
This document is authorized for use only by Liudmyla Feurstein at EBCM - European University of Munich until October 2014. Copying or posting is an infringement of
copyright. [email protected] or 617.783.7860.
101Assets
call that $3 million “goodwill.” The $3 million of goodwill and the $2 mil-
lion of physical assets add up to the $5 million you paid and the corre-
sponding $5 million increase in assets on the balance sheet.
And now we want to tell a little story about goodwill; it shows the art
of fi nance at work.
In years past, goodwill was amortized. (Remember, amortization is the
same idea as depreciation, except that it applies to intangible assets.) Assets
were typically depreciated over two to fi ve years, but goodwill was amor-
tized over thirty years. That was the rule.
Then the rule changed. The people who write those generally accepted
accounting principles—the Financial Accounting Standards Board, or
FASB—decided that if goodwill consists of the reputation, the customer
base, and so on of the company you are buying, then all those assets don’t
lose value over time. They actually may become more valuable over time. In
short, goodwill is more like land than it is like equipment. So not amortiz-
ing it helps accountants portray that accurate refl ection of reality that they
are always seeking.
But look at the effect. When you bought MJQ Storage, you wound
up with $3 million worth of goodwill on your balance sheet. Before the
rule change, you would have amortized the goodwill over thirty years at
$100,000 per year. In other words, you would have deducted $100,000 a
year from revenue, thereby reducing the profi tability of your company by
the same amount. Meanwhile, you’re depreciating MJQ’s physical assets
(worth $2 million) over, say, a four-year period at $500,000 per year. Again,
that $500,000 would be subtracted from revenue to determine profi t.
So what happens? Before the rule change, other things being equal, you
wanted to have more goodwill and less in physical assets, simply because
goodwill is amortized over a longer period of time, so the amount sub-
tracted from revenue to determine profi t is less (keeping profi ts higher).
You had an incentive to shop for companies where most of what you’d be
buying was goodwill, and you had an incentive to undervalue the physical
assets of the company you were buying. (Remember, it is often your own
people who are doing the appraisal of those assets!)
Today, goodwill sits on the books and isn’t amortized. Now nothing at
all is subtracted from revenue, and profi tability is correspondingly higher.
You have an even bigger incentive to look for companies without much in
H6061.indb 101H6061.indb 101 11/21/12 8:25:34 AM11/21/12 8:25:34 AM
Do
Not
Cop
y or
Pos
t
This document is authorized for use only by Liudmyla Feurstein at EBCM - European University of Munich until October 2014. Copying or posting is an infringement of
copyright. [email protected] or 617.783.7860.
102THE BALANCE SHEET REVEALS THE MOST
the way of physical assets, and even more of an incentive to undervalue
those assets. Tyco was one company that was accused of taking advantage
of this rule. Several years ago, as we noted earlier, Tyco was buying compa-
nies at breakneck speed—more than six hundred in two years’ time. Many
analysts felt that Tyco regularly undervalued the assets of these numerous
companies. Doing so would increase the goodwill included in all those ac-
quisitions and lower the depreciation Tyco had to take each year. That, in
turn, would make profi t higher and in theory would drive up Tyco’s share
price.
But eventually, analysts and investors noticed a fact that we alluded to
in part 1, namely that Tyco had too much goodwill on its books and too
little (relatively speaking) in the way of physical assets. They began focus-
ing on a measure called tangible net worth, which is just total assets minus
intangible assets minus liabilities. When this metric turns negative, inves-
tors tend to get nervous and often sell their stock.
Intellectual Property, Patents, and Other Intangibles
How do you account for the cost of creating a new software program that
you expect to generate revenue for years? What about the cost of develop-
ing a new wonder drug, which is protected by a twenty-year patent (from
the date of application)? Obviously, it makes no sense to record the whole
cost as an expense on the income statement in any given period, any more
than you would record the whole cost of buying a truck. Like a truck, the
software and the patent will help generate revenue in future accounting
periods. So these investments are considered intangible assets and should
be amortized over the life of the revenue stream they generate. By the same
token, however, R&D expenses that do not result in an asset likely to gener-
ate revenue should be recorded as an expense on the income statement.
You can see the potential for subjectivity here. Some software compa-
nies, for example, are famous for spending considerable sums on R&D, then
amortizing those sums over time, thus making their profi ts look higher.
Others choose to expense R&D as it is incurred—a more conservative ap-
proach. Amortization is fi ne if the R&D is actually expected to generate
revenue, but not if it isn’t. Computer Associates is one company that got
itself into trouble for amortizing R&D on products that had a question-
able future. But even when there is no question of fraud, you need to know
H6061.indb 102H6061.indb 102 11/21/12 8:25:34 AM11/21/12 8:25:34 AM
Do
Not
Cop
y or
Pos
t
This document is authorized for use only by Liudmyla Feurstein at EBCM - European University of Munich until October 2014. Copying or posting is an infringement of
copyright. [email protected] or 617.783.7860.
103Assets
how aggressive or conservative your company’s policies and practices on
amortization are. Like depreciation, amortization decisions can often have
a sizable effect on profi tability and owners’ equity.
Accruals and Prepaid Assets
To explain this line item, let’s look at a hypothetical example. Say you start
a bicycle manufacturing company, and you rent manufacturing space for
the entire year for $60,000. Since your company is a lousy credit risk—
nobody likes to do business with a start-up for just this reason—the land-
lord insists on payment up front.
Now, we know from the matching principle that it doesn’t make sense
to “book” the entire $60,000 in January as an expense on the income
statement. It’s rent for the whole year, and it has to be spread out over all
twelve months. So in January you put $5,000 on the income statement for
rent. But where does the other $55,000 go? You have to keep track of it
somewhere. Well, prepaid rent is one example of a prepaid asset. You have
bought something—you own the rights to that space for a year—so it is an
asset. And you keep track of assets on the balance sheet.
Every month, of course, you’ll have to move $5,000 out of the prepaid-
asset line on the balance sheet and put it in the income statement as an
expense for rent. That’s called an accrual, and the “account” on the balance
sheet that records what has not yet been expensed is called an accrued as-
set account. Though the terms are confusing, note that the practice is still
conservative: we’re keeping track of all our known expenses, and we’re also
tracking what we paid for in advance.
But the art of fi nance can creep in here as well, because there is room for
judgment on what to accrue and what to charge in any given period. Say,
for example, your company is developing a major advertising campaign.
The work is all done in January, and it comes to $1 million. The accoun-
tants might decide that this campaign will benefi t the company for two
years, so they would book the $1 million as a prepaid asset and charge one-
twenty-fourth of the cost each month on the income statement. A com-
pany facing a tough month is likely to decide that this is the best course—
after all, it’s better to deduct one-twenty-fourth of a million dollars from
profi ts than the whole million. But what if January is a great month? Then
the company might decide to “expense” the entire campaign—charge it all
H6061.indb 103H6061.indb 103 11/21/12 8:25:34 AM11/21/12 8:25:34 AM
Do
Not
Cop
y or
Pos
t
This document is authorized for use only by Liudmyla Feurstein at EBCM - European University of Munich until October 2014. Copying or posting is an infringement of
copyright. [email protected] or 617.783.7860.
104THE BALANCE SHEET REVEALS THE MOST
against January’s revenue—because, well, they aren’t sure that it will help
generate revenue during the next two years. Now they have an advertising
campaign that’s all paid for, and profi ts in the months to come will be cor-
respondingly higher. In a perfect world, our accounting friends would have
a crystal ball to tell them exactly how long that advertising campaign will
generate revenue. Since they don’t yet have such a device, they must rely
on estimates.
VALUING ASSETS: THE MARK-TO-MARKET RULE
Though most assets are valued at purchase price less accumulated depre-
ciation, there is one exception to this approach. It’s known as the mark-to-
market rule, and use of the rule is often called mark-to-market accounting.
The rule allows (and in some cases requires) certain classes of assets to be
listed at their current market value. To qualify for this kind of treatment,
assets must meet two criteria. One, their value must be able to be deter-
mined without an appraisal. Two, they must be held by the company as
short-term investments.
Publicly traded fi nancial assets such as stocks and bonds, whose value
is determined every day in the public markets, may meet these two criteria.
Imagine, for instance, that Amalgamated Services has a spare $100 million
dollars in cash on its balance sheet and chooses to buy 1 million shares of
IBM at $100 a share. Amalgamated lists its new current asset on the balance
sheet as “stock $100 million.” Three months later, the IBM stock is trading at
$110. Amalgamated now marks the 1 million shares up to $110 million and
records a gain of $10 million on its income statement (typically in the line
labeled “other income”). Of course, if the stock is at $95 after three months,
then Amalgamated’s stock holding must be marked down to $95 million,
and it must record a loss of $5 million in the income statement. Unlike in
conventional accounting, Amalgamated records these gains or losses while
it is still holding the stock. So mark-to-market accounting gains or losses
take place purely on paper.
The fi nancial crisis of 2008 revealed two issues surrounding this rule
that can have serious consequences in the capital markets. First, how does
one determine whether a certain group of assets is held for sale or held as
a long-term investment? Two businesses could have the same assets, one
H6061.indb 104H6061.indb 104 11/21/12 8:25:34 AM11/21/12 8:25:34 AM

Do
Not
Cop
y or
Pos
t
This document is authorized for use only by Liudmyla Feurstein at EBCM - European University of Munich until October 2014. Copying or posting is an infringement of
copyright. [email protected] or 617.783.7860.
105Assets
designating them as buy-and-sell and thus marking them to market, the
other planning to hold the assets and thus valuing them at cost. It seems
strange that the same assets can be presented differently, depending on an
organization’s intentions. Second, what happens when the market nearly
collapses or fails outright? In the toolbox following this part, we’ll see what
happened when hundreds of fi nancial institutions were forced to mark
their loan assets to market. The fi nancial crisis was in many ways a mark-
to-market crisis, as we explain in the toolbox. But if the crisis eases and the
institution then chooses to hold the assets until the market recovers, must
it still take the mark-to-market losses? This is a question that is still under
debate.
That’s it for assets. Add them all up, along with whatever extraneous
items you might fi nd, and you get the “total assets” line at the bottom of
the left side. Now it’s time to move on to the other side—liabilities and
owners’ equity.
H6061.indb 105H6061.indb 105 11/21/12 8:25:35 AM11/21/12 8:25:35 AM

Do
Not
Cop
y or
Pos
t
This document is authorized for use only by Liudmyla Feurstein at EBCM - European University of Munich until October 2014. Copying or posting is an infringement of
copyright. [email protected] or 617.783.7860.
1 2
On the Other SideLiabilities and Equity
WE SAID EARL IER THAT L IAB IL IT IES are what a company owes and equity
is its net worth. There’s another—only slightly different—way to
look at this side of the balance sheet, which is that it shows how
the assets were obtained. If a company borrows funds in any way, shape,
or form to obtain an asset, the borrowing is going to show up on one or
another of the liabilities lines. If it sells stock to obtain an asset, that will be
refl ected on one of the lines under owners’ equity.
TYPES OF LIABILITIES
But fi rst things fi rst, which on this side of the balance sheet means liabili-
ties, the fi nancial obligations a company owes to other entities. Liabilities
are always divided into two main categories. Current liabilities are those
that have to be paid off in less than a year. Long-term liabilities are
those that come due over a longer time frame. Liabilities are usually listed
on the balance sheet from shortest-term to longest-term, so the very layout
tells you something about what’s due when.
H6061.indb 106H6061.indb 106 11/21/12 8:25:35 AM11/21/12 8:25:35 AM
Do
Not
Cop
y or
Pos
t
This document is authorized for use only by Liudmyla Feurstein at EBCM - European University of Munich until October 2014. Copying or posting is an infringement of
copyright. [email protected] or 617.783.7860.
107On the Other Side
Current Portion of Long-Term Debt
If your company owes $100,000 to a bank on a long-term loan, maybe
$10,000 of it is due this year. So that’s the amount that shows up in the
current liabilities section of the balance sheet. The line will be labeled “cur-
rent portion of long-term debt” or something like that. The other $90,000
shows up under long-term liabilities.
Short-Term Loans
These are lines of credit and short-term revolving loans. These short-term
credit lines are usually secured by current assets such as accounts receiv-
able and inventory. The entire balance outstanding is shown here.
Accounts Payable
Accounts payable shows the amount the company owes its vendors. The
company receives goods and services from suppliers every day and typi-
cally doesn’t pay their bills for at least thirty days. The vendors, in effect,
have loaned the company money. Accounts payable shows how much was
owed on the date of the balance sheet. Any balance on a company’s credit
cards is usually included in accounts payable.
Accrued Expenses and Other Short-Term Liabilities
This catch-all category includes everything else the company owes. One
example is payroll. Let’s assume that you get paid on October 1. Does it
make sense to charge your pay as an expense on the income statement in
October? Probably not—your October paycheck is for work performed in
September. So the accountants would fi gure out or estimate how much
the company owes you on October 1 for work completed in September
and then charge those expenses to September. This is an accrued liability.
It’s like an internal bill in September for a payment to be made in October.
Accrued liabilities are part of the matching principle—we have matched
expenses with the revenue they help to bring in every month.
Deferred Revenue
Some companies have an item called deferred revenue on their balance
sheets. This is puzzling to the fi nancial novice: how can revenue be a
H6061.indb 107H6061.indb 107 11/21/12 8:25:35 AM11/21/12 8:25:35 AM
Do
Not
Cop
y or
Pos
t
This document is authorized for use only by Liudmyla Feurstein at EBCM - European University of Munich until October 2014. Copying or posting is an infringement of
copyright. [email protected] or 617.783.7860.
108THE BALANCE SHEET REVEALS THE MOST
liability? Well, a liability is a fi nancial obligation the company owes to oth-
ers. Deferred revenue represents money received for products or services
that have not yet been delivered. So it’s an obligation. Once the product or
service has been delivered, the corresponding revenue will be included in
the top line of the income statement, and it will come off the balance sheet.
Industries where you might see deferred revenue on the balance sheet in-
clude airlines (you pay before you fl y) and project-based businesses (a cli-
ent typically makes a down payment prior to the start of the work). This
method of dealing with revenue not yet earned is in line with the principle
of conservatism: don’t recognize gains until they are actually earned.
Long-Term Liabilities
Most long-term liabilities are loans. But there are also other liabilities that
you might see listed here. Examples include deferred bonuses or compen-
sation, deferred taxes, and pension liabilities. If these other liabilities are
substantial, this section of the balance sheet needs to be watched closely.
OWNERS’ EQUITY
Finally! Remember the equation? Owners’ equity is what’s left after we sub-
tract liabilities from assets. Equity includes the capital provided by inves-
tors and the profi ts retained by the company over time. Owners’ equity
goes by many names, including shareholders’ equity and stockholders’ eq-
uity. The owners’ equity line items listed in some companies’ balance sheets
Capital
The word means a number of things in business. Physical capital is plant, equipment, vehicles, and the like. Financial capital from an investor’s point of view is the stocks and bonds he holds; from a company’s point of view it is the shareholders’ equity investment plus whatever funds the company has borrowed. “Sources of capital” in an annual report shows where the company got its money. “Uses of capital” shows how the company used its money.
H6061.indb 108H6061.indb 108 11/21/12 8:25:35 AM11/21/12 8:25:35 AM
Do
Not
Cop
y or
Pos
t
This document is authorized for use only by Liudmyla Feurstein at EBCM - European University of Munich until October 2014. Copying or posting is an infringement of
copyright. [email protected] or 617.783.7860.
109On the Other Side
can be quite detailed and confusing. They typically include the following
categories.
Preferred Shares
Preferred shares—also known as preference stock or shares—are a specifi c
type of stock. People who hold preferred shares usually receive dividends
on their investment before the holders of common stock get a nickel. But
preferred shares typically carry a fi xed dividend, so their price doesn’t fl uc-
tuate as much as the price of common shares. Investors who hold pre-
ferred shares may not receive the full benefi t of a company’s growth in
value. When the company issues preferred shares, it sells them to investors
at a certain initial price. The value shown on the balance sheet refl ects that
price.
Most preferred shares do not carry voting rights. In a way, they’re more
like bonds than like common stock. The difference? With a bond, the
owner gets a fi xed coupon or interest payment, and with preferred shares
the owner gets a fi xed dividend. Companies use preferred stock to raise
money because it does not carry the same legal implications as debt. If a
company cannot pay a coupon on a bond, bondholders can force it into
bankruptcy. Holders of preferred shares normally can’t.
Common Shares or Common Stock
Unlike most preferred shares, common shares usually carry voting rights.
People who hold them can vote for members of the board of directors
(usually one share, one vote) and on any other matter that may be put be-
fore the shareholders. Common shares may or may not pay dividends. The
value shown on the balance sheet is based on the issuing price of the shares;
it’s shown as “par value” and “paid-in capital.”
Dividends
Dividends are funds distributed to shareholders taken from a company’s equity. In public companies, dividends are typically distributed at the end of a quarter or year.
H6061.indb 109H6061.indb 109 11/21/12 8:25:35 AM11/21/12 8:25:35 AM
Do
Not
Cop
y or
Pos
t
This document is authorized for use only by Liudmyla Feurstein at EBCM - European University of Munich until October 2014. Copying or posting is an infringement of
copyright. [email protected] or 617.783.7860.
110THE BALANCE SHEET REVEALS THE MOST
Retained Earnings
Retained earnings or accumulated earnings are the profi ts that have been
reinvested in the business instead of being paid out in dividends. The
number represents the total after-tax income that has been reinvested or
retained over the life of the business. Sometimes a company that holds a
lot of retained earnings in the form of cash—Microsoft is an example—
comes under pressure to pay out some of the money to shareholders, in the
form of dividends. After all, what shareholder wants to see his money just
sitting there in the company’s coffers, rather than being reinvested in pro-
ductive assets? Of course, you may see an accumulated defi cit—a negative
number—which indicates that the company has lost money over time.
So owners’ equity is what the shareholders would receive if the com-
pany were sold, right? Of course not! Remember all those rules, estimates,
and assumptions that affect the balance sheet. Assets are recorded at their
acquisition price less accumulated depreciation. Goodwill is piled up with
every acquisition the company makes, and it is never amortized. And of
course the company has intangible assets of its own, such as its brand name
and customer list, which don’t show up on the balance sheet at all. Moral:
the market value of a company almost never matches its equity or book
value on the balance sheet. The actual market value of a company is what a
willing buyer would pay for it. In the case of a public company, that value
is estimated by calculating the company’s market cap, or the number of
shares outstanding times the share price on any given day. In the case of
private companies, the market value can be estimated by one of the valua-
tion methods described in part 1.
H6061.indb 110H6061.indb 110 11/21/12 8:25:35 AM11/21/12 8:25:35 AM
Do
Not
Cop
y or
Pos
t
This document is authorized for use only by Liudmyla Feurstein at EBCM - European University of Munich until October 2014. Copying or posting is an infringement of
copyright. [email protected] or 617.783.7860.
1 3
Why the Balance Sheet Balances
IF YOU LEARNED IN SCHOOL about the fundamental accounting equation,
the instructor probably said something like this: “It’s called the balance
sheet because it balances. Assets always equal liabilities plus owners’ eq-
uity.” But even if you dutifully wrote down that answer on the exam, you
may be less than 100 percent crystal-clear on why the balance sheet bal-
ances. So here are three ways of understanding it.
REASONS FOR BALANCE
First, let’s go back to an individual. You can look at a company’s balance
sheet just the same way you’d look at a person’s net worth. Net worth has to
equal what he owns minus what he owes, because that’s the way we defi ne
the term. The fi rst formulation of the “individual” equation in chapter 10
is owns – owes = net worth. It’s the same for a business. Owners’ equity is
defi ned as assets minus liabilities.
Second, look at what the balance sheet shows. On one side are the as-
sets, which is what the company owns. On the other side are the liabilities
and equity, which show how the company obtained what it owns. Since
you can’t get something for nothing, the “owns” side and the “how we ob-
tained it” side will always be in balance. They have to be.
H6061.indb 111H6061.indb 111 11/21/12 8:25:35 AM11/21/12 8:25:35 AM
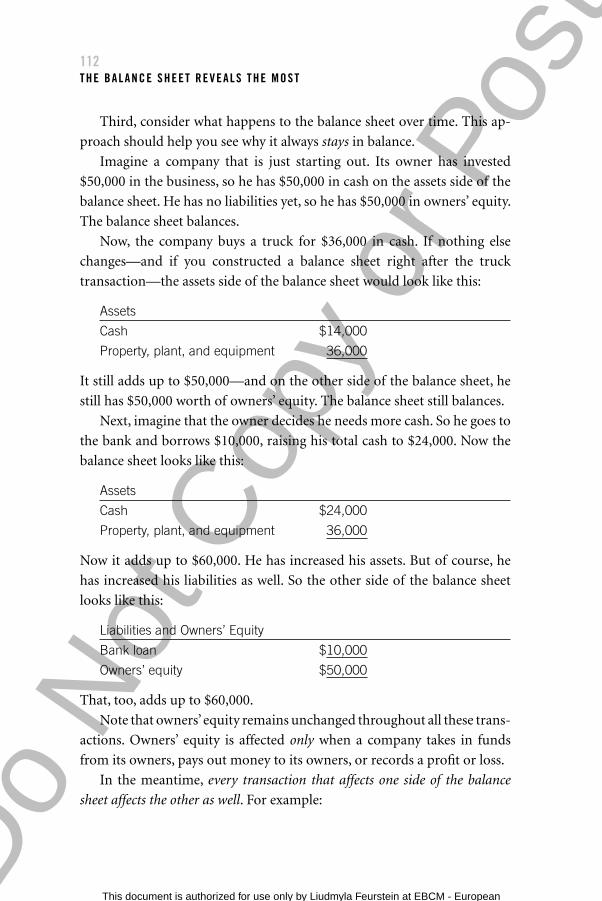
Do
Not
Cop
y or
Pos
t
This document is authorized for use only by Liudmyla Feurstein at EBCM - European University of Munich until October 2014. Copying or posting is an infringement of
copyright. [email protected] or 617.783.7860.
112THE BALANCE SHEET REVEALS THE MOST
Third, consider what happens to the balance sheet over time. This ap-
proach should help you see why it always stays in balance.
Imagine a company that is just starting out. Its owner has invested
$50,000 in the business, so he has $50,000 in cash on the assets side of the
balance sheet. He has no liabilities yet, so he has $50,000 in owners’ equity.
The balance sheet balances.
Now, the company buys a truck for $36,000 in cash. If nothing else
changes—and if you constructed a balance sheet right after the truck
transaction—the assets side of the balance sheet would look like this:
Assets
Cash $14,000
Property, plant, and equipment 36,000
It still adds up to $50,000—and on the other side of the balance sheet, he
still has $50,000 worth of owners’ equity. The balance sheet still balances.
Next, imagine that the owner decides he needs more cash. So he goes to
the bank and borrows $10,000, raising his total cash to $24,000. Now the
balance sheet looks like this:
Assets
Cash $24,000
Property, plant, and equipment 36,000
Now it adds up to $60,000. He has increased his assets. But of course, he
has increased his liabilities as well. So the other side of the balance sheet
looks like this:
Liabilities and Owners’ Equity
Bank loan $10,000
Owners’ equity $50,000
That, too, adds up to $60,000.
Note that owners’ equity remains unchanged throughout all these trans-
actions. Owners’ equity is affected only when a company takes in funds
from its owners, pays out money to its owners, or records a profi t or loss.
In the meantime, every transaction that affects one side of the balance
sheet affects the other as well. For example:
H6061.indb 112H6061.indb 112 11/21/12 8:25:35 AM11/21/12 8:25:35 AM

Do
Not
Cop
y or
Pos
t
This document is authorized for use only by Liudmyla Feurstein at EBCM - European University of Munich until October 2014. Copying or posting is an infringement of
copyright. [email protected] or 617.783.7860.
113Why the Balance Sheet Balances
• A company uses $100,000 cash to pay off a loan. The cash line on
the assets side decreases by $100,000, and the liabilities line on the
other side decreases by the same amount. So the balance sheet stays in
balance.
• A company buys a $100,000 machine, paying $50,000 down and ow-
ing the rest. Now the cash line is $50,000 less than it used to be—but
the new machine shows up on the assets side at $100,000. So total as-
sets increase by $50,000. Meanwhile, the $50,000 owed on the machine
shows up on the liabilities side. Again, we’re still in balance.
As long as you remember the fundamental fact that transactions affect
both sides of the balance sheet, you’ll be OK. That’s why the balance sheet
balances. Understanding this point is a basic building block of fi nancial
intelligence. Remember, if assets don’t equal liabilities and equity, you do
not have a balance sheet.
H6061.indb 113H6061.indb 113 11/21/12 8:25:35 AM11/21/12 8:25:35 AM
Do
Not
Cop
y or
Pos
t
This document is authorized for use only by Liudmyla Feurstein at EBCM - European University of Munich until October 2014. Copying or posting is an infringement of
copyright. [email protected] or 617.783.7860.
1 4
The Income Statement Affects the Balance Sheet
SO FAR WE HAVE BEEN CONSIDERING the balance sheet by itself. But here’s
one of the best-kept secrets in the world of fi nancial statements: a
change in one statement nearly always has an impact on the other state-
ments. So when you’re managing the income statement, you’re also having
an effect on the balance sheet.
PROFITS AND EQUITY
To see the relationship between profi t, from the income statement, and eq-
uity, which appears on the balance sheet, we’ll look at a couple of examples.
Here’s a highly simplifi ed balance sheet for a brand-new (and very small!)
company:
Assets
Cash $25
Accounts receivable 0
Total assets $25
Liabilities and Owners’ Equity
Accounts payable $ 0
Owners’ equity $25
H6061.indb 114H6061.indb 114 11/21/12 8:25:35 AM11/21/12 8:25:35 AM
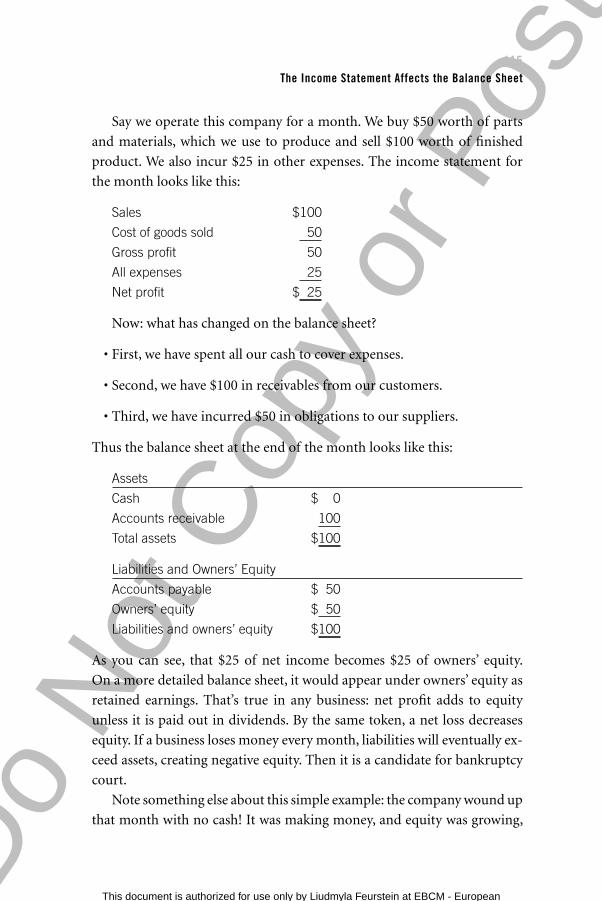
Do
Not
Cop
y or
Pos
t
This document is authorized for use only by Liudmyla Feurstein at EBCM - European University of Munich until October 2014. Copying or posting is an infringement of
copyright. [email protected] or 617.783.7860.
115The Income Statement Affects the Balance Sheet
Say we operate this company for a month. We buy $50 worth of parts
and materials, which we use to produce and sell $100 worth of fi nished
product. We also incur $25 in other expenses. The income statement for
the month looks like this:
Sales $100
Cost of goods sold 50
Gross profi t 50
All expenses 25
Net profi t $ 25
Now: what has changed on the balance sheet?
• First, we have spent all our cash to cover expenses.
• Second, we have $100 in receivables from our customers.
• Third, we have incurred $50 in obligations to our suppliers.
Thus the balance sheet at the end of the month looks like this:
Assets
Cash $ 0
Accounts receivable 100
Total assets $100
Liabilities and Owners’ Equity
Accounts payable $ 50
Owners’ equity $ 50
Liabilities and owners’ equity $100
As you can see, that $25 of net income becomes $25 of owners’ equity.
On a more detailed balance sheet, it would appear under owners’ equity as
retained earnings. That’s true in any business: net profi t adds to equity
unless it is paid out in dividends. By the same token, a net loss decreases
equity. If a business loses money every month, liabilities will eventually ex-
ceed assets, creating negative equity. Then it is a candidate for bankruptcy
court.
Note something else about this simple example: the company wound up
that month with no cash! It was making money, and equity was growing,
H6061.indb 115H6061.indb 115 11/21/12 8:25:35 AM11/21/12 8:25:35 AM
Do
Not
Cop
y or
Pos
t
This document is authorized for use only by Liudmyla Feurstein at EBCM - European University of Munich until October 2014. Copying or posting is an infringement of
copyright. [email protected] or 617.783.7860.
116THE BALANCE SHEET REVEALS THE MOST
but it had nothing in the bank. So a good manager needs to be aware of
how both cash and profi ts interact on the balance sheet. This is a topic we’ll
return to in part 4, when we take up the cash fl ow statement.
AND MANY OTHER EFFECTS
The relationship between profi ts and equity isn’t the only link between
changes in the income statement and changes on the balance sheet. Far
from it. Every sale recorded on the income statement generates an increase
either in cash (if it’s a cash sale) or in receivables. Every payroll dollar re-
corded under COGS or under operating expenses represents a dollar less
on the cash line or a dollar more on the accrued expenses line of the bal-
ance sheet. A purchase of materials adds to accounts payable, and so on.
And of course, all these changes have an effect on total assets or liabilities.
Overall, if a manager’s job is to boost profi tability, he or she can have
a positive effect on the balance sheet, just because profi ts increase equity.
But it isn’t quite so simple, because it matters how the company earns those
profi ts, and it matters what happens to the other assets and liabilities on
the balance sheet itself. For example:
• A plant manager hears of a good deal on an important raw material
and asks the purchasing department to buy a lot of it. Makes sense,
right? Not necessarily. The inventory line on the balance sheet in-
creases. The accounts payable line increases a corresponding amount.
Eventually, the company will have to draw down its cash to cover the
accounts payable—possibly long before the material is used to gener-
ate revenue. Meanwhile, the company has to pay for warehousing the
inventory, and it may need to borrow money to cover the decrease
in cash. Figuring out whether to take advantage of the deal requires
detailed analysis; be sure to consider all of the fi nancial issues when
making such decisions.
• A sales manager is looking to boost revenue and profi t, and decides
to target smaller businesses as customers. Is it a good idea? Maybe
not. Smaller customers may not be as good credit risks as larger ones.
Accounts receivable may rise disproportionately because the custom-
ers are slower to pay. The accountants may need to increase that “bad
H6061.indb 116H6061.indb 116 11/21/12 8:25:35 AM11/21/12 8:25:35 AM
Do
Not
Cop
y or
Pos
t
This document is authorized for use only by Liudmyla Feurstein at EBCM - European University of Munich until October 2014. Copying or posting is an infringement of
copyright. [email protected] or 617.783.7860.
117The Income Statement Affects the Balance Sheet
debt” allowance, which reduces profi t, assets, and thus equity. The fi -
nancially intelligent sales manager will need to investigate pricing pos-
sibilities: can he increase gross margin to compensate for the increased
risk on sales to smaller customers?
• An IT manager makes a decision to buy a new computer system,
believing that the new system will boost productivity and therefore
contribute to profi tability. But how is the new equipment going to be
paid for? If a company is overleveraged—that is, if it has a heavy debt
load compared with its equity—borrowing the money to pay for the
system may not be a good idea. Perhaps it will need to issue new stock
and therefore increase its equity investment. Making decisions about
how to get the capital required to run a business is the job of the chief
fi nancial offi cer and the treasurer, not the IT manager. But an under-
standing of the company’s cash and debt situation should inform the
manager’s decision about when to buy the new equipment.
Any manager, in short, may want to step back now and then and look
at the big picture. Consider not just the one line item on the income state-
ment that you are focusing on, but the balance sheet as well (and the cash
fl ow statement, which we’ll get to shortly). When you do, your thinking,
your work, and your decisions will be “deeper”—that is, they will consider
more factors, and you’ll be able to talk about their impact with greater nu-
ance and understanding. Besides, imagine talking to your CFO about the
impact of profi t on equity: he’s likely to be impressed (even shocked).
ASSESSING A COMPANY’S HEALTH
Remember, we said at the beginning of this part that savvy investors typi-
cally pore over a company’s balance sheet fi rst. The reason is that the bal-
ance sheet answers a lot of questions—questions like the following:
• Is the company solvent? That is, do its assets outweigh its liabilities, so
that owners’ equity is a positive number?
• Can the company pay its bills? Here the important numbers are cur-
rent assets, particularly cash, compared with current liabilities. More
on this in part 5, on ratios.
H6061.indb 117H6061.indb 117 11/21/12 8:25:35 AM11/21/12 8:25:35 AM
Do
Not
Cop
y or
Pos
t
This document is authorized for use only by Liudmyla Feurstein at EBCM - European University of Munich until October 2014. Copying or posting is an infringement of
copyright. [email protected] or 617.783.7860.
118THE BALANCE SHEET REVEALS THE MOST
• Has owners’ equity been growing over time? A comparison of balance
sheets over a period of time will show whether the company has been
moving in the right direction.
These are simple, basic questions, of course. But investors can learn
much more from detailed examination of the balance sheet and its foot-
notes and from comparisons between the balance sheet and other state-
ments. How important is goodwill to the company’s “total assets” line?
What assumptions have been used to determine depreciation, and how im-
portant is that? (Remember Waste Management.) Is the cash line increas-
ing over time—usually a good sign—or is it decreasing? If owners’ equity
is rising, is that because the company has required an infusion of capital,
or is it because the company has been making money?
The balance sheet, in short, helps to show whether a company is fi nan-
cially healthy. All the statements help you make that judgment, but the
balance sheet—a company’s cumulative GPA—may be the most important
of all.
H6061.indb 118H6061.indb 118 11/21/12 8:25:35 AM11/21/12 8:25:35 AM
Do
Not
Cop
y or
Pos
t
This document is authorized for use only by Liudmyla Feurstein at EBCM - European University of Munich until October 2014. Copying or posting is an infringement of
copyright. [email protected] or 617.783.7860.
Part ThreeToolbox
EXPENSE? OR CAPITAL EXPENDITURE?
When a company buys a piece of capital equipment, the cost doesn’t show
up on the income statement; rather, the new asset appears on the bal-
ance sheet, and only the depreciation appears on the income statement as
a charge against profi t. You might think the distinction between expense
(showing up on the income statement) and capital expenditure (showing
up on the balance sheet) would be clear and simple. But of course it isn’t.
Indeed, it’s a prime canvas for the art of fi nance.
Consider that taking a big item off the income statement and put-
ting it on the balance sheet—so that only the depreciation shows up as a
charge against profi t—can have the effect of increasing profi t considerably.
WorldCom, mentioned in chapter 1, is the classic case study. A large por-
tion of WorldCom’s expenses consisted of so-called line costs. These were
fees it paid to local phone companies to use their phone lines. Line costs
were normally treated as ordinary operating expenses, but you could argue
(albeit incorrectly) that some of them were actually investments in new
markets and wouldn’t start paying off for years. That was the logic pursued
by CFO Scott Sullivan, anyway, who began “capitalizing” his company’s
line costs. Bingo: these expenses disappeared off the income statement, and
profi ts rose by billions of dollars. To Wall Street, it appeared that WorldCom
was suddenly generating much more in profi ts than it had before—and no
one caught on until later, when the whole house of cards collapsed.
WorldCom took an overaggressive approach toward capitalizing its costs
and ended up in hot water. But some companies will treat the occasional
H6061.indb 119H6061.indb 119 11/21/12 8:25:35 AM11/21/12 8:25:35 AM
Do
Not
Cop
y or
Pos
t
This document is authorized for use only by Liudmyla Feurstein at EBCM - European University of Munich until October 2014. Copying or posting is an infringement of
copyright. [email protected] or 617.783.7860.
120THE BALANCE SHEET REVEALS THE MOST
questionable item as a capital expenditure just to pump up their earnings
a little. Does yours?
THE IMPACT OF MARK-TO-MARKET ACCOUNTING
Mark-to-market accounting, as we explained in chapter 11, involves valu-
ing certain fi nancial assets at their current prices rather than by their his-
torical cost. The fi nancial crisis that began in 2008 was in many respects a
mark-to-market accounting crisis. Let’s see why.
First, consider a simplifi ed accounting of a bank’s assets and liabilities.
Its assets include loans made to others plus cash. Its liabilities include cus-
tomer deposits such as checking and savings account balances. Fundamen-
tally, a bank makes money by taking deposits and then lending that money
out at a higher rate than it must pay its depositors.
In the 1980s, however, many savings and loan institutions—small banks
that specialized in home mortgages—found themselves in a pickle. Their
assets consisted mainly of long-term mortgages, which paid a relatively low
interest rate. Meanwhile, depositors were demanding high interest rates on
their deposits because infl ation at the time was so high. To keep the deposi-
tors from withdrawing their funds, the S&Ls had to pay out more in inter-
est than they were making on their assets. In a matter of months, hundreds
of them became insolvent.
As a result of this issue, the government then began requiring fi nancial
institutions to maintain a balance between the duration of their loans and
their deposits. That meant the banks couldn’t offer long-term mortgages
because depositors didn’t want to tie up their money for that long. To solve
the problem, the government commissioned two enterprises known as
Fannie Mae and Freddie Mac to buy mortgages from the banks, package
them into securities, and sell the securities to investors. These new instru-
ments were known as mortgage-backed securities, and they were highly
popular. They paid a good interest rate, and they seemed safe. The loans
that Freddie and Fannie could buy had to meet certain requirements, and
were known as prime loans.
After several years, other fi nancial organizations began buying mort-
gages that did not fi t the requirements for prime loans. They packaged
these riskier “subprime” loans into securities and sold the securities to
H6061.indb 120H6061.indb 120 11/21/12 8:25:36 AM11/21/12 8:25:36 AM
Do
Not
Cop
y or
Pos
t
This document is authorized for use only by Liudmyla Feurstein at EBCM - European University of Munich until October 2014. Copying or posting is an infringement of
copyright. [email protected] or 617.783.7860.
121Part Three Toolbox
investors. Soon, even Freddie and Fannie were allowed to buy subprime
mortgages, since the government believed that doing so would help more
people become homeowners. All this created an environment where al-
most anybody could get a mortgage. That boosted demand for housing,
which drove up housing prices and seemed to provide investors even more
safety. With home prices rising, any default would always be covered by
higher home values.
Since banks were originating these mortgages and selling them within
a week to a ready market, the mortgages were considered mark-to-market
assets on their balance sheets. Many banks held billions of dollars’ worth
of mortgages that they planned to resell for a profi t. But then the housing
market began its collapse. Prices fell. More homeowners defaulted. Most
investors quit buying the mortgage-backed securities, and the middlemen
who created them quit buying mortgages from the banks. With no ready
buyers, the value of the mortgages held by the banks plunged.
Now let’s go back to the mark-to-market rule, which said that the bank
must mark these mortgages down to their current market value. If a bank
held $10 billion worth of mortgages and the market dropped 10 percent, it
would have to record a loss of $1 billion. That might wipe out all its equity,
and the bank would have to be shut down.
In the fourth quarter of 2008, something very much like this scenario
happened to hundreds of banks across the United States. News reports told
the public about the “toxic” assets the banks couldn’t sell. The government
responded with the $800 billion Troubled Asset Relief Program (TARP)
to bail out many of the troubled banks. In many cases, however, the banks
were not actually insolvent: borrowers were still paying, and the banks
could rely on the interest rate spread to meet the needs of depositors. But
the mark-to-market rule drove them to their knees.
Since the crisis, the Financial Accounting Standards Board has modi-
fi ed the mark-to-market rules for fi nancial institutions in ways that limits
the losses a bank might need to take in such circumstances. But the board’s
moves were too little and too late to affect the crisis.
H6061.indb 121H6061.indb 121 11/21/12 8:25:36 AM11/21/12 8:25:36 AM

Do
Not
Cop
y or
Pos
t
This document is authorized for use only by Liudmyla Feurstein at EBCM - European University of Munich until October 2014. Copying or posting is an infringement of
copyright. [email protected] or 617.783.7860.H6061.indb 122H6061.indb 122 11/21/12 8:25:36 AM11/21/12 8:25:36 AM

Do
Not
Cop
y or
Pos
t
This document is authorized for use only by Liudmyla Feurstein at EBCM - European University of Munich until October 2014. Copying or posting is an infringement of
copyright. [email protected] or 617.783.7860.
Part Four
Cash Is King
H6061.indb 123H6061.indb 123 11/21/12 8:25:36 AM11/21/12 8:25:36 AM

Do
Not
Cop
y or
Pos
t
This document is authorized for use only by Liudmyla Feurstein at EBCM - European University of Munich until October 2014. Copying or posting is an infringement of
copyright. [email protected] or 617.783.7860.H6061.indb 124H6061.indb 124 11/21/12 8:25:36 AM11/21/12 8:25:36 AM
Do
Not
Cop
y or
Pos
t
This document is authorized for use only by Liudmyla Feurstein at EBCM - European University of Munich until October 2014. Copying or posting is an infringement of
copyright. [email protected] or 617.783.7860.
1 5
Cash Is a Reality Check
MANY MANAGERS ARE TOO BUSY worrying about income-statement
measures such as EBITDA to give cash much notice. Boards of di-
rectors and outside analysts sometimes focus too heavily on the
balance sheet. But there is one investor who watches cash closely: Warren
Buffett.
Warren Buffett may be the single greatest investor of all time. His
company, Berkshire Hathaway, has invested in scores of companies and
achieved astonishing results. From 2006 through 2010, the book value of
Berkshire Hathaway—a conservative indicator of its worth—rose at an av-
erage annual rate of 10.0 percent, compared with 2.3 percent for the S&P
500, a broad gauge of publicly traded stocks. That continued an excep-
tional investment performance dating all the way back to 1965. How does
Buffett do it? Many people have written books attempting to explain his in-
vesting philosophy and analytical approach. But in our opinion it all boils
down to just three simple precepts. First, he evaluates a business on its
long-term rather than its short-term prospects. Second, he always looks for
businesses he understands. (This led him to avoid many Internet-related
investments.) And third, when he examines fi nancial statements, he places
the greatest emphasis on a measure of cash fl ow that he calls owner earn-
ings. Warren Buffett has taken fi nancial intelligence to a whole new level,
and his net worth refl ects it. How interesting that, to him, cash is king.
H6061.indb 125H6061.indb 125 11/21/12 8:25:36 AM11/21/12 8:25:36 AM
Do
Not
Cop
y or
Pos
t
This document is authorized for use only by Liudmyla Feurstein at EBCM - European University of Munich until October 2014. Copying or posting is an infringement of
copyright. [email protected] or 617.783.7860.
126CASH IS K ING
WHY CASH IS KING
Let’s look at that third element of the fi nancial statements—cash—in
more detail. Why target cash fl ow as a key measure of business perfor-
mance? Why not just profi t, as found on the income statement? Why not
just a company’s assets or owners’ equity, as revealed by the balance sheet?
For one thing, profi t is not the same as cash, as we explain in chapter 16.
Profi t is based on promises, not money coming in. So if you want to know
whether your company has cash to pay employees, pay its bills, and even
invest in equipment, you need to study cash fl ow.
Then, too, the income statement and balance sheet, however useful,
have all sorts of potential biases, a result of the assumptions and estimates
that are built into them. Cash is different. Look at a company’s cash fl ow
statement, and you are indirectly peering into its bank account. Today, after
all the fi nancial turmoil of the past fi fteen years, cash fl ow is the darling of
Wall Street. It has become a prominent measure by which analysts evaluate
companies. But Warren Buffett has been looking at cash all along because
he knows that it’s the number least affected by the art of fi nance.
Why do some managers fail to pay attention to cash? There are any
number of reasons. In the past, nobody asked them to (though this is be-
ginning to change). Folks in the fi nance organization often believe that
cash is their concern and nobody else’s. But often, the reason is simply a
lack of fi nancial intelligence. Managers don’t understand the accounting
rules that determine profi t, so they assume that profi t is pretty much the
same as net cash coming in. Some don’t believe that their actions affect
Owner Earnings
Owner earnings is a measure of the company’s ability to generate cash over a period of time. We like to say it is the money an owner could take out of his busi-ness and spend for his own benefi t. Owner earnings is an important measure because it allows for the continuing capital expenditures that will be necessary to maintain a healthy business. Profi t and even operating cash fl ow measures do not. More about owner earnings in the toolbox at the end of this part.
H6061.indb 126H6061.indb 126 11/21/12 8:25:36 AM11/21/12 8:25:36 AM

Do
Not
Cop
y or
Pos
t
This document is authorized for use only by Liudmyla Feurstein at EBCM - European University of Munich until October 2014. Copying or posting is an infringement of
copyright. [email protected] or 617.783.7860.
127Cash Is a Reality Check
their company’s cash situation; others may believe it, but they don’t un-
derstand how.
There’s another reason, too, which is that the language on the cash fl ow
statement is a little arcane. Most cash fl ow statements are hard for a nonfi -
nancial person to read, let alone understand. But talk about an investment
that pays off: if you take the time to understand cash, you can cut right
through a lot of the smoke and mirrors created by your company’s fi nan-
cial artists. You can see how good a job your company is doing at turning
profi t into cash. You can spot early warning signs of trouble, and you will
know how to manage so that cash fl ow is healthy. Cash is a reality check.
One of us, Joe, learned about the importance of cash when he was a
fi nancial analyst at a small company early in his career. The company was
struggling, and everyone knew it. One day the CFO and the controller were
both out golfi ng and were unreachable. (This was in the days before every-
body had a cell phone, which shows you how old Joe is.) The banker called
the offi ce and talked with the CEO. Evidently, the CEO didn’t like what
he was hearing from the banker and felt he had better talk to someone in
accounting or fi nance. So he passed the call to Joe. Joe learned from the
banker that the company’s credit line was maxed out. “Given that tomor-
row is payday,” the banker said, “we’re curious about what your plan is to
cover payroll.” Thinking quickly (as always), Joe replied, “Um—can I call
you back?” He then did some research and found that a big customer owed
the company a good deal of money and that the check—really—was in the
mail. He told the banker this, and the banker agreed to cover payroll, pro-
vided Joe brought the customer’s check to the bank the minute it arrived.
In fact, the check arrived that same day, but after the bank closed. So
fi rst thing the next morning, Joe drove to the bank, check in hand. He ar-
rived a few minutes before the bank opened, and noticed that a line had
already formed. In fact, he saw that several employees from his company
were already there, holding their paychecks. One of them accosted him and
said, “So you fi gured it out too, huh?” “Figured what out?” Joe asked. The
guy looked at him with something resembling pity. “Figured it out. We’ve
been taking our paychecks to the bank every Friday fi rst break we got. We
cash ’em and then deposit the cash in our own banks. That way, we can
make sure the checks don’t bounce—and if the bank won’t cash them, we
can spend the rest of the day looking for a job.”
H6061.indb 127H6061.indb 127 11/21/12 8:25:36 AM11/21/12 8:25:36 AM

Do
Not
Cop
y or
Pos
t
This document is authorized for use only by Liudmyla Feurstein at EBCM - European University of Munich until October 2014. Copying or posting is an infringement of
copyright. [email protected] or 617.783.7860.
128CASH IS K ING
That was one day Joe’s fi nancial intelligence took a big leap upward. He
realized what Warren Buffett already knew: it’s cash that keeps a company
alive, and cash fl ow is a critical measure of its fi nancial health. You need
people to run the business—any business. You need a place of business,
telephones, electricity, computers, supplies, and so on. And you can’t pay
for all these things with profi ts, because profi ts aren’t real money. Cash is.
H6061.indb 128H6061.indb 128 11/21/12 8:25:36 AM11/21/12 8:25:36 AM
Do
Not
Cop
y or
Pos
t
This document is authorized for use only by Liudmyla Feurstein at EBCM - European University of Munich until October 2014. Copying or posting is an infringement of
copyright. [email protected] or 617.783.7860.
1 6
Profi t ≠ Cash(and You Need Both)
W HY I S PROF IT NOT THE SAME AS CASH COMING IN? Some reasons are
pretty obvious: cash may be coming in from loans or from inves-
tors, and that cash isn’t going to show up on the income statement
at all. But even operating cash fl ow, which we’ll explain in detail in chap-
ter 17, is not at all the same as net profi t. There are three essential reasons:
• Revenue is booked at sale. One reason is the fundamental fact that we
explained in our discussion of the income statement. A sale is re-
corded whenever a company delivers a product or service. Ace Print-
ing Company delivers $1,000 worth of brochures to a customer; Ace
Printing Company records revenues of $1,000, and theoretically it
could record a profi t by subtracting its costs and expenses from that
revenue. But no cash has changed hands, because Ace’s customer typi-
cally has thirty days or more to pay. Since profi t starts with revenue,
it always refl ects customers’ promises to pay. Cash fl ow, by contrast,
always refl ects cash transactions.
• Expenses are matched to revenue. The purpose of the income state-
ment is to tote up all the costs and expenses associated with generat-
ing revenue during a given time period. As we saw in part 2, however,
those expenses may not be the ones that were actually paid during
H6061.indb 129H6061.indb 129 11/21/12 8:25:36 AM11/21/12 8:25:36 AM
Do
Not
Cop
y or
Pos
t
This document is authorized for use only by Liudmyla Feurstein at EBCM - European University of Munich until October 2014. Copying or posting is an infringement of
copyright. [email protected] or 617.783.7860.
130CASH IS K ING
that time period. Some may have been paid for earlier (as with the
start-up that had to pay for a year’s rent in advance). Most will be paid
for later, when vendors’ bills come due. So the expenses on the income
statement do not refl ect cash going out. The cash fl ow statement,
however, always measures cash in and out the door during a particular
time period.
• Capital expenditures don’t count against profi t. Remember the tool-
box at the end of part 3? A capital expenditure doesn’t appear on the
income statement when it occurs; only as the item depreciates is its
cost charged against revenue. So a company can buy trucks, machin-
ery, computer systems, and so on, and the expense will appear on the
income statement only gradually, over the useful life of each item.
Cash, of course, is another story: all those items often are paid for long
before they have been fully depreciated, and the cash used to pay for
them will be refl ected in the cash fl ow statement.
You may be thinking that in the long run cash fl ow will pretty much
track net profi t. Accounts receivable will be collected, so sales will turn into
cash. Accounts payable will be paid, so expenses will more or less even out
from one time period to the next. And capital expenditures will be depreci-
ated, so that over time the charges against revenue from depreciation will
more or less equal the cash being spent on new assets. All this is true, to
a degree, at least for a mature, well-managed company. But the difference
between profi t and cash can create all sorts of mischief in the meantime.
PROFIT WITHOUT CASH
We’ll illustrate this point by comparing two simple companies with two
dramatically different profi t and cash positions.
Sweet Dreams Bakery is a new cookies-and-cakes manufacturer that
supplies specialty grocery stores. The founder has lined up orders based
on her unique home-style recipes, and she’s ready to launch on January 1.
We’ll assume she has $10,000 cash in the bank, and we’ll also assume that
in the fi rst three months her sales are $20,000, $30,000, and $45,000. Cost
of goods sold is 60 percent of sales, and her monthly operating expenses
are $10,000.
H6061.indb 130H6061.indb 130 11/21/12 8:25:36 AM11/21/12 8:25:36 AM
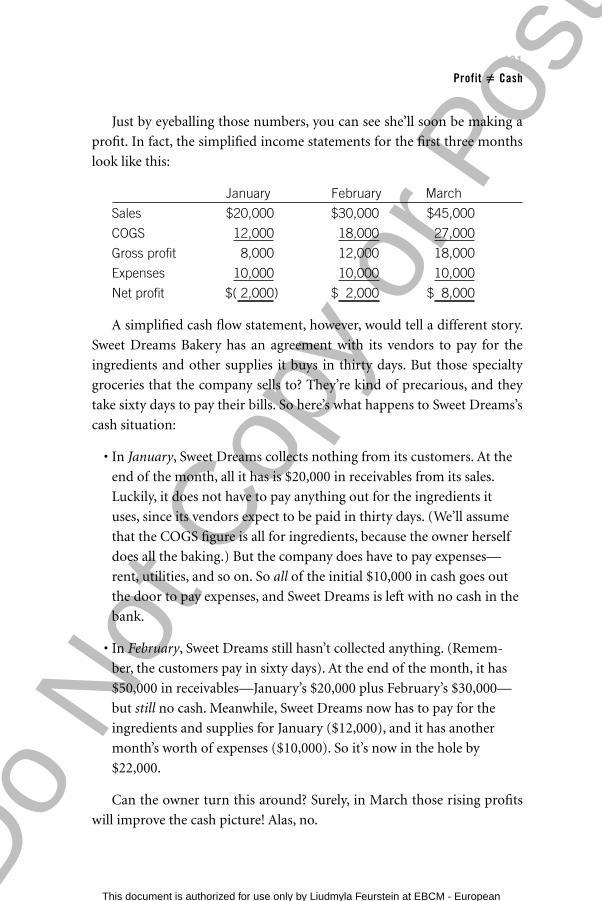
Do
Not
Cop
y or
Pos
t
This document is authorized for use only by Liudmyla Feurstein at EBCM - European University of Munich until October 2014. Copying or posting is an infringement of
copyright. [email protected] or 617.783.7860.
131Profit ≠ Cash
Just by eyeballing those numbers, you can see she’ll soon be making a
profi t. In fact, the simplifi ed income statements for the fi rst three months
look like this:
January February March
Sales $20,000 $30,000 $45,000
COGS 12,000 18,000 27,000
Gross profi t 8,000 12,000 18,000
Expenses 10,000 10,000 10,000
Net profi t $( 2,000) $ 2,000 $ 8,000
A simplifi ed cash fl ow statement, however, would tell a different story.
Sweet Dreams Bakery has an agreement with its vendors to pay for the
ingredients and other supplies it buys in thirty days. But those specialty
groceries that the company sells to? They’re kind of precarious, and they
take sixty days to pay their bills. So here’s what happens to Sweet Dreams’s
cash situation:
• In January, Sweet Dreams collects nothing from its customers. At the
end of the month, all it has is $20,000 in receivables from its sales.
Luckily, it does not have to pay anything out for the ingredients it
uses, since its vendors expect to be paid in thirty days. (We’ll assume
that the COGS fi gure is all for ingredients, because the owner herself
does all the baking.) But the company does have to pay expenses—
rent, utilities, and so on. So all of the initial $10,000 in cash goes out
the door to pay expenses, and Sweet Dreams is left with no cash in the
bank.
• In February, Sweet Dreams still hasn’t collected anything. (Remem-
ber, the customers pay in sixty days). At the end of the month, it has
$50,000 in receivables—January’s $20,000 plus February’s $30,000—
but still no cash. Meanwhile, Sweet Dreams now has to pay for the
ingredients and supplies for January ($12,000), and it has another
month’s worth of expenses ($10,000). So it’s now in the hole by
$22,000.
Can the owner turn this around? Surely, in March those rising profi ts
will improve the cash picture! Alas, no.
H6061.indb 131H6061.indb 131 11/21/12 8:25:36 AM11/21/12 8:25:36 AM
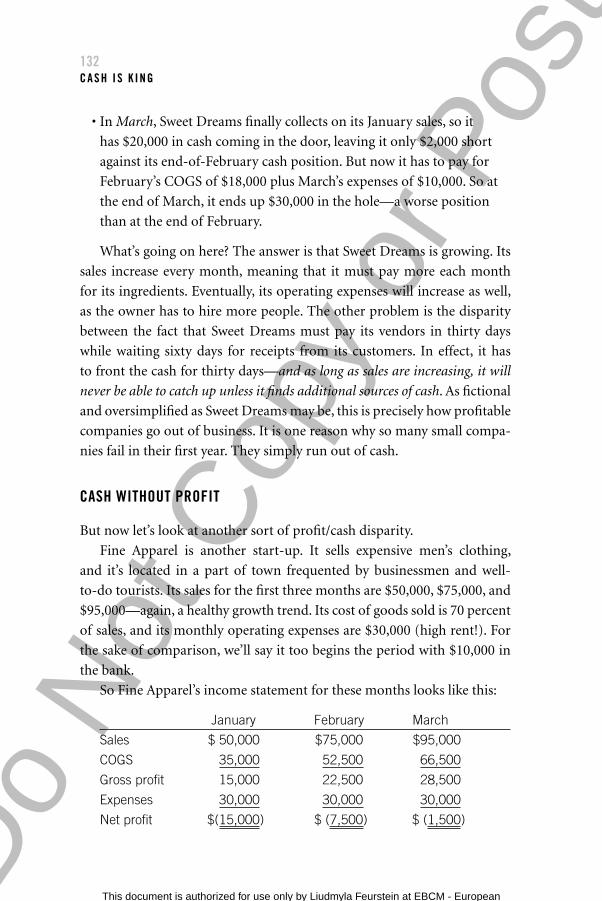
Do
Not
Cop
y or
Pos
t
This document is authorized for use only by Liudmyla Feurstein at EBCM - European University of Munich until October 2014. Copying or posting is an infringement of
copyright. [email protected] or 617.783.7860.
132CASH IS K ING
• In March, Sweet Dreams fi nally collects on its January sales, so it
has $20,000 in cash coming in the door, leaving it only $2,000 short
against its end-of-February cash position. But now it has to pay for
February’s COGS of $18,000 plus March’s expenses of $10,000. So at
the end of March, it ends up $30,000 in the hole—a worse position
than at the end of February.
What’s going on here? The answer is that Sweet Dreams is growing. Its
sales increase every month, meaning that it must pay more each month
for its ingredients. Eventually, its operating expenses will increase as well,
as the owner has to hire more people. The other problem is the disparity
between the fact that Sweet Dreams must pay its vendors in thirty days
while waiting sixty days for receipts from its customers. In effect, it has
to front the cash for thirty days—and as long as sales are increasing, it will
never be able to catch up unless it fi nds additional sources of cash. As fi ctional
and oversimplifi ed as Sweet Dreams may be, this is precisely how profi table
companies go out of business. It is one reason why so many small compa-
nies fail in their fi rst year. They simply run out of cash.
CASH WITHOUT PROFIT
But now let’s look at another sort of profi t/cash disparity.
Fine Apparel is another start-up. It sells expensive men’s clothing,
and it’s located in a part of town frequented by businessmen and well-
to-do tourists. Its sales for the fi rst three months are $50,000, $75,000, and
$95,000—again, a healthy growth trend. Its cost of goods sold is 70 percent
of sales, and its monthly operating expenses are $30,000 (high rent!). For
the sake of comparison, we’ll say it too begins the period with $10,000 in
the bank.
So Fine Apparel’s income statement for these months looks like this:
January February March
Sales $ 50,000 $75,000 $95,000
COGS 35,000 52,500 66,500
Gross profi t 15,000 22,500 28,500
Expenses 30,000 30,000 30,000
Net profi t $(15,000) $ (7,500) $ (1,500)
H6061.indb 132H6061.indb 132 11/21/12 8:25:36 AM11/21/12 8:25:36 AM
Do
Not
Cop
y or
Pos
t
This document is authorized for use only by Liudmyla Feurstein at EBCM - European University of Munich until October 2014. Copying or posting is an infringement of
copyright. [email protected] or 617.783.7860.
133Profit ≠ Cash
It hasn’t yet turned the corner on profi tability, though it is losing less
money each month. Meanwhile, what does its cash picture look like? As
a retailer, of course, it collects the money on each sale immediately. And
we’ll assume that Fine Apparel was able to negotiate good terms with its
vendors, paying them in sixty days.
• In January, it begins with $10,000 and adds $50,000 in cash sales. It
doesn’t have to pay for any cost of goods sold yet, so the only cash out
the door is that $30,000 in expenses. End-of-the-month bank balance:
$30,000.
• In February, it adds $75,000 in cash sales and still doesn’t pay anything
for cost of goods sold. So the month’s net cash after the $30,000 in
expenses is $45,000. Now the bank balance is $75,000!
• In March, it adds $95,000 in cash sales, pays for January’s supplies
($35,000) and March’s expenses ($30,000). Net cash in for the month
is $30,000, and the bank balance is now $105,000.
Cash-based businesses—retailers, restaurants, and so on—can thus get
an equally skewed picture of their situation. In this case Fine Apparel’s
bank balance is climbing every month even though the company is un-
profi table. That’s fi ne for a while, and it will continue to be fi ne so long as
the company holds down expenses so that it can turn the corner on profi t-
ability. But the owner has to be careful: if he’s lulled into thinking that his
business is doing great and he can increase those expenses, he’s liable to
continue on the unprofi table path. If he fails to attain profi tability, eventu-
ally he will run out of cash.
Fine Apparel, too, has its real-world parallels. Every cash-based busi-
ness, from tiny Main Street shops to giants such as Amazon.com and Dell,
has the luxury of taking the customer’s money before it must pay for its
costs and expenses. It enjoys the “fl oat”—and if it is growing, that fl oat will
grow ever larger. But ultimately, the company must be profi table by the
standards of the income statement; cash fl ow in the long run is no protec-
tion against unprofi tability. In the apparel example, the losses on the books
will eventually lead to negative cash fl ow; just as profi ts eventually lead to
cash, losses eventually use up cash. It’s the timing of those cash fl ows that
we are trying to understand here.
H6061.indb 133H6061.indb 133 11/21/12 8:25:36 AM11/21/12 8:25:36 AM
Do
Not
Cop
y or
Pos
t
This document is authorized for use only by Liudmyla Feurstein at EBCM - European University of Munich until October 2014. Copying or posting is an infringement of
copyright. [email protected] or 617.783.7860.
134CASH IS K ING
Understanding the difference between profi t and cash is a key to in-
creasing your fi nancial intelligence. It is a foundational concept, one that
many managers haven’t had an opportunity to learn. And it opens a whole
new window of opportunity to ask questions and make smart decisions.
For example:
• Finding the right kind of expertise. The two situations we described
in this chapter require different skills. If a company is profi table but
short on cash, then it needs fi nancial expertise—someone capable of
lining up additional fi nancing. If a company has cash but is unprof-
itable, it needs operational expertise, meaning someone capable of
bringing down costs or generating additional revenue without adding
costs. So not only do fi nancial statements tell you what is going on in
the company, they also can tell you what kind of expertise you need
to hire.
• Making good decisions about timing. Informed decisions on when to
take an action can increase a company’s effectiveness. Take Setpoint
as an example. When Joe isn’t out training people in business literacy,
he is CFO of Setpoint, a company that builds factory-automation
systems and other products. Managers at the company know that the
fi rst quarter of the year, when many orders for automation systems
come in, is the most profi table for the business. But cash is always
tight because Setpoint must pay out cash to buy components and pay
contractors. The next quarter, Setpoint’s cash fl ow typically improves
because receivables from the prior quarter are collected, but profi ts
slow down. Setpoint managers have learned that it’s better to buy
capital equipment for the business in the second quarter rather than
the fi rst, even though the second quarter is traditionally less profi table,
just because there’s more cash available to pay for it.
The ultimate lesson here is that companies need both profi t and cash.
They are different, and a healthy business requires both.
H6061.indb 134H6061.indb 134 11/21/12 8:25:36 AM11/21/12 8:25:36 AM
Do
Not
Cop
y or
Pos
t
This document is authorized for use only by Liudmyla Feurstein at EBCM - European University of Munich until October 2014. Copying or posting is an infringement of
copyright. [email protected] or 617.783.7860.
1 7
The Language of Cash Flow
YOU’D THINK A CASH FLOW STATEMENT would be easy to read. Since cash is
real money, there are no assumptions and estimates incorporated in the
numbers. Cash coming in is a positive number, cash going out is a nega-
tive one, and net cash is simply the sum of the two. In fact, though, we fi nd that
most nonfi nancial managers (and even some fi nancial folks, as we’ve learned
in working with many fi nance departments) take a while to understand a cash
fl ow statement. One reason is that the labels on the statement’s categories can
be confusing. A second reason is that the positives and the negatives aren’t
always clear. (A typical line item might say, “(increase)/decrease in accounts
receivable,” followed by a positive or a negative number. Is it an increase or a
decrease?) A fi nal reason is that it can be tough to see the relationship between
the cash fl ow statement and the other two fi nancial statements.
We’ll take up the last issue in chapter 18. Right now, let’s just sit down
with a cash fl ow statement and learn the basic vocabulary.
TYPES OF CASH FLOW
The statement shows the cash moving into a business, called the infl ows,
and the cash moving out of a business, called the outfl ows. These are di-
vided into three main categories.
H6061.indb 135H6061.indb 135 11/21/12 8:25:37 AM11/21/12 8:25:37 AM
Do
Not
Cop
y or
Pos
t
This document is authorized for use only by Liudmyla Feurstein at EBCM - European University of Munich until October 2014. Copying or posting is an infringement of
copyright. [email protected] or 617.783.7860.
136CASH IS K ING
Cash From or Used in Operating Activities
At times you’ll see slight variations to this language, such as “cash provided
by or used for operating activities.” Whatever the exact language, this cat-
egory includes all the cash fl ow, in and out, that is related to the actual
operations of the business. It includes the cash customers send in when
they pay their bills. It includes the cash the company pays out in salaries, to
vendors, and to the landlord, along with all the other cash it must spend to
keep the doors open and the business operating.
Cash From or Used in Investing Activities
This is one of the labels that can be confusing. Investing activities in this
context refers to investments made by the company, not by its owners. A
key subcategory here is cash spent on capital investments—that is, the pur-
chase of assets. If the company buys a truck or a machine, the cash it pays
out shows up on this part of the statement. Conversely, if the company
sells a truck or a machine (or any other asset), the cash it receives shows
up here. This section also includes investment in acquisitions or fi nancial
securities—anything, in short, that involves the buying or selling of com-
pany assets.
Cash From or Used in Financing Activities
Financing refers to borrowing and paying back loans on the one hand, and
transactions between a company and its shareholders on the other. So if a
company receives a loan, the proceeds show up in this category. If a com-
pany gets an equity investment from a shareholder, that, too, shows up
here. Should the company pay off the principal on a loan, buy back its own
Financing a Company
How a company is fi nanced refers to how it gets the cash it needs to start up or expand. Ordinarily, a company is fi nanced through debt, equity, or both. Debt means borrowing money from banks, family members, or other creditors. Equity means getting people to buy stock in the company.
H6061.indb 136H6061.indb 136 11/21/12 8:25:37 AM11/21/12 8:25:37 AM
Do
Not
Cop
y or
Pos
t
This document is authorized for use only by Liudmyla Feurstein at EBCM - European University of Munich until October 2014. Copying or posting is an infringement of
copyright. [email protected] or 617.783.7860.
137The Language of Cash Flow
stock, or pay a dividend to its shareholders, those expenditures of cash
also would appear in this category. Here again is some label confusion: if a
shareholder invests more money in a company, the cash involved shows up
under fi nancing, not investing.
WHAT EACH CATEGORY TELLS YOU
You can see right away that there is a lot of useful information in the cash
fl ow statement. The fi rst category shows operating cash fl ow, which in
many ways is the single most important number indicating the health of
a business. A company with a consistently healthy operating cash fl ow is
probably profi table, and it is probably doing a good job of turning its prof-
its into cash. A healthy operating cash fl ow, moreover, means that it can
fi nance more of its growth internally, without either borrowing or selling
more stock.
The second category shows how much cash the company is spending
on investments in its future. If the number is low relative to the size of the
company, it may not be investing much at all; management may be treating
the business as a “cash cow,” milking it for the cash it can generate while
not investing in future growth. If the number is high relative to company
size, it may suggest that management has high hopes for the future of the
company. Of course, what counts as high or low will depend on the type of
company it is. A service company, for instance, typically invests less in as-
sets than a manufacturing company. So your analysis has to refl ect the big
picture of the company you’re assessing.
The third category shows to what extent the company is dependent on
outside fi nancing. Look at this category over time, and you can see whether
Buying Back Stock
If a company has extra cash and believes that its stock is trading at a price that is lower than it ought to be, it may buy back some of its shares. The effect is to decrease the number of shares outstanding and hence to increase the possibility that the price will rise.
H6061.indb 137H6061.indb 137 11/21/12 8:25:37 AM11/21/12 8:25:37 AM
Do
Not
Cop
y or
Pos
t
This document is authorized for use only by Liudmyla Feurstein at EBCM - European University of Munich until October 2014. Copying or posting is an infringement of
copyright. [email protected] or 617.783.7860.
138CASH IS K ING
the company is a net borrower (borrowing more than it is paying off). You
can also see whether it has been selling new shares to outside investors or
buying back its own stock.
Finally, the cash fl ow statement allows you to calculate Warren Buffett’s
famous owner earnings metric, known on Wall Street as free cash fl ow. (See
the toolbox at the end of this part.)
Wall Street in recent years has been focusing more and more on the
cash fl ow statement. For example, many analysts have begun comparing
parts of the income statement to parts of the cash fl ow statement to ensure
that the company is converting its profi t into cash. Also, as Buffett knows,
there is much less room for manipulation of the numbers on the cash
fl ow statement than on the others. To be sure, “less room” doesn’t mean
“no room.” For example, if a company is trying to show good cash fl ow
in a particular quarter, it may delay paying vendors or employee bonuses
until the next quarter. Unless a company delays payments over and over,
however—and eventually, vendors who don’t get paid will stop providing
goods and services—the effects are signifi cant only in the short term.
H6061.indb 138H6061.indb 138 11/21/12 8:25:37 AM11/21/12 8:25:37 AM

Do
Not
Cop
y or
Pos
t
This document is authorized for use only by Liudmyla Feurstein at EBCM - European University of Munich until October 2014. Copying or posting is an infringement of
copyright. [email protected] or 617.783.7860.
1 8
How Cash Connects with Everything Else
ONCE YOU’VE LEARNED TO READ THE CASH FLOW STATEMENT, you can sim-
ply take it the way it comes and inspect it for what it tells you about
your company’s cash situation. Then you can fi gure out how you af-
fect it—how you as a manager can help better the business’s cash position.
We’ll spell out some of these opportunities in chapter 19.
But if you’re the type of person who enjoys a puzzle—who likes to un-
derstand the logic of what you’re looking at—then stick with us through
this chapter. Because it may have already dawned on you: you can calculate
a cash fl ow statement just by looking at the income statement and two balance
sheets.
The calculations aren’t hard: they involve no more than adding and
subtracting. But it’s easy to get lost in the process. The reason is that ac-
countants don’t just have a special language and a special set of tools and
techniques; they also have a certain way of thinking. They understand that
profi t as reported on the income statement is the result of certain rules,
assumptions, estimates, and calculations. They understand that assets as
reported on the balance sheet aren’t “really” worth what the balance sheet
says, again because of the rules, assumptions, and estimates that go into
valuing them. But accountants also understand that the art of fi nance, as
H6061.indb 139H6061.indb 139 11/21/12 8:25:37 AM11/21/12 8:25:37 AM
Do
Not
Cop
y or
Pos
t
This document is authorized for use only by Liudmyla Feurstein at EBCM - European University of Munich until October 2014. Copying or posting is an infringement of
copyright. [email protected] or 617.783.7860.
140CASH IS K ING
we have called it, doesn’t exist in the abstract. Ultimately, all those rules,
assumptions, and estimates have to provide us with useful information
about the real world. And since in fi nance the real world is represented by
cash, the balance sheet and the income statement must have some logical
relationship to the cash fl ow statement.
You can see the connections in common transactions. For example,
take a credit sale of $100. It shows up as:
• an increase of $100 in accounts receivable on the balance sheet, and
• an increase in sales of $100 on the income statement
When the customer pays the bill, here’s what happens:
• accounts receivable decreases by $100, and
• cash increases by $100
These changes both appear on the balance sheet. But because cash is now
involved, the transaction affects the cash fl ow statement as well.
You can watch the effect of all sorts of transactions in just this manner.
Say a company buys $100 worth of inventory. The balance sheet records
two changes: accounts payable rises by $100 and inventory rises by $100.
When the company pays the bill, accounts payable decreases by $100 and
cash decreases by $100—again, both on the balance sheet. When that in-
ventory is sold (either intact, as by a retailer, or incorporated into a product
by a manufacturer), $100 worth of cost of goods sold will be recorded on
the income statement. The cash parts of these transactions—the original
disbursement of cash to cover the $100 in accounts payable and the later
receipt of cash from the sale of fi nished goods—will show up on the cash
fl ow statement.
So all these transactions ultimately have an effect on the income state-
ment, the balance sheet, and the cash fl ow statement. In fact, most transac-
tions eventually fi nd their way onto all three. To show you more of the spe-
cifi c connections, let us walk you through how accountants use the income
statement and two balance sheets to calculate cash fl ow.
H6061.indb 140H6061.indb 140 11/21/12 8:25:37 AM11/21/12 8:25:37 AM
Do
Not
Cop
y or
Pos
t
This document is authorized for use only by Liudmyla Feurstein at EBCM - European University of Munich until October 2014. Copying or posting is an infringement of
copyright. [email protected] or 617.783.7860.
141How Cash Connects with Everything Else
RECONCILING PROFIT AND CASH
The fi rst exercise in this process is to reconcile profi t to cash. The question
you’re trying to answer here is pretty simple: given that we have $X in net
profi t, what effect does that have on our cash fl ow?
We start with net profi t for this reason: if every transaction were com-
pletely in cash, and if there were no noncash expenses such as depreciation,
then net profi t and operating cash fl ow would be identical. But since in
most businesses everything isn’t a cash transaction, we need to determine
which line items on the income statement and the balance sheet had the
effect of increasing or decreasing cash—in other words, making operating
cash fl ow different from net profi t. As accountants put it, we need to fi nd
“adjustments” to net profi t that, when they are added up, let us arrive at the
changes in cash fl ow.
One such adjustment is in accounts receivable. In any given time pe-
riod, a company takes in some cash from receivables. That decreases the
A/R line on the balance sheet. However, the company is also making more
credit sales, which adds to the A/R line. We can “net out” the cash fi gure
from these two kinds of transactions by looking at the change in receiv-
ables from one balance sheet to the next. (Remember, the balance sheet is
for a specifi c day, so changes can be seen when you compare two balance
sheets.)
Imagine, for example, that your company has $100 in receivables on
the balance sheet at the start of the month. You take in $75 in cash during
the month, and you make $100 worth of new credit sales. Here’s how you
calculate the A/R line at the end of the month:
$100 – $75 + $100 = $125
Reconciliation
In a fi nancial context, reconciliation means getting the cash line on a company’s balance sheet to match the actual cash the company has in the bank—sort of like balancing your checkbook, but on a larger scale.
H6061.indb 141H6061.indb 141 11/21/12 8:25:37 AM11/21/12 8:25:37 AM
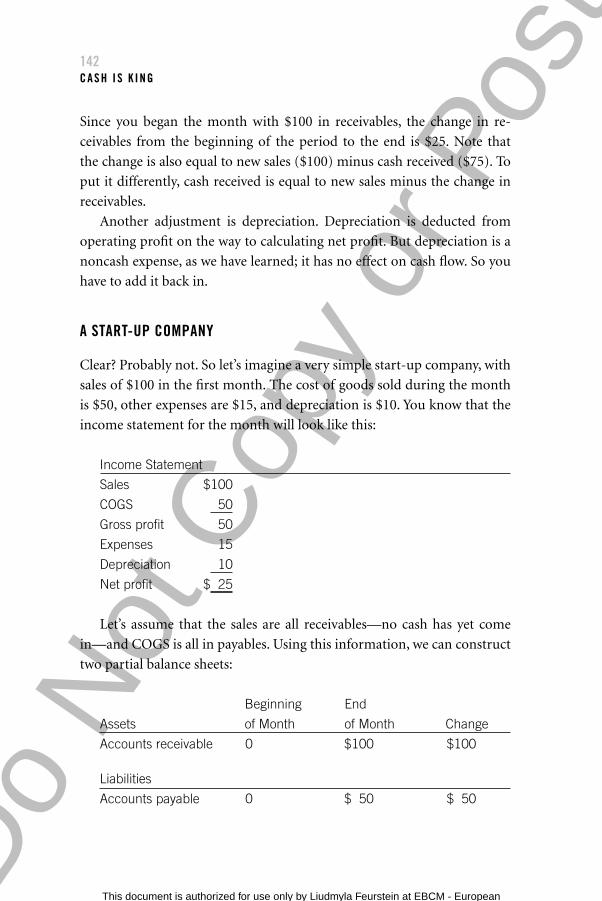
Do
Not
Cop
y or
Pos
t
This document is authorized for use only by Liudmyla Feurstein at EBCM - European University of Munich until October 2014. Copying or posting is an infringement of
copyright. [email protected] or 617.783.7860.
142CASH IS K ING
Since you began the month with $100 in receivables, the change in re-
ceivables from the beginning of the period to the end is $25. Note that
the change is also equal to new sales ($100) minus cash received ($75). To
put it differently, cash received is equal to new sales minus the change in
receivables.
Another adjustment is depreciation. Depreciation is deducted from
operating profi t on the way to calculating net profi t. But depreciation is a
noncash expense, as we have learned; it has no effect on cash fl ow. So you
have to add it back in.
A START-UP COMPANY
Clear? Probably not. So let’s imagine a very simple start-up company, with
sales of $100 in the fi rst month. The cost of goods sold during the month
is $50, other expenses are $15, and depreciation is $10. You know that the
income statement for the month will look like this:
Income Statement
Sales $100
COGS 50
Gross profi t 50
Expenses 15
Depreciation 10
Net profi t $ 25
Let’s assume that the sales are all receivables—no cash has yet come
in—and COGS is all in payables. Using this information, we can construct
two partial balance sheets:
Beginning End
Assets of Month of Month Change
Accounts receivable 0 $100 $100
Liabilities
Accounts payable 0 $ 50 $ 50
H6061.indb 142H6061.indb 142 11/21/12 8:25:37 AM11/21/12 8:25:37 AM
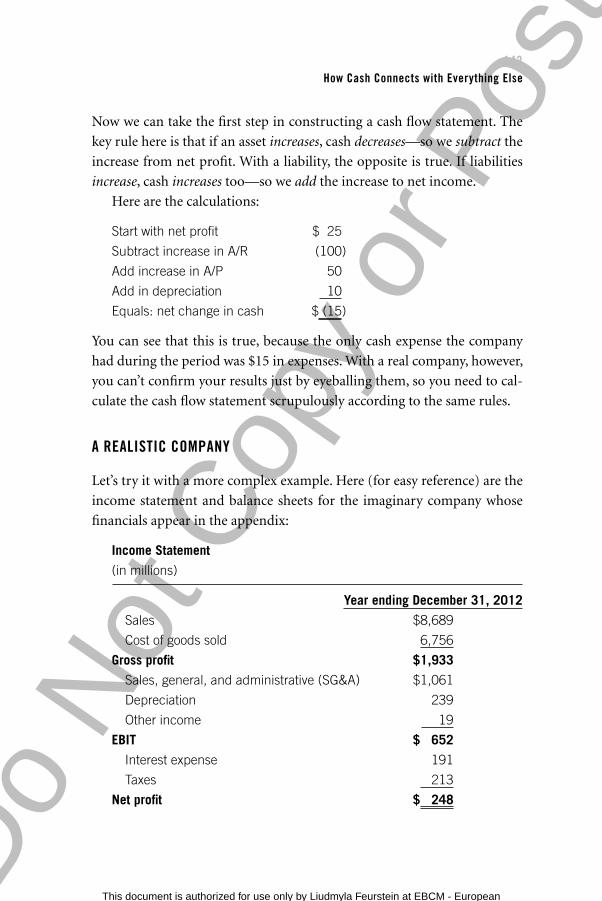
Do
Not
Cop
y or
Pos
t
This document is authorized for use only by Liudmyla Feurstein at EBCM - European University of Munich until October 2014. Copying or posting is an infringement of
copyright. [email protected] or 617.783.7860.
143How Cash Connects with Everything Else
Now we can take the fi rst step in constructing a cash fl ow statement. The
key rule here is that if an asset increases, cash decreases—so we subtract the
increase from net profi t. With a liability, the opposite is true. If liabilities
increase, cash increases too—so we add the increase to net income.
Here are the calculations:
Start with net profi t $ 25
Subtract increase in A/R (100)
Add increase in A/P 50
Add in depreciation 10
Equals: net change in cash $ (15)
You can see that this is true, because the only cash expense the company
had during the period was $15 in expenses. With a real company, however,
you can’t confi rm your results just by eyeballing them, so you need to cal-
culate the cash fl ow statement scrupulously according to the same rules.
A REALISTIC COMPANY
Let’s try it with a more complex example. Here (for easy reference) are the
income statement and balance sheets for the imaginary company whose
fi nancials appear in the appendix:
Income Statement
(in millions)
Year ending December 31, 2012
Sales $8,689
Cost of goods sold 6,756
Gross profi t $1,933
Sales, general, and administrative (SG&A) $1,061
Depreciation 239
Other income 19
EBIT $ 652
Interest expense 191
Taxes 213
Net profi t $ 248
H6061.indb 143H6061.indb 143 11/21/12 8:25:37 AM11/21/12 8:25:37 AM
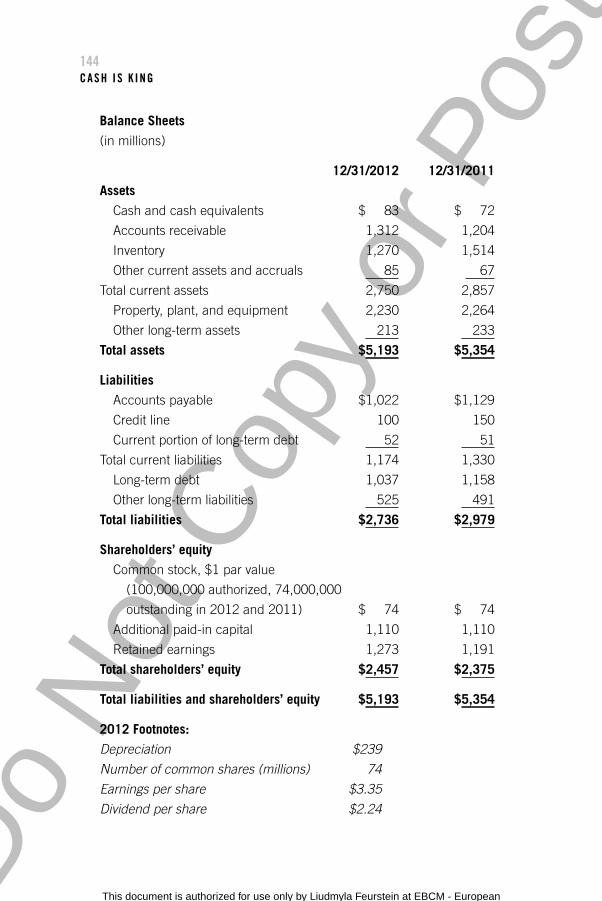
Do
Not
Cop
y or
Pos
t
This document is authorized for use only by Liudmyla Feurstein at EBCM - European University of Munich until October 2014. Copying or posting is an infringement of
copyright. [email protected] or 617.783.7860.
144CASH IS K ING
Balance Sheets
(in millions)
12/31/2012 12/31/2011
Assets
Cash and cash equivalents $ 83 $ 72
Accounts receivable 1,312 1,204
Inventory 1,270 1,514
Other current assets and accruals 85 67
Total current assets 2,750 2,857
Property, plant, and equipment 2,230 2,264
Other long-term assets 213 233
Total assets $5,193 $5,354
Liabilities
Accounts payable $1,022 $1,129
Credit line 100 150
Current portion of long-term debt 52 51
Total current liabilities 1,174 1,330
Long-term debt 1,037 1,158
Other long-term liabilities 525 491
Total liabilities $2,736 $2,979
Shareholders’ equity
Common stock, $1 par value
(100,000,000 authorized, 74,000,000
outstanding in 2012 and 2011) $ 74 $ 74
Additional paid-in capital 1,110 1,110
Retained earnings 1,273 1,191
Total shareholders’ equity $2,457 $2,375
Total liabilities and shareholders’ equity $5,193 $5,354
2012 Footnotes:
Depreciation $239
Number of common shares (millions) 74
Earnings per share $3.35
Dividend per share $2.24
H6061.indb 144H6061.indb 144 11/21/12 8:25:37 AM11/21/12 8:25:37 AM
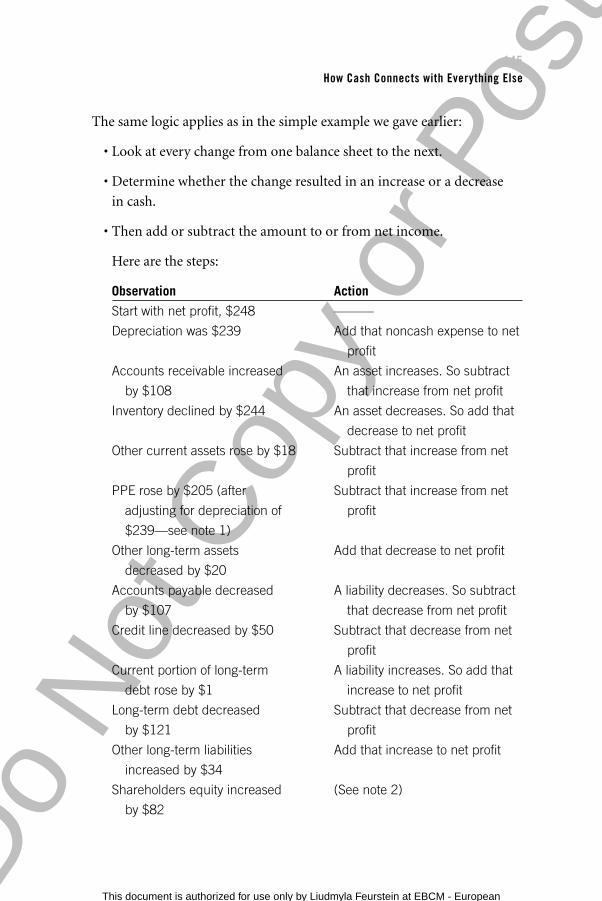
Do
Not
Cop
y or
Pos
t
This document is authorized for use only by Liudmyla Feurstein at EBCM - European University of Munich until October 2014. Copying or posting is an infringement of
copyright. [email protected] or 617.783.7860.
145How Cash Connects with Everything Else
The same logic applies as in the simple example we gave earlier:
• Look at every change from one balance sheet to the next.
• Determine whether the change resulted in an increase or a decrease
in cash.
• Then add or subtract the amount to or from net income.
Here are the steps:
Observation Action
Start with net profi t, $248 ———
Depreciation was $239 Add that noncash expense to net
profi t
Accounts receivable increased An asset increases. So subtract
by $108 that increase from net profi t
Inventory declined by $244 An asset decreases. So add that
decrease to net profi t
Other current assets rose by $18 Subtract that increase from net
profi t
PPE rose by $205 (after Subtract that increase from net
adjusting for depreciation of profi t
$239—see note 1)
Other long-term assets Add that decrease to net profi t
decreased by $20
Accounts payable decreased A liability decreases. So subtract
by $107 that decrease from net profi t
Credit line decreased by $50 Subtract that decrease from net
profi t
Current portion of long-term A liability increases. So add that
debt rose by $1 increase to net profi t
Long-term debt decreased Subtract that decrease from net
by $121 profi t
Other long-term liabilities Add that increase to net profi t
increased by $34
Shareholders equity increased (See note 2)
by $82
H6061.indb 145H6061.indb 145 11/21/12 8:25:37 AM11/21/12 8:25:37 AM
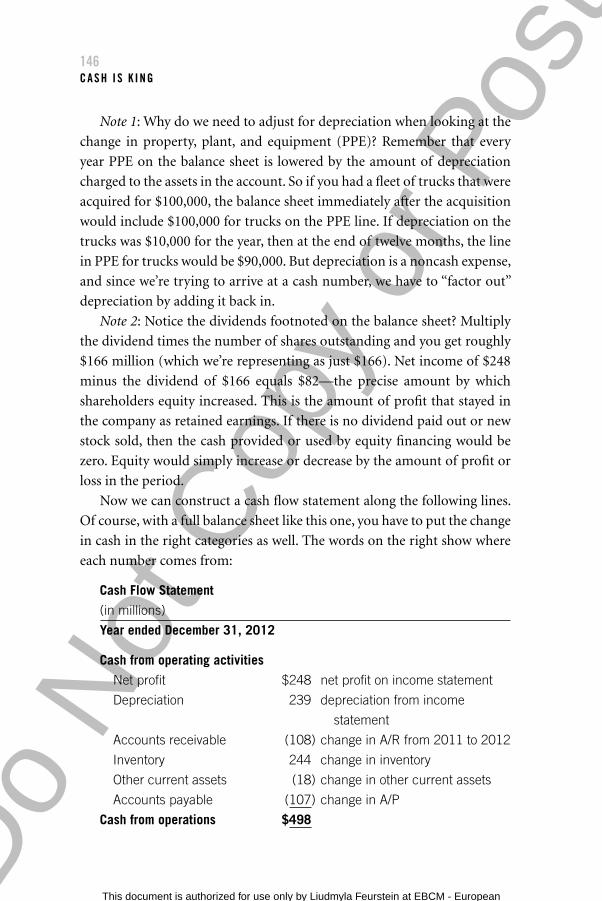
Do
Not
Cop
y or
Pos
t
This document is authorized for use only by Liudmyla Feurstein at EBCM - European University of Munich until October 2014. Copying or posting is an infringement of
copyright. [email protected] or 617.783.7860.
146CASH IS K ING
Note 1: Why do we need to adjust for depreciation when looking at the
change in property, plant, and equipment (PPE)? Remember that every
year PPE on the balance sheet is lowered by the amount of depreciation
charged to the assets in the account. So if you had a fl eet of trucks that were
acquired for $100,000, the balance sheet immediately after the acquisition
would include $100,000 for trucks on the PPE line. If depreciation on the
trucks was $10,000 for the year, then at the end of twelve months, the line
in PPE for trucks would be $90,000. But depreciation is a noncash expense,
and since we’re trying to arrive at a cash number, we have to “factor out”
depreciation by adding it back in.
Note 2: Notice the dividends footnoted on the balance sheet? Multiply
the dividend times the number of shares outstanding and you get roughly
$166 million (which we’re representing as just $166). Net income of $248
minus the dividend of $166 equals $82—the precise amount by which
shareholders equity increased. This is the amount of profi t that stayed in
the company as retained earnings. If there is no dividend paid out or new
stock sold, then the cash provided or used by equity fi nancing would be
zero. Equity would simply increase or decrease by the amount of profi t or
loss in the period.
Now we can construct a cash fl ow statement along the following lines.
Of course, with a full balance sheet like this one, you have to put the change
in cash in the right categories as well. The words on the right show where
each number comes from:
Cash Flow Statement
(in millions)
Year ended December 31, 2012
Cash from operating activities
Net profi t $248 net profi t on income statement
Depreciation 239 depreciation from income
statement
Accounts receivable (108) change in A/R from 2011 to 2012
Inventory 244 change in inventory
Other current assets (18) change in other current assets
Accounts payable (107) change in A/P
Cash from operations $498
H6061.indb 146H6061.indb 146 11/21/12 8:25:37 AM11/21/12 8:25:37 AM
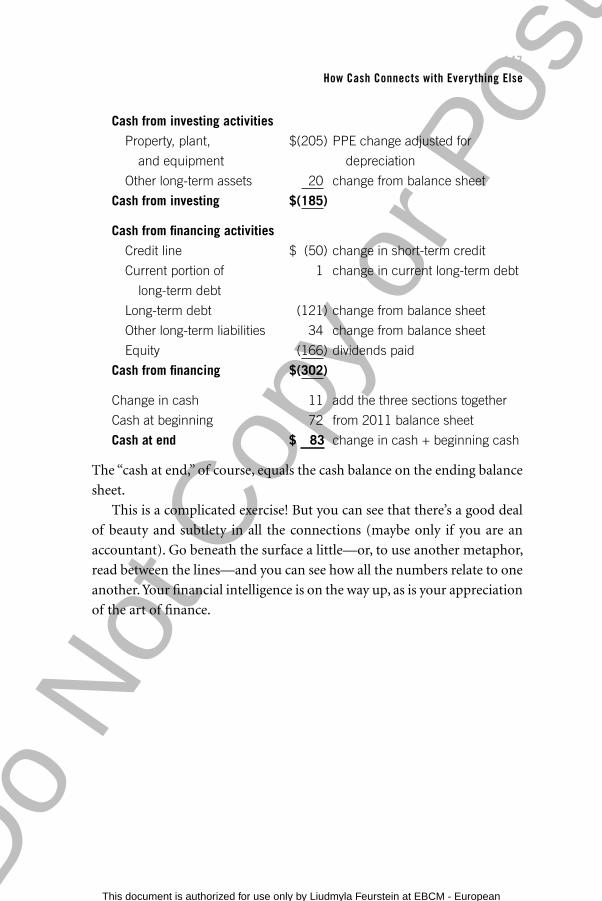
Do
Not
Cop
y or
Pos
t
This document is authorized for use only by Liudmyla Feurstein at EBCM - European University of Munich until October 2014. Copying or posting is an infringement of
copyright. [email protected] or 617.783.7860.
147How Cash Connects with Everything Else
Cash from investing activities
Property, plant, $(205) PPE change adjusted for
and equipment depreciation
Other long-term assets 20 change from balance sheet
Cash from investing $(185)
Cash from fi nancing activities
Credit line $ (50) change in short-term credit
Current portion of 1 change in current long-term debt
long-term debt
Long-term debt (121) change from balance sheet
Other long-term liabilities 34 change from balance sheet
Equity (166) dividends paid
Cash from fi nancing $(302)
Change in cash 11 add the three sections together
Cash at beginning 72 from 2011 balance sheet
Cash at end $ 83 change in cash + beginning cash
The “cash at end,” of course, equals the cash balance on the ending balance
sheet.
This is a complicated exercise! But you can see that there’s a good deal
of beauty and subtlety in all the connections (maybe only if you are an
accountant). Go beneath the surface a little—or, to use another metaphor,
read between the lines—and you can see how all the numbers relate to one
another. Your fi nancial intelligence is on the way up, as is your appreciation
of the art of fi nance.
H6061.indb 147H6061.indb 147 11/21/12 8:25:37 AM11/21/12 8:25:37 AM
Do
Not
Cop
y or
Pos
t
This document is authorized for use only by Liudmyla Feurstein at EBCM - European University of Munich until October 2014. Copying or posting is an infringement of
copyright. [email protected] or 617.783.7860.
1 9
Why Cash Matters
OF COURSE, by now you may be saying to yourself, “So what? All this is
cumbersome to fi gure out, and why do I care?”
For starters, let’s see what our sample company’s cash fl ow state-
ment reveals. In terms of operations, it is certainly doing a good job of gen-
erating cash. Operating cash fl ow is considerably higher than net income.
Inventory declined, so it’s reasonable to suppose that the company is tight-
ening up its operations. All of this makes for a stronger cash position.
We can also see, however, that there is not a lot of new investment going
on. Depreciation outweighed new investment, which makes us wonder if
management believes that the company has much of a future. Meanwhile,
the company is paying its shareholders a healthy dividend, which may sug-
gest that they value it more for its cash-generating potential than for its
future. (Many growing companies don’t pay large dividends because they
retain the earnings to invest in the business. Some pay no dividends at all.)
Of course, these are all suppositions about our sample company. To
really know the truth, you’d have to know a lot more about the company,
what business it’s in, and so on—the big-picture part of fi nancial intelli-
gence. But if you did know all those things, the cash fl ow statement would
be extraordinarily revealing.
That brings us to your own situation as a manager and to your own
company’s cash fl ow. We think there are three big reasons for looking at
and trying to understand the cash fl ow statement.
H6061.indb 148H6061.indb 148 11/21/12 8:25:37 AM11/21/12 8:25:37 AM
Do
Not
Cop
y or
Pos
t
This document is authorized for use only by Liudmyla Feurstein at EBCM - European University of Munich until October 2014. Copying or posting is an infringement of
copyright. [email protected] or 617.783.7860.
149Why Cash Matters
THE POWER OF UNDERSTANDING CASH FLOW
First, knowing your company’s cash situation will help you understand
what is going on now, where the business is headed, and what senior man-
agement’s priorities are likely to be. You need to know not just whether the
overall cash position is healthy but specifi cally where the cash is coming
from. Is it from operations? That’s a good thing—it means the business
is generating cash. Is investing cash fl ow a sizable negative number? If it
isn’t, it may mean that the company isn’t investing in its future. And what
about fi nancing cash fl ow? If investment money is coming in, that may be
an optimistic sign for the future, or it may mean that the company is des-
perately selling stock to stay afl oat. Looking at the cash fl ow statement may
generate a lot of questions, but they are the right ones to be asking. Are we
paying off loans? Why or why not? Are we buying equipment? The answers
to those questions will reveal a lot about senior management’s plans for
the company.
Second, you affect cash. As we’ve said before, managers should be focus-
ing on both profi t and cash. Of course, their impact is usually limited to
operating cash fl ow—but that’s one of the most important measures there
is. For instance:
• Accounts receivable. If you’re in sales, are you selling to customers
who pay their bills on time? Do you have a close enough relationship
with your customers to talk with them about payment terms? If you’re
in customer service, do you offer customers the kind of service that
will encourage them to pay their bills on time? Is the product free of
defects? Are the invoices accurate? Does the mailroom send invoices
on a timely basis? Is the receptionist helpful? All these factors help
determine how customers feel about your company and indirectly in-
fl uence how fast they are likely to pay their bills. Disgruntled custom-
ers are not known for prompt payments—they like to wait until any
dispute is resolved.
• Inventory. If you’re in engineering, do you request special products
all the time? If you do, you may be creating an inventory nightmare. If
you’re in operations and you like to have lots in stock, just in case, you
may be creating a situation in which cash is just sitting on the shelves,
H6061.indb 149H6061.indb 149 11/21/12 8:25:37 AM11/21/12 8:25:37 AM
Do
Not
Cop
y or
Pos
t
This document is authorized for use only by Liudmyla Feurstein at EBCM - European University of Munich until October 2014. Copying or posting is an infringement of
copyright. [email protected] or 617.783.7860.
150CASH IS K ING
when it could be used for something else. Manufacturing and ware-
house managers can often reduce inventory hugely by studying and
applying the principles of lean enterprise, pioneered at Toyota.
• Expenses. Do you defer expenses when you can? Do you consider the
timing of cash fl ow when making purchases? Obviously, we’re not say-
ing it’s always wise to defer expenses; it’s just wise to understand what
the cash impact will be when you do decide to spend money, and to
take that into account.
• Giving credit. Do you give credit to potential customers too easily?
Alternatively, do you withhold credit when you should give it? Both
decisions affect the company’s cash fl ow and sales, which is why the
credit department always has to strike a careful balance.
The list goes on. Maybe you’re a plant manager, and you are always
recommending buying more equipment, just in case the orders come in.
Perhaps you’re in IT, and you feel that the company always needs the lat-
est upgrades to its computer systems. All these decisions affect cash fl ow,
and senior management usually understands that very well. If you want to
make an effective request, you need to familiarize yourself with the num-
bers that they’re looking at.
Third, managers who understand cash fl ow tend to be given more re-
sponsibilities, and thus tend to advance more quickly, than those who fo-
cus purely on the income statement. In the following part, for instance,
you’ll learn to calculate ratios such as days sales outstanding (DSO), which
is a key measure of the company’s effi ciency in collecting receivables. The
faster receivables are collected, the better a company’s cash position. You
could go to someone in fi nance and say, “By the way, I notice our DSO has
been heading in the wrong direction over the last few months—how can I
help turn that around?” Alternatively, you might learn the precepts of lean
enterprise, which focus on (among other things) keeping inventories to a
minimum. A manager who leads a company in converting to lean thereby
frees up huge quantities of cash.
But our general point here is that cash fl ow is a key indicator of a com-
pany’s fi nancial health, along with profi tability and shareholders’ equity.
H6061.indb 150H6061.indb 150 11/21/12 8:25:37 AM11/21/12 8:25:37 AM

Do
Not
Cop
y or
Pos
t
This document is authorized for use only by Liudmyla Feurstein at EBCM - European University of Munich until October 2014. Copying or posting is an infringement of
copyright. [email protected] or 617.783.7860.
151Why Cash Matters
It’s the fi nal link in the triad, and you need all three to assess a company’s
fi nancial health. It’s also the fi nal link in the fi rst level of fi nancial intel-
ligence. You now have a good understanding of all three fi nancial state-
ments. Now it’s time to move on to the next level—to put that information
to work.
H6061.indb 151H6061.indb 151 11/21/12 8:25:37 AM11/21/12 8:25:37 AM
Do
Not
Cop
y or
Pos
t
This document is authorized for use only by Liudmyla Feurstein at EBCM - European University of Munich until October 2014. Copying or posting is an infringement of
copyright. [email protected] or 617.783.7860.
Part FourToolbox
FREE CASH FLOW
Several years ago, Wall Street’s favorite measure was EBITDA, or earnings
before interest, taxes, depreciation, and amortization. Banks loved EBITDA
because they believed it was a good indication of future cash fl ow. But
then came a double whammy. During the dot-com boom of the late 1990s,
companies such as WorldCom turned out to have cooked their books. So
their EBITDA fi gures were not reliable. When the fi nancial crisis hit in
2008, investors and lenders grew even more wary of any metric tied to the
income statement. They realized that income statements are loaded with
estimates and assumptions, and that profi t shown on these statements is
not necessarily real.
So now there’s a hot new metric on Wall Street: free cash fl ow. Some
companies have looked at free cash fl ow for years. Warren Buffett’s Berk-
shire Hathaway is the best-known example, though Buffett calls it owner
earnings.
You can calculate free cash fl ow in a couple of different ways, but the
most common approach is simple subtraction:
Free cash fl ow = operating cash fl ow less net capital expenditures
These fi gures come directly from the cash fl ow statement. Operating
cash fl ow (or “cash provided by operating activities”) is the total from the
top section of the statement. Net capital expenditures are purchases of
property, plant, and equipment—a line item in the investing section of
the cash fl ow statement. We use the term net capital expenditures because
many businesses add back any proceeds from sales of capital equipment
H6061.indb 152H6061.indb 152 11/21/12 8:25:38 AM11/21/12 8:25:38 AM

Do
Not
Cop
y or
Pos
t
This document is authorized for use only by Liudmyla Feurstein at EBCM - European University of Munich until October 2014. Copying or posting is an infringement of
copyright. [email protected] or 617.783.7860.
153Part Four Toolbox
(another line in the investing section). Note that net capital expenditures
is almost always a negative number, which may create some confusion. Ig-
nore the minus sign! Just subtract the absolute value of that line from op-
erating cash fl ow. Using our sample fi nancial statements in the appendix,
for example, free cash fl ow for this company would be $498 (cash from
operations) less $205 (the amount invested in property, plant, and equip-
ment), or $293 million.
Investors have gravitated to this metric because cash is not subject to
estimates and assumptions. It’s easy to audit cash balances. Unless the
company is simply lying—and this kind of lie is very likely to come out
quickly—it really has the cash fl ow indicated on its statement. Also, when-
ever capital markets are constrained (as they have often been since 2008),
the businesses most able to invest in growth will be those that can generate
their own cash.
From a company’s point of view, a healthy free cash fl ow gives it some
good options. It can expand operations, make acquisitions, pay off debt,
buy back its stock, or pay dividends to shareholders. Companies with
weak free cash fl ow have to get outside fi nancing to do any of that. And, of
course, the more free cash fl ow you have, the more favorably Wall Street
will view your stock.
EVEN THE BIG GUYS CAN RUN OUT OF CASH
While teaching a fi nance module to executives of a Fortune 100 company,
we were discussing the importance of cash. An attendee raised her hand to
recount a story.
It was the fi rst quarter of 2009, she said, and the capital markets were in
trouble. One of her clients called. The client had a $100 million credit line
with the company’s fi nancial division and wanted to draw down the entire
amount. She remonstrated, arguing that the client seemed to have plenty
of cash on its balance sheet. But the client persisted.
So the executive contacted her company’s treasury department and re-
quested that the funds be wired to her client’s account. The request was
normally a routine exercise for such a large company, but this time the
treasury told her that the corporation did not have enough cash to make
the transfer. The executive was in shock. “Did I hear you right?” she asked.
H6061.indb 153H6061.indb 153 11/21/12 8:25:38 AM11/21/12 8:25:38 AM
Do
Not
Cop
y or
Pos
t
This document is authorized for use only by Liudmyla Feurstein at EBCM - European University of Munich until October 2014. Copying or posting is an infringement of
copyright. [email protected] or 617.783.7860.
154CASH IS K ING
And then she said, “Do you really want me to tell the client that our corpo-
ration does not have the cash to meet this committed credit line?” Finally,
the treasury representative asked her to contact the CEO’s offi ce for ap-
proval and said he and his colleagues would try to fi nd the cash. Which
they eventually did.
How can a big corporation even come close to running out of cash?
In fact, the trouble lay behind the scenes. For a week or two in early 2009,
the commercial paper window on Wall Street shut down because of all
the uncertainty in fi nancial circles. Commercial paper consists of short-
term notes or loans to large, stable corporations that typically come due
in thirty, sixty, or ninety days. Many large corporations roll over billions
of dollars of these low-interest notes to handle their short-term fi nancial
needs. This particular company was using many billions of dollars’ worth
of commercial paper for that purpose. Every week, several billion in notes
would come due, and the company would roll this over into new notes.
When the market shut down, the corporation was billions of dollars short
and had to scramble to fi nd a way to cover the shortfall.
H6061.indb 154H6061.indb 154 11/21/12 8:25:38 AM11/21/12 8:25:38 AM

Do
Not
Cop
y or
Pos
t
This document is authorized for use only by Liudmyla Feurstein at EBCM - European University of Munich until October 2014. Copying or posting is an infringement of
copyright. [email protected] or 617.783.7860.
Part Five
Ratios: Learning What the
Numbers Are Really Telling You
H6061.indb 155H6061.indb 155 11/21/12 8:25:38 AM11/21/12 8:25:38 AM

Do
Not
Cop
y or
Pos
t
This document is authorized for use only by Liudmyla Feurstein at EBCM - European University of Munich until October 2014. Copying or posting is an infringement of
copyright. [email protected] or 617.783.7860.H6061.indb 156H6061.indb 156 11/21/12 8:25:38 AM11/21/12 8:25:38 AM
Do
Not
Cop
y or
Pos
t
This document is authorized for use only by Liudmyla Feurstein at EBCM - European University of Munich until October 2014. Copying or posting is an infringement of
copyright. [email protected] or 617.783.7860.
2 0
The Power of Ratios
THE EYES MAY OR MAY NOT BE A WINDOW INTO THE SOUL , as Immanuel Kant
suggested, but ratios are defi nitely a window into a company’s fi nan-
cial statements. They offer a quick shortcut to understanding what the
fi nancials are saying.
There’s a classic story that illustrates this point very well. The year was
1997. The notorious “Chainsaw Al” Dunlap had recently become chief ex-
ecutive of Sunbeam, then an independent appliance maker. By the time he
arrived at Sunbeam, Dunlap already had a great reputation on Wall Street
and a standard modus operandi. He would show up at a troubled company,
fi re the management team, bring in his own people, and immediately start
slashing expenses by closing down or selling factories and laying off thou-
sands of employees. Soon the company would be showing a profi t because
of all those cuts, even though it might not be well positioned for the longer
term. Dunlap would then arrange for it to be sold, usually at a premium—
which meant that he was often hailed as a champion of shareholder value.
Sunbeam’s stock jumped more than 50 percent on the news that he’d been
hired as CEO.
At Sunbeam, everything went according to the usual plan until Dunlap
began readying the company for sale. By then, he had cut the workforce
in half, from twelve thousand to six thousand, and was reporting strong
profi ts. Wall Street was so impressed that Sunbeam’s stock price had gone
through the roof—which, as we noted earlier, turned out to be a major
H6061.indb 157H6061.indb 157 11/21/12 8:25:38 AM11/21/12 8:25:38 AM
Do
Not
Cop
y or
Pos
t
This document is authorized for use only by Liudmyla Feurstein at EBCM - European University of Munich until October 2014. Copying or posting is an infringement of
copyright. [email protected] or 617.783.7860.
158RAT IOS
problem. When the investment bankers went out to sell the company, the
price was so high that they had trouble identifying prospective buyers.
Dunlap’s only hope was to boost sales and earnings to a level that could
justify the kind of premium a buyer would have to offer for Sunbeam’s
stock.
ACCOUNTING TRICKS
We now know that Dunlap and his CFO, Russ Kersh, used a whole bag of
accounting tricks in that fourth quarter to make Sunbeam look far stron-
ger and more profi table than it actually was. One of the tricks was a perver-
sion of a technique called bill-and-hold.
Bill-and-hold is essentially a way of accommodating retailers who want
to buy large quantities of products for sale in the future, but put off pay-
ing for them until the products are actually being sold. Say that you have
a chain of toy stores, and you want to ensure that you have an adequate
supply of Barbie dolls for the Christmas season. Sometime in the spring,
you might go to Mattel and propose a deal whereby you’ll buy a certain
number of Barbies, take delivery of them, and even allow Mattel to bill you
for them—but you won’t pay for the dolls until the Christmas season rolls
around and you start selling them. Meanwhile, you’ll keep them in a ware-
house. It’s a good deal for you, since you can count on having the Barbies
when you need them, yet you can hold off paying for them until you have
decent cash fl ow. It’s also a good deal for Mattel, which can make the sale
and record it immediately, even though it has to wait a few more months
to collect the cash.
Dunlap fi gured that a variation on bill-and-hold was one answer to his
problem. The fourth quarter was not a particularly strong period for Sun-
beam, which made a lot of products geared toward summer—gas grills, for
example. So Sunbeam went to major retailers such as Walmart and Kmart
and offered to guarantee that they’d have all the grills they wanted for the
following summer provided they did their buying in the middle of winter.
They’d be billed immediately, but they wouldn’t have to pay until spring,
when they actually put the goods in the stores. The retailers were cool to
the idea. They didn’t have anywhere to keep all that stuff, nor did they want
to bear the cost of storing the inventory through the winter. “No problem,”
H6061.indb 158H6061.indb 158 11/21/12 8:25:38 AM11/21/12 8:25:38 AM
Do
Not
Cop
y or
Pos
t
This document is authorized for use only by Liudmyla Feurstein at EBCM - European University of Munich until October 2014. Copying or posting is an infringement of
copyright. [email protected] or 617.783.7860.
159The Power of Ratios
said Sunbeam. “We’ll take care of that for you. We’ll lease space near your
facilities and cover all the storage costs ourselves.”
Supposedly, the retailers agreed to those terms, although an audit con-
ducted after Dunlap was fi red failed to turn up a complete paper trail. In
any case, Sunbeam went ahead and reported an additional $36 million in
sales for the fourth quarter based on the bill-and-hold deals it had initi-
ated. The scam worked well enough to fool most analysts, investors, and
even Sunbeam’s board of directors, which in early 1998 rewarded Dunlap
and other members of the executive team with lucrative new employment
contracts. Although they had been on the job for less than a year, they
received some $38 million in stock grants, based largely on the mistaken
belief that the company had just had a stellar fourth quarter.
But Andrew Shore, a consumer-products analyst with the investment
fi rm Paine Webber, had been following Sunbeam since Dunlap arrived, and
now was scrutinizing its fi nancials. He noticed some oddities, like higher-
than-normal sales in the fourth quarter. Then he calculated a ratio called
days sales outstanding (DSO) and found that it was huge, far above what
it ought to have been. In effect, it indicated that the company’s accounts
receivable had gone through the roof. That was a bad sign, so he called a
Sunbeam accountant to ask what was going on. The accountant told Shore
about the bill-and-hold strategy. Shore realized that Sunbeam, in effect,
had already recorded a hefty chunk of sales that would normally appear
in the fi rst and second quarters. After discovering this bill-and-hold game
and other questionable practices, he promptly downgraded the stock.
The rest, as they say, is history. Dunlap tried to hang on, but the stock
plummeted and investors grew wary of what Sunbeam’s fi nancials were
telling them. Eventually, Dunlap was forced out and Sunbeam went bank-
rupt—and it all started because Andrew Shore knew enough to dig beneath
the surface and fi nd out what was really going on. Ratios such as DSO were
a useful tool for Shore, as they can be for you.
ANALYZING RATIOS
Ratios indicate the relationship of one number to another. People use them
every day. A baseball player’s batting average of .333 shows the relationship
between hits and offi cial at bats—one hit for every three at bats. The odds
H6061.indb 159H6061.indb 159 11/21/12 8:25:38 AM11/21/12 8:25:38 AM

Do
Not
Cop
y or
Pos
t
This document is authorized for use only by Liudmyla Feurstein at EBCM - European University of Munich until October 2014. Copying or posting is an infringement of
copyright. [email protected] or 617.783.7860.
160RAT IOS
of winning a lottery jackpot, say one in 6 million, show the relationship
between winning tickets sold (1) and total tickets sold (6 million). Ratios
don’t require any complex calculations. To fi gure a ratio, usually, you just
divide one number by another and then express the result as a decimal or
as a percentage.
All kinds of people use all kinds of fi nancial ratios in assessing a busi-
ness. For example:
• Bankers and other lenders examine ratios such as debt-to-equity,
which gives them an idea of whether a company will be able to pay
back a loan.
• Senior managers watch ratios such as gross margin, which helps them
be aware of rising costs or inappropriate discounting.
• Credit managers assess potential customers’ fi nancial health by
inspecting the quick ratio, which gives them an indication of
the customer’s supply of ready cash compared with its current
liabilities.
• Potential and current shareholders look at ratios such as price-to-
earnings, which helps them decide whether a company is valued high
or low by comparison with other stocks (and with its own value in
previous years).
In this part of the book we’ll show you how to calculate many such
ratios. The ability to calculate them—to read between the lines of the fi -
nancials, so to speak—is a mark of fi nancial intelligence. Learning about
ratios will give you a host of intelligent questions to ask your boss or CFO.
And, of course, we’ll show you how to use them to boost your company’s
performance.
The power of ratios lies in the fact that the numbers in the fi nancial state-
ments by themselves don’t reveal the whole story. Is net profi t of $10 million
a healthy bottom line for a company? Who knows? It depends on the size of
the company, on what net profi t was last year, on how much net profi t was
expected to be this year, and on many other variables. If you ask whether a
$10 million profi t is good or bad, the only possible answer is the one given
H6061.indb 160H6061.indb 160 11/21/12 8:25:38 AM11/21/12 8:25:38 AM
Do
Not
Cop
y or
Pos
t
This document is authorized for use only by Liudmyla Feurstein at EBCM - European University of Munich until October 2014. Copying or posting is an infringement of
copyright. [email protected] or 617.783.7860.
161The Power of Ratios
by the woman in the old joke. Asked how her husband was, she replied,
“Compared to what?”
Ratios offer points of comparison and thus tell you more than the raw
numbers alone. Profi t, for example, can be compared with sales, or with
total assets, or with the amount of equity shareholders have invested in the
company. A different ratio expresses each relationship, and each gives you
a way of gauging whether a $10 million profi t is good news or bad news. As
we’ll see, many of the different line items on the fi nancials are incorporated
into ratios. Those ratios help you understand whether the numbers you’re
looking at are favorable or unfavorable.
What’s more, the ratios themselves can be compared. For instance:
• You can compare ratios with themselves over time. Is profi t relative to
sales up or down this year? This level of analysis can reveal some pow-
erful trend lines—and some big warning fl ags if the ratios are headed
in the wrong direction.
• You can also compare ratios with what was projected. To pick just one
of the ratios we’ll be examining in this part, if your inventory turnover
is worse than you expected it to be, you need to fi nd out why.
• You can compare ratios with industry averages. If you fi nd that your
company’s key ratios are worse than those of your competitors, you
defi nitely want to fi gure out the reason. To be sure, not all the ratio re-
sults we discuss will be similar from one company to another, even in
the same industry. For most, there’s a reasonable range. It’s when the
ratios get outside of that range, as Sunbeam’s DSO did, that it’s worth
your attention.
There are four categories of ratios that managers and other stakeholders
in a business typically use to analyze the company’s performance: profi t-
ability, leverage, liquidity, and effi ciency. We will give you examples in each
category. Note, however, that many of these formulas can be tinkered with
by the fi nancial folks to address specifi c approaches or concerns. We see
this on a regular basis with our clients. The formulas used by one client in
Silicon Valley, for example, were highly specifi c to its business; as a result,
it was diffi cult to compare the company’s results to those of a competitor,
H6061.indb 161H6061.indb 161 11/21/12 8:25:38 AM11/21/12 8:25:38 AM
Do
Not
Cop
y or
Pos
t
This document is authorized for use only by Liudmyla Feurstein at EBCM - European University of Munich until October 2014. Copying or posting is an infringement of
copyright. [email protected] or 617.783.7860.
162RAT IOS
which also had its own unique formulas. Tinkering of this sort doesn’t
mean that people are cooking the books, only that they are using their ex-
pertise to obtain the most useful information for particular situations (yes,
there is art even in formulas). What we will provide are the foundational
formulas, the ones you need to learn fi rst. Each provides a different view—
like looking into a house through windows on all four sides.
A WORD OF CAUTION
We do want to add a note of caution before we begin. In our experience,
some companies focus attention on one or two ratios while ignoring other
key ratios and the big picture of the business. For example, every public
company concerns itself with earnings per share, which is a ratio that in-
vestors watch closely. And many watch net profi t margin to the exclusion
of ratios that might indicate suboptimal performance in other areas.
When Joe worked at Ford in the early 1990s, for example, he was given
the assignment of pricing a certain category of aftermarket parts. Ford
wanted a predetermined profi t margin on the entire line of parts and re-
quired that prices be set accordingly. In Joe’s product line, it turned out
that Ford had a warehouse full of old Mustang parts that just wouldn’t sell.
Because Ford’s prices were high, would-be buyers could get the parts much
cheaper from a junkyard or third-party sellers.
Joe realized that these parts were costing Ford warehousing space, and
that they sat on the company’s balance sheet as inventory, which as we
know ties up cash. But when he suggested deeply discounting the parts to
free up space and get them out of inventory, management’s answer was
simple: no. If we did that, they said, the product line would not hit its profi t
margin target. So the price discount was never considered.
In our view, Ford at the time was too focused on one ratio, profi t mar-
gin, while ignoring ratios that might have indicated the value of selling the
parts. If it discounted the parts, the margin it received would have been
below its target. But overall total profi t would have been higher because the
parts hadn’t been selling at all up to then. Moreover, the company would
have freed up warehouse space and converted some of its inventory to cash.
Return on assets, free cash fl ow, and asset turnover, to name a few other
ratios, would have improved.
H6061.indb 162H6061.indb 162 11/21/12 8:25:38 AM11/21/12 8:25:38 AM

Do
Not
Cop
y or
Pos
t
This document is authorized for use only by Liudmyla Feurstein at EBCM - European University of Munich until October 2014. Copying or posting is an infringement of
copyright. [email protected] or 617.783.7860.
163The Power of Ratios
One more caution: when you are looking at ratios, you also need to
consider the overall value of the numbers. If Walmart consistently earns
a 3 percent profi t margin on annual sales of over $400 billion, that is a lot
more money than a 30 percent profi t margin on a business with $50 mil-
lion in sales. While ratios are an important piece of the fi nancial puzzle,
you always need to put them in context to get the complete picture.
H6061.indb 163H6061.indb 163 11/21/12 8:25:38 AM11/21/12 8:25:38 AM
Do
Not
Cop
y or
Pos
t
This document is authorized for use only by Liudmyla Feurstein at EBCM - European University of Munich until October 2014. Copying or posting is an infringement of
copyright. [email protected] or 617.783.7860.
2 1
Profi tability RatiosThe Higher the Better (Mostly)
PROFITABIL ITY RAT IOS help you evaluate a company’s ability to generate
profi ts. There are dozens of them, a fact that helps keep the fi nancial
folks busy. But here we’re going to focus on just the most important.
These are really the only ones most managers need to understand and use.
Profi tability ratios are the most common of ratios. If you get these, you’ll
be off to a good start in fi nancial statement analysis.
Before we dive in, however, do remember the artful aspects of what
we’re looking at. Profi tability is a measure of a company’s ability to gen-
erate sales and to control its expenses. None of these numbers is wholly
objective. Sales are subject to rules as to when the revenue can be recorded.
Expenses are often a matter of estimation, not to say guesswork. Assump-
tions are built into both sets of numbers. So profi t as reported on the in-
come statement is a product of the art of fi nance, and any ratio based on
those numbers will itself refl ect all those estimates and assumptions. We
don’t propose throwing out the baby with the bathwater—the ratios are
still useful—only that you keep in mind that estimates and assumptions
can always change.
Now, on to the profi tability ratios that we promised you.
H6061.indb 164H6061.indb 164 11/21/12 8:25:38 AM11/21/12 8:25:38 AM
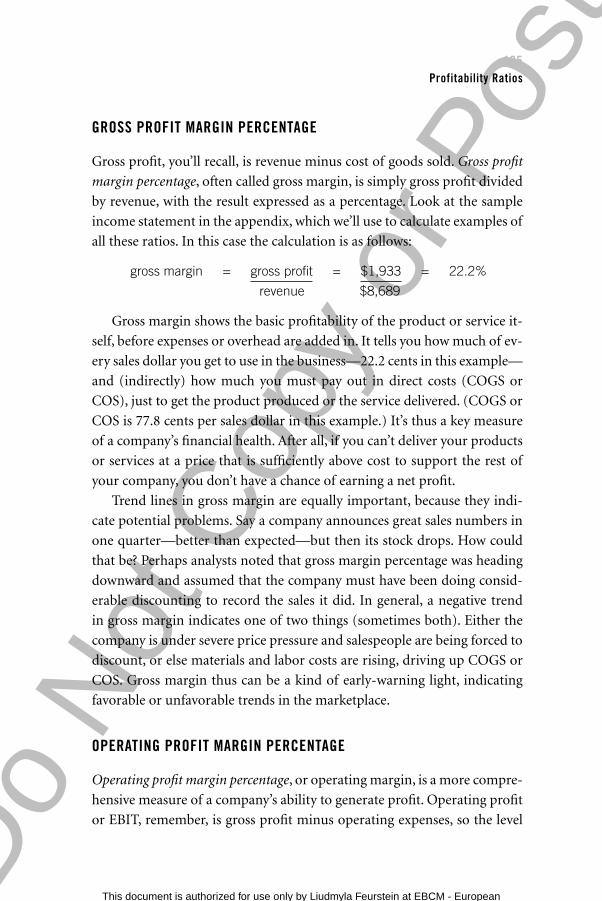
Do
Not
Cop
y or
Pos
t
This document is authorized for use only by Liudmyla Feurstein at EBCM - European University of Munich until October 2014. Copying or posting is an infringement of
copyright. [email protected] or 617.783.7860.
165Profitability Ratios
GROSS PROFIT MARGIN PERCENTAGE
Gross profi t, you’ll recall, is revenue minus cost of goods sold. Gross profi t
margin percentage, often called gross margin, is simply gross profi t divided
by revenue, with the result expressed as a percentage. Look at the sample
income statement in the appendix, which we’ll use to calculate examples of
all these ratios. In this case the calculation is as follows:
gross margin = gross profi t = $1,933 = 22.2%
revenue $8,689
Gross margin shows the basic profi tability of the product or service it-
self, before expenses or overhead are added in. It tells you how much of ev-
ery sales dollar you get to use in the business—22.2 cents in this example—
and (indirectly) how much you must pay out in direct costs (COGS or
COS), just to get the product produced or the service delivered. (COGS or
COS is 77.8 cents per sales dollar in this example.) It’s thus a key measure
of a company’s fi nancial health. After all, if you can’t deliver your products
or services at a price that is suffi ciently above cost to support the rest of
your company, you don’t have a chance of earning a net profi t.
Trend lines in gross margin are equally important, because they indi-
cate potential problems. Say a company announces great sales numbers in
one quarter—better than expected—but then its stock drops. How could
that be? Perhaps analysts noted that gross margin percentage was heading
downward and assumed that the company must have been doing consid-
erable discounting to record the sales it did. In general, a negative trend
in gross margin indicates one of two things (sometimes both). Either the
company is under severe price pressure and salespeople are being forced to
discount, or else materials and labor costs are rising, driving up COGS or
COS. Gross margin thus can be a kind of early-warning light, indicating
favorable or unfavorable trends in the marketplace.
OPERATING PROFIT MARGIN PERCENTAGE
Operating profi t margin percentage, or operating margin, is a more compre-
hensive measure of a company’s ability to generate profi t. Operating profi t
or EBIT, remember, is gross profi t minus operating expenses, so the level
H6061.indb 165H6061.indb 165 11/21/12 8:25:38 AM11/21/12 8:25:38 AM
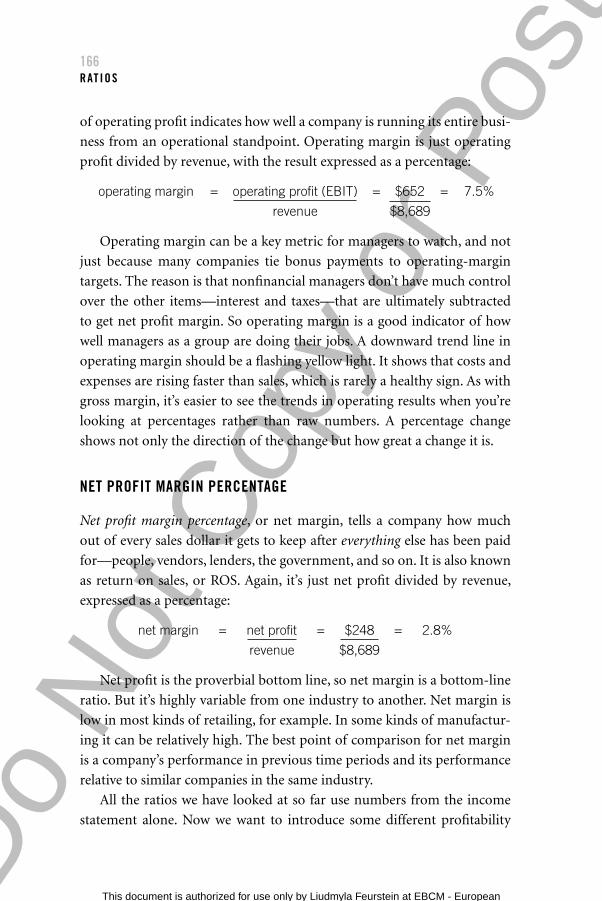
Do
Not
Cop
y or
Pos
t
This document is authorized for use only by Liudmyla Feurstein at EBCM - European University of Munich until October 2014. Copying or posting is an infringement of
copyright. [email protected] or 617.783.7860.
166RAT IOS
of operating profi t indicates how well a company is running its entire busi-
ness from an operational standpoint. Operating margin is just operating
profi t divided by revenue, with the result expressed as a percentage:
operating margin = operating profi t (EBIT) = $652 = 7.5%
revenue $8,689
Operating margin can be a key metric for managers to watch, and not
just because many companies tie bonus payments to operating-margin
targets. The reason is that nonfi nancial managers don’t have much control
over the other items—interest and taxes—that are ultimately subtracted
to get net profi t margin. So operating margin is a good indicator of how
well managers as a group are doing their jobs. A downward trend line in
operating margin should be a fl ashing yellow light. It shows that costs and
expenses are rising faster than sales, which is rarely a healthy sign. As with
gross margin, it’s easier to see the trends in operating results when you’re
looking at percentages rather than raw numbers. A percentage change
shows not only the direction of the change but how great a change it is.
NET PROFIT MARGIN PERCENTAGE
Net profi t margin percentage, or net margin, tells a company how much
out of every sales dollar it gets to keep after everything else has been paid
for—people, vendors, lenders, the government, and so on. It is also known
as return on sales, or ROS. Again, it’s just net profi t divided by revenue,
expressed as a percentage:
net margin = net profi t = $248 = 2.8%
revenue $8,689
Net profi t is the proverbial bottom line, so net margin is a bottom-line
ratio. But it’s highly variable from one industry to another. Net margin is
low in most kinds of retailing, for example. In some kinds of manufactur-
ing it can be relatively high. The best point of comparison for net margin
is a company’s performance in previous time periods and its performance
relative to similar companies in the same industry.
All the ratios we have looked at so far use numbers from the income
statement alone. Now we want to introduce some different profi tability
H6061.indb 166H6061.indb 166 11/21/12 8:25:38 AM11/21/12 8:25:38 AM
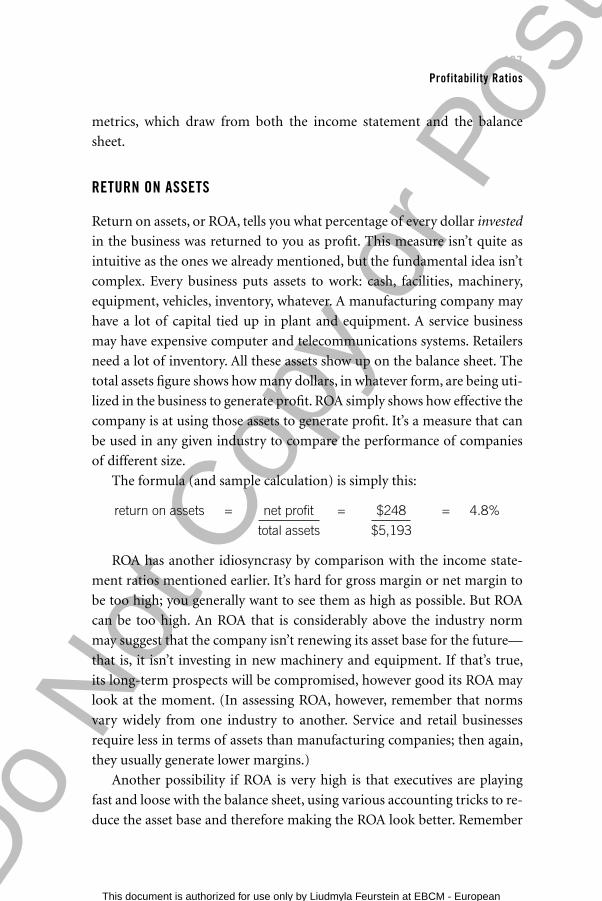
Do
Not
Cop
y or
Pos
t
This document is authorized for use only by Liudmyla Feurstein at EBCM - European University of Munich until October 2014. Copying or posting is an infringement of
copyright. [email protected] or 617.783.7860.
167Profitability Ratios
metrics, which draw from both the income statement and the balance
sheet.
RETURN ON ASSETS
Return on assets, or ROA, tells you what percentage of every dollar invested
in the business was returned to you as profi t. This measure isn’t quite as
intuitive as the ones we already mentioned, but the fundamental idea isn’t
complex. Every business puts assets to work: cash, facilities, machinery,
equipment, vehicles, inventory, whatever. A manufacturing company may
have a lot of capital tied up in plant and equipment. A service business
may have expensive computer and telecommunications systems. Retailers
need a lot of inventory. All these assets show up on the balance sheet. The
total assets fi gure shows how many dollars, in whatever form, are being uti-
lized in the business to generate profi t. ROA simply shows how effective the
company is at using those assets to generate profi t. It’s a measure that can
be used in any given industry to compare the performance of companies
of different size.
The formula (and sample calculation) is simply this:
return on assets = net profi t = $248 = 4.8%
total assets $5,193
ROA has another idiosyncrasy by comparison with the income state-
ment ratios mentioned earlier. It’s hard for gross margin or net margin to
be too high; you generally want to see them as high as possible. But ROA
can be too high. An ROA that is considerably above the industry norm
may suggest that the company isn’t renewing its asset base for the future—
that is, it isn’t investing in new machinery and equipment. If that’s true,
its long-term prospects will be compromised, however good its ROA may
look at the moment. (In assessing ROA, however, remember that norms
vary widely from one industry to another. Service and retail businesses
require less in terms of assets than manufacturing companies; then again,
they usually generate lower margins.)
Another possibility if ROA is very high is that executives are playing
fast and loose with the balance sheet, using various accounting tricks to re-
duce the asset base and therefore making the ROA look better. Remember
H6061.indb 167H6061.indb 167 11/21/12 8:25:38 AM11/21/12 8:25:38 AM
Do
Not
Cop
y or
Pos
t
This document is authorized for use only by Liudmyla Feurstein at EBCM - European University of Munich until October 2014. Copying or posting is an infringement of
copyright. [email protected] or 617.783.7860.
168RAT IOS
Enron, the energy-trading company that collapsed in 2001? Enron had
set up a host of partnerships partially owned by CFO Andrew Fastow and
other executives, and then it “sold” assets to the partnerships. The com-
pany’s share of the partnerships’ profi ts appeared in its income statement,
but the assets were nowhere to be found on its balance sheet. Enron’s ROA
was great, but Enron wasn’t a healthy company.
RETURN ON EQUITY
Return on equity, or ROE, is a little different: it tells us what percentage of
profi t we make for every dollar of equity invested in the company. Remem-
ber the difference between assets and equity: assets refers to what the com-
pany owns, and equity refers to its net worth as determined by accounting
rules.
As with the other profi tability ratios, ROE can be used to compare a
company with its competitors (and, indeed, with companies in other in-
dustries). Still, the comparison isn’t always simple. For instance, Company
A may have a higher ROE than Company B because it has borrowed more
money—that is, it has greater liabilities and proportionately less equity in-
vested in the company. Is this good or bad? The answer depends on whether
Company A is taking on too much risk or whether, by contrast, it is using
borrowed money judiciously to enhance its return. That gets us into ratios
such as debt-to-equity, which we’ll take up in chapter 22.
At any rate, here are the formula and sample calculation for ROE:
Return on Investment
Why isn’t ROI included in our list of profi tability ratios? The reason is that the term has a number of different meanings. Traditionally, ROI was the same as ROA: return on assets. But these days it can also mean return on a particular investment. What is the ROI on that machine? What’s the ROI on our training program? What’s the ROI of our new acquisition? These calculations will be dif-ferent depending on how people are measuring costs and returns. We’ll return to ROI calculations of this sort in part 6.
H6061.indb 168H6061.indb 168 11/21/12 8:25:38 AM11/21/12 8:25:38 AM
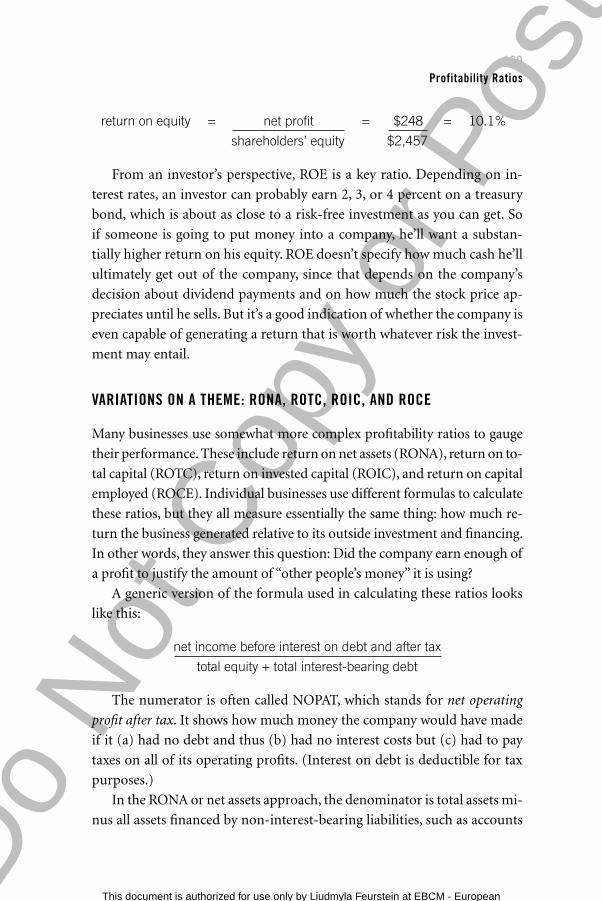
Do
Not
Cop
y or
Pos
t
This document is authorized for use only by Liudmyla Feurstein at EBCM - European University of Munich until October 2014. Copying or posting is an infringement of
copyright. [email protected] or 617.783.7860.
169Profitability Ratios
return on equity = net profi t = $248 = 10.1%
shareholders’ equity $2,457
From an investor’s perspective, ROE is a key ratio. Depending on in-
terest rates, an investor can probably earn 2, 3, or 4 percent on a treasury
bond, which is about as close to a risk-free investment as you can get. So
if someone is going to put money into a company, he’ll want a substan-
tially higher return on his equity. ROE doesn’t specify how much cash he’ll
ultimately get out of the company, since that depends on the company’s
decision about dividend payments and on how much the stock price ap-
preciates until he sells. But it’s a good indication of whether the company is
even capable of generating a return that is worth whatever risk the invest-
ment may entail.
VARIATIONS ON A THEME: RONA, ROTC, ROIC, AND ROCE
Many businesses use somewhat more complex profi tability ratios to gauge
their performance. These include return on net assets (RONA), return on to-
tal capital (ROTC), return on invested capital (ROIC), and return on capital
employed (ROCE). Individual businesses use different formulas to calculate
these ratios, but they all measure essentially the same thing: how much re-
turn the business generated relative to its outside investment and fi nancing.
In other words, they answer this question: Did the company earn enough of
a profi t to justify the amount of “other people’s money” it is using?
A generic version of the formula used in calculating these ratios looks
like this:
net income before interest on debt and after tax
total equity + total interest-bearing debt
The numerator is often called NOPAT, which stands for net operating
profi t after tax. It shows how much money the company would have made
if it (a) had no debt and thus (b) had no interest costs but (c) had to pay
taxes on all of its operating profi ts. (Interest on debt is deductible for tax
purposes.)
In the RONA or net assets approach, the denominator is total assets mi-
nus all assets fi nanced by non-interest-bearing liabilities, such as accounts
H6061.indb 169H6061.indb 169 11/21/12 8:25:38 AM11/21/12 8:25:38 AM
Do
Not
Cop
y or
Pos
t
This document is authorized for use only by Liudmyla Feurstein at EBCM - European University of Munich until October 2014. Copying or posting is an infringement of
copyright. [email protected] or 617.783.7860.
170RAT IOS
payable and accrued expenses. In the ROCE, ROIC, or ROTC approach,
shown in the equation above, the denominator is total equity plus all
interest-bearing debt. Fundamentally, the various approaches amount to
the same thing. You are separating out the liabilities you have to pay inter-
est on from those you don’t. The separation refl ects the fact that some of
the fi nancing necessary to run a business comes from such items as ac-
crued liabilities, accounts payable, and deferred taxes. These will ultimately
wind up as charges on the income statement, but the people to whom the
money is owed don’t expect a return.
Using the sample income statement and balance sheet in the appendix,
you can calculate these ratios as follows. We have left out the zeroes for
simplicity’s sake:
1. Calculate the company’s income before taxes. This is just operating
income or EBIT less interest expenses: $652 – $191 = $461.
2. Determine the company’s tax rate. It shows a charge on the income
statement of $213 for taxes, and $213/$461 = 46 percent. This is
a bit higher than most US businesses, which usually pay between
30 percent and 40 percent.
3. Determine the tax liability on the company’s operating profi t:
$652 × 46% = $301. NOPAT or net operating profi t after tax is
$652 – $301 or $351. This is the numerator of all the ratios.
4. Calculate the denominator. First add up all the interest-bearing
debt on the balance sheet. In this case the category includes the
credit line of $100, the current portion of long-term debt of $52,
and the long-term debt of $1,037. The total is $1,189. The other
liabilities on the balance sheet don’t carry interest—though in the
real world you might need to study them to make sure that is the
case. Usually it is.
5. Now add this fi gure to total equity: $1,189 + $2,457 = $3,646. This
is the all the capital that outsiders have provided plus whatever the
company has retained from profi ts. It is the denominator of the
ratio.
H6061.indb 170H6061.indb 170 11/21/12 8:25:39 AM11/21/12 8:25:39 AM
Do
Not
Cop
y or
Pos
t
This document is authorized for use only by Liudmyla Feurstein at EBCM - European University of Munich until October 2014. Copying or posting is an infringement of
copyright. [email protected] or 617.783.7860.
171Profitability Ratios
6. Finally, calculate the RONA, ROTC, ROIC, or ROCE for this
business:
$351 = 9.6%
$3,646
What does it all mean? For every dollar tied up in this company, the
return in the past year was 9.6 percent. If the ratio is higher than expected,
stakeholders with money in the business are happy. If it is lower, they might
want to look elsewhere. These ratios are essential for measuring the return
on the business’s overall capital.
One note on all such ratios: you’ll notice that they compare a profi t
number taken from the income statement to a capital number taken
from the balance sheet. This creates a potential problem: NOPAT repre-
sents money earned during an entire year, but the denominator—total
capital—is shown for a single point in time, the end of the year. Many
fi nancial folks prefer to take an average of several balance sheets during the
year to get an “average” total capital fi gure rather than using just year-end
numbers. (See the toolbox at the end of this part for more on this topic.)
Whether you’re calculating simple profi tability ratios or more complex
ones, do remember one thing: the numerator is some form of profi t, which
is always an estimate. The denominators, too, are based on assumptions
and estimates. The ratios are useful, particularly when they are tracked
over time to establish trend lines. But we shouldn’t be lulled into thinking
that they are impervious to artistic effort.
H6061.indb 171H6061.indb 171 11/21/12 8:25:39 AM11/21/12 8:25:39 AM
Do
Not
Cop
y or
Pos
t
This document is authorized for use only by Liudmyla Feurstein at EBCM - European University of Munich until October 2014. Copying or posting is an infringement of
copyright. [email protected] or 617.783.7860.
2 2
Leverage RatiosThe Balancing Act
LEVERAGE RAT IOS LET YOU SEE HOW— and how extensively—a company
uses debt. Debt is a loaded word for many people: it conjures up im-
ages of credit cards, interest payments, an enterprise in hock to the
bank. But consider the analogy with home ownership. As long as a family
takes on a mortgage it can afford, debt allows the family to live in a house
that it might otherwise never be able to own. What’s more, homeowners
can deduct the interest paid on the debt from their taxable income, mak-
ing it even cheaper to own that house. So it is with a business: debt allows
a company to grow beyond what its invested capital alone would allow,
and indeed to earn profi ts that expand its equity base. A business can also
deduct interest payments on debt from its taxable income. The fi nancial
analyst’s word for debt is leverage. The implication of the term is that a
business can use a modest amount of capital to build up a larger amount of
assets through debt to run the business, just the way a person using a lever
can move a larger weight than she otherwise could.
The term leverage is actually defi ned in two ways in business—operating
leverage and fi nancial leverage. The ideas are related but different. Operat-
ing leverage is the ratio between fi xed costs and variable costs; increas-
ing your operating leverage means adding to fi xed costs with the objective
H6061.indb 172H6061.indb 172 11/21/12 8:25:39 AM11/21/12 8:25:39 AM
Do
Not
Cop
y or
Pos
t
This document is authorized for use only by Liudmyla Feurstein at EBCM - European University of Munich until October 2014. Copying or posting is an infringement of
copyright. [email protected] or 617.783.7860.
173Leverage Ratios
of reducing variable costs. A retailer that occupies a bigger, more effi cient
store and a manufacturer that builds a bigger, more productive factory
are both increasing their fi xed costs. But they hope to reduce their vari-
able costs, because the new collection of assets is more effi cient than the
old. These are examples of operating leverage. Financial leverage, by con-
trast, simply means the extent to which a company’s asset base is fi nanced
by debt.
Leverage of either kind makes it possible for a company to make more
money, but it also increases risk. The airline industry is an example of a
business with high operating leverage—all those airplanes!—and high fi -
nancial leverage, since most of the planes are fi nanced through debt. The
combination creates enormous risk, because if revenue drops off for any
reason, the companies are not easily able to cut those fi xed costs. That’s
pretty much what happened after September 11, 2001. The airlines were
forced to shut down for a couple of weeks, and the industry lost billions of
dollars in just that short time.
Here we will focus only on fi nancial leverage, and we’ll look at just two
ratios: debt-to-equity and interest coverage.
DEBT-TO-EQUITY
The debt-to-equity ratio is simple and straightforward: it tells how much
debt the company has for every dollar of shareholders’ equity. The formula
and sample calculation look like this:
debt-to-equity ratio = total liabilities = $2,736 = 1.11
shareholders’ equity $2,457
(Note that this ratio isn’t usually expressed in percentage terms.) Both
these numbers come from the balance sheet.
What’s a good debt-to-equity ratio? As with most ratios, the answer
depends on the industry. But many, many companies have a debt-to-equity
ratio considerably larger than 1—that is, they have more debt than equity.
Since the interest on debt is deductible from a company’s taxable income,
plenty of companies use debt to fi nance at least a part of their business. In
fact, companies with particularly low debt-to-equity ratios may be targets
H6061.indb 173H6061.indb 173 11/21/12 8:25:39 AM11/21/12 8:25:39 AM
Do
Not
Cop
y or
Pos
t
This document is authorized for use only by Liudmyla Feurstein at EBCM - European University of Munich until October 2014. Copying or posting is an infringement of
copyright. [email protected] or 617.783.7860.
174RAT IOS
for a leveraged buyout, in which management or other investors use debt
to buy up the stock.
Bankers love the debt-to-equity ratio. They use it to determine whether
or not to offer a company a loan. They know from experience what a rea-
sonable debt-to-equity ratio is for a company of a given size in a particular
industry (and, of course, they check out profi tability, cash fl ow, and other
measures as well). For a manager, knowing the debt-to-equity ratio and
how it compares with those of competitors is a handy gauge of how se-
nior management is likely to feel about taking on more debt. If the ratio
is high, raising more cash through borrowing could be diffi cult. So expan-
sion could require more equity investment.
INTEREST COVERAGE
Bankers love this one, too. It’s a measure of the company’s “interest
exposure”—how much interest it has to pay every year—relative to how
much it’s making. The formula and calculation look like this:
interest coverage = operating profi t = $652 = 3.41
annual interest charges $191
In other words, the ratio shows how easy it will be for the company to
pay its interest. A ratio that gets too close to 1 is obviously a bad sign: most
of a company’s profi t is going to pay off interest! A high ratio is generally a
sign that the company can afford to take on more debt—or at least that it
can make the payments.
What happens when either of these ratios heads too far in the wrong
direction—that is, too high for debt-to-equity and too low for interest cov-
erage? We’d like to think that senior management’s response is always to fo-
cus on paying off debt, so as to get both ratios back into a reasonable range.
But fi nancial artists often have different ideas. There’s a wonderful little
invention called an operating lease, for instance, which is widely used in
the airline industry and others. Rather than buying equipment such as an
airplane outright, a company leases it from an investor. The lease payments
count as an expense on the income statement, but there is no asset and no
debt related to that asset on a company’s books. Some companies that are
H6061.indb 174H6061.indb 174 11/21/12 8:25:39 AM11/21/12 8:25:39 AM

Do
Not
Cop
y or
Pos
t
This document is authorized for use only by Liudmyla Feurstein at EBCM - European University of Munich until October 2014. Copying or posting is an infringement of
copyright. [email protected] or 617.783.7860.
175Leverage Ratios
already overleveraged are willing to pay a premium to lease equipment just
to keep these two ratios in the area that bankers and investors like to see.
If you want to get a complete sense of your company’s indebtedness, by all
means calculate the ratios—but ask someone in fi nance if the company
uses any debtlike instruments such as operating leases as well.
H6061.indb 175H6061.indb 175 11/21/12 8:25:39 AM11/21/12 8:25:39 AM
Do
Not
Cop
y or
Pos
t
This document is authorized for use only by Liudmyla Feurstein at EBCM - European University of Munich until October 2014. Copying or posting is an infringement of
copyright. [email protected] or 617.783.7860.
2 3
Liquidity RatiosCan We Pay Our Bills?
LIQUIDITY RAT IOS TELL YOU about a company’s ability to meet all its fi -
nancial obligations—not just debt but payroll, payments to vendors,
taxes, and so on. These ratios are particularly important to small
businesses—the ones that are in most danger of running out of cash—but
they become important whenever a larger company encounters fi nancial
trouble as well. Not to harp on the airlines too much, but several of the
larger carriers have been through bankruptcy in recent years. You can bet
that professional investors and bondholders have been carefully watching
their liquidity ratios ever since.
Again, we’ll limit ourselves to two of the most common ratios.
CURRENT RATIO
The current ratio measures a company’s current assets against its current
liabilities. Remember from the balance sheet chapters (part 3) that current
in accountantese generally means a period of less than a year. So current
assets are those that can be converted into cash in less than a year; the fi g-
ure normally includes accounts receivable and inventory as well as cash.
Current liabilities are those that will have to be paid off in less than a year,
mostly accounts payable and short-term loans.
H6061.indb 176H6061.indb 176 11/21/12 8:25:39 AM11/21/12 8:25:39 AM
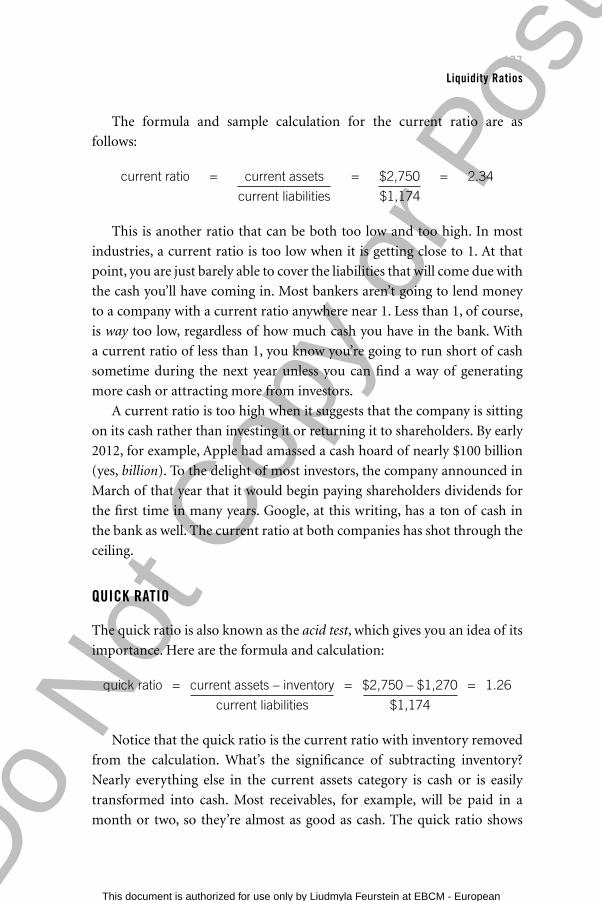
Do
Not
Cop
y or
Pos
t
This document is authorized for use only by Liudmyla Feurstein at EBCM - European University of Munich until October 2014. Copying or posting is an infringement of
copyright. [email protected] or 617.783.7860.
177Liquidity Ratios
The formula and sample calculation for the current ratio are as
follows:
current ratio = current assets = $2,750 = 2.34
current liabilities $1,174
This is another ratio that can be both too low and too high. In most
industries, a current ratio is too low when it is getting close to 1. At that
point, you are just barely able to cover the liabilities that will come due with
the cash you’ll have coming in. Most bankers aren’t going to lend money
to a company with a current ratio anywhere near 1. Less than 1, of course,
is way too low, regardless of how much cash you have in the bank. With
a current ratio of less than 1, you know you’re going to run short of cash
sometime during the next year unless you can fi nd a way of generating
more cash or attracting more from investors.
A current ratio is too high when it suggests that the company is sitting
on its cash rather than investing it or returning it to shareholders. By early
2012, for example, Apple had amassed a cash hoard of nearly $100 billion
(yes, billion). To the delight of most investors, the company announced in
March of that year that it would begin paying shareholders dividends for
the fi rst time in many years. Google, at this writing, has a ton of cash in
the bank as well. The current ratio at both companies has shot through the
ceiling.
QUICK RATIO
The quick ratio is also known as the acid test, which gives you an idea of its
importance. Here are the formula and calculation:
quick ratio = current assets – inventory = $2,750 – $1,270 = 1.26
current liabilities $1,174
Notice that the quick ratio is the current ratio with inventory removed
from the calculation. What’s the signifi cance of subtracting inventory?
Nearly everything else in the current assets category is cash or is easily
transformed into cash. Most receivables, for example, will be paid in a
month or two, so they’re almost as good as cash. The quick ratio shows
H6061.indb 177H6061.indb 177 11/21/12 8:25:39 AM11/21/12 8:25:39 AM

Do
Not
Cop
y or
Pos
t
This document is authorized for use only by Liudmyla Feurstein at EBCM - European University of Munich until October 2014. Copying or posting is an infringement of
copyright. [email protected] or 617.783.7860.
178RAT IOS
how easy it would be for a company to pay off its short-term debt without
waiting to sell off inventory or convert it into product. Any business that
has a lot of cash tied up in inventory has to know that lenders and vendors
will be looking at its quick ratio—and will be expecting it (in most cases)
to be signifi cantly above 1.
H6061.indb 178H6061.indb 178 11/21/12 8:25:39 AM11/21/12 8:25:39 AM
Do
Not
Cop
y or
Pos
t
This document is authorized for use only by Liudmyla Feurstein at EBCM - European University of Munich until October 2014. Copying or posting is an infringement of
copyright. [email protected] or 617.783.7860.
2 4
Effi ciency RatiosMaking the Most of Your Assets
EFFICIENCY RAT IOS HELP YOU EVALUATE how effi ciently you manage cer-
tain key balance sheet assets and liabilities.
The phrase managing the balance sheet may have a peculiar ring, espe-
cially since most managers are accustomed to focusing only on the income
statement. But think about it: the balance sheet lists assets and liabilities,
and these assets and liabilities are always in fl ux. If you can reduce inven-
tory or speed up collection of receivables, you will have a direct and im-
mediate impact on your company’s cash position. The effi ciency ratios let
you know how you’re doing on just such measures of performance. (We’ll
have more to say on managing the balance sheet in part 7.)
INVENTORY DAYS AND TURNOVER
These ratios can be a little confusing. They’re based on the fact that inven-
tory fl ows through a company, and it can fl ow at a greater or lesser speed.
Moreover, how fast it fl ows matters a lot. If you look at inventory as frozen
cash, then the faster you can get it out the door and collect the actual cash,
the better off you will be.
So let’s begin with a ratio sporting the catchy name days in inventory,
or DII. (It’s also called inventory days.) Essentially, it measures the number
H6061.indb 179H6061.indb 179 11/21/12 8:25:39 AM11/21/12 8:25:39 AM
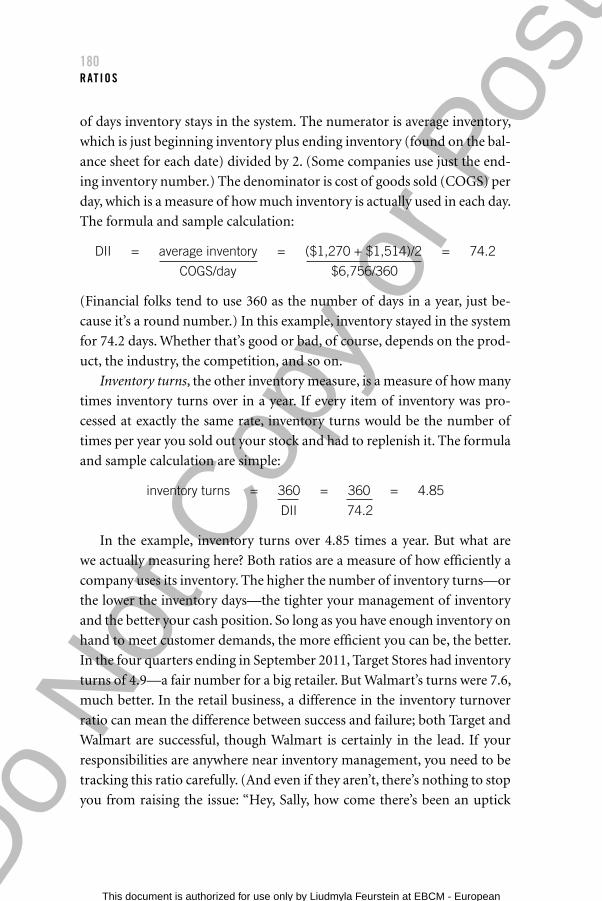
Do
Not
Cop
y or
Pos
t
This document is authorized for use only by Liudmyla Feurstein at EBCM - European University of Munich until October 2014. Copying or posting is an infringement of
copyright. [email protected] or 617.783.7860.
180RAT IOS
of days inventory stays in the system. The numerator is average inventory,
which is just beginning inventory plus ending inventory (found on the bal-
ance sheet for each date) divided by 2. (Some companies use just the end-
ing inventory number.) The denominator is cost of goods sold (COGS) per
day, which is a measure of how much inventory is actually used in each day.
The formula and sample calculation:
DII = average inventory = ($1,270 + $1,514)/2 = 74.2
COGS/day $6,756/360
(Financial folks tend to use 360 as the number of days in a year, just be-
cause it’s a round number.) In this example, inventory stayed in the system
for 74.2 days. Whether that’s good or bad, of course, depends on the prod-
uct, the industry, the competition, and so on.
Inventory turns, the other inventory measure, is a measure of how many
times inventory turns over in a year. If every item of inventory was pro-
cessed at exactly the same rate, inventory turns would be the number of
times per year you sold out your stock and had to replenish it. The formula
and sample calculation are simple:
inventory turns = 360 = 360 = 4.85
DII 74.2
In the example, inventory turns over 4.85 times a year. But what are
we actually measuring here? Both ratios are a measure of how effi ciently a
company uses its inventory. The higher the number of inventory turns—or
the lower the inventory days—the tighter your management of inventory
and the better your cash position. So long as you have enough inventory on
hand to meet customer demands, the more effi cient you can be, the better.
In the four quarters ending in September 2011, Target Stores had inventory
turns of 4.9—a fair number for a big retailer. But Walmart’s turns were 7.6,
much better. In the retail business, a difference in the inventory turnover
ratio can mean the difference between success and failure; both Target and
Walmart are successful, though Walmart is certainly in the lead. If your
responsibilities are anywhere near inventory management, you need to be
tracking this ratio carefully. (And even if they aren’t, there’s nothing to stop
you from raising the issue: “Hey, Sally, how come there’s been an uptick
H6061.indb 180H6061.indb 180 11/21/12 8:25:39 AM11/21/12 8:25:39 AM
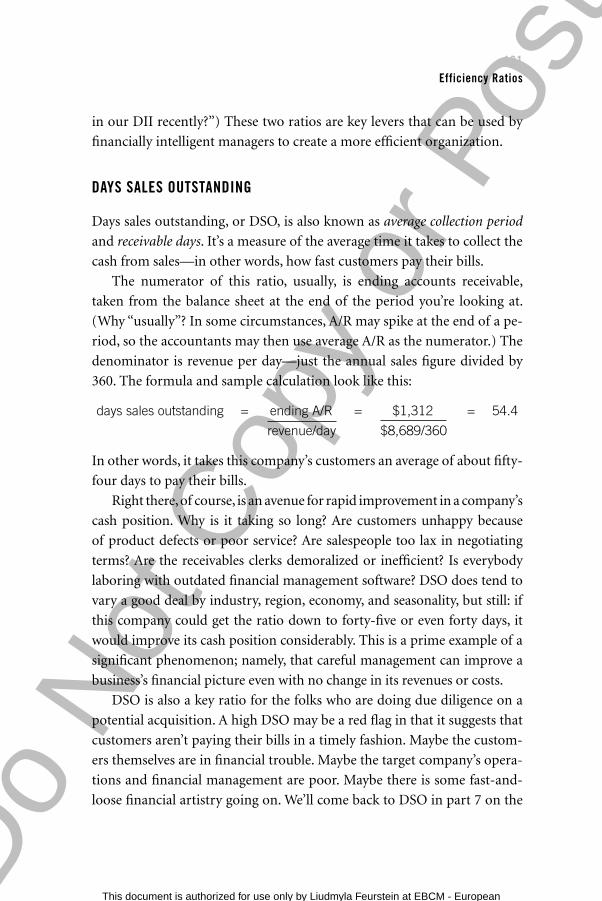
Do
Not
Cop
y or
Pos
t
This document is authorized for use only by Liudmyla Feurstein at EBCM - European University of Munich until October 2014. Copying or posting is an infringement of
copyright. [email protected] or 617.783.7860.
181Efficiency Ratios
in our DII recently?”) These two ratios are key levers that can be used by
fi nancially intelligent managers to create a more effi cient organization.
DAYS SALES OUTSTANDING
Days sales outstanding, or DSO, is also known as average collection period
and receivable days. It’s a measure of the average time it takes to collect the
cash from sales—in other words, how fast customers pay their bills.
The numerator of this ratio, usually, is ending accounts receivable,
taken from the balance sheet at the end of the period you’re looking at.
(Why “usually”? In some circumstances, A/R may spike at the end of a pe-
riod, so the accountants may then use average A/R as the numerator.) The
denominator is revenue per day—just the annual sales fi gure divided by
360. The formula and sample calculation look like this:
days sales outstanding = ending A/R = $1,312 = 54.4
revenue/day $8,689/360
In other words, it takes this company’s customers an average of about fi fty-
four days to pay their bills.
Right there, of course, is an avenue for rapid improvement in a com pany’s
cash position. Why is it taking so long? Are customers unhappy because
of product defects or poor service? Are salespeople too lax in negotiating
terms? Are the receivables clerks demoralized or ineffi cient? Is everybody
laboring with outdated fi nancial management software? DSO does tend to
vary a good deal by industry, region, economy, and seasonality, but still: if
this company could get the ratio down to forty-fi ve or even forty days, it
would improve its cash position considerably. This is a prime example of a
signifi cant phenomenon; namely, that careful management can improve a
business’s fi nancial picture even with no change in its revenues or costs.
DSO is also a key ratio for the folks who are doing due diligence on a
potential acquisition. A high DSO may be a red fl ag in that it suggests that
customers aren’t paying their bills in a timely fashion. Maybe the custom-
ers themselves are in fi nancial trouble. Maybe the target company’s opera-
tions and fi nancial management are poor. Maybe there is some fast-and-
loose fi nancial artistry going on. We’ll come back to DSO in part 7 on the
H6061.indb 181H6061.indb 181 11/21/12 8:25:39 AM11/21/12 8:25:39 AM
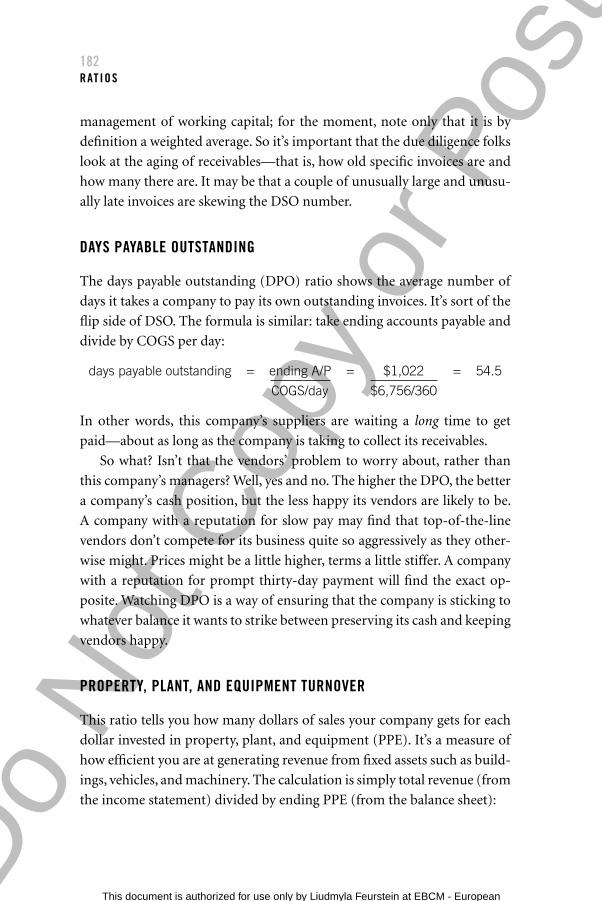
Do
Not
Cop
y or
Pos
t
This document is authorized for use only by Liudmyla Feurstein at EBCM - European University of Munich until October 2014. Copying or posting is an infringement of
copyright. [email protected] or 617.783.7860.
182RAT IOS
management of working capital; for the moment, note only that it is by
defi nition a weighted average. So it’s important that the due diligence folks
look at the aging of receivables—that is, how old specifi c invoices are and
how many there are. It may be that a couple of unusually large and unusu-
ally late invoices are skewing the DSO number.
DAYS PAYABLE OUTSTANDING
The days payable outstanding (DPO) ratio shows the average number of
days it takes a company to pay its own outstanding invoices. It’s sort of the
fl ip side of DSO. The formula is similar: take ending accounts payable and
divide by COGS per day:
days payable outstanding = ending A/P = $1,022 = 54.5
COGS/day $6,756/360
In other words, this company’s suppliers are waiting a long time to get
paid—about as long as the company is taking to collect its receivables.
So what? Isn’t that the vendors’ problem to worry about, rather than
this company’s managers? Well, yes and no. The higher the DPO, the better
a company’s cash position, but the less happy its vendors are likely to be.
A company with a reputation for slow pay may fi nd that top-of-the-line
vendors don’t compete for its business quite so aggressively as they other-
wise might. Prices might be a little higher, terms a little stiffer. A company
with a reputation for prompt thirty-day payment will fi nd the exact op-
posite. Watching DPO is a way of ensuring that the company is sticking to
whatever balance it wants to strike between preserving its cash and keeping
vendors happy.
PROPERTY, PLANT, AND EQUIPMENT TURNOVER
This ratio tells you how many dollars of sales your company gets for each
dollar invested in property, plant, and equipment (PPE). It’s a measure of
how effi cient you are at generating revenue from fi xed assets such as build-
ings, vehicles, and machinery. The calculation is simply total revenue (from
the income statement) divided by ending PPE (from the balance sheet):
H6061.indb 182H6061.indb 182 11/21/12 8:25:39 AM11/21/12 8:25:39 AM
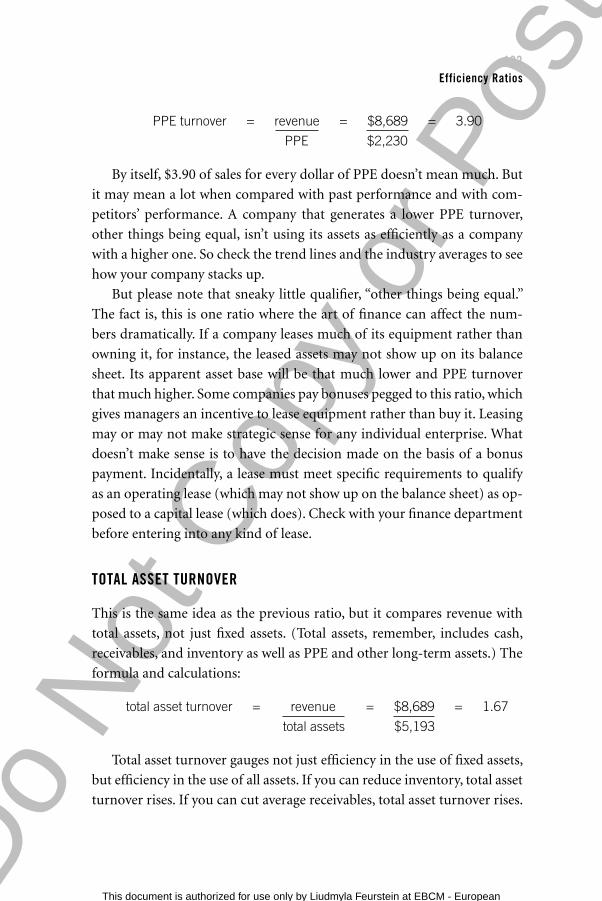
Do
Not
Cop
y or
Pos
t
This document is authorized for use only by Liudmyla Feurstein at EBCM - European University of Munich until October 2014. Copying or posting is an infringement of
copyright. [email protected] or 617.783.7860.
183Efficiency Ratios
PPE turnover = revenue = $8,689 = 3.90
PPE $2,230
By itself, $3.90 of sales for every dollar of PPE doesn’t mean much. But
it may mean a lot when compared with past performance and with com-
petitors’ performance. A company that generates a lower PPE turnover,
other things being equal, isn’t using its assets as effi ciently as a company
with a higher one. So check the trend lines and the industry averages to see
how your company stacks up.
But please note that sneaky little qualifi er, “other things being equal.”
The fact is, this is one ratio where the art of fi nance can affect the num-
bers dramatically. If a company leases much of its equipment rather than
owning it, for instance, the leased assets may not show up on its balance
sheet. Its apparent asset base will be that much lower and PPE turnover
that much higher. Some companies pay bonuses pegged to this ratio, which
gives managers an incentive to lease equipment rather than buy it. Leasing
may or may not make strategic sense for any individual enterprise. What
doesn’t make sense is to have the decision made on the basis of a bonus
payment. Incidentally, a lease must meet specifi c requirements to qualify
as an operating lease (which may not show up on the balance sheet) as op-
posed to a capital lease (which does). Check with your fi nance department
before entering into any kind of lease.
TOTAL ASSET TURNOVER
This is the same idea as the previous ratio, but it compares revenue with
total assets, not just fi xed assets. (Total assets, remember, includes cash,
receivables, and inventory as well as PPE and other long-term assets.) The
formula and calculations:
total asset turnover = revenue = $8,689 = 1.67
total assets $5,193
Total asset turnover gauges not just effi ciency in the use of fi xed assets,
but effi ciency in the use of all assets. If you can reduce inventory, total asset
turnover rises. If you can cut average receivables, total asset turnover rises.
H6061.indb 183H6061.indb 183 11/21/12 8:25:40 AM11/21/12 8:25:40 AM

Do
Not
Cop
y or
Pos
t
This document is authorized for use only by Liudmyla Feurstein at EBCM - European University of Munich until October 2014. Copying or posting is an infringement of
copyright. [email protected] or 617.783.7860.
184RAT IOS
If you can increase sales while holding assets constant (or increasing at a
slower rate), total asset turnover rises. Any of these managing-the-balance-
sheet moves improves effi ciency. Watching the trends in total asset turn-
over shows you how you’re doing.
There are many more ratios than these, of course. Financial professionals
of all sorts use a lot of them. Investment analysts do, too, as we’ll see in
chapter 25. Your own organization is likely to have specifi c ratios that are
appropriate for the company, the industry, or both. You’ll want to learn how
to calculate them, how to use them, and how you affect them. But those we
have outlined here are the most common for most working managers.
H6061.indb 184H6061.indb 184 11/21/12 8:25:40 AM11/21/12 8:25:40 AM
Do
Not
Cop
y or
Pos
t
This document is authorized for use only by Liudmyla Feurstein at EBCM - European University of Munich until October 2014. Copying or posting is an infringement of
copyright. [email protected] or 617.783.7860.
2 5
The Investor’s PerspectiveThe “Big Five” Numbers and Shareholder Value
AS WE’VE MENT IONED BEFORE, we wrote this book for people who work
in organizations, not for investors. But the investor’s perspective al-
ways informs managerial decisions, because every company must do
its best to keep shareholders and bondholders happy. Even the owners and
employees of privately held companies can benefi t from understanding this
perspective, since it provides some good indicators of the fi nancial health
of their company. So this chapter addresses the question: which ratios and
other indicators does the typical investor or bondholder care most about?
In our view, Wall Street and other outside investors are really looking
at fi ve key metrics when they assess a company’s fi nancial performance or
its attractiveness as an investment. You can think of these measures as the
Big Five. When all fi ve are moving in the right direction, it’s a safe bet that
investors will favor the company’s prospects.
The Big Five are:
• Revenue growth from one year to the next
• Earnings per share (EPS)
• Earnings before interest, taxes, depreciation, and amortization
(EBITDA)
H6061.indb 185H6061.indb 185 11/21/12 8:25:40 AM11/21/12 8:25:40 AM
Do
Not
Cop
y or
Pos
t
This document is authorized for use only by Liudmyla Feurstein at EBCM - European University of Munich until October 2014. Copying or posting is an infringement of
copyright. [email protected] or 617.783.7860.
186RAT IOS
• Free cash fl ow (FCF)
• Return on total capital (ROTC) or return on equity (ROE). ROE is
the right metric for fi nancial businesses such as banks and insurance
companies.
Let’s briefl y look at each one.
REVENUE GROWTH YEAR OVER YEAR
Not every company grows. Most small businesses reach a certain size and
stay there because the opportunities for growth are limited. Some privately
held companies have terrifi c growth prospects, but the owners decide that
they prefer to keep the business relatively small. (A great book called Small
Giants, by Bo Burlingham, tells the story of many such companies.1) But
when a business “goes public”—sells stock to outside investors—it has no
choice about whether to pursue growth. Investors won’t buy the stock un-
less they expect the value of their investment to increase over time. They
want to see a growing dividend, an appreciating stock price, or both. To
provide either one, the company must expand its business.
How much growth is reasonable? It depends on the company, the in-
dustry, and the economic situation. Some high-tech companies—Google
is an example—go through periods of explosive growth. Most growth-
oriented companies expand far more slowly; a growth rate of 10 percent
a year, sustained over time, is remarkably good. (According to research by
Bain & Company, only about 10 percent of global companies sustain an
annual growth rate in revenue and earnings of at least 5.5 percent over ten
years while also earning their cost of capital.2) Some large companies peg
their goals to the growth in gross domestic product (GDP) in the coun-
tries where they operate. General Electric, for instance, typically plans to
expand its business by two or three times the rate of GDP growth. If GDP
is increasing at 1 percent and GE grows at 2 or 3 percent, the company can
declare victory.
H6061.indb 186H6061.indb 186 11/21/12 8:25:40 AM11/21/12 8:25:40 AM
Do
Not
Cop
y or
Pos
t
This document is authorized for use only by Liudmyla Feurstein at EBCM - European University of Munich until October 2014. Copying or posting is an infringement of
copyright. [email protected] or 617.783.7860.
187The Investor’s Perspective
EARNINGS PER SHARE
EPS is often the fi rst number companies report to investors in their quar-
terly earnings calls. It is simply the company’s net income for the quarter
or year divided by the average number of shares outstanding during the
period.
Investors expect increases in EPS over time, just as they do with rev-
enue. Other things being equal, a growing EPS presages an increasing stock
price. During an economic slowdown, revenues might fall, but most com-
panies try hard to keep EPS up by reducing costs. Shareholders can accept
revenue declines during a slump, but they don’t like to see a drop in EPS.
EARNINGS BEFORE INTEREST, TAXES, DEPRECIATION, AND AMORTIZATION
We’ve already mentioned EBITDA a few times in this book. It’s an impor-
tant measure because investors and bankers view it as a good indicator of
future operating cash fl ow. Lenders like it because it can help them assess
a company’s ability to repay its loans. Shareholders like it because it is a
measure of cash earnings before the accountants have added in noncash
expenses such as depreciation. EBITDA can be manipulated by accounting
tricks, as we noted earlier, but it isn’t as easily manipulated as net profi t. A
strong, healthy company should experience growth in EBITDA over time.
Incidentally, EBITDA is often used in valuing businesses. Many com-
panies are bought and sold at a price that is an agreed-upon multiple of
EBITDA.
FREE CASH FLOW
We discussed free cash fl ow in the toolbox for part 4. It’s a key part of any
investor’s measurement kit. If a company’s free cash fl ow is healthy and
growing, investors can be pretty sure that it is doing well and that its stock
price will rise over time. Moreover, a company with a healthy free cash fl ow
can fi nance its own growth even when investment or debt capital is hard
to come by.
H6061.indb 187H6061.indb 187 11/21/12 8:25:40 AM11/21/12 8:25:40 AM
Do
Not
Cop
y or
Pos
t
This document is authorized for use only by Liudmyla Feurstein at EBCM - European University of Munich until October 2014. Copying or posting is an infringement of
copyright. [email protected] or 617.783.7860.
188RAT IOS
Here’s one more wrinkle on these two indicators: many investors are
now looking at free cash fl ow divided by EBITDA. When that ratio is low,
it may indicate that the company is trying to make its EBITDA look strong
through accounting gimmickry even though its cash fl ow is relatively weak.
Some people call this ratio the cash conversion metric. Another formula
that’s sometimes used is operating cash fl ow divided by EBIT (rather than
by EBITDA). Either way, the metric shows how well the company is con-
verting profi t to cash.
RETURN ON TOTAL CAPITAL OR RETURN ON EQUITY
ROTC, discussed in chapter 21, tells investors whether the business is gen-
erating a return high enough to justify their investment. ROE is most com-
monly used in evaluating fi nancial businesses. A bank, for instance, makes
money by borrowing money in the form of deposits and then lending
those deposits out. ROTC isn’t a good indicator of its performance because
a bank’s debt to its depositors is part of its business, not part of its capital.
ROE is a far better gauge of performance.
MARKET CAP, PRICE-TO-EARNINGS, AND SHAREHOLDER VALUE
Along with the Big Five, investors also examine many other ratios and indi-
cators. Three of the most common are market capitalization, the price-to-
earnings ratio (P/E), and what is often called shareholder value.
A company’s market cap is simply the current stock price of a com-
pany multiplied by the number of shares outstanding. It represents the
total value of the business on any given day. If a company has 10 million
shares outstanding and its market price on Tuesday is $20, its market cap
that day is $200 million. Many large companies have market caps well over
$100 billion. At the end of 2011, Apple’s was about $375 billion, IBM’s
close to $220 billion.
While the market cap shows what a company is worth to investors, the
book value of the company is simply the value of the equity of the business
as shown on the balance sheet. Most companies’ market caps are signifi -
cantly higher than their book values. Some investors—Warren Buffett, for
example—like to look at the “market to book” ratio. Buffett often tries to
H6061.indb 188H6061.indb 188 11/21/12 8:25:40 AM11/21/12 8:25:40 AM
Do
Not
Cop
y or
Pos
t
This document is authorized for use only by Liudmyla Feurstein at EBCM - European University of Munich until October 2014. Copying or posting is an infringement of
copyright. [email protected] or 617.783.7860.
189The Investor’s Perspective
fi nd companies that are trading at a market cap close to or even below their
book value.
The price-to-earnings ratio or P/E is the current stock price divided by
the prior year’s earning per share. Historically, most businesses have traded
in public markets at P/E ratios of roughly 16 to 18. Companies with higher
ratios are considered to have high growth potential; those with lower ratios
are considered slow-growth businesses. Investors often try to fi nd compa-
nies with P/E ratios lower than the investor believes appropriate. At the end
of 2011 both Apple and IBM had a P/E of about 14.6.
In a sense, all these measures are indicators of a company’s shareholder
value. But the term “shareholder value” crops up in a number of different
contexts and has a variety of meanings. Sometimes it just means market
cap; sometimes it refers to the expected future cash fl ows of a company
(which, after all, is what investors are buying when they purchase a share of
stock); sometimes it refers to the increase in dividends, share price, or both
that investors hope to realize over time. A CEO might write in his annual
letter, “Our goal is to increase shareholder value.” It hardly matters what
defi nition he is using, because increases in any one of them would redound
to investors’ advantage.
Increasing shareholder value is important to everyone who works for a
company, not just to shareholders. A higher shareholder value compared
with the past or compared with competitors bespeaks relative fi nancial
strength. Lenders like to lend to strong companies. Investors like to invest
in them. Strong companies are more likely than weaker ones to survive
tough economic times and to prosper in good ones. They are more likely to
offer their employees job security and opportunities for advancement, to
say nothing of steady paychecks and annual raises. Customers like strong
companies as well. Strong companies have more pricing fl exibility than
weak ones, and they are likely to be around next month and next year.
What determines shareholder value? It isn’t just current fi nancial per-
formance. A well-regarded biotech company, for instance, may have a high
market cap even though it has no earnings, just because investors expect it
to create a lot of value in the future through the products it brings to mar-
ket. Conversely, a solidly profi table company with poor growth prospects
may be worth considerably less than a company with lower current profi ts
and better hopes for the future.
H6061.indb 189H6061.indb 189 11/21/12 8:25:40 AM11/21/12 8:25:40 AM
Do
Not
Cop
y or
Pos
t
This document is authorized for use only by Liudmyla Feurstein at EBCM - European University of Munich until October 2014. Copying or posting is an infringement of
copyright. [email protected] or 617.783.7860.
190RAT IOS
In general, shareholder value depends on market perceptions, which in
turn are driven by:
• The company’s current fi nancial performance
• The company’s prospects for growth in the future
• The company’s anticipated cash fl ows in the future
• The predictability of its performance—that is, the degree of risk involved
• Investors’ assessments of the expertise of a company’s management
and the skills of its employees . . .
. . . and of course a lot of other factors, such as the overall state of the econ-
omy, the condition of the stock market in general, the level of speculative
fervor, and so on. At any given point in time, investors will disagree about
a company’s “true” value, which is why some are willing to buy shares at a
particular price and some are willing to sell them.
Sophisticated investors always look at the kinds of accounting measures
we describe in this book: sales, cost of sales, operating margin, and so on.
They look at a company’s physical assets, its inventories, its receivables, its
level of overhead, and many other indicators. But they also understand
that investment is a game of psychology as well as of economics. As the
economist John Maynard Keynes once pointed out, buying stocks is like
trying to anticipate who will win a beauty contest. You want to choose not
the person who you think is the most beautiful but the person you think
everyone else will see as most beautiful. So it is with stocks: prices rise not
just when a company turns in great performance but when a lot of inves-
tors believe that the future will bring even better performance
We hope that you now see the importance of ratios, from both a manager’s
and an investor’s perspective. Although understanding the fi nancial state-
ments is important, it is just a start on the journey to fi nancial intelligence.
Ratios take you to the next level; they give you a way to read between (or
maybe underneath) the lines, so you can really understand what is going
on. They are a useful tool for analyzing your company or any other com-
pany, and for telling its fi nancial story.
H6061.indb 190H6061.indb 190 11/21/12 8:25:40 AM11/21/12 8:25:40 AM
Do
Not
Cop
y or
Pos
t
This document is authorized for use only by Liudmyla Feurstein at EBCM - European University of Munich until October 2014. Copying or posting is an infringement of
copyright. [email protected] or 617.783.7860.
Part FiveToolbox
WHICH RATIOS ARE MOST IMPORTANT TO YOUR BUSINESS?
Certain ratios are generally seen as critical in certain industries. Retailers,
for instance, watch inventory turnover closely. The faster they can turn
their stock, the more effi cient use they are making of their other assets,
such as the store itself. But individual companies typically like to create
their own key ratios, depending on their circumstances and competitive
situation. For example, Joe’s company, Setpoint, is a small, project-based
business that must keep a careful eye on both operating expenses and cash.
So which ratios do Setpoint’s managers watch most closely? One is home-
grown: gross profi t divided by operating expenses. Keeping an eye on that
ratio ensures that operating expenses don’t get out of line in relation to
the gross profi t dollars the company is generating. The other is the current
ratio, which compares current assets with current liabilities. The current
ratio is usually a good indication of whether a company has enough cash
to meet its obligations.
You may already know your company’s key ratios. If not, try asking
the CFO or someone on her staff what they are. We bet they’ll be able to
answer the question pretty easily.
THE POWER OF PERCENT OF SALES
You’ll often see one kind of ratio built right into a company’s income state-
ment: each line item will be expressed not only in dollars but as a percent of
sales. For instance, COGS might be 68 percent of sales, operating expenses
20 percent, and so on. The percent-of-sales fi gure itself will be tracked over
H6061.indb 191H6061.indb 191 11/21/12 8:25:40 AM11/21/12 8:25:40 AM
Do
Not
Cop
y or
Pos
t
This document is authorized for use only by Liudmyla Feurstein at EBCM - European University of Munich until October 2014. Copying or posting is an infringement of
copyright. [email protected] or 617.783.7860.
192RAT IOS
time to establish trend lines. Companies can pursue this analysis in some
detail—for example, tracking what percent of sales each product line ac-
counts for, or what percent of sales each store or region in a retail chain
accounts for. The power here is that percent-of-sales calculations give a
manager much more information than the raw numbers alone. Percent of
sales allows a manager to track his expenses in relationship to sales. Oth-
erwise, it’s tough for the manager to know if he is in line or not as sales
increase and decrease.
If your company doesn’t break out percent of sales, try this exercise: lo-
cate the last three income statements and calculate percent of sales for each
major line item. Then track the results over time. If you see certain items
creep up while others creep down, ask yourself why that happened—and if
you don’t know, try to fi nd someone who does. The exercise can teach you
a lot about the competitive (or other) pressures your company has been
under.
RATIO RELATIONSHIPS
Like the fi nancial statements themselves, ratios fi t together mathematically.
We won’t go into enormous detail here, because this book isn’t aimed at
fi nancial professionals. But one relationship among ratios is worth spell-
ing out because it shows so clearly what we have been saying; namely, that
managers can affect a business’s performance in a variety of ways.
Start with the fact that one of a business’s key profi tability objectives is
return on assets, or ROA. That’s a critical metric because investment capi-
tal is a business’s fuel, and if a company can’t deliver a satisfactory ROA, its
fl ow of capital will dry up. We know from this part that ROA is equal to net
income divided by total assets.
But another way to express ROA is through two different factors
that, multiplied together, equal net income divided by total assets. Here
they are:
net income × revenue = net income = ROA
revenue assets assets
The fi rst term, net income divided by revenue, is of course net profi t
margin percentage, or return on sales (ROS). The second term, revenue
H6061.indb 192H6061.indb 192 11/21/12 8:25:40 AM11/21/12 8:25:40 AM
Do
Not
Cop
y or
Pos
t
This document is authorized for use only by Liudmyla Feurstein at EBCM - European University of Munich until October 2014. Copying or posting is an infringement of
copyright. [email protected] or 617.783.7860.
193Part Five Toolbox
divided by assets, is asset turnover, discussed in chapter 24. So net profi t
margin times asset turnover equals ROA.
The equation shows explicitly that there are two moves to the hoop,
where the “hoop” is higher ROA. One is to increase net profi t margin, ei-
ther by raising prices or by delivering goods or services more effi ciently.
That can be tough if the marketplace you operate in is highly competitive.
A second is to increase the asset turnover ratio. That opens up another set
of possible actions: reducing average inventory, reducing days sales out-
standing, and reducing the purchase of property, plant, and equipment. If
you can’t improve your net profi t margin, working on those objectives—
that is, managing the balance sheet—may be your best path to beating the
competition and improving your ROA.
DIFFERENT COMPANIES, DIFFERENT CALCULATIONS
Having read the chapters in this part, you might assume that the formulas
we present are “the” formulas. Return on assets, for example, is just net in-
come divided by assets, right? Not necessarily. We have presented the stan-
dard formulas, but even with those, companies may decide on a particular
way of calculating some of the numbers. The accountants do need to be
consistent from one year to the next, and public companies must disclose
how they are calculating the ratios. But when you compare one company’s
ratios with another’s, you need to ask whether they are calculating each
ratio the same way.
The most common differences arise with balance sheet data. Let’s use
the same example, return on assets. The denominator, total assets, comes
from the balance sheet. Of course, the balance sheet typically shows two
points in time, say December 31, 2011, and December 31, 2012. For the
standard formula, you use the total assets number from the most recent
point in time, December 31, 2012. (This is also called ending assets, as it is
the last point in time for which you have data.)
But some companies don’t believe that one point in time is a good way
of measuring total assets. So they might use “average” total assets, adding the
2011 and the 2012 fi gures and dividing by 2. Or they might calculate a “roll-
ing average” using three, four, or even fi ve quarters of data. As a new quarter
closes, they replace the oldest data with the newest in the calculation.
H6061.indb 193H6061.indb 193 11/21/12 8:25:40 AM11/21/12 8:25:40 AM
Do
Not
Cop
y or
Pos
t
This document is authorized for use only by Liudmyla Feurstein at EBCM - European University of Munich until October 2014. Copying or posting is an infringement of
copyright. [email protected] or 617.783.7860.
194RAT IOS
Does it matter? A little. Rolling averages tend to smooth results out,
and ending often shows more ups and downs. Then, too, most fi nancial
analysts would agree that some kind of averaging makes more sense for
calculations such as ROA. As we mentioned in chapter 21, you have an
apples-and-oranges situation whenever you compare an income statement
number such as net income to a balance sheet number such as total assets.
The income statement measures profi t or income over a period of time.
The balance sheet lists assets at a point in time. So it seems more reasonable
to use a rolling average of total assets over the whole period rather than as-
sets at a single point in time.
In general, though, the precise methodology may not matter much.
Remember that ratios are used to look at trends over time, and as long
as a company’s methodology is consistent you can learn a lot from the
comparison.
H6061.indb 194H6061.indb 194 11/21/12 8:25:40 AM11/21/12 8:25:40 AM
Do
Not
Cop
y or
Pos
t
This document is authorized for use only by Liudmyla Feurstein at EBCM - European University of Munich until October 2014. Copying or posting is an infringement of
copyright. [email protected] or 617.783.7860.
Part Six
How to Calculate (and Really Understand) Return on Investment
H6061.indb 195H6061.indb 195 11/21/12 8:25:40 AM11/21/12 8:25:40 AM

Do
Not
Cop
y or
Pos
t
This document is authorized for use only by Liudmyla Feurstein at EBCM - European University of Munich until October 2014. Copying or posting is an infringement of
copyright. [email protected] or 617.783.7860.H6061.indb 196H6061.indb 196 11/21/12 8:25:40 AM11/21/12 8:25:40 AM
Do
Not
Cop
y or
Pos
t
This document is authorized for use only by Liudmyla Feurstein at EBCM - European University of Munich until October 2014. Copying or posting is an infringement of
copyright. [email protected] or 617.783.7860.
2 6
The Building Blocks of ROI
FINANCIAL INTELL IGENCE is all about understanding how the fi nancial
side of business works and how fi nancial decisions are made. The
principles discussed in this chapter are the foundation of how some
decisions—those relating to capital investment—are made in corporate
America.
Most of us need little introduction to the fundamental principle of fi -
nance known as the time value of money. The reason is that we take advan-
tage of it every day in our personal fi nances. We take out home mortgages
and car loans. We run up balances on our credit cards. Meanwhile, we’re
putting our own savings into interest-bearing checking or savings accounts,
money-market funds, treasury bills, stocks and I bonds, and probably half
a dozen other kinds of investments. The United States in particular is a
nation of borrowers—in fact, the US government borrowed so much that
its debt was downgraded in 2011—but it is also a nation of savers, lenders,
and investors. Since all these activities refl ect the time value of money, it’s
a safe bet that most of us have a gut-level understanding of the idea. Those
who don’t are likely to wind up on the losing end of the principle, which
can be expensive indeed.
At its simplest, the principle of the time value of money says this: a
dollar in your hand today is worth more than a dollar you expect to col-
lect tomorrow—and it’s worth a whole lot more than a dollar you hope to
collect ten years from now. The reasons are obvious. You know you have
H6061.indb 197H6061.indb 197 11/21/12 8:25:41 AM11/21/12 8:25:41 AM

Do
Not
Cop
y or
Pos
t
This document is authorized for use only by Liudmyla Feurstein at EBCM - European University of Munich until October 2014. Copying or posting is an infringement of
copyright. [email protected] or 617.783.7860.
198HOW TO CALCULATE ROI
today’s dollar, whereas a dollar you expect to get tomorrow (let alone in
ten years) is a little iffy. There’s risk involved. What’s more, you can buy
something today with the dollar you have. If you want to spend the dol-
lar you hope to have, you have to wait until you have it. Given the time
value of money, anyone who lends money to somebody else expects to be
paid interest, and anybody who borrows money expects to pay interest.
The longer the time period and the higher the risk, the larger the interest
charges are likely to be.
The principle here is the same, of course, even if interest isn’t the term
used and even if there is no fi xed expectation about what the return will
be. Say you buy stock in a high-tech start-up. You’re not going to get any
interest, and you probably will never receive a dividend—but you hope
you can sell the stock for more than you paid for it. In effect, you’re lending
the company your money with the expectation of a return on your invest-
ment. When and if the return materializes, you can calculate it in percent-
age terms just as if it were really interest.
This is the basic principle that underlies a business’s decisions about
capital investments, which we will discuss in this part. The business has
to spend cash that it has now in hopes of realizing a return at some future
date. If you are charged with preparing a fi nancial proposal for buying a
new machine or opening a new branch offi ce—tasks that we’ll show you
how to do in the following pages—you will be relying on calculations in-
volving the time value of money.
While the time value of money is the basic principle, the three key con-
cepts you’ll be using in analyzing capital expenditures are future value, pres-
ent value, and required rate of return. You may fi nd them confusing at fi rst,
but none of them is too complicated. They’re simply ways to calculate the
time value of money. If you can understand these concepts and use them
in your decision making, you’ll fi nd yourself thinking more creatively—
maybe we should say more artistically—about fi nancial matters, just the
way the pros do.
FUTURE VALUE
Future value is what a given amount of cash will be worth in the future if
it is loaned out or invested. In personal fi nance, it’s a concept often used in
H6061.indb 198H6061.indb 198 11/21/12 8:25:41 AM11/21/12 8:25:41 AM
Do
Not
Cop
y or
Pos
t
This document is authorized for use only by Liudmyla Feurstein at EBCM - European University of Munich until October 2014. Copying or posting is an infringement of
copyright. [email protected] or 617.783.7860.
199The Building Blocks of ROI
retirement planning. Perhaps you have $50,000 in the bank at age thirty-
fi ve, and you want to know what that $50,000 will be worth at age sixty-
fi ve. That’s the future value of the $50,000. In business, an investment ana-
lyst might project the value of a company’s stock in two years if earnings
grow at some given percent a year. That future-value calculation can help
her advise clients as to whether the company is a good investment.
Figuring future value offers a broad canvas for fi nancial artists. Look
at that retirement plan, for example. Do you assume an average 3 percent
return over the next thirty years, or do you assume an average 6 percent?
The difference is substantial: at 3 percent your $50,000 will grow to slightly
more than $121,000 (and never mind what infl ation will have done to the
value of a dollar in the meantime). At 6 percent it will grow to more than
$287,000, though with the same caveat about the effect of infl ation. It’s
tough to decide the right interest rate to use: how on earth can anyone know
what interest rates will prevail over the next thirty years? At best, calculating
future value that far out is educated guesswork—an exercise in artistry.
The investment analyst is in a somewhat better position, because she is
looking out only two years. Still, she has more variables to contend with.
Why does she think earnings might grow at 3 percent or 5 percent or 7 per-
cent or some other rate entirely? And what happens if they do? If earnings
grow at only 3 percent, for instance, investors might lose interest and sell
their shares, and the stock’s price-to-earnings ratio might decline. If earn-
ings grow at 7 percent, investors might get excited, buy more stock, and
push up that ratio. And of course, the market itself will have an effect on
the stock’s price, and nobody can reliably predict the market’s overall di-
rection. Again, we’re back to educated guesswork.
In fact, every calculation of future value involves a series of assumptions
about what will happen between now and the time that you’re looking at.
Change the assumptions, and you get a different future value. The variance
in return rates is a form of fi nancial risk. The longer the investment out-
look, the more estimating is required, hence the higher the risk.
PRESENT VALUE
This is the concept used most often in analyzing capital expenditures. It’s
the reverse of future value. Say you believe that a particular investment
H6061.indb 199H6061.indb 199 11/21/12 8:25:41 AM11/21/12 8:25:41 AM
Do
Not
Cop
y or
Pos
t
This document is authorized for use only by Liudmyla Feurstein at EBCM - European University of Munich until October 2014. Copying or posting is an infringement of
copyright. [email protected] or 617.783.7860.
200HOW TO CALCULATE ROI
will generate $100,000 in cash fl ow per year over the next three years.
If you want to know whether the investment is worth spending money
on, you need to know what that $300,000 would be worth right now. Just
as you use a particular interest rate to fi gure future value, you also use an
interest rate to “discount” a future value and bring it back to present value.
To take a simple example, the present value of $106,000 one year from now
at 6 percent interest is $100,000. We are back to the notion that a dollar
today is worth more than a dollar tomorrow. In this example, $106,000 in
twelve months is worth $100,000 today.
Present-value concepts are widely used to evaluate investments in
equipment, real estate, business opportunities, even mergers and acqui-
sitions. But you can see the art of fi nance clearly here as well. To fi gure
present value, you have to make assumptions both about the cash the in-
vestment will generate in the future and about what kind of an interest rate
should be used to discount that future value.
REQUIRED RATE OF RETURN
When you’re fi guring what interest rate to use in calculating present value,
remember that you’re working backward. You are assuming your invest-
ment will pay off a certain amount in the future, and you want to know
how much is worth investing now in order to get that amount at a future
date. So your decision about the interest or discount rate is essentially a de-
cision about what interest rate you need in order to make the investment at
all. You might not invest $100,000 now to get $102,000 in a year—a 2 per-
cent rate—but you might very well invest $100,000 now to get $120,000 in
a year—a 20 percent rate. Different companies set the bar, or “hurdle,” at
different points, and they typically set it higher for riskier projects than for
less risky ones. The rate that they require before they will make an invest-
ment is called the required rate of return, or the “hurdle rate.”
There is always some judgment involved in establishing a hurdle rate,
but the judgment isn’t wholly arbitrary. One factor is the opportunity cost
involved. The company has only so much cash, and it has to make judg-
ments about how best to use its funds. That 2 percent return is unattrac-
tive because the company could probably do better just by buying a trea-
sury bill, which might pay 3 percent or 4 percent with almost no risk. The
H6061.indb 200H6061.indb 200 11/21/12 8:25:41 AM11/21/12 8:25:41 AM
Do
Not
Cop
y or
Pos
t
This document is authorized for use only by Liudmyla Feurstein at EBCM - European University of Munich until October 2014. Copying or posting is an infringement of
copyright. [email protected] or 617.783.7860.
201The Building Blocks of ROI
20 percent return may well be attractive—it’s hard to make 20 percent on
most investments—but it obviously depends on how risky the venture is.
A second factor is the company’s own cost of capital. If it borrows money, it
has to pay interest. If it uses shareholders’ capital, the shareholders expect a
return. The proposed investment has to add enough value to the company
that debtholders can be repaid and shareholders kept happy. An investment
that returns less than the company’s cost of capital won’t meet these two
objectives—so the required rate of return should always be higher than the
cost of capital. (See the toolbox at the end of this part for a detailed discus-
sion of cost of capital.)
That said, decisions about hurdle rates are rarely a matter of following
a formula. The company’s CFO or treasurer will evaluate how risky a given
investment is, how it is likely to be fi nanced, and what the company’s over-
all situation is. He knows that shareholders expect the company to invest
for the future. He knows, too, that shareholders expect those investments
to generate a return at least comparable to what they can get elsewhere at
a similar level of risk. He knows—or at least you hope he does—how tight
the company’s cash position is, how much risk the CEO and the board are
comfortable with, and what’s going on in the marketplace the company
operates in. Then he makes judgments—assumptions—about what kind
of hurdle rates make sense. High-growth companies typically use a high
hurdle rate, because they must invest their money where they think it will
generate the level of growth they need. More stable, low-growth companies
typically use a lower hurdle rate. If you don’t already know it, someone in
your fi nance organization can tell you what hurdle rate your company uses
for the kind of projects you’re likely to be involved in.
Opportunity Cost
In everyday language, this phrase denotes what you had to give up to follow a certain course of action. If you spend all your money on a fancy vacation, the opportunity cost is that you can’t buy a car. In business, opportunity cost often means the potential benefi t forgone from not following the fi nancially optimal course of action.
H6061.indb 201H6061.indb 201 11/21/12 8:25:41 AM11/21/12 8:25:41 AM

Do
Not
Cop
y or
Pos
t
This document is authorized for use only by Liudmyla Feurstein at EBCM - European University of Munich until October 2014. Copying or posting is an infringement of
copyright. [email protected] or 617.783.7860.
202HOW TO CALCULATE ROI
A word on the calculations involving these concepts. In chapter 27, we’ll
show you a formula or two. But you don’t need to work it all out by hand;
you can use a fi nancial calculator, fi nd a book of tables, or just go online.
For instance, type “future value calculator” into Google, and you’ll get sev-
eral sites where you can fi gure simple future values. To be sure, real-world
calculations aren’t always so easy. Maybe you think the investment you’re
considering will generate $100,000 in cash in the fi rst year and 3 percent
more in each of the subsequent years. Now you have to fi gure the increase,
make assumptions about whether the appropriate discount rate should
change from one year to the next, and so forth. Nonfi nancial managers
generally don’t have to worry about actually doing these more complex
calculations; the fi nance folks will do them for you. Usually, they’ll have a
spreadsheet or template with the appropriate formulas embedded, so that
you or they can just plug in the numbers. But you do have to be aware of
the concepts and assumptions that they’ll use in the process. If you’re just
plugging in numbers without understanding the logic, you won’t under-
stand why the results turn out as they do, and you won’t know how to make
them turn out differently by starting with different assumptions.
Now let’s put these concepts to work.
H6061.indb 202H6061.indb 202 11/21/12 8:25:41 AM11/21/12 8:25:41 AM
Do
Not
Cop
y or
Pos
t
This document is authorized for use only by Liudmyla Feurstein at EBCM - European University of Munich until October 2014. Copying or posting is an infringement of
copyright. [email protected] or 617.783.7860.
2 7
Figuring ROIThe Nitty-Gritty
CAPITAL EXPENDITURES. Cap-ex. Capital investments. Capital budget-
ing. And of course, return on investment—ROI. Many companies
use these terms loosely or even interchangeably, but they’re usually
referring to the same thing; namely, the process of deciding what capital
investments to make to improve the value of the company.
ANALYZING CAPITAL EXPENDITURES
Capital expenditures are large projects that require a signifi cant investment
of cash. Every organization defi nes signifi cant differently; some draw the
line at $1,000, others at $5,000 or more. Capital expenditures go toward
items and projects expected to help generate revenue for more than a year.
The category is broad. It includes equipment purchases, business expan-
sions, acquisitions, and the development of new products. A new market-
ing campaign can be considered a capital expenditure. So can the renova-
tion of a building, the upgrade of a computer system, and the purchase of
a new company car.
Companies treat expenditures like these differently from ordinary pur-
chases of inventory, supplies, utilities, and so on, for at least three reasons.
H6061.indb 203H6061.indb 203 11/21/12 8:25:41 AM11/21/12 8:25:41 AM
Do
Not
Cop
y or
Pos
t
This document is authorized for use only by Liudmyla Feurstein at EBCM - European University of Munich until October 2014. Copying or posting is an infringement of
copyright. [email protected] or 617.783.7860.
204HOW TO CALCULATE ROI
One is that the expenditures involve large (and sometimes indeterminate)
amounts of cash. A second is that they are typically expected to provide
returns for several years, so the time value of money comes into play. A
third is that they always entail some degree of risk. A company may not
know whether the expenditure will “work”—that is, whether it will deliver
the expected results. Even if it does work generally as planned, the com-
pany can’t know exactly how much cash the investment will actually help
to generate.
We will outline the basic steps of analyzing capital expenditures, and
then describe the three methods fi nance people generally use for calculat-
ing whether a given expenditure is worth making. But please: remember
that this, too, is an exercise in the art of fi nance. It’s actually kind of amaz-
ing; fi nancial professionals can and do analyze proposed projects and make
recommendations using a host of assumptions and estimates, and the re-
sults turn out well. They even enjoy the challenge of taking these unknowns
and quantifying them in a way that makes their company more successful.
With a little fi nancial intelligence, you can contribute your own spe-
cialized knowledge to this process. We know of a company where the CFO
makes a point of involving engineers and technicians in the capital budget-
ing process, precisely because they are likely to know more about what an
investment in a steel-fabricating plant, say, will actually produce. The CFO
likes to say that he’d rather teach those people a little fi nance than learn
metallurgy himself.
So here’s how to go about it:
• Step 1 in analyzing a capital expenditure is to determine the initial cash
outlay. Even this step involves estimates and assumptions: you must
make judgments about what a machine or project is likely to cost
before it begins to generate revenue. The costs may include purchasing
equipment, installing it, allowing people time to learn to use it, and so
on. Typically, most of the costs are incurred during the fi rst year, but
some may spill over into year two or even year three. All these calcula-
tions should be done in terms of cash out the door, not in terms of
decreased profi ts.
• Step 2 is to project future cash fl ows from the investment. (Again, you
want to know cash infl ows, not profi t. We’ll have more to say on this
H6061.indb 204H6061.indb 204 11/21/12 8:25:41 AM11/21/12 8:25:41 AM
Do
Not
Cop
y or
Pos
t
This document is authorized for use only by Liudmyla Feurstein at EBCM - European University of Munich until October 2014. Copying or posting is an infringement of
copyright. [email protected] or 617.783.7860.
205Figuring ROI
distinction later in the chapter.) This is a tricky step—defi nitely
an example of the art of fi nance—both because it is so diffi cult to
predict the future and because there are many factors that need
to be taken into account. (See the toolbox at the end of this part.)
Managers need to be conservative, even cautious, in projecting
future cash fl ows from an investment. If the investment returns more
than projected, everybody will be happy. If it returns signifi cantly
less, no one will be happy, and the company may well have wasted its
money.
• Step 3, fi nally, is to evaluate the future cash fl ows—to fi gure the re-
turn on investment. Are they substantial enough so that the invest-
ment is worthwhile? On what basis can we make that determination?
Finance professionals typically use three different methods—alone
or in combination—for deciding whether a given expenditure is
worth it: the payback method, the net present value (NPV) method,
and the internal rate of return (IRR) method. Each provides dif-
ferent information, and each has its characteristic strengths and
weaknesses.
You can see right away that most of the work and intelligence in good
capital budgeting involves the estimates of costs and returns. A lot of data
must be collected and analyzed—a tough job in and of itself. Then the data
has to be translated into projections about the future. Financially savvy
managers will understand that both of these are diffi cult processes, and
will ask questions and challenge assumptions.
LEARNING THE THREE METHODS
To help you see these steps in action and understand how they work, we’ll
take a very simple example. Your company is considering buying a $3,000
piece of equipment—a specialized computer, say, that will help one of your
employees deliver a service to your customers in less time. The computer is
expected to last three years. At the end of each of the three years, the cash
fl ow from this piece of equipment is estimated at $1,300. Your company’s
required rate of return—the hurdle rate—is 8 percent. Do you buy this
computer or not?
H6061.indb 205H6061.indb 205 11/21/12 8:25:41 AM11/21/12 8:25:41 AM
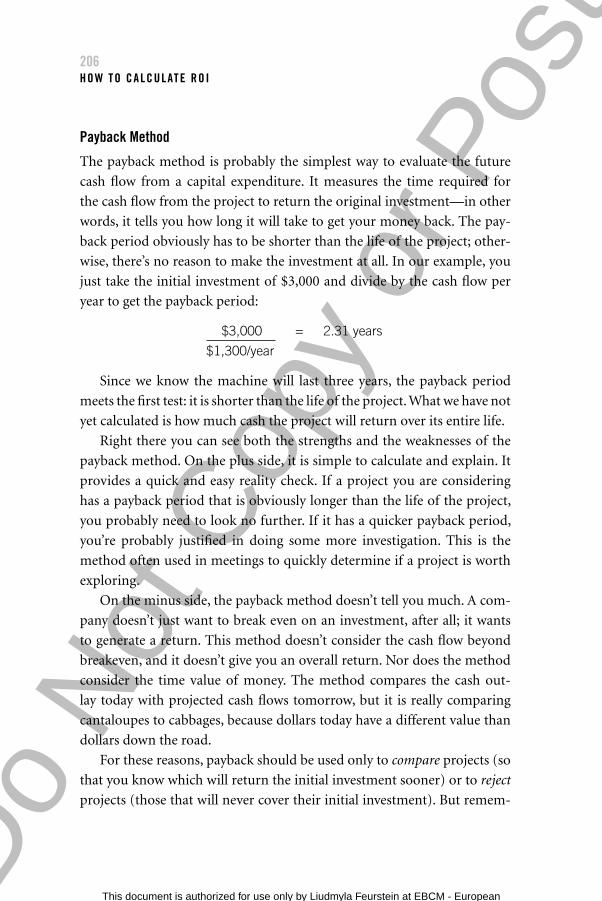
Do
Not
Cop
y or
Pos
t
This document is authorized for use only by Liudmyla Feurstein at EBCM - European University of Munich until October 2014. Copying or posting is an infringement of
copyright. [email protected] or 617.783.7860.
206HOW TO CALCULATE ROI
Payback Method
The payback method is probably the simplest way to evaluate the future
cash fl ow from a capital expenditure. It measures the time required for
the cash fl ow from the project to return the original investment—in other
words, it tells you how long it will take to get your money back. The pay-
back period obviously has to be shorter than the life of the project; other-
wise, there’s no reason to make the investment at all. In our example, you
just take the initial investment of $3,000 and divide by the cash fl ow per
year to get the payback period:
$3,000 = 2.31 years
$1,300/year
Since we know the machine will last three years, the payback period
meets the fi rst test: it is shorter than the life of the project. What we have not
yet calculated is how much cash the project will return over its entire life.
Right there you can see both the strengths and the weaknesses of the
payback method. On the plus side, it is simple to calculate and explain. It
provides a quick and easy reality check. If a project you are considering
has a payback period that is obviously longer than the life of the project,
you probably need to look no further. If it has a quicker payback period,
you’re probably justifi ed in doing some more investigation. This is the
method often used in meetings to quickly determine if a project is worth
exploring.
On the minus side, the payback method doesn’t tell you much. A com-
pany doesn’t just want to break even on an investment, after all; it wants
to generate a return. This method doesn’t consider the cash fl ow beyond
breakeven, and it doesn’t give you an overall return. Nor does the method
consider the time value of money. The method compares the cash out-
lay today with projected cash fl ows tomorrow, but it is really comparing
cantaloupes to cabbages, because dollars today have a different value than
dollars down the road.
For these reasons, payback should be used only to compare projects (so
that you know which will return the initial investment sooner) or to reject
projects (those that will never cover their initial investment). But remem-
H6061.indb 206H6061.indb 206 11/21/12 8:25:41 AM11/21/12 8:25:41 AM
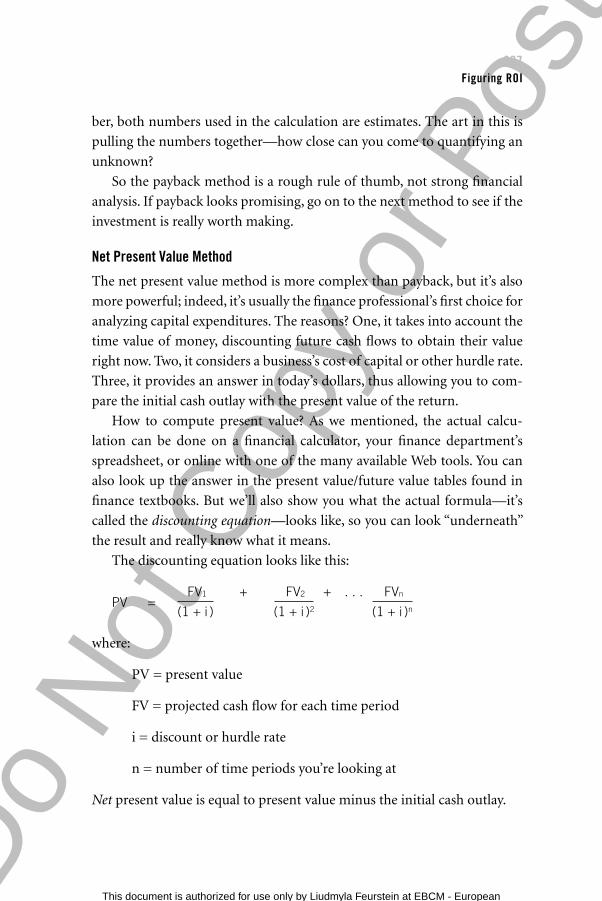
Do
Not
Cop
y or
Pos
t
This document is authorized for use only by Liudmyla Feurstein at EBCM - European University of Munich until October 2014. Copying or posting is an infringement of
copyright. [email protected] or 617.783.7860.
207Figuring ROI
ber, both numbers used in the calculation are estimates. The art in this is
pulling the numbers together—how close can you come to quantifying an
unknown?
So the payback method is a rough rule of thumb, not strong fi nancial
analysis. If payback looks promising, go on to the next method to see if the
investment is really worth making.
Net Present Value Method
The net present value method is more complex than payback, but it’s also
more powerful; indeed, it’s usually the fi nance professional’s fi rst choice for
analyzing capital expenditures. The reasons? One, it takes into account the
time value of money, discounting future cash fl ows to obtain their value
right now. Two, it considers a business’s cost of capital or other hurdle rate.
Three, it provides an answer in today’s dollars, thus allowing you to com-
pare the initial cash outlay with the present value of the return.
How to compute present value? As we mentioned, the actual calcu-
lation can be done on a fi nancial calculator, your fi nance department’s
spreadsheet, or online with one of the many available Web tools. You can
also look up the answer in the present value/future value tables found in
fi nance textbooks. But we’ll also show you what the actual formula—it’s
called the discounting equation—looks like, so you can look “underneath”
the result and really know what it means.
The discounting equation looks like this:
PV = FV1 + FV2 + . . . FVn
(1 + i ) (1 + i )2 (1 + i )n
where:
PV = present value
FV = projected cash fl ow for each time period
i = discount or hurdle rate
n = number of time periods you’re looking at
Net present value is equal to present value minus the initial cash outlay.
H6061.indb 207H6061.indb 207 11/21/12 8:25:41 AM11/21/12 8:25:41 AM
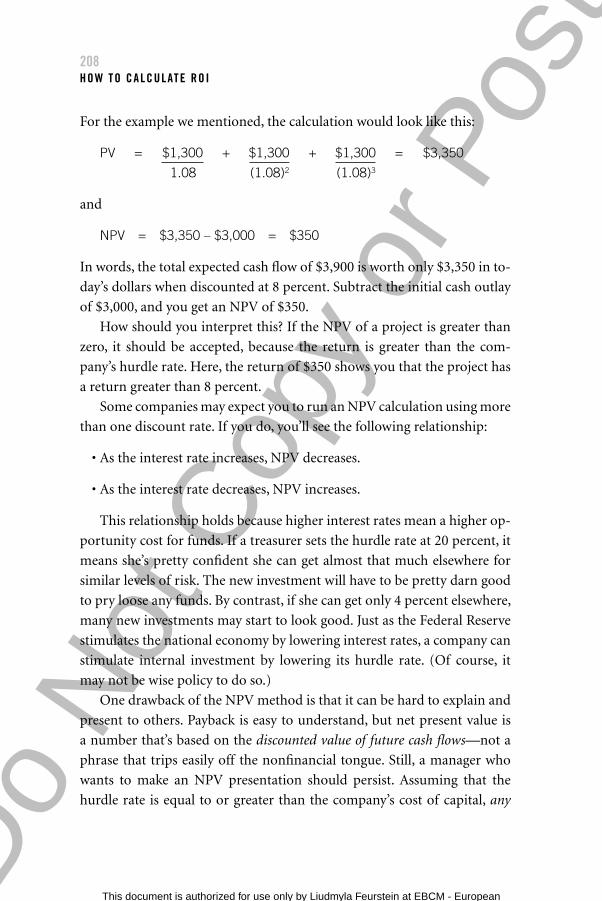
Do
Not
Cop
y or
Pos
t
This document is authorized for use only by Liudmyla Feurstein at EBCM - European University of Munich until October 2014. Copying or posting is an infringement of
copyright. [email protected] or 617.783.7860.
208HOW TO CALCULATE ROI
For the example we mentioned, the calculation would look like this:
PV = $1,300 + $1,300 + $1,300 = $3,350
1.08 (1.08)2 (1.08)3
and
NPV = $3,350 – $3,000 = $350
In words, the total expected cash fl ow of $3,900 is worth only $3,350 in to-
day’s dollars when discounted at 8 percent. Subtract the initial cash outlay
of $3,000, and you get an NPV of $350.
How should you interpret this? If the NPV of a project is greater than
zero, it should be accepted, because the return is greater than the com-
pany’s hurdle rate. Here, the return of $350 shows you that the project has
a return greater than 8 percent.
Some companies may expect you to run an NPV calculation using more
than one discount rate. If you do, you’ll see the following relationship:
• As the interest rate increases, NPV decreases.
• As the interest rate decreases, NPV increases.
This relationship holds because higher interest rates mean a higher op-
portunity cost for funds. If a treasurer sets the hurdle rate at 20 percent, it
means she’s pretty confi dent she can get almost that much elsewhere for
similar levels of risk. The new investment will have to be pretty darn good
to pry loose any funds. By contrast, if she can get only 4 percent elsewhere,
many new investments may start to look good. Just as the Federal Reserve
stimulates the national economy by lowering interest rates, a company can
stimulate internal investment by lowering its hurdle rate. (Of course, it
may not be wise policy to do so.)
One drawback of the NPV method is that it can be hard to explain and
present to others. Payback is easy to understand, but net present value is
a number that’s based on the discounted value of future cash fl ows—not a
phrase that trips easily off the nonfi nancial tongue. Still, a manager who
wants to make an NPV presentation should persist. Assuming that the
hurdle rate is equal to or greater than the company’s cost of capital, any
H6061.indb 208H6061.indb 208 11/21/12 8:25:41 AM11/21/12 8:25:41 AM
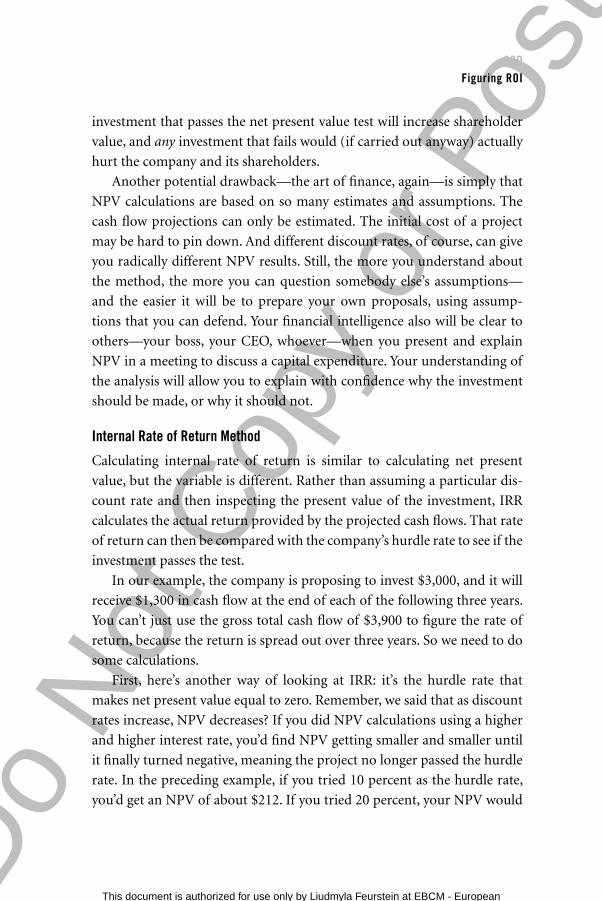
Do
Not
Cop
y or
Pos
t
This document is authorized for use only by Liudmyla Feurstein at EBCM - European University of Munich until October 2014. Copying or posting is an infringement of
copyright. [email protected] or 617.783.7860.
209Figuring ROI
investment that passes the net present value test will increase shareholder
value, and any investment that fails would (if carried out anyway) actually
hurt the company and its shareholders.
Another potential drawback—the art of fi nance, again—is simply that
NPV calculations are based on so many estimates and assumptions. The
cash fl ow projections can only be estimated. The initial cost of a project
may be hard to pin down. And different discount rates, of course, can give
you radically different NPV results. Still, the more you understand about
the method, the more you can question somebody else’s assumptions—
and the easier it will be to prepare your own proposals, using assump-
tions that you can defend. Your fi nancial intelligence also will be clear to
others—your boss, your CEO, whoever—when you present and explain
NPV in a meeting to discuss a capital expenditure. Your understanding of
the analysis will allow you to explain with confi dence why the investment
should be made, or why it should not.
Internal Rate of Return Method
Calculating internal rate of return is similar to calculating net present
value, but the variable is different. Rather than assuming a particular dis-
count rate and then inspecting the present value of the investment, IRR
calculates the actual return provided by the projected cash fl ows. That rate
of return can then be compared with the company’s hurdle rate to see if the
investment passes the test.
In our example, the company is proposing to invest $3,000, and it will
receive $1,300 in cash fl ow at the end of each of the following three years.
You can’t just use the gross total cash fl ow of $3,900 to fi gure the rate of
return, because the return is spread out over three years. So we need to do
some calculations.
First, here’s another way of looking at IRR: it’s the hurdle rate that
makes net present value equal to zero. Remember, we said that as discount
rates increase, NPV decreases? If you did NPV calculations using a higher
and higher interest rate, you’d fi nd NPV getting smaller and smaller until
it fi nally turned negative, meaning the project no longer passed the hurdle
rate. In the preceding example, if you tried 10 percent as the hurdle rate,
you’d get an NPV of about $212. If you tried 20 percent, your NPV would
H6061.indb 209H6061.indb 209 11/21/12 8:25:41 AM11/21/12 8:25:41 AM
Do
Not
Cop
y or
Pos
t
This document is authorized for use only by Liudmyla Feurstein at EBCM - European University of Munich until October 2014. Copying or posting is an infringement of
copyright. [email protected] or 617.783.7860.
210HOW TO CALCULATE ROI
be negative, at –$218. So the infl ection point, where NPV equals zero, is
somewhere between 10 percent and 20 percent. In theory, you could keep
narrowing in until you found it. In practice, you can just use a fi nancial
calculator or a Web tool, and you will fi nd that the point where NPV equals
zero is 14.36 percent. That is the investment’s internal rate of return.
IRR is an easy method to explain and present, because it allows for a
quick comparison of the project’s return to the hurdle rate. On the down-
side, it does not quantify the project’s contribution to the overall value
of the company, as NPV does. It also does not quantify the effects of an
important variable, namely how long the company expects to enjoy the
given rate of return. When competing projects have different durations,
using IRR exclusively can lead you to favor a quick-payback project with
a high-percentage return when you should be investing in longer-payback
projects with lower-percentage returns. IRR also does not address the issue
of scale. For example, an IRR of 20 percent does not tell you anything about
the dollar size of the return. It could be 20 percent of $1 or 20 percent of
$1 million. NPV, by contrast, does tell you the dollar amount. When the
stakes are high, in short, it may make sense to use both IRR and NPV.
COMPARING THE THREE METHODS
We’ve been hinting at two lessons here. One is that the three methods we
have reviewed may lead you to different decisions, depending on which
one you rely on. The other is that the NPV method is the best choice when
the methods confl ict. Let’s take another example and see how the differ-
ences play out.
Assume again that your company has $3,000 to invest. (Keeping the
numbers small makes the calculations easier to follow.) It also has three
different possible investments in different types of computer systems, as
follows:
• Investment A: Returns cash fl ow of $1,000 per year for three years
• Investment B: Returns cash fl ow of $3,600 at the end of year one
• Investment C: Returns cash fl ow of $4,600 at the end of year three
H6061.indb 210H6061.indb 210 11/21/12 8:25:41 AM11/21/12 8:25:41 AM
Do
Not
Cop
y or
Pos
t
This document is authorized for use only by Liudmyla Feurstein at EBCM - European University of Munich until October 2014. Copying or posting is an infringement of
copyright. [email protected] or 617.783.7860.
211Figuring ROI
The required rate of return—the hurdle rate—in your company is 9 per-
cent, and all three investments carry similar levels of risk. If you could
select only one of these investments, which would it be?
The payback method tells us how long it will take to get back the initial
investment. Assuming the payback occurs at the end of each year, here is
how it turns out:
• Investment A: Three years
• Investment B: One year
• Investment C: Three years
By this method alone, investment B is the clear winner. But if we run the
calculations for net present value, here is how they turn out:
• Investment A: –$469 (negative!)
• Investment B: $303
• Investment C: $552
Now investment A is out, and investment C looks like the best choice. What
does the internal rate of return method say?
• Investment A: 0 percent
• Investment B: 20 percent
• Investment C: 15.3 percent
Interesting. If we went by IRR alone, we would choose investment B. But
the NPV calculation favors C—and that would be the correct decision. As
NPV shows us, investment C is worth more in today’s dollars than invest-
ment B.
The explanation? While B pays a higher return than C, it only pays that
return for one year. With C we get a lower return, but we get it for three
years. And three years at 15.3 percent is better than one year at 20 per-
cent. Of course, if you assume you could keep on investing the money at
20 percent, then B would be better—but NPV can’t take into account hy-
pothetical future investments. What it does assume is that the company
H6061.indb 211H6061.indb 211 11/21/12 8:25:41 AM11/21/12 8:25:41 AM
Do
Not
Cop
y or
Pos
t
This document is authorized for use only by Liudmyla Feurstein at EBCM - European University of Munich until October 2014. Copying or posting is an infringement of
copyright. [email protected] or 617.783.7860.
212HOW TO CALCULATE ROI
can go on earning 9 percent on its cash. Even so, if we take the $3,600 that
investment B gives us at the end of year one and reinvest it at 9 percent,
we still end up with less at the end of year three than we would get from
investment C.
So it always makes sense to use NPV calculations for your investment
decisions, even if you sometimes decide to use one of the other methods
for discussion and presentation.
PROFITABILITY INDEX
The profi tability index (PI) is a tool used to compare capital investments.
Every company, after all, has limited capital. Most could invest that capital
in a variety of different ways, and each investment would probably require
a different amount of money. Calculating a PI helps you see which invest-
ments are likely to be most valuable to the business.
To calculate the PI, we fi rst must perform NPV calculations for each
investment. Then we take the net present value and add back the initial
investment itself to get the present value. In our three examples, each re-
quired an initial investment of $3,000. Investment A had a net present
value of –469 and a present value of $2,531. Investment B’s NPV was $303,
and its present value $3,303. For investment C the fi gures are $552 and
$3,552, respectively. To convert these NPV results to a profi tability index,
just take the present value and divide by the initial investment. The calcula-
tions look like this:
• Investment A’s PI is $2,531 divided by $3,000, or 0.84.
• Investment B’s PI is $3,303 divided by $3,000, or 1.10.
• Investment C’s PI is $3,552 divided by $3,000, or 1.18.
In other words, investment A pays $.84 in present dollars for every dollar
invested. Investment B pays $1.10, and investment C pays $1.18. The index
makes it possible to rank-order investments by their PI value—particularly
useful when you are looking at opportunities requiring different levels of
investment. One investment may carry a higher NPV than another, but if
it costs more than the alternative, you don’t have an accurate comparison.
The PI solves this problem.
H6061.indb 212H6061.indb 212 11/21/12 8:25:41 AM11/21/12 8:25:41 AM
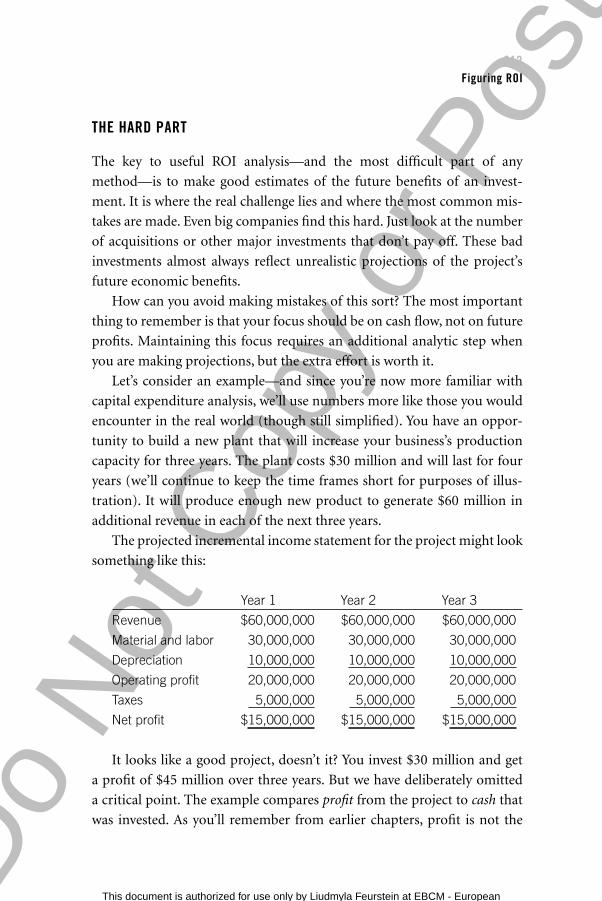
Do
Not
Cop
y or
Pos
t
This document is authorized for use only by Liudmyla Feurstein at EBCM - European University of Munich until October 2014. Copying or posting is an infringement of
copyright. [email protected] or 617.783.7860.
213Figuring ROI
THE HARD PART
The key to useful ROI analysis—and the most diffi cult part of any
method—is to make good estimates of the future benefi ts of an invest-
ment. It is where the real challenge lies and where the most common mis-
takes are made. Even big companies fi nd this hard. Just look at the number
of acquisitions or other major investments that don’t pay off. These bad
investments almost always refl ect unrealistic projections of the project’s
future economic benefi ts.
How can you avoid making mistakes of this sort? The most important
thing to remember is that your focus should be on cash fl ow, not on future
profi ts. Maintaining this focus requires an additional analytic step when
you are making projections, but the extra effort is worth it.
Let’s consider an example—and since you’re now more familiar with
capital expenditure analysis, we’ll use numbers more like those you would
encounter in the real world (though still simplifi ed). You have an oppor-
tunity to build a new plant that will increase your business’s production
capacity for three years. The plant costs $30 million and will last for four
years (we’ll continue to keep the time frames short for purposes of illus-
tration). It will produce enough new product to generate $60 million in
additional revenue in each of the next three years.
The projected incremental income statement for the project might look
something like this:
Year 1 Year 2 Year 3
Revenue $60,000,000 $60,000,000 $60,000,000
Material and labor 30,000,000 30,000,000 30,000,000
Depreciation 10,000,000 10,000,000 10,000,000
Operating profi t 20,000,000 20,000,000 20,000,000
Taxes 5,000,000 5,000,000 5,000,000
Net profi t $15,000,000 $15,000,000 $15,000,000
It looks like a good project, doesn’t it? You invest $30 million and get
a profi t of $45 million over three years. But we have deliberately omitted
a critical point. The example compares profi t from the project to cash that
was invested. As you’ll remember from earlier chapters, profi t is not the
H6061.indb 213H6061.indb 213 11/21/12 8:25:41 AM11/21/12 8:25:41 AM
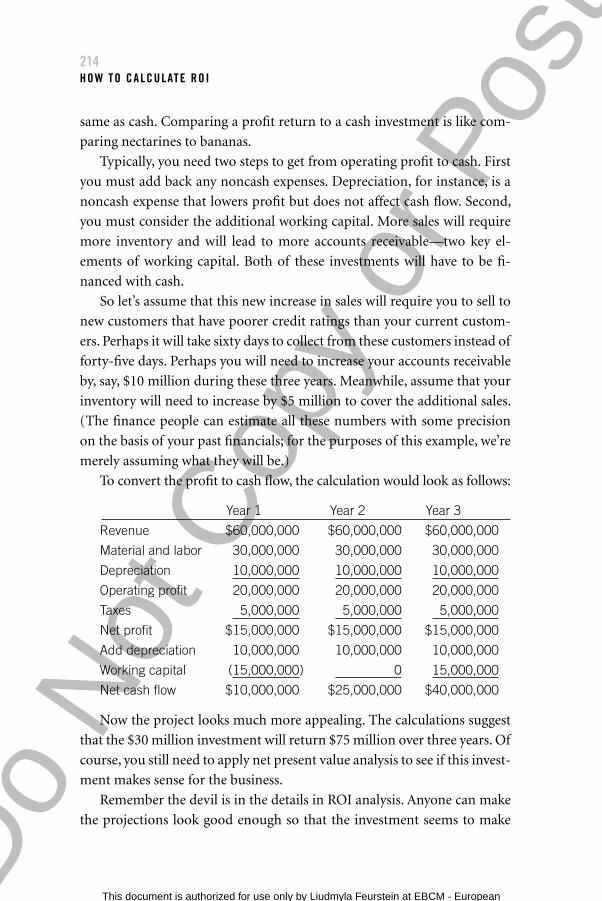
Do
Not
Cop
y or
Pos
t
This document is authorized for use only by Liudmyla Feurstein at EBCM - European University of Munich until October 2014. Copying or posting is an infringement of
copyright. [email protected] or 617.783.7860.
214HOW TO CALCULATE ROI
same as cash. Comparing a profi t return to a cash investment is like com-
paring nectarines to bananas.
Typically, you need two steps to get from operating profi t to cash. First
you must add back any noncash expenses. Depreciation, for instance, is a
noncash expense that lowers profi t but does not affect cash fl ow. Second,
you must consider the additional working capital. More sales will require
more inventory and will lead to more accounts receivable—two key el-
ements of working capital. Both of these investments will have to be fi -
nanced with cash.
So let’s assume that this new increase in sales will require you to sell to
new customers that have poorer credit ratings than your current custom-
ers. Perhaps it will take sixty days to collect from these customers instead of
forty-fi ve days. Perhaps you will need to increase your accounts receivable
by, say, $10 million during these three years. Meanwhile, assume that your
inventory will need to increase by $5 million to cover the additional sales.
(The fi nance people can estimate all these numbers with some precision
on the basis of your past fi nancials; for the purposes of this example, we’re
merely assuming what they will be.)
To convert the profi t to cash fl ow, the calculation would look as follows:
Year 1 Year 2 Year 3
Revenue $60,000,000 $60,000,000 $60,000,000
Material and labor 30,000,000 30,000,000 30,000,000
Depreciation 10,000,000 10,000,000 10,000,000
Operating profi t 20,000,000 20,000,000 20,000,000
Taxes 5,000,000 5,000,000 5,000,000
Net profi t $15,000,000 $15,000,000 $15,000,000
Add depreciation 10,000,000 10,000,000 10,000,000
Working capital (15,000,000) 0 15,000,000
Net cash fl ow $10,000,000 $25,000,000 $40,000,000
Now the project looks much more appealing. The calculations suggest
that the $30 million investment will return $75 million over three years. Of
course, you still need to apply net present value analysis to see if this invest-
ment makes sense for the business.
Remember the devil is in the details in ROI analysis. Anyone can make
the projections look good enough so that the investment seems to make
H6061.indb 214H6061.indb 214 11/21/12 8:25:41 AM11/21/12 8:25:41 AM
Do
Not
Cop
y or
Pos
t
This document is authorized for use only by Liudmyla Feurstein at EBCM - European University of Munich until October 2014. Copying or posting is an infringement of
copyright. [email protected] or 617.783.7860.
215Figuring ROI
sense. Often it makes sense to do a sensitivity analysis—that is, check the
calculations using future cash fl ows that are 80 percent or 90 percent of the
original projections, and see if the investment still looks good. If it does,
you can be more confi dent that your calculations are leading you to the
right decision.
This chapter, we know, has involved a lot of calculating. But sometimes
you’d be surprised at how intuitive the whole process can be. Not long ago,
Joe was running a fi nancial review meeting at Setpoint. A senior manager
in the company was suggesting that Setpoint invest $80,000 in a new ma-
chining center so that it could produce certain parts in-house rather than
relying on an outside vendor. Joe wasn’t wild about the proposal for several
reasons, but before he could speak up, a shop assembly technician asked
the manager the following questions:
• Did you fi gure out the monthly cash fl ow return we will get on this
new equipment? Eighty thousand dollars is a lot of money!
• Do you realize that we are in the spring, and the business is typically
slow, and cash is tight during the summer?
• Have you fi gured in the cost of labor to run the machine? We are all
pretty busy in the shop; you will probably have to hire someone to run
this equipment.
• And are there better ways we could spend that cash to grow the
business?
After this grilling, the manager dropped the proposal. The assembly tech-
nician might not have been an expert in net present value calculations, but
he sure understood the concepts.
Intuition is great when it works. If you can make decisions (or chal-
lenge someone else’s proposal) on gut feel, as the technician did, go ahead.
With larger or more complex projects, however, intuition isn’t suffi cient;
you need solid analysis as well. That’s when you need the concepts and
procedures outlined in this chapter.
H6061.indb 215H6061.indb 215 11/21/12 8:25:41 AM11/21/12 8:25:41 AM
Do
Not
Cop
y or
Pos
t
This document is authorized for use only by Liudmyla Feurstein at EBCM - European University of Munich until October 2014. Copying or posting is an infringement of
copyright. [email protected] or 617.783.7860.
Part SixToolbox
A STEP-BY-STEP GUIDE TO ANALYZING CAPITAL EXPENDITURES
You’ve been talking with your boss about buying a new piece of equipment
for the plant, or maybe mounting a new marketing campaign. He ends the
meeting abruptly. “Sounds good,” he says. “Write me up a proposal with
the ROI and have it on my desk by Monday.”
Don’t panic: here’s a step-by-step guide to preparing your proposal.
1. Remember that ROI means return on investment—just another
way of saying, “Prepare an analysis of this capital expenditure.”
The boss wants to know whether the investment is worth it, and he
wants calculations to back it up.
2. Collect all the data you can about the cost of the investment. In
the case of a new machine, total costs would include the purchase
price, shipping costs, installation, factory downtime, debugging,
training, and so on. Where you must make estimates, note that
fact. Treat the total as your initial cash outlay. You will also need
to determine the machine’s useful life, not an easy task (but part
of the art we enjoy so much!). You might talk to the manufacturer
and to others who have purchased the equipment to help you
answer the question.
3. Determine the benefi ts of the new investment, in terms of
what it will save the company or what it will help the company
earn. A calculation for a new machine should include any cost sav-
H6061.indb 216H6061.indb 216 11/21/12 8:25:41 AM11/21/12 8:25:41 AM

Do
Not
Cop
y or
Pos
t
This document is authorized for use only by Liudmyla Feurstein at EBCM - European University of Munich until October 2014. Copying or posting is an infringement of
copyright. [email protected] or 617.783.7860.
217Part Six Toolbox
ings from greater output speed, less rework, a reduction
in the number of people required to operate the equipment,
increased sales because customers are happier, and so on.
The tricky part here is that you need to fi gure out how all these
factors translate into an estimate of cash fl ow, as we showed in
chapter 27. Don’t be afraid to ask for help from your fi nance
department—they’re trained in this kind of thing and should be
willing to help.
4. Find out the company’s hurdle rate for this kind of investment.
Calculate the net present value of the project using this hurdle
rate. Remember to use your fi nance department—they should
have a spreadsheet that ensures you’ll gather the data they believe
is important and that you run the calculations the way they want
them done.
5. Calculate payback and internal rate of return (the fi nance depart-
ment’s spreadsheet probably includes those as well). You’ll proba-
bly get questions about what they are from your boss, so you need
to have the answers ready.
6. Write up the proposal. Keep it brief. Describe the project, outline
the costs and benefi ts (both fi nancial and otherwise), and describe
the risks. Discuss how it fi ts with the company’s strategy or com-
petitive situation. Then give your recommendations. Include your
NPV, payback, and IRR calculations in case there are questions
about how you arrived at your results.
Managers sometimes go overboard in writing up capital expenditure
proposals. It’s probably human nature: we all like new things, and it’s usu-
ally pretty easy to make the numbers turn out so that the investment looks
good. But we advise conservatism and caution. Explain exactly where you
think the estimates are good and where you think they may be shaky. Do
a sensitivity analysis, and show (if you can) that the estimate makes sense
even if cash fl ows don’t materialize at quite the level you hope. A conserva-
tive proposal is one that is likely to be funded—and one that is likely to add
the most to the company’s value in the long run.
H6061.indb 217H6061.indb 217 11/21/12 8:25:42 AM11/21/12 8:25:42 AM
Do
Not
Cop
y or
Pos
t
This document is authorized for use only by Liudmyla Feurstein at EBCM - European University of Munich until October 2014. Copying or posting is an infringement of
copyright. [email protected] or 617.783.7860.
218HOW TO CALCULATE ROI
One more comment. There are times when doing this kind of analysis
isn’t worth the time and trouble. Sometimes, for instance, a senior execu-
tive might ask you to justify a decision he has already made. There’s really
no point in doing the analysis (unless you can’t get out of it). You will
just have to fi ddle with your assumptions and estimates until the numbers
come out “right.” We know of a small software company (less than $50 mil-
lion in annual revenue) whose owner decided he wanted a corporate jet. He
asked the company controller to do an ROI analysis on the jet to make sure
it made economic sense. When the controller’s numbers showed that the
investment wasn’t even in the ballpark for a business this size, the owner
asked him to redo the analysis with “new” information. The numbers still
did not justify the jet. Never mind: last we heard, the owner was just wait-
ing to close a big sale and then planned to buy the jet anyway.
Then, too, some investments are “no brainers” and don’t require detailed
analysis. At Joe’s company, Setpoint, engineers generate several hundred
dollars a day in gross profi t when they are working on a valuable project. If
an engineer’s CAD system goes down, he can’t generate that profi t. So let’s
imagine that Robert’s computer is getting old and periodically crashes. If
it’s down for several days over the course of a year, the company might be
forgoing thousands of dollars in gross profi t. Meanwhile, a new computer
costs $4,000. You don’t need NPV or IRR to fi gure out that the new one is
worth the money.
CALCULATING THE COST OF CAPITAL
How does a company determine the interest rate or discount rate to use
when it does capital budgeting analysis? To answer this question you need
to fi gure out the company’s cost of capital.
Cost of capital can be a complex calculation. You’ll need to know sev-
eral things about the company, including:
• What is the proportion of debt and equity that it uses to fi nance its
operations?
• How volatile is the company’s stock?
• What is the overall interest cost on its debt?
H6061.indb 218H6061.indb 218 11/21/12 8:25:42 AM11/21/12 8:25:42 AM
Do
Not
Cop
y or
Pos
t
This document is authorized for use only by Liudmyla Feurstein at EBCM - European University of Munich until October 2014. Copying or posting is an infringement of
copyright. [email protected] or 617.783.7860.
219Part Six Toolbox
• What are the prevailing interest rates in the market?
• What is the company’s current tax rate?
Answering these questions allows you to determine the minimum return
or interest rate required to justify an investment.
Let’s look at an example. We’ll assume that the answers to the questions
are as follows:
• The company fi nances its operations with 30 percent debt and 70 per-
cent equity. (You can derive these percentages from the balance sheet.)
• The stock’s volatility, as measured by its beta, is 1.25. (Beta measures
the volatility of a security compared with the market as a whole.
Stocks that typically rise and fall with the market, like those of many
large industrial companies, have a beta close to 1.0. More volatile
companies, which tend to rise and fall more than the market, might
have a beta of 2.0, and companies that are stable relative to the mar-
ket, such as utilities, might have betas of 0.65. The higher the beta, the
riskier the stock in the eyes of investors.)
• The average interest rate on the company’s debt is 6 percent.
• The interest rate on a risk-free US treasury bill is 3 percent; a typical
investment in the stock market is expected to provide an 11 percent
return.
• The company’s tax rate is 25 percent.
Armed with this information, we can determine the company’s weighted
average cost of capital (WACC)—that is, the cost of its debt and equity
weighted by the 70-to-30 percent ratio. The WACC is the minimum return
that a company must earn on its asset base to satisfy creditors, owners, and
everyone else who provides capital.
The fi rst step is to calculate the cost of debt. Since the interest on debt
is deductible for taxes, we need to look at both the interest rate and the tax
rate to determine the after-tax cost. Here’s the formula:
Cost of debt = average interest cost of debt × (1 – tax rate)
So for our business this would be:
H6061.indb 219H6061.indb 219 11/21/12 8:25:42 AM11/21/12 8:25:42 AM
Do
Not
Cop
y or
Pos
t
This document is authorized for use only by Liudmyla Feurstein at EBCM - European University of Munich until October 2014. Copying or posting is an infringement of
copyright. [email protected] or 617.783.7860.
220HOW TO CALCULATE ROI
Cost of debt = 6% × (1.00 – .25) = 4.5%
The next step is to calculate the cost of the company’s equity by using beta
(risk) and prevailing interest rates. Here’s the equation:
Cost of equity = risk-free interest rate + beta × (market rate – risk free rate)
In the example, it is as follows:
Cost of equity = 3% + 1.25 × (11% – 3%) = 13%
The analysis shows that this company has an after-tax cost of debt of
4.5 percent and a cost of equity of 13 percent.
Finally, we know that the company is 30 percent debt and 70 percent
equity. So the weighted average cost of capital (WACC) would be:
(0.3 × 4.5%) + (0.7 × 13) = 10.45%
The minimum return the business should get on its investments is
10.45 percent. That’s a return that justifi es its use of capital.
As you look at the numbers, you might ask, “Why not use more low-
cost debt and less high-cost equity? Wouldn’t that lower the business’s cost
of capital?” It might—but it also might not. Taking on more debt increases
risk. This perceived risk might increase the beta of the stock and thus raise
the cost of equity still further. Extra risk might also persuade debtholders
to demand a higher return. These increases might wipe out the gain from
increasing debt.
A business’s fi nance group must determine the right mix of debt to
equity to minimize its WACC. This mix is tough to get exactly right, and it
changes as interest rates and perceived risks change. If the fi nance folks do
get it right, they’re certainly earning their keep.
WACC is often considered the minimum return a business should earn
on its capital investments. Most large companies evaluate their WACC
annually and use it as a benchmark to set the hurdle rate for NPV and
other capital budgeting calculations. In actually determining the hurdle
rate, however, companies often add two or three percentage points to the
WACC, just for a margin of error.
H6061.indb 220H6061.indb 220 11/21/12 8:25:42 AM11/21/12 8:25:42 AM
Do
Not
Cop
y or
Pos
t
This document is authorized for use only by Liudmyla Feurstein at EBCM - European University of Munich until October 2014. Copying or posting is an infringement of
copyright. [email protected] or 617.783.7860.
221Part Six Toolbox
ECONOMIC VALUE ADDED AND ECONOMIC PROFIT—PUTTING IT ALL TOGETHER
Economic value added (EVA) and economic profi t (EP) are widely used
measures for assessing a fi rm’s fi nancial performance. They measure much
the same thing, but they are calculated slightly differently.
Economic value added, as far as we know, is the only measure that is ac-
tually a registered trademark of a consulting fi rm. (It is owned by the New
York fi rm Stern Stewart & Co.) The underlying idea is this: a company adds
value for its shareholders only if it earns a risk-adjusted profi t greater than
what it could have earned by investing that same capital elsewhere.
To calculate EVA and EP, you begin by calculating return on total capi-
tal (ROTC). Then you subtract the WACC. Proponents of the two mea-
sures point out that a company must incur costs to purchase the operating
assets that it uses to generate profi ts, whether it uses equity or debt or some
combination. To understand a company’s true profi t, you ought to take
those costs into account.
We’ll look at the same example we used in the previous entry and see
how that company is doing by these measures. Remember that this com -
pany’s WACC was 10.45 percent. We’ll also say that its ROTC was 9.6 per-
cent, just as in the example in chapter 21. Now here’s the formula for EVA:
EVA = ROTC – WACC
So for our business, it is:
EVA = 9.60% –10.45% = –0.85%
In short, the EVA for this company is negative. It earned a return for the
capital providers that was nearly 1 percentage point lower than what they
would typically expect. If the EVA for this business continues to be nega-
tive, shareholders and lenders will be likely to look elsewhere.
Now let’s look at what this negative EVA means for economic profi t. EP
converts the EVA percentage to a dollar amount; you just multiply EVA by
total capital, calculated as we showed you in chapter 21. So if the total capi-
tal invested in the business is $3.646 billion as in the example in chapter 21,
the calculation looks like this:
H6061.indb 221H6061.indb 221 11/21/12 8:25:42 AM11/21/12 8:25:42 AM

Do
Not
Cop
y or
Pos
t
This document is authorized for use only by Liudmyla Feurstein at EBCM - European University of Munich until October 2014. Copying or posting is an infringement of
copyright. [email protected] or 617.783.7860.
222HOW TO CALCULATE ROI
EP = –0.85 × $3.646 billion or –$30,991,000
The capital providers are $31 million behind what they could reason-
ably expect from this business as a return.
What about the next year? Suppose that the company’s performance
improves, and it achieves an ROTC of 12 percent. Its WACC, meanwhile,
drops to 9.5 percent due to decreases in interest rates. The only thing that
remains the same is total capital. Now its EVA is 12% – 9.5% or 2.5%, and
its EP is 2.5% × $3.646 billion, or $91,150,000. That’s quite an improve-
ment, and the providers of capital are no doubt happy.
H6061.indb 222H6061.indb 222 11/21/12 8:25:42 AM11/21/12 8:25:42 AM
Do
Not
Cop
y or
Pos
t
This document is authorized for use only by Liudmyla Feurstein at EBCM - European University of Munich until October 2014. Copying or posting is an infringement of
copyright. [email protected] or 617.783.7860.
Part Seven
Applied Financial Intelligence:
Working Capital Management
H6061.indb 223H6061.indb 223 11/21/12 8:25:42 AM11/21/12 8:25:42 AM

Do
Not
Cop
y or
Pos
t
This document is authorized for use only by Liudmyla Feurstein at EBCM - European University of Munich until October 2014. Copying or posting is an infringement of
copyright. [email protected] or 617.783.7860.H6061.indb 224H6061.indb 224 11/21/12 8:25:42 AM11/21/12 8:25:42 AM
Do
Not
Cop
y or
Pos
t
This document is authorized for use only by Liudmyla Feurstein at EBCM - European University of Munich until October 2014. Copying or posting is an infringement of
copyright. [email protected] or 617.783.7860.
2 8
The Magic of Managing the Balance Sheet
WE’VE MENT IONED THE PHRASE managing the balance sheet a couple of
times in this book. Right now we want to go into greater detail
about how to do it. The reason? Astute management of the balance
sheet is like fi nancial magic. It allows a company to improve its fi nancial
performance even without boosting sales or lowering costs. Better balance
sheet management makes a business more effi cient at converting inputs to
outputs and ultimately to cash. It speeds up the cash conversion cycle, a con-
cept that we’ll take up later in this part. Companies that can generate more
cash in less time have greater freedom of action; they aren’t so dependent
on outside investors or lenders.
To be sure, the fi nance organization in your company is ultimately re-
sponsible for managing most of the balance sheet. They’re the ones re-
sponsible for fi guring out how much to borrow and on what terms, for lin-
ing up equity investment when necessary, and for generally keeping an eye
on the company’s overall assets and liabilities. But nonfi nancial managers
have a huge impact on certain key line items from the balance sheet, which
taken together are known as working capital. Working capital is a prime
arena for the development and application of fi nancial intelligence. Once
you grasp the concept, you’ll become a valuable partner to the fi nance or-
ganization and senior managers. Learn to manage working capital better,
H6061.indb 225H6061.indb 225 11/21/12 8:25:42 AM11/21/12 8:25:42 AM
Do
Not
Cop
y or
Pos
t
This document is authorized for use only by Liudmyla Feurstein at EBCM - European University of Munich until October 2014. Copying or posting is an infringement of
copyright. [email protected] or 617.783.7860.
226APPLIED F INANCIAL INTELL IGENCE
and you can have a powerful effect on both your company’s profi tability
and its cash position.
THE ELEMENTS OF WORKING CAPITAL
Working capital is a category of resources that includes cash, inventory, and
receivables, minus whatever a company owes in the short term. It comes
straight from the balance sheet, and it’s often calculated according to the
following formula:
working capital = current assets – current liabilities
Of course, this equation can be broken down further. Current assets,
as we have seen, includes items such as cash, receivables, and inventory.
Current liabilities includes payables and other short-term obligations. But
these aren’t isolated balance sheet line items; they represent different stages
of the production cycle and different forms of working capital.
To understand this, imagine a small manufacturing company. Every
production cycle begins with cash, which is the fi rst component of work-
ing capital. The company takes the cash and buys some raw materials. That
creates raw-materials inventory, a second component of working capital.
Then the raw materials are used in production, creating work-in-process
inventory and eventually fi nished-goods inventory, also part of the “inven-
tory” component of working capital. Finally, the company sells the goods
to customers, creating receivables, which are the third and last component
of working capital (fi gure 28-1). In a service business, the cycle is simi-
lar but simpler. For example, our own company—the Business Literacy
Institute—is primarily a training business. Its operating cycle involves the
time required to go from the initial development of training materials to
Working Capital
Working capital is the money a company needs to fi nance its daily operations. Accountants usually measure it by adding up a company’s cash, inventory, and accounts receivable, and then subtracting short-term debts.
H6061.indb 226H6061.indb 226 11/21/12 8:25:42 AM11/21/12 8:25:42 AM
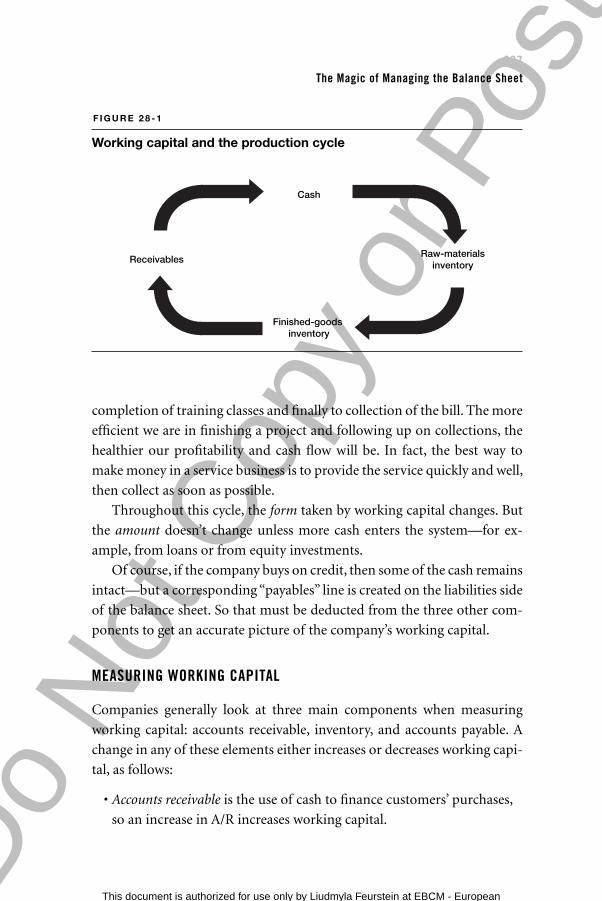
Do
Not
Cop
y or
Pos
t
This document is authorized for use only by Liudmyla Feurstein at EBCM - European University of Munich until October 2014. Copying or posting is an infringement of
copyright. [email protected] or 617.783.7860.
227The Magic of Managing the Balance Sheet
completion of training classes and fi nally to collection of the bill. The more
effi cient we are in fi nishing a project and following up on collections, the
healthier our profi tability and cash fl ow will be. In fact, the best way to
make money in a service business is to provide the service quickly and well,
then collect as soon as possible.
Throughout this cycle, the form taken by working capital changes. But
the amount doesn’t change unless more cash enters the system—for ex-
ample, from loans or from equity investments.
Of course, if the company buys on credit, then some of the cash remains
intact—but a corresponding “payables” line is created on the liabilities side
of the balance sheet. So that must be deducted from the three other com-
ponents to get an accurate picture of the company’s working capital.
MEASURING WORKING CAPITAL
Companies generally look at three main components when measuring
working capital: accounts receivable, inventory, and accounts payable. A
change in any of these elements either increases or decreases working capi-
tal, as follows:
• Accounts receivable is the use of cash to fi nance customers’ purchases,
so an increase in A/R increases working capital.
Receivables
Cash
Finished-goods inventory
Raw-materialsinventory
F I G U R E 2 8 - 1
Working capital and the production cycle
H6061.indb 227H6061.indb 227 11/21/12 8:25:42 AM11/21/12 8:25:42 AM
Do
Not
Cop
y or
Pos
t
This document is authorized for use only by Liudmyla Feurstein at EBCM - European University of Munich until October 2014. Copying or posting is an infringement of
copyright. [email protected] or 617.783.7860.
228APPLIED F INANCIAL INTELL IGENCE
• Inventory is the use of cash to purchase and stock inventory for sale to
customers, so an increase in inventory also increases working capital.
• Accounts payable, though, is money owed to others, so an increase in
A/P decreases working capital.
You can use a few of the ratios we’ve already discussed to understand
and manage working capital. As you might imagine, these ratios all mea-
sure either A/R, inventory, or A/P. Days sales outstanding (DSO), as you
might recall, measures the average time it takes to collect sales. So reduc-
ing DSO allows a company to reduce working capital. Days in inventory
outstanding (DII) is the number of days inventory stays in the system.
Since inventory costs money, reducing DII allows you to reduce working
capital. By now you’ve probably guessed the third key measure: days pay-
able outstanding, or DPO. If you increase DPO—take longer to pay your
bills—you reduce working capital. We’ll discuss managing these elements
of working capital in chapters 29 and 30.
Overall, how much working capital is appropriate for a company? This
question doesn’t allow an easy answer. Every company needs enough cash
and inventory to do its job. The larger it is and the faster it is growing, the
more working capital it is likely to need. But the real challenge is to use
working capital effi ciently. The three working capital accounts that non-
fi nancial managers can truly affect are accounts receivable, inventory, and
(to a lesser extent) accounts payable. We’ll take up each one in turn.
Before we do, though, it’s worth asking once again how much “art” is
involved in all these calculations. In this case, the best answer might be
“some.” Cash is a hard number, not easily subject to manipulation. Receiv-
ables and payables are relatively hard as well. Inventory isn’t quite so hard.
Various accounting techniques and assumptions allow a company to value
inventory in different ways. So a company’s calculation of working capital
will depend to an extent on the rules the company follows. Still, you can
generally assume that working capital fi gures aren’t subject to as much dis-
cretion and judgment as many of the numbers we learned about earlier.
H6061.indb 228H6061.indb 228 11/21/12 8:25:42 AM11/21/12 8:25:42 AM
Do
Not
Cop
y or
Pos
t
This document is authorized for use only by Liudmyla Feurstein at EBCM - European University of Munich until October 2014. Copying or posting is an infringement of
copyright. [email protected] or 617.783.7860.
2 9
Your Balance Sheet Levers
MOST COMPANIES USE THE IR CASH to fi nance customers’ purchase of
products or services. That’s the “accounts receivable” line on the
balance sheet—the amount of money customers owe at a given
point in time, based on the value of what they have purchased before
that date.
The key ratio that measures accounts receivable, as we saw in part 5,
is days sales outstanding, or DSO—that is, the average number of days it
takes to collect on these receivables. The longer a company’s DSO, the more
working capital is required to run the business. Customers have more of its
cash in the form of products or services not yet paid for, so that cash isn’t
available to buy inventory, deliver more services, and so on. Conversely, the
shorter a company’s DSO, the less working capital is required to run the
business. It follows that the more people who understand DSO and work
to bring it down, the more free cash the company will have at its disposal.
MANAGING DSO
The fi rst step in managing DSO is to understand what it is and in which
direction it has been heading. If it’s higher than it ought to be, and particu-
larly if it’s trending upward (which it nearly always seems to be), managers
need to begin asking questions.
H6061.indb 229H6061.indb 229 11/21/12 8:25:42 AM11/21/12 8:25:42 AM
Do
Not
Cop
y or
Pos
t
This document is authorized for use only by Liudmyla Feurstein at EBCM - European University of Munich until October 2014. Copying or posting is an infringement of
copyright. [email protected] or 617.783.7860.
230APPLIED F INANCIAL INTELL IGENCE
Operations and R&D managers, for example, must ask themselves
whether there are any problems with the products that might make cus-
tomers less willing to pay their bills. Is the company selling what customers
want and expect? Is there a problem with delivery? Quality problems and
late deliveries often provoke late payment, just because customers are not
pleased with the products they’re receiving and decide that they will take
their own sweet time about payment. Managers in quality assurance, mar-
ket research, product development, and so on thus have an effect on receiv-
ables, as do managers in production and shipping. In a service company,
people who are out delivering the service need to ask themselves the same
questions. If service customers aren’t satisfi ed with what they’re getting,
they too will take their time about paying.
Customer-facing managers—those in sales and customer service—have
to ask a similar set of questions. Are our customers healthy? What is the
standard in their industry for paying bills? Are they in a region of the world
that pays fast or slow? Salespeople typically have the fi rst contact with a
customer, so it is up to them to fl ag any concerns about the customer’s
fi nancial health. Once the sale is made, customer-service reps need to pick
up the ball and learn what’s going on. What’s happening at the customer’s
shop? Are they working overtime? Laying people off? Meanwhile, salespeo-
ple need to work with the folks in credit and customer service so that ev-
erybody understands the terms up front and will notice when a customer
is late. At one company we worked with, the delivery people knew the most
about customers’ situations because they were at their facilities every day.
They would alert sales and accounting if there seemed to be issues crop-
ping up in a customer’s business.
Credit managers need to ask whether the terms offered are good for the
company and whether they fi t the credit histories of the customers. They
need to make judgments about whether the company is giving credit too
easily or whether it is too tough in its credit policies. There’s always a trade-
off between increasing sales on the one hand and issuing credit to poorer
credit risks on the other. Credit managers need to set the precise terms
they’re willing to offer. Is net thirty days satisfactory—or should we al-
low net sixty? They need to determine strategies such as offering discounts
for early pay. For example, “2/10 net 30” means that customers get a dis-
count of 2 percent if they pay their bill in ten days and no discount if they
H6061.indb 230H6061.indb 230 11/21/12 8:25:42 AM11/21/12 8:25:42 AM
Do
Not
Cop
y or
Pos
t
This document is authorized for use only by Liudmyla Feurstein at EBCM - European University of Munich until October 2014. Copying or posting is an infringement of
copyright. [email protected] or 617.783.7860.
231Your Balance Sheet Levers
wait thirty days. Sometimes a 1 or 2 percent discount can help a struggling
company collect its receivables and thereby lower its DSO—but of course
it does so by eating into profi tability.
We know of a small company that has a simple, homegrown approach
to the issue of giving credit to customers. The company has identifi ed the
traits it wants in its customers, and has even named its ideal customer
“Bob.” Bob’s qualities include the following:
• He works for a large company.
• His company is known for paying its bills on time.
• He can maintain and understand the product provided (this company
makes complex, technology-intensive products).
• He is looking for an ongoing relationship.
If a new customer meets these criteria, his company will get credit from
this small manufacturer. Otherwise it won’t. As a result of this policy, the
company has been able to keep its DSO quite low and to grow without ad-
ditional equity investment.
All these decisions greatly affect accounts receivable and thus work-
ing capital. And the fact is, they can have a huge impact. Reducing DSO
even by one day can save a large company millions of dollars per day. For
example, check back to the DSO calculation in chapter 24, and you’ll note
that one day of sales in our sample company is just over $24 million. Re-
ducing DSO from fi fty-fi ve days to fi fty-four in this company would thus
increase cash by $24 million. That’s cash that can be used for other things
in the business.
MANAGING INVENTORY
Many managers (and consultants!) these days are focusing on inventory.
They work to reduce inventory wherever possible. They use buzzwords
such as lean manufacturing, just-in-time inventory management, and eco-
nomic order quantity (EOQ). The reason for all this attention is exactly
what we’re talking about here. Managing inventory effi ciently reduces
working capital requirements by freeing up large amounts of cash.
H6061.indb 231H6061.indb 231 11/21/12 8:25:42 AM11/21/12 8:25:42 AM
Do
Not
Cop
y or
Pos
t
This document is authorized for use only by Liudmyla Feurstein at EBCM - European University of Munich until October 2014. Copying or posting is an infringement of
copyright. [email protected] or 617.783.7860.
232APPLIED F INANCIAL INTELL IGENCE
The challenge for inventory management, of course, isn’t to reduce in-
ventory to zero, which would probably leave a lot of customers unsatisfi ed.
The challenge is to reduce it to a minimum level while still ensuring that
every raw material and every part will be available when needed and every
product will be ready for sale when a customer wants it. A manufacturer
needs to be constantly ordering raw material, making things, and holding
them for delivery to customers. Wholesalers and retailers need to replenish
their stocks regularly, and avoid the dreaded “stockout”—an item that isn’t
available when a customer wants it. Yet every item in inventory ties up cash,
which means that the cash cannot be used for other purposes. Exactly how
much inventory is required to satisfy customers while minimizing that
tied-up cash, well, that’s the million-dollar question (and the reason for all
those consultants).
The techniques for managing inventory are beyond the scope of this
book. But we do want to emphasize that many different kinds of manag-
ers affect a company’s use of inventory—which means that all these man-
agers can have an impact on reducing working capital requirements. For
example:
• Salespeople love to tell customers they can have exactly what they
want. (“Have it your way,” as the old Burger King jingle put it.)
Custom paint job? No problem. Bells and whistles? No problem. But
every variation requires a little more inventory, meaning a little more
cash. Obviously, customers must be satisfi ed. But that commonsense
requirement has to be balanced against the fact that inventory costs
money. The more that salespeople can sell standard products with
limited variations, the less inventory their company will have to carry.
• Engineers love those same bells and whistles. In fact, they’re constantly
working to improve the company’s products, replacing version 2.54
with version 2.55, and so on. Again, this is a laudable business objec-
tive, but one that has to be balanced against inventory requirements.
A proliferation of product versions puts a burden on inventory man-
agement. When a product line is kept simple, with a few easily inter-
changeable options, inventory declines and inventory management
becomes a less taxing task.
H6061.indb 232H6061.indb 232 11/21/12 8:25:43 AM11/21/12 8:25:43 AM
Do
Not
Cop
y or
Pos
t
This document is authorized for use only by Liudmyla Feurstein at EBCM - European University of Munich until October 2014. Copying or posting is an infringement of
copyright. [email protected] or 617.783.7860.
233Your Balance Sheet Levers
• Production departments greatly affect inventory. For instance, what’s
the percentage of machine downtime? Frequent breakdowns require
the company to carry more work-in-process inventory and more
fi nished-goods inventory. And what’s the average time between
changeovers? Decisions about how much to build of a particular part
have an enormous impact on inventory requirements. Even the layout
of a plant affects inventory: an effi ciently designed production fl ow in
an effi cient plant minimizes the need for inventory.
Along these lines, it’s worth noting that many US plants operate on
a principle that eats up tremendous amounts of working capital. When
business is slow, they nevertheless keep on churning out product in order
to maintain factory effi ciency. Plant managers focus on keeping unit costs
down, often because that goal has been pounded into their heads for so
long that they no longer question it. They have been trained to do it, told
to do it, and paid (with bonuses) for achieving it.
When business is good, the goal makes perfect sense: keeping unit costs
down is simply a way of managing all the costs of production in an effi cient
manner. (This is the old approach of focusing only on the income state-
ment, which is fi ne as far as it goes.) When demand is slow, however, the
plant manager must consider the company’s cash as well as its unit costs.
A plant that continues to turn out product in these circumstances is just
creating more inventory that will sit on a shelf taking up space. Coming to
work and reading a book might be better than building product that is not
ready to be sold.
How much can a company save through astute inventory management?
Look again at our sample company: cutting just one day out of the DII
number—reducing it from seventy-four days to seventy-three—would in-
crease cash by nearly $19 million. Any large company can save millions of
dollars of cash, and thereby reduce working capital requirements—just by
making modest improvements in its inventory management.
H6061.indb 233H6061.indb 233 11/21/12 8:25:43 AM11/21/12 8:25:43 AM
Do
Not
Cop
y or
Pos
t
This document is authorized for use only by Liudmyla Feurstein at EBCM - European University of Munich until October 2014. Copying or posting is an infringement of
copyright. [email protected] or 617.783.7860.
3 0
Homing In on Cash Conversion
IN THIS CHAPTER WE’LL TAKE UP THE CASH CONVERSION CYCLE , which mea-
sures how effective a company is at collecting its cash. But there’s one
little wrinkle we have to consider fi rst—how fast a company decides to
pay the money it owes its vendors.
Accounts payable is a tough number to get right. It’s an area where fi -
nance meets philosophy. Financial considerations alone would encourage
managers to maximize days payable outstanding (DPO), thus conserving
the company’s cash. A change in this ratio is as powerful as a change in the
other ratios we’ve been discussing. In our sample company, for instance,
increasing DPO by just one day would add about $19 million to the com-
pany’s cash balance.
Companies do often use DPO as a tool to increase cash fl ow and reduce
the amount of working capital tied up in the business. During the fi nan-
cial crisis that began in 2008 and the subsequent recession, for instance,
many corporations increased their DPO as a strategy to conserve cash. In
fact, one Fortune 50 company actually told suppliers it would pay them in
120 days.
But is this a good strategy for ordinary times? Or for companies that are
not part of the Fortune 50? The strategy carries residual costs that are hard
to assess. Sure, the fi nance team can measure how much cash is generated
H6061.indb 234H6061.indb 234 11/21/12 8:25:43 AM11/21/12 8:25:43 AM
Do
Not
Cop
y or
Pos
t
This document is authorized for use only by Liudmyla Feurstein at EBCM - European University of Munich until October 2014. Copying or posting is an infringement of
copyright. [email protected] or 617.783.7860.
235Homing In on Cash Conversion
by increasing DPO from sixty days to seventy. For a large company, that
can be a signifi cant amount. But what about the “soft” costs? A company
that delays payments may put a key supplier out of business. It may fi nd
that suppliers are raising their prices to cover the cost of the additional
fi nancing they must line up. It may face slower delivery times and even
lower quality—after all, the suppliers are likely to feel squeezed and will
have to cope as best they can. Some suppliers may even decline the com-
pany’s business. Another practical consideration is the company’s Dun &
Bradstreet rating. D&B bases its scores, in part, on a company’s payment
history. An organization that consistently pays late may fi nd that it has
trouble later on getting a loan.
A personal story illustrates the point. In the early days of Joe’s manufac-
turing company, Setpoint, the company’s founders told him that “net 30”
meant just that: net 30. Setpoint would always pay its suppliers in thirty
days. The founders had previously worked for a struggling company that
routinely delayed its payables to one hundred days or more. As engineers,
they were often unable to get parts for critical projects until the suppliers
were paid. That delayed the projects and thus delayed revenue payments
based on project completion, creating a downward spiral. Because of their
experience, Setpoint’s founders decided never to be in that position with
their own business.
The policy created a problem for Joe, because Setpoint’s primary cus-
tomer at the time, a large corporation, paid in forty-fi ve to sixty days. So
Joe took one of the founders to the bank to discuss a credit line. He showed
the banker how much cash they were likely to need. The banker responded,
“I don’t know why you need this line. Just delay paying your suppliers by
twenty days and you will be fi ne.”
The founder spoke fi rmly but quietly. “If I delay paying my suppliers,
are they going to provide me with quality product on time? I need suppli-
ers I can trust. That’s what the business depends on. If I delay paying them
by twenty days, what will that do to my relationship with them?”
The young banker just stared. Finally he agreed to look into a credit line
for Setpoint. Setpoint eventually got the line, and for nearly twenty years,
with few exceptions, has stayed at net 30 with its suppliers. The policy has
cost the company money because it raises working capital requirements.
But while it puts constraints on cash fl ow, Setpoint’s leaders believe that
H6061.indb 235H6061.indb 235 11/21/12 8:25:43 AM11/21/12 8:25:43 AM
Do
Not
Cop
y or
Pos
t
This document is authorized for use only by Liudmyla Feurstein at EBCM - European University of Munich until October 2014. Copying or posting is an infringement of
copyright. [email protected] or 617.783.7860.
236APPLIED F INANCIAL INTELL IGENCE
it positively affects the company’s reputation and relationship with its
vendors—and in the long term helps to build a stronger community of
businesses around the company.
We won’t go into any more detail about payables policies, because in
most companies nonfi nancial managers don’t have much direct impact on
how fast the company pays its bills. But in general, if you notice that your
company’s DPO is climbing—and particularly if it is higher than your
DSO—you might want to ask the fi nance folks a few questions. After all,
your work probably depends on good relationships with vendors, and—
like Setpoint’s founders—you don’t want fi nance to mess up those rela-
tionships unnecessarily.
THE CASH CONVERSION CYCLE
Another way to understand working capital is to study the cash conversion
cycle. It’s essentially a timeline relating the stages of production (the oper-
ating cycle) to the company’s investment in working capital. The timeline
has three levels, and you can see how the levels are linked in fi gure 30-1.
Understanding these three levels and their measures provides a power-
ful way of understanding the business. It should help you make good
decisions.
Starting at the left, the company purchases raw materials. That begins
the accounts payable period and the inventory period. In the next phase,
the company has to pay for those raw materials. That begins the cash con-
version cycle itself—the cash has now been paid out, and the job is to see
how fast it can come back. Yet the company is still in its inventory period;
it hasn’t actually sold any fi nished goods yet.
Eventually, the company does sell its fi nished goods, ending the inven-
tory period. But it is just entering the accounts receivable period; it still
hasn’t received any cash. Finally, it does collect the cash on its sales, which
ends both the accounts receivable period and the cash conversion cycle.
Why is all of this important? Because we can use it to determine how
many days all this takes and then understand how many days a company’s
cash is tied up. That’s an important number for managers and leaders to
know. Armed with the information, managers can potentially fi nd ways
H6061.indb 236H6061.indb 236 11/21/12 8:25:43 AM11/21/12 8:25:43 AM
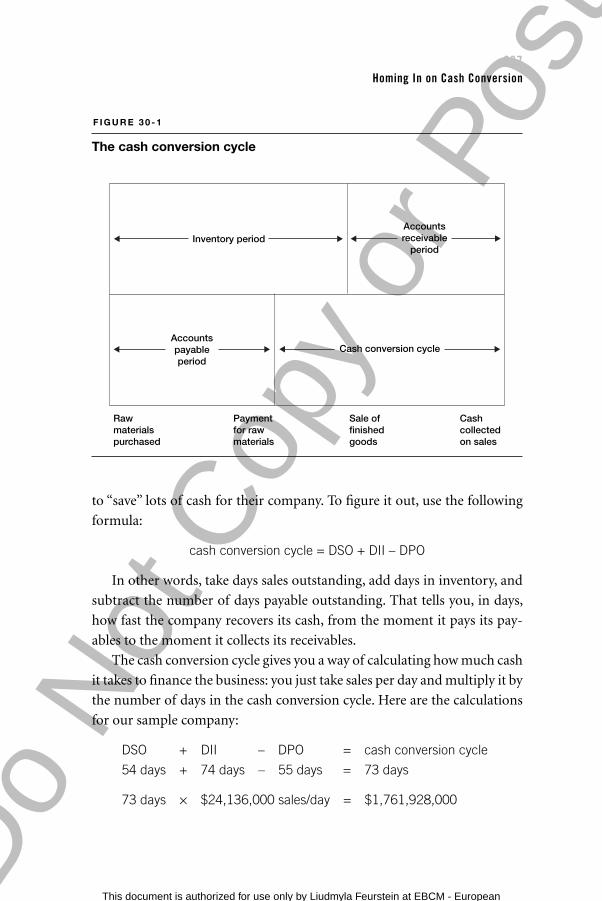
Do
Not
Cop
y or
Pos
t
This document is authorized for use only by Liudmyla Feurstein at EBCM - European University of Munich until October 2014. Copying or posting is an infringement of
copyright. [email protected] or 617.783.7860.
237Homing In on Cash Conversion
to “save” lots of cash for their company. To fi gure it out, use the following
formula:
cash conversion cycle = DSO + DII – DPO
In other words, take days sales outstanding, add days in inventory, and
subtract the number of days payable outstanding. That tells you, in days,
how fast the company recovers its cash, from the moment it pays its pay-
ables to the moment it collects its receivables.
The cash conversion cycle gives you a way of calculating how much cash
it takes to fi nance the business: you just take sales per day and multiply it by
the number of days in the cash conversion cycle. Here are the calculations
for our sample company:
DSO + DII – DPO = cash conversion cycle
54 days + 74 days – 55 days = 73 days
73 days × $24,136,000 sales/day = $1,761,928,000
Raw materials purchased
Inventory periodAccountsreceivable
period
Accountspayableperiod
Cash conversion cycle
Payment for raw materials
Sale of finished goods
Cash collectedon sales
F I G U R E 3 0 - 1
The cash conversion cycle
H6061.indb 237H6061.indb 237 11/21/12 8:25:43 AM11/21/12 8:25:43 AM
Do
Not
Cop
y or
Pos
t
This document is authorized for use only by Liudmyla Feurstein at EBCM - European University of Munich until October 2014. Copying or posting is an infringement of
copyright. [email protected] or 617.783.7860.
238APPLIED F INANCIAL INTELL IGENCE
This business requires working capital of around $1.8 billion just to fi -
nance its operations. That isn’t unusual for a large corporation. Even small
companies require a lot of working capital relative to their sales if their
cash conversion cycle is as long as sixty days. Companies of any size can
get themselves into trouble on this score. Tyco International—mentioned
earlier in this book—was famous for acquiring six hundred companies in
two years. All those acquisitions entailed a lot of challenges, but one seri-
ous one involved huge increases in the cash conversion cycle. The reason?
Tyco often was acquiring companies in the same industry, and competing
products were added to its product list. Now that Tyco had several very
similar products in inventory, the inventory didn’t move as fast as it once
had—and inventory days began to spiral out of control, increasing in some
parts of the business by more than ten days. In a multinational company
with more than $30 billion in revenue, increases on that scale can deplete
cash by several hundred million dollars! (This is an issue that Tyco has long
since addressed by closing down the acquisition pipeline and focusing on
the operations of the business.)
The cash conversion cycle can be shortened by all the techniques dis-
cussed in this part: decreasing DSO, decreasing inventory, and increasing
DPO. Find out what your company’s cycle is and which direction it’s head-
ing in. You may want to discuss it with the folks in fi nance. Who knows?
They might even be impressed that you know what it is and what levers can
affect it. More important, you might start a conversation that will result
in a faster cash conversion cycle, lower working capital requirements, and
more free cash. That will benefi t everybody in the business.
H6061.indb 238H6061.indb 238 11/21/12 8:25:43 AM11/21/12 8:25:43 AM
Do
Not
Cop
y or
Pos
t
This document is authorized for use only by Liudmyla Feurstein at EBCM - European University of Munich until October 2014. Copying or posting is an infringement of
copyright. [email protected] or 617.783.7860.
Part SevenToolbox
ACCOUNTS RECEIVABLE AGING
Want to manage accounts receivable more effectively? DSO is not the only
measure to look at. Another is what’s called the aging of receivables. Often,
reviewing aging is the key to understanding the true situation in your com-
pany’s receivables.
Here’s why. As we mentioned earlier, DSO is by defi nition an average.
For example, if you have $1 million in receivables that are under ten days
and $1 million that are more than ninety days, your overall DSO is about
fi fty days. That doesn’t sound too bad—but in fact, your company may be
in substantial trouble, because half of its customers don’t seem to be pay-
ing their bills. Another business of the same size might have a DSO fi gure
of fi fty days with only $250,000 over ninety days. That business isn’t in the
same sort of trouble.
An aging analysis will present you with just these kinds of fi gures: total
receivables under thirty days, total for thirty to sixty days, and so on. It’s
usually worth checking out that analysis as well as your overall DSO num-
ber to get the full picture of your receivables.
H6061.indb 239H6061.indb 239 11/21/12 8:25:43 AM11/21/12 8:25:43 AM

Do
Not
Cop
y or
Pos
t
This document is authorized for use only by Liudmyla Feurstein at EBCM - European University of Munich until October 2014. Copying or posting is an infringement of
copyright. [email protected] or 617.783.7860.H6061.indb 240H6061.indb 240 11/21/12 8:25:43 AM11/21/12 8:25:43 AM

Do
Not
Cop
y or
Pos
t
This document is authorized for use only by Liudmyla Feurstein at EBCM - European University of Munich until October 2014. Copying or posting is an infringement of
copyright. [email protected] or 617.783.7860.
Part Eight
Creating a Financially Intelligent Company
H6061.indb 241H6061.indb 241 11/21/12 8:25:43 AM11/21/12 8:25:43 AM

Do
Not
Cop
y or
Pos
t
This document is authorized for use only by Liudmyla Feurstein at EBCM - European University of Munich until October 2014. Copying or posting is an infringement of
copyright. [email protected] or 617.783.7860.H6061.indb 242H6061.indb 242 11/21/12 8:25:43 AM11/21/12 8:25:43 AM
Do
Not
Cop
y or
Pos
t
This document is authorized for use only by Liudmyla Feurstein at EBCM - European University of Munich until October 2014. Copying or posting is an infringement of
copyright. [email protected] or 617.783.7860.
3 1
Financial Literacy and Corporate Performance
WE HAVE WRITTEN TH IS BOOK IN HOPES of increasing your fi nancial
intelligence and helping you become a better leader, manager, or
employee. We fi rmly believe that understanding the fi nancial state-
ments, the ratios, and everything else we have included in the book will
make you more effective on the job and will better your career prospects.
We also think that understanding the fi nancial side of the business will
make your work life more meaningful. You would never play baseball or
backgammon without fi rst learning how the game is played; why should
business be any different? Knowing the rules—how profi ts are fi gured,
why return on assets matters to shareholders, and all the rest—lets you
see your work in the big-picture context of business enterprise, which is
simply people working together to achieve certain objectives. You’ll see
more clearly how the company that you’re a part of operates. You’ll want to
contribute to it, and you’ll know how to do so. You’ll be able to assess your
performance better than you could before, because you can see which way
the key numbers are moving and understand why they’re moving in one
direction or the other.
Then, of course, there’s the fun of it. As we’ve shown, the fi nancial re-
port cards of business are partly refl ections of reality. But they’re also—
sometimes very much so—refl ections of estimates, assumptions, educated
H6061.indb 243H6061.indb 243 11/21/12 8:25:43 AM11/21/12 8:25:43 AM
Do
Not
Cop
y or
Pos
t
This document is authorized for use only by Liudmyla Feurstein at EBCM - European University of Munich until October 2014. Copying or posting is an infringement of
copyright. [email protected] or 617.783.7860.
244CREAT ING A F INANCIALLY INTELL IGENT COMPANY
guesswork, and all the resulting biases. (Occasionally they refl ect outright
manipulation as well.) The folks in your company’s fi nance organization
know all this, but many of them haven’t done a good job of sharing their
knowledge with the rest of us. Now you get to ask them the tough ques-
tions. How do they recognize a particular category of revenue? Why did
they choose a particular time frame for depreciation? Why is DII on the
upswing? Of course, once they get past the shock of hearing that non-
fi nancial colleagues speak their language, they’ll almost certainly be will-
ing to discuss the bases for their assumptions and estimates, and modify
them when appropriate. Who knows? They may even start asking for your
advice.
BETTER COMPANIES
We also believe that businesses perform better when the fi nancial intelli-
gence quotient is higher. A healthy business, after all, is a good thing. It of-
fers valuable goods and services to its customers. It provides its employees
with stable jobs, pay raises, and opportunities for advancement. It pays a
good return to its shareholders. Overall, healthy businesses help our econ-
omy grow, keep our communities strong, and improve our standard of
living.
Financially intelligent managers contribute to a business’s health be-
cause they can make better decisions. They can use their knowledge to
help the company succeed. They manage resources more wisely and use
fi nancial information more astutely, and thereby increase their company’s
profi tability and cash fl ow. They also understand more about why things
happen, and can lend a shoulder to the wheel instead of just carping about
how misguided the senior leadership is. We remember, for example, teach-
ing a class of sales executives, using their company’s actual fi nancials. When
we got to the cash fl ow statement—and showed them how the company’s
cash coffers had been drained to pursue growth by acquisition—one of the
sales executives smiled. We asked him why he was smiling, and he laughed.
“I’ve been fi ghting with the vice president of sales in my division for the
better part of a year,” he said. “The reason is, they changed our commis-
sion plan. We used to be paid on sales, and now we’re paid when the sales
H6061.indb 244H6061.indb 244 11/21/12 8:25:43 AM11/21/12 8:25:43 AM
Do
Not
Cop
y or
Pos
t
This document is authorized for use only by Liudmyla Feurstein at EBCM - European University of Munich until October 2014. Copying or posting is an infringement of
copyright. [email protected] or 617.783.7860.
245Financial Literacy and Corporate Performance
are collected. Finally I understand the reason for the change.” He went on
to explain that he agreed with the strategy of growth by acquisition, and
he really didn’t mind that the comp plan had been changed to support the
strategy. But he had never understood why.
Financial intelligence makes for healthier business in another sense, too.
A lot of companies today are governed by politics and power. They reward
people who curry favor with their superiors and who build behind-the-
scenes alliances. Gossip and mistrust are rife; common objectives get lost as
individuals scurry to ensure their own advancement. At its worst, this kind
of environment becomes truly toxic. At one company we worked with, em-
ployees thought that profi t-sharing bonuses were distributed only in years
when employees complained loudly enough that they were unhappy. The
purpose of profi t sharing, they fi gured, was to keep them quiet. In reality,
the company had a fairly straightforward plan that linked employees’ ef-
forts to their quarterly profi t-sharing checks. But the politics were such
that employees never believed the plan was real.
There’s a simple antidote to politics: sunlight, transparency, and open
communication. When people understand a company’s objectives and
work to attain them, it’s easier to create an organization built on a sense of
trust and a feeling of community. In the long run, that kind of organization
will always be more successful than its less open counterparts. Sure, an Enron
or a WorldCom or a Lehman Brothers can prosper for a while under se-
cretive, self-serving leadership. But an organization that is successful over
the long haul will almost invariably be built around trust, communication,
and a shared sense of purpose. Financial training—an increase in fi nancial
intelligence—can make a big difference. At the company where employees
thought that the purpose of profi t sharing was to keep them quiet, those
who underwent training learned how the plan really worked. Soon they
were focusing their efforts on the numbers they affected—and soon they
were getting a profi t-sharing check every quarter.
Finally, fi nancially savvy managers can react more quickly to the unex-
pected. There’s a famous book called Warfi ghting, prepared by staff mem-
bers of the US Marine Corps, that was fi rst published in 1989 and since
then has become a kind of bible for special forces of all kinds.1 One theme
of the book is that marines in combat are always faced with uncertainty
H6061.indb 245H6061.indb 245 11/21/12 8:25:43 AM11/21/12 8:25:43 AM
Do
Not
Cop
y or
Pos
t
This document is authorized for use only by Liudmyla Feurstein at EBCM - European University of Munich until October 2014. Copying or posting is an infringement of
copyright. [email protected] or 617.783.7860.
246CREAT ING A F INANCIALLY INTELL IGENT COMPANY
and rapidly changing conditions. They can rarely rely on instructions from
above; instead they must make decisions on their own. So it’s imperative
that commanders spell out their broad objectives and then leave decisions
about implementation to junior offi cers and ordinary marines in the fi eld.
That’s a lesson that’s just as valuable to companies in today’s mercurial
business climate. Managers have to make a lot of day-to-day decisions
without consulting the higher-ups. If they understand the fi nancial pa-
rameters they’re working under, those decisions can be made more quickly
and effectively. The company’s performance—like the performance of a
marine unit on the ground—will be that much stronger.
TAKING IT TO THE TROOPS
There’s a next step here as well. If it makes a difference for managers to un-
derstand fi nance, imagine how much more of a difference it would make
if everybody in a department—indeed, everybody in a company—under-
stood it.
The same logic applies: people in offi ces, in stores and warehouses, on
shop fl oors, and at client sites can make smarter decisions if they know
something about how their unit is measured and about the fi nancial im-
plications of what they do every day. Should they rework a damaged part
or use a new one? Should they work fast to get as much done as possible
or work more deliberately to ensure fewer mistakes? Should they spend
their time developing new services or cultivating and serving existing cus-
tomers? How important is it to have everything a customer might possi-
bly need? Like marines, frontline employees and supervisors should know
the broad outlines of what the organization needs so that they can work
smarter on the job.
Companies understand this idea, of course, and in recent years have
deluged employees and supervisors with performance goals, key perfor-
mance indicators (KPIs), and other metrics. Maybe you have been the one
to inform people of the KPIs they’ll be evaluated on; if so, you know that
there’s typically a good deal of eye rolling and head shaking, particularly if
the KPIs this quarter are different from last quarter’s. But what if the folks
in the fi eld understood the fi nancial logic of the KPIs or the performance
H6061.indb 246H6061.indb 246 11/21/12 8:25:43 AM11/21/12 8:25:43 AM
Do
Not
Cop
y or
Pos
t
This document is authorized for use only by Liudmyla Feurstein at EBCM - European University of Munich until October 2014. Copying or posting is an infringement of
copyright. [email protected] or 617.783.7860.
247Financial Literacy and Corporate Performance
goals? What if they understood that they are facing new KPIs this quarter
not because some executive randomly decided it but because the compa-
ny’s fi nancial situation had changed? Like the sales executive in the class,
most people are willing to adapt to a new situation, provided they under-
stand the reason for the change. If they don’t understand, they’ll wonder if
management really knows what it’s doing.
Just as fi nancial intelligence in the managerial ranks can boost a busi-
ness’s performance, so can fi nancial intelligence among the troops. The
Center for Effective Organizations, for instance, conducted a study that
looked at (among other things) many measures of employee involvement.2
Two measures in particular were “sharing information about business
performance, plans and goals” and training employees in “skills in under-
standing the business.” Both of these were positively related to productiv-
ity, customer satisfaction, quality, speed, profi tability, competitiveness, and
employee satisfaction. The more that organizations trained their people in
fi nancial literacy, in other words, the better the organizations did. Other
students of management, including Daniel R. Denison, Peter Drucker, and
Jeffrey Pfeffer, have studied and supported the idea that the more employ-
ees understand the business, the better the business performs. All these
fi ndings should come as no surprise. When people understand what’s go-
ing on, the level of trust in the organization rises. Turnover drops. Moti-
vation and commitment increase. Does anybody doubt that greater trust,
motivation, and commitment lead to better performance?
One of us, Joe, has seen all these phenomena fi rsthand. He and his
partners have spent years building a business, Setpoint, from the ground
up. Like every start-up, it experienced periodic diffi culties and crises, and
more than once the company’s accountant told Joe that it couldn’t sur-
vive another period of turbulence. But somehow it always did. Finally, the
accountant confessed to Joe, “You know, I think the reason why you get
through these diffi cult times is because you train your employees and share
the fi nances with them. When times are tough, the company rallies to-
gether and fi nds a way to fi ght through it.”
The accountant was right: the employees all do know exactly where the
company stands. Sharing fi nancial information and helping subordinates
and coworkers to understand it is a way of creating a common purpose
H6061.indb 247H6061.indb 247 11/21/12 8:25:43 AM11/21/12 8:25:43 AM
Do
Not
Cop
y or
Pos
t
This document is authorized for use only by Liudmyla Feurstein at EBCM - European University of Munich until October 2014. Copying or posting is an infringement of
copyright. [email protected] or 617.783.7860.
248CREAT ING A F INANCIALLY INTELL IGENT COMPANY
in a company. It fosters an environment where teamwork can survive and
prosper. What’s more, it’s pretty tough for anyone to cook the books when
they’re open for everybody to see.
Of course, sharing the fi nancials isn’t enough. People have to under-
stand them, and that usually requires training. This may be why more and
more companies are now including fi nancial intelligence training as part
of their educational offerings. Some of the training programs are required;
some are voluntary. All focus on the idea that if employees, managers, and
leaders understand how fi nancial success is measured, the company is go-
ing to be more successful. There are plenty of ways to increase fi nancial
intelligence, whether for a team, a department, a division, or a whole com-
pany. Our organization, the Business Literacy Institute, has taught not only
leadership and management teams but also salespeople, human resources
and IT personnel, operations people, engineers, project managers, and
others about the fi nancial side of their business. The following chapter will
give you some specifi c ideas about how to increase the level of fi nancial
intelligence in your organization.
H6061.indb 248H6061.indb 248 11/21/12 8:25:43 AM11/21/12 8:25:43 AM
Do
Not
Cop
y or
Pos
t
This document is authorized for use only by Liudmyla Feurstein at EBCM - European University of Munich until October 2014. Copying or posting is an infringement of
copyright. [email protected] or 617.783.7860.
3 2
Financial Literacy Strategies
IF YOUR GOAL IS TO HAVE A fi nancially intelligent workplace or depart-
ment, your fi rst step is to fi gure out a strategy for getting there. We don’t
use the word strategy lightly. You can’t just sponsor a one-time training
course or hand out an instruction book and expect everyone to be enlight-
ened. People need to be engaged in the learning. The material needs to be
repeated, then revisited in different ways. Financial literacy needs to be-
come part of a company’s culture. That takes time, effort, and even a little
monetary investment.
But it’s very doable. In this chapter, we’ll offer some suggestions for both
smaller companies and larger ones. You don’t need to limit yourself to just
one category or the other, however. All the suggestions work in both contexts;
the differences are often a matter of logistics and budgets. Large companies,
for instance, are accustomed to producing formal training programs, while
smaller companies may need to improvise. And a small company may not
have much money to spend on training—although we believe that this is one
of the few training programs that has a direct impact on the bottom line.
SMALL-COMPANY TOOLS AND TECHNIQUES
The following tools and techniques hardly constitute an exhaustive list. But
they are all approaches that any manager or company owner can imple-
ment fairly easily on his or her own initiative.
H6061.indb 249H6061.indb 249 11/21/12 8:25:43 AM11/21/12 8:25:43 AM
Do
Not
Cop
y or
Pos
t
This document is authorized for use only by Liudmyla Feurstein at EBCM - European University of Munich until October 2014. Copying or posting is an infringement of
copyright. [email protected] or 617.783.7860.
250CREAT ING A F INANCIALLY INTELL IGENT COMPANY
Training (Over and Over)
Start by putting together three short, informal training sessions. We don’t
mean anything fancy: even a PowerPoint presentation with some handouts
works fi ne (though we would caution you that PowerPoint isn’t always
conducive to lasting learning!). Each session should last between thirty and
sixty minutes. Focus on one fi nancial concept per session. Joe, for example,
conducts three one-hour courses at Setpoint—on the income statement,
on cash fl ow and project fi nance, and on the balance sheet. Depending on
your situation, you might look at gross margin, selling expenses as a percent
of sales, or even inventory turns. The concept should be relevant to your
team’s job, and you should show people how they affect the numbers.
Offer these classes on a regular basis, maybe once a month. Let people
attend two or three times if they want—it often takes that long for folks
to get it. Encourage 100 percent attendance among your direct reports.
Create an environment that tells the participants you believe they are an
important part of the success of the company and that you want their in-
volvement. Eventually, you can ask other people to teach the class—that’s
a good way for them to learn the material, and their teaching styles might
be different enough from yours that they’re able to reach people whom
you can’t.
Weekly “Numbers” Meetings
What are the two or three numbers that measure your unit’s performance
week after week and month after month? What are the two or three num-
bers that you yourself watch to know whether you’re doing a good job
as a manager? Shipments? Sales? Hours billed? Performance to budget?
Chances are, the key numbers that you watch relate in some way to your
company’s fi nancial statements and hence ultimately affect its results. So
start sharing those numbers with your team in weekly meetings. Explain
where the numbers come from, why they’re important, and how every-
body on the team affects them. Track the trend lines over time.
You know what will happen? Pretty soon people will begin talking about
the numbers themselves. They’ll start fi guring out ways to move the needle
in the right direction. Once that begins to occur, try taking it to the next
H6061.indb 250H6061.indb 250 11/21/12 8:25:44 AM11/21/12 8:25:44 AM
Do
Not
Cop
y or
Pos
t
This document is authorized for use only by Liudmyla Feurstein at EBCM - European University of Munich until October 2014. Copying or posting is an infringement of
copyright. [email protected] or 617.783.7860.
251Financial Literacy Strategies
level: forecast where the numbers will be in the coming month or quarter.
You’d be amazed how people begin to take ownership of a number once
they have staked their credibility on a forecast. (We’ve even seen companies
where employees have set up a betting pool on where a given number will
be at the end of a month or quarter!)
Reinforcements: Scoreboards and Other Visual Aids
It’s fashionable these days for corporate executives to have a “dashboard”
on their computers, showing where the business’s performance indicators
stand at any given moment. We always wonder why smaller companies
and operating units don’t have the same thing out in the open for all em-
ployees to see. So we not only recommend discussing the key number or
numbers in meetings, we also suggest posting them on a scoreboard and
comparing past performance with present performance and future fore-
casts. When the numbers are out there for everybody to see, it’s tough for
people to forget or ignore them. Remember, though, that small graphs
can be easily ignored—and if they can be, they will be. As with your dash-
board, make sure the scoreboard is clear, straightforward, and easily vis-
ible to all.
We also like visual aids that remind people how the company makes
money. They provide a context for the day-to-day focus on key numbers.
Our own company has developed what we call Money Maps, illustrating
topics such as where profi ts come from. See the sample in fi gure 32-1: the
map traces the entire business process at a fi ctional company, showing how
much of each sales dollar goes to paying the expenses of each department,
and then highlighting how much is left over as profi t. We customize them
for our clients, so that everyone can see all the operations in their com-
panies. But you can even draw maps and diagrams yourself, if you know
the material well enough. A visual is always a powerful tool for reinforcing
learning. When people look at it, it reminds them how they fi t into the big
picture. It’s useful as well. One company we know of put up two copies of
the same map. One showed the company’s target numbers—what its best
branch was doing. On the other, managers wrote their own branch’s actual
numbers. People could see for each critical element how close they were to,
or how far away from, the best branch’s performance.
H6061.indb 251H6061.indb 251 11/21/12 8:25:44 AM11/21/12 8:25:44 AM
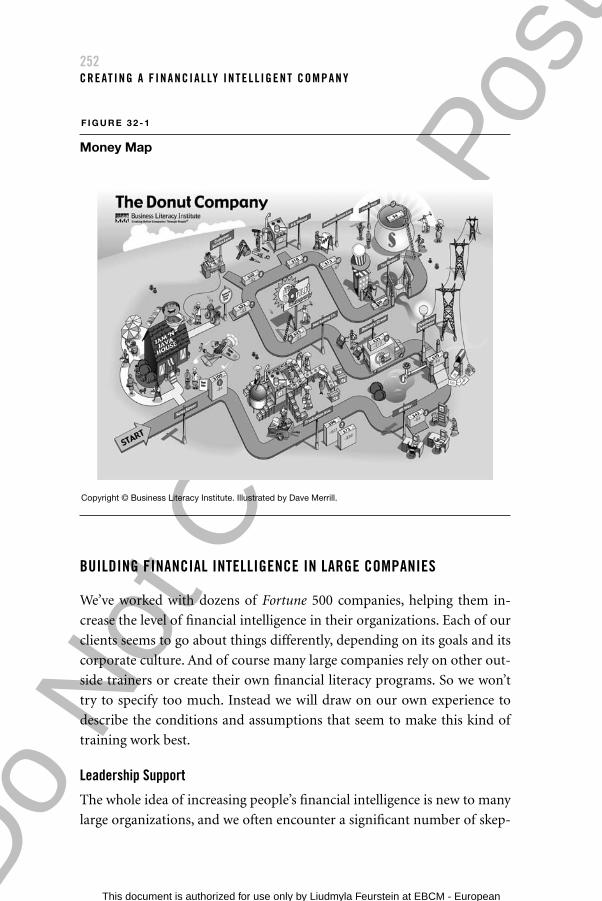
Do
Not
Cop
y or
Pos
t
This document is authorized for use only by Liudmyla Feurstein at EBCM - European University of Munich until October 2014. Copying or posting is an infringement of
copyright. [email protected] or 617.783.7860.
252CREAT ING A F INANCIALLY INTELL IGENT COMPANY
BUILDING FINANCIAL INTELLIGENCE IN LARGE COMPANIES
We’ve worked with dozens of Fortune 500 companies, helping them in-
crease the level of fi nancial intelligence in their organizations. Each of our
clients seems to go about things differently, depending on its goals and its
corporate culture. And of course many large companies rely on other out-
side trainers or create their own fi nancial literacy programs. So we won’t
try to specify too much. Instead we will draw on our own experience to
describe the conditions and assumptions that seem to make this kind of
training work best.
Leadership Support
The whole idea of increasing people’s fi nancial intelligence is new to many
large organizations, and we often encounter a signifi cant number of skep-
F I G U R E 3 2 - 1
Money Map
Copyright © Business Literacy Institute. Illustrated by Dave Merrill.
H6061.indb 252H6061.indb 252 11/21/12 8:25:44 AM11/21/12 8:25:44 AM
Do
Not
Cop
y or
Pos
t
This document is authorized for use only by Liudmyla Feurstein at EBCM - European University of Munich until October 2014. Copying or posting is an infringement of
copyright. [email protected] or 617.783.7860.
253Financial Literacy Strategies
tics or even detractors. (“Why should everyone understand fi nance—that’s
what we have an accounting organization for, isn’t it?”) This is why a fi nan-
cial training initiative is likely to require support from the top. The stronger
that support, the more likely it is that people throughout the organization
will buy into the idea. Companies that experience the greatest impact from
fi nancial intelligence training, typically, are those where C-suite executives
believe it is essential. Those companies educate people year after year, with
some individuals taking the class every year as a refresher. Some even add
new classes to advance their leaders’ and managers’ knowledge.
Support from the top also encourages others to contribute to the initia-
tive. When we work with a client, for instance, we customize the content of
what we teach to the client’s key concepts, measures, and fi nancial results.
To create that kind of program, we need help from people in various de-
partments, but especially in fi nance. The fi nancial folks are usually much
happier about collaborating if they understand that the program has com-
plete support at the top of the organization.
Assumptions and Follow-Up
One big obstacle to effective training is the assumption—common at many
large companies—that people in responsible positions already know fi -
nance. A typical expression of this assumption might be, “Charlie has been
a sales VP for so long, of course he knows how to read our fi nancials.” We
know from experience that the assumption is rarely true. Many manag-
ers and executives do their jobs well enough. But because they don’t truly
understand fi nancial measures and how their jobs affect those measures,
they are operating well below their full potential. Think back to the twenty-
one-question fi nance exam that we gave to a large sample of US managers.
As we noted in chapter 3, the results indicated a remarkably low level of
fi nancial intelligence. So be careful not to assume that everyone under-
stands. Assess fi rst.
It’s also diffi cult to get people to admit that they don’t know fi nance.
Nobody wants to look dumb in front of his or her peers, bosses, or direct
reports. So there’s no point in asking people to raise their hands and volun-
teer for a class. Instead, we almost always include the foundational elements
of fi nance in every class—notice we call it “foundational,” not “basic”—and
our facilitator then assesses the needs of the group to determine where to
H6061.indb 253H6061.indb 253 11/21/12 8:25:46 AM11/21/12 8:25:46 AM
Do
Not
Cop
y or
Pos
t
This document is authorized for use only by Liudmyla Feurstein at EBCM - European University of Munich until October 2014. Copying or posting is an infringement of
copyright. [email protected] or 617.783.7860.
254CREAT ING A F INANCIALLY INTELL IGENT COMPANY
start. Some companies require everyone to attend (so the question whether
someone “needs” the training never arises); others hold classes that don’t
cross levels, on the assumption that participants will feel more comfortable
asking questions with no bosses or direct reports in the room.
Another issue that plagues many training initiatives is a lack of follow-
up. Most large companies launch new programs frequently. Most also ro-
tate their managers through a variety of positions. So there’s a danger that
fi nancial intelligence training gets lost. The best way to support ongoing
fi nancial intelligence in large organizations is to make sure that the con-
versation continues. Executives can talk about the numbers in meetings. If
the company is public, they can ask employees to listen in on the quarterly
earnings call, and then sponsor a post-call question-and-answer session.
Leaders need to use every opportunity to let everyone know the impor-
tance of fi nancial literacy.
The Practicalities
When a client asks for a training program, we naturally ask what the com-
pany wants to achieve, and what the needs of the training audience are
likely to be. Then we home in on three practical questions:
• Whom do you want to attend?
• What content should we teach?
• How should we roll it out?
These discussions set the stage for successful planning and implemen-
tation of the program.
The who is sometimes determined in advance. For example, some cli-
ents integrate fi nancial intelligence programs into their leadership or man-
agement development programs. But many clients start with one group,
see how it goes, and then decide to roll it out to others. Some offer training
at the highest level fi rst, following up with sessions for midlevel manag-
ers and then for all employees. The logic is that the leaders can support
the managers and the managers can support the rest of the organization.
Others mix people from different levels in the same classes. That makes for
good discussions, and it creates a feeling that everyone is in this together.
The downside is that frontline employees may feel uncomfortable asking
H6061.indb 254H6061.indb 254 11/21/12 8:25:46 AM11/21/12 8:25:46 AM
Do
Not
Cop
y or
Pos
t
This document is authorized for use only by Liudmyla Feurstein at EBCM - European University of Munich until October 2014. Copying or posting is an infringement of
copyright. [email protected] or 617.783.7860.
255Financial Literacy Strategies
questions when their bosses are in the room with them. Still others roll
out the program by function—HR fi rst, then IT, and so on—while others
simply allow open enrollment.
What to teach is obviously a critical decision, and the answer always
depends on an individual company’s needs. Here are some key consid-
erations:
• Don’t assume you can skip the foundation for any audience, even
leaders. We always teach the foundational elements, just at a higher or
lower level. It is a rare leader or manager who will actually tell you that
he or she needs a review of these elements. By foundation, we mean
such things as how to read an income statement and balance sheet,
what revenue recognition means, and what the difference is between
capitalizing and expensing.
• Integrate your key measures and concepts. This is an opportunity for
the audience to learn what the CEO and CFO are talking about. Is free
cash fl ow, EBITDA, or some other measure important in this industry
and this company? If it is, then teach it. Review the defi nition, the ele-
ments, the formula, and the company’s own results.
• Determine the needs of the audience. If you are working with sales-
people, you might want to examine their customers’ fi nances. That
will help them learn how to assess customers’ needs from a fi nancial
perspective. If you’re working with HR people, you may want to focus
on how HR has an impact on the fi nancials (particularly since many
HR people feel that they don’t make an impact at all).
In all these approaches, you have to remember a few key precepts that
have to do with the way adults learn. Adults learn best when the instruc-
tors combine conceptual learning with calculations using real numbers,
explain the meaning of the results, and lead discussions about their im-
pact. We bet you’ll hear some amazing things, like new ideas for how to
reduce downtime or improve cash fl ow. When people understand the big
picture—and understand how what they’re learning connects to their job
and their impact on the company results—they’ll pay close attention. Keep
the teaching tightly focused, keep it fun—and remember, don’t try to make
anyone into an accountant!
H6061.indb 255H6061.indb 255 11/21/12 8:25:46 AM11/21/12 8:25:46 AM
Do
Not
Cop
y or
Pos
t
This document is authorized for use only by Liudmyla Feurstein at EBCM - European University of Munich until October 2014. Copying or posting is an infringement of
copyright. [email protected] or 617.783.7860.
256CREAT ING A F INANCIALLY INTELL IGENT COMPANY
A Final Thought: The Issue of Sharing Information
Sharing fi nancial information makes many people nervous, and with good
reason. A public company cannot share nonpublic fi nancial data without
risking violation of the rules governing insider trading. The owners of pri-
vate companies may feel that nobody other than the tax authorities has a
right to see the data, just as nobody has a right to peer into their personal
bank accounts. Here are some thoughts about this issue, based on our ex-
perience with a large number of clients.
Public companies publish a wealth of information in their annual and
quarterly reports. In our classes, most of the data we use derives directly
from the annual results found in the 10-K. But we also typically ask clients
to share additional information with us so that the participants can learn
what they need to—measures that aren’t shared publicly, for instance, or
internal income statements that break down the data in helpful ways, or
key concepts that are discussed internally but aren’t shared externally. We
keep the materials confi dential, and we discuss the importance of confi -
dentiality with the participants. Sometimes company executives worry that
competitors will get the information. But fi nancial training rarely includes
material that would benefi t a competitor. How is a rival likely to gain from
seeing the formula a company uses for ROTC?
The issue of what to share and how to share it is actually tougher in
privately held companies. Some, of course, have no problem with sharing.
For those that do have concerns, we often suggest sharing the information
but collecting the handouts afterward, so that there is little chance of data
leaking out. Occasionally, a client decides to alter the data in ways that ac-
curately refl ect trends and ratios while not revealing the real numbers. In
this case, it’s important that trainees understand that the data has been
camoufl aged. The worst thing you can do is to make up information and
pretend that it is real—it destroys trust.
Whatever your approach, don’t be afraid of experimentation. There’s
a lot to gain from increasing the level of fi nancial intelligence in your
organization.
H6061.indb 256H6061.indb 256 11/21/12 8:25:46 AM11/21/12 8:25:46 AM
Do
Not
Cop
y or
Pos
t
This document is authorized for use only by Liudmyla Feurstein at EBCM - European University of Munich until October 2014. Copying or posting is an infringement of
copyright. [email protected] or 617.783.7860.
3 3
Financial Transparency: Our Ultimate Goal
FINANCIAL TRA IN ING IS VALUABLE , both to the people who receive it and
to the company that sponsors it. But these days, even that may not go
far enough.
The reason? People may not have learned a lot about fi nance in recent
years, but they have certainly learned that they can’t take their employer’s
fi nancial stability for granted. Too many large companies have gone out of
business or have been snapped up by an acquirer at bargain prices (usu-
ally with a huge loss of jobs). Too many companies have been shown to be
cooking the books, typically with devastating consequences for the people
who worked there. People all over the country have learned the lesson:
for very practical reasons, they should understand something about the
fi nances of the company they work for. Like investors, they need to know
how it’s doing.
So think what could be gained by a true culture of fi nancial transpar-
ency and intelligence—a culture in which people everywhere actually saw
and learned to understand the fi nancial statements. No, we don’t expect
everyone to become Wall Street analysts or accountants. We just think that
if the fi nancials are out there and the key concepts repeatedly explained,
every employee in the place will be more trusting and more loyal, and the
company will be stronger for it. To be sure, publicly traded companies can’t
H6061.indb 257H6061.indb 257 11/21/12 8:25:46 AM11/21/12 8:25:46 AM
Do
Not
Cop
y or
Pos
t
This document is authorized for use only by Liudmyla Feurstein at EBCM - European University of Munich until October 2014. Copying or posting is an infringement of
copyright. [email protected] or 617.783.7860.
258CREAT ING A F INANCIALLY INTELL IGENT COMPANY
show consolidated fi nancials to employees except once a quarter, when the
information is released to the public. But they can certainly make a point
of explaining those fi nancials when they are released. In the meantime,
they can make sure that employees see operating numbers for the depart-
ment or facility they work in.
You can see that we believe passionately in the power of knowledge—
and when it comes to business, we believe most of all in the power of fi nan-
cial knowledge and the fi nancial intelligence necessary to put it to work.
Financial information is the nervous system of any business. It contains the
data that show how the business is faring—where its strengths are, where
its weaknesses are, where its opportunities and threats are as well. For too
long, a relative handful of people in each company are the only ones who
have understood what the fi nancial data was telling them. We think more
people should understand it—starting with managers but ultimately ex-
tending out into the entire workforce. People will be better off for gaining
that understanding, and so will companies.
H6061.indb 258H6061.indb 258 11/21/12 8:25:46 AM11/21/12 8:25:46 AM
Do
Not
Cop
y or
Pos
t
This document is authorized for use only by Liudmyla Feurstein at EBCM - European University of Munich until October 2014. Copying or posting is an infringement of
copyright. [email protected] or 617.783.7860.
Part 8Toolbox
UNDERSTANDING SARBANES-OXLEY
If you are anywhere near your fi nance department, you have heard of
Sarbanes-Oxley, also known as Sarbox or just Sox. Sarbanes-Oxley is a law
enacted by the US Congress in July 2002 in response to continuing revela-
tions of fi nancial fraud. It may be the most signifi cant legislation affecting
corporate governance, fi nancial disclosure, and public accounting since
the original US securities laws were enacted in the 1930s. It is designed to
improve the public’s confi dence in the fi nancial markets by strengthening
fi nancial reporting controls and the penalties for noncompliance.
Sarbanes-Oxley’s provisions affect nearly everyone involved with fi -
nance (and most of the operations folks, too). The law created the Pub-
lic Company Accounting Oversight Board. It bans accounting fi rms from
selling both audit and nonaudit services to clients. It requires corporate
boards of directors to include at least one director who is a fi nancial expert
and requires board audit committees to establish procedures whereby em-
ployees can confi dentially tip off directors to fraudulent accounting. Under
Sarbanes-Oxley, a company cannot fi re, demote, or harass employees who
attempt to report suspected fi nancial fraud.
CEOs and CFOs are greatly affected by the law. These offi cers must cer-
tify their company’s quarterly and annual fi nancial statements, attest that
they are responsible for disclosure and control procedures, and affi rm that
the fi nancial statements don’t contain misrepresentations. Most companies
we work with now have extensive approval and sign-off procedures each
quarter. Since the CEO and CFO are on the hook for the fi nancials, they
often want every division president to sign for his or her division. Indeed,
H6061.indb 259H6061.indb 259 11/21/12 8:25:46 AM11/21/12 8:25:46 AM
Do
Not
Cop
y or
Pos
t
This document is authorized for use only by Liudmyla Feurstein at EBCM - European University of Munich until October 2014. Copying or posting is an infringement of
copyright. [email protected] or 617.783.7860.
260CREAT ING A F INANCIALLY INTELL IGENT COMPANY
signoffs may extend several levels down. According to the law, fi nes and jail
time may be required if fi nancial results are misrepresented intentionally.
Also, the law forbids companies from granting or guaranteeing personal
loans to executives and directors. (A study by the nonprofi t Corporate
Library Research Group found that companies lent executives more than
$4.5 billion in 2001, just prior to the law’s enactment, often at no or low
interest.) And it requires CEOs or CFOs to give back certain bonuses and
stock option profi ts if their company is forced to restate fi nancial results
because of misconduct.
Sarbanes-Oxley requires companies to strengthen their internal con-
trols. They must include an “internal controls report” in their annual re-
port to shareholders, addressing management’s responsibility in maintain-
ing adequate controls over fi nancial reporting and stating a conclusion as
to the effectiveness of the controls. In addition, management must disclose
information on material changes in the fi nancial condition or operations
of the company on a rapid and current basis.
Sarbanes-Oxley forces public companies to take more responsibility for
their fi nancial statements, and may lessen the probability of undetected
fraud. However, it is very expensive to implement. The average cost for
companies is $5 million; for large companies such as General Electric, it
may be as much as $30 million.
H6061.indb 260H6061.indb 260 11/21/12 8:25:46 AM11/21/12 8:25:46 AM
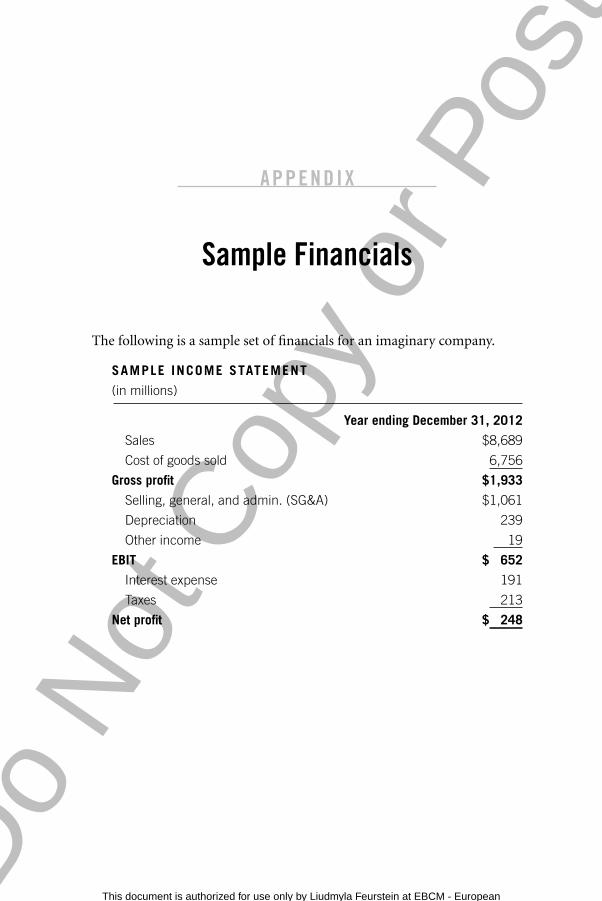
Do
Not
Cop
y or
Pos
t
This document is authorized for use only by Liudmyla Feurstein at EBCM - European University of Munich until October 2014. Copying or posting is an infringement of
copyright. [email protected] or 617.783.7860.
A P P E N D I X
Sample Financials
The following is a sample set of fi nancials for an imaginary company.
SAMPLE INCOME STATEMENT
(in millions)
Year ending December 31, 2012
Sales $8,689
Cost of goods sold 6,756
Gross profi t $1,933
Selling, general, and admin. (SG&A) $1,061
Depreciation 239
Other income 19
EBIT $ 652
Interest expense 191
Taxes 213
Net profi t $ 248
H6061.indb 261H6061.indb 261 11/21/12 8:25:46 AM11/21/12 8:25:46 AM
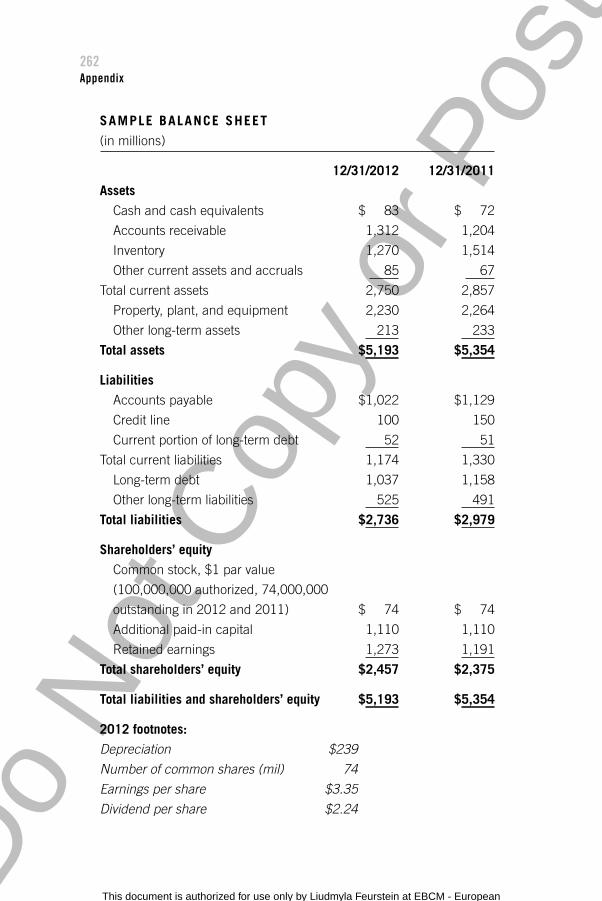
Do
Not
Cop
y or
Pos
t
This document is authorized for use only by Liudmyla Feurstein at EBCM - European University of Munich until October 2014. Copying or posting is an infringement of
copyright. [email protected] or 617.783.7860.
262Appendix
SAMPLE BALANCE SHEET
(in millions)
12/31/2012 12/31/2011
Assets
Cash and cash equivalents $ 83 $ 72
Accounts receivable 1,312 1,204
Inventory 1,270 1,514
Other current assets and accruals 85 67
Total current assets 2,750 2,857
Property, plant, and equipment 2,230 2,264
Other long-term assets 213 233
Total assets $5,193 $5,354
Liabilities
Accounts payable $1,022 $1,129
Credit line 100 150
Current portion of long-term debt 52 51
Total current liabilities 1,174 1,330
Long-term debt 1,037 1,158
Other long-term liabilities 525 491
Total liabilities $2,736 $2,979
Shareholders’ equity
Common stock, $1 par value
(100,000,000 authorized, 74,000,000
outstanding in 2012 and 2011) $ 74 $ 74
Additional paid-in capital 1,110 1,110
Retained earnings 1,273 1,191
Total shareholders’ equity $2,457 $2,375
Total liabilities and shareholders’ equity $5,193 $5,354
2012 footnotes:
Depreciation $239
Number of common shares (mil) 74
Earnings per share $3.35
Dividend per share $2.24
H6061.indb 262H6061.indb 262 11/21/12 8:25:46 AM11/21/12 8:25:46 AM
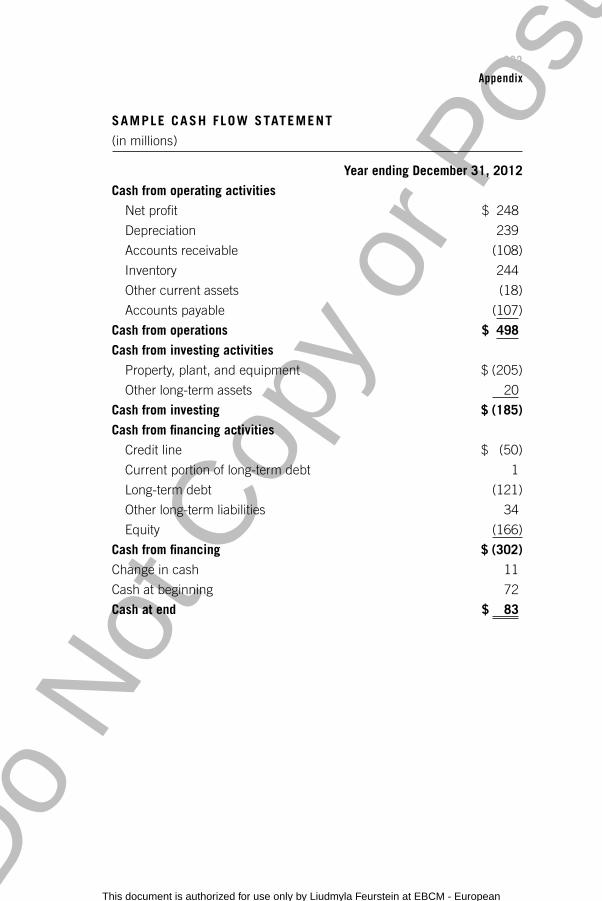
Do
Not
Cop
y or
Pos
t
This document is authorized for use only by Liudmyla Feurstein at EBCM - European University of Munich until October 2014. Copying or posting is an infringement of
copyright. [email protected] or 617.783.7860.
263Appendix
SAMPLE CASH FLOW STATEMENT
(in millions)
Year ending December 31, 2012
Cash from operating activities
Net profi t $ 248
Depreciation 239
Accounts receivable (108)
Inventory 244
Other current assets (18)
Accounts payable (107)
Cash from operations $ 498
Cash from investing activities
Property, plant, and equipment $ (205)
Other long-term assets 20
Cash from investing $ (185)
Cash from fi nancing activities
Credit line $ (50)
Current portion of long-term debt 1
Long-term debt (121)
Other long-term liabilities 34
Equity (166)
Cash from fi nancing $ (302)
Change in cash 11
Cash at beginning 72
Cash at end $ 83
H6061.indb 263H6061.indb 263 11/21/12 8:25:46 AM11/21/12 8:25:46 AM

Do
Not
Cop
y or
Pos
t
This document is authorized for use only by Liudmyla Feurstein at EBCM - European University of Munich until October 2014. Copying or posting is an infringement of
copyright. [email protected] or 617.783.7860.H6061.indb 264H6061.indb 264 11/21/12 8:25:46 AM11/21/12 8:25:46 AM
Do
Not
Cop
y or
Pos
t
This document is authorized for use only by Liudmyla Feurstein at EBCM - European University of Munich until October 2014. Copying or posting is an infringement of
copyright. [email protected] or 617.783.7860.
N O T E S
Chapter 1
1. Deloitte Forensic Center, Ten Things About Financial Statement Fraud: A Review of SEC Enforcement Releases, 2000–2006 (June 2007), http://www.deloitte.com/view/en_US/us/Services/Financial-Advisory-Services/Forensic-Center/5ac81266d7115210VgnVCM100000ba42f00aRCRD.htm.
Chapter 3
1. For more, see our article, “Are Your People Financially Literate?” Harvard Business Review, October 2009, 28.
2. Mike France, “Why Bernie Before Kenny-Boy?” BusinessWeek, March 15, 2004, 37.
Chapter 4
1. Michael Rapoport, “U.S. Firms Clash Over Accounting Rules,” Wall Street Journal, July 6, 2011.
Chapter 6
1. H. Thomas Johnson and Robert S. Kaplan, Relevance Lost: The Rise and Fall of Management Accounting (Boston: Harvard Business School Press, 1991).
Chapter 7
1. See “Vitesse Semiconductor Announces Results of the Review by the Special Committee of the Board,” Business Wire, December 19, 2006; U.S. Securities and Exchange Commission, Litigation Release No. 21769, December 10, 2010; and Ac-counting and Auditing Enforcement Release No. 3217, December 10, 2010, “SEC Charges Vitesse Semiconductor Corporation and Four Former Vitesse Executives in Revenue Recognition and Options Backdating Schemes.”
Chapter 8
1. Randall Smith and Steven Lipin, “Odd Numbers: Are Companies Using Re-structuring Costs to Fudge the Figures?” Wall Street Journal, January 30, 1996.
H6061.indb 265H6061.indb 265 11/21/12 8:25:46 AM11/21/12 8:25:46 AM
Do
Not
Cop
y or
Pos
t
This document is authorized for use only by Liudmyla Feurstein at EBCM - European University of Munich until October 2014. Copying or posting is an infringement of
copyright. [email protected] or 617.783.7860.
266Notes
Chapter 9
1. For a brief summary, see Kathleen Day, “Study Finds ‘Extensive’ Fraud at Fannie Mae,” Washington Post, May 24, 2006.
Chapter 11
1. Manjeet Kripalani, “India’s Madoff? Satyam Scandal Rocks Outsourcing In-dustry,” Bloomberg Business Week, January 7, 2009.
Chapter 25
1. Bo Burlingham, Small Giants: Companies That Choose to Be Great Instead of Big (New York: Portfolio, 2007).
2. See Chris Zook and James Allen, Repeatability: Build Enduring Businesses for a World of Constant Change (Boston: Harvard Business Review Press, 2012).
Chapter 31
1. U.S. Marine Corps Staff, Warfi ghting (New York: Crown Business, 1995).2. Edward E. Lawler, Susan A. Mohrman, and Gerald E. Ledford, “Creating
High Performance Organizations” (Los Angeles: Center for Effective Organiza-tions, Marshall School of Business, University of Southern California, 1995).
H6061.indb 266H6061.indb 266 11/21/12 8:25:46 AM11/21/12 8:25:46 AM

Do
Not
Cop
y or
Pos
t
This document is authorized for use only by Liudmyla Feurstein at EBCM - European University of Munich until October 2014. Copying or posting is an infringement of
copyright. [email protected] or 617.783.7860.
A C K N O W L E D G M E N T S
We—Karen and Joe—have been working together for more than twelve years. Our partnership began with a chance meeting at a conference and evolved over time into co-ownership of our company, the Business Literacy Institute, and now into coauthorship of this book. Over the years, we have met, worked with, and shared experiences with many people who have had an impact on our thinking and our work. This book is a culmination of our education, of our work and management experiences, of our research, of our partnership, and of all we have learned from our work with thousands of employees, managers, and leaders.
Karen fi rst met John while conducting research for her dissertation. He was, and still is, one of the preeminent experts on open-book management and a highly respected business author. We kept track of each other through the years and were always interested in each other’s work. Karen was delighted when John wanted to be a part of this project. He has been an indispensable part of the team.
Many other people have helped make this book a reality. Among them:
• The readers of the fi rst edition of Financial Intelligence. We knew when we wrote the fi rst book that there was a need for a down-to-earth, real-world book about fi nance. But we had no idea we were writing a best-seller! This second edition is available in part because so many of these readers recom-mended the book, shared it, and bought it for people they knew would benefi t from it.
• Bo Burlingham, an editor-at-large at Inc. magazine, author of the wonder-ful book Small Giants, and coauthor (with Jack Stack) of The Great Game of Business and A Stake in the Outcome. Bo graciously shared with us the research and writing on fi nancial fraud that he and Joe had gathered for another project.
• Joe Cornwell and Joe VanDenBerghe, founders of Setpoint (at Setpoint they were referred to simply as “the Joes”). We’re grateful for their belief in teaching everyone the fi nancials and for their tireless efforts in encouraging everyone at Setpoint to participate actively in the success of the company. We
H6061.indb 267H6061.indb 267 11/21/12 8:25:47 AM11/21/12 8:25:47 AM

Do
Not
Cop
y or
Pos
t
This document is authorized for use only by Liudmyla Feurstein at EBCM - European University of Munich until October 2014. Copying or posting is an infringement of
copyright. [email protected] or 617.783.7860.
268Acknowledgments
also want to thank Setpoint’s current CEO, Brad Angus, who has been ex-tremely helpful as an adviser to this second edition. We’re glad they let us tell some Setpoint stories. We also want to acknowledge Reid Leland (owner of LeanWerks), Mark Coy, Machel Jackson, Jason Munns, Steve Neutzman, Kara Smith, Roger Thomas, and all the Setpoint employees for helping us refi ne our approach to fi nancial intelligence. If you are ever in Utah, you should visit Setpoint; the company’s system works, and you’ll see both fi nancial intelligence and psychic ownership in action. We suspect you’ll be surprised at employees’ depth of understanding of the business and their commitment to its success.
• Our clients at the Business Literacy Institute. Thanks to their commitment to fi nancial literacy, we have been able to help spread fi nancial intelligence throughout many organizations. It’s impossible to thank them all, but a few who cheered us on during the writing of this second edition are Heidi Fla-herty and the team at Advent; the Association of General Contractors; Cheryl Mackie at CVS Caremark; Andy Billings at Electronic Arts; Jeff Detrick, Mi-chael Guarnieri, Ellie Murphy, and the entire team at General Electric; Valorie McClelland and Ginny Hoverman at Goodrich; Jim Roberts, Tom Case, Ron Gatto, Catherine Hambley and the team at Granite Construction; Tiffany Keller at Gulfstream, Tanya Chermack at Harvard Vanguard; the Independent College Bookstore Association; Becky Nawrocki at the Institute of Supply Management; Gayle Tomlinson at Kraton; Michael Sigmund at MacDermid Incorporated; Michelle Duke and Anne Frenette at the National Association of Broadcasters; Steve Capas, David Pietrycha, Christy Shibata, Mary von Herrmann, and the teams at NBC News and NBC Universal; Manu Varma at Sierra Wireless; the Society of Human Resource Management; Meghan O’Leary and Stacy Pell at Silicon Valley Bank; Beth Goldstein at Smile Brands; Melinda Del Toro and Ron Wangerin at Viasat; and Mariela Saravia at Visa.
• Our colleagues at the Business Literacy Institute. Our facilitation team—Jim Bado, Cathy Ivancic, Hovig Tchalian, and Ed Westfi eld—are all top-notch trainers, with their own unique styles that make taking a class from them an enriching experience. Stephanie Wexler is manager of client services; her professionalism keeps our projects on track. Judy Golove, manager of train-ing development, ensures that all our training programs are of the highest quality. Kara Smith also works in training development, joining Judy in keep-ing our programs top notch. Sharon Maas’s extensive knowledge of business literacy is refl ected in our customized training program content. Brad Angus, our business development manager, works tirelessly to ensure we are meeting our clients’ needs. Kathy Hoye is the team’s administrative assistant, keeping everything running smoothly.
H6061.indb 268H6061.indb 268 11/21/12 8:25:47 AM11/21/12 8:25:47 AM

Do
Not
Cop
y or
Pos
t
This document is authorized for use only by Liudmyla Feurstein at EBCM - European University of Munich until October 2014. Copying or posting is an infringement of
copyright. [email protected] or 617.783.7860.
269Acknowledgments
• Dave Merrill, the creative artist who illustrates our Money Maps. His ability to take our initial rough ideas and bring them to life is a true talent.
• Jonathan Troper and the team at Alliant International University’s Marshall Goldsmith School of Management, who worked with us to conduct the national study in which we assessed the fi nancial intelligence of US managers and leaders. We relied on their expertise to ensure that the fi nancial intel-ligence test itself and our approach were statistically valid and reliable, giving us accurate data about where US managers and leaders stand in terms of their fi nancial intelligence.
• Our agent, James Levine.
• Tim Sullivan, our editor; and the rest of the team at Harvard Business Review Press, with a special thank you to Julie Devoll.
• And all the others who have helped us along the way, including Helen and Gene Berman, Tony Bonenfant, Kelin Gersick, Larry and Jewel Knight, Nel-lie Lal, Michael Lee and the Main Graphics team, Don Mankin, Philomena McAndrew, Alen Miller, Loren Roberts, Marlin Shelley, Brian Shore, Roberta Wolff, Paige Woodward, Joanne Worrell, and Brian Zander. Our heartfelt thanks to all.
H6061.indb 269H6061.indb 269 11/21/12 8:25:47 AM11/21/12 8:25:47 AM

Do
Not
Cop
y or
Pos
t
This document is authorized for use only by Liudmyla Feurstein at EBCM - European University of Munich until October 2014. Copying or posting is an infringement of
copyright. [email protected] or 617.783.7860.H6061.indb 270H6061.indb 270 11/21/12 8:25:47 AM11/21/12 8:25:47 AM
Do
Not
Cop
y or
Pos
t
This document is authorized for use only by Liudmyla Feurstein at EBCM - European University of Munich until October 2014. Copying or posting is an infringement of
copyright. [email protected] or 617.783.7860.
I N D E X
above the line expenses, 65accounting departments, 20, 64, 72accounts payable (A/P)
cash conversion cycle and, 236–237cash fl ow statement connection, 140days payable outstanding and, 182defi ned, 107income statement connection, 116profi tability ratios and, 169–170working capital and, 228
accounts receivable (A/R)cash conversion cycle and, 236–237cash fl ow statement connection, 140,
149days sales outstanding and, 181, 229 defi ned, 96–97reconciling profi t and cash and, 141working capital and, 227
accounts receivable aging, 239accruals, 11–13, 103–104accrued expenses, 107, 116accumulated depreciation, 99accumulated earnings. See retained
earningsacid test, 177acquisitions
cash conversion cycle and, 238defi ned, 100Tyco, 19–20WorldCom, 18–19
actual versus pro forma, 50–51
AIG, 18airline industry, 14, 173, 174allocations, 11–12American Institute of Certifi ed Public
Accountants (AICPA), 26, 33amortization
defi nition, 70–71EBITDA, 78, 152, 187goodwill and, 101operating profi t and, 77R&D expenses and, 102–103
A/P. See accounts payableApple, 28, 29, 32, 177, 188, 189A/R. See accounts receivableart of fi nance described, 4–5assets
accounts receivable, 96–97, 227accruals, 103–104accumulated depreciation, 99bad debt, 96–97 balance sheet relationships and,
114–116cash and cash equivalents, 95–96current, 95, 117, 176–177defi ned, 95goodwill, 19, 99–102intangible, 102–103intellectual property, 102inventory, 97–98, 228, 231–233liquid, 95long-term, 95, 183
H6061.indb 271H6061.indb 271 11/21/12 8:25:47 AM11/21/12 8:25:47 AM
Do
Not
Cop
y or
Pos
t
This document is authorized for use only by Liudmyla Feurstein at EBCM - European University of Munich until October 2014. Copying or posting is an infringement of
copyright. [email protected] or 617.783.7860.
272Index
assets (continued)mark-to-market accounting (rule),
30, 104–105, 120–121net, 19, 93, 169–171patents, 102 physical assets, 101, 102prepaid, 103–104property, plant, and equipment,
98–99purchase price considerations, 98return on total, 167–168, 192–193total assets, 105total asset turnover, 183–184valuation, 104–105
asset valuation method, 15assumptions
accruals and allocations and, 11–12art of fi nance and, 4–5, 9–16balance sheet and, 91, 93bias in, 12depreciation and, 13–14, 67–70fi nancial intelligence and, 20–22future value and, 199hurdle rate and, 201importance of understanding, 8–9inventory and, 228in NPV calculations, 209present value and, 200profi t and, 46reading an income statement and, 55reality of cash, 126return on investment and, 204–205revenue recognition and, 54in valuation methods, 14–16working capital and, 228
average collection period, 181
backlog and bookings, 61bad debt, allowance for, 96–97balance sheet
accumulated defi cit, 91accumulated earnings, 91assessing a company’s health using,
117–118assets (see assets)balance sheet equation, 92capital expenditures versus expenses,
119–120cash fl ow calculations using,
139–147defi ned, 20, 90–91effi ciency ratios and (see effi ciency
ratios)equity, 90–91footnotes, 94formats, 93fundamental accounting equation
and, 92income statement changes and,
116–117liabilities (see liabilities)mark-to-market accounting (rule),
104–105, 120–121net worth, 91–92owners’ equity (see owners’ equity)profi ts and equity relationship,
114–116reading, 92–94reasons for balance requirement,
111–113retained earnings, 91shareholders’ equity (see owners’
equity)sample, 262
Barnes & Noble, 97below the line expenses, 65Berkshire Hathaway, 125beta measurement, 219bias
allocations and, 12–13art of fi nance and, 5, 9–16
H6061.indb 272H6061.indb 272 11/21/12 8:25:47 AM11/21/12 8:25:47 AM
Do
Not
Cop
y or
Pos
t
This document is authorized for use only by Liudmyla Feurstein at EBCM - European University of Munich until October 2014. Copying or posting is an infringement of
copyright. [email protected] or 617.783.7860.
273Index
in assumptions, 12balance sheet and, 91, 93, 96–97in decision making, 27fi nancial intelligence and, 20–22impact on profi t, 78income statement and, 46introducing through estimates, 59profi t, potential impact on, 77reality of cash, 126in restructuring charges estimates,
72–73in revenue recognition, 59in valuation methods, 14–16
bill-and-hold technique, 158–159bill-paying ability of a company. See
cash fl owbookings, 61bottom line, 6, 56, 78, 79, 84, 166budgeting process, 90Buffett, Warren, 29, 125, 188Burlingham, Bo, 186Business Literacy Institute, 248buying back stock, 137
calculations. See formulas/calculationscalculators, fi nancial, 202capital
cost of, 201, 207, 218–220defi ned, 108expenditures (see capital
expenditures)sources and uses of, 108working (see working capital)
capital budgeting. See capital expendi-tures; return on investment
capital expendituresanalysis methods comparison,
210–215analyzing using ROI (see return on
investment)
capital equipment, 119counting against profi t, 130defi ned, 8, 203–204expenses versus, 8, 119–120free cash fl ow and, 152–153fraud and scandals involving, 8, 19internal rate of return, 209–210 net present value, 207–209owner earnings and, 126payback method, 205, 206–207, 211process of analyzing, 203–204step-by-step guide to, 204–205
capital investments. See capital expenditures
cashcapital expenditures and, 152–153,
199–200, 204–205cash and cash equivalents, 95–96cash without profi t scenario,
132–133defi ned, 23fi nancing a company, 136free cash fl ow, 152–153, 187–188operating cash fl ow versus net profi t,
129–130, 134owner earnings, 126, 134profi t versus, 22, 129–134profi t without cash scenario,
130–132reconciling with profi t, 141–147types of cash fl ow, 135–137why cash matters, 126–128, 148
cash-based businesses, 133cash conversion, 188, 236–238cash cow, 137cash and cash equivalents, 95–96cash fl ow
discounted cash fl ow method, 15discounting equation, 207discounting future cash fl ows,
207–208
H6061.indb 273H6061.indb 273 11/21/12 8:25:47 AM11/21/12 8:25:47 AM
Do
Not
Cop
y or
Pos
t
This document is authorized for use only by Liudmyla Feurstein at EBCM - European University of Munich until October 2014. Copying or posting is an infringement of
copyright. [email protected] or 617.783.7860.
274Index
cash fl ow (continued)evaluating future, 205focus on in ROI, 213–214free cash fl ow, 152–153, 187–188manager’s impact on, 140–151operating cash fl ow, 129–130, 134,
148, 152projecting future, 204–205, 209running out of cash example,
153–154types, 135–138why cash matters, 148
cash fl ow statementcash from or used in fi nancing
activities, 136–137cash from or used in investing ac-
tivities, 136cash from or used in operating
activities, 136information gained from, 137–138potential for manipulation, 138, 228reconciling profi t and cash, 141–147relationship to the balance sheet and
income statement, 139–140sample, 263
Center for Effective Organizations, 247
“Chainsaw Al.” See Dunlap, Alchannel stuffi ng, 60chief fi nancial offi cer (CFO), 37closing the books, 11Coca-Cola, 94common shares/stock, 109company lending to CEOs, 260Computer Associates, 102conservatism and GAAP, 30–31consistency and GAAP, 31consolidated income statement. See
income statementcontribution margin, 80–81controller, 37
Corporate Library Research Group, 260
cost of capital, 201, 207, 218–220cost of goods sold (COGS), 52, 63–66,
76, 78, 180cost of sales (COS), 53–54, 63, 190cost of services (COS), 52, 63–66,
76, 78costs and expenses
above or below the line, 65accrued, 107amortization and, 67–71capital expenditures versus, 8,
119–120cash fl ow and, 150cost of goods sold, 52, 63–66cost of sales, 52–54, 63, 190cost of service (COS)depreciation and, 67–71on the income statement (see costs
and expenses)matching principle and, 45–46noncash expense, 70one-time charges, 71–73operating, 7, 66–67selling expense line, 52sales, general, and administrative
(SG&A), 66tracking expenses, 73–74
credit, givingcash fl ow and, 150making judgments about, 230–231
credit managers, 160, 230culture of a company, 249, 252,
256–258current assets, 95, 117, 176–177current liabilities, 106, 107, 176–177,
191, 226current portion of long-term debt,
107current ratio, 176–177
H6061.indb 274H6061.indb 274 11/21/12 8:25:47 AM11/21/12 8:25:47 AM
Do
Not
Cop
y or
Pos
t
This document is authorized for use only by Liudmyla Feurstein at EBCM - European University of Munich until October 2014. Copying or posting is an infringement of
copyright. [email protected] or 617.783.7860.
275Index
days in inventory (DII), 179–180, 228days payable outstanding (DPO)
calculating, 182cash conversion cycle and, 237impact on a business, 234–236working capital and, 228
days sales outstanding (DSO)calculating, 181–182cash conversion cycle and, 237evaluating a company using, 159managing, 150, 228, 229–231ROA and, 193working capital and, 228
debt-to-equity ratio, 173–174deferred revenue, 61–62, 107–108Denison, Daniel R., 247depreciation
accumulated, 99adjusting for in creating a cash fl ow
statement, 146in calculating net profi t, 142of capital equipment, 8defi ned, 13–14EBITDA, 78, 152, 187economic, 71power of, 67–71
DII (days in inventory). See days in inventory
disclosures, fi nancial, 31–32 discounted cash fl ow method, 15discounted value of future cash fl ows,
208discounting equation, 207dividends, 109, 146divisional system of income statements
(GM), 50dot-com boom, 15–16, 152DPO. See days payable outstandingDrucker, Peter, 43, 247DSO. See days sales outstandingDun & Bradstreet rating, 235
Dunlap, “Chainsaw Al,” 72, 80, 157–159
earnings. See profi tearnings per share (EPS), 58, 187earnings statement. See income
statementEBIT (earnings before interest and
taxes), 77–78, 188EBITDA (earnings before interest,
taxes, depreciation, and amortiza-tion), 78, 152, 187, 188
economic depreciation, 71economic profi t (EP), 221–222economic value added (EVA), 221–222 EDGAR, 39effi ciency ratios, 179–184
days payable outstanding, 182days sales outstanding, 181–182inventory days, 179–181inventory turnover, 179–181property, plant, and equipment
turnover, 182–183total asset turnover, 183–184
Enron, 3, 168, 245EOQ (economic order quantity), 231EPS (earnings per share), 58, 187equity. See owners’ equityestimates
art of fi nance and, 4–5, 7, 10–16in capital expenditures analysis, 7–8,
204–205earnings and, 15introducing biases through, 59in NPV calculations, 209profi t and, 43–47reading an income statement and, 55restructuring charges and, 72–73revenue and, 7role in fi nance, 11–12
H6061.indb 275H6061.indb 275 11/21/12 8:25:47 AM11/21/12 8:25:47 AM
Do
Not
Cop
y or
Pos
t
This document is authorized for use only by Liudmyla Feurstein at EBCM - European University of Munich until October 2014. Copying or posting is an infringement of
copyright. [email protected] or 617.783.7860.
276Index
exchange rates and profi tability, 81–82expenses. See costs and expensesexternal income statements, 53extraordinary items, 72
Fannie Mae, 79, 120Fastow, Andrew, 168Financial Accounting Standards Board
(FASB), 26, 101fi nancial capital, 108fi nancial intelligence, xi–xivfi nancial leverage, 172, 173fi nancial literacy
fi nancial transparency goal, 257–258frontline employees’ potential con-
tribution due to, 246–248managers’ potential contribution
due to, 244–246sharing information’s benefi ts, 256strategies for large companies,
252–255strategies for small companies,
250–251training programs benefi ts, 248
fi nancial ratios. See ratiosfi nancial transparency, 257–258fi nancing a company, 136Fine Apparel example, 132–133fi nished goods inventory, 97, 227fi scal year, 93fi xed costs, 81footnotes to fi nancial statements, 27,
30, 32, 53–54, 94, 97 Ford Motor Company, 27, 31, 162Form 10-K, 38formulas/calculations
cash conversion cycle, 237cost of capital, 218–220cost of debt, 219cost of equity, 220
current ratio, 176–177days in inventory, 179–180days payable outstanding, 182days sales outstanding, 181–182debt-to-equity, 173–174discounting equation, 207economic profi t, 222economic value added, 221free cash fl ow, 152fundamental accounting equa-
tion, 92future value, 198–199gross margin, 165interest coverage, 174–175internal rate of return, 209–210inventory turnover, 180net margin, 166net present value, 207–209operating margin, 165–166payback method, 206–207percent of sales, 191–192 property, plant, and equipment
turnover, 182–183present value, 199–200, 207profi tability index, 212quick ratio, 177–178ratio relationships, 192–193required rate of return, 200–201return on assets, 167–168return on equity, 168–169return on investment, 202total asset turnover, 183–184working capital, 226
fraud and scandalsAIG, 18 channel stuffi ng, 60Computer Associates, 102due to depreciation manipulation, 78Enron, 3, 168, 245Fannie Mae, 79, 120Freddie Mac, 120
H6061.indb 276H6061.indb 276 11/21/12 8:25:47 AM11/21/12 8:25:47 AM
Do
Not
Cop
y or
Pos
t
This document is authorized for use only by Liudmyla Feurstein at EBCM - European University of Munich until October 2014. Copying or posting is an infringement of
copyright. [email protected] or 617.783.7860.
277Index
involving capital expenditures, 8, 19involving the top line, 60Lehman Brothers, 18, 245most common source of, 60Parmalat, 96revenue manipulation and, 58–60Sarbanes-Oxley, 259–260Satyam Computer Services, 96Sunbeam, 72, 80, 157–159Tyco International, 19–20, 102, 238Vitesse Semiconductor, 60Washington Mutual, 18Waste Management, 69, 78, 118WorldCom, 8, 18–19, 119, 152, 245Xerox, 7
Freddie Mac, 120free cash fl ow, 152–153, 187–188full disclosure and GAAP, 31–32fundamental accounting equation, 92future value, 198–199
GAAP. See Generally Accepted Ac-counting Principles
Generally Accepted Accounting Prin-ciples (GAAP)
benefi ts of uniformity, 28–29conservatism, 30–31consistency, 31FASB, 26, 29, 101full disclosure, 31–32historical cost, 30international standards and, 32–33key principles, 29–32materiality, 32monetary units, 30non-GAAP reporting, 33–35purpose of, 26–27
Genentech, 66general and administrative expenses
(G&A), 66–67
General Electric (GE), 186General Motors (GM), 50goodwill, 19, 99–102, 110, 118Google, 177, 186gross margin, 165gross profi t, 75–77, 165
Hewlett-Packard, 54historical cost and GAAP, 30hurdle rate. See also required rate of
returndefi ned, 200–201evaluating a capital expenditure
decision using, 210–212, 217in NPV calculations, 207–209WACC and, 220
IBM, 188, 189income. See profi tincome statement
actual versus pro forma, 50–51balance sheet changes and, 116–117capital expenditures versus expenses,
119–120categories in, 51–52comparative data, 52–53costs and expenses line (see costs
and expenses)defi ned, 6guidelines, 57–58label, 49matching principle and, 44–45potential for manipulation, 58–60profi t and, 44profi t line (see profi t)profi t versus equity, 114–117purpose of, 46–47reading (see reading an income
statement)
H6061.indb 277H6061.indb 277 11/21/12 8:25:47 AM11/21/12 8:25:47 AM
Do
Not
Cop
y or
Pos
t
This document is authorized for use only by Liudmyla Feurstein at EBCM - European University of Munich until October 2014. Copying or posting is an infringement of
copyright. [email protected] or 617.783.7860.
278Index
income statement (continued)relationship to the balance sheet,
114–118, 140 revenue line (see revenue)sample, 261types of profi t seen on, 64using to calculate cash fl ow state-
ment, 139–147what it measures, 50
intangible assets, 49, 70–71, 100, 102–103, 110
intellectual property, 100, 102interest, 15, 65, 77interest coverage ratio, 174–175interest rates
bank lending and, 120–121future value and, 199 in cost of capital calculation,
218–220net present value and, 208–209
internal controls report, 260internal rate of return (IRR), 209–210International Financial Reporting
Standards (IFRS), 33inventory
cash fl ow and, 149–150days, 179–181, 228defi ned, 97–98just-in-time, 231managing, 231–233raw materials, 97reducing, 193turnover, 179–181working capital and, 228work-in-process, 97
investors’ perspectives on ratiosearnings per share, 187EBITDA, 187free cash fl ow, 187–188market capitalization, 188
price-to-earnings ratio, 189revenue growth year over year, 186ROTC, 188shareholder value and, 189–190
Johnson, H. Thomas, 50just-in-time inventory management,
231
Kant, Immanuel, 157Kaplan, Robert S., 50Kersh, Russ, 158Keynes, John Maynard, 190key performance indicators (KPIs),
246–247Kmart, 158Knight, Joe, 134, 191, 215, 218, 235,
247, 250
large-company fi nancial literacy strate-gies, 252–255
layoffs, 79–80lean manufacturing, 231lease, operating, 174, 175Lehman Brothers, 18, 245leverage, fi nancial, 172, 173leverage, operating, 172, 173leveraged buyout, 174leverage ratios, 172–175
debt-to-equity, 173–174interest coverage, 174–175
liabilitiesaccounts payable, 107accrued expenses, 107on the balance sheet, 92current, 106, 107, 176–177, 191,
226
H6061.indb 278H6061.indb 278 11/21/12 8:25:47 AM11/21/12 8:25:47 AM
Do
Not
Cop
y or
Pos
t
This document is authorized for use only by Liudmyla Feurstein at EBCM - European University of Munich until October 2014. Copying or posting is an infringement of
copyright. [email protected] or 617.783.7860.
279Index
current portion of long-term debt, 107
deferred revenue, 107–108long-term, 108short-term loans, 107types of, 106–108
liquid assets, 95liquidity ratios, 176–178
current ratio, 176–177quick ratio, 160, 177–178
long-term assets, 95, 183long-term liabilities, 108losses, 32, 91, 104, 105, 121, 133
Macromedia, 60managing the balance sheet
accounts receivable aging, 239advantages to, 225cash conversion cycle and, 225,
236–238DPO’s impact on a business,
234–236DSO management, 229–231inventory management, 231–233working capital elements, 226–227working capital measurement,
227–228market capitalization, 14, 188market value and owners’ equity,
110mark-to-market accounting rule
asset valuation and, 30, 104–105GAAP and, 30impact of, 120–121
matching principle, 45–46, 67, 99, 103, 107
materiality and GAAP, 32Mattel, 158Microsoft, 29, 66, 76, 96, 110
monetary units and GAAP, 30Money Maps, 251, 252
negative equity, 115net assets, 19, 93, 169–171net margin. See profi tnet operating profi t after tax
(NOPAT), 169–171net present value method, 207–209net profi t. See profi tnet profi t margin percentage, 166net worth, 91–92noncash expense, 70non-GAAP income statements, 51non-GAAP reporting, 33–35nonprofi t organizations, 83–84NOPAT (net operating profi t after
tax), 169–171
one-time charges, 71–73operating cycle, 226, 236, 237operating expenses, 7, 8, 66–67operating lease, 174, 175operating leverage, 172, 173operating margin. See profi toperating profi t (EBIT). See profi toperating profi t margin percentage,
165–166operating statement. See income
statementopportunity cost, 201–202other income/expense, 71overhead, 12, 67, 68, 79, 165, 190owner earnings, 125, 126, 138, 152owners’ equity
additional paid-in capital, 109balance sheet relationships and,
114–116
H6061.indb 279H6061.indb 279 11/21/12 8:25:47 AM11/21/12 8:25:47 AM
Do
Not
Cop
y or
Pos
t
This document is authorized for use only by Liudmyla Feurstein at EBCM - European University of Munich until October 2014. Copying or posting is an infringement of
copyright. [email protected] or 617.783.7860.
280Index
owners’ equity (continued)categories, 108–110common shares/stock, 109defi nition, 91, 108debt-to-equity ratio, 173–174in the fundamental accounting
equation, 92versus profi t on income statement,
114–116return on, 168–169preferred shares/stock, 109retained earnings, 110
P&L statement. See income statementpaid-in capital, 109parentheses, 83Parmalat, 96par value, 109patents, 71, 102payback method, 205, 206–207, 211“percent of” and “percent change,”
84–85percent of sales, 191–192Peter, Laurence J., 43Peter Principle, The, 43Pfeffer, Jeffrey, 247physical capital, 108PI (profi tability index), 212PPE (property, plant, and equipment),
98–99preferred shares, 109prepaid assets, 103–104present value, 199–200price-to-earnings ratio (P/E), 15, 79,
188–189production cycle, 226, 227profi t
above/below the line, 65cash versus, 22, 129–134
cash without profi t scenario, 132–133
contribution margin, 80–81counting capital expenditures
against,130defi ned, 76depreciation in calculating net, 68determining, 45–46effects on assets, 116–117equity versus, on a balance sheet,
114–116exchange rates’ impact on profi tabil-
ity, 81–82fi xes for low profi tability, 79gross, 75–77gross margin, 165impact of biases on, 78net, 78–80net margin, 166–167at nonprofi ts, 83–84operating, 77–78operating cash fl ow versus net,
129–130 operating margin, 165–166profi t without cash scenario,
130–132reconciling with cash, 141–147types of, 75
profi tability index (PI), 212profi tability ratios, 154–171
gross margin, 165net margin, 166operating margin, 165–166return on assets, 167–168return on capital employed, 169–
171return on equity, 168–169return on invested capital, 169–171return on net assets, 169–171return on total capital, 169–171
H6061.indb 280H6061.indb 280 11/21/12 8:25:47 AM11/21/12 8:25:47 AM
Do
Not
Cop
y or
Pos
t
This document is authorized for use only by Liudmyla Feurstein at EBCM - European University of Munich until October 2014. Copying or posting is an infringement of
copyright. [email protected] or 617.783.7860.
281Index
profi t and loss statement. See income statement
pro forma income statement, 51projecting future cash fl ows, 205. See
also return on investmentproperty, plant, and equipment (PPE),
98–99, 146property, plant, and equipment turn-
over, 182–183Public Company Accounting Over-
sight Board, 259purchase price of an asset, 98
quick ratio, 160, 177–178
R&D (research and development), 4, 12, 71, 102, 230
ratios analyzing, 159–162bill-and-hold technique used by
Sunbeam, 158–159categories of, 161–162cautions about reliance on, 162–163current, 176–177days in inventory, 179–181days payable outstanding, 182days sales outstanding, 181–182debt-to-equity, 160, 173–174differences between companies,
193–194effi ciency, 179–184gross margin, 165interest coverage, 174–175inventory turnover, 179–181investors’ perspectives on, 185–190leverage, 172–175liquidity, 176–178net margin, 166
operating margin, 165–166percent of sales, 191–192price-to-earnings, 160, 189profi tability, 164–171property, plant, and equipment
turnover, 182–183quick, 160, 177–178relationships between, 192–193return on assets, 167–168return on capital employed, 169–171return on equity, 168–169return on invested capital, 169–171return on net assets, 169–171return on total capital, 169–171total asset turnover, 183–184
raw materials inventory, 97reading an income statement
actual versus pro forma, 50–51categories of numbers, 51–52comparative data, 52–53estimates and assumptions, 55footnotes, 53–54label on the statement, 49what it measures, 50
receivable days, 181recognized revenue. See revenue
recognitionreconciliation, 141Relevance Lost (Johnson and Kap-
lan), 50required rate of return, 200–201research and development (R&D), 4,
12, 71, 102, 230restructuring charges, 72–73retained earnings, 91, 110, 115, 146return on assets (ROA), 167–168,
192–193return on capital employed (ROCE),
169–171return on equity (ROE), 168–169
H6061.indb 281H6061.indb 281 11/21/12 8:25:47 AM11/21/12 8:25:47 AM
Do
Not
Cop
y or
Pos
t
This document is authorized for use only by Liudmyla Feurstein at EBCM - European University of Munich until October 2014. Copying or posting is an infringement of
copyright. [email protected] or 617.783.7860.
282Index
return on invested capital (ROIC), 169–171
return on investment (ROI) capital expenditures analysis, 203–215cash fl ow focus, 213–214comparison of methods, 210–212cost of capital calculation, 218–220defi ned, 203economic profi t, 221–222economic value added, 221–222future value, 198–199internal rate of return method,
209–210methods comparison, 210–212net present value method, 207–209payback method, 206–207present value, 199–200profi tability index, 212required rate of return, 200–201sensitivity analysis, 215step-by-step guide to analyzing capi-
tal expenditures, 216–218steps from operating profi ts to cash
fl ow, 214time value of money and, 197–198
return on net assets (RONA), 169–171return on sales (ROS), 166return on total capital (ROTC),
169–171, 188revenue
backlog and bookings, 61deferred, 61–62defi ned, 6, 57income statement and, 44–45matching principle and, 45–46, 99,
103, 107percent of, 191–192possibilities for manipulation, 58–60recognition of, 6–7, 22, 54, 58–61,
129–130return on, 166
revenue growth year over year, 186revenue recognition, 6–7, 22, 54,
58–61, 129–130ROA (return on assets), 167–168,
192–193 ROCE (return on capital employed),
169–171ROE (return on equity), 168–169ROI. See return on investmentROIC (return on invested capital),
169–171RONA (return on net assets), 169–171ROS (return on sales), 166ROTC (return on total capital),
169–171, 188
sales. See revenuesales, general, and administrative
expenses (SG&A), 66–67Sarbanes-Oxley, 259–260Satyam Computer Services, 96scandals. See fraud and scandalsSchuetze, Walter, 73scoreboards, 251Securities and Exchange Commission
(SEC), 6, 26, 38, 53, 60, 73, 250sensitivity analysis, 215Setpoint, 134, 191, 215, 218, 235, 247,
250SG&A (sales, general, and administra-
tive expenses), 66–67shareholders’ equity. See owners’
equityshareholder value, 189–190Shore, Andrew, 159short-term liabilities, 107short-term loans, 107small-company fi nancial literacy strat-
egies, 250–251Small Giants (Burlingham), 186
H6061.indb 282H6061.indb 282 11/21/12 8:25:47 AM11/21/12 8:25:47 AM

Do
Not
Cop
y or
Pos
t
This document is authorized for use only by Liudmyla Feurstein at EBCM - European University of Munich until October 2014. Copying or posting is an infringement of
copyright. [email protected] or 617.783.7860.
283Index
smoothing earnings, 96 software industry, 60sources of capital, 108stages of production, 236Starbucks, 34start-up businesses, 103, 142–143, 198,
247statement of earnings. See income
statementstatement of operations. See income
statementstockholders’ equity. See owners’
equitystockout, 232stock price, 4, 7, 8, 14, 157, 169, 187,
188, 189stocks
and bonds, 23, 30, 95, 104, 108buying back stock, 137common shares, 109mark-to-market accounting (rule)
and, 104–105preferred shares, 109
Sullivan, Scott, 119Sunbeam, 72, 80, 157–159Sweet Dreams Bakery example,
130–132
tangible net worth, 102Target Stores, 180taxes
EBIT, 77–78, 188EBITDA, 78, 152, 187, 188matching principle for, 46taxable income, 172, 173total after-tax income, 110
10-K, 3810-Q, 38time value of money, 197–198, 204,
206, 207
toolboxesaccounts receivable aging, 239analyzing capital expenditures,
216–218choosing ratios, 191cost of capital calculation, 218–220differences between companies,
193–194economic profi t, 221–222economic value added, 221–222expense versus capital expenditure,
119–120free cash fl ow, 152–153getting what you want, 36–37mark-to-market accounting,
120–121nonprofi ts, 83–84“percent of” and “percent change,”
84–85percent of sales, 191–192the players and what they do, 37–38ratio relationships, 192–193reporting obligations of public com-
panies, 38–39running out of cash example,
153–154Sarbanes-Oxley, 259–260variance, 83
total after-tax income, 110total asset turnover, 183–184Toyota, 150training programs, 253–254transparency, fi nancial, 257–258treasurer, 37Troubled Asset Relief Program
(TARP), 120Tyco International, 19–20, 102, 238
undervalued assets, 99uses of capital, 108
H6061.indb 283H6061.indb 283 11/21/12 8:25:47 AM11/21/12 8:25:47 AM

Do
Not
Cop
y or
Pos
t
This document is authorized for use only by Liudmyla Feurstein at EBCM - European University of Munich until October 2014. Copying or posting is an infringement of
copyright. [email protected] or 617.783.7860.
284Index
valuation of a company, 14–16variable cost, 67variance, 83vendors, paying, 107, 138, 234venture capitalists (VCs), 15–16visual aids, 251Vitesse Semiconductor, 60voting rights, 109
WACC (weighted average cost of capital), 219
Wall Streetbalance sheet and, 89earnings per share and, 58EBITDA and, 78free cash fl ow and, 18, 126, 138,
152–153metrics of interest to, 185–186smoothing earnings and, 96WorldCom and, 119
Walmart, 53, 158, 180Warfi ghting, 245Washington Mutual, 18Waste Management Inc. (WMI), 69,
78, 118Web tools for calculating NPV, 207weekly numbers meetings, 250–251weighted average cost of capital
(WACC), 219working capital
cash conversion cycle and, 236–238elements of, 226–227formula, 226managing inventory, 231–233measuring, 227–228production cycle, 226
work-in-process inventory (WIP), 97WorldCom, 8, 18–19, 119, 152, 245
Xerox, 7
H6061.indb 284H6061.indb 284 11/21/12 8:25:47 AM11/21/12 8:25:47 AM
Do
Not
Cop
y or
Pos
t
This document is authorized for use only by Liudmyla Feurstein at EBCM - European University of Munich until October 2014. Copying or posting is an infringement of
copyright. [email protected] or 617.783.7860.
A B O U T T H E A U T H O R S
Karen Berman, PhD, is founder and co-owner of the Business Literacy In-
stitute, a consulting fi rm offering customized fi nancial intelligence train-
ing programs, fi nancial intelligence assessments, Money Maps, and other
products and services designed to ensure that everyone in organizations
understands how fi nancial success is measured and how they make an im-
pact. Karen has worked with dozens of Fortune 100 companies, helping
them to create fi nancial literacy programs that transform employees, man-
agers, and leaders into business partners.
Joe Knight is co-owner of the Business Literacy Institute and a principal
owner of Setpoint Companies, where he is also chief fi nancial offi cer. He is
a senior facilitator and keynote speaker for the Business Literacy Institute,
traveling to clients and conferences all over the world to teach them about
fi nance. Joe is a true believer in fi nancial transparency and lives it every day
at Setpoint.
H6061.indb 285H6061.indb 285 11/21/12 8:25:47 AM11/21/12 8:25:47 AM

Do
Not
Cop
y or
Pos
t
This document is authorized for use only by Liudmyla Feurstein at EBCM - European University of Munich until October 2014. Copying or posting is an infringement of
copyright. [email protected] or 617.783.7860.H6061.indb 286H6061.indb 286 11/21/12 8:25:47 AM11/21/12 8:25:47 AM
Related Documents


