Working Paper Series No. 14002 Financial Innovation and Endogenous Growth Luc Laeven International Monetary Fund Centre for Economic Policy Research Ross Levine Haas School of Business, University of California, Berkeley The Milken Institute National Bureau of Economic Research Stelios Michalopoulos Brown University National Bureau of Economic Research January 2014 Hoover Institution Working Group on Intellectual Property, Innovation, and Prosperity Stanford University www.hooverip2.com

Financial Innovation and Endogenous Growth
Apr 05, 2016
We model technological and financial innovation as reflecting the decisions of profit-maximizing agents and explore the implications for economic growth. We start with a Schumpeterian model where entrepreneurs earn profits by inventing better goods and financiers arise to screen entrepreneurs. A novel feature of our model is that financiers also engage in the costly, risky, and potentially profitable process of innovation: Financiers can invent more effective processes for screening entrepreneurs. Every screening process, however, becomes less effective as technology advances, i.e., informational asymmetries evolve endogenously. The model predicts, therefore, that technological innovation and economic growth eventually stop unless financiers innovate to enhance screening. Empirical evidence is consistent with this dynamic, synergistic model of financial and technological innovation and economic growth.
Welcome message from author
This document is posted to help you gain knowledge. Please leave a comment to let me know what you think about it! Share it to your friends and learn new things together.
Transcript
Working Paper Series
No. 14002
Financial Innovation and Endogenous Growth
Luc Laeven International Monetary Fund
Centre for Economic Policy Research
Ross Levine
Haas School of Business, University of California, Berkeley The Milken Institute
National Bureau of Economic Research
Stelios Michalopoulos
Brown University National Bureau of Economic Research
January 2014
Hoover Institution Working Group on
Intellectual Property, Innovation, and Prosperity
Stanford University
www.hooverip2.com
Financial Innovation and Endogenous Growth
Luc Laeven, Ross Levine, and Stelios Michalopoulos�
December 5, 2013
Abstract
We model technological and �nancial innovation as re�ecting the decisions of pro�t-maximizing agents and explore the implications for economic growth. We start with aSchumpeterian model where entrepreneurs earn pro�ts by inventing better goods and �-nanciers arise to screen entrepreneurs. A novel feature is that �nanciers also engage in thecostly, risky, and potentially pro�table process of innovation: Financiers can invent moree¤ective processes for screening entrepreneurs. Every screening process, however, becomesless e¤ective as technology advances, i.e., informational asymmetries evolve endogenously.The model predicts, therefore, that technological innovation and economic growth eventu-ally stop unless �nanciers innovate to enhance screening. Empirical evidence is consistentwith this dynamic, synergistic model of �nancial and technological innovation and economicgrowth.
Keywords: Screening; Financial Intermediation; Invention; Economic Growth; CorporateFinance; Technological Change; Entrepreneurship.
JEL classi�cation Numbers: G0; O31; O4
�Laeven: IMF and CEPR; Levine: Haas School of Business at the University of California, Berkeley, theMilken Institute, and the NBER; and Michalopoulos: Brown University and the NBER. We thank GiovanniDell�Ariccia,Peter Howitt, Yona Rubinstein, Frank Smets, Uwe Sunde, and seminar participants at the BrownUniversity, the London School of Economics, the Bank of England, the Conference on Corporate Finance andEconomic Performance at the University of St. Gallen, the University of Modena, Collegio Carlo Alberto,the European Central Bank, the American Economic Association meetings, and Stanford University for usefulcomments. The views expressed in this paper are entirely those of the authors. They should not be attributedto the International Monetary Fund.
1 Introduction
Two observations motivate this paper. First, a considerable body of research documents that
technology and �nance have evolved together, often in a synergistic manner, over several cen-
turies (Allen and Gale, 1994; Frame and White, 2004; Goetzmann, 2009; Tufano, 2003). For
example, to �nance the construction of vast railroads in the 19th and 20th centuries, �nan-
cial entrepreneurs developed specialized investment banks and accounting systems to facilitate
screening and monitoring by distant investors (Chandler, 1965, 1977; Baskin and Miranti, 1997;
and Neal, 1990). More recently, �nancial entrepreneurs developed modern venture capital �rms
to screen information technology start-ups. And, still more recently, �nanciers designed new
�nancial institutions for identifying biotechnology endeavors with the highest probability of
commercial success (Gompers and Lerner, 2001; Schweitzer, 2006). Econometric evidence from
the United States (Amore, et al 2013; Chava et al 2013) and around the world (Beck et al 2013)
suggests a strong connection between �nance and technological innovation.
Second, economists haven not yet developed models of the co-evolution of technology
and �nance in which both technological and �nancial improvements re�ect the actions of pro�t-
maximizing agents. Existing Schumpeterian models of technological innovation examine �tech-
nological entrepreneurs,�who choose how much to invest in the risky, but potentially lucrative,
process of improving technology (Aghion and Howitt, 2009). These models either ignore the
�nancial system, or presume that economies are endowed with �xed, unchanging �nancial sys-
tems, or assume that �nance changes in a mechanical manner with economic activity. Thus,
these models do not include ��nancial entrepreneurs�, who choose how much to invest in, for
example, the risky, but potentially lucrative, process of improving their abilities to identify
the most promising technological entrepreneurs. As such, existing models cannot provide in-
sights into how the policies, laws, and regulations that shape the incentives of technological
and �nancial entrepreneurs interact to determine the rate of economic growth.
In this paper, we add two novel features to the canonical model of Schumpeterian growth,
so that we can explore the coevolution of �nance and technology. First, we model both tech-
nological and �nancial innovation as re�ecting the explicit, pro�t-maximizing choices of in-
dividuals. In textbook Schumpeterian models, technology evolves based on the choices of
entrepreneurs. Our model also includes �nancial entrepreneurs, who choose how much to in-
vest in the risky activity of improving the screening of technological entrepreneurs. Investors
will pay for improved screening information because it increases the probability of investing in
pro�table technologies. Just as successful technological innovation generates temporary rents
1

for the technological entrepreneur in textbook Schumpeterian models, successful �nancial "in-
novation" generates temporary rents for �nanciers who are better at screening technological
entrepreneurs than their competitors in our model. Thus, �nancial entrepreneurs choose how
much to invest in improving the screening of technological entrepreneurs based on the expected
pro�ts from this activity.
A second novel feature is that every screening modality becomes less e¤ective at iden-
tifying promising entrepreneurs as technology advances. As technology moves up the Schum-
peterian quality ladder, any particular screening procedure becomes less e¤ective at identifying
the technological entrepreneur with the best chance of successfully making the next techno-
logical improvement. That is, informational asymmetries widen endogenously as technologies
advance. For example, the processes for screening the potential builders of new, cross-Atlantic
ships in the 16th century were less e¤ective at screening innovations in railroad technologies in
the 19th century. Technological innovation makes existing screening technologies obsolete.
The core implications of the theory are that (1) technological and �nancial innovation
will be positively correlated and (2) economic growth will eventually stagnate unless �nanciers
innovate. In terms of positive synergies between technological and �nancial innovation, �rst
note that technological change increases the returns to �nancial innovation. As technology
advances, any given screening technology becomes less and less e¤ective at identifying capa-
ble technological innovators as informational asymmetries grow. Thus, the bene�ts�and hence
pro�ts�from improving the screening of technology grow with technological advances. The
synergies work in the other direction too. Better screening boosts the expected pro�ts from
technological innovation, because the expected returns from investing in technological innova-
tion grow when �nanciers are better at identifying the most promising projects (innovators).
In terms of stagnation, the model stresses that existing screening methods become increas-
ingly inadequate at identifying promising technological innovations as the world�s technological
frontier advances. Consequently, unless �nanciers innovate and improve screening technologies
in tandem, the probability of �nding successful entrepreneurs declines, slowing growth. With
appropriate policies, laws, and regulations, however, the drive for pro�ts by �nancial and tech-
nological entrepreneurs alike can produce a continuing stream of �nancial and technological
innovations that sustain growth.
It is worth emphasizing and clarifying the model�s boundaries. First, we examine the
role of the �nancial system in screening entrepreneurs before they are funded. We do not model
the role of the �nancial system in diversifying risk, easing transactions, monitoring loans, or
2
enhancing the governance of �rms once they are funded. Second, we use the term "�nancial
innovation" to refer broadly to any change in the �nancial system that improves the screening
of technological entrepreneurs. Thus, �nancial innovation is neither limited to the invention of
new �nancial instruments, nor is it limited to innovation by �nancial institutions. Financial
innovation includes more mundane �nancial improvements, such as the new �nancial report-
ing procedures that facilitated the screening and monitoring of railroads in the 19th century,
improvements in data processing and credit scoring that enhanced the ability of banks to eval-
uate borrowers since the 1970s, and the establishment and upgrading of private credit bureaus
around the world during the last few decades. Third, we are not the �rst to model the relation-
ship between �nance and growth. For example, Greenwood and Jovanovic (1990), Bencivenga
and Smith (1991), Levine (1991), King and Levine (1993a), Greenwood, Sanchez, and Wang
(2010), and many other papers discussed in Levine (2005a) examine how �nance in�uences the
allocation of capital and hence long-run growth. But, to the best of our knowledge, we are the
�rst to develop a growth model in which improvements in �nance are determined by agents
choosing to invest in the risky, but potentially pro�table, process of �nancial innovation. In
this way, we examine the coevolution of technology and �nance.
Although this paper�s main contribution is the development of a theoretical framework
in which technological and �nancial entrepreneurs drive economic growth, we also examine the
model�s predictions empirically. Our theory yields an estimation equation that di¤ers in one
key dimension from the textbook model of �nance and growth (Aghion and Howitt, 2009): our
theory predicts that �nancial innovation, i.e., the rate of �nancial system improvement, a¤ects
the speed at which economies converge to the world technology frontier, while the textbook
model implies that only the level of �nancial development in�uences growth.
We evaluate the relationship between �nancial innovation and economic growth using dif-
ferent measures of �nancial innovation and di¤erent estimation methods, To measure �nancial
development, we use the ratio of private credit to Gross Domestic Product (GDP), which has
been used by many authors. To proxy for �nancial innovation, we primarily use the growth rate
of the ratio of private credit to GDP. As an additional measure of �nancial innovation, we con-
struct an indicator of how quickly each country adopted one particular modality for improving
the screening of entrepreneurs: the year in which a country�s banking system developed, if ever,
a private credit bureau to share information about potential borrowers (Djankov et al., 2007).
In terms of estimation methods, we �rst extend the cross-country speci�cation used by Aghion,
Howitt, and Mayer-Foulkes (2005) to assess whether the rate of �nancial innovation shapes the
3
speed of convergence to the growth path of the leading economy. Second, we employ a panel
GMM estimator to address concerns about omitted country traits and simultaneity bias, and
to exploit the time-series dimension of the data.1
The empirical �ndings are consistent with the model�s empirical predictions. In the
pure cross-sectional analyses, we �nd that �nancial innovation boosts the speed with which
economies converge to the growth path of the economic leader. And, in the panel GMM
estimation, we �nd that �nancial innovation, but not the level of �nancial development, boosts
the rate of economic growth, especially for countries much poorer than the economic leader.
Although we discuss reasons for interpreting our results cautiously, the �ndings�along with the
econometric evidence in Amore et al (2013), Beck et al (2013), and Chava et al (2013)�are
more consistent with our dynamic, synergistic model of �nancial and technological innovation
than with existing theories of �nancial development and growth.
Of course, �nancial development may not always promote economic growth.2 It is
straightforward to extend our model to allow for rent-seeking �nancial innovation that slows
growth (as we do in a longer version of this paper, available on request). Our purpose in this
paper is not to argue that �nancial innovation is always welfare improving. Rather, we show
that if technological innovation reduces the ability of extant screening modalities to identify
promising future technologies, then fewer resources will �ow toward these promising technolo-
gies, hindering economic growth.
The paper is organized as follows. Section 2 outlines the model�s basic structure , and
Section 3 solves the model and derives testable implications. Section 4 provides suggestive
empirical evidence, and Section 5 concludes.
1Levine, Loayza, and Beck (2000) use the panel GMM estimators developed by Arrellano and Bond (1991),Arellano and Bover (1995), and Blundell and Bond (1998) to assess the impact of �nance on growth.
2Many have sought to understand the role of �nancial innovation in triggering the recent �nancial crisis.Researchers suggest that �nancial innovation in conjunction with investors who neglect small risks (Gennaioli,Shleifer, and Vishny, 2012), investors with biased expectations or institutionalized constraints (Shleifer andVishny, 2010), or excessively competitive banking markets (Thakor, 2012) can induce instability. And, Allenand Carletti (2006) presciently warned that �nancial innovations, such as securitization, that transfer credit riskcan hinder the e¤ective screening of borrowers, boosting �nancial fragility. Additionally, many have argued thatagency problems arising from short-term oriented compensation contracts and con�icted rating agencies led toexcessive risk taking by �nancial intermediaries (Acharya and Naqvi, 2012; Bolton, Freixas, and Shapiro, 2012).Consistent with these views, Dell�Ariccia, Igan, and Laeven (2012), Keys, Mukherjee, Seru, and Vig (2010),and Mian and Su� (2009) �nd that securitization reduced lending standards and increased loan delinquencyrates, while simultaneously boosting the supply of loans and �nancier pro�ts (Loutskina and Strahan, 2009).Henderson and Pearson (2010) show that �nancial institutions engineered �nancial products that exploitedinvestors�misunderstanding of the payo¤s to these products.
4
2 The Basic Structure of the Model
We begin with the discrete-time Schumpeterian growth model developed by Aghion, Howitt,
and Mayer-Foulkes (2005). Economic activity occurs in k countries, which do not exchange
goods or factors of production, but do use each others�technological ideas. There is a continuum
of individuals in each country. Each country has a �xed population, N , which is normalized
to one, so that aggregate and per capita quantities coincide. Each individual lives two periods
and is endowed with three units of labor in the �rst period and none in the second. The utility
function is linear in consumption, so that U = c1 + �c2; where c1 is consumption in the �rst
period of life, c2 is consumption in the second period of life, and � 2 (0; 1) is the rate at whichindividuals discount the utility of consumption in period 2 relative to that in period 1.
2.1 Final Output
In every period the economy produces a �nal good combining labor and a continuum of spe-
cialized intermediate goods according to the following production function:
Zt = N1��
Z 1
0A1��i;t x
�i;tdi; � 2 (0; 1); (1)
where xi;t is the amount of intermediate good i in period t with technology level of Ai;t: N is
the labor supply. The �nal good Z is used for consumption, as an input into entrepreneurial
and �nancial innovation, and an input into the production of intermediate goods.
The production of the �nal good, which we de�ne as the numeraire, occurs under perfectly
competitive conditions. Thus the price of each intermediate good equals its marginal product:
pi;t = �
�Ai;txi;t
�1��: (2)
2.2 Intermediate Goods
In each intermediate goods sector i, a continuum of individuals with an entrepreneurial idea is
born in period t� 1. Only one entrepreneur in a sector has a capable idea, i.e., an idea with apositive probability of producing a successful innovation in period t:
The quality of each entrepreneurial idea is unknown both to the entrepreneur and to
households looking to invest in entrepreneurial ideas, which generates a demand for "screening."
As we detail below, screening in a particular goods sector i is done either by households using a
standard screening technology or by a �nancier who may improve upon the standard screening
5
technology by successfully engaging in the costly, risky, and potentially pro�table process of
�nancial innovation. Based on the screening assessment, households fund the entrepreneur
designated as capable.3
Let �ei;t equal the probability that the capable entrepreneur successfully innovates, so
that the level of technology of intermediate goods sector i in period t, Ai;t, is de�ned as:
Ai;t =
(�At with probability �ei;t
Ai;t�1 with probability 1� �ei;t
), (3)
where �At is the world technology frontier. Following the endogenous growth literature, techno-
logical innovation� or, more accurately, technological transfer� involves the costly, uncertain
process of adapting ideas from the world technology frontier to the domestic economy. Innova-
tion is necessary to transfer a technology because technology and technological expertise have
tacit, country-speci�c qualities. Thus, when the capable entrepreneur successfully innovates,
the level of technology jumps to �At. This world technology frontier grows at a constant rate g;
which is taken as given for now (we derive it formally below).
A successful technological innovator enjoys a production cost advantage over entrepre-
neurs who do not innovate. Namely, she can produce intermediate goods at the rate of one unit
of intermediate good per one unit of �nal good as input. Entrepreneurs who do not innovate
can produce at the rate of one unit of intermediate good per � units of �nal good as input,
where � > 1. In every intermediate sector, there exists an unlimited number of people� the
competitive fringe� capable of producing at the rate of one unit of intermediate good per �
units of the �nal good as input.
Thus, successful innovators become the sole producers in their respective intermediate
sectors. They charge a price equal to the unit cost of the competitive fringe (�) and earn
monopoly pro�ts for one period. In intermediate goods sectors where entrepreneurial innovation
is unsuccessful, production occurs under perfectly competitive conditions, so that the price
equals the unit cost of the competitive fringe (�) and unsuccessful innovators earn zero pro�ts.
Thus, in all intermediate goods sectors, the price, pit, equals �.
3The assumption that entrepreneurs do not know whether their entrepreneurial idea is going to be pro�table isimportant and well-documented. In the model, if entrepreneurs know that they have zero probability of success-fully innovating, then they will not ask for funding because they only receive pro�ts from a successful innovation.Hence, there would be no demand for �nancial screening. The historical examples presented above, along withwork by Chernow (1990), Goetzmann and Rouwenhorst (2005), Gompers and Lerner (2001), Schweitzer (2006),and Tufano (2003), indicate that �nanciers provide information both to investors and entrepreneurs about thepro�tability of entrepreneurial ideas. For example, venture capitalists provide guidance to high-tech innovatorsabout the marketability and value of their ideas.
6
Successful innovators earn monopoly pro�ts for one period. After that period, the in-
cumbent monopolist dies and her technology can be imitated costlessly within the country.
As stated above� and as emphasized throughout the endogenous growth literature, we assume
that it is costly to transfer technologies from the world technology frontier to a particular
country. Using the demand function for intermediate goods from equation (2), the quantity
demanded for intermediate good i equals:
xi;t =
��
�
� 11��
Ai;t : (4)
Since pro�ts per intermediate good equal �� 1, a successful innovator earns pro�ts of:
�i;t = � �Ai;t;where � = (�� 1)��
�
� 11��
: (5)
2.3 Financiers
There is a single �nancier in each sector that screens entrepreneurs to identify the capable
one. In return to their screening services, �nanciers are paid a share of entrepreneurial pro�ts
which we describe formally below. Financiers provide their assessments to households and
entrepreneurs, who use this information to make investment decisions. In the model, �nanciers
are not organized in any particular institutional or legal form, such as a commercial bank, rating
agency, or private equity �rm; �nanciers are simply agents that screen entrepreneurial ideas.
This �ts both the real world, in which �nanciers organize in a variety of forms, and our broad
conception of �nancial innovation, in which �nanciers create and modify their institutional and
legal forms to screen entrepreneurs more e¤ectively.
For each intermediate good sector i, there is a �nancier born each period t � 1: This�nancier may engage in �nancial innovation in order to improve the screening technology next
period. A successful �nancial innovation in sector i allows the �nancier to identify the capable
entrepreneur in sector i with probability one. In the absence of successful �nancial innova-
tion, households use the existing, imperfect screening technology (the "standard" screening
technology de�ned below) to select the capable entrepreneur.
Let �fi;t equal the probability that a �nancier successfully innovates and improves the
screening technology in sector i, so that the level of screening technology in intermediate goods
7
sector i in period t, mi;t, is de�ned as:
mi;t =
8<:�At with probability �fi;t
mt�1 with probability 1� �fi;t
9=; : (6)
For symmetry and simplicity of notation, we index the world screening frontier by the world
technology frontier, �At. As the technological frontier advances, the frontier screening technology
also advances, though the actual screening technology,mt, may lag behind the frontier screening
technology, �At. As with entrepreneurial innovation, �nancial innovation involves the costly and
risky process of transferring screening methodologies from the world frontier to a particular
country. As with intermediate goods technology, screening and �nancial expertise have tacit,
country-speci�c qualities that must be addressed in adapting frontier screening technology to
any particular country.
The successfully innovating �nancier in sector i identi�es the capable entrepreneur with
probability one and is the monopolist provider of the frontier screening technology, �At. If
unsuccessful, households can screen entrepreneurial ideas in sector i during period t using
the common economy-wide screening technology of period t � 1, mt�1. As with technological
entrepreneurs, we assume that it is costless within a country to imitate the screening technology
from last period, so that a successful �nancial innovator maintains the monopoly position for
only one period.
Households in a country in period t have free access to a common, economy-wide screening
technology. We make the simplifying assumption that the latter equals the average of the
screening technologies across all sectors in period t � 1, mt�1. Mechanically, this assumption
means that we do not have to keep track of the distance of each sector�s screening technology
from the frontier; rather, we can simply trace the average distance from the frontier across all
sectors in a country. The underlying intuition is that (a) last period�s screening technologies can
be costlessly used by all sectors within a country and (b) when entrepreneurs in each sector try
to innovate to attain the world technology frontier, �At, such innovative activity involves using
technological ideas from multiple sectors. For example, biotechnology innovation in period t
will typically involve the use of recent innovations in information technology, chemistry, and
other sectors, so that screening biotech entrepreneurs in period t requires an ability to screen
technologies from these other sectors as well. Thus, the common screening technology in period
t is an amalgam of each sector�s screening technology from period t�1, which is freely availablewithin the country in period t.
8
This assumption, however, is not qualitatively important. Rather than de�ning the com-
mon, economy-wide screening technology as the average of last period�s screening technologies,
we could de�ne the common, economy-wide screening technology as the maximum screening
technology across all sectors in the last period. This yields the same qualitative predictions.
Indeed, for the common, economy-wide screening technology, we could choose any point in the
distribution of sector-speci�c screening technologies from last period without loss of generality.
Furthermore, allowing each intermediate sector to maintain its own screening technology over
time delivers cumbersome mathematics without altering the qualitative predictions.
The probability that the capable entrepreneur, �i;t, is identi�ed in sector i is a function of
the gap between the level of the good�s frontier technology and the level of the screening tech-
nology. If the �nancier successfully innovates (which occurs with probability �fi;t), then there
is no gap, and the �nancier identi�es the capable entrepreneur with probability one. If the
�nancier does not successfully innovate (which occurs with probability 1��fi;t), then the �nan-cial gap in period t re�ects the di¤erence between the technological frontier and last period�s
common, economy-wide screening technology. In this case the probability that households
correctly identify the capable entrepreneur is less than one. Speci�cally,
�i;t = mi;t= �At =
8<:�At= �At = 1 with probability �fi;t
mt�1= �At =�t�11+g with probability 1� �fi;t
9=; ; (7)
where, as described above, g is the growth rate of the world technology leader. Note that
within a sector, households have the same screening technology and therefore identify the same
entrepreneur as the capable one. Consequently, households �nance only one entrepreneur per
sector. Across sectors in which �nanciers did not successfully innovate, the households correctly
identify the capable entrepreneur in �t sectors, whereas in 1��t sectors, the households �nancean incapable entrepreneur. Formally, screening projects by the households is deterministic
within a sector but stochastic across sectors.
In the presence of technological innovation in the world frontier but in the absence
of domestic �nancial innovation, the screening technology becomes increasingly ine¤ective at
identifying the capable entrepreneur. This growing �nancial gap reduces the probability that
the society invests in the best entrepreneurial ideas with adverse rami�cations on technological
change. More formally, as technology advances (as �At increases) and without a concomitant
advance in the screening technology, mi;t, the probability that households successfully identify
and fund the capable entrepreneur, �i;t = mi;t= �At, falls.
Financiers are paid by entrepreneurs in the form of a share, �i;t, of entrepreneurial pro�ts.
9
For simplicity but without loss of generality we assume that, though all entrepreneurs sign a
perfectly enforceable contract before screening regarding this share, only one entrepreneur in
a sector is designated as capable by the �nancier when the latter innovates successfully. This
designated entrepreneur, therefore, is the only one in the sector that receives capital from
households.
The �nancier�s fraction of entrepreneurial pro�ts, �i;t, is determined endogenously in
the model. In sectors with successful �nancial innovation, the successful �nancier is the sole
provider of the frontier screening technology and charges a monopoly price in the form of a high
share of entrepreneurial pro�ts. That is, the successful, �nancier charges a price such that the
entrepreneur is ex-ante indi¤erent between using the frontier screening technology and using
the old screening technology available to the households. Without loss of generality, we assume
that households can employ the old screening technology at zero cost, so that entrepreneurs
screened by households keep 100% of the pro�ts.
2.4 Timing of Events
At the beginning of period t�1 in each sector, the �nancier borrows money from households andinvests in �nancial innovation. If the �nancier successfully innovates, then this new screening
technology identi�es the capable entrepreneur in the sector with probability one in period t. In
this case entrepreneurs contract with her and she becomes the single seller of screening services
in the sector. If the �nancier does not innovate, then the households screen the projects,
using the old screening technology from period t � 1, which is available at zero cost, and theentrepreneur designated as capable borrows from the households and invests in innovation.
In period t, uncertainty about entrepreneurial innovation is resolved. If the entrepreneur
successfully innovates, she repays the households for their investment in innovation, pays the
contracted fraction of pro�ts to the �nancier, and keeps the remaining pro�ts. If the �nancier
and entrepreneur successfully innovate, then the �nancier pays back households who lent money
for �nancial innovation.
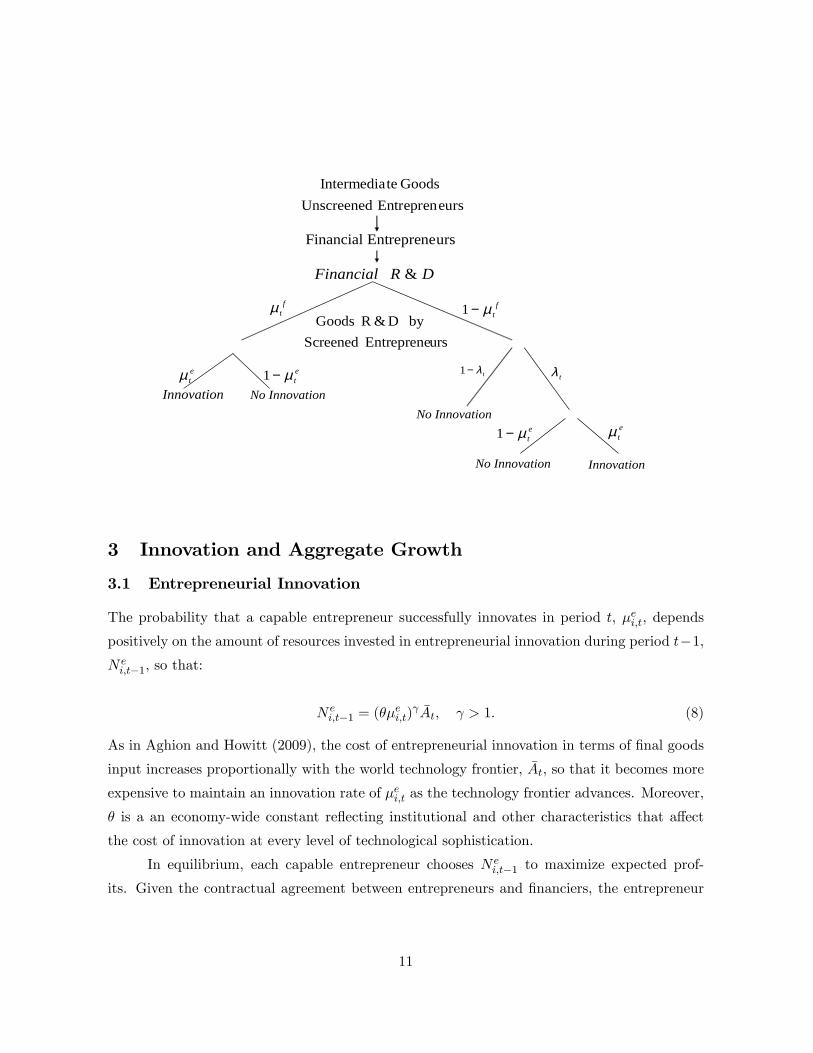
Figure 1 below summarizes all possible scenarios.
10
DRFinancial &
Innovation
ursEntrepreneFinancial
eurs EntreprenUnscreenedGoodsteIntermedia
ursEntrepreneScreenedbyD&RGoods
ftµ f
tµ−1
etµ
Innovation
InnovationNo
InnovationNo
InnovationNo
tλ−1tλ
etµ−1
etµ−1
etµ
3 Innovation and Aggregate Growth
3.1 Entrepreneurial Innovation
The probability that a capable entrepreneur successfully innovates in period t, �ei;t, depends
positively on the amount of resources invested in entrepreneurial innovation during period t�1,N ei;t�1, so that:
N ei;t�1 = (��
ei;t)
�At; > 1: (8)
As in Aghion and Howitt (2009), the cost of entrepreneurial innovation in terms of �nal goods
input increases proportionally with the world technology frontier, �At, so that it becomes more
expensive to maintain an innovation rate of �ei;t as the technology frontier advances. Moreover,
� is a an economy-wide constant re�ecting institutional and other characteristics that a¤ect
the cost of innovation at every level of technological sophistication.
In equilibrium, each capable entrepreneur chooses N ei;t�1 to maximize expected prof-
its. Given the contractual agreement between entrepreneurs and �nanciers, the entrepreneur
11

designated as capable keeps the fraction (1� �i;t) of expected entrepreneurial pro�ts �ei;t, sothat:
�ei;t = (1� �i;t)���ei;t� �At �N e
i;t�1�: (9)
Risk-neutral individuals in the �rst period of life provide resources to entrepreneurs
designated as capable by �nanciers.4 They provide resources to entrepreneurs at a sector-
speci�c interest rate that is an inverse function of the quality of the screening technology in
the sector. De�ning the risk free interest rate as r = 1=� � 1, the interest rate charged to anentrepreneur that is rated as capable by a successful �nancier is Rei;t =
1+r�ei;t. In turn, households
charge the interest rate of Rei;t =1+r�i;t�ei;t
to entrepreneurs selected by the economy-wide screening
technology from the last period. Recall that �i;t = 1 for �nanciers that successfully innovate,
so these two interest rates are consistent.
Consider �rst entrepreneurs that are screened by successful �nanciers, so that the selected
entrepreneur knows with probability one that she is the capable one. The pro�t-maximizing
probability of entrepreneurial innovation comes from maximizing (9) by choosing �ei;t subject
to (8):
�e�i;t =
���
�
�1=( �1); (10)
where we assume that �� < � to ensure that the equilibrium probability of successful en-
trepreneurial innovation is less than one (��e;t < 1) under perfect �nancial screening. Since
entrepreneurs repay �nanciers only when they successfully innovate, �i;t does not a¤ect invest-
ment in entrepreneurial innovation.
From (10), the comparative statics of when a �nancier successfully innovates are intuitive.
Entrepreneurs invest more in innovation and boost the probability of success when (1) the net
pro�ts per unit of the intermediate good, �, are higher and (2) the cost of entrepreneurial
innovation, �; is lower. If � and � are common across sectors, then �e�i;t = �e� 8 i.
4We assume that all investment is domestically �nanced, but allowing for perfect international capital mobilitywould not change the analysis given the structure of the model. First, linear utility with a constant discount rateimplies that individuals are indi¤erent between investing domestically or abroad, so that perfect capital mobilityyields the same results. Second, we treat �nancial and technological innovation symmetrically: Entrepreneursin a country must engage in the costly, risky process of adapting a technology from the frontier country totheir domestic market. Similarly, �nanciers must engage in the costly, risky process of adapting a screeningmethodology from the frontier country to a particular domestic market. Whether the �nancier that undertakesthese costly, risky "innovations" is domestic or foreign is irrelevant for our purposes.
12
Substituting (10) into (9) yields the net expected pro�ts of an entrepreneur screened by
a successful �nancier,
�e�i;t = (1� �i;t)�e�' �At; (11)
where ' = ��(1� 1= ):Now, consider entrepreneurs screened by households using the old, imperfect screening
technology,mt�1. Under these conditions, the entrepreneur keeps all the pro�ts, so that �i;t = 0.
Thus, the expected pro�ts to an imperfectly screened entrepreneur, �e0i;t; i.e., the expected
pro�ts of an entrepreneur screened using the old screening technology is:
�e0i;t = ��i;t�ei;t�
�At �N et�1: (12)
Consequently, the pro�t-maximizing probability of entrepreneurial innovation for imperfectly
screened entrepreneurs, �0e;t; is:
�e0i;t = (�i;t)
1 �1 �e�: (13)
Substituting (13) in (12) one derives the maximal net expected revenue of an entrepreneur
selected using the old screening technology as:
�e0i;t = (�i;t)
�1 �e�' �At: (14)
The following Lemma establishes the properties of entrepreneurial innovation in sector i
when using the old screening technology, �i;t,
Lemma 1 The properties of entrepreneurial innovation in sectors using the old, imperfect
screening technology:
1. Entrepreneurs invest more in innovation and boost the probability of successful innovation
when (1) the net pro�ts per unit of the intermediate good, �, are higher and (2) the cost
of entrepreneurial innovation, �; is lower, i.e.,
@�e0i;t
@� > 0;@�e
0i;t
@� < 0:
2. The rate of entrepreneurial innovation is an increasing function of the standard screening
technology, �i;t; i.e.,@�e
0i;t
@�i;t> 0:
13
Proof. These properties follow by directly di¤erentiating equation (13). �We can now derive the fraction of entrepreneurial pro�ts accruing to the entrepreneur
(1� �i;t) and the �nancier (�i;t). For the unscreened entrepreneurs in the beginning of periodt� 1 to be indi¤erent between choosing a contract with a �nancier or using the economy-widescreening technology supplied by the households, these two alternatives must deliver the same
expected pro�ts. Formally, (11) must equal (14), so that:
�i;t = 1� (�i;t)
�1 : (15)
Equation (15) indicates that the better is the economy�s �nancial screening capacity
(higher �i;t) the lower is the fraction of entrepreneurial pro�ts (�i;t) that a successful �nancier
can demand. This occurs because if the standard screening technology is close to the frontier
screening technology, then households o¤er a close substitute. On the other hand, if the avail-
able screening technology is a poor substitute for newly developed screening capabilities, then
the �nancier can obtain a larger fraction of expected entrepreneurial pro�ts.
3.2 Financial Innovation
As with entrepreneurial innovation, the probability that the �nancier in sector i successfully
innovates during period t � 1 and identi�es the entrepreneur capable of innovation in periodt, �fi;t, depends positively on the amount of resources invested in �nancial innovation during
period t� 1, Nfi;t�1:
Nfi;t�1 = (�f�
fi;t)
�At; > 1; (16)
where the cost of �nancial innovation in terms of the �nal goods input increases proportionally
with the world technology frontier, �At. Thus, it becomes more expensive to maintain the same
rate of �nancial innovation, �fi;t, as the technological frontier advances since the entrepreneurs
that are screened by �nanciers are striving to reach the world technology frontier.
The �nancier chooses Nfi;t�1 to maximize expected pro�ts, �
fi;t. Since a successfully in-
novating �nancier keeps the fraction �i;t of expected entrepreneurial pro�ts, �e�i;t, the �nancier�s
expected pro�ts equals:
�fi;t = �fi;t��i;t�
e�i;t �N
fi;t�1: (17)
The �nancier maximizes pro�ts by borrowing Nfi;t�1 worth of �nal goods and investing
these resources in �nancial innovation. Risk-neutral individuals lend to �nanciers seeking to
14
innovate at an interest rate of Rft =1+r
�ft;i�et;i
, which is a function of the risk free interest
rate, r, the probability that the �nancier successfully innovates, and the probability that the
entrepreneur designated by the �nancier as capable successfully innovates. After substituting
(15) into (17), the �nancier chooses to borrow and invest in �nancial innovation such that the
pro�t-maximizing probability of successful �nancial innovation in sector i during period t is:
�f�i;t =
��e�t '(1� (�i;t)
�1 )
� f
! 1 �1
; (18)
where we assume that �f > � to ensure that the rate of �nancial innovation is less than one.
3.3 Aggregating the Financial System
To examine the e¢ ciency of a country�s �nancial system, we aggregate across individual sectors
to focus on the average, or representative, probability that the capable entrepreneur is identi�ed,
�t =
Z 1
0�i;tdi;
where �i;t equals the probability that the entrepreneur capable of innovating in sector i during
period t is chosen. From equation (7), the average level of �nancial e¢ ciency evolves according
to the following equation:
�t = �ft + (1� �
ft )�t�11 + g
: (19)
Financiers identify the capable entrepreneur with probability one in fraction �ft of the sectors
in which the �nancial innovation is successful. Since we aggregate �nancial screening quality
across a continuum of sectors, we ignore negligible relative size di¤erences. In the remaining
1��ft of the sectors, households identify the capable entrepreneur with a probability of�t�11+g < 1.
To obtain the steady state level of average �nancial screening, let �t = �t�1 = �� and
�ft = �f� in the steady state and then solve for �� in equation (19):
�� =�f�
g + �f�: (20)
Directly di¤erentiating equation (20) yields a key result:
@��
@�f�> 0: (21)
15
The higher is the steady state rate of �nancial innovation, �f�; the more e¢ cient is the econ-
omy�s �nancial system at identifying capable entrepreneurs in the steady state, ��.
The steady state pro�t-maximizing innovation probability of the �nancial system is de-
termined by replacing �i;t = �� into (18), so that:
�f� =
��e�'(1� (��)
�1 )
� f
! 1 �1
: (22)
Finally, combining (20) and (22), yields the implicit function:
F (�e�; �f�; �f ) � 0; (23)
which characterizes the equilibrium innovation rate of the �nancial system. The following
Lemma summarizes the properties of an economy�s �nancial innovation rate:
Lemma 2 The properties of �nancial innovation in the steady state:
1. Financial innovation is an increasing function of the rate at which entrepreneurs innovate:
@�f�
@�e�> 0:
2. Financial innovation is a decreasing function of the costs of �nancial innovation, �f :
@�f�t@�f
< 0:
3. Financial innovation is an increasing function of the rate at which the world technology
frontier, g, advances:@�f�t@g
> 0:
Proof. Repeated di¤erentiation of equation (22) according to the Implicit Function Theorem
delivers the results. �We present the comparative statics of �f�t with respect to entrepreneurial innovation �e�
to highlight the nexus between entrepreneurial and �nancial innovation. It is straightforward
to show that since �e� itself is a function of exogenous features of the economy (�; �), (part
1 of Lemma 1), changes in these structural parameters will a¤ect the equilibrium �nancial
innovation accordingly.
16

Stagnant entrepreneurial innovation reduces the expected pro�ts from �nancial inno-
vation, which in turn (a) reduces investment in �nancial innovation, (b) slows the rate of
improvement in the screening technology, (c) lowers the probability that capable entrepreneurs
are selected, and hence (d) impedes technological innovation and growth. Put di¤erently, there
is a multiplier e¤ect associated with changes in entrepreneurial innovation that reverberates
through the rate of �nancial innovation back to the rate of technological change.
Policies, regulations, and institutions that impede �nancial innovation have large e¤ects
on the rate of technological innovation. Thus, countries in which it is more expensive to
innovate �nancially (higher �f ) will tend to experience slower rates of technological growth.
Cross-economy di¤erences in the cost of �nancial innovation can arise for many reasons. For
example, a large literature suggests that some legal systems (for example, those that rely on
case law) are more conducive to �nancial innovation than other systems (such as those that
rely less heavily on case law to adapt to changing conditions), which has been documented by
Levine (2005b), Gennaioli and Shleifer (2007), and Levine (2005a, 2005b).
3.4 Aggregate Economic Activity
This section aggregates an economy�s economic activity and examines its components. We
de�ne the economy�s average level of technological productivity, At, as:
At =
Z 1
0At(i)di;
where aggregation is performed across the continuum of intermediate sectors.
To derive the law of motion of the average level of technological productivity, note that
in equilibrium, the expected rate of entrepreneurial and �nancial innovation is the same across
sectors, i.e. �fi;t = �ft and �ei;t = �et . Then, one can simply use the branches of Figure 1 and
equation (13) to derive the law of motion of average productivity:
At+1 = (�ft+1�
et+1+(1��
ft+1)�
1=( �1)t+1 �et+1)
�At+1+(1��1=( �1)t+1 �et+1��ft+1�
et+1+�
ft+1�
1=( �1)t+1 �et+1)At:
(24)
Inspecting (24) reveals that a country�s average technological productivity in period t+ 1 is a
weighted average of sectors that implement the frontier technology, �At+1; and of sectors using
the average technology of period t; At. The weights are functions of (a) the rate of �nancial
innovation, �ft+1, (b) the quality of the �nancial screening technology, �t+1, and (c) the proba-
bility of successful entrepreneurial innovation, �et+1. In particular, the productivity parameter
17
will equal �At+1 both in sectors where �nanciers and entrepreneurs successfully innovated and
in sectors where �nanciers did not innovate, but where, nevertheless, the funded entrepreneurs
successfully innovated.
To derive the per capita gross domestic product within a country, note that it is composed
of wages in the �nal goods sector and pro�ts in the intermediate goods and �nancial sectors.
In terms of wages, note that �nal good production can be summarized by Zt = �At where
� = (�=�)�=(1��), which may be derived by substituting (4) into (1). Since by assumption
the �nal goods sector is competitive, the wage rate wt is the marginal product of labor in
the production of the �nal good, so that wt = (1 � �)Zt = (1 � �)�At.5 In terms of pro�ts,
successful entrepreneurs earn �At, where � = (�� 1)���
� 11��. Thus, per capita gross domestic
product is the sum of added value across sectors:
Yt = wt + �t�t = (1� �)�At + �t�At ; (25)
where �t is the fraction of goods�sectors with successful entrepreneurial innovation in period
t.
3.5 Equilibrium Economic Performance Across Countries
We now characterize the growth rate of Yt as a function of the underlying parameters of the
model economy. Denote a country�s inverse distance from the world technological frontier as
at = At= �At. Each economy takes the evolution of the frontier as given (see below how this is
derived). Thus, the technology gap evolves according to:
at+1 = (�ft+1�
et+1+(1��
ft+1)�
1=( �1)t+1 �et+1)+
�1� �1=( �1)t+1 �et+1 � �
ft+1�
et+1 + �
ft+1�
1=( �1)t+1 �et+1
�1 + g
at � H(at) :(26)
This converges in the long run to the steady state value:
ass =(1 + g)��
g + ��;
5Unlike Aghion et al. (2005), where the proportionality of the wage rate to the domestic productivity deter-mines the level of technology investment in a credit-constrained country, this ratio plays no role in determiningentrepreneurial investment in our model. As shown in equations (10) and (13), the probability of entrepreneurialinnovation depends only on entrepreneurial pro�ts and the level of the �nancial screening technology. Domesticproductivity determines the amount that a �nancier and an entrepreneur can borrow from households in periodt. Since we assume that neither �nanciers nor entrepreneurs can hide their proceeds, households are willing tolend any amount at the prevailing interest rate.
18

where �� = �f��e�+(1��f�) (��)1=( �1) �e� is the fraction of innovating entrepreneur sectors.As in other multi-country Schumpeterian models, the growth rate of the technological
frontier is determined by the equilibrium rate of entrepreneurial innovations in the leading
country labeled 1.6 That is,
g = �f�1 �e�1 + (1� �
f�1 ) (�
�1)1=( �1) �e�1 : (27)
The following Proposition summarizes the properties of an economy attempting to im-
plement the world technology frontier.
Proposition 1 An economy�s steady state technology gap displays the following properties:
1. The steady state technology gap is decreasing at the cost of �nancial innovation; �f ; i.e.,
@ass@�f�
@�f�
@�f< 0:
2. The steady state technology gap is increasing at the rate of entrepreneurial innovation,
�e�; i.e.,@ass@�e�
@�e�
@�< 0;
@ass@�e�
@�e�
@�> 0
Proof. The �rst property obtains by di¤erentiating ass with respect to �f� and taking into
account the second part of Lemma 2. The second property obtains by taking into account that
both the net pro�ts per unit of the intermediate good, �, and the cost of entrepreneurial inno-
vation, �; (see part 1 of Lemma 1) shape entrepreneurial innovation which in turn determines
the steady state technological gap.
Corollary 1 An economy blocking �nancial innovation will eventually stagnate irrespective of
the initial level of screening technology, �t:
ass = 0 if �f !1:
Proof. When the cost of �nancial innovation goes to in�nity, �f !1, then part 2 of Lemma2 implies that �nancial entrepreneurs allocate no resources towards R&D and thus �nancial
and subsequently technological innovation stagnate.
The next section brie�y discusses the derived properties.6There is no need to explicitly specify the size of innovation for the leader since it does not a¤ect the
equilibrium innovation probability. To see that, assume that the leader�s technological jump from period t� 1;is h > 1; i.e. At = hAt�1. Looking at (9) it becomes clear that the size of the jump, h; multiplies both theexpected revenues and the innovation costs leaving the equilibrium rate of entrepreneurial innovation una¤ected.
19
3.6 Dynamic versus Static Financial Markets
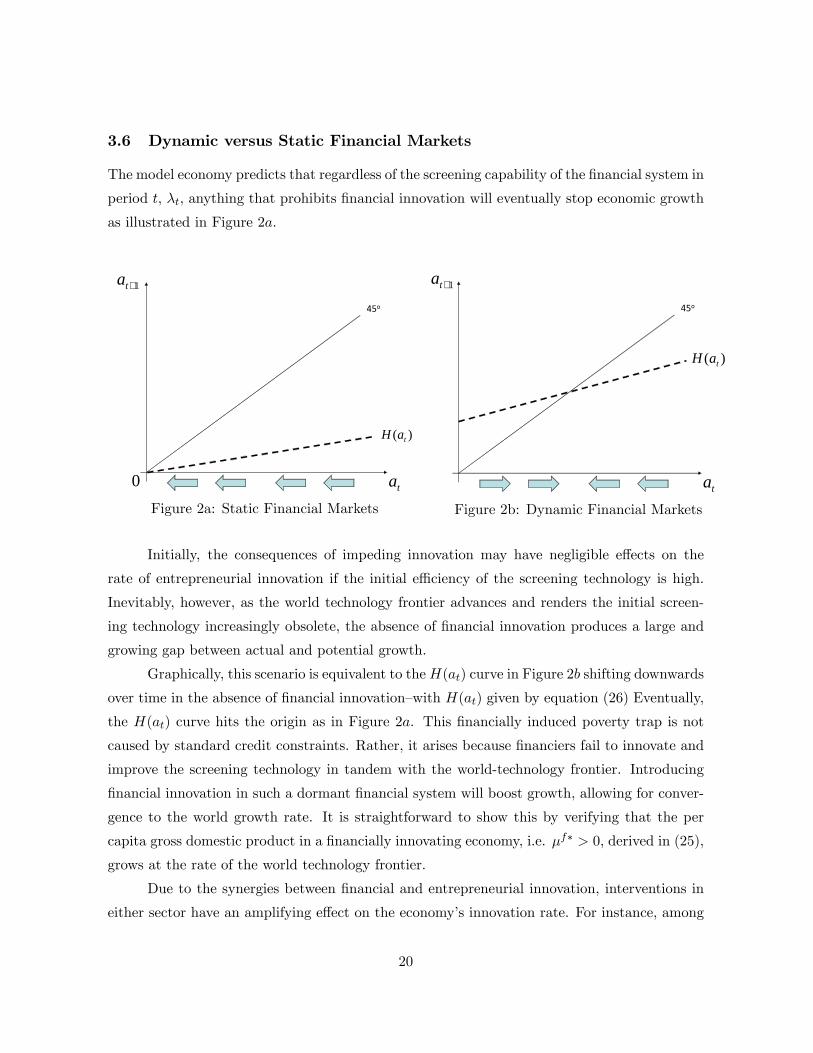
The model economy predicts that regardless of the screening capability of the �nancial system in
period t, �t, anything that prohibits �nancial innovation will eventually stop economic growth
as illustrated in Figure 2a.
45o
1+ta
ta0
)( taH
Figure 2a: Static Financial Markets
45o
1+ta
ta
)( taH
Figure 2b: Dynamic Financial Markets
Initially, the consequences of impeding innovation may have negligible e¤ects on the
rate of entrepreneurial innovation if the initial e¢ ciency of the screening technology is high.
Inevitably, however, as the world technology frontier advances and renders the initial screen-
ing technology increasingly obsolete, the absence of �nancial innovation produces a large and
growing gap between actual and potential growth.
Graphically, this scenario is equivalent to theH(at) curve in Figure 2b shifting downwards
over time in the absence of �nancial innovation�with H(at) given by equation (26) Eventually,
the H(at) curve hits the origin as in Figure 2a. This �nancially induced poverty trap is not
caused by standard credit constraints. Rather, it arises because �nanciers fail to innovate and
improve the screening technology in tandem with the world-technology frontier. Introducing
�nancial innovation in such a dormant �nancial system will boost growth, allowing for conver-
gence to the world growth rate. It is straightforward to show this by verifying that the per
capita gross domestic product in a �nancially innovating economy, i.e. �f� > 0; derived in (25),
grows at the rate of the world technology frontier.
Due to the synergies between �nancial and entrepreneurial innovation, interventions in
either sector have an amplifying e¤ect on the economy�s innovation rate. For instance, among
20
economies that invest in �nancial innovation, further decreasing the barriers to �nancial inno-
vation will shift the H(at) curve upwards in Figure 2b, increasing a country�s steady state level
of technology relative to the frontier, ass. In a similar fashion, factors a¤ecting entrepreneurial
innovation also shape a country�s steady state technology gap.
4 Evidence on Financial Innovation and Growth
4.1 Preliminaries
Although the primary contribution of this paper is the development of a theoretical model
in which both technological and �nancial innovation re�ect the choices of pro�t-maximizing
agents, this section provides empirical evidence on the model�s key prediction: Financial inno-
vation is crucial for long-run growth. Our model predicts that without improvements to the
�nancial system, economic growth will slow regardless of the initial level of �nancial develop-
ment. This prediction di¤ers from existing models that ignore the potential role of �nancial
innovation in facilitating technological innovation and economic growth and that focus only on
the impact of the level of �nancial development on long-run growth.
As emphasized in the Introduction, researchers have already documented close ties be-
tween �nancial innovation and economic growth. Indeed, it is this research that helped motivate
our theoretical model. Tufano (2003), Goetzmann (2009), Neal (1990), Gompers and Lerner
(2001), and others provide descriptions of how �nancial innovations fostered technological ad-
vancements over the centuries. Other studies provide econometric evidence of the robust as-
sociation between �nancial innovation and economic growth. Amore, Schneider, and Zaldokas
(2013) show that exogenous increases in bank credit across the states of the United States
spur innovation in non�nancial �rms, as measured by the production of patents. Interpreting
bank credit as a proxy for �nancial innovation, these �ndings suggest that �nancial innovation
boosts technological innovation and hence economic growth. In a cross-country study, Beck,
Chen, and Song (2013) show that economic growth is positively associated with how much a
country�s banking system spends on research and development. Interpreting research and de-
velopment spending by banks as a proxy for innovation, this research too advertises the positive
association between �nancial innovation and economic growth.
We contribute to these empirical studies in several ways. First, while existing cross-
economy studies of �nancial innovation and growth add �nancial innovation as an additional
explanatory variable into a standard, reduced-form empirical growth regression, we assess the
speci�c regression speci�cation emerging from theory. That is, our model predicts that �nancial
21

innovation will be positively associated with the rate at which an economy converges to the
technological leader. Second, we test the predictions of our model against a well-speci�ed
alternative. In particular, our theoretical model yields an estimation equation that di¤ers in
only one key dimension from that of Aghion, Howitt, and Mayer-Foulkes (2005) (henceforth
AHM). While AHM stress that the level of �nancial development accounts for the rate at which
economies converge to the technological leader, we highlight the role of �nancial innovation.
We evaluate these views empirically. Third, besides using the growth rate of credit to the
private �rms (as a share of GDP) as a proxy for �nancial innovation, we also examine the
speed with which a country�s banks created a private credit bureau to better screen businesses.
While both proxies are imperfect measures of �nancial innovation, they provide complementary
evidence and add to the growing body of empirical evidence on the role of �nancial innovation in
fostering long-run growth. Finally, since pure cross-economy analyses face severe endogeneity
problems and do not exploit the time-series dimension of the data, we also employ a panel
GMM estimator to assess the impact of both �nancial development and �nancial innovation
on economic growth while controlling for other features of the economy.
4.2 Econometric model and data
To test the predictions of our model against a well-speci�ed alternative, we build on AHM�s
framework. They �nd that the level of �nancial development boosts the speed with which a
country converges to the economic leader using cross-country data over the 1960-1995 period.
In particular, the AHM cross-country regression speci�cation is as follows:
g � g1 = �0 + �1F + �2(y � y1) + �3F (y � y1) + �4X + "; (28)
where g � g1 is average growth rate of per capita income relative to U.S. growth over theperiod 1960-95, F is �nancial development, which is measured as credit to the private sector
as a share of GDP, y � y1 is log of per capita income relative to U.S. per capita income, X is
set of control variables, and " is an error term. The data are from Levine, Loayza, and Beck
(2000). Consistent with their theoretical model, AHM �nd that �1 is not signi�cantly di¤erent
from zero and �3 is negative and signi�cant, indicating that the level of �nancial development
accelerates the rate at which economies converge to the technological frontier.
Our model economy encompasses the AHM framework but di¤ers in one key aspect: our
model stresses the importance of �nancial innovation, not �nancial development. Indeed, in
our model, the level of �nancial development in any period is an outcome of previous �nancial
22
innovations. Therefore, our amended regression framework is as follows:
g � g1 = b0 + b1F + b2(y � y1) + b3F (y � y1) + b4X + b5f + b6f(y � y1) + u; (29)
where f denotes �nancial innovation over the sample period 1960-95. Our model predicts that
b6 < 0 : the speed of convergence depends positively on �nancial innovation. The model also
predicts that b5 will be insigni�cant, indicating a vanishing steady-state growth e¤ect. This
prediction derives from the assumption that the technological leader already possesses a �nan-
cial system that innovates at the growth-maximizing rate, so that faster �nancial innovation
would not increase the probability of picking capable entrepreneurs. Note that f is measured
over the sample period, while F is measured at the beginning of the sample period, i.e., F does
not include improvements to the �nancial system�s screening technology during the period.
We use two measures of �nancial innovation. First, we use the growth rate of credit
to the private sector as a share of GDP, so that f equals the average annual growth rate of
F over the period from 1960 to 1995. Since a large body of research uses the ratio of credit
to the private sector to GDP as a proxy for the level of �nancial development as discussed
in Levine (2005), it is natural to use the growth rate of �nancial development as a proxy for
improvements in the �nancial system. Furthermore, although surges in the ratio of credit to
GDP over short horizons might re�ect unsustainable credit booms, this is unlikely to be the
case over a 35 year period, increasing the likelihood that the growth rate of credit to GDP from
1960 to 1995 provides information on the rate of improvement in a country�s �nancial system.
Similarly, since this proxy for �nancial innovation omits credit to the government or public
enterprises, it is unlikely to re�ect expansionary �scal policies or increased expenditures by
public entities and hence more likely to gauge improvements in �nancial services. Nevertheless,
the growth rate of credit to the private sector is not an ideal measure of �nancial innovation
because it does not explicitly measure any particular �nancial innovation.
Second, we measure how quickly a country�s banking system created a private credit
bureau to improve the screening of entrepreneurs.7 Private credit bureaus share credit infor-
mation about the creditworthiness of individuals and �rms.8 Such bureaus allow banks to7Speci�cally, this measure equals the fraction of years between 1960 and 1995 that a country had a private
credit bureau (Djankov et al., 2007). Since banking systems do not eliminate private credit bureaus once theyare created, this measure is larger, the earlier a country�s banking system created a private credit bureau.
8The world�s oldest private credit bureau, Equifax, was founded in Atlanta, Georgia in 1899 as Retail CreditCompany. It began with two brothers, Cator and Guy Woolford, keeping a list of customers and their cred-itworthiness for their local Retail Grocer�s Association. They would sell their book to other merchants in the
23
obtain credit information on customers of other banks and serve as an important screening
mechanism for new borrowers. It is true that these credit bureaus are backward looking; they
provide information on a potential borrower�s credit history. But, this information is used in
evaluating the economic potential of entrepreneurs. Although imperfect and narrow in scope,
we use the speed with which a country�s banking system established a private credit bureau
as an additional empirical proxy of �nancial innovation. As of 2003, private credit bureaus
operated in 55 out of the 133 countries covered by Djankov et al. (2007).
For comparison purposes, we test the empirical predictions of our model using the same
dataset and the same set of control variables, X, as in AHM. These control variables include
measures of educational attainment (school), government size (gov), in�ation (pi), black market
premium (bmp), openness to trade (trade), revolutions and coups (revc), political assassinations
(assass), and ethnic diversity (avelf). The summary statistics of our main regression variables,
including data de�nitions, are reported in Table 1.
4.3 Results: Cross-country regressions
We start by running a simple cross-country OLS regression, limiting the sample to countries
with data on the initial level of �nancial development in 1960. King and Levine (1993b) �nd
that the level of �nancial development in 1960 predicts subsequent rates of long-run growth.
Although AHM use average private credit over the period 1960-95, we use the initial level
of private credit to GDP because the average includes �nancial innovation�improvements in
�nancial development�during the period.
Table 2 presents the cross-country regression results. First, the results on �nancial
innovation in regression (1) are consistent with the central prediction from our model. In
particular, the estimated value of b5 (the coe¢ cient on f) is not statistically di¤erent from zero,
but the estimated value of the coe¢ cient on the interaction between �nancial innovation, f , and
the deviation of GDP from U.S. GDP (y� y1), i.e., b6, enters negatively and signi�cantly. Theestimated economic e¤ect is large. A one-standard-deviation increase in �nancial innovation
(3.08), when evaluated at the mean of the income di¤erential with the leading country, (y�y1);(-1.37), implies an increase in growth relative to U.S. growth (g � g1) of 0.383. This is aboutone-�fth of the standard deviation of the growth di¤erential with the U.S. (1.7).
association and credit reporting was born. With the onset of credit scoring models, developed by engineer BillFair and mathematician Earl Isaac in the late 1950s who founded the Fair Isaac Corporation (producer of thewell-known FICO credit scores) and the passage of the 1968 Fair Credit Reporting Act in the US, private creditbureaus became an increasingly important provider of credit information.
24

Second, regression (1) also con�rms the AHM �ndings of a negative interaction between
�nancial development, F , and the deviation of initial per capita income from US per capita
income, (y � y1). The estimated value of b3 is negative and statistically signi�cant, while theestimated value of b1 is not signi�cantly di¤erent from zero. From the perspective of regression
(1), therefore, both the initial level of �nancial development and �nancial innovation help
account for convergence to the growth leader.9 As we demonstrate below, however, the results
on the level of �nancial development are not robust to using panel data techniques.
Third, the results hold when using the private credit bureau proxy of �nancial innovation.
The interaction between the credit bureau proxy of �nancial innovation and the deviation of
GDP from U.S. GDP (y�y1) enters negatively and signi�cantly at the ten percent level. Whenincorporating the private credit bureau variable as a proxy of �nancial innovation, the level of
�nancial development and its interaction with the deviation from U.S. GDP per capita do not
enter signi�cantly.
Fourth, as a falsi�cation test, we examine public credit registries. Credit information
sharing arrangements can be organized by the government (typically the central bank) in the
form of a public credit registry. Private credit bureaus, however, usually gather more informa-
tion and o¤er a broader range of services to lenders than public credit registries, according to
Jappelli and Pagano (2002). Consistent with this view, we �nd that the speed with which a
country creates a public credit bureau is unrelated to economic growth or convergence, while
the speed with which a country�s banks create a private credit bureau to better screen potential
entrepreneurs is associated with faster economic growth.
Fifth, Table 2 presents two sets of instrumental variables (IV) regressions to address
concerns about endogeneity between growth, �nancial development and �nancial innovation.
We follow AHM and use legal origin, L, and legal origin interacted with initial relative output
(L(y � y1)) as instrumental variables. Legal origin is a set of three dummy variables, �rstused by La Porta et al. (1997, 1998), indicating whether the country�s legal system is based
on French, English, German, or Scandinavian traditions. La Porta et al. (1997, 1998) argue
that legal origin explains variation in the protection of the rights of shareholders and creditors.
Levine et al. (2000) argue that legal origin constitutes a good set of instruments for �nancial
development because they are predetermined variables, have a bearing on the enforceability
of �nancial contracts, have a strong e¤ect on �nancial development, and should a¤ect growth
9Our theoretical model stresses the role of �nancial innovation. A fairly natural generalization of the modelwould yield an equation in which both the level of �nancial development and the rate of �nancial innovationindependently shape economic performance.
25
primarily though their impact on �nancial development. As additional instrumental variables,
we use a measure of the degree to which �nancial reforms ease restrictions on the operation
of the �nancial system, which might in turn encourage �nanciers to invest more in improving
the �nancial system. Speci�cally, we use the change over the period 1973-1995 in the Abiad
and Mody (2005) �nancial reform index, R, and its interaction with initial output di¤erences,
R(y � y1), as instruments. Abiad and Mody (2005) create an aggregate country-level indexof �nancial reform for a sample of 35 countries over the period 1973-1996 by aggregating six
subcomponents that each obtain a score between 0 and 3, with higher scores denoting more
liberalization. The six policy components relate to credit controls, interest rate controls, entry
barriers in the banking sector, operational restrictions, privatization in the �nancial sector, and
restrictions on international �nancial transactions. We use the relative change in this aggregate
index over the period 1973-1995 as proxy for �nancial deregulation at the country level.
Using an index of �nancial liberalization as an instrument is motivated by research on
how deregulation in the U.S. banking industry enhanced �nancial innovation and e¢ ciency. For
example, Silber (1983) and Kane (1983 and 1988) argued that �nancial deregulation was an
important underlying force behind U.S. �nancial sector innovations in the 1970s and early 1980s,
while Jayaratne and Strahan (1998) �nd that the U.S. banking industry became signi�cantly
more e¢ cient following �nancial deregulation during the 1980s. They show that non-interest
costs fell, wages fell, and loan losses fell after states deregulated branching.
As reported in columns (4) and (5) of Table 2, we assess the strength and validity of
the instrumental variables. To test the strength of our instruments, we use F -tests of joint
signi�cance of the excluded instruments in the �rst stage regressions of F , F (y � y1), f , andf(y � y1). As shown, the results generally reject the null hypothesis that the instruments donot explain variation in the endogenous variables. In the two IV speci�cations� one using
credit growth as a proxy for �nancial innovation and the second using the speed with which
a country�s banking system implemented a private credit bureau, the instruments reject the
�rst-stage F -test at the 10% level for three of the endogenous variables and for the fourth
instrumented regressor, the F -test has a p-value of 0.10. To further test the validity of the
instruments, we use the Hansen-Sargan test, where the null hypothesis is that the instruments
are uncorrelated with the second-stage residuals. As shown, the instruments do not reject the
Hansen-Sargan test, meaning that we do not reject the null hypothesis that the instruments
only explain growth through their in�uence on the speci�ed endogenous variables.
The IV results in Table 2 are consistent with those from the OLS speci�cations. The
26

interaction between �nancial innovation and the deviation of GDP from U.S. GDP enters
negatively and signi�cantly. This holds when measuring �nancial innovation as the growth
rate of private credit or as the speed with which a country�s banking system implemented a
private credit bureau. Consistent with the theoretical model, none of the other explanatory
variables enters signi�cantly. The IV estimated coe¢ cients are larger in absolute value than
the OLS coe¢ cient estimates on the interaction term between �nancial innovation and GDP
deviations. This di¤erence between the IV and OLS estimates is consistent with the presence of
measurement error bias in the OLS estimation. Speci�cally, if �nancial innovation is measured
erroneously and the true impact of �nancial innovation on growth is positive, the OLS estimate
will be biased toward zero. If the instruments are not correlated with the measurement error
in �nancial innovation, then IV estimates will be free from this bias.
Although these IV results are (i) supported by the F -test of excluded instruments and
the Hansen-Sargan test of overidentifying restrictions and (ii) consistent with both the theory
presented above and the results from the OLS estimates, there are several concerns. First,
there are severe di¢ culties in incorporating instrumental variables to separately identify four
interrelated endogenous variables for �nancial development and �nancial innovation and their
interaction terms. While not rejecting the Hansen-Sargan test, the �nancial reform index is not
a predetermined instrument. Unlike the legal origin instrumental variable, the reform index is
measured over the sample period, so that economic growth and changes in the functioning of
�nancial systems might alter the demand for �nancial reforms. Second, the other explanatory
variables might also be endogenously related to economic growth, suggesting the need for a still
fuller array of instruments. Third, in a pure cross-country setting, we cannot incorporate the
time-series variation into the analyses. For these reasons, we now turn to a panel estimator.
4.4 A panel GMM estimator
This section uses panel econometric techniques to examine the impact of �nancial innovation,
the level of �nancial development, and other potential growth determinants on the convergence
of countries to the growth path of the technological leader. We use panel techniques to (a)
control for simultaneity and omitted variable bias and (b) exploit the time-series dimension of
the data. We use the panel dataset from Levine et al (2000), which is a non-overlapping panel of
seven �ve-year intervals from 1960 to 1995. And, we use �rst-di¤erence Generalized-Method-of
Moments (GMM) estimator developed by Arrellano and Bond (1991).
More speci�cally, the panel version of equation (29) is given by
27

gi;t�g1i;t = b0+b1Fi;t+b2(yi;t�y1i;t)+b3Fi;t(yi;t�y1i;t)+b4Xi;t+b5fi;t+b6fi;t(yi;t�y1i;t)+�i+ui;t;(30)
where the t subscripts indicate the particular �ve-year period, so that t = 1; 2; : : : 7, for each
country i, data permitting, �i is the coe¢ cient on a country-speci�c e¤ect, and where we also
control for a time-speci�c e¤ect in each period . We refer to this as the levels equation.
Di¤erencing yields:
�[gi;t�g1i;t] = b1�Fi;t+b2�(yi;t�y1i;t)+b3�[Fi;t(yi;t�y1i;t)]+b4�Xi;t+b5�fi;t+b6�[fi;t(yi;t�y1i;t)]+�i+�ui;t;(31)
where �[gi;t � g1i;t] = [(gi;t � g1i;t)� (gi;t�1 � g1i;t�1)], �[Fi;t(yi;t � y1i;t)] = [Fi;t(yi;t � y1i;t))�(Fi;t�1(yi;t�1 � y1i;t�1 ];�ui;t = (ui;t � ui;t�1), etc.
Arrellano and Bond (1991) develop a di¤erence estimator under the assumptions that
(a) ui;t is not serially correlated and (b) the explanatory variables are uncorrelated with fu-
ture realizations of ui;t.10 As instrumental variables, they propose using lagged values of the
explanatory variables in levels, i.e., using the values of the explanatory variables from the
levels equation (equation (30)) as instruments for the explanatory variables in the di¤erence
equation (equation (31)).11 The consistency of this GMM estimator depends on the validity
of the assumption that the error terms do not exhibit serial correlation and on the validity
of the instruments. To assess these conditions, we use two speci�cation tests. The �rst is
the Hansen-Sargan test of over-identifying restrictions, which tests the overall validity of the
instruments by analyzing the sample analog of the moment conditions used in the estimation
10Using these moment conditions, Arellano and Bond (1991) propose a two-step GMM estimator. In the �rststep the error terms are assumed to be independent and homoskedastic across countries and over time. In thesecond step, the residuals obtained in the �rst step are used to construct a consistent estimate of the variance-covariance matrix, thus relaxing the assumptions of independence and homoskedasticity. The two-step estimatoris thus asymptotically more e¢ cient relative to the �rst-step estimator. We refer to the GMM estimator basedon these conditions as the di¤erence estimator.11We do not use the system GMM estimator developed by Arellano and Bover (1995) and Blundell and Bond
(1998), which jointly estimates the regression in di¤erences and in levels, because the validity of the additionalinstruments used by this estimator (relative to �rst-di¤erence GMM) is not supported by a Hansen-Sargan testof over-identifying restrictions.The additional instruments used in the system GMM estimator for the regressionin levels are the lagged values of the explanatory variables from the di¤erence equation. These are appropriateinstruments only if there is no correlation between the di¤erences of these variables and the country-speci�ce¤ect. The validity of the additional instruments in system GMM depends on the assumption that changes inthe instrumenting variables are uncorrelated with the �xed e¤ects. In particular, they require that throughoutthe sample period, country growth rates are not too far from their steady states, in the sense that deviationsfrom long-run means are not systematically related to �xed e¤ects.
28
process. The second test examines the hypothesis that the error term is not serially correlated.
We test whether the di¤erenced error term is second-order serially correlated (by construction,
the di¤erenced error term is �rst-order serially correlated even if the original error term is not).
Failure to reject the null hypotheses of both tests gives support to our model.
With one modi�cation, we use this GMM estimator to examine the impact of �nancial
innovation, the level of �nancial development, and other potential growth determinants on
economic growth. When moving to the panel data, there is (1) very little within-country
variation in GDP per capita di¤erences, (yi;t � y1i;t), across the �ve-year periods and (2)considerable within-country variation in the growth rate of private credit, f , over such periods
(associated with business-cycles and national banking system problems). In light of these
limitations, we split the sample between economies that are above and below the median GDP
per capita gap, (yi;t�y1i;t) and assess whether (1) �nancial innovation speeds economic growthand (2) �nancial innovation spurs the rate of growth more in countries that are farther, in
terms of GDP per capita, from the leading country.
4.5 Results: Panel GMM regression
Based on these panel data, Table 3 indicates that �nancial innovation is positively associated
with economic growth and the impact of �nancial innovation is stronger for countries farther
away from the growth path of the leading economy. Table 3 presents three regressions. The
�rst includes the full sample and the next two limits the sample to those observations for which
the log per capita income of the country minus the log per capita income of the United States
at the beginning of each �ve-year period is below�or above�the sample median for that period.
Thus, we di¤erentiate between countries "far" or "close" to the leading country. This provides
a test of the theory, which predicts that �nancial innovation will have a bigger e¤ect on growth
for economies farther away from the leading economy.
As shown at the bottom of Table 3, the regression analyses do not reject the hypothesis
that the instruments are valid. That is, the data do not reject the null hypotheses that (1) there
is no second-order serial correlation and (2) there is no correlation between the instruments
and errors in the second stage regressions.
While �nancial innovation, as measured by the growth rate of private credit to GDP
of each �ve-year period, is positively related to economic growth in all of the equations, it is
notably larger when restricting the sample to economies far from the economic leader. The
di¤erence between the estimated coe¢ cient in equation (2) for observations far from the leader
29
is statistically signi�cantly larger than the estimated coe¢ cient in equation (3) for observations
close to the leader at the 10 percent signi�cance level. The results indicate that a one standard
deviation increase in 5-year period �nancial innovation (0.095) will boost economic growth over
the same period by 0.76 percentage points for observations far from the leader (as compared
to 0.47 percentage points for observations close to the leader). This is a large e¤ect as the
standard deviation of real per capita growth rate across the sample over the same period is 2.9
percentage points.
These panel results complement the pure cross-country �ndings presented above and
the studies by Amore et al (2013), Chava et al (2013), and Beck et al (2013). Some may
raise concerns that �nancial innovation is a long-run phenomenon that cannot be usefully
examined using panel data based on �ve-year intervals. Without ignoring the limitations of
the panel approach, we simply o¤er it as one additional study to a growing array of evidence
that advertises the value of more carefully modeling the linkages between �nancial innovation
and economic growth.
5 Concluding Remarks
Historically, �nancial innovation has been a ubiquitous phenomenon of expanding economies.
Whether it is the development of new �nancial instruments, the formation of new �nancial
institutions, or the emergence of new �nancial reporting techniques, successful technological
innovations have typically required the invention of new �nancial arrangements. In this paper,
we model the joint, endogenous evolution of �nancial and technological innovation, focusing on
improvements in screening technologies of �nanciers.
We model technological and �nancial innovation as re�ecting the pro�t-maximizing de-
cisions of individuals and explore the implications for economic growth. We start with a
Schumpeterian endogenous growth model where entrepreneurs can earn monopoly pro�ts by
inventing better goods. Financiers screen the potential entrepreneurs. More importantly, they
engage in the costly and risky process of inventing better processes for screening entrepre-
neurs. Successful �nancial innovators are more e¤ective at screening entrepreneurs than the
standard screening methods available. Their increased e¢ ciency generates monopoly rents and
the economic motivation for �nancial innovation. Every particular screening process becomes
obsolete as technology advances. Consequently, technological innovation and economic growth
will eventually stop unless �nanciers innovate.
The predictions emerging from our model, in which �nancial and technological entrepre-
30

neurs interact to shape economic growth, �t cross-country data better than existing models of
�nancial development and growth. Rather than stressing the level of �nancial development, we
highlight the vital role of �nancial innovation in the process of economic growth. From a pol-
icy perspective, the analyses stress adaptability and innovation as key elements for sustaining
economic growth. Institutions, laws, regulations, and policies that impede �nancial innovation
slow technological change and economic growth.
31

References
[1] Abiad, Abdul, Mody, Ashoka. 2005. "Financial Reform: What Shakes It? What Shapesit?" American Economic Review 95, 66-88.
[2] Acharya, Viral, Naqvi, Hassan. 2012. "The seeds of a crisis: A theory of bank liquidityand risk taking over the business cycle" Journal of Financial Economics 103, 349-366.
[3] Aghion, Philippe, Howitt, Peter. 1992. "A Model of Growth through Creative Destruc-tion." Econometrica 60(2), 323-351.
[4] Aghion, Philippe, Howitt, Peter. 2009. The Economics of Growth. Cambridge, MA: MITPress.
[5] Aghion, Philippe, Howitt, Peter, Mayer-Foulkes, David. 2005. "The E¤ect of FinancialDevelopment on Convergence: Theory and Evidence." Quarterly Journal of Economics120(1), 323-351.
[6] Allen, Franklin, Gale, Douglas. 1988. "Optimal Security Design". Review of FinancialStudies 1, 229-263.
[7] Allen, Franklin, Gale, Douglas. 1991. "Arbitrage, Short Sales and Financial Innovation".Econometrica 59, 1041-1068.
[8] Allen, Franklin, Gale, Douglas. 1994. Financial Innovation and Risk Sharing. Cambridge,MA: Cambridge University Press.
[9] Amore, Mario, Schneider, Cedric, Zaldokas, Alminas. 2013, "Credit Supply and CorporateInnovation." Journal of Financial Economics, forthcoming.
[10] Arellano, Manuel, Bond, Stephen. 1991. "Some Tests of Speci�cation for Panel Data:Monte Carlo Evidence and an Application to Employment Equations." Review of Eco-nomic Studies 58, 277-297.
[11] Arellano, Manuel, Bover, Olympia. 1995. "Another Look at the Instrumental VariableEstimation of Error-Components Models." Journal of Econometrics 68, 29-51.
[12] Baskin, Jonathan B., Miranti, Paul J. Jr. 1997. A History of Corporate Finance. NewYork: Cambridge University Press.
[13] Benhabib, Jess, Spiegel, Mark, 2005, "Human capital and technology di¤usion." In:Philippe Aghion and Steven Durlauf, Eds., Handbook of Economic Growth, North-Holland:Elsevier Publishers.
[14] Beck, Thorsten, Chen, T., Lin, C., Song, R.M. 2012. "Financial Innovation: The Brightand the Dark Sides." Tilburg University, mimeo.
[15] Beck, Thorsten, Levine, Ross, Levkov, Alexey. 2010. �Big Bad Banks? The Winners andLosers from U.S. Branch Deregulation.�Journal of Finance 65, 1637-1667.
[16] Bencivenga, Valerie, Smith, Bruce. 1991. "Financial Intermediation and EndogenousGrowth." Review of Economics Studies 58, 195-209.
[17] Blundell, Richard, Bond, Stephen. 1998. "Initial Conditions and Moment Restrictions inDynamic Panel Data Models." Journal of Econometrics 87, 115-143.
32

[18] Bodenhorn, Howard. 2003. State Banking in Early America: A New Economic History.Cambridge University Press, New York.
[19] Bolton, Patrick, Freixas, Xavier, Shapiro, Joel. 2012. "The Credit Ratings Game." Journalof Finance, 67(1), 85-11.
[20] Boyd, John H., Prescott, Edward C. 1986. "Financial Intermediary-Coalitions." Journalof Economic Theory 38, 211-232.
[21] Braudel, Fernand. 1992. Civilization and Capitalism, 15th - 18th Centuries, Vol. II: TheWheels of Commerce. Berkeley, CA: University of California Press.
[22] Carosso, Vincent P. 1970. Investment Banking in America: A History. Cambridge, MA.:Harvard University Press.
[23] Chandler, Alfred D., Jr. 1965. "The Railroads: Pioneers in Modern Corporate Manage-ment." The Business History Review 39(1), 16-40.
[24] Chandler, Alfred D., Jr. 1977. The Visible Hand: The Managerial Revolution in AmericanBusiness. Cambridge, MA: Harvard University Press.
[25] Chava, Sudheer, Oetti, Alexander, Subramanian, Ajay, and Subramanian, Krishnamurthy2013. "Banking Deregulation and Innovation." Journal of Financial Economics, forthcom-ing.
[26] Dell�Ariccia, Giovanni, Igan, Deniz, Laeven, Luc. 2012. "Credit Booms and Lending Stan-dards: Evidence from the Subprime Mortgage Market." Journal of Money, Credit, andBanking 44, 367-384.
[27] Djankov, Simeon, McLiesh, Caralee, Shleifer, Andrei. 2007. "Private Credit in 129 Coun-tries." Journal of Financial Economics 84, 299-329.
[28] Gennaioli, Nicola, Shleifer, Andrei. 2007. "The Evolution of the Common Law." Journalof Political Economy 115(1): 43-67.
[29] Gennaioli, Nicola, Shleifer, Andrei, Vishny, Robert. 2012. Neglected Risks, Financial In-novation, and Financial Fragility, Journal of Financial Economics, 104, 452-468.
[30] Goetzmann, William N. 2009. Financing Civilization. mimeo, Yale University.
[31] Goetzmann, William N., Rouwenhorst, K. Geert. 2005. The Origins of Value: The Finan-cial Innovations that Created Modern Finance. New York: Oxford University Press.
[32] Gompers, Paul, Lerner, Josh. 2001. "The Venture Capital Revolution." Journal of Eco-nomic Perspectives 2(1), 145-168.
[33] Greenspan, Alan. 2010. Testimony before the Financial Crisis Inquiry Commission. April7, 2010.
[34] Greenwood, Jeremy, Jovanovic, Boyan. 1990. "Financial Development, Growth, and theDistribution of Income." Journal of Political Economy. 98, 1076-1107.
[35] Greenwood, Jeremy, Sanchez, Juan M., Wang, Cheng. 2010. "Financial Development: TheRole of Information Costs." American Economic Review 100, 1875-1891.
33
[36] Henderson, B., Pearson, N., 2010. "The Dark Side of Financial Innovation: A Case Studyof the Pricing of Retail Financial Products." Journal of Financial Economics 100(2), 227-247.
[37] Jappelli, Tulio, Pagano, Marco. 2002, "Information Sharing, Lending, and Defaults: Cross-Country Evidence." Journal of Banking and Finance 26, 2017-2045.
[38] Jayaratne, Jith, Strahan, Philip E. 1998. "Entry Restrictions, Industry Evolution, andDynamic E¢ ciency: Evidence from Commercial Banking." Journal of Law and Economics41, 239-273.
[39] Kane, Edward, 1983, "Policy Implications of Structural Changes in Financial Markets."American Economic Review 73, 96-100.
[40] Kane, Edward, 1988, "Interaction of Financial and Regulatory Innovation." AmericanEconomic Review 78, 328-334.
[41] Kerr, William, Nanda, Ramana. 2009. "Democratizing Entry: Banking Deregulations,Financing Constraints, and Entrepreneurship." Journal of Financial Economics 94(1),124-149.
[42] Keys, Benjamin, Mukherjee, Tanmoy, Seru, Amit, Vig, Vikrant. 2010. "Did SecuritizationLead to Lax Screening? Evidence from Subprime Loans." Quarterly Journal of Economics125, 1-45.
[43] King, Robert, Levine, Ross. 1993a. "Finance, Entrepreneurship, and Growth: Theory andEvidence." Journal of Monetary Economics 32, 513-542.
[44] King, Robert, Levine, Ross. 1993b. "Finance and Growth: Schumpeter Might be Right."Quarterly Journal of Economics 103, 717-737.
[45] Levine, Ross, Norman Loayza, and Thorsten Beck. 2000. "Financial Intermediation andGrowth: Causality and Causes." Journal of Monetary Economics 66, 31-77.
[46] Levine, Ross. 1991. "Stock Markets, Growth, and Tax Policy." Journal of Finance 46,1445-1465.
[47] Levine, Ross. 2005a. "Finance and Growth: Theory and Evidence." In: Handbook ofEconomic Growth, Eds: Philippe Aghion and Steven N. Durlauf. Elsevier North-Holland.Publishers. 866-934.
[48] Levine, Ross. 2005b. �Law, Endowments, and Property Rights.� Journal of EconomicPerspectives 19, 61-88.
[49] Loutskina, Elena, Strahan, Philip E. 2009. "Securitization and the Decline of Bank Financeon Loan Supply: Evidence from Mortgage Originations." Journal of Finance 64, 861-889.
[50] Malmendier, Ulrike. 2009. "Law and Finance at the Origin." Journal of Economic Liter-ature 47, 1076-1108.
[51] Mian, Atif, Su�, Amir. 2009. "The Consequences of Mortgage Credit Expansion: Evidencefrom the 2007 Mortgage Default Crisis." Quarterly Journal of Economics 124, 1449-1496.
[52] Neal, Larry. 1990. The Rise of Financial Capitalism: International Capital Markets in theAge of Reason. New York: Cambridge University Press.
34
[53] Romer, Paul M. 1990. "Endogenous Technological Change." Journal of Political Economy98, S71-102.
[54] Schweitzer, Stuart. 2006. Pharmaceutical Economics and Policy. New York: Oxford Uni-versity Press.
[55] Shleifer, Andrei, Vishny, Robert, 2010. "Unstable Banking." Journal of Financial Eco-nomics 97(3), 306-318.
[56] Silber, William L. 1983. "The Process of Financial Innovation." American Economic Re-view 73, 89-95.
[57] Thakor, Anjan. 2012. "Incentives to Innovate and Finance Crises." Journal of FinancialEconomics 103(1), 130-148.
[58] Tufano, Peter. 2003. "Financial Innovation." In: Handbook of the Economics of Finance(Volume 1a: Corporate Finance). Eds: George Constantinidis, Milton Harris, and ReneStulz. Elsevier North-Holland. 307-336.
35
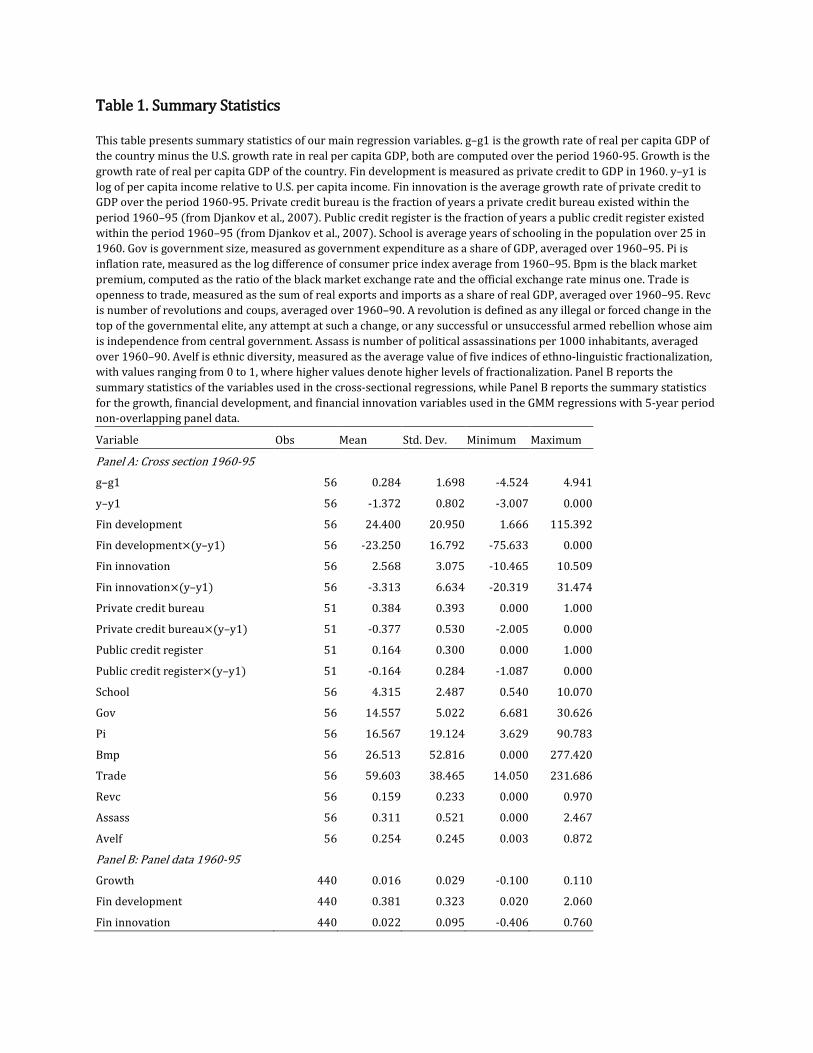
Table 1. Summary Statistics This table presents summary statistics of our main regression variables. g–g1 is the growth rate of real per capita GDP of the country minus the U.S. growth rate in real per capita GDP, both are computed over the period 1960-95. Growth is the growth rate of real per capita GDP of the country. Fin development is measured as private credit to GDP in 1960. y–y1 is log of per capita income relative to U.S. per capita income. Fin innovation is the average growth rate of private credit to GDP over the period 1960-95. Private credit bureau is the fraction of years a private credit bureau existed within the period 1960–95 (from Djankov et al., 2007). Public credit register is the fraction of years a public credit register existed within the period 1960–95 (from Djankov et al., 2007). School is average years of schooling in the population over 25 in 1960. Gov is government size, measured as government expenditure as a share of GDP, averaged over 1960–95. Pi is inflation rate, measured as the log difference of consumer price index average from 1960–95. Bpm is the black market premium, computed as the ratio of the black market exchange rate and the official exchange rate minus one. Trade is openness to trade, measured as the sum of real exports and imports as a share of real GDP, averaged over 1960–95. Revc is number of revolutions and coups, averaged over 1960–90. A revolution is defined as any illegal or forced change in the top of the governmental elite, any attempt at such a change, or any successful or unsuccessful armed rebellion whose aim is independence from central government. Assass is number of political assassinations per 1000 inhabitants, averaged over 1960–90. Avelf is ethnic diversity, measured as the average value of five indices of ethno-linguistic fractionalization, with values ranging from 0 to 1, where higher values denote higher levels of fractionalization. Panel B reports the summary statistics of the variables used in the cross-sectional regressions, while Panel B reports the summary statistics for the growth, financial development, and financial innovation variables used in the GMM regressions with 5-year period non-overlapping panel data.
Variable Obs Mean Std. Dev. Minimum Maximum
Panel A: Cross section 1960-95 g–g1 56 0.284 1.698 -4.524 4.941
y–y1 56 -1.372 0.802 -3.007 0.000
Fin development 56 24.400 20.950 1.666 115.392
Fin development×(y–y1) 56 -23.250 16.792 -75.633 0.000
Fin innovation 56 2.568 3.075 -10.465 10.509
Fin innovation×(y–y1) 56 -3.313 6.634 -20.319 31.474
Private credit bureau 51 0.384 0.393 0.000 1.000
Private credit bureau×(y–y1) 51 -0.377 0.530 -2.005 0.000
Public credit register 51 0.164 0.300 0.000 1.000
Public credit register×(y–y1) 51 -0.164 0.284 -1.087 0.000
School 56 4.315 2.487 0.540 10.070
Gov 56 14.557 5.022 6.681 30.626
Pi 56 16.567 19.124 3.629 90.783
Bmp 56 26.513 52.816 0.000 277.420
Trade 56 59.603 38.465 14.050 231.686
Revc 56 0.159 0.233 0.000 0.970
Assass 56 0.311 0.521 0.000 2.467
Avelf 56 0.254 0.245 0.003 0.872
Panel B: Panel data 1960-95 Growth 440 0.016 0.029 -0.100 0.110
Fin development 440 0.381 0.323 0.020 2.060
Fin innovation 440 0.022 0.095 -0.406 0.760
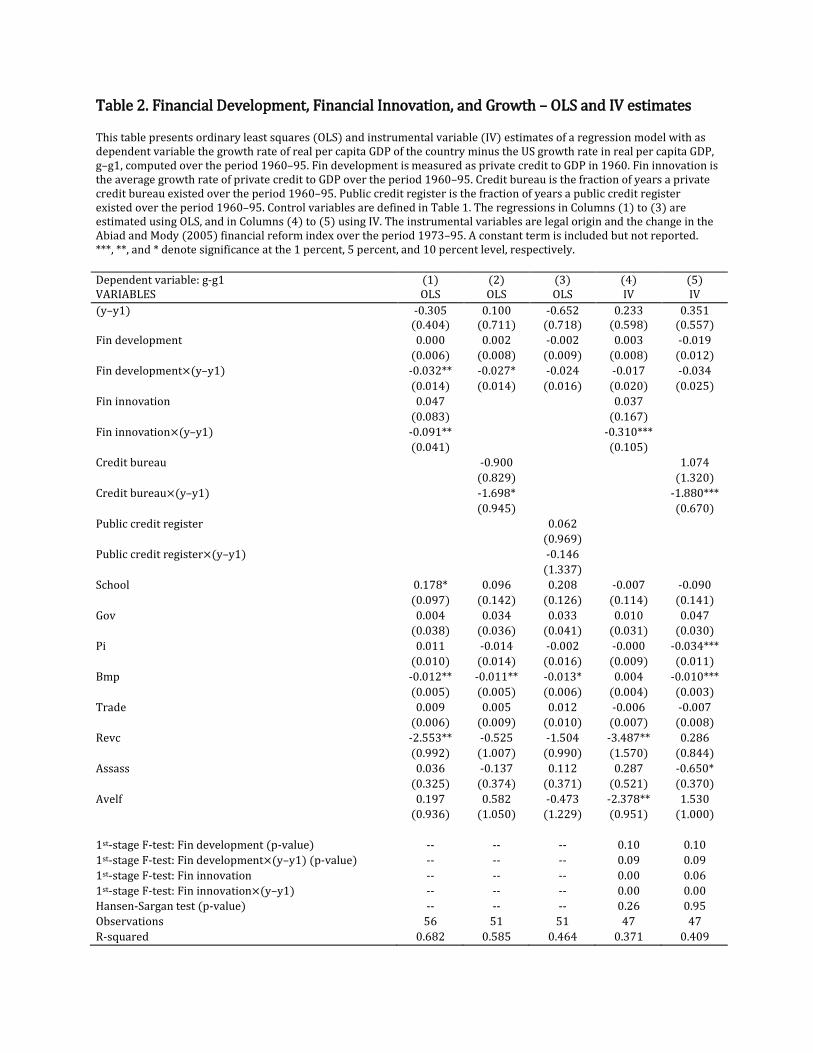
Table 2. Financial Development, Financial Innovation, and Growth – OLS and IV estimates This table presents ordinary least squares (OLS) and instrumental variable (IV) estimates of a regression model with as dependent variable the growth rate of real per capita GDP of the country minus the US growth rate in real per capita GDP, g–g1, computed over the period 1960–95. Fin development is measured as private credit to GDP in 1960. Fin innovation is the average growth rate of private credit to GDP over the period 1960–95. Credit bureau is the fraction of years a private credit bureau existed over the period 1960–95. Public credit register is the fraction of years a public credit register existed over the period 1960–95. Control variables are defined in Table 1. The regressions in Columns (1) to (3) are estimated using OLS, and in Columns (4) to (5) using IV. The instrumental variables are legal origin and the change in the Abiad and Mody (2005) financial reform index over the period 1973–95. A constant term is included but not reported. ***, **, and * denote significance at the 1 percent, 5 percent, and 10 percent level, respectively. Dependent variable: g-g1 (1) (2) (3) (4) (5) VARIABLES OLS OLS OLS IV IV (y–y1) -0.305 0.100 -0.652 0.233 0.351 (0.404) (0.711) (0.718) (0.598) (0.557) Fin development 0.000 0.002 -0.002 0.003 -0.019 (0.006) (0.008) (0.009) (0.008) (0.012) Fin development×(y–y1) -0.032** -0.027* -0.024 -0.017 -0.034 (0.014) (0.014) (0.016) (0.020) (0.025) Fin innovation 0.047 0.037 (0.083) (0.167) Fin innovation×(y–y1) -0.091** -0.310*** (0.041) (0.105) Credit bureau -0.900 1.074 (0.829) (1.320) Credit bureau×(y–y1) -1.698* -1.880*** (0.945) (0.670) Public credit register 0.062 (0.969) Public credit register×(y–y1) -0.146 (1.337) School 0.178* 0.096 0.208 -0.007 -0.090 (0.097) (0.142) (0.126) (0.114) (0.141) Gov 0.004 0.034 0.033 0.010 0.047 (0.038) (0.036) (0.041) (0.031) (0.030) Pi 0.011 -0.014 -0.002 -0.000 -0.034*** (0.010) (0.014) (0.016) (0.009) (0.011) Bmp -0.012** -0.011** -0.013* 0.004 -0.010*** (0.005) (0.005) (0.006) (0.004) (0.003) Trade 0.009 0.005 0.012 -0.006 -0.007 (0.006) (0.009) (0.010) (0.007) (0.008) Revc -2.553** -0.525 -1.504 -3.487** 0.286 (0.992) (1.007) (0.990) (1.570) (0.844) Assass 0.036 -0.137 0.112 0.287 -0.650* (0.325) (0.374) (0.371) (0.521) (0.370) Avelf 0.197 0.582 -0.473 -2.378** 1.530 (0.936) (1.050) (1.229) (0.951) (1.000) 1st-stage F-test: Fin development (p-value) -- -- -- 0.10 0.10 1st-stage F-test: Fin development×(y–y1) (p-value) -- -- -- 0.09 0.09 1st-stage F-test: Fin innovation -- -- -- 0.00 0.06 1st-stage F-test: Fin innovation×(y–y1) -- -- -- 0.00 0.00 Hansen-Sargan test (p-value) -- -- -- 0.26 0.95 Observations 56 51 51 47 47 R-squared 0.682 0.585 0.464 0.371 0.409

Table 3. Financial Development, Financial Innovation, and Growth – GMM estimates This table presents first-difference GMM dynamic panel estimates of a regression model with the 5-year average growth rate of real per capita GDP of the country as dependent variable. The panel data set consists of non-overlapping periods of 5 years each for 77 countries for the period 1960-1995. Log per capita income of the country at the beginning of each 5-year period. Fin development is private credit to GDP averaged over each 5-year period. Fin innovation is the average growth rate of private credit to GDP over each 5-year period. School is average years of schooling in the population over 25 averaged over each 5-year period. Gov is government size, measured as government expenditure as a share of GDP, averaged over each 5-year period. Pi is inflation rate, measured as the log difference of consumer price index averaged over each 5-year period. Bmp is the black market premium averaged over each 5-year period. Trade is openness to trade, measured as the sum of real exports and imports as a share of real GDP, averaged over each 5-year period. The regression in column (2) limits the sample to those observations for which the log per capita income of the country minus the log per capita income of the U.S. per capita income at the beginning of each 5-year period is below the sample median. The regression in column (3) limits the sample to those observations for which the log per capita income of the country minus the log per capita income of the U.S. per capita income at the beginning of each 5-year period is equal to or above the sample median. The United States, the leader, is excluded from the sample. Year effects and a constant are included but not reported. For each time period, we use all available lags of the specified variables in levels dated t-2 as instruments in the differences equation. ***, **, and * denote significance at the 1 percent, 5 percent, and 10 percent level, respectively. Dependent variable: Growth (1) (2) (3)
Full sample Far from leader Close to leader
Log per capita income -0.116*** -0.100*** -0.114***
(0.036) (0.031) (0.026)
Fin development 0.046 0.077 -0.036
(0.054) (0.0725) (0.0407)
Fin innovation 0.063** 0.080** 0.049*
(0.030) (0.035) (0.028)
School -0.000 0.010 0.005
(0.012) (0.011) (0.009)
Gov 0.106 0.173 -0.291*
(0.100) (0.113) (0.162)
Pi -0.002 -0.002 -0.007
(0.020) (0.026) (0.023)
Bmp 0.000 0.000 -0.003
(0.001) (0.002) (0.004)
Trade 0.051* 0.013 0.063*
(0.030) (0.032) (0.033)
Second-order serial correlation (p-value) 0.635 0.996 0.204 Hansen-Sargan test (p-value) 0.365 0.501 0.623 Observations 362 171 191 Number of countries 77 45 40
Related Documents