ERIA-DP-2020-17 ERIA Discussion Paper Series No. 344 Financial Inclusion and Savings in Indonesia Rashesh SHRESTHA 1 Economist, ERIA Samuel NURSAMSU 2 Economist, PROSPERA September 2020 Abstract: This paper discusses the status of financial inclusion in Indonesia and examines the impact of financial inclusion – based on availability of bank branches on household outcomes – in Indonesia. Based on analysis of the World Bank’s Financial Inclusion Survey (FINDEX) data, Indonesia has made some progress on expanding financial inclusion. The share of individuals with bank accounts rose from less than 20% to just under 50% in 2017. Interestingly, while the gain between 2011 and 2014 was greater for individuals in the upper 60 percentile of income, the gains between 2014 and 2017 were more pro-poor. This progress was made possible due to concerted government efforts to expand financial inclusion. In our empirical analysis, we study how financial inclusion enables households with income gains into savings for assets and earnings. Using the Indonesian Family Life Survey data, we find that living in areas with high density of bank branches helps poor households accumulate savings. The marginal effect of financial inclusion on savings is highest amongst the households in the bottom quintile of per capita consumption distribution. Thus, access to formal financial institutions can lead to improvement in household welfare. Keywords: Financial inclusion, savings, Indonesia JEL Classifications: G20, D14, I31 1 Economist, Economic Research Institute for ASEAN and East Asia (ERIA). Email: [email protected]. 2 Economist, Prospera. Email: [email protected].

Welcome message from author
This document is posted to help you gain knowledge. Please leave a comment to let me know what you think about it! Share it to your friends and learn new things together.
Transcript

ERIA-DP-2020-17
ERIA Discussion Paper Series
No. 344
Financial Inclusion and Savings in Indonesia
Rashesh SHRESTHA1
Economist, ERIA
Samuel NURSAMSU2
Economist, PROSPERA
September 2020
Abstract: This paper discusses the status of financial inclusion in Indonesia
and examines the impact of financial inclusion – based on availability of bank
branches on household outcomes – in Indonesia. Based on analysis of the
World Bank’s Financial Inclusion Survey (FINDEX) data, Indonesia has made
some progress on expanding financial inclusion. The share of individuals with
bank accounts rose from less than 20% to just under 50% in 2017.
Interestingly, while the gain between 2011 and 2014 was greater for
individuals in the upper 60 percentile of income, the gains between 2014 and
2017 were more pro-poor. This progress was made possible due to concerted
government efforts to expand financial inclusion. In our empirical analysis, we
study how financial inclusion enables households with income gains into
savings for assets and earnings. Using the Indonesian Family Life Survey
data, we find that living in areas with high density of bank branches helps
poor households accumulate savings. The marginal effect of financial
inclusion on savings is highest amongst the households in the bottom quintile
of per capita consumption distribution. Thus, access to formal financial
institutions can lead to improvement in household welfare.
Keywords: Financial inclusion, savings, Indonesia
JEL Classifications: G20, D14, I31
1Economist, Economic Research Institute for ASEAN and East Asia (ERIA). Email:
[email protected]. 2Economist, Prospera. Email: [email protected].
2
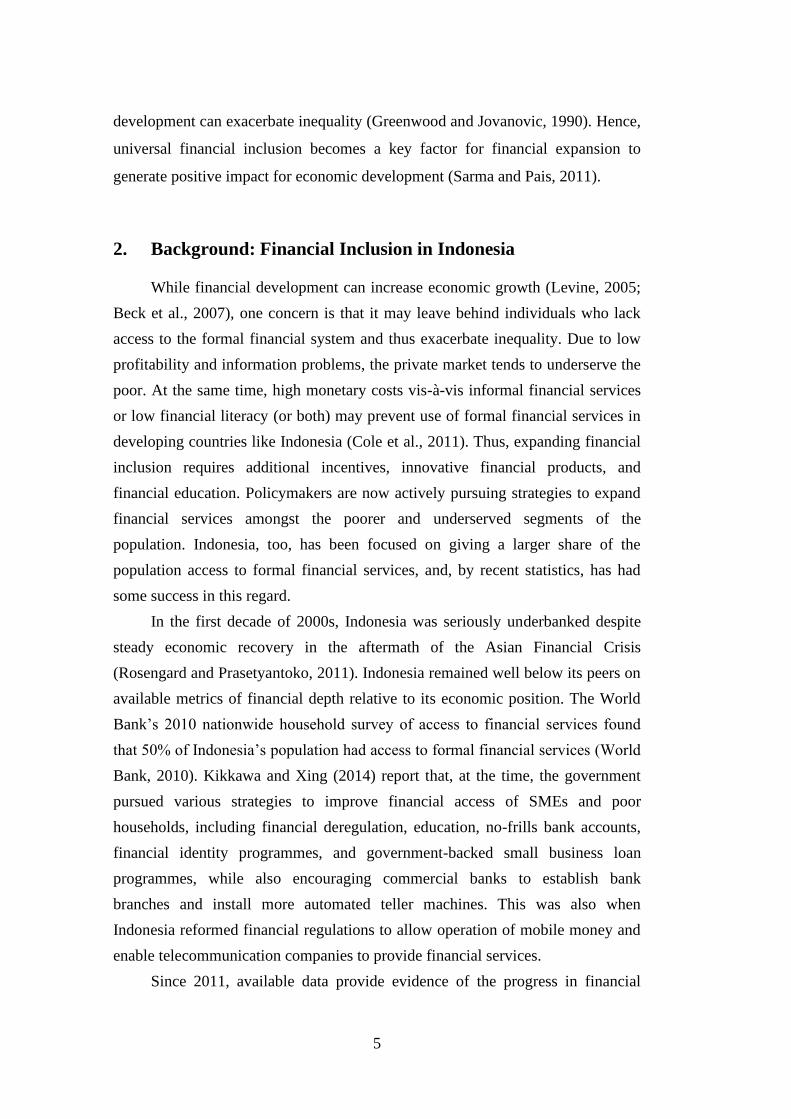
1. Introduction
Financial inclusion can contribute towards poverty alleviation by enabling
poor households to use products and services of formal financial institutions to
optimally save, invest, and manage risks, and to benefit from the financial
deepening of the broader economy. The benefits of financial products are well
known (Beck and Demirgüç-Kunt, 2006; Karlan and Morduch, 2010): with
savings, households can accumulate assets, which in turn can enable them to
invest in capital and access credit. If they can obtain credit at a reasonable interest
rate, they can make profitable investments and grow their enterprise. With
insurance, poor households can insure against unanticipated income and health
shocks due to environmental conditions (e.g. inclement weather, pollution, natural
disasters, etc), macroeconomic upheaval (recession, financial crisis), or other
reasons. Currently, many poor households rely on informal sources to meet their
financial needs—borrowing from family and friends or village moneylenders that
charge exorbitant fees, and saving in informal groups. These sources are usually
costly, inadequate, risky, and insufficiently regulated, which may lead to
exploitation. Recognising the importance of access to formal finance in improving
household welfare, many developing countries have been emphasising financial
inclusion over the past decade.
Focused financial inclusion policies have met with some success in
encouraging bank account openings, which remain the most basic financial
service. However, existing studies find that while opening a bank account is an
important first step towards financial inclusion, it does not reliably translate into
usage. When poor households were offered opportunity to open a savings account
at low cost, Prina (2015) found high frequency of usage amongst new account
holders in Nepal. However, a similar intervention in three African countries by
Dupas et al. (2018) found that new bank account holders did not actively use
them. Lack of income was an important barrier in the latter setting. This suggests
income growth and financial inclusion interact positively to improve welfare. The
question then is whether financial inclusion in a high growth economic
environment enables households to make investments that puts them in a stable
trajectory of welfare gains.

3
This paper studies the relationship between financial inclusion and
household savings in Indonesia, a setting with rapid economic growth and
concerted government effort to expand financial inclusion over the past decade.
The setting allows us to explore how financial inclusion translates income growth
into accumulation of financial assets. Indonesia has consistently grown at over
5.5% per year over the past decade, with nominal income per capita rising by
US$1,300 between 2006 and 2016, an increase of 50% (see Figure 1). The
additional income would have enabled households to expand their consumption
and move out of poverty. Indeed, the World Bank estimated that during this
period poverty headcount fell from 22.5% to 6.5%.3 Nonetheless, many
households in Indonesia remain vulnerable to falling back into poverty, and rising
inequality is a concern, making inclusivity an important policy concern (Tim
Nasional Percepatan Penanggulangan Kemiskinan 2018). Thus, understanding the
relationship between financial inclusion and savings behaviour can contribute to
the discussion about sustained poverty alleviation.
Figure 1. Indonesia's Real GDP per capita
(in 2010 US$)
3 This is based on a US$1.9 per day poverty line. Data are available at
http://povertydata.worldbank.org/poverty/country/IDN. This is different from the Indonesian
Central Statistical Agency’s estimation of poverty headcount rate based on the national poverty
line, which was 12.52% in 2007 and 10% in 2016.
GDP = gross domestic product.
Source: Authors’ calculation from World Development Indicators.

4
We use the Indonesian Family Life Survey (IFLS) data on household
income, assets, consumption, and economic characteristics. The same households
can be observed at two points in time, that is, 2007 and 2014, which allows
investigating how households with different characteristics benefit from financial
inclusion. We focus on households whose baseline characteristics (in 2007) made
them likely to experience income growth during the 2007–14 period, and study
variation in savings in 2014 by level of financial inclusion. To measure the level
of financial inclusion of the households, we construct a sub-district (kecamatan)4
index derived from the density of bank branches. The calculation follows the
methodology of Sarma and Pais (2014) and uses the 2014 Village Potential
Survey (PODES) data.
We find that poor households have higher probability of owning a savings
account if they live in areas with a higher density of bank branches. According to
our baseline results, a 0.1 increase in index of financial inclusion (whose average
value in the sample is 0.23) increases the probability of savings ownership by 2.9
percentage points amongst the poorest consumption quintile households in 2014
(the sample savings rate amongst the poorest quintile is 14%). The marginal effect
on each of the four higher quintiles is approximately equal to 1.3%. Using
different proxies for household welfare level (for example, education level of the
household head) does not alter the main inference. Thus, access to formal
financial institutions can be most beneficial to increase savings amongst the
poorest households.
The paper contributes to our understanding of the role of financial inclusion
in moving households securely out of poverty by enabling them to accumulate
savings and other assets. The importance of savings on household welfare has
been well-argued in the literature (Karlan et al., 2010). This is especially
important in Indonesia given the vulnerability of many non-poor households to
many types of shocks and lack of access to financial services for a sizable
population. With rising income, Indonesia is also facing increasing inequality. It
has been argued that as the country becomes more advanced, financial
4 Kecamatans are the third-level sub-national administrative units in Indonesia, after provinces and
districts. In 2014, there were 7,024 sub-districts, with the median sub-district comprising 6,500
families.
5
development can exacerbate inequality (Greenwood and Jovanovic, 1990). Hence,
universal financial inclusion becomes a key factor for financial expansion to
generate positive impact for economic development (Sarma and Pais, 2011).
2. Background: Financial Inclusion in Indonesia
While financial development can increase economic growth (Levine, 2005;
Beck et al., 2007), one concern is that it may leave behind individuals who lack
access to the formal financial system and thus exacerbate inequality. Due to low
profitability and information problems, the private market tends to underserve the
poor. At the same time, high monetary costs vis-à-vis informal financial services
or low financial literacy (or both) may prevent use of formal financial services in
developing countries like Indonesia (Cole et al., 2011). Thus, expanding financial
inclusion requires additional incentives, innovative financial products, and
financial education. Policymakers are now actively pursuing strategies to expand
financial services amongst the poorer and underserved segments of the
population. Indonesia, too, has been focused on giving a larger share of the
population access to formal financial services, and, by recent statistics, has had
some success in this regard.
In the first decade of 2000s, Indonesia was seriously underbanked despite
steady economic recovery in the aftermath of the Asian Financial Crisis
(Rosengard and Prasetyantoko, 2011). Indonesia remained well below its peers on
available metrics of financial depth relative to its economic position. The World
Bank’s 2010 nationwide household survey of access to financial services found
that 50% of Indonesia’s population had access to formal financial services (World
Bank, 2010). Kikkawa and Xing (2014) report that, at the time, the government
pursued various strategies to improve financial access of SMEs and poor
households, including financial deregulation, education, no-frills bank accounts,
financial identity programmes, and government-backed small business loan
programmes, while also encouraging commercial banks to establish bank
branches and install more automated teller machines. This was also when
Indonesia reformed financial regulations to allow operation of mobile money and
enable telecommunication companies to provide financial services.
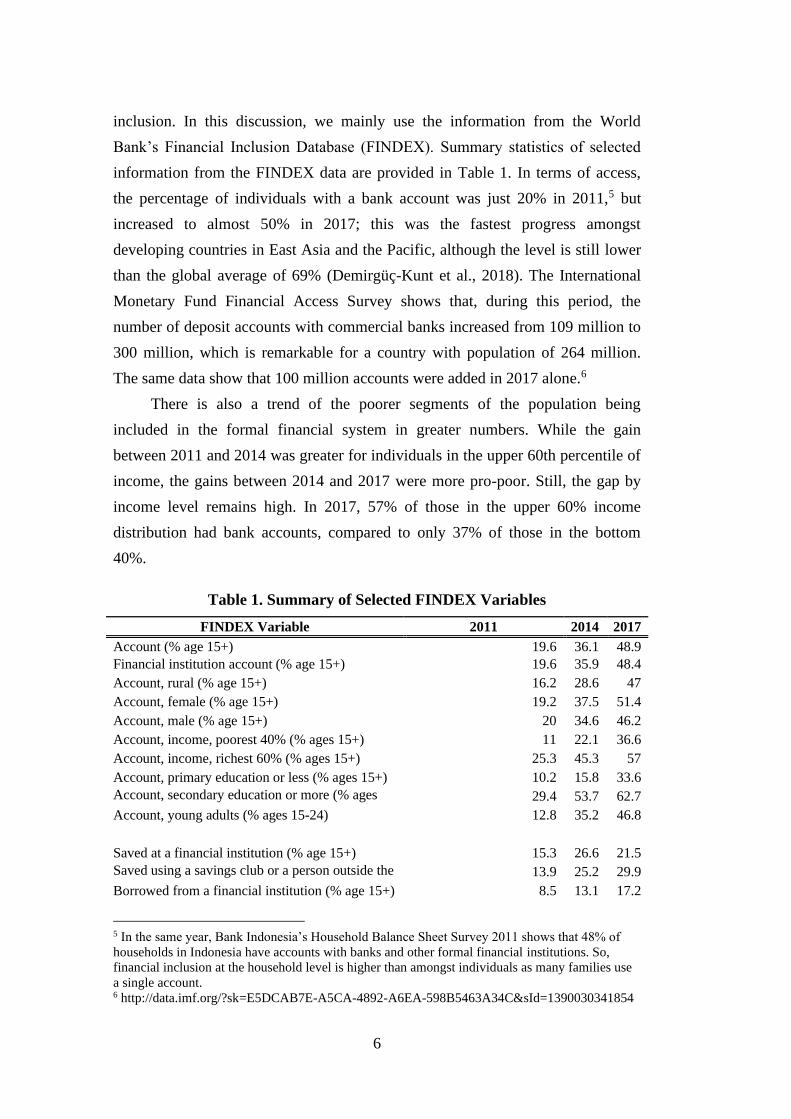
Since 2011, available data provide evidence of the progress in financial
6
inclusion. In this discussion, we mainly use the information from the World
Bank’s Financial Inclusion Database (FINDEX). Summary statistics of selected
information from the FINDEX data are provided in Table 1. In terms of access,
the percentage of individuals with a bank account was just 20% in 2011,5 but
increased to almost 50% in 2017; this was the fastest progress amongst
developing countries in East Asia and the Pacific, although the level is still lower
than the global average of 69% (Demirgüç-Kunt et al., 2018). The International
Monetary Fund Financial Access Survey shows that, during this period, the
number of deposit accounts with commercial banks increased from 109 million to
300 million, which is remarkable for a country with population of 264 million.
The same data show that 100 million accounts were added in 2017 alone.6
There is also a trend of the poorer segments of the population being
included in the formal financial system in greater numbers. While the gain
between 2011 and 2014 was greater for individuals in the upper 60th percentile of
income, the gains between 2014 and 2017 were more pro-poor. Still, the gap by
income level remains high. In 2017, 57% of those in the upper 60% income
distribution had bank accounts, compared to only 37% of those in the bottom
40%.
Table 1. Summary of Selected FINDEX Variables
FINDEX Variable 2011 2014 2017
Account (% age 15+) 19.6 36.1 48.9
Financial institution account (% age 15+) 19.6 35.9 48.4
Account, rural (% age 15+) 16.2 28.6 47
Account, female (% age 15+) 19.2 37.5 51.4
Account, male (% age 15+) 20 34.6 46.2
Account, income, poorest 40% (% ages 15+) 11 22.1 36.6
Account, income, richest 60% (% ages 15+) 25.3 45.3 57
Account, primary education or less (% ages 15+) 10.2 15.8 33.6
Account, secondary education or more (% ages
15+) 29.4 53.7 62.7
Account, young adults (% ages 15-24) 12.8 35.2 46.8
Saved at a financial institution (% age 15+) 15.3 26.6 21.5
Saved using a savings club or a person outside the
family (% age 15+) 13.9 25.2 29.9
Borrowed from a financial institution (% age 15+) 8.5 13.1 17.2
5 In the same year, Bank Indonesia’s Household Balance Sheet Survey 2011 shows that 48% of
households in Indonesia have accounts with banks and other formal financial institutions. So,
financial inclusion at the household level is higher than amongst individuals as many families use
a single account. 6 http://data.imf.org/?sk=E5DCAB7E-A5CA-4892-A6EA-598B5463A34C&sId=1390030341854
7
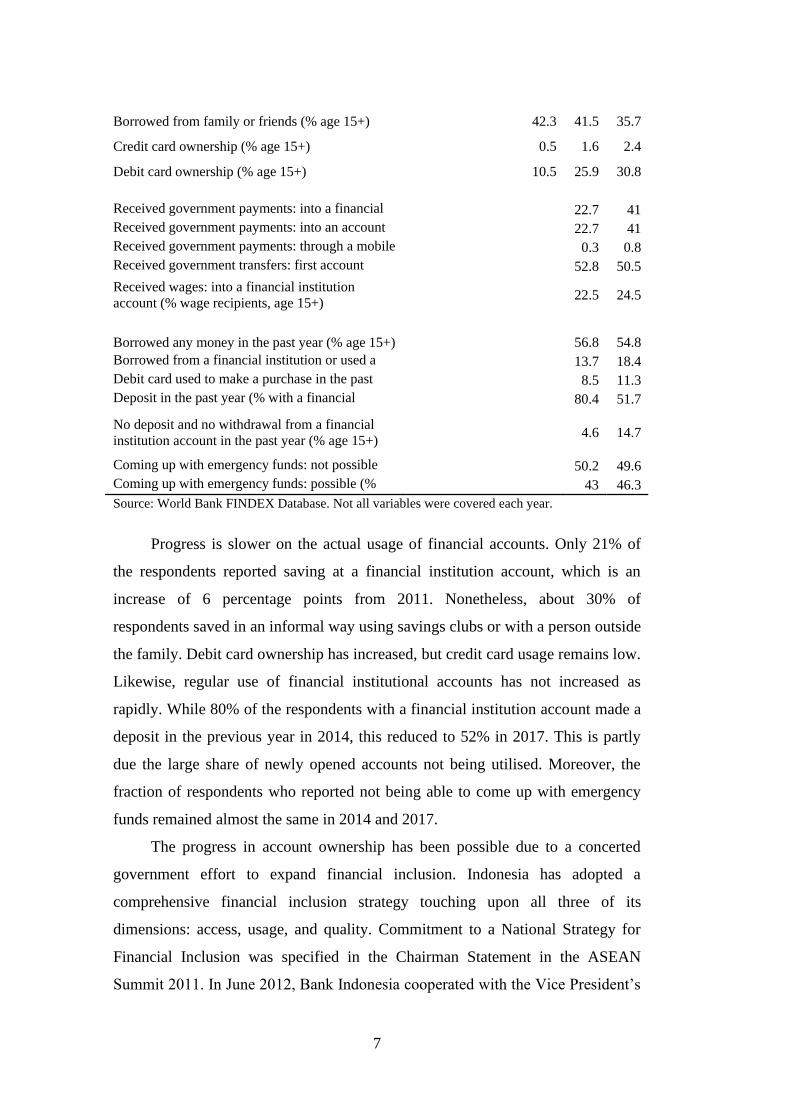
Borrowed from family or friends (% age 15+) 42.3 41.5 35.7
Credit card ownership (% age 15+) 0.5 1.6 2.4
Debit card ownership (% age 15+) 10.5 25.9 30.8
Received government payments: into a financial
institution account (% payment recipients, age
15+)
22.7 41
Received government payments: into an account
(% payment recipients, age 15+)
22.7 41
Received government payments: through a mobile
phone (% payment recipients, age 15+)
0.3 0.8
Received government transfers: first account
opened to receive government transfers (%
receiving transfers into an account, age 15+)
52.8 50.5
Received wages: into a financial institution
account (% wage recipients, age 15+) 22.5 24.5
Borrowed any money in the past year (% age 15+) 56.8 54.8
Borrowed from a financial institution or used a
credit card (% age 15+)
13.7 18.4
Debit card used to make a purchase in the past
year (% age 15+)
8.5 11.3
Deposit in the past year (% with a financial
institution account, age 15+)
80.4 51.7
No deposit and no withdrawal from a financial
institution account in the past year (% age 15+) 4.6 14.7
Coming up with emergency funds: not possible
(% age 15+)
50.2 49.6
Coming up with emergency funds: possible (%
age 15+) 43 46.3
Source: World Bank FINDEX Database. Not all variables were covered each year.
Progress is slower on the actual usage of financial accounts. Only 21% of
the respondents reported saving at a financial institution account, which is an
increase of 6 percentage points from 2011. Nonetheless, about 30% of
respondents saved in an informal way using savings clubs or with a person outside
the family. Debit card ownership has increased, but credit card usage remains low.
Likewise, regular use of financial institutional accounts has not increased as
rapidly. While 80% of the respondents with a financial institution account made a
deposit in the previous year in 2014, this reduced to 52% in 2017. This is partly
due the large share of newly opened accounts not being utilised. Moreover, the
fraction of respondents who reported not being able to come up with emergency
funds remained almost the same in 2014 and 2017.
The progress in account ownership has been possible due to a concerted
government effort to expand financial inclusion. Indonesia has adopted a
comprehensive financial inclusion strategy touching upon all three of its
dimensions: access, usage, and quality. Commitment to a National Strategy for
Financial Inclusion was specified in the Chairman Statement in the ASEAN
Summit 2011. In June 2012, Bank Indonesia cooperated with the Vice President’s
8
Secretariat - National Team of Poverty Alleviation Acceleration (TNP2K) and
Fiscal Policy Agency of Ministry of Finance to issue a National Strategy for
Financial Inclusion. The National Strategy, promulgated as Presidential
Regulation 82/2016,7 set an ambitious target of covering 75% of the adult
population by formal financial institutions by 2019. The progress towards this
goal is tracked by a specially designed National Financial Literacy and Inclusion
Survey, which shows a higher rate of financial inclusion at 68% in 2016, with
bank account ownership at 63.6%. To coordinate various government agencies,
Indonesia has established a National Secretariat for Financial Inclusion, an inter-
governmental body comprised of Indonesia’s Financial Authority (OJK), Bank
Indonesia, TNP2K, and the Ministry of Finance.
The national strategy pays special attention to the underserved groups: poor
households, small and micro enterprises (SMEs), and students. One effective
strategy has been to convert government assistance from in-kind to cash and
transfer them through the bank. Furthermore, Indonesia instituted a policy of
directly transferring welfare payments into a recipient’s bank account rather than
providing cash, thus requiring them to open bank accounts. The conditional cash
transfer (Family Hope Program or PKH) is now channelled through the banks in
areas where the infrastructure is present. Other agencies are also encouraged to
convert their programmes, but the complexity of some makes this approach not
feasible for all programs. The strategy to combine poverty programmes and
financial inclusion seems to be working. Between 2014 and 2017, the share of
adults receiving government transfers into a financial institution account almost
doubled to 41%. Half of the respondents reported that they first opened an account
to receive government transfers.
The Indonesia policy initiative is well-rounded as it targets multiple aspects
of financial inclusion: access, availability, usage, and quality. Based on the
National Financial Literacy and Inclusion Survey conducted by the OJK, the
financial inclusion index in 2016 was 67.82%, increasing from 59.74% in 2013.
On the other hand, the financial literacy index in 2016 was 29.66%, increasing
from 21.84% in 2013.
7https://www.bi.go.id/id/perbankan/keuanganinklusif/edukasi/Contents/Booklet%20Financial%20I
nclusion%20(English%20Version).pdf

9
The OJK also monitors the financial landscape in such areas as
knowledge/literacy, usage, and access. According to the OJK survey,
conventional methods and physical access are still prominent in Indonesia, with
physical offices becoming the main access channel of financial products. In
addition, ATMs have also become the second-largest channel for people accessing
financial products. On the other hand, the utilisation of the digital technology is
still small, with only 5.8% respondents using phone banking and only 25% of
respondents experienced in using online transactions to access the stock market.
The number of bank branches—the most basic conduit for access to
financial service for a large majority of Indonesians—is expanding. The number
of commercial bank offices increased from 26,894 in 2012 to 31,618 in 2018,
while the number of rural bank offices increased from 4,425 to 6,273 over the
same period (Otoritas Jasa Keuangan 2015, 2019). However, the expansion of
commercial bank branches has plateaued since 2015, although the number of rural
banks (Bank Perkreditan Rakyat)8 continues to rise. Moreover, there is substantial
variation across locations. Using PODES, we create two indicators of bank
branches: the share of families living in villages with a commercial bank branch,
and the number of commercial bank branches per 1,000 families. These are
reported in Table 2. Given the uneven distribution of Indonesia’s population, the
density and share of families living close to bank branches is different. While 96%
of the population in DKI Jakarta lives in ‘villages’ with a bank branch, the rate is
less than 11% in Aceh. Bank branches tend to be highly concentrated in urban and
peri-urban locations.
8 In Indonesia, commercial banks provide a full range of banking products, while rural banks
mostly work with microenterprises in rural and urban areas.

10
Table 2. Bank Branches Density by Province
Province Share of
families
Density
Aceh 10.86 0.33
Sumatera Utara 23.53 0.29
Sumatera Barat 35.63 0.35
Riau 35.53 0.36
Jambi 21.18 0.35
Sumatera Selatan 22.67 0.27
Bengkulu 16.67 0.38
Lampung 16.58 0.20
Kepulauan Bangka Belitung 26.64 0.39
Kepulauan Riau 51.19 0.37
Dki Jakarta 96.02 0.62
Jawa Barat 32.36 0.23
Jawa Tengah 22.92 0.24
D I Yogyakarta 51.89 0.39
Jawa Timur 25.32 0.23
Banten 30.36 0.22
Bali 42.88 0.43
Nusa Tenggara Barat 18.21 0.18
Nusa Tenggara Timur 14.31 0.27
Kalimantan Barat 30.47 0.29
Kalimantan Tengah 31.07 0.25
Kalimantan Selatan 28.90 0.31
Kalimantan Timur 53.07 0.40
Sulawesi Utara 16.52 0.33
Sulawesi Tengah 16.54 0.28
Sulawesi Selatan 24.37 0.31
Sulawesi Tenggara 14.09 0.34
Gorontalo 12.23 0.31
Sulawesi Barat 16.50 0.25
Maluku 21.03 0.29
Maluku Utara 10.93 0.30
Papua Barat 35.10 0.52
Papua 24.13 0.28
Total 28.17 0.32
N 33
Source: Authors’ calculation from PODES 2014. Kalimantan Utara, which was a newly formed
province in 2014, is included into its parent Kalimantan Timur.
The traditional model of bank branches is not commercially viable
everywhere across the archipelago, which means branchless banking will play a
central strategic role in expanding access to financial services. Indonesia’s attempt
to make progress in this respect started with regulatory changes that enabled the
11
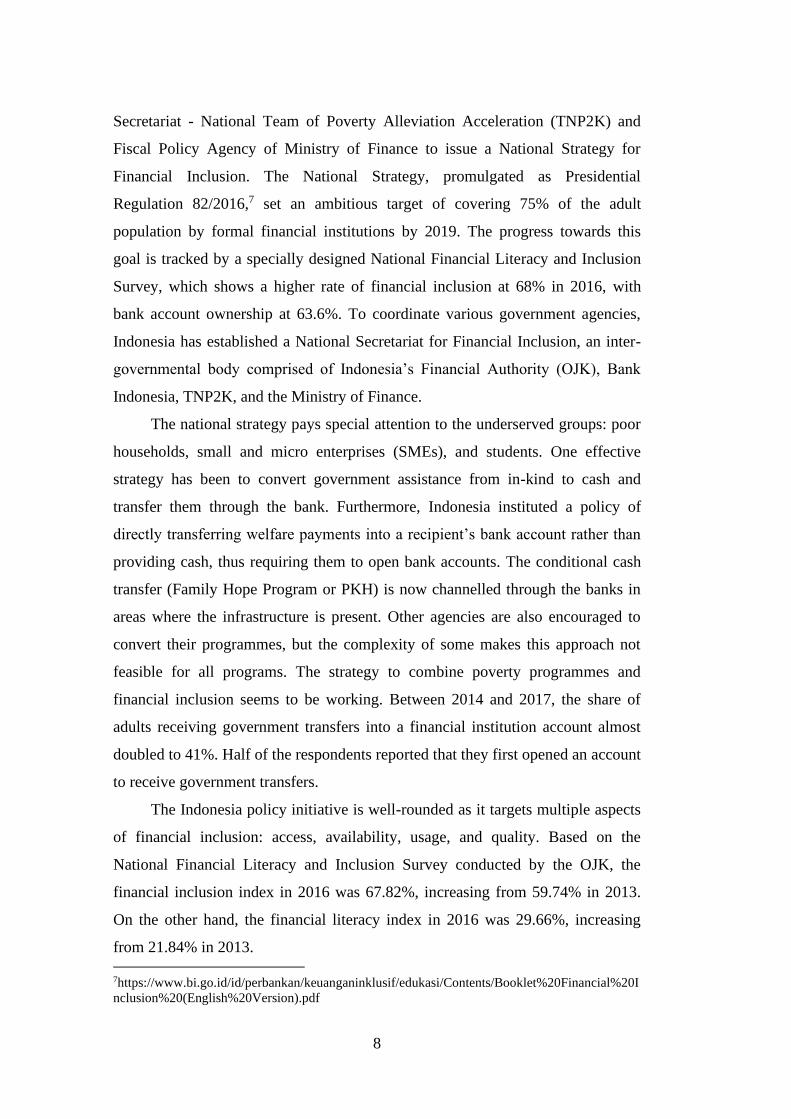
launch of Digital Financial Services in 2009. The take-up of digital banking had
been slow owing to regulatory hurdles, but its usage has expanded, according to
the International Monetary Fund Financial Access Survey. Since the provision of
branchless banking, both the number of deposits and mobile money accounts have
increased rapidly (see Figure 2). Telkomsel’s T-Cash and Go-Jek’s Go-Pay are
the most popular payment and money transfer services, which are well integrated
with bank accounts. However, existing services are biased towards individuals
who already have some degree of financial inclusion. For example, e-money
regulations require providers to maintain a bank balance equivalent to the issued
cash balance.
Figure 2. Expansion of Banking in Indonesia.
Source: International Monetary Fund Financial Access Survey Statistics
The provision of branchless banking received another boost with the launch
of the service locally known as Laku Pandai in 2015 by four major commercial
banks (Amianti, 2015). Under this programme, banks can provide (basic) savings,
loan, and microinsurance services through their agents. In 2016, Bank Indonesia
changed the regulation to make it easier for agents to sign up new customers for
savings accounts (Diela, 2016).
12
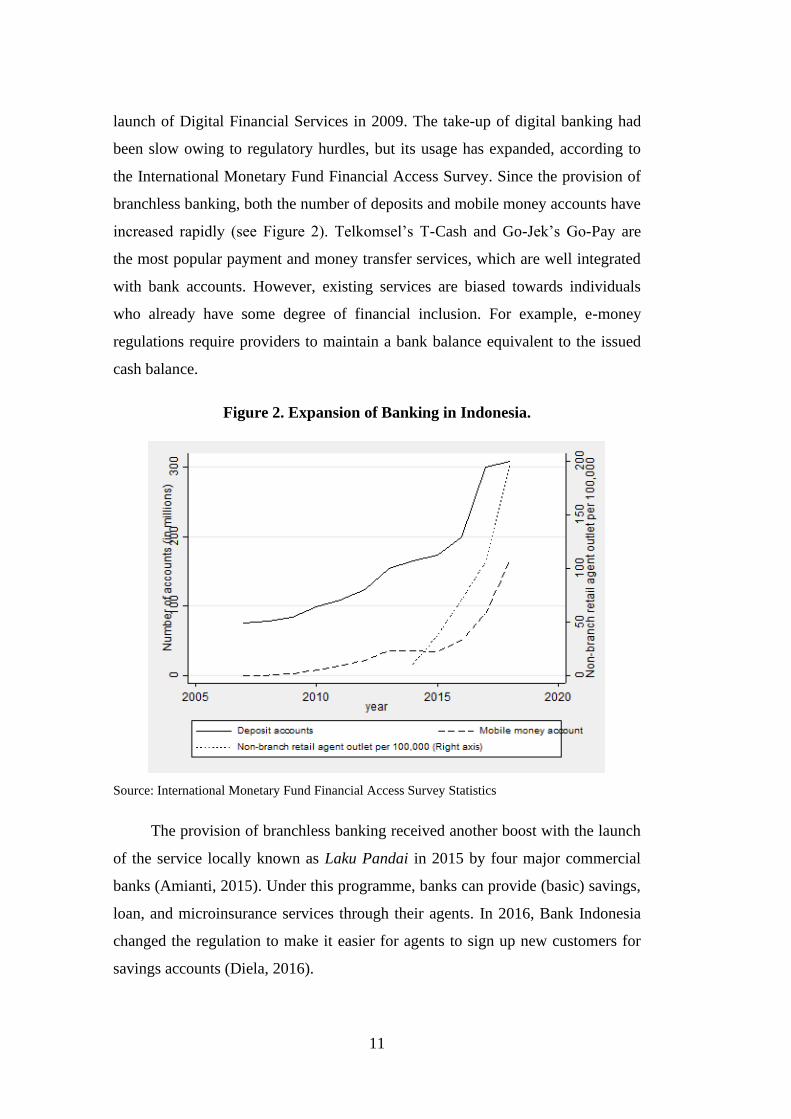
The use of non-branch outlets is rising in Indonesia, with the number of
non-bank retail outlets increasing exponentially from 10.75 per 100,000 adults in
2014 to 197 in 2018. In the FINDEX data, the proportion of respondents making
or receiving digital payments9 increased from 22% to 35% between 2014 and
2016. Although the rich–poor divide also exists in the use of digital payment
services, progress is evident even amongst the poorest 40%, one-fifth of whom
used digital payments in 2017. The service is equally available in rural areas,
where one-third of respondents reported using digital payment services.
Nonetheless, more effort is required to narrow the income and education gap in
use of digital payments.
Table 3. Percent of Adults who Made or Received Digital Payments in the
Past Year
Sample group 2014 2017
Overall 22.4 34.6
By subgroups:
Female (% age 15+) 23.1 35.5
In labour force (% age 15+) 25.1 38.5
Income, poorest 40% (% age 15+) 10.2 21.5
Income, richest 60% (% age 15+) 30.4 43.4
Male (% age 15+) 21.6 33.7
Older adults (% age 25+) 21.1 34.2
Out of labour force (% age 15+) 17.6 27.9
Primary education or less (% age 15+) 7.3 20.1
Rural (% age 15+) 15.7 33.4
Secondary education or more (% age 15+) 35.5 47.8
Young adults (% age 15-24) 26.6 36.0
Source: World Bank Financial Inclusion database.
9 World Bank FINDEX defines digital services as ‘using mobile money, a debit or credit card, or a
mobile phone to make a payment from an account or using the internet to pay bills or to buy
something online, in the past 12 months, [and] also includes… paying bills or sending remittances
directly from a financial institution account or through a mobile money account in the past 12
months.’
13
Literature review – financial inclusion and savings
Given the concerted effort towards increasing financial inclusion, we
conduct an original microdata analysis to understand its impact on households.
We focus on savings ownership as our main outcome. Savings is one of the basic
human activities and is seen as a universal indicator of financial inclusion.
Economic theory suggests that most households would have a reason to save
money. The lifecycle hypothesis by Modigliani (1986) theorises the relationship
between consumption, income, wealth, and savings of households. The main idea
is that households would save part of their income to accumulate their wealth and
use it in retirement. This hypothesis is supported by much evidence, especially on
rich or developed countries (Karlan and Morduch, 2010).
However, the lifecycle hypothesis requires some adjustments to be able to
postulate savings behaviour in poor households. Rather than accumulate wealth,
poor households tend to have a precautionary motive for savings to smoothen out
their consumption (Deaton and Paxson, 1997; Karlan et al., 2010). Because many
poor households have volatile income, they need to save in anticipation of lump-
sum expenditure in the future. In this case, poor households need a mechanism to
make deposits in small amounts and make occasional large withdrawals since
most of their needs to cope with emergencies will require lump-sum money.
Adequate savings also allow households to accumulate assets that enable
movement out of poverty and stable future income. Increased savings induces
higher expenditure on health and education. Moreover, parents will save and
make investments for their children’s education and health outcomes, leading to
intergenerational mobility (Becker and Tomes, 1979; Deaton and Paxson, 1997).
Despite this strong motive to save, many poor households do not save
enough. Whilst lack of income is an obvious constraint, there are many additional
reasons. One of these is because they lack safe places to keep their money,
indicating a lack of financial access (Banerjee and Duflo, 2007). This issue is
exacerbated by their lack of trust in formal financial institutions and knowledge of
financial products (Bachas et al., 2016). Therefore, even if banking institutions are
available in their regions, they are still less likely to have accounts (Allen et al.,
2012; Karlan and Morduch, 2010; Guiso et al., 2009). Recent research also
14
highlights behavioural reasons for low savings. Households in rural areas tend to
spend a significant part of their disposable income on festival expenses for
sociocultural reasons (Banerjee and Duflo, 2007; Karlan and Morduch, 2010).
Moreover, there may also be a commitment issue, where individuals or
households have difficulty resisting impulsive consumption, or a lack of
commitment to save a part of their income gradually (Banerjee and Duflo, 2007;
Karlan and Morduch, 2010).
There is a large academic literature showing that improved financial
inclusion can improve the welfare of poorer households. Bruhn and Love (2014)
presented evidence that financial inclusion through the increase in banking access
in Mexico decreased poverty levels, with banking access positively impacting
small businesses and households below median income levels. Burgess and Pande
(2005) also showed similar evidence with bank openings in rural areas in India,
where the government through its licensing policy strongly encouraged
commercial banks to open branches in unbanked locations from the 1970s through
the1990s. Therefore, reducing barriers to entry for bank branches could ease
household and individual access to banking services, including account ownership
(Beck et al., 2006).
While digital technology is changing the financial landscape, owning a bank
account is one of the basic indicators of financial inclusion. Randomised control
trials show that poor households take up savings accounts that have low costs and
with banks that have branches nearby (e.g. Prina, 2015, Dupas et al., 2018).
Distance to bank branches is an important barrier in Indonesia as well. The 2017
FINDEX data ask about the reason for not having a back account. The most
common answer is lack of sufficient funds, which was chosen by 72% of the
respondents, as shown in Table 4. However, one in three also indicated that
financial institutions are too far away and financial services are too expensive.

15
Table 4. Reason for Not Having Bank Account
FINDEX Variable 2017
Financial institutions are too far away 33.0
Financial services are too expensive 31.7
Insufficient funds 72.1
Lack of necessary documentation 26.4
Lack of trust in financial institutions 8.0
No need for financial services ONLY 1.7
Religious reasons 5.2
Someone in the family has an account 29.2
Source: World Bank Financial Inclusion database.
While the evidence of the positive effect from bank branches towards
savings ownership increase is ubiquitous, the effectiveness of bank accounts to
increase savings amounts is still debated. A recent study by Dupas et al. (2018)
showed that simply having bank accounts does not necessarily translate into an
increase in savings, even when the accounts are subsidised. One important reason
is because poor households are simply unable to save or their necessities are
unable to be fulfilled with the current saving products. On the other hand, in their
previous study, Dupas and Robinson (2013) found a positive effect of savings
account ownership to savings amounts in rural Kenya, even with high withdrawal
fees. This evidence is also supported by the finding of Ashraf et al. (2006), where
the increase in savings accounts also increased savings balances, although in this
case the savings account was tied with individual commitment.
Analysis of IFLS data
In our empirical analysis, we study how financial inclusion as determined
by local bank branch density impacts household welfare. While the concept of
household welfare is quite broad and depends on a multitude of factors, in a
developing country context, arguably the most important measure of welfare is the
ability to escape poverty in a sustained way. While current consumption is a way
of measuring welfare, it is subject to transitory shocks (positive or negative) that
16
may provide a misleading picture. For a more permanent transition out of poverty,
households must accumulate assets, which could include ‘conventional, privately
held productive and financial wealth, as well as social, geographic and market
access positions that confer economic advantage’ (Carter and Barrett, 2006, p.
179). In this regard, accumulation of savings is an important variable.
The main data for this analysis derive from the IFLS, which asks many
relevant questions. The IFLS tracked the same 7,200 households (and their
offshoots) since 1993. So far, five waves have been conducted in 1993, 1997,
2000, 2007, and 2014 (for details, see Strauss et al., 2009 and Strauss et al., 2016).
We use the 2007 and 2014 rounds (IFLS 4 and 5, respectively).
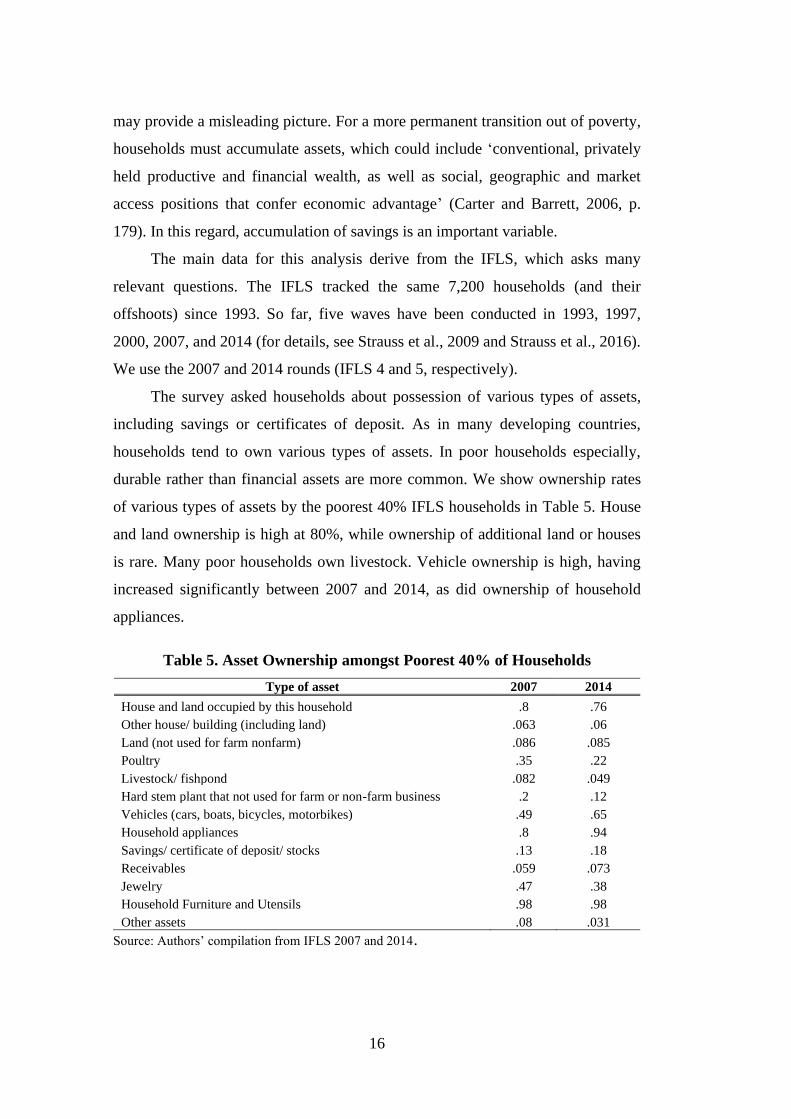
The survey asked households about possession of various types of assets,
including savings or certificates of deposit. As in many developing countries,
households tend to own various types of assets. In poor households especially,
durable rather than financial assets are more common. We show ownership rates
of various types of assets by the poorest 40% IFLS households in Table 5. House
and land ownership is high at 80%, while ownership of additional land or houses
is rare. Many poor households own livestock. Vehicle ownership is high, having
increased significantly between 2007 and 2014, as did ownership of household
appliances.
Table 5. Asset Ownership amongst Poorest 40% of Households
Type of asset 2007 2014
House and land occupied by this household .8 .76
Other house/ building (including land) .063 .06
Land (not used for farm nonfarm) .086 .085
Poultry .35 .22
Livestock/ fishpond .082 .049
Hard stem plant that not used for farm or non-farm business .2 .12
Vehicles (cars, boats, bicycles, motorbikes) .49 .65
Household appliances .8 .94
Savings/ certificate of deposit/ stocks .13 .18
Receivables .059 .073
Jewelry .47 .38
Household Furniture and Utensils .98 .98
Other assets .08 .031
Source: Authors’ compilation from IFLS 2007 and 2014.

17
Some questions about financial inclusion were also available in the survey,
although we do not use them in this study. Nonetheless, it is revealing to discuss
some of them here as they cover aspects of financial literacy. Table 4 summarises
several financial inclusion indicators of Indonesian households in 2007 and 2014.
In general, Indonesian households knew how to get a loan from many sources. In
addition, the majority (around 87% in 2007 and 83% in 2014) knew that they can
get a loan from banks or other financial institutions. Savings rates increased
slightly from 26% to 30% over the 7 years. Likewise, the average amount of
savings in banks doubled since 2007, with around Rp17 million in 2014.
Disaggregating the data by quantiles of per capita consumption, we find that
lower expenditure group is less financially literate since fewer households could
identify borrowing sources, or knew financial institutions, and they were more
likely to be rejected when requesting loans. In addition, the lower expenditure
group was also less likely to have savings and receivable accounts. Nonetheless,
we do find that savings ownership increased by 6 percentage points amongst the
poorest quintile of households, which shows gains at the bottom of the income
distribution.
Table 6. Household Financial Inclusion Status in IFLS
Year 2007 2014 Unit
Known place to borrow money 88.08 82.29 %
Known financial institution (from known place) 87.01 83.56 %
Have Savings (Overall) 26.09 30.42 %
Have Savings (Bottom 20%) 9.2 15.4 %
Have Savings (Top 20%) 47.8 46.8 %
Observations 12,987 15,178 Source: Indonesia Family Life Survey (IFLS), calculated.
For our regression analysis, we focus specifically on savings ownership. For
the dependent variable, we construct an indicator that takes value one if the
household owned savings as well as a continuous variable that measures the value
of the assets. It should be stressed that savings ownership is not the same as a
savings account at a financial institution, as many Indonesians, especially those
who are poor or living in rural areas, use informal savings arrangements. The
FINDEX survey shows that, in 2017, almost 30% used savings clubs or saved
with persons outside the family (see Table 1).
18
The measurement of financial inclusion at the household level is one of the
key issues in the literature. Much of the literature has focused on developing
national indicators (e.g. Sarma and Pais, 2011) and cross-country analysis of
relationships to various development outcomes (e.g. Park and Mercado, 2015).
For households, financial status, i.e. whether the household owns a savings
account, is the outcome rather than measure of financial inclusion. In a recent
contribution, Zhang and Posso (2019) construct a multidimensional financial
exclusion index by combining proxies for savings and credit and study the
relationship between financial inclusion and household income.
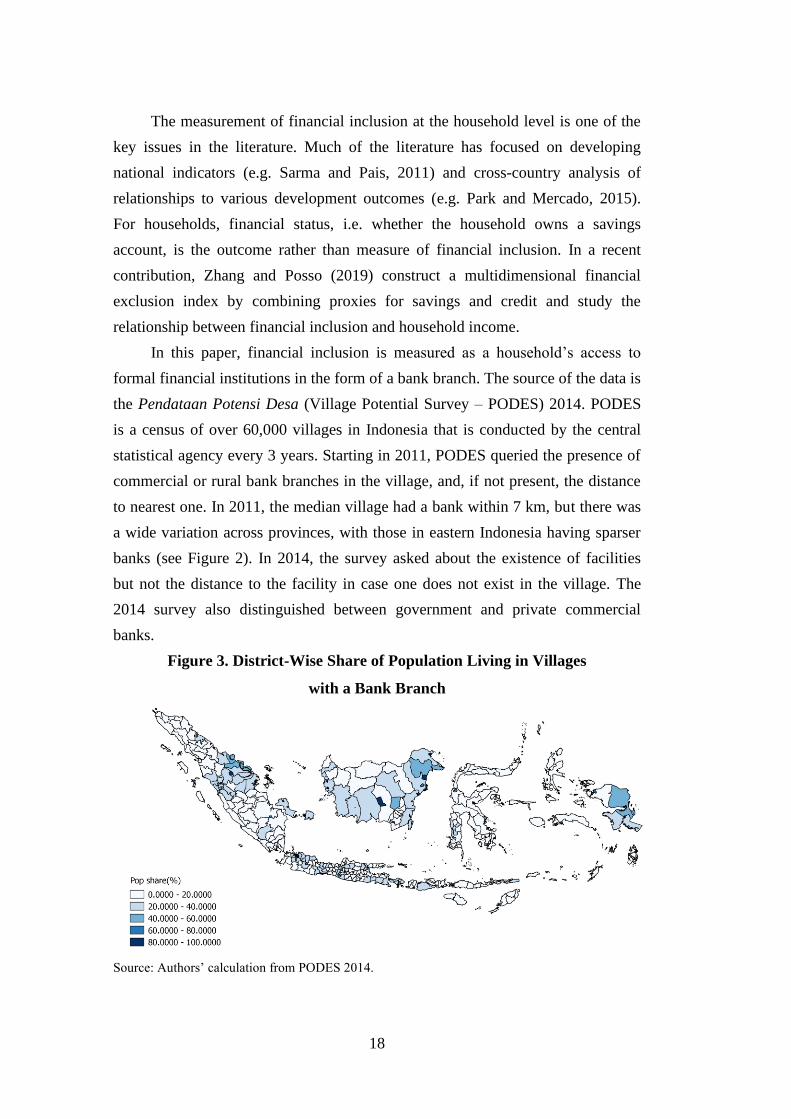
In this paper, financial inclusion is measured as a household’s access to
formal financial institutions in the form of a bank branch. The source of the data is
the Pendataan Potensi Desa (Village Potential Survey – PODES) 2014. PODES
is a census of over 60,000 villages in Indonesia that is conducted by the central
statistical agency every 3 years. Starting in 2011, PODES queried the presence of
commercial or rural bank branches in the village, and, if not present, the distance
to nearest one. In 2011, the median village had a bank within 7 km, but there was
a wide variation across provinces, with those in eastern Indonesia having sparser
banks (see Figure 2). In 2014, the survey asked about the existence of facilities
but not the distance to the facility in case one does not exist in the village. The
2014 survey also distinguished between government and private commercial
banks.
Figure 3. District-Wise Share of Population Living in Villages
with a Bank Branch
Source: Authors’ calculation from PODES 2014.

19
We use PODES to calculate a sub-national index of financial inclusion
derived from the density of bank branches in the sub-district where households
were located. For location 𝑗, 𝑆𝑗 is the share of families living in villages with at
least one bank branch. Then the financial inclusion index of location j,
𝐹𝐼𝑗 =𝑆𝑗 − 𝑆
𝑆̅ − 𝑆
where 𝑆 = min{𝑆𝑗} ∀ 𝑗, 𝑆̅ = max{𝑆𝑗} ∀ 𝑗. This mirrors the index constructed by
Sarma and Pais (2011), but for sub-national locations. Figure 4 shows the
distribution of financial inclusion indicators across sub-districts, which shows
large variations. In many sub-districts, the availability of bank branches is quite
low, with an index value below 0.4.
Figure 4. Distribution of Sub-National Financial Inclusion Index
Source: Authors’ calculation from PODES 2014.
We conduct some robustness checks to ensure consistency of information
provided by the IFLS community survey and indicators of financial inclusion. The
IFLS community module asked about the presence of bank branches in the
location. Out of the 311 IFLS communities, 181 (58%) had no banks in the village
20
in 2007. By 2014, this number of had reduced slightly to 171. Thus, within the
dataset, there is no temporal variation in the availability of bank branches. We
treat financial inclusion as a time-invariant explanatory variable.
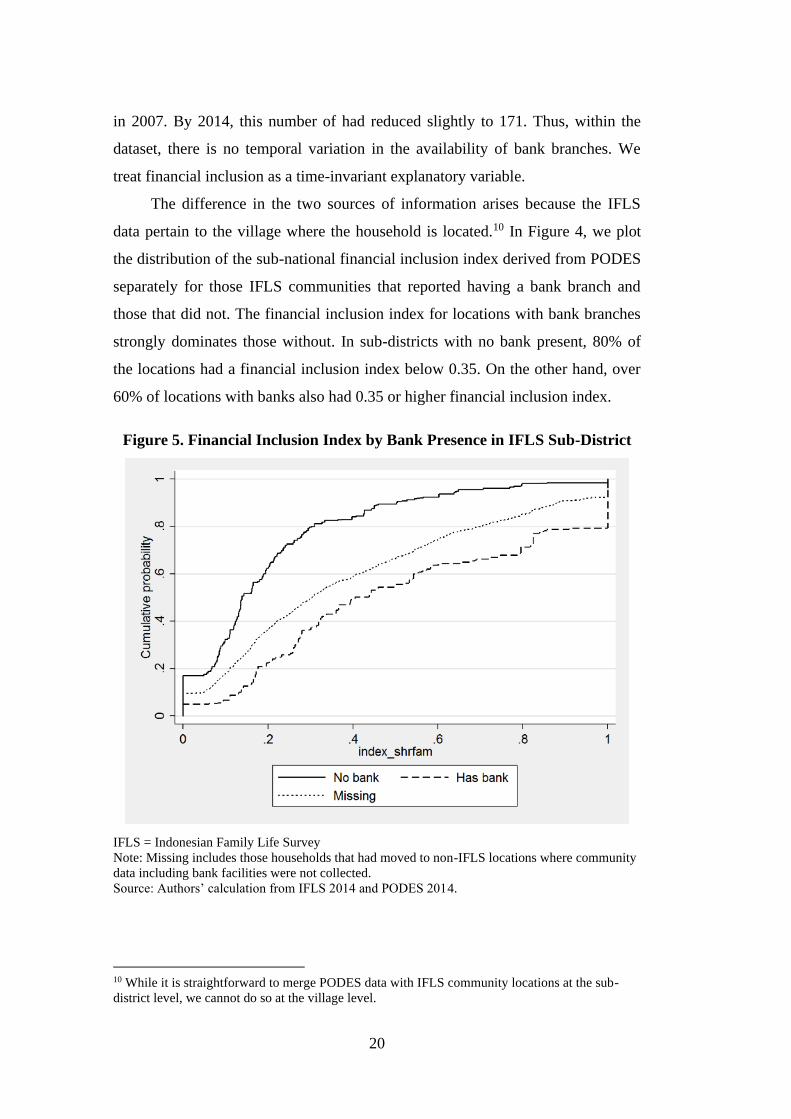
The difference in the two sources of information arises because the IFLS
data pertain to the village where the household is located.10 In Figure 4, we plot
the distribution of the sub-national financial inclusion index derived from PODES
separately for those IFLS communities that reported having a bank branch and
those that did not. The financial inclusion index for locations with bank branches
strongly dominates those without. In sub-districts with no bank present, 80% of
the locations had a financial inclusion index below 0.35. On the other hand, over
60% of locations with banks also had 0.35 or higher financial inclusion index.
Figure 5. Financial Inclusion Index by Bank Presence in IFLS Sub-District
IFLS = Indonesian Family Life Survey Note: Missing includes those households that had moved to non-IFLS locations where community
data including bank facilities were not collected.
Source: Authors’ calculation from IFLS 2014 and PODES 2014.
10 While it is straightforward to merge PODES data with IFLS community locations at the sub-
district level, we cannot do so at the village level.
21
We estimate the following relationship between outcome 𝑌𝑖𝑗𝑡 of household 𝑖
in location 𝑗 at time 𝑡 and financial inclusion 𝐹𝑖𝑗𝑡:
𝑌𝑖𝑗𝑡 = 𝛿 + 𝛽𝐹𝑖𝑗𝑡 + 𝜶𝐹𝑖𝑗𝑡 × 𝑇𝑖𝑗0 + 𝜸𝑋𝑖𝑗𝑡 + 𝜎𝑖𝑗 + 𝑒𝑖𝑗𝑡,
where 𝑇𝑖𝑗0 denotes household characteristics at the baseline, 𝑋𝑖𝑗𝑡 is a vector of
time-variant household characteristics, 𝜎𝑖 indicates unobserved time-invariant
household heterogeneity, and 𝑒𝑖𝑗𝑡 is time-variant unobserved factors. The
interaction between financial inclusion and baseline characteristics is to capture
the heterogeneous impact across various types of households. A household-level
fixed effects estimator is used to capture unobserved variation across households.
Baseline household characteristics include income level, presence of poor
health for individuals (determines demand for health expenditure), and presence
of school-age children (determines demand for education expenditure). Time-
variant household characteristics include the number of family members, current
income, etc.
Results
In this section, we discuss the results of our econometric estimation. Before
delving into the regression analysis, we provide some summary statistics of the
household data and descriptive analysis of financial inclusion variables and
household outcomes.
4.1. Descriptive analysis
The summary statistics are shown in Table 6. The median nominal monthly
per capita expenditure more than doubled between 2007 and 2014, from Rp0.44
million to Rp0.9 million.11 In 2007, 26% of the households reported that they had
any savings; this increased slightly to 30% in 2014. The share of households
residing in villages with any bank branch did not change during this period. For
villages that did not have any bank branches, the closest bank branch was 6.5 km
away.
11 As of August 2019, Rp1 million is equivalent to US$70.
22
Table 7. Summary Statistics of Selected Variables in IFLS data
Variable (unit) 2007 2014
Number of households (N) 12,987 15,178
Household consumption per capita (Nominal Rp, median) 438,399 904,598
Has savings (% households) 26.1 30.4
Savings rate (% of household income, all households)
HH education
< 5 years 20.8
6–8 years 23.2
9–11 years 15.5
12–15 years 27.8
16 years 12.7
Has bank branch in village (% households) 34.7 35.1
FI index (2014, median) 0.23 0.24
FI = financial inclusion, HH = household.
Source: Indonesia Family Life Survey (IFLS), calculated.
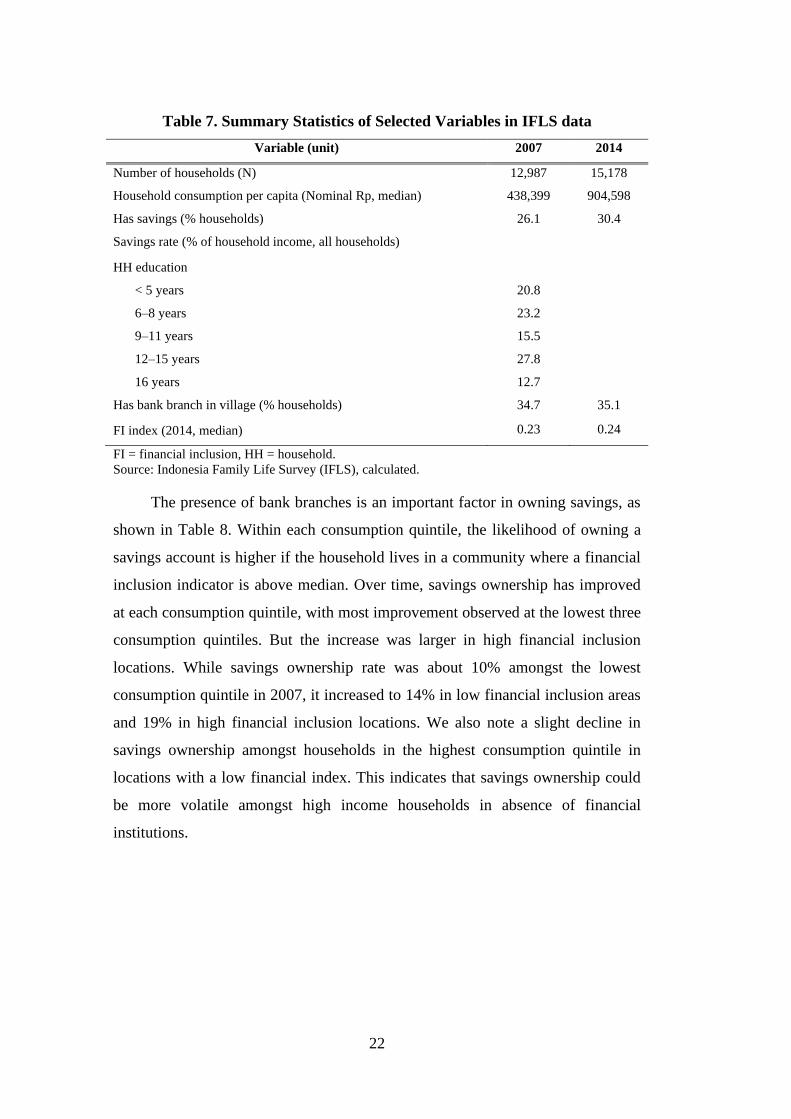
The presence of bank branches is an important factor in owning savings, as
shown in Table 8. Within each consumption quintile, the likelihood of owning a
savings account is higher if the household lives in a community where a financial
inclusion indicator is above median. Over time, savings ownership has improved
at each consumption quintile, with most improvement observed at the lowest three
consumption quintiles. But the increase was larger in high financial inclusion
locations. While savings ownership rate was about 10% amongst the lowest
consumption quintile in 2007, it increased to 14% in low financial inclusion areas
and 19% in high financial inclusion locations. We also note a slight decline in
savings ownership amongst households in the highest consumption quintile in
locations with a low financial index. This indicates that savings ownership could
be more volatile amongst high income households in absence of financial
institutions.
23
Table 8. Savings Ownership Rate by Consumption Quintile and FI indicator
Consumption
quintile
(1) (2) (3) (4)
2007, Low FI 2007, High FI 2014, Low FI 2014, High FI
1 (Lowest) 0.09 0.10 0.14 0.19
2 0.15 0.18 0.20 0.24
3 0.19 0.26 0.25 0.30
4 0.29 0.37 0.31 0.41
5 (Highest) 0.43 0.51 0.39 0.50
Total 0.19 0.30 0.24 0.36
N 5665 5548 7216 6964
FI = financial inclusion.
Source: Indonesia Family Life Survey (IFLS), calculated.
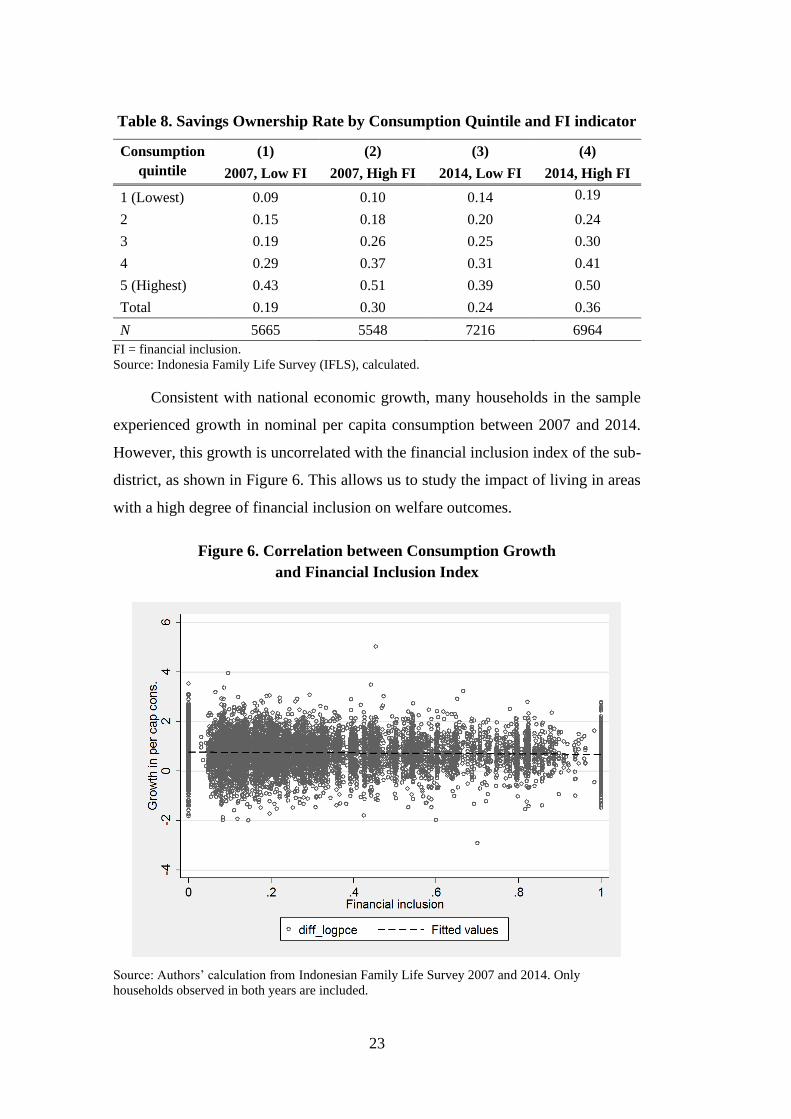
Consistent with national economic growth, many households in the sample
experienced growth in nominal per capita consumption between 2007 and 2014.
However, this growth is uncorrelated with the financial inclusion index of the sub-
district, as shown in Figure 6. This allows us to study the impact of living in areas
with a high degree of financial inclusion on welfare outcomes.
Figure 6. Correlation between Consumption Growth
and Financial Inclusion Index
Source: Authors’ calculation from Indonesian Family Life Survey 2007 and 2014. Only
households observed in both years are included.
24
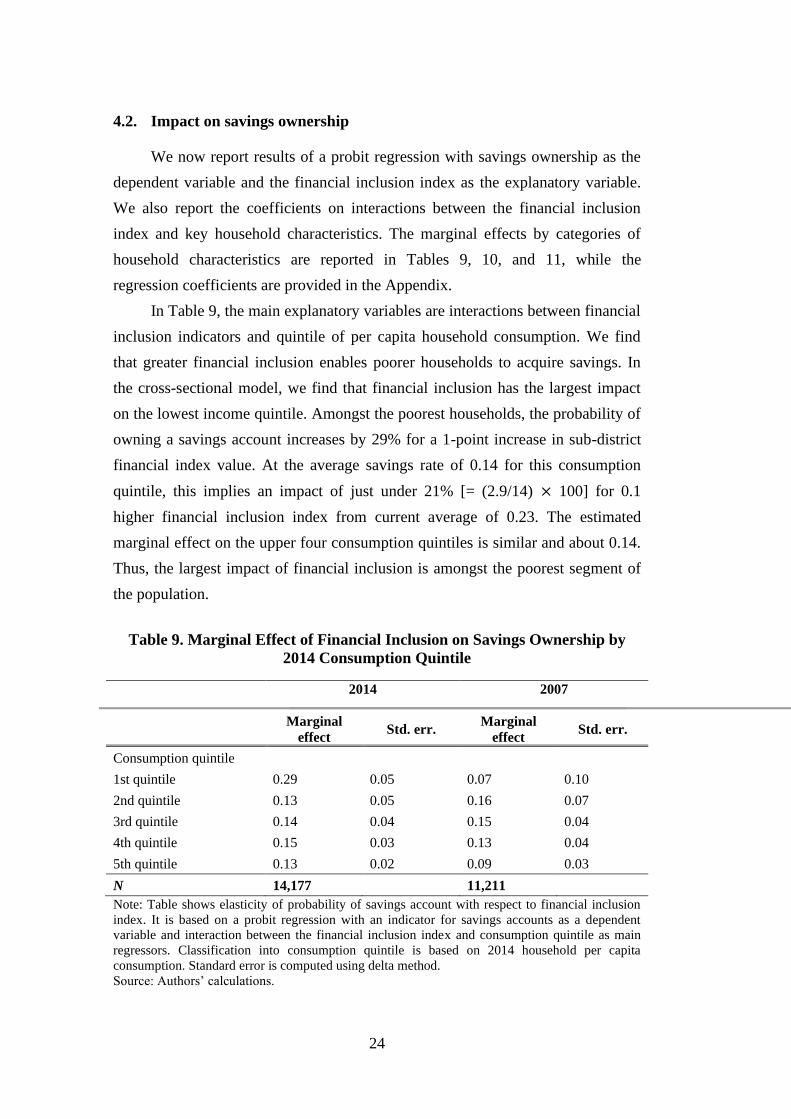
4.2. Impact on savings ownership
We now report results of a probit regression with savings ownership as the
dependent variable and the financial inclusion index as the explanatory variable.
We also report the coefficients on interactions between the financial inclusion
index and key household characteristics. The marginal effects by categories of
household characteristics are reported in Tables 9, 10, and 11, while the
regression coefficients are provided in the Appendix.
In Table 9, the main explanatory variables are interactions between financial
inclusion indicators and quintile of per capita household consumption. We find
that greater financial inclusion enables poorer households to acquire savings. In
the cross-sectional model, we find that financial inclusion has the largest impact
on the lowest income quintile. Amongst the poorest households, the probability of
owning a savings account increases by 29% for a 1-point increase in sub-district
financial index value. At the average savings rate of 0.14 for this consumption
quintile, this implies an impact of just under 21% [= (2.9/14) × 100] for 0.1
higher financial inclusion index from current average of 0.23. The estimated
marginal effect on the upper four consumption quintiles is similar and about 0.14.
Thus, the largest impact of financial inclusion is amongst the poorest segment of
the population.
Note: Table shows elasticity of probability of savings account with respect to financial inclusion
index. It is based on a probit regression with an indicator for savings accounts as a dependent
variable and interaction between the financial inclusion index and consumption quintile as main
regressors. Classification into consumption quintile is based on 2014 household per capita
consumption. Standard error is computed using delta method.
Source: Authors’ calculations.
Table 9. Marginal Effect of Financial Inclusion on Savings Ownership by
2014 Consumption Quintile
2014
2007
Marginal
effect Std. err.
Marginal
effect Std. err.
Consumption quintile
1st quintile 0.29 0.05 0.07 0.10
2nd quintile 0.13 0.05 0.16 0.07
3rd quintile 0.14 0.04 0.15 0.04
4th quintile 0.15 0.03 0.13 0.04
5th quintile 0.13 0.02 0.09 0.03
N 14,177 11,211
25
For robustness check, we study the relationship between savings ownership
in 2007 and financial inclusion index of 2014. The results are shown in the third
and fourth columns of Table 9. We find that location’s financial inclusion index in
2014 has no predictive power in 2007 for savings probability of the poorest
quintile. So, we can be assured that the 2014 results are not wholly driven by
other location-specific factors. Furthermore, we can infer that the income growth
experienced by Indonesian households since 2007 has translated into greater
savings in areas with greater financial inclusion.
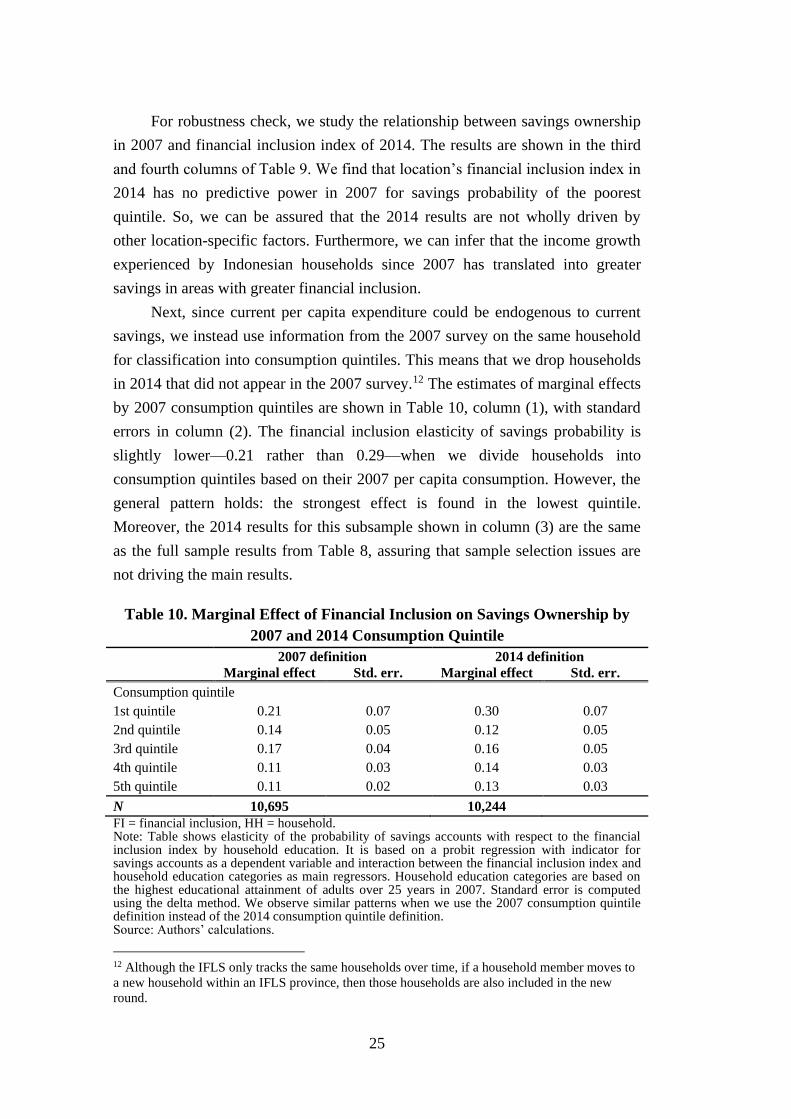
Next, since current per capita expenditure could be endogenous to current
savings, we instead use information from the 2007 survey on the same household
for classification into consumption quintiles. This means that we drop households
in 2014 that did not appear in the 2007 survey.12 The estimates of marginal effects
by 2007 consumption quintiles are shown in Table 10, column (1), with standard
errors in column (2). The financial inclusion elasticity of savings probability is
slightly lower—0.21 rather than 0.29—when we divide households into
consumption quintiles based on their 2007 per capita consumption. However, the
general pattern holds: the strongest effect is found in the lowest quintile.
Moreover, the 2014 results for this subsample shown in column (3) are the same
as the full sample results from Table 8, assuring that sample selection issues are
not driving the main results.
Table 10. Marginal Effect of Financial Inclusion on Savings Ownership by
2007 and 2014 Consumption Quintile
2007 definition 2014 definition Marginal effect Std. err. Marginal effect Std. err.
Consumption quintile
1st quintile 0.21 0.07 0.30 0.07
2nd quintile 0.14 0.05 0.12 0.05
3rd quintile 0.17 0.04 0.16 0.05
4th quintile 0.11 0.03 0.14 0.03
5th quintile 0.11 0.02 0.13 0.03
N 10,695 10,244
FI = financial inclusion, HH = household. Note: Table shows elasticity of the probability of savings accounts with respect to the financial inclusion index by household education. It is based on a probit regression with indicator for savings accounts as a dependent variable and interaction between the financial inclusion index and household education categories as main regressors. Household education categories are based on the highest educational attainment of adults over 25 years in 2007. Standard error is computed using the delta method. We observe similar patterns when we use the 2007 consumption quintile definition instead of the 2014 consumption quintile definition. Source: Authors’ calculations.
12 Although the IFLS only tracks the same households over time, if a household member moves to
a new household within an IFLS province, then those households are also included in the new
round.
26
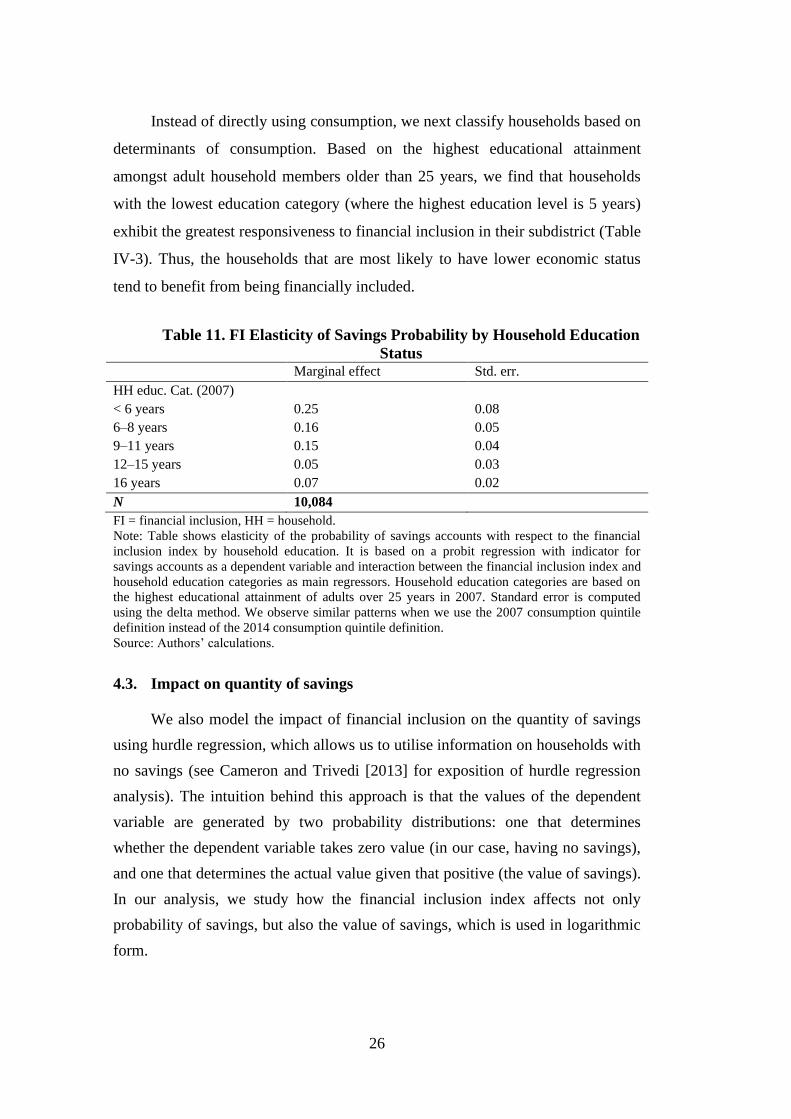
Instead of directly using consumption, we next classify households based on
determinants of consumption. Based on the highest educational attainment
amongst adult household members older than 25 years, we find that households
with the lowest education category (where the highest education level is 5 years)
exhibit the greatest responsiveness to financial inclusion in their subdistrict (Table
IV-3). Thus, the households that are most likely to have lower economic status
tend to benefit from being financially included.
Note: Table shows elasticity of the probability of savings accounts with respect to the financial
inclusion index by household education. It is based on a probit regression with indicator for
savings accounts as a dependent variable and interaction between the financial inclusion index and
household education categories as main regressors. Household education categories are based on
the highest educational attainment of adults over 25 years in 2007. Standard error is computed
using the delta method. We observe similar patterns when we use the 2007 consumption quintile
definition instead of the 2014 consumption quintile definition.
Source: Authors’ calculations.
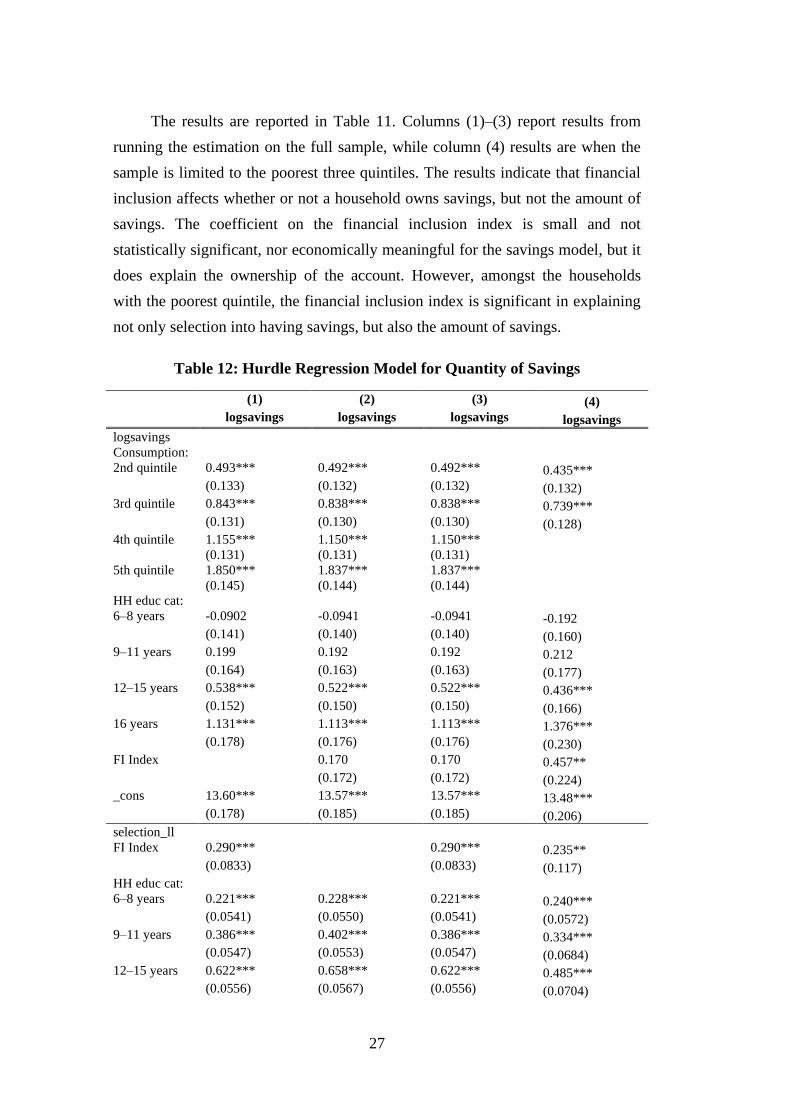
4.3. Impact on quantity of savings
We also model the impact of financial inclusion on the quantity of savings
using hurdle regression, which allows us to utilise information on households with
no savings (see Cameron and Trivedi [2013] for exposition of hurdle regression
analysis). The intuition behind this approach is that the values of the dependent
variable are generated by two probability distributions: one that determines
whether the dependent variable takes zero value (in our case, having no savings),
and one that determines the actual value given that positive (the value of savings).
In our analysis, we study how the financial inclusion index affects not only
probability of savings, but also the value of savings, which is used in logarithmic
form.
Table 11. FI Elasticity of Savings Probability by Household Education
Status Marginal effect Std. err.
HH educ. Cat. (2007)
< 6 years 0.25 0.08
6–8 years 0.16 0.05
9–11 years 0.15 0.04
12–15 years 0.05 0.03
16 years 0.07 0.02
N 10,084
FI = financial inclusion, HH = household.
27
The results are reported in Table 11. Columns (1)–(3) report results from
running the estimation on the full sample, while column (4) results are when the
sample is limited to the poorest three quintiles. The results indicate that financial
inclusion affects whether or not a household owns savings, but not the amount of
savings. The coefficient on the financial inclusion index is small and not
statistically significant, nor economically meaningful for the savings model, but it
does explain the ownership of the account. However, amongst the households
with the poorest quintile, the financial inclusion index is significant in explaining
not only selection into having savings, but also the amount of savings.
Table 12: Hurdle Regression Model for Quantity of Savings
(1) (2) (3) (4)
logsavings logsavings logsavings logsavings
logsavings
Consumption:
2nd quintile 0.493*** 0.492*** 0.492*** 0.435***
(0.133) (0.132) (0.132) (0.132)
3rd quintile 0.843*** 0.838*** 0.838*** 0.739***
(0.131) (0.130) (0.130) (0.128)
4th quintile 1.155*** 1.150*** 1.150***
(0.131) (0.131) (0.131)
5th quintile 1.850*** 1.837*** 1.837***
(0.145) (0.144) (0.144)
HH educ cat:
6–8 years -0.0902 -0.0941 -0.0941 -0.192
(0.141) (0.140) (0.140) (0.160)
9–11 years 0.199 0.192 0.192 0.212
(0.164) (0.163) (0.163) (0.177)
12–15 years 0.538*** 0.522*** 0.522*** 0.436***
(0.152) (0.150) (0.150) (0.166)
16 years 1.131*** 1.113*** 1.113*** 1.376***
(0.178) (0.176) (0.176) (0.230)
FI Index 0.170 0.170 0.457**
(0.172) (0.172) (0.224)
_cons 13.60*** 13.57*** 13.57*** 13.48***
(0.178) (0.185) (0.185) (0.206)
selection_ll
FI Index 0.290*** 0.290*** 0.235**
(0.0833) (0.0833) (0.117)
HH educ cat:
6–8 years 0.221*** 0.228*** 0.221*** 0.240***
(0.0541) (0.0550) (0.0541) (0.0572)
9–11 years 0.386*** 0.402*** 0.386*** 0.334***
(0.0547) (0.0553) (0.0547) (0.0684)
12–15 years 0.622*** 0.658*** 0.622*** 0.485***
(0.0556) (0.0567) (0.0556) (0.0704)

28
16 years 1.145*** 1.186*** 1.145*** 0.913***
(0.0675) (0.0690) (0.0675) (0.0975)
_cons -1.253*** -1.212*** -1.253*** -1.318***
(0.0751) (0.0777) (0.0751) (0.0935)
lnsigma
_cons 0.495*** 0.494*** 0.494*** 0.461***
(0.0153) (0.0154) (0.0154) (0.0223)
N 9178 9178 9178 5929
FI = financial inclusion, HH = household.
Source: Authors’ calculation. Standard errors in parentheses. * p<.1, ** p<.05, *** p<.01.
Discussion and Conclusion
How might the recent efforts of governments around the developing world
to expand access to formal financial institutions lead to better lives for citizens?
The Indonesian government’s expansion of financial inclusion has relied on
various strategies. Recent data suggest that it is on its way to meeting the goal it
set in 2015 of financially including 75% of its population. Bank branches remain
the most common form of financial access, although awareness and usage of
digital financial services is also growing. With the success and growing popularity
of homegrown companies like Go-Jek, Indonesia is in a good position to leverage
financial inclusion for sustainable growth.
While much of the strategic push for greater financial inclusion in Indonesia
took place after 2015, looking at available data still provides clues to the likely
impact of this policy. Our results suggest that financial inclusion can be an
effective pro-poor policy. It shows that having access to bank accounts increased
savings ownership amongst the poor, which is the first step towards financial
stability and long-term welfare.
However, our results are not adequate to assess some of the recent
developments in the financial inclusion strategy. The advent of digital technology
and recognition that true financial inclusion goes beyond access to encompass
literacy and consumer protection gives rise to issues that are not salient with bank
branches. Thus, further research is required to understand the impact of the recent
push towards financial inclusion.

29
References
Allen, F., A. Demirguc-Kunt, L. Klapper, and M.S. Peria (2012), ‘The
Foundations of Financial Inclusion: Understanding Ownership and Use of
Formal Accounts’, World Bank Policy Research Working Paper, 6290,
Washington, DC: World Bank.
Amianti, G.D. (2015), ‘Four Major Banks Launch Branchless Banking Program’,
The Jakarta Post, 27 March.
https://www.thejakartapost.com/news/2015/03/27/four-major-banks-launch-
branchless-banking-program.html (accessed 22 June 2020).
Ashraf, N., D. Karlan, and W. Yin (2006), ‘Tying Odysseus to the Mast: Evidence
from a Commitment Savings Product in The Philippines’, Quarterly Journal
of Economics, 121(2), pp.635–72.
Bachas, P., P. Gertler, and S. Higgins (2016), ‘Banking on Trust: How Debit
Cards Help the Poor to Save More’, NBER Working Paper Series, No.
23252, Cambridge, MA: NBER.
Banerjee, A., and E. Duflo (2007), ‘The Economic Lives of the Poor’, Journal of
Economic Perspectives, 21(1), pp.141–67.
Beck, T., A. Demirguc-Kunt, and R. Levine (2007), ‘Finance, Inequality and the
Poor’, Journal of Economic Growth, 12, pp.27–49.
Beck, T., A. Demirguc-Kunt, and M.S. Peria (2006), ‘Banking Services for
Everyone? Barriers to Bank Access and Use around the World’, World Bank
Policy Research Working Paper 4079. Washington, DC: World Bank.
Becker, G. S., and N. Tomes (1979), ‘An Equilibrium Theory of the Distribution
of Income and Intergenerational Mobility’, Journal of Political Economy,
87, pp.1153–89.
Bruhn, M., and I. Love (2014), ‘The Real Impact of Improved Access to Finance:
Evidence from Mexico’, Journal of Finance, 69(3), pp.1347–76.
Burgess, R., and R. Pande (2005), ‘Do Rural Banks Matter? Evidence from the
Indian Social Banking Experiment’, American Economic Review, 95(3),
pp.780–95.
Cameron, A.C., and P.K. Trivuedi (2013), Regression Analysis of Count Data (2nd
edition), New York, NY: Cambridge University Press.
Carter, M.R., and C.B. Barrett, (2006), ‘The Economics of Poverty Traps and
Persistent Poverty: An Asset-Based Approach’, The Journal of Development
Studies, 42(2), pp.178–99.
Cole, S., T. Sampson, and B. Zia (2011), ‘Prices or Knowledge? What Drives
Demand for Financial Services in Emerging Markets?’, The Journal of
Finance, 66(6), pp.1933–67.
30
Deaton, A and C. Paxson (1997), ‘The Effects of Economic and Population
Growth on National Saving and Inequality’, Demography, 34(1), pp.97–
114.
Demirguc-Kunt, A., L. Klapper, D. Singer, and P.V. Oudheusden (2015), ‘The
Global Findex Database 2014: Measuring Financial Inclusion around the
World’, World Bank Policy Research Working Paper Series, No. 7255,
Washington, DC: World Bank.
Demirgüç-Kunt, A., L. Klapper, D. Singer, S. Ansar, and J. Hess, (2018) The
Global Findex Database 2017: Measuring Financial Inclusion and the
Fintech Revolution. Washington, DC: World Bank.
Diela, T. (2016), ‘Bank Indonesia Relaxes Agent Regulation to Sign Up More
First-Time Customers’, Jakarta Globe, 10 September.
https://jakartaglobe.id/context/bank-indonesia-relaxes-agent-regulation-
sign-first-time-customers/ (accessed 22 June 2020).
Dupas, P., and J. Robinson (2013), ‘Why Don’t the Poor Save More? Evidence
from Health Savings Experiments’, American Economic Review, 103(4),
pp.1138–71.
Dupas, P., D. Karlan, J. Robinson, and D. Ubfal (2018), ‘Banking the Unbanked?
Evidence from Three Countries’, American Economic Journal: Applied
Economics 10(2), pp.257–97.
Greenwood, J., and B. Jovanovic (1990), ‘Financial Development, Growth, and
the Distribution of Income’, Journal of Political Economy, 98(5), pp.1076–
107.
Guiso, L., P. Sapienza, and L. Zingales (2009), ‘Cultural Biases in Economic
Exchange?’ Quarterly Journal of Economics, 124(3), pp.1095–131.
Karlan, D., and J. Morduch (2010), ‘Access to Finance’, in D. Rodrik, and M.
Rosenzweig, Handbook of Development Economics, Volume 5. New York:
Elsevier, pp.4703–84.
Kikkawa, K., and Y. Xing (2014), ‘Financial Inclusion in Indonesia: A Poverty
Alleviation Strategy’, in Financial Inclusion in Asia. Tokyo: Asia-Pacific
Finance and Development Center and Asian Development Bank
Institute, pp.45–62.
Levine, R. (2005), ‘Finance and Growth: Theory and Evidence’, in P. Aghion, and
S. N. Durlauf, Handbook of Economic Growth, Volume 1A. New York:
Elsevier, pp.865–934.
Modigliani, F. (1986), ‘Life Cycle, Individual Thrift, and the Wealth of Nations’,
American Economic Review, 76(3), pp.297–313.
Nielsen, K.B. (2014), ‘10 Useful Data Sources for Measuring Financial
Inclusion’, Blog post. https://www.cgap.org/blog/10-useful-data-sources-
measuring-financial-inclusion (accessed 19 September 2019).
Otoritas Jasa Keuangan (2015), Statistik Perbankan Indonesia [Indonesia
Banking Statistics] (Volume 14, No. 1), Jakarta: Otoritas Jasa Keuangan.

31
Otoritas Jasa Keuangan (2019), Statistik Perbankan Indonesia [Indonesia
Banking Statistics] (Volume 17, No. 4), Jakarta: Otoritas Jasa Keuangan.
Park, C.-Y., and R. Mercado (2015), ‘Financial Inclusion, Poverty, and Income
Inequality in Developing Asia.’ Asian Development Bank Economics
Working Paper Series, 426.
Prina, S. (2015), ‘Banking the Poor Via Savings Accounts: Evidence from a Field
Experiment’, Journal of Development Economics, 115, pp.16–31.
Rosengard, J.K., and A. Prasetyantoko (2011), ‘If the Banks Are Doing So Well,
Why Can't I Get a Loan? Regulatory Constraints to Financial Inclusion in
Indonesia’, Asian Economic Policy Review, 6(2), pp.273–96.
Sarma, M., and J. Pais (2011), ‘Financial Inclusion and Development’, Journal of
International Development, 23(5), pp.613–28.
Strauss, J., F. Witoelar, and B. Sikoki (2016), ‘The Fifth Wave of the Indonesia
Family Life Survey (IFLS5): Overview and Field Report’, WR-1143/1-
NIA/NICHD. RAND Corporation: California.
Strauss, J., F. Witoelar, B. Sikoki, and A.M. Wattie (2009), ‘The Fourth Wave of
the Indonesia Family Life Survey (IFLS4): Overview and Field Report’,
WR-675/1-NIA/NICHD. RAND Corporation: California.
Tim Nasional Percepatan Penanggulangan Kemiskinan (TNP2K) 2018, The
Future of the Social Protection System in Indonesia: Social Protection for
All. Jakarta: TNP2K.
World Bank (2010), Improving Access to Financial Services in Indonesia.
Washington, DC: World Bank.
Zhang, Q, and A. Posso (2019), ‘Thinking Inside the Box: A Closer Look at
Financial Inclusion and Household Income’, The Journal of Development
Studies, 55(7), pp.1616–31.
32
ERIA Discussion Paper Series
No. Author(s) Title Year
2020-16
(no.342)
Kimty SENG The Poverty-Reducing Effects of
Financial Inclusion: Evidence from
Cambodia
September
2020
2020-15
(no. 342)
Rajabrata BANERJEE,
Ronald DONATO,
Admasu Afsaw
MARUTA
The Effects of Financial Inclusion on
Development Outcomes: New Insights
from ASEAN and East Asian
Countries
September
2020
2020-14
(no. 341)
Rajabrata BANERJEE
and Ronald DONATO
The Composition of Financial
Inclusion in ASEAN and East Asia: A
New Hybrid Index and Some Stylised
Facts
September
2020
2020-13
(no. 340)
Tony CAVOLI and
Rashesh SHRESTHA
The Nature and Landscape of
Financial Inclusion in Asia
September
2020
2020-12
(no. 339)
Han PHOUMIN, TO
Minh Tu, THIM Ly
Sustainable Water Resource
Development Scenarios and Water
Diplomacy in the Lower Mekong
Basin: Policy Implications
September
2020
2020-11
(no. 338)
Kiki VERICO and Mari
Elka PANGESTU
The Economic Impact of Globalisation
in Indonesia
August
2020
2020-10
(no. 337)
Yuziang YANG and
Hongyong ZHANG
The Value-Added Tax Reform and
Labour Market Outcomes: Firm-Level
Evidence from China
August
2020
2020-09
(no. 336)
Juthathip
JONGWANICH,
Archanun
KOHPAIBOON, Ayako
OBASHI
Technological Advancement, Import
Penetration, and Labour Markets:
Evidence from Thai Manufacturing
August
2020
2020-08
(no. 335)
Duc Anh DANG and
Thu Thu VU
Technology Imports and Employment
in Developing Countries: Evidence
August
2020
33
from Viet Nam
2020-07
(no. 334)
Hiroaki ISHIWATA,
Hiroyuki WADA, Koji
SUZUKI, Makoto
IKEDA, Naoto TADA
A Quantitative Analysis of Disaster
Risk Reduction Investment Effects for
Sustainable Development: Indonesia
Case Study
June 2020
2020-06
(no. 333)
Dao Ngoc TIEN,
Nguyen Quynh HUONG
Assessment of Industrial Cluster
Policies in Viet Nam: The Role of
Special Economic Zones in Attracting
Foreign Direct Investment
June 2020
2020-05
(no. 332)
Ayako OBASHI and
Fukunari KIMURA
New Developments in International
Production Networks: Impact of
Digital Technologies
June 2020
2020-04
(no. 331)
Upalat
KORWATANASAKUL,
Youngmin BAEK,
Adam MAJOE
Analysis of Global Value Chain
Participation and the Labour Market in
Thailand:
A Micro-level Analysis
May 2020
2020-03
(no. 330)
Ha Thi Thanh DOAN
and Huong Quynh
NGUYEN
Trade Reform and the Evolution of
Agglomeration in Vietnamese
Manufacturing
April
2020
2020-02
(no. 329)
Kazunobu
HAYAKAWA, Tadashi
ITO, Shujiro URATA
Labour Market Impacts of Import
Penetration from China and Regional
Trade Agreement Partners:
The Case of Japan
April
2020
2020-01
(no. 328)
Fukunari KIMURA,
Shandre Mugan
THANGAVELU,
Dionisius A.
NARJOKO, Christopher
FINDLAY
Pandemic (COVID-19) Policy,
Regional Cooperation, and the
Emerging Global Production Network
April
2020
ERIA discussion papers from the previous years can be found at:
http://www.eria.org/publications/category/discussion-papers
Related Documents