California HealthCare Foundation The Financial Health of California Hospitals June 2007

Welcome message from author
This document is posted to help you gain knowledge. Please leave a comment to let me know what you think about it! Share it to your friends and learn new things together.
Transcript

California HealthCare Foundation
The Financial Health of California HospitalsJune 2007

pwc
The Financial Health of California Hospitals California HealthCare Foundation June 2007 Commissioned by a grant from the California HealthCare Foundation. PricewaterhouseCoopers’ services were performed, and this report was developed in accordance with our engagement letter dated Feb. 3, 2006, (CHCF reference 05-1574) and are subject to the terms and conditions included therein. Our services were performed in accordance with Standards for Consulting Services established by the American Institute of Certified Public Accountants (AICPA). The procedures we performed did not constitute an examination or a review in accordance with generally accepted auditing standards or attestation standards. Accordingly, we provide no opinion, attestation or other form of assurance with respect to our work or the information upon which our work was based. We did not audit or otherwise verify the information supplied to us in connection with this engagement, from whatever source, except as may be specified in this report or in our engagement letter. Our work was limited to the specific procedures and analysis described herein and was based only on the information made available through March 13, 2007. Accordingly, changes in circumstances after this date could affect the findings outlined in this report. © 2007 PricewaterhouseCoopers LLP. All rights reserved. PricewaterhouseCoopers LLP refers to the PricewaterhouseCoopers LLP (a Delaware limited liability partnership) or, as the context requires, other member firms of PricewaterhouseCoopers International Limited, each of which is a separate and independent legal entity.


i
Acknowledgments PricewaterhouseCoopers, LLP would like to gratefully acknowledge the assistance of the following: Advisory Board Blue Shield of California Andrea Brown, Director of Contracting Blue Shield of California Eileen Duncan, Director of Network Strategy California Hospital Association Sherrata Lane, VP Reimbursement & Economic Analysis California Nurses Foundation Anna Mullins, RN, DNSC California Office of Statewide Health Planning Mike Rodrian, Deputy Director & Development Catholic Healthcare West Lisa Zuckerman, Vice President, Treasury Services City & County San Francisco Dept. Public Health Mitchell Katz, MD, Director of Health Glendale Memorial Hospital Ignacio Valdes, MD Kaiser Permanente Michele Flanagin, VP, Delivery Systems Strategy Kaiser Permanente Roland Lyon, Executive Director, Regional Strategy New Century Healthcare Institute Wanda Jones, President Office of Assembly Member John Laird Michael Dimmitt, Principal Consultant Providence Health System of California Michael Madden, Chief Executive Officer San Joaquin General Hospital Kenneth Cohen, Chief Executive Officer SEIU, United Healthcare Workers West Richard Thomason, Policy Director Tehachapi Valley District Hospital Raymond Hino, Chief Executive Officer University of California Office of the President Santiago Munoz, Executive Director Clinical Service
Development UCSF Medical Center Kenneth Jones, Chief Financial Officer Participants in the PricewaterhouseCoopers Interviews with California Healthcare Leaders California Association of Public Hospitals Melissa Stafford Jones, Chief Executive Officer California Office of Statewide Health Planning Michael Rodrian, Deputy Director & Development Cedars-Sinai Medical Center Thomas Priselac, Chief Executive Officer Cedars-Sinai Medical Center Richard Jacobs, Senior Vice President Cedars-Sinai Medical Center Edward Prunchunas, Chief Financial Officer Daughters of Charity Health System Marc Golan, Chief Financial Officer Healthcare Partners Robert Margolis, MD, President & Chief Executive
Officer Hoag Memorial Hospital Presbyterian Richard Afable, MD, Chief Executive Officer Kaiser Permanente Roland Lyon, Executive Director, Regional Strategy Los Angeles County Department of Health Services Gary Wells, Chief Financial Officer Memorial Health System Francis Henckel, Chief of Hospital Operations Memorial Health System Barry Arbuckle, Ph.D, Chief Executive Officer New Century Healthcare Institute Wanda Jones, President Providence Health System Michael Madden, Chief Executive Officer San Joaquin General Hospital Kenneth Cohen, Chief Executive Officer SEIU, United Healthcare Workers West Richard Thomason, Policy Director Tehachapi Valley Healthcare District Raymond Hino, Chief Executive Officer University of California Office of the President William Gurtner, Vice President Clinical Services University of California Office of the President Santiago Munoz, Executive Director Clinical Service
Development

ii
Acknowledgments Principal PricewaterhouseCoopers Authors of This Report Kevin Baldwin, Engagement Partner Michael Galper, Partner Scott Burns, Director, Los Angeles Janice Drennan, Manager, Tampa Jackie Edwards, Director, Phoenix Susan Maerki, Director, San Francisco PricewaterhouseCoopers Subject Matter Specialists Deborah Allbach, Senior Associate, Dallas Christine Armstrong, Managing Director, Dallas Nancy Bateman, Managing Director, Phoenix Ann Filiault, Director, New York Gary Garbrecht, Partner, Denver Patricia Glenn, Manager, Dallas Sandra Hunt, Partner, San Francisco Chad Leopard, Partner, Dallas Sandy Lutz, Director, PwC Health Research Institute, Dallas Devindra Patel, Senior Associate – Data and Analytics, Los Angeles Vanessa Sam, Senior Associate – Data and Analytics, San Francisco

Financial Health of California Hospitals iii PricewaterhouseCoopers LLP
Table of Contents Page Chapter 1: Executive Summary ..................................................................................... 1–1
Key Findings of 1995–1999 Report ...........................................................................1–1 Profitability............................................................................................................1–1 Volume, Operations and Other Performance Measures......................................1–1
Key Findings of 2001 -2005 Report ...........................................................................1–2 Profitability............................................................................................................1–2 Volume, Operations and Other Performance Measures......................................1–3
Dynamics of the California Health Care Market.........................................................1–4 Government Programs.........................................................................................1–4 California’s Seismic Law ......................................................................................1–4 Uninsured Population...........................................................................................1–5 Quality Initiatives ..................................................................................................1–5 Consumer-Driven Health Care.............................................................................1–5 Rising Expenses...................................................................................................1–5 Shifting Demographics .........................................................................................1–5 Consolidation of Health Care Payers and Providers............................................1–5
Health Care Reform in California...............................................................................1–6 Key Provisions of Governor’s Proposal ...............................................................1–6
Assessment of the Financial Health of California Hospitals ......................................1–7 Methodology...............................................................................................................1–7
Use of Medians ....................................................................................................1–7
Chapter 2: Historical Overview ...................................................................................... 2–1 Hospital Expansion through Public Financing ...........................................................2–3
Medicare and Medicaid Propel Hospital Expansion.............................................2–3 California Reacts to Federal Funding Shifts ........................................................2–4 California Legislation Further Challenges Hospitals ............................................2–5
National Health Care Expenditures: Recent Trends..................................................2–5 Competitive Environment...........................................................................................2–8
Growth of Managed Care.....................................................................................2–8 Kaiser HMO Opens to Public after World War II..................................................2–8 New Models of Managed Care Reshape California Health Care Market ............2–8 HMO Enrollment Declines....................................................................................2–9 Hospitals Feel Financial Pressure from Managed Care ....................................2–11 Mergers and Acquisitions...................................................................................2–13 Pricing Pressure.................................................................................................2–14 Consumer Influence on the Health Care Market................................................2–15
Summary..................................................................................................................2–17

Financial Health of California Hospitals iv PricewaterhouseCoopers LLP
Chapter 3: Description of the California Hospital Industry ......................................... 3–1 Key Findings ..............................................................................................................3–1 Hospital and Bed Trends ...........................................................................................3–1 California Hospital Composition, Typology and Trends.............................................3–4
Composition by Size ............................................................................................3–4 Distribution by Ownership/Type of Control ..........................................................3–5 Rural Hospitals by Type of Control ......................................................................3–8 Distribution by Geographic Region ....................................................................3–10 Distribution by System Designation ...................................................................3–15 Distribution of Hospitals by Seismic Zone..........................................................3–16 Composition by Academic Medical Center ........................................................3–16 Disproportionate Share and Safety Net Hospitals .............................................3–19
Summary..................................................................................................................3–22
Chapter 4: Payment Structures and Utilization Trends ............................................... 4–1 Key Findings ..............................................................................................................4–1 Payment Structure .....................................................................................................4–2
Contractual Allowances........................................................................................4–4 Hospital Utilization Trends .........................................................................................4–8
Utilization Trends 2001–2005 Compared to 1995–1999 ...................................4–10 California Acute Hospital ALOS and Severity of Care .......................................4–12 Case Mix Index...................................................................................................4–14
California Median Acute Care Inpatient Hospital ALOS ..........................................4–16 California Acute Care Hospital Outpatient Utilization Trends ..................................4–18 Medicare DRGs and Outpatient APCs ....................................................................4–20
The Experience of California Hospitals with Medicare Outpatient Reimbursement ..................................................................................................4–20
Summary..................................................................................................................4–22
Chapter 5: Comparing California Hospitals to the Nation........................................... 5–1 Key Findings ..............................................................................................................5–1 Utilization Rates .........................................................................................................5–2 Hospital Bed Supply...................................................................................................5–3 Profitability..................................................................................................................5–4 Managed Care ...........................................................................................................5–5 Uninsured Population.................................................................................................5–8 Operating and Capital Costs......................................................................................5–8 Doing More with Less ................................................................................................5–9

Financial Health of California Hospitals v PricewaterhouseCoopers LLP
Chapter 6: California Operating and Total Margin Trends .......................................... 6–1 Key Findings ..............................................................................................................6–1 Operating Margin as Primary Indicator of Financial Health .......................................6–1 Nonoperating Revenue ..............................................................................................6–5 Operating Margin Compared to Total Margin ............................................................6–6 Operating Margin by Hospital Characteristics ...........................................................6–9
Operating Margin by Size.....................................................................................6–9 Operating Margin by Ownership/Type of Control...............................................6–10 Operating Margin by Rural and Urban ...............................................................6–11 Operating and Total Margin by DSH Status.......................................................6–13 Operating Margin by Type of Control and DSH Status......................................6–16 Operating Margin by Region ..............................................................................6–18 Operating Margin by System and Nonsystem ...................................................6–19
Operating Margin by Quartiles (High- and Low-Margin Hospitals) ..........................6–20 System and Nonsystem Hospitals .....................................................................6–20 Hospitals by Ownership/Type of Control............................................................6–22
Median Operating Margins 2001–2005 Compared to 1995–1999 ..........................6–26 Summary..................................................................................................................6–27
Chapter 7: Revenue and Expense Trends .................................................................... 7–1 Key Findings ..............................................................................................................7–1 California Hospital Revenue and Expense Trends....................................................7–2 Quartile Revenue, Expense and Utilization for High- and Low-Margin Hospitals .....7–6 California Hospital Revenue Trends ........................................................................7–13
Median Operating Patient Revenue per Day and Discharge Trends.................7–13 Median Outpatient Gross Revenue Mix Trends by Typology ............................7–22
California Hospital Expense Trends ........................................................................7–24 Expense Trends by California Hospital Typology ..............................................7–24 Distribution of Expenses by Category................................................................7–27 Salary and Benefit Expense...............................................................................7–31
Nursing Staff as a Component of Labor Supply and Expense ................................7–33 Supply Expense .................................................................................................7–37
Comparing Revenue and Expenses 2001–2005 to 1995–1999..............................7–42 Summary..................................................................................................................7–44
Chapter 8: Capital Financing and Access..................................................................... 8–1 Key Findings ..............................................................................................................8–1 Liquidity: Days Cash on Hand....................................................................................8–4 Liquidity: Debt Service Coverage Ratio .....................................................................8–7 Capital Structure: Debt to Capitalization....................................................................8–9 Summary..................................................................................................................8–15

Financial Health of California Hospitals vi PricewaterhouseCoopers LLP
List of Figures Page Figure 1.1: Median Operating Margins, California versus the United States............................................1–2 Figure 2.1: Timeline of Important Events Affecting California Hospitals...................................................2–2 Figure 2.2: National Health Expenditures in the United States 1999–2005 .............................................2–5 Figure 2.3: National Health Expenditures for Health Services and Supplies (Dollars in Billions).............2–6 Figure 2.3B: National Health Expenditures per Capita: Hospital Care 1998–2005..................................2–7 Figure 2.4: California HMO Enrollment 1999–2005................................................................................2–10 Figure 2.5: Median Average Acute Length of Stay in California (ALOS) 2000–2005.............................2–12 Figure 2.6: National Hospital Mergers and Acquisitions: Number of Deals............................................2–13 Figure 2.7: Increase in Premiums Compared to Inflation, California vs. U.S .........................................2–15 Figure 3.1: OSHPD Acute Care Hospital Count 2001–2005 ....................................................................3–2 Figure 3.2: California and United States: Hospital Staffed Beds to Population Ratio 1999–2005 ...........3–2 Figure 3.3: Occupancy Rates for All California Hospitals 2001–2005......................................................3–3 Figure 3.4: Composition of California Hospitals by Hospital Size 2001–2005..........................................3–4 Figure 3.5: California Hospital Occupancy Rates by Hospital Size 2001–2005.......................................3–5 Figure 3.6A: California General Acute Care Hospitals by Type of Control 2001–2005............................3–6 Figure 3.6B: California General Acute Care Hospitals by Type of Control 2005......................................3–7 Figure 3.7: California Hospital Occupancy Rates by Type of Control 2001–2005 ...................................3–8 Figure 3.8: Rural Hospitals by Type of Control Compared to All Other California Hospitals 2001–2005 ................................................................................................................................................3–9 Figure 3.9A: Geographic Regions Map...................................................................................................3–10 Figure 3.9B: Distribution of Hospitals by Geographic Regions 2001 and 2005......................................3–11 Figure 3.10A: California Hospitals by Region 2001–2005 ......................................................................3–12 Figure 3.10B: California Hospitals by Region 2001–2005, Continued ...................................................3–13 Figure 3.11: California Hospital Type of Control by Region 2005...........................................................3–14 Figure 3.12A: California Hospitals by System Designation in 2005 .......................................................3–15 Figure 3.12B: California Hospitals by System Designation and Size in 2005 ........................................3–16 Figure 3.13A: Composition of Academic Medical Centers (AMCs) in 2005 ...........................................3–17 Figure 3.13B: Academic Medical Centers (AMCs) as Percent of All Hospitals in 2005 .........................3–17 Figure 3.14: Academic Medical Centers by Size in 2005 .......................................................................3–18 Figure 3.15: Count of Disproportionate Share Hospitals 2001–2005 .....................................................3–20 Figure 3.16: Medi-Cal and Indigent Care Adjusted Days as a Percentage of Total Adjusted Patient Days 2001–2005.........................................................................................................................3–21 Figure 4.1: Distribution by Payer Category; Net Patient Revenue 2001 versus 2005..............................4–3 Figure 4.2: Distribution by Payer Category; Outpatient Gross Revenue: 2001 versus 2005 ...................4–4 Figure 4.3A: Contractual Allowances per Adjusted Patient Day by Payer Category 2001–2005.............4–5 Figure 4.3B: Contractual Allowances as Percentage of Gross Charges by Payer Category 2001–2005 ................................................................................................................................................4–6 Figure 4.4: CMI Adjusted Net Revenue as Percentage of Average Cost per Adjusted Patient Day by Payer Category 2001–2005..........................................................................................................4–7 Figure 4.5: California Population, Patient Days and Discharges 2001–2005...........................................4–8
Financial Health of California Hospitals vii PricewaterhouseCoopers LLP
Figure 4.6: California General Acute Care Hospital Inpatient Days and Discharges by Category of Care 2001–2005....................................................................................................................4–9 Figure 4.7: California Acute Hospital System Utilization per 1,000 Population ......................................4–10 Figure 4.8: Hospital Utilization 1995–1999 and 2001–2005...................................................................4–11 Figure 4.9: Average Length of Stay (ALOS) Perinatal versus Nonperinatal...........................................4–12 Figure 4.10: California Acute Hospital ALOS by Payer Category...........................................................4–13 Figure 4.11A: California Hospital Median Total and Medicare Case Mix Index .....................................4–14 Figure 4.11B: California Hospital Median Total Case Mix Index by Hospital Size .................................4–15 Figure 4.11C: California Hospital Median Total Case Mix Index by Type of Control..............................4–15 Figure 4.12: Median Acute ALOS Based on Acute Care Days and Acute Care Discharges by Typology.............................................................................................................................................4–17 Figure 4.13: California Acute Hospital System Outpatient Utilization per 1,000 California Population ...............................................................................................................................................4–18 Figure 4.14: Percent of Outpatient Surgeries by Facility Type, United States 1981–2005*...................4–19 Figure 4.15: Distribution of Surgeries by Facility Type, California 2000–2005.......................................4–20 Figure 4.16: Selected California Hospitals: APC Service Mix Index 2002–2007....................................4–21 Figure 5.1: Inpatient Utilization, California versus United States..............................................................5–2 Figure 5.2: Hospital Beds per 1,000, California versus United States......................................................5–3 Figure 5.3: Median Operating Margins for Hospitals, California versus United States ............................5–4 Figure 5.4: Median Values, Percentage of Total Revenue from Inpatient and Outpatient Services, California versus United States.................................................................................................................5–4 Figure 5.5: Percentage of Hospital Discharges from Medicare and Medicaid, California versus United States.............................................................................................................................................5–5 Figure 5.6: California HMO Enrollment 2000–2006..................................................................................5–6 Figure 5.7: Percent Enrollment for Top Three HMOs by Line of Business 1999–2005 ...........................5–7 Figure 5.8: Median Hospital Salary per FTE, California versus United States .........................................5–9 Figure 6.1: Median Operating Margins, California versus the United States............................................6–2 Figure 6.2: Median Operating Margin Quartiles, California versus the United States..............................6–3 Figure 6.3: California Operating Margin 2001-2005 .................................................................................6–4 Figure 6.4: Composition of Total Revenue by Operating versus Nonoperating Revenue 2001–2005.....6–5 Figure 6.5: Proportion of Hospitals with Negative Operating Margin and Negative Total Margin 2001–2005 ................................................................................................................................................6–6 Figure 6.6: Comparison of Mean Operating Margin and Mean Total Margin for High-Margin Hospitals 2001–2005 ................................................................................................................................6–7 Figure 6.7: Comparison of Mean Operating Margin and Mean Total Margin for Low-Margin Hospitals 2001–2005 ................................................................................................................................6–8 Figure 6.8: Median Operating Margin by Hospital Size 2001–2005 .........................................................6–9 Figure 6.9: Median Operating Margins by Type of Control 2001–2005..................................................6–10 Figure 6.10: Median Operating Margins for Rural and Urban Hospitals 2001–2005..............................6–11 Figure 6.11: Median Operating Margins for Rural Hospitals by Quartile 2001–2005.............................6–12 Figure 6.12: Median Operating Margins for DSH and Non-DSH Hospitals 2001–2005.........................6–13 Figure 6.13: Median Operating Margins for DSH Hospitals by Quartile 2001–2005..............................6–14 Figure 6.14: Total Margins of DSH Hospitals by Quartile 2001–2005....................................................6–15

Financial Health of California Hospitals viii PricewaterhouseCoopers LLP
Figure 6.15: Median Operating Margins by Type of Control and DSH Status 2001–2005.....................6–16 Figure 6.16: Count of Hospitals by Type of Control and DSH Status 2001–2005..................................6–16 Figure 6.17: Operating and Total Margin of DSH Hospitals by Type of Control 2005............................6–17 Figure 6.18: Median Operating Margins by Region 2001–2005.............................................................6–18 Figure 6.19: Median Operating Margins for System and Nonsystem Hospitals 2001–2005..................6–19 Figure 6.20: Distribution of Hospitals by Quartile: Operating Margins of System and Nonsystem Hospitals 2001–2005 ..............................................................................................................................6–21 Figure 6.21: Distribution of Hospitals by Quartile: Operating Margins of City/County and District Hospitals 2001–2005 ..............................................................................................................................6–23 Figure 6.22: Distribution of Hospitals by Quartile: Operating Margins of For-Profit and Nonprofit Hospitals..................................................................................................................................................6–25 Figure 6.23: Median Operating Margins 2001–2005 Compared to 1995–1999 .....................................6–26 Figure 7.1: California Hospital Net Revenue, Expense and Utilization Trends 2001–2005 .....................7–3 Figure 7.2: California Revenue and Expenses per Adjusted Patient Day 2001–2005 .............................7–4 Figure 7.3: CMI-Adjusted Gross Revenue, Net Operating Revenue and Net Operating Expenses per Adjusted Patient Day 2001–2005 .......................................................................................................7–5 Figure 7.4A: California Hospital Top and Bottom Quartile and Median Operating Margins 2001–2005, Excluding Kaiser Data...........................................................................................................7–6 Figure 7.4B: California Hospital Top and Bottom Quartile and Median Operating Margins 2001–2005, Including Kaiser Data............................................................................................................7–7 Figure 7.5: Top Quartile Net Revenue, Expense and Utilization Trends 2001–2005...............................7–9 Figure 7.6: CMI-Adjusted Gross Revenue, Net Operating Revenue and Net Operating Expenses per Adjusted Patient Day for High-Margin Hospitals 2001–2005 ...........................................................7–10 Figure 7.7: Bottom Quartile Net Revenue, Expense and Utilization Trends 2001–2005 .......................7–11 Figure 7.8: CMI-Adjusted Gross Revenue, Net Operating Revenue and Net Operating Expenses per Adjusted Patient Day for Low-Margin Hospitals 2001–2005 ............................................................7–12 Figure 7.9: Median Operating Revenue per Adjusted Patient Day (Adjusted for Case Mix) by Typology 2001–2005...............................................................................................................................7–14 Figure 7.10: Median Operating Revenue per Adjusted Patient Discharge (Adjusted for Total Case Mix) by Typology 2001–2005 ........................................................................................................7–16 Figure 7.11: California Acute Hospital Net Patient Revenue by Payer Category 2001–2005................7–17 Figure 7.12: Percent Distribution of Net Revenue by Payer Category for High-Margin Hospitals 2001–2005 ..............................................................................................................................7–18 Figure 7.13: Percent Distribution of Net Revenue by Payer Category for Low-Margin Hospitals 2001–2005 ..............................................................................................................................................7–19 Figure 7.14: Gross Outpatient Revenue/Gross Total Patient Revenue by Payer 2001–2005 ...............7–21 Figure 7.15: Median Outpatient Gross Revenues/Total Gross Revenues by Typology 2001–2005......7–23 Figure 7.16: CMS Medical Price Deflator 2001–2005 ............................................................................7–24 Figure 7.17: California Hospital Expenses by Region ............................................................................7–25 Figure 7.18: California Hospital Expenses by Type of Control ...............................................................7–25 Figure 7.19: Median Operating Expense per Adjusted Patient Day (Adjusted for Case Mix) by Typology 2001–2005...............................................................................................................................7–26 Figure 7.20: California Hospital Expenses by Expense Category ..........................................................7–28 Figure 7.21: California Hospital Expenses by Expense Category 2001 and 2005.................................7–29 Figure 7.22: California Hospital Expenses per Adjusted Patient Day (Select Categories).....................7–30

Financial Health of California Hospitals ix PricewaterhouseCoopers LLP
Figure 7.23: Median Salary and Wages per Adjusted Patient Day (Adjusted for Case Mix) by Typology 2001–2005...............................................................................................................................7–32 Figure 7.24: Percentage of Productive Hours by Staff Classification 2001–2005..................................7–33 Figure 7.25: Percentage of Total Nursing Hours by Staff Classification 2001–2005..............................7–34 Figure 7.26: Nursing Hours per Adjusted Patient Day 2001–2005.........................................................7–35 Figure 7.27: Median Supplies Expense per Adjusted Patient Day (Adjusted for Case Mix) by Typology 2001–2005...............................................................................................................................7–37 Figure 7.28: California Historical and Projected Pharmacy Expenses as Percentage of Total Hospital Expenses 2001–2004 ...............................................................................................................7–38 Figure 7.29: Median Purchased Services Expense per Adjusted Patient Day (Adjusted for Case Mix) by Typology 2001–2005 ........................................................................................................7–39 Figure 7.30: Median Other Professional Fees Expense per Adjusted Patient Day (Adjusted for Case Mix) by Typology 2001–2005 ........................................................................................................7–40 Figure 7.31: Total Lease, Insurance and Interest Expense Data for Entire California Health System 2001–2005 .................................................................................................................................7–41 Figure 7.32: Revenue and Expenses 1995–1999 and 2001–2005 ........................................................7–42 Figure 7.33: Major Expense Categories 1995–1999 and 2001–2005 ....................................................7–43 Figure 8.1: California Hospital Credit Ratios 2001–2005..........................................................................8–2 Figure 8.2: Key Financial Metrics for California Hospitals Compared to Standard & Poor’s Bond Credit Ratings 2005.........................................................................................................................8–4 Figure 8.3: Median Days Cash on Hand 2001–2005................................................................................8–6 Figure 8.4: Median Debt Service Coverage Ratios 2001–2005 ...............................................................8–8 Figure 8.5: Median Long-Term Debt to Total Capital Ratios 2001–2005 ...............................................8–10 Figure 8.6: Credit Ratios Median of Top Quartile 2001 and 2005 ..........................................................8–11 Figure 8.7: Credit Ratios Median of Bottom Quartile 2001 and 2005.....................................................8–11 Figure 8.8: California Hospital Credit Ratings 2005................................................................................8–12 Figure 8.9: Average Age of Plant by Region...........................................................................................8–13 Figure 8.10: Median Days Cash on Hand Comparison 1995–1999 and 2001–2005.............................8–14


Financial Health of California Hospitals 1-1 PricewaterhouseCoopers LLP
Chapter 1: Executive Summary
This report, prepared for the California Healthcare Foundation by PricewaterhouseCoopers, examines data on California general acute care hospitals reported to the California Office of Statewide Health Planning for the years 2001 through 2005 to analyze the recent financial health of California hospitals and to highlight trends that may influence future financial performance.
An earlier report prepared for the Foundation in 2001, The Financial Health of California’s Hospitals, raised concerns about the financial viability of the state’s hospitals and concluded that the “potential for a crisis situation,” in which a large proportion of California hospitals would face closure, was “greater than ever.”1 That report, prepared by Shattuck Hammond Partners, focused on the years 1995 through 1999.
In contrast, this analysis concludes that the dire predictions of closures did not occur. Overall, median hospital operating margins improved, but net revenue and expenses rose at nearly the same rate, resulting in break-even to slightly positive performance. The slim operating profits mean many hospitals may not be able to build the reserves or access the capital necessary to meet the technological, regulatory, and market challenges facing the hospital industry.
Key Findings of 1995–1999 Report Because of the contrast in performance between the two analysis periods, it is helpful to understand the financial performance of California hospitals over the 1995 to 1999 period.
Profitability More than half of California hospitals were losing money. In 1999, California hospitals reported
a negative median operating margin of -0.33 percent, well below the U.S. hospital median.2
A gap between the median operating margins of high-margin (top quartile) and low-margin (bottom quartile) hospitals widened from 10.8 percent in 1995 to 13.5 percent in 1999. Low-margin hospitals typically were small (less than 200 beds); rural; district-, city- or county-owned; not affiliated with a system; and receiving Medicaid Disproportionate Share Hospital (DSH) funding. High-margin hospitals tended to be medium-large or medium-small for-profit or system-affiliated urban hospitals.3
In 1999, the median credit ratio profile of California hospitals was one notch above junk-bond status, which negatively affected access to capital.4 The report predicted that a significant portion of California hospitals would not have access to capital sufficient to fund the requirements of the state seismic standards law, which mandates that all hospital buildings be earthquake safe by 2030.5
Volume, Operations and Other Performance Measures California’s HMO penetration stood at 54 percent in 1999, compared to 34 percent for the
nation. Approximately 85 percent of HMO members were in five health plans, indicating consolidated purchasing power for hospital services in the hands of a limited number of payers.6
Case mix index (CMI), a measure of illness severity, was 9.8 percent higher in California than nationwide, indicating that hospitals in the state were treating sicker patients with more complicated illnesses.7
California faced a nursing shortage, with the fewest nurses per capita in the nation. Yet the state’s median salary per full-time equivalent (FTE) was 25 percent higher than the U.S. median, and its staffing expense growth was lower than the rate of inflation.8
California’s uninsured population was 20.3 percent, compared to 15.5 percent for the United States.9

Financial Health of California Hospitals 1-2 PricewaterhouseCoopers LLP
Key Findings of 2001 -2005 Report The crisis scenario predicted to manifest itself in “widespread hospital closures”10 did not materialize. To the contrary, most California hospitals survived the first five years of the decade stronger financially than predicted. Although 26 general acute care hospitals closed between 2001 and 2005, the decline of 7.31 percent in the number of hospitals over the period was similar to the 7 percent decline from 1995 to 1999.
One problem persisted — a dichotomy between high- and low-margin hospitals. In 2005, the median operating margin for the bottom quartile was negative 5.6 percent, compared to positive 7.3 percent for the top quartile. While narrowing slightly from 13.9 percent in 2001 to 12.9 percent in 2005, the gap between operating margins of high- and low-margin hospitals remained large.
Other key findings of the 2001–2005 report are:
Profitability Despite improvement in net operating margins since 1999 and a move into positive territory
beginning in 2000, median operating margins for general acute care hospitals in California hovered near the break-even point over the period. Based on California Office of Statewide Health Planning and Development (OSHPD) data reports from 355 general acute care hospitals, the 2005 median operating margin was 1.3 percent. This slim margin, however, marked a substantial improvement from the 0.8 percent margin of 2001 and an even greater improvement from the -0.33 percent of 1999.
The proportion of hospitals with negative operating margins declined throughout the period. When nonoperating income is considered, the proportion of California hospitals with negative margins drops approximately 10 percent. In 2001, 46.3 percent of hospitals reported negative operating margins; this decreased to 38.5 percent by 2005. In 2005, 28.2 percent of California general acute care hospitals reported negative total margins.
Net revenue and average expense per adjusted patient day rose at approximately the same rate during 2001–2005.
California continued to trail the rest of the nation in operating margin. Based on national data, the median operating margin for California hospitals grew to 2.03 percent in 2005, a figure still lower than the U.S. all-hospital median of 2.89 percent.11
Figure 1.1: Median Operating Margins, California versus the United States 1999 2000 2001 2002 2003 2004 2005
California -0.0 0.2 0.24 0.81 1.97 1.69 2.03
U.S. 0.7 0.7 0.95 1.56 1.70 2.17 2.89
Source: Ingenix, “Medicare Cost Report Indicators, Operating Margin,” Almanac of Hospital Financial and Operating Indicators (2007), 320-321, and (2005), 306-307
Bed size, type of ownership, system affiliation and geographic location influenced profitability. Hospitals with the lowest operating margin were:
- Small hospitals (fewer than 150 beds)
- District hospitals
- City/county hospitals
- Rural hospitals
- Hospitals that treat a high percentage of Medi-Cal and indigent patients
- Independent hospitals not affiliated with a hospital system

Financial Health of California Hospitals 1-3 PricewaterhouseCoopers LLP
Hospitals with the highest operating margin were:
- Medium-large and large (greater than 250 beds)
- Affiliated with a hospital system
- Hospitals that treat a high percentage commercial patients
Location was a factor in profitability. Los Angeles County hospitals reported negative median operating margins, Northern and Sierra counties were slightly above break-even, and San Diego and Orange counties performed just under 1 percent. Sacramento area counties had the highest operating margins in 2005 at 10 percent.
Salaries and benefits were the fastest growing expenses for hospitals, with benefits increasing at a 16 percent compound annual growth rate from 2001 to 2005. In 2005, salaries and wages consumed 38 percent of hospital spending. Expenses grew at a faster rate during 2001–2005 than during the previous study period.
The state law mandating hospital nurse staffing ratios went into effect in 2004. Data show that hospitals responded by increasing nursing hours and the use of registry nurses. California’s nursing shortage continued. In 2005, California had 626 nurses per 100,000 residents, compared to 799 per 100,000 residents for the United States (Bureau of Labor Statistics data).12 Although California reported higher than average salaries per hospital full-time equivalent (FTE) than the United States overall, when adjusted for regional wage indices, those salaries ranked less than the national average.
The California health care sector (health insurers and acute care providers) exhibited improved credit quality over the 2001–2005 period, and Standard and Poor’s (S&P) reported a “solid rebound” in 2004 despite the state’s “extremely challenging” environment. That year the nonprofit hospital sector experienced more upgrades than downgrades in credit ratings for the first time in many years.13 Credit ratings for California hospitals by agencies such as Moody’s, S&P and Fitch Ratings compared favorably to those of hospitals nationally.
The low-margin hospitals, however, were unable to accumulate the magnitude of cash and liquid reserves typically required for a ratable credit and found it increasingly difficult to borrow money. These hospitals used internal capital to fund improvements or sustain operations because they were not able to access external sources or were unwilling to borrow at the interest rates available to them. Approximately 140 hospitals (44 percent) had financial indicators equal to a bond rating falling below S&P investment grade (junk bond status).
Nonprofit hospitals, particularly in urban areas of the state, had the most days of cash on hand, highest operating margin, optimal debt service coverage and debt-to-capital ratios. Conversely, small rural hospitals performed poorly in these areas. For-profit hospital data also showed clear deficiencies based on these metrics.
Volume, Operations and Other Performance Measures The number of available inpatient beds in California dropped from 2.2 beds per 1,000 residents
in 2001 to 1.9 per 1,000 residents in 2005. This decrease in inpatient capacity followed national trends, but the number of hospital beds per capita in California remained much lower than the national average, which was 2.7 beds per 1,000 in 2005, according to American Hospital Association statistics.14 California’s population continued to rise at rate of 1.14 percent as capacity decreased.
Utilization of hospital services, reflected in admissions and inpatient days, was lower in California than the United States over the five-year period. California admissions ranged from 97 to 98 per thousand, while the U.S. range was 117 to 120 per thousand. Inpatient days per thousand in California hospitals ranged from 512 to 531 versus a range of 681 to 704 for all U.S. hospitals.

Financial Health of California Hospitals 1-4 PricewaterhouseCoopers LLP
California hospitals treated sicker patients than during the previous study period. The case mix index (CMI), a measure of diagnostic severity, increased, along with average length of stay (ALOS) for acute care patients. Total CMI increased from 1.02 in 2001 to 1.05 in 2005. Acute care ALOS increased from 4.4 days in 2001 to 4.5 in 2005.
More than 1 million surgeries were performed in ambulatory surgery centers and clinics in California in 2005. That year procedures in ambulatory surgery centers represented a third of surgeries, up from less than a quarter of surgeries in 2000.
Since 2001, California hospitals have become more dependent on revenue from commercial insurers (private health plans) as government payment rates have failed to match the increase in expenses. The private third-party share of net revenue increased from 40 percent in 2001 to 45 percent in 2005. The combined Medicare and Medicaid (Medi-Cal) share decreased from 55 percent in 2001 to 50 percent in 2005.
The ownership of California hospitals (city/county, district, private nonprofit, for-profit) remained largely unchanged. Profitability varied with type of ownership. For-profit hospitals, which make up about a fourth of all California hospitals, experienced the biggest drop in revenue of any ownership sector, in contrast to the earlier report. They also reported the lowest occupancy rates. Academic medical centers, which represent only 7 percent of all California hospitals, generated one-fourth of all patient revenues.
California’s uninsured population continued to grow to more than 6.5 million in 2006. In 2005, 21.3 percent of the state’s population under the age of 65 had no health insurance. This figure was substantially higher than the U.S. Census Bureau estimate of 15.3 percent for the nation.15
Dynamics of the California Health Care Market This analysis of the financial health of California hospitals needs to consider external market forces that challenge hospitals on a daily basis and their potential impact. The major forces during the 2001–2005 period will continue to influence the ability of hospitals to maintain financial stability and to provide health care services for a growing population.
Government Programs Nearly half of the hospital days and services are for people covered under government programs. Changes in the rules and regulations of Medicare and Medicaid programs can have a negative or positive impact on hospital profitability. For hospitals designated as safety net or critical access, these changes are particularly critical because supplemental government payments enable these hospitals to provide care for high numbers of uninsured and low-income patients and rural residents who otherwise would not have access to hospital care.
One such major change in government funding during the report period was California’s new Medicaid Hospital Financing Waiver of July 2005, which revamped the funding sources and allocation methods for disproportionate share "safety net" hospitals and established a separate distressed hospital fund and safety net fund pool. The 23 designated public hospitals (17 county and 6 University of California hospitals) must now claim federal Medicaid matching funds primarily on the basis of certified public expenditures rather than intergovernmental transfers. In 2006, the waiver boosted public hospital funding by $242.8 million, a 12 percent increase over 2005.16 Because funding is capped for the remainder of the waiver, the total impact cannot be assessed.
California’s Seismic Law Although the state has granted extensions to the original 2008 and 2013 deadlines, hospitals will continue to struggle to meet the requirements of SB 1953, California’s Hospital Seismic Safety Law Amendment passed in 1994. Recent estimates suggest that hospitals will need up to $110 billion to fund the construction necessary to become earthquake safe by the 2030 deadline. This estimate does not include financing costs, which could double the financial impact of the seismic legislation.17 (See Appendix C for more information on the seismic law.)

Financial Health of California Hospitals 1-5 PricewaterhouseCoopers LLP
Uninsured Population California has among the highest number of uninsured of any state. An estimated 6.8 million people, 19 percent of the population, are without any source of insurance at some time during the year. The governor’s health care reform proposal contains provisions to address the number of uninsured, but the outcome of this proposal is unknown at this time.
Quality Initiatives Government, payer and consumer demands for quality care and transparency will require hospitals to spend more for quality improvement and reporting initiatives. The Deficit Reduction Act of 2005 required hospitals to report quality data to receive the full inflation update from Medicare. Furthermore, health insurers and major employers have implemented pay-for-performance programs, which reward providers that meet quality standards and may pay lower rates for those that do not.
Consumer-Driven Health Care Although enrollment numbers have been low in the early years of consumer-driven health plans, the number of employers offering high-deductible health plans with health savings accounts is rising; and federal and state governments are looking for incentives to promote their use as a way to control escalating health care costs. These plans shift more of the responsibility for payment to patients, which could potentially increase bad debt and drive pricing for hospital services lower as consumers shop for services.
Rising Expenses The costs of salaries, employee benefits and supplies will continue to rise. In addition to these direct costs, hospitals must make additional investment in clinical technology for new and more effective diagnostics and treatments and in information technology for electronic health records, medication management and privacy protection. Hospitals face a competitive labor market and must keep up with technological advances to recruit physicians, nurses and other clinical staff.
Shifting Demographics America’s aging population is expected to affect California hospitals by contributing to an increase in hospital admissions and in the complexity of cases that hospitals treat. About 80 percent of older Americans have at least one chronic condition. The cost of providing health care for an older American is three to five times greater than for someone under the age of 65.18 In 2000, California was home to 3.6 million people aged 65 and over, accounting for 10.6 percent of the state’s population. Of the elderly population, 16 percent were hospitalized during the year 2003.19 The U.S. Census Bureau projects that California’s 65-and-older portion will rise by 130.5 percent by 2030.20
California hospitals also need to address the needs of a high number of immigrants with limited English proficiency. Hiring clinical staff with foreign language skills continues to be a priority.
Consolidation of Health Care Payers and Providers Nationally and in California, commercial health insurers have merged to form large payer organizations with more power to negotiate competitive rates from hospitals and other health care service providers. One large purchasing organization in California recently asked a health plan to cut higher-cost hospitals from its network. Other payers have tied higher payments to quality standards. These payers and purchasers of hospital services will continue to exert pricing pressure on hospitals.
Managed care penetration in California remains high. In contrast to the national trend, HMOs continue to have a large presence in California, with a smaller though growing share of insured workers enrolled in PPOs. In 2005, 49 percent of workers covered by employer-sponsored health plans — and 47.7 percent of the total state population — were enrolled in an HMO, making California the state with the highest HMO penetration in the nation, more than twice the national average.21
Financial Health of California Hospitals 1-6 PricewaterhouseCoopers LLP
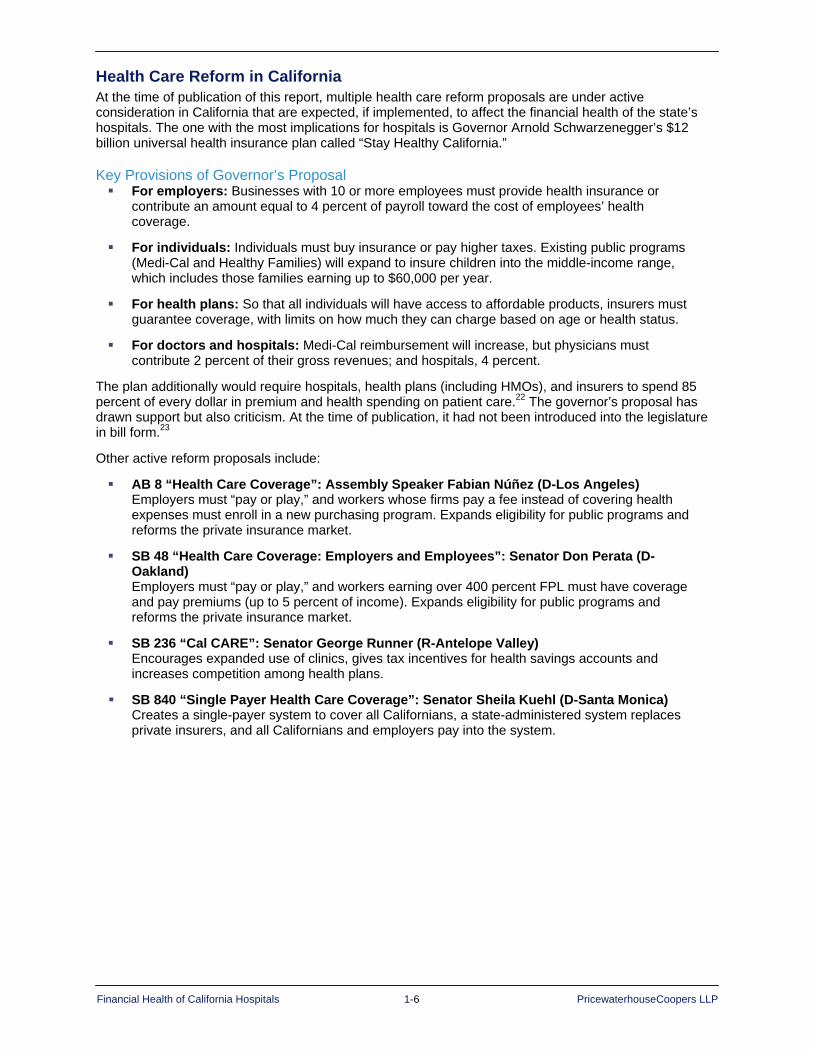
Health Care Reform in California At the time of publication of this report, multiple health care reform proposals are under active consideration in California that are expected, if implemented, to affect the financial health of the state’s hospitals. The one with the most implications for hospitals is Governor Arnold Schwarzenegger’s $12 billion universal health insurance plan called “Stay Healthy California.”
Key Provisions of Governor’s Proposal For employers: Businesses with 10 or more employees must provide health insurance or
contribute an amount equal to 4 percent of payroll toward the cost of employees’ health coverage.
For individuals: Individuals must buy insurance or pay higher taxes. Existing public programs (Medi-Cal and Healthy Families) will expand to insure children into the middle-income range, which includes those families earning up to $60,000 per year.
For health plans: So that all individuals will have access to affordable products, insurers must guarantee coverage, with limits on how much they can charge based on age or health status.
For doctors and hospitals: Medi-Cal reimbursement will increase, but physicians must contribute 2 percent of their gross revenues; and hospitals, 4 percent.
The plan additionally would require hospitals, health plans (including HMOs), and insurers to spend 85 percent of every dollar in premium and health spending on patient care.22 The governor’s proposal has drawn support but also criticism. At the time of publication, it had not been introduced into the legislature in bill form.23
Other active reform proposals include:
AB 8 “Health Care Coverage”: Assembly Speaker Fabian Núñez (D-Los Angeles) Employers must “pay or play,” and workers whose firms pay a fee instead of covering health expenses must enroll in a new purchasing program. Expands eligibility for public programs and reforms the private insurance market.
SB 48 “Health Care Coverage: Employers and Employees”: Senator Don Perata (D-Oakland) Employers must “pay or play,” and workers earning over 400 percent FPL must have coverage and pay premiums (up to 5 percent of income). Expands eligibility for public programs and reforms the private insurance market.
SB 236 “Cal CARE”: Senator George Runner (R-Antelope Valley) Encourages expanded use of clinics, gives tax incentives for health savings accounts and increases competition among health plans.
SB 840 “Single Payer Health Care Coverage”: Senator Sheila Kuehl (D-Santa Monica) Creates a single-payer system to cover all Californians, a state-administered system replaces private insurers, and all Californians and employers pay into the system.
Financial Health of California Hospitals 1-7 PricewaterhouseCoopers LLP
Assessment of the Financial Health of California Hospitals This study shows that the overall financial health of California hospitals has improved — but extreme variation in financial viability exists between the high-operating-margin and low-operating-margin hospitals. Some California hospitals are performing well financially, with operating margins substantially higher than the national median. Others are struggling to stay open. Whether these low-margin hospitals can access capital sufficient for them to meet the requirements of the state’s seismic law and withstand the ups and downs of government reimbursement and market pressures remains an unanswered question. High-margin hospitals have the ability to respond and adapt more successfully to ever-changing health care market forces. They will continue to thrive, while the low-margin hospitals will require help to survive. The chapters that follow provide an update to the 2001 report prepared for the California HealthCare Foundation. This update focuses on the years 2001 through 2005 and follows the outline of the prior report. The next chapter provides a historical overview of the California hospital industry. A description of the California hospital industry’s current composition, typology and trends follows. The report continues with an analysis of payment structures and utilization trends, operating margin trends, revenue and expense trends, and capital financing and access trends. It also includes a comparison of California hospitals to the nation. A set of appendices provides further information that supports the overall findings of this analysis.
Methodology This analysis relies primarily on the Selected Annual Financial data extract that state licensed hospitals report to the California Office of Statewide Health Planning and Development (OSHPD). It focuses on the subset of 350 to 385 general acute care hospitals that reported each year and excludes specialty hospitals, such as psychiatric hospitals, chemical dependency recovery hospitals, long-term acute care hospitals, state hospitals, rehabilitation facilities, skilled nursing and long-term care facilities, and the Shriners Children's hospitals. Appendix A provides a detailed description of the data and methods of this analysis.
This report also includes information from other publicly available sources, such as the American Hospital Association (AHA), California Hospital Association (CHA), Ingenix, Inc., California Medical Assistance Commission (CMAC), California Department of Health Services (CDHS), and references research by Congressional Budget Office (CBO), Medi-Cal Policy Institute, Healthcare Financial Management Association (HFMA) and California HealthCare Foundation (CHCF).
This analysis often refers to hospital operating margins. Operating margin, a measure of profitability, divides operating income by total net operating revenues (total net operating revenue minus operating expenses divided by total net operating revenue equals operating margin). Operating margin is derived from patient care revenue and excludes investment income. The operating margin calculation for publicly owned and operated hospitals, primarily city/county and district hospitals, does not include general revenue appropriations that are reported as nonoperating income. Kaiser Foundation hospitals report financial information for the Northern and Southern California regions; individual hospital results are not reported. For this analysis, each Kaiser hospital in a region is assigned the operating margin for the relevant region. Because Kaiser does not report separate inpatient and outpatient financial statistics, Kaiser hospitals are excluded from calculations that use adjusted patient day.
Use of Medians To minimize the effect of skewing from outliers, this analysis uses medians for the majority of the revenue, expense and margin trend analyses. The report also uses averages and sums for the evaluation of mathematical relationships.
The use of medians not only reduces the effects of outliers, but also provides insight into individual hospitals. Regardless of size, individual hospitals are the fundamental economic unit on whose financial performance the hospital industry depends for its financial health.
In addition to the data analysis, PricewaterhouseCoopers interviewed several key California health care leaders to gain diverse perspectives on the financial health of California hospitals. Appendix B provides highlights of the commentary gathered during the interviews.

Financial Health of California Hospitals 2-1 PricewaterhouseCoopers LLP
Chapter 2: Historical Overview
Throughout its history, California has led industrial, social and economic change in the United States. During the past few decades as the state charted a course for managed care, the nation has watched the state’s innovative structures for health care financing and delivery for signs of success and failure.24
California’s size alone makes it a microcosm for study. In 2005, California boasted the eighth largest economy in the world25 and a population of more than 36 million — more people than most nations and by far more than any other state.
Health spending has played a significant role in California’s economy, contributing 11 percent to its gross domestic product (GDP) of $1.551 trillion in 2004.26 Californians spent $169 billion on health care that year, although as a percent of GDP, California’s spending is lower than the national average of 16 percent of GDP.27 California spends more than $58 billion annually on hospital care.28
Moving into the new millennium, the health care industry in California faced a congruence of powerful challenges, which threatened to deliver a damaging blow to the financial health of its hospitals.29 Yet most California hospitals survived the first five years of the decade considerably stronger financially than predicted. This speaks to the resiliency of the industry and its ability to adapt to market trends. A dichotomy still exists, however, between hospitals that perform well financially and those that do not.
During the past 65 years, many influences, including state and federal legislation, shaped the California health care market and the current financial position of its hospitals. Figure 2.1, focusing on the period from 1990 to 2005, pinpoints some of the significant events in recent years. The section following Figure 2.1 looks back in time to summarize the major influences on California hospitals leading up to this period.

Financial Health of California Hospitals 2-2 PricewaterhouseCoopers LLP
Figure 2.1: Timeline of Important Events Affecting California Hospitals
1990
1990
2000
2000
Late
199
0sC
onsu
mer
ba
ckla
sh, h
alt o
f co
nsol
idat
ion
activ
ity,
prem
ium
s be
gin
to ri
se
2004
AB
394
nur
se-
to-p
atie
nt ra
tios
go in
to e
ffect
2006
Pas
sage
of A
B
1661
, gra
ntin
g ad
ditio
nal
two-
year
ext
ensi
on
to h
ospi
tal s
eism
ic
regu
latio
ns
2000
Pas
sage
of
MM
SB
IA,
miti
gatin
g im
pact
of B
BA 20
00P
assa
ge o
f SB
180
1, S
B
2006
and
AB
219
4,
prov
idin
g ex
tens
ions
, ex
cept
ions
and
lice
nsin
g pr
ovis
ions
to b
uffe
r the
im
pact
of S
B 1
953
(hos
pita
l sei
smic
re
gula
tions
)
1986
Pas
sage
of
EM
TALA
, en
surin
g pu
blic
ac
cess
to
emer
genc
y se
rvic
es
rega
rdle
ss o
f ab
ility
to p
ay
2000
Pas
sage
of M
MA
, re
duci
ng s
ome
Med
icar
e pa
ymen
t po
licie
s
2005
Pas
sage
of S
B
1100
and
co
rresp
ondi
ng
wai
ver,
chan
ging
m
echa
nism
for
Med
icai
d fu
ndin
g
2003
P
assa
ge o
f H
IPA
A, p
rote
ctin
g th
e co
nfid
entia
lity
of p
aten
ts' m
edic
al
reco
rds
1981
Pas
sage
of
Bor
en
Amen
dmen
t to
the
Om
nibu
s R
econ
cilia
tion
Act
of 1
981
auth
oriz
es D
SH
1993
Cal
PE
RS
dem
ands
5%
pr
emiu
m
redu
ctio
n fro
m it
s 18
H
MO
s
1999
Pas
sage
of A
B
394,
man
datin
g nu
rse-
to-p
atie
nt
ratio
s
1999
Pas
sage
of
BB
RA
, m
itiga
ting
impa
ct o
f BB
A
1999
Cal
iforn
ia
hosp
ital
med
ian
oper
atin
g m
argi
ns tu
rn
nega
tive
1996
-199
8Im
plem
enta
tion
of m
edic
al
man
aged
car
e pl
ans
in 1
3 C
alifo
rnia
co
untie
s
1997
Pas
sage
of
BBA
, red
ucin
g M
edic
are
pa
ymen
ts b
y $2
16 b
illio
n ov
er 5
yea
rs
1991
SB
855
esta
blis
hes
Cal
iforn
ia D
SH

Financial Health of California Hospitals 2-3 PricewaterhouseCoopers LLP
Hospital Expansion through Public Financing Federal and state legislation has affected reimbursement, shaped capital funding outlays, and influenced much of the cost of hospital operations. The federal Hill-Burton Act (Hospital Survey and Construction Act of 1946, PL 79-725) helped finance the majority of hospitals operating in California and the United States today. The programs under the Hill-Burton Act provided federal aid to survey existing hospitals and build additional facilities. Federal planners assumed in 1946 that the population would require 4.5 hospital beds per 1,000 people. To cover that need, during the 20 years following its passage, Hill-Burton provided capital for 4,678 hospital construction projects in the United States.30
This act had additional impact on the community service role of hospitals. In return for receiving Hill-Burton funds, facilities agreed to provide a reasonable volume of services to people unable to pay and to make their services available to anyone residing in the facility’s area. Although the program stopped providing funds in 1997, about 300 health care facilities nationwide — including two general hospitals, two mental hospitals and several outpatient clinics in California — are still obligated to provide free or reduced-cost care.31
Medicare and Medicaid Propel Hospital Expansion A second major national impetus for public health care — the 1965 Social Security Act Amendments, Title XVIII and Title XIX — came almost 20 years later. These amendments created the Medicare and Medicaid programs, which propelled further expansion of the hospital industry. These programs enabled most of the elderly, disabled and poor in the United States to have access to hospital, physician and home health care. Medicare (Title XVIII) also included a program to fund hospital capital costs.32 The Medicaid (Title XIX) program provided health care payments under federal-state matching programs for low-income people.
Medicare created a tax-based fund, administered in conjunction with Social Security, to pay for hospital benefits for elderly and disabled citizens. Medicare also created a fee for service payment structure for participating acute care hospitals based on reported costs. (See Appendix D for a detailed description of Medicare and Medicaid.)33
In the 18 years following the creation of Medicare and Medicaid, national health care expenditures climbed steeply. Medicare hospital expenses per beneficiary more than doubled between 1970 and 1975 and doubled again by 1980. Construction funding continued to be readily available, spurring the growth of capital assets of nonfederal acute care hospitals in the United States from approximately $16 million in worth in 1965 to $61 billion in 1977.34
The 1980s brought far-reaching reforms in federal payment and policy that would affect hospitals in California and the nation:
In 1981, the Boren Amendment to the federal Omnibus Budget Reconciliation Act (OBRA) created “disproportionate share” payments to help compensate hospitals for treating large numbers of low-income patients. The amendment allowed each state to create its own eligibility criteria for Disproportionate Share Hospitals (DSHs).35 California did not act until 1991 with SB 855 to establish the Medi-Cal Disproportionate Share Hospital Program.36
In 1982, the Tax Equity and Fiscal Responsibility Act authorized Medicare to contract with health maintenance organizations (HMOs) to cover beneficiaries who voluntarily enrolled.37
In 1983, Congress revamped Medicare’s inpatient hospital reimbursement system, replacing cost-based payments with the Prospective Payment System (PPS). PPS paid hospitals based on the diagnosis of the patient, as defined by the federal government’s diagnosis-related groups (DRGs) rather than what the hospital spent on treatment. Hospitals received a fixed amount per discharge based on the DRG.38

Financial Health of California Hospitals 2-4 PricewaterhouseCoopers LLP
PPS, which was phased in over the next several years, revolutionized cost management for hospitals. It rewarded hospitals financially when patients used fewer resources and stayed for shorter periods. In addition, as long as the fixed payment for a DRG was sufficient to cover a hospital’s costs, hospitals benefited more financially when patients were admitted rather than redirected to less-intensive settings. Furthermore, the federal government tied future payment increases to an index of hospital cost increases. Congress annually approved a PPS update that was less than the increase in the index, citing a need for efficiency by hospitals. As a result, national expenditures for hospital care grew at a much slower rate from 1985 to 1998 than they had in prior periods.39
California Reacts to Federal Funding Shifts On the statewide front, a turbulent time for California’s healthcare economy ensued as the 1990s brought a recession followed by the dot-com boom and subsequent bust. State budget deficits grew, the number of uninsured residents increased, and consolidation brought increasing competition to the marketplace. These pressures made California’s public hospitals increasingly dependent on DSH.
In 2002 and over the five-year period of this study, approximately one-third of California hospitals received some DSH payments, which totaled approximately $1.4 billion, with the state’s share funded primarily through intergovernmental transfers from counties and the University of California.40 Many public and private hospitals in California would have significantly lower or negative operating margins without DSH payments. Maintaining market share of Medi-Cal (Medicaid) patients has become critical to their financial viability.41
Initially, nationwide, the BBA delivered a strong blow to the financial health of hospitals by significantly reducing the growth of Medicare reimbursement rates. When Congress passed the BBA, it based reimbursement cuts on a plan to save more than $115 billion over a five-year period and predicted that reduced payments for hospitals would account for 35 percent of those projected savings.42
The negative impact of the BBA became evident as the Congressional Budget Office (CBO) later restated the estimated savings at $226 billion. In response, Congress passed the Balanced Budget Refinement Act of 1999 (BBRA) and the Medicare, Medicaid and SCHIP Benefits Improvement Act of 2000 (BIPA or MMSBIA).43 The BBRA and MMSBIA restored some of the Medicare payment cuts and enhanced payments to some hospitals in an effort to reduce the burden of uncompensated charity care.
More recent federal legislation relating to Medicare also has significantly influenced hospital finances. The Medicare Modernization Act of 2003 (MMA) enacted further payment provisions and mechanisms for providers; and the Health Insurance Portability and Accountability Act of 1996 (HIPAA) required providers, among other things, to adhere to standards regarding patient privacy and standardization of electronic transactions. (See Appendix C for more information on HIPAA and its impact.)
Medi-Cal reimbursement rates, falling short of the cost of care, have contributed to financial pressures for some California hospitals. In the early 1990s, the state began shifting large numbers of Medi-Cal patients into managed care plans. By 2000, approximately 52 percent of Medi-Cal beneficiaries were enrolled in managed care plans.44 That year, however, the State of California and hospitals settled a 10-year-old lawsuit concerning outpatient reimbursement rates. This settlement helped hospitals when the California Department of Health Services (DHS) agreed to pay them $350 million and increase Medi-Cal rates for outpatient services. The one-time payment was followed by a 30-percent increase in reimbursement rates for outpatient care in 2001 and a 3.3-percent increase per year through 2004. Total payments to hospitals during the four years amounted to nearly $700 million. Hospitals responded to the settlement by saying that it would not go far enough to compensate for losses hospitals incur for treating Medi-Cal patients but was a step in the right direction.45

Financial Health of California Hospitals 2-5 PricewaterhouseCoopers LLP
California Legislation Further Challenges Hospitals Adding to the impact of these numerous federal mandates, California state legislation has further challenged California hospitals with laws reinforcing seismic standards and requiring nurse staffing ratios. In 1994, SB 1953 (seismic standards) was passed and signed into law. This law established a schedule for California hospitals to meet seismic safety goals by classifying hospital buildings by level of danger of collapse and instituted deadlines for retrofitting or reconstruction. SB 1953 put pressure on already stressed capital funding needs. A 2007 report by the RAND Corporation concluded that the total cost to replace all of the structures targeted for reconstruction or retrofitting could range from $45 billion to $110 billon in 2006 dollars.46 This estimate did not consider the cost of financing, which could double the total cost. Amendments to SB 1953 in 2000 and 2006 provided extensions, exceptions for hospitals in lower-risk seismic zones, and provisions for temporary licensing. (See Appendix C for more information on hospital seismic regulations and their impact.)
In 1999, the legislature passed AB 394, the Health Facilities Nursing Staff law, with an effective date of 2004. This bill established minimum nurse-to-patient ratios for registered nurses (RNs) and licensed vocational nurses (LVNs) in the state’s acute care hospitals.47
The California Department of Health Services negotiated a new Medi-Cal Hospital waiver with the Centers for Medicare and Medicaid Services that replaces the Medicaid Selective Hospital Contracting waiver that had been in effect since the early 1980s. This agreement was operationalized in another law, SB 1100, which passed in 2005 and went into effect in 2006, changed the mechanism for Medicaid funding in California, and implemented terms of a waiver negotiated between state and federal governments. The full implications of this legislation have yet to materialize. (See Appendix D for more information.)
National Health Care Expenditures: Recent Trends Much of the federal legislation that so heavily influenced the financial health of California hospitals focused on lowering the growth of national health care spending. Although government efforts such as PPS and Medicare HMOs did achieve a slower growth rate from 1985 to 1998, national health care expenditures continued to outpace growth in the overall U.S. economy. By 1999, total health care expenditures accounted for 13.7 percent of the gross domestic product (GDP) ($1.27 trillion) and rose to 16 percent (almost $2 trillion) in 2005 (Figure 2.2).48
Figure 2.2: National Health Expenditures in the United States 1999–2005 1999 2000 2001 2002 2003 2004 2005
National Health Expenditures (in Billions) $1,265.3 $1,353.3 $1,469.6 $1,602.8 $1,733.4 $1,858.9 $1,987.7
California Health Expenditures (in Millions)
$116,028 $122,185 $132,376 $142,934 $156,511 $167,228 NA
National Health Expenditures as a Percent of Gross Domestic Product 13.7% 13.8% 14.5% 15.3% 15.8% 15.9% 16.0%
California Health Expenditures as a Percent of Gross State Product 9.8% 9.5% 10.2% 10.7% 11.1% 11.0% NA
National Health Expenditures per Capita (in Billions) $4,522 $4,790 $5,148 $5,559 $5,952 $6,322 $6,697
CMS Implicit Medical Price Deflator 0.967 1.000 1.038 1.078 1.118 1.163 1.205
Adjusted National Health Expenditures per Capita (in Billions) $4,676 $4,790 $4,960 $5,157 $5,324 $5,436 $5,558
Source: Centers for Medicare and Medicaid Services, “National Health Expenditures,” (Retrieved March 2007) http://www.cms.hhs.gov/NationalHealthExpendData/downloads/tables.pdf Total national health expenditures include research, hospital care, professional services, nursing home and home health care, prescription drugs, medical equipment, health insurance, investment, and other related costs.
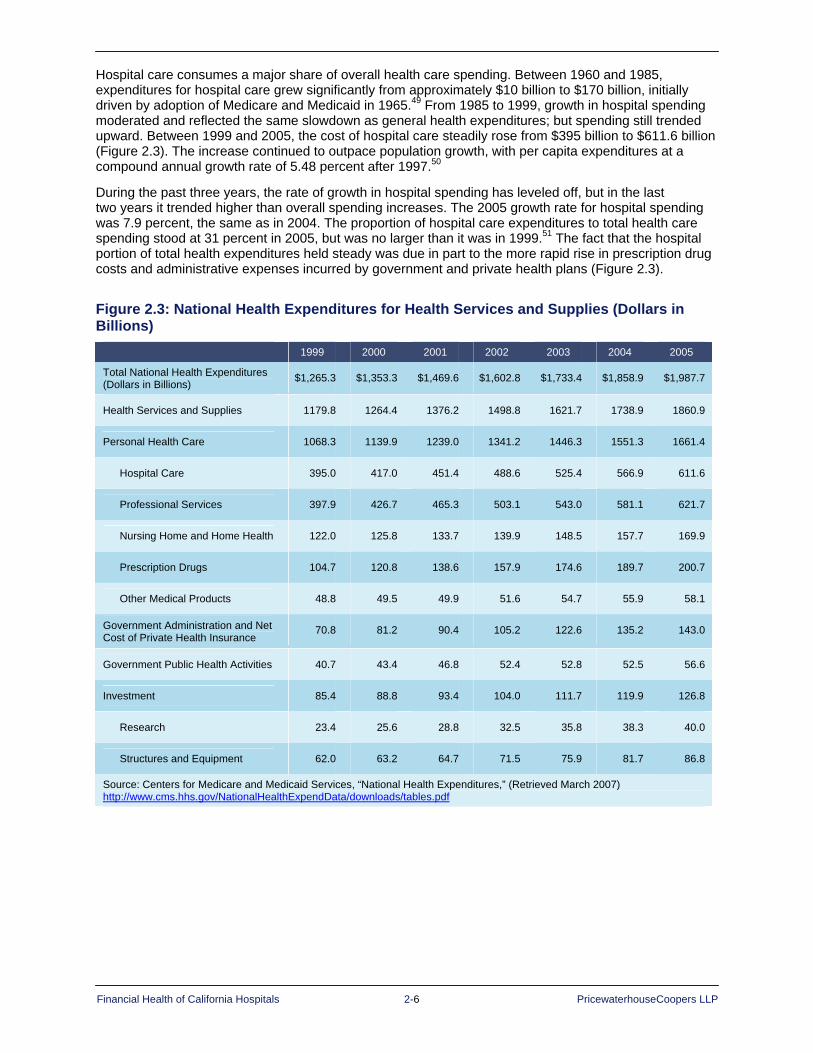
Financial Health of California Hospitals 2-6 PricewaterhouseCoopers LLP
Hospital care consumes a major share of overall health care spending. Between 1960 and 1985, expenditures for hospital care grew significantly from approximately $10 billion to $170 billion, initially driven by adoption of Medicare and Medicaid in 1965.49 From 1985 to 1999, growth in hospital spending moderated and reflected the same slowdown as general health expenditures; but spending still trended upward. Between 1999 and 2005, the cost of hospital care steadily rose from $395 billion to $611.6 billion (Figure 2.3). The increase continued to outpace population growth, with per capita expenditures at a compound annual growth rate of 5.48 percent after 1997.50
During the past three years, the rate of growth in hospital spending has leveled off, but in the last two years it trended higher than overall spending increases. The 2005 growth rate for hospital spending was 7.9 percent, the same as in 2004. The proportion of hospital care expenditures to total health care spending stood at 31 percent in 2005, but was no larger than it was in 1999.51 The fact that the hospital portion of total health expenditures held steady was due in part to the more rapid rise in prescription drug costs and administrative expenses incurred by government and private health plans (Figure 2.3).
Figure 2.3: National Health Expenditures for Health Services and Supplies (Dollars in Billions)
1999 2000 2001 2002 2003 2004 2005
Total National Health Expenditures (Dollars in Billions) $1,265.3 $1,353.3 $1,469.6 $1,602.8 $1,733.4 $1,858.9 $1,987.7
Health Services and Supplies 1179.8 1264.4 1376.2 1498.8 1621.7 1738.9 1860.9
Personal Health Care 1068.3 1139.9 1239.0 1341.2 1446.3 1551.3 1661.4
Hospital Care 395.0 417.0 451.4 488.6 525.4 566.9 611.6
Professional Services 397.9 426.7 465.3 503.1 543.0 581.1 621.7
Nursing Home and Home Health 122.0 125.8 133.7 139.9 148.5 157.7 169.9
Prescription Drugs 104.7 120.8 138.6 157.9 174.6 189.7 200.7
Other Medical Products 48.8 49.5 49.9 51.6 54.7 55.9 58.1
Government Administration and Net Cost of Private Health Insurance
70.8 81.2 90.4 105.2 122.6 135.2 143.0
Government Public Health Activities 40.7 43.4 46.8 52.4 52.8 52.5 56.6
Investment 85.4 88.8 93.4 104.0 111.7 119.9 126.8
Research 23.4 25.6 28.8 32.5 35.8 38.3 40.0
Structures and Equipment 62.0 63.2 64.7 71.5 75.9 81.7 86.8
Source: Centers for Medicare and Medicaid Services, “National Health Expenditures,” (Retrieved March 2007) http://www.cms.hhs.gov/NationalHealthExpendData/downloads/tables.pdf

Financial Health of California Hospitals 2-7 PricewaterhouseCoopers LLP
Figure 2.3B: National Health Expenditures per Capita: Hospital Care 1998–2005
Per Capita Annual Expenditure: Hospital
Third-Party Payments
Public
Year Total Out-of-Pocket
Payment
Total Third-Party
Private Health
Insurance
Other Private
Total Public Federal
State and
Local
1998 $1,358 $43 $1,315 $440 $72 $802 $652 $150
1999 $1,412 $46 $1,366 $471 $76 $819 $666 $153
2000 $1,476 $48 $1,428 $510 $77 $840 $680 $160
2001 $1,581 $50 $1,532 $550 $73 $908 $737 $171
2002 $1,695 $54 $1,641 $595 $74 $971 $787 $185
2003 $1,804 $58 $1,746 $639 $84 $1,023 $830 $192
2004 $1,928 $63 $1,865 $686 $86 $1,092 $888 $204
2005 $2,061 $68 $1,993 $731 $92 $1,169 $941 $228
Percent Distribution of Per Capita Annual Expenditure: Hospital
Third-Party Payments
Public
Year Total Out-of-Pocket
Payment
Total Third-Party
Private Health
Insurance
Other Private
Total Public Federal
State and
Local
1998 100.0 3.2 96.8 32.4 5.3 59.1 48.0 11.1
1999 100.0 3.2 96.8 33.4 5.4 58.0 47.2 10.8
2000 100.0 3.3 96.7 34.6 5.2 56.9 46.1 10.9
2001 100.0 3.2 96.8 34.8 4.6 57.4 46.6 10.8
2002 100.0 3.2 96.8 35.1 4.4 57.3 46.4 10.9
2003 100.0 3.2 96.8 35.4 4.6 56.7 46.0 10.7
2004 100.0 3.3 96.7 35.6 4.5 56.7 46.1 10.6
2005 100.0 3.3 96.7 35.5 4.5 56.8 45.7 11.1
Source: Centers for Medicare and Medicaid Services, “National Health Expenditures,” (Retrieved March 2007) http://www.cms.hhs.gov/NationalHealthExpendData/downloads/tables.pdf Note: Estimated per capita annual amount for total population, not per capita for Medicare and Medicaid eligibles.
National per capita hospital expenditures were more than $2,000 in 2005, with more than half of the total paid through government programs, primarily Medicare and Medicaid. Over the period, the proportion paid by government sources declined. The proportion paid by federal government decreased from 48 percent in 2001 to 45.7 percent in 2005 (Figure 2.3B). The share paid by private health insurance increased from 32.4 percent in 1998 to 35.5 percent in 2005. The portion covered by out-of-pocket payments on the part of individuals increased slightly, but has remained constant as a proportion of total hospital expenditures.52

Financial Health of California Hospitals 2-8 PricewaterhouseCoopers LLP
Competitive Environment
Growth of Managed Care The California health care market has one of the highest penetrations of managed care plans in the country. The history of managed care in California began early in the 1900s. In 1929, the Ross-Loos Clinic, a physician group practice, formed a partnership with the Los Angeles Department of Water and Power to provide prepaid care under a capitation model. One of the earliest prepaid group practices in the nation, this group continued until it was acquired by Insurance Company of North America, now part of CIGNA HealthCare, in 1980.53
The early growth of prepaid care in California continued in 1933, when Sidney Garfield, M.D. provided prepaid, preventive health care to workers building the Los Angeles Aqueduct. Dr. Garfield did not turn anyone away from the small hospital he built with borrowed money, and he quickly ran into financial trouble. Harold Hatch, an engineer-turned-insurance-agent, approached Dr. Garfield with the idea that insurance companies could pay a fixed amount per day, per covered worker, up front. The workers could receive job-related health coverage for five cents per day and could extend that care to non-job-related treatment for an additional five cents per day. After adopting this proposal, Dr. Garfield’s hospital became financially successful, and the workers received the medical care they needed.54
After the aqueduct construction project ended, industrialist Henry J. Kaiser hired Dr. Garfield to provide health care to 6,500 workers and their families at the Grand Coulee Dam site in Washington. Following completion of the dam, World War II brought tens of thousands of workers into the shipyards in Richmond, California; and Kaiser needed to provide care for 30,000 workers there. Dr. Garfield moved back to California and recruited a team of physicians to help care for the shipyard workers.55
Kaiser HMO Opens to Public after World War II In 1945, after WWII ended and the shipyard workers’ numbers diminished, the Permanente Health Plan officially opened to the public. Within 10 years, it had enrolled 300,000 Californians. In 1952, the health plan took the Kaiser name, and the medical group kept the Permanente name. Today the organization, which consists of the nonprofit Kaiser Foundation Health Plan and Hospitals and the Permanente Medical Groups, operates as Kaiser Permanente with 8.4 million members in nine states and Washington, D.C. Kaiser Permanente operates 30 medical centers and 431 medical offices and employs 12,000 physicians. The managed care organization serves approximately 6.4 million members in California.56
The health maintenance organization (HMO) model started by Dr. Garfield and Kaiser expanded to other health plans during the 1960s, when several proprietary groups collected premiums from subscribers (members) and contracted with physicians, physician groups and hospitals to provide for their members’ health care.57 By 1970, 37 HMOs operated in 14 states, with California in the lead with 16. HMO growth increased after the federal government passed the HMO Act of 1973, which defined “federally qualified” HMOs and authorized grants for their development. The act also required larger employers to offer federally certified HMO options to their employees alongside traditional indemnity insurance (dual choice). In 1976, Congress amended this act to relax requirements for federal qualification. National networks began to develop,58 and their size gave them the power to negotiate lower rates from providers in exchange for providing a large number of patients.
New Models of Managed Care Reshape California Health Care Market Two laws helped propel the managed care movement in California. Facing a state budget crisis in 1982, the legislature enacted Section 14087 of the California Welfare and Institution Code to allow the Medi-Cal (Medicaid) program to selectively contract with providers and negotiate competitive rates. The following year California adopted Section 10133 of the Insurance Code to authorize preferred provider organizations (PPOs),59 which permitted insurance companies, employers and other payers to contract with a restricted network under differential payment structures for in- and out-of-network providers.
The commercially insured sector of the California hospital market began to feel the competitive pressure of the managed care movement. The attraction of lower premiums drove consumers increasingly to choose HMOs. HMO enrollment rose dramatically in California in the early 1990s, and reached more than 12 million by 1995 and more than 17 million in 1999.60 That year more than 40 percent of California’s Medicare population had enrolled in an HMO.61
Financial Health of California Hospitals 2-9 PricewaterhouseCoopers LLP
Medicare beneficiaries in California also found managed care products appealing because they allowed them to limit out-of-pocket costs for coinsurance and deductibles. Many of the early Medicare HMOs, particularly in Southern California, required no premium payment beyond the Medicare Part B premium, making them less expensive than competing supplemental “Medigap” policies. Furthermore, these early Medicare HMOs offered members coverage for prescription drugs, which were not covered under the traditional Medicare program.
In spite of the general consumer appeal of HMOs and PPOs, two elements of these plans became increasingly unpopular: restricted networks of providers and utilization review designed to contain costs. With the economy booming in the late 1990s, employers became sensitive to worker complaints about these restrictions and started offering the more flexible PPOs. By 2001, California’s HMO enrollment, which stood at a high of 18.3 million, representing 53 percent of the state’s population, reversed its growth trend and began to decline (Figure 2.4). By 2005, the figure was down to 17.2 million, representing 47 percent of the total California population. This decline resulted in part from the reduction in plan offerings from both Medi-Cal and commercial (private) insurance.62
HMO Enrollment Declines Commercial HMO enrollment began to decline in absolute numbers in 2002, dropping 1,675,818 members, or 12.3 percent, by 2005. Managed Medi-Cal exhibited a similar decrease, with enrollment dropping 38,611 members, or 11.7 percent, from 2003 to 2005. Medicare also saw a decrease in HMO enrollment, with a compound annual growth rate (CAGR) of -3.98 percent from 2000 to 2004, but rebounded from 2004 to 2005, with an increase of 1.6 percent. Newly eligible beneficiaries were most likely to enroll in a Medicare HMO; 64 percent of them joined an HMO in 2005.63 Managed care products seemed to appeal to younger and healthier Medicare beneficiaries.
Healthy Families — California’s version of the State Child Health Insurance Program (SCHIP), Title XXI of the Social Security Act, which covers children who are without health insurance and ineligible for Medi-Cal — was the only program that demonstrated a consistent growth trend in HMO enrollment during the past five years, growing from a start-up program in the late 1990s to more than 700,000 members by 2005 (Figure 2.4). The plans available to Healthy Family members are predominantly HMO products, so any growth in Healthy Families translates into HMO growth.64
As HMO enrollment declined during the early 2000s, preferred provider organization (PPO) and point of service (POS) enrollment increased. In 2001, 54 percent of California workers were enrolled in an HMO, 25 percent in a PPO and 21 percent in a POS plan. PPOs gave consumers some of the price-control benefits of managed care combined with more choice and fewer restrictions. Increasing HMO premiums also influenced more workers to join PPOs, whose premiums were not significantly higher. Nationwide PPO enrollment jumped from 18 percent of covered workers in 1988 to 71 percent in 2001.65
Californians in 2005 still were more likely to be enrolled in an HMO than residents of other states. By 2005, 49 percent of covered workers in the state were enrolled in an HMO; 34 percent PPO; and 17 percent POS. The national averages were 21 percent HMO, 61 percent PPO and 15 percent POS.66

Financial Health of California Hospitals 2-10 PricewaterhouseCoopers LLP
Figure 2.4: California HMO Enrollment 1999–2005 1999 2000 2001 2002 2003 2004 2005
Population Enrolled in HMO
Commercial HMO 12,956,417 13,079,630 13,590,515 12,955,236 12,421,848 12,137,507 11,961,602
Medicare HMO 1,550,213 1,573,056 1,549,985 1,432,259 1,358,562 1,336,472 1,357,234
Medi-Cal HMO 2,464,560 2,551,997 2,729,155 3,066,058 3,295,416 3,263,488 3,256,818
Healthy Families HMO 94,844 262,460 412,433 521,049 639,638 707,269 716,825
CA HMO Enrollment 17,066,034 17,467,143 18,282,088 17,974,602 17,715,464 17,444,736 17,292,479
Eligible Population
Commercial Eligible 25,522,114 25,710,606 25,605,488 25,419,142 25,409,230 25,766,155 26,195,654
Medicare Eligible 3,174,861 3,198,410 3,266,330 3,275,913 3,284,840 3,315,310 3,345,640
Medi-Cal Eligible 4,973,311 5,035,604 5,100,459 5,784,026 6,278,482 6,482,357 6,470,080
Total CA Population 33,765,130 34,207,080 34,384,710 35,000,130 35,612,190 36,271,091 36,728,196
Percent of Eligible Population Enrolled in HMO
Commercial HMO 50.8% 50.9% 53.1% 51.0% 48.9% 47.1% 45.7%
Medicare HMO 48.8% 49.2% 47.5% 43.7% 41.4% 40.3% 40.6%
Medi-Cal HMO 49.6% 50.7% 53.5% 53.0% 52.5% 50.3% 50.3%
Total Population 50.5% 51.1% 53.2% 51.4% 49.7% 48.1% 47.1%
Sources: Cattaneo & Stroud, 2006 Statewide HMO and Special Programs Enrollment Study, and U.S. Census http://www.cattaneostroud.com/2006HMO.htm and, for 1999 data, 2005 Statewide HMO and Special Programs Enrollment Study http://www.cattaneostroud.com/2005HMO.htm
Notes: - The 2006 California Statewide HMO & Special Programs Enrollment Study is Cattaneo & Stroud’s 10th annual analysis of
California HMO enrollment by county. The study provides HMO enrollment compared to the total eligible population for four major lines of business: commercial, Medi-Cal, Medicare and Healthy Families. All health plan membership data are for the month of March 2006.
- C&S revised the March 2005 data to reflect an adjustment to the 2005 population by the California Department of Finance in May 2006.
- Percent eligible population was calculated as follows: o All lines of business (total enrollment)¸ (total California population, January 1, 2006) x 100 = 46.9% o Commercial (total Commercial Enrollment)¸ (total California population – (Healthy Families Enrollment + Medi-Cal
Eligibles + (Medicare Eligibles – Medicare/Medi-Cal Eligibles))) x 100 = 45.6% (Note that the total eligible population in this category includes uninsured)
o Medicare (total Medicare Enrollment – Medicare/Medi-Cal Enrollment)¸ (Medicare Eligibles – Medicare/Medi-Cal Eligibles) x 100 = 39.8%
o Medi-Cal (total Medi-Cal Enrollment)¸ (total Medi-Cal Eligibles including Medicare/Medi-Cal Eligibles) x 100 = 50.1% - Percent eligible and percent of eligible population are not applicable to Healthy Families.
Definitions: Commercial Enrollment: Includes HMO (standard group, both large and small), individual, point-of-service, Aid for Infants & Mothers, California Kids, county-sponsored Healthy Kids programs and capitated administrative-services-only members. Medi-Cal: Programs administered by the Department of Health Services, including 2-Plan County Programs, County Organized Health Systems, Fee-For-Service Managed Care, Geographic Managed Care, Prepaid Health Plans, Primary Care Case Management. Medicare: Programs administered by the Centers for Medicare & Medicaid Services, including Medicare+Choice, Cost, Demonstration Contracts and Program for All Inclusive Care (PACE). Healthy Families: Administered by the California Major Risk Medical Insurance Board, which uses the HMO or EPO networks of participating health plans.
Financial Health of California Hospitals 2-11 PricewaterhouseCoopers LLP
At the end of 2005, the four largest HMOs in California — Kaiser Permanente, Blue Cross of California, Blue Shield of California and Health Net — accounted for 73.3 percent of the state’s HMO enrollees. Kaiser remained California’s largest HMO, enrolling 34.8 percent of the HMO population or approximately 6.6 million people. Blue Cross was the second largest HMO in 2004, with 15.7 percent of HMO enrollment. Blue Shield was third, with 13 percent; Health Net, fourth, with 9.5 percent; and PacifiCare, fifth, with 8.7 percent.67
Kaiser owns and operates its own hospitals and medical groups, giving it the advantage of alignment of clinical and financial incentives in the delivery of health care.6869
Significant consolidation has occurred among health plans in the California market, transforming some from large regional plans into national organizations. In 2004, California’s Blue Cross health plans became part of Wellpoint, Inc., the result of the merger of Wellpoint Health Networks and Anthem, a for-profit company that holds the Blue Cross and Blue Shield mark in 14 states and has 34.1 million medical members. More recently, at the end of 2005, United Health Group merged with PacifiCare, acquiring its substantial Medicare HMO operations and commercial enrollment in California and nine other states.70 These consolidated plans carried more weight and had more bargaining power in the health care market.
Hospitals Feel Financial Pressure from Managed Care The success of HMOs and managed care in California created financial pressure on the state’s hospitals by lowering rates of hospital utilization and by creating large collective bargaining organizations with the power to solicit price concessions in aggressive contractual negotiations. In response, California hospitals implemented defensive strategies, such as aligning themselves with physicians to form integrated delivery systems (IDSs). IDSs envisioned a future in which a single hospital-physician organization with fully aligned incentives could accept capitation as a form of payment. Under capitation, a health care provider agrees to accept a fixed amount of payment per HMO enrollee per month (adjusted for the age and sex of the member) regardless of the volume of services consumed by that member. Capitation provides incentive for provider organizations to manage the overall health status of enrolled populations — theoretically preventing illness and hospitalization and using resources efficiently to keep members healthy.71 Capitation is not as common today in California as it was during the 1990s at the peak of HMO and managed care growth.
Utilization review by managed care organizations began to affect California hospitals negatively in the late 1990s by reducing utilization of their services. This was accompanied by improvements in equipment and anesthesia that enabled services to move outside hospital walls. Less-invasive surgery could be done increasingly on an outpatient basis, and new imaging technologies eliminated the need for exploratory surgeries.
ALOS in California declined from 1989 through 1997.72 However, this trend began to reverse after 1997, with a slight increase in median acute ALOS from 3.76 days in 1997 to 3.79 in 1999. In 2001, the ALOS rose to a high of 5.4 days and remained higher at 5.3 days in 2005, an increase of 1.54 days over 1999 (see Figure 2.5). Kaiser’s third-party ALOS remained below that of California’s from 2000 to 2004, most likely a result of tighter control of its integrated delivery system. From 2000 to 2004, this difference became even more pronounced.73
In contrast, national hospital utilization rates continued to decline in the 1990s and into the 2000s. In spite of their continual decline, national rates remained slightly higher than California rates. The national ALOS declined from 5.8 days in 2000 to 5.6 days in 2004 (Figure 2.5).
Federal legislation that required minimum lengths of stay for insurance coverage for maternity care beginning January 1, 1998, could be one factor that drove the California ALOS increase. Prior to 1998, most health plans required discharge of obstetrical patients within 24 hours for a normal vaginal delivery and 72 hours for a cesarean section. The new law required group health plans, insurance companies and HMOs to allow two days for a normal delivery and four days for a cesarean section.74

Financial Health of California Hospitals 2-12 PricewaterhouseCoopers LLP
Figure 2.5: Median Average Acute Length of Stay in California (ALOS) 2000–2005
2000 2001 2002 2003 2004 2005
ALOS (U.S.) 5.8 5.7 5.7 5.7 5.6 5.6
ALOS (CA) 5.3 5.4 5.4 5.4 5.3 5.3
Source: American Hospital Association, AHA Hospital Statistics (2006 and 2007) Table 3 (U.S.) and Table 6 (California)
Median Average LOS
5
5.2
5.4
5.6
5.8
6
2000 2001 2002 2003 2004 2005
Years
Days
ALOS (US)ALOS (CA)
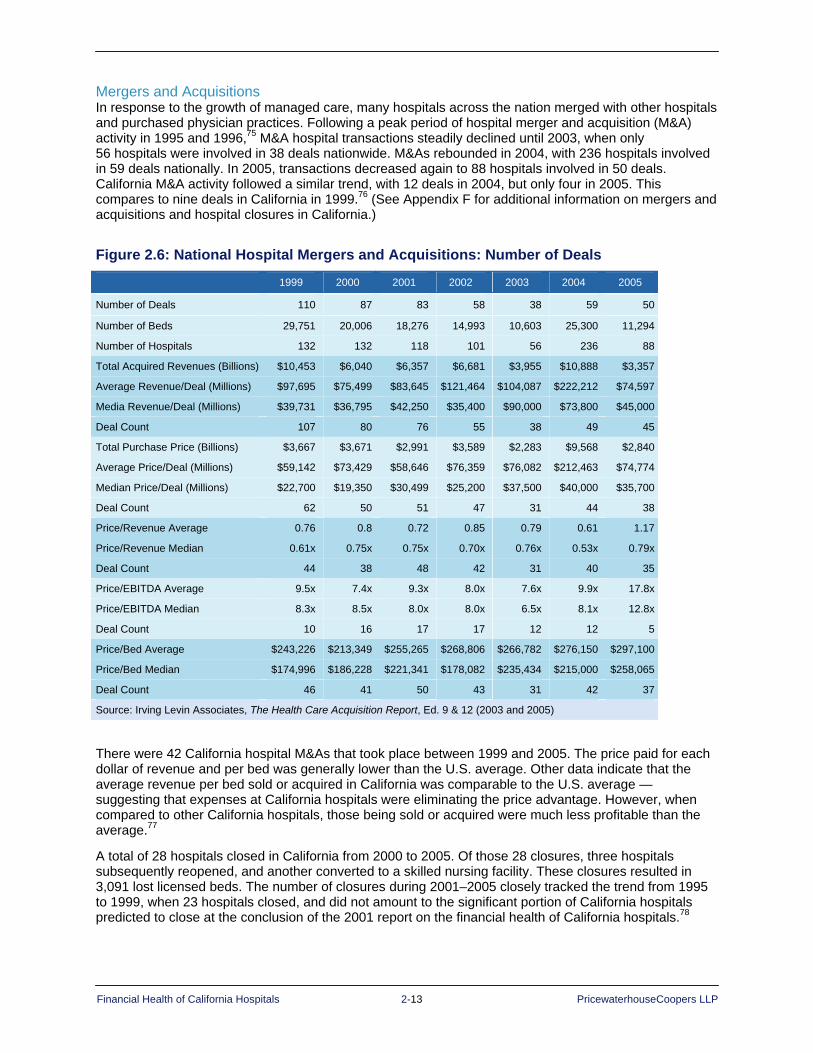
Financial Health of California Hospitals 2-13 PricewaterhouseCoopers LLP
Mergers and Acquisitions In response to the growth of managed care, many hospitals across the nation merged with other hospitals and purchased physician practices. Following a peak period of hospital merger and acquisition (M&A) activity in 1995 and 1996,75 M&A hospital transactions steadily declined until 2003, when only 56 hospitals were involved in 38 deals nationwide. M&As rebounded in 2004, with 236 hospitals involved in 59 deals nationally. In 2005, transactions decreased again to 88 hospitals involved in 50 deals. California M&A activity followed a similar trend, with 12 deals in 2004, but only four in 2005. This compares to nine deals in California in 1999.76 (See Appendix F for additional information on mergers and acquisitions and hospital closures in California.)
Figure 2.6: National Hospital Mergers and Acquisitions: Number of Deals
1999 2000 2001 2002 2003 2004 2005
Number of Deals 110 87 83 58 38 59 50
Number of Beds 29,751 20,006 18,276 14,993 10,603 25,300 11,294
Number of Hospitals 132 132 118 101 56 236 88
Total Acquired Revenues (Billions) $10,453 $6,040 $6,357 $6,681 $3,955 $10,888 $3,357
Average Revenue/Deal (Millions) $97,695 $75,499 $83,645 $121,464 $104,087 $222,212 $74,597
Media Revenue/Deal (Millions) $39,731 $36,795 $42,250 $35,400 $90,000 $73,800 $45,000
Deal Count 107 80 76 55 38 49 45
Total Purchase Price (Billions) $3,667 $3,671 $2,991 $3,589 $2,283 $9,568 $2,840
Average Price/Deal (Millions) $59,142 $73,429 $58,646 $76,359 $76,082 $212,463 $74,774
Median Price/Deal (Millions) $22,700 $19,350 $30,499 $25,200 $37,500 $40,000 $35,700
Deal Count 62 50 51 47 31 44 38
Price/Revenue Average 0.76 0.8 0.72 0.85 0.79 0.61 1.17
Price/Revenue Median 0.61x 0.75x 0.75x 0.70x 0.76x 0.53x 0.79x
Deal Count 44 38 48 42 31 40 35
Price/EBITDA Average 9.5x 7.4x 9.3x 8.0x 7.6x 9.9x 17.8x
Price/EBITDA Median 8.3x 8.5x 8.0x 8.0x 6.5x 8.1x 12.8x
Deal Count 10 16 17 17 12 12 5
Price/Bed Average $243,226 $213,349 $255,265 $268,806 $266,782 $276,150 $297,100
Price/Bed Median $174,996 $186,228 $221,341 $178,082 $235,434 $215,000 $258,065
Deal Count 46 41 50 43 31 42 37
Source: Irving Levin Associates, The Health Care Acquisition Report, Ed. 9 & 12 (2003 and 2005)
There were 42 California hospital M&As that took place between 1999 and 2005. The price paid for each dollar of revenue and per bed was generally lower than the U.S. average. Other data indicate that the average revenue per bed sold or acquired in California was comparable to the U.S. average — suggesting that expenses at California hospitals were eliminating the price advantage. However, when compared to other California hospitals, those being sold or acquired were much less profitable than the average.77
A total of 28 hospitals closed in California from 2000 to 2005. Of those 28 closures, three hospitals subsequently reopened, and another converted to a skilled nursing facility. These closures resulted in 3,091 lost licensed beds. The number of closures during 2001–2005 closely tracked the trend from 1995 to 1999, when 23 hospitals closed, and did not amount to the significant portion of California hospitals predicted to close at the conclusion of the 2001 report on the financial health of California hospitals.78
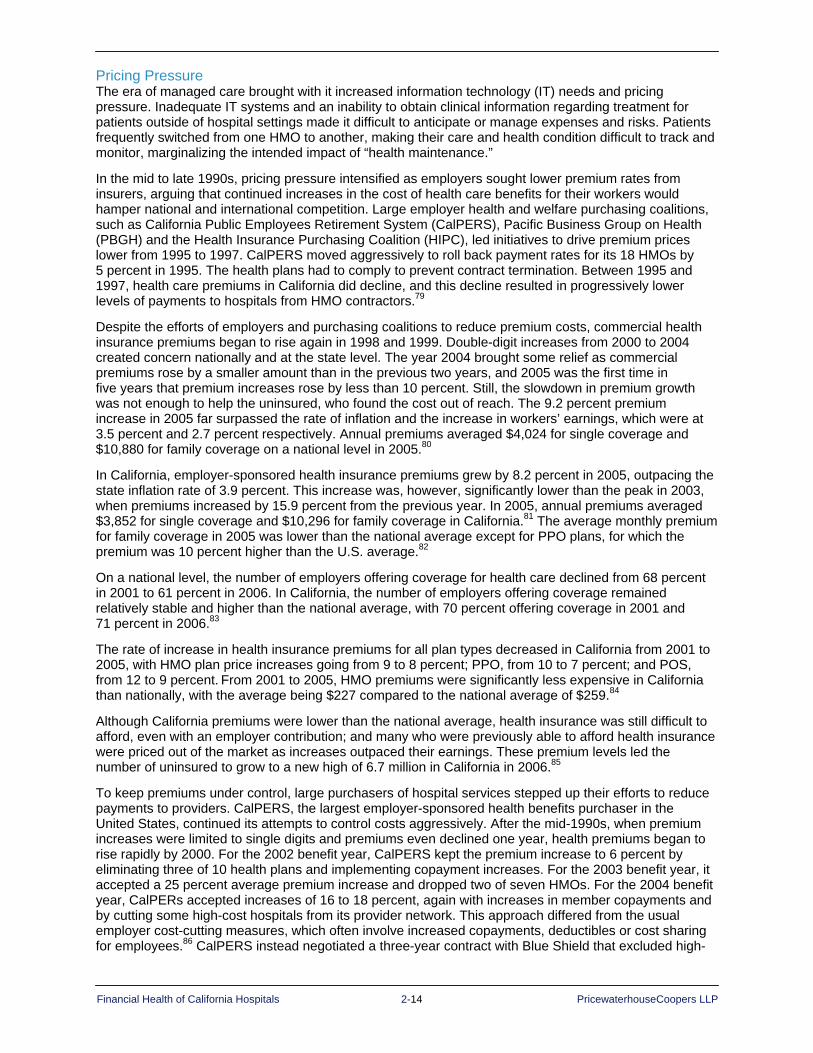
Financial Health of California Hospitals 2-14 PricewaterhouseCoopers LLP
Pricing Pressure The era of managed care brought with it increased information technology (IT) needs and pricing pressure. Inadequate IT systems and an inability to obtain clinical information regarding treatment for patients outside of hospital settings made it difficult to anticipate or manage expenses and risks. Patients frequently switched from one HMO to another, making their care and health condition difficult to track and monitor, marginalizing the intended impact of “health maintenance.”
In the mid to late 1990s, pricing pressure intensified as employers sought lower premium rates from insurers, arguing that continued increases in the cost of health care benefits for their workers would hamper national and international competition. Large employer health and welfare purchasing coalitions, such as California Public Employees Retirement System (CalPERS), Pacific Business Group on Health (PBGH) and the Health Insurance Purchasing Coalition (HIPC), led initiatives to drive premium prices lower from 1995 to 1997. CalPERS moved aggressively to roll back payment rates for its 18 HMOs by 5 percent in 1995. The health plans had to comply to prevent contract termination. Between 1995 and 1997, health care premiums in California did decline, and this decline resulted in progressively lower levels of payments to hospitals from HMO contractors.79
Despite the efforts of employers and purchasing coalitions to reduce premium costs, commercial health insurance premiums began to rise again in 1998 and 1999. Double-digit increases from 2000 to 2004 created concern nationally and at the state level. The year 2004 brought some relief as commercial premiums rose by a smaller amount than in the previous two years, and 2005 was the first time in five years that premium increases rose by less than 10 percent. Still, the slowdown in premium growth was not enough to help the uninsured, who found the cost out of reach. The 9.2 percent premium increase in 2005 far surpassed the rate of inflation and the increase in workers’ earnings, which were at 3.5 percent and 2.7 percent respectively. Annual premiums averaged $4,024 for single coverage and $10,880 for family coverage on a national level in 2005.80
In California, employer-sponsored health insurance premiums grew by 8.2 percent in 2005, outpacing the state inflation rate of 3.9 percent. This increase was, however, significantly lower than the peak in 2003, when premiums increased by 15.9 percent from the previous year. In 2005, annual premiums averaged $3,852 for single coverage and $10,296 for family coverage in California.81 The average monthly premium for family coverage in 2005 was lower than the national average except for PPO plans, for which the premium was 10 percent higher than the U.S. average.82
On a national level, the number of employers offering coverage for health care declined from 68 percent in 2001 to 61 percent in 2006. In California, the number of employers offering coverage remained relatively stable and higher than the national average, with 70 percent offering coverage in 2001 and 71 percent in 2006.83
The rate of increase in health insurance premiums for all plan types decreased in California from 2001 to 2005, with HMO plan price increases going from 9 to 8 percent; PPO, from 10 to 7 percent; and POS, from 12 to 9 percent. From 2001 to 2005, HMO premiums were significantly less expensive in California than nationally, with the average being $227 compared to the national average of $259.84
Although California premiums were lower than the national average, health insurance was still difficult to afford, even with an employer contribution; and many who were previously able to afford health insurance were priced out of the market as increases outpaced their earnings. These premium levels led the number of uninsured to grow to a new high of 6.7 million in California in 2006.85
To keep premiums under control, large purchasers of hospital services stepped up their efforts to reduce payments to providers. CalPERS, the largest employer-sponsored health benefits purchaser in the United States, continued its attempts to control costs aggressively. After the mid-1990s, when premium increases were limited to single digits and premiums even declined one year, health premiums began to rise rapidly by 2000. For the 2002 benefit year, CalPERS kept the premium increase to 6 percent by eliminating three of 10 health plans and implementing copayment increases. For the 2003 benefit year, it accepted a 25 percent average premium increase and dropped two of seven HMOs. For the 2004 benefit year, CalPERs accepted increases of 16 to 18 percent, again with increases in member copayments and by cutting some high-cost hospitals from its provider network. This approach differed from the usual employer cost-cutting measures, which often involve increased copayments, deductibles or cost sharing for employees.86 CalPERS instead negotiated a three-year contract with Blue Shield that excluded high-
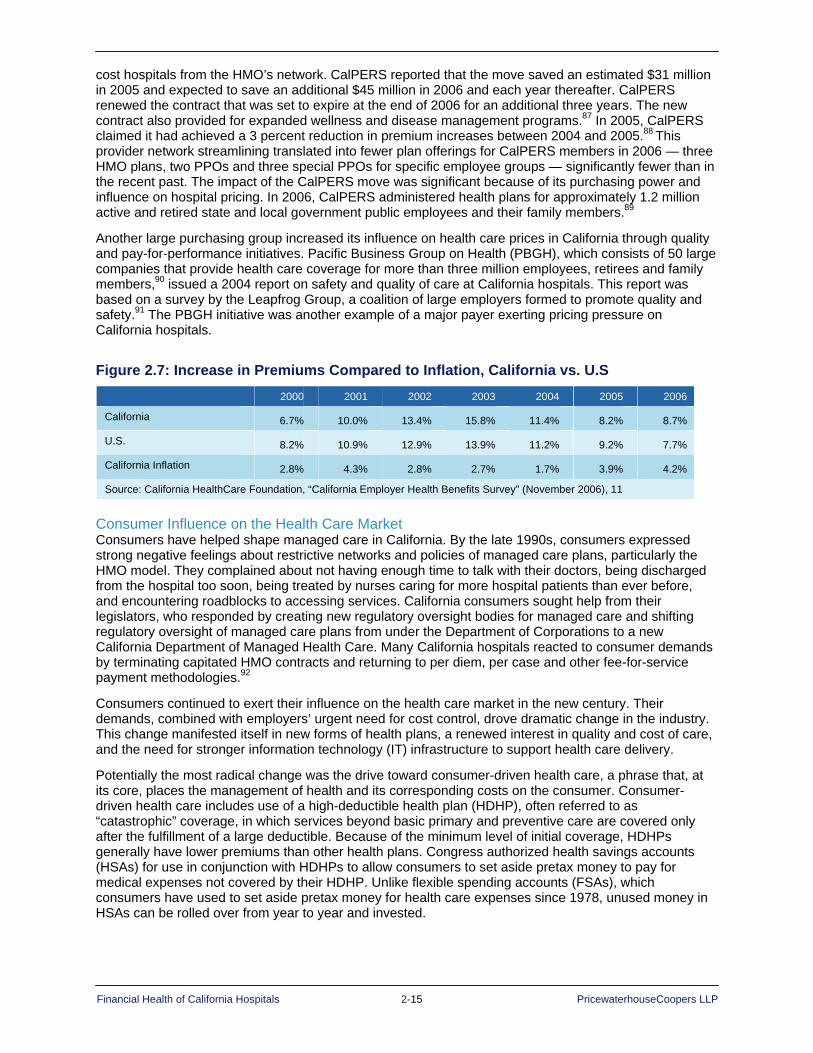
Financial Health of California Hospitals 2-15 PricewaterhouseCoopers LLP
cost hospitals from the HMO’s network. CalPERS reported that the move saved an estimated $31 million in 2005 and expected to save an additional $45 million in 2006 and each year thereafter. CalPERS renewed the contract that was set to expire at the end of 2006 for an additional three years. The new contract also provided for expanded wellness and disease management programs.87 In 2005, CalPERS claimed it had achieved a 3 percent reduction in premium increases between 2004 and 2005.88 This provider network streamlining translated into fewer plan offerings for CalPERS members in 2006 — three HMO plans, two PPOs and three special PPOs for specific employee groups — significantly fewer than in the recent past. The impact of the CalPERS move was significant because of its purchasing power and influence on hospital pricing. In 2006, CalPERS administered health plans for approximately 1.2 million active and retired state and local government public employees and their family members.89
Another large purchasing group increased its influence on health care prices in California through quality and pay-for-performance initiatives. Pacific Business Group on Health (PBGH), which consists of 50 large companies that provide health care coverage for more than three million employees, retirees and family members,90 issued a 2004 report on safety and quality of care at California hospitals. This report was based on a survey by the Leapfrog Group, a coalition of large employers formed to promote quality and safety.91 The PBGH initiative was another example of a major payer exerting pricing pressure on California hospitals.
Figure 2.7: Increase in Premiums Compared to Inflation, California vs. U.S 2000 2001 2002 2003 2004 2005 2006
California 6.7% 10.0% 13.4% 15.8% 11.4% 8.2% 8.7%
U.S. 8.2% 10.9% 12.9% 13.9% 11.2% 9.2% 7.7%
California Inflation 2.8% 4.3% 2.8% 2.7% 1.7% 3.9% 4.2%
Source: California HealthCare Foundation, “California Employer Health Benefits Survey” (November 2006), 11
Consumer Influence on the Health Care Market Consumers have helped shape managed care in California. By the late 1990s, consumers expressed strong negative feelings about restrictive networks and policies of managed care plans, particularly the HMO model. They complained about not having enough time to talk with their doctors, being discharged from the hospital too soon, being treated by nurses caring for more hospital patients than ever before, and encountering roadblocks to accessing services. California consumers sought help from their legislators, who responded by creating new regulatory oversight bodies for managed care and shifting regulatory oversight of managed care plans from under the Department of Corporations to a new California Department of Managed Health Care. Many California hospitals reacted to consumer demands by terminating capitated HMO contracts and returning to per diem, per case and other fee-for-service payment methodologies.92
Consumers continued to exert their influence on the health care market in the new century. Their demands, combined with employers’ urgent need for cost control, drove dramatic change in the industry. This change manifested itself in new forms of health plans, a renewed interest in quality and cost of care, and the need for stronger information technology (IT) infrastructure to support health care delivery.
Potentially the most radical change was the drive toward consumer-driven health care, a phrase that, at its core, places the management of health and its corresponding costs on the consumer. Consumer-driven health care includes use of a high-deductible health plan (HDHP), often referred to as “catastrophic” coverage, in which services beyond basic primary and preventive care are covered only after the fulfillment of a large deductible. Because of the minimum level of initial coverage, HDHPs generally have lower premiums than other health plans. Congress authorized health savings accounts (HSAs) for use in conjunction with HDHPs to allow consumers to set aside pretax money to pay for medical expenses not covered by their HDHP. Unlike flexible spending accounts (FSAs), which consumers have used to set aside pretax money for health care expenses since 1978, unused money in HSAs can be rolled over from year to year and invested.

Financial Health of California Hospitals 2-16 PricewaterhouseCoopers LLP
Proponents of HSAs like the way in which consumers control their own money, deciding how to invest it and how to spend it. This control gives HDHPs cost-containment power. The reasoning is that consumers will act more selectively in their consumption of health care services, seeking out the best quality care at the most competitive prices. Unlike traditional health plans, in which consumers are billed only for copayment and coinsurance amounts, HDHPs force consumers to understand the full cost of health care services, which they pay out of their HSA until it is depleted and then pay out of their own pocket until they meet their deductible. Opponents of HSAs and HDHPs worry that these plans will create incentives to delay or forego needed medical care and that the risk pool of these plans will consist of wealthier, healthier members, raising costs in the traditional plans they leave behind.93
HDHPs are growing in favor slowly across the country. In 2006, only 7 percent of employers who offered health insurance to their employees offered an HDHP with a savings account option, up from 4 percent in 2005. Only 6 percent of companies that offer traditional health plans for their employees were “very likely” to adopt HDHPs.94 By October 2006, only three million workers were enrolled nationwide in HDHPs. This compared to 240 million enrolled in other private insurance plans.95
In California, 16 percent of employers offered a high-deductible health plan in 2006, but only 6 percent offered an HSA-eligible HDHP.96 Only 2 percent of Californians were enrolled in HDHPs with a savings option in 2006, compared with 4 percent nationally.97
While the percent of consumers enrolled in HDHPs in California and nationwide is relatively small, the move toward more consumer engagement continues to gain momentum. Eighty percent of employers surveyed by PricewaterhouseCoopers said they could reduce health care costs by providing employees with more information on health care price and quality. Seven out of 10 said they believed that better information on how to evaluate medications, doctors and hospitals would lower costs and increase quality.98
The consequences of consumer-driven health care could be significant for hospitals. Consumer-driven health care has the potential to affect hospitals and other health care providers by reducing prices and increasing costs related to retail marketing. California requires providers to report charges for the 50 most common medical procedures. This allows Californians to compare prices when considering where to go for treatment.99 Consumers may “shop around” for lower-cost services and delay or avoid expensive procedures. This could reduce private-payer revenue for hospitals as they adjust pricing and incur new reporting and marketing costs.
The growing role of consumers in the health care process also has led to an increased focus on quality. Quality is one of the metrics consumers are most concerned about, and increased reporting and dissemination of performance data has made quality initiatives more pressing for providers. Although quality has always been a priority for health care providers, changes in the marketplace have brought this issue into the public’s eye, providing an impetus for improvement.
National attention refocused on quality issues with the release of the Institute of Medicine’s (IOM’s) “To Err is Human” report in 1999, which was followed by “Crossing the Quality Chasm” in 2001. The IOM’s first report startled many with the grim statistic that as many as 98,000 deaths a year were the result of medical errors.100 In response to this renewed awareness, quality initiatives, such as provider report cards and “pay-for-performance” incentives, were developed. Pay-for-performance offers financial incentives for providers to encourage them to adhere to certain standards, achieve specific benchmarks, and ultimately improve the quality of health care.101

Financial Health of California Hospitals 2-17 PricewaterhouseCoopers LLP
Pressure to improve quality, meet consumer expectations and enhance the performance of health care providers — along with the Health Insurance Portability and Accountability Act of 1996 (HIPAA) — created another expense for health care providers — the need to upgrade and improve information technology (IT) capabilities.102 Technologies that improve patient safety are among the most sought after and include electronic medical records (EMRs), clinical decision-support services (CDSSs), computerized physician order-entry systems (CPOEs), bar-coding prescription medication and e-prescribing. According to the 17th Annual Healthcare Information and Management Systems Society (HIMSS) Leadership Survey, 24 percent of health care IT executives surveyed already have a fully operational EMR in their hospital, and another 36 percent have begun installing an EMR. Only 12 percent of those surveyed had not developed a plan to implement an EMR. They identified bar code technology, handheld PDAs and automated alerts as the forms of technology they were most likely to utilize in their facility in the next two years.103
Information technology improvements are costly, and the financial return on investment can be difficult to assess. The California HealthCare Foundation found that “IT investments produce significant ‘soft-dollar’ and intangible benefits,” making it difficult to measure.104 Hospitals bear the cost of implementing new technology, but the benefits accrue primarily to payers and patients. New technology reduces health care costs by minimizing complications, reducing duplicative tests and improving outcomes. Medicare provides new technology add-on and pass-through payments, but the criteria for receiving these payments are stringent, and they do not cover the hospital’s investment.105
Although statistical modeling suggests that health information technology has the potential to assist in dramatically transforming the delivery of health care — making it safer, more effective and more efficient — the experimental evidence supporting these benefits is limited. Lack of knowledge about what types of IT and methods of implementation are most effective for small hospitals limits widespread implementation by small hospitals and small physician practices. 106 Considering that IT was ranked the highest priority among participants in the 1995–1999 report and that IT costs were among those predicted to grow most steeply, developments affecting IT will continue to be important to health care providers.107
Summary Hospitals have been a fixture in the health care industry in a role almost unchanged since the passage of the Hill-Burton Act. Many of the historical factors that shaped the California hospital environment are still in place today.
The need for access to health care services drove the establishment of community-based facilities throughout California. Although most, if not all, of these facilities were built with an identifiable need for services, socioeconomic and demographic changes have begun to place into question, in the minds of some, the need for certain facilities. The recent divestiture of several small facilities by for-profit entities is further testimony to this trend of thinking.
The payer environment over the last 20 years has been marked with continued consolidation. Interviews with hospital executives suggest that the power these few organizations have on the hospital community has continued to grow; and, in some cases, these payers have significantly influenced the financial circumstances of various organizations. Hospital location, proximity to high percentages of HMO/PPO employees, a broad array of services, and the level of local competition are all factors influencing hospitals’ ability to negotiate more favorable payer contracts.
In more recent years, consumers have become increasingly influential in the health care marketplace. The high-deductible health plan (HDHP), although still a small percentage of the overall product mix, will continue to apply increasing pressure on providers to demonstrate transparency on the issues of both quality and price.


Financial Health of California Hospitals 3-1 PricewaterhouseCoopers LLP
Chapter 3: Description of the California Hospital Industry
Key Findings The number of California general acute care hospitals and inpatient beds has dropped since
2001. This decrease in inpatient capacity follows national trends.
The largest decrease in the number of hospitals occurred in Southern California, particularly Los Angeles and Orange counties. However, a proportionate decrease in available beds did not occur, indicating that closures were among smaller hospitals and that existing or new hospitals opened beds.
The composition of California hospitals in terms of ownership (city/county, district, private nonprofit, for-profit) has remained largely unchanged during the past five years. When measured by bed size, the proportion of small (<150 beds) has decreased while the proportion of large (>350 beds) has increased.
The number of hospital beds per capita in California remains much lower than the national average. In 2005, the national average was 2.7 staffed beds per 1,000 compared to the California average of 1.9 staffed beds per 1,000.
Staffed beds as a percent of licensed beds decreased during the period. This helps to explain an increase in occupancy rates between 2001 to 2005. Available beds as a percent of licensed beds was stable through the period. Consistent with previous findings, inpatient occupancy rates increase with increasing bed size.
More than 60 percent of California hospitals are affiliated with a hospital system. This proportion increases with bed size: 52% of small hospitals were part of a system, but for hospitals of more than 250 beds, 74 percent were part of a system.
Academic medical centers, which represent only 7 percent of all California hospitals, have 16 percent of available beds and generated one-fourth of all net patient revenues.
Hospital and Bed Trends The California Office of Statewide Health Planning and Development (OSHPD) Selected Annual Financial Data includes reports for nearly 450 licensed hospitals,108 but this report focuses on the general acute care hospitals in the state. It excludes acute psychiatric, chemical dependency and behavioral health, long-term acute care, federal and state government (such as Veteran’s Administration and military facilities) and specialty hospitals, such as the Shriners facilities. The remaining acute care hospitals are the major sources of hospital inpatient and outpatient care for the residents of California.
In 2005, 355 acute care hospitals submitted disclosure reports to the California Office of Statewide Healthcare Planning and Development (OSHPD).109 This compares to 383 in 2001, a decrease of 7.31 percent. The number of reporting hospitals remained relatively stable from 2001 through 2003, with a decrease of only five. From 2003 through 2005, however, the number declined more sharply, from 378 to 355, reflecting a loss of 23 hospitals through a combination of closures, mergers and hospitals that did not submit reports to OSHPD. (See Appendix F for list of closed hospitals.)
Figure 3.1 compares the number of California hospital OSHPD filings to the California Department of Health inventory of licensed hospitals for the period of 2001–2005.
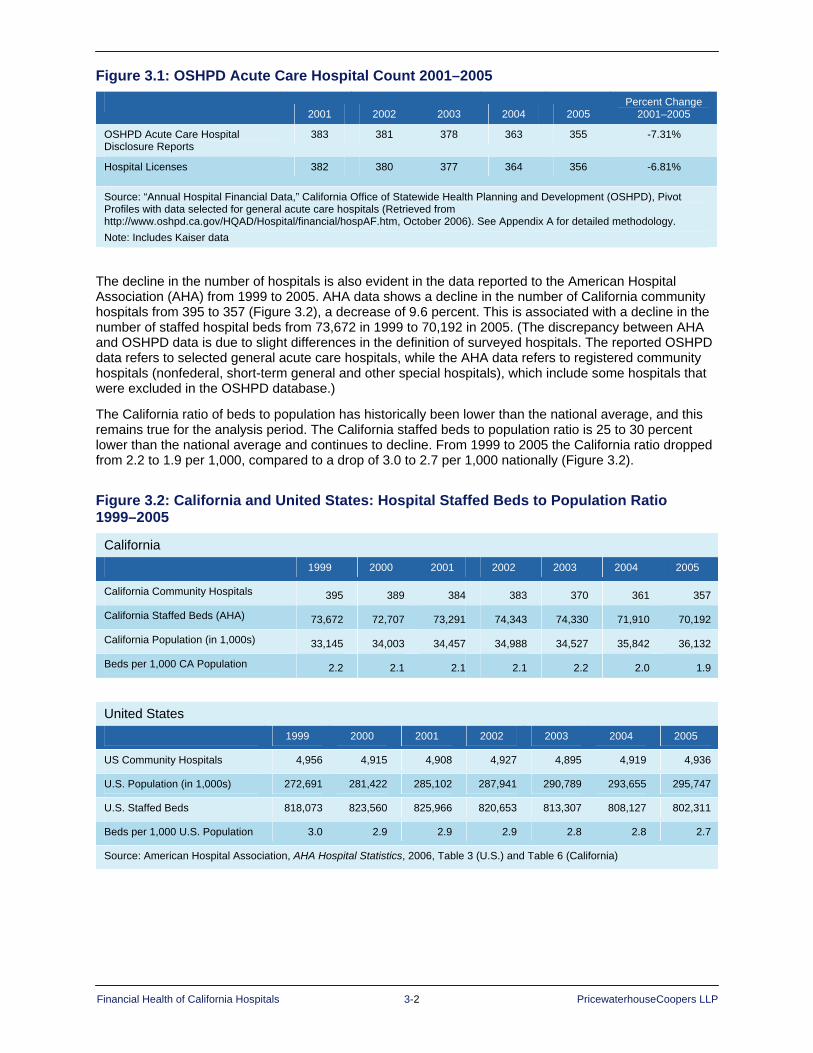
Financial Health of California Hospitals 3-2 PricewaterhouseCoopers LLP
Figure 3.1: OSHPD Acute Care Hospital Count 2001–2005
2001 2002 2003 2004 2005
Percent Change 2001–2005
OSHPD Acute Care Hospital Disclosure Reports
383 381 378 363 355 -7.31%
Hospital Licenses 382 380 377 364 356 -6.81%
Source: “Annual Hospital Financial Data,” California Office of Statewide Health Planning and Development (OSHPD), Pivot Profiles with data selected for general acute care hospitals (Retrieved from http://www.oshpd.ca.gov/HQAD/Hospital/financial/hospAF.htm, October 2006). See Appendix A for detailed methodology. Note: Includes Kaiser data
The decline in the number of hospitals is also evident in the data reported to the American Hospital Association (AHA) from 1999 to 2005. AHA data shows a decline in the number of California community hospitals from 395 to 357 (Figure 3.2), a decrease of 9.6 percent. This is associated with a decline in the number of staffed hospital beds from 73,672 in 1999 to 70,192 in 2005. (The discrepancy between AHA and OSHPD data is due to slight differences in the definition of surveyed hospitals. The reported OSHPD data refers to selected general acute care hospitals, while the AHA data refers to registered community hospitals (nonfederal, short-term general and other special hospitals), which include some hospitals that were excluded in the OSHPD database.)
The California ratio of beds to population has historically been lower than the national average, and this remains true for the analysis period. The California staffed beds to population ratio is 25 to 30 percent lower than the national average and continues to decline. From 1999 to 2005 the California ratio dropped from 2.2 to 1.9 per 1,000, compared to a drop of 3.0 to 2.7 per 1,000 nationally (Figure 3.2).
Figure 3.2: California and United States: Hospital Staffed Beds to Population Ratio 1999–2005
California 1999 2000 2001 2002 2003 2004 2005
California Community Hospitals 395 389 384 383 370 361 357
California Staffed Beds (AHA) 73,672 72,707 73,291 74,343 74,330 71,910 70,192
California Population (in 1,000s) 33,145 34,003 34,457 34,988 34,527 35,842 36,132
Beds per 1,000 CA Population 2.2 2.1 2.1 2.1 2.2 2.0 1.9
United States 1999 2000 2001 2002 2003 2004 2005
US Community Hospitals 4,956 4,915 4,908 4,927 4,895 4,919 4,936
U.S. Population (in 1,000s) 272,691 281,422 285,102 287,941 290,789 293,655 295,747
U.S. Staffed Beds 818,073 823,560 825,966 820,653 813,307 808,127 802,311
Beds per 1,000 U.S. Population 3.0 2.9 2.9 2.9 2.8 2.8 2.7
Source: American Hospital Association, AHA Hospital Statistics, 2006, Table 3 (U.S.) and Table 6 (California)

Financial Health of California Hospitals 3-3 PricewaterhouseCoopers LLP
Inpatient bed occupancy rates are a measure of utilization relative to supply and reflect demand for services, management and staffing of the hospital, and the capacity of hospitals to meet the demands of the population. In California, occupancy is calculated on the hospital’s capacity of beds as measured by:
Licensed Beds: Number of beds stated on the hospital license for the reporting period
Available beds: Average number of beds that hospitals actively own and can make available for patient care within 24 hours
Staffed beds: Average number of beds staffed by clinical personnel for use
Total inpatient days for California hospitals increased by 2.55 percent from 2001 to 2005 (Figure 3.3). The occupancy rate for staffed beds increased by a larger percent (8 percent), while the total number of staffed beds decreased by 5 percent. The average occupancy rate for staffed beds for this period was 71 percent. Occupancy rates were higher in 2004 (74 percent) and 2005 (75 percent).
In the late 1980s and early 1990s, California hospitals reported more available bed capacity because managed care programs were initially effective in lowering utilization of inpatient services. That scenario changed during 2001–2005, when occupancy rates for all types of beds increased. An average occupancy rate of 70 percent or more is considered high for acute care hospitals.110 California’s average rate during 2001–2005 hit this high mark for staffed beds but not for available beds. Interview findings in support of this report suggest that hospitals are increasingly more proactive in managing inpatient throughput and inpatient utilization, given the direct costs associated with patient care (staffing and supply expenses) and availability of those resources.
Figure 3.3 presents occupancy rates using three different measures of bed occupancy as defined above.
Figure 3.3: Occupancy Rates for All California Hospitals 2001–2005
2001 2002 2003 2004 2005 Percent Change
2001–2005
Inpatient Days 17,381,380 17,502,557 18,130,012 17,846,797 17,824,664 2.55%
Licensed Beds 82,390 82,570 82,276 81,675 81,922 -0.57%
Available Beds 75,502 76,58 76,588 75,803 75,517 0.02%
Staffed Beds 69,016 70,086 69,841 66,275 65,528 -5.05%
Occupancy Rate (Licensed Beds) 58% 58% 60% 60% 60% 3.14%
Occupancy Rate (Available Beds) 63% 63% 65% 65% 65% 2.53%
Occupancy Rate (Staffed Beds) 69% 68% 71% 74% 75% 8.01%
Available Beds as Percent of Licensed Beds 92% 93% 93% 93% 92% 0.59%
Staffed Beds as Percent of Licensed Beds 84% 85% 85% 81% 80% -4.51%
Source: “Annual Hospital Financial Data,” California Office of Statewide Health Planning and Development (OSHPD), Pivot Profiles with data selected for general acute care hospitals (Retrieved from http://www.oshpd.ca.gov/HQAD/Hospital/financial/hospAF.htm, October 2006). See Appendix A for detailed methodology. Note: Includes Kaiser data.
Formula: Occupancy Rate = (Total Inpatient Days/365 * Total Available Beds) * 100

Financial Health of California Hospitals 3-4 PricewaterhouseCoopers LLP
California Hospital Composition, Typology and Trends California hospitals can be categorized by a number of characteristics, including size (number of beds), ownership, geographic location, affiliated or not affiliated with a health system, and special features such as whether a hospital is an academic medical center (AMC) or a safety net facility. This section profiles California hospitals by these key characteristics as a background to understand the relationship of these variables’ past and future to financial performance.
Composition by Size Of the 355 general acute care hospitals reporting in 2005, approximately two-thirds (67 percent) had 250 or fewer available beds (Figure 3.4), and 43 percent had fewer than 150 available beds. Large hospitals, those with more than 350 beds, were fewer in number (18 percent) but had the largest share of beds, patient days and net revenues of any other size group. The number of large hospitals grew from 14 percent of total hospitals in 2001 to 18 percent in 2005. The average number of beds in California hospitals in 2005 was 211; little changed from 2000 when the average number of beds was 200.
Figure 3.4: Composition of California Hospitals by Hospital Size 2001–2005
Hospital Size
(Available Beds)
Number of Hospitals Available Beds Patient Days
Net Patient Revenues
(includes Kaiser but excludes DSH
transfer)
Net Patient Revenues
(includes Kaiser and net DSH
transfer)
2001 <150 47% 19% 16% 14% 14% 151-250 25% 25% 25% 23% 23% 251-350 14% 21% 22% 21% 22% 350+ 14% 35% 37% 42% 41% 2001 Total 383 75,502 17,381,380 $34,008,394,613 $38,449,022,324 2002 <150 46% 19% 17% 14% 15% 151-250 25% 24% 24% 22% 22% 251-350 14% 21% 22% 21% 21% 350+ 15% 36% 38% 43% 42% 2002 Total 381 76,586 17,502,557 $37,603,696,465 $42,442,415,941 2003 <150 45% 18% 15% 13% 14% 151-250 26% 25% 25% 23% 23% 251-350 13% 20% 20% 19% 20% 350+ 16% 38% 40% 45% 43% 2003 Total 378 76,588 18,130,012 $41,828,951,181 $47,881,504,316 2004 <150 43% 16% 14% 12% 12% 151-250 25% 23% 22% 20% 20% 251-350 15% 22% 23% 23% 23% 350+ 17% 39% 41% 46% 45% 2004 Total 363 75,803 17,846,797 $43,958,897,499 $51,421,704,196 2005 <150 43% 16% 13% 12% 12% 151-250 24% 22% 21% 19% 19% 251-350 15% 21% 22% 22% 22% 350+ 18% 41% 44% 47% 46% 2005 Total 355 75,517 17,824,664 $47,603,664,350 $55,559,397,677
Source: “Annual Hospital Financial Data,” California Office of Statewide Health Planning and Development (OSHPD), Pivot Profiles with data selected for general acute care hospitals (Retrieved from http://www.oshpd.ca.gov/HQAD/Hospital/financial/hospAF.htm, October 2006). See Appendix A for detailed methodology. Note: Includes Kaiser data.
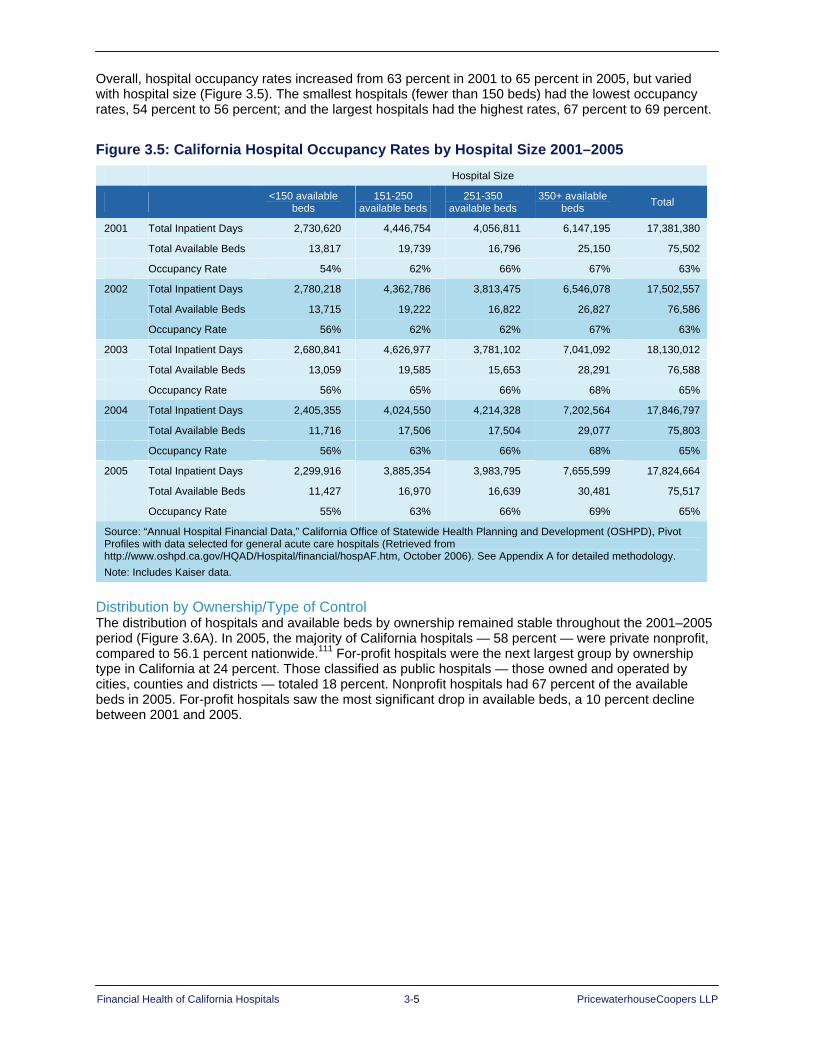
Financial Health of California Hospitals 3-5 PricewaterhouseCoopers LLP
Overall, hospital occupancy rates increased from 63 percent in 2001 to 65 percent in 2005, but varied with hospital size (Figure 3.5). The smallest hospitals (fewer than 150 beds) had the lowest occupancy rates, 54 percent to 56 percent; and the largest hospitals had the highest rates, 67 percent to 69 percent.
Figure 3.5: California Hospital Occupancy Rates by Hospital Size 2001–2005 Hospital Size
<150 available beds
151-250 available beds
251-350 available beds
350+ available beds Total
2001 Total Inpatient Days 2,730,620 4,446,754 4,056,811 6,147,195 17,381,380
Total Available Beds 13,817 19,739 16,796 25,150 75,502
Occupancy Rate 54% 62% 66% 67% 63%
2002 Total Inpatient Days 2,780,218 4,362,786 3,813,475 6,546,078 17,502,557
Total Available Beds 13,715 19,222 16,822 26,827 76,586
Occupancy Rate 56% 62% 62% 67% 63%
2003 Total Inpatient Days 2,680,841 4,626,977 3,781,102 7,041,092 18,130,012
Total Available Beds 13,059 19,585 15,653 28,291 76,588
Occupancy Rate 56% 65% 66% 68% 65%
2004 Total Inpatient Days 2,405,355 4,024,550 4,214,328 7,202,564 17,846,797
Total Available Beds 11,716 17,506 17,504 29,077 75,803
Occupancy Rate 56% 63% 66% 68% 65%
2005 Total Inpatient Days 2,299,916 3,885,354 3,983,795 7,655,599 17,824,664
Total Available Beds 11,427 16,970 16,639 30,481 75,517
Occupancy Rate 55% 63% 66% 69% 65%
Source: “Annual Hospital Financial Data,” California Office of Statewide Health Planning and Development (OSHPD), Pivot Profiles with data selected for general acute care hospitals (Retrieved from http://www.oshpd.ca.gov/HQAD/Hospital/financial/hospAF.htm, October 2006). See Appendix A for detailed methodology. Note: Includes Kaiser data.
Distribution by Ownership/Type of Control The distribution of hospitals and available beds by ownership remained stable throughout the 2001–2005 period (Figure 3.6A). In 2005, the majority of California hospitals — 58 percent — were private nonprofit, compared to 56.1 percent nationwide.111 For-profit hospitals were the next largest group by ownership type in California at 24 percent. Those classified as public hospitals — those owned and operated by cities, counties and districts — totaled 18 percent. Nonprofit hospitals had 67 percent of the available beds in 2005. For-profit hospitals saw the most significant drop in available beds, a 10 percent decline between 2001 and 2005.

Financial Health of California Hospitals 3-6 PricewaterhouseCoopers LLP
Figure 3.6A: California General Acute Care Hospitals by Type of Control 2001–2005
Number of Hospitals Type of Control 2001 2002 2003 2004 2005
City/County 21 21 21 19 19
District 44 45 46 45 46
For-Profit 94 96 93 86 84
Nonprofit 224 219 218 213 206
Total 383 381 378 363 355
Number of Hospitals (Percent) Type of Control 2001 2002 2003 2004 2005
City/County 5% 5% 6% 5% 5%
District 11% 12% 12% 12% 13%
For-Profit 25% 25% 25% 24% 24%
Nonprofit 58% 57% 58% 59% 58%
Number of Available Beds Type of Control 2001 2002 2003 2004 2005
City/County 5,822 5,854 5,809 6,119 5,937
District 5,088 5,157 5,403 5,392 5,642
For-Profit 14,115 14,615 14,545 13,492 13,316
Nonprofit 50,477 50,960 50,831 50,800 50,622
Total 75,502 76,586 76,588 75,803 75,517
Number of Available Beds (Percent) Type of Control 2001 2002 2003 2004 2005
City/County 8% 8% 8% 8% 8%
District 7% 7% 7% 7% 7%
For-Profit 19% 19% 19% 18% 18%
Nonprofit 67% 67% 66% 67% 67%
Average Bed Size
Type of Control 2001 2002 2003 2004 2005
City/County 277 279 277 322 312
District 116 115 117 120 123
For-Profit 150 152 156 157 159
Nonprofit 225 233 233 238 246
Total 197 201 203 209 213
Source: “Annual Hospital Financial Data,” California Office of Statewide Health Planning and Development (OSHPD), Pivot Profiles with data selected for general acute care hospitals (Retrieved from http://www.oshpd.ca.gov/HQAD/ Hospital/financial/hospAF.htm, October 2006). See Appendix A for detailed methodology.
Note: Includes Kaiser data.
Formula: Occupancy Rate = (Total Inpatient Days/365 * Total Available Beds) * 100

Financial Health of California Hospitals 3-7 PricewaterhouseCoopers LLP
Figure 3.6B: California General Acute Care Hospitals by Type of Control 2005
FOR-PROFIT 24%
DISTRICT 13%
CITY/COUNTY 5%
Number of Hospitals in 2005
NONPROFIT 58%
FOR-PROFIT 18%
NONPROFIT67%
DISTRICT 7%
CITY/COUNTY 8%
Number of Available Beds in 2005

Financial Health of California Hospitals 3-8 PricewaterhouseCoopers LLP
Occupancy rates were slightly higher for city, county and district hospitals in California (Figure 3.7) in 2005. For-profit hospitals had the lowest occupancy rate at 58 percent.
Figure 3.7: California Hospital Occupancy Rates by Type of Control 2001–2005
City/County District For-Profit Nonprofit Total
2001 Total Inpatient Days 1,494,003 1,233,274 2,930,305 11,723,798 17,381,380
Total Available Beds 5,822 5,088 14,115 50,477 75,502
Occupancy Rate 70% 66% 57% 64% 63%
2002 Total Inpatient Days 1,513,008 1,249,119 3,072,049 11,668,381 17,502,557
Total Available Beds 5,854 5,157 14,615 50,960 76,586
Occupancy Rate 71% 66% 58% 64% 63%
2003 Total Inpatient Days 1,496,528 1,293,838 3,117,027 12,222,619 18,130,012
Total Available Beds 5,809 5,403 14,545 50,831 75,588
Occupancy Rate 71% 66% 59% 66% 65%
2004 Total Inpatient Days 1,494,851 1,343,014 2,827,819 12,181,113 17,846,797
Total Available Beds 6,119 5,392 13,492 50,800 75,803
Occupancy Rate 67% 68% 57% 66% 65%
2005 Total Inpatient Days 1,504,103 1,392,423 2,807,418 12,120,720 17,824,664
Total Available Beds 5,937 5,642 13,316 50,622 75,517
Occupancy Rate 69% 68% 58% 66% 65%
Source: “Annual Hospital Financial Data,” California Office of Statewide Health Planning and Development (OSHPD), Pivot Profiles with data selected for general acute care hospitals (Retrieved from http://www.oshpd.ca.gov/HQAD/Hospital/financial/hospAF.htm, October 2006). See Appendix A for detailed methodology.
Note: Includes Kaiser data.
Rural Hospitals by Type of Control Less than 20 percent of California hospitals are classified as rural. Rural hospitals, as identified in the OSHPD data, were designated legislatively by Section 439 of the California Health and Safety Code in 1991. These are hospitals in communities with a population of 15,000 or less (based on 1980 census data) that are classified as small urban or rural and have no more than 76 acute care beds. The California Rural Health Policy Council is collaborating with OSHPD and the California Department of Health Services to develop legislative language to update this list.112
Rural hospitals reflected a different ownership composition than all other hospitals in California in 2005 (Figure 3.8). Approximately two-thirds of the district hospitals were designated rural hospitals (31 of 46 in 2005) and represented 47 percent of the total rural hospitals. Another 45 percent of rural hospitals were nonprofit, while 61 percent of all other hospitals in the state were nonprofit. For-profit ownership of rural hospitals declined over the study period to only two hospitals, leaving only 3 percent of rural hospitals owned by for-profit entities, compared to 28 percent of all other hospitals categorized as for-profit.

Financial Health of California Hospitals 3-9 PricewaterhouseCoopers LLP
Figure 3.8: Rural Hospitals by Type of Control Compared to All Other California Hospitals 2001–2005
Number of Rural Hospitals by Type of Control
Number of All Other Hospitals by Type of Control
Type of Control 2001 2002 2003 2004 2005 2001 2002 2003 2004 2005
City/County 3 3 3 3 3 18 18 18 16 16
District 31 32 32 31 31 13 13 14 14 15
For-Profit 5 6 5 5 2 89 90 88 81 82
Nonprofit 31 32 32 31 30 193 187 186 182 176
Total 70 73 72 70 66 313 308 306 293 289
Distribution of Rural Hospitals by Type of Control
Distribution of All Other Hospitals by Type of Control
Type of Control 2001 2002 2003 2004 2005 2001 2002 2003 2004 2005
City/County 4% 4% 4% 4% 5% 6% 6% 6% 5% 6%
District 44% 44% 44% 44% 47% 4% 4% 5% 5% 5%
For-Profit 7% 8% 7% 7% 3% 28% 29% 29% 28% 28%
Nonprofit 44% 44% 44% 44% 45% 62% 61% 61% 62% 61%
Source: “Annual Hospital Financial Data,” California Office of Statewide Health Planning and Development (OSHPD), Pivot Profiles with data selected for general acute care hospitals (Retrieved from http://www.oshpd.ca.gov/HQAD/Hospital/financial/hospAF.htm, October 2006). See Appendix A for detailed methodology. Note: Includes Kaiser data2.
All Other Hospitals in 2005
DISTRICT 5%
NONPROFIT61%
CITY/COUNTY 6%
FOR-PROFIT
28%
Rural Hospitals in 2005
45%
FOR-PROFIT
3%
NONPROFIT 45%
DISTRICT47%
CITY/COUNTY 5%

Financial Health of California Hospitals 3-10 PricewaterhouseCoopers LLP
Distribution by Geographic Region Throughout this report, geographic regions refers to the areas outlined in the map in Figure 3.9A. These regions are based on the regions used by the California Health Interview Survey (CHIS), but are modified to break out San Diego and Orange counties because of their significant size.
The greatest concentration of hospitals and available beds lies in the heavily populated urban Greater Bay Area counties and Los Angeles County (Figure 3.9B).
It is also evident from the geographic distribution that the largest decrease in the number of hospitals occurred in Southern California, particularly in Los Angeles and Orange counties. These closures did not produce a proportionate decrease in available beds, indicating that closures were among smaller hospitals and that existing hospitals or new hospitals may have increased available beds.
Figure 3.9A: Geographic Regions Map

Financial Health of California Hospitals 3-11 PricewaterhouseCoopers LLP
Figure 3.9B: Distribution of Hospitals by Geographic Regions 2001 and 2005 Region Counties Hospitals 2001 Hospitals 2005
Northern and Sierra Counties Alpine
Amador
Butte
Calaveras
Colusa
Del Norte
Glenn
Humboldt
Inyo
Lake
Lassen
Mariposa
Mendocino
Modoc
Mono
Nevada
Plumas
Shasta
Sierra
Siskiyou
Sutter
Tehama
Trinity
Tuolumne
Yuba
44 42
Sacramento Area Counties El Dorado
Placer
Sacramento
Yolo
14 14
San Joaquin Counties Fresno
Kern
Kings
Madera
Merced
San Joaquin
Stanislaus
Tulare
47 45
Central Coast Counties Monterey
San Benito
San Luis Obispo
Santa Barbara
Ventura
27 25
Los Angeles County Los Angeles 103 91
Orange County Orange 31 28
San Diego County San Diego 20 19
Other Southern Counties Imperial
Riverside
San Bernardino
35 31
Total 383 355
Source: “Annual Hospital Financial Data,” California Office of Statewide Health Planning and Development (OSHPD), Pivot Profiles with data selected for general acute care hospitals (Retrieved from http://www.oshpd.ca.gov/HQAD/Hospital/financial/hospAF.htm, October 2006). See Appendix A for detailed methodology.

Financial Health of California Hospitals 3-12 PricewaterhouseCoopers LLP
Figure 3.10A: California Hospitals by Region 2001–2005
Central Coast Counties
Greater Bay Area Counties
Los Angeles County
Northern and Sierra Counties
Other Southern Counties
2001 Net Patient Revenues (with DSH Transfer) $1,939,958,217 $7,873,328,512 $9,899,087,369 $1,508,874,699 $2,740,523,896
Number of Hospitals 27 54 94 44 33
Available Beds 3,923 12,707 23,191 3,448 5,882
Average Available Beds 145 235 247 78 178
2002 Net Patient Revenues (with DSH Transfer) $2,185,888,788 $8,645,797,471 $10,651,664,860 $1,694,954,815 $3,057,069,318
Number of Hospitals 27 53 94 44 33
Available Beds 4,003 12,935 23,220 3,440 5,987
Average Number Beds 148 244 247 78 181
2003 Net Patient Revenues (with DSH Transfer) $2,366,870,057 $9,757,766,901 $11,805,759,740 $1,826,851,323 $3,311,582,829
Number of Hospitals 27 53 91 45 32
Available Beds 4,039 12,498 23,058 3,475 6,062
Average Available Beds 150 236 253 77 189
2004 Net Patient Revenues (with DSH Transfer) $2,445,697,836 $10,701,648,531 $11,755,861,229 $1,802,900,744 $3,563,723,006
Number of Hospitals 24 53 85 42 31
Available Beds 3,867 13,055 22,029 3,426 6,129
Average Available Beds 161 246 259 82 198
2005 Net Patient Revenues (with DSH Transfer) $2,659,379,197 $11,704,330,853 $12,489,897,063 $2,026,994,349 $3,908,570,185
Number of Hospitals 25 50 84 42 29
Available Beds 3,867 12,619 22,244 3,252 6,034
Average Available Beds 155 252 265 77 208
Source: “Annual Hospital Financial Data,” California Office of Statewide Health Planning and Development (OSHPD), Pivot Profiles with data selected for general acute care hospitals (Retrieved from http://www.oshpd.ca.gov/HQAD/Hospital/financial/hospAF.htm, October 2006). See Appendix A for detailed methodology. Note: Excludes Kaiser data (Net patient revenue cannot be assigned correctly to individual Kaiser facilities.)
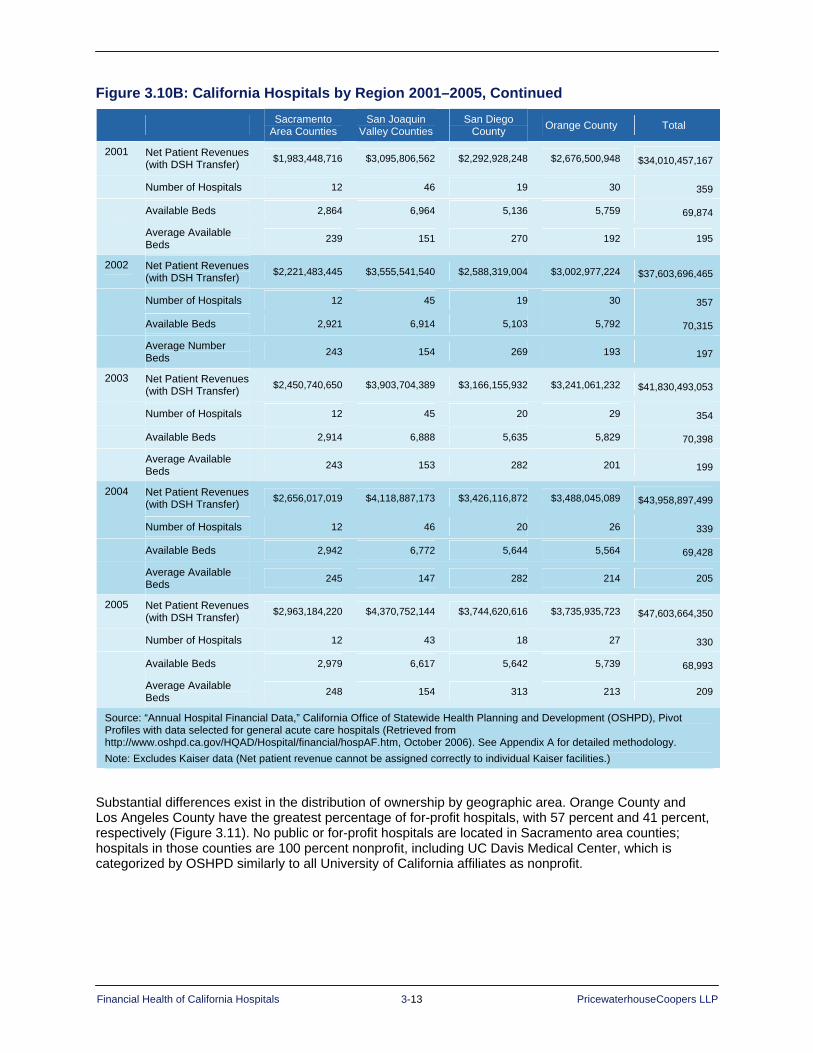
Financial Health of California Hospitals 3-13 PricewaterhouseCoopers LLP
Figure 3.10B: California Hospitals by Region 2001–2005, Continued
Sacramento Area Counties
San Joaquin Valley Counties
San Diego County Orange County Total
2001 Net Patient Revenues (with DSH Transfer) $1,983,448,716 $3,095,806,562 $2,292,928,248 $2,676,500,948 $34,010,457,167
Number of Hospitals 12 46 19 30 359
Available Beds 2,864 6,964 5,136 5,759 69,874
Average Available Beds 239 151 270 192 195
2002 Net Patient Revenues (with DSH Transfer) $2,221,483,445 $3,555,541,540 $2,588,319,004 $3,002,977,224 $37,603,696,465
Number of Hospitals 12 45 19 30 357
Available Beds 2,921 6,914 5,103 5,792 70,315
Average Number Beds 243 154 269 193 197
2003 Net Patient Revenues (with DSH Transfer) $2,450,740,650 $3,903,704,389 $3,166,155,932 $3,241,061,232 $41,830,493,053
Number of Hospitals 12 45 20 29 354
Available Beds 2,914 6,888 5,635 5,829 70,398
Average Available Beds 243 153 282 201 199
2004 Net Patient Revenues (with DSH Transfer) $2,656,017,019 $4,118,887,173 $3,426,116,872 $3,488,045,089 $43,958,897,499
Number of Hospitals 12 46 20 26 339
Available Beds 2,942 6,772 5,644 5,564 69,428
Average Available Beds 245 147 282 214 205
2005 Net Patient Revenues (with DSH Transfer) $2,963,184,220 $4,370,752,144 $3,744,620,616 $3,735,935,723 $47,603,664,350
Number of Hospitals 12 43 18 27 330
Available Beds 2,979 6,617 5,642 5,739 68,993
Average Available Beds 248 154 313 213 209
Source: “Annual Hospital Financial Data,” California Office of Statewide Health Planning and Development (OSHPD), Pivot Profiles with data selected for general acute care hospitals (Retrieved from http://www.oshpd.ca.gov/HQAD/Hospital/financial/hospAF.htm, October 2006). See Appendix A for detailed methodology. Note: Excludes Kaiser data (Net patient revenue cannot be assigned correctly to individual Kaiser facilities.)
Substantial differences exist in the distribution of ownership by geographic area. Orange County and Los Angeles County have the greatest percentage of for-profit hospitals, with 57 percent and 41 percent, respectively (Figure 3.11). No public or for-profit hospitals are located in Sacramento area counties; hospitals in those counties are 100 percent nonprofit, including UC Davis Medical Center, which is categorized by OSHPD similarly to all University of California affiliates as nonprofit.
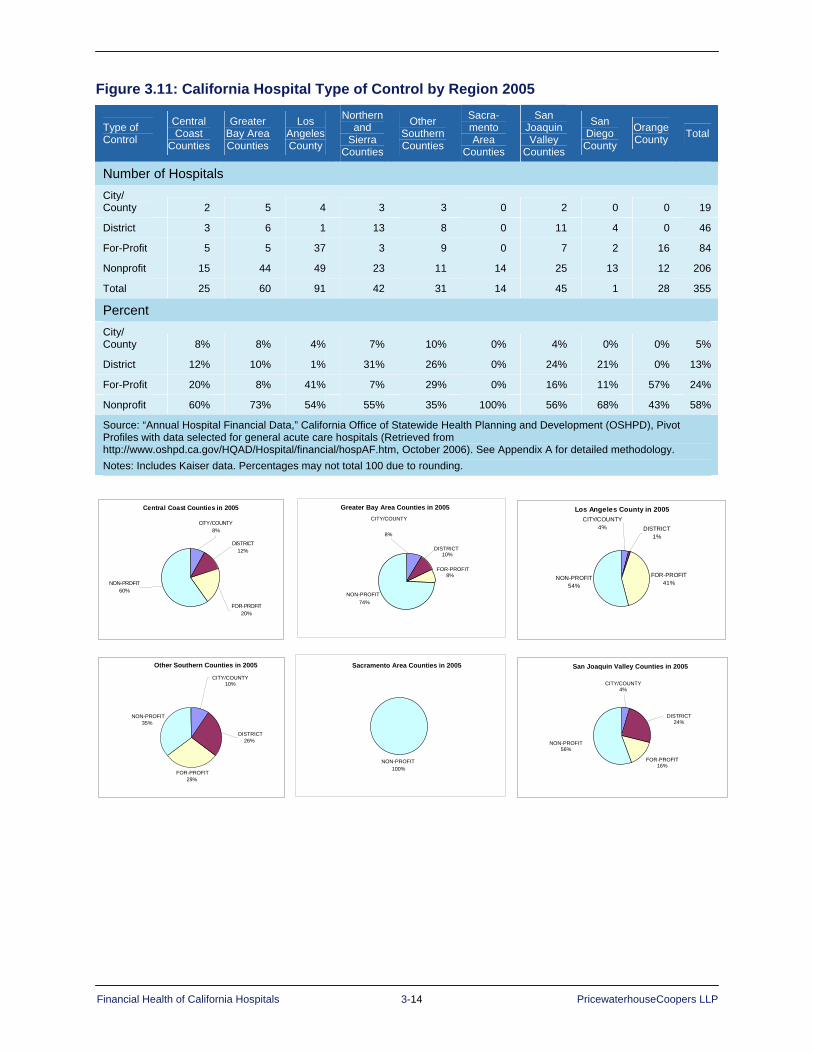
Financial Health of California Hospitals 3-14 PricewaterhouseCoopers LLP
Figure 3.11: California Hospital Type of Control by Region 2005
Type of Control
Central Coast
Counties
Greater Bay Area Counties
Los Angeles County
Northern and
Sierra Counties
Other Southern Counties
Sacra-mento Area
Counties
San Joaquin Valley
Counties
San Diego County
Orange County Total
Number of Hospitals City/ County 2 5 4 3 3 0 2 0 0 19
District 3 6 1 13 8 0 11 4 0 46
For-Profit 5 5 37 3 9 0 7 2 16 84
Nonprofit 15 44 49 23 11 14 25 13 12 206
Total 25 60 91 42 31 14 45 1 28 355
Percent City/ County 8% 8% 4% 7% 10% 0% 4% 0% 0% 5%
District 12% 10% 1% 31% 26% 0% 24% 21% 0% 13%
For-Profit 20% 8% 41% 7% 29% 0% 16% 11% 57% 24%
Nonprofit 60% 73% 54% 55% 35% 100% 56% 68% 43% 58%
Source: “Annual Hospital Financial Data,” California Office of Statewide Health Planning and Development (OSHPD), Pivot Profiles with data selected for general acute care hospitals (Retrieved from http://www.oshpd.ca.gov/HQAD/Hospital/financial/hospAF.htm, October 2006). See Appendix A for detailed methodology. Notes: Includes Kaiser data. Percentages may not total 100 due to rounding.
Central Coast Counties in 2005
CITY/COUNTY8%
DISTRICT12%
NON-PROFIT60%
FOR-PROFIT20%
Greater Bay Area Counties in 2005
FOR-PROFIT8%
NON-PROFIT74%
DISTRICT10%
CITY/COUNTY
8%
Los Angeles County in 2005
FOR-PROFIT41%
NON-PROFIT54%
DISTRICT1%
CITY/COUNTY4%
San Joaquin Valley Counties in 2005
FOR-PROFIT 16%
NON-PROFIT 56%
DISTRICT24%
CITY/COUNTY 4%
Other Southern Counties in 2005
FOR-PROFIT 29%
NON-PROFIT35%
CITY/COUNTY 10%
DISTRICT 26%
Sacramento Area Counties in 2005
NON-PROFIT100%

Financial Health of California Hospitals 3-15 PricewaterhouseCoopers LLP
Distribution by System Designation Almost two-thirds of California hospitals (62 percent) are members of a system, according to 2005 data reported in the American Hospital Association (AHA) annual survey (Figure 3.12A). This compares to 60 percent in 2001, a 2 percent increase over the five years. AHA uses the term health care system both for multihospital and diversified single-hospital systems. The system may be centralized, decentralized or independent. The designation may be applied to a single California hospital that is part of a regional or national chain, as well as affiliates of systems that are primarily based in California. Almost three-quarters (74.3 percent) of system hospitals are large and medium-large, those with more than 250 beds. In contrast, about half (52.3 percent) of small hospitals, those with less than 150 beds, are system hospitals.113
The top five hospital systems in California were identified by considering the number of facilities, patient days and discharges, and net revenue over the time period. For purposes of this report, they are Catholic Healthcare West, Kaiser Permanente, Tenet Healthcare Corporation, Sutter Health and the University of California’s hospitals.114 In 2005, hospitals in the top five systems comprised nearly half of all California hospitals in systems and 29 percent of all general acute care hospitals in the state.
Affiliation with a health system has been one of the ways that individual hospitals have positioned themselves to take advantage of a larger scale. Negotiating clout with payers, buying power for medical supplies, access to expertise in various managerial and clinical support functions (e.g., reimbursement, medical management, decision support), and the ability to maintain a more robust suite of information technology solutions are all reasons to affiliate with health systems.
Figure 3.12A: California Hospitals by System Designation in 2005
Top Five Systems All Systems Non-System Total Percent Top
Five Percent All Systems
2001 126 238 145 383 32.9% 62.1%
2002 125 237 144 381 32.8% 62.2%
2003 121 233 145 378 32.0% 61.6%
2004 106 217 146 363 29.2% 59.8%
2005 104 221 134 355 29.3% 62.3%
Percent of Total 29% 62% 38% 100% 29.3% 62.3%
Source: American Hospital Association, AHA Hospital Statistics (2006) Notes: Includes Kaiser data.
The top five hospital systems are Catholic Healthcare West, Kaiser Permanente, Tenet Healthcare Corporation, Sutter Healthcare Corporation and the University of California.
Northern and Sierra Counties in 2005
NONPROFIT 55%
CITY/COUNTY 7% DISTRICT
31%
FOR-PROFIT 7%
San Diego County in 2004
NON-PROFIT 68% FOR-PROFIT
11%
DISTRICT21%
CITY/COUNTY0%
Orange County in 2005
NON-PROFIT43
CITY/COUNTY0%
DISTRICT0%
FOR-PROFIT57%
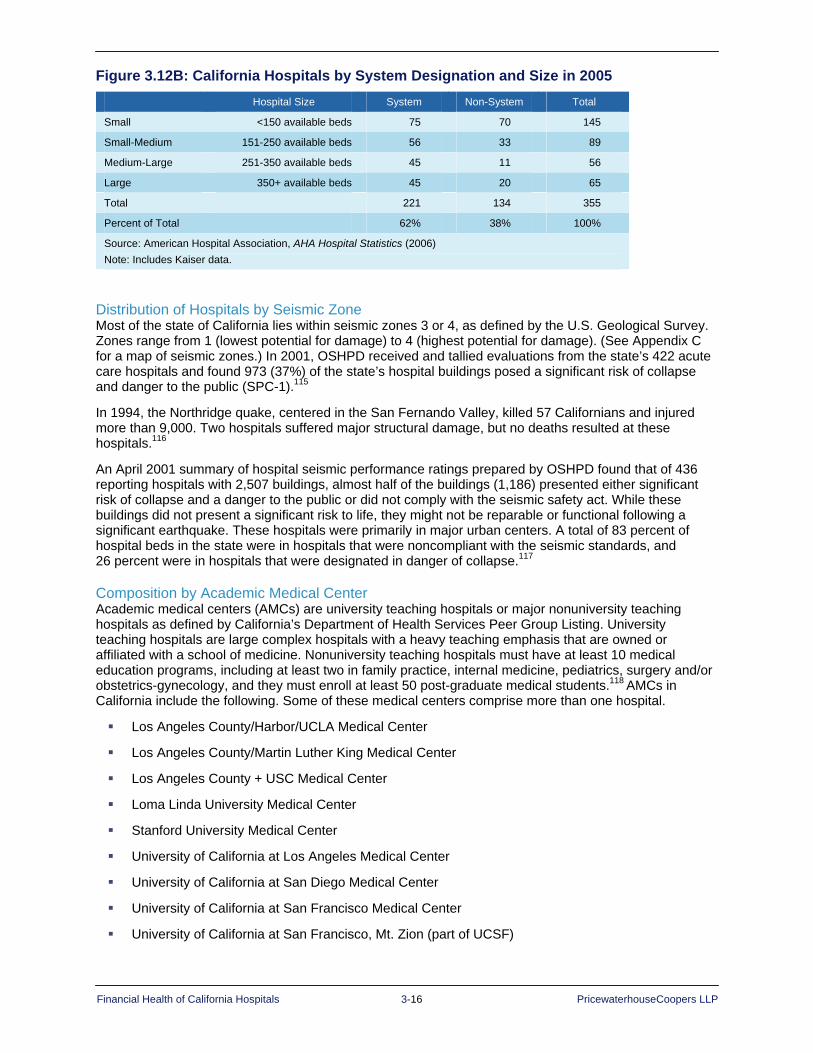
Financial Health of California Hospitals 3-16 PricewaterhouseCoopers LLP
Figure 3.12B: California Hospitals by System Designation and Size in 2005 Hospital Size System Non-System Total
Small <150 available beds 75 70 145
Small-Medium 151-250 available beds 56 33 89
Medium-Large 251-350 available beds 45 11 56
Large 350+ available beds 45 20 65
Total 221 134 355
Percent of Total 62% 38% 100%
Source: American Hospital Association, AHA Hospital Statistics (2006) Note: Includes Kaiser data.
Distribution of Hospitals by Seismic Zone Most of the state of California lies within seismic zones 3 or 4, as defined by the U.S. Geological Survey. Zones range from 1 (lowest potential for damage) to 4 (highest potential for damage). (See Appendix C for a map of seismic zones.) In 2001, OSHPD received and tallied evaluations from the state’s 422 acute care hospitals and found 973 (37%) of the state’s hospital buildings posed a significant risk of collapse and danger to the public (SPC-1).115
In 1994, the Northridge quake, centered in the San Fernando Valley, killed 57 Californians and injured more than 9,000. Two hospitals suffered major structural damage, but no deaths resulted at these hospitals.116
An April 2001 summary of hospital seismic performance ratings prepared by OSHPD found that of 436 reporting hospitals with 2,507 buildings, almost half of the buildings (1,186) presented either significant risk of collapse and a danger to the public or did not comply with the seismic safety act. While these buildings did not present a significant risk to life, they might not be reparable or functional following a significant earthquake. These hospitals were primarily in major urban centers. A total of 83 percent of hospital beds in the state were in hospitals that were noncompliant with the seismic standards, and 26 percent were in hospitals that were designated in danger of collapse.117
Composition by Academic Medical Center Academic medical centers (AMCs) are university teaching hospitals or major nonuniversity teaching hospitals as defined by California’s Department of Health Services Peer Group Listing. University teaching hospitals are large complex hospitals with a heavy teaching emphasis that are owned or affiliated with a school of medicine. Nonuniversity teaching hospitals must have at least 10 medical education programs, including at least two in family practice, internal medicine, pediatrics, surgery and/or obstetrics-gynecology, and they must enroll at least 50 post-graduate medical students.118 AMCs in California include the following. Some of these medical centers comprise more than one hospital.
Los Angeles County/Harbor/UCLA Medical Center
Los Angeles County/Martin Luther King Medical Center
Los Angeles County + USC Medical Center
Loma Linda University Medical Center
Stanford University Medical Center
University of California at Los Angeles Medical Center
University of California at San Diego Medical Center
University of California at San Francisco Medical Center
University of California at San Francisco, Mt. Zion (part of UCSF)

Financial Health of California Hospitals 3-17 PricewaterhouseCoopers LLP
University of California, Irvine Medical Center
University of California, Davis Medical Center
Alameda County Medical Center
Arrowhead Regional Medical Center (formerly San Bernardino County)
Kern County Medical Center
San Francisco General Medical Center
University of Southern California (USC) University Medical Center (Los Angeles)
These 25 hospitals represent only 7 percent of all California hospitals, but they have 16 percent of the available beds, 18 percent of patient days and 25 percent of net patient revenues (Figure 3.13A). Sixteen of the hospitals are nonprofit, and nine are owned by a city or county. They are all located in urban areas.
Figure 3.13A: Composition of Academic Medical Centers (AMCs) in 2005
City/County AMCs Nonprofit AMCs All Academic Medical Centers All Hospitals
Number of Hospitals 9 16 25 355
Number of Available Beds 4,030 8,177 12,207 75,517
Total Patient Days 1,016,462 2,192,478 3,208,940 17,824,664
Net Patient Revenues $4,164,022,818 $9,862,818,372 $14,026,841,190 $57,215,571,505
Net Patient Revenues with Net DSH Transfers $2,861,492,953 $9,706,307,632 $12,567,800,585 $55,559,397,677
Source: “Annual Hospital Financial Data,” California Office of Statewide Health Planning and Development (OSHPD), Pivot Profiles with data selected for general acute care hospitals (Retrieved from http://www.oshpd.ca.gov/HQAD/Hospital/financial/hospAF.htm, October 2006). See Appendix A for detailed methodology. Notes: Includes Kaiser data. Hospital size is defined by available beds.
Figure 3.13B: Academic Medical Centers (AMCs) as Percent of All Hospitals in 2005
City/County AMCs Nonprofit AMCs All Academic Medical Centers
Number of Hospitals 3% 5% 7%
Number of Available Beds 5% 11% 16%
Total Patient Days 6% 12% 18%
Net Patient Revenues 7% 17% 25%
Net Patient Revenues with Net DSH Transfers 5% 17% 23%
Source: “Annual Hospital Financial Data,” California Office of Statewide Health Planning and Development (OSHPD), Pivot Profiles with data selected for general acute care hospitals (Retrieved from http://www.oshpd.ca.gov/HQAD/Hospital/financial/hospAF.htm, October 2006). See Appendix A for detailed methodology. Note: Includes Kaiser data. Hospital size is defined by available beds.

Financial Health of California Hospitals 3-18 PricewaterhouseCoopers LLP
Seventy-six percent of academic medical centers are large (350+ beds), while none has less than 150 beds (Figure 3.14). In contrast, only 18 percent of all California hospitals have 350 beds or more. The University of California operates eight acute care academic hospitals, two psychiatric hospitals and one skilled nursing facility on five campuses. The university’s medical centers serve as “safety net” hospitals for uninsured and underinsured patients in Sacramento, San Diego and Orange counties.119 Notably, they share the safety net burden through a long-standing affiliation with the County of Los Angeles Department of Health at two medical centers in Los Angeles County.
Figure 3.14: Academic Medical Centers by Size in 2005
Hospital Size Teaching All Hospitals
Small <150 available beds 0% 41%
Medium-Small 151-250 available beds 12% 25%
Medium-Large 251-350 available beds 12% 16%
Large 350+ available beds 76% 18%
All Hospitals All Hospitals 100% 100%
Source: “Annual Hospital Financial Data,” California Office of Statewide Health Planning and Development (OSHPD), Pivot Profiles with data selected for general acute care hospitals (Retrieved from http://www.oshpd.ca.gov/HQAD/Hospital/financial/hospAF.htm, October 2006). See Appendix A for detailed methodology. Notes: Includes Kaiser data2. Hospital size is defined by available beds.

Financial Health of California Hospitals 3-19 PricewaterhouseCoopers LLP
Disproportionate Share and Safety Net Hospitals Government payments to designated “safety net” hospitals can have a substantial impact on profitability. Safety net hospitals are those hospitals that serve a higher proportion of low-income and uninsured populations. The term also may refer to smaller hospitals in less populated areas that provide the only hospital services within the geographic area. Federal and state government programs recognize the critical role of these hospitals, and for those that meet the established criteria, provide enhanced or supplemental Medicare and/or Medicaid payments
Among those programs established by federal legislation are Medicare and Medicaid Disproportionate Share Hospital (DSH) programs, which provide additional funding for inpatient services to hospitals that serve large low-income populations. Nationally, Medicaid DSH funding, which is a capped amount of federal dollars per year, is substantially greater than Medicare DSH funding. The federal Medicaid DSH allotment amounts to $10.3 billion for FY 2007.120 Other federal legislation has established Medicare special payment policies for inpatient services for rural hospitals under a variety of designations, such as sole community hospital, rural referral center, Medicare dependent hospitals, Essential Access Community Hospital, and Critical Access Hospital (CAH).
For purposes of this report, “safety net” hospitals are those that qualify for Medicaid DSH funding under the federal criteria as specified in California under Senate Bill 855 (SB 855) signed in 1991 (see Figure 3.15). These hospitals meet the minimum criteria for the proportion of inpatient services to Medicaid beneficiaries or low-income populations and are identified in this analysis as the hospitals that reported receiving SB 855 funds in each year in their annual financial data. More than 100 California hospitals received Medicaid DSH funding each year of the analysis period. (This may differ from DSH eligibility reported by the California Department of Health Services because California determines eligibility for SB 855 funding on a state fiscal year basis [July to June], and the OSHPD reporting year may not coincide with the state fiscal year.)

Financial Health of California Hospitals 3-20 PricewaterhouseCoopers LLP
Figure 3.15: Count of Disproportionate Share Hospitals 2001–2005
Number of Hospitals Hospitals 2001 2002 2003 2004 2005
DHS 117 123 125 112 102
Non-DHS 266 258 253 251 253
Total 383 381 378 363 355
Source: “Annual Hospital Financial Data,” California Office of Statewide Health Planning and Development (OSHPD), Pivot Profiles with data selected for general acute care hospitals (Retrieved from http://www.oshpd.ca.gov/HQAD/Hospital/financial/hospAF.htm, October 2006). See Appendix A for detailed methodology.
Total California SB 855 DSH payments amount to approximately $2 billion per year. Because the local share is provided by intergovernmental transfers from public entities that own and operate hospitals — some county governments and the University of California, however, only the federal share — in California, approximately half of this amount — is considered supplemental DSH revenue. (Three of the University of California Hospitals [UC Davis, UC Irvine and UC San Diego] qualify for DSH funding. The other campuses, UC Los Angeles and UC San Francisco, are not DSH-eligible, but are considered Designated Public Hospitals under the Medicaid waiver. The Intergovernmental Transfer fund for their hospitals is provided by UC Systemwide.) The amount of supplemental funding varies with the exact ratio for the Federal Matching Assistance Payment (FMAP) and the proportion of the intergovernmental transfer that the county, district and University of California hospitals transfer back to the governmental entity. The public hospitals operated by governmental agencies that fund the intergovernmental transfer are guaranteed 50 percent of these federal funds.
During the analysis period, California also administered other supplemental funding programs that targeted additional funds to DSH-eligible hospitals. Eligibility for these programs varied but included DSH hospitals that provided emergency and maternity services (SB 1255) and a Medicaid GME (graduate medical education) program for teaching hospitals. These supplemental payments are included in reported revenue but cannot be separately identified in the OSHPD data.
In July 2005, near the end of the report analysis period, California began a new Federal Hospital Financing Waiver, which altered the supplemental funding programs for DSH hospitals and revamped the supplemental funding sources and allocation methods to public hospital for support services for Medi-Cal beneficiaries and the uninsured. Essentially, it removed intergovernmental transfer as a mechanism for drawing down federal Medicaid matching funds. The waiver instead called for state government to fund the match for private hospitals and for the public hospital match to be provided by certified public expenditures (CPEs). It also eliminated the SB 1255 program and other supplemental funding programs for DSH hospitals and instituted a Safety Net Pool and a Distressed Hospital Fund. Initial funding from the five-year waiver is estimated to boost public hospital funding by $242.8 million, a 12 percent increase over 2005.121 Because total waiver funding is capped, regardless of volume increases, the longer-term effect of the waiver cannot be determined at this time (See Appendix D for additional information.)
Rural safety net hospitals, as referred to in this report, are as those with Critical Access Hospital designation. Approximately 1,200 hospitals nationwide have CAH status, which increases their Medicare inpatient reimbursement to cover cost, as compared to reimbursement base upon the inpatient Diagnosis Related Group PPS system.122 Established by Congress in 1997, this program attempts to stabilize America’s smallest and most financially vulnerable rural hospitals and to improve access to hospital-based care for rural populations. As of November 2006, California had granted 24 hospitals CAH status.123
In addition, California designates rural hospitals (66 in 2005) under Section 439 of the Health and Safety Code. The state makes low-cost loans available to these hospitals and grants them some flexibility in meeting certain rules and regulations.124 The fiscal health of many rural hospitals depends on their ability to obtain status as critical access or sole community hospitals, which qualifies them for enhanced reimbursement for Medicare services.125
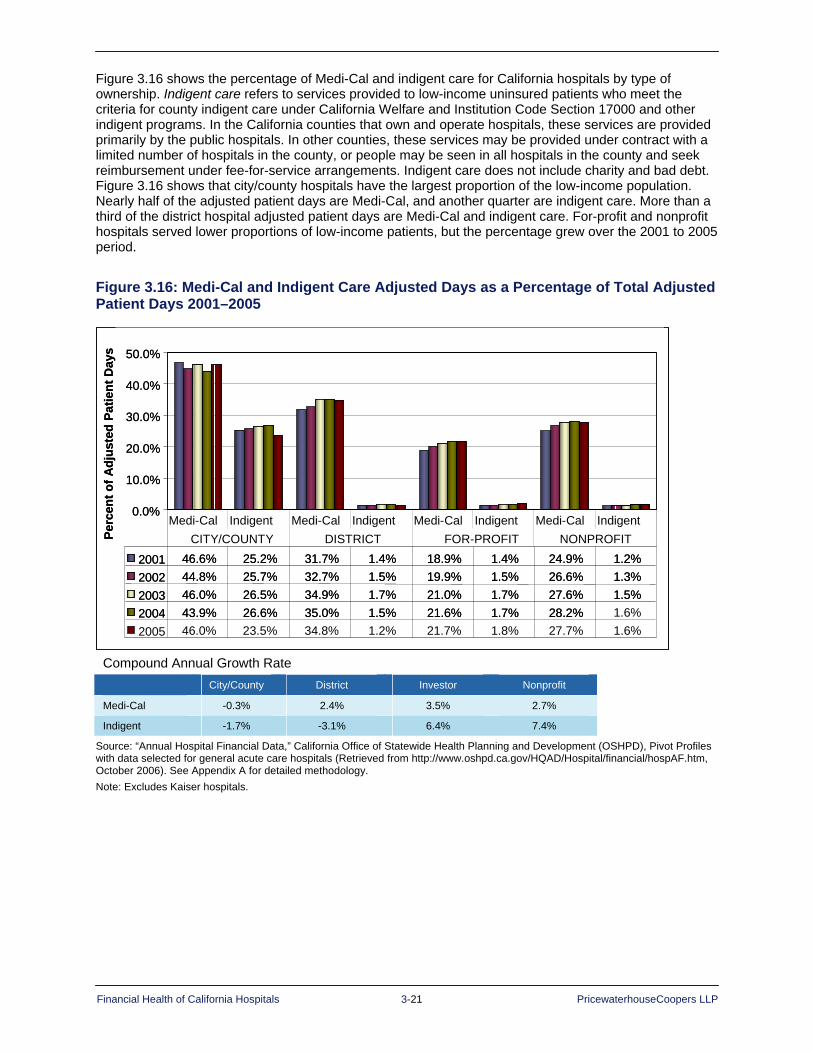
Financial Health of California Hospitals 3-21 PricewaterhouseCoopers LLP
Figure 3.16 shows the percentage of Medi-Cal and indigent care for California hospitals by type of ownership. Indigent care refers to services provided to low-income uninsured patients who meet the criteria for county indigent care under California Welfare and Institution Code Section 17000 and other indigent programs. In the California counties that own and operate hospitals, these services are provided primarily by the public hospitals. In other counties, these services may be provided under contract with a limited number of hospitals in the county, or people may be seen in all hospitals in the county and seek reimbursement under fee-for-service arrangements. Indigent care does not include charity and bad debt. Figure 3.16 shows that city/county hospitals have the largest proportion of the low-income population. Nearly half of the adjusted patient days are Medi-Cal, and another quarter are indigent care. More than a third of the district hospital adjusted patient days are Medi-Cal and indigent care. For-profit and nonprofit hospitals served lower proportions of low-income patients, but the percentage grew over the 2001 to 2005 period.
Figure 3.16: Medi-Cal and Indigent Care Adjusted Days as a Percentage of Total Adjusted Patient Days 2001–2005
0.0%
10.0%
20.0%
30.0%
40.0%
50.0%
2001 46.6% 25.2% 31.7% 1.4% 18.9% 1.4% 24.9% 1.2%2002 44.8% 25.7% 32.7% 1.5% 19.9% 1.5% 26.6% 1.3%2003 46.0% 26.5% 34.9% 1.7% 21.0% 1.7% 27.6% 1.5%2004 43.9% 26.6% 35.0% 1.5% 21.6% 1.7% 28.2% 1.6%2005 46.0% 23.5% 34.8% 1.2% 21.7% 1.8% 27.7% 1.6%
Medi-Cal Indigent Medi-Cal Indigent Medi-Cal Indigent Medi-Cal IndigentCITY/COUNTY DISTRICT FOR-PROFIT NONPROFITPe
rcen
t of A
djus
ted
Patie
nt D
ays
0.0%
10.0%
20.0%
30.0%
40.0%
50.0%
2001 46.6% 25.2% 31.7% 1.4% 18.9% 1.4% 24.9% 1.2%2002 44.8% 25.7% 32.7% 1.5% 19.9% 1.5% 26.6% 1.3%2003 46.0% 26.5% 34.9% 1.7% 21.0% 1.7% 27.6% 1.5%2004 43.9% 26.6% 35.0% 1.5% 21.6% 1.7% 28.2% 1.6%2005 46.0% 23.5% 34.8% 1.2% 21.7% 1.8% 27.7% 1.6%
Medi-Cal Indigent Medi-Cal Indigent Medi-Cal Indigent Medi-Cal IndigentCITY/COUNTY DISTRICT FOR-PROFIT NONPROFIT
0.0%
10.0%
20.0%
30.0%
40.0%
50.0%
2001 46.6% 25.2% 31.7% 1.4% 18.9% 1.4% 24.9% 1.2%2002 44.8% 25.7% 32.7% 1.5% 19.9% 1.5% 26.6% 1.3%2003 46.0% 26.5% 34.9% 1.7% 21.0% 1.7% 27.6% 1.5%2004 43.9% 26.6% 35.0% 1.5% 21.6% 1.7% 28.2%
0.0%
10.0%
20.0%
30.0%
40.0%
50.0%
2001 46.6% 25.2% 31.7% 1.4% 18.9% 1.4% 24.9% 1.2%2002 44.8% 25.7% 32.7% 1.5% 19.9% 1.5% 26.6% 1.3%2003 46.0% 26.5% 34.9% 1.7% 21.0% 1.7% 27.6% 1.5%2004 43.9% 26.6% 35.0% 1.5% 21.6% 1.7% 28.2% 1.6%2005 46.0% 23.5% 34.8% 1.2% 21.7% 1.8% 27.7% 1.6%
Medi-Cal Indigent Medi-Cal Indigent Medi-Cal Indigent Medi-Cal IndigentCITY/COUNTY DISTRICT FOR-PROFIT NONPROFITPe
rcen
t of A
djus
ted
Patie
nt D
ays
Compound Annual Growth Rate
City/County District Investor Nonprofit
Medi-Cal -0.3% 2.4% 3.5% 2.7%
Indigent -1.7% -3.1% 6.4% 7.4%
Source: “Annual Hospital Financial Data,” California Office of Statewide Health Planning and Development (OSHPD), Pivot Profiles with data selected for general acute care hospitals (Retrieved from http://www.oshpd.ca.gov/HQAD/Hospital/financial/hospAF.htm, October 2006). See Appendix A for detailed methodology. Note: Excludes Kaiser hospitals.

Financial Health of California Hospitals 3-22 PricewaterhouseCoopers LLP
Summary The gradual decline in the number of hospitals and inpatient beds in California is consistent with the national trend. More services are moving to an outpatient basis. This is forcing hospitals to redistribute their assets in a way that best aligns with the changing needs of their patients, physicians and the payer community. California remains much lower than the national average for number of beds per capita.
The greatest concentration of hospitals and available beds lies in the heavily populated, urban Greater Bay Area counties and Los Angeles County. Net patient revenues are also higher in those areas.
The average bed size for California hospitals in 2005 was 211. The smallest hospitals had the lowest occupancy rates over the five-year period of this report. Overall, total inpatient days for California hospitals increased for the period 2001–2005.
The for-profit sector made up about one-fourth of all hospitals in California. This sector also experienced the most substantial drop in revenue of any sector. The divestiture of 19 hospitals from the portfolio of Tenet Healthcare Corporation was a contributing factor. The majority of California hospitals were private nonprofit, and a majority of hospitals belonged to a system.
California hospitals lie within active seismic zones and face a challenge in meeting state seismic safety mandates. This challenge is most difficult for the state’s safety net hospitals, which provide care for the uninsured and underinsured.

Financial Health of California Hospitals 4-1 PricewaterhouseCoopers LLP
Chapter 4: Payment Structures and Utilization Trends
Key Findings Since 2001, California hospitals have become more dependent on revenue from commercial
insurers (private health plans). Commercial payment rates have helped offset the decline in government payment rates relative to hospital average expense.
Net revenue distribution by payer over the five-year period did not match volume distribution — trends moved in opposite directions. While commercial insurer net revenue increased, the proportion of commercial insurer discharges, both traditional and managed care, decreased from 33 percent in 2001 to 31 percent in 2005. Government program net revenue decreased, but the proportion of discharges increased from 60 percent in 2001 to 62 percent in 2005.
Inpatient utilization increased over the period. Inpatient days and discharges increased in absolute numbers and in rates per 1,000.
California hospitals are treating sicker patients than they were five years ago. The case mix index (CMI), a measure of diagnostic severity, has increased slightly since 2001. The increase in overall case mix was most evident in medium-to-large hospitals.
The number of reported hospital outpatient visits declined over the five-year period. More than 1 million surgeries were performed in ambulatory surgery centers and clinics in 2005. The expansion of ambulatory surgery centers is an important factor contributing to the lack of increase in the number of hospital-based outpatient surgeries in California hospitals.
Hospitals derive revenue for patient services from various third-party payers, primarily commercial health insurers and government health programs (Medicare and Medicaid). While hospitals establish a common charge schedule for services across all third-party payers, payment structure and reimbursement methodologies vary by payer. Hospital net revenue depends on the utilization of services and the payment rate the hospital receives for those services from each third-party payer.126 For commercial insurers, hospitals and third-party payers usually negotiate payment rates. For government programs, the payment rates often are set by policy, and the hospital accepts the payment level as part of the decision to accept patients who are covered by the government payer. Because third-party payers use different reimbursement methodologies that often result in different payment amounts for the same service provided by the hospital, the distribution of payment from third-party payers, the “payer mix,” is an important factor in the financial health of a hospital.
Utilization is the rate at which customers use hospital services, and often is measured by service per capita (e.g., admissions per 1,000 population).
Starting with the 2000 reporting period, the California Office of Statewide Health Planning and Development (OSHPD) required more detailed reporting of volume and revenue measures by payer source. Specifically, reports required that gross revenue, net revenue, number of patient discharges and patient days be separated into traditional (fee for service) and managed care, primarily health maintenance organizations (HMOs) and preferred provider organizations (PPOs). The OSHPD payer reporting categories are:
1. Medicare traditional 2. Medicare managed care 3. Medicaid (Medi-Cal) traditional 4. Medicaid (Medi-Cal) managed care 5. Third-party (commercial/private) traditional 6. Third-party (commercial/private) managed care 7. County indigent programs 8. Other indigent 9. Other payers
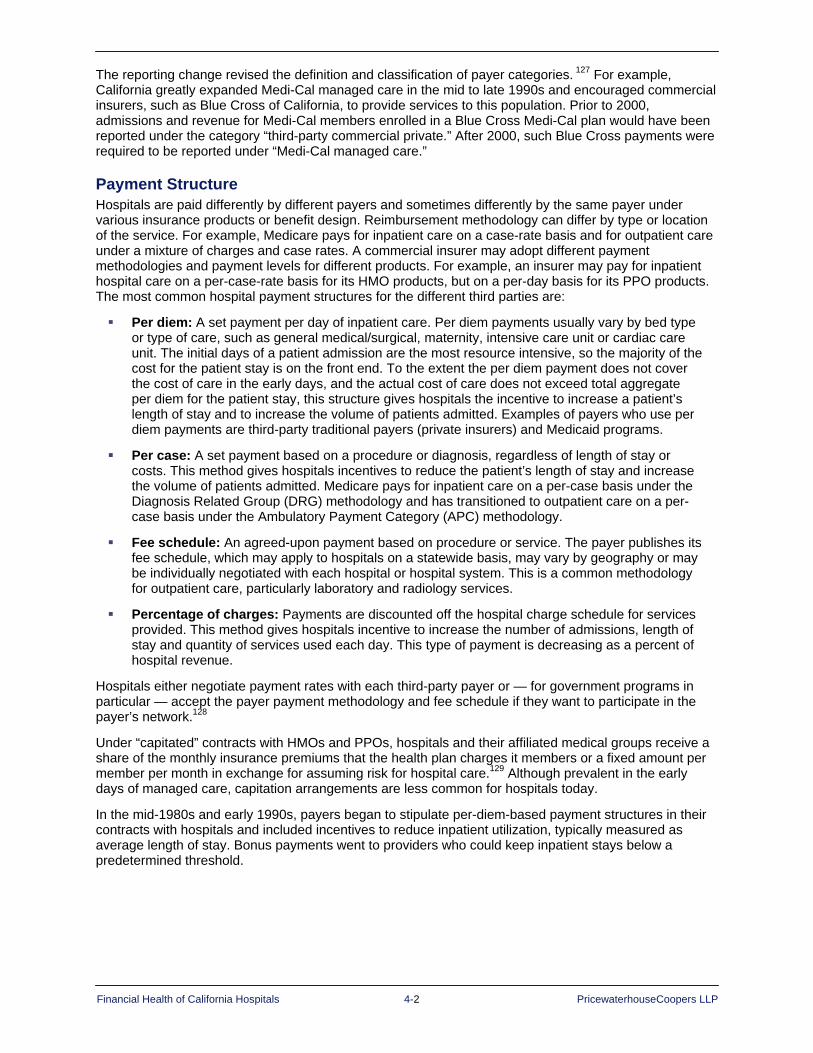
Financial Health of California Hospitals 4-2 PricewaterhouseCoopers LLP
The reporting change revised the definition and classification of payer categories. 127 For example, California greatly expanded Medi-Cal managed care in the mid to late 1990s and encouraged commercial insurers, such as Blue Cross of California, to provide services to this population. Prior to 2000, admissions and revenue for Medi-Cal members enrolled in a Blue Cross Medi-Cal plan would have been reported under the category “third-party commercial private.” After 2000, such Blue Cross payments were required to be reported under “Medi-Cal managed care.”
Payment Structure Hospitals are paid differently by different payers and sometimes differently by the same payer under various insurance products or benefit design. Reimbursement methodology can differ by type or location of the service. For example, Medicare pays for inpatient care on a case-rate basis and for outpatient care under a mixture of charges and case rates. A commercial insurer may adopt different payment methodologies and payment levels for different products. For example, an insurer may pay for inpatient hospital care on a per-case-rate basis for its HMO products, but on a per-day basis for its PPO products. The most common hospital payment structures for the different third parties are:
Per diem: A set payment per day of inpatient care. Per diem payments usually vary by bed type or type of care, such as general medical/surgical, maternity, intensive care unit or cardiac care unit. The initial days of a patient admission are the most resource intensive, so the majority of the cost for the patient stay is on the front end. To the extent the per diem payment does not cover the cost of care in the early days, and the actual cost of care does not exceed total aggregate per diem for the patient stay, this structure gives hospitals the incentive to increase a patient’s length of stay and to increase the volume of patients admitted. Examples of payers who use per diem payments are third-party traditional payers (private insurers) and Medicaid programs.
Per case: A set payment based on a procedure or diagnosis, regardless of length of stay or costs. This method gives hospitals incentives to reduce the patient’s length of stay and increase the volume of patients admitted. Medicare pays for inpatient care on a per-case basis under the Diagnosis Related Group (DRG) methodology and has transitioned to outpatient care on a per-case basis under the Ambulatory Payment Category (APC) methodology.
Fee schedule: An agreed-upon payment based on procedure or service. The payer publishes its fee schedule, which may apply to hospitals on a statewide basis, may vary by geography or may be individually negotiated with each hospital or hospital system. This is a common methodology for outpatient care, particularly laboratory and radiology services.
Percentage of charges: Payments are discounted off the hospital charge schedule for services provided. This method gives hospitals incentive to increase the number of admissions, length of stay and quantity of services used each day. This type of payment is decreasing as a percent of hospital revenue.
Hospitals either negotiate payment rates with each third-party payer or — for government programs in particular — accept the payer payment methodology and fee schedule if they want to participate in the payer’s network.128
Under “capitated” contracts with HMOs and PPOs, hospitals and their affiliated medical groups receive a share of the monthly insurance premiums that the health plan charges it members or a fixed amount per member per month in exchange for assuming risk for hospital care.129 Although prevalent in the early days of managed care, capitation arrangements are less common for hospitals today.
In the mid-1980s and early 1990s, payers began to stipulate per-diem-based payment structures in their contracts with hospitals and included incentives to reduce inpatient utilization, typically measured as average length of stay. Bonus payments went to providers who could keep inpatient stays below a predetermined threshold.
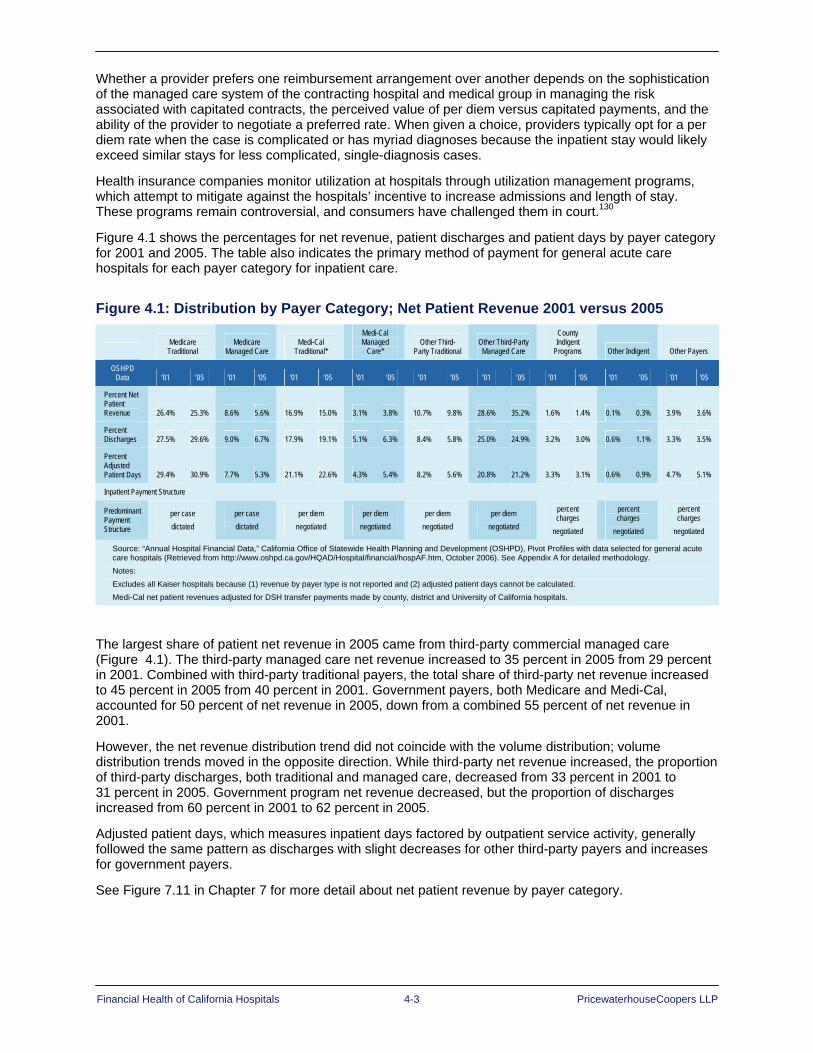
Financial Health of California Hospitals 4-3 PricewaterhouseCoopers LLP
Whether a provider prefers one reimbursement arrangement over another depends on the sophistication of the managed care system of the contracting hospital and medical group in managing the risk associated with capitated contracts, the perceived value of per diem versus capitated payments, and the ability of the provider to negotiate a preferred rate. When given a choice, providers typically opt for a per diem rate when the case is complicated or has myriad diagnoses because the inpatient stay would likely exceed similar stays for less complicated, single-diagnosis cases.
Health insurance companies monitor utilization at hospitals through utilization management programs, which attempt to mitigate against the hospitals’ incentive to increase admissions and length of stay. These programs remain controversial, and consumers have challenged them in court.130
Figure 4.1 shows the percentages for net revenue, patient discharges and patient days by payer category for 2001 and 2005. The table also indicates the primary method of payment for general acute care hospitals for each payer category for inpatient care.
Figure 4.1: Distribution by Payer Category; Net Patient Revenue 2001 versus 2005
Medicare
Traditional Medicare
Managed Care Medi-Cal
Traditional*
Medi-Cal Managed
Care* Other Third-
Party Traditional Other Third-Party
Managed Care
County Indigent
Programs Other Indigent Other Payers
OSHPD Data ’01 ’05 ’01 ’05 ’01 ’05 ’01 ’05 ’01 ’05 ’01 ’05 ’01 ’05 ’01 ’05 ’01 ’05
Percent Net Patient Revenue 26.4% 25.3% 8.6% 5.6% 16.9% 15.0% 3.1% 3.8% 10.7% 9.8% 28.6% 35.2% 1.6% 1.4% 0.1% 0.3% 3.9% 3.6%
Percent Discharges 27.5% 29.6% 9.0% 6.7% 17.9% 19.1% 5.1% 6.3% 8.4% 5.8% 25.0% 24.9% 3.2% 3.0% 0.6% 1.1% 3.3% 3.5%
Percent Adjusted Patient Days 29.4% 30.9% 7.7% 5.3% 21.1% 22.6% 4.3% 5.4% 8.2% 5.6% 20.8% 21.2% 3.3% 3.1% 0.6% 0.9% 4.7% 5.1%
Inpatient Payment Structure
Predominant Payment Structure
per case dictated
per case dictated
per diem negotiated
per diem negotiated
per diem negotiated
per diem negotiated
percent charges
negotiated
percent charges
negotiated
percent charges
negotiated
Source: “Annual Hospital Financial Data,” California Office of Statewide Health Planning and Development (OSHPD), Pivot Profiles with data selected for general acute care hospitals (Retrieved from http://www.oshpd.ca.gov/HQAD/Hospital/financial/hospAF.htm, October 2006). See Appendix A for detailed methodology. Notes: Excludes all Kaiser hospitals because (1) revenue by payer type is not reported and (2) adjusted patient days cannot be calculated. Medi-Cal net patient revenues adjusted for DSH transfer payments made by county, district and University of California hospitals.
The largest share of patient net revenue in 2005 came from third-party commercial managed care (Figure 4.1). The third-party managed care net revenue increased to 35 percent in 2005 from 29 percent in 2001. Combined with third-party traditional payers, the total share of third-party net revenue increased to 45 percent in 2005 from 40 percent in 2001. Government payers, both Medicare and Medi-Cal, accounted for 50 percent of net revenue in 2005, down from a combined 55 percent of net revenue in 2001.
However, the net revenue distribution trend did not coincide with the volume distribution; volume distribution trends moved in the opposite direction. While third-party net revenue increased, the proportion of third-party discharges, both traditional and managed care, decreased from 33 percent in 2001 to 31 percent in 2005. Government program net revenue decreased, but the proportion of discharges increased from 60 percent in 2001 to 62 percent in 2005.
Adjusted patient days, which measures inpatient days factored by outpatient service activity, generally followed the same pattern as discharges with slight decreases for other third-party payers and increases for government payers.
See Figure 7.11 in Chapter 7 for more detail about net patient revenue by payer category.

Financial Health of California Hospitals 4-4 PricewaterhouseCoopers LLP
Figure 4.2 shows the payment mix for outpatient services. Third-party commercial payers represent the largest percentage of gross outpatient revenue. The percentages for outpatient care in Figure 4.2 include emergency room visits and hospital-based clinics, and may indicate that Medi-Cal patients are increasing their use of these facilities.
Figure 4.2: Distribution by Payer Category; Outpatient Gross Revenue: 2001 versus 2005
Medicare
Traditional Medicare
Managed Care Medi-Cal
Traditional* Medi-Cal
Managed Care* Other Third-Party
Traditional Other Third-Party Managed Care
County Indigent Programs Other Indigent Other Payers
OSHPD Data ’01 ’05 ’01 ’05 ’01 ’05 ’01 ’05 ’01 ’05 ’01 ’05 ’01 ’05 ’01 ’05 ’01 ’05
Percent Gross Outpatient Revenue 22.0% 25.4% 6.8% 4.7% 10.1% 10.6% 4.8% 6.0% 12.4% 9.2% 33.7% 34.6% 3.9% 3.0% 0.6% 0.9% 5.8% 5.6%
Percent Outpatient Visits 21.6% 23.4% 5.0% 3.4% 13.9% 15.6% 5.9% 7.2% 12.0% 9.9% 28.3% 26.7% 5.2% 4.9% 0.8% 1.2% 7.3% 7.7%
Outpatient Payment Structure
Predomi-nant Payment Structure
per case dictated
per case dictated
fee schedule dictated
fee schedule dictated
fee schedule dictated
fee schedule dictated
percent charges negotiated
percent charges negotiated
percent charges negotiated
Source: “Annual Hospital Financial Data,” California Office of Statewide Health Planning and Development (OSHPD), Pivot Profiles with data selected for general acute care hospitals (Retrieved from http://www.oshpd.ca.gov/HQAD/Hospital/financial/hospAF.htm, October 2006). See Appendix A for detailed methodology. Notes: Excludes all Kaiser hospitals because revenue by payer type is not reported. Medi-Cal net patient revenues adjusted for DSH transfers payments made by county, district and University of California hospitals. Includes emergency department visits where patient returns home; excludes emergency department visits where patient is admitted to hospital.
Contractual Allowances Contractual allowances represent the difference between hospital charges (OSHPD gross revenue) at established rates and the amount collected for the service (net revenue). Hospitals establish a charge master with rates for each service and use it to itemize the charges billed to commercial insurers, government programs and the uninsured. Charges for a given mixture of services should be the same to all payers. Terms of negotiated and other contractual payment agreements with the third-party payer usually mean that the hospital will accept less than the standard charge, and this amount will vary by payer. This “discount” from the standard charge is considered the contractual allowance.
The contractual allowance for any given payer reflects the agreed-upon discount, which also assumes the hospital will collect any patient deductibles and copayments. The difference between hospital charges and net patient revenue incorporates contractual allowances for each payer, in addition to provisions for bad debt and charity.

Financial Health of California Hospitals 4-5 PricewaterhouseCoopers LLP
Figure 4.3A illustrates the average dollar amount for contractual allowances per adjusted patient day for each payer category. The increase in contractual allowance can reflect a more complex case mix, which will generate higher charges, as well as negotiated payment rates that do not keep pace with the increase in charges. The largest absolute dollar increases are for Medicare traditional, Medi-Cal traditional and third-party commercial managed care. All have increased at an average rate of 12 to 20 percent per year.
Figure 4.3A: Contractual Allowances per Adjusted Patient Day by Payer Category 2001–2005
Compound Annual Growth Rate
Medicare Traditional
Medicare Managed
Care Medi-Cal
Traditional
Medi-Cal Managed
Care County Indigent
Third-Party Traditional
Third-Party Managed
Care
CAGR 19.2% 5.4% 16.7% 20.2% 4.9% 2.7% 12.9%
Source: “Annual Hospital Financial Data,” California Office of Statewide Health Planning and Development (OSHPD), Pivot Profiles with data selected for general acute care hospitals (Retrieved from http://www.oshpd.ca.gov/HQAD/Hospital/financial/hospAF.htm, October 2006). See Appendix A for detailed methodology.
$-
$500
$1,000
$1,500
$2,000
Perc
ent
Medicare Traditional $960 $1,236 $1,553 $1,754 $1,937
Medicare Managed Care $312 $300 $332 $346 $385
Medi-Cal Traditional $508 $644 $759 $880 $942
Medi-Cal Managed Care $145 $190 $241 $263 $303
County Indigent $127 $141 $156 $160 $154
Third Party Traditional $235 $220 $229 $235 $262
Third Party Managed Care $833 $1,022 $1,144 $1,232 $1,354
2001 2002 2003 2004 2005$-
$500
$1,000
$1,500
$2,000
Medicare Traditional $960 $1,236 $1,553 $1,754 $1,937
Medicare Managed Care $312 $300 $332 $346 $385
Medi-Cal Traditional $508 $644 $759 $880 $942
Medi-Cal Managed Care $145 $190 $241 $263 $303
County Indigent $127 $141 $156 $160 $154
Third Party Traditional $235 $220 $229 $235 $262
Third Party Managed Care $833 $1,022 $1,144 $1,232 $1,354
2001 2002 2003 2004 2005Dol
lars
per
Adj
uste
d Pa
tient
Day
0$-
$500
$1,000
$1,500
$2,000
Perc
ent
Medicare Traditional $960 $1,236 $1,553 $1,754 $1,937
Medicare Managed Care $312 $300 $332 $346 $385
Medi-Cal Traditional $508 $644 $759 $880 $942
Medi-Cal Managed Care $145 $190 $241 $263 $303
County Indigent $127 $141 $156 $160 $154
Third Party Traditional $235 $220 $229 $235 $262
Third Party Managed Care $833 $1,022 $1,144 $1,232 $1,354
2001 2002 2003 2004 2005$-
$500
$1,000
$1,500
$2,000
Medicare Traditional $960 $1,236 $1,553 $1,754 $1,937
Medicare Managed Care $312 $300 $332 $346 $385
Medi-Cal Traditional $508 $644 $759 $880 $942
Medi-Cal Managed Care $145 $190 $241 $263 $303
County Indigent $127 $141 $156 $160 $154
Third Party Traditional $235 $220 $229 $235 $262
Third Party Managed Care $833 $1,022 $1,144 $1,232 $1,354
2001 2002 2003 2004 2005Dol
lars
per
Adj
uste
d Pa
tient
Day
0

Financial Health of California Hospitals 4-6 PricewaterhouseCoopers LLP
When the dollar value of the contractual allowance is presented as a percentage of gross charges, the average contractual allowance amounts to 78 percent in 2005 (Figure 4.3B). It is highest for Medicare managed care cases (83 percent) and Medi-Cal managed care (81 percent). While the hospital data indicate county indigent have the highest contractual allowances at 86 percent, this calculation does not reflect county general revenue and all other subsidies and funding to city and county hospitals that fund the majority of indigent care.
Actual reimbursement to providers is less than half of gross charges. This extreme variance between what a hospital charges and what it receives can be confusing for health care consumers, and raises questions concerning the relevance of reported pricing to the analysis of financial performance.
Figure 4.3B: Contractual Allowances as Percentage of Gross Charges by Payer Category 2001–2005
Perc
ent o
f Gro
ss C
harg
es
50%55%60%
65%70%75%80%85%
90%95%
100%
Medicare Traditional 70% 73% 76% 78% 78%
Medicare Managed Care 76% 77% 81% 83% 83%
Medi-Cal Traditional 67% 71% 72% 76% 76%
Medi-Cal Managed Care 77% 79% 81% 80% 81%
County Indigent 82% 83% 86% 86% 84%
Third Party Traditional 57% 56% 54% 52% 55%
Third Party Managed Care 67% 68% 67% 65% 65%
2001 2002 2003 2004 2005
Compound Annual Growth Rate
Medicare
Traditional
Medicare Managed
Care Medi-Cal
Traditional
Medi-Cal Managed
Care County Indigent
Third-Party Traditional
Third-Party Managed
Care
CAGR 2.9% 2.5% 3.1% 1.2% 0.5% -1.0% -0.9%
Source: “Annual Hospital Financial Data,” California Office of Statewide Health Planning and Development (OSHPD), Pivot Profiles with data selected for general acute care hospitals (Retrieved from http://www.oshpd.ca.gov/HQAD/Hospital/financial/hospAF.htm, October 2006). See Appendix A for detailed methodology.

Financial Health of California Hospitals 4-7 PricewaterhouseCoopers LLP
From an operational perspective, the relevant comparison is net patient revenue to expenses. Figure 4.4 presents an estimate of this relationship. Cost is calculated as the average expense per patient day across all payers and is compared to the case-mix-adjusted net patient revenue for each major payer. Break-even, where payer net revenue covers average cost, is shown at 100 percent. Most striking is the decline in the percentage of average cost covered by Medicare traditional — from 87 percent to 74 percent over the five-year period. In contrast, hospitals appear to be offsetting other payer declines with an increase in third-party commercial payments. These third-party payments have increased from 111 percent to 129 percent over the same period.
Figure 4.4: CMI Adjusted Net Revenue as Percentage of Average Cost per Adjusted Patient Day by Payer Category 2001–2005
0%
20%
40%
60%
80%
100%
120%
140%
160%
Perc
ent
Medicare Traditional 87% 85% 82% 75% 74%
Medicare Managed Care 93% 107% 101% 98% 98%
Medi-Cal Traditional 67% 66% 61% 57% 56%
Medi-Cal Managed Care 87% 68% 70% 69% 65%
County and Other Indigent 44% 23% 50% 45% 42%
Third Party and Other 111% 114% 124% 128% 129%
2001 2002 2003 2004 2005
Perc
ent o
f Ave
rage
Cos
t pe
r Adj
uste
d Pa
tient
Day
Compound Annual Growth Rate
Medicare Traditional
Medicare Managed Care
Medi-Cal Traditional
Medi-Cal Managed Care
County and Other Indigent
Third-Party and Other
CAGR -3.9% 1.3% -4.3% -7.0% -1.2% 3.8%
Source: “Annual Hospital Financial Data,” California Office of Statewide Health Planning and Development (OSHPD), Pivot Profiles with data selected for general acute care hospitals (Retrieved from http://www.oshpd.ca.gov/HQAD/Hospital/financial/hospAF.htm, October 2006). See Appendix A for detailed methodology.

Financial Health of California Hospitals 4-8 PricewaterhouseCoopers LLP
Hospital Utilization Trends California’s population grew at an average annual rate of 1.14 percent from 2001 through 2005, increasing at a higher rate than patient days or discharges (Figure 4.5). Total patient days and discharges increased until 2003; there was a slight decline in 2004, but the increase in 2005 did not rebound to the 2003 level. Outpatient visits followed a similar trend. They increased from 2001 to 2003, but were lower in 2004 and 2005.
Figure 4.5: California Population, Patient Days and Discharges 2001–2005
2001 2002 2003 2004 2005
Percent Change
2001–2005
Compound Annual
Growth Rate
California Population 34,526,660 34,988,088 35,456,602 35,842,038 36,132,147 4.65 1.14%
Patient Days 17,381,380 17,502,557 18,130,012 17,846,797 17,824,664 2.55 0.63%
Adjusted Patient Days 22,264,602 22,474,096 23,296,059 23,084,402 23,217,476 4.28 1.05%
Discharges 3,241,591 3,243,908 3,363,874 3,324,517 3,357,190 3.57 0.88%
Outpatient Visits 43,490,117 44,200,218 44,333,563 41,817,847 42,140,274 -3.10 -.79%
Patient Days/1,000 503.4 506.9 525.1 516.9 516.7 2.64
Adjusted Patient Days/1,000 644.9 650.9 674.7 668.6 672.9 4.34
Discharges/1,000 93.9 94.0 97.4 96.3 97.2 3.51
Outpatient Visits/1,000 1,259.6 1,280.0 1,284.0 1,211.25 1,220.5 -3.10
Sources: “Annual Hospital Financial Data,” California Office of Statewide Health Planning and Development (OSHPD), Pivot Profiles with data selected for general acute care hospitals (Retrieved from http://www.oshpd.ca.gov/HQAD/Hospital/financial/hospAF.htm, October 2006). See Appendix A for detailed methodology. California population estimates obtained from U.S. Census Bureau at hppt://www.census.gov/popest/counties/CO-EST2005.01.html. Note: Excludes Kaiser data in the Adjusted Patient Days field because the values are set to zero. Formula: CAGR = (FV/PV) ^ (1/n) – FV is future (most recent) value, PV is present (earliest) value, and n is time period in number of years
Hospitals included in this analysis are classified as general acute care. Specialty hospitals with an emphasis on psychiatric, chemical dependency, physical rehabilitation and long-term care services are excluded. However, such services may be provided in special units of general acute care hospitals and are included in the analysis. Acute care days and discharges accounted for more than 75 percent of total hospital days and more than 90 percent of discharges in those hospitals included in the review; these categories increased over the period (Figure 4.6). The percent change was 2.8 percent for acute care days and 0.87 percent for discharges. Psychiatric, rehabilitation and long-term care days as provided in acute care hospitals declined, while chemical dependency and residency services days increased slightly.

Financial Health of California Hospitals 4-9 PricewaterhouseCoopers LLP
Figure 4.6: California General Acute Care Hospital Inpatient Days and Discharges by Category of Care 2001–2005
Days
2001 2002 2003 2004 2005 Change
2001–2005 CAGR
Acute Care 76.0% 76.7% 77.1% 77.9% 78.7% 2.8% 1.53%
Psychiatric 6.4% 6.4% 6.4% 6.1% 5.8% -0.69% -2.14%
Chemical Dependency 0.3% 0.3% 0.3% 0.3% 0.3% 0.01% 1.37%
Rehabilitation 2.2% 2.2% 2.2% 2.2% 2.2% -0.02% 0.45%
Long-Term Care 14.8% 14.0% 13.5% 13.1% 12.6% -2.17% -3.30%
Residency Services 0.3% 0.4% 0.4% 0.4% 0.4% 0.11% 8.86%
Total 17,381,380 17,502,527 18,130,012 17,846,797 17,824,664 2.55 0.63%
Discharges
2001 2002 2003 2004 2005 Change
2001–2005 CAGR
Acute Care 92.5% 92.9% 92.7% 93.0% 93.3% 0.87% 1.12%
Psychiatric 3.7% 3.6% 3.9% 3.8% 3.6% -0.05% 0.54%
Chemical Dependency 0.2% 0.2% 0.2% 0.2% 0.2% 0.06% 8.63%
Rehabilitation 0.8% 0.8% 0.9% 0.8% 0.9% 0.06% 2.60%
Long-Term Care 2.9% 2.6% 2.3% 2.1% 1.9% -0.93% -8.47%
Residency Services 0.0% 0.0% 0.0% 0.0% 0.0% -0.01% -25.81%
Total 3,241,291 3,243,908 3,363,874 3,324,517 3,357,190 3.57% 0.88%
Source: “Annual Hospital Financial Data,” California Office of Statewide Health Planning and Development (OSHPD), Pivot Profiles with data selected for general acute care hospitals (Retrieved from http://www.oshpd.ca.gov/HQAD/Hospital/financial/hospAF.htm, October 2006). See Appendix A for detailed methodology. Note: Includes Kaiser data.
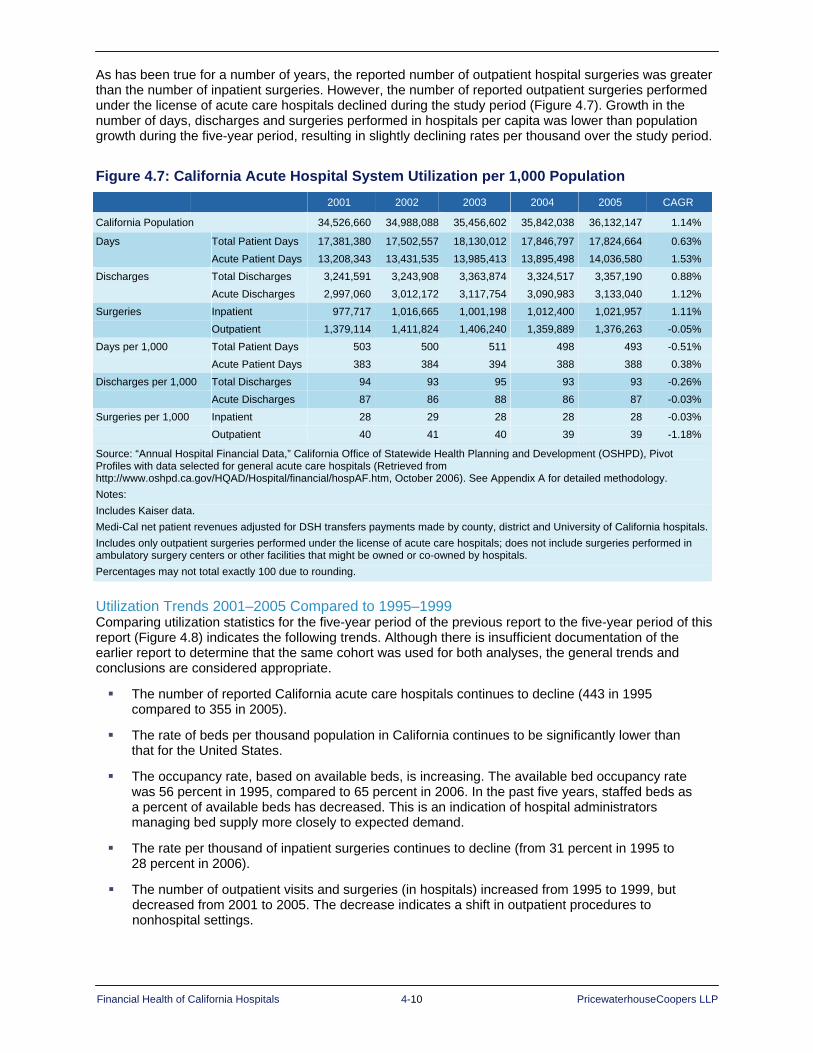
Financial Health of California Hospitals 4-10 PricewaterhouseCoopers LLP
As has been true for a number of years, the reported number of outpatient hospital surgeries was greater than the number of inpatient surgeries. However, the number of reported outpatient surgeries performed under the license of acute care hospitals declined during the study period (Figure 4.7). Growth in the number of days, discharges and surgeries performed in hospitals per capita was lower than population growth during the five-year period, resulting in slightly declining rates per thousand over the study period.
Figure 4.7: California Acute Hospital System Utilization per 1,000 Population 2001 2002 2003 2004 2005 CAGR
California Population 34,526,660 34,988,088 35,456,602 35,842,038 36,132,147 1.14%
Days Total Patient Days 17,381,380 17,502,557 18,130,012 17,846,797 17,824,664 0.63% Acute Patient Days 13,208,343 13,431,535 13,985,413 13,895,498 14,036,580 1.53% Discharges Total Discharges 3,241,591 3,243,908 3,363,874 3,324,517 3,357,190 0.88% Acute Discharges 2,997,060 3,012,172 3,117,754 3,090,983 3,133,040 1.12% Surgeries Inpatient 977,717 1,016,665 1,001,198 1,012,400 1,021,957 1.11% Outpatient 1,379,114 1,411,824 1,406,240 1,359,889 1,376,263 -0.05% Days per 1,000 Total Patient Days 503 500 511 498 493 -0.51% Acute Patient Days 383 384 394 388 388 0.38% Discharges per 1,000 Total Discharges 94 93 95 93 93 -0.26% Acute Discharges 87 86 88 86 87 -0.03% Surgeries per 1,000 Inpatient 28 29 28 28 28 -0.03% Outpatient 40 41 40 39 39 -1.18%
Source: “Annual Hospital Financial Data,” California Office of Statewide Health Planning and Development (OSHPD), Pivot Profiles with data selected for general acute care hospitals (Retrieved from http://www.oshpd.ca.gov/HQAD/Hospital/financial/hospAF.htm, October 2006). See Appendix A for detailed methodology. Notes: Includes Kaiser data. Medi-Cal net patient revenues adjusted for DSH transfers payments made by county, district and University of California hospitals.Includes only outpatient surgeries performed under the license of acute care hospitals; does not include surgeries performed in ambulatory surgery centers or other facilities that might be owned or co-owned by hospitals. Percentages may not total exactly 100 due to rounding.
Utilization Trends 2001–2005 Compared to 1995–1999 Comparing utilization statistics for the five-year period of the previous report to the five-year period of this report (Figure 4.8) indicates the following trends. Although there is insufficient documentation of the earlier report to determine that the same cohort was used for both analyses, the general trends and conclusions are considered appropriate.
The number of reported California acute care hospitals continues to decline (443 in 1995 compared to 355 in 2005).
The rate of beds per thousand population in California continues to be significantly lower than that for the United States.
The occupancy rate, based on available beds, is increasing. The available bed occupancy rate was 56 percent in 1995, compared to 65 percent in 2006. In the past five years, staffed beds as a percent of available beds has decreased. This is an indication of hospital administrators managing bed supply more closely to expected demand.
The rate per thousand of inpatient surgeries continues to decline (from 31 percent in 1995 to 28 percent in 2006).
The number of outpatient visits and surgeries (in hospitals) increased from 1995 to 1999, but decreased from 2001 to 2005. The decrease indicates a shift in outpatient procedures to nonhospital settings.

Financial Health of California Hospitals 4-11 PricewaterhouseCoopers LLP
Utilization statistics for the 10 years shown in Figure 4.8 demonstrate that the California hospital system shows some ability to adapt to changing demographics and medical technological change. Capacity has been removed from the system at the same time the state has experienced population growth.
Figure 4.8: Hospital Utilization 1995–1999 and 2001–2005
Key Utilization Findings 1995–1999
1995 1996 1997 1998 1999 Percent Change
OSHPD Acute Care Hospitals 443 435 436 420 409 -7.7%
California Staffed Beds per 1,000 Population 2.4 2.4 2.3 2.3 2.2 -8.3%
U.S. Staffed Beds per 1,000 Population 3.3 3.3 3.2 3.1 3.0 -9.1%
California Occupancy Rate (Available Beds) 56% 55% 55% 57% 59% 5.4%
California Outpatient Visits per 1,000 Population (Hospital Facilities)
1,205 1,211 1,247 1,214 1,214 0.7%
California Outpatient Surgeries per 1,000 Population (Hospital Facilities)
35 36 38 39 42 19.0%
California Inpatient Surgeries per 1,000 Population 31 31 32 31 30 -3.2%
Key Utilization Findings 2001–2005
2001 2002 2003 2004 2005 Percent Change
OSHPD Acute Care Hospitals 383 381 378 363 355 -7.3%
California Staffed Beds per 1,000 Population 2.2 2.1 2.2 2.0 1.9 -13.6%
U.S. Staffed Beds per 1,000 Population 2.9 2.9 2.8 2.8 2.7 -6.9%
California Occupancy Rate (Available Beds) 63% 63% 65% 65% 65% 3.2%
California Outpatient Visits per 1,000 Population 1,260 1,280 1,284 1,211 1,221 -3.1%
California Outpatient Surgeries per 1,000 Population 40 41 40 39 38 -5.0%
California Inpatient Surgeries per 1,000 Population 28 29 28 28 28 0.0%
Sources: “Annual Hospital Financial Data,” California Office of Statewide Health Planning and Development (OSHPD), Pivot Profiles with data selected for general acute care hospitals (Retrieved from http://www.oshpd.ca.gov/HQAD/Hospital/financial/hospAF.htm, October 2006). See Appendix A for detailed methodology. American Hospital Association, AHA Hospital Statistics (2006 and 2007), Table 3 (U.S.) and Table 6 (California) Shattuck Hammond Partners, The Financial Health of California Hospitals (July 2001)
Recent studies show that emergency room visit rates have decreased in California, the opposite of the national trend. The state’s 2005 rate of 262 per thousand population declined from 290 per thousand in 1999. The California rate is lower than the national rate, which rose to 387 in 2005 from 365 in 1999.131

Financial Health of California Hospitals 4-12 PricewaterhouseCoopers LLP
California Acute Hospital ALOS and Severity of Care Average length of stay (ALOS), which measures the average number of patient days per discharge, is an important indicator of hospital utilization. ALOS can also be an indicator of severity of illness and efficiency of care. California continues to have a shorter ALOS than the national average (Figure 4.9).
Maternity care consistently ranks in the top 20 conditions for hospital admission. Legislation passed in 1998 requires California health plans to cover two acute hospital days for a normal vaginal delivery and four days for a Cesarean section. From 2001 through 2005, perinatal days and discharges increased at a faster rate than general acute care (Figure 4.9). Total perinatal discharges showed a 1.77 percent annual growth rate during this period, which was also greater than the rate of population growth.
Figure 4.9: Average Length of Stay (ALOS) Perinatal versus Nonperinatal 2001 2002 2003 2004 2005 CAGR
Days Total Patient Days 17,381,380 17,502,557 18,130,012 17,846,797 17,824,664 0.63%
Acute Patient Days 13,208,343 13,431,535 13,985,413 13,895,498 14,036,580 1.53%
Perinatal Days 819,400 828,028 860,284 900,653 900,680 2.39%
Discharges Total Discharges 3,241,591 3,243,908 3,363,874 3,324,517 3,357,190 0.88%
Acute Discharges 2,997,060 3,012,172 3,117,754 3,090,943 3,133,040 1.12%
Perinatal Discharges 393,207 391,509 405,272 414,109 421,840 1.77%
ALOS All Hospital Care 5.4 5.4 5.4 5.4 5.3 -0.25%
Acute Care 4.4 4.5 4.5 4.5 4.5 0.41%
Perinatal 2.1 2.1 2.1 2.2 2.1 0.61%
Source: “Annual Hospital Financial Data,” California Office of Statewide Health Planning and Development (OSHPD), Pivot Profiles with data selected for general acute care hospitals (Retrieved from http://www.oshpd.ca.gov/HQAD/Hospital/financial/hospAF.htm, October 2006). See Appendix A for detailed methodology. Notes: Includes Kaiser data. Perinatal discharges are reported separately in the OSHPD data. Acute and perinatal discharges will not add to total discharges. Normal newborns discharged with their mother are reported as a single discharge. Formula: ALOS = patient days/total discharges
ALOS for acute hospital care across all payer categories declined slightly over the period (-0.25 percent) from 2001 through 2005. Differences in ALOS were more varied by payer category and generally reflected a difference in the covered populations (Figure 4.10):
Medicare and Medi-Cal traditional showed the highest ALOS. The Medicare traditional population is predominantly over age 65, and the Medi-Cal traditional population in California is disproportionately the low-income aged and disabled. The high ALOS likely reflects the health status of elderly patients, who are more likely to have complex diagnoses that may include complicating secondary chronic conditions.
Medicare managed care ALOS was substantially lower than Medicare traditional and may reflect enrollment of a younger and healthier population, better care coordination or financial incentives.
Medi-Cal (Medicaid) managed care ALOS was substantially lower than Medicaid traditional. This likely reflects the mandatory enrollment of the Temporary Assistance for Needy Family (TANF) population, primarily women and children in Medi-Cal HMOs in large urban areas throughout the state.
Third-party traditional and managed care, which included the commercially insured and predominantly under-65 populations, exhibited the shortest ALOS; and ALOS for this category declined over the analysis period.

Financial Health of California Hospitals 4-13 PricewaterhouseCoopers LLP
Figure 4.10: California Acute Hospital ALOS by Payer Category
Days
2001 2002 2003 2004 2005 CAGR
Medicare Traditional 5,143,483 5,375,180 5,643,775 5,631,299 5,526,700 1.81%
Medicare Managed Care 1,753,012 1,633,503 1,568,881 1,532,575 1,567,926 -2.75%
Medi-Cal Traditional 3,769,898 3,881,712 4,140,539 4,147,102 4,156,815 2.47%
Medi-Cal Managed Care 648,282 714,760 784,038 775,028 813,702 5.85%
Other Third-Party Traditional 1,104,736 868,496 836,052 783,516 758,676 -8.97%
Other Third-Party Managed Care 3,712,816 3,866,246 3,976,996 3,798,480 3,793,164 0.54%
County Indigent Programs 462,476 472,433 492,472 475,598 430,684 -1.76%
Other Indigent 94,790 95,995 134,774 132,448 147,618 11.71%
Other Payers 691,887 594,232 552,485 570,751 629,379 -2.34%
Total Patient 17,381,380 17,502,557 18,130,012 17,846,797 17,824,664 0.63%
Discharges 2001 2002 2003 2004 2005 CAGR
Medicare Traditional 816,357 844,385 894,139 891,611 899,317 2.45%
Medicare Managed Care 368,473 348,816 327,440 328,284 334,555 -2.39%
Medi-Cal Traditional 521,211 545,563 581,410 574,625 574,911 2.48%
Medi-Cal Managed Care 152,085 171,670 192,071 185,692 193,466 6.20%
Other Third-Party Traditional 243,865 198,458 193,672 179,327 180,982 -7.18%
Other Third-Party Managed Care 911,117 932,406 943,313 942,197 939,375 0.77%
County Indigent Programs 93,185 92,992 97,317 93,403 89,369 -1.04%
Other Indigent 16,728 19,000 28,076 29,625 32,061 17.66%
Other Payers 118,570 90,618 106,436 99,753 113,154 -1.16%
Total Patient 3,241,591 3,243,908 3,363,874 3,324,517 3,357,190 0.88%
ALOS 2001 2002 2003 2004 2005 CAGR
Medicare Traditional 6.3 6.4 6.3 6.3 6.1 -0.62%
Medicare Managed Care 4.8 4.7 4.8 4.7 4.7 -0.37%
Medi-Cal Traditional 7.2 7.1 7.1 7.2 7.2 -0.01%
Medi-Cal Managed Care 4.3 4.2 4.1 4.2 4.2 -0.33%
Other Third-Party Traditional 4.5 4.4 4.3 4.4 4.2 -1.92%
Other Third-Party Managed Care 4.1 4.1 4.2 4.0 4.0 -0.23%
County Indigent Programs 5.0 5.1 5.1 5.1 4.8 -0.73%
Other Indigent 5.7 5.1 4.8 4.5 4.6 -5.06%
Other Payers 5.8 6.6 5.2 5.7 5.6 -1.19%
Total Patient 5.4 5.4 5.4 5.4 5.3 -0.25%
Source: “Annual Hospital Financial Data,” California Office of Statewide Health Planning and Development (OSHPD), Pivot Profiles with data selected for general acute care hospitals (Retrieved from http://www.oshpd.ca.gov/HQAD/Hospital/financial/hospAF.htm, October 2006). See Appendix A for detailed methodology. Note: Includes Kaiser data. Formula: ALOS = patient days/total discharges
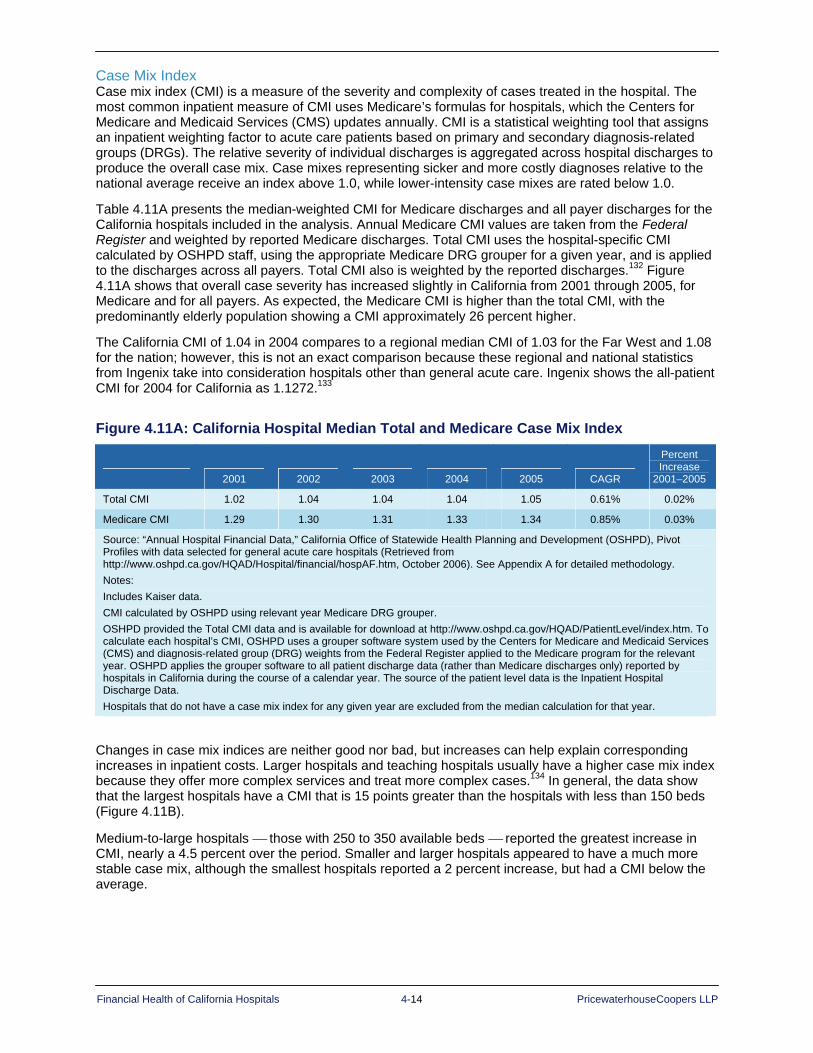
Financial Health of California Hospitals 4-14 PricewaterhouseCoopers LLP
Case Mix Index Case mix index (CMI) is a measure of the severity and complexity of cases treated in the hospital. The most common inpatient measure of CMI uses Medicare’s formulas for hospitals, which the Centers for Medicare and Medicaid Services (CMS) updates annually. CMI is a statistical weighting tool that assigns an inpatient weighting factor to acute care patients based on primary and secondary diagnosis-related groups (DRGs). The relative severity of individual discharges is aggregated across hospital discharges to produce the overall case mix. Case mixes representing sicker and more costly diagnoses relative to the national average receive an index above 1.0, while lower-intensity case mixes are rated below 1.0.
Table 4.11A presents the median-weighted CMI for Medicare discharges and all payer discharges for the California hospitals included in the analysis. Annual Medicare CMI values are taken from the Federal Register and weighted by reported Medicare discharges. Total CMI uses the hospital-specific CMI calculated by OSHPD staff, using the appropriate Medicare DRG grouper for a given year, and is applied to the discharges across all payers. Total CMI also is weighted by the reported discharges.132 Figure 4.11A shows that overall case severity has increased slightly in California from 2001 through 2005, for Medicare and for all payers. As expected, the Medicare CMI is higher than the total CMI, with the predominantly elderly population showing a CMI approximately 26 percent higher.
The California CMI of 1.04 in 2004 compares to a regional median CMI of 1.03 for the Far West and 1.08 for the nation; however, this is not an exact comparison because these regional and national statistics from Ingenix take into consideration hospitals other than general acute care. Ingenix shows the all-patient CMI for 2004 for California as 1.1272.133
Figure 4.11A: California Hospital Median Total and Medicare Case Mix Index
2001 2002 2003 2004 2005 CAGR
Percent Increase
2001–2005
Total CMI 1.02 1.04 1.04 1.04 1.05 0.61% 0.02%
Medicare CMI 1.29 1.30 1.31 1.33 1.34 0.85% 0.03%
Source: “Annual Hospital Financial Data,” California Office of Statewide Health Planning and Development (OSHPD), Pivot Profiles with data selected for general acute care hospitals (Retrieved from http://www.oshpd.ca.gov/HQAD/Hospital/financial/hospAF.htm, October 2006). See Appendix A for detailed methodology. Notes: Includes Kaiser data. CMI calculated by OSHPD using relevant year Medicare DRG grouper. OSHPD provided the Total CMI data and is available for download at http://www.oshpd.ca.gov/HQAD/PatientLevel/index.htm. To calculate each hospital’s CMI, OSHPD uses a grouper software system used by the Centers for Medicare and Medicaid Services (CMS) and diagnosis-related group (DRG) weights from the Federal Register applied to the Medicare program for the relevant year. OSHPD applies the grouper software to all patient discharge data (rather than Medicare discharges only) reported by hospitals in California during the course of a calendar year. The source of the patient level data is the Inpatient Hospital Discharge Data. Hospitals that do not have a case mix index for any given year are excluded from the median calculation for that year.
Changes in case mix indices are neither good nor bad, but increases can help explain corresponding increases in inpatient costs. Larger hospitals and teaching hospitals usually have a higher case mix index because they offer more complex services and treat more complex cases.134 In general, the data show that the largest hospitals have a CMI that is 15 points greater than the hospitals with less than 150 beds (Figure 4.11B).
Medium-to-large hospitals ⎯ those with 250 to 350 available beds ⎯ reported the greatest increase in CMI, nearly a 4.5 percent over the period. Smaller and larger hospitals appeared to have a much more stable case mix, although the smallest hospitals reported a 2 percent increase, but had a CMI below the average.

Financial Health of California Hospitals 4-15 PricewaterhouseCoopers LLP
Figure 4.11B: California Hospital Median Total Case Mix Index by Hospital Size
2001 2002 2003 2004 2005 CAGR Percent Change
2001–2005 <150 available beds 0.96 0.96 0.97 0.98 0.98 0.52% 2.10% 151-250 available beds 1.00 1.04 1.02 1.03 1.01 0.37% 1.00% 251-350 available beds 1.12 1.17 1.17 1.16 1.17 0.99% 4.50% 350+ available beds 1.13 1.14 1.16 1.14 1.13 0.00% 0.00% Source: “Annual Hospital Financial Data,” California Office of Statewide Health Planning and Development (OSHPD), Pivot Profiles with data selected for general acute-care hospitals (Retrieved from http://www.oshpd.ca.gov/HQAD/Hospital/financial/hospAF.htm, October 2006). See Appendix A for detailed methodology. Notes: Includes Kaiser data CMI calculated by OSHPD using relevant year Medicare DRG grouper OSHPD provided the Total CMI data and is available for download at http://www.oshpd.ca.gov/HQAD/PatientLevel/index.htm. To calculate each hospital'\’s CMI, OSHPD uses a grouper software system used by the Centers for Medicare and Medicaid Services (CMS) and diagnosis-related group (DRG) weights from the Federal Register applied to the Medicare program for the relevant year. OSHPD applies the grouper software to all patient discharge data (rather than Medicare discharges only) reported by hospitals in California during the course of a calendar year. The source of the patient level data is the Inpatient Hospital Discharge Data. Hospitals that do not have a case mix index for any given year are excluded from the median calculation for that year.
For-profit and nonprofit hospitals had the highest CMI for the five-year period (Figure 4.11C). For-profit hospitals saw the largest increase in CMI, a 6 percent increase over the period. City/county and district hospitals had a CMI lower than the state average.
Figure 4.11C: California Hospital Median Total Case Mix Index by Type of Control
2001 2002 2003 2004 2005 CAGR Percent Change2001–2005
City/County 0.99 0.99 0.98 0.97 0.93 -1.55% -6.20% District 0.91 0.91 0.94 0.93 0.94 0.68% 3.30% For-Profit 1.00 1.03 1.01 1.04 1.06 1.47% 6.00% Nonprofit 1.05 1.06 1.08 1.08 1.08 0.71% 2.90% Source: “Annual Hospital Financial Data,” California Office of Statewide Health Planning and Development (OSHPD), Pivot Profiles with data selected for general acute-care hospitals (Retrieved from http://www.oshpd.ca.gov/HQAD/Hospital/financial/hospAF.htm, October 2006). See Appendix A for detailed methodology. Notes: Includes Kaiser data. CMI calculated by OSHPD using relevant year Medicare DRG grouper. OSHPD provided the Total CMI data and is available for download at http://www.oshpd.ca.gov/HQAD/PatientLevel/index.htm. To calculate each hospital's CMI, OSHPD uses a grouper software system used by the Centers for Medicare and Medicaid Services (CMS) and diagnosis-related group (DRG) weights from the Federal Register applied to the Medicare program for the relevant year. OSHPD applies the grouper software to all patient discharge data (rather than Medicare discharges only) reported by hospitals in California during the course of a calendar year. The source of the patient level data is the Inpatient Hospital Discharge Data. Hospitals that do not have a case mix index for any given year are excluded from the median calculation for that year.

Financial Health of California Hospitals 4-16 PricewaterhouseCoopers LLP
California Median Acute Care Inpatient Hospital ALOS Figure 4.12 indicates the statewide median hospital ALOS for acute care was essentially flat over the period.
Factors affecting ALOS include:
Variations in admission type by hospital: A high proportion of normal newborn maternity cases will lower ALOS, while a substantial rehabilitation or skilled nursing unit will increase ALOS.
Availability of specialty and tertiary care services: A higher proportion of complex cases and procedures will increase ALOS.
Shift of procedures to outpatient care: Improvements in technology allow treatments to move to the outpatient setting. The average inpatient case and procedure can become more complex, leading to an increase in ALOS.
Utilization management programs: Effective case management, utilization management and discharge planning programs usually decrease ALOS.
Differences in ALOS emerge when presented by hospital category. Smaller hospitals (less than 150 beds), district hospitals and rural hospitals all demonstrate a lower ALOS, generally about 0.5 days shorter than the statewide average. Although not completely overlapping, the hospitals in these categories are similar in that they provide general medical and surgical services and typically do not offer the full range of specialty-care or tertiary-care services. A less complex case mix is associated with a lower ALOS. Geographic differences appear to reflect the mixture of hospitals by bed size and other features, such as the presence of teaching hospitals, which are associated with differences in ALOS. This is demonstrated in part by the regional differences in ALOS before and after case-mix adjustment. For most regions, the CMI-adjusted ALOS is 0.2 to 0.6 days shorter than the unadjusted ALOS.

Financial Health of California Hospitals 4-17 PricewaterhouseCoopers LLP
Figure 4.12: Median Acute ALOS Based on Acute Care Days and Acute Care Discharges by Typology
2001 2002 2003 2004 2005 CAGR
Median Acute ALOS Total 4.1 4.1 4.1 4.2 4.1 0.27%
Hospital Size <150 available beds 3.6 3.6 3.6 3.6 3.6 0.04%
151-250 available beds 4.2 4.2 4.2 4.2 4.1 -0.27%
251-350 available beds 4.4 4.4 4.4 4.4 4.4 -0.03%
350+ available beds 4.7 4.7 4.7 4.7 4.7 -0.13%
Type of Control City/County 4.7 4.5 4.6 4.5 4.2 -2.78%
District 3.1 3.3 3.6 3.6 3.5 3.63%
For-Profit 4.2 4.2 4.2 4.2 4.1 -0.79%
Nonprofit 4.1 4.2 4.2 4.2 4.2 0.67%
Rural versus Urban Rural 3.1 3.2 3.4 3.3 3.3 1.59%
Urban 4.2 4.2 4.3 4.3 4.2 0.19%
DSH versus Non-DSH DSH 4.2 4.3 4.4 4.4 4.3 0.22%
Non DSH 4.0 4.0 4.1 4.1 4.1 0.23%
Geography (Region) Central Coast Counties 3.7 3.8 3.6 4.0 4.2 3.06%
Greater Bay Area Counties 4.3 4.3 4.4 4.3 4.3 -0.47%
Los Angeles County 4.5 4.7 4.7 4.7 4.6 0.43%
Northern and Sierra Counties 3.4 3.5 3.5 3.5 3.5 0.51%
Orange County 3.9 4.0 3.9 3.8 3.7 -0.79%
Other Southern Counties 3.9 3.8 3.9 4.1 3.9 0.52%
Sacramento Area Counties 3.8 3.9 3.9 3.8 3.9 0.33%
San Diego County 4.2 4.2 4.2 4.5 4.5 1.29%
San Joaquin Valley Counties 3.8 4.0 4.1 4.0 4.0 1.14%
Geography (Region) Adjusted for Case Mix Central Coast Counties 3.5 3.5 3.6 3.7 3.8 2.11%
Greater Bay Area Counties 3.9 3.8 3.8 3.8 3.8 -0.54%
Los Angeles County 4.3 4.5 4.5 4.4 4.3 -0.04%
Northern and Sierra Counties 3.4 3.3 3.4 3.4 3.4 -0.10%
Orange County 3.8 3.8 3.8 3.7 3.7 -0.94%
Other Southern Counties 3.8 3.9 3.9 3.9 3.9 0.98%
Sacramento Area Counties 3.6 3.6 3.6 3.6 3.5 -0.08%
San Diego County 3.6 3.7 3.6 3.6 3.6 -0.22%
San Joaquin Valley Counties 3.8 4.0 4.0 4.1 3.8 0.30%
Source: “Annual Hospital Financial Data,” California Office of Statewide Health Planning and Development (OSHPD), Pivot Profiles with data selected for general acute care hospitals (Retrieved from http://www.oshpd.ca.gov/HQAD/Hospital/financial/hospAF.htm, October 2006). See Appendix A for detailed methodology. Note: Includes Kaiser data. Formula: ALOS = patient days/total discharges
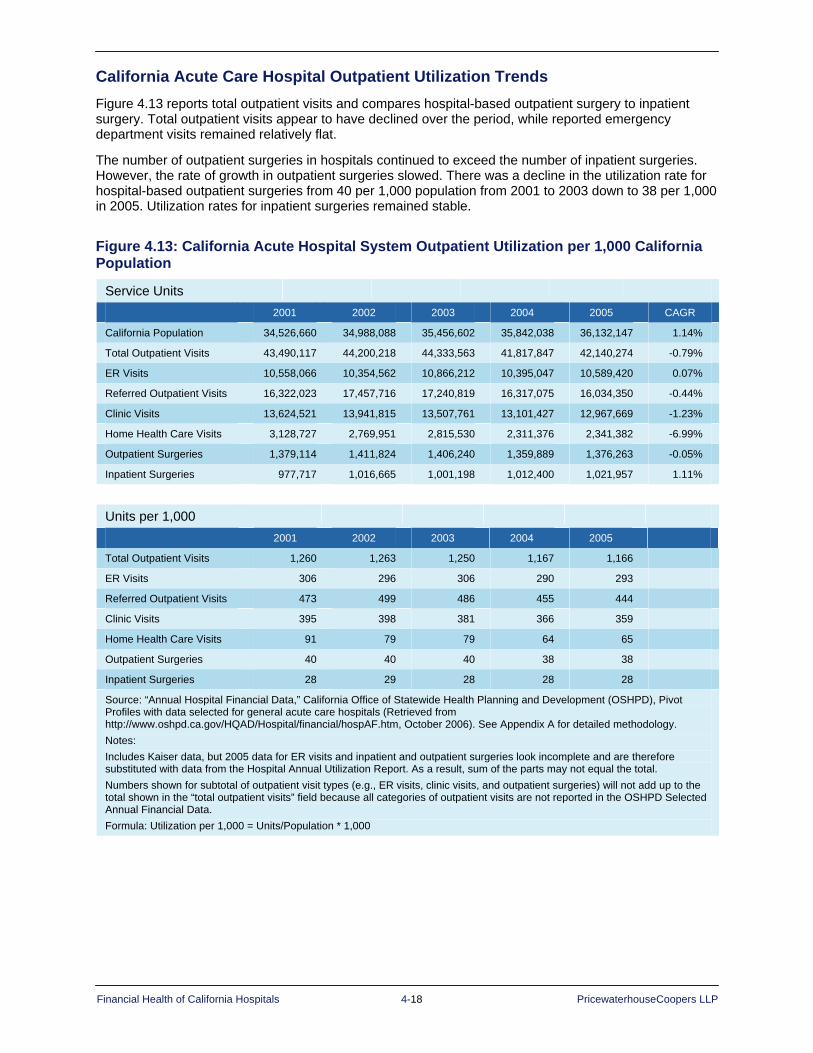
Financial Health of California Hospitals 4-18 PricewaterhouseCoopers LLP
California Acute Care Hospital Outpatient Utilization Trends
Figure 4.13 reports total outpatient visits and compares hospital-based outpatient surgery to inpatient surgery. Total outpatient visits appear to have declined over the period, while reported emergency department visits remained relatively flat.
The number of outpatient surgeries in hospitals continued to exceed the number of inpatient surgeries. However, the rate of growth in outpatient surgeries slowed. There was a decline in the utilization rate for hospital-based outpatient surgeries from 40 per 1,000 population from 2001 to 2003 down to 38 per 1,000 in 2005. Utilization rates for inpatient surgeries remained stable.
Figure 4.13: California Acute Hospital System Outpatient Utilization per 1,000 California Population
Service Units
2001 2002 2003 2004 2005 CAGR
California Population 34,526,660 34,988,088 35,456,602 35,842,038 36,132,147 1.14%
Total Outpatient Visits 43,490,117 44,200,218 44,333,563 41,817,847 42,140,274 -0.79%
ER Visits 10,558,066 10,354,562 10,866,212 10,395,047 10,589,420 0.07%
Referred Outpatient Visits 16,322,023 17,457,716 17,240,819 16,317,075 16,034,350 -0.44%
Clinic Visits 13,624,521 13,941,815 13,507,761 13,101,427 12,967,669 -1.23%
Home Health Care Visits 3,128,727 2,769,951 2,815,530 2,311,376 2,341,382 -6.99%
Outpatient Surgeries 1,379,114 1,411,824 1,406,240 1,359,889 1,376,263 -0.05%
Inpatient Surgeries 977,717 1,016,665 1,001,198 1,012,400 1,021,957 1.11%
Units per 1,000
2001 2002 2003 2004 2005
Total Outpatient Visits 1,260 1,263 1,250 1,167 1,166
ER Visits 306 296 306 290 293
Referred Outpatient Visits 473 499 486 455 444
Clinic Visits 395 398 381 366 359
Home Health Care Visits 91 79 79 64 65
Outpatient Surgeries 40 40 40 38 38
Inpatient Surgeries 28 29 28 28 28
Source: “Annual Hospital Financial Data,” California Office of Statewide Health Planning and Development (OSHPD), Pivot Profiles with data selected for general acute care hospitals (Retrieved from http://www.oshpd.ca.gov/HQAD/Hospital/financial/hospAF.htm, October 2006). See Appendix A for detailed methodology. Notes: Includes Kaiser data, but 2005 data for ER visits and inpatient and outpatient surgeries look incomplete and are therefore substituted with data from the Hospital Annual Utilization Report. As a result, sum of the parts may not equal the total. Numbers shown for subtotal of outpatient visit types (e.g., ER visits, clinic visits, and outpatient surgeries) will not add up to the total shown in the “total outpatient visits” field because all categories of outpatient visits are not reported in the OSHPD Selected Annual Financial Data. Formula: Utilization per 1,000 = Units/Population * 1,000
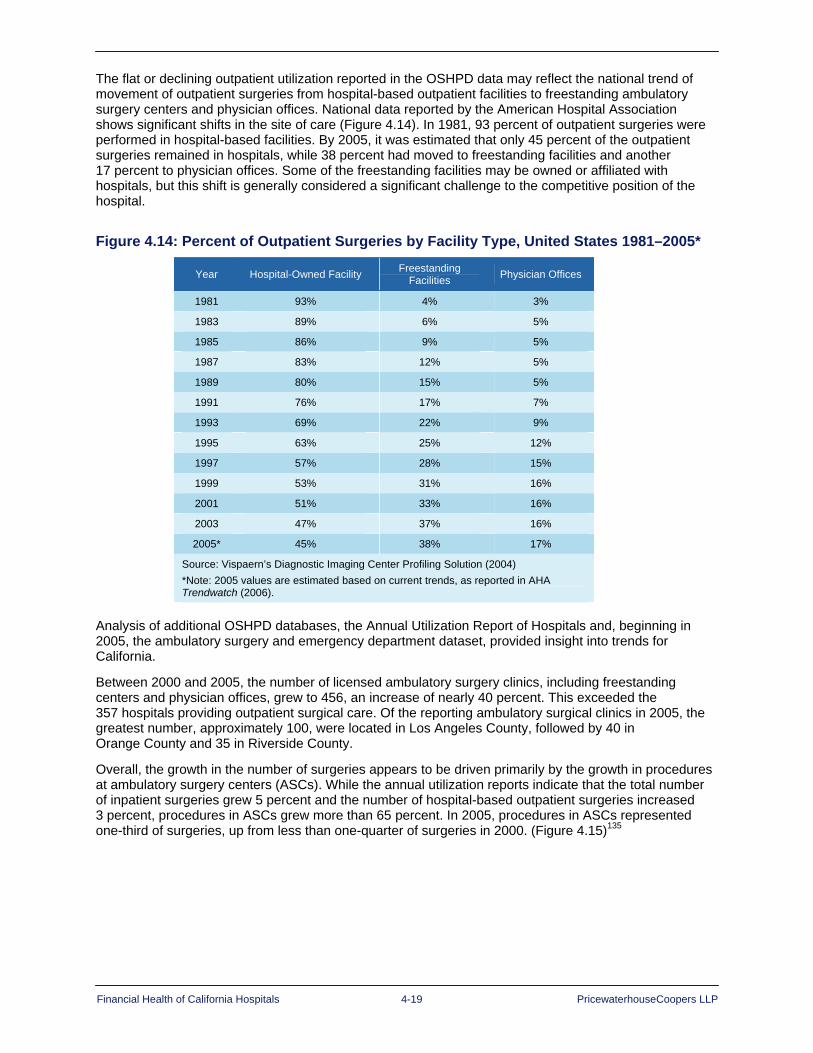
Financial Health of California Hospitals 4-19 PricewaterhouseCoopers LLP
The flat or declining outpatient utilization reported in the OSHPD data may reflect the national trend of movement of outpatient surgeries from hospital-based outpatient facilities to freestanding ambulatory surgery centers and physician offices. National data reported by the American Hospital Association shows significant shifts in the site of care (Figure 4.14). In 1981, 93 percent of outpatient surgeries were performed in hospital-based facilities. By 2005, it was estimated that only 45 percent of the outpatient surgeries remained in hospitals, while 38 percent had moved to freestanding facilities and another 17 percent to physician offices. Some of the freestanding facilities may be owned or affiliated with hospitals, but this shift is generally considered a significant challenge to the competitive position of the hospital.
Figure 4.14: Percent of Outpatient Surgeries by Facility Type, United States 1981–2005*
Year Hospital-Owned Facility Freestanding Facilities Physician Offices
1981 93% 4% 3%
1983 89% 6% 5%
1985 86% 9% 5%
1987 83% 12% 5%
1989 80% 15% 5%
1991 76% 17% 7%
1993 69% 22% 9%
1995 63% 25% 12%
1997 57% 28% 15%
1999 53% 31% 16%
2001 51% 33% 16%
2003 47% 37% 16%
2005* 45% 38% 17%
Source: Vispaern’s Diagnostic Imaging Center Profiling Solution (2004) *Note: 2005 values are estimated based on current trends, as reported in AHA Trendwatch (2006).
Analysis of additional OSHPD databases, the Annual Utilization Report of Hospitals and, beginning in 2005, the ambulatory surgery and emergency department dataset, provided insight into trends for California.
Between 2000 and 2005, the number of licensed ambulatory surgery clinics, including freestanding centers and physician offices, grew to 456, an increase of nearly 40 percent. This exceeded the 357 hospitals providing outpatient surgical care. Of the reporting ambulatory surgical clinics in 2005, the greatest number, approximately 100, were located in Los Angeles County, followed by 40 in Orange County and 35 in Riverside County.
Overall, the growth in the number of surgeries appears to be driven primarily by the growth in procedures at ambulatory surgery centers (ASCs). While the annual utilization reports indicate that the total number of inpatient surgeries grew 5 percent and the number of hospital-based outpatient surgeries increased 3 percent, procedures in ASCs grew more than 65 percent. In 2005, procedures in ASCs represented one-third of surgeries, up from less than one-quarter of surgeries in 2000. (Figure 4.15)135
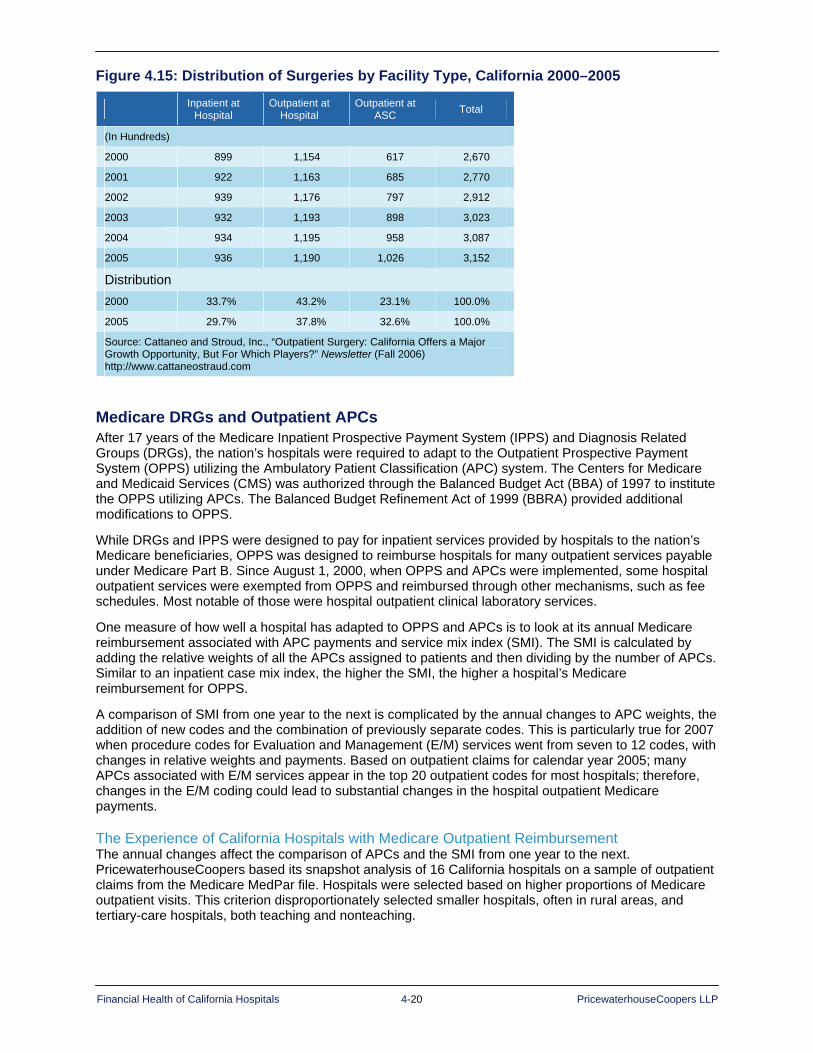
Financial Health of California Hospitals 4-20 PricewaterhouseCoopers LLP
Figure 4.15: Distribution of Surgeries by Facility Type, California 2000–2005
Medicare DRGs and Outpatient APCs After 17 years of the Medicare Inpatient Prospective Payment System (IPPS) and Diagnosis Related Groups (DRGs), the nation’s hospitals were required to adapt to the Outpatient Prospective Payment System (OPPS) utilizing the Ambulatory Patient Classification (APC) system. The Centers for Medicare and Medicaid Services (CMS) was authorized through the Balanced Budget Act (BBA) of 1997 to institute the OPPS utilizing APCs. The Balanced Budget Refinement Act of 1999 (BBRA) provided additional modifications to OPPS.
While DRGs and IPPS were designed to pay for inpatient services provided by hospitals to the nation’s Medicare beneficiaries, OPPS was designed to reimburse hospitals for many outpatient services payable under Medicare Part B. Since August 1, 2000, when OPPS and APCs were implemented, some hospital outpatient services were exempted from OPPS and reimbursed through other mechanisms, such as fee schedules. Most notable of those were hospital outpatient clinical laboratory services.
One measure of how well a hospital has adapted to OPPS and APCs is to look at its annual Medicare reimbursement associated with APC payments and service mix index (SMI). The SMI is calculated by adding the relative weights of all the APCs assigned to patients and then dividing by the number of APCs. Similar to an inpatient case mix index, the higher the SMI, the higher a hospital’s Medicare reimbursement for OPPS.
A comparison of SMI from one year to the next is complicated by the annual changes to APC weights, the addition of new codes and the combination of previously separate codes. This is particularly true for 2007 when procedure codes for Evaluation and Management (E/M) services went from seven to 12 codes, with changes in relative weights and payments. Based on outpatient claims for calendar year 2005; many APCs associated with E/M services appear in the top 20 outpatient codes for most hospitals; therefore, changes in the E/M coding could lead to substantial changes in the hospital outpatient Medicare payments.
The Experience of California Hospitals with Medicare Outpatient Reimbursement The annual changes affect the comparison of APCs and the SMI from one year to the next. PricewaterhouseCoopers based its snapshot analysis of 16 California hospitals on a sample of outpatient claims from the Medicare MedPar file. Hospitals were selected based on higher proportions of Medicare outpatient visits. This criterion disproportionately selected smaller hospitals, often in rural areas, and tertiary-care hospitals, both teaching and nonteaching.
Inpatient at Hospital
Outpatient at Hospital
Outpatient at ASC Total
(In Hundreds)
2000 899 1,154 617 2,670
2001 922 1,163 685 2,770
2002 939 1,176 797 2,912
2003 932 1,193 898 3,023
2004 934 1,195 958 3,087
2005 936 1,190 1,026 3,152
Distribution 2000 33.7% 43.2% 23.1% 100.0%
2005 29.7% 37.8% 32.6% 100.0%
Source: Cattaneo and Stroud, Inc., “Outpatient Surgery: California Offers a Major Growth Opportunity, But For Which Players?” Newsletter (Fall 2006) http://www.cattaneostraud.com
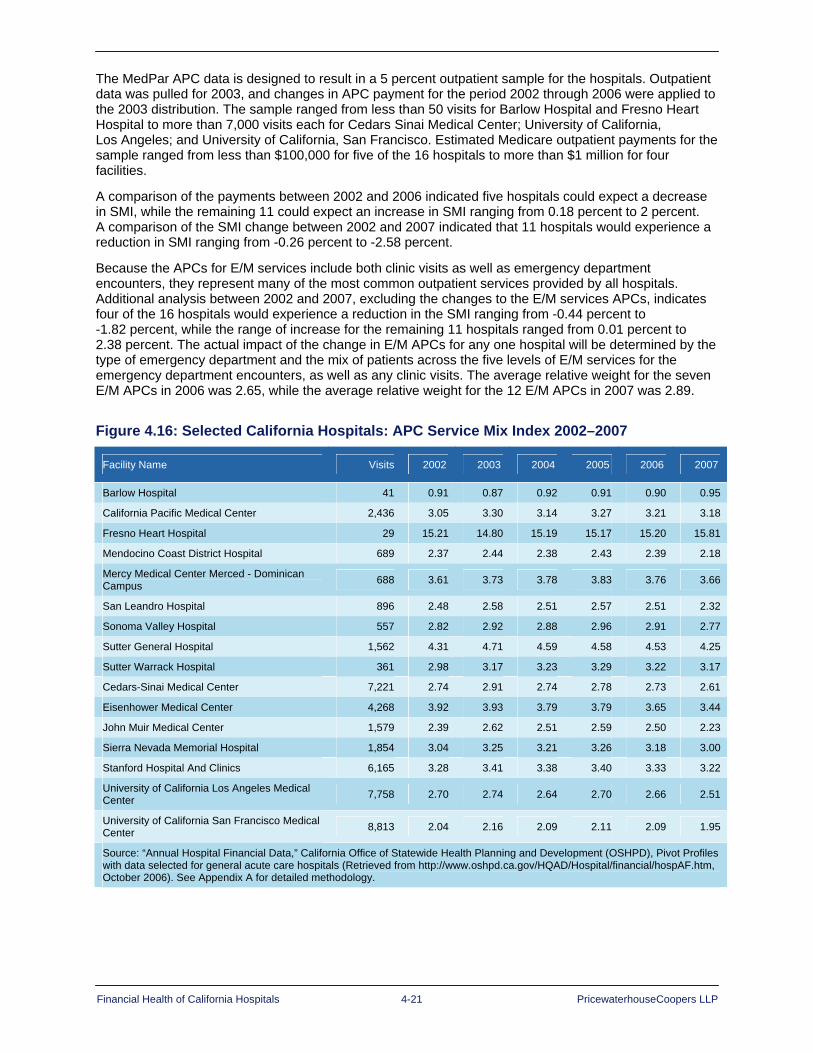
Financial Health of California Hospitals 4-21 PricewaterhouseCoopers LLP
The MedPar APC data is designed to result in a 5 percent outpatient sample for the hospitals. Outpatient data was pulled for 2003, and changes in APC payment for the period 2002 through 2006 were applied to the 2003 distribution. The sample ranged from less than 50 visits for Barlow Hospital and Fresno Heart Hospital to more than 7,000 visits each for Cedars Sinai Medical Center; University of California, Los Angeles; and University of California, San Francisco. Estimated Medicare outpatient payments for the sample ranged from less than $100,000 for five of the 16 hospitals to more than $1 million for four facilities.
A comparison of the payments between 2002 and 2006 indicated five hospitals could expect a decrease in SMI, while the remaining 11 could expect an increase in SMI ranging from 0.18 percent to 2 percent. A comparison of the SMI change between 2002 and 2007 indicated that 11 hospitals would experience a reduction in SMI ranging from -0.26 percent to -2.58 percent.
Because the APCs for E/M services include both clinic visits as well as emergency department encounters, they represent many of the most common outpatient services provided by all hospitals. Additional analysis between 2002 and 2007, excluding the changes to the E/M services APCs, indicates four of the 16 hospitals would experience a reduction in the SMI ranging from -0.44 percent to -1.82 percent, while the range of increase for the remaining 11 hospitals ranged from 0.01 percent to 2.38 percent. The actual impact of the change in E/M APCs for any one hospital will be determined by the type of emergency department and the mix of patients across the five levels of E/M services for the emergency department encounters, as well as any clinic visits. The average relative weight for the seven E/M APCs in 2006 was 2.65, while the average relative weight for the 12 E/M APCs in 2007 was 2.89.
Figure 4.16: Selected California Hospitals: APC Service Mix Index 2002–2007
Facility Name Visits 2002 2003 2004 2005 2006 2007
Barlow Hospital 41 0.91 0.87 0.92 0.91 0.90 0.95
California Pacific Medical Center 2,436 3.05 3.30 3.14 3.27 3.21 3.18
Fresno Heart Hospital 29 15.21 14.80 15.19 15.17 15.20 15.81
Mendocino Coast District Hospital 689 2.37 2.44 2.38 2.43 2.39 2.18
Mercy Medical Center Merced - Dominican Campus 688 3.61 3.73 3.78 3.83 3.76 3.66
San Leandro Hospital 896 2.48 2.58 2.51 2.57 2.51 2.32
Sonoma Valley Hospital 557 2.82 2.92 2.88 2.96 2.91 2.77
Sutter General Hospital 1,562 4.31 4.71 4.59 4.58 4.53 4.25
Sutter Warrack Hospital 361 2.98 3.17 3.23 3.29 3.22 3.17
Cedars-Sinai Medical Center 7,221 2.74 2.91 2.74 2.78 2.73 2.61
Eisenhower Medical Center 4,268 3.92 3.93 3.79 3.79 3.65 3.44
John Muir Medical Center 1,579 2.39 2.62 2.51 2.59 2.50 2.23
Sierra Nevada Memorial Hospital 1,854 3.04 3.25 3.21 3.26 3.18 3.00
Stanford Hospital And Clinics 6,165 3.28 3.41 3.38 3.40 3.33 3.22
University of California Los Angeles Medical Center 7,758 2.70 2.74 2.64 2.70 2.66 2.51
University of California San Francisco Medical Center 8,813 2.04 2.16 2.09 2.11 2.09 1.95
Source: “Annual Hospital Financial Data,” California Office of Statewide Health Planning and Development (OSHPD), Pivot Profiles with data selected for general acute care hospitals (Retrieved from http://www.oshpd.ca.gov/HQAD/Hospital/financial/hospAF.htm, October 2006). See Appendix A for detailed methodology.

Financial Health of California Hospitals 4-22 PricewaterhouseCoopers LLP
Summary Hospital payment systems are complex and getting more so. Third-party payers reimburse hospitals for their services following varying payment structures, which often change with new legislation and regulations; for many, government programs are not negotiable.
Along with the complexity of the payment system, pressure on net income results from:
Increased utilization by elderly and low-income patients, for whom reimbursement rates fall short of the cost of care
Increased dependency on a shrinking managed care population, which generates the largest share of hospital revenue
Potential for additional cuts to Medicare and Medicaid (Medi-Cal) reimbursement rates
Increasing contractual allowances — particularly by key payers such as Medicare — diminish the utility of a hospital’s recognition of operating expenses in pricing its services. Changes in net income from patient services result primarily from negotiation of reimbursement rates with payers and ability to control the revenue cycle on reimbursement and collections.
The shift in surgeries from inpatient to outpatient settings has negatively affected hospitals by skimming off the more profitable procedures. This has left hospitals with sicker patients and more complex and costly surgeries. Diagnostic procedures also have moved outside the hospital setting to physician offices and freestanding facilities.
The slight increase in average length of stay (ALOS), when combined with the large increase in case mix index (CMI), indicates that lower-intensity procedures with shorter lengths of stay have moved to ambulatory surgery centers or physician offices. This follows a national trend.

Financial Health of California Hospitals 5-1 PricewaterhouseCoopers LLP
Chapter 5: Comparing California Hospitals to the Nation
Key Findings Comparative statistics showing health care utilization and spending patterns for California and the United States reveal key distinctions and characterize the types of populations served. The following section provides an analysis of hospital utilization, bed supply, managed care penetration, uncompensated care, and hospital labor supply and compensation in California from a national perspective.
More of the personal health care dollar is spent at a national level on hospital care (36.5 percent) than in California (34.8 percent). A greater percentage of this dollar goes toward payments for physicians and other professional services in California (33.5 percent) than in the United States (28.8 percent). This statistic could reflect the importance in California of a physician network in managing patient care under health maintenance organizations (HMOs) and preferred provider organizations (PPOs).136
Admissions and inpatient days per thousand population were lower for California than the U.S. average over the study period. California admissions per thousand ranged from 97 to 98 per thousand in comparison to the U.S. range of 117 to 120 per thousand. Inpatient days per thousand in California hospitals ranged from 512 to 531 versus a range for all U.S. hospitals of 681 to 704 per thousand.137
The difference in outpatient utilization between California and U.S. hospitals is not as great as inpatient, although California consistently reports lower utilization rates. For the period 1999–2004, U.S. hospital outpatient visits per thousand population ranged from 1,817 to 1,946, in comparison to 1,322 to 1,406 per thousand population in California.
California bed supply has consistently been below the U.S. ratio, though the gap has narrowed slightly within the past five years. California’s rate of beds per thousand population in 2005 was 2.1, compared to a 2.7 for the United States. This lower ratio could represent a combination of some relaxing of managed care patient utilization “gate-keeping” concurrent with expansion of the number of managed care programs in the balance of the country.
Operating (profit) margins for California hospitals have improved slightly over the five-year period, inching into the positive, though at a rate less than those for the United States overall. California 2005 operating margins grew to 2.03 percent in comparison to 2.89 percent for the United States.
Clinical work force issues moved to the forefront in California with mandatory nurse-to-patient staffing ratios taking effect in January 2004 (AB 394). The 1995–1999 report noted that California had the lowest number of nurses per capita in the United States, with 555 nurses per 100,000 population versus 823 per 100,000 nationally.138 The difference in 2005 is still significant, with California reporting 626 nurses per 100,000 population in comparison to 799 per 100,000 population in the United States.
California has higher average salaries per hospital full-time equivalent (FTE) than the United States overall, approximately $10,000 more in nominal dollars per year from 2000 to 2004. However, when adjusted for regional wage indices, the effective difference results in California’s average salaries per FTE ranging between $342 to $5,327 less than the United States overall over the same period.139 This presents a significant challenge to California hospitals in recruiting and retaining professional clinical staff from outside the state.

Financial Health of California Hospitals 5-2 PricewaterhouseCoopers LLP
Utilization Rates Nationally, demand for inpatient care fell from the 1980s into the mid-1990s but began to rise after that. More people using more services per person fueled a 43 percent increase in hospital care (inpatient and outpatient) from 1998 to 2004. This trend toward increased utilization should continue in California and nationwide as baby boomers age and require more medical care and life expectancy lengthens.140
California hospital utilization rates for acute care are generally lower than the U.S. average. The rate of acute hospital days per 1,000 people in 2005 was 504.7 in California, compared to 666.4 in the nation — a 32 percent difference. Admissions per 1,000 also were lower in California (95 compared to 119.2 nationally). In 2004, California ranked 41st among the states, including the District of Columbia, in admissions per 1,000 residents and 42nd for inpatient days per 1,000 residents.141
Figure 5.1: Inpatient Utilization, California versus United States
California 2000 2001 2002 2003 2004 2005
Admits 3,315,316 3,332,839 3,430,241 3,473,879 3,468,538 3,434,221
Days 17,481,600 17,835,799 18,591,536 18,814,783 18,351,443 18,235,884
Surgeries 884,506 882,138 978,223 920,411 933,289 918,661
Admits per 1,000 97.9 96.5 98.0 98.0 96.6 95.0
Days per 1,000 516.1 516.5 531.4 530.5 511.3 504.7
Surgeries per 1,000 26.1 25.5 28.0 26.0 26.0 25.4
CA Population (Thousands) 33,872 34,532 34,988 35,463 35,894 36,132
United States 2000 2001 2002 2003 2004 2005
Admits 35,239,000 33,813,589 34,478,280 34,782,742 35,086,061 35,238,673
Days 192,420,368 194,106,316 196,690,099 196,649,769 197,564,172 197,073,770
Surgeries 9,729,336 9,779,583 10,105,010 9,940,922 10,050,346 10,097,271
Admits per 1,000 125.2 118.6 119.7 119.6 119.5 119.2
Days per 1,000 683.7 680.8 683.1 676.3 672.8 666.4
Surgeries per 1,000 34.6 34.3 35.1 34.2 34.2 34.1
U.S. Population (Thousands) 281,422 285,102 287,941 290,789 293,655 295,747
Source: American Hospital Association, AHA Hospital Statistics (2006 and 2007), Table 3 (U.S.) and Table 6 (California)
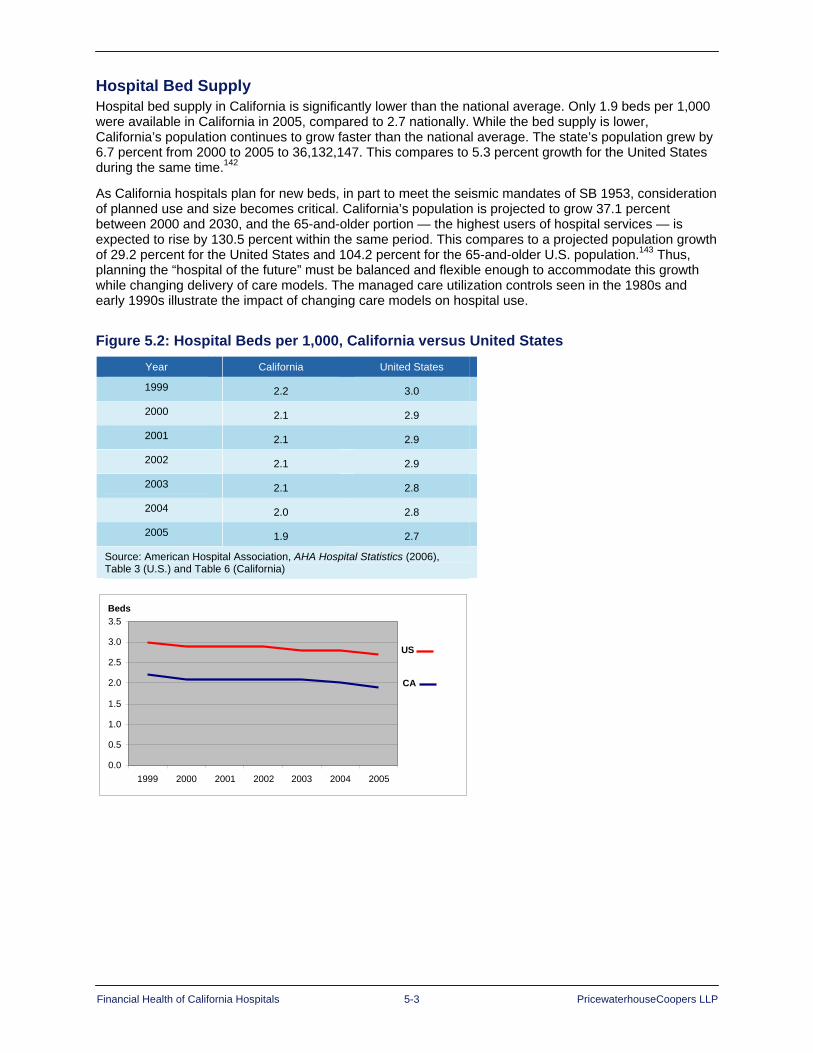
Financial Health of California Hospitals 5-3 PricewaterhouseCoopers LLP
Hospital Bed Supply Hospital bed supply in California is significantly lower than the national average. Only 1.9 beds per 1,000 were available in California in 2005, compared to 2.7 nationally. While the bed supply is lower, California’s population continues to grow faster than the national average. The state’s population grew by 6.7 percent from 2000 to 2005 to 36,132,147. This compares to 5.3 percent growth for the United States during the same time.142
As California hospitals plan for new beds, in part to meet the seismic mandates of SB 1953, consideration of planned use and size becomes critical. California’s population is projected to grow 37.1 percent between 2000 and 2030, and the 65-and-older portion — the highest users of hospital services — is expected to rise by 130.5 percent within the same period. This compares to a projected population growth of 29.2 percent for the United States and 104.2 percent for the 65-and-older U.S. population.143 Thus, planning the “hospital of the future” must be balanced and flexible enough to accommodate this growth while changing delivery of care models. The managed care utilization controls seen in the 1980s and early 1990s illustrate the impact of changing care models on hospital use.
Figure 5.2: Hospital Beds per 1,000, California versus United States Year California United States
1999 2.2 3.0
2000 2.1 2.9
2001 2.1 2.9
2002 2.1 2.9
2003 2.1 2.8
2004 2.0 2.8
2005 1.9 2.7
Source: American Hospital Association, AHA Hospital Statistics (2006), Table 3 (U.S.) and Table 6 (California)
0.0 0.5 1.0 1.5 2.0 2.5 3.0 3.5
1999 2000 2001 2002 2003 2004 2005
CA
US
Beds

Financial Health of California Hospitals 5-4 PricewaterhouseCoopers LLP
Profitability In comparison to U.S. averages, California hospitals continue to operate at profit margins much narrower than those in other states. In 2005, the California median was 2.03, compared to 2.89 for the United States.
Figure 5.3: Median Operating Margins for Hospitals, California versus United States 1999 2000 2001 2002 2003 2004 2005
California -0.0 0.2 0.24 0.81 1.97 1.69 2.03
United States 0.7 0.7 0.95 1.56 1.70 2.17 2.89
Source: Ingenix, “Medicare Cost Report Indicators, Operating Margin” Almanac of Hospital Financial and Operating Indicators” (Ingenix, 2007) 320-321 and, for 1999 and 2000 data, (2005), 306-307
Only 27.45 percent of California hospital revenue came from outpatient services in 2005. This was lower than the national average of 44.49 percent and an area of concern because hospitals typically report higher operating margins on outpatient business than on inpatient.144 There has been a greater reliance on inpatients by California hospitals when compared to the United States over the review period. Though this has decreased from 73.26 percent in 2001 to 72.55 percent in 2005, it is still higher than the corresponding period for U.S hospitals, shifting from 59.54 percent inpatient revenue (as percent of total) to 55.58 percent by 2005.
Figure 5.4: Median Values, Percentage of Total Revenue from Inpatient and Outpatient Services, California versus United States
California 2001 2002 2003 2004 2005
Inpatient Revenue 73.26 72.75 72.84 73.06 72.55
Outpatient Revenue 26.74 27.25 27.16 26.94 27.45
Nonoperating Revenue 6 6 6 5 3
United States 2001 2002 2003 2004 2005
Inpatient Revenue 59.54 58.84 58.41 57.57 55.58
Outpatient Revenue 40.50 41.19 41.63 42.50 44.49
Nonoperating Revenue 29 15 12 12 17
Source: Ingenix, “Medicare Cost Report Indicators,” Almanac of Hospital Financial and Operating Indicators (Ingenix, 2007), 461-465, 323-324

Financial Health of California Hospitals 5-5 PricewaterhouseCoopers LLP
California hospitals rely more heavily on commercial and third-party payers for reimbursement than U.S. hospitals overall. In 2005, 55.55 percent of discharges in California were patients other than Medicare and Medicaid, compared to 42.2 percent for the United States (Figure 5.5).
Figure 5.5: Percentage of Hospital Discharges from Medicare and Medicaid, California versus United States
Managed Care In contrast to the national trend, HMOs continue to have a large presence in California, with a smaller though growing share of insured workers enrolled in PPOs. In 2005, 49 percent of workers covered by employer-sponsored health plans — and 47.7 percent of the total state population — were enrolled in an HMO, making California the state with the highest HMO penetration in the nation, more than twice the national average.145
On a national level, HMO enrollment has declined since 1996 when 31 percent of covered employees chose HMOs. In 2006, only 20 percent chose an HMO, while 60 percent selected a PPO, up from 11 percent in 1988.146
California’s HMO enrollment also has declined from a high of 54 percent of covered workers in 2001 to 50 percent in 2006, but this decline is not as dramatic as the national decrease. Like the national trend, California PPO enrollment is steadily increasing, but is about half the national average, with 34 percent of covered workers in California enrolled in a PPO plan in 2006.147
As noted in the California HealthCare Foundation’s “California Health Care Market Report 2006,” this migration of Californians from HMOs to PPOs has put pressure on the state’s large physician medical groups to adapt to different payment incentives.148
Figures 5.6 and 5.7 show enrollment data for California HMOs by line of business (commercial, Medicare, Medi-Cal and Healthy Families) from the Cattaneo & Stroud 2006 Statewide HMO and Special Programs Enrollment Study. These figures also show the percent of the eligible population enrolled by line of business and the enrollment percentages for the top three HMOs by line of business. Kaiser Foundation Health Plan had the largest share of HMO enrollees for all lines of business in 2005.
California 2001 2002 2003 2004 2005
Medicare 28.75 30.14 31.26 31.91 32.68
Medicaid 10.08 10.45 11.13 11.72 11.77
Commercial/Other 61.7 59.41 57.61 56.37 55.55
United States 2001 2002 2003 2004 2005
Medicare 45.51 45.76 45.95 46.41 47.82
Medicaid 9.01 9.48 9.89 9.97 9.98
Commercial/Other 45.48 44.76 44.16 43.62 42.20
Source: Ingenix, “Medicare Cost Report Indicators,” Almanac of Hospital Financial and Operating Indicators (Ingenix, 2007), 443-450

Financial Health of California Hospitals 5-6 PricewaterhouseCoopers LLP
Figure 5.6: California HMO Enrollment 2000–2006 2000 2001 2002 2003 2004 2005 2006
Population Enrolled in HMO Commercial HMO 13,079,630 13,590,515 12,955,236 12,421,848 12,137,507 11,961,602 12,076,812
Medicare HMO 1,573,056 1,549,985 1,432,259 1,358,562 1,336,472 1,357,234 1,371,489
Medi-Cal HMO 2,551,997 2,729,155 3,066,058 3,295,416 3,263,488 3,256,818 3,246,997
Healthy Families HMO 262,460 412,433 521,049 639,638 707,269 716,825 747,333
CA HMO Enrollment 17,467,143 18,282,088 17,974,602 17,715,464 17,444,736 17,292,479 17,442,631
Eligible Population Commercial Eligible 25,710,606 25,605,488 25,419,142 25,409,230 25,766,155 26,195,654 26,497,550
Medicare Eligible 3,198,410 3,266,330 3,275,913 3,284,840 3,315,310 3,345,640 3,442,513
Medi-Cal Eligible 5,035,604 5,100,459 5,784,026 6,278,482 6,482,357 6,470,080 6,484,619
Total CA Population 34,207,080 34,384,710 35,000,130 35,612,190 36,271,091 36,728,196 37,172,015
Percent of Eligible Population Enrolled in HMO Commercial HMO 50.9% 53.1% 51.0% 48.9% 47.1% 45.7% 45.6%
Medicare HMO 49.2% 47.5% 43.7% 41.4% 40.3% 40.6% 39.8%
Medi-Cal HMO 50.7% 53.5% 53.0% 52.5% 50.3% 50.3% 50.1%
Total Population 51.1% 53.2% 51.4% 49.7% 48.1% 47.1% 46.9%
Sources: Cattaneo & Stroud, 2006 Statewide HMO and Special Programs Enrollment Study, and U.S. Census http://www.cattaneostroud.com/2006HMO.htm
Notes: - The 2006 California Statewide HMO & Special Programs Enrollment Study is Cattaneo & Stroud’s 10th annual analysis of
California HMO enrollment by county. The study provides HMO enrollment compared to the total eligible population for four major lines of business: commercial, Medi-Cal, Medicare and Healthy Families. All health plan membership data are for the month of March 2006.
- C&S revised the March 2005 data to reflect an adjustment to the 2005 population by the California Department of Finance in May 2006.
- Percent eligible population was calculated as follows: o All lines of business (total enrollment)¸ (total California population, Jan 1, 2006) x 100 = 46.9% o Commercial (total Commercial Enrollment)¸ (total California population – (Healthy Families Enrollment + Medi-Cal
Eligibles + (Medicare Eligibles – Medicare/Medi-Cal Eligibles))) x 100 = 45.6% (Note that the total eligible population in this category includes uninsured.)
o Medicare (total Medicare Enrollment – Medicare/Medi-Cal Enrollment)¸ (Medicare Eligibles – Medicare/Medi-Cal Eligibles) x 100 = 39.8%
o Medi-Cal (total Medi-Cal Enrollment)¸ (total Medi-Cal Eligibles including Medicare/Medi-Cal Eligibles) x 100 = 50.1% - Percent eligible and percent of eligible population are not applicable to Healthy Families.
Definitions: Commercial Enrollment: Includes HMO (standard group, both large and small), individual, point-of-service, Aid for Infants & Mothers, California Kids, county-sponsored Healthy Kids programs and capitated administrative-services-only members. Medi-Cal: Programs administered by the Department of Health Services, including 2-Plan County Programs, County Organized Health Systems, Fee-For-Service Managed Care, Geographic Managed Care, Prepaid Health Plans, Primary Care Case Management. Medicare: Programs administered by the Centers for Medicare & Medicaid Services, including Medicare+Choice, Cost, Demonstration Contracts and Program for All Inclusive Care (PACE). Healthy Families: Administered by the California Major Risk Medical Insurance Board, which uses the HMO or EPO networks of participating health plans.
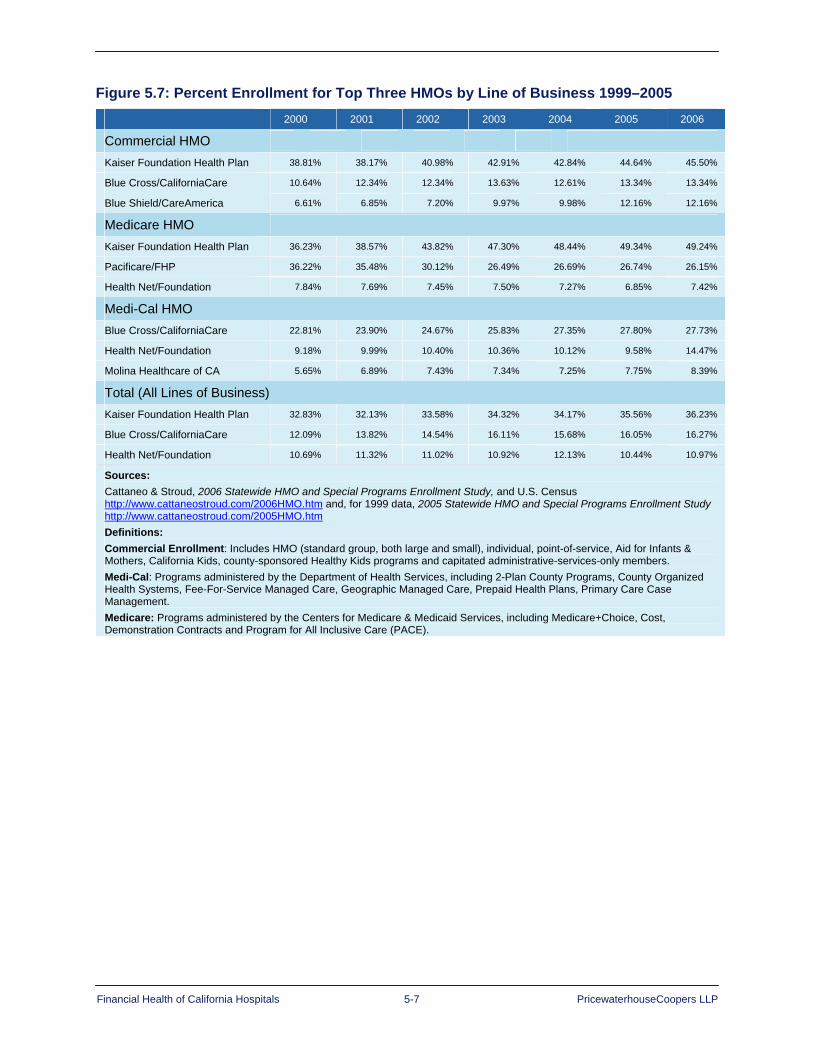
Financial Health of California Hospitals 5-7 PricewaterhouseCoopers LLP
Figure 5.7: Percent Enrollment for Top Three HMOs by Line of Business 1999–2005 2000 2001 2002 2003 2004 2005 2006
Commercial HMO
Kaiser Foundation Health Plan 38.81% 38.17% 40.98% 42.91% 42.84% 44.64% 45.50%
Blue Cross/CaliforniaCare 10.64% 12.34% 12.34% 13.63% 12.61% 13.34% 13.34%
Blue Shield/CareAmerica 6.61% 6.85% 7.20% 9.97% 9.98% 12.16% 12.16%
Medicare HMO
Kaiser Foundation Health Plan 36.23% 38.57% 43.82% 47.30% 48.44% 49.34% 49.24%
Pacificare/FHP 36.22% 35.48% 30.12% 26.49% 26.69% 26.74% 26.15%
Health Net/Foundation 7.84% 7.69% 7.45% 7.50% 7.27% 6.85% 7.42%
Medi-Cal HMO Blue Cross/CaliforniaCare 22.81% 23.90% 24.67% 25.83% 27.35% 27.80% 27.73%
Health Net/Foundation 9.18% 9.99% 10.40% 10.36% 10.12% 9.58% 14.47%
Molina Healthcare of CA 5.65% 6.89% 7.43% 7.34% 7.25% 7.75% 8.39%
Total (All Lines of Business) Kaiser Foundation Health Plan 32.83% 32.13% 33.58% 34.32% 34.17% 35.56% 36.23%
Blue Cross/CaliforniaCare 12.09% 13.82% 14.54% 16.11% 15.68% 16.05% 16.27%
Health Net/Foundation 10.69% 11.32% 11.02% 10.92% 12.13% 10.44% 10.97%
Sources: Cattaneo & Stroud, 2006 Statewide HMO and Special Programs Enrollment Study, and U.S. Census http://www.cattaneostroud.com/2006HMO.htm and, for 1999 data, 2005 Statewide HMO and Special Programs Enrollment Study http://www.cattaneostroud.com/2005HMO.htm Definitions: Commercial Enrollment: Includes HMO (standard group, both large and small), individual, point-of-service, Aid for Infants & Mothers, California Kids, county-sponsored Healthy Kids programs and capitated administrative-services-only members. Medi-Cal: Programs administered by the Department of Health Services, including 2-Plan County Programs, County Organized Health Systems, Fee-For-Service Managed Care, Geographic Managed Care, Prepaid Health Plans, Primary Care Case Management. Medicare: Programs administered by the Centers for Medicare & Medicaid Services, including Medicare+Choice, Cost, Demonstration Contracts and Program for All Inclusive Care (PACE).

Financial Health of California Hospitals 5-8 PricewaterhouseCoopers LLP
Uninsured Population Nationally, and in California, the growing uninsured population represents a continuous challenge for its health care system. In 2004, California had the eighth largest proportion of uninsured in the nation at 20.5 percent (6.5 million people), compared to a national average of 17.8 percent.149 By 2005, this percentage increased to 21.3 percent of Californians under the age of 65 without health insurance.150 California has fewer nonelderly covered through employer-sponsored health insurance than the national average, with 53.5 percent of the nonelderly receiving health coverage through employers, compared to a national average of 61 percent in 2005.151
The growing number of uninsured patients puts financial pressure on hospitals. Hospitals are responding by shifting some of the costs of charity care to insured patients.152 Yet, as third-party and commercial payers shift greater financial responsibility for hospital claims to their beneficiaries, hospitals also are pressed to collect those payments from patients to maintain those current balances as copayments and deductibles increase. Some local surveys in California and elsewhere suggest that some insured people, as they shift to larger copayments and higher-deductible plans, will not fill a prescription or will delay a surgical procedure because of worries about not being able to afford the cost of the deductible or copayment.
In addition to the concern about the propensity for the insured population to delay care, there is ongoing concern about the health care system’s ability to manage the uninsured patient population and to ensure that the delicate balance that currently exists does not erode.
Operating and Capital Costs Labor costs consume the biggest part of hospital expenditures nationwide.153 About 64 cents of every dollar a hospital spends goes toward salaries and benefits. Between 1998 and 2003, growth in hospital salaries and benefits was the greatest single factor driving up the cost of hospital care.154
The median hospital salary in California is higher than the national average because of the higher cost of living. When adjusted for California’s wage index, the median salary is actually lower in the state in comparison to the nation: the adjusted 2005 California salary was $46,864, compared to $47,219 for the United States.
California hospitals, like those nationwide, will need to increase salaries to attract nurses and other clinical workers who are in short supply. Nursing shortages will persist in California for the near future because of lack of capacity in nursing schools, difficulty recruiting and retaining faculty, and aging of the nursing population, half of whom will reach retirement age by 2020.155
California ranks 50th out of the 50 states in nurses per 100,000 population. The California Board of Registered Nursing estimates the shortage of California registered nurses at 22,500 full-time equivalents (FTEs); this could grow to 116,000 FTEs by 2020, a 45 percent shortfall. By 2030, the gap could grow to 55 percent, nearly double the projected nationwide shortfall.156 California’s mandated nurse-to-patient ratios, promulgated by AB 394, will put more pressure on the need to address the nursing shortage. The full impact of this legislation, effective in January 2004, is difficult to ascertain at this point. However, interviews with hospital administrators across the state suggest that high-margin hospitals are not having difficulty in meeting the staffing mandate nor attracting registered nurses to their workforce. Low-margin hospitals, on the other hand, are finding it more difficult to attract as well as retain this finite supply of clinical professionals.

Financial Health of California Hospitals 5-9 PricewaterhouseCoopers LLP
Figure 5.8: Median Hospital Salary per FTE, California versus United States
Median Hospital Salary per FTE
2001 2002 2003 2004 2005
All U.S. Hospitals $37,164 $39,671 $42,904 $44,431 $45,813
California $46,073 $48,377 $53,929 $53,463 $54,611
Median Hospital Salary per FTE (Adjusted for Wage Index) 2001 2002 2003 2004 2005
All U.S. Hospitals $39,687 $41,737 $44,754 $46,350 $47,219
California $39,322 $41,617 $40,536 $45,047 $46,864
Source: Ingenix, “Medicare Cost Report Indicators,” Almanac of Hospital Financial and Operating Indicators (Ingenix, 2007), 272-277
In addition to facing significant operating expenses, California hospitals must comply with mandated seismic upgrade requirements. Though discussed in greater length in other sections of this report (see Appendix C), it is important to note that no other state has imposed such a significant financial obligation on its hospitals.
The Foundation released a study in 2002, “Estimating the Compliance Cost of California SB1953,” completed by RAND Corporation, which estimated that the total expenditures by hospitals may be as large as $41.7 billion.157 An update to that study, released in January 2007, revisited the cost of compliance and developed cost scenarios to recognize a range of potential costs, accounting for trade-offs in inflation rates, construction rates and schedules, and sizing of new facilities. The new estimate (in 2006 dollars) indicates the total construction costs for replacement of SPC-1 structures range between $45 billion to $110 billion. This estimate does not include the cost of capital, which could escalate this range two-fold.158
Doing More with Less In comparison to the United States, California hospitals’ financial performance is improving but has not attained the average margins realized by the United States overall. This will be a continuing challenge because the prospect for improving operating income from patient revenue is expected to diminish with:
Increased reliance on high deductibles and copayments
Expanding uninsured patient population
Increasing operational and capital costs associated with increased costs of recruiting and retaining clinical staff and complying with seismic mandates


Financial Health of California Hospitals 6-1 PricewaterhouseCoopers LLP
Chapter 6: California Operating and Total Margin Trends
Key Findings Median operating margins remain thin for California hospitals. They have moved from slightly
negative to positive, but median operating margins for hospitals in California remained low, hovering near the break-even point over the period 2001 to 2005.
The gap between high-margin and low-margin hospitals narrowed slightly from 2001 to 2005, but remained large. This gap between the high-margin and low-margin hospitals was larger in California than in the nation. For general acute care hospitals in this analysis, the difference in the cut off for top and bottom quartile hospitals was nearly 13 percent in 2005.
Almost 39 percent of hospitals reported an operating loss in 2005, a decrease from 46 percent of hospitals in 2001. The addition of nonoperating income moved about 10 percent of hospitals from negative operating margins to break even or positive total margin. In 2005, about 28 percent of hospitals reported negative total margins.
The most profitable hospitals are medium to large, in urban areas, are part of systems and have an above-average proportion of net revenue from commercial payers. Many hospitals also have multiple years of profits and have built up reserves that generate substantial investment income.
The low margin hospitals are more likely to be small, in rural areas, affiliated with a system and have a high proportion of Medicaid and county indigent payers. Even when nonoperating income is included, the low operating margin hospitals report negative total margin. This may predict a negative outlook for their long-term viability.
Hospitals that were not part of a system reported negative operating margin, although there was slight improvement, over the study period. Conversely, hospitals that are part of a system reported positive, but slightly declining operating margins, moving from 4.2 percent in 2001 to 3.5 percent in 2005. Hospitals in the top five systems had a median operating margin of 6.1 percent in 2005. Hospitals that are part of the top five systems reported operating margins up to twice as great as all system hospitals. These hospitals had a median operating margin of 6.1 percent in 2005.
Hospitals receiving Disproportionate Share Hospital (DSH) funding exhibited negative median operating margins across the entire five-year period of the study. The negative margins were worse than those reported for the 1995–1999 study period. However, for those DSH facilities owned and operated by city and county governments, losses were offset by county general revenue and other nonoperating income.
A substantial difference exists in operating margin by region. Los Angeles County reflected a negative median operating margin. Northern and Sierra counties were slightly above break-even. San Diego and Orange counties performed just under 1 percent. These regions represented market areas with larger numbers of safety net hospitals.
Operating Margin as Primary Indicator of Financial Health Operating margin, defined as total net operating revenue minus total operating expense, serves as a primary indicator of financial status. This analysis uses this measure of financial performance because operating margin:
Best reflects the combined underlying business dynamics and trends of the hospital marketplace.
Directly and indirectly provides a measure of access to the capital required to sustain and grow a business in the future159 (see Chapter 8 and Appendix E of this report for more information on access to capital).

Financial Health of California Hospitals 6-2 PricewaterhouseCoopers LLP
This report relies on analysis of median statistics to understand margin trends. In addition to minimizing the impact of outliers, the use of medians focuses on the individual hospital, which is “the fundamental economic unit on which the financial performance of the hospital industry depends for its financial health.”160
The 1995–1999 report concluded that declining operating margins for the majority of California hospitals would, if they continued, “likely jeopardize these hospitals’ future viability.” Operating margins in the earlier report showed a wide gap between “have and have-not” hospitals. Those hospitals most likely to fall in the top quartile for 1995–1999 were medium-large, medium-small, for-profit urban or part of a system. The 1995–1999 report also showed that hospitals with the following characteristics were more likely to fall in the bottom quartile of operating margin: small, district-owned, city- or county-owned, DSH-funded and not part of a system.161
For the 2001–2005 period, the median operating margin for California hospitals improved each year, moving into positive territory in 2000, and even surpassing the national median in 2003 (Figure 6.1). Nationally, median operating margins improved more consistently from 2000 to 2005, and rose to 2.89 in 2005.
Figure 6.1: Median Operating Margins, California versus the United States
1999 2000 2001 2002 2003 2004 2005
California -0.0 0.2 0.24 0.81 1.97 1.69 2.03
U.S. 0.7 0.7 0.95 1.56 1.70 2.17 2.89
Source: Ingenix, “Medicare Cost Report Indicators, Operating Margin” Almanac of Hospital Financial and Operating Indicators” (Ingenix, 2007) 320-321 and, for 1999 and 2000 data, (2005), 306-307; data for 1999 and 2000 are based on earlier report and are limited to one decimal point.
From 2000 onward, more than half of California hospitals were making money from operations. In spite of these gains, median operating margins for California and nationwide remained near the break-even mark, requiring significant funding from nonoperating sources to address even routine capital requirements.
Overall, margins are positive, though thin, for California hospitals. A wide gap exists between the margins of high- and low-margin facilities. This gap became evident as this study further analyzed operating margin by grouping hospitals into quartiles, as follows:
75th Percentile: The top quartile represents the 25 percent of hospitals with the highest operating margins.
Median: The midpoint of the universe of hospitals in OSHPD’s database. Half of the hospitals fall above this operating margin, and half fall below.
25th Percentile: The bottom quartile represents the 25 percent of hospitals with the lowest operating margins.
75th Minus 25th Percentile: This represents the gap between the top- and bottom-quartile medians.
The quartile calculations are based upon analysis of the values reported for the general acute care hospitals that are included in the OSHPD database and, therefore, should be interpreted relative to all California hospitals. The quartile comparison may not hold if values are compared to other data sources, such as the American Hospital Association Annual Survey or benchmarks established by rating agencies such as Standard & Poor’s or Moody’s. Between 2001 and 2005, the database used for this analysis contains 356 to 385 hospitals; therefore, each quartile represents 89 to 96 hospitals, depending on the year. Hospitals may move among quartiles, depending on the analytic metric under analysis.

Financial Health of California Hospitals 6-3 PricewaterhouseCoopers LLP
Overall, California hospitals maintained positive operating margins during the study period (Figure 6.2), The median improved from 0.8 percent in 2001 to 1.3 percent in 2005. This is a gain of 0.5 percent, but represents a barely break-even performance. This contrasts to the 1995–1999 study period, when hospitals collectively reported a 0.4 percent operating margin in 1999 following a declining trend of 1.98 percent.
In California, the operating margin disparity between the top- and bottom-quartile hospitals narrowed slightly but remained substantial. It decreased from 13.86 percent in 2001 to 12.92 percent in 2005 (Figure 6.2). On a national level, the gap also decreased, from 10.1 percent in 1999 to 8.04 percent in 2005 (Figure 6.2). The gap between the high- and low-margin facilities was larger in California than on a national level (12.92 percent in California in 2005 compared to 8.04 percent nationally) (Figure 6.2).
The operating margin of California top-quartile hospitals dipped in 2004 (5.73 percent), putting it lower than the national top-quartile (5.9 percent); but California top quartile recovered in 2005 (7.28 percent) and outpaced the national top-quartile median of 6.93 percent. During 2001–2005, California top hospitals experienced a slight decline of 0.98 percent in operating margin. In contrast, on a national level, the top quartile gained 38.6 percent from 1999 to 2005 (Figure 6.2).
The bottom-quartile hospitals improved their operating margin from -6.51 percent in 2001 to -5.65 percent in 2005. The slightly narrowing gap between the top and bottom quartiles reflected this improvement. For comparison, during the period of the earlier report (1995–1999), the gap widened from 10.82 percent to 13.48 percent. In spite of the small improvement during 2001–2005, from 13.86 percent to 12.92 percent, the gap between low- and high-margin hospitals remained large.
Figure 6.2: Median Operating Margin Quartiles, California versus the United States
California U.S.
Quartile 2001 2002 2003 2004 2005 Percent Change 1999 2005 Percent
Change
75th Percentile 7.35% 7.93% 7.34% 5.73% 7.28% -0.98% 5.00% 6.93% 38.6%
Median 0.81% 0.95% 1.37% 0.68% 1.31% 61.76% 0.40% 2.89% 622.5%
25th Percentile -6.51% -5.53% -6.10% -8.46% -5.65% -13.32% -5.10% -1.11% -68.63%
75th Minus 25th Percentile
13.86% 13.46% 13.43% 14.19% 12.92% NA 10.10% 8.04% NA
Note: U.S. data includes specialty hospitals in addition to general acute care hospitals. California data includes general acute care hospitals only. Sources: For California 2001–2005 values, OSHPD; includes Kaiser data For 1999 U.S. values, Shattuck Hammond Partners, The Financial Health of California Hospitals (July 2001). For 2005 U.S. values, Ingenix, “Medicare Cost Report Indicators, Operating Margin” Almanac of Hospital Financial and Operating Indicators (2007) 320.
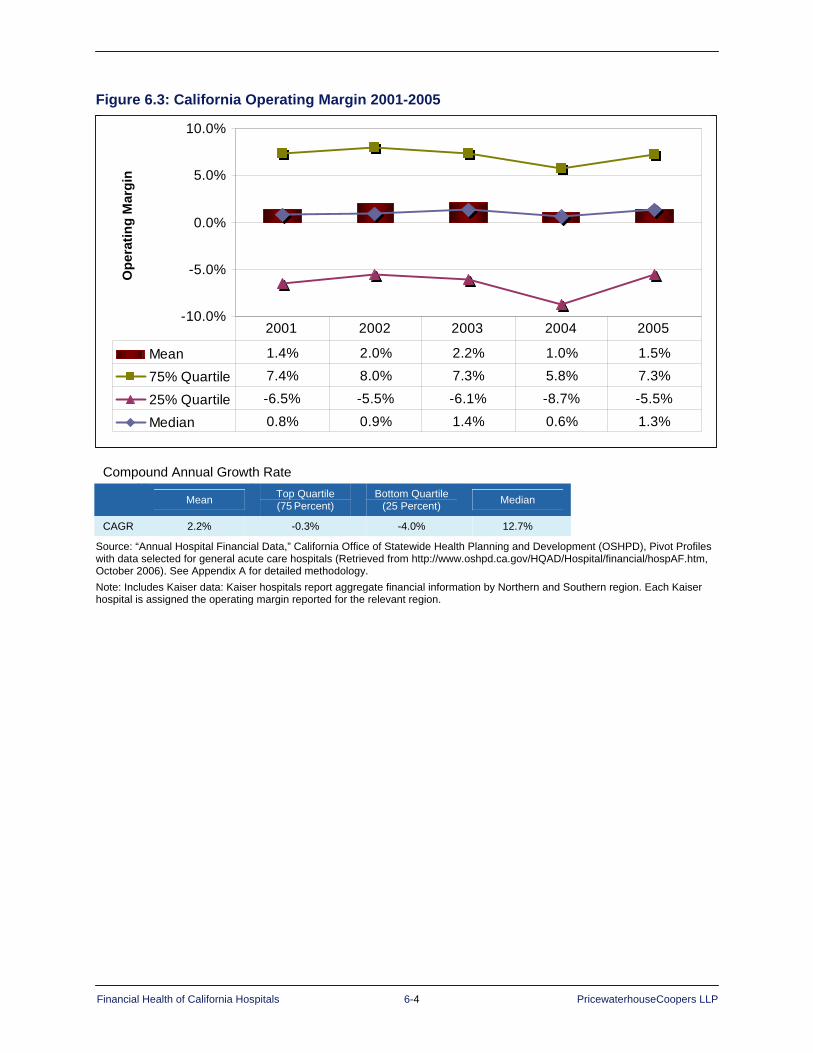
Financial Health of California Hospitals 6-4 PricewaterhouseCoopers LLP
Figure 6.3: California Operating Margin 2001-2005
-10.0%
-5.0%
0.0%
5.0%
10.0%
Mean 1.4% 2.0% 2.2% 1.0% 1.5%
75% Quartile 7.4% 8.0% 7.3% 5.8% 7.3%
25% Quartile -6.5% -5.5% -6.1% -8.7% -5.5%
Median 0.8% 0.9% 1.4% 0.6% 1.3%
2001 2002 2003 2004 2005
Ope
ratin
g M
argi
n
-10.0%
-5.0%
0.0%
5.0%
10.0%
Mean 1.4% 2.0% 2.2% 1.0% 1.5%
75% Quartile 7.4% 8.0% 7.3% 5.8% 7.3%
25% Quartile -6.5% -5.5% -6.1% -8.7% -5.5%
Median 0.8% 0.9% 1.4% 0.6% 1.3%
2001 2002 2003 2004 2005
Ope
ratin
g M
argi
n
Compound Annual Growth Rate Mean Top Quartile
(75 Percent) Bottom Quartile
(25 Percent) Median
CAGR 2.2% -0.3% -4.0% 12.7%
Source: “Annual Hospital Financial Data,” California Office of Statewide Health Planning and Development (OSHPD), Pivot Profiles with data selected for general acute care hospitals (Retrieved from http://www.oshpd.ca.gov/HQAD/Hospital/financial/hospAF.htm, October 2006). See Appendix A for detailed methodology. Note: Includes Kaiser data: Kaiser hospitals report aggregate financial information by Northern and Southern region. Each Kaiser hospital is assigned the operating margin reported for the relevant region.

Financial Health of California Hospitals 6-5 PricewaterhouseCoopers LLP
Nonoperating Revenue Figure 6.4 presents a profile of the revenue composition of California hospitals, which consists of three categories:
1. Net patient revenue (from patient care)
2. Other operating revenue (excluding investment earnings)
3. Nonoperating revenue, including investment earnings (Nonoperating revenue consists of investment earnings, contributions, government appropriations and transfers, and income from affiliates and subsidiaries.)162
In 2005, net patient revenue accounted for 92.9 percent of total revenue, but grew at only 0.2 percent for the study period (Figure 6.14). The share of total revenue contributed by the other two sources declined, and was 2.8 percent for other operating revenue and 4.3 percent for nonoperating revenue in 2005. Total revenue increased each year, with an overall CAGR of 9.4 percent.
Figure 6.4: Composition of Total Revenue by Operating versus Nonoperating Revenue 2001–2005
2001 2002 2003 2004 2005 CAGR
Net Patient Revenue with Net DSH $38,449,022,324 $42,442,415,941 $47,881,504,316 $51,421,704,196 $55,559,397,677 9.64%
Other Operating Revenue $1,301,391,026 $1,349,657,983 $1,552,748,941 $1,526,319,520 $1,685,082,773 6.7%
Nonoperating Revenue $1,974,115,381 $1,908,367,051 $2,129,147,524 $2,252,197,859 $2,577,645,920 6.9%
Total Revenue $41,724,528,731 $45,700,440,974 $51,563,400,781 $55,200,221,575 $59,822,126,370 9.4%
Percent Total Net Patient Revenue with Net DSH 92.1% 92.9% 92.9% 93.2% 92.9% 0.2%
Percent Total Other Operating Revenue 3.1% 3.0% 3.0% 2.8% 2.8% -2.5%
Percent Total Nonoperating Revenue 4.7% 4.2% 4.1% 4.1% 4.3% -2.3%
Source: “Annual Hospital Financial Data,” California Office of Statewide Health Planning and Development (OSHPD), Pivot Profiles with data selected for general acute care hospitals (Retrieved from http://www.oshpd.ca.gov/HQAD/Hospital/financial/hospAF.htm, October 2006). See Appendix A for detailed methodology. Notes: Includes Kaiser data. Net patient revenue is adjusted by removing DSH transfer payments. Percentages may not add exactly to 100 due to rounding. Discharges in the revenue and expense calculations were adjusted for outpatients (Adjustment Factor = Gross Patient Revenue/Gross Inpatient Revenue). Hospital is excluded if it did not report net patient revenue or discharge information or CMI data. Net patient revenues were adjusted by removing DSH transfer payments for county, district and University of California hospitals (see Appendix A for detailed methodology). Calculation for each hospital that was included: Net Patient Revenue + Other Operating Revenue/(Total Discharges * Adjustment Factor)/CMI.
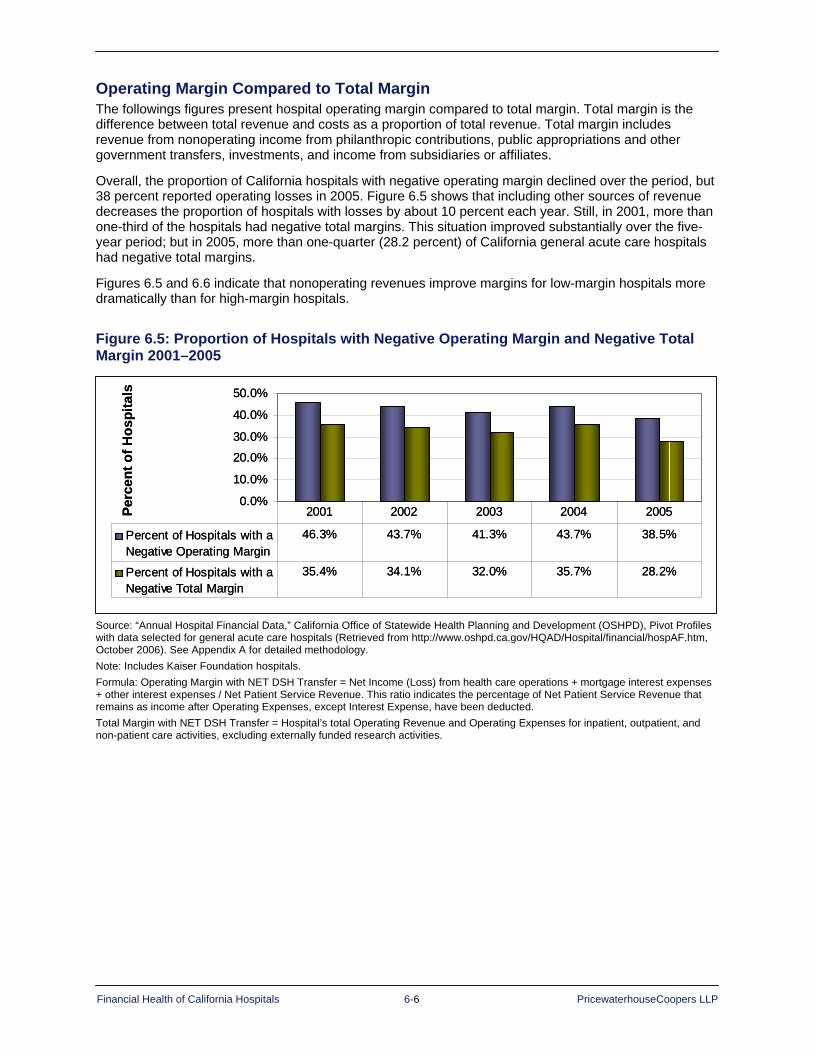
Financial Health of California Hospitals 6-6 PricewaterhouseCoopers LLP
Operating Margin Compared to Total Margin The followings figures present hospital operating margin compared to total margin. Total margin is the difference between total revenue and costs as a proportion of total revenue. Total margin includes revenue from nonoperating income from philanthropic contributions, public appropriations and other government transfers, investments, and income from subsidiaries or affiliates.
Overall, the proportion of California hospitals with negative operating margin declined over the period, but 38 percent reported operating losses in 2005. Figure 6.5 shows that including other sources of revenue decreases the proportion of hospitals with losses by about 10 percent each year. Still, in 2001, more than one-third of the hospitals had negative total margins. This situation improved substantially over the five-year period; but in 2005, more than one-quarter (28.2 percent) of California general acute care hospitals had negative total margins.
Figures 6.5 and 6.6 indicate that nonoperating revenues improve margins for low-margin hospitals more dramatically than for high-margin hospitals.
Figure 6.5: Proportion of Hospitals with Negative Operating Margin and Negative Total Margin 2001–2005
0.0%
10.0%
20.0%
30.0%
40.0%
50.0%
Percent of Hospitals with aNegative Operating Margin
46.3% 43.7% 41.3% 43.7% 38.5%
Percent of Hospitals with aNegative Total Margin
35.4% 34.1% 32.0% 35.7% 28.2%
2001 2002 2003 2004 2005Perc
ent o
f Hos
pita
ls
0.0%
10.0%
20.0%
30.0%
40.0%
50.0%
Percent of Hospitals with aNegative Operating Margin
46.3% 43.7% 41.3% 43.7% 38.5%
Percent of Hospitals with aNegative Total Margin
35.4% 34.1% 32.0% 35.7% 28.2%
2001 2002 2003 2004 2005Perc
ent o
f Hos
pita
ls
Source: “Annual Hospital Financial Data,” California Office of Statewide Health Planning and Development (OSHPD), Pivot Profiles with data selected for general acute care hospitals (Retrieved from http://www.oshpd.ca.gov/HQAD/Hospital/financial/hospAF.htm, October 2006). See Appendix A for detailed methodology. Note: Includes Kaiser Foundation hospitals. Formula: Operating Margin with NET DSH Transfer = Net Income (Loss) from health care operations + mortgage interest expenses + other interest expenses / Net Patient Service Revenue. This ratio indicates the percentage of Net Patient Service Revenue that remains as income after Operating Expenses, except Interest Expense, have been deducted. Total Margin with NET DSH Transfer = Hospital’s total Operating Revenue and Operating Expenses for inpatient, outpatient, and non-patient care activities, excluding externally funded research activities.

Financial Health of California Hospitals 6-7 PricewaterhouseCoopers LLP
Figures 6.6 and 6.7 indicate that nonoperating revenues are critical to the financial performance of the hospitals in the lowest quartile of operating margin. High-margin hospitals reported operating margins greater than 10 percent in 2005, but the mean declined from 2001 to 2005. In general, other revenue added approximately 1 percent to total margin.
Figure 6.6: Comparison of Mean Operating Margin and Mean Total Margin for High-Margin Hospitals 2001–2005
0.0%
2.0%
4.0%
6.0%
8.0%
10.0%
12.0%
14.0%
16.0%
Perc
ent
Mean Operating Margin 13.7% 13.8% 13.9% 11.5% 10.2%
Mean Total Margin 13.9% 14.1% 14.2% 12.3% 11.6%
2001 2002 2003 2004 2005
Mea
n M
argi
n
0.0%
2.0%
4.0%
6.0%
8.0%
10.0%
12.0%
14.0%
16.0%
Perc
ent
Mean Operating Margin 13.7% 13.8% 13.9% 11.5% 10.2%
Mean Total Margin 13.9% 14.1% 14.2% 12.3% 11.6%
2001 2002 2003 2004 2005
Mea
n M
argi
n
Source: “Annual Hospital Financial Data,” California Office of Statewide Health Planning and Development (OSHPD), Pivot Profiles with data selected for general acute care hospitals (Retrieved from http://www.oshpd.ca.gov/HQAD/Hospital/financial/hospAF.htm, October 2006). See Appendix A for detailed methodology.

Financial Health of California Hospitals 6-8 PricewaterhouseCoopers LLP
In contrast, the mean operating margin of the lowest-quartile hospitals improved but was -19 percent in 2005. Inclusion of other revenue improved performance by 10 to 15 percent, but the low-margin hospitals still reported negative total margins.
Figure 6.7: Comparison of Mean Operating Margin and Mean Total Margin for Low-Margin Hospitals 2001–2005
-25.0%
-20.0%
-15.0%
-10.0%
-5.0%
0.0%
Perc
ent
Mean Operating Margin -24.8% -22.4% -20.6% -23.3% -19.5%
Mean Total Margin -7.4% -4.7% -5.2% -9.7% -5.6%
2001 2002 2003 2004 2005
Mea
n M
argi
n
-25.0%
-20.0%
-15.0%
-10.0%
-5.0%
0.0%
Perc
ent
Mean Operating Margin -24.8% -22.4% -20.6% -23.3% -19.5%
Mean Total Margin -7.4% -4.7% -5.2% -9.7% -5.6%
2001 2002 2003 2004 2005
Mea
n M
argi
n
Source: “Annual Hospital Financial Data,” California Office of Statewide Health Planning and Development (OSHPD), Pivot Profiles with data selected for general acute care hospitals (Retrieved from http://www.oshpd.ca.gov/HQAD/Hospital/financial/hospAF.htm, October 2006). See Appendix A for detailed methodology.
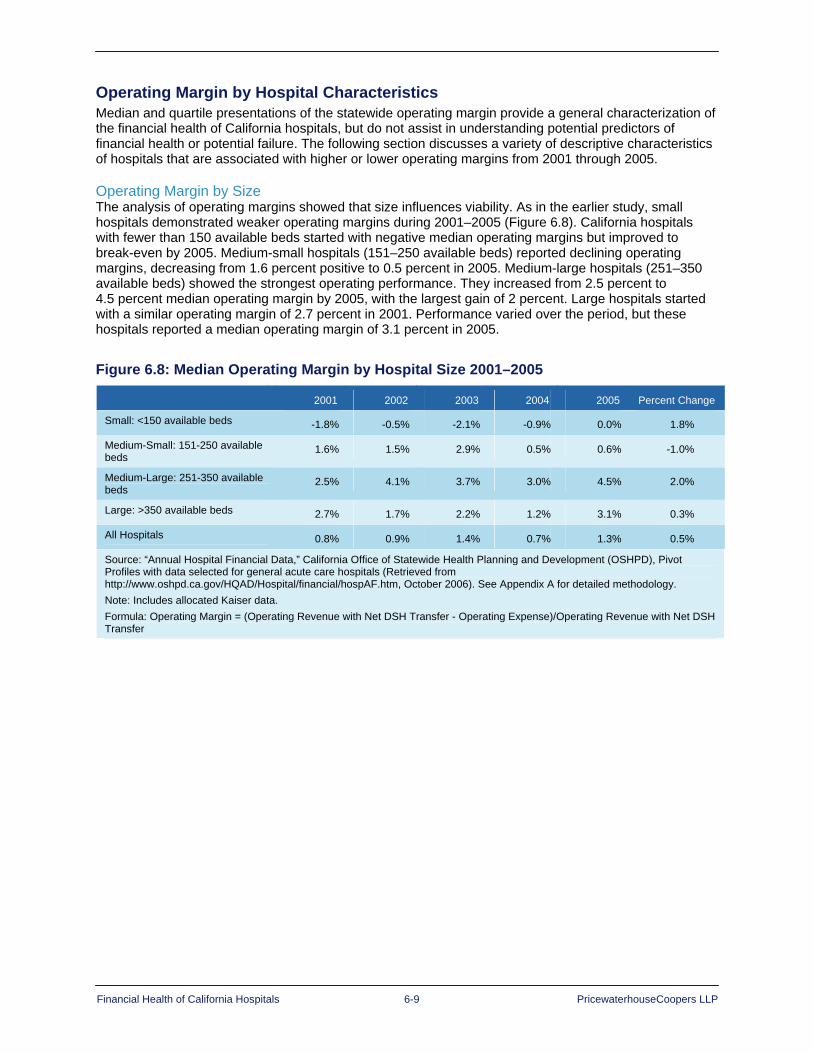
Financial Health of California Hospitals 6-9 PricewaterhouseCoopers LLP
Operating Margin by Hospital Characteristics Median and quartile presentations of the statewide operating margin provide a general characterization of the financial health of California hospitals, but do not assist in understanding potential predictors of financial health or potential failure. The following section discusses a variety of descriptive characteristics of hospitals that are associated with higher or lower operating margins from 2001 through 2005.
Operating Margin by Size The analysis of operating margins showed that size influences viability. As in the earlier study, small hospitals demonstrated weaker operating margins during 2001–2005 (Figure 6.8). California hospitals with fewer than 150 available beds started with negative median operating margins but improved to break-even by 2005. Medium-small hospitals (151–250 available beds) reported declining operating margins, decreasing from 1.6 percent positive to 0.5 percent in 2005. Medium-large hospitals (251–350 available beds) showed the strongest operating performance. They increased from 2.5 percent to 4.5 percent median operating margin by 2005, with the largest gain of 2 percent. Large hospitals started with a similar operating margin of 2.7 percent in 2001. Performance varied over the period, but these hospitals reported a median operating margin of 3.1 percent in 2005.
Figure 6.8: Median Operating Margin by Hospital Size 2001–2005 2001 2002 2003 2004 2005 Percent Change
Small: <150 available beds -1.8% -0.5% -2.1% -0.9% 0.0% 1.8%
Medium-Small: 151-250 available beds
1.6% 1.5% 2.9% 0.5% 0.6% -1.0%
Medium-Large: 251-350 available beds
2.5% 4.1% 3.7% 3.0% 4.5% 2.0%
Large: >350 available beds 2.7% 1.7% 2.2% 1.2% 3.1% 0.3%
All Hospitals 0.8% 0.9% 1.4% 0.7% 1.3% 0.5%
Source: “Annual Hospital Financial Data,” California Office of Statewide Health Planning and Development (OSHPD), Pivot Profiles with data selected for general acute care hospitals (Retrieved from http://www.oshpd.ca.gov/HQAD/Hospital/financial/hospAF.htm, October 2006). See Appendix A for detailed methodology. Note: Includes allocated Kaiser data. Formula: Operating Margin = (Operating Revenue with Net DSH Transfer - Operating Expense)/Operating Revenue with Net DSH Transfer

Financial Health of California Hospitals 6-10 PricewaterhouseCoopers LLP
Operating Margin by Ownership/Type of Control This analysis showed that financial performance varied by ownership and type of control (Figure 6.9). Similar to the findings in the earlier report, this study found that city/county and district hospitals had negative median margins throughout the study period. The city/county operating margin remained lowest of all categories for type of control at -19.9 percent in 2005. District hospitals also remained in negative territory at -4.4 percent in 2005. Hospitals in both categories, however, experienced an increase in median operating margins for the 2001–2005 period: 12.7 percent for city/county and 0.8 percent for district). These results, particularly those for the city/county hospitals, should be interpreted with caution because under OSHPD revenue classification, these statistics do not reflect public general revenue or tax appropriations that many of these hospitals receive.
For-profit hospitals reported declines in median operating margins of 5.3 percent during the study period. This category dropped from positive 4.4 percent in 2001 to negative -0.9 percent in 2005. This performance drop contrasts to the findings of the 1995–1999 study, in which for-profit hospitals had the highest median operating margins. Because Tenet Healthcare Corporation owned a great majority (32) of for-profit hospitals in the state in 2001, its decision in 2004 to sell or close 19 of its affiliates had a significant impact on this category. In 2001, Tenet generated 59 percent of the state’s for-profit hospital revenue, peaking at 61 percent in 2002. By 2005, following Tenet’s announcement and sale of 10 hospitals and closure of nine hospitals, its share of for-profit hospital revenue in California dropped to 36 percent.
The nonprofit sector fared best in 2005, increasing from 2.0 percent operating margin in 2001 to a 3.5 percent median operating margin by 2005. The strength of this sector helped lift the overall median for hospitals by 0.5 percent during the study period to 1.3 percent.
Figure 6.9: Median Operating Margins by Type of Control 2001–2005
2001 2002 2003 2004 2005 Percent Change
City/County -32.6% -27.1% -24.5% -25.1% -19.9% 12.7%
District -5.2% -4.5% -4.2% -4.0% -4.4% 0.8%
For-Profit 4.4% 2.7% 2.2% -2.7% -0.9% -5.3%
Nonprofit 2.0% 2.8% 2.8% 2.5% 3.5% 1.5%
All Hospitals 0.8% 0.9% 1.4% 0.7% 1.3% 0.5%
Source: “Annual Hospital Financial Data,” California Office of Statewide Health Planning and Development (OSHPD), Pivot Profiles with data selected for general acute care hospitals (Retrieved from http://www.oshpd.ca.gov/HQAD/Hospital/financial/hospAF.htm, October 2006). See Appendix A for detailed methodology. Note: Includes allocated Kaiser data. Formula: Operating Margin = (Operating Revenue with Net DSH Transfer – Operating Expense)/Operating Revenue with Net DSH Transfer
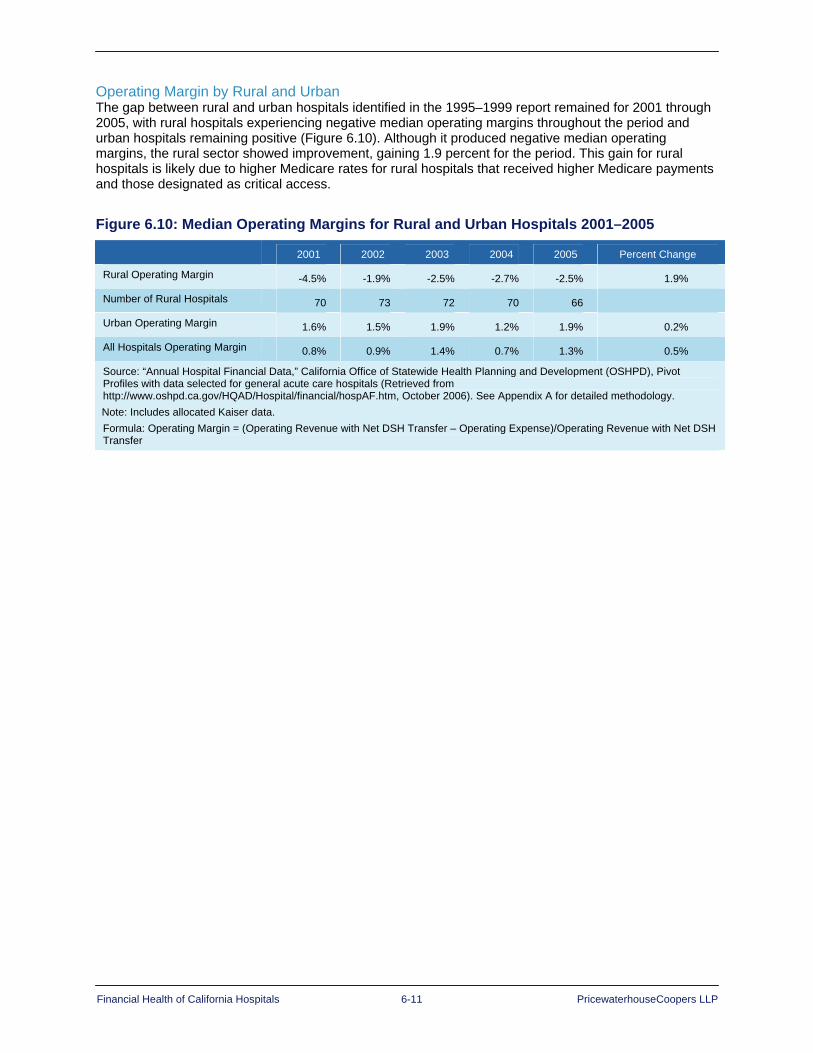
Financial Health of California Hospitals 6-11 PricewaterhouseCoopers LLP
Operating Margin by Rural and Urban The gap between rural and urban hospitals identified in the 1995–1999 report remained for 2001 through 2005, with rural hospitals experiencing negative median operating margins throughout the period and urban hospitals remaining positive (Figure 6.10). Although it produced negative median operating margins, the rural sector showed improvement, gaining 1.9 percent for the period. This gain for rural hospitals is likely due to higher Medicare rates for rural hospitals that received higher Medicare payments and those designated as critical access.
Figure 6.10: Median Operating Margins for Rural and Urban Hospitals 2001–2005
2001 2002 2003 2004 2005 Percent Change
Rural Operating Margin -4.5% -1.9% -2.5% -2.7% -2.5% 1.9%
Number of Rural Hospitals 70 73 72 70 66
Urban Operating Margin 1.6% 1.5% 1.9% 1.2% 1.9% 0.2%
All Hospitals Operating Margin 0.8% 0.9% 1.4% 0.7% 1.3% 0.5%
Source: “Annual Hospital Financial Data,” California Office of Statewide Health Planning and Development (OSHPD), Pivot Profiles with data selected for general acute care hospitals (Retrieved from http://www.oshpd.ca.gov/HQAD/Hospital/financial/hospAF.htm, October 2006). See Appendix A for detailed methodology. Note: Includes allocated Kaiser data. Formula: Operating Margin = (Operating Revenue with Net DSH Transfer – Operating Expense)/Operating Revenue with Net DSH Transfer
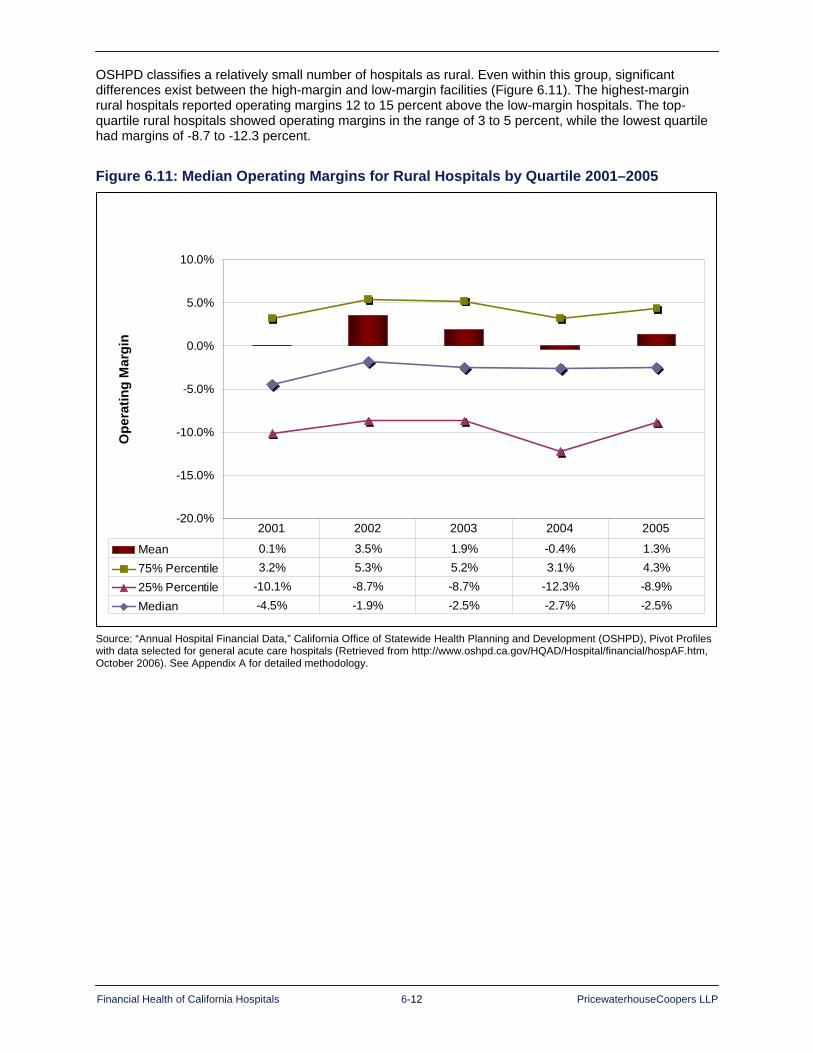
Financial Health of California Hospitals 6-12 PricewaterhouseCoopers LLP
OSHPD classifies a relatively small number of hospitals as rural. Even within this group, significant differences exist between the high-margin and low-margin facilities (Figure 6.11). The highest-margin rural hospitals reported operating margins 12 to 15 percent above the low-margin hospitals. The top-quartile rural hospitals showed operating margins in the range of 3 to 5 percent, while the lowest quartile had margins of -8.7 to -12.3 percent.
Figure 6.11: Median Operating Margins for Rural Hospitals by Quartile 2001–2005
Operating Margin of Rural Hospitals 2001-2005
-20.0%
-15.0%
-10.0%
-5.0%
0.0%
5.0%
10.0%
Mean 0.1% 3.5% 1.9% -0.4% 1.3%75% Percentile 3.2% 5.3% 5.2% 3.1% 4.3%25% Percentile -10.1% -8.7% -8.7% -12.3% -8.9%Median -4.5% -1.9% -2.5% -2.7% -2.5%
2001 2002 2003 2004 2005
Ope
ratin
g M
argi
n
Operating Margin of Rural Hospitals 2001-2005
-20.0%
-15.0%
-10.0%
-5.0%
0.0%
5.0%
10.0%
Mean 0.1% 3.5% 1.9% -0.4% 1.3%75% Percentile 3.2% 5.3% 5.2% 3.1% 4.3%25% Percentile -10.1% -8.7% -8.7% -12.3% -8.9%Median -4.5% -1.9% -2.5% -2.7% -2.5%
2001 2002 2003 2004 2005
Ope
ratin
g M
argi
n
Source: “Annual Hospital Financial Data,” California Office of Statewide Health Planning and Development (OSHPD), Pivot Profiles with data selected for general acute care hospitals (Retrieved from http://www.oshpd.ca.gov/HQAD/Hospital/financial/hospAF.htm, October 2006). See Appendix A for detailed methodology.

Financial Health of California Hospitals 6-13 PricewaterhouseCoopers LLP
Operating and Total Margin by DSH Status Operating and total margin metrics for hospitals that receive Medi-Cal SB 855 Disproportionate Share Hospital (DSH) funding must be interpreted cautiously because of the method of classification of the dollars in the OSHPD Selected Annual Financial Data. SB 855 gross revenue is reported as a component of net revenue. While this is appropriate for the private hospitals that receive DSH funding, the revenue for the publicly operated hospitals must be adjusted for the DSH transfer back to governmental agencies. In addition, some DSH hospitals receive supplemental payments under other state administered programs. These programs, such as SB 1255 and the medical education program, are not reported separately, but are netted from the reported Medi-Cal contractual allowances. Finally, public county and district hospitals that receive a local general fund appropriation to support operations report those funds as nonoperating rather than operating revenue. Those dollars are not counted, therefore, in the calculation of operating margin, but are included in the calculation of total margin.
Hospitals receiving Medi-Cal SB 855 DSH funding exhibited negative median operating margins across the entire five-year period of the study (Figure 6.12). The negative margins were lower than those reported for the 1995–1999 study period. The 1999 median operating margin reported for DSH hospitals was -1.95 percent, while the 2005 median was -3.0 percent. However, this represents an improved median operating margin for DSH-funded hospitals from 2001 to 2005. In contrast, the Non-DSH median operating margin was positive at 3.0 percent for 2005.
Figure 6.12: Median Operating Margins for DSH and Non-DSH Hospitals 2001–2005 2001 2002 2003 2004 2005 Percent Change
DSH -4.5% -4.5% -4.3% -6.7% -3.0% 1.4%
Non-DSH 2.6% 3.3% 3.6% 2.5% 3.0% 0.4%
All Hospitals 0.8% 0.9% 1.4% 0.7% 1.3% 0.5%
Source: “Annual Hospital Financial Data,” California Office of Statewide Health Planning and Development (OSHPD), Pivot Profiles with data selected for general acute care hospitals (Retrieved from http://www.oshpd.ca.gov/HQAD/Hospital/financial/hospAF.htm, October 2006). See Appendix A for detailed methodology. Note: Includes allocated Kaiser data. Formula: Operating Margin = (Operating Revenue with Net DSH Transfer – Operating Expense)/Operating Revenue with Net DSH Transfer

Financial Health of California Hospitals 6-14 PricewaterhouseCoopers LLP
Focusing only on the DSH hospitals, Figure 6.13 shows the operating margins of DSH hospitals by quartile. All quartiles exhibited declining operating margins over the period. The top-quartile hospitals (75th percentile) had slightly positive margins until 2005. The bottom-quartile margins were 12 to 17 percentage points lower than the top quartile.
Figure 6.13: Median Operating Margins for DSH Hospitals by Quartile 2001–2005
-20.0%
-15.0%
-10.0%
-5.0%
0.0%
5.0%
10.0%
Mean -6.5% -6.2% -6.8% -9.2% -6.8%75th Percentile 2.9% 1.4% 1.2% -0.8% 1.8%25th Percentile -14.0% -16.2% -15.1% -16.5% -10.1%Median -4.5% -4.5% -4.3% -6.7% -3.0%
2001 2002 2003 2004 2005
Ope
ratin
g M
argi
n
-20.0%
-15.0%
-10.0%
-5.0%
0.0%
5.0%
10.0%
-20.0%
-15.0%
-10.0%
-5.0%
0.0%
5.0%
10.0%
Mean -6.5% -6.2% -6.8% -9.2% -6.8%75th Percentile 2.9% 1.4% 1.2% -0.8% 1.8%25th Percentile -14.0% -16.2% -15.1% -16.5% -10.1%Median -4.5% -4.5% -4.3% -6.7% -3.0%
2001 2002 2003 2004 2005
Ope
ratin
g M
argi
n
Compound Annual Growth Rate Mean Top Quartile
(75 Percent) Bottom Quartile
(25 Percent) Median
CAGR 1.1% -6.9% -7.9% -9.3%
Source: “Annual Hospital Financial Data,” California Office of Statewide Health Planning and Development (OSHPD), Pivot Profiles with data selected for general acute care hospitals (Retrieved from http://www.oshpd.ca.gov/HQAD/Hospital/financial/hospAF.htm, October 2006). See Appendix A for detailed methodology. Note: Includes DSH funding in operating margin. Public DSH hospital margins are calculated after DSH transfer.

Financial Health of California Hospitals 6-15 PricewaterhouseCoopers LLP
In comparison to operating margin, Figure 6.14 shows the total margins of DSH-funded hospitals by quartile. This measure incorporates nonoperating revenue — most importantly, general revenue allocations for county and district hospitals. With the addition of the nonoperating revenue, the total margins become positive, although they continue to decline over the five-year period. The top-quartile hospitals (75th percentile) maintain positive total margins for the five-year period. The bottom-quartile (25th percentile) margins remain negative but improve by 8 to 9 percentage points relative to the operating margin.
Figure 6.14: Total Margins of DSH Hospitals by Quartile 2001–2005
-20.0%
-15.0%
-10.0%
-5.0%
0.0%
5.0%
10.0%
Mean 4.1% 3.6% 2.1% -1.1% 1.7%
75% Percentile 7.0% 5.4% 4.4% 3.3% 4.7%
25% Percentile -5.5% -7.3% -5.6% -7.6% -2.4%
Median 0.9% -0.1% 0.4% -1.2% 1.3%
2001 2002 2003 2004 2005
Tota
l Mar
gin
-20.0%
-15.0%
-10.0%
-5.0%
0.0%
5.0%
10.0%
Mean 4.1% 3.6% 2.1% -1.1% 1.7%
75% Percentile 7.0% 5.4% 4.4% 3.3% 4.7%
25% Percentile -5.5% -7.3% -5.6% -7.6% -2.4%
Median 0.9% -0.1% 0.4% -1.2% 1.3%
2001 2002 2003 2004 2005-20.0%
-15.0%
-10.0%
-5.0%
0.0%
5.0%
10.0%
Mean 4.1% 3.6% 2.1% -1.1% 1.7%
75% Percentile 7.0%
-20.0%
-15.0%
-10.0%
-5.0%
0.0%
5.0%
10.0%
Mean 4.1% 3.6% 2.1% -1.1% 1.7%
75% Percentile 7.0% 5.4% 4.4% 3.3% 4.7%
25% Percentile -5.5% -7.3% -5.6% -7.6% -2.4%
Median 0.9% -0.1% 0.4% -1.2% 1.3%
2001 2002 2003 2004 2005
Tota
l Mar
gin
Compound Annual Growth Rate Mean Top Quartile
(75 Percent) Bottom Quartile
(25 Percent) Median
CAGR -20.1% -9.4% -18.3% -98.8%
Source: “Annual Hospital Financial Data,” California Office of Statewide Health Planning and Development (OSHPD), Pivot Profiles with data selected for general acute care hospitals (Retrieved from http://www.oshpd.ca.gov/HQAD/Hospital/financial/hospAF.htm, October 2006). See Appendix A for detailed methodology. Note: Includes DSH funding in operating margin and includes county general fund in nonoperating revenue.

Financial Health of California Hospitals 6-16 PricewaterhouseCoopers LLP
Operating Margin by Type of Control and DSH Status The performance of large city/county public DSH facilities (Figure 6.15) drove the overall performance of DSH hospitals. The city/county DSH hospitals reported operating losses starting at -32 percent and improving only to -23 percent. All district hospitals had negative median operating margins during the study period, but those that were DSH-eligible had operating margins approximately 3 percent lower. For-profit hospitals moved from positive operating margins in 2001 and 2003 to negative median operating margins in 2004 and 2005. Again, the DSH-eligible hospitals had lower median operating margins than the non-DSH hospitals. Among nonprofit hospitals, the DSH-funded sector had negative medians each year except 2005, while the non-DSH private hospitals had positive median margins. The lowest-margin sector, city/county and DSH-funded, showed the greatest improvement in median operating margins at 9 percent. For-profit, non-DSH hospitals showed the greatest decrease in operating margin (5.4 percent). For reference, Figure 6.16 indicates the number of DSH and non-DSH hospitals in each category.
Figure 6.15: Median Operating Margins by Type of Control and DSH Status 2001–2005 2001 2002 2003 2004 2005 Percent Change
City/County DSH -32.6% -27.1% -24.5% -25.1% -23.6% 9%
Non-DSH N/A N/A N/A N/A -7.8% N/A
District DSH -7.7% -6.8% -7.2% -7.7% -5.8% 1.9%
Non-DSH -3.6% -2.9% -2.8% -1.7% -2.7% 0.8%
For-Profit DSH 0.9% 0.3% 0.9% -6.4% -1.4% -2.3%
Non-DSH 5.3% 3.9% 5.3% -1.0% -0.1% -5.4%
Nonprofit DSH -3.4% -2.5% -3.4% -3.7% 0.2% 3.6%
Non-DSH 2.9% 3.9% 4.3% 3.8% 5.1% 2.2%
Source: “Annual Hospital Financial Data,” California Office of Statewide Health Planning and Development (OSHPD), Pivot Profiles with data selected for general acute care hospitals (Retrieved from http://www.oshpd.ca.gov/HQAD/Hospital/financial/hospAF.htm, October 2006). See Appendix A for detailed methodology. Note: Includes allocated Kaiser data.
Formula: Operating Margin = (Operating Revenue with Net DSH Transfer – Operating Expense)/Operating Revenue with Net DSH Transfer
Figure 6.16: Count of Hospitals by Type of Control and DSH Status 2001–2005 DSH 2001 2002 2003 2004 2005 CAGR
City/County DSH 21 21 21 19 18 -3.78%
Non-DSH N/A N/A N/A N/A 1 N/A
District DSH 16 17 15 13 14 -3.28%
Non-DSH 28 28 31 32 32 3.39%
For-Profit DSH 32 38 41 34 29 -2.43%
Non-DSH 62 58 52 52 55 -2.95%
Nonprofit DSH 48 47 48 46 41 -3.86%
Non-DSH 176 172 170 167 165 -1.60%
All Hospitals DSH 117 123 125 112 102 -3.37%
Non-DSH 383 381 378 363 355 -1.88%

Financial Health of California Hospitals 6-17 PricewaterhouseCoopers LLP
Figure 6.17, compares operating and total margin for 2005 and illustrates the importance of general revenue funds for city/county hospitals. The general funds, which represent on average 85 percent of those hospitals’ nonoperating revenue, moves these hospitals from a negative 23 percent operating margin to a positive total margin. District hospitals also move from a negative operating margin to a positive total margin. Nonprofit DSH hospitals report a small positive operating margin and a slightly higher positive total margin. Only for-profit DSH hospitals do not achieve positive total margin.
Figure 6.17: Operating and Total Margin of DSH Hospitals by Type of Control 2005
-25.0%
-20.0%
-15.0%
-10.0%
-5.0%
0.0%
5.0%
Median Operating Margin -23.6% -5.8% -1.4% 0.2% 2.4%
Median Total Margin 2.4% 3.7% -0.3% 1.4% 2.7%
CITY/COUNTY DISTRICT FOR-PROFIT ALL NONPROFIT NONPROFIT-DPH
Med
ian
Mar
gin
-25.0%
-20.0%
-15.0%
-10.0%
-5.0%
0.0%
5.0%
Median Operating Margin -23.6% -5.8% -1.4% 0.2% 2.4%
Median Total Margin 2.4% 3.7% -0.3% 1.4% 2.7%
CITY/COUNTY DISTRICT FOR-PROFIT ALL NONPROFIT NONPROFIT-DPH
Med
ian
Mar
gin
Source: “Annual Hospital Financial Data,” California Office of Statewide Health Planning and Development (OSHPD), Pivot Profiles with data selected for general acute care hospitals (Retrieved from http://www.oshpd.ca.gov/HQAD/Hospital/financial/hospAF.htm, October 2006). See Appendix A for detailed methodology. Notes: Nonprofit designated public hospitals (DPHs) represent the three University of California DSH medical centers. Median total margin includes county general revenue appropriations.
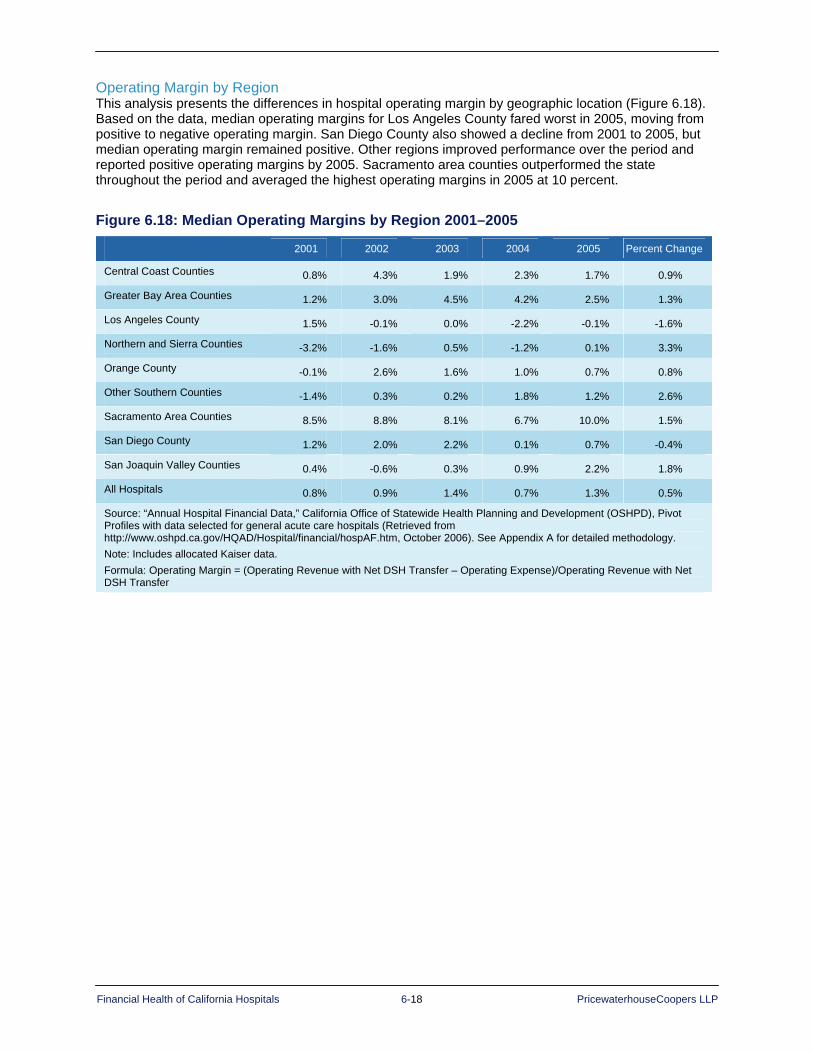
Financial Health of California Hospitals 6-18 PricewaterhouseCoopers LLP
Operating Margin by Region This analysis presents the differences in hospital operating margin by geographic location (Figure 6.18). Based on the data, median operating margins for Los Angeles County fared worst in 2005, moving from positive to negative operating margin. San Diego County also showed a decline from 2001 to 2005, but median operating margin remained positive. Other regions improved performance over the period and reported positive operating margins by 2005. Sacramento area counties outperformed the state throughout the period and averaged the highest operating margins in 2005 at 10 percent.
Figure 6.18: Median Operating Margins by Region 2001–2005
2001 2002 2003 2004 2005 Percent Change
Central Coast Counties 0.8% 4.3% 1.9% 2.3% 1.7% 0.9%
Greater Bay Area Counties 1.2% 3.0% 4.5% 4.2% 2.5% 1.3%
Los Angeles County 1.5% -0.1% 0.0% -2.2% -0.1% -1.6%
Northern and Sierra Counties -3.2% -1.6% 0.5% -1.2% 0.1% 3.3%
Orange County -0.1% 2.6% 1.6% 1.0% 0.7% 0.8%
Other Southern Counties -1.4% 0.3% 0.2% 1.8% 1.2% 2.6%
Sacramento Area Counties 8.5% 8.8% 8.1% 6.7% 10.0% 1.5%
San Diego County 1.2% 2.0% 2.2% 0.1% 0.7% -0.4%
San Joaquin Valley Counties 0.4% -0.6% 0.3% 0.9% 2.2% 1.8%
All Hospitals 0.8% 0.9% 1.4% 0.7% 1.3% 0.5%
Source: “Annual Hospital Financial Data,” California Office of Statewide Health Planning and Development (OSHPD), Pivot Profiles with data selected for general acute care hospitals (Retrieved from http://www.oshpd.ca.gov/HQAD/Hospital/financial/hospAF.htm, October 2006). See Appendix A for detailed methodology. Note: Includes allocated Kaiser data. Formula: Operating Margin = (Operating Revenue with Net DSH Transfer – Operating Expense)/Operating Revenue with Net DSH Transfer

Financial Health of California Hospitals 6-19 PricewaterhouseCoopers LLP
Operating Margin by System and Nonsystem The nearly two-thirds of hospitals that were part of a system performed better than hospitals that were not affiliated with a system, with positive median operating margins over the five-year period (Figure 6.19). The top five systems performed at nearly twice the system median, with a median operating margin of 6.1 percent in 2005, although this was down from 9.3 percent in 2001, a -3.3 percent change. In comparison, the operating margins of nonsystem hospitals were negative for the entire period.
Figure 6.19: Median Operating Margins for System and Nonsystem Hospitals 2001–2005
2001 2002 2003 2004 2005 Percent Change
Part of System 4.2% 3.3% 3.4% 2.3% 3.5% -0.7%
Not Part of System -3.8% -2.8% -3.6% -2.7% -2.4% 1.4%
Top Five Systems 9.3% 8.6% 8.1% 3.1% 6.1% -3.3%
All Hospitals 0.8% 0.9% 1.4% 0.7% 1.3% 0.5%
Source: “Annual Hospital Financial Data,” California Office of Statewide Health Planning and Development (OSHPD), Pivot Profiles with data selected for general acute care hospitals (Retrieved from http://www.oshpd.ca.gov/HQAD/Hospital/financial/hospAF.htm, October 2006). See Appendix A for detailed methodology. Notes: Includes Kaiser data. Top Five Systems = comprises hospital data as reported to OSHPD for California’s major health systems (Sutter Health, Catholic Healthcare West, Kaiser Permanente, Tenet Healthcare Corporation, University of California affiliates), as measured by both number of hospitals in the systems and number of patient days. Formula: Operating Margin = (Operating Revenue with Net DSH Transfer – Operating Expense)/Operating Revenue with Net DSH Transfer
Financial Health of California Hospitals 6-20 PricewaterhouseCoopers LLP
Operating Margin by Quartiles (High- and Low-Margin Hospitals) The following section compares operating margin by quartiles and show that system membership, type of ownership and geographic location are associated with profitability. The next series of graphs presents a summary of the distribution of hospitals by operating margin quartile and some of the characteristics summarized in the median and quartile tables from Figure 6.8 to Figure 6.19. The graphs incorporate the number of hospitals with the relevant characteristic and provide additional information for interpreting the importance of these characteristics as an indicator of operating margin performance. All of the distributions are relative to the statewide operating quartile distributions presented in Figure 6.2 and graphed in Figure 6.3. The number of hospitals in each quartile decreases from approximately 96 (383 total) in 2001 to 89 (355 total) in 2005.
System and Nonsystem Hospitals Hospitals in systems made up approximately two-thirds of the general acute care hospitals analyzed for 2001–2005.
System Hospitals: The majority of hospitals in systems reported operating margins above the median, but the percentage declined from 62.6 percent to 58.4 percent, a decrease from 147 hospitals to 137 hospitals. The proportion in the top quartile (4th quartile in Figure 6.20) dropped from 36.1 percent (86 hospitals) in 2001 to 28.5 percent (63 hospitals) in 2005. Conversely, the number of system hospitals in the bottom quartile (1st quartile) grew from 16 percent (38 hospitals) in 2001 to 18.6 percent (41 hospitals) in 2005.
Nonsystem Hospitals: Nonsystem hospitals showed opposite trends. The majority of hospitals not affiliated with a system reported operating margins below the statewide average, but this declined from more than 70 percent of hospitals in 2001 to 64.2 percent in 2005. Most nonsystem hospitals fell in the bottom quartile (1st quartile), with 40.3 percent in 2001 (58 hospitals) decreasing to 35.8 percent in 2005 (48 hospitals). A small number of nonsystem hospitals performed in the top quartile (4th quartile), increasing from 6.3 percent in 2001 (9 hospitals) to 11.2 percent in 2005 (15 hospitals).

Financial Health of California Hospitals 6-21 PricewaterhouseCoopers LLP
Figure 6.20: Distribution of Hospitals by Quartile: Operating Margins of System and Nonsystem Hospitals 2001–2005
0.0%
5.0%
10.0%
15.0%
20.0%
25.0%
30.0%
35.0%
40.0%
45.0%
2001 16.0% 21.4% 26.5% 36.1% 40.3% 31.3% 22.2% 6.3%2002 16.0% 23.6% 25.3% 35.0% 39.9% 28.0% 23.8% 8.4%2003 17.2% 22.3% 27.0% 33.5% 37.5% 29.9% 21.5% 11.1%2004 18.4% 22.6% 24.0% 35.0% 34.9% 28.8% 26.0% 10.3%2005 18.6% 23.1% 29.9% 28.5% 35.8% 28.4% 24.6% 11.2%
1st Quartile 2nd Quartile 3rd Quartile 4th Quartile 1st Quartile 2nd Quartile 3rd Quartile 4th QuartileSystem Nonsystem
Perc
ent o
f Hos
pita
ls
0.0%
5.0%
10.0%
15.0%
20.0%
25.0%
30.0%
35.0%
40.0%
45.0%
0.0%
5.0%
10.0%
15.0%
20.0%
25.0%
30.0%
35.0%
40.0%
45.0%
2001 16.0% 21.4% 26.5% 36.1% 40.3% 31.3% 22.2% 6.3%2002 16.0% 23.6% 25.3% 35.0% 39.9% 28.0% 23.8% 8.4%2003 17.2% 22.3% 27.0% 33.5% 37.5% 29.9% 21.5% 11.1%2004 18.4% 22.6% 24.0% 35.0% 34.9% 28.8% 26.0% 10.3%2005 18.6% 23.1% 29.9% 28.5% 35.8% 28.4% 24.6% 11.2%
1st Quartile 2nd Quartile 3rd Quartile 4th Quartile 1st Quartile 2nd Quartile 3rd Quartile 4th QuartileSystem Nonsystem
Perc
ent o
f Hos
pita
ls
Compound Annual Growth Rate
System Nonsystem
1st Quartile 2nd Quartile 3rd Quartile 4th Quartile 1st Quartile 2nd Quartile 3rd Quartile 4th Quartile
CAGR 3.8% 1.9% 3.1% -5.8% -2.9% -2.4% 2.6% 15.7%
Number of System Hospitals
2001 2002 2003 2004 2005
System 238 237 233 217 221
Nonsystem 144 143 144 146 134
Total Hospitals 383 381 378 363 355
Source: “Annual Hospital Financial Data,” California Office of Statewide Health Planning and Development (OSHPD), Pivot Profiles with data selected for general acute care hospitals (Retrieved from http://www.oshpd.ca.gov/HQAD/Hospital/financial/hospAF.htm, October 2006). See Appendix A for detailed methodology.
(Bottom) (Top) (Top) (Bottom)

Financial Health of California Hospitals 6-22 PricewaterhouseCoopers LLP
Hospitals by Ownership/Type of Control In 2005, 206 nonprofit hospitals composed 58 percent of general acute care hospitals; 85 for-profit hospitals made up 24 percent of the total. The 19 city/county hospitals composed 12.7 percent of the facilities, and the 45 district hospitals composed 5.3 percent.
City/County and District Hospitals City/County Hospitals: Nearly all — 85 to 95 percent — of city and county hospitals had
operating margins below the statewide median (Figure 6.21). This position improved slightly over the period. The number of city/county hospitals in the bottom quartile (1st quartile) decreased from 71.4 percent in 2001 (15 hospitals) to 68.4 percent in 2005 (13 hospitals). Only one city/county hospital reported an operating margin in the top quartile in 2001 and again in 2005.
District Hospitals: Similarly, 75 to 85 percent of district hospitals reported operating margins below the statewide median. More district hospitals fell into the bottom quartile (1st quartile), going from 41.9 percent in 2001 (18 hospitals) to 44.4 percent in 2005 (20 hospitals). At the same time, district hospitals showed a small improvement above the median operating margin. Seven district hospitals were above the median in 2001; and 11 were above the median in 2005, including four hospitals in the top operating-margin quartile in 2003 and 2004.

Financial Health of California Hospitals 6-23 PricewaterhouseCoopers LLP
Figure 6.21: Distribution of Hospitals by Quartile: Operating Margins of City/County and District Hospitals 2001–2005
Perc
ent o
f Hos
pita
ls
0.0%
10.0%
20.0%
30.0%
40.0%
50.0%
60.0%
70.0%
80.0%
90.0%
2001 71.4% 23.8% 0.0% 4.8% 41.9% 41.9% 16.3% 0.0%2002 81.0% 19.0% 0.0% 0.0% 40.9% 38.6% 13.6% 6.8%2003 85.7% 14.3% 0.0% 0.0% 33.3% 42.2% 15.6% 8.9%2004 78.9% 15.8% 5.3% 0.0% 31.8% 38.6% 20.5% 9.1%2005 68.4% 15.8% 10.5% 5.3% 44.4% 31.1% 20.0% 4.4%
1st Quartile 2nd Quartile 3rd Quartile 4th Quartile 1st Quartile 2nd Quartile 3rd Quartile 4th QuartileCITY/COUNTY DISTRICT
Compound Annual Growth Rate City/County District
1st Quartile 2nd Quartile 3rd Quartile 4th Quartile 1st Quartile 2nd Quartile 3rd Quartile 4th Quartile
CAGR -1.1% -9.8% 585.7% 2.5% 1.5% -7.2% 5.3% 561.2%
Source: “Annual Hospital Financial Data,” California Office of Statewide Health Planning and Development (OSHPD), Pivot Profiles with data selected for general acute care hospitals (Retrieved from http://www.oshpd.ca.gov/HQAD/Hospital/financial/hospAF.htm, October 2006). See Appendix A for detailed methodology.
Number of City/County and District Hospitals
2001 2002 2003 2004 2005
City/County 21 21 21 19 19
District 43 44 45 44 45
Total Hospitals 383 381 378 363 355
(Bottom) (Top) (Top) (Bottom)

Financial Health of California Hospitals 6-24 PricewaterhouseCoopers LLP
For-Profit and Non Profit Hospitals For-Profit Hospitals: For-profit hospitals experienced negative operating margin trends. The
proportion of for-profit hospitals with operating margins below the statewide median increased from 41.4 percent in 2001 to 62.4 percent in 2005 (Figure 6.22). The number in the bottom quartile (1st quartile) grew from 19.1 percent in 2001 (18 hospitals) to 31.8 percent in 2005 (27 hospitals). The number of for-profit hospitals in the top quartile dropped by half. For the top quartile (4th quartile), the proportion dropped from 42.6 percent in 2001 (40 hospitals) to 22.4 percent in 2005 (19 hospitals).
Nonprofit Hospitals: Nonprofit hospitals showed a positive trend. The proportion of nonprofit hospitals with operating margins above the statewide median increased from 56.7 percent to 63.5 percent. The number in the top quartile (4th quartile) grew from 24.1 percent in 2001 (54 hospitals) to 27.2 percent in 2005 (56 hospitals). At the same time, the number in the bottom quartile (1st quartile) fell from 20.1 percent in 2001 (45 hospitals) to 14.1 percent in 2005 (29 hospitals).
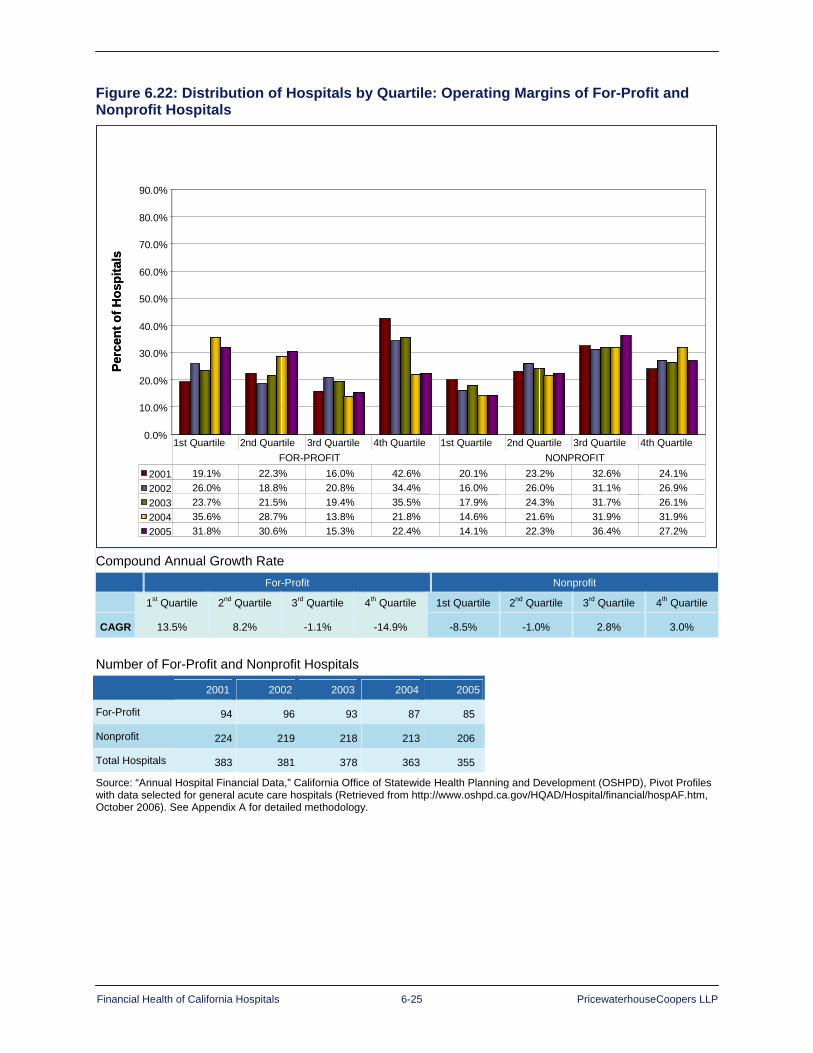
Financial Health of California Hospitals 6-25 PricewaterhouseCoopers LLP
Figure 6.22: Distribution of Hospitals by Quartile: Operating Margins of For-Profit and Nonprofit Hospitals
0.0%
10.0%
20.0%
30.0%
40.0%
50.0%
60.0%
70.0%
80.0%
90.0%
2001 19.1% 22.3% 16.0% 42.6% 20.1% 23.2% 32.6% 24.1%2002 26.0% 18.8% 20.8% 34.4% 16.0% 26.0% 31.1% 26.9%2003 23.7% 21.5% 19.4% 35.5% 17.9% 24.3% 31.7% 26.1%2004 35.6% 28.7% 13.8% 21.8% 14.6% 21.6% 31.9% 31.9%2005 31.8% 30.6% 15.3% 22.4% 14.1% 22.3% 36.4% 27.2%
1st Quartile 2nd Quartile 3rd Quartile 4th Quartile 1st Quartile 2nd Quartile 3rd Quartile 4th QuartileFOR-PROFIT NONPROFIT
Perc
ent o
f Hos
pita
ls
0.0%
10.0%
20.0%
30.0%
40.0%
50.0%
60.0%
70.0%
80.0%
90.0%
2001 19.1% 22.3% 16.0% 42.6% 20.1% 23.2% 32.6% 24.1%2002 26.0% 18.8% 20.8% 34.4% 16.0% 26.0% 31.1% 26.9%2003 23.7% 21.5% 19.4% 35.5% 17.9% 24.3% 31.7% 26.1%2004 35.6% 28.7% 13.8% 21.8% 14.6% 21.6% 31.9% 31.9%2005 31.8% 30.6% 15.3% 22.4% 14.1% 22.3% 36.4% 27.2%
1st Quartile 2nd Quartile 3rd Quartile 4th Quartile 1st Quartile 2nd Quartile 3rd Quartile 4th QuartileFOR-PROFIT NONPROFIT
Perc
ent o
f Hos
pita
ls
Compound Annual Growth Rate
For-Profit Nonprofit
1st Quartile 2nd Quartile 3rd Quartile 4th Quartile 1st Quartile 2nd Quartile 3rd Quartile 4th Quartile
CAGR 13.5% 8.2% -1.1% -14.9% -8.5% -1.0% 2.8% 3.0% Number of For-Profit and Nonprofit Hospitals
2001 2002 2003 2004 2005
For-Profit 94 96 93 87 85
Nonprofit 224 219 218 213 206
Total Hospitals 383 381 378 363 355
Source: “Annual Hospital Financial Data,” California Office of Statewide Health Planning and Development (OSHPD), Pivot Profiles with data selected for general acute care hospitals (Retrieved from http://www.oshpd.ca.gov/HQAD/Hospital/financial/hospAF.htm, October 2006). See Appendix A for detailed methodology.
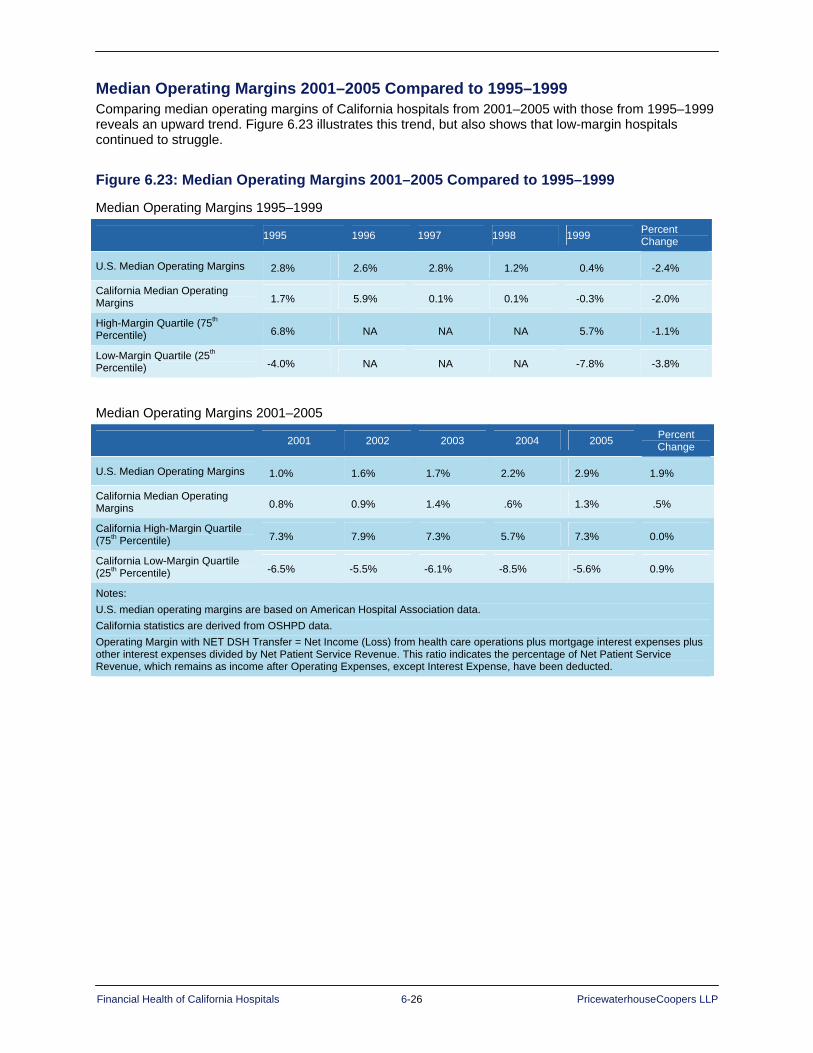
Financial Health of California Hospitals 6-26 PricewaterhouseCoopers LLP
Median Operating Margins 2001–2005 Compared to 1995–1999 Comparing median operating margins of California hospitals from 2001–2005 with those from 1995–1999 reveals an upward trend. Figure 6.23 illustrates this trend, but also shows that low-margin hospitals continued to struggle.
Figure 6.23: Median Operating Margins 2001–2005 Compared to 1995–1999
Median Operating Margins 1995–1999
1995 1996 1997 1998 1999 Percent Change
U.S. Median Operating Margins 2.8% 2.6% 2.8% 1.2% 0.4% -2.4%
California Median Operating Margins 1.7% 5.9% 0.1% 0.1% -0.3% -2.0%
High-Margin Quartile (75th Percentile) 6.8% NA NA NA 5.7% -1.1%
Low-Margin Quartile (25th Percentile) -4.0% NA NA NA -7.8% -3.8%
Median Operating Margins 2001–2005
2001 2002 2003 2004 2005 Percent Change
U.S. Median Operating Margins 1.0% 1.6% 1.7% 2.2% 2.9% 1.9%
California Median Operating Margins 0.8% 0.9% 1.4% .6% 1.3% .5%
California High-Margin Quartile (75th Percentile) 7.3% 7.9% 7.3% 5.7% 7.3% 0.0%
California Low-Margin Quartile (25th Percentile) -6.5% -5.5% -6.1% -8.5% -5.6% 0.9%
Notes: U.S. median operating margins are based on American Hospital Association data. California statistics are derived from OSHPD data. Operating Margin with NET DSH Transfer = Net Income (Loss) from health care operations plus mortgage interest expenses plus other interest expenses divided by Net Patient Service Revenue. This ratio indicates the percentage of Net Patient Service Revenue, which remains as income after Operating Expenses, except Interest Expense, have been deducted.

Financial Health of California Hospitals 6-27 PricewaterhouseCoopers LLP
Summary From 2001 through 2005, median operating margins for California hospitals remained at or near the break-even point. Trends continued to reflect a dichotomy between those hospitals falling into high- and low-margin quartiles. The average California hospital was operating profitably, but its margin was softening. The decline in profitability for low-quartile hospitals was accelerating. In 2004, 68.4 percent (238 of 348 California hospitals) earned less than the average operating margin versus 58 percent in 1999.
As in the 1995–1999 study, typology analysis for the 2001–2005 study revealed that size, type of ownership, system membership and geographic location influenced profitability. Overrepresented in the bottom quartile were the following hospitals:
Small (fewer than 150 beds)
District
City/county
Rural (although there are some exceptions)
Hospitals with a high percentage of Medi-Cal and indigent patients
Nonsystem
Located in inner city and near Los Angeles and other Southern counties (San Bernardino, Riverside and Imperial)
Hospitals more likely to fall in the top quartile were:
Medium-large and large (greater than 150 beds)
Urban
System
Have a high percentage of commercial payers
Located primarily in higher-income areas with urban markets
Located in Sacramento, Central Coast and Greater Bay Area counties
An insignificant share of the top quartile was represented by city/county, district and rural hospitals.
The performance of hospitals that are still operating at a loss and have low nonoperating revenues provides negative implications for their long-term viability.
In addition, when analyzing the data by region, Los Angeles County region reflected a negative median operating margin, with Northern and Sierra counties slightly above break-even and San Diego and Orange counties performing just under 1 percent. These counties also represent market areas that include safety net hospitals.
For currently struggling California hospitals, the potential impact of factors influencing the financial health of California hospitals raises significant issues regarding their future viability and ability to serve the community.

Financial Health of California Hospitals 7-1 PricewaterhouseCoopers LLP
Chapter 7: Revenue and Expense Trends
Key Findings Overall growth in expenses closely matched growth in net operating revenue from 2001–2005;
both grew at approximately 7.5 percent per year. The California median operating margin, therefore, was near the break-even point for the period (1.3 percent in 2005) but increased by 0.05 percent from 2001 to 2005. This was an improvement over the negative operating margin of 0.33 percent in 1999 and the 1.98 percent decrease from 1995 to 1999.
CMI-adjusted net operating expenses per adjusted patient day for reporting hospitals rose from $1,497 to $1,961 over the five-year period. Similarly, CMI-adjusted net operating revenue per adjusted patient day increased from $1,507 to $1,973 from 2001-2005. Each year provided a slim margin with exception of 2004, where the difference (operating margin) was -$12.
For top-quartile hospitals, the CMI-adjusted net operating expense per adjusted patient day was similar to the state median, ranging from $1,447 in 2001 to $2,073 in 2005. Hospitals in this high-margin quartile were able to gain more in CMI-adjusted net operating revenue per adjusted patient day than those in the median, reporting $1,712 to $2,351 over the same period.
For bottom-quartile hospitals, CMI-adjusted net operating expense per adjusted patient day for the five-year study period ranged from $1,623 in 2001 to $2,086 in 2005. In each of those years, this same cohort of providers were unable to realize net operating revenues per adjusted patient day higher than net operating revenues, with amounts ranging from $1,300 in 2001 to $1,747 in 2005. This group was able to approach break-even but still reported double-digit negative margins over the reporting period.
Median operating revenue per day increased with available bed size, with smaller hospitals (less than 150 beds) reporting 5 to 8 percent lower operating revenue than the statewide median; medium-to-large and large hospitals (more than 250 beds) yielded revenue 5-10 percent higher than the median.
Hospitals in the Greater Bay and Sacramento regions reported operating revenue ranging between 20 – 35 percent higher than the state median. Los Angeles County, with the greatest number of the state’s hospitals, overall, ranged 9 – 16 percent lower than the statewide median.
Median operating expenses per patient day increased with bed size, though the medium-to-large hospitals (those with 251-350 beds) reported the highest expenses, 7.4 percent above the state median in 2005. District hospitals reported expenses approximately 60 percent of the state median, while city/county hospitals reported the highest expenses – up to $2,400 per day or more than 40 percent above the state median.
Salaries and benefits were the fastest growing component of expenses for hospitals, with benefits increasing at a 16 percent compound annual growth rate.
In contrast, statewide growth in depreciation and interest expense over the five-year period was approximately 3 percent compounded annually. This reflects a relatively low investment in capital improvements when compared to growth of total expenses (8.5% CAGR).
Data show that hospitals responded to the mandated nurse-staffing ratios in 2004. Reported nursing hours per adjusted patient day increased by almost an hour per adjusted patient day in 2004 and 2005. The demand was initially met by an increase of 6 percent in 2004 of nurse registry hours.
After reviewing the revenue, expense and utilization dynamics driving operating margins, this chapter presents revenue and expense trends by hospital typology and by revenue and expense category. Additionally, this chapter summarizes the most significant revenue and expense findings of this study.
Financial Health of California Hospitals 7-2 PricewaterhouseCoopers LLP
California Hospital Revenue and Expense Trends Figure 7.1 contains key indicators of operating margin performance, but interpretation requires an understanding of hospital management and reporting statistics. For example, operating revenue includes inpatient and outpatient revenue. Inpatient days and discharges have standardized methods to adjust to account for outpatient activity. There are inpatient measures reported as case mix index (CMI) that use standardized adjusters, such as inpatient diagnosis related group (DRG) case mix, but there are no comparable standardized outpatient adjusters. Adjustments to total operating revenue and expense by severity are suggestive but not conclusive. Despite these limitations, combining and contrasting these statistics can yield valuable conclusions about hospital profitability.163
Statistics also can indicate indirectly the impact of hospital service-line offerings. Although the case mix severity index plays a role in patient revenue, the type of services a hospital offers — particularly surgical services — and new technology the hospital applies to its services and procedures also affect revenue.
Service offerings, technology and supplies, as well as expenditures on salaries and benefits, factor into expense trends driving operating margin. Figure 7.1 depicts adjusted revenue and expense trends per adjusted patient day, as well as per discharge. For this chart, days and discharge figures are adjusted to create a factor for outpatient revenue and then adjusted for total case mix index (CMI).
Data presented in Figure 7.1 indicate that net revenue per adjusted patient day closely tracked expenses from 2001 to 2005. Total operating revenue trended at a compound annual growth rate (CAGR) of 7 percent, the same annual rate as operating expenses. Although the margin remained narrow, operating revenue exceeded expenses by a small margin each year except 2004. The average difference between revenue and expense per day and per discharge eroded in 2004 to negative $12 and negative $124 per discharge, but rebounded in 2005. The annual growth rates of expense per day (7 percent) and per discharge (6.9 percent) were above the rate of medical inflation for the period, as measured by the CMS Implicit Medical Price Deflator, which averaged 3.8 percent over the period and ranged from 1.038 in 2001 to 1.205 in 2005. However, California’s increase closely matched the annual increase in hospital expenses reported by CMS for National Health Expenditures.
The net operating revenue statistics in Figure 7.1 are adjusted by removing Disproportionate Share Hospital (DSH) transfers back to local government. These primarily affect publicly owned hospitals that return revenue to sponsoring government agencies.

Financial Health of California Hospitals 7-3 PricewaterhouseCoopers LLP
Figure 7.1: California Hospital Net Revenue, Expense and Utilization Trends 2001–2005 2001 2002 2003 2004 2005 CAGR
Total Operating Revenue with Net DSH/Adjusted Patient Day (CMI Adjusted) $1,507 $1,622 $1,735 $1,833 $1,973 7.0%
Total Operating Expense/Adjusted Patient Day (CMI Adjusted) $1,497 $1,597 $1,710 $1,846 $1,961 7.0%
Difference $10 $26 $25 -$12 $13
Total Operating Revenue with Net DSH/Adjusted Discharge (CMI Adjusted) $7,801 $8,463 $9,039 $9,519 $10,161 6.8%
Total Operating Expense/Adjusted Discharge (CMI Adjusted) $7,791 $8,376 $8,958 $9,642 $10,156 6.9%
Difference $11 $87 $81 -$124 $5
Acute ALOS (CMI Adjusted) 4.02 4.02 4.05 4.06 4.04 0.2%
Total ALOS (Not CMI Adjusted) 5.50 5.54 5.53 5.53 5.46 -0.2%
Total CMI 1.12 1.13 1.14 1.14 1.15 0.6%
Percent Acute Patient Days of Total Adjusted Patient Days 74.1% 74.8% 75.2% 76.0% 76.8% 0.9%
Percent Acute Discharges of Total Adjusted Discharges 91.7% 92.1% 91.9% 92.2% 92.5% 0.2%
Percent Gross Outpatient Revenue of Gross Patient Revenue 25.9% 26.1% 26.3% 27.0% 27.7% 1.8%
CMS Implicit Medical Price Deflator 1.038 1.078 1.118 1.163 1.205 3.8%
- Source: “Annual Hospital Financial Data,” California Office of Statewide Health Planning and Development (OSHPD), Pivot Profiles with data selected for general acute care hospitals (Retrieved from http://www.oshpd.ca.gov/HQAD/Hospital/financial/hospAF.htm, October 2006). See Appendix A for detailed methodology.
Notes: Excludes Kaiser data. Operating revenues include net patient revenues and other operating revenues. Net patient revenues were adjusted by removing DSH transfer payments for county, district and University of California hospitals (see Appendix A). Days and discharges in the revenue and expense calculations were adjusted for outpatients (Adjustment Factor = Gross Patient Revenue/Gross Inpatient Revenue). Acute ALOS includes only acute inpatient discharges and days, and is CMI-adjusted. Hospitals that do not provide CMI or income statement information are excluded from the analysis. For example, since Kaiser hospitals (which fall into the top quartile for 2001 and 2005) do not report income statement information broken out by inpatient and outpatient categories, days and discharges cannot be adjusted and, therefore, are not included in the table. Discharges are used to calculate weighted averages. Percentages may not total exactly 100 due to rounding.

Financial Health of California Hospitals 7-4 PricewaterhouseCoopers LLP
Figure 7.2: California Revenue and Expenses per Adjusted Patient Day 2001–2005
$1,500
$1,600
$1,700
$1,800
$1,900
$2,000
$2,100
$2,200
$2,300
$2,400
Net Operating Revenue perAdjusted Patient Day
$1,586 $1,729 $1,855 $1,971 $2,122
Net Operating Expenses perAdjusted Patient Day
$1,583 $1,710 $1,837 $1,992 $2,116
2001 2002 2003 2004 2005
Dol
lars
per
Adj
uste
d Pa
tient
Day
$1,500
$1,600
$1,700
$1,800
$1,900
$2,000
$2,100
$2,200
$2,300
$2,400
Net Operating Revenue perAdjusted Patient Day
$1,586 $1,729 $1,855 $1,971 $2,122
Net Operating Expenses perAdjusted Patient Day
$1,583 $1,710 $1,837 $1,992 $2,116
2001 2002 2003 2004 2005
Dol
lars
per
Adj
uste
d Pa
tient
Day
2001 2002 2003 2004 2005 CAGR
Net Operating Revenue per Adjusted Patient Day $1,586 $1,729 $1,855 $1,971 $2,122 7.6%
Net Operating Expenses per Adjusted Patient Day $1,583 $1,710 $1,837 $1,992 $2,116 7.5%
Difference (Operating Margin) $3 $19 $17 -$21 $6
Percent Operating Revenue 0.2% 1.1% 0.9% -1.1% 0.3% Source: “Annual Hospital Financial Data,” California Office of Statewide Health Planning and Development (OSHPD), Pivot Profiles with data selected for general acute care hospitals (Retrieved from http://www.oshpd.ca.gov/HQAD/Hospital/financial/hospAF.htm, October 2006). See Appendix A for detailed Methodology. Note: Excludes Kaiser data.
Figure 7.3 compares the gross revenue (hospital charges) per adjusted patient day to the net operating revenue and expense per adjusted patient day presented in Figure 7.2. As noted previously, the difference between charges at established rates and amounts collected from third-party payers under contractual agreements is called contractual allowances, although technically the gap also incorporates provisions for bad debt and charity care. The CMI-adjusted gross revenue per adjusted patient day compound annual growth rate was 12 percent over the five-year period, compared to 7 percent for both net revenue and expenses. This difference illustrates that contractual allowances are growing faster and serves to underscore the observation that hospital charges, and the increase in hospital charges, do not always reflect a clear and consistent relationship to payment amounts agreed to under contractual relationships or to hospital expenses.
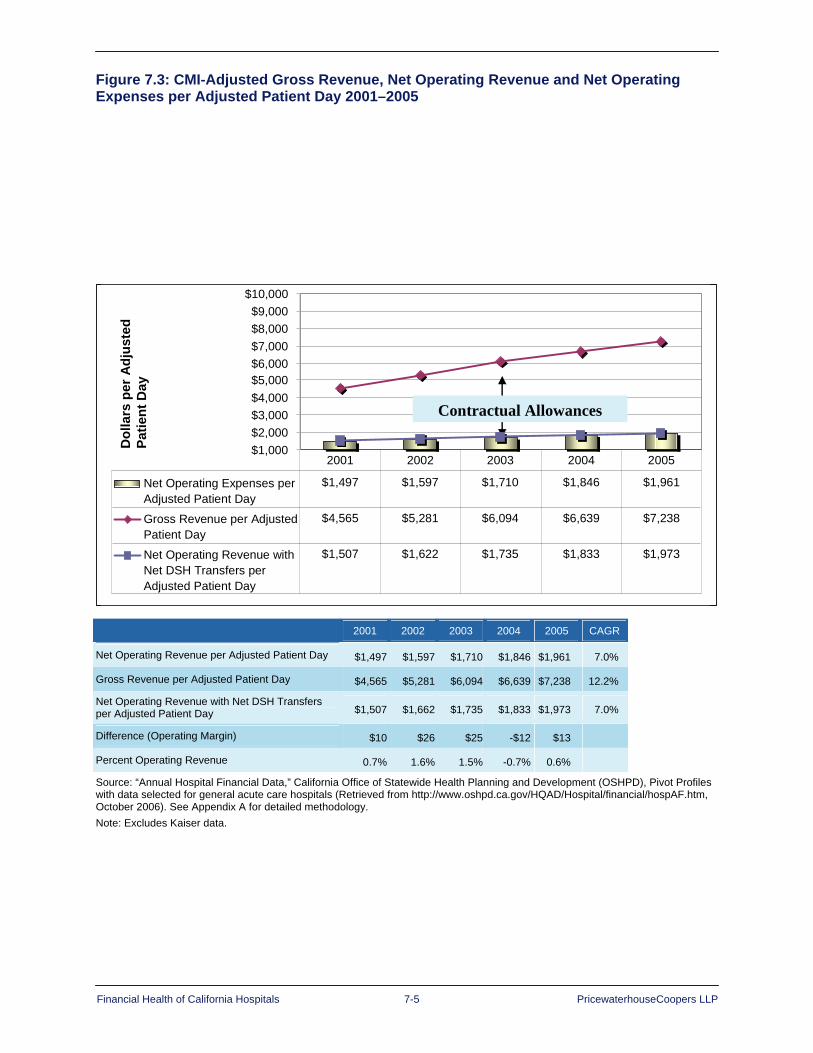
Financial Health of California Hospitals 7-5 PricewaterhouseCoopers LLP
Figure 7.3: CMI-Adjusted Gross Revenue, Net Operating Revenue and Net Operating Expenses per Adjusted Patient Day 2001–2005
Contractual Allowances
Dol
lars
per
Adj
uste
d Pa
tient
Day
$1,000$2,000$3,000$4,000$5,000$6,000$7,000$8,000$9,000
$10,000
Net Operating Expenses perAdjusted Patient Day
$1,497 $1,597 $1,710 $1,846 $1,961
Gross Revenue per AdjustedPatient Day
$4,565 $5,281 $6,094 $6,639 $7,238
Net Operating Revenue withNet DSH Transfers perAdjusted Patient Day
$1,507 $1,622 $1,735 $1,833 $1,973
2001 2002 2003 2004 2005
2001 2002 2003 2004 2005 CAGR
Net Operating Revenue per Adjusted Patient Day $1,497 $1,597 $1,710 $1,846 $1,961 7.0%
Gross Revenue per Adjusted Patient Day $4,565 $5,281 $6,094 $6,639 $7,238 12.2%
Net Operating Revenue with Net DSH Transfers per Adjusted Patient Day $1,507 $1,662 $1,735 $1,833 $1,973 7.0%
Difference (Operating Margin) $10 $26 $25 -$12 $13
Percent Operating Revenue 0.7% 1.6% 1.5% -0.7% 0.6%
Source: “Annual Hospital Financial Data,” California Office of Statewide Health Planning and Development (OSHPD), Pivot Profiles with data selected for general acute care hospitals (Retrieved from http://www.oshpd.ca.gov/HQAD/Hospital/financial/hospAF.htm, October 2006). See Appendix A for detailed methodology. Note: Excludes Kaiser data.
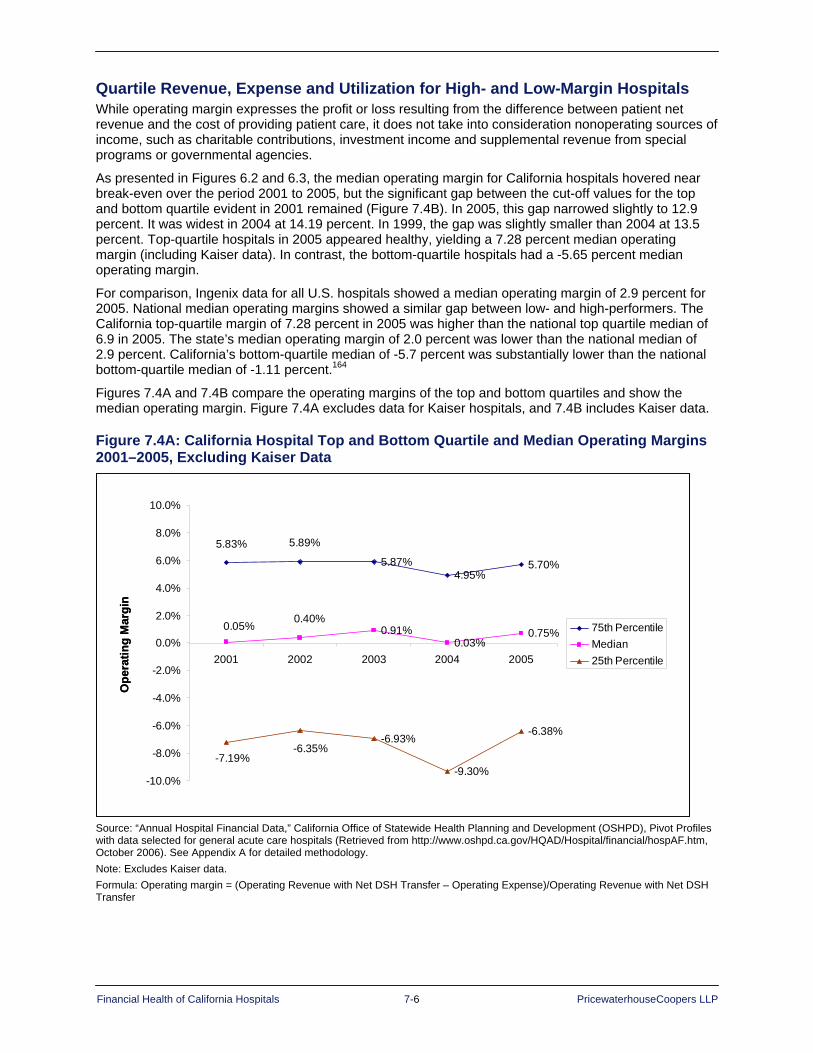
Financial Health of California Hospitals 7-6 PricewaterhouseCoopers LLP
Quartile Revenue, Expense and Utilization for High- and Low-Margin Hospitals While operating margin expresses the profit or loss resulting from the difference between patient net revenue and the cost of providing patient care, it does not take into consideration nonoperating sources of income, such as charitable contributions, investment income and supplemental revenue from special programs or governmental agencies.
As presented in Figures 6.2 and 6.3, the median operating margin for California hospitals hovered near break-even over the period 2001 to 2005, but the significant gap between the cut-off values for the top and bottom quartile evident in 2001 remained (Figure 7.4B). In 2005, this gap narrowed slightly to 12.9 percent. It was widest in 2004 at 14.19 percent. In 1999, the gap was slightly smaller than 2004 at 13.5 percent. Top-quartile hospitals in 2005 appeared healthy, yielding a 7.28 percent median operating margin (including Kaiser data). In contrast, the bottom-quartile hospitals had a -5.65 percent median operating margin.
For comparison, Ingenix data for all U.S. hospitals showed a median operating margin of 2.9 percent for 2005. National median operating margins showed a similar gap between low- and high-performers. The California top-quartile margin of 7.28 percent in 2005 was higher than the national top quartile median of 6.9 in 2005. The state’s median operating margin of 2.0 percent was lower than the national median of 2.9 percent. California’s bottom-quartile median of -5.7 percent was substantially lower than the national bottom-quartile median of -1.11 percent.164
Figures 7.4A and 7.4B compare the operating margins of the top and bottom quartiles and show the median operating margin. Figure 7.4A excludes data for Kaiser hospitals, and 7.4B includes Kaiser data.
Figure 7.4A: California Hospital Top and Bottom Quartile and Median Operating Margins 2001–2005, Excluding Kaiser Data
Ope
ratin
g M
argi
n
5.87%4.95%
5.70%
0.91%0.03%
0.75%
-6.93%
-9.30%
-6.38%
5.89%5.83%
0.40%0.05%
-7.19%-6.35%
-10.0%
-8.0%
-6.0%
-4.0%
-2.0%
0.0%
2.0%
4.0%
6.0%
8.0%
10.0%
2001 2002 2003 2004 2005
75th PercentileMedian25th Percentile
Ope
ratin
g M
argi
n
5.87%4.95%
5.70%
0.91%0.03%
0.75%
-6.93%
-9.30%
-6.38%
5.89%5.83%
0.40%0.05%
-7.19%-6.35%
-10.0%
-8.0%
-6.0%
-4.0%
-2.0%
0.0%
2.0%
4.0%
6.0%
8.0%
10.0%
2001 2002 2003 2004 2005
75th PercentileMedian25th Percentile
Source: “Annual Hospital Financial Data,” California Office of Statewide Health Planning and Development (OSHPD), Pivot Profiles with data selected for general acute care hospitals (Retrieved from http://www.oshpd.ca.gov/HQAD/Hospital/financial/hospAF.htm, October 2006). See Appendix A for detailed methodology. Note: Excludes Kaiser data. Formula: Operating margin = (Operating Revenue with Net DSH Transfer – Operating Expense)/Operating Revenue with Net DSH Transfer
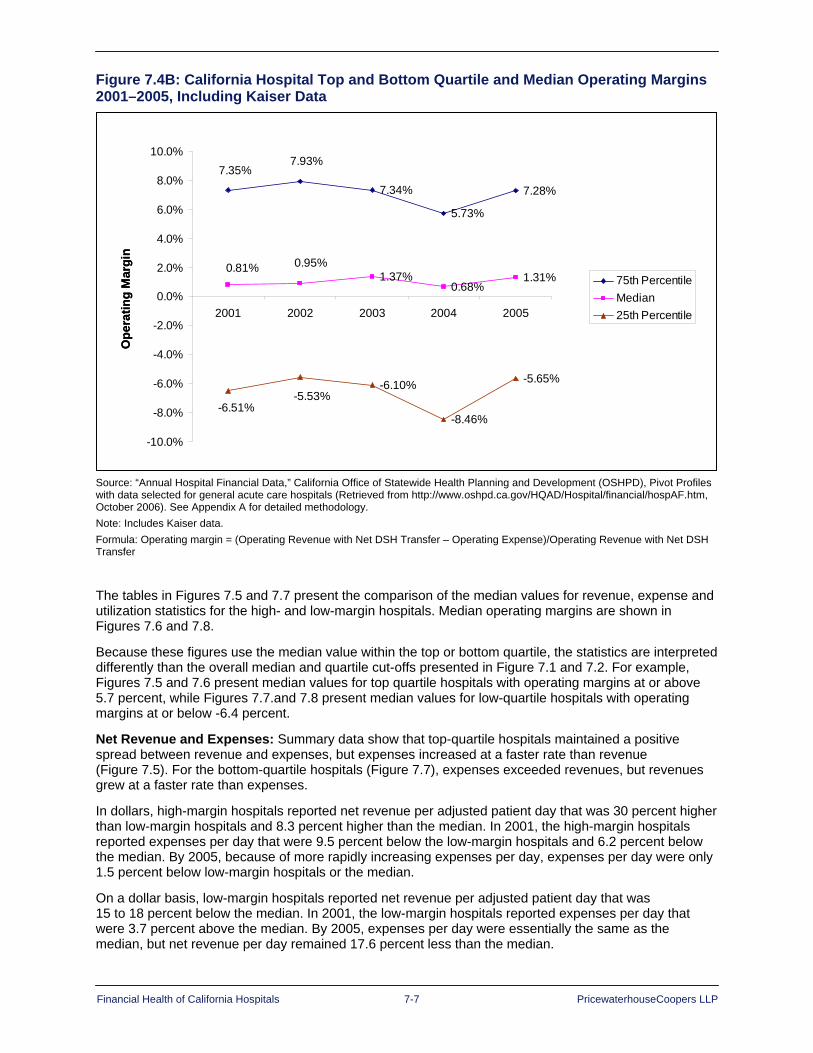
Financial Health of California Hospitals 7-7 PricewaterhouseCoopers LLP
Figure 7.4B: California Hospital Top and Bottom Quartile and Median Operating Margins 2001–2005, Including Kaiser Data
Ope
ratin
g M
argi
n
7.34%
5.73%
7.28%
1.37%0.68%
1.31%
-6.10%
-8.46%
-5.65%
7.93%7.35%
0.95%0.81%
-6.51%-5.53%
-10.0%
-8.0%
-6.0%
-4.0%
-2.0%
0.0%
2.0%
4.0%
6.0%
8.0%
10.0%
2001 2002 2003 2004 2005
75th PercentileMedian25th Percentile
Ope
ratin
g M
argi
n
7.34%
5.73%
7.28%
1.37%0.68%
1.31%
-6.10%
-8.46%
-5.65%
7.93%7.35%
0.95%0.81%
-6.51%-5.53%
-10.0%
-8.0%
-6.0%
-4.0%
-2.0%
0.0%
2.0%
4.0%
6.0%
8.0%
10.0%
2001 2002 2003 2004 2005
75th PercentileMedian25th Percentile
Source: “Annual Hospital Financial Data,” California Office of Statewide Health Planning and Development (OSHPD), Pivot Profiles with data selected for general acute care hospitals (Retrieved from http://www.oshpd.ca.gov/HQAD/Hospital/financial/hospAF.htm, October 2006). See Appendix A for detailed methodology. Note: Includes Kaiser data. Formula: Operating margin = (Operating Revenue with Net DSH Transfer – Operating Expense)/Operating Revenue with Net DSH Transfer
The tables in Figures 7.5 and 7.7 present the comparison of the median values for revenue, expense and utilization statistics for the high- and low-margin hospitals. Median operating margins are shown in Figures 7.6 and 7.8.
Because these figures use the median value within the top or bottom quartile, the statistics are interpreted differently than the overall median and quartile cut-offs presented in Figure 7.1 and 7.2. For example, Figures 7.5 and 7.6 present median values for top quartile hospitals with operating margins at or above 5.7 percent, while Figures 7.7.and 7.8 present median values for low-quartile hospitals with operating margins at or below -6.4 percent.
Net Revenue and Expenses: Summary data show that top-quartile hospitals maintained a positive spread between revenue and expenses, but expenses increased at a faster rate than revenue (Figure 7.5). For the bottom-quartile hospitals (Figure 7.7), expenses exceeded revenues, but revenues grew at a faster rate than expenses.
In dollars, high-margin hospitals reported net revenue per adjusted patient day that was 30 percent higher than low-margin hospitals and 8.3 percent higher than the median. In 2001, the high-margin hospitals reported expenses per day that were 9.5 percent below the low-margin hospitals and 6.2 percent below the median. By 2005, because of more rapidly increasing expenses per day, expenses per day were only 1.5 percent below low-margin hospitals or the median.
On a dollar basis, low-margin hospitals reported net revenue per adjusted patient day that was 15 to 18 percent below the median. In 2001, the low-margin hospitals reported expenses per day that were 3.7 percent above the median. By 2005, expenses per day were essentially the same as the median, but net revenue per day remained 17.6 percent less than the median.
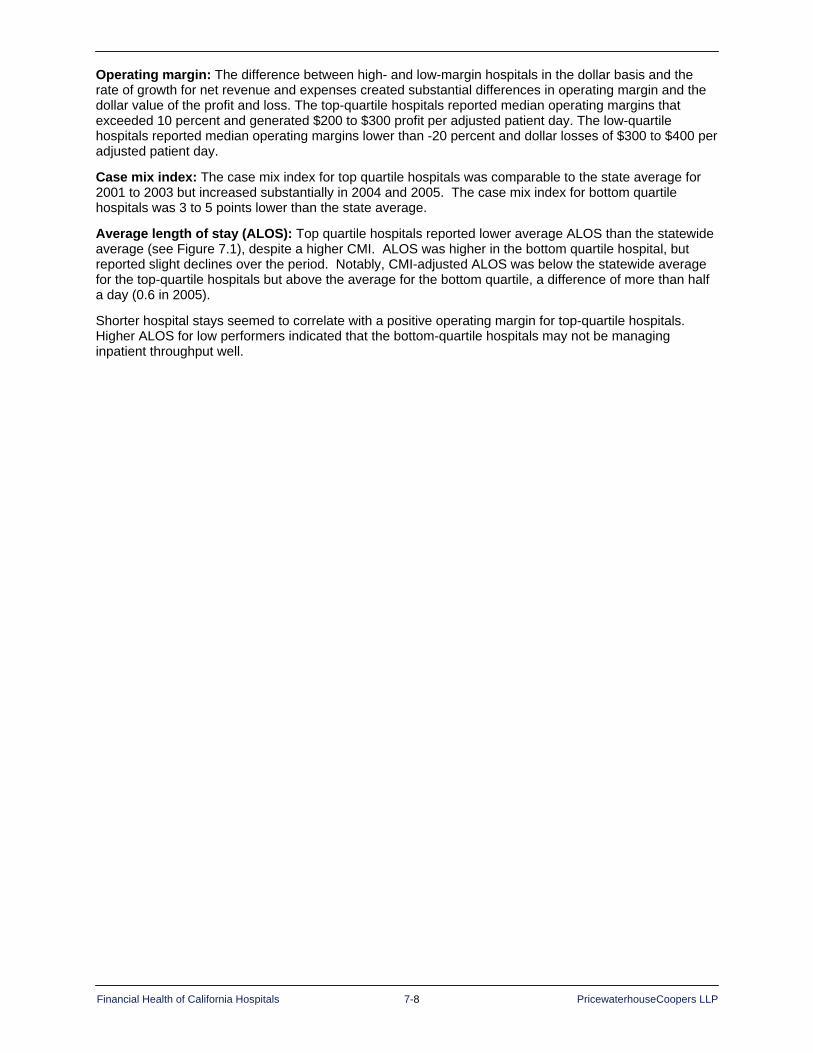
Financial Health of California Hospitals 7-8 PricewaterhouseCoopers LLP
Operating margin: The difference between high- and low-margin hospitals in the dollar basis and the rate of growth for net revenue and expenses created substantial differences in operating margin and the dollar value of the profit and loss. The top-quartile hospitals reported median operating margins that exceeded 10 percent and generated $200 to $300 profit per adjusted patient day. The low-quartile hospitals reported median operating margins lower than -20 percent and dollar losses of $300 to $400 per adjusted patient day.
Case mix index: The case mix index for top quartile hospitals was comparable to the state average for 2001 to 2003 but increased substantially in 2004 and 2005. The case mix index for bottom quartile hospitals was 3 to 5 points lower than the state average.
Average length of stay (ALOS): Top quartile hospitals reported lower average ALOS than the statewide average (see Figure 7.1), despite a higher CMI. ALOS was higher in the bottom quartile hospital, but reported slight declines over the period. Notably, CMI-adjusted ALOS was below the statewide average for the top-quartile hospitals but above the average for the bottom quartile, a difference of more than half a day (0.6 in 2005).
Shorter hospital stays seemed to correlate with a positive operating margin for top-quartile hospitals. Higher ALOS for low performers indicated that the bottom-quartile hospitals may not be managing inpatient throughput well.
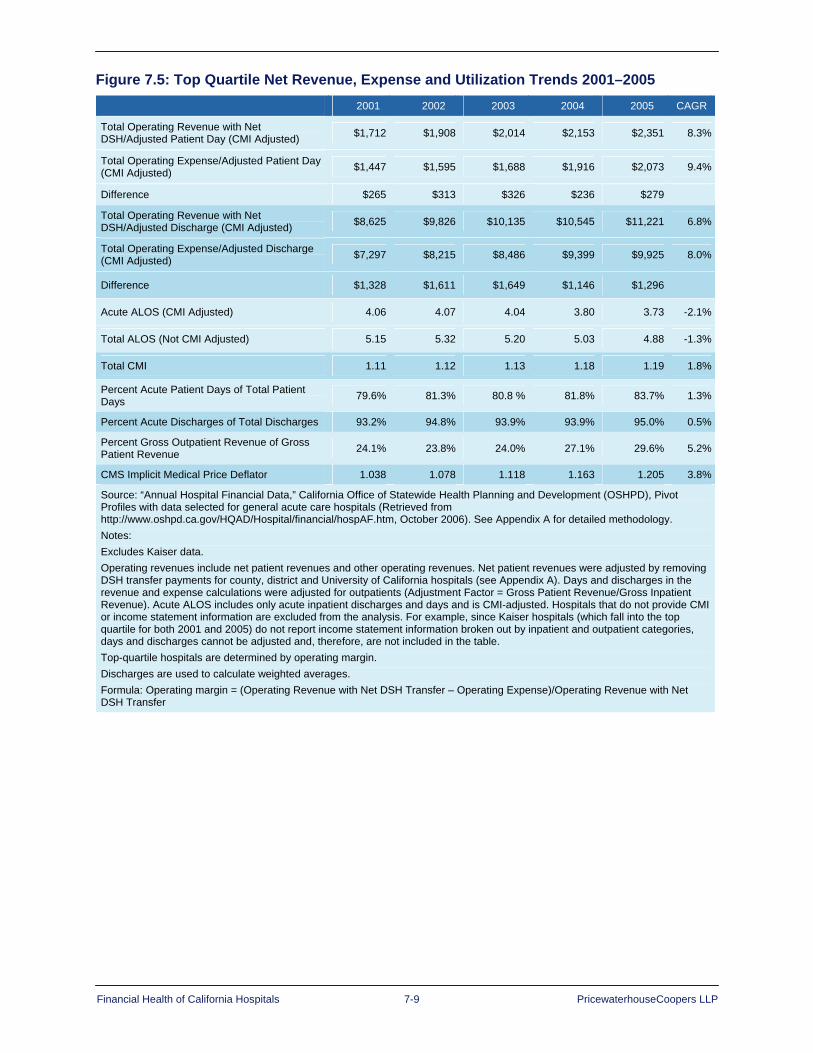
Financial Health of California Hospitals 7-9 PricewaterhouseCoopers LLP
Figure 7.5: Top Quartile Net Revenue, Expense and Utilization Trends 2001–2005 2001 2002 2003 2004 2005 CAGR
Total Operating Revenue with Net DSH/Adjusted Patient Day (CMI Adjusted) $1,712 $1,908 $2,014 $2,153 $2,351 8.3%
Total Operating Expense/Adjusted Patient Day (CMI Adjusted) $1,447 $1,595 $1,688 $1,916 $2,073 9.4%
Difference $265 $313 $326 $236 $279
Total Operating Revenue with Net DSH/Adjusted Discharge (CMI Adjusted) $8,625 $9,826 $10,135 $10,545 $11,221 6.8%
Total Operating Expense/Adjusted Discharge (CMI Adjusted) $7,297 $8,215 $8,486 $9,399 $9,925 8.0%
Difference $1,328 $1,611 $1,649 $1,146 $1,296
Acute ALOS (CMI Adjusted) 4.06 4.07 4.04 3.80 3.73 -2.1%
Total ALOS (Not CMI Adjusted) 5.15 5.32 5.20 5.03 4.88 -1.3%
Total CMI 1.11 1.12 1.13 1.18 1.19 1.8%
Percent Acute Patient Days of Total Patient Days 79.6% 81.3% 80.8 % 81.8% 83.7% 1.3%
Percent Acute Discharges of Total Discharges 93.2% 94.8% 93.9% 93.9% 95.0% 0.5%
Percent Gross Outpatient Revenue of Gross Patient Revenue 24.1% 23.8% 24.0% 27.1% 29.6% 5.2%
CMS Implicit Medical Price Deflator 1.038 1.078 1.118 1.163 1.205 3.8%
Source: “Annual Hospital Financial Data,” California Office of Statewide Health Planning and Development (OSHPD), Pivot Profiles with data selected for general acute care hospitals (Retrieved from http://www.oshpd.ca.gov/HQAD/Hospital/financial/hospAF.htm, October 2006). See Appendix A for detailed methodology. Notes: Excludes Kaiser data. Operating revenues include net patient revenues and other operating revenues. Net patient revenues were adjusted by removing DSH transfer payments for county, district and University of California hospitals (see Appendix A). Days and discharges in the revenue and expense calculations were adjusted for outpatients (Adjustment Factor = Gross Patient Revenue/Gross Inpatient Revenue). Acute ALOS includes only acute inpatient discharges and days and is CMI-adjusted. Hospitals that do not provide CMI or income statement information are excluded from the analysis. For example, since Kaiser hospitals (which fall into the top quartile for both 2001 and 2005) do not report income statement information broken out by inpatient and outpatient categories, days and discharges cannot be adjusted and, therefore, are not included in the table. Top-quartile hospitals are determined by operating margin. Discharges are used to calculate weighted averages. Formula: Operating margin = (Operating Revenue with Net DSH Transfer – Operating Expense)/Operating Revenue with Net DSH Transfer
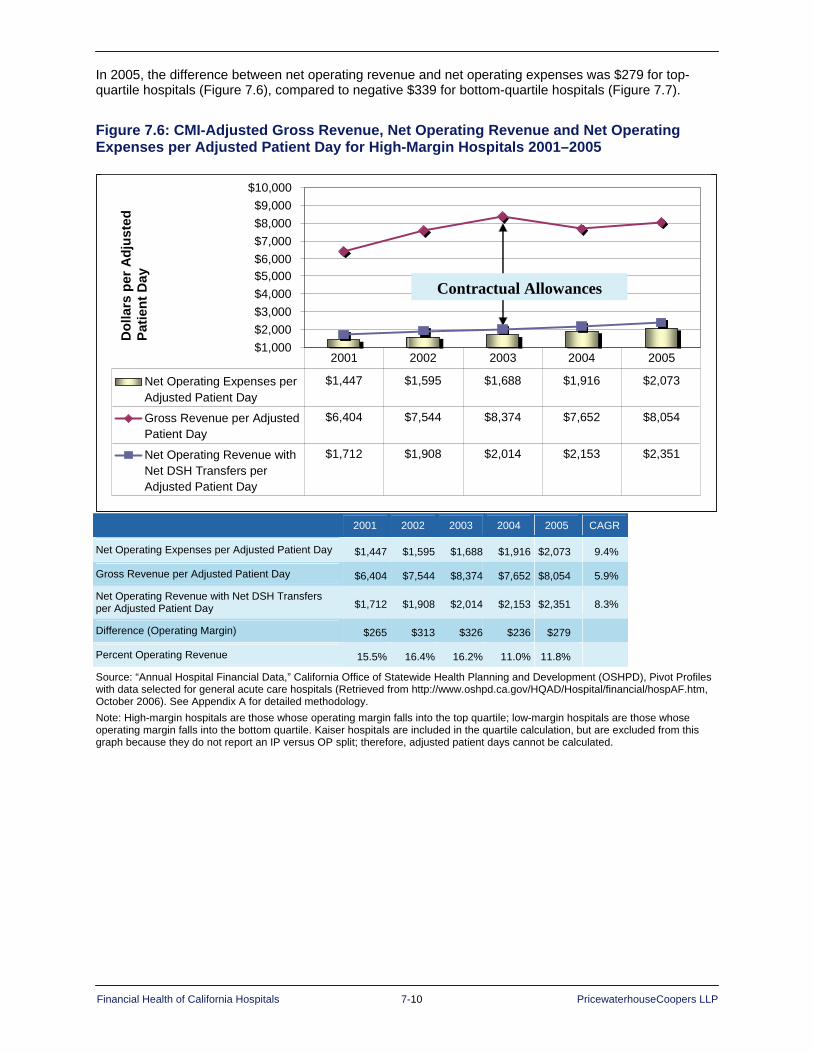
Financial Health of California Hospitals 7-10 PricewaterhouseCoopers LLP
In 2005, the difference between net operating revenue and net operating expenses was $279 for top-quartile hospitals (Figure 7.6), compared to negative $339 for bottom-quartile hospitals (Figure 7.7).
Figure 7.6: CMI-Adjusted Gross Revenue, Net Operating Revenue and Net Operating Expenses per Adjusted Patient Day for High-Margin Hospitals 2001–2005
Contractual Allowances
Dol
lars
per
Adj
uste
d Pa
tient
Day
$1,000$2,000$3,000$4,000$5,000$6,000$7,000$8,000$9,000
$10,000
Net Operating Expenses perAdjusted Patient Day
$1,447 $1,595 $1,688 $1,916 $2,073
Gross Revenue per AdjustedPatient Day
$6,404 $7,544 $8,374 $7,652 $8,054
Net Operating Revenue withNet DSH Transfers perAdjusted Patient Day
$1,712 $1,908 $2,014 $2,153 $2,351
2001 2002 2003 2004 2005
2001 2002 2003 2004 2005 CAGR
Net Operating Expenses per Adjusted Patient Day $1,447 $1,595 $1,688 $1,916 $2,073 9.4%
Gross Revenue per Adjusted Patient Day $6,404 $7,544 $8,374 $7,652 $8,054 5.9%
Net Operating Revenue with Net DSH Transfers per Adjusted Patient Day $1,712 $1,908 $2,014 $2,153 $2,351 8.3%
Difference (Operating Margin) $265 $313 $326 $236 $279
Percent Operating Revenue 15.5% 16.4% 16.2% 11.0% 11.8%
Source: “Annual Hospital Financial Data,” California Office of Statewide Health Planning and Development (OSHPD), Pivot Profiles with data selected for general acute care hospitals (Retrieved from http://www.oshpd.ca.gov/HQAD/Hospital/financial/hospAF.htm, October 2006). See Appendix A for detailed methodology. Note: High-margin hospitals are those whose operating margin falls into the top quartile; low-margin hospitals are those whose operating margin falls into the bottom quartile. Kaiser hospitals are included in the quartile calculation, but are excluded from this graph because they do not report an IP versus OP split; therefore, adjusted patient days cannot be calculated.

Financial Health of California Hospitals 7-11 PricewaterhouseCoopers LLP
Figure 7.7: Bottom Quartile Net Revenue, Expense and Utilization Trends 2001–2005 2001 2002 2003 2004 2005 CAGR
Total Operating Revenue with Net DSH/Adjusted Patient Day (CMI Adjusted) $1,300 $1,479 $1,536 $1,647 $1,747 7.7%
Total Operating Expense/Adjusted Patient Day (CMI Adjusted) $1,623 $1,796 $1,864 $2,018 $2,086 6.5%
Difference -$323 -$317 -$328 -$371 -$339
Total Operating Revenue with Net DSH/Adjusted Discharge (CMI Adjusted) $7,402 $8,221 $8,882 $9,141 $9,550 6.6%
Total Operating Expense/Adjusted Discharge (CMI Adjusted) $9,225 $10,059 $10,767 $11,239 $11,443 5.5%
Difference -$1,824 -$1,837 -$1.885 -$2,098 -$1,893
Acute ALOS (CMI Adjusted) 4.37 4.38 4.43 4.49 4.34 -0.2%
Total ALOS (Not CMI Adjusted) 6.29 6.20 6.53 6.27 6.07 -0.9%
Total CMI 1.06 1.07 1.09 1.06 1.08 0.6%
Percent Acute Patient Days of Total Patient Days 65.3% 68.7% 67.4% 68.4% 72.3% 2.6%
Percent Acute Discharges of Total Discharges 88.9% 91.0% 89.9% 90.3% 91.7% 0.8%
Percent Gross Outpatient Revenue of Gross Patient Revenue 26.6% 28.1% 27.8% 26.7% 28.4% 1.7%
CMS Implicit Medical Price Deflator* 1.038 1.078 1.118 1.163 1.205 3.8%
Source: “Annual Hospital Financial Data,” California Office of Statewide Health Planning and Development (OSHPD), Pivot Profiles with data selected for general acute care hospitals (Retrieved from http://www.oshpd.ca.gov/HQAD/Hospital/financial/hospAF.htm, October 2006). See Appendix A for detailed methodology. Notes: Excludes Kaiser data. Operating revenues include net patient revenues and other operating revenues. Net patient revenues were adjusted by removing DSH transfer payments for county, district and University of California hospitals (see Appendix A). Days and discharges in the revenue and expense calculations were adjusted for outpatients (Adjustment Factor = Gross Patient Revenue/Gross Inpatient Revenue). Acute ALOS includes only acute inpatient discharges and days and is CMI-adjusted. Hospitals that do not provide CMI or income statement information are excluded from the analysis. For example, since Kaiser hospitals (which fall into the top quartile for both 2001 and 2005) do not report income statement information broken out by inpatient and outpatient categories, days and discharges cannot be adjusted and, therefore, are not included in the table. Bottom-quartile hospitals are determined by operating margin. Formula: Operating margin = (Operating Revenue with Net DSH Transfer – Operating Expense)/Operating Revenue with Net DSH Transfer *CMA Implicit Medical Price Deflator for 2000 = 1.0
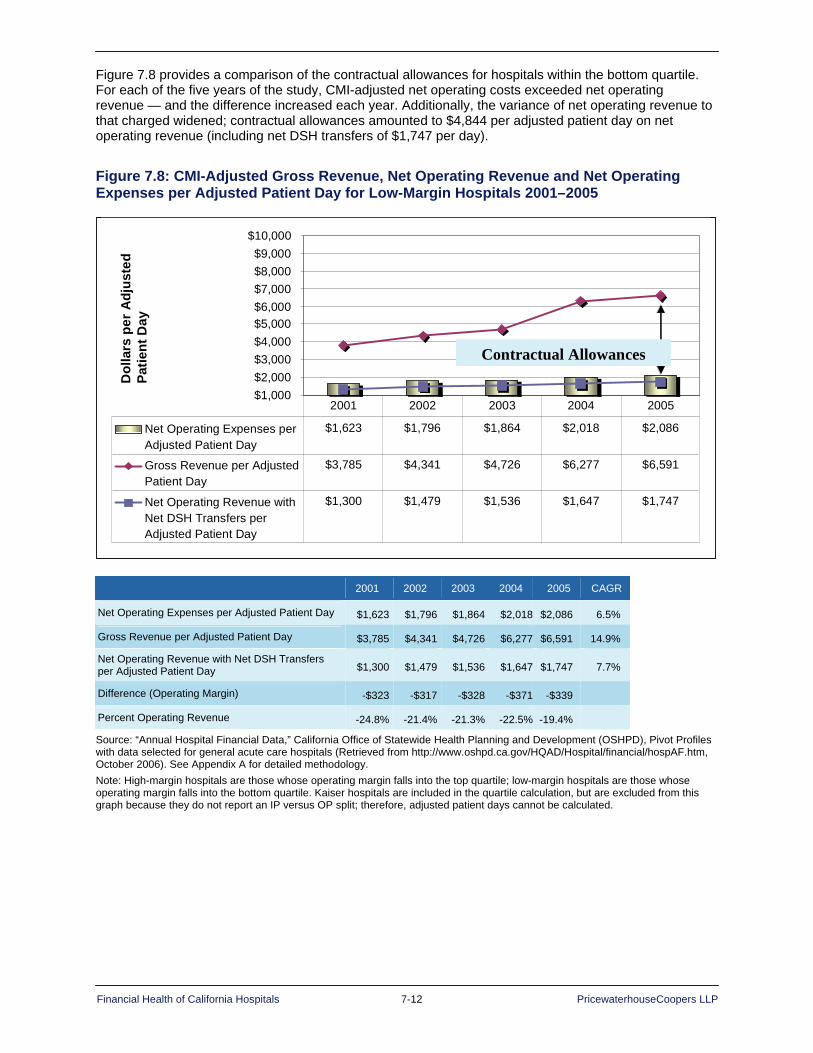
Financial Health of California Hospitals 7-12 PricewaterhouseCoopers LLP
Figure 7.8 provides a comparison of the contractual allowances for hospitals within the bottom quartile. For each of the five years of the study, CMI-adjusted net operating costs exceeded net operating revenue — and the difference increased each year. Additionally, the variance of net operating revenue to that charged widened; contractual allowances amounted to $4,844 per adjusted patient day on net operating revenue (including net DSH transfers of $1,747 per day).
Figure 7.8: CMI-Adjusted Gross Revenue, Net Operating Revenue and Net Operating Expenses per Adjusted Patient Day for Low-Margin Hospitals 2001–2005
$1,000$2,000$3,000$4,000$5,000$6,000$7,000$8,000$9,000
$10,000
Net Operating Expenses perAdjusted Patient Day
$1,623 $1,796 $1,864 $2,018 $2,086
Gross Revenue per AdjustedPatient Day
$3,785 $4,341 $4,726 $6,277 $6,591
Net Operating Revenue withNet DSH Transfers perAdjusted Patient Day
$1,300 $1,479 $1,536 $1,647 $1,747
2001 2002 2003 2004 2005
Contractual Allowances
Dol
lars
per
Adj
uste
d Pa
tient
Day
$1,000$2,000$3,000$4,000$5,000$6,000$7,000$8,000$9,000
$10,000
Net Operating Expenses perAdjusted Patient Day
$1,623 $1,796 $1,864 $2,018 $2,086
Gross Revenue per AdjustedPatient Day
$3,785 $4,341 $4,726 $6,277 $6,591
Net Operating Revenue withNet DSH Transfers perAdjusted Patient Day
$1,300 $1,479 $1,536 $1,647 $1,747
2001 2002 2003 2004 2005
Contractual Allowances
Dol
lars
per
Adj
uste
d Pa
tient
Day
2001 2002 2003 2004 2005 CAGR
Net Operating Expenses per Adjusted Patient Day $1,623 $1,796 $1,864 $2,018 $2,086 6.5%
Gross Revenue per Adjusted Patient Day $3,785 $4,341 $4,726 $6,277 $6,591 14.9%
Net Operating Revenue with Net DSH Transfers per Adjusted Patient Day $1,300 $1,479 $1,536 $1,647 $1,747 7.7%
Difference (Operating Margin) -$323 -$317 -$328 -$371 -$339
Percent Operating Revenue -24.8% -21.4% -21.3% -22.5% -19.4%
Source: “Annual Hospital Financial Data,” California Office of Statewide Health Planning and Development (OSHPD), Pivot Profiles with data selected for general acute care hospitals (Retrieved from http://www.oshpd.ca.gov/HQAD/Hospital/financial/hospAF.htm, October 2006). See Appendix A for detailed methodology. Note: High-margin hospitals are those whose operating margin falls into the top quartile; low-margin hospitals are those whose operating margin falls into the bottom quartile. Kaiser hospitals are included in the quartile calculation, but are excluded from this graph because they do not report an IP versus OP split; therefore, adjusted patient days cannot be calculated.

Financial Health of California Hospitals 7-13 PricewaterhouseCoopers LLP
California Hospital Revenue Trends
Median Operating Patient Revenue per Day and Discharge Trends Median net patient revenue per day and discharge trends, adjusted for CMI and outpatient factors, are the best measures of true revenue trends.165 The California median revenue per day and discharge increased at an annual rate of 6.9 percent during 2001–2005 (Figures 7.9 and 7.10). This contrasts with a decline in revenue per day during 1991–1995.
Considerable variability is evident when hospitals are grouped by characteristics and compared to the statewide average, as follows:
Available bed size: Median operating revenue per day increased with available bed size. Smaller hospitals (less than 150 available beds) had net revenue 5 to 8 percent lower than the statewide median, while medium-to-large hospitals (more than 250 available beds) had revenue 5 to 10 percent higher than median.
Ownership/type of control: District hospitals reported about half the revenue per day of the other ownership categories — about 55 percent of the state median. City/county hospitals increased their revenue per day more rapidly over the period, moving from 5 to 16 percent above the median. For-profit hospitals reported annual rates of increase of only 5.4 percent, which resulted in a relative decline in operating revenue compared to the median. Operating revenue per day went from 3 percent above median in 2001 to 3 percent below in 2005.
Rural and urban: Rural hospitals, many of which are also district hospitals and smaller in bed size, reported operating revenue per day that grew at a slower rate and was approximately two-thirds of the statewide median.
DSH and non-DSH: DSH hospitals, which include all types of ownership, saw annual revenue per day growth nearly 1 percent below the state median. Operating revenue per day slipped from slightly above the state median in 2001 to about 2 percent lower in 2005. Non-DSH hospitals showed the reverse trend — a higher annual revenue per day growth rate and a median operating revenue that moved from slightly below median in 2001 to slightly above median in 2005.
Region: The greatest variability in operating revenue per day was shown by region. Los Angeles, with the greatest number of hospitals, reported annual growth more than 1 percent below median. All other regions reported growth rates above median, hitting levels above 9 percent in the Greater Bay Area and San Joaquin Valley. On a dollar basis, two Northern California regions, the Greater Bay Area and Sacramento, had operating revenue 20 to 35 percent higher than the state median.

Financial Health of California Hospitals 7-14 PricewaterhouseCoopers LLP
Figure 7.9: Median Operating Revenue per Adjusted Patient Day (Adjusted for Case Mix) by Typology 2001–2005
2001 2002 2003 2004 2005 CAGR
Overall Total $1,323 $1,440 $1,536 $1,576 $1,727 6.89%
Hospital Size <150 available beds $1,244 $1,321 $1,407 $1,464 $1,634 7.06%
151-250 available beds $1,294 $1,415 $1,617 $1,568 $1,697 7.02%
251-350 available beds $1,435 $1,512 $1,598 $1,697 $1,835 6.34%
350+ available beds $1,429 $1,561 $1,624 $1,735 $1,831 6.41%
Type of Control City/County $1,388 $1,590 $1,604 $1,812 $2,009 9.69%
District $717 $763 $845 $880 $930 6.70%
Nonprofit $1,349 $1,495 $1,616 $1,740 $1,874 8.57%
For-Profit $1,359 $1,481 $1,591 $1,507 $1,678 5.40%
Rural versus Urban Rural $871 $967 $983 $1,008 $1,112 6.29%
Urban $1,365 $1,467 $1,594 $1,685 $1,766 6.65%
DSH versus Non-DSH DSH $1,341 $1,417 $1,447 $1,555 $1,684 5.85%
Non-DSH $1,311 $1,448 $1,571 $1,632 $1,746 7.42%
Geography (Region) Central Coast Counties $1,310 $1,439 $1,611 $1,774 $1,835 8.78%
Greater Bay Area Counties $1,585 $1,809 $1,901 $2,009 $2,258 9.25%
Los Angeles County $1,242 $1,299 $1,406 $1,424 $1,554 5.76%
Northern and Sierra Counties $1,258 $1,328 $1,447 $1,522 $1,659 7.18%
Other Southern Counties $1,341 $1,467 $1,529 $1,609 $1,887 8.92%
Sacramento Area Counties $1,745 $1,855 $1,980 $2,136 $2,357 7.81%
San Joaquin Valley Counties $1,204 $1,319 $1,440 $1,563 $1,716 9.26%
San Diego County $1,223 $1,387 $1,434 $1,533 $1,613 7.17%
Orange County $1,378 $1,575 $1,724 $1,798 $1,849 7.63%
Source: “Annual Hospital Financial Data,” California Office of Statewide Health Planning and Development (OSHPD), Pivot Profiles with data selected for general acute care hospitals (Retrieved from http://www.oshpd.ca.gov/HQAD/Hospital/financial/hospAF.htm, October 2006). See Appendix A for detailed methodology. Notes: Excludes Kaiser data. Operating revenues include net patient revenues and other operating revenues and are adjusted by removing DSH transfer payments. Days and discharges are adjusted for outpatient factor. Per Adjusted Patient Day: Includes a statistical proxy for the volume of outpatient care relative to volume of inpatient care provided by hospitals, computed by dividing gross total patient revenue by gross inpatient revenue. Days in the revenue and expense calculations were adjusted for outpatients (Adjustment Factor = Gross Patient Revenue/Gross Inpatient Revenue). Hospital is excluded if it did not report net patient revenue or day information or CMI data. Net patient revenues were adjusted by removing DSH transfer payments for county, district and University of California hospitals (see Appendix A for detailed methodology). Calculation for each hospital that was included: Net Patient Revenue + Other Operating Revenue/(Total Days * Adjustment Factor)/CMI.

Financial Health of California Hospitals 7-15 PricewaterhouseCoopers LLP
Median operating revenue per patient discharge (Figure 7.10) combines the effect of the dollar value and growth rate of net operating revenue per day with changes in inpatient length of stay. Findings included:
Available bed size: Median operating revenue per discharge increased with available bed size. Lower ALOS in smaller hospitals (less than 150 available beds) resulted in net revenue per discharge 8 to 11 percent lower than the state median. In comparison, large hospitals (more than 350 available beds) had revenue about 10 percent above the state median.
Ownership/type of control: District hospitals reported revenue per discharge near the statewide median. City/county hospitals increased their revenue per discharge more rapidly, but decreased ALOS and reported revenue per discharge more than 20 percent above the median. For-profit operating revenue per discharge went from approximately the median in 2001 to 10 percent below in 2005.
Rural and urban: Rural hospitals increased revenue per discharge over the period and reported amounts comparable to the state median. Urban hospitals tracked the state median over the period.
DSH and non-DSH: DSH hospitals, which include all types of ownership, combined lower annual revenue per day growth with slight increases in ALOS. Operating revenue per discharge slipped from 14 percent above the state median in 2001 to about 8 percent higher in 2005, but dropped as low as 3 to 4 percent higher in 2003 and 2004. For non-DSH hospitals, a higher annual revenue per day growth rate and stable ALOS produced operating revenue per discharge that improved from 5 percent below median in 2001 to 2 percent below in 2005.
Region: Analysis by region showed the greatest variability in operating revenue per discharge. Los Angeles showed annual growth in revenue per day more than 1 percent below median, experienced a small decline in ALOS, and moved from about 2 percent above median in 2001 to 5 percent below median by 2005. On a dollar basis, two northern California regions, the Greater Bay Area and Sacramento, increased operating revenue per discharge more than 8 percent per year and, in 2005, reported revenue per discharge 30 and 14 percent above the median. San Diego also increased to 20 to 35 percent higher than the state median.

Financial Health of California Hospitals 7-16 PricewaterhouseCoopers LLP
Figure 7.10: Median Operating Revenue per Adjusted Patient Discharge (Adjusted for Total Case Mix) by Typology 2001–2005
2001 2002 2003 2004 2005 CAGR
Overall Total $6,941 $7,597 $8,167 $8,574 $9,019 6.77%
Hospital Size <150 available beds $6,573 $6,908 $7,399 $7,658 $8,273 5.92%
151-250 available beds $6,965 $7,338 $8,215 $8,511 $8,939 6.44%
251-350 available beds $7,612 $7,792 $8,437 $8,705 $8,935 4.09%
350+ available beds $7,927 $8,630 $8,746 $9,450 $10,017 6.03%
Type of Control City/County $8,437 $9,292 $10,547 $10,210 $11,196 7.33%
District $7,359 $7,382 $7,943 $8,448 $8,637 4.08%
Nonprofit $6,867 $7,577 $8,303 $8,888 $9,397 8.16%
For-Profit $6,912 $7,352 $7,924 $7,812 $8,013 3.76%
Rural versus Urban Rural $6,669 $7,279 $7,938 $7,972 $8,984 7.73%
Urban $7,001 $7,655 $8,231 $8,615 $9,029 6.57%
DSH versus Non-DSH DSH $7,935 $8,172 $8,484 $8,841 $9,702 5.16%
Non-DSH $6,616 $7,241 $7,943 $8,258 $8,858 7.57%
Geography (Region) Central Coast Counties $6,569 $7,241 $8,689 $9,386 $10,091 11.33%
Greater Bay Area Counties $8,514 $9,140 $9,834 $10,707 $11,683 8.23%
Los Angeles County $7,049 $7,620 $8,143 $8,185 $8,530 4.88%
Northern and Sierra Counties $6,603 $7,210 $7,732 $7,779 $9,009 8.08%
Other Southern Counties $5,651 $6,065 $6,907 $6,912 $7,676 7.96%
Sacramento Area Counties $7,373 $8,223 $8,663 $9,529 $10,285 8.68%
San Joaquin Valley Counties $6,019 $6,587 $7,227 $7,531 $8,065 7.59%
San Diego County $6,646 $7,382 $7,500 $8,084 $8,550 6.50%
Orange County $6,959 $7,557 $8,104 $8,707 $8,324 4.58%
Source: “Annual Hospital Financial Data,” California Office of Statewide Health Planning and Development (OSHPD), Pivot Profiles with data selected for general acute care hospitals (Retrieved from http://www.oshpd.ca.gov/HQAD/Hospital/financial/hospAF.htm, October 2006). See Appendix A for detailed methodology. Notes: Excludes Kaiser data. Operating revenues include net patient revenues and other operating revenues and are adjusted by removing DSH transfer payments. Days and discharges are adjusted for outpatient factor. Days in the revenue and expense calculations were adjusted for outpatients (Adjustment Factor = Gross Patient Revenue/Gross Inpatient Revenue). Hospital is excluded if it did not report net patient revenue or day information or CMI data. Net patient revenues were adjusted by removing DSH transfer payments for county, district and University of California hospitals (see Appendix A for detailed methodology). Calculation for each hospital that was included: Net Patient Revenue + Other Operating Revenue/(Total Days * Adjustment Factor)/CMI.
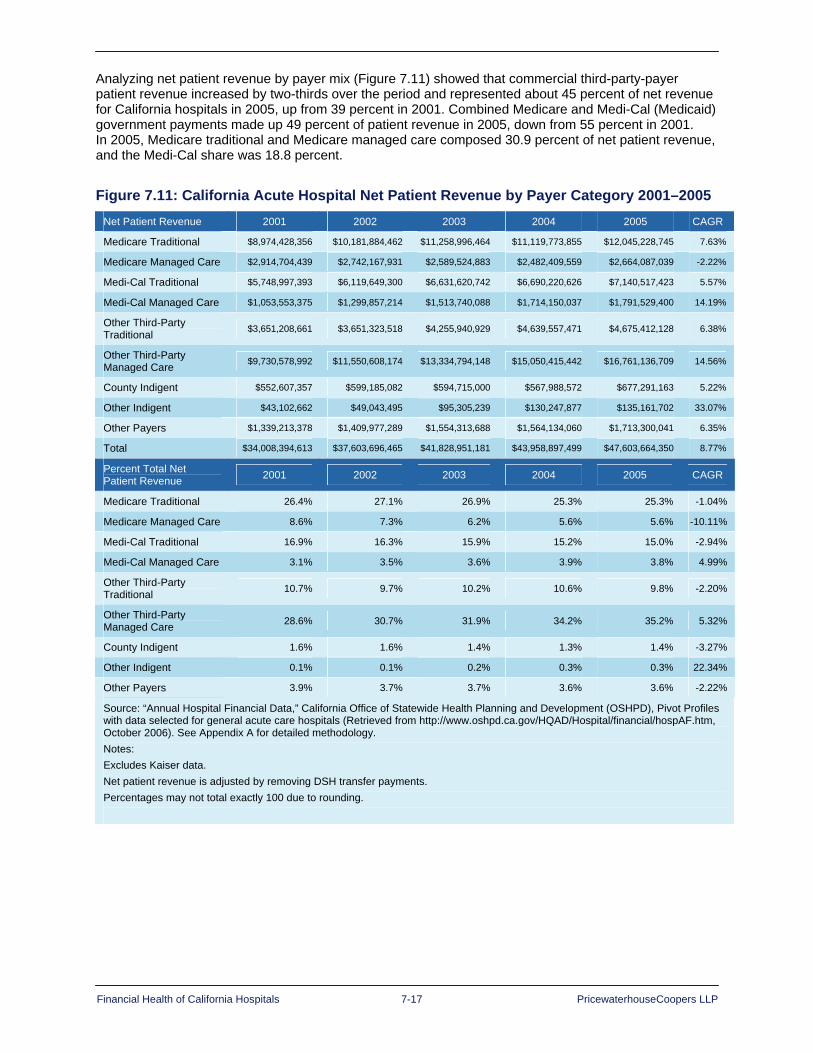
Financial Health of California Hospitals 7-17 PricewaterhouseCoopers LLP
Analyzing net patient revenue by payer mix (Figure 7.11) showed that commercial third-party-payer patient revenue increased by two-thirds over the period and represented about 45 percent of net revenue for California hospitals in 2005, up from 39 percent in 2001. Combined Medicare and Medi-Cal (Medicaid) government payments made up 49 percent of patient revenue in 2005, down from 55 percent in 2001. In 2005, Medicare traditional and Medicare managed care composed 30.9 percent of net patient revenue, and the Medi-Cal share was 18.8 percent.
Figure 7.11: California Acute Hospital Net Patient Revenue by Payer Category 2001–2005 Net Patient Revenue 2001 2002 2003 2004 2005 CAGR
Medicare Traditional $8,974,428,356 $10,181,884,462 $11,258,996,464 $11,119,773,855 $12,045,228,745 7.63%
Medicare Managed Care $2,914,704,439 $2,742,167,931 $2,589,524,883 $2,482,409,559 $2,664,087,039 -2.22%
Medi-Cal Traditional $5,748,997,393 $6,119,649,300 $6,631,620,742 $6,690,220,626 $7,140,517,423 5.57%
Medi-Cal Managed Care $1,053,553,375 $1,299,857,214 $1,513,740,088 $1,714,150,037 $1,791,529,400 14.19%
Other Third-Party Traditional $3,651,208,661 $3,651,323,518 $4,255,940,929 $4,639,557,471 $4,675,412,128 6.38%
Other Third-Party Managed Care $9,730,578,992 $11,550,608,174 $13,334,794,148 $15,050,415,442 $16,761,136,709 14.56%
County Indigent $552,607,357 $599,185,082 $594,715,000 $567,988,572 $677,291,163 5.22%
Other Indigent $43,102,662 $49,043,495 $95,305,239 $130,247,877 $135,161,702 33.07%
Other Payers $1,339,213,378 $1,409,977,289 $1,554,313,688 $1,564,134,060 $1,713,300,041 6.35%
Total $34,008,394,613 $37,603,696,465 $41,828,951,181 $43,958,897,499 $47,603,664,350 8.77%
Percent Total Net Patient Revenue 2001 2002 2003 2004 2005 CAGR
Medicare Traditional 26.4% 27.1% 26.9% 25.3% 25.3% -1.04%
Medicare Managed Care 8.6% 7.3% 6.2% 5.6% 5.6% -10.11%
Medi-Cal Traditional 16.9% 16.3% 15.9% 15.2% 15.0% -2.94%
Medi-Cal Managed Care 3.1% 3.5% 3.6% 3.9% 3.8% 4.99%
Other Third-Party Traditional 10.7% 9.7% 10.2% 10.6% 9.8% -2.20%
Other Third-Party Managed Care 28.6% 30.7% 31.9% 34.2% 35.2% 5.32%
County Indigent 1.6% 1.6% 1.4% 1.3% 1.4% -3.27%
Other Indigent 0.1% 0.1% 0.2% 0.3% 0.3% 22.34%
Other Payers 3.9% 3.7% 3.7% 3.6% 3.6% -2.22%
Source: “Annual Hospital Financial Data,” California Office of Statewide Health Planning and Development (OSHPD), Pivot Profiles with data selected for general acute care hospitals (Retrieved from http://www.oshpd.ca.gov/HQAD/Hospital/financial/hospAF.htm, October 2006). See Appendix A for detailed methodology. Notes: Excludes Kaiser data. Net patient revenue is adjusted by removing DSH transfer payments. Percentages may not total exactly 100 due to rounding.

Financial Health of California Hospitals 7-18 PricewaterhouseCoopers LLP
Payer mix is an important factor in describing high- and low-margin hospitals. Given the finding that commercial third-party adjusted net revenue, particularly for HMO and PPO managed care plans, is increasing relative to average cost while government payers have paid a declining proportion of cost (refer to Figure 4.4), hospitals with a higher proportion of commercial payers are more likely to report profits.
Figure 7.12 shows that the top quartile for high-margin hospitals derived a substantially greater share of their revenue from commercial payers. In 2005, third-party payer mix was almost 40 percent greater than the statewide median. At the same time, those payers that paid a declining proportion of costs were a decreasing part of these hospitals’ payer mix. While the Medicare proportion of net revenue was somewhat below the state median, at 29 percent in 2005 compared to about 31 percent statewide, the Medi-Cal (Medicaid) proportion was much lower. High-margin hospitals decreased their proportion of Medi-Cal, both traditional and managed care, by more than half, from 18.5 percent in 2001 to 7.2 percent in 2005. This compared to a state average of 19 to 20 percent.
Figure 7.12: Percent Distribution of Net Revenue by Payer Category for High-Margin Hospitals 2001–2005
0.0%
10.0%
20.0%
30.0%
40.0%
50.0%
60.0%
70.0%
Medicare Traditional 26.6% 28.3% 27.6% 24.6% 23.7%
Medicare Managed Care 8.9% 7.2% 5.9% 6.0% 5.4%
Medi-Cal Traditional 14.7% 10.0% 6.6% 5.5% 5.0%
Medi-Cal Managed Care 3.6% 3.3% 3.6% 2.8% 2.2%
County and Other Indigent 1.7% 0.9% 0.8% 1.0% 0.5%
Third Party and Other 44.4% 50.3% 55.5% 60.1% 63.2%
2001 2002 2003 2004 2005
Perc
ent o
f Net
Rev
enue
Source: “Annual Hospital Financial Data,” California Office of Statewide Health Planning and Development (OSHPD), Pivot Profiles with data selected for general acute care hospitals (Retrieved from http://www.oshpd.ca.gov/HQAD/Hospital/financial/hospAF.htm, October 2006). See Appendix A for detailed methodology. Note: Includes Kaiser data.

Financial Health of California Hospitals 7-19 PricewaterhouseCoopers LLP
In contrast, Figure 7.13 shows that the bottom quartile low-margin hospitals have almost the opposite mix — 35 percent commercial third-party payers and 63 percent government payers in 2005. For low-margin hospitals, the Medicare proportion of net revenue is near the state median, at 29 percent compared to about 31 percent statewide, The Medi-Cal (Medicaid) proportion, 34 percent, is more than 75 percent above the state average. The decline in the Medi-Cal proportion of net revenue and the increase in commercial third-party net revenue between 2004 and 2005 may suggest some future improvement, but it also reflects the difference in payment amount and trend for each payer.
Figure 7.13: Percent Distribution of Net Revenue by Payer Category for Low-Margin Hospitals 2001–2005
0.0%
10.0%
20.0%
30.0%
40.0%
50.0%
60.0%
70.0%
Medicare Traditional 21.5% 19.1% 21.4% 23.2% 24.8%
Medicare Managed Care 4.8% 3.5% 3.3% 3.3% 4.1%
Medi-Cal Traditional 36.6% 40.7% 38.7% 35.1% 29.4%
Medi-Cal Managed Care 3.2% 3.9% 4.1% 4.8% 4.5%
County and Other Indigent 3.5% 4.5% 3.1% 2.3% 2.0%
Third Party and Other 30.4% 28.2% 29.4% 31.4% 35.2%
2001 2002 2003 2004 2005
Perc
ent o
f Net
Rev
enue
Source: “Annual Hospital Financial Data,” California Office of Statewide Health Planning and Development (OSHPD), Pivot Profiles with data selected for general acute care hospitals (Retrieved from http://www.oshpd.ca.gov/HQAD/Hospital/financial/hospAF.htm, October 2006). See Appendix A for detailed methodology. Note: Includes Kaiser data.

Financial Health of California Hospitals 7-20 PricewaterhouseCoopers LLP
The OSHPD selected annual financial data can be used to report total net revenue per adjusted patient day, but does not permit analysis of net revenue by inpatient and outpatient service. The dollar value of the services can be analyzed using gross inpatient and outpatient revenue (hospital charges) only. To the extent the hospitals own and operate separately licensed freestanding clinics or ambulatory surgery centers, gross outpatient revenue may be underestimated because this ownership information is not included in their disclosure reports.166
Figure 7.14 shows that gross outpatient revenue grew more rapidly than inpatient, an average of nearly 16 percent a year, to nearly 28 percent of total gross revenue by 2005. This finding contrasts with that of the 1995–1999 study, when outpatient revenue growth remained steady. This rate of increase, based on total dollars, also reflects a decreasing number of general acute care hospitals between 2001 and 2005.
Substantial differences were evident for payer mix for outpatient and inpatient gross revenue. Medicare made up 29 to 30 percent of outpatient charges and more than 40 percent of inpatient charges. The commercial third-party payer proportions were nearly opposite, at about 45 percent of outpatient charges and 30 percent of inpatient. Medi-Cal (Medicare) made up about 15 percent of the outpatient charges and 22 to 23 percent of inpatient.

Financial Health of California Hospitals 7-21 PricewaterhouseCoopers LLP
Figure 7.14: Gross Outpatient Revenue/Gross Total Patient Revenue by Payer 2001–2005
Gross Outpatient Revenue 2001 2002 2003 2004 2005 CAGR
Medicare Traditional $5,972,179,194 $7,548,309,178 $9,506,848,633 $10,834,533,711 $12,449,114,455 20.16%
Medicare Managed Care $1,836,033,114 $1,755,970,858 $1,942,796,158 $1,937,153,649 $2,290,476,661 5.7%
Medi-Cal Traditional $2,741,109,987 $3,341,719,467 $4,119,424,575 $4,668,961,315 $5,174,915,299 17.2%
Medi-Cal Managed Care $1,290,312,550 $1,724,608,006 $2,286,138,724 $2,586,342,651 $2,951,361,781 23.0%
Other Third-Party Traditional $3,355,396,423 $3,562,222,404 $3,828,080,475 $4,073,780,458 $4,487,314,265 7.5%
Other Third-Party Managed Care $9,157,420,839 $11,330,593,484 $13,535,263,777 $15,004,161,311 $16,975,430,119 16.7%
County Indigent $1,066,234,495 $1,226,820,751 $1,357,236,412 $1,472,536,312 $1,492,431,309 8.8%
Other Indigent $151,180,817 $220,499,526 $289,201,547 $336,690,589 $445,274,322 31.0%
Other Payers $1,586,240,644 $1,696,260,270 $2,070,163,225 $2,382,634,014 $2,770,261,685 15.0%
Total $27,156,108,063 $32,407,003,944 $38,935,153,526 $43,296,794,010 $49,036,579,896 15.9%
Gross Inpatient Revenue 2001 2002 2003 2004 2005 CAGR
Medicare Traditional $24,611,466,800 $30,654,179,021 $38,208,434,807 $41,096,384,846 $44,885,170,100 16.2%
Medicare Managed Care $7,334,079,917 $7,024,903,759 $7,635,004,139 $7,736,033,391 $8,416,782,211 3.5%
Medi-Cal Traditional $14,113,606,450 $17,071,442,108 $20,464,626,146 $22,092,517,119 $23,648,760,331 13.8%
Medi-Cal Managed Care $2,890,005,870 $3,710,432,220 $4,660,154,283 $5,045,364,818 $5,746,543,631 18.7%
Other Third-Party Traditional $5,866,540,773 $5,342,425,502 $6,042,507,400 $6,347,831,783 $6,641,079,661 3.1%
Other Third-Party Managed Care $18,362,211,752 $22,624,088,877 $26,233,444,721 $28,641,019,889 $31,336,079,413 14.3%
County Indigent $2,386,101,168 $2,589,219,388 $2,896,660,143 $2,824,788,108 $2,783,419,932 3.9%
Other Indigent $457,480,403 $610,930,877 $922,339,111 $1,070,336,665 $1,293,353,355 29.7%
Other Payers $1,777,985,190 $1,904,287,748 $2,201,218,649 $2,458,091,912 $2,994,270,818 13.9%
Total $77,799,478,323 $91,531,909,500 $109,264,389,399 $117,312,368,531 $127,745,459,452 13.2%
Gross Total Inpatient Revenue 2001 2002 2003 2004 2005 CAGR
Medicare Traditional $30,583,645,994 $38,202,488,199 $47,715,283,440 $51,930,918,557 $57,334,284,555 17.0%
Medicare Managed Care $9,170,113,031 $8,780,874,617 $9,577,800,297 $9,673,187,040 $10,707,258,872 4.0%
Medi-Cal Traditional $16,854,716,437 $20,413,161,575 $24,584,050,721 $26,761,478,434 $28,823,675,630 14.4%
Medi-Cal Managed Care $4,180,318,420 $5,435,040,226 $6,946,293,007 $7,631,707,469 $8,697,905,412 20.1%
Other Third-Party Traditional $9,221,937,196 $8,904,647,906 $9,870,587,875 $10,421,612,241 $11,128,393,926 4.8%
Other Third-Party Managed Care $27,519,632,591 $33,954,682,361 $39,768,708,498 $43,645,181,200 $48,311,509,532 15.1%
County Indigent $3,452,335,663 $3,816,040,139 $4,253,896,555 $4,297,324,420 $4,275,851,241 5.5%
Other Indigent $608,661,220 $831,430,403 $1,211,540,658 $1,407,027,254 $1,738,627,677 30.0%
Other Payers $3,364,225,834 $3,600,548,018 $4,271,381,874 $4,840,725,926 $5,764,532,503 14.4%
Total $104,955,586,386 $123,938,913,444 $148,199,542,925 $160,609,162,541 $176,782,039,348 13.9%
Source: “Annual Hospital Financial Data,” California Office of Statewide Health Planning and Development (OSHPD), Pivot Profiles with data selected for general acute care hospitals (Retrieved from http://www.oshpd.ca.gov/HQAD/Hospital/financial/hospAF.htm, October 2006). See Appendix A for detailed methodology. Notes: Excludes Kaiser data. Net patient revenue is adjusted by removing DSH transfer payments. .

Financial Health of California Hospitals 7-22 PricewaterhouseCoopers LLP
Median Outpatient Gross Revenue Mix Trends by Typology Outpatient gross revenue mix trends provide a rough indicator of net outpatient distribution and revenue composition trends.167 Figure 7.15 presents the proportion of gross revenue billed through outpatient services.
In general, smaller hospitals, which include most district and rural hospitals, reported a higher proportion of gross revenue for outpatient services for the study period. For rural hospitals, half of the charges were for outpatient services. Hospitals in Northern and Sierra counties, predominantly smaller and rural, also had higher percentages of gross outpatient revenues when compared to other geographic regions. This trend reflected the typical pattern of care in smaller communities, where the local hospital, rather than freestanding reference labs or provider offices and clinics, is the common referral center for community physician laboratory and diagnostic services.
Overall, there was little year-to-year growth in the proportion of outpatient gross revenue within most hospital groupings. However, for the largest hospitals, those with more than 350 available beds, the proportion of outpatient charges increased from 22 to 25 percent, almost 3 percent per year. More dramatically, Sacramento area counties showed an increase in the proportion of outpatient charges from 27 to 36 percent, more than 7 percent per year.

Financial Health of California Hospitals 7-23 PricewaterhouseCoopers LLP
Figure 7.15: Median Outpatient Gross Revenues/Total Gross Revenues by Typology 2001–2005
2001 2002 2003 2004 2005 CAGR
Total 29.06% 29.24% 29.36% 29.66% 29.84% 0.67%
Hospital Size <150 available beds 41.34% 41.02% 42.93% 44.11% 45.11% 2.21%
151-250 available beds 26.14% 26.07% 26.04% 27.29% 27.96% 1.70%
251-350 available beds 24.04% 22.27% 23.92% 24.03% 25.08% 1.07%
350+ available beds 22.33% 24.14% 23.94% 24.75% 25.01% 2.87%
Type of Control City/County 31.68% 29.96% 28.56% 30.40% 30.24% -1.15%
District 42.20% 44.25% 44.85% 47.91% 46.93% 2.70%
Nonprofit 28.85% 29.51% 29.54% 29.66% 30.00% 0.98%
For-Profit 25.83% 25.88% 25.72% 25.36% 25.05% -0.76%
Rural versus Urban Rural 49.15% 49.54% 49.74% 50.87% 51.39% 1.12%
Urban 26.64% 26.50% 26.84% 26.95% 27.70% 0.97%
DSH versus Non-DSH DSH 27.53% 27.37% 26.94% 26.97% 27.80% 0.24%
Non-DSH 29.42% 30.51% 31.04% 30.95% 31.58% 1.79%
Geography (Region ) Central Coast Counties 33.27% 33.60% 35.20% 31.88% 33.38% 0.08%
Greater Bay Area Counties 29.19% 29.51% 30.07% 30.16% 31.17% 1.65%
Los Angeles County 23.00% 23.36% 23.10% 24.01% 24.00% 1.07%
Northern and Sierra Counties 48.78% 50.80% 50.92% 51.29% 51.78% 1.50%
Other Southern Counties 27.58% 30.05% 29.24% 29.86% 29.10% 1.35%
Sacramento Area Counties 26.95% 29.11% 31.89% 34.97% 35.75% 7.32%
San Joaquin Valley Counties 39.09% 38.72% 38.76% 37.58% 37.88% -0.78%
San Diego County 25.49% 25.23% 25.52% 25.11% 26.56% 1.04%
Orange County 25.96% 26.57% 26.49% 25.17% 27.26% 1.23%
Source: “Annual Hospital Financial Data,” California Office of Statewide Health Planning and Development (OSHPD), Pivot Profiles with data selected for general acute care hospitals (Retrieved from http://www.oshpd.ca.gov/HQAD/Hospital/financial/hospAF.htm, October 2006). See Appendix A for detailed methodology. Notes: Excludes Kaiser data. Net patient revenue is adjusted by removing DSH transfer payments. Percentages may not total exactly 100 due to rounding.
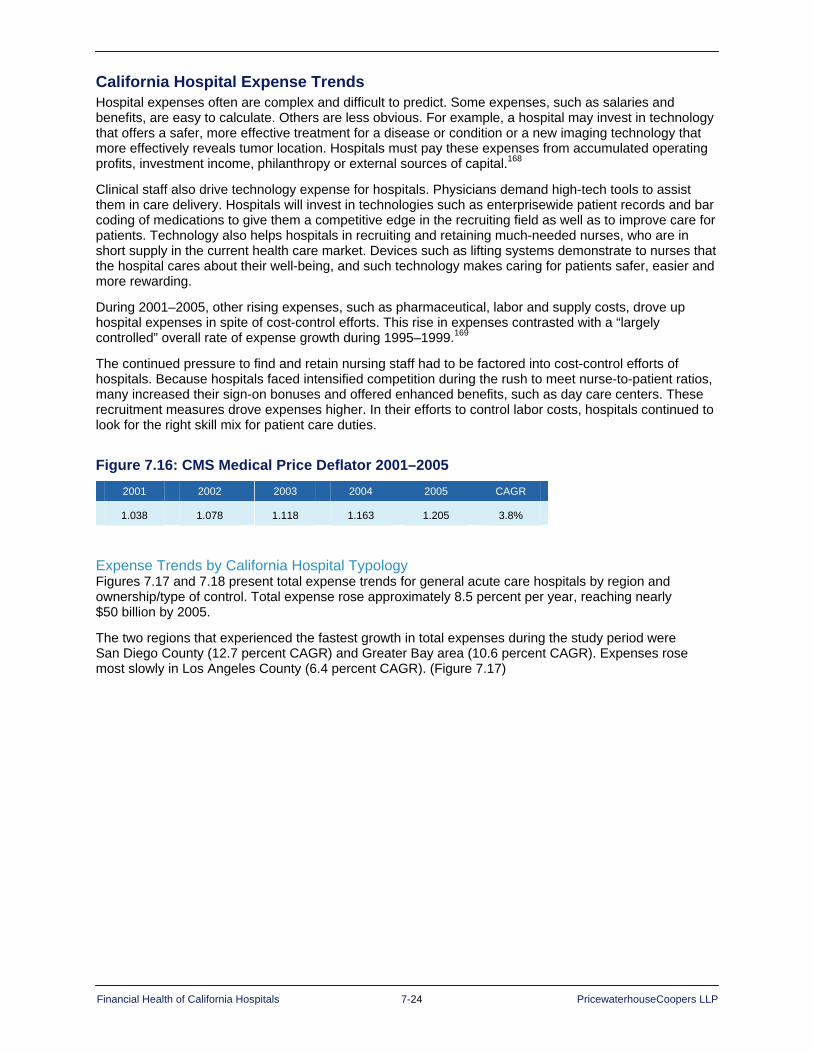
Financial Health of California Hospitals 7-24 PricewaterhouseCoopers LLP
California Hospital Expense Trends Hospital expenses often are complex and difficult to predict. Some expenses, such as salaries and benefits, are easy to calculate. Others are less obvious. For example, a hospital may invest in technology that offers a safer, more effective treatment for a disease or condition or a new imaging technology that more effectively reveals tumor location. Hospitals must pay these expenses from accumulated operating profits, investment income, philanthropy or external sources of capital.168
Clinical staff also drive technology expense for hospitals. Physicians demand high-tech tools to assist them in care delivery. Hospitals will invest in technologies such as enterprisewide patient records and bar coding of medications to give them a competitive edge in the recruiting field as well as to improve care for patients. Technology also helps hospitals in recruiting and retaining much-needed nurses, who are in short supply in the current health care market. Devices such as lifting systems demonstrate to nurses that the hospital cares about their well-being, and such technology makes caring for patients safer, easier and more rewarding.
During 2001–2005, other rising expenses, such as pharmaceutical, labor and supply costs, drove up hospital expenses in spite of cost-control efforts. This rise in expenses contrasted with a “largely controlled” overall rate of expense growth during 1995–1999.169
The continued pressure to find and retain nursing staff had to be factored into cost-control efforts of hospitals. Because hospitals faced intensified competition during the rush to meet nurse-to-patient ratios, many increased their sign-on bonuses and offered enhanced benefits, such as day care centers. These recruitment measures drove expenses higher. In their efforts to control labor costs, hospitals continued to look for the right skill mix for patient care duties.
Figure 7.16: CMS Medical Price Deflator 2001–2005 2001 2002 2003 2004 2005 CAGR
1.038 1.078 1.118 1.163 1.205 3.8%
Expense Trends by California Hospital Typology Figures 7.17 and 7.18 present total expense trends for general acute care hospitals by region and ownership/type of control. Total expense rose approximately 8.5 percent per year, reaching nearly $50 billion by 2005.
The two regions that experienced the fastest growth in total expenses during the study period were San Diego County (12.7 percent CAGR) and Greater Bay area (10.6 percent CAGR). Expenses rose most slowly in Los Angeles County (6.4 percent CAGR). (Figure 7.17)

Financial Health of California Hospitals 7-25 PricewaterhouseCoopers LLP
Figure 7.17: California Hospital Expenses by Region Region 2001 2002 2003 2004 2005 CAGR
Central Coast Counties $1,956,057,003 $2,156,542,636 $2,395,310,108 $2,485,649,025 $2,711,747,057 7.9%
Greater Bay Area Counties $8,338,823,040 $8,888,332,169 $9,986,383,235 $11,035,005,111 $12,018,217,739 10.6%
Los Angeles County $10,687,306,400 $11,415,574,330 $12,588,384,229 $13,094,536,342 $13,756,098,914 6.4%
Northern and Sierra Counties $1,455,169,261 $1,642,367,535 $1,792,617,683 $1,829,709,748 $2,039,981,010 7.5%
Orange County $2,715,167,768 $3,026,259,510 $3,230,059,961 $3,537,012,890 $3,791,660,645 7.8%
Other Southern Counties $2,821,195,533 $3,133,753,381 $3,405,357,305 $3,685,708,250 $3,903,293,802 7.6%
Sacramento Area Counties $1,889,706,722 $2,086,689,581 $2,366,619,507 $2,617,711,141 $2,742,821,304 9.5%
San Diego County $2,344,621,646 $2,643,499,942 $3,247,706,241 $3,544,605,244 $3,788,547,416 12.7%
San Joaquin Valley Counties $3,034,153,684 $3,433,961,826 $3,793,219,467 $4,134,718,134 $4,340,199,376 8.1%
All Hospitals $35,242,201,057 $38,426,980,910 $42,805,657,736 $45,964,655,885 $49,092,567,263 8.5%
Source: “Annual Hospital Financial Data,” California Office of Statewide Health Planning and Development (OSHPD), Pivot Profiles with data selected for general acute care hospitals (Retrieved from http://www.oshpd.ca.gov/HQAD/Hospital/financial/hospAF.htm, October 2006). See Appendix A for detailed methodology. Note: Excludes Kaiser data.
For-profit and city/county hospitals showed slower growth rates in expenses. District hospitals, although small, had the highest growth in expenses at 12.5 percent (Figure 7.18).
Figure 7.18: California Hospital Expenses by Type of Control Type of Control 2001 2002 2003 2004 2005 CAGR
City/County $4,236,348,316 $4,465,911,154 $4,765,298,086 $4,842,102,502 $5,177,776,797 5.1%
District $1,791,317,903 $1,977,764,868 $2,226,448,216 $2,465,542,783 $2,812,576,452 12.5%
Nonprofit $23,991,222,992 $25,883,323,306 $29,358,977,018 $32,127,459,764 $34,385,556,345 9.9%
For-Profit $5,223,311,846 $6,099,981,582 $6,454,934,416 $6,529,550,836 $6,716,657,669 3.3%
All Hospitals $35,242,201,057 $38,426,980,910 $42,805,657,736 $45,964,655,885 $49,092,567,263 8.5%
Source: “Annual Hospital Financial Data,” California Office of Statewide Health Planning and Development (OSHPD), Pivot Profiles with data selected for general acute care hospitals (Retrieved from http://www.oshpd.ca.gov/HQAD/Hospital/financial/hospAF.htm, October 2006). See Appendix A for detailed methodology. Note: Excludes Kaiser data.
As already note, median operating expense per adjusted patient day for California general acute care hospitals rose from $1,300 to $1,700 from 2001 to 2005 at an annual rate of 7.09 percent (Figure 7.17). Per-patient-day expense trends varied by hospital grouping, as follows:
Available bed size: Median operating expense increased with available bed size, but the medium-to-large hospitals (251–350 available beds) reported the highest total expense, 7.4 percent above the state median in 2005.
Ownership/type of control: District hospitals reported expenses approximately 60 percent of the state median, while city/county hospitals reported the highest expenses, up to $2,400 per day and more than 40 percent above the state median.
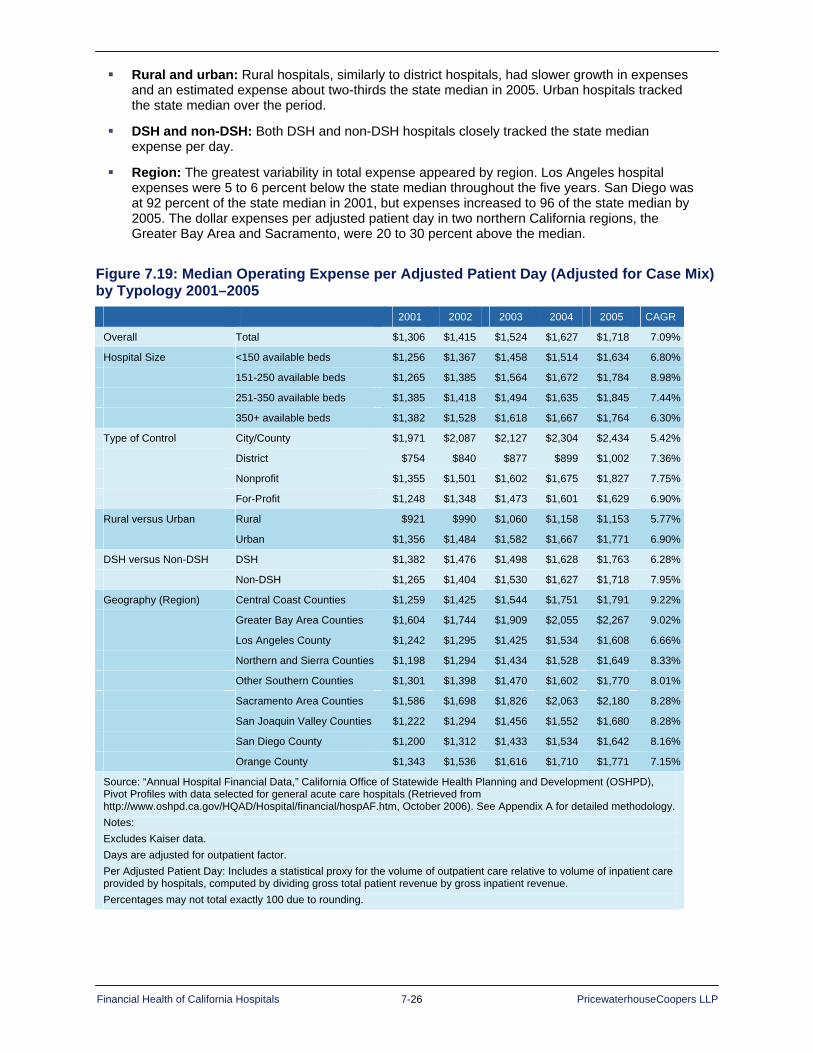
Financial Health of California Hospitals 7-26 PricewaterhouseCoopers LLP
Rural and urban: Rural hospitals, similarly to district hospitals, had slower growth in expenses and an estimated expense about two-thirds the state median in 2005. Urban hospitals tracked the state median over the period.
DSH and non-DSH: Both DSH and non-DSH hospitals closely tracked the state median expense per day.
Region: The greatest variability in total expense appeared by region. Los Angeles hospital expenses were 5 to 6 percent below the state median throughout the five years. San Diego was at 92 percent of the state median in 2001, but expenses increased to 96 of the state median by 2005. The dollar expenses per adjusted patient day in two northern California regions, the Greater Bay Area and Sacramento, were 20 to 30 percent above the median.
Figure 7.19: Median Operating Expense per Adjusted Patient Day (Adjusted for Case Mix) by Typology 2001–2005
2001 2002 2003 2004 2005 CAGR
Overall Total $1,306 $1,415 $1,524 $1,627 $1,718 7.09%
Hospital Size <150 available beds $1,256 $1,367 $1,458 $1,514 $1,634 6.80%
151-250 available beds $1,265 $1,385 $1,564 $1,672 $1,784 8.98%
251-350 available beds $1,385 $1,418 $1,494 $1,635 $1,845 7.44%
350+ available beds $1,382 $1,528 $1,618 $1,667 $1,764 6.30%
Type of Control City/County $1,971 $2,087 $2,127 $2,304 $2,434 5.42%
District $754 $840 $877 $899 $1,002 7.36%
Nonprofit $1,355 $1,501 $1,602 $1,675 $1,827 7.75%
For-Profit $1,248 $1,348 $1,473 $1,601 $1,629 6.90%
Rural versus Urban Rural $921 $990 $1,060 $1,158 $1,153 5.77%
Urban $1,356 $1,484 $1,582 $1,667 $1,771 6.90%
DSH versus Non-DSH DSH $1,382 $1,476 $1,498 $1,628 $1,763 6.28%
Non-DSH $1,265 $1,404 $1,530 $1,627 $1,718 7.95%
Geography (Region) Central Coast Counties $1,259 $1,425 $1,544 $1,751 $1,791 9.22%
Greater Bay Area Counties $1,604 $1,744 $1,909 $2,055 $2,267 9.02%
Los Angeles County $1,242 $1,295 $1,425 $1,534 $1,608 6.66%
Northern and Sierra Counties $1,198 $1,294 $1,434 $1,528 $1,649 8.33%
Other Southern Counties $1,301 $1,398 $1,470 $1,602 $1,770 8.01%
Sacramento Area Counties $1,586 $1,698 $1,826 $2,063 $2,180 8.28%
San Joaquin Valley Counties $1,222 $1,294 $1,456 $1,552 $1,680 8.28%
San Diego County $1,200 $1,312 $1,433 $1,534 $1,642 8.16%
Orange County $1,343 $1,536 $1,616 $1,710 $1,771 7.15%
Source: “Annual Hospital Financial Data,” California Office of Statewide Health Planning and Development (OSHPD), Pivot Profiles with data selected for general acute care hospitals (Retrieved from http://www.oshpd.ca.gov/HQAD/Hospital/financial/hospAF.htm, October 2006). See Appendix A for detailed methodology. Notes: Excludes Kaiser data. Days are adjusted for outpatient factor. Per Adjusted Patient Day: Includes a statistical proxy for the volume of outpatient care relative to volume of inpatient care provided by hospitals, computed by dividing gross total patient revenue by gross inpatient revenue. Percentages may not total exactly 100 due to rounding.
Financial Health of California Hospitals 7-27 PricewaterhouseCoopers LLP
Distribution of Expenses by Category This study uses the OSHPD classifications to break down total expenses into 11 main categories:
1. Salaries and wages
2. Employee benefits
3. Physician professional fees
4. Other professional fees
5. Supplies
6. Purchased services
7. Depreciation
8. Leases and rentals
9. Insurance (hospital and professional malpractice)
10. Interest (working capital and other)
11. Other
Expenses within these 11 main categories, such as pharmaceutical supply costs, are not reported and are difficult to track because hospital cost-accounting systems usually do not allocate expenses on a per-patient basis. Many expenses are reported as overhead rather than direct expenses. Examples are administrative services, information technology and standby capacity in ancillary departments. Additionally, hospitals usually do not allocate and report costs between inpatient and outpatient settings.170
The distribution of expenses was fairly constant during the study period.
• Salaries and wages consumed the largest single share at 36.7 percent in 2005, while employee benefits rose to 15 percent of expenses. Benefits, which included vacation, health care and pension plans for hospital employees was the fastest-growing category, increasing at an average annual rate of 16.1 percent. Salaries and wages grew at an annual rate of 8.4 percent. Supplemental interview findings revealed that for some lower-level employees, the cost of benefits exceeded wages.
• Supplies represented 16 percent of expenses throughout the period.
• Other professional fees and depreciation were each approximately 4 percent of expenses, and physician professional fees were 3 percent.
• Leases and rentals, interest and working capital, and insurance were each 1.5 percent or less.

Financial Health of California Hospitals 7-28 PricewaterhouseCoopers LLP
Figure 7.20 compares the distribution of hospital expense categories for 2001 and 2005.
Figure 7.20: California Hospital Expenses by Expense Category 2001 2002 2003 2004 2005 CAGR
Salaries and Wages $13,072,897,039 $14,151,718,824 $15,596,136,923 $16,818,049,620 $18,039,827,911 8.4%
Employee Benefits $4,256,252,024 $4,841,023,042 $6,193,579,590 $6,983,188,790 $7,573,285,914 16.1%
Physician Professional Fees $982,021,880 $1,071,716,748 $1,220,069,637 $1,314,196,377 $1,405,721,716 9.5%
Other Professional Fees $1,443,683,516 $1,788,560,035 $2,081,405,185 $2,081,507,982 $2,186,112,609 6.9%
Supplies $5,773,795,893 $6,250,767,477 $6,944,850,241 $7,482,225,855 $8,039,017,474 8.7%
Purchased Services $4,876,384,844 $5,219,059,826 $5,375,479,279 $5,673,636,242 $6,113,780,806 5.4%
Depreciation $1,751,237,464 $1,807,849,318 $1,863,793,222 $1,901,618,284 $2,001,491,166 3.4%
Leases and Rentals $529,137,789 $558,442,663 $602,409,341 $619,755,932 $680,455,366 6.8%
Insurance: Hospital and Professional Malpractice $269,306,469 $368,330,783 $449,014,181 $553,840,069 $457,265,388 7.5%
Interest: Working Capital and Other $697,478,232 $657,301,937 $666,662,950 $681,227,942 $718,395,544 3.0%
All Other $1,590,005,907 $1,712,210,257 $1,812,257,187 $1,855,408,792 $1,877,213,369 3.1%
Total $35,242,201,057 $38,426,980,910 $42,805,657,736 $45,964,655,885 $49,092,567,263 8.5%
Percent of Total Expenses 2001 2002 2003 2004 2005 CAGR
Salaries and Wages 37.1% 36.8% 36.4% 36.6% 36.7% -0.2%
Employee Benefits 12.1% 12.6% 14.5% 15.2% 15.4% 6.3%
Physician Professional Fees 2.8% 2.8% 2.9% 2.9% 2.9% 0.7%
Other Professional Fees 4.1% 4.7% 4.9% 4.5% 4.5% 2.1%
Supplies 16.4% 16.3% 16.2% 16.3% 16.4% 0.0%
Purchased Services 13.8% 13.6% 12.6% 12.3% 12.5% -2.6%
Depreciation 5.0% 4.7% 4.4% 4.1% 4.1% -4.8%
Leases and Rentals 1.5% 1.5% 1.4% 1.3% 1.4% -2.0%
Insurance: Hospital and Professional Malpractice 0.8% 1.0% 1.0% 1.2% 0.9% 5.1%
Interest: Working Capital and Other 2.0% 1.7% 1.6% 1.5% 1.5% -7.3%
All Other 4.5% 4.5% 4.2% 4.0% 3.8% -4.1%
Source: “Annual Hospital Financial Data,” California Office of Statewide Health Planning and Development (OSHPD), Pivot Profiles with data selected for general acute care hospitals (Retrieved from http://www.oshpd.ca.gov/HQAD/Hospital/financial/hospAF.htm, October 2006). See Appendix A for detailed methodology. Notes: Excludes Kaiser data. Percentages may not total exactly 100 due to rounding.

Financial Health of California Hospitals 7-29 PricewaterhouseCoopers LLP
Figure 7.21: California Hospital Expenses by Expense Category 2001 and 2005
Insurance: Hospital and Professional Malpractice
1%Interest: Working Capital
and Other1%
All Other4%
Salaries and Wages 38%
Employee Benefits15%
Other Professional Fees4% Physician Professional
Fees 3 %
Supplies 17%
Purchased Services 12%
Depreciation 4%
Leases and Rentals 1%
California Hospital Expenses by Expense Category in 2001
Insurance: Hospital andMedical Malpractice
1%
Interest: Working Capitaland Other
2% All Other
5%
Salaries and Wages36%
Employee Benefits12%
Other Professional Fees4%
Physician Professional Fees3%
Supplies 16%
Purchased Services 14%
Depreciation 5%
Leases and Rentals 2%
California Hospital Expenses by Expense Category in 2005
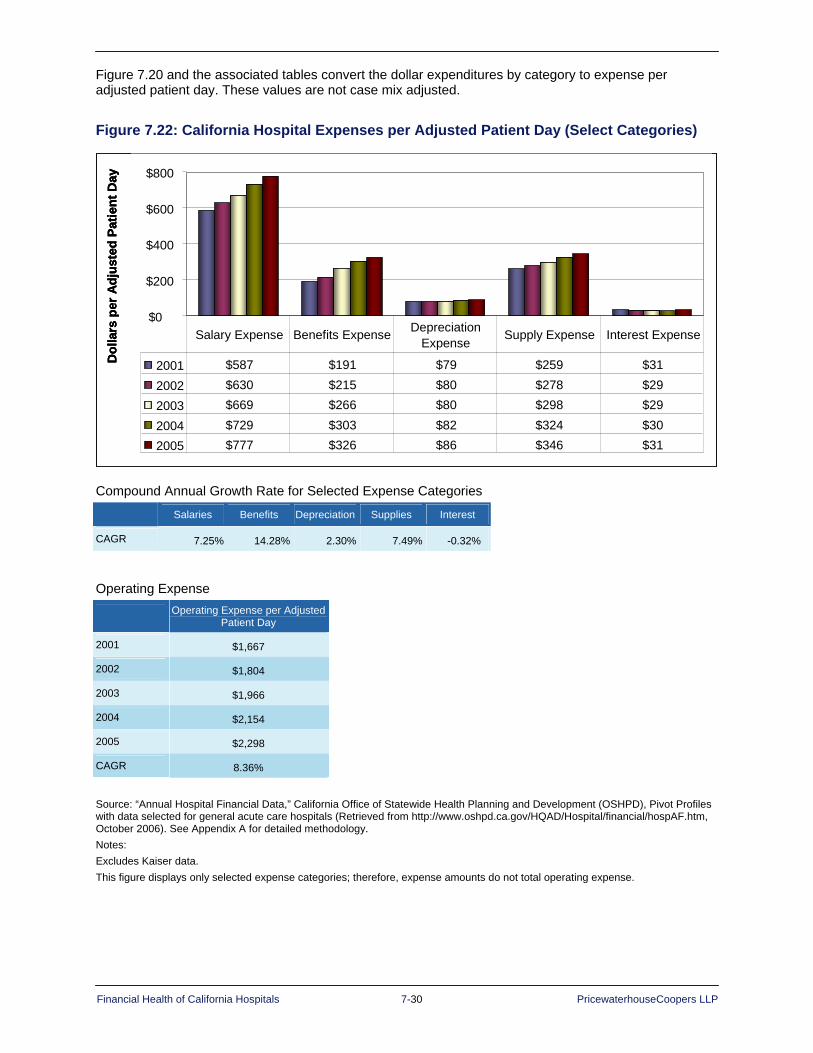
Financial Health of California Hospitals 7-30 PricewaterhouseCoopers LLP
Figure 7.20 and the associated tables convert the dollar expenditures by category to expense per adjusted patient day. These values are not case mix adjusted.
Figure 7.22: California Hospital Expenses per Adjusted Patient Day (Select Categories)
$-
$200
$400
$600
$800
2001 $587 $191 $79 $259 $31
2002 $630 $215 $80 $278 $29 2003 $669 $266 $80 $298 $29
2004 $729 $303 $82 $324 $30 2005 $777 $326 $86 $346 $31
Salary Expense Benefits Expense Depreciation Expense Supply Expense Interest Expense
Dol
lars
per
Adj
uste
d Pa
tient
Day
0$-
$200
$400
$600
$800
2001 $587 $191 $79 $259 $31
2002 $630 $215 $80 $278 $29 2003 $669 $266 $80 $298 $29
2004 $729 $303 $82 $324 $30 2005 $777 $326 $86 $346 $31
Salary Expense Benefits Expense Depreciation Expense Supply Expense Interest Expense
Dol
lars
per
Adj
uste
d Pa
tient
Day
$-
$200
$400
$600
$800
2001 $587 $191 $79 $259 $31
2002 $630 $215 $80 $278 $29 2003 $669 $266 $80 $298 $29
2004 $729 $303 $82 $324 $30 2005 $777 $326 $86 $346 $31
Salary Expense Benefits Expense Depreciation Expense Supply Expense Interest Expense
Dol
lars
per
Adj
uste
d Pa
tient
Day
0
Compound Annual Growth Rate for Selected Expense Categories
Salaries Benefits Depreciation Supplies Interest
CAGR 7.25% 14.28% 2.30% 7.49% -0.32%
Operating Expense
Operating Expense per Adjusted
Patient Day
2001 $1,667
2002 $1,804
2003 $1,966
2004 $2,154
2005 $2,298
CAGR 8.36%
Source: “Annual Hospital Financial Data,” California Office of Statewide Health Planning and Development (OSHPD), Pivot Profiles with data selected for general acute care hospitals (Retrieved from http://www.oshpd.ca.gov/HQAD/Hospital/financial/hospAF.htm, October 2006). See Appendix A for detailed methodology. Notes: Excludes Kaiser data. This figure displays only selected expense categories; therefore, expense amounts do not total operating expense.
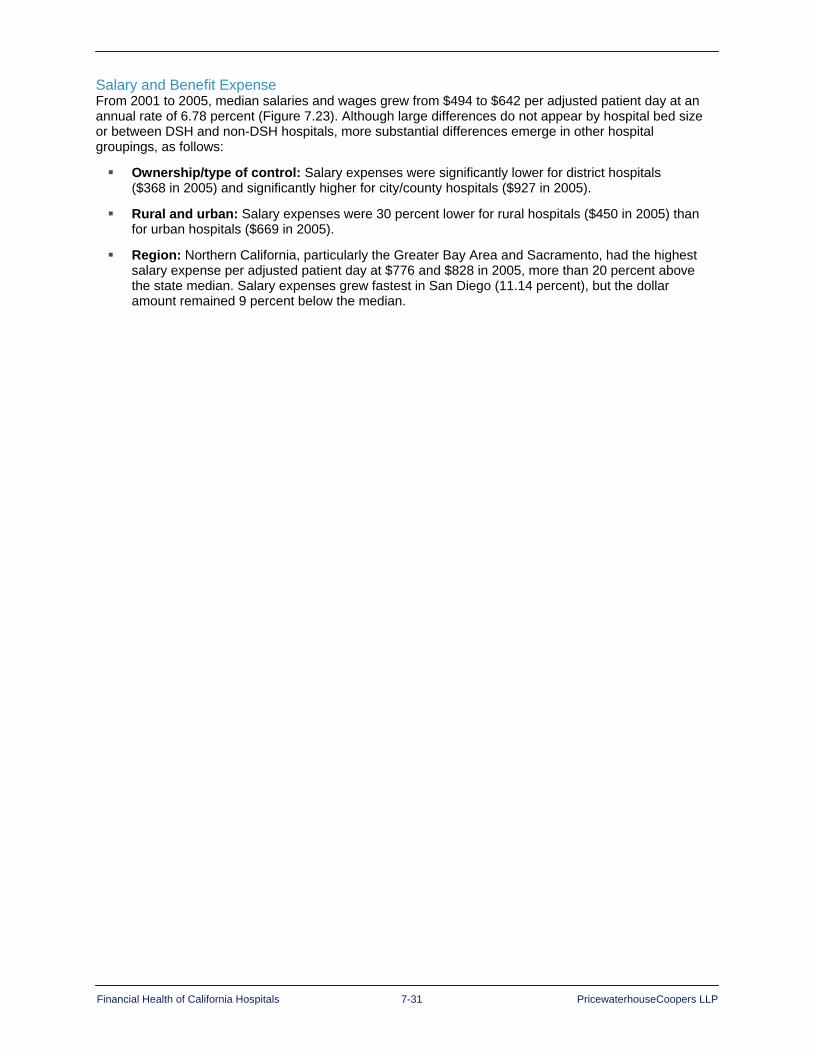
Financial Health of California Hospitals 7-31 PricewaterhouseCoopers LLP
Salary and Benefit Expense From 2001 to 2005, median salaries and wages grew from $494 to $642 per adjusted patient day at an annual rate of 6.78 percent (Figure 7.23). Although large differences do not appear by hospital bed size or between DSH and non-DSH hospitals, more substantial differences emerge in other hospital groupings, as follows:
Ownership/type of control: Salary expenses were significantly lower for district hospitals ($368 in 2005) and significantly higher for city/county hospitals ($927 in 2005).
Rural and urban: Salary expenses were 30 percent lower for rural hospitals ($450 in 2005) than for urban hospitals ($669 in 2005).
Region: Northern California, particularly the Greater Bay Area and Sacramento, had the highest salary expense per adjusted patient day at $776 and $828 in 2005, more than 20 percent above the state median. Salary expenses grew fastest in San Diego (11.14 percent), but the dollar amount remained 9 percent below the median.

Financial Health of California Hospitals 7-32 PricewaterhouseCoopers LLP
Figure 7.23: Median Salary and Wages per Adjusted Patient Day (Adjusted for Case Mix) by Typology 2001–2005
2001 2002 2003 2004 2005 CAGR
Overall Total $494 $520 $551 $609 $642 6.78%
Hospital Size <150 available beds $482 $511 $525 $561 $613 6.17%
151-250 available beds $490 $532 $571 $651 $669 8.10%
251-350 available beds $513 $522 $558 $602 $656 6.34%
350+ available beds $507 $560 $563 $619 $662 6.91%
Type of Control City/County $728 $804 $848 $919 $927 6.25%
District $283 $351 $319 $340 $368 6.87%
Nonprofit $507 $551 $578 $635 $696 8.24%
For-Profit $479 $508 $536 $583 $616 6.48%
Rural versus Urban Rural $345 $409 $420 $418 $450 6.89%
Urban $505 $542 $565 $624 $669 7.29%
DSH versus Non-DSH DSH $509 $545 $578 $652 $698 8.22%
Non-DSH $479 $512 $543 $585 $626 6.93%
Geography (Region) Central Coast Counties $479 $514 $609 $604 $663 8.44%
Greater Bay Area Counties $596 $617 $650 $771 $776 6.83%
Los Angeles County $452 $474 $525 $567 $612 7.91%
Northern and Sierra Counties $447 $477 $517 $543 $605 7.82%
Other Southern Counties $479 $525 $523 $558 $600 5.81%
Sacramento Area Counties $586 $635 $697 $764 $828 9.00%
San Joaquin Valley Counties $484 $540 $564 $619 $688 9.17%
San Diego County $386 $445 $479 $553 $588 11.14%
Orange County $518 $561 $585 $668 $673 6.79%
Source: “Annual Hospital Financial Data,” California Office of Statewide Health Planning and Development (OSHPD), Pivot Profiles with data selected for general acute care hospitals (Retrieved from http://www.oshpd.ca.gov/HQAD/Hospital/financial/hospAF.htm, October 2006). See Appendix A for detailed methodology. Notes: Excludes Kaiser data. Days were adjusted for outpatients (Adjustment Factor = Gross Patient Revenue/Gross Inpatient Revenue). Hospital is excluded if it did not report expense or day information (excludes individual Kaiser facilities) or CMI data. Per Adjusted Patient Day: Includes a statistical proxy for the volume of outpatient care relative to volume of inpatient care provided by hospitals, computed by dividing gross total patient revenue by gross inpatient revenue.
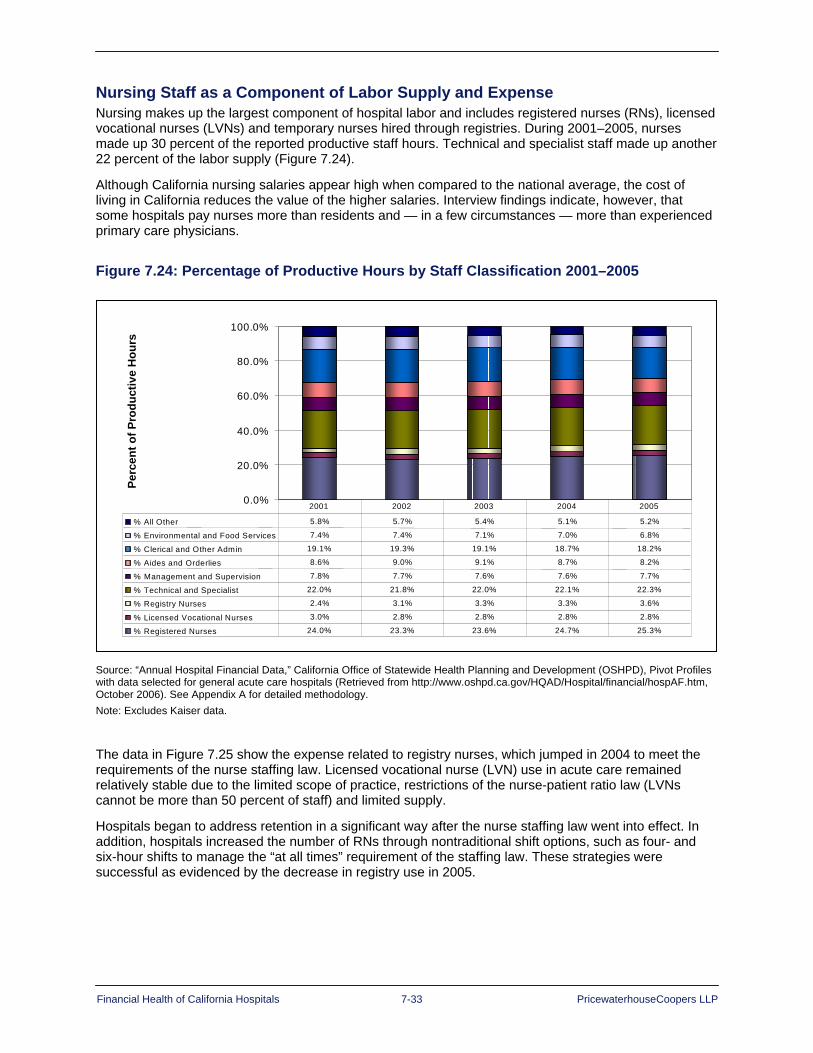
Financial Health of California Hospitals 7-33 PricewaterhouseCoopers LLP
Nursing Staff as a Component of Labor Supply and Expense
Nursing makes up the largest component of hospital labor and includes registered nurses (RNs), licensed vocational nurses (LVNs) and temporary nurses hired through registries. During 2001–2005, nurses made up 30 percent of the reported productive staff hours. Technical and specialist staff made up another 22 percent of the labor supply (Figure 7.24).
Although California nursing salaries appear high when compared to the national average, the cost of living in California reduces the value of the higher salaries. Interview findings indicate, however, that some hospitals pay nurses more than residents and — in a few circumstances — more than experienced primary care physicians.
Figure 7.24: Percentage of Productive Hours by Staff Classification 2001–2005
Perc
ent o
f Pro
duct
ive
Hou
rs
0.0%
20.0%
40.0%
60.0%
80.0%
100.0%
% All Other 5.8% 5.7% 5.4% 5.1% 5.2%
% Environmental and Food Services 7.4% 7.4% 7.1% 7.0% 6.8%
% Clerical and Other Admin 19.1% 19.3% 19.1% 18.7% 18.2%
% Aides and Orderlies 8.6% 9.0% 9.1% 8.7% 8.2%
% Management and Supervision 7.8% 7.7% 7.6% 7.6% 7.7%
% Technical and Specialist 22.0% 21.8% 22.0% 22.1% 22.3%
% Registry Nurses 2.4% 3.1% 3.3% 3.3% 3.6%
% Licensed Vocational Nurses 3.0% 2.8% 2.8% 2.8% 2.8%
% Registered Nurses 24.0% 23.3% 23.6% 24.7% 25.3%
2001 2002 2003 2004 2005
Perc
ent o
f Pro
duct
ive
Hou
rs
0.0%
20.0%
40.0%
60.0%
80.0%
100.0%
% All Other 5.8% 5.7% 5.4% 5.1% 5.2%
% Environmental and Food Services 7.4% 7.4% 7.1% 7.0% 6.8%
% Clerical and Other Admin 19.1% 19.3% 19.1% 18.7% 18.2%
% Aides and Orderlies 8.6% 9.0% 9.1% 8.7% 8.2%
% Management and Supervision 7.8% 7.7% 7.6% 7.6% 7.7%
% Technical and Specialist 22.0% 21.8% 22.0% 22.1% 22.3%
% Registry Nurses 2.4% 3.1% 3.3% 3.3% 3.6%
% Licensed Vocational Nurses 3.0% 2.8% 2.8% 2.8% 2.8%
% Registered Nurses 24.0% 23.3% 23.6% 24.7% 25.3%
2001 2002 2003 2004 2005
Source: “Annual Hospital Financial Data,” California Office of Statewide Health Planning and Development (OSHPD), Pivot Profiles with data selected for general acute care hospitals (Retrieved from http://www.oshpd.ca.gov/HQAD/Hospital/financial/hospAF.htm, October 2006). See Appendix A for detailed methodology. Note: Excludes Kaiser data.
The data in Figure 7.25 show the expense related to registry nurses, which jumped in 2004 to meet the requirements of the nurse staffing law. Licensed vocational nurse (LVN) use in acute care remained relatively stable due to the limited scope of practice, restrictions of the nurse-patient ratio law (LVNs cannot be more than 50 percent of staff) and limited supply.
Hospitals began to address retention in a significant way after the nurse staffing law went into effect. In addition, hospitals increased the number of RNs through nontraditional shift options, such as four- and six-hour shifts to manage the “at all times” requirement of the staffing law. These strategies were successful as evidenced by the decrease in registry use in 2005.

Financial Health of California Hospitals 7-34 PricewaterhouseCoopers LLP
Figure 7.25: Percentage of Total Nursing Hours by Staff Classification 2001–2005
0.0%
20.0%
40.0%
60.0%
80.0%
100.0%
2001 81.9% 9.9% 8.2%
2002 80.0% 9.4% 10.6%
2003 80.0% 9.2% 10.9%
2004 75.2% 8.7% 16.1%
2005 80.6% 8.4% 10.9%
Registered Nurses Hours Licensed Vocational Nurses Hours Registry Nurses Hours
Perc
ent o
f Nur
sing
Hou
rs
0.0%
20.0%
40.0%
60.0%
80.0%
100.0%
2001 81.9% 9.9% 8.2%
2002 80.0% 9.4% 10.6%
2003 80.0% 9.2% 10.9%
2004 75.2% 8.7% 16.1%
2005 80.6% 8.4% 10.9%
Registered Nurses Hours Licensed Vocational Nurses Hours Registry Nurses Hours
Perc
ent o
f Nur
sing
Hou
rs
Source: “Annual Hospital Financial Data,” California Office of Statewide Health Planning and Development (OSHPD), Pivot Profiles with data selected for general acute care hospitals (Retrieved from http://www.oshpd.ca.gov/HQAD/Hospital/financial/hospAF.htm, October 2006). See Appendix A for detailed methodology. Note: Includes Kaiser data.
Nursing Hours by Staff Classification
Year Registered Nurses (RNs) Licensed Vocational Nurses (LVNs) Registry Nurses
2001 144,245,305 17,432,094 14,527,697
2002 144,786,586 16,998,828 19,238,659
2003 154,376,924 17,714,314 20,954,238
2004 162,787,992 18,833,778 34,931,451
2005 170,286,877 17,811,084 23,046,024
Total 776,483,684 88,790,098 112,698,069
CAGR -0.4% -3.9% 7.35
Source: “Annual Hospital Financial Data,” California Office of Statewide Health Planning and Development (OSHPD), Pivot Profiles with data selected for general acute care hospitals (Retrieved from http://www.oshpd.ca.gov/HQAD/Hospital/financial/hospAF.htm, October 2006). See Appendix A for detailed methodology. Note: Includes Kaiser data.
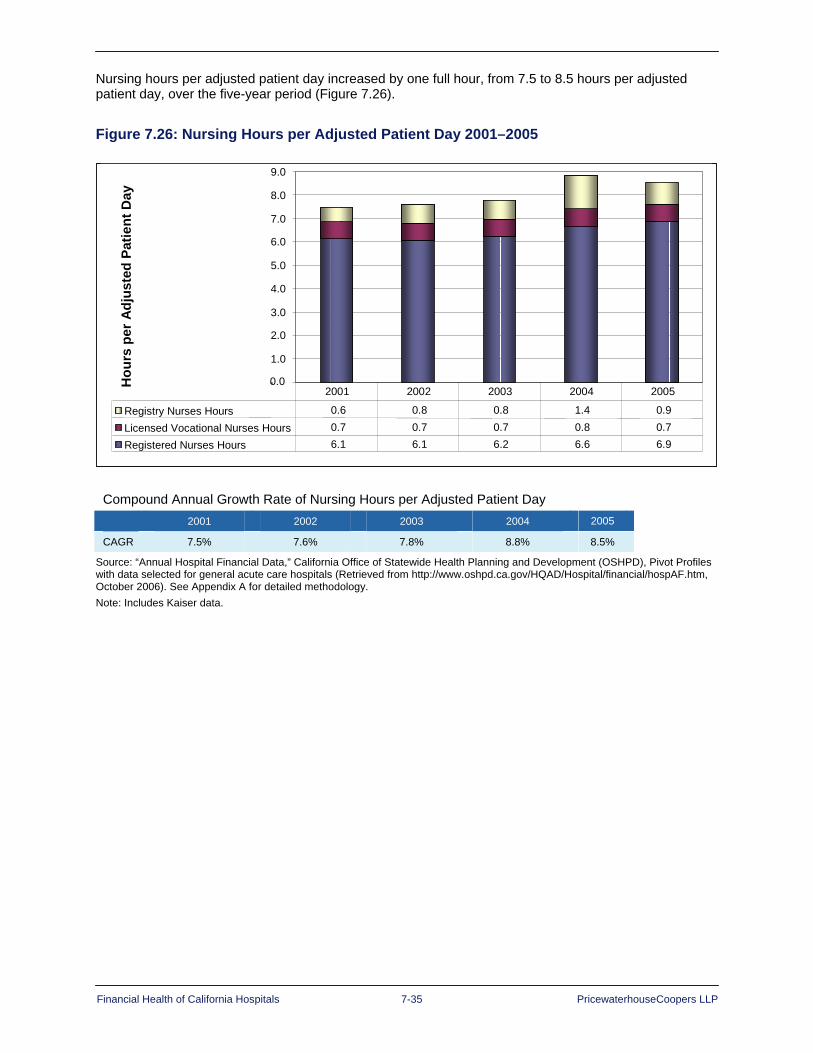
Financial Health of California Hospitals 7-35 PricewaterhouseCoopers LLP
Nursing hours per adjusted patient day increased by one full hour, from 7.5 to 8.5 hours per adjusted patient day, over the five-year period (Figure 7.26).
Figure 7.26: Nursing Hours per Adjusted Patient Day 2001–2005 H
ours
per
Adj
uste
d Pa
tient
Day
0.0-
1.0
2.0
3.0
4.0
5.0
6.0
7.0
8.0
9.0
Registry Nurses Hours 0.6 0.8 0.8 1.4 0.9 Licensed Vocational Nurses Hours 0.7 0.7 0.7 0.8 0.7 Registered Nurses Hours 6.1 6.1 6.2 6.6 6.9
2001 2002 2003 2004 2005
Hou
rs p
er A
djus
ted
Patie
nt D
ay
0.0-
1.0
2.0
3.0
4.0
5.0
6.0
7.0
8.0
9.0
Registry Nurses Hours 0.6 0.8 0.8 1.4 0.9 Licensed Vocational Nurses Hours 0.7 0.7 0.7 0.8 0.7 Registered Nurses Hours 6.1 6.1 6.2 6.6 6.9
2001 2002 2003 2004 2005
Compound Annual Growth Rate of Nursing Hours per Adjusted Patient Day
2001 2002 2003 2004 2005
CAGR 7.5% 7.6% 7.8% 8.8% 8.5%
Source: “Annual Hospital Financial Data,” California Office of Statewide Health Planning and Development (OSHPD), Pivot Profiles with data selected for general acute care hospitals (Retrieved from http://www.oshpd.ca.gov/HQAD/Hospital/financial/hospAF.htm, October 2006). See Appendix A for detailed methodology. Note: Includes Kaiser data.
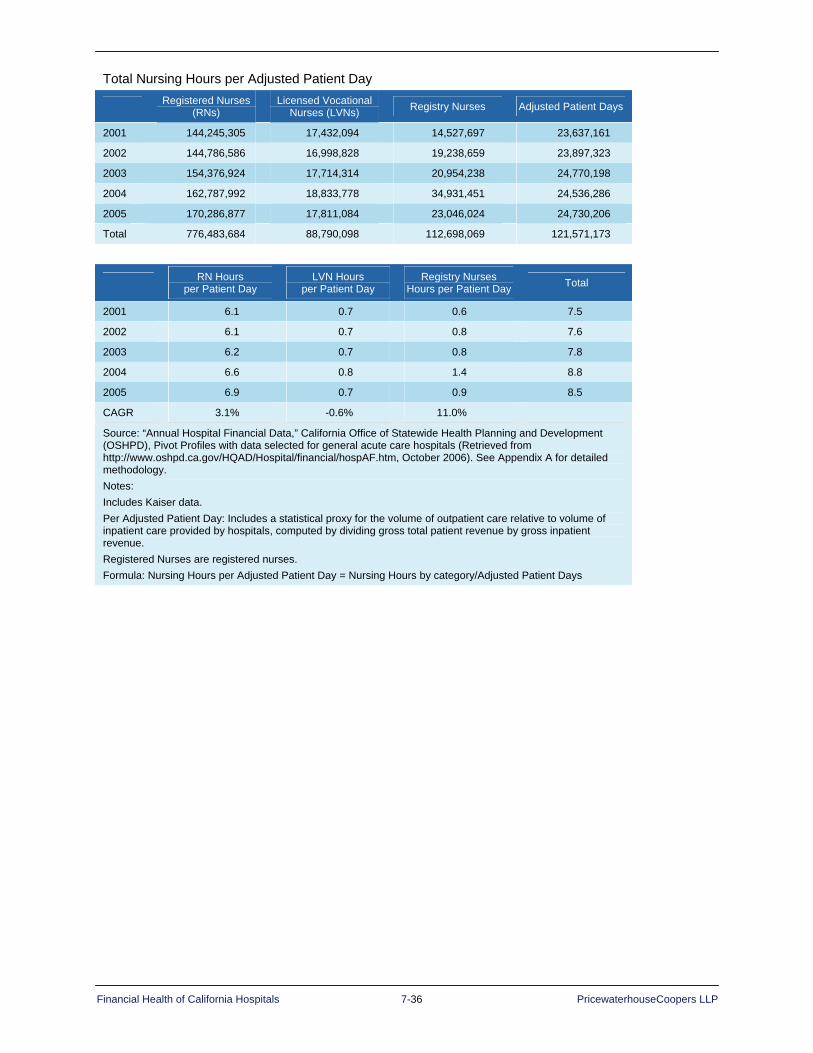
Financial Health of California Hospitals 7-36 PricewaterhouseCoopers LLP
Total Nursing Hours per Adjusted Patient Day
Registered Nurses (RNs)
Licensed Vocational Nurses (LVNs) Registry Nurses Adjusted Patient Days
2001 144,245,305 17,432,094 14,527,697 23,637,161
2002 144,786,586 16,998,828 19,238,659 23,897,323
2003 154,376,924 17,714,314 20,954,238 24,770,198
2004 162,787,992 18,833,778 34,931,451 24,536,286
2005 170,286,877 17,811,084 23,046,024 24,730,206
Total 776,483,684 88,790,098 112,698,069 121,571,173
RN Hours per Patient Day
LVN Hours per Patient Day
Registry Nurses Hours per Patient Day Total
2001 6.1 0.7 0.6 7.5
2002 6.1 0.7 0.8 7.6
2003 6.2 0.7 0.8 7.8
2004 6.6 0.8 1.4 8.8
2005 6.9 0.7 0.9 8.5
CAGR 3.1% -0.6% 11.0%
Source: “Annual Hospital Financial Data,” California Office of Statewide Health Planning and Development (OSHPD), Pivot Profiles with data selected for general acute care hospitals (Retrieved from http://www.oshpd.ca.gov/HQAD/Hospital/financial/hospAF.htm, October 2006). See Appendix A for detailed methodology. Notes: Includes Kaiser data. Per Adjusted Patient Day: Includes a statistical proxy for the volume of outpatient care relative to volume of inpatient care provided by hospitals, computed by dividing gross total patient revenue by gross inpatient revenue. Registered Nurses are registered nurses. Formula: Nursing Hours per Adjusted Patient Day = Nursing Hours by category/Adjusted Patient Days
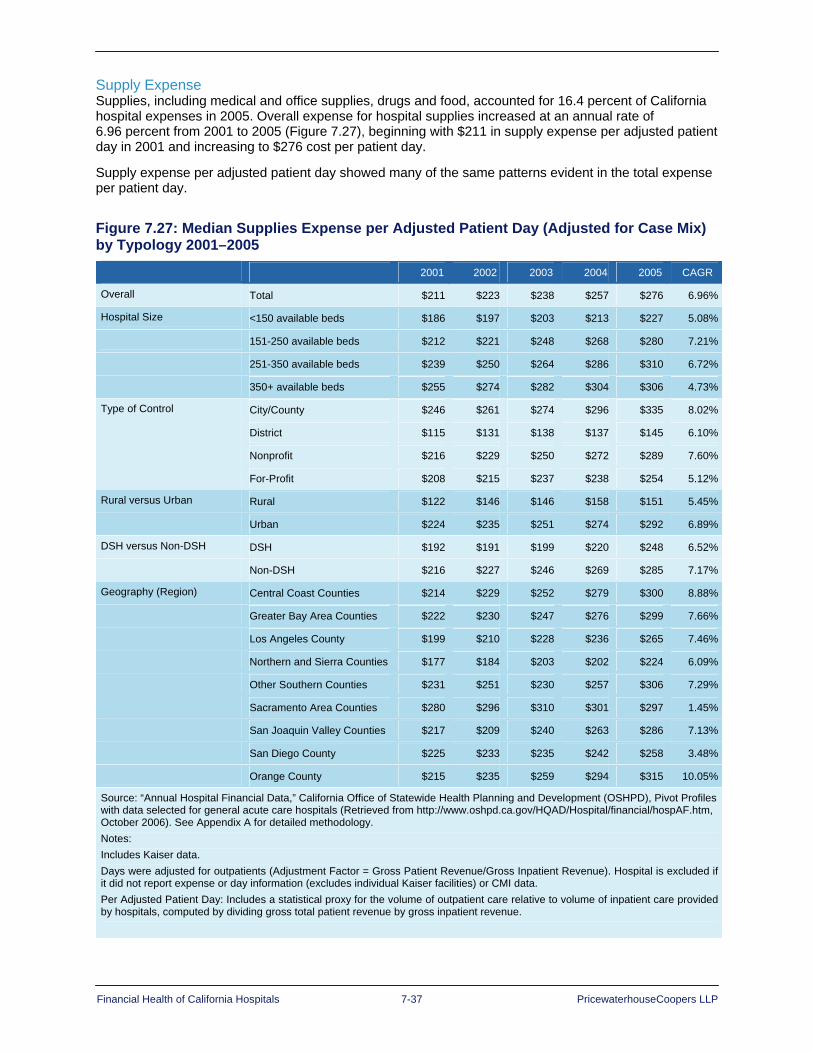
Financial Health of California Hospitals 7-37 PricewaterhouseCoopers LLP
Supply Expense Supplies, including medical and office supplies, drugs and food, accounted for 16.4 percent of California hospital expenses in 2005. Overall expense for hospital supplies increased at an annual rate of 6.96 percent from 2001 to 2005 (Figure 7.27), beginning with $211 in supply expense per adjusted patient day in 2001 and increasing to $276 cost per patient day.
Supply expense per adjusted patient day showed many of the same patterns evident in the total expense per patient day.
Figure 7.27: Median Supplies Expense per Adjusted Patient Day (Adjusted for Case Mix) by Typology 2001–2005
2001 2002 2003 2004 2005 CAGR
Overall Total $211 $223 $238 $257 $276 6.96%
Hospital Size <150 available beds $186 $197 $203 $213 $227 5.08%
151-250 available beds $212 $221 $248 $268 $280 7.21%
251-350 available beds $239 $250 $264 $286 $310 6.72%
350+ available beds $255 $274 $282 $304 $306 4.73%
Type of Control City/County $246 $261 $274 $296 $335 8.02%
District $115 $131 $138 $137 $145 6.10%
Nonprofit $216 $229 $250 $272 $289 7.60%
For-Profit $208 $215 $237 $238 $254 5.12%
Rural versus Urban Rural $122 $146 $146 $158 $151 5.45%
Urban $224 $235 $251 $274 $292 6.89%
DSH versus Non-DSH DSH $192 $191 $199 $220 $248 6.52%
Non-DSH $216 $227 $246 $269 $285 7.17%
Geography (Region) Central Coast Counties $214 $229 $252 $279 $300 8.88%
Greater Bay Area Counties $222 $230 $247 $276 $299 7.66%
Los Angeles County $199 $210 $228 $236 $265 7.46%
Northern and Sierra Counties $177 $184 $203 $202 $224 6.09%
Other Southern Counties $231 $251 $230 $257 $306 7.29%
Sacramento Area Counties $280 $296 $310 $301 $297 1.45%
San Joaquin Valley Counties $217 $209 $240 $263 $286 7.13%
San Diego County $225 $233 $235 $242 $258 3.48%
Orange County $215 $235 $259 $294 $315 10.05%
Source: “Annual Hospital Financial Data,” California Office of Statewide Health Planning and Development (OSHPD), Pivot Profiles with data selected for general acute care hospitals (Retrieved from http://www.oshpd.ca.gov/HQAD/Hospital/financial/hospAF.htm, October 2006). See Appendix A for detailed methodology. Notes: Includes Kaiser data. Days were adjusted for outpatients (Adjustment Factor = Gross Patient Revenue/Gross Inpatient Revenue). Hospital is excluded if it did not report expense or day information (excludes individual Kaiser facilities) or CMI data. Per Adjusted Patient Day: Includes a statistical proxy for the volume of outpatient care relative to volume of inpatient care provided by hospitals, computed by dividing gross total patient revenue by gross inpatient revenue.

Financial Health of California Hospitals 7-38 PricewaterhouseCoopers LLP
Nearly all hospitals use group purchasing and, increasingly, more sophisticated supply chain management to achieve better purchasing contracts, improve purchasing processes (ordering, delivery and stocking) and reduce costs. In spite of these cost-control efforts, unpredictable costs, such as pharmaceuticals and medical devices, continue to increase supply costs overall. From 2001 to 2004, however, it is noteworthy that the majority of the increase was attributably to medical devices and other supplies, as the portion of total hospital expenditures for pharmacy remained flat.
Figure 7.28: California Historical and Projected Pharmacy Expenses as Percentage of Total Hospital Expenses 2001–2004
Perc
ent o
f Exp
ense
s
7.0% 6.9% 6.8% 6.8% 7.0%
0.0%
2.0%
4.0%
6.0%
8.0%
10.0%
2000 2001 2002 2003 2004
Perc
ent o
f Exp
ense
s
7.0% 6.9% 6.8% 6.8% 7.0%
0.0%
2.0%
4.0%
6.0%
8.0%
10.0%
2000 2001 2002 2003 2004
Source: Solucient, “Percentile Values for the 59 Performance Measures, California,” The Sourcebook, 2006, 193 Formula: Pharmacy Cost per Adjusted Discharge, Case Mix Adjusted/Expense per Adjusted Discharge

Financial Health of California Hospitals 7-39 PricewaterhouseCoopers LLP
Expenses for purchased services from outside contractors or vendors included diagnostic imaging services, equipment repairs and maintenance, collection services and management, and inpatient services purchased from other hospitals.171 This category grew at a slower rate from 2001 to 2005, at a CAGR of 4.52 percent (Figure 7.29), than it did in 1995–1999, when it grew at a rate of 6.5 percent. This expense category showed wide variation by type of control and geographic location.
Figure 7.29: Median Purchased Services Expense per Adjusted Patient Day (Adjusted for Case Mix) by Typology 2001–2005
2001 2002 2003 2004 2005 CAGR
Overall Total $162 $173 $171 $184 $194 4.52%
Hospital Size <150 available beds $134 $153 $147 $150 $157 4.09%
151-250 available beds $165 $192 $180 $190 $207 5.76%
251-350 available beds $183 $187 $181 $206 $198 1.97%
350+ available beds $190 $214 $207 $220 $220 3.66%
Type of Control City/County $205 $190 $223 $194 $226 2.53%
District $75 $ 74 $ 71 $ 76 $ 78 1.14%
Nonprofit $164 $165 $175 $191 $203 5.52%
For-Profit $193 $235 $199 $219 $211 2.26%
Rural versus Urban Rural3 $77 $ 74 $ 77 $ 81 $ 85 2.27%
Urban $182 $193 $190 $205 $211 3.79%
DSH versus Non-DSH DSH $183 $190 $170 $193 $182 -0.19%
Non-DSH $158 $167 $172 $179 $199 6.01%
Geography (Region) Central Coast Counties $131 $140 $160 $153 $210 12.52%
Greater Bay Area Counties $189 $205 $200 $213 $227 4.75%
Los Angeles County $188 $194 $185 $212 $209 2.64%
Northern and Sierra Counties $96 $105 $115 $132 $139 9.71%
Other Southern Counties $149 $183 $169 $177 $184 5.34%
Sacramento Area Counties $244 $265 $264 $254 $239 -0.53%
San Joaquin Valley Counties $103 $102 $113 $120 $124 4.80%
San Diego County $159 $200 $199 $207 $205 6.59%
Orange County $236 $274 $244 $265 $274 3.77%
Source: “Annual Hospital Financial Data,” California Office of Statewide Health Planning and Development (OSHPD), Pivot Profiles with data selected for general acute care hospitals (Retrieved from http://www.oshpd.ca.gov/HQAD/Hospital/financial/hospAF.htm, October 2006). See Appendix A for detailed methodology. Notes: Excludes Kaiser data. Days were adjusted for outpatients (Adjustment Factor = Gross Patient Revenue/Gross Inpatient Revenue). Hospital is excluded if it did not report expense or day information (excludes individual Kaiser facilities) or CMI data. Per Adjusted Patient Day: Includes a statistical proxy for the volume of outpatient care relative to volume of inpatient care provided by hospitals, computed by dividing gross total patient revenue by gross inpatient revenue. Percentages may not total exactly 100 due to rounding.
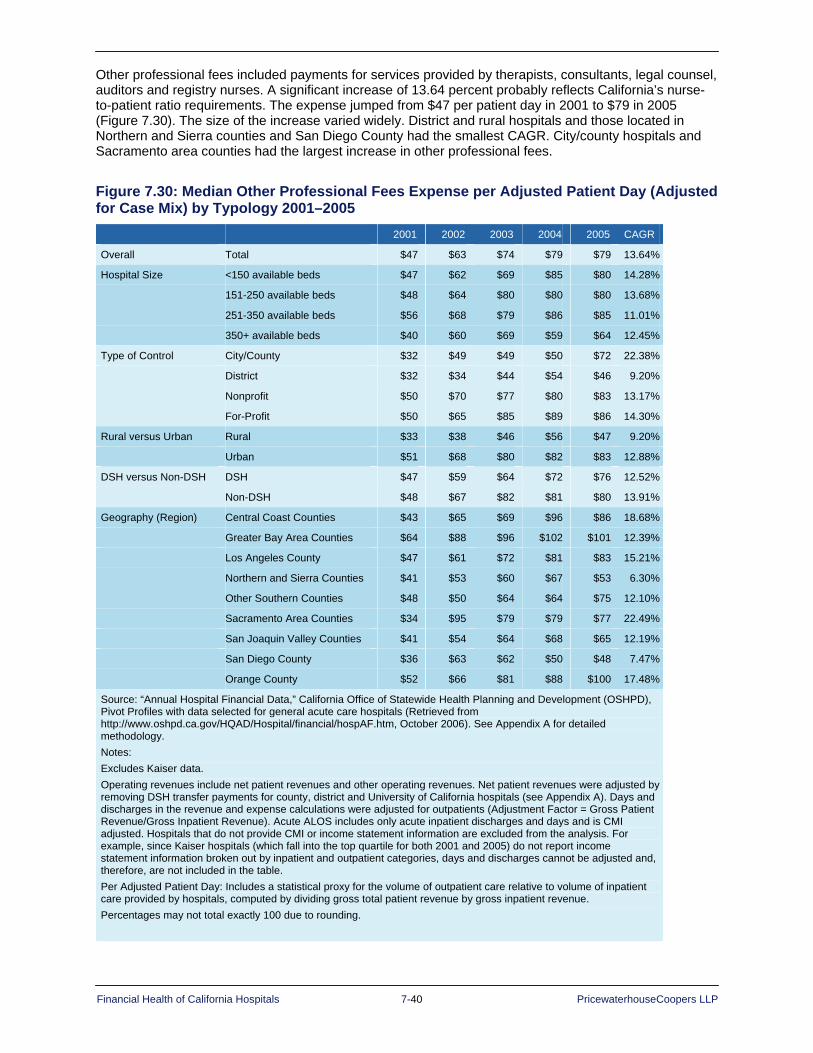
Financial Health of California Hospitals 7-40 PricewaterhouseCoopers LLP
Other professional fees included payments for services provided by therapists, consultants, legal counsel, auditors and registry nurses. A significant increase of 13.64 percent probably reflects California’s nurse-to-patient ratio requirements. The expense jumped from $47 per patient day in 2001 to $79 in 2005 (Figure 7.30). The size of the increase varied widely. District and rural hospitals and those located in Northern and Sierra counties and San Diego County had the smallest CAGR. City/county hospitals and Sacramento area counties had the largest increase in other professional fees.
Figure 7.30: Median Other Professional Fees Expense per Adjusted Patient Day (Adjusted for Case Mix) by Typology 2001–2005
2001 2002 2003 2004 2005 CAGR
Overall Total $47 $63 $74 $79 $79 13.64%
Hospital Size <150 available beds $47 $62 $69 $85 $80 14.28%
151-250 available beds $48 $64 $80 $80 $80 13.68%
251-350 available beds $56 $68 $79 $86 $85 11.01%
350+ available beds $40 $60 $69 $59 $64 12.45%
Type of Control City/County $32 $49 $49 $50 $72 22.38%
District $32 $34 $44 $54 $46 9.20%
Nonprofit $50 $70 $77 $80 $83 13.17%
For-Profit $50 $65 $85 $89 $86 14.30%
Rural versus Urban Rural $33 $38 $46 $56 $47 9.20%
Urban $51 $68 $80 $82 $83 12.88%
DSH versus Non-DSH DSH $47 $59 $64 $72 $76 12.52%
Non-DSH $48 $67 $82 $81 $80 13.91%
Geography (Region) Central Coast Counties $43 $65 $69 $96 $86 18.68%
Greater Bay Area Counties $64 $88 $96 $102 $101 12.39%
Los Angeles County $47 $61 $72 $81 $83 15.21%
Northern and Sierra Counties $41 $53 $60 $67 $53 6.30%
Other Southern Counties $48 $50 $64 $64 $75 12.10%
Sacramento Area Counties $34 $95 $79 $79 $77 22.49%
San Joaquin Valley Counties $41 $54 $64 $68 $65 12.19%
San Diego County $36 $63 $62 $50 $48 7.47%
Orange County $52 $66 $81 $88 $100 17.48%
Source: “Annual Hospital Financial Data,” California Office of Statewide Health Planning and Development (OSHPD), Pivot Profiles with data selected for general acute care hospitals (Retrieved from http://www.oshpd.ca.gov/HQAD/Hospital/financial/hospAF.htm, October 2006). See Appendix A for detailed methodology. Notes: Excludes Kaiser data. Operating revenues include net patient revenues and other operating revenues. Net patient revenues were adjusted by removing DSH transfer payments for county, district and University of California hospitals (see Appendix A). Days and discharges in the revenue and expense calculations were adjusted for outpatients (Adjustment Factor = Gross Patient Revenue/Gross Inpatient Revenue). Acute ALOS includes only acute inpatient discharges and days and is CMI adjusted. Hospitals that do not provide CMI or income statement information are excluded from the analysis. For example, since Kaiser hospitals (which fall into the top quartile for both 2001 and 2005) do not report income statement information broken out by inpatient and outpatient categories, days and discharges cannot be adjusted and, therefore, are not included in the table. Per Adjusted Patient Day: Includes a statistical proxy for the volume of outpatient care relative to volume of inpatient care provided by hospitals, computed by dividing gross total patient revenue by gross inpatient revenue. Percentages may not total exactly 100 due to rounding.
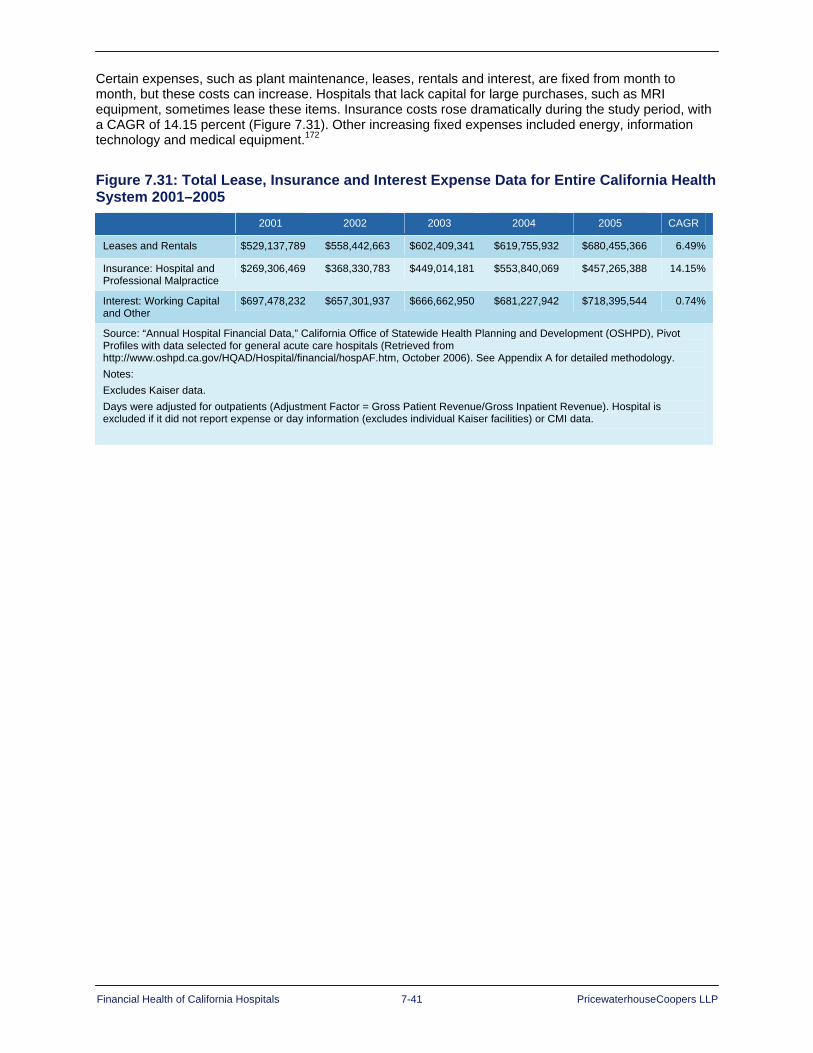
Financial Health of California Hospitals 7-41 PricewaterhouseCoopers LLP
Certain expenses, such as plant maintenance, leases, rentals and interest, are fixed from month to month, but these costs can increase. Hospitals that lack capital for large purchases, such as MRI equipment, sometimes lease these items. Insurance costs rose dramatically during the study period, with a CAGR of 14.15 percent (Figure 7.31). Other increasing fixed expenses included energy, information technology and medical equipment.172
Figure 7.31: Total Lease, Insurance and Interest Expense Data for Entire California Health System 2001–2005
2001 2002 2003 2004 2005 CAGR
Leases and Rentals $529,137,789 $558,442,663 $602,409,341 $619,755,932 $680,455,366 6.49%
Insurance: Hospital and Professional Malpractice
$269,306,469 $368,330,783 $449,014,181 $553,840,069 $457,265,388 14.15%
Interest: Working Capital and Other
$697,478,232 $657,301,937 $666,662,950 $681,227,942 $718,395,544 0.74%
Source: “Annual Hospital Financial Data,” California Office of Statewide Health Planning and Development (OSHPD), Pivot Profiles with data selected for general acute care hospitals (Retrieved from http://www.oshpd.ca.gov/HQAD/Hospital/financial/hospAF.htm, October 2006). See Appendix A for detailed methodology. Notes: Excludes Kaiser data. Days were adjusted for outpatients (Adjustment Factor = Gross Patient Revenue/Gross Inpatient Revenue). Hospital is excluded if it did not report expense or day information (excludes individual Kaiser facilities) or CMI data.

Financial Health of California Hospitals 7-42 PricewaterhouseCoopers LLP
Comparing Revenue and Expenses 2001–2005 to 1995–1999 In contrast to the previous study period when expenses declined slightly, revenues and expenses rose at a rate of 7 percent during 2001–2005. Figure 7.32 compares the revenues, expenses, ALOS and CMI for the two study periods.
Figure 7.32: Revenue and Expenses 1995–1999 and 2001–2005
Source: “Annual Hospital Financial Data,” California Office of Statewide Health Planning and Development (OSHPD), Pivot Profiles with data selected for general acute care hospitals (Retrieved from http://www.oshpd.ca.gov/HQAD/Hospital/financial/hospAF.htm, October 2006). See Appendix A for detailed methodology.
Revenue and Expenses 1995–1999
1995 1999 Percent Change
California Operating Revenue per Adjusted Patient Day (CMI Adjusted) $1,222 $1,189 -0.7%
California Operating Expense per Adjusted Patient Day (CMI Adjusted) $1,219 $1,212 -0.1%
Difference $3 $(23)
Acute ALOS (CMI Adjusted) 4.55 4.24 -1.7%
Total CMI 1.03 1.08 1.2%
Revenue and Expenses 2001–2005
2001 2002 2003 2004 2005 Percent Change
California Operating Revenue per Adjusted Patient Day (CMI Adjusted) $1,507 $1,622 $1,735 $1,833 $1,973 7.0%
California Operating Expense per Adjusted Patient Day (CMI Adjusted) $1,497 $1,597 $1,710 $1,846 $1,961 7.0%
Difference $10 $25 $25 $(13) $12
Acute ALOS (CMI Adjusted) 4.02 4.02 4.05 4.06 4.04 0.2%
Total CMI 1.12 1.13 1.14 1.14 1.15 0.6%
Note: CMI weighted by number of discharges. CMI represents all payers, not just Medicare.
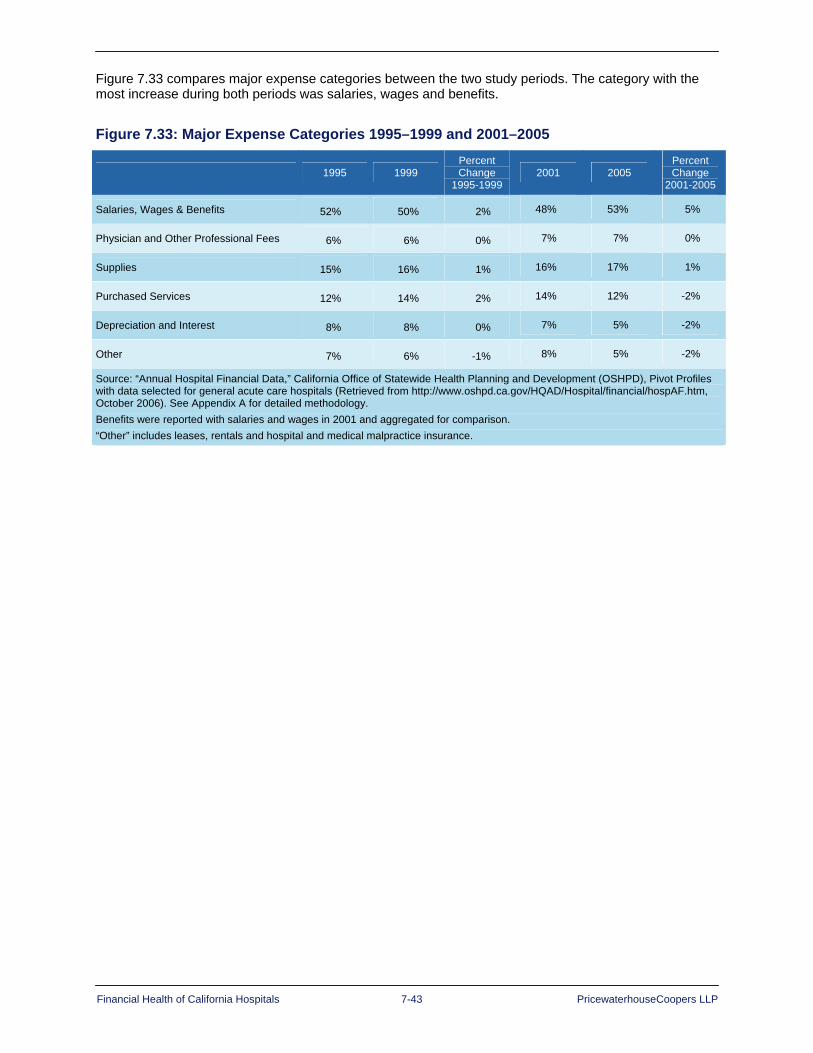
Financial Health of California Hospitals 7-43 PricewaterhouseCoopers LLP
Figure 7.33 compares major expense categories between the two study periods. The category with the most increase during both periods was salaries, wages and benefits.
Figure 7.33: Major Expense Categories 1995–1999 and 2001–2005
1995 1999 Percent Change
1995-1999 2001 2005
Percent Change
2001-2005
Salaries, Wages & Benefits 52% 50% 2% 48% 53% 5%
Physician and Other Professional Fees 6% 6% 0% 7% 7% 0%
Supplies 15% 16% 1% 16% 17% 1%
Purchased Services 12% 14% 2% 14% 12% -2%
Depreciation and Interest 8% 8% 0% 7% 5% -2%
Other 7% 6% -1% 8% 5% -2%
Source: “Annual Hospital Financial Data,” California Office of Statewide Health Planning and Development (OSHPD), Pivot Profiles with data selected for general acute care hospitals (Retrieved from http://www.oshpd.ca.gov/HQAD/Hospital/financial/hospAF.htm, October 2006). See Appendix A for detailed methodology. Benefits were reported with salaries and wages in 2001 and aggregated for comparison. “Other” includes leases, rentals and hospital and medical malpractice insurance.

Financial Health of California Hospitals 7-44 PricewaterhouseCoopers LLP
Summary While revenues rose during 2001–2005, so did expenses — though expenses rose at a much faster pace than during 1995–1999.
A gap continued to exist between the top-quartile hospitals. Expenses for both the top and bottom quartile grew at the same rate, but hospitals in the bottom quartile did not have the revenue to cover the growth in expenses.
From a revenue perspective, revenues barely kept pace with expenses from 2001 to 2005. Operating revenue trended at a CAGR of about 7 percent, raising operating margin out of the negative territory hospitals occupied from 1995 to 1999. Patient care generated the largest share of revenue at 91.9 percent in 2005. Outpatient revenue grew at a CAGR of 15.9 percent.
Expenses grew at almost the same rate as revenues for the review period, presenting continued challenges for hospitals throughout the state. The largest expense categories were salaries and wages (36.7 percent), employee benefits (15.4 percent) and supplies (16.4 percent). Benefit expense escalated at a CAGR of 16.1 percent and represented roughly a $5 billion increase. Coupled with a CAGR of 8.4 percent for salaries and wages and an 8.7 percent CAGR in supply expense, this increase continued to pressure earnings and restrict debt capacity of some hospitals.
Hospital sectors generating higher median operating revenue per adjusted patient day were:
Hospitals with more than 250 beds
City/county hospitals
Urban hospitals
Non-DSH hospitals
Sacramento area hospitals
Sectors generating higher median operating revenue per adjusted patient discharge were:
Hospitals with more than 350 beds
City/county hospitals
Urban hospitals
DSH hospitals
Greater Bay area hospitals
Sectors with the fastest growing revenue per day were:
Hospitals with 250 beds or fewer
City/county hospitals
Urban hospitals
Non-DSH hospitals
Greater Bay area and San Joaquin Valley hospitals
Sectors with the fastest growing revenue per discharge were:
Hospitals with 151 to 250 beds
Nonprofit hospitals
Rural hospitals
Non-DSH hospitals
Central Coast hospitals

Financial Health of California Hospitals 8-1 PricewaterhouseCoopers LLP
Chapter 8: Capital Financing and Access
Key Findings Profitability among California hospitals is stronger in current years than it has been previously,
and current-year cash flow is strong in comparison to immediate debt service obligations.
Leverage is slightly lower than expected, indicating that hospitals may have experienced financial difficulty historically, which limited their ability and willingness to access external capital. Low leverage is a double-edged sword, particularly in combination with low liquidity.
Hospitals that have used internal capital because they have not been able to access external sources or have been unwilling to do so at the interest rates available to them have been unable to amass cash reserves needed to qualify them as investment grade.
Industry analysts consistently cite cash reserves as one of the most attractive features in lending to the hospital industry because cash can be collateralized. Until California hospitals are able to show substantial improvements in cash and other liquid reserves, it is unlikely they will be able to play more heavily in the investment-grade capital markets.
The capital markets measure profitability, liquidity and capital structure in determining the extent to which a hospital can access external capital and the cost of doing so. For-profit and nonprofit hospitals depend on a variety of sources for capital: operating cash, liquid investments, long-term debt, short-term leasing, philanthropy, equity and government subsidies. The mix of capital varies based on the magnitude of capital required, the type of capital investment they are making and the type of hospital control. The trend toward credit worthiness in California hospitals discussed below is crucial to the hospital industry, which must raise internal or external capital for maintenance, replacement, new technology, quality enhancement and growth. Capital access affects the quality of service, which depends, in part, on tangible assets such as land, facilities, medical equipment and information technology.173 To the extent enhancement of creditworthiness expands internal capital, hospitals have more ability to implement timely change; to the extent creditworthiness expands access to the external capital markets, hospitals can position themselves to enhance quality and long-term financial viability.
Analysts, creditors, bankers and others interested in the financial viability of organizations review a number of measures in assessing credit worthiness and access to various sources of funds for capital finance. These measures focus on profitability, liquidity and capital structure. Profitability has been discussed in Chapter 6 but is included in this discussion of capital financing and access because it is a critical indicator of a hospital’s ability to meet its debt obligations. Profitability is represented through operating margin, liquidity is represented by days cash on hand and debt service coverage ratio, and capital structure is represented by the ratio of long-term debt to capitalization.174
Figure 8.1 presents financial ratios for California hospitals by system (sum of all hospitals in systems) and median, as well as the compound annual growth rate (CAGR), derived from OSHPD data. The chart also compares California hospitals’ ratio to Standard & Poor’s national median ratio for “A” credits, the preferred medium grade for favorable funding rates.

Financial Health of California Hospitals 8-2 PricewaterhouseCoopers LLP
Figure 8.1: California Hospital Credit Ratios 2001–2005
2001 2005 CAGR 2005 Standard
& Poor’s “A” Median
Operating Margin Average 0.2% 0.3% 16.02% 3.7%
Median 0.1% 0.8% 92.91%
Days Cash on Hand Average 121.1 109.9 -2.41% 204.0
Median 42.2 40.0 -1.31%
Debt Service Coverage Average 4.5 4.8 1.68% 4.1
Median 3.1 3.3 1.28%
Debt to Capital Average 41.0% 38.8% -1.37% 36.4%
Median 33.8% 34.1% 0.24%
Source: “Annual Hospital Financial Data,” California Office of Statewide Health Planning and Development (OSHPD), Pivot Profiles with data selected for general acute care hospitals (Retrieved from http://www.oshpd.ca.gov/HQAD/Hospital/financial/hospAF.htm, October 2006). See Appendix A for detailed methodology. Notes: Excludes Kaiser data.
Formulas: CAGR = (FV/PV) ^ (1/n) – 1 where FV is future (most recent) value, PV is present (earliest) value, and n is time period in number of years. Days Cash on Hand = (Cash + Assets Whose Use is Limited + Investments)/(Operating Expense - Depreciation Expense)/365 Long-term Debt to Total Capital Ratio = Net Long-term Debt/(Net Long-term Debt + Equity)
The picture of California hospitals presented by the comparison to medians for rated facilities nationally suggests that the state’s hospitals compare favorably with respect to profitability and capital structure, but they have been unable to amass the magnitude of cash reserves typically required to be considered a ratable credit. This finding is important in that the credit markets have shown an increasing desire to lend to hospitals with large amounts of cash or liquid investments because cash serves as de facto collateral for the financing.175 The following sections describe these measures in more detail and compare the performance California hospitals over the five-year period of this study to these benchmarks.
The California healthcare sector exhibited improved credit quality over the 2001–2005 period as evidenced through the rating agencies. Standard and Poor’s (S&P) reported “a solid rebound” in 2004 despite the state’s “extremely challenging” environment. Challenges cited in the S&P report on selected California hospitals included “broad legislative mandates, predominance of managed care and capitation, organized labor union environment and high number of uninsured individuals.”176
In spite of these challenges, the strength of California hospitals’ credit quality in recent years defied predictions of deterioration as anticipated in the previous report.177 At the time of publication of the 1995–1999 report, California nonprofit hospitals led the nation in negative rating actions. At the end of 2000, S&P’s Ratings Service report showed entirely negative ratings actions, with no credits upgraded from 1999 through 2000, and nearly half of the state’s nonprofit hospitals downgraded during this period.178
In California and nationwide, that trend has shifted. Nationwide in 2005, credit rating upgrades in the nonprofit sector outpaced downgrades for the first time in seven years. S&P cited “stronger income and cash flow measures, growth in liquidity and overall improvement in balance sheet measures, along with real growth business volumes over the past few years” as the reasons for improvement in sector credit quality. S&P predicted favorable credit trends for the sector in 2006 as well.179

Financial Health of California Hospitals 8-3 PricewaterhouseCoopers LLP
For the first time in five years, Fitch Ratings reported more upgrades than downgrades nationwide in its portfolio of nonprofit hospitals and health care systems in 2005, and commented that the improvement in its portfolio exceeded expectations from the prior year’s median ratios report based on:
Continued implementation of management best practices
A relatively stable revenue environment with favorable rate increases from managed care payers
Improved expense control
Operating efficiencies that came as a direct result of investment in quality and information technology180
Furthermore, though not specific to California, Fitch indicated in its 2007 outlook report that it expected the positive trend to continue, based on similar factors, although it warned of growing pressures from:
External scrutiny on nonprofits by federal, state and local legislators around issues of transparency and disclosure of community benefits
The rising uninsured and under-insured
Rising consumerism, which is likely to force volatility in volume trends as patients become decision makers on services and to result in increases in the self-insured population with the growth of high-deductible health plans181
The positive momentum in 2004 in California was stronger than the national trend. This is, in part, the result of an intense period of hospital consolidations during the late 1990s, producing more financially stable, dominant providers, yielding greater ability to negotiate higher reimbursement rates from health insurers.182
Appendix E provides more details about the California hospital financing system.

Financial Health of California Hospitals 8-4 PricewaterhouseCoopers LLP
Figure 8.2: Key Financial Metrics for California Hospitals Compared to Standard & Poor’s Bond Credit Ratings 2005
Bond Rating Operating Margin Days Cash on Hand
Debt Service Coverage
Debt to Capitalization
AAA–aaa
Range >3.7% >204.0 >4.1 <36.4%
Number of Hospitals 113 52 147 172
Percent of Hospitals 34% 16% 44% 52%
aaa–BBB
Range <3.7% to >1.6% <204.0 to >110.0 <4.1 to >2.7 >36.4% to <44.1%
Number of Hospitals 38 41 40 17
Percent of Hospitals 11% 12% 12% 5%
bbb–Junk
Range <1.6% to ->0.4% <110.0 to >46.0 <2.7 to >1.9 >44.1% to <55.1%
Number of Hospitals 36 63 26 37
Percent of Hospitals 11% 19% 8% 11%
Junk
Range <.4% <46.0 <1.9 >55.1%
Number of Hospitals 144 175 118 105
Percent of Hospitals 44% 53% 36% 32%
Source: Standard & Poor’s Credit Ratings and OSHPD, 2005 Notes: The purpose of this analysis is to provide another mechanism for analyzing the financial health of hospitals, but not all of the California hospitals are subject to review based on these ratings. The results as analyzed for the “Days Cash on Hand” metric reflect a potential for distortion between the “A or better” rating and the “Below Investment Grade” rating because many system hospitals sweep their cash into corporate accounts. This figure excludes Kaiser hospitals. The Fitch rating for the Kaiser Permanente system was “A+” as of June 30, 2006.
Liquidity: Days Cash on Hand Liquidity dictates a hospital’s ability to meet short-term obligations, including payments on debt, and to fund necessary expenditures from cash on hand.183 Liquid investment reserves not only provide a direct source of internal capital, but also influence a hospital’s access to external capital. Lenders view low liquid reserves increasingly negatively. One standard indicator by which analysts measure liquidity is days cash on hand, which measures the number of days of operating expense that liquid reserves can fund.184
Figure 8.3 presents the median days cash on hand for various categorizations of California hospitals. The median level of 40 days cash on hand for all the hospitals in the state compares unfavorably to the lowest investment grade of rated hospitals nationally and shows a decline from 2001 to 2005. Half of the hospitals in California had fewer than 40 days cash on hand, which suggests that half of the hospitals in the state had cash on hand to cover slightly more than one month’s expenses. The median days cash on hand may, however, be understated in that system hospitals that are members of larger chains, which account for a quarter of the hospitals in the state, may sweep cash to a corporate treasury upon collection and, therefore, present very little cash on their affiliate hospital balance sheets. Furthermore, if average and median days cash on hand are compared, the discrepancy between the average of 110 days and the median of 40 days suggests that there are a small number of hospitals with significant cash balances that skew the average. The implication of these cash levels and trends in cash position is that the majority of hospitals in California would generally not be considered investment grade on the basis of cash position alone.
Financial Health of California Hospitals 8-5 PricewaterhouseCoopers LLP
Days cash on hand varied significantly by hospital size. Only hospitals with between 251 and 350 beds had cash balances that were near 2005 median national levels of 104 days of cash for rated facilities. They also experienced the most significant annual increases in days cash on hand. While the smaller sized hospitals had significantly lower cash balances, they showed modest gains in days cash on hand between 2001 and 2005. The largest hospitals with greater than 350 beds were the only size category to show an average annual decline between 2001 and 2005.
District-owned and nonprofit hospitals showed the strongest median days cash on hand over the five-year period, but their medians were still significantly lower than the medians for rated facilities nationally. As previously stated, the cash position of the for-profits may be misleading to the extent cash is reported in the corporate treasury. City- and county-owned facilities showed a substantial annual rate of decline in days cash on hand and ended with less than 30 days of available cash to fund expenses. This finding is not uncommon to the extent that governmental facilities frequently are not encouraged to amass and maintain reserves, but rather find their cash needs funded on a more current basis.
The classifications of hospitals by rural or urban and with respect to whether they receive Medicare Disproportionate Share Hospital (DSH) funding suggested some differences based on geography and DSH status, but none of the categorizations came close to the median national values for rated facilities. Rural hospitals were the only category to show an overall improvement in cash position, which may be explained, at least in part, by the limited expansion of hospitals designated as Critical Access Hospitals (CAHs). These CAH-designated facilities qualify for Medicare cost-based reimbursement, resulting in stronger cash flow to small, mostly rural hospitals.

Financial Health of California Hospitals 8-6 PricewaterhouseCoopers LLP
Figure 8.3: Median Days Cash on Hand 2001–2005 2001 2002 2003 2004 2005 CAGR
Overall Total 42.2 42.2 46.3 44.3 40.0 -1.31%
Hospital Size <150 available beds 32.1 41.6 36.1 30.5 33.1 .83%
151-250 available beds 26.1 28.1 29.4 31.9 29.1 2.68%
251-350 available beds 80.0 93.2 110.2 102.7 103.5 6.63%
350+ available beds 90.5 74.0 55.2 68.5 75.8 -4.34%
Type of Control City/County 50.3 37.5 44.1 38.3 26.2 -15.02%
District 81.0 77.8 67.1 73.8 89.3 2.49%
For-Profit 6.5 3.4 4.7 5.3 8.5 6.90%
Nonprofit 67.7 68.5 64.0 61.3 62.6 -1.97%
Rural versus Urban Rural 34.2 50.4 48.2 48.6 46.6 8.00%
Urban 49.2 37.9 44.1 43.7 38.5 -5.94%
DSH versus Non-DSH DSH 31.2 27.8 26.6 26.8 29.4 -1.50%
Non-DSH 53.5 59.9 57.3 61.3 50.3 -1.52%
Geography (Region) Central Coast Counties 43.8 35.8 58.1 72.3 57.2 6.92%
Greater Bay Area Counties 54.9 49.1 44.1 56.6 51.8 -1.47%
Los Angeles County 38.1 36.2 39.5 39.7 37.7 -0.26%
Northern and Sierra Counties 33.8 54.5 35.2 25.7 25.9 -6.47%
Orange County 16.9 7.1 12.7 14.0 6.1 -22.38%
Other Southern Counties 50.7 59.0 55.3 53.2 70.7 8.67%
Sacramento Area Counties 99.6 75.0 107.1 81.7 76.9 -6.27%
San Diego County 5.1 4.5 6.1 9.9 8.3 13.06%
San Joaquin Valley Counties 91.0 85.4 94.1 78.8 98.3 1.94%
Source: “Annual Hospital Financial Data,” California Office of Statewide Health Planning and Development (OSHPD), Pivot Profiles with data selected for general acute-care hospitals (Retrieved from http://www.oshpd.ca.gov/HQAD/Hospital/financial/hospAF.htm, October 2006). See Appendix A for detailed methodology. Notes: Excludes Kaiser data.
Formulas: CAGR = (FV/PV) ^ (1/n) - 1 Days Cash on Hand = (Cash + Assets Whose Use is Limited + Investments)/(Operating Expense - Depreciation Expense)/365

Financial Health of California Hospitals 8-7 PricewaterhouseCoopers LLP
Liquidity: Debt Service Coverage Ratio Cash flow, defined through the debt service coverage ratio, is another critical indicator of liquidity and creditworthiness, measuring the extent to which the cash generated by a hospital in a given year is sufficient to make principal and interest payments on debt for that year. Annual cash flow consists of operating cash flow (operating income plus depreciation expense and interest expense) and nonoperating cash flow (nonoperating income, primarily investment income and philanthropy). Lenders and credit analysts use cash flow to calculate annual debt service coverage, which is the ratio of cash flow divided by annual debt service payment (principal plus interest).185 The higher the coverage ratio, the greater the flexibility a hospital has in making its principal and interest payments -- even if an unforeseen event requires a significant cash outlay. A debt service coverage ratio of less than 1.0 indicates a hospital cannot meet its principal and interest payments from current cash flow, requiring a hospital to dip into cash reserves and undermine its long-term cash position.
Lenders and credit analysts focus heavily on internal and external factors affecting cash flow, such as trends in operating margin and nonoperating margin. The relationship of current and expected future cash-flow levels to current and expected annual debt service payments strongly affects a hospital’s ability to borrow.186
Figure 8.4 shows the median debt service coverage ratios for hospitals between 2001 and 2005 by various typologies. The debt service coverage ratio for all hospitals in California was 4.8 in 2005, which compared favorably against national medians for rated facilities, being closer to the median for AA-rated hospitals than to the lower investment categories. This finding suggests that increasingly strong profitability and low reliance on external debt drive strong current-year liquidity, as opposed to the overall long-term liquidity of cash reserves measured by days cash on hand. The implication of this finding is that hospitals may be able to generate increasing cash reserves over the coming years, to the extent that profitability remains strong and reliance on external capital does not increase disproportionately.
Median debt service coverage is generally strong for larger hospitals, with hospitals of more than 250 beds comparing favorably to medians and showing positive annual rates of increase between 2001 and 2005. In hospitals with 250 or fewer beds, debt service coverage is lower than the medians for the lowest investment grade of nationally rated facilities and has shown declining trends over the five-year period. It should be noted, however, that even the smaller hospitals can and do have median ratios that are substantially in excess of 1.0 times, suggesting that there is cash to pay current-year debt service.
Debt service coverage medians by type of hospital control vary from a low of 0.93 for for-profit facilities to 5.69 for city- and county-owned hospitals. The 0.93 ratio for for-profits is of concern in that it indicates at least half of the for-profit hospitals cannot meet their debt service obligations with current-year cash flow and must use cash reserves to do so. However, the result for for-profits may be misleading to the extent that cash flow may be artificially low because larger for-profit chains can be embedding management costs or other corporate expenses in operating expenses and thereby reducing cash available to pay debt service. All sectors, aside from the for-profit hospitals, showed strong annual increases in debt service coverage ratios. Only district-controlled hospitals had ratios lower than median national values for rated facilities.
Urban hospitals showed stronger debt service coverage ratios than rural hospitals, with ratios generally consistent with nationally rated facilities, but rural hospitals made more significant gains between 2001 and 2005. Hospitals with a high percentage of indigent patients, as differentiated by their Medicare DSH status, had lower debt service coverage ratios than those without Medicare DSH, but again showed more significant gains in debt service coverage over the five-year period.
By regional geography, the variation in median debt service coverage ranged from a high of 7.24 in Sacramento to a low of 2.08 in the Central Coast area. Sacramento and the Greater Bay Area presented the highest debt service coverage ratios in comparison to other regional clusters and, by a wide margin, reported the two highest rates of growth between 2001 and 2005. Most of the remaining regions showed debt service coverage ratios lower than the medians for rated facilities nationally.

Financial Health of California Hospitals 8-8 PricewaterhouseCoopers LLP
Figure 8.4: Median Debt Service Coverage Ratios 2001–2005 2001 2002 2003 2004 2005 CAGR
Overall Total 3.14 3.24 3.44 3.21 3.30 1.28%
Hospital Size <150 available beds 2.70 2.43 2.57 2.54 2.48 -2.11%
151-250 available beds 3.33 3.39 4.39 3.03 2.50 -6.92%
251-350 available beds 3.36 3.31 4.01 4.28 3.63 1.95%
350+ available beds 4.15 3.55 5.57 4.83 5.80 8.74%
Type of Control City/County 4.61 3.02 4.56 4.52 5.69 5.41%
District 1.98 1.84 2.29 2.53 2.52 6.18%
For-Profit 3.20 3.35 4.20 0.96 0.93 -26.63%
Nonprofit 3.18 3.47 3.60 3.82 3.92 5.35%
Rural versus Urban Rural 2.13 2.45 2.45 2.54 2.63 5.34%
Urban 3.38 3.33 3.75 3.65 3.40 0.16%
DSH versus Non-DSH DSH 2.29 2.21 2.21 1.87 2.65 3.68%
Non-DSH 3.33 3.77 4.01 3.98 3.44 0.81%
Geography (Region) Central Coast Counties 3.00 3.35 3.23 3.02 2.08 -8.82%
Greater Bay Area Counties 3.01 4.10 5.29 5.09 6.15 19.53%
Los Angeles County 3.67 3.31 3.54 2.13 2.38 -10.27%
Northern and Sierra Counties 2.84 2.45 3.01 2.30 2.89 0.42%
Orange County 3.62 2.93 5.52 9.39 2.65 -7.55%
Other Southern Counties 2.16 2.30 2.38 3.66 2.28 1.37%
Sacramento Area Counties 5.44 6.10 4.44 3.95 7.24 7.42%
San Diego County 3.02 6.26 2.72 3.87 3.80 5.86%
San Joaquin Valley Counties 2.94 2.60 2.22 2.59 3.17 1.91%
Source: “Annual Hospital Financial Data,” California Office of Statewide Health Planning and Development (OSHPD), Pivot Profiles with data selected for general acute care hospitals (Retrieved from http://www.oshpd.ca.gov/HQAD/Hospital/financial/hospAF.htm, October 2006). See Appendix A for detailed methodology. Notes: Excludes Kaiser data. Formulas: CAGR = (FV/PV) ^ (1/n) – 1 Debt Service Coverage = (Net Income + Depreciation Expense + Interest Expense)/(Current Maturities on Long-term Debt + Interest Expense)
Financial Health of California Hospitals 8-9 PricewaterhouseCoopers LLP
Capital Structure: Debt to Capitalization Capital structure also affects a hospital’s ability to borrow money because it indicates how much of a hospital’s assets are currently tied up in external obligations.187 Long-term debt to capitalization is the total balance of long-term debt to total invested capital. Long-term debt includes those obligations due after one year, such as bonds, notes payable, mortgages and lease obligations. Total invested capital generally includes:
In the case of for-profits, stockholders’ equity
In the case of nonprofits, total net assets
Long-term debt
Capital lease obligations188
Total invested capital also can include other items, such as deferred income taxes, investment credits and minority interests.
Hospitals with lower debt-to-capitalization ratios may receive better credit ratings because it is assumed they have more unencumbered assets with which to generate cash to cover additional obligations. A higher credit rating can result in a favorable interest rate when a hospital takes on additional debt. A lower debt-to-capitalization ratio also indicates the potential ability to use internal assets to finance acquisitions and facility upgrades, with internal cost of capital that is lower than a hospital might obtain in the capital markets.189 Lower leverage also helps hospitals survive adverse events beyond their control, such as unanticipated regulatory changes, natural disasters or changes in reimbursement policies.190
Figure 8.5 presents median long-term debt to capitalization ratios for the hospitals in the state from 2001 through 2005, stratified by hospital characteristics. Median debt to capital was 39 percent in 2005 for all hospitals in the state, which compared favorably to the medians for rated facilities nationally, which were typically over 40 percent. Median debt to capitalization declined annually between 2001 and 2005 as well. Debt to capitalization, however, can be misleading in that a declining trend and lower than expected ratio can indicate that hospitals have not been able to access external capital to as great an extent as hospitals with stronger financial results. In this case, the median for California is not dramatically different from the ratio for nationally rated facilities, but further erosion could indicate an inability to access the capital markets.
Debt to capitalization was highest among the smallest facilities (under 150 beds), and they showed an increasing trend between 2001 and 2005. This finding may indicate that because of their size, they have been less able to generate a proportionate amount of internal capital or that the emergence of hospitals designated as critical access hospitals has allowed them to access capital markets more easily. The other significant observation on bed size was that hospitals within the 151-250 bed group showed the lowest leverage, with median values substantially under industry medians for rated facilities. This finding, in combination with their low level of days cash on hand cited earlier, suggests they may be underleveraged and using internal capital at the cost of liquidity.
The differences in debt to capitalization between rural and urban hospitals were less significant than the differences between hospitals with Medicare DSH status and those without. Hospitals with Medicare DSH status (treating a high proportion of indigent patients) had higher and increasing leverage, while non-DSH hospitals had lower and decreasing leverage. Interestingly, the Medicare DSH hospitals’ ratios were consistent with rated facilities nationally, although conventional wisdom would suggest they would have less ability to access capital markets because of a higher proportion of indigent care provision. However, the higher ratio also may indicate that their ability to generate internal capital is limited and they have therefore accessed external sources more frequently.
Median debt to capitalization varied substantially by regional geography, with a high of 50 percent in Other Southern counties and a low of 0.0 percent in Orange County.

Financial Health of California Hospitals 8-10 PricewaterhouseCoopers LLP
Figure 8.5: Median Long-Term Debt to Total Capital Ratios 2001–2005 2001 2002 2003 2004 2005 CAGR
Overall Total 33.8% 33.4% 32.7% 32.3% 34.1 0.24%
Hospital Size <150 available beds 36.3% 36.9% 35.6% 35.7% 41.2% 3.21%
151-250 available beds 28.1% 23.8% 26.0% 25.2% 28.2% 0.07%
251-350 available beds 31.9% 32.6% 32.3% 33.5% 33.2% 0.99%
350+ available beds 37.0% 38.5% 36.6% 31.4% 33.2% -2.68%
Type of Control City/County 62.0% 54.1% 76.2% 79.5% 77.2% 5.65%
District 46.0% 45.1% 45.0% 43.6% 48.9% 1.54%
For-Profit 0.0% 0.0% 0.0% 0.0% 0.0% N/A
Nonprofit 36.3% 37.6% 35.9% 38.4% 34.3% -1.42%
Rural versus Urban Rural 37.8% 38.2% 37.1% 34.6% 37.4% -0.27%
Urban 32.3% 31.5% 31.8% 31.6% 33.5% 0.88%
DSH versus Non-DSH DSH 39.1% 33.6% 36.5% 37.3% 44.1% 3.02%
Non DSH 32.0% 33.2% 31.7% 30.3% 31.1% -0.66%
Geography (Region) Central Coast Counties 24.2% 22.2% 30.7% 40.4% 34.3% 9.07%
Greater Bay Area Counties 36.3% 38.3% 35.1% 26.6% 28.9% -5.55%
Los Angeles County 29.7% 28.6% 29.2% 28.7% 33.9% 3.34%
Northern and Sierra Counties 36.4% 34.4% 36.4% 33.6% 42.4% 3.91%
Orange County 12.4% 5.6% 9.7% 10.6% 0.0% -100.00%
Other Southern Counties 53.0% 42.3% 48.4% 48.7% 49.7% -1.56%
Sacramento Area Counties 55.2% 47.8% 43.1% 46.9% 44.7% -5.12%
San Diego County 18.2% 16.6% 20.8% 24.7% 23.0% 6.01%
San Joaquin Valley Counties 45.6% 53.0% 54.2% 52.0% 48.5% 1.54%
Source: “Annual Hospital Financial Data,” California Office of Statewide Health Planning and Development (OSHPD), Pivot Profiles with data selected for general acute care hospitals (Retrieved from http://www.oshpd.ca.gov/HQAD/Hospital/financial/hospAF.htm, October 2006). See Appendix A for detailed methodology. Notes: Excludes Kaiser data. Formulas: CAGR = (FV/PV) ^ (1/n) – 1 Long-term Debt to Total Capital Ratio = Net Long-term Debt/(Net Long-term Debt + Equity)
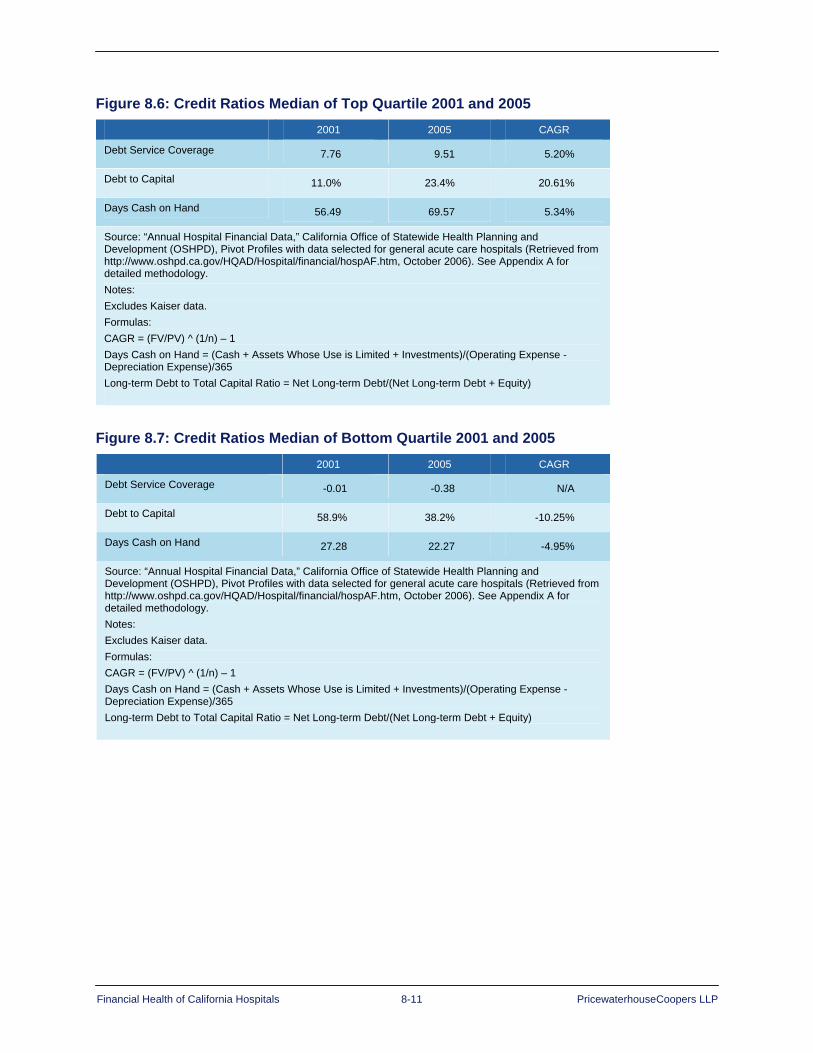
Financial Health of California Hospitals 8-11 PricewaterhouseCoopers LLP
Figure 8.6: Credit Ratios Median of Top Quartile 2001 and 2005 2001 2005 CAGR
Debt Service Coverage 7.76 9.51 5.20%
Debt to Capital 11.0% 23.4% 20.61%
Days Cash on Hand 56.49 69.57 5.34%
Source: “Annual Hospital Financial Data,” California Office of Statewide Health Planning and Development (OSHPD), Pivot Profiles with data selected for general acute care hospitals (Retrieved from http://www.oshpd.ca.gov/HQAD/Hospital/financial/hospAF.htm, October 2006). See Appendix A for detailed methodology. Notes: Excludes Kaiser data. Formulas: CAGR = (FV/PV) ^ (1/n) – 1 Days Cash on Hand = (Cash + Assets Whose Use is Limited + Investments)/(Operating Expense - Depreciation Expense)/365 Long-term Debt to Total Capital Ratio = Net Long-term Debt/(Net Long-term Debt + Equity)
Figure 8.7: Credit Ratios Median of Bottom Quartile 2001 and 2005 2001 2005 CAGR
Debt Service Coverage -0.01 -0.38 N/A
Debt to Capital 58.9% 38.2% -10.25%
Days Cash on Hand 27.28 22.27 -4.95%
Source: “Annual Hospital Financial Data,” California Office of Statewide Health Planning and Development (OSHPD), Pivot Profiles with data selected for general acute care hospitals (Retrieved from http://www.oshpd.ca.gov/HQAD/Hospital/financial/hospAF.htm, October 2006). See Appendix A for detailed methodology. Notes: Excludes Kaiser data. Formulas: CAGR = (FV/PV) ^ (1/n) – 1 Days Cash on Hand = (Cash + Assets Whose Use is Limited + Investments)/(Operating Expense - Depreciation Expense)/365 Long-term Debt to Total Capital Ratio = Net Long-term Debt/(Net Long-term Debt + Equity)

Financial Health of California Hospitals 8-12 PricewaterhouseCoopers LLP
Figure 8.8: California Hospital Credit Ratings 2005
2005 Medians AA, Aa A Baa, BBBBelow
Investment Grade
Operating Margin
Moody’s 4.30% 3.30% 1.90% -0.30%
Fitch 3.40% 3.20% 2.20% 0.00%
S&P 4.50% 3.70% 1.60% -0.40%
Days Cash on Hand
Moody's 245.7 173.1 110.7 55.5
Fitch 230.0 188.6 130.5 54.1
S&P 401.0 204.0 110.0 46.0
Debt Service Coverage
Moody’s 6.8 5.0 3.1 1.6
Fitch 4.8 3.9 3.2 1.7
S&P 5.6 4.1 2.7 1.9
Debt to Capitalization
Moody’s 32.70% 37.00% 48.30% 65.60%
Fitch 33.10% 41.70% 47.10% 65.00%
S&P 24.70% 36.40% 44.10% 55.10%
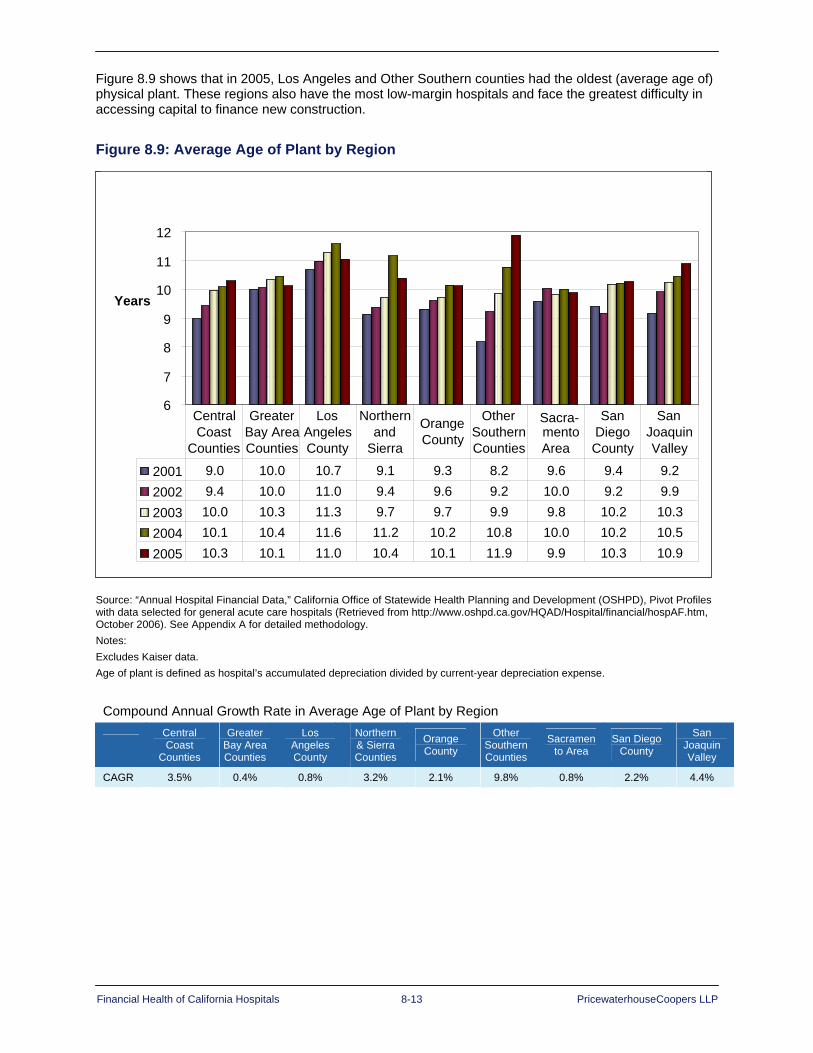
Financial Health of California Hospitals 8-13 PricewaterhouseCoopers LLP
Figure 8.9 shows that in 2005, Los Angeles and Other Southern counties had the oldest (average age of) physical plant. These regions also have the most low-margin hospitals and face the greatest difficulty in accessing capital to finance new construction.
Figure 8.9: Average Age of Plant by Region
Source: “Annual Hospital Financial Data,” California Office of Statewide Health Planning and Development (OSHPD), Pivot Profiles with data selected for general acute care hospitals (Retrieved from http://www.oshpd.ca.gov/HQAD/Hospital/financial/hospAF.htm, October 2006). See Appendix A for detailed methodology. Notes: Excludes Kaiser data. Age of plant is defined as hospital’s accumulated depreciation divided by current-year depreciation expense.
Compound Annual Growth Rate in Average Age of Plant by Region
Central Coast
Counties
Greater Bay Area Counties
Los Angeles County
Northern & Sierra Counties
Orange County
Other Southern Counties
Sacramento Area
San Diego County
San Joaquin Valley
CAGR 3.5% 0.4% 0.8% 3.2% 2.1% 9.8% 0.8% 2.2% 4.4%
6
7
8
9
10
11
12
Years
2001 9.0 10.0 10.7 9.1 9.3 8.2 9.6 9.4 9.2 2002 9.4 10.0 11.0 9.4 9.6 9.2 10.0 9.2 9.9 2003 10.0 10.3 11.3 9.7 9.7 9.9 9.8 10.2 10.3 2004 10.1 10.4 11.6 11.2 10.2 10.8 10.0 10.2 10.5 2005 10.3 10.1 11.0 10.4 10.1 11.9 9.9 10.3 10.9
Central Coast
Counties
Greater Bay Area Counties
Los Angeles County
Northern and
Sierra
Orange County
Other Southern Counties
Sacra- mento Area
San Diego County
San Joaquin Valley

Financial Health of California Hospitals 8-14 PricewaterhouseCoopers LLP
Figure 8.10 compares median days cash on hand for the 1995–1999 to the 2001–2005 periods. Totals are lower for the later period for all types of hospital control except for-profits. City and county hospitals showed the greatest rate of decline, ending with less than 30 days of cash available to fund expenses.
Figure 8.10: Median Days Cash on Hand Comparison 1995–1999 and 2001–2005
Median Days Cash on Hand Overall and by Type of Control 1995–1999
1995 1996 1997 1998 1999 Percent Change
Overall 81.1 89.1 87.1 77.6 50.9 -11.1%
Nonprofit 106.0 101.7 101.3 103.2 79.3 -7.02%
For-Profit 9.8 16.2 19.3 20.4 7.6 -6.33%
City/County 67.2 76.3 77.1 79.5 55.5 -4.69%
District 112.8 105.5 98.8 107.8 95.8 -4.09%
Median Days Cash on Hand Overall and by Type of Control 2001–2005
2001 2002 2003 2004 2005 Percent Change
Overall 42.2 42.2 46.3 44.3 40.0 -1.13%
Nonprofit 67.7 68.5 64.0 61.3 62.6 -1.97%
For-Profit 6.5 3.4 4.7 5.3 8.5 6.90%
City/County 50.3 37.5 44.1 38.3 26.2 -15.02%
District 81.0 77.8 67.1 73.8 89.3 2.49%
Source: “Annual Hospital Financial Data,” California Office of Statewide Health Planning and Development (OSHPD), Pivot Profiles with data selected for general acute care hospitals (Retrieved from http://www.oshpd.ca.gov/HQAD/Hospital/financial/hospAF.htm, October 2006). See Appendix A for detailed methodology.
Financial Health of California Hospitals 8-15 PricewaterhouseCoopers LLP
Summary California hospitals must rely on all available avenues to access capital given the heavy reliance on capital for operations. To secure access to capital and obtain low interest debt financing, hospitals must optimize key operating metrics: days cash on hand, operating margin, debt service coverage and debt-to-capital ratio.
In general, over the period of this study, hospitals in California compare favorably to hospitals nationally, as rated and reported by credit rating agencies such as Moody’s, Standard & Poor’s and Fitch Ratings. Based on recent analysts reports, these agencies expect that this trend will continue beyond the five-year review period of this study.
Generally, hospitals identified in other sections of this report as high operating-margin performers reflect metrics that are, in comparison, more favorable for attracting incremental financing than those with low operating margins, further exacerbating the gap between these groups of providers. For example, nonprofit hospitals, particularly in urban areas of the state, yield the most days cash on hand, highest operating margin and optimal debt service coverage and debt-to-capital ratios. Conversely, small rural hospitals are more challenged in these areas. For-profit hospital data show clear deficiencies based on these metrics, but caution is needed in interpreting the data given the propensity of hospital systems to sweep cash into corporate treasury accounts and off the affiliate hospital’s accounts.
It is critical for California hospitals to improve and maintain these highly visible metrics to supplement cyclical operational cash flows, as well as help mitigate shifts in investment returns and philanthropic giving. In this way, hospitals can position themselves better to have the funding to attract and retain clinical staff needed to meet nurse-to-patient staffing ratios and to supplement capital sources for mandated capital investment — both routine and strategic.
Financial Health of California Hospitals 8-16 PricewaterhouseCoopers LLP
1 Shattuck Hammond Partners, The Financial Health of California Hospitals (Oakland, California: California HealthCare Foundation, July 2001), chap. 9, 2. 2 Ibid., 4. 3 Ibid., chap. 6, 8. 4 Ibid., chap. 9, 5. 5 Ibid., 8. 6 Ibid., 3. 7 Ibid., 4. 8 Ibid., chap. 5, 3. 9 Ibid. 10 Ibid., chap. 9, 10. 11 Ingenix, Almanac of Hospital Financial and Operating Indicators: A Comprehensive Benchmark of the Nation’s Hospitals 2006 (Ingenix, 2007), 320-321. (Operating margin data includes specialty hospitals — such as psychiatric, rehabilitation and children’s hospitals — in addition to general acute care hospitals and therefore is not an exact match for the operating margin derived from the OSPHD data used for this report, which includes only general acute care hospitals.) 12 Kaiser Family Foundation, “California: Registered Nurses per 100,000 Population, as of May 2005” (Retrieved January 23, 2007) http://www.statehealthfacts.org. 13 Lisa Zuckerman, Joseph Marinucci, David Peknay and James Cortez, “The California Health Care Market: Recent Strength Defies Expectations” (Standard & Poor’s, June 2, 2004), 1. 14 American Hospital Association (AHA), 2007 AHA Hospital Statistics (Health Forum, LLC, 2007). 15 U.S. Census Bureau, “Census Bureau Revises 2004 and 2005 Health Insurance Coverage Estimates” (March 23, 2007, Retrieved March 27, 2007) http://www.census.gov/Press-Release/www/releases/archives/health_care_insurance/009789.html. 16 California Association of Public Hospitals and Health Systems, “The California Hospital Financing Medicaid Waiver: Year One Implementation and Results for Public Hospitals” (CAPH, November 2006), 1. 17 Charles Mead and Jonathan Kulick, SB1953 and the Challenge of Hospital Seismic Safety in California (RAND Corporation for the California HealthCare Foundation, January 2007), 5. 18 Centers for Disease Control (CDC), “Executive Summary,” The State of Aging and Health in America 2007 (Merck Company Foundation and CDC, 2007), III. 19 Stephen P. Wallace, Nadereh Pourat, Vilma Enriquez-Haass and Alek Sripipatana, Health of Older Californians: County Data Book (Los Angeles: UCLA Center for Health Policy Research, October 2003). 20 U.S. Census Bureau, “Table 4: Interim Projections: Change in Total Population and Population 65 and Older, by State 2000 to 2030” (April 21, 2005, Retrieved April 17, 2007) http://www.census.gov/population/www/projections/projectionsagesex.html. 21 California HealthCare Foundation, “California Employer Health Benefits Survey 2006” (Oakland California: California Healthcare Foundation, November 2006), 37. 22 Ibid. 23 Frank D. Russo, “‘Year of Health Care Reform’ in California Will Be Between Governor and Democrats in the Legislature” California Progress Report (March 4, 2007, Retrieved March 29, 2007) http://www.californiaprogressreport.com/2007/03/year_of_health.html. 24 Shattuck Hammond, The Financial Health of California Hospitals, chap. 2, 2. 25 California Department of Finance, “Top Countries Ranked by Its Gross Domestic Product, California’s World Ranking” (Retrieved Nov. 12, 2006) http://www.dof.ca.gov/HTML/FS_DATA/LatestEconData/FS_Misc.htm. 26 California HealthCare Foundation, “Snapshot: California Addendum,” Health Care Costs 101 (Oakland, California: California HealthCare Foundation, March 2006), 1.

Financial Health of California Hospitals 8-17 PricewaterhouseCoopers LLP
27 Centers for Medicare and Medicaid Services, “National Health Care Expenditures” (Retrieved Dec. 14, 2006) http://www.cms.hhs.gov/NationalHealthExpendData/downloads/tables.pdf. 28 Kaiser Family Foundation, “Distribution of Health Care Expenditures by Service (in millions), 2004,” statehealthfacts.org (Retrieved May 8, 2007) http://www.statehealthfacts.org. 29 Shattuck Hammond, The Financial Health of California Hospitals, chap. 2, 2. 30 Ibid. 31 Health Resources and Services Administration, “Hill-Burton Free and Reduced Cost Health Care” (U.S. Department of Health and Human Services, Retrieved April 18, 2007) http://www.hrsa.gov/hillburton/default.html. 32 Shattuck Hammond, The Financial Health of California Hospitals, chap. 2, 3. 33 Ibid., 2-3. 34 Ibid., 3. 35 Ibid., 4. 36 California Association of Public Hospitals and Health Systems, “Medi-Cal Disproportionate Share Hospital Payment Program” (Updated 2000, Retrieved Nov. 27, 2006) http://www.caph.org/publications/dsh2000update.pdf, 1. 37 Shattuck Hammond, The Financial Health of California Hospitals, chap. 2, 4. 38 Ibid. 39 Ibid. 40 Robert E. Mechanic, “Medicaid’s Disproportionate Share Hospital Program: Complex Structure, Critical Payments” (National Health Policy Forum, Sept. 14, 2004, Retrieved Nov. 28, 2006), 8. 41 Shattuck Hammond, The Financial Health of California Hospitals, chap. 2, 4. 42 Ibid., 9. 43 Ibid. 44 Medi-Cal Policy Institute, “Medi-Cal Managed Care,” Medi-Cal Facts, No. 8 (March 2000), 1. 45 Ron Shinkman, “California Hospitals Win Medicaid Increases,” Modern Healthcare, Vol. 30, Num. 51 (Dec. 11, 2000, Retrieved from Factiva, Dow Jones Reuters Business Interactive LLC, Nov. 28, 2006). 46 Mead and Kulick, “SB1953 and the Challenge of Hospital Seismic Safety in California,” 5. 47 California HealthCare Foundation, “Understanding California’s Nursing Crisis” (March 2001, Retrieved Nov. 12, 2006) http://www.chcf.org/topics/view.cfm?itemID=19638. 48 Centers for Medicare and Medicaid Services, “National Health Expenditures.” 49 Shattuck Hammond, The Financial Health of California Hospitals, chap. 2, 3. 50 Centers for Medicare and Medicaid Services, “National Health Expenditures.” 51 Ibid. 52 Ibid. 53 Lester Breslow, “Public Health and Managed Care: A California Perspective” Health Affairs (Spring 1996, Retrieved Feb. 15, 2007) http://content.healthaffairs.org/cgi/reprint/15/1/92.pdf, 93. 54 Kaiser Permanente, “History of Kaiser Permanente” (Retrieved Dec. 15, 2006) https://newsmedia.kaiserpermanente.org/kpweb/historykp/entrypage.do. 55 Ibid. 56 Ibid. 57 Breslow, “Public Health and Managed Care: A California Perspective,” 93. 58 Lynn R. Gruber, Maureen Shadle and Cynthia L. Polich, “From Movement to Industry: The Growth of HMOs,” Health Affairs (Summer 1998, Retrieved Feb. 15, 2007) http://content.healthaffairs.org/cgi/reprint/7/3/197.pdf, 197-199. 59 Shattuck Hammond, The Financial Health of California Hospitals, chap. 2, 5. 60 Ibid.

Financial Health of California Hospitals 8-18 PricewaterhouseCoopers LLP
61 Michael Hammer, “HMO Regional Market Analysis,” Interstudy Competitive Edge 9 (1) (April 1999), 1-178. 62 Cattaneo & Stroud, Statewide HMO and Special Programs Enrollment Study (2005, Retrieved Nov. 28, 2006) http://www.cattaneostroud.com/2005HMO.htm. 63 Ibid. 64 Cattaneo & Stroud, Statewide HMO and Special Programs Enrollment Study. 65 Peter A. York, et al., The Interstudy PPO Directory and Performance Report (St. Paul, MN: Decision Resources, 2002), 8-11. 66 California HealthCare Foundation and Center for Studying Health System Change, “California Health Benefits Survey 2005” (Oakland, California: California HealthCare Foundation, 2005), 28. 67 Allan Baumgarten, “California Health Care Market Report 2006” (Oakland, California: California HealthCare Foundation, February 2007), 12. 68 Shattuck Hammond, The Financial Health of California Hospitals, chap. 2, 5. 69 Baumgarten, “California Health Care Market Report 2006,” 5. 70 United Health Group, “PacifiCare Health Systems Shareholders Approve Merger with United Health Group” (United Health Group Press Release, Nov. 17, 2005). 71 Shattuck Hammond, The Financial Health of California Hospitals, chap. 2, 6. 72 Ibid. 73 California Office of Statewide Health Planning and Development (OSHPD), Utilization Data. 74 Shattuck Hammond, The Financial Health of California Hospitals, chap. 2, 6. 75 Ibid., 7. 76 Irving Levin Associates, The Health Care Acquisition Report, Ed. 9 & 12 (2003 and 2005), 13. 77 Ibid. 78 Shattuck Hammond, The Financial Health of California Hospitals, chap. 9, 2. 79 Ibid. 80 Kaiser Family Foundation and Health Research and Educational Trust, “2005 Annual Employer Benefits” (October 2005, Retrieved Dec. 14, 2006) http://www.kff.org/insurance/7315/upload/7315.pdf, 16. 81 California HealthCare Foundation, “California Health Benefits Survey 2005,” 2. 82 Ibid., 14. 83 Ibid. 84 Ibid. 85 Jim Christie, “Cost of California Health-Care Push Questioned,” (Reuters: Nov. 27, 2006, Retrieved Nov. 29, 2006) http://today.reuters.com/news. 86 California Department of Managed Health Care, “Report of the Analysis of the CalPERS/Blue Shield Narrow Network” (March 31, 2005), 1. 87 CalPERS Press Release, “CalPERS Approves Second Three-Year Contract with Blue Shield of California” (June 21, 2006, Retrieved April 18, 2007), http://www.calpers.ca.gov/eip/toolbar/print.jsp?bc=/about/press/pr-2006/june/three-year-blue-shield.xml. 88 Baumgarten, “California Health Care Market Report 2005,” 9. 89 California Public Employees’ Retirement System, “CalPERS On-Line: About CalPERS: Facts at a Glance” (Retrieved Dec. 7, 2006) https://www.calpers.ca.gov/index.jsp?bc=/about/facts/home.xml. 90 Pacific Business Group on Health, “PBGH.org: About PBGH” (Retrieved Dec. 7, 2006) http://www.pbgh.org/about_pbgh/default.asp. 91 Baumgarten, “California Health Care Market Report 2005,” 10. 92 Shattuck Hammond, “The Financial Health of California Hospitals,” chap. 2, 8. 93 California HealthCare Foundation, “Consumer-Directed Health Plans: Implications for Health Care Quality and Cost” (June 2005).
Financial Health of California Hospitals 8-19 PricewaterhouseCoopers LLP
94 Kaiser and HRET, “2005 Annual Employer Benefits,” 47, 108. 95 PricewaterhouseCoopers, “Behind the Numbers: Medical Cost Trends for 2007,” 4. 96 California HealthCare Foundation and Center for Studying Health System Change, “California Employer Health Benefits Survey 2006” (Oakland, California: California HealthCare Foundation, November 2006), 2. 97 Ibid., 37. 98 PricewaterhouseCoopers, “Behind the Numbers: Medical Cost Trends for 2007” (Pricewaterhouse Coopers, October 2006), 4 99 California HealthCare Foundation, “California Employer Health Benefits Survey 2006.” 100 Institute of Medicine, “To Err is Human” (Nov. 1, 1999). 101 California HealthCare Foundation, “Pay for Performance Overview” (January 2006) http://www.chcf.org/topics/chronicdisease/index.cfm?subtopic=CL503. 102 California HealthCare Foundation, “Measuring the Costs and Benefits of Health Care Information Technology: Six Case Studies” (September 2004). 103 Healthcare Information and Management Systems Society, “17th Annual Leadership Survey” (February 2006) http://www.himss.org/ASP/ContentRedirector.asp?ContentId=65647. 104 James Fisher, Charles Shell, David Troiano and PricewaterhouseCoopers, “Measuring the Costs and Benefits of Health Care Information Technology: Six Case Studies” (Oakland, California: California HealthCare Foundation, September 2004), 5. 105 American Hospital Association (AHA), “Adopting Technological Innovation in Hospitals: Who Pays and Who Benefits” (October 2006), 1. 106 Agency for Healthcare Research and Quality, “Costs and Benefits of Health Information Technology,” Evidence Report/Technology Assessment Number 132 (April 2006), 6. 107 Shattuck Hammond, The Financial Health of California Hospitals, app. C, 10. 108 Office of Statewide Health Planning and Development Healthcare Information Division (OSHPD), “FAQs: Hospital Annual and Quarterly Financial” (Revised Jan. 23, 2007; Retrieved Feb. 28, 2007) http://www.oshpd.ca.gov/HID/hospital/finance/faqshospfin.htm. 109 This note applies to all of the OSHPD data displayed in this report:
Excludes acute psychiatric hospitals, chemical dependency recovery hospitals, psychiatric health facilities and special hospitals based on the Category field in the 2004 California Licensed Healthcare Facilities file, which describes the category of health care facility as licensed by the California Department of Health Services
Excludes state hospitals, psychiatric health facilities, and hospitals with emphasis on long-term care based on TYPE_HOSP definition from OSHPD
Excludes psychiatric hospitals based on TYPE_CARE definition from OSHPD
Excludes Shriners and Kindred hospitals based on hospital name; also excludes all other psychiatric and rehabilitation hospitals based on hospital name
110 Baumgarten, “California Health Care Market Report 2005,” 65. 111 American Hospital Association (AHA), “Statistics for Multihospital Health Care Systems and Their Hospitals,” 2007 AHA Hospital Statistics (Health Forum, LLC, 2007), 197. 112 California Rural Health Policy Council, “Rural Hospital Information,” (Retrieved Feb. 28, 2007) http://www.ruralhealth.ca.gov/ruralhospital.htm. 113 AHA, 2007 AHA Hospital Statistics. 114 Baumgarten, “California Health Care Market Report 2005,” 19. 115 Office of Statewide Health Planning and Development (OSHPD), California’s Hospital Seismic Safety Law: Its History, Implementation and Progress (2005), 11. 116 Ibid., 4. 117 Wanda Jones, “Renewal by Earthquake: Designing 21st Century Hospitals in Response to California’s Seismic Safety Legislation” (Oakland, California: California HealthCare Foundation, March 2004), 5.

Financial Health of California Hospitals 8-20 PricewaterhouseCoopers LLP
118 Office of Statewide Health Planning and Development, Personal Interview with K. Kwong, OSHPD staff (Jan. 26, 2007). 119 University of California, “University of California Medical Education and Academic Medical Centers” (August 20, 2002, Retrieved Feb. 28, 2007) http://www.ucop.edu/healthaffairs/reports/. 120 Kaiser Family Foundation, statehealthfacts.org (Retrieved May 11, 2007) http://www.statehealthfacts.org. (Sources: Federal Register, October 3, 2006 (Vol. 71, No. 191), pp. 58398-58415). 121 California Association of Public Hospitals and Health Systems (CAPH), “The California Hospital Financing Medicaid Waiver: Year One Implementation and Results for Public Hospitals.” 122 Ingenix, Almanac of Hospital Financial and Operating Indicators: A Comprehensive Benchmark of the Nation’s Hospitals 2006, x. 123 California Office of Rural Health, “Medicare Rural Hospital Program” (Retrieved May 27, 2007) http://www.prh.dhs.ca.gov/Programs/CalSORH/MRH.htm. 124 California Rural Health Policy Council, “Rural Hospital Information” (Retrieved May 27, 2007), http://www.ruralhealth.ca.gov/ruralhospital.htm. 125 National Health Policy Forum, “Exploring California’s Rural Hospital System: From the Redwood Forests to the Baja Border” (Washington, D.C.: George Washington University, June 22, 2005, Retrieved May 27, 2007), http://nhpf.org/pdfs_sv/SV_RuralCA05.pdf, 7-11. 126 Shattuck Hammond, The Financial Health of California Hospitals (Oakland, California: California HealthCare Foundation, July 2001), chap. 4, 2. 127 For specific definitions and reporting instructions, see The Accounting & Reporting Manual for California Hospitals, 2nd Ed., available for download at: http://www.oshpd.ca.gov/HID/hospital/finance/manuals/index.htm. An OSHPD glossary is included as part of the documentation of the OSHPD Selected Annual Financial Report. 128 Shattuck Hammond, The Financial Health of California Hospitals, 3-4. 129 Ibid., 4. 130 Ibid. 131 Kaiser Family Foundation, “Hospital Emergency Room Visits per 1,000 Population,” statehealthfacts.org (Retrieved May 8, 2007) http://www.statehealthfacts.org. 132 California Office of Statewide Health Planning and Development (OSHPD). 133 Ingenix, “All Patient Case Mix Index,” Almanac of Hospital and Operating Indicators: A Comprehensive Benchmark of the Nation’s Hospitals (Ingenix, 2006), 240. 134 Stephen P. Wallace, Nadereh Pourat, Vilma Enriquez-Haass and Alek Sripipatana, Health of Older Californians: County Data Book (Los Angeles: UCLA Center for Health Policy Research, October 2003), 238. 135 Cattaneo and Stroud, Inc., “Outpatient Surgery: California Offers a Major Growth Opportunity, But For Which Players? 136 Kaiser Family Foundation, “Distribution of Personal Health Care Expenditures by Service (in millions), FY 2004” (Henry Kaiser Family Foundation, 2007) http://www.statehealthfacts.org. 137 Ibid., “California: Admissions and Inpatient Days per 1,000 Population, 1999-2004.” 138 Shattuck Hammond, The Financial Health of California’s Hospitals, chap. 5, 3. 139 Ingenix, “Salary per FTE,” Almanac of Hospital Financial & Operating Indicators (Ingenix, 2007), 276-277. 140 American Hospital Association and The Lewin Group, “The Costs of Caring: Sources of Growth in Spending for Hospital Care” (2005), 7. 141 Kaiser Family Foundation, “Hospital Admissions per 1,000 Population” and “Hospital Inpatient Days per 1,000 Population,” statehealthfacts.org (Retrieved April 12, 2007) http://statehealthfacts.org. 142 U.S. Census Bureau, “State & County QuickFacts” (Retrieved Dec. 11, 2006) http://quickfacts.census.gov/qfd/states/06000.html. 143 U.S. Census Bureau, “Table 4: Interim Projections: Change in Total Population and Population 65 and Older, by State 2000 to 2030” (April 21, 2005, Retrieved April 17, 2007) http://www.census.gov/population/www/projections/projectionsagesex.html. 144 Shattuck Hammond, The Financial Health of California’s Hospitals, chap. 5, 5.

Financial Health of California Hospitals 8-21 PricewaterhouseCoopers LLP
145 California HealthCare Foundation, “California Employer Health Benefits Survey 2006,” 37. 146 Kaiser Family Foundation and Health Research Educational Trust, “Employer Health Benefits 2006 Annual Survey,” 54-55. 147 California HealthCare Foundation, “California Employer Health Benefits Survey 2006,” 37. 148 Baumgarten, “California Health Care Market Report 2006,” 5. 149 California HealthCare Foundation, “Snapshot: California’s Uninsured” (Oakland, California, 2005), http://www.chcf.org/documents/insurance/SnapshotCaliforniaUninsured05.pdf1, 1. 150 Ibid., pg. 6. 151 Kaiser Commission on Medicaid and the Uninsured, “Health Insurance Coverage in America: 2005 Data Update” (Kaiser Family Foundation, November, 2006), 1, 19. 152 PricewaterhouseCoopers Health Research Institute, “Behind the Numbers: Medical Cost Trends for 2007” (2006), 6. 153 Fitch Ratings, “2006 Nonprofit Hospitals and Health Care Systems Outlook” (Jan.12, 2006), 7. 154 American Hospital Association and The Lewin Group, 6. 155 Hospital Association of Southern California, “The Nursing Shortage: What We’re Doing About It, What You Can Do About It” (October 2006, Retrieved Dec. 12, 2006) http://www.cinhc.org/documents/NursingWorkforcePaper.pdf, 4-5. 156 Ibid., 2. 157 California HealthCare Foundation, “Estimating the Compliance Costs for California SB1953,” (Oakland, California: California HealthCare Foundation, April 2002). 158 Mead and Kulick, “SB1953 and the Challenge of Hospital Seismic Safety in California,” 5. 159 Shattuck Hammond, The Financial Health of California Hospitals, chap. 6, 1. 160 Ibid. 161 Ibid., 8. 162 North Carolina Rural Health Research and Policy Analysis Center, “A Primer on Interpreting Hospital Margins” (Chapel Hill: University of North Carolina, July 2003, Retrieved February 1, 2007) http://www.shepscenter.unc.edu/research_programs/rural_program/Primer.pdf, 2. 163 Shattuck Hammond, The Financial Health of California Hospitals, chap.7, 2. 164 Ingenix, Almanac of Hospital Financial and Operating Indicators: A Comprehensive Benchmark of the Nation’s Hospitals 2006, 306. 165 Shattuck Hammond, The Financial Health of California Hospitals, chap. 7, 7. 166 Ibid., 10. 167 Ibid. 168 Shattuck Hammond, The Financial Health of California Hospitals, chap. 7, 11 169 “Staffing: California Hospital Asserts Registered Nurse Retention Rates Are Better than Average,” Healthcare Finance, Tax & Law Weekly (Atlanta: June 7, 2006), 228. 170 Shattuck Hammond, The Financial Health of California Hospitals, chap. 7, 13. 171 Ibid., 16. 172 Ibid. 173 Martin D. Arrick, Lisa Zuckerman and Stephen Infranco, “U.S. Not-for-profit Health Care 2006 Outlook: Emerging Evidence of a Turning Tide” (Standard & Poor’s, Feb. 6, 2006), 2. 174 Capitalization for for-profit hospitals is defined as equity, while capitalization for nonprofit hospitals is defined as total net assets. 175 Healthcare Financial Management Association (HFMA), “Financing the Future Report 1: How Are Hospitals Financing the Future? Access to Capital in Health Care Today” (Westchester, IL: HFMA, 2003). 176 Zuckerman, et al, “The California Health Care Market: Recent Strength Defies Expectations,” 1.
Financial Health of California Hospitals 8-22 PricewaterhouseCoopers LLP
177 Shattuck Hammond, The Financial Health of California Hospitals (Oakland, California: California HealthCare Foundation, July 2001), chap. 8, 10. 178 Zuckerman et al., “The California Health Care Market: Recent Strength Defies Expectations,” 1. 179 Arrick, Zuckerman and Infranco, “U.S. Not-for-profit Health Care 2006 Outlook: Emerging Evidence of a Turning Tide,” 1. 180 Fitch Ratings, “2006 Median Ratios for Nonprofit Hospitals and Health Care Systems” (Aug. 10, 2006), 1. 181 Fitch Ratings, “2007 Nonprofit Hospitals and Health Care Systems Outlook” (January 10, 2007), 1. 182 Ibid., 1-3. 183 David Peknay, “S&P Credit Market Services View: Evaluating a For-profit Hospital Company’s Creditworthiness,” Healthcare: Facilities Industry Survey (Standard & Poor’s, Dec. 28, 2006), 32. 184 Shattuck Hammond, The Financial Health of California Hospitals, chap. 8, 2. 185 Ibid., 3. 186 Ibid. 187 Ibid. 188 Cameron Lavy,“Uncompensated Care Continues to Pressure Providers,” Healthcare: Facilities Industry Survey, 1. 189 Ibid., 30. 190 David Peknay, “S&P Credit Market Services View: Evaluating a For-profit Hospital Company’s Creditworthiness,” 32.

pwc
Appendices: The Financial Health of California Hospitals California HealthCare Foundation June 2007 Commissioned by a grant from the California HealthCare Foundation. PricewaterhouseCoopers' services were performed, and this report was developed in accordance with our engagement letter dated Feb. 3, 2006, (CHCF reference 05-1574) and are subject to the terms and conditions included therein. Our services were performed in accordance with Standards for Consulting Services established by the American Institute of Certified Public Accountants (AICPA). The procedures we performed did not constitute an examination or a review in accordance with generally accepted auditing standards or attestation standards. Accordingly, we provide no opinion, attestation or other form of assurance with respect to our work or the information upon which our work was based. We did not audit or otherwise verify the information supplied to us in connection with this engagement, from whatever source, except as may be specified in this report or in our engagement letter. Our work was limited to the specific procedures and analysis described herein and was based only on the information made available through March 13, 2007. Accordingly, changes in circumstances after this date could affect the findings outlined in this report. © 2007 PricewaterhouseCoopers LLP. All rights reserved. PricewaterhouseCoopers LLP refers to the PricewaterhouseCoopers LLP (a Delaware limited liability partnership) or, as the context requires, other member firms of PricewaterhouseCoopers International Limited, each of which is a separate and independent legal entity.


Financial Health of California Hospitals i PricewaterhouseCoopers LLP
Table of Contents Page
Appendix A: Data and Methods .................................................................................... A–1 Data Source..............................................................................................................A–1
General Description .............................................................................................A–1 Analysis Period.....................................................................................................A–1 Definition of a Hospital .........................................................................................A–2 Variable Definitions ..............................................................................................A–2
Data Cleaning...........................................................................................................A–2 Exclusions ............................................................................................................A–2 Kaiser Foundation Hospitals ................................................................................A–3 Other Reporting Issues ........................................................................................A–5 Hospital Names....................................................................................................A–5 Missing Data.........................................................................................................A–5 Metric-Specific Data Cleaning..............................................................................A–5 Additional Data .....................................................................................................A–6
Data Definitions and Calculations ............................................................................A–7 Number of Beds ...................................................................................................A–7 Adjustment Factor for Adjusted Patient Days and Discharges ............................A–7 DSH Transfers......................................................................................................A–7 The Use of Medians .............................................................................................A–7 Financial Indicators ..............................................................................................A–8
Hospitals by Typology ..............................................................................................A–8 Typology Definitions.............................................................................................A–8 List of Included Hospitals ...................................................................................A–10
Appendix B: Interviews and Summary Findings......................................................... B–1 Methodology .............................................................................................................B–1 Key Findings.............................................................................................................B–2
Thoughts on Operating Margin ............................................................................B–2 Thoughts on Revenue/Expense...........................................................................B–3 Thoughts on Key Expenses .................................................................................B–4 Thoughts on Nursing/Resources..........................................................................B–5 Thoughts on Capital Planning ..............................................................................B–6 Thoughts on County Indigent/Uncompensated Care...........................................B–7 Other Views..........................................................................................................B–8
Appendix C: Government Legislation and Regulations ............................................. C–1 Federal Health Insurance Portability and Accountability Act of 1996 (HIPAA) ....... C–1
Privacy................................................................................................................. C–1 Security ............................................................................................................... C–1 Electronic Transactions....................................................................................... C–2 Unique Identifiers ................................................................................................ C–2
Federal Emergency Medical Treatment & Labor Act of 1986 ................................. C–3 Senate Bill 1953 of 1994: California’s Hospital Seismic Safety Law Amendment .. C–5 California Assembly Bill 394 of 1999: Nurse Staffing Ratios................................. C–10
Financial Health of California Hospitals ii PricewaterhouseCoopers LLP
Appendix D: Hospital Governmental Reimbursement Programs.............................. D–1 Medicare.................................................................................................................. D–1
Program Description ........................................................................................... D–1 Recent Legislation and Impact............................................................................ D–2
Medi-Cal (California’s Medicaid Program)............................................................... D–5 Program Description ........................................................................................... D–5 Recent Legislation and Impact............................................................................ D–6
Medi-Cal Managed Care ......................................................................................... D–7 Disproportionate Share Hospitals (DSH)................................................................. D–8
Appendix E: Hospital Capital Financing System .........................................................E–1 Tax-Exempt Hospital Financing ...............................................................................E–4 Credit Quality, Access to Capital and Credit Trends................................................E–5 Credit Enhancement and Trends .............................................................................E–8
Appendix F: Report on Hospital Closures, Acquisitions and Mergers ......................F–1 Closures ...................................................................................................................F–1
Closures from 2001 to 2005.................................................................................F–2 Closures from 1995 to 2000.................................................................................F–6
Mergers and Acquisitions .........................................................................................F–6
Financial Health of California Hospitals iii PricewaterhouseCoopers LLP
List of Figures Page Figure A.1: Closed Hospitals and Year of Closure ...................................................................................A–3 Figure A.2: Kaiser Regional Breakdown for Northern and Southern California........................................A–4 Figure A.3: Regions ..................................................................................................................................A–9 Figure A.4: List of All Included Hospitals by Year...................................................................................A–10 Figure B.1: Interview Participants .............................................................................................................B–1 Figure C.1: HIPAA Administrative Simplification Compliance Deadlines ................................................ C–3 Figure C.2: Seismic Hazard Zone Map.................................................................................................... C–8 Figure C.3: Probabilistic Seismic Hazard Map of California .................................................................... C–9 Figure C.4: Nurse-to-Patient Staffing Ratios.......................................................................................... C–10 Figure E.1: Sources of Capital by Ownership Type..................................................................................E–1 Figure E.2: Sources of Capital ..................................................................................................................E–2 Figure E.3: Rating Categories...................................................................................................................E–5 Figure E.4: Sources of Credit Enhancement ............................................................................................E–8 Figure F.1: Hospital Closures in California 1996–2005 ............................................................................F–1 Figure F.2: Hospital Closures in California ...............................................................................................F–2 Figure F.3: California Hospital Mergers and Acquisitions 1999-2005 ......................................................F–7 Figure F.4: Comparison of California and U.S. Average Price per Bed Sold 1999-2005.........................F–8 Figure F.5: Comparison of California and U.S. Average Revenue per Bed Sold 1999–2005..................F–8


Financial Health of California Hospitals A-1 PricewaterhouseCoopers LLP
Appendix A: Data and Methods
Data Source
General Description The primary source of data for this study is the Selected Annual Hospital Financial Data obtained from California’s Office of Statewide Health Planning and Development (OSHPD). Unless otherwise noted, all data tables and charts throughout the study are based on OSHPD data. These datasets have been enhanced by OSHPD to include additional variables, such as bed days, adjusted patient days and the net Disproportionate Share Hospital (DSH) payments calculated from the annual financial data variables. More details on the methodology for such calculations are provided in the following sections. These datasets also serve as the basis for the Selected Annual Financial Data Pivot Profiles developed by OSHPD, available for download at http://www.oshpd.ca.gov/HQAD/Hospital/financial/hospAF.htm.
The Selected Annual Hospital Financial Data is a subset of the full body of information reported on OSHPD’s Hospital Annual Financial Disclosure Reports. The disclosure reports consist of detailed financial and utilization information compiled and submitted by hospitals each year, including a detailed income statement, balance sheet, statements of revenue and expense and supporting schedules.1 All California licensed hospitals are required to submit an annual disclosure report to OSHPD within seven months (four months, plus a possible three-month extension) from the end of their fiscal year. These financial reports are based on a uniform accounting and reporting system developed and maintained by OSHPD and undergo a thorough desk audit.2 The complete disclosure reports are available for purchase from OSHPD on a CD-ROM. Certain pages of the disclosure reports and their associated report forms are available on OSHPD’s website at http://www.oshpd.ca.gov/HID/hospital/finance/annual/index.htm. Because of its ease of use and accessibility, this study relies on the Selected Annual Hospital Financial Data rather than the full Hospital Disclosure Reports.
Analysis Period Any hospital with a reporting period falling wholly or partially within the period January 1, 2001, through December 31, 2005, is included in the data. The data is divided into five reporting years, 2001–2005, based on the fiscal year-end dates of individual reporting hospitals. For example, if a hospital’s reporting period ended on January 31, 2005, or December 31, 2005, it is included in the 2005 section of the dataset. Some of this 2005 data would therefore include hospitals with reporting cycles that may cover a significant portion of 2004.
Penalties exist for hospitals that report late — $100 for each day the filing is overdue. If hospitals fail to report a minimum amount of relevant information, OSHPD staff follows up with the hospitals to obtain additional information. Because OSHPD cannot delay publication indefinitely, for certain years, late reporting hospitals are missing from the data.
Effective with report periods ended on and after June 30, 2000, the Hospital Annual Financial Disclosure Report was amended to include financial and utilization data associated with patients enrolled in managed care health plans. Specifically, a more refined breakdown of payer categories was introduced: Medicare Managed Care, Medi-Cal Managed Care, County Indigent Managed Care, and Other Third Parties Managed Care were added. For report periods ended before June 30, 2000, these payer categories were reported under the Other Third Parties payer category. Additionally, an Other Indigent payer category that was formerly part of Other Payers was established.3 These payer categories were used to report breakdowns of a number of the utilization and revenue variables.
The previous study released by Shattuck Hammond Partners in July 2001 covered an analysis period of 1995 to 1999. In an effort to maintain the continuum, 2000 data was assessed; however, because of these changes in the reporting requirements, certain data elements in the revised selected data file were not comparable with the pre-June 30, 2000 data files. Also due to this change, the 2000 data file includes only hospitals with reporting periods ended on June 30, 2000 through December 31, 2000. Therefore, it was determined that an analysis period excluding the incomplete 2000 data would provide the most accurate view of the financial health of California hospitals.

Financial Health of California Hospitals A-2 PricewaterhouseCoopers LLP
Definition of a Hospital A hospital, for the purposes of this study, refers to any reporting hospital included in the hospital disclosure filing material for a given year. Based on this definition, a total count of hospitals does not equate to a count of licensed hospitals nor a count of individual hospital sites. More than one hospital site might operate under a single license; and multiple hospitals operating under one license could submit multiple reports in a single year. This can occur if there is a change of ownership so that parts of the year are reported by different corporate entities. Therefore, the number of hospitals that submit disclosure reports does not perfectly correspond to the number of hospital sites.
Variable Definitions Data elements in the Selected Annual Hospital Financial Data are defined in the Selected Data File Documentation for Report Periods Ended on and after June 30, 2004, which can be found at http://www.oshpd.ca.gov/HQAD/Hospital/financial/annualSData/CY04/HAFDDoc2004.pdf. OSHPD provided PricewaterhouseCoopers with the formulas used to calculate additional variables, such as Net Revenue with Net DSH Transfer, which are included in the pivot profiles and derived from the submitted annual financial data. Formulas for values summarized in the pivot tables are also those used by OSHPD.
Classification variables, such as ownership type, urban or rural status, teaching status and DSH status, also are used with the OSHPD assignment.
Data Cleaning
Exclusions This study focused on all hospitals that submitted disclosure reports and were classified as general acute and children’s acute care hospitals. Specialty and psychiatric hospitals were excluded if they were licensed as such. Some specialty and psychiatric hospitals licensed as acute care hospitals — for example, the long-term acute care hospitals operated by Kindred and the Shriners hospitals — were excluded for purposes of this study. However, many acute care hospitals have psychiatric or chemical dependency units or beds. All beds, including ones for psychiatric or chemical dependency, licensed in a general acute care hospital, were included in the analysis. Applying the exclusion criteria reduced the total observations from 441 to 355 disclosure reports in 2005.
Throughout the time covered in this analysis, certain hospitals occasionally changed classifications, which influenced the overall number of hospitals analyzed from year to year. These changes in classification were infrequent. Rather than attempting to adjust for each of these reporting issues in each year, with the aforementioned exceptions, all hospitals that reported as a general acute or children’s hospital were included in that year’s dataset.
In addition, a number of hospitals closed within the analysis period, which also contributed to a different number of reporting hospitals each year. This also means that the set of included hospitals varied across the years.
OSHPD’s Healthcare Facilities Licensure file provides a snapshot of hospital closures (see Figure A.1).

Financial Health of California Hospitals A-3 PricewaterhouseCoopers LLP
Figure A.1: Closed Hospitals and Year of Closure Year Facility Name 2002 Memorial Hospital at Exeter 2003 Lassen Community Hospital Orange County Community Hospital of Buena Park San Luis Obispo General Hospital Santa Ana Hospital Medical Center St. Luke Medical Center 2004 Granada Hills Community Hospital Monrovia Community Hospital Northridge Hospital and Medical Center, Sherman Way Campus Robert F. Kennedy Medical Center San Jose Medical Center 2005 Brea Community Hospital
Source: OSHPD Healthcare Facilities Licensure File 2004
The full list of included hospitals and an indicator of whether it reported each year of the period 2001–2005 is shown in Figure A.4.
Kaiser Foundation Hospitals OSHPD authorizes Kaiser to submit a consolidated income and expense statement because the majority of its revenue comes from revenue to the health maintenance organization (HMO) itself. However, because of the important role that Kaiser plays in the California hospital system, to the extent possible, this study included Kaiser data. Because Kaiser reports utilization at the individual hospital level and consolidated financial statement information at the regional level, in many circumstances it was possible to allocate consolidated information to the hospitals using a pro rata methodology to achieve a general understanding of Kaiser hospitals’ financial performance. In all cases unless otherwise noted, this analysis incorporated all acute care hospital data. Nevertheless, in a number of cases, it was impossible to include certain Kaiser hospitals when the reports did not provide enough information to complete the calculations.
For the financial information, including such metrics as operating revenue and expenses, the pro rata methodology effectively assigned to each Kaiser hospital in a region the reported value for the appropriate aggregated region. The allocated revenue and expense variables included gross patient revenue, net patient revenue, other operating revenue, total operating revenue, total operating expense, net from operations, nonoperating revenue, nonoperating expense, and net income. A factor was calculated based on the proportion of CMI-adjusted total patient days for each individual hospital to the CMI-adjusted total patient days for the region. This factor then was applied to each of the above variables to arrive at an allocated value for each hospital.
Figure A.2 shows the Kaiser regional breakdown between Northern and Southern California4.

Financial Health of California Hospitals A-4 PricewaterhouseCoopers LLP
Figure A.2: Kaiser Regional Breakdown for Northern and Southern California
Region Facility Name North Kaiser Foundation Hospital - Fresno Kaiser Foundation Hospital - Geary (S.F.) Kaiser Foundation Hospital - Hayward Kaiser Foundation Hospital - Oakland Campus Kaiser Foundation Hospital - Redwood City Kaiser Foundation Hospital - Sacramento Kaiser Foundation Hospital - San Rafael Kaiser Foundation Hospital - Santa Clara Kaiser Foundation Hospital - Santa Rosa Kaiser Foundation Hospital - Santa Teresa Community Hospital Kaiser Foundation Hospital - South Sacramento Kaiser Foundation Hospital - South San Francisco Kaiser Foundation Hospital - Walnut Creek St. Dominic’s Hospital
South Kaiser Foundation Hospital - Anaheim Kaiser Foundation Hospital - Baldwin Park Kaiser Foundation Hospital - Bellflower Kaiser Foundation Hospital - Fontana Kaiser Foundation Hospital - Harbor City Kaiser Foundation Hospital - Panorama City Kaiser Foundation Hospital - Riverside Kaiser Foundation Hospital - San Diego Kaiser Foundation Hospital - Sunset Kaiser Foundation Hospital - West La Kaiser Foundation Hospital - Woodland Hills
Source: Kaiser Permanente website
Using this pro rata methodology allowed the inclusion of Kaiser data in the overall assessment of the system’s profitability and its effect on the California market while maintaining an accurate count of the number of hospitals included in the analysis. However, there are situations in which the exclusion of Kaiser data was inevitable even when the pro rata methodology was applied. For example, because Kaiser did not report revenue by inpatient and outpatient categories, any metric that was calculated on the basis of adjusted patient days excluded Kaiser data.

Financial Health of California Hospitals A-5 PricewaterhouseCoopers LLP
A number of data anomalies exist in the Kaiser reported data. In 2001, 2002 and 2003, all Kaiser hospitals in the Northern California region appear to have reported some patient days, discharges and visits in the “traditional” category rather than the “managed care” category. OSHPD staff confirmed this issue; therefore, this analysis applied an additional step in the data cleaning process to correct the data. Certain outpatient utilization data, such as emergency room visits, inpatient surgeries, outpatient surgeries and total outpatient visits, were incomplete or inconsistent. For example, some hospitals reported total outpatient visits equal to the values reported for outpatient surgeries. In another example, in 2004, all Kaiser hospitals reported zero emergency room visits.
In addition to the annual financial reports, all nonfederal hospitals licensed in California are required to file an annual utilization report with OSHPD at the end of each calendar year. This analysis compared the disclosure report data to the OSHPD Hospital Annual Utilization Report to determine the accuracy of the data. A comparison showed that data in the utilization report exhibited a much more reasonable pattern and trend during the five-year analysis period. Therefore, this analysis substituted emergency room visit, inpatient surgery and outpatient surgery data for Kaiser hospitals with data from the utilization report.
Other Reporting Issues For various reasons, some hospitals filed reports that represented less than or more than 365 days in a reporting period. This could have occurred when a hospital was closed or sold. With OSHPD approval, a reporting period may be as long as an additional quarter or up to 487 days. For each of these hospitals, it was verified that no multiple reports were filed for the same hospital in the same year; these reports were then included in the analysis without modification. However, care was taken in calculations, such as occupancy rates, to ensure that the actual number of days in the reporting period was used, rather than defaulting to 365 days.
For example, Novato Community Hospital had two reports for 2001, one representing 139 days and the other 226 days, totaling 365 days. To combine the two reports, descriptive statistics such as bed size, type of ownership and address that matched information submitted in later years were selected. Certain variables such as patient days, discharges, visits, revenue, expenses and productive hours were aggregated together by simple addition. Other variables such as bed days and FTEs were recalculated to reflect the combined number of days in the reporting period.
In 2001, a handful of hospitals reported values in the wrong variables. Specifically, productive hours were reported as paid hours, paid hours as hospital FTE, and hospital FTE as productive hours. These variables were rearranged to reflect the correct values.
Hospital Names Each hospital might report in each year under a slightly different name due to spelling differences or use of abbreviations. For consistency, this analysis assigned all hospitals names for all years corresponding to those reported in the AHA Guide.
Missing Data When certain individual hospitals did not report critical data elements, those hospitals were excluded from the specific analysis. For example, when CMI-adjusted average length of stay (ALOS) was calculated, hospitals that did not provide days, discharges or CMI information were excluded from the specific analysis.
Metric-Specific Data Cleaning Throughout the course of the analysis, data cleaning methods specifically targeted to individual metric calculations were employed. These methods were footnoted.

Financial Health of California Hospitals A-6 PricewaterhouseCoopers LLP
Additional Data A number of additional variables from various sources were added to the OSHPD selected data to facilitate additional analyses and to further inform:
Case Mix Index (CMI): OSHPD provided the CMI data used in the analysis. It is available for download at http://www.oshpd.ca.gov/HQAD/PatientLevel/index.htm. To calculate each hospital’s CMI, OSHPD uses a grouper software system used by the Centers for Medicare and Medicaid Services (CMS) and Diagnosis Related Groups (DRG) weights from the Federal Register applied to the Medicare program for the relevant year. OSHPD applies the grouper software to all patient discharge data (rather than Medicare discharges only) reported by hospitals in California during the course of a calendar year. The source of the patient-level data is the Inpatient Hospital Discharge Data.5
California Health Interview Survey (CHIS) regions6: The geographic typology of north versus south used in the earlier report has been improved by using a variation of the CHIS regional breakdowns. This was done to improve the analysis based on geographical differences and to allow a better match to other data sources that researchers and policy analysts may use. Therefore, the refinement in regions improves the ability to discern utilization patterns and financial trends that are more representative of the local health care market. The difference from the CHIS regions is that Orange and San Diego counties were considered sufficiently large and different enough from each other that they were further broken out from the “Other Southern California counties” used in the CHIS region definition.
American Hospital Association (AHA) system definition: The OSHPD pivot profiles data included a system indicator. Based on discussion with OSHPD, PricewaterhouseCoopers (PwC) learned that OSHPD staff who annually research the major hospital systems added this indicator. PwC dropped the OSHPD system designation indicator from the database and replaced it with a system indicator and name reported by hospitals to the American Hospital Association (AHA) Annual Survey. Because there is a two-year lag between the year of survey data and published data, AHA Guides from 2003 to 2007 were consulted to assign the correct system designation for each hospital in the analysis period of 2001 to 2005. All hospital systems reported to the AHA were included. Therefore, a hospital was considered part of a system if all members of the hospital system were based in California or if it was one of a regional or national system that had hospitals in other states or throughout the country.
Herfindahl-Hirschman Index (HHI): the HHI is a commonly accepted measure of market concentration. A hospital-level HHI for 2003 using the OSHPD discharge date that was developed by Glenn Melnick of the University of Southern California was attached to the database to determine each hospital’s competitive level.
Critical Access Hospitals: Critical access hospitals were identified by a list obtained from the U.S. Department of Health and Human Services Health Resources and Services Administration.
Designated Public Hospitals: Designated public hospitals were identified by a list from Bill Number AB 3070 Chapter 327 filed with the California secretary of state. A “designated public hospital” refers to a government-operated hospital to be reimbursed on a certified public expenditure basis to the special terms and conditions for the demonstration project issued by the federal Centers for Medicare and Medicaid Services (CMS).
Information from the OSHPD Healthcare Facilities Licensure File 2004: Additional information, such as hospital license number, facility status, hospital category, state assembly district, congressional district and state senate district, was added to the database.

Financial Health of California Hospitals A-7 PricewaterhouseCoopers LLP
Data Definitions and Calculations
Number of Beds To understand the current capacity of the California hospital system, this study examined the number of available beds over time. OSHPD requires that hospitals submit information about licensed, staffed and available beds.
Licensed beds refers to the number of licensed beds (excluding beds placed in suspense and nursery bassinets) stated on the hospital license at the end of the reporting period.
Available beds refers to the average daily complement of beds (excluding nursery bassinets) physically existing and actually available for overnight use, regardless of staffing levels. This variable excludes beds placed in suspense or in nursing units converted to nonpatient care uses that cannot be placed into service within 24 hours.
Staffed beds refers to the average daily complement of beds (excluding nursery bassinets) that are set up, staffed and equipped, and in all respects, ready for use by patients remaining in the hospital overnight.
For the purposes of this study, available beds provide the most relevant information about short-term hospital capacity. This variable measures the number of patients a hospital could accommodate. Staffed beds, on the other hand, usually are based on actual occupancy levels, not necessarily on the true capacity of a hospital.
Adjustment Factor for Adjusted Patient Days and Discharges The term adjustment factor refers to the calculation used to account for the relative volume of inpatient versus outpatient care. It is computed by dividing gross total patient revenues by gross inpatient revenues.
DSH Transfers The SB 855 supplemental funding for hospitals that are eligible for the Disproportionate Share Hospital (DSH) program is included in the net-patient-revenue variable reported by OSHPD. During the period covered by this report, the state dollars for the federal match were provided through intergovernmental transfers (IGTs) from public hospitals operated by city, county, district and the University of California hospitals. These IGTs are recouped by the governmental entity after DSH payments are made directly to the hospitals. Therefore, for these public DSH hospitals, net patient revenue is overstated by the amount that the hospitals are required to transfer back to the governmental entity. The DSH transfer calculation subtracts the amount of the payments made by county, district and University of California DSH providers to the related governmental entities from the reported net patient revenue, resulting in net patient revenue with DSH transfer. Because the private DSH hospitals do not provide any IGT, there is no DSH transfer, and the full value of the DSH payment as reported in net patient revenue is included for the private DSH hospitals.
The Use of Medians To minimize the effect of skewing from outliers, this analysis used medians for the majority of the revenue, expense and margin trend analysis. Averages and sums were used for the evaluation of mathematical relationships.
The use of medians not only reduces the effects of outliers, but also provides insight into individual hospitals. Regardless of size, individual hospitals are the fundamental economic unit on whose financial performance the hospital industry depends for its financial health.
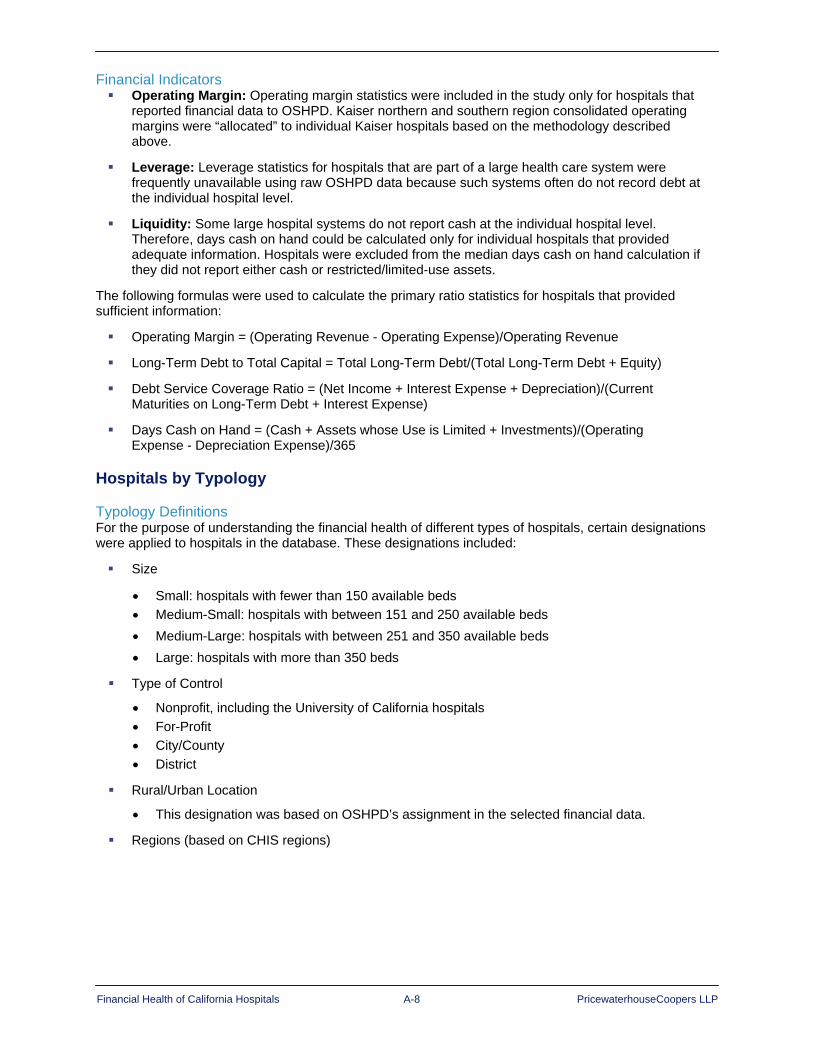
Financial Health of California Hospitals A-8 PricewaterhouseCoopers LLP
Financial Indicators Operating Margin: Operating margin statistics were included in the study only for hospitals that
reported financial data to OSHPD. Kaiser northern and southern region consolidated operating margins were “allocated” to individual Kaiser hospitals based on the methodology described above.
Leverage: Leverage statistics for hospitals that are part of a large health care system were frequently unavailable using raw OSHPD data because such systems often do not record debt at the individual hospital level.
Liquidity: Some large hospital systems do not report cash at the individual hospital level. Therefore, days cash on hand could be calculated only for individual hospitals that provided adequate information. Hospitals were excluded from the median days cash on hand calculation if they did not report either cash or restricted/limited-use assets.
The following formulas were used to calculate the primary ratio statistics for hospitals that provided sufficient information:
Operating Margin = (Operating Revenue - Operating Expense)/Operating Revenue
Long-Term Debt to Total Capital = Total Long-Term Debt/(Total Long-Term Debt + Equity)
Debt Service Coverage Ratio = (Net Income + Interest Expense + Depreciation)/(Current Maturities on Long-Term Debt + Interest Expense)
Days Cash on Hand = (Cash + Assets whose Use is Limited + Investments)/(Operating Expense - Depreciation Expense)/365
Hospitals by Typology
Typology Definitions For the purpose of understanding the financial health of different types of hospitals, certain designations were applied to hospitals in the database. These designations included:
Size
• Small: hospitals with fewer than 150 available beds • Medium-Small: hospitals with between 151 and 250 available beds • Medium-Large: hospitals with between 251 and 350 available beds • Large: hospitals with more than 350 beds
Type of Control
• Nonprofit, including the University of California hospitals • For-Profit • City/County • District
Rural/Urban Location
• This designation was based on OSHPD’s assignment in the selected financial data.
Regions (based on CHIS regions)

Financial Health of California Hospitals A-9 PricewaterhouseCoopers LLP
Figure A.3: Regions
• Northern and Sierra Counties: Alpine, Amador, Butte, Calaveras, Colusa, Del Norte, Glenn, Humboldt, Inyo, Lake, Lassen, Mariposa, Mendocino, Modoc, Mono, Nevada, Plumas, Shasta, Sierra, Siskiyou, Sutter, Tehama, Trinity, Tuolumne, Yuba
• Greater Bay Area Counties: Alameda, Contra Costa, Marin, Napa, San Francisco, San Mateo, Santa Clara, Solano, Sonoma
• Sacramento Area Counties: El Dorado, Placer, Sacramento, Yolo • San Joaquin Valley Counties: Fresno, Kern, Kings, Madera, Merced, Stanislaus • Central Coast Counties: Monterey, San Benito, San Joaquin, San Luis Obispo,
Santa Barbara, Tulare, Ventura • Los Angeles: Los Angeles County • Other Southern Counties: Imperial, Riverside, San Bernardino • Orange: Orange County (separated from the original CHIS region definitions) • San Diego: San Diego County (separated from the original CHIS region definitions)
DSH Status
• Hospitals designated as DSH hospitals for a given year were identified by OSHPD as those receiving DSH funding in that reporting year.
System Designation
• Hospitals were classified as being members of a system based on AHA Guides 2003 to 2007, for designation in the period 2001 to 2005.
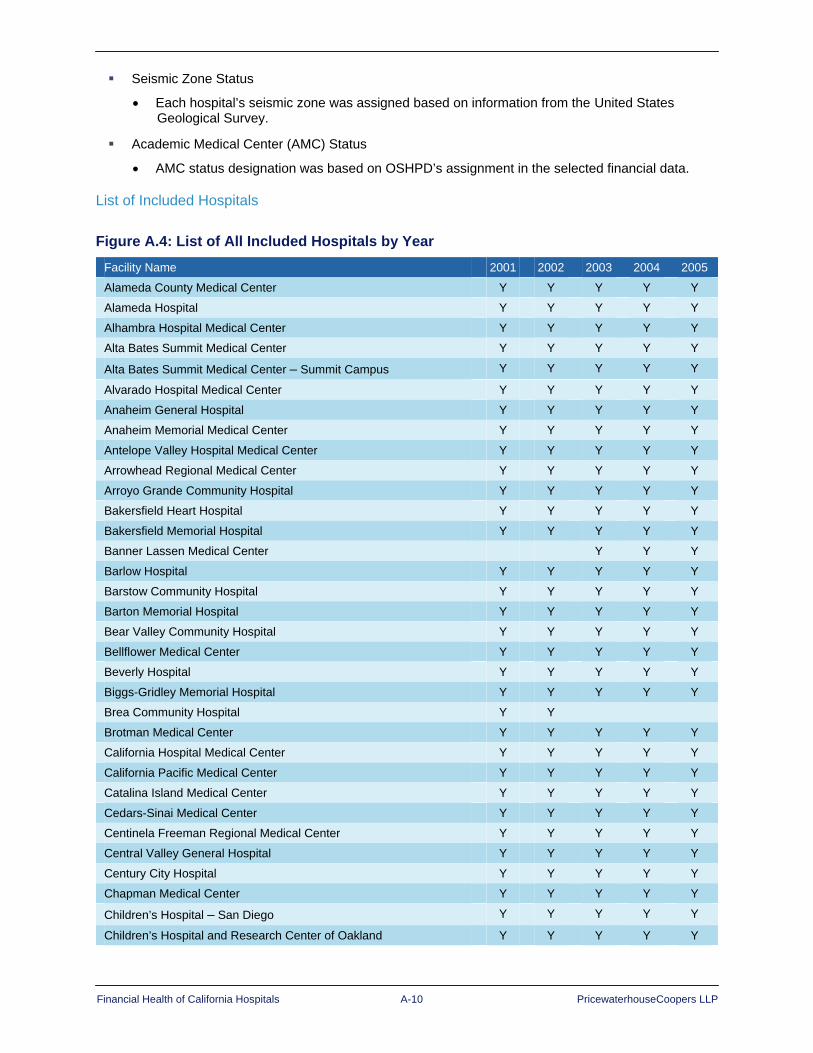
Financial Health of California Hospitals A-10 PricewaterhouseCoopers LLP
Seismic Zone Status
• Each hospital’s seismic zone was assigned based on information from the United States Geological Survey.
Academic Medical Center (AMC) Status
• AMC status designation was based on OSHPD’s assignment in the selected financial data.
List of Included Hospitals
Figure A.4: List of All Included Hospitals by Year
Facility Name 2001 2002 2003 2004 2005
Alameda County Medical Center Y Y Y Y Y
Alameda Hospital Y Y Y Y Y
Alhambra Hospital Medical Center Y Y Y Y Y
Alta Bates Summit Medical Center Y Y Y Y Y
Alta Bates Summit Medical Center – Summit Campus Y Y Y Y Y
Alvarado Hospital Medical Center Y Y Y Y Y
Anaheim General Hospital Y Y Y Y Y
Anaheim Memorial Medical Center Y Y Y Y Y
Antelope Valley Hospital Medical Center Y Y Y Y Y
Arrowhead Regional Medical Center Y Y Y Y Y
Arroyo Grande Community Hospital Y Y Y Y Y
Bakersfield Heart Hospital Y Y Y Y Y
Bakersfield Memorial Hospital Y Y Y Y Y
Banner Lassen Medical Center Y Y Y
Barlow Hospital Y Y Y Y Y
Barstow Community Hospital Y Y Y Y Y
Barton Memorial Hospital Y Y Y Y Y
Bear Valley Community Hospital Y Y Y Y Y
Bellflower Medical Center Y Y Y Y Y
Beverly Hospital Y Y Y Y Y
Biggs-Gridley Memorial Hospital Y Y Y Y Y
Brea Community Hospital Y Y
Brotman Medical Center Y Y Y Y Y
California Hospital Medical Center Y Y Y Y Y
California Pacific Medical Center Y Y Y Y Y
Catalina Island Medical Center Y Y Y Y Y
Cedars-Sinai Medical Center Y Y Y Y Y
Centinela Freeman Regional Medical Center Y Y Y Y Y
Central Valley General Hospital Y Y Y Y Y
Century City Hospital Y Y Y Y Y
Chapman Medical Center Y Y Y Y Y
Children’s Hospital – San Diego Y Y Y Y Y
Children’s Hospital and Research Center of Oakland Y Y Y Y Y
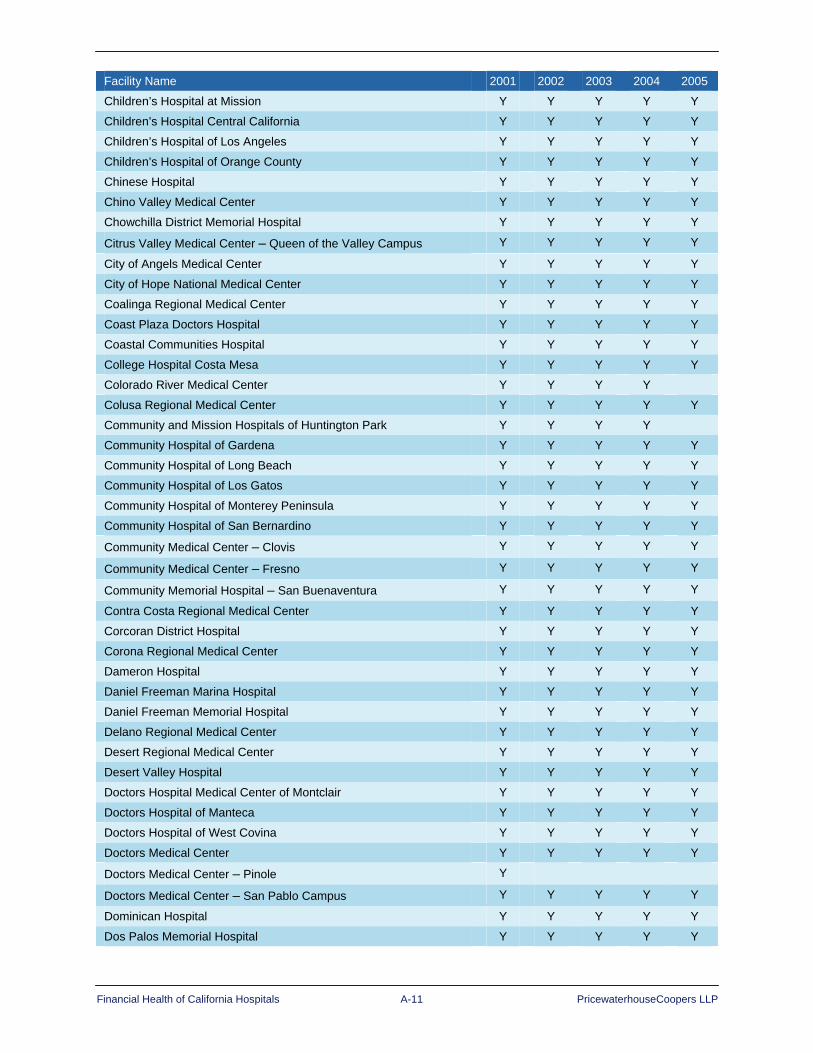
Financial Health of California Hospitals A-11 PricewaterhouseCoopers LLP
Facility Name 2001 2002 2003 2004 2005
Children’s Hospital at Mission Y Y Y Y Y
Children’s Hospital Central California Y Y Y Y Y
Children’s Hospital of Los Angeles Y Y Y Y Y
Children’s Hospital of Orange County Y Y Y Y Y
Chinese Hospital Y Y Y Y Y
Chino Valley Medical Center Y Y Y Y Y
Chowchilla District Memorial Hospital Y Y Y Y Y
Citrus Valley Medical Center – Queen of the Valley Campus Y Y Y Y Y
City of Angels Medical Center Y Y Y Y Y
City of Hope National Medical Center Y Y Y Y Y
Coalinga Regional Medical Center Y Y Y Y Y
Coast Plaza Doctors Hospital Y Y Y Y Y
Coastal Communities Hospital Y Y Y Y Y
College Hospital Costa Mesa Y Y Y Y Y
Colorado River Medical Center Y Y Y Y
Colusa Regional Medical Center Y Y Y Y Y
Community and Mission Hospitals of Huntington Park Y Y Y Y
Community Hospital of Gardena Y Y Y Y Y
Community Hospital of Long Beach Y Y Y Y Y
Community Hospital of Los Gatos Y Y Y Y Y
Community Hospital of Monterey Peninsula Y Y Y Y Y
Community Hospital of San Bernardino Y Y Y Y Y
Community Medical Center – Clovis Y Y Y Y Y
Community Medical Center – Fresno Y Y Y Y Y
Community Memorial Hospital – San Buenaventura Y Y Y Y Y
Contra Costa Regional Medical Center Y Y Y Y Y
Corcoran District Hospital Y Y Y Y Y
Corona Regional Medical Center Y Y Y Y Y
Dameron Hospital Y Y Y Y Y
Daniel Freeman Marina Hospital Y Y Y Y Y
Daniel Freeman Memorial Hospital Y Y Y Y Y
Delano Regional Medical Center Y Y Y Y Y
Desert Regional Medical Center Y Y Y Y Y
Desert Valley Hospital Y Y Y Y Y
Doctors Hospital Medical Center of Montclair Y Y Y Y Y
Doctors Hospital of Manteca Y Y Y Y Y
Doctors Hospital of West Covina Y Y Y Y Y
Doctors Medical Center Y Y Y Y Y
Doctors Medical Center – Pinole Y
Doctors Medical Center – San Pablo Campus Y Y Y Y Y
Dominican Hospital Y Y Y Y Y
Dos Palos Memorial Hospital Y Y Y Y Y

Financial Health of California Hospitals A-12 PricewaterhouseCoopers LLP
Facility Name 2001 2002 2003 2004 2005
Downey Regional Medical Center Y Y Y Y Y
Earl & Lorraine Miller Children’s Hospital Y Y Y Y Y
East Los Angeles Doctors Hospital Y Y Y Y Y
Eastern Plumas Health Care Y Y Y Y Y
Eden Medical Center Y Y Y Y Y
Eisenhower Medical Center Y Y Y Y Y
El Camino Hospital Y Y Y Y Y
El Centro Regional Medical Center Y Y Y Y Y
Emanuel Medical Center Y Y Y Y Y
Encino-Tarzana Regional Medical Center Encino Campus Y Y Y Y Y
Encino-Tarzana Regional Medical Center Tarzana Campus Y Y Y Y Y
Enloe Medical Center – Esplanade Campus Y Y Y Y Y
Fairchild Medical Center Y Y Y Y Y
Fallbrook Hospital Y Y Y Y Y
Feather River Hospital Y Y Y Y Y
Foothill Presbyterian Hospital – Morris L. Johnston Memorial Y Y Y Y Y
Fountain Valley Regional Hospital and Medical Center Y Y Y Y Y
Frank R. Howard Memorial Hospital Y Y Y Y Y
Fremont Medical Center – Yuba City Y Y Y
French Hospital Medical Center Y Y Y Y Y
Fresno Heart Hospital Y Y
Fresno Surgery Center Y Y Y Y Y
Garden Grove Hospital and Medical Center Y Y Y Y Y
Garfield Medical Center Y Y Y Y Y
George L. Mee Memorial Hospital Y Y Y Y Y
Glendale Adventist Medical Center Y Y Y Y Y
Glendale Memorial Hospital and Health Center Y Y Y Y Y
Glenn Medical Center Y Y Y Y Y
Goleta Valley Cottage Hospital Y Y Y Y Y
Good Samaritan Hospital Y Y Y Y Y
Good Samaritan Hospital – Los Angeles Y Y Y Y Y
Good Samaritan Hospital – Bakersfield Y Y Y Y Y
Granada Hills Community Hospital Y Y
Greater El Monte Community Hospital Y Y Y Y Y
Hanford Community Medical Center Y Y Y Y Y
Hazel Hawkins Memorial Hospital Y Y Y Y Y
Healdsburg District Hospital Y Y Y Y Y
Hemet Valley Medical Center Y Y Y Y Y
Henry Mayo Newhall Memorial Hospital Y Y Y Y Y
Hi-Desert Medical Center Y Y Y Y Y
Hoag Memorial Hospital Presbyterian Y Y Y Y Y
Hollywood Community Hospital Y Y Y
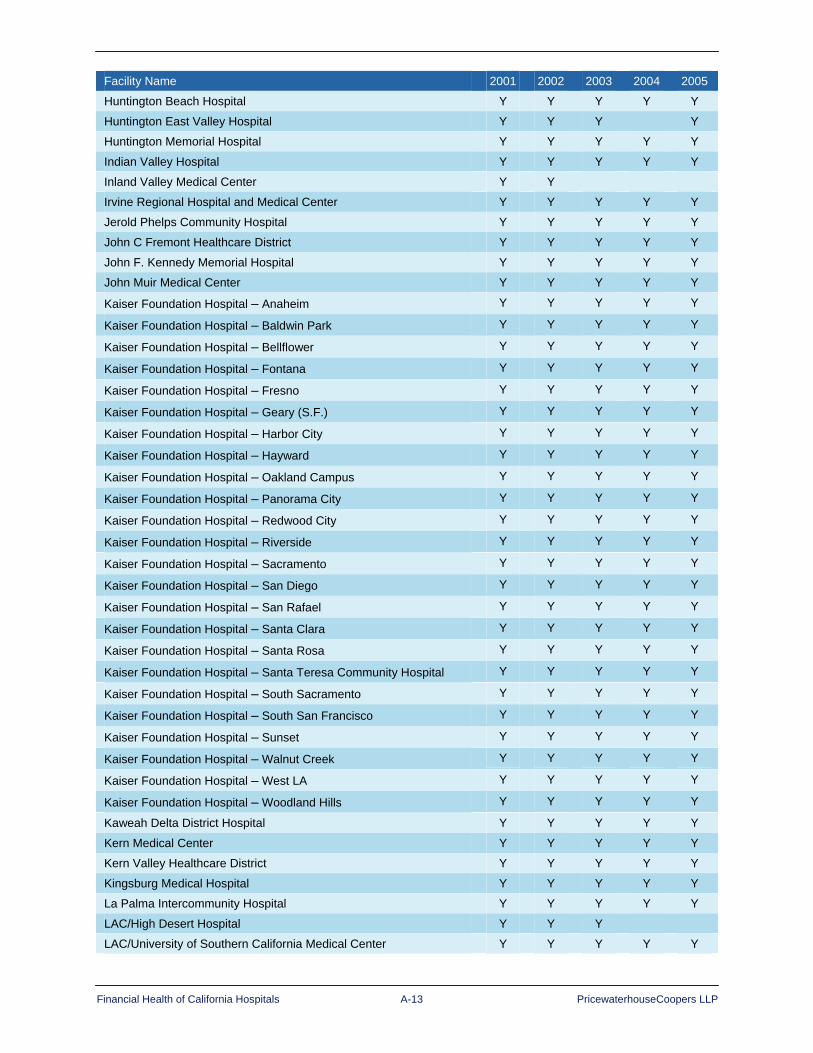
Financial Health of California Hospitals A-13 PricewaterhouseCoopers LLP
Facility Name 2001 2002 2003 2004 2005
Huntington Beach Hospital Y Y Y Y Y
Huntington East Valley Hospital Y Y Y Y
Huntington Memorial Hospital Y Y Y Y Y
Indian Valley Hospital Y Y Y Y Y
Inland Valley Medical Center Y Y
Irvine Regional Hospital and Medical Center Y Y Y Y Y
Jerold Phelps Community Hospital Y Y Y Y Y
John C Fremont Healthcare District Y Y Y Y Y
John F. Kennedy Memorial Hospital Y Y Y Y Y
John Muir Medical Center Y Y Y Y Y
Kaiser Foundation Hospital – Anaheim Y Y Y Y Y
Kaiser Foundation Hospital – Baldwin Park Y Y Y Y Y
Kaiser Foundation Hospital – Bellflower Y Y Y Y Y
Kaiser Foundation Hospital – Fontana Y Y Y Y Y
Kaiser Foundation Hospital – Fresno Y Y Y Y Y
Kaiser Foundation Hospital – Geary (S.F.) Y Y Y Y Y
Kaiser Foundation Hospital – Harbor City Y Y Y Y Y
Kaiser Foundation Hospital – Hayward Y Y Y Y Y
Kaiser Foundation Hospital – Oakland Campus Y Y Y Y Y
Kaiser Foundation Hospital – Panorama City Y Y Y Y Y
Kaiser Foundation Hospital – Redwood City Y Y Y Y Y
Kaiser Foundation Hospital – Riverside Y Y Y Y Y
Kaiser Foundation Hospital – Sacramento Y Y Y Y Y
Kaiser Foundation Hospital – San Diego Y Y Y Y Y
Kaiser Foundation Hospital – San Rafael Y Y Y Y Y
Kaiser Foundation Hospital – Santa Clara Y Y Y Y Y
Kaiser Foundation Hospital – Santa Rosa Y Y Y Y Y
Kaiser Foundation Hospital – Santa Teresa Community Hospital Y Y Y Y Y
Kaiser Foundation Hospital – South Sacramento Y Y Y Y Y
Kaiser Foundation Hospital – South San Francisco Y Y Y Y Y
Kaiser Foundation Hospital – Sunset Y Y Y Y Y
Kaiser Foundation Hospital – Walnut Creek Y Y Y Y Y
Kaiser Foundation Hospital – West LA Y Y Y Y Y
Kaiser Foundation Hospital – Woodland Hills Y Y Y Y Y
Kaweah Delta District Hospital Y Y Y Y Y
Kern Medical Center Y Y Y Y Y
Kern Valley Healthcare District Y Y Y Y Y
Kingsburg Medical Hospital Y Y Y Y Y
La Palma Intercommunity Hospital Y Y Y Y Y
LAC/High Desert Hospital Y Y Y
LAC/University of Southern California Medical Center Y Y Y Y Y

Financial Health of California Hospitals A-14 PricewaterhouseCoopers LLP
Facility Name 2001 2002 2003 2004 2005
LAC – Harbor-University of California at Los Angeles Medical Center Y Y Y Y Y
LAC – King-Drew Medical Center Y Y Y Y Y
LAC – Olive View-UCLA Medical Center Y Y Y Y Y
Lakewood Regional Medical Center Y Y Y Y Y
Lancaster Community Hospital Y Y Y Y Y
Lassen Community Hospital Y Y Y
Lodi Memorial Hospital Y Y Y Y Y
Loma Linda University Medical Center Y Y Y Y Y
Lompoc Healthcare District Y Y Y Y Y
Long Beach Memorial Medical Center Y Y Y Y Y
Los Alamitos Medical Center Y Y Y Y Y
Los Angeles Community Hospital Y Y Y Y Y
Los Angeles Metropolitan Medical Center Y Y Y Y Y
Los Robles Hospital and Medical Center Y Y Y Y Y
Lucile Salter Packard Children’s Hospital at Stanford Y Y Y Y Y
Mad River Community Hospital Y Y Y Y Y
Madera Community Hospital Y Y Y Y Y
Mammoth Hospital Y Y Y Y Y
Marian Medical Center Y Y Y Y Y
Marin General Hospital Y Y Y Y Y
Mark Twain St. Joseph’s Hospital Y Y Y Y Y
Marshall Medical Center Y Y Y Y Y
Mayers Memorial Hospital Y Y Y Y Y
Memorial Hospital at Exeter Y
Memorial Hospital Los Banos Y Y Y Y Y
Memorial Hospital of Gardena Y Y Y Y Y
Memorial Hospitals Association Y Y Y Y Y
Mendocino Coast District Hospital Y Y Y Y Y
Menifee Valley Medical Center Y Y Y Y Y
Menlo Park Surgical Hospital Y Y Y Y Y
Mercy General Hospital Y Y Y Y Y
Mercy Hospital Y Y Y Y Y
Mercy Hospital of Folsom Y Y Y Y Y
Mercy Medical Center Merced – Community Campus Y Y Y Y Y
Mercy Medical Center Merced – Dominican Campus Y Y Y Y Y
Mercy Medical Center Mount Shasta Y Y Y Y Y
Mercy Medical Center Redding Y Y Y Y Y
Mercy San Juan Medical Center Y Y Y Y Y
Mercy Westside Hospital Y Y Y Y
Methodist Hospital of Sacramento Y Y Y Y Y
Methodist Hospital of Southern California Y Y Y Y Y
Midway Hospital Medical Center Y Y Y Y Y
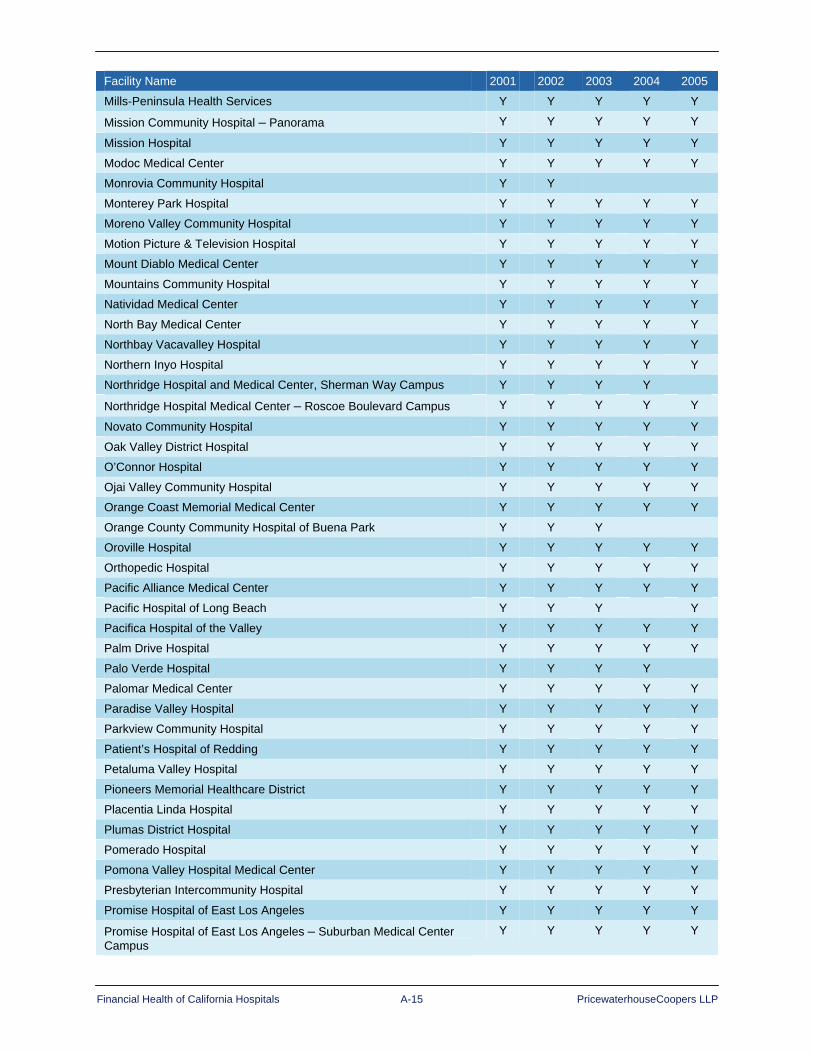
Financial Health of California Hospitals A-15 PricewaterhouseCoopers LLP
Facility Name 2001 2002 2003 2004 2005
Mills-Peninsula Health Services Y Y Y Y Y
Mission Community Hospital – Panorama Y Y Y Y Y
Mission Hospital Y Y Y Y Y
Modoc Medical Center Y Y Y Y Y
Monrovia Community Hospital Y Y
Monterey Park Hospital Y Y Y Y Y
Moreno Valley Community Hospital Y Y Y Y Y
Motion Picture & Television Hospital Y Y Y Y Y
Mount Diablo Medical Center Y Y Y Y Y
Mountains Community Hospital Y Y Y Y Y
Natividad Medical Center Y Y Y Y Y
North Bay Medical Center Y Y Y Y Y
Northbay Vacavalley Hospital Y Y Y Y Y
Northern Inyo Hospital Y Y Y Y Y
Northridge Hospital and Medical Center, Sherman Way Campus Y Y Y Y
Northridge Hospital Medical Center – Roscoe Boulevard Campus Y Y Y Y Y
Novato Community Hospital Y Y Y Y Y
Oak Valley District Hospital Y Y Y Y Y
O’Connor Hospital Y Y Y Y Y
Ojai Valley Community Hospital Y Y Y Y Y
Orange Coast Memorial Medical Center Y Y Y Y Y
Orange County Community Hospital of Buena Park Y Y Y
Oroville Hospital Y Y Y Y Y
Orthopedic Hospital Y Y Y Y Y
Pacific Alliance Medical Center Y Y Y Y Y
Pacific Hospital of Long Beach Y Y Y Y
Pacifica Hospital of the Valley Y Y Y Y Y
Palm Drive Hospital Y Y Y Y Y
Palo Verde Hospital Y Y Y Y
Palomar Medical Center Y Y Y Y Y
Paradise Valley Hospital Y Y Y Y Y
Parkview Community Hospital Y Y Y Y Y
Patient’s Hospital of Redding Y Y Y Y Y
Petaluma Valley Hospital Y Y Y Y Y
Pioneers Memorial Healthcare District Y Y Y Y Y
Placentia Linda Hospital Y Y Y Y Y
Plumas District Hospital Y Y Y Y Y
Pomerado Hospital Y Y Y Y Y
Pomona Valley Hospital Medical Center Y Y Y Y Y
Presbyterian Intercommunity Hospital Y Y Y Y Y
Promise Hospital of East Los Angeles Y Y Y Y Y
Promise Hospital of East Los Angeles – Suburban Medical Center Campus
Y Y Y Y Y

Financial Health of California Hospitals A-16 PricewaterhouseCoopers LLP
Facility Name 2001 2002 2003 2004 2005
Providence – Little Company of Mary Service Area Y Y Y Y Y
Providence Holy Cross Medical Center Y Y Y Y Y
Providence Saint Joseph Medical Center Y Y Y Y Y
Queen of Angels-Hollywood Presbyterian Medical Center Y Y Y Y Y
Queen of the Valley Hospital Y Y Y Y Y
Rancho Springs Medical Center Y Y Y Y Y
Redbud Community Hospital Y Y Y Y Y
Redlands Community Hospital Y Y Y Y Y
Redwood Memorial Hospital Y Y Y Y Y
Regional Medical Center of San Jose Y Y Y Y Y
Rideout Memorial Hospital Y Y Y Y Y
Ridgecrest Regional Hospital Y Y Y Y Y
Riverside Community Hospital Y Y Y Y Y
Riverside County Regional Medical Center Y Y Y Y Y
Robert F. Kennedy Medical Center Y Y Y Y
Saddleback Memorial Medical Center Y Y Y Y Y
Saint Agnes Medical Center Y Y Y Y Y
Saint Francis Memorial Hospital Y Y Y Y Y
Salinas Valley Memorial Hospital Y Y Y Y Y
San Antonio Community Hospital Y Y Y Y Y
San Clemente Hospital and Medical Center Y Y Y Y
San Dimas Community Hospital Y Y Y Y Y
San Francisco General Hospital Medical Center Y Y Y Y Y
San Gabriel Valley Medical Center Y Y Y Y Y
San Gorgonio Memorial Hospital Y Y Y Y Y
San Joaquin Community Hospital Y Y Y Y Y
San Joaquin General Hospital Y Y Y Y Y
San Jose Medical Center Y Y Y Y
San Leandro Hospital Y Y Y Y
San Luis Obispo General Hospital Y Y Y
San Mateo Medical Center Y Y Y Y Y
San Pedro Peninsula Hospital Y Y Y Y Y
San Ramon Regional Medical Center Y Y Y Y Y
San Vicente Hospital Y Y Y Y Y
Sanger General Hospital Y Y Y Y
Santa Ana Hospital Medical Center Y Y Y
Santa Barbara Cottage Hospital Y Y Y Y Y
Santa Clara Valley Medical Center Y Y Y Y Y
Santa Marta Hospital Y Y Y
Santa Monica – UCLA Medical Center Y Y Y Y Y
Santa Paula Memorial Hospital Y Y Y
Santa Rosa Memorial Hospital Y Y Y Y Y

Financial Health of California Hospitals A-17 PricewaterhouseCoopers LLP
Facility Name 2001 2002 2003 2004 2005
Santa Teresita Hospital Y Y Y
Santa Ynez Valley Cottage Hospital Y Y Y Y Y
Scripps Green Hospital Y Y Y Y Y
Scripps Memorial Hospital – Chula Vista Y Y Y Y
Scripps Memorial Hospital – Encinitas Y Y Y Y Y
Scripps Memorial Hospital – La Jolla Y Y Y Y Y
Scripps Mercy Hospital Y Y Y Y Y
Selma Community Hospital Y Y Y Y Y
Seneca Healthcare District Y Y Y Y Y
Sequoia Hospital Y Y Y Y Y
Seton Medical Center Y Y Y Y Y
Seton Medical Center Coastside Y Y Y Y Y
Sharp Cabrillo Hospital Y Y Y Y
Sharp Chula Vista Medical Center Y Y Y Y Y
Sharp Coronado Hospital and Health Center Y Y Y Y Y
Sharp Grossmont Hospital Y Y Y Y Y
Sharp Mary Birch Hospital For Women Y Y Y Y Y
Sharp Memorial Hospital Y Y Y
Shasta Regional Medical Center Y Y Y Y Y
Sherman Oaks Hospital & Health Center Y Y Y Y Y
Sierra Kings District Hospital Y Y Y Y Y
Sierra Nevada Memorial Hospital Y Y Y Y Y
Sierra Valley District Hospital Y Y Y
Sierra View District Hospital Y Y Y Y Y
Sierra Vista Regional Medical Center Y Y Y Y Y
Simi Valley Hospital and Health Care Services Y Y Y Y Y
Sonoma Valley Hospital Y Y Y Y Y
Sonora Regional Medical Center Y Y Y Y Y
South Coast Medical Center Y Y Y Y Y
Southern Inyo Hospital Y Y Y Y Y
St. Bernardine Medical Center Y Y Y Y Y
St. Dominic’s Hospital Y Y Y Y Y
St. Elizabeth Community Hospital Y Y Y Y Y
St. Francis Medical Center Y Y Y Y Y
St. Francis Medical Center of Santa Barbara Y Y Y
St. Helena Hospital Y Y Y Y Y
St. John’s Health Center Y Y Y Y Y
St. John’s Pleasant Valley Hospital Y Y Y Y Y
St. John’s Regional Medical Center Y Y Y Y Y
St. Joseph Hospital – Eureka Y Y Y Y Y
St. Joseph Hospital – Orange Y Y Y Y Y
St. Joseph’s Medical Center Y Y Y Y Y

Financial Health of California Hospitals A-18 PricewaterhouseCoopers LLP
Facility Name 2001 2002 2003 2004 2005
St. Jude Medical Center Y Y Y Y Y
St. Louise Regional Hospital Y Y Y Y Y
St. Luke Medical Center Y Y
St. Luke’s Hospital Y Y Y Y Y
St. Mary Medical Center – Apple Valley Y Y Y Y Y
St. Mary Medical Center – Long Beach Y Y Y Y Y
St. Mary’s Medical Center – San Francisco Y Y Y Y Y
St. Rose Hospital Y Y Y Y Y
St. Vincent Medical Center Y Y Y Y Y
Stanford Hospital and Clinics Y Y Y Y Y
Stanislaus Surgical Hospital Y Y Y Y Y
Surprise Valley Community Hospital Y Y Y Y Y
Sutter Amador Hospital Y Y Y Y Y
Sutter Auburn Faith Hospital Y Y Y Y Y
Sutter Coast Hospital Y Y Y Y Y
Sutter Davis Hospital Y Y Y Y Y
Sutter Delta Medical Center Y Y Y Y Y
Sutter Lakeside Hospital Y Y Y Y Y
Sutter Maternity and Surgery Center of Santa Cruz Y Y Y Y Y
Sutter Medical Center of Santa Rosa Y Y Y Y Y
Sutter Medical Center, Sacramento Y Y Y Y Y
Sutter Roseville Medical Center Y Y Y Y Y
Sutter Solano Medical Center Y Y Y Y Y
Sutter Tracy Community Hospital Y Y Y Y Y
Sutter Warrack Hospital Y Y Y Y
Tahoe Forest Hospital Y Y Y Y Y
Tehachapi Hospital Y Y Y Y Y
Temple Community Hospital Y Y Y Y Y
Thousand Oaks Surgical Hospital Y
Torrance Memorial Medical Center Y Y Y Y Y
Tri-City Medical Center Y Y Y Y Y
Tri-City Regional Medical Center Y Y Y Y Y
Trinity General Hospital Y Y Y Y Y
Tulare District Hospital Y Y Y Y Y
Tuolumne General Hospital Y Y Y Y Y
Tustin Hospital and Medical Center Y Y Y Y Y
Twin Cities Community Hospital Y Y Y Y Y
Ukiah Valley Medical Center Y Y Y Y Y
University Medical Center Y Y Y Y Y
University of California Davis Medical Center Y Y Y Y Y
University of California Irvine Medical Center Y Y Y Y Y
University of California Los Angeles Medical Center Y Y Y Y Y

Financial Health of California Hospitals A-19 PricewaterhouseCoopers LLP
Facility Name 2001 2002 2003 2004 2005
University of California San Diego Medical Center Y Y Y Y Y
University of California San Francisco Medical Center Y Y Y Y Y
University of Southern California – Norris Comprehensive Cancer Center and Hospital
Y Y Y Y Y
USC University Hospital Y Y Y Y Y
Valley Memorial Hospital Y Y Y Y Y
Valley Plaza Doctors Hospital Y Y Y
Valley Presbyterian Hospital Y Y Y Y Y
Ventura County Medical Center Y Y Y Y Y
Verdugo Hills Hospital Y Y Y Y Y
Victor Valley Community Hospital Y Y Y Y Y
Washington Hospital – Fremont Y Y Y Y Y
Watsonville Community Hospital Y Y Y Y Y
West Anaheim Medical Center Y Y Y Y Y
West Hills Hospital and Medical Center Y Y Y Y Y
Western Medical Center – Santa Ana Y Y Y Y Y
Western Medical Center Anaheim Y Y Y Y Y
White Memorial Medical Center Y Y Y Y Y
Whittier Hospital Medical Center Y Y Y Y Y
Woodland Healthcare Y Y Y Y Y
Total 383 381 378 363 355


Financial Health of California Hospitals B-1 PricewaterhouseCoopers LLP
Appendix B: Interviews and Summary Findings
Methodology In addition to the quantified, evidence-based analysis and findings used to compile this report and referenced throughout, PricewaterhouseCoopers (PwC) organized and pursued an extensive interview process for this study. PwC identified and solicited key health care leaders — some of whom were already connected to this project — throughout the state. Prospective respondents received survey questionnaires for their review before the actual interviews. The questionnaires went to senior executives — primarily the chief executive officers of the organizations in the study sample.
PwC conducted the in-person, oral interviews between October 2006 and March 2007 on a confidential basis, promising not to disclose respondents’ individual answers to the questions in the survey. Because disclosure of the respondents’ individual responses could be highly sensitive, protecting confidentiality would ensure that responses to the questions would be as candid as possible. Listed below are the interview participants:
Figure B.1: Interview Participants
Organization Interview Representative(s)
California Association of Public Hospitals Melissa Stafford Jones – Chief Executive Officer
Cedars-Sinai Medical Center
Thomas Priselac – Chief Executive Officer Richard Jacobs – Senior Vice President Edward Prunchunas – Chief Financial Officer
Daughters of Charity Health System J. Marc Golan, Chief Financial Officer
HealthCare Partners Robert Margolis, M.D. – Chief Executive Officer
Hoag Memorial Hospital Presbyterian Richard Afable, M.D. – Chief Executive Officer
Kaiser Permanente Roland Lyon – Vice President, Strategic Planning
Los Angeles County Department of Health Services Gary Wells – Chief Financial Officer
MemorialCare
Francis Hanckel – Chief of Hospital Operations Barry Arbuckle, Ph.D – Chief Executive Officer
New Century Healthcare Institute Wanda Jones, President
Providence Health System – Southern California Michael Madden – Chief Executive Officer
San Joaquin General Hospital Kenneth Cohen – Chief Executive Officer
SEIU United Healthcare Workers West Richard Thomason – Policy Director
Tehachapi Valley Healthcare District Raymond Hino – Chief Executive Officer
University of California – Office of the President William Gurtner – Vice President Clinical Services Santiago Muno – Executive Director Clinical Service Development
Financial Health of California Hospitals B-2 PricewaterhouseCoopers LLP
Key Findings
Thoughts on Operating Margin Hospitals identified with high operating margins (75th percentile) have seen improving profitably in recent years; but hospitals with low operating margins (25th percentile) are struggling with more demand than supply as the cost of delivering care far exceeds reimbursement rates. With current reimbursement limitations, 25th percentile hospitals find it difficult to collect adequate payment and have to rely increasingly on nonoperating income. As a result, hospital foundations are working diligently on fundraising efforts to increase the rate of donations.
Sustaining Underperforming Hospitals… “For public hospitals, specifically, the fundamental struggle is that there is more demand than supply — and smaller community hospitals outside of urban areas are most affected.”
“Generally, [high-operating-margin hospitals] have had overall strong performance in the past two years — and would have done more if not limited in overall capacity.”
“Quality measures are dictating that patients should be moved to different levels of care, but there’s not capacity in the continuum — anywhere.”
“The [new state Medicaid] Waiver is a bubble of prosperity for safety net hospitals, who are expected to benefit for the next 2–3 years, though creating a cliff in reimbursement at the end of the third year.”
“Grim reality — Medicare has dried-up as a source for reimbursement of medical education compared to five years ago.”
“Generally, communities don’t let hospitals fail — there are a number of examples in the state — where [corporate] had to respond with additional services [at one or more failing affiliates] even when a convenient alternative would [meet the community’s needs].”
“The sophistication of a hospital’s board is directly proportional to the success of that hospital.”
Reliance on Nonoperating Income … “We have a concerted plan to use foundations to demonstrate community benefit in hopes of raising awareness and support by communities.”
“Foundations usually range in 20 percent in benefit to operational income. [We’re] leaning more on that — though with mixed results.”
“Always have had ‘haves’ and ‘have-nots’ — and some have been successful in tapping their constituents for fundraising and donations.”
“Investment income is most obvious and has picked up considerably within the past two years.”
“Most UC campuses obtained philanthropy for medical schools rather than their hospitals. [That system] must expand its philanthropy, potentially competing with the medical schools.”
“FEMA has not supported all the required improvement capital required to meet the seismic standards — it’s going to take more and, fortunately, Californians have the money.”
“The moneyed are not retiring to California from other parts of the country like they used to, which may create a problem in back-filling for those already here and giving.”
“Health care in California has a compelling story in showing payments are less than the cost of delivering care. Just need to get the story out.”
“The issue is not operating a hospital to fund, but the whole business model relies on nonoperating income to run the enterprise. When the market is good, hospitals need to drive the fund balance in order to buffer the cyclical nature of operations. So much is out of the control in operations of hospitals, requiring nonoperating income to sustain the enterprise over the longer term. Operational cycles are severe, externally driven and need to be mitigated by other funding sources.”
Financial Health of California Hospitals B-3 PricewaterhouseCoopers LLP
Thoughts on Revenue/Expense The products that both providers and payers provide are askew. Reimbursement levels are down, while over utilization is currently at a high. There appears to be, according to interview findings, less emphasis on the service and product provided and more emphasis on the revenue generated. These two areas are not in sync, and there is a pressing need for reimbursement models to be in step with the advancement of technology and services.
Incentives Are Misaligned … “[The telling] trends in reimbursement are on the physician side: the federal government is cutting physician reimbursement, making them struggle more, and driving over utilization — the Dartmouth syndrome (e.g., unnecessary back, cardiovascular procedures).”
“Payers don’t care much about the product they deliver but more about the subscriber/employer view as being economical, viable and sellable to constituents.”
“Our payers fall into three categories: a payer as partner, concerned with the services and programs provided and cost in order to come up with a fair reimbursement — generally a surprise; those who give and take whatever can be negotiated (vast majority); and those whom you can’t think where they’re coming from — seeking 30 percent decreases in negotiated rates. [Overall], we expect a 7 to 8 percent increase, and most are coming close to that.”
“High-deductible plans are economical only to young employees. Additionally, the process shifts the collections process to the hospital, which is a short-lived process, putting [hospitals] in a bad light while putting the payers in a good light by reducing overall premium.”
“Obligation of federal government is to put incentives in place to appropriately deliver the care — move from care for illness to wellness. Currently measuring beta blocker times — the wrong things … Must pay on basis of outcomes versus procedures.”
“Providers need to be anchored in a system of delivery for a minimum of two to five years. Patients and providers can then become stakeholders in the process [of driving favorable outcomes].”
“Fifty-five percent of [our system’s revenue] is on the commercial side, and that is responsible for the majority of our profits. [Our system] must plan and prepare to maintain that.”
“Hospitals attempt to be as efficient as possible. We expand on the outpatient side and develop creative models with physicians.”
“Reimbursement models need to keep pace with technology and new drug therapies — biologics. New treatments with living organisms can cost as much as $50,000. Plans are changing to authorize and pay for this — but it’s tough for [our health system] to sell that value, presence and identity.”
“There’s got to be a law of diminishing returns on investment in technology — somebody should call the question over time on the investment in cutting and zapping versus consideration in greater use of biologics. Payments will be realigned to outcomes versus procedures, and [there is a] need for changing incentives.”
“The Medi-Cal Waiver is a tremendous change. The entire reimbursement structure has changed, though the structural elements have not and won’t change. This is new money for the UCs and county public hospitals, likely in the second year.”
“Medicare has been a tremendous success with improvements in access and funding, though serving a limited population (15 percent of population), but [it] pays for a lot of health care (50 percent). Health care inflation has run amok due to lack of controls by providers with technology. Now economics don’t pan out — government must ration resources in a way that is palatable. Can’t ignore demographics — more people using than can support through payroll contributions. When Medicare reimbursement goes below actual costs, actual rationing will have to begin.”
“With CMS as it relates to Medicare advantage capitated payments, there is an incentive to equalize the Medicare Advantage Plan. For carriers who have Medicare Advantage products, they will be incrementally impacted because they will not only feel the impact of a reduction in Medicare Advantage reimbursement but also a reduction in their fee-for-service revenue source. There will be a reduction of 11 percent to 2 to 3 percent over the next few years.”

Financial Health of California Hospitals B-4 PricewaterhouseCoopers LLP
Thoughts on Key Expenses Key hospital expenses fall into three categories: salaries, benefits and supplies. Hospitals must reduce the staff turnover rate to keep salary expenses under control. Newer nurses and higher-paid leaders, such as clinicians and administrators, are difficult to retain. The turnover in these categories causes a burden on an organization because the expense in hiring and training individuals who don’t remain in their jobs drives up expenses and lowers return on investment. Benefit expenses add to salary expenses. In some cases, the benefit expense is almost equal to the salary. In addition to better management of salary and benefit expenses, hospitals need more efficient management in purchasing supplies. Group purchasing organizations (GPOs) need to play a bigger part in supply management, and organization material managers need to manage current contracts and vendor negotiations more efficiently.
Salary Expense … “It’s interesting to see [compensation] trends among health care professionals. We’re seeing some facilities where nursing is at a higher pay level than that for residents, and — in a few circumstances — higher than [experienced] primary care physicians.”
“[Our hospital’s] nurses are older, are highly compensated, and aren’t leaving. That isn’t our problem. Our problem is the front-end: young nurses who come for five years of experience and then move on to the next job.”
“High-end leaders — clinicians/researchers, administrators, department heads — need to be retained versus other positions, and the pool isn’t that large to begin with.”
Benefits Expense … “Health care is a benefit expense. Pensions have always been expensive, as has worker’s compensation — though better now than it was.”
“[Health care labor] unions have modified salary benefits but have been more concerned about representation and dues [than in enhancing benefit levels].”
“We’ve found with lower-level employees that the costs of benefits are equal to their salaries.”
“Northern California public hospitals have a broader benefit structure than those in Southern California. Health care to retirees is a big [cost].”
“[Our hospital] employees are probably the worst of all. We are the highest utilizers of our products and services. We (employees) use our own health care system more than the general member. We know how to use and utilize the system; therefore it results in higher expenses.”
Supply Expense … “[We’re] putting a lot of effort into standardization of mechanics (e.g., prosthetics) and less so at the suture level — where it’s needed. Looking to get some economic sharing between [ourselves] and our vendors — and having some success with it.”
“When the [federal government] put price parameters on oncology drugs, clinicians found they could make more money from the drugs than on the procedures. The dominoes of public policy are not always thought through.”
“All GPOs need committed buying — all the rest is just nonsense. The leverage is with health systems and in managing the 5 percent of items that comprise 25 percent of the spend.”
“We’re finding success in our GPO packaging certain preference items — like gauze, band-aids — as private label (generic), so changes aren’t noticed [by users]. Establishing standardized defaults is key to getting less variation and lower prices.”
“[Hospitals are losing in negotiations with] vendors and small device manufacturers. Payers should decide which supplies to buy and pay for it, and not make it the role of the hospitals and providers to make these business decisions. Let the providers be clinicians, the consultants.”
“Supply expense is a problem at this hospital — and among other providers. It is shameful that some are making more money from selling product than in delivering care. Need to understand the R&D aspects of health care.”

Financial Health of California Hospitals B-5 PricewaterhouseCoopers LLP
“What is really messy is when GPOs try to be more than an agent for supply chain and try to be an information system, which shows that this element is not functional.”
“In general with all GPOs, the sources of discounted supplies are good, but the issue is in compliance. Typically hospitals struggle with physicians ordering supplies offered through the GPO. The compliance in the delivery system, the enforcement of the compliance and the lack of commitment are the issues.”
Thoughts on Nursing/Resources The shortage of salaried nurses is still an issue with no relief in sight. Many hospitals call upon registry or traveling nurses and do not have an in-house succession plan in place. It is proving a challenge to plan for the future shortage when many of the new nurses in the field take a long time to train. Furthermore, few programs exist to attract qualified individuals into the field.
Accommodating Nurse-to-Patient Ratios … “There are a number of hospitals that are secretly not meeting the law — especially coverage of breaks and lunch. If [nurse-to-patient staffing] ratios had been accommodated by a corresponding expansion in nursing training programs, it would have made a difference. It’s a constant hassle.”
“Travelers [nurses] are generally providing great care and are well trained, based on my personal experience. We see [travelers] coming from the East Coast three times a year and making more money than if they had stayed home. Lifestyle and increased compensation counters their concerns about the demands of travel — and this is not going to change.”
“Registry nurses can be less expensive in the aggregate — when you take into account a full-time nurses’ salary, benefits and overtime pay — and quality aside, there’s more financial savings working with registries.”
“Nurse-patient staffing ratio regulations hit rural providers hardest where there’s no pool of full-time or registry nurses around. We must [then] transfer patients out to other providers in order to meet the regulations, and this isn’t easy with overall limited bed capacity.”
“If we just had some flexing [of the mandate]. A 10 percent threshold would alleviate the impracticality of the legislation. Weekends and evenings are less stressful, but the unions will keep compliance to the letter of the law.”
“[This hospital] has satisfied the nurse-patient staffing ratios before others, by choice. A good business model improves the perception of quality. Labor is used as a key element [for the] perception of quality. When [we] staff well, there’s a correlation to improved business.”
“…Traveling and after-hours nurses are other great expenses. We’re not tapping into these pools as much. We’re able to attract full-time nurses. We pay well and we’re relatively stable. We provide nurses with a sense of empowerment and ownership in the company, so there’s incentive to stay. Bottom line is that the nurse staffing ratio is a non-issue for us.”
More on Attracting Talent to California Health Care … “It gets pretty personal given that 50 percent of 110 senior system management is due to retire within the next five years. There’s no easy way to take care of that — and our nursing floors are the same. We have no succession plan in place.”
“Long-term nurse employees can create a staid culture and status-quo standard — a bad phenomenon.”
“It would be nice if high-school kids could read and write. [City] schools are pitiful and can’t support future basic manpower needs of this community.”
“It normally takes a year to orient [new nursing] candidates and many don’t understand the most basic matters, which are a big change from years past.”
“This hospital has had the great fortune of recruiting and retaining nurses like no other hospital. [The] quality of nurses and technical base is high. Why? Ninety percent of staff do not live anywhere near here… but quality people want to work with other quality folks. Ensure pay at reasonably high level,

Financial Health of California Hospitals B-6 PricewaterhouseCoopers LLP
not exceptionally well, with bonus structure that supports that. All the tools and methods are here — employees get what they need.”
“What are differentiators — what is sustaining [our] culture? [The] training of middle management is vital in recruitment and retention … being responsible to employees and [us] holding accountable to make that work (150 managers in that stratum). Location has something to do with [the] pride element — to work in wealthy area is preferred. A new building feels and looks like growth.”
“Our first on the list is compensation. In order to attract a person into a particular occupation, there needs to be incentive. We need to pay them enough. Secondly, training. Training nurses and investing in programs need to be increased more and more over the next few years; otherwise they’re short changing themselves.”
Thoughts on Capital Planning The respondents shared a viewpoint that funding is being misdirected. Most hospitals, both private and public, are spending millions and even billions of dollars in expansion costs. Due to constant regulation changes, building is often delayed and expensive. Many agree the funds should be spent on partnerships with rural community hospitals or in the expansion of outside clinics to reduce the volume and associated expense of unnecessary ER visits.
Capital Planning for Growth and Compliance … “Nobody can bear the burden [of SB 1953’s unfunded mandate.]”
“There was a time when the seismic regulations may have had the power to close poor performers. Some hospitals, in fact, thrive by canceling contracts and bill charges as out-of-network providers. This will soon get regulatory intervention.”
“One answer is to have ERs be true emergency rooms and not clinics. Hospitals must do a better job of screening for true emergent cases and turning those who aren’t away; make hospitals enforce EMTALA [providing] clinics a steady volume. Total value of care would go down. Until that happens, ERs will expand and exacerbate the uncompensated care burden. Expanding clinics is better than expanding ERs.”
“Kaiser reported that its cost of construction increased 67 percent in two years. There is no way to adequately budget for changes in technology and OSHPD’s plan check timetable. [Our] bed tower project took [12 years] to complete, with countless changes in design to accommodate technology upgrades.”
“Need to force ‘have hospitals’ into adopting small, rural ‘have-not hospitals’ — such as Critical Access Hospitals — and keep them running. Access is not threatened by the number of struggling hospitals in urban areas.”
“We’re starting to look with physician-partners at retail medicine in shopping malls. There’s an opportunity to develop [this type of care] and meet demand forced by payers to this type of care. We’ll need to control the flow of money into the core [hospital] system.”
“Intention of the state in enacting legislation is admirable. [You] can’t discount the notion of being accountable to promulgate patient safety enhancements. Legislators have taken advantage of the confusion among the public by believing hospitals could actually afford seismic upgrades and associated costs when they can’t.”
“It’s interesting that those hospitals that can afford to retrofit hospitals for seismic needs alone (putting aside the strategic aspects of replacement/retrofit), are usually in great locations anyway. It’s those hospitals that are in poor locations [that] can’t afford the upgrades at $2.5 million per bed. It is not an option for hospitals to relocate to a more favorable location if they can’t afford.”
“Insurers, providers and purchasers will bear the burden. Insurances are in a position to pass on a lot of the pain, but I don’t see them maintaining double-digit profit margins. The providers will be pushed to a minimal level of profitability. Regulatory demands eat into balance sheets or cause borrowing. It will have to go back to the insurers. All this will occur unless there is a huge state mandate.”
Financial Health of California Hospitals B-7 PricewaterhouseCoopers LLP
“Many hospitals will be challenged with the interest payments and won’t be able to do it. The construction costs continue to escalate, borrowing will be at high rates, and either they will be able to do it or not. If not, they will close or will be either absorbed by a system or the state will feel the pressure and reduce the requirements. It’s simple. Either you have the money and do it, or you don’t. It will lead to a shortage of beds in many markets. Hospitals that do rebuild may not rebuild to adapt to market changes/increases. Others won’t have the money, so won’t build at all. The communities need these hospitals. The hospitals will be fined, but their debt will be forgiven due to the need of the community. The smaller ones just won’t be able to comply, and the state will have to change their view on requirements or in some way provide subsidies to support the required upgrades.”
Thoughts on County Indigent/Uncompensated Care Uncompensated Care is an imperative issue among providers and government. The level of uncompensated care has increased over the years, without any relief in sight. Providers feel the original plan of county health systems for caring for the indigent population failed, with more and more of the indigent population receiving care in private hospitals, especially through the emergency room. Government direction needs to change to create a long-term plan that will solidly address the issue. Under the restraint of current government term limits, plans are not initiated, approved, implemented and executed with success.
“Uncompensated care is not worth collecting, whereas bad debt is associated with those who have the money but don’t pay.”
“Our strategy on the government side is more political and more involved in [clinical] product. The county [health systems — original safety net hospitals] missed the boat. They have an attitude of ‘you owe us,’ and there isn’t enough money in the system without a product, such as a full range of competent services and distinctive tertiary care.”
“Expect Washington to change direction — the [uncompensated care] issue will attract attention of both Democrats and Republicans. Issue in California is that the federal government is politically disconnected.”
“Hospitals have charity care policies, which vary by county but are usually defined at some level [percent] of federal poverty level on a sliding scale [for collections]. Some hospitals are doing away with programs heavily utilized by the uninsured, though public hospitals cannot.”
“Because of [limited] capacity issues and [case] mix of patients — providers need to control the payer mix. [Our health system] will be a superb example of how to make choices and control lines for care based on performance of high- and low-margin product lines. If [providers] don’t limit their payer mix [of low-margin cases], they won’t have capacity.”
“Legislative term limits have done more damage to public policy than anything else. Currently, Sacramento — legislators or their staffs — does not have the depth to understand the issues, to solve the problems over a longer term. It’s tough to get attention on the important points. No public forum is available that is highly educated on the complexities of California health care and financing of it.”
“The number-one determinant of payer mix is the location of the provider. Hospitals have little to no decision on control. Payment and earnings are predisposed, [and you] can only work on what can be controlled. Every hospital has a share in caring for six million uninsured; it’s disproportionate. Now the governor is attempting to level the playing field with new health insurance plan. [You] can’t look to governmental entities — [there is] no funding, and no philanthropies to support it. That uncollectible piece of the obligation is part of the business model; no characteristic of the hospital can resolve that. For over 50 percent of the California hospitals, it doesn’t work. Now have laws (aggressively) to block hospitals from seeking those with insurance to compensate for the balance of the pay mix; those that try get whacked.”
“Markets are unique, and we saw quite a bit of consolidating on the provider side in the ‘90s. It created a dynamic where they called the shots. We see now the insurance companies consolidating. We see self-funding and replacement products. So, these mega-players have turned the table on the provider. There is now pressure for providers. I predict that in the next five years, we will see a continued or renewed effort in consolidating providers.”
Financial Health of California Hospitals B-8 PricewaterhouseCoopers LLP
Other Views Respondents had common views on the keys to success for health systems and if and how specialty hospitals play into the statewide hospital system as a whole. The road to success for any health care system is collaboration. Collaboration is needed internally within systems, within the statewide hospital system as a whole and among physicians. Specialty hospitals have had minimal impact on the California health care system. Their reimbursement and flexibility for change is low. Instead of causing a threat to tertiary hospitals, they give tertiary hospitals the competitive streak to improve.
On Affiliation with a Health System … “There is power in numbers, in all contracts and affiliations. The challenge is aligning all [internal] systems and contracts to take advantage of the whole system.”
“It’s a mixed bag for affiliates — [system affiliation] presents name recognition and access to corporate resources, but frequently [affiliates are] hit with large corporate overhead charges.”
“Is big good? Yes, if you have an adequate parallel with your physicians. Attaining a level of success with patients is on the physician side.”
“Systems give an operator an ability to lead and change; systems provide protections for making a difference. To have a system say ‘this is the direction we’re going in outcomes measures, etc.’, an individual administrator then has the tools and backup to make a difference. Medical staffs are compelled to move in the same direction.”
“Hospitals in health system versus independent — [is there] much difference? From a provider perspective (hospital), there are two big benefits [in hospital systems vs. freestanding]: depth of knowledge and skill and ability. Most hospitals can’t afford this skill and experience on their own. [They] need some assistance with contracting and leverage with managed care payers and expense controls (supplies). [There is a] cost benefit of corporate sweeps. For some [freestanding hospitals], there is no chance of survival unless they join a hospital system, which will reduce the cost of capital and attract talent. Growth is key — not sitting on laurels.”
“It will absolutely be further enhanced. Providers will be pushed into consolidation. They have a stronger position in relation to payer negotiations. A standalone hospital may join a system in order to gain several ‘monopolistic’ benefits. Among them are: A) More payer contracting clout. Better rates and with the large systems the payer ‘has to’ have them versus a standalone system who does not have the negotiating power. B) Gain economies of scale (e.g., implementation of an electronic health record is virtually impossible for a standalone system; GPO larger discounts offered to systems based on high volume. C). Access to capital is another primary driver for consolidation.”
On Specialty Hospitals … “Hasn’t been an issue in California — the reimbursement isn’t strong enough. Investor-owned hospitals don’t do well in this state. Also, Stark rules are back for referring physicians to whole hospitals, and we may see a change in federal regulations to beef this up.”
“They’re alright — if you’re still doing cardiovascular surgery in 15 years. I think we’re forcing obsolescence, with no short-term flexibility to improve with technology and change.”
“[One large regional tertiary hospital] has become a better hospital due to the competition from [a local specialty hospital].”
“[In order to keep physicians from going to specialty hospitals], the five Cs must be kept in mind to what motivates the doctors: care of my patients; control (own); consideration (kings of their domain); clock (turnaround times); and cash (motivation). On the other side is ‘my’ hospital: ‘I love my hospital and want to make it better.’ Issue is managing the magnitude of the five Cs [in managing medical staffs and physicians].”
Financial Health of California Hospitals C-1 PricewaterhouseCoopers LLP
Appendix C: Government Legislation and Regulations
Continually changing requirements of federal and state legislation and regulations persistently challenge the financial health of California hospitals. These mandates often deliver an unavoidable budgetary jolt to individual hospitals and the industry. This appendix summarizes the major laws and regulations and their financial implications for California hospitals. Generally, this analysis found that two major types of legislation and regulations have an impact on hospitals: those affecting the strategic operations or capital planning of hospitals and those affecting reimbursement programs. Appendix D deals specifically with reimbursement programs; therefore, legislation and regulations related to Medicare and Medicaid do not appear in Appendix C.
Federal Health Insurance Portability and Accountability Act of 1996 (HIPAA) Public Law 104-191, the federal Health Insurance Portability and Accountability Act (HIPAA), which took effect April 14, 2003, established federal privacy standards to protect the confidentiality and security of patients’ medical records and other personal data provided to health plans, doctors, hospitals and other health care providers. The law also required improved efficiency in health care delivery through standardization of electronic data interchange. The federal government phased in implementation of the various provisions of the law, setting a final deadline of May 2008 for the final phase.
The U.S. Department of Health and Human Services (HHS) issued four types of standards under HIPAA’s Administrative Simplification provisions: privacy, security, electronic transactions and unique identifiers. “Taken together, these regulations have a major impact on the day-to-day functioning of the nation’s hospitals and affect virtually every department of every entity that provides or pays for health care,” the American Hospital Association (AHA) observed.7 The regulations required sweeping changes in most health care transaction and administrative information systems.8
Privacy The privacy regulations addressed how hospitals may use or disclose “protected health information” (PHI). One year after the privacy regulations went into effect April 14, 2003, most providers were not in complete compliance, but the majority had achieved significant progress toward that goal. Although only 23 percent of the hospitals and health systems surveyed in 2004 by the American Health Information Management Association (AHIMA) reported full compliance, most were “significantly compliant.” A majority of 68 percent felt their facilities were between 85 to 99 percent compliant.9
Seventy percent of respondents to the AHIMA survey agreed that HIPAA implementation uncovered privacy problems within their facilities. Problems most often cited were lack of standardized practices for release of information and public access to personal health information.10
Although AHIMA attempted to capture information about the cost of compliance, AHIMA discovered that many of the responding organizations did not have specific budgets for HIPAA privacy implementation. Compliance required extensive use of staff time as opposed to tangible resources, and various department budgets absorbed this cost. AHIMA determined, however, that the costs did not come close to the millions that many organizations had predicted when the legislation was enacted.11
Security As the April 2005 compliance date for HIPAA security passed, many provider organizations were not fully compliant. The HIPAA security rule specifically focused on the safeguarding of protected health information during electronic health transactions, including claims, enrollment, eligibility, payment and coordination of benefits. These standards also addressed the security of electronic health information systems.

Financial Health of California Hospitals C-2 PricewaterhouseCoopers LLP
Phoenix Health Systems of Montgomery Village, Maryland, and the Chicago-based Healthcare Information and Management Systems Society conducted a survey in January 2006, which found that only 55 percent of providers believed they had fully implemented the security rule’s provisions. Health care organizations were still filling gaps in their data protection infrastructure and reviewing existing protections to see where they could improve them.12 The survey also found that one-third of providers continued to experience data security incidents.13 Noncompliant respondents ranked contingency planning and emergency access procedures as the areas of lowest compliance. Risk management analysis, workstation use and security ranked highest.14
Electronic Transactions HIPAA attempted to standardize electronic formats for health transactions, such as enrollment, claims and coordination of benefits, and for codes used to identify components of these transactions, such as diseases, injuries, causes, symptoms and actions taken (prevention, diagnosis and treatment).15
In June 2006, the National Committee on Vital and Health Statistics (NCVHS) assessed the impact of HIPAA administrative simplification provisions, specifically the adoption and use of transactions and code sets.16 NCHVS reported that “HIPAA implementation had taken longer than anticipated.”17 Reasons cited were:
Actual publication of the rules took much longer than expected.
While payers were required to implement all standards, providers were not.
Vendors were reluctant to build the range of software needed for the non-revenue-related HIPAA transactions, such as eligibility and claim status notification.18
NCHVS also reported that organizations using only the HIPAA health claims transactions could not show a positive return on investment (ROI). “It is important that we improve the ROI for HIPAA transactions and code sets so that they will serve as the driver for further adoption of health information technology and standards in the health care field,” Simon P. Cohn, M.D., M.P.H, chairman of NCVHS, stated.19
Unique Identifiers For providers, only one major HIPAA compliance deadline remains (at the time of this writing): the requirement for national identifiers. Almost all health care providers — and certainly any health care provider who bills for Medicare services — will need a national provider identifier (NPI) by May23, 2007. Obtaining an NPI is only the first step. Each provider must integrate its NPI with internal billing systems and the systems of billing service providers, clearinghouses and payers.20
Most of the other HIPAA compliance deadlines have passed. Figure C.1 outlines the timeline for HIPAA deadlines.

Financial Health of California Hospitals C-3 PricewaterhouseCoopers LLP
Figure C.1: HIPAA Administrative Simplification Compliance Deadlines
Date Deadline
October 15, 2002 Electronic Health Care Transactions and Code Sets: This was the deadline to submit a compliance extension form.
October 16, 2002 Electronic Health Care Transactions and Code Sets: All covered entities except those who filed for an extension and were not a small health plan should have complied.
April 14, 2003 Privacy: All covered entities except small health plans should have complied.
April 16, 2003 Electronic Health Care Transactions and Code Sets: All covered entities should have started software and systems testing.
October 16, 2003 Electronic Health Care Transactions and Code Sets: All covered entities who filed for an extension and small health plans should have complied.
October 16, 2003 Medicare accepted paper claims only under limited circumstances after this date.
April 14, 2004 Privacy: Small health plans should have complied.
July 30, 2004 Employer Identifier Standard: All covered entities except small health plans should have complied.
April 20, 2005 Security Standards: All covered entities except small health plans should have complied.
August 1, 2005 Employer Identifier Standard: Small health plans should have complied.
April 20, 2006 Security Standard: Small health plans should have complied.
May 23, 2007 National Provider Identifier: All covered entities except small health plans should comply.
May 23, 2008 National Provider Identifier: Small health plans should comply.
Federal Emergency Medical Treatment & Labor Act of 1986 In 1986, Congress enacted the Emergency Medical Treatment & Labor Act (EMTALA) to ensure public access to emergency services regardless of ability to pay. Congress acted in response to complaints about “patient dumping,” a practice by some hospital emergency departments (EDs) in refusing to treat indigent or uninsured patients or inappropriately transferring them to government-owned or charity hospitals.21
Under EMTALA, Medicare- and Medicaid-participating hospitals that offer emergency services must provide a medical screening examination for any emergency medical condition, including active labor, regardless of an individual’s ability to pay. Hospitals also must provide stabilizing treatment for patients with emergencies or transfer the patient to a location where help is available if they cannot provide specialized treatment.22 The receiving hospital must accept a patient from a transferring hospital if it can provide the specialized care the patient needs.23
The medical community raised concerns about the burdens EMTALA placed on overcrowded EDs, hospitals and physicians. In response, Congress passed the Consolidated Appropriations Act of 2001, mandating that the U.S. General Accounting Office (GAO) evaluate EMTALA’s impact. In a 2001 report to Congress, the GAO summarized hospital and physician concerns as follows:
EMTALA adversely affects the efficiency and type of services provided in hospital EDs and results in additional costs to hospitals and physicians. For example, EMTALA has resulted in more people coming to the ED for nonurgent services, leading to overcrowding and delays.
Fewer physicians are joining hospital staffs and participating in ED on-call panels because EMTLA leads to on-call physicians providing uncompensated care.
Hospitals and physicians are unsure about their responsibilities under EMTALA.24

Financial Health of California Hospitals C-4 PricewaterhouseCoopers LLP
Further, the GAO commented that other factors, such as the growth of the uninsured population and the difficulty some managed care patients might have in obtaining timely appointments with their primary care physicians also could explain an increase in emergency room visits.25 Uninsured adults are four times more likely to use the ED than insured adults, and uninsured children are five times more likely. In answer to the second concern, GAO commented that other factors, such as the ability to perform procedures in nonhospital settings, also have reduced incentives for certain specialists to serve on hospital staffs.26
EMTALA caused some reimbursement problems for hospitals and physicians. Under EMTALA, an ED cannot delay care (screening or stabilizing treatment) to inquire about the patient’s method of payment or insurance status. This practice conflicted with requirements of some managed care companies (MCOs) that require prior authorization for hospital services. Some MCOs denied or reduced payment because the treatment was not medically necessary, the patient did not have an emergency condition or the treatment was provided by a nonnetwork hospital or physician. To address this problem, the Balanced Budget Act of 1997 and some state mandates required MCOs to use prudent layperson standards when determining payment for Medicare and Medicaid beneficiaries. These standards required MCOs to base the decision on the patient’s presenting symptoms rather than final diagnosis.
A later study published online by Health Affairs concentrated on ED capacity and access in California during a 12-year period. The study found a robust market for EDs from 1990 to 2001. Contrary to claims that EDs cause hospitals to lose money, the study found that they “generate a sizable and growing portion of inpatient admissions, which contribute to overall economic viability.”27
This study, published in 2004, did find a substantial increase of 13.4 percent in ED visits from 1998 to 2001, compared to a 5.6 percent population growth rate. The report suggested that this increase could be attributed, in part, to the shift from health maintenance organizations (HMOs), whose capitation payments discouraged ED referrals, to preferred provider organizations (PPOs), which pay for ED care directly and, therefore, encourage ED referrals. The study also suggested that increased enforcement of EMTALA in California beginning in 1997 could have contributed to the increase in ED utilization.28
ED overcrowding has in some instances resulted in hospitals diverting Emergency Medical Services (EMS) admissions when beds were full or staffing was at the mandated 1:4 nurse patient ratio. When all community providers attempted to divert, EMS had no recourse but to present at an ED, usually rotating among hospitals in the community. Because of inadequate staffing or bed nonavailability, ED personnel would then delay a receiving report from EMS or delay transfer of the patient from ambulance gurney to hospital gurney. These delays prolonged out-of-service time for EMS units, causing general community concerns. This domino series of events led to an amendment of EMTALA that requires the ED to accept EMS patients in a timely manner upon arrival, transfer the patient to an ED gurney and complete a receiving report. While this permits a quick return to service for the EMS, it does not address ED overcrowding.
To determine whether hospitals purposely were reducing ED capacity, the Health Affairs study compared the number of EDs lost to the number of hospitals closed. The number of hospitals with EDs declined from 405 in 1990 to 359 in 2001. Because a substantial number of hospitals left the California market during the study period, a sizable portion of the reduction in EDs resulted from hospital closures. Of the hospitals that remained open, four added an ED, and 21 closed an ED. Very few hospitals reduced their ED capacity during the study period, and the percentage of California hospitals that maintained an ED remained stable.29

Financial Health of California Hospitals C-5 PricewaterhouseCoopers LLP
Today California hospitals in urban locations and those that are government-owned continue to express concerns about EMTALA and a lack of enforcement, which could be exacerbating the gap between the high- and low-operating-margin hospitals. Financially stressed hospitals are treating a larger share of indigent patients who are either turned away or transferred from other hospitals in violation of EMTALA. Multiple agencies, including Centers for Medicare and Medicaid Services (CMS) and the Office of Inspector General (OIG), enforce EMTLA. From 1995 to 2001, CMS investigated about 400 hospitals nationwide per year and citied about half of those investigated for EMTALA violations. Although CMS can terminate the violating hospital’s Medicare provider agreement, it terminated only four hospitals’ contracts during that period, and CMS recertified two of those.30 Most CMS investigations result from complaints from patients or other hospitals or from self-reporting by hospitals. CMS refers violators to the OIG for assessment of fines. From 1995 through 2000, the OIG imposed fines of more than $5.6 million on 194 hospitals and 19 physicians. The majority of hospital fines were $25,000 or less.31
Senate Bill 1953 of 1994: California’s Hospital Seismic Safety Law Amendment California law requires all acute care hospitals in the state to be capable of maintaining services after a major earthquake by 2030. This law excludes freestanding skilled-nursing facilities. In reality, many hospitals will fail to meet this deadline because of the financial burden it imposes.32
California has experienced a long history of strong earthquakes, and only a handful of hospitals are in seismic zones that may be considered relatively free of this threat. On average, California experiences a moderately strong earthquake (M6.0 to M6.9, as measured by the Richter scale) every two to three years.33
This history has triggered a series of California laws related to building codes. The first of these resulted from public reaction to the Long Beach earthquake of 1933, which killed 115 people, destroyed 70 schools and left another 120 schools badly damaged. The Field Act of 1933 required public schools and other public buildings to be substantially earthquake resistant.34 School construction going forward adhered to this standard; and by 1975, most pre-1933 school buildings had been retrofitted or abandoned.35
Another major piece of legislation followed the 1971 Sylmar quake, which resulted in 65 deaths and the collapse of a hospital. In response, the state legislature passed the Alfred E. Alquist Hospital Seismic Safety Act of 1973. This act required new acute care hospital design and construction to withstand a major earthquake and remain operational immediately afterward.36
In 1994, in response to another major earthquake, the legislature amended the Alquist Act to make it stronger. The Northridge earthquake in January 1994 in Southern California damaged many hospitals constructed before 1973 and caused 23 to suspend some or all of their services. The amendment, SB 1953, required the state’s 442 acute care hospitals to evaluate and rate their general acute care hospital buildings and seismic resistance using standards developed by the California Office of Statewide Health Planning and Development (OSHPD).37 The evaluation completed in 2001 found that approximately 40 percent of California hospital buildings might collapse in a major earthquake. Survey findings included:
A total of 973 hospital buildings (37 percent) pose a significant risk of collapse and danger to the public, placing them in Structural Performance Category 1 (SPC1). These buildings must be retrofitted, replaced or removed from acute care service by January 1, 2008. (With OSHPD approval, some hospitals may delay compliance until 2013 or 2015.)
Another 175 hospital buildings do not significantly jeopardize life, but may not be repairable or functional following a strong quake (SPC2). These buildings must comply by January 1, 2030.
More than 1,400 hospital buildings fall in categories SPC-3, SPC-4 and SPC-5. These could provide services following a strong quake and could be used without restriction to 2030 and beyond.38

Financial Health of California Hospitals C-6 PricewaterhouseCoopers LLP
The law also required hospitals to submit plans to:
Retrofit the buildings for continued acute care operation beyond 2030.
Partially retrofit the building for initial compliance with closure or replacement by 2002, 2008 or 2030.
Relocate acute care services or close or demolish the building.39
Depending on the compliance status for these hospitals, the plans are due in 2007, 2009 or 2011.40
Succeeding legislation allowed hospitals to apply for a five-year extension of the January1, 2008 deadline for structural and nonstructural requirements to January 1, 2013, as long as they meet certain criteria and can meet the 2030 requirements by 2013. Hospitals that have made substantial progress on large construction projects for seismic compliance may apply for another two-year extension to 2015. Hospitals in Seismic Zone 3 may apply for a 22-year extension to January 1, 2030, for some nonstructural requirements.41
In 2007, the RAND Corporation updated its 2002 report on compliance with SB 1953 for the California HealthCare Foundation, including an update of the original survey results. The update considered only hospitals operational in 2006 and found that:
SPC-1 buildings contain 53.4 million square feet of floor space, representing 53.9 percent of the total general acute care hospital building area in California.
SPC-1 buildings house 44,011 licensed beds (47.2 percent of the statewide total).
SPC-1 buildings reside on 305 campuses (out of a statewide total of 456 general acute care facilities).42
From the time of the original survey (January 2001) through 2006, 29 general acute care hospitals closed in California. Of those, 19 included SPC-1 buildings. The closures reduced the SPC-1 floor space inventory by only about 4 percent and the beds located in SPC-1 buildings by only about 4.4 percent.43
The largest share of remaining SPC-1 buildings (40.9 percent) is concentrated in Los Angeles County.44 Almost 80 percent of SPC-1 infrastructure lies in the Bay Area (Alameda, Contra Costa, Marin, San Francisco, San Mateo and Santa Clara counties) and Los Angeles/Southern California (Los Angeles, Orange, Riverside, San Bernardino and Ventura counties).45
Without question, the need for reconstruction or retrofitting in these critical areas is severe. The cost of compliance, however, remains a nebulous issue that proves difficult to measure. In 2005, hospitals had $10 billion in planning and construction under way to meet the requirements of the amended seismic law, and 53 hospitals already had constructed new or replacement buildings. The California Hospital Association estimated that hospitals could end up spending more than $50 billion to comply because of skyrocketing hospital construction costs.46 According to one 2006 report, these costs rose from $330 per square foot in 2003 to $550 per square foot in 2005. A later report estimated costs at more than double the 2005 figure. The 2006 report cited market congestion as the primary escalator of construction costs during that time in California. High demand for construction services and a limited number of contractors qualified for complex health care projects contributed to the squeeze.47
In its earlier 2002 report, the RAND Corporation took a different position, saying it could directly attribute only as little as $3 billion of California’s estimated hospital construction costs to seismic-retrofit requirements. Its 2002 study found that the remaining costs related to the need to replace an aging infrastructure dating back to the early post-World War II era.48 By 2008, the first SB 1953 compliance date, the average age of affected hospital buildings in California will be 45 to 49 years, which parallels the average useful life of a hospital building (40 to 50 years). While the seismic law might act as a catalyst to speed reconstruction, the need to modernize an aging state hospital infrastructure eventually would have required action.49
In the 2007 report, the RAND Corporation drastically updated this initial cost estimate, concluding that the total cost to replace all of the SPC-1 structures could range from $45 billion to $110 billon in 2006 dollars. This estimate did not consider financing costs, which could double the total replacement cost.50
Financial Health of California Hospitals C-7 PricewaterhouseCoopers LLP
In the original 2002 report, the RAND Corporation found that California hospitals would retrofit, reconstruct or close approximately 50 percent of their buildings over the next 28 years to meet the requirements of SB 1953. At the time, the report predicted that approximately 75 percent of the buildings would undergo nonstructural renovations to improve operational capabilities following a major earthquake.51
Contrary to its original prediction, the RAND Corporation discovered during the newer study that most hospitals are choosing to replace rather than retrofit their noncompliant buildings. This approach requires larger expenditures and lengthens the time required for construction projects to allow for strategic planning to incorporate new design and technology, manage the balance sheet and hire capital advisers.52 Only a few hospitals have decided on retrofits because “they are expensive and disruptive to health care operation.” Reconstruction rather than retrofitting effectively negates the 2030 deadline and moves it to the 2008–2015 timeframe for all SPC-1 structures.53
The new report also warned that severe inflation in construction costs for California hospitals would further reduce the likelihood that hospitals could realistically meet SB 1953 deadlines. Hospital construction costs in California are about 40 percent higher than in other states for comparable facilities. In 2006, the cost for a fully furnished and equipped facility was $1,000 per square foot.54 When considering finance charges, the cost for a new hospital facility, including construction, equipment and furnishing, escalates to $1,400 to $2,800 per square foot, depending on the type of financing.55
The original RAND report warned that hospitals with little access to capital to finance reconstruction or retrofitting may close. “Closures will change the competitive markets for health care in California, potentially leading to further consolidation in the industry,” the report warned.56
The updated report concluded that it would take at least 25 years — and perhaps 30 years — to bring all SPC-1 facilities into full compliance with SB 1953, and would require reconstruction of about 50 percent of hospital floor space (40 million to 70 million square feet). Furthermore, as much as 10 million square feet of floor space in SPC-2 buildings would need to be reconstructed by 2030.57
The RAND report found “a large mismatch between the profitability of the current California hospital infrastructure and the costs of new construction.” It warned that increases in the costs per adjusted patient day and higher patient charges could result.58
Already hospitals are announcing closures in response to SB 1953. Sutter Medical Center of Santa Rosa announced that it will close its Community Hospital in 2008 and that it no longer plans to build a new facility nearby. The hospital would require extensive renovation to meet the state’s seismic safety standards.59 The CEO of Alameda County Medical Center estimated that it would cost $400 to $600 million to retrofit that hospital. Hospitals that are not financially stable will not be able to finance extensive retrofitting, much less complete replacement. At-risk hospitals that have not begun reconstruction today probably will not meet the 2008 deadline because of the five to seven years normally required for hospital construction.60
Tenet Health Corporation also cited the cost of seismic compliance as a factor in divesting approximately half of their California assets. In January 2004, Tenet stated that it was selling 27 of its hospitals — 19 in California — and estimated that the cost of bringing those California affiliates into compliance would cost $1.6 billion. This compared to the $450 million in aggregate for the 17 hospitals that would remain n Tenet’s California portfolio.61
Some cost relief for California hospitals in meeting SB 1953 requirements could come from the federal government. On September 27, 2006, U.S. Senator Dianne Feinstein (D.-Calif.) announced that the Department of Homeland Security’s Federal Emergency Management Agency (FEMA) released more than $5.6 million in grants to two Northern California medical centers to improve their ability to continue operations following an earthquake. The grants were part of FEMA’s Hazard Mitigation Grant Program. Recipients were the University of California San Francisco Medical Center ($3 million) and the City of Napa/Queen of the Valley Hospital ($2,656,670).62

Financial Health of California Hospitals C-8 PricewaterhouseCoopers LLP
Additional relief should come in the form of re-evaluation of the state’s 1,111 medical buildings using HAZUS software that FEMA employs to assess risk from natural disasters. The software evaluates a region’s seismic risk, distance from an active fault and soil conditions — factors that could reduce California’s current inventory of at-risk buildings. Under this new approach, some buildings now flagged as most at risk could receive a safety upgrade and extra time for renovations.63 Recent maps compiled by the U.S. Geological Survey and California Division of Mines and Geology show a much larger variation in seismic hazard than the parameters used by OSHPD to calculate the original SPC values.64 (See Figures C.2 and C.3.)
Because of these improvements in calculating seismic risk, the Hospital Building Safety Board recently authorized OSHPD to re-evaluate the SPC-1 buildings using up-to-date engineering and scientific analysis. If the new method shows that an SPC-1 building faces a 10 percent or less chance of complete damage, it will move to SPC-2, with a compliance deadline of 2030. If the new probability is 10 to 15 percent, the building will move to a new SPC-1E category, with a compliance deadline of 2020. Results of the re-evaluation were not available at the time of publication of this report.65
Figure C.2: Seismic Hazard Zone Map
Source: California Building Code, 2001
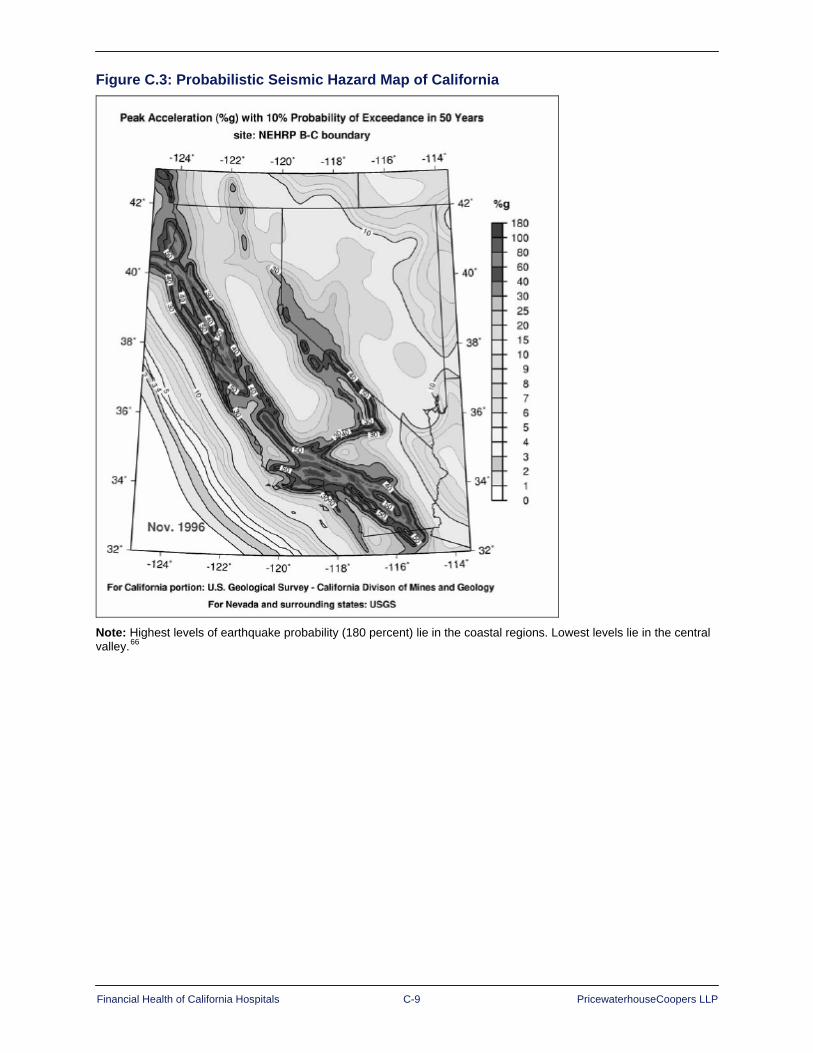
Financial Health of California Hospitals C-9 PricewaterhouseCoopers LLP
Figure C.3: Probabilistic Seismic Hazard Map of California
Note: Highest levels of earthquake probability (180 percent) lie in the coastal regions. Lowest levels lie in the central valley.66
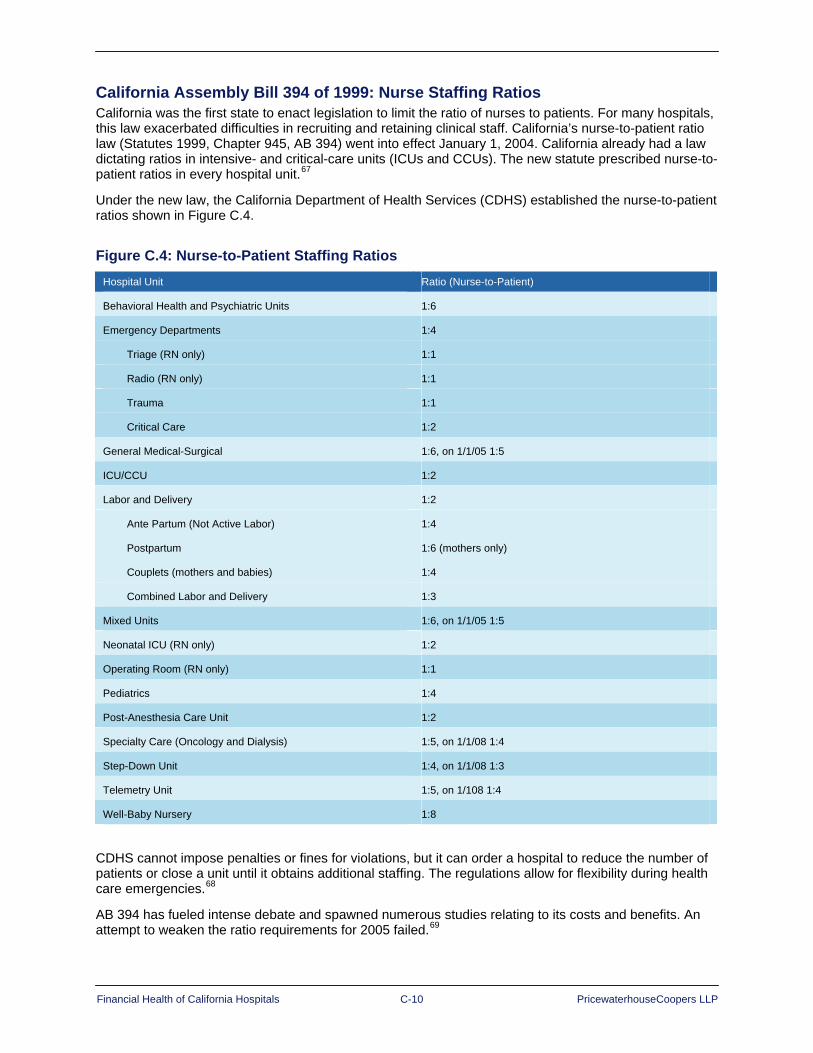
Financial Health of California Hospitals C-10 PricewaterhouseCoopers LLP
California Assembly Bill 394 of 1999: Nurse Staffing Ratios California was the first state to enact legislation to limit the ratio of nurses to patients. For many hospitals, this law exacerbated difficulties in recruiting and retaining clinical staff. California’s nurse-to-patient ratio law (Statutes 1999, Chapter 945, AB 394) went into effect January 1, 2004. California already had a law dictating ratios in intensive- and critical-care units (ICUs and CCUs). The new statute prescribed nurse-to-patient ratios in every hospital unit.67
Under the new law, the California Department of Health Services (CDHS) established the nurse-to-patient ratios shown in Figure C.4.
Figure C.4: Nurse-to-Patient Staffing Ratios Hospital Unit Ratio (Nurse-to-Patient)
Behavioral Health and Psychiatric Units 1:6
Emergency Departments 1:4
Triage (RN only) 1:1
Radio (RN only) 1:1
Trauma 1:1
Critical Care 1:2
General Medical-Surgical 1:6, on 1/1/05 1:5
ICU/CCU 1:2
Labor and Delivery 1:2
Ante Partum (Not Active Labor) 1:4
Postpartum 1:6 (mothers only)
Couplets (mothers and babies) 1:4
Combined Labor and Delivery 1:3
Mixed Units 1:6, on 1/1/05 1:5
Neonatal ICU (RN only) 1:2
Operating Room (RN only) 1:1
Pediatrics 1:4
Post-Anesthesia Care Unit 1:2
Specialty Care (Oncology and Dialysis) 1:5, on 1/1/08 1:4
Step-Down Unit 1:4, on 1/1/08 1:3
Telemetry Unit 1:5, on 1/108 1:4
Well-Baby Nursery 1:8
CDHS cannot impose penalties or fines for violations, but it can order a hospital to reduce the number of patients or close a unit until it obtains additional staffing. The regulations allow for flexibility during health care emergencies.68
AB 394 has fueled intense debate and spawned numerous studies relating to its costs and benefits. An attempt to weaken the ratio requirements for 2005 failed.69
Financial Health of California Hospitals C-11 PricewaterhouseCoopers LLP
Following implementation of the legislation, nurse staffing levels did increase, along with the number of applications for licenses to the California Board of Nursing.70 A study published in 2005 in Policy, Politics & Nursing Practice journal found that nurse staffing levels increased significantly. The study was completed by a research team headed by Nancy E. Donaldson of the University of California at San Francisco and was affiliated with the California Nursing Outcomes Coalition (CalNOC). Donaldson’s team found that total registered nurse (RN) hours of care per patient day increased by 20.8 percent in medical-surgical units and that the number of patients per RN decreased by 17.5 percent.71
The study further found that, in spite of fears that hospitals would hire licensed vocational nurses (LVNs) to meet ratio requirements, no significant increase in use of LVNs or contracted nursing staff supplied by outside agencies or registries resulted.72 (LVN is California’s equivalent of licensed practical nurse [LPN] in other states.)
Uncertainty about the impact of the staffing increase on hospitals’ financial health prevails. Conflicting cost studies have surfaced since the law was enacted. California’s Department of Health Services (CDHS) estimated in 2004 that compliance with AB 394 would cost the state’s hospitals almost $1 billion by 2008. CDHS reported that several hospitals have closed critical departments, such as emergency rooms, and others have closed their entire facility as a result of ratio requirements and the combined impact of a nursing shortage.73 Similarly, a study that appeared in the February 2006 issue of Decision Sciences concluded that tightening the nurse-to-patient ratio by only one patient can increase a five-week schedule cost by as much as $20,000 or 19 percent.74
In contrast, some studies have suggested that the qualitative benefits of lower nurse-to-patient ratios will offset the increase in staff costs. The Institute for Health and Socio-Economic Policy projected an annual savings of about $2 billion per year for California hospitals that achieve shorter patient stays resulting from a higher level of RN staffing and increased quality of care. Better ratios also might lower the cost of nurse recruitment and retention and, ultimately, improve quality of care and patient outcomes.75 Another study could not find enough evidence that mandatory nurse-to-patient ratios would improve patient outcomes. This same study found a large variation in compliance costs among California hospitals, ranging from $19,909 per hospital in the rural Sierra Nevada region to $309,797 per hospital in the Los Angeles area. Factors influencing the cost variation included hospital size, wage rates and staffing patterns.76
A 2000 study by the Center for the Health Professions, University of California, San Francisco, which was funded by the California HealthCare Foundation, examined the relationship between levels of nurse staffing and quality of care:
Although the data are not conclusive, there is some evidence that an increase in nurse staffing is related to a number of positive patient outcomes. Unfortunately, the studies are not specific enough to provide ideal nurse-to-patient ratios. Several studies have found that higher percentages of RNs in the skill mix or higher RN FTEs per patient census were associated with decreased risk-adjusted mortality; decreased urinary tract infection, thrombosis, and pulmonary complications in surgical patients; decreased pressure ulcers; decreased pneumonia; lower rates of postoperative infection; and fewer medication errors. But several studies with both large and small sample sizes have found skill mix to be unrelated to mortality, treatment problems, medical errors, falls, patient injuries, and postoperative complications.77
A growing shortage of nurses in California further complicates compliance with the staffing law. A 2005 Center for California Health Workforce Studies report warned that “California’s RN shortage will worsen each year through 2030, and will range between 99,945 and 122,223 full-time equivalent (FTE) RNs.” (A later study revised that forecast downward to a shortage of 89,314 FTE RNs by 2030.) This compares to an existing shortage in 2005 of 6,872 to 21,161 FTEs. The study forecast that in 2030, California would have 220,279 RNs, translating into 458 FTE RNs per 100,000 people. For comparison, the study estimated that in 2005 California had 198,530 FTE RNs or 539 per 100,000 residents.78 This per-100,000 figure is lower than the national average, which was 799 in 2005.79

Financial Health of California Hospitals C-12 PricewaterhouseCoopers LLP
The Center investigated the regional differences in the nursing shortage in a follow-up study published in 2006. The later study concluded that all California regions would have a shortage of RNs by 2012. It also found that:
The Los Angeles area, with an estimated shortage of 10,000 RNs in 2006, needs the greatest number of nurses. This need would grow to more than 20,000 by 2030.
The Central Coast region needs the greatest rate of growth (25 percent) in the number of RNs.
By 2030, the region with the greatest share of unfilled RN positions, with nearly 40 percent of jobs vacant, will be the Northern counties.
The Sacramento, Bay Area, Central Valley and Central Coast regions will find more than 30 percent of RN FTE jobs vacant in 2030.80
The 2006 study found encouraging growth in the number of RN graduates from 2004 to 2005. The growth was not enough, however, to change its prediction of a growing statewide shortage persisting into coming decades.81

Financial Health of California Hospitals D-1 PricewaterhouseCoopers LLP
Appendix D: Hospital Governmental Reimbursement Programs
The major governmental reimbursement programs — Medicare, Medi-Cal (Medicaid), and Disproportionate Share Hospital Reimbursement (DSH) — contribute almost half of the revenue California hospitals receive. In 2005, Medicare accounted for 30.9 percent of acute hospital net patient revenue; and Medi-Cal, 18.8 percent. This appendix describes the primary provisions of these programs and examines the impact of recent legislation affecting reimbursement rates.
Medicare
Program Description Authorized by Title XVIII of the Social Security Act and signed into law July 30, 1965, Medicare provides health insurance to the 65-and-older population, individuals under age 65 with certain disabilities, and persons of any age with end-stage renal disease (permanent kidney failure requiring dialysis or a kidney transplant). More than 19 million individuals enrolled when Medicare began in 1966. Today Medicare covers more than 42 million individuals and is the largest federal entitlement program after Social Security.82
California has more than 4 million Medicare enrollees, the largest number of any state. California accounts for approximately 10 percent of all Medicare expenditures. Its per-beneficiary expenditure is higher than the national average by about $700 and is the eighth highest level in the nation.83
Medicare consists of four parts:
Part A: Hospital insurance
Part B: Supplementary medical insurance
Part C: Medicare Advantage program
Part D: Prescription drug program
Individuals who are 65 or older and eligible for Social Security or Railroad Retirement benefits receive Part A (hospital) coverage automatically without paying a premium. Part A covers inpatient hospital, short-term skilled nursing facility, home health and hospice care. Those not eligible to receive Part A free of charge may purchase it, but they must also purchase Part B.84
Voluntary Part B enrollment requires monthly premium payments and carries a deductible. Part B covers physician services, outpatient hospital care and ancillary services, such as laboratory tests, durable medical equipment (DME) and ambulance service. Specified preventive services, such as diabetes and colon cancer screenings and mammograms, also are covered. As of January 1, 2007, Part B premiums vary with income, and the schedule changes annually.85
Part D, the most recent addition to Medicare, covers prescription drugs. The Medicare Modernization Act (MMA) of 2003 authorized Part D plans, which private insurers administer. Premiums, copayments and coinsurance vary by plan. Currently all Part D plans have a coverage gap, which is sometimes called the “donut hole.” After the individual and the insurance plan have spent a certain amount of money for covered drugs (no more than $2,400), the individual has to pay all costs for drugs out of pocket while in the gap. The most an individual currently pays out of pocket in the coverage gap is $3,051.25. Once the individual reaches the plan’s out-of-pocket limit, “catastrophic coverage” then applies. This means that the individual pays only a coinsurance amount or a copayment for the rest of the calendar year.86
Medicare does not cover long-term nursing care, custodial care, dental services, eyeglasses, hearing aids or acupuncture. Individuals may purchase Medigap insurance from private companies to help pay the individual’s share (coinsurance, copayments or deductibles) of the costs of Medicare-covered services and certain costs not covered by Medicare. Medigap insurers must follow federal and state regulations and offer standard benefit plans, but premiums and additional benefits vary from company to company.87
Financial Health of California Hospitals D-2 PricewaterhouseCoopers LLP
Those who participate in Part A and Part B may join a Medicare Advantage (Part C) plan. Some of these plans include Part D coverage for prescription drugs. Most Part C plans are managed-care plans that involve a network of providers who provide care at discount prices. Medicare Advantage plans may be health maintenance organizations (HMOs), preferred provider organizations (PPOs), private fee-for-service plans (PFFSs), special needs plans for those with chronic diseases, and Medicare Advantage Medical Savings Account (MSA) plans. MSAs take advantage of tax-free savings accounts connected to high-deductible health plans. In many cases, the premiums or copayments are lower in a Medicare Advantage Plan than they are in the traditional Medicare plan or traditional Medicare combined with a Medigap policy.88 California has the fourth highest enrollment in Medicare HMOs in the nation. The majority of California Medicare Advantage plans are in densely populated areas.89
Since 1983, Medicare reimburses most hospitals under a prospective payment system (PPS) based on diagnosis. Psychiatric and children’s hospitals and certain other specialty hospitals are exempt from this system. Under PPS, payment depends on the diagnosis-related group (DRG) to which the hospital assigns the discharge based on diagnosis, surgery, patient age, discharge destination and gender. Each of the nearly 500 DRGs pays a fixed amount. DRG weight, based on Medicare billing and cost data, reflects the relative cost of all hospitals treating cases classified in that DRG. The federal government adjusts payments for DRGs annually to reflect increases in the cost of labor and resources that make up the health care industry’s market basket.90
Except for outpatient services, Part B reimbursement depends on reasonable cost. Outpatient services are paid under a PPS.91 Medicare Advantage plans receive a per-patient payment from Medicare, regardless of the amount of services each patient consumes.92
Medicare Advantage payments have generated some controversy. A 2006 study by the Commonwealth Fund found the cost of Medicare Advantage enrollees was 12.4 percent higher than the cost for traditional fee-for-service enrollees. The difference amounted to $922 per beneficiary in 2005, for a national total of $5.2 billion.93
One reason for this controversy is that traditional Medicare reimbursement usually does not cover actual costs. In 2005, 65 percent of hospitals received Medicare payments that were less than the cost of care. The American Hospital Association estimated Medicare and Medicaid underpayments to hospitals at $9.8 billion in 2005.94
Recent Legislation and Impact In addition to creating Part D, the most dramatic change to Medicare since its inception, the enabling legislation — the Medicare Prescription Drug, Improvement and Modernization Act (MMA) of 2003 — linked Medicare payments to quality reporting. Section 501(b) of the MMA called for reduced payments to hospitals that fail to submit quality data on predetermined indicators. The Deficit Reduction Act of 2005 (DFA) expanded MMA requirements for hospital quality reporting and increased the penalty for noncompliance. Today 99 percent of U.S. hospitals have chosen to report quality data, which CMS posts on a public website (http://www.hospitalcompare.hhs.gov). Currently the site compares hospitals on eight measures relating to heart attacks, four relating to heart failure and five relating to pneumonia.95
Findings from the first two years of a three-year CMS-sponsored pilot study by Premier Inc. health care alliance, involving more than 260 hospitals nationwide, showed that quality saves lives and reduces costs. The Hospital Quality Incentive Demonstration (HQID) concluded that if all pneumonia, heart bypass, heart attack and hip and knee replacement patients received most or all of a set of 30 widely accepted care processes in 2004, the results would have been:
5,700 fewer deaths
8,100 fewer complications
10,000 fewer readmissions
750,000 fewer days in the hospital
As much as $1.3 billion less in hospital costs96
Financial Health of California Hospitals D-3 PricewaterhouseCoopers LLP
At the end of the second year, Premier found that the HQID hospitals had raised overall quality by 11.8 percent. Improvements in quality of care saved 1,284 acute myocardial infarction (heart attack) patients. The 115 top-performing hospitals in the study earned $8.7 million in incentive payments from CMS.97
In addition to initiating pay for performance, the MMA channeled more funds to rural and small urban hospitals. The Medicare Payment Advisory Commission (MedPAC) issued a report to Congress in December 2006 on the impact of rural payment provisions of the MMA. The report found that PPS payments to rural hospitals in fiscal year 2006 would increase by an estimated $377 million, and payments to urban hospitals would increase $774 million. The report noted that in addition to increasing PPS payments, the MMA expanded opportunities for hospitals to convert to critical access hospital (CAH) status and receive cost-based reimbursement.98
The MedPAC report presented a summary of the provisions of the act relating to rural payments and assessed their impact as follows:
Equalized standardized amount (MMA section 401). This provision increases the standardized amount paid to rural and small urban hospitals to the amount large urban providers receive. It increases Medicare spending by approximately $571 million per year.
Lowered labor share (section 403). This provision lowers the labor share (hospitals’ labor costs as a share of total costs) for hospitals with a wage index less than 1.0, from 69.7 percent to 62 percent. It increases spending by about $314 million per year.
Increased cap on rural disproportionate share (section 402). This provision enhances disproportionate share (DSH) payments for rural hospitals and urban hospitals with fewer than 100 beds. The cap on DSH payments rises from 5.25 percent to 12 percent of inpatient payments for these hospitals. The provision increases spending by approximately $223 million per year.
Adjustment for low volume (section 406). This provision increases inpatient payments for isolated low-volume hospitals (affects fewer than five hospitals). It increases spending by less than $1 million per year. Few low-volume hospitals qualify primarily because most small rural hospitals have converted to CAH status.
Adjustment for out-commuting (section 505). For three years starting in fiscal year 2005, this provision increases the wage index for hospitals located in counties where a large number of employees commute to a higher-wage county. It increases spending by $44 million per year.
Revised market basket weights (section 404). This provision revises the weights (including the labor share) used in the hospital market basket more frequently. It has no material effect on payments.
Extended outpatient hold-harmless payments (section 411). This provision extends the outpatient hold-harmless provision for small rural and sole community hospitals (SCHs) for two years. The current extension increases spending by roughly $50 million per year.
Provided for cost-based laboratory payments (section 416). For cost report years between July 1, 2004, and June 30, 2006, hospitals with fewer than 50 beds located in qualified rural areas (those with population density in the lower 25 percent) received cost-based laboratory payments. This provision increased spending by roughly $9 million in 2006.

Financial Health of California Hospitals D-4 PricewaterhouseCoopers LLP
Changed CAH limitations (section 405). This provision increases CAH payment rates from 100 percent to 101 percent of costs, allows CAHs to use all 25 beds for acute care, and permits distinct part-psychiatric and -rehabilitation units. However, starting in 2006, all new CAH converters must be 15 miles by secondary road or 35 miles by primary road from the nearest hospital. Although the average CAH conversion increases Medicare payments by about $1 million, we have not estimated a specific number of conversions caused by the MMA.99
The MedPAC report concluded that it was too soon to determine the magnitude of these changes but went on to say that “the magnitude of any change in costs is likely to be small for most hospitals.” Furthermore, MedPAC recommended that “when the provision extending hold-harmless payments expires at the end of 2008, it may be time to refine the outpatient payment system to account for factors leading to the poor outpatient financial performance of small hospitals. One possibility is to have a low-volume adjustment to offset the effect of low patient volumes on costs per unit of service. Currently, small rural hospitals benefit from hold-harmless payments, and SCHs benefit from a 7.1 percent add-on to their outpatient payments. However, neither of these payment adjustments effectively targets isolated hospitals that have high costs because they lack economies of scale.”100
Additional changes to the Medicare program that affected acute care hospitals came through the Deficit Reduction Act of 2005 (DFA). In addition to expanding hospital quality reporting requirements, the DFA:
Increased payments to Medicare-dependent hospitals (certain rural hospitals with 100 beds or less that have greater than 60 percent share of Medicare patients).
Reformed payments for procedures in ambulatory surgery centers and for imaging services delivered in physician offices so that these payments would not exceed rates for identical services in hospital outpatient departments.
Suspended issuance of new provider numbers for specialty hospitals until Health and Human Services developed a plan relating to physician investment and care for low-income patients and uncompensated care. CMS issued this plan in August 2006.
Provided a three-year transition of hold-harmless payments for small rural hospitals for outpatient services so that these payments would not be reduced.
Revised inpatient rehabilitation facility classification criteria.
Provided a Medicare demonstration program to evaluate gain-sharing arrangements between hospitals and other providers.
Increased payment for dialysis services.
Extended a moratorium on caps for physical and speech language therapy and occupational therapy through 2006.101

Financial Health of California Hospitals D-5 PricewaterhouseCoopers LLP
Medi-Cal (California’s Medicaid Program)
Program Description Authorized by Title XIX of the Social Security Act, Medicaid joins states and the federal government in a funding partnership to provide health care for low-income families, long-term care for the elderly and services for the disabled. CMS oversees this program as well as Medicare. While the federal government issues regulations and standards for Medicaid eligibility, funding and scope of services, states determine reimbursement rates to providers and establish optional eligibility categories. States administer the program,102 which in aggregate is larger than Medicare. In California, county health and social services departments determine eligibility and oversee enrollment and recertification.103
Medi-Cal, the California Medicaid program, provides health care coverage to nearly 20 percent of the state’s residents. Medi-Cal is the largest Medicaid program in the country in terms of people served (6.5 million) and second in terms of dollars spent, with a total budget of $34.4 billion in fiscal year 2005–2006. (of that amount, nearly $19 million, or 55 percent, comes from federal funds.) In California, one in six residents under the age of 65, one in four of the state’s children, and the majority of people who have AIDS use Medi-Cal as their primary source of health insurance coverage. Medi-Cal pays for 42 percent of all births and two-thirds of all nursing-home days in California, and generates two-thirds of all revenue for public hospitals.104
The largest share of Medi-Cal expenditures (19 percent) goes toward hospital care.105 For fiscal year 2006–2007, estimated Medi-Cal payments to hospitals totaled $7.5 billion.106 California public hospitals receive 69 percent of their net revenue from Medi-Cal, compared to 11 percent from Medicare. In addition to what Medi-Cal routinely pays for hospital care, designated safety net hospitals that care for a disproportionate share of Medi-Cal and uninsured patients receive supplemental reimbursement from the state.107
Medi-Cal pays hospitals by either fee-for-service or cost-based reimbursement.108 Under the fee-based Selective Provider Contracting Program (SPCP), the California Medical Assistance Commission (CMAC) negotiates per diem rates with select hospitals for inpatient services. CMAC chooses these hospitals to ensure that needed services are readily available to Medi-Cal enrollees. At the end of 2005, 193 acute care hospitals were under contract for per diem rates of $1,108 per patient. CMAC no longer negotiates rates with the 23 University of California and county hospitals for the inpatient services they provide under the fee-for-service Medi-Cal program. Instead, the California Department of Health Services reimburses these hospitals on a certified-public-expenditure (CPE) basis established by a five-year federal waiver in 2005. CMAC continues, however, to negotiate Medi-Cal inpatient rates with private and district hospitals.109 (See “Recent Legislation and Impact” for more information about waiver provisions.)
SPCP has lowered costs for the Medi-Cal program by negotiating lower reimbursement rates for its contracted hospitals. Since its inception in 1982, the average contract rate under SPCP has increased 115.6 percent, approximately 3.6 percent per year. This increase is significantly lower, however, than the increase paid to hospitals under the cost-based reimbursement system, which amounted to 234.5 percent, approximately 5.6 percent per year.110 Before 1982, the state used a cost-based reimbursement system for all hospitals.
In fiscal year 2004–2005, Medi-Cal paid contract and noncontract hospitals for approximately 2.49 million days of inpatient hospital care. Of those days, 11.2 percent were at noncontract hospitals. Cost-reimbursed hospitals that were paid the higher rates were primarily small rural facilities in areas where no competing facilities existed to serve the Medi-Cal population.111
In those areas where little or no competition among hospitals exists, Medi-Cal audits cost reports, organizes them into peer groups and pays a daily rate equal to the lowest of:
An allowable rate established in 1979 and revised annually.
The 60th percentile of the hospitals in the appropriate peer group.
The hospital’s allowable costs under the Tax Equity and Fiscal Responsibility Act of 1982 (TEFRA).
The hospital’s charges

Financial Health of California Hospitals D-6 PricewaterhouseCoopers LLP
This process, the Peer Group Inpatient Reimbursement Limitation (PIRL) system, meets the legislative requirement that Medicaid agencies reimburse facilities based on the reasonable costs of an efficiently run facility.112
For outpatient services, Medi-Cal reimburses hospitals based on a fee schedule. More than $775 million was directed to outpatient services in fiscal year 2006–2007.113
Recent Legislation and Impact California’s Hospital Financing Waiver of September 2005 completely revamped the funding sources and allocation methods for public hospital services to Medi-Cal beneficiaries and the uninsured. The waiver gave 23 public hospitals (17 county and six University of California hospitals) and private, safety net hospitals a five-year waiver from federal Medicaid rules. As a result, in 2006, the waiver boosted public hospital funding by $242.8 million, a 12 percent increase over 2005.114
In spite of this financial boost, seven public hospitals recorded deficits at year-end. This financial struggle stems partially from costs that have risen 79.6 percent between 1995 and 2004 for public hospitals. The rising number of uninsured Californians also has contributed to the financial squeeze. Although public hospitals make up only 6 percent of the state’s hospitals, they provide more than half of uninsured hospital care.115
Medicaid Section 1115 granted authority for the 2005 waiver, which was approved by the U.S. Department of Health and Human Services. Section 1115 waivers originally encouraged research and demonstration programs to promote innovation in the Medicaid program and to demonstrate program improvements. More recently states have used waivers to modify benefits and financing structures.116
The 2005 waiver essentially shifted the source of nonfederal funding for designated public hospitals (DPHs) from the California General Fund to county governments, which own and operate the DPHs, and the University of California, which administers the state’s teaching and research hospitals.117 The amount of federal matching funds DPHs receive depends on their certified public expenditures (CPEs) in caring for eligible beneficiaries, making the reimbursement system cost driven. Before the waiver, DPHs received per diem payments negotiated by CMAC. The federal government reimburses a DPH’s CPEs, based on the 50 percent Medicaid matching rate.118
The waiver also restricted use of intergovernmental transfers for the nonfederal share of Medicaid funds and created a Safety Net Care Pool (SNCP), which provides a fixed amount of available federal dollars to cover uncompensated health care costs.119
To implement the waiver, the state legislature passed the Medi-Cal Hospital/Uninsured Demonstration Project Act (SB 1100). This act created several new payment systems for Medi-Cal and uninsured patient care:
Private Hospital Supplemental Fund: Payments from this fund support hospitals that meet established criteria for the Emergency Services and Supplemental Payment Program, Medi-Cal Medical Education Supplemental Payment and Medi-Cal Large Teaching Emphasis Hospital and Children’s Hospital Medical Education Supplemental Payment Programs, or the Small and Rural Hospital Supplemental Payment Program.
Nondesignated Public Hospital Supplemental Fund: This fund provides reimbursement to SPCP-participating public hospitals not reimbursed on a certified-public-expenditure (CPE) basis. These are primarily district hospitals. These hospitals must meet the same criteria as the hospitals receiving Private Hospital Supplemental dollars.
Distressed Hospital Fund: This fund helps SPCP hospitals facing a significant financial hardship that could prevent them from continuing to provide services to Medi-Cal patients. To qualify, the hospitals must serve a substantial volume of Medi-Cal patients and must be considered critical components of the Medi-Cal health care delivery system.120
In addition to the 2005 California waiver, two federal laws made substantial changes to the Medicaid program on a national level. These were the Medicare Modernization Act of 2003 (MMA) and the Deficit Reduction Act of 2005 (DRA).121

Financial Health of California Hospitals D-7 PricewaterhouseCoopers LLP
The MMA, which established the Part D Medicare prescription drug program, dictated that individuals who are eligible for full drug coverage under both Medicare and Medicaid (about 6.2 million nationwide) receive their drug benefits through Medicare. States must pay the federal government a portion of the estimated costs they would have incurred if they had continued to cover those drug costs.122
The DRA contained provisions to:
Reduce prescription drug costs by limiting payments for drugs that have a generic equivalent
Reduce payments for nursing home care by making individuals who have a substantial amount of home equity ineligible for nursing home benefits and imposing penalties on individuals who transfer assets for less than their fair market value to quality for nursing home care
Reduce federal matching payments to states by restricting their ability to use revenues from taxes on health care providers to finance their share of Medicaid costs and by limiting coverage of case management services
Reduce Medicaid costs by giving states greater flexibility to impose cost-sharing requirements and premiums and by allowing states to restrict benefits for certain enrollees123
Medi-Cal Managed Care More than 50 percent of all Medi-Cal patients receive coverage through managed care plans. The California Department of Health Services (CDHS) determines capitation rates for 59 providers of nine Medi-Cal managed care plans. Annual payments to these plans amount to more than $5 billion.124
California authorized managed care for Medi-Cal recipients as early as 1972, but didn’t begin shifting large numbers of beneficiaries to managed care plans until the early 1990s. Rapidly rising health care costs and a lack of access to primary health care services drove this shift.125
The state has three managed care models in operation today:
County Organized Health System (COHS): Under this model, counties operate managed care programs. Enrollment is mandatory for Medi-Cal recipients who live in the five areas that operate a COHS:
1. Health Plan of San Mateo (San Mateo County)
2. Partnership Health Plan of California (Napa, Solano and Yolo counties)
3. CalOPTIMA (Orange County)
4. Central Coast Alliance for Health (Monterey and Santa Cruz counties)
5. Santa Barbara Health Initiative (Santa Barbara County) — CMAC negotiates contracts with four of these COHS plans.126
Geographic Managed Care (GMC): This model allows many plans to operate within a geographic region and allows Medi-Cal enrollees to choose among plans. CMAC negotiates contract rates, terms and conditions for Medi-Cal contracts between competing HMOs and CDHS for a standard benefit package. The plans receive payment on a capitated basis. One GMC operates in Sacramento County and one in San Diego County. Enrollment is voluntary for some Medi-Cal beneficiaries.127
Two-Plan Model: Twelve counties participate in the Two-Plan model. In this model, CDHS contracts with one locally developed health care service plan, known as the “local initiative,” and one nongovernment-operated plan, known as the “commercial plan.” Enrollment is mandatory for some categories of beneficiaries. Counties participating are Alameda, Contra Costa, Fresno, Kern, Los Angeles, Riverside, San Bernardino, San Francisco, San Joaquin, Santa Clara, Stanislaus and Tulare.128
Financial Health of California Hospitals D-8 PricewaterhouseCoopers LLP
In 2007, approximately 3.5 million Medi-Cal beneficiaries in 22 counties were receiving health care through these three plan models. In 2007, 58 plans participated. Private companies represented in these three models included Kaiser Permanente, Blue Cross of California, Blue Shield of California and Health Net.129
The 2005 Medicaid waiver contained some provisions that would have provided additional federal funds for Medi-Cal managed care, but the state legislature has not enacted the laws necessary to implement the provisions. The state missed its deadline to receive $180 million during the first year of the waiver, but has until August 31, 2007 to pass legislation relating to mandatory managed care enrollment to receive $180 million for the second year.130
Disproportionate Share Hospitals (DSH) Disproportionate Share Hospitals (DSH), authorized by the Boren Amendment to the Omnibus Reconciliation Act of 1981, receive federal and state funds to compensate for providing care to indigent and low-income patients. Under federal law, the maximum amount paid to an individual hospital cannot exceed 100 percent of the difference between the hospital’s unreimbursed costs of treating Medicaid and uninsured inpatients and outpatients and the amount of reimbursement the hospital receives from Medicaid (other than DSH) and from uninsured patients out of pocket. Federal law caps California’s DSH payments at up to 175 percent of this amount for most public hospitals.131
The 2005 waiver restructured the funding sources of the DSH program by allocating traditional DSH payments from the federal-capped California DSH allotment exclusively to public hospitals. This made $233 million of the state’s annual DSH allotment previously paid to private hospitals available for public hospitals. DSH funds will come from CPE and intergovernmental transfers. Private DSH hospitals will continue to receive supplemental funds, but these most likely will be financed by the state General Fund and federal Medicaid funds. Private hospitals will no longer receive traditional DSH payments.132
The waiver also permits DSH payments to hospitals for costs associated with providing nonemergency care to unqualified immigrants.133
One program unchanged by the 2005 waiver was the Construction and Renovation Reimbursement Program, established by SB 1732. This program provides construction-related payments to certain DSH facilities that submitted construction plans by June 30, 1994. Payments continue over a 30-year period.134
The waiver replaced the state’s Emergency Services and Supplemental Payments fund, which many DSH hospitals used as an important source of supplemental funding beginning in 1989, with the Safety Net Care Pool (SNCP) for DPHs. The waiver capped federal funds for the SNCP at $766 million annually. Private and nondesignated public hospitals will continue to receive some supplemental funds, but these will come from the General Fund, not from intergovernmental transfers or through the SNCP.135
Under federal law, California must fund 40 percent of its Medi-Cal program from the state’s General Fund. Additional funds can come from intergovernmental transfers, certified public expenditures and permissible provider taxes. The federal government matches California’s Medicaid expenditures at a rate of 50 percent.136
Private hospitals benefited from the waiver by gaining additional room for growth in per-diem payments for inpatient care. Before the waiver, the cap for this type of payment was limited to fixed dollar amounts. The waiver reset the cap at the aggregate upper payment limit (UPL), which is based on higher Medicare reimbursement rates.137
Finally, Medicare and Medi-Cal do not serve 100 percent of the uninsured residents of California. County governments serve as the “providers of last resort” for the uninsured under the state’s Welfare and Institutions Code Section 17000. The state’s 58 counties have established programs to serve the “medically indigent,” which are low-income, uninsured people with medical needs.138
Thirty-four less populous and more rural counties participate in the standardized state-organized County Medical Services Program (CMSP). Blue Cross administers CMSP under contract to the CMSP Governing board. County social services agencies determine eligibility.139

Financial Health of California Hospitals D-9 PricewaterhouseCoopers LLP
The remaining 24 large or urban counties contract with local clinics and hospitals or use county-operated facilities to provide care for individuals enrolled in their Medically Indigent Service Programs (MISP). Each county establishes its own eligibility and enrollment procedures and determines benefits.140

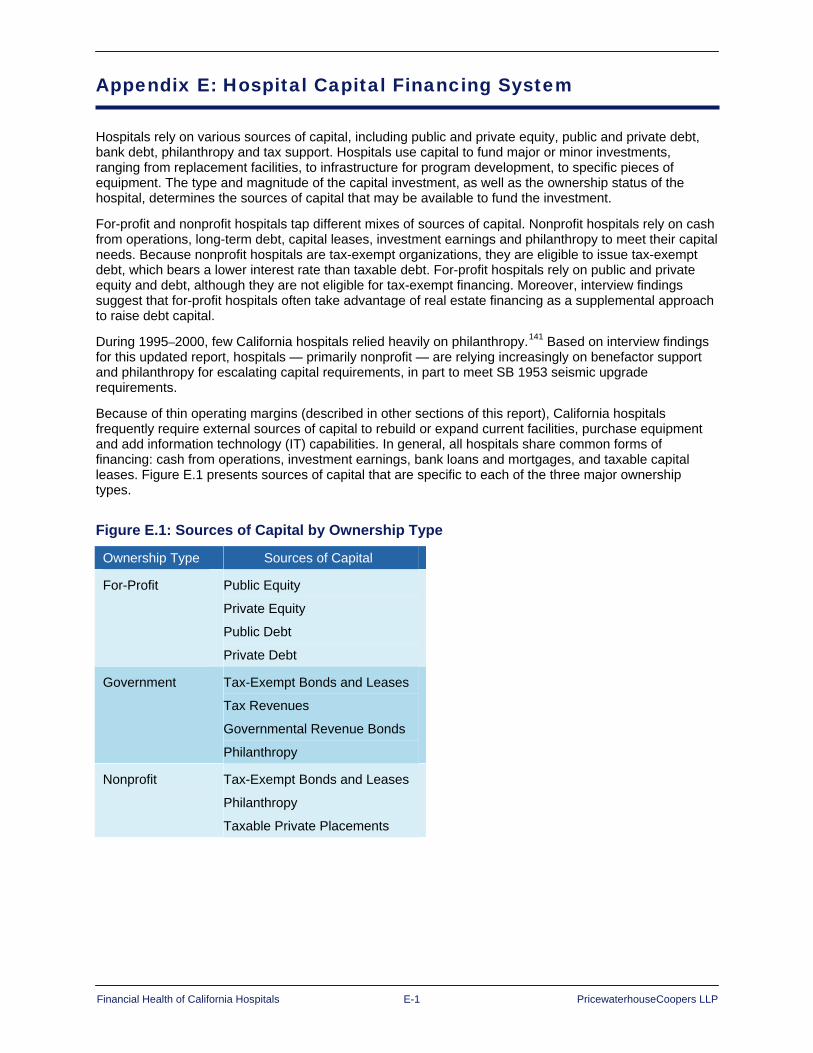
Financial Health of California Hospitals E-1 PricewaterhouseCoopers LLP
Appendix E: Hospital Capital Financing System
Hospitals rely on various sources of capital, including public and private equity, public and private debt, bank debt, philanthropy and tax support. Hospitals use capital to fund major or minor investments, ranging from replacement facilities, to infrastructure for program development, to specific pieces of equipment. The type and magnitude of the capital investment, as well as the ownership status of the hospital, determines the sources of capital that may be available to fund the investment.
For-profit and nonprofit hospitals tap different mixes of sources of capital. Nonprofit hospitals rely on cash from operations, long-term debt, capital leases, investment earnings and philanthropy to meet their capital needs. Because nonprofit hospitals are tax-exempt organizations, they are eligible to issue tax-exempt debt, which bears a lower interest rate than taxable debt. For-profit hospitals rely on public and private equity and debt, although they are not eligible for tax-exempt financing. Moreover, interview findings suggest that for-profit hospitals often take advantage of real estate financing as a supplemental approach to raise debt capital.
During 1995–2000, few California hospitals relied heavily on philanthropy.141 Based on interview findings for this updated report, hospitals — primarily nonprofit — are relying increasingly on benefactor support and philanthropy for escalating capital requirements, in part to meet SB 1953 seismic upgrade requirements.
Because of thin operating margins (described in other sections of this report), California hospitals frequently require external sources of capital to rebuild or expand current facilities, purchase equipment and add information technology (IT) capabilities. In general, all hospitals share common forms of financing: cash from operations, investment earnings, bank loans and mortgages, and taxable capital leases. Figure E.1 presents sources of capital that are specific to each of the three major ownership types.
Figure E.1: Sources of Capital by Ownership Type Ownership Type Sources of Capital
For-Profit Public Equity
Private Equity
Public Debt
Private Debt
Government Tax-Exempt Bonds and Leases
Tax Revenues
Governmental Revenue Bonds
Philanthropy
Nonprofit Tax-Exempt Bonds and Leases
Philanthropy
Taxable Private Placements

Financial Health of California Hospitals E-2 PricewaterhouseCoopers LLP
Hospitals today have become more resourceful in tapping nontraditional sources of capital, such as leases, sale of assets and real estate investment trusts (REITs). These sources are used commonly in the corporate world, but have only recently become more common in the health care provider industry. Through the early 1990s, nonprofit and governmental hospitals relied heavily on tax-exempt financing. By 2002, tax-exempt bond issues — still a major source of funding for nonprofit hospitals — comprised less than half of hospitals’ funding. More than half (54 percent) of hospitals’ external capital came from other sources.142 Figure E.2 describes both traditional and nontraditional sources of capital.143
Figure E.2: Sources of Capital Capital Source Best Use Access Method Risks
Tax-exempt Bonds
Hospitals use tax-exempt bonds for large infrastructure projects, new buildings and extensive renovations.
A government authority issues bonds on behalf of an institution that is a government-supported or nonprofit 501(c)3 health system.
An organization’s credit profile and debt capacity limit access. Because revenue from operations backs revenue bonds, the organization must maintain the revenue stream.
Taxable Bonds
Hospitals use taxable bonds for large infrastructure projects, new buildings and extensive renovations, medical office buildings and any other for-profit activity.
Taxable bonds may be placed privately or underwritten in the corporate or taxable municipal bond market.
Bond debt can lead to increased leverage and credit risk, especially if hospitals do not increase overall cash-flow generation.
Venture Capital and Public Equity Offerings
Venture capital funds look for high returns. Health care service companies typically occupy a small percentage of the overall venture capital market. In general, equity offerings finance expansions by for-profit hospital chains.
Underwriters and venture capitalists negotiate terms directly, and many will assist the business through the IPO process.
With venture capital funding and preparation for public offering comes a reduction in management control. Publicly traded companies also may be subject to takeover, although this has been a rare occurrence in health care.
Sale of Assets In most cases, capital raised through conversion of a nonprofit to a for-profit as a result of a sale funnels into a foundation that funds local health initiatives. Hospitals may increase their overall access to capital by becoming part of a system that is profitable and, therefore, has access to capital regardless of any change in tax status.
The majority of conversions are direct sales to a for-profit corporation. Federal and state laws require that the proceeds from the sale continue to serve charitable purposes.
Tax status conversion does not ensure future success. Even with greater access to capital, serious operating and debt issues may remain. These converted entities may choose to revert to nonprofit status later. In addition, community leaders may feel a loss of control in the future direction of the local hospital.
Banks and Other Financial Services Companies
Banks and other financial services companies may provide smaller or short-term capital needs (less than $10 million) or provide capital when other options are unavailable. However, commercial finance companies often offer a variety of solutions for transactions of more than $10 million.
Banks and financial services companies negotiate loan terms on a deal-by-deal basis. The type of obligation, strength of the borrower and time required to repay the loan influence terms.
Collateral requirements are negotiable but always required. Lenders may require hospitals to secure loans with gross receipts pledges and mortgages. Covenant violations may result in loss of control of the hospital.
Capital Leases Capital leases traditionally fund large equipment acquisitions, such as imaging and laboratory diagnostic equipment, and often incorporate service contracts. A capital lease may be advantageous to organizations that use equipment with frequently changing technology.
Lessors negotiate individual capital lease terms directly and typically require a 36- to 84-month lease term.
Nonpayment of the capital lease may result in the loss of a major capital asset needed for the core business.

Financial Health of California Hospitals E-3 PricewaterhouseCoopers LLP
Capital Source Best Use Access Method Risks
Joint Ventures (JVs)/ Partnerships
JVs are best suited for health care organizations that have an innovative solution or product but very little access to capital and situations in which health care providers and physicians want to align incentives.
The two organizations negotiate JV terms individually.
Smaller organizations in the JV may lose substantial management power. Owners often do not plan for future management, for example, how to pass on ownership when current physician partners retire.
Real Estate Investment Trusts (REITs)
REITS are best suited for health care organizations with large amounts of property and facilities and organizations with underutilized facilities. Hospitals are most likely to sell medical office buildings or outpatient centers to REITs. The sale of property to a REIT typically results in a large cash infusion to the health care organization.
The parties negotiate REIT terms individually. Some REITs structure property sales to leave some control with the health care organization through retention of the “ground” rights.
REIT investments depend highly on real estate market rates. Selling property to a REIT results in a health care organization giving up control over a primary asset and forgoing any benefits from the future appreciation of the sold asset. Unless contractually structured, hospitals may lose the ability to determine appropriate tenants for the buildings.
Private Philanthropy
Hospitals use philanthropy for specific expansion or renovation projects compatible with naming-rights campaigns. High-profile services, such as cancer, pediatric, birthing and research centers, tend to be most popular.
Primarily, hospitals access philanthropic funds through grants from charitable trusts and foundations, or they solicit donors. Hospitals often pursue large donations through naming-recognition campaigns for capital projects.
Accessing philanthropy is a highly competitive process, with numerous institutions chasing the same dollars. Philanthropic funding depends heavily on hospital marketing and public relations efforts and the charisma of management or board members. Lackluster returns on Wall Street translates into less money for donors to donate. In addition, some regions are more generous givers than others.
Public Grants Hospitals most often apply for grant funding for specific expansions and renovations relating to the institution’s specialized purpose or a service that meets an important public need, such as an emergency department or burn unit.
State health departments and local governments typically administer the health care grant-application process.
Many institutions compete for a limited number of grant funds. Hospitals should not rely on grants for recurring capital improvements, expansion or renovations.
Source: Healthcare Financial Management Association, “Financing the Future Report 1: How Are Hospitals Financing the Future? Access to Capital in Health Care Today” (Westchester, IL: 2003), 24-26.
In addition to these common sources of funding, hospitals have discovered in recent years that real estate and equipment offer opportunities for off-balance-sheet (OBS) financing. OBS financing does not appear on a hospital’s balance sheet, which improves debt ratios and, in turn, credit status. Examples of OBS financing include:
Sale-leasebacks: A third-party investor purchases the property or equipment and leases it back to the hospital or a related organization. The cash the hospital gains from the sale immediately becomes available to pay operating expenses or to invest.
Synthetic leases: These leases for new equipment and real estate have shorter initial terms and lower lease payments. They reflect interest-only economics on the underlying debt, in contrast to other lease arrangements that include amortization of principal. Synthetic leases can contain purchase options.

Financial Health of California Hospitals E-4 PricewaterhouseCoopers LLP
Master leases (joint ventures): Master leases typically cover real estate and involve joint ventures with developers. These leases can be on or off the balance sheet. Often used for long-term-care and retirement facilities, master leases spread financial risk.
True operating leases: Used for new or existing real estate or equipment, operating leases include amortization of underlying principal, making payments higher than under synthetic leases.144
The American Institute of Certified Public Accountants (AICPA) has increased its scrutiny of OBS transactions, focusing on issues of control and obligation. Hospitals that enter into OBS transactions must carefully word their legal documents to meet the accounting criteria by which OBS transactions can be categorized.
As they turn to nontraditional sources of capital, hospitals also are employing innovative ways to manage the cost of capital and capital structure through derivatives. Employed as a tactic by only a few larger systems, a derivative is a contract that manages or adjusts the character of underlying debt or equity securities. A common derivative is an interest rate swap, in which two parties exchange interest rate modes on a specific amount or type of debt. For example, a swap might convert a hospital’s fixed-rate debt into variable-rate debt.
Common types of derivatives are:
Interest rate swap: Exchanges interest rate payments
Plain-vanilla cap: Protects from increases in floating rates above strike price
Chooser cap: Protects from interest rate spikes on a retroactive basis
Collar: Protects from increases above a cap but reduces benefits if rates decline below a floor
Corridor: Protects from increases within a range of interest rates between two strike prices
Knockout cap: Protects from increasing interest rates up to a threshold, where the cap “knocks out”145
Tax-Exempt Hospital Financing Nonprofit hospitals are generally exempt from federal, state and local taxation, and may issue debt that is exempt from federal income tax. In return, they must provide community benefit by promoting the health of “any broad class of people.” Community benefit might include charity care, health screening, public education programs on health risks, emergency room services and basic research.146 The U.S. Congress Joint Committee on Taxation estimates that nonprofit hospitals saved about $2 billion in federal income taxes in 2002 (latest year for which data was available) and that the use of tax-exempt bonds provided them an additional $1.8 billion.147
As in California, the number of nonprofit hospitals nationwide outweighs the number of for-profits. In 2003, 59 percent of community hospitals providing short-term care were nonprofit, and 18 percent were for-profit. The remaining 23 percent were government-owned. Nonprofits also held a larger share of fixed assets (86 percent), indicating that they were, on average, larger than for-profit facilities.148 Percentages are similar in California, with 58 percent nonprofit, 24 percent for-profit, 13 percent district and 5 percent city- or county-owned in 2005.
Federal tax advantages give nonprofit hospitals a significantly lower cost of capital than for-profit hospitals. National statistics showed in mid-2006 that for-profit hospitals had a cost of capital of about 12.9 cents per dollar of investment, while nonprofit hospitals had a cost of 10.8 cents per dollar.149
Nonprofit hospitals cannot issue tax-exempt debt directly but must go through the state or its political subdivisions (cities, counties, hospital districts), which may issue bonds or certificates of participation (COPs) on behalf of hospitals. This debt is exempt from federal income taxation. In addition, any debt issued by California or its political subdivisions is exempt from state income taxes, making it further attractive to investors looking for tax savings. Consequently, tax-exempt debt remains the most prevalent source of external capital for nonprofit hospitals in California.150

Financial Health of California Hospitals E-5 PricewaterhouseCoopers LLP
The government entities issuing the debt (“conduit issuers”) have no liability for debt repayment. Instead, hospitals are responsible for repaying the debt. Major conduit issuers in California have been the California Health Facilities Financing Authority (CHFFA) and the California Statewide Communities Development Authority (CSCDA).151 Debt is issued on the creditworthiness of the individual institution and not on that of the conduit issuer.
Counties and hospital districts also serve as conduit issuers. California counties most commonly use general obligation bonds and either bonds or COPs secured by lease revenues to finance construction of the hospitals they own and operate. Two-thirds of county voters must approve general obligation bonds. Hospital districts, also considered political subdivisions of the state, most often use revenue bonds for hospital financing.
Credit Quality, Access to Capital and Credit Trends Good credit quality is critical to the financial success of hospitals because lenders use ratings or credit profiles to determine their risk of not being repaid and to set the interest rate they charge to cover that risk. Some hospitals pursue formal credit ratings through prominent credit rating agencies, such as Moody’s Investor Services (Moody’s), Fitch Ratings (Fitch) and Standard & Poor’s (S&P). These agencies assign credit ratings to borrowers based on the likelihood of the borrower repaying its debt obligation. The formal credit rating acts as a de facto form of credit enhancement in that investors can base their investment decisions in part on the due diligence performed by the rating agency. Hospitals with lower credit quality may opt not to receive a formal agency credit rating, but are essentially evaluated along the same criteria by credit enhancers, such as bond insurers. The credit quality of a hospital depends, in part, upon financial ratios such as those presented in Chapter 8 and, in part, on less tangible factors such as extensive discussions with senior leadership of the institution, understanding of the market in which the hospital operates, risk of regulatory change within the market, and competitive factors. Relative credit quality is also a major determinant of interest rate. (See Figure E.3 for rating categories for Moody’s and S&P and corresponding interest rates.)
Figure E.3: Rating Categories Credit Rating Moody’s S&P Tax-Exempt Interest Rate
Triple A Aaa AAA 4.30%
Double A Aa1/Aa2/Aa3 AA+/AA/AA-c 4.59%
Single A A1/A2/A3 A+/A/A- 4.64%
B-Grade Baa1/Baa2/Baa3 BBB+/BBB/BBB- 4.76%
Noninvestment Grade Below Baa3 Below BBB- 5.10%
Source: Ziegler Capital Markets Group, B.C. Ziegler and Company (Retrieved May 10, 2007) http://www.ziegler.com
Note: Interest rates are for 30-year bonds with 5 percent coupons as of May 10, 2007.
In addition to higher interest rates, borrowers with lower credit ratings may have fewer available sources of capital. Investors prefer low risk in this type of investment and are often unwilling to perform the due diligence that purchasing bonds from entities with reduced credit quality requires. Making it even more difficult for hospitals with low credit ratings, issuing authorities often require borrowers with A- and below credit ratings to issue minimum denominations of $100,000, prohibit them from selling bonds to the general public, or subject them to bond transfer restrictions. These constraints do not block access to funding, but they significantly increase the cost of capital for borrowers with poor credit ratings.152 This mechanism serves to widen the chasm between those hospitals with high operating margins and enjoy fewer restrictions to capital than those hospitals with break-even or negative margins.

Financial Health of California Hospitals E-6 PricewaterhouseCoopers LLP
Credit quality for the California nonprofit health care sector rebounded in 2003 and 2004, when upgrades outpaced downgrades for the first time in many years. California credit trends at the time outperformed national trends.153 The rest of the nation caught up in 2005 when the U.S. nonprofit health care sector saw upgrades outpace downgrades on a national scale for the first time in seven years. Investor confidence in the sector and renewed interest from municipal bond insurance companies helped launch a wave of capital spending in 2005 that was expected to continue into 2006.154 The Fitch 2007 national outlook on nonprofit hospitals indicated that there was continued improvement of its rated hospitals in 2006, building off strong trends experienced in 2005, and with slight improvements expected for 2007155.
After 2003, the for-profit sector did not fare as well as the rebounding nonprofit sector. At the end of 2006, S&P reported that credit quality for corporate hospitals nationwide had eroded. In November 2006, 64 percent of the for-profit hospitals and health systems tracked by S&P had negative ratings, compared to 17 percent in 2003. S&P cited “growing bad debt expense, greater risks to managed care pricing, a somewhat weak government reimbursement environment, weak patient volume and more aggressive financial policy” as the underlying causes of a negative outlook for corporate hospitals for the remainder of 2006 and into 2007.156
As noted above, a growing gap in credit quality between hospitals with high and low operating margins exists in California and nationwide. A larger percentage of California hospitals rate in the BBB category, and a smaller percentage fall in the AA and A categories. A 2003 study of capital access in the hospital industry ranked California as having the highest number of hospitals with broad access to capital in the country, but also as having the second highest number of hospitals with limited access.157 A 2004 S&P report attributed this gap to the “nature of the California market, with the dominance of several large systems in Northern California and the intensely fragmented market in the southern part of the state.”158 S&P pointed out that the high-performing health care organizations are thriving, while the under-achievers are experiencing “continued erosion in credit quality and diminishing access to capital.”159
In general, systems are viewed by lenders and rating agencies as more stable credits because, if debt is cross-obligated, negative trends in one system hospital may be offset by stable or positive trends elsewhere within the system. The fragmentation of acute care in Southern California limits hospitals’ ability to offset individual credit problems with systemwide credit stability. Additionally, the existence of smaller health systems and unaffiliated institutions fuels competition among the various hospitals, which may result in duplication of capital investments. This phenomenon, which is referred to as a “medical arms race,” causes not only excess capital investment, but also potential shifts in patient volume — both of which endanger the fiscal health of the institutions involved.160
Credit ratings also can be self-fulfilling. Hospitals with higher credit ratings spend more in capital in relation to depreciation expense than lower-rated hospitals. Higher cash flow and stronger liquidity allow high-performing hospitals to spend more and have better access to lower-cost capital. High performers can more readily replace or refurbish facilities and update equipment and information technology infrastructure.161 Similarly, hospitals with lower credit ratings may have less ability to fund investment, spending a greater proportion of their available capital on infrastructure and maintenance, which does not necessarily lead to increased patient volumes or revenues that would support improved operating performance. For the near and long-term future, hospitals that lack capital to reinvest in new technologies, information systems, facility upgrades and strategic expansion will fall further behind, and the gap between the high and low performers will continue to rise.162
Among those California hospitals showing the most improvement were several major systems:
Kaiser Permanente recovered from $1.4 billion in operating losses in 1997–1999 to show strong improvement 2000–2004.163 The system went on to issue $1.5 billion in new debt in 2006 and received an upgrade from A to A+, with a stable rating outlook from Fitch.164
Catholic Healthcare West, which turned the corner on $1.1 billion in operating losses 1997–2001, was upgraded from A- to A+ by Fitch in 2006, with a stable outlook.165
Scripps Health was upgraded in 2006 by Fitch from A to A+, with a stable outlook.166

Financial Health of California Hospitals E-7 PricewaterhouseCoopers LLP
Sutter Health achieved an AA- rating, up from A+, in early 2004, from S&P, which cited Sutter’s “strong and consistent cash flow as well as its very strong market position in Northern California” as the reasons for the upgrade.167
According to S&P, success factors for the high-operating-margin hospitals include:
Strong vision and planning on the part of management, including divestiture of under-performing assets and institution of greater financial controls and accountability
Ability to make major revenue cycle improvements and manage costs
Ability to attain needed rate increases
Market demographics, including payer mix and population growth
Substantial investment in information technologies
Strategic allocation of capital to growth in key service lines and locations168
In early 2006, S&P cited one overarching impetus for an improved ratio of credit rating upgrades to downgrades. “Many providers are benefiting,” S&P noted, “from a focused approach at the senior management and board level, with a keen eye on core operations and bottom-line results.” Specifics included rigorous expense management, favorable rate increases from third-party payers, and information technology integration allowing access to more detailed datasets for analysis and benchmarking. S&P also noted stronger cash reserves from enhanced cash-flow generation, improved collections of receivables, favorable investment returns and strong bond market access.169
Fitch Ratings offered a generally consistent assessment of the underlying reasons for improved operating performance for nonprofit hospitals and health care systems. Fitch cited “continued implementation of best practices, a relatively stable environment with favorable rate increases from managed care payers, improved expense control, and operating efficiencies that came as a direct result of investment in quality and IT. Management initiatives related to revenue cycle and supply chain management, joint ventures, strategic capital allocation, monetization of noncore assets and asset liability management also contributed to 2005’s improved performance.” Furthermore, Fitch reported that the operating performance improvement was not confined to the higher-rated credits, but dispersed across the range of rating categories.170 Fitch’s 2007 outlook is that operating performance will continue to improve based on similar factors.171
On the other hand, small and midsize hospitals with relatively low levels of debt experienced the most credit downgrades in 2005. The median par amount for downgrades was $44 million nationwide, with an average of $143 million. This compared to a median of $114 million and an average of $271 million for upgrades.172
The rating agencies warn of various risk factors associated with a continued improvement in operating performance. S&P predicted, in an early 2006 public finance report, that the tide might turn because some of the factors that drove strong nonprofit sector performance in 2005 showed erosion:
Increased competition from specialty physician ventures
The rise of consumer-directed health plans with higher copayments and deductibles
Fitch’s 2007 health care systems outlook indicated a stable view of the nonprofit hospital sector, based on slight expected improvements in operating performance, but cited the following additional factors that could result in a reversal of current trends as soon as 2008:
Slowing in the rate of revenue growth
Increased federal, state and IRS scrutiny on nonprofit providers regarding community benefit
The rising number of uninsured and underinsured173
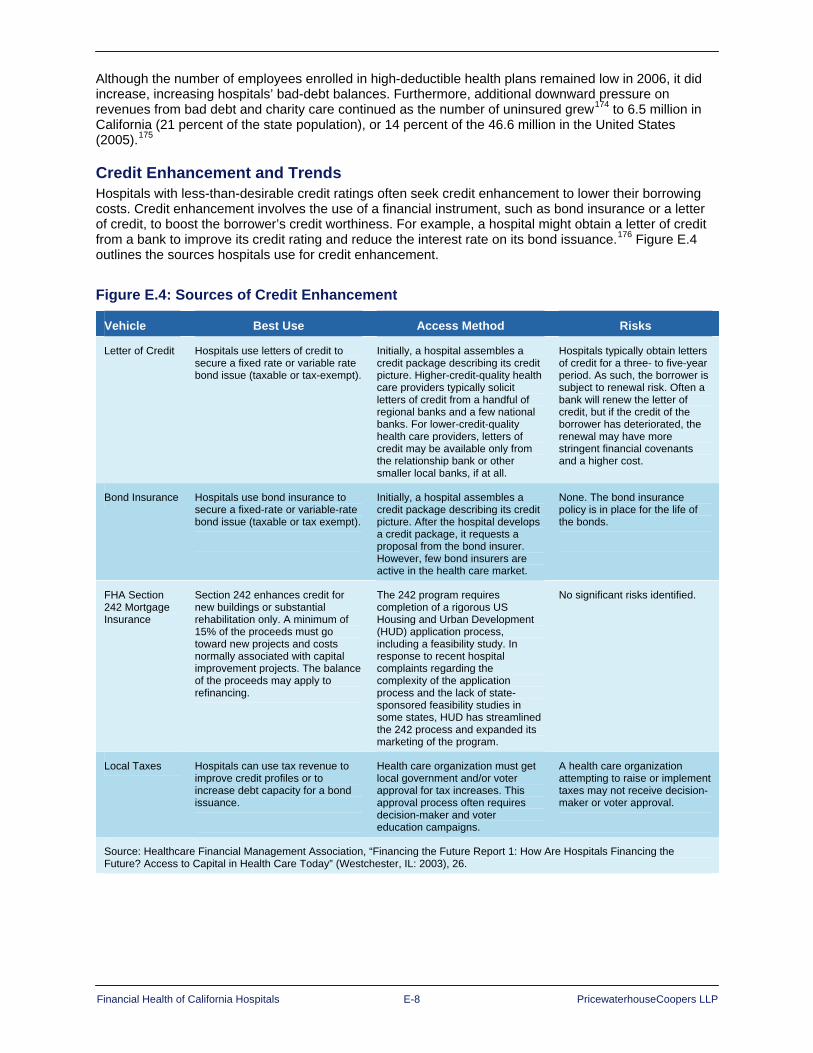
Financial Health of California Hospitals E-8 PricewaterhouseCoopers LLP
Although the number of employees enrolled in high-deductible health plans remained low in 2006, it did increase, increasing hospitals’ bad-debt balances. Furthermore, additional downward pressure on revenues from bad debt and charity care continued as the number of uninsured grew174 to 6.5 million in California (21 percent of the state population), or 14 percent of the 46.6 million in the United States (2005).175
Credit Enhancement and Trends Hospitals with less-than-desirable credit ratings often seek credit enhancement to lower their borrowing costs. Credit enhancement involves the use of a financial instrument, such as bond insurance or a letter of credit, to boost the borrower’s credit worthiness. For example, a hospital might obtain a letter of credit from a bank to improve its credit rating and reduce the interest rate on its bond issuance.176 Figure E.4 outlines the sources hospitals use for credit enhancement.
Figure E.4: Sources of Credit Enhancement
Vehicle Best Use Access Method Risks
Letter of Credit Hospitals use letters of credit to secure a fixed rate or variable rate bond issue (taxable or tax-exempt).
Initially, a hospital assembles a credit package describing its credit picture. Higher-credit-quality health care providers typically solicit letters of credit from a handful of regional banks and a few national banks. For lower-credit-quality health care providers, letters of credit may be available only from the relationship bank or other smaller local banks, if at all.
Hospitals typically obtain letters of credit for a three- to five-year period. As such, the borrower is subject to renewal risk. Often a bank will renew the letter of credit, but if the credit of the borrower has deteriorated, the renewal may have more stringent financial covenants and a higher cost.
Bond Insurance Hospitals use bond insurance to secure a fixed-rate or variable-rate bond issue (taxable or tax exempt).
Initially, a hospital assembles a credit package describing its credit picture. After the hospital develops a credit package, it requests a proposal from the bond insurer. However, few bond insurers are active in the health care market.
None. The bond insurance policy is in place for the life of the bonds.
FHA Section 242 Mortgage Insurance
Section 242 enhances credit for new buildings or substantial rehabilitation only. A minimum of 15% of the proceeds must go toward new projects and costs normally associated with capital improvement projects. The balance of the proceeds may apply to refinancing.
The 242 program requires completion of a rigorous US Housing and Urban Development (HUD) application process, including a feasibility study. In response to recent hospital complaints regarding the complexity of the application process and the lack of state-sponsored feasibility studies in some states, HUD has streamlined the 242 process and expanded its marketing of the program.
No significant risks identified.
Local Taxes Hospitals can use tax revenue to improve credit profiles or to increase debt capacity for a bond issuance.
Health care organization must get local government and/or voter approval for tax increases. This approval process often requires decision-maker and voter education campaigns.
A health care organization attempting to raise or implement taxes may not receive decision-maker or voter approval.
Source: Healthcare Financial Management Association, “Financing the Future Report 1: How Are Hospitals Financing the Future? Access to Capital in Health Care Today” (Westchester, IL: 2003), 26.

Financial Health of California Hospitals E-9 PricewaterhouseCoopers LLP
Major private bond insurance companies, such as AMBAC, MBIA, FGIC and FSA, have triple-A credit ratings and stringently screen the borrowers they cover. Borrowers must have a Baa2 or BBB rating at a minimum, and health care credits usually require a higher rating. Several private bond insurers with lower ratings, including ACA Financial Guaranty Corporation and Asset Guaranty Insurance Company, provide enhancement to weaker credits.
In addition to providing letters of credit, banks provide cash loans for variable-rate bond issues. Most bank credit facilities and loans are short-term, usually for three to five years and sometimes seven. This limits their usefulness in enhancing credit for fixed-rate debt.
Another source of credit enhancement for California facilities is Cal-Mortgage, a state-sponsored insurance program for nonprofit health care organizations. Cal-Mortgage’s credit rating is the same as the State of California’s. During the 1990s, Cal-Mortgage’s hospital portfolio shrank as hospital credit ratings headed downward, commercial credit enhancement became readily available and hospitals merged into systems. The majority of CalMortgage’s current portfolio is composed of long-term care facilities and selected small acute care facilities.
Credit-enhanced debt from these sources was common during the 1980s and 1990s. Cost-effective credit enhancement was easy to obtain if a hospital had at least an A rating. In 1998, approximately 60 percent of health care financings were insured. In 1999, however, the trend began to reverse, and only 50 percent of health care financings were insured. A factor contributing to this trend was the bankruptcy of Allegheny Health, Education and Research Foundation, causing one of its insurers, MBIA, to implement more stringent criteria and higher premiums for health care credits.177
The downward trend in insured debt continued in the next decade. Bond insurance as a percentage of total hospital debt issuance was 43.9 percent through the six months ended June 30, 2005, compared with 47.1 percent in 2004. Many letter-of-credit providers displayed a more aggressive approach to credit in 2005, but capital access remained relatively good for most hospitals. Hospitals benefited from increased competition in 2005 among triple-A bond insurers, which resulted in lower interest rates for insured bonds. This allowed hospitals to decrease their cost of capital on existing debt while meeting capital spending goals through debt issuance.178

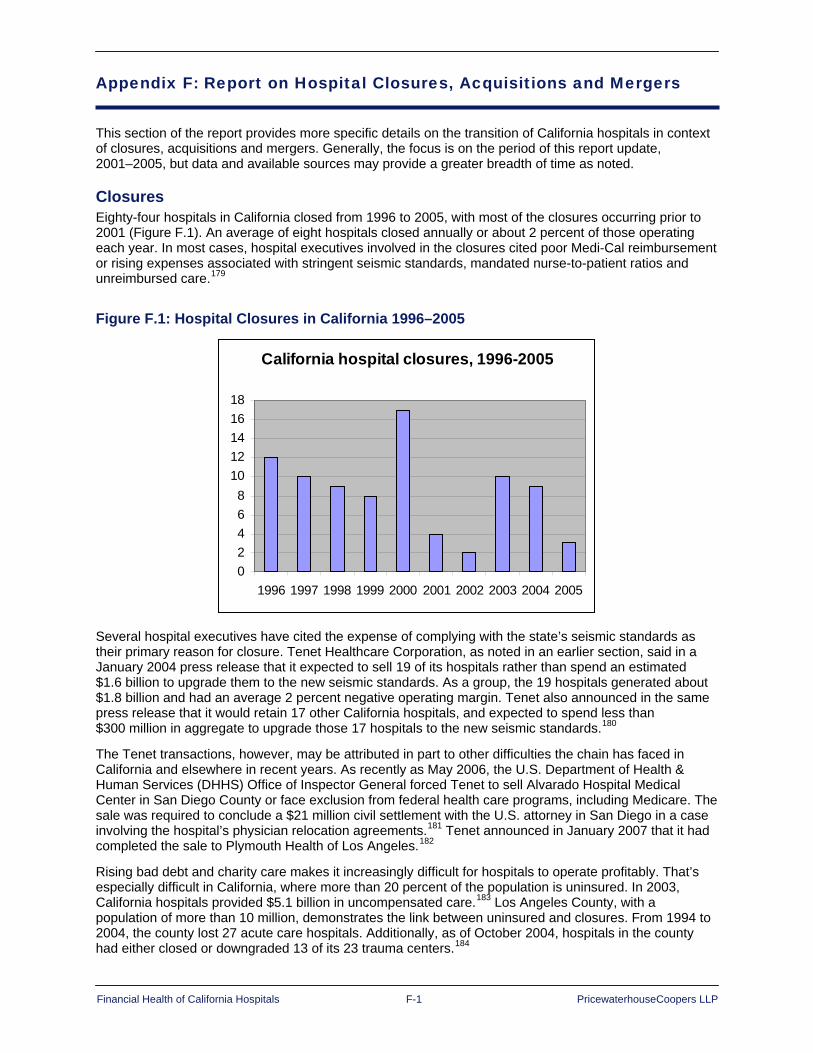
Financial Health of California Hospitals F-1 PricewaterhouseCoopers LLP
Appendix F: Report on Hospital Closures, Acquisitions and Mergers
This section of the report provides more specific details on the transition of California hospitals in context of closures, acquisitions and mergers. Generally, the focus is on the period of this report update, 2001–2005, but data and available sources may provide a greater breadth of time as noted.
Closures Eighty-four hospitals in California closed from 1996 to 2005, with most of the closures occurring prior to 2001 (Figure F.1). An average of eight hospitals closed annually or about 2 percent of those operating each year. In most cases, hospital executives involved in the closures cited poor Medi-Cal reimbursement or rising expenses associated with stringent seismic standards, mandated nurse-to-patient ratios and unreimbursed care.179
Figure F.1: Hospital Closures in California 1996–2005
California hospital closures, 1996-2005
02468
1012141618
1996 1997 1998 1999 2000 2001 2002 2003 2004 2005
Several hospital executives have cited the expense of complying with the state’s seismic standards as their primary reason for closure. Tenet Healthcare Corporation, as noted in an earlier section, said in a January 2004 press release that it expected to sell 19 of its hospitals rather than spend an estimated $1.6 billion to upgrade them to the new seismic standards. As a group, the 19 hospitals generated about $1.8 billion and had an average 2 percent negative operating margin. Tenet also announced in the same press release that it would retain 17 other California hospitals, and expected to spend less than $300 million in aggregate to upgrade those 17 hospitals to the new seismic standards.180
The Tenet transactions, however, may be attributed in part to other difficulties the chain has faced in California and elsewhere in recent years. As recently as May 2006, the U.S. Department of Health & Human Services (DHHS) Office of Inspector General forced Tenet to sell Alvarado Hospital Medical Center in San Diego County or face exclusion from federal health care programs, including Medicare. The sale was required to conclude a $21 million civil settlement with the U.S. attorney in San Diego in a case involving the hospital’s physician relocation agreements.181 Tenet announced in January 2007 that it had completed the sale to Plymouth Health of Los Angeles.182
Rising bad debt and charity care makes it increasingly difficult for hospitals to operate profitably. That’s especially difficult in California, where more than 20 percent of the population is uninsured. In 2003, California hospitals provided $5.1 billion in uncompensated care.183 Los Angeles County, with a population of more than 10 million, demonstrates the link between uninsured and closures. From 1994 to 2004, the county lost 27 acute care hospitals. Additionally, as of October 2004, hospitals in the county had either closed or downgraded 13 of its 23 trauma centers.184
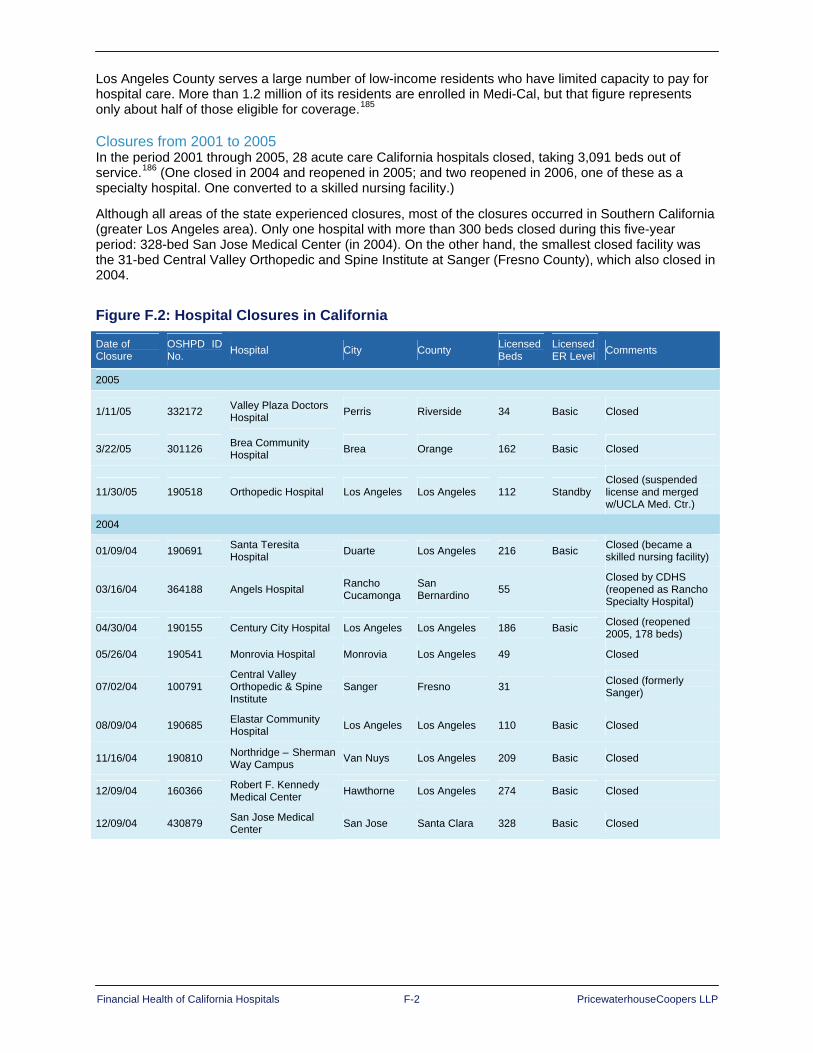
Financial Health of California Hospitals F-2 PricewaterhouseCoopers LLP
Los Angeles County serves a large number of low-income residents who have limited capacity to pay for hospital care. More than 1.2 million of its residents are enrolled in Medi-Cal, but that figure represents only about half of those eligible for coverage.185
Closures from 2001 to 2005 In the period 2001 through 2005, 28 acute care California hospitals closed, taking 3,091 beds out of service.186 (One closed in 2004 and reopened in 2005; and two reopened in 2006, one of these as a specialty hospital. One converted to a skilled nursing facility.)
Although all areas of the state experienced closures, most of the closures occurred in Southern California (greater Los Angeles area). Only one hospital with more than 300 beds closed during this five-year period: 328-bed San Jose Medical Center (in 2004). On the other hand, the smallest closed facility was the 31-bed Central Valley Orthopedic and Spine Institute at Sanger (Fresno County), which also closed in 2004.
Figure F.2: Hospital Closures in California
Date of Closure
OSHPD ID No. Hospital City County Licensed
Beds Licensed ER Level Comments
2005
1/11/05 332172 Valley Plaza Doctors Hospital Perris Riverside 34 Basic Closed
3/22/05 301126 Brea Community Hospital Brea Orange 162 Basic Closed
11/30/05 190518 Orthopedic Hospital Los Angeles Los Angeles 112 Standby Closed (suspended license and merged w/UCLA Med. Ctr.)
2004
01/09/04 190691 Santa Teresita Hospital Duarte Los Angeles 216 Basic Closed (became a
skilled nursing facility)
03/16/04 364188 Angels Hospital Rancho Cucamonga
San Bernardino 55
Closed by CDHS (reopened as Rancho Specialty Hospital)
04/30/04 190155 Century City Hospital Los Angeles Los Angeles 186 Basic Closed (reopened 2005, 178 beds)
05/26/04 190541 Monrovia Hospital Monrovia Los Angeles 49 Closed
07/02/04 100791 Central Valley Orthopedic & Spine Institute
Sanger Fresno 31 Closed (formerly Sanger)
08/09/04 190685 Elastar Community Hospital Los Angeles Los Angeles 110 Basic Closed
11/16/04 190810 Northridge – Sherman Way Campus Van Nuys Los Angeles 209 Basic Closed
12/09/04 160366 Robert F. Kennedy Medical Center Hawthorne Los Angeles 274 Basic Closed
12/09/04 430879 San Jose Medical Center San Jose Santa Clara 328 Basic Closed
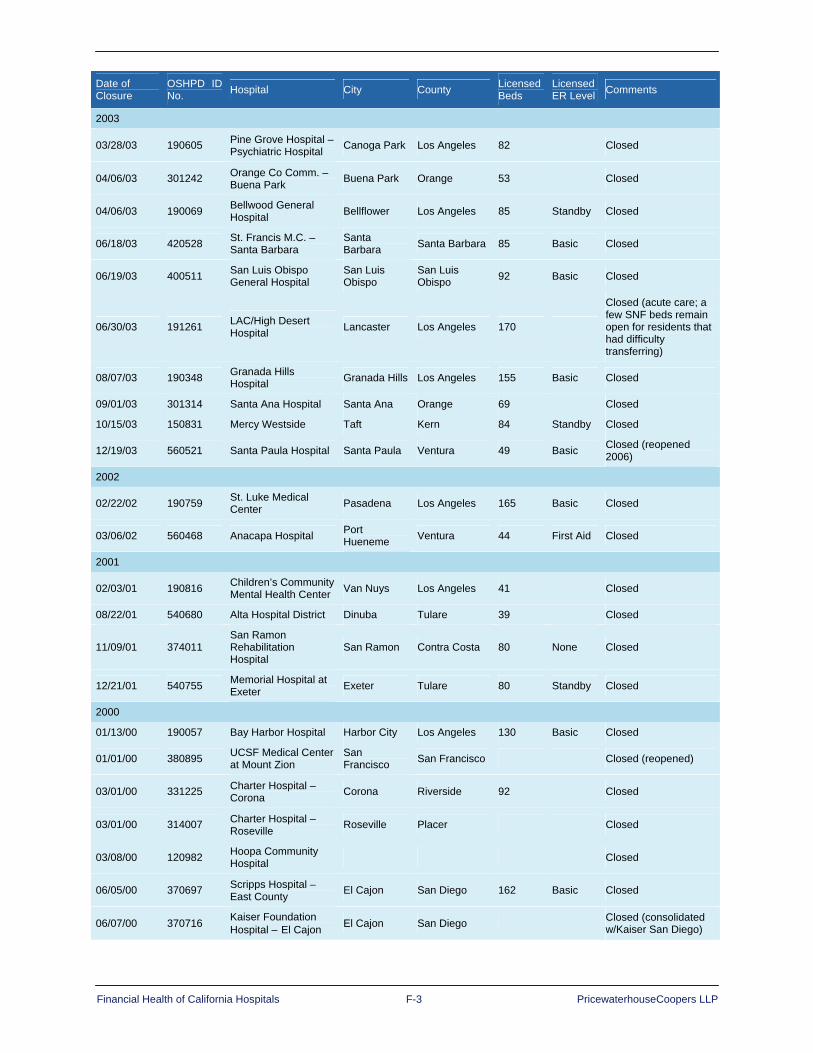
Financial Health of California Hospitals F-3 PricewaterhouseCoopers LLP
Date of Closure
OSHPD ID No. Hospital City County Licensed
Beds Licensed ER Level Comments
2003
03/28/03 190605 Pine Grove Hospital – Psychiatric Hospital Canoga Park Los Angeles 82 Closed
04/06/03 301242 Orange Co Comm. – Buena Park Buena Park Orange 53 Closed
04/06/03 190069 Bellwood General Hospital Bellflower Los Angeles 85 Standby Closed
06/18/03 420528 St. Francis M.C. – Santa Barbara
Santa Barbara Santa Barbara 85 Basic Closed
06/19/03 400511 San Luis Obispo General Hospital
San Luis Obispo
San Luis Obispo 92 Basic Closed
06/30/03 191261 LAC/High Desert Hospital Lancaster Los Angeles 170
Closed (acute care; a few SNF beds remain open for residents that had difficulty transferring)
08/07/03 190348 Granada Hills Hospital Granada Hills Los Angeles 155 Basic Closed
09/01/03 301314 Santa Ana Hospital Santa Ana Orange 69 Closed
10/15/03 150831 Mercy Westside Taft Kern 84 Standby Closed
12/19/03 560521 Santa Paula Hospital Santa Paula Ventura 49 Basic Closed (reopened 2006)
2002
02/22/02 190759 St. Luke Medical Center Pasadena Los Angeles 165 Basic Closed
03/06/02 560468 Anacapa Hospital Port Hueneme Ventura 44 First Aid Closed
2001
02/03/01 190816 Children’s Community Mental Health Center Van Nuys Los Angeles 41 Closed
08/22/01 540680 Alta Hospital District Dinuba Tulare 39 Closed
11/09/01 374011 San Ramon Rehabilitation Hospital
San Ramon Contra Costa 80 None Closed
12/21/01 540755 Memorial Hospital at Exeter Exeter Tulare 80 Standby Closed
2000
01/13/00 190057 Bay Harbor Hospital Harbor City Los Angeles 130 Basic Closed
01/01/00 380895 UCSF Medical Center at Mount Zion
San Francisco San Francisco Closed (reopened)
03/01/00 331225 Charter Hospital – Corona Corona Riverside 92 Closed
03/01/00 314007 Charter Hospital – Roseville Roseville Placer Closed
03/08/00 120982 Hoopa Community Hospital Closed
06/05/00 370697 Scripps Hospital – East County El Cajon San Diego 162 Basic Closed
06/07/00 370716 Kaiser Foundation Hospital – El Cajon El Cajon San Diego Closed (consolidated
w/Kaiser San Diego)

Financial Health of California Hospitals F-4 PricewaterhouseCoopers LLP
Date of Closure
OSHPD ID No. Hospital City County Licensed
Beds Licensed ER Level Comments
06/10/00 190260 Edgemont Hospital Los Angeles Los Angeles 61 Closed
08/31/00 380769 Pacific Coast Hospital San Francisco San Francisco 28 Closed
10/09/00 364188 Heritage Hospital – Inland Empire
Rancho Cucamonga Riverside 55 None Closed
11/29/00 370775 Bayview Hospital CMH System Chula Vista San Diego 64 Closed
11/30/00 540746 Lindsay District Hospital Lindsay Tulare 102 Basic Closed
11/30/00 370746 Mission Bay Hospital San Diego San Diego 128 Basic Closed
12/19/00 334481 The Heart Hospital Rancho Mirage Riverside 12 Closed
06/21/00 073449 Doctor’s Hospital of Pinole Pinole Contra Costa Closed
Martin Luther Hospital Medical Center Closed
340869 Mercy American River Hospital Closed
1999
02/20/99 190847 Washington Hospital-Culver City Culver City Los Angeles 98 Standby Closed
03/29/99 420535 Valley Community Hospital Santa Maria Santa Barbara 70 Basic Closed
07/01/99 334017 Charter B.H.S. – So Cal – Palm Springs
Cathedral City Riverside 80 Closed
09/30/99 434020 St. Louise Med Ctr –Morgan Hill Morgan Hill Santa Clara 60 Basic Closed (moved to
Gilroy)
09/30/99 304040 Charter Hospital-Mission Viejo Mission Viejo Orange 80 Closed
11/04/99 214005 Ross Hospital Kentfield Marin 72 Closed
11/12/99 434032 Charter Hospital – San Jose San Jose Santa Clara 80 Closed
12/31/99 374045 San Luis Rey Hospital Encinitas San Diego 76 Closed
1998
01/15/98 130666 Calexico Hospital Calexico Imperial 34 Basic Closed
03/31/98 240803 Bloss Memorial District Hospital Atwater Merced 23 Standby Closed
04/30/98 500850 Del Puerto Hospital Patterson Stanislaus 40 Standby Closed
05/15/98 301232 Friendly Hills Regional Med Center La Habra Orange 274 Basic Closed
05/31/98 190734 South Bay Medical Center
Redondo Beach Los Angeles 200 Basic Closed
06/30/98 301133 Capistrano By the Sea Hospital Dana Point Orange 98 Closed
08/31/98 190654 North Hollywood Hospital
North Hollywood Los Angeles 160 Basic Closed
09/30/98 100819 Valley Children’s Hosp & Guild Clinic Fresno Fresno 201 Basic Closed (moved to
Madera Co.)
11/16/98 301282 Pacifica Hospital of Huntington Beach
Huntington Beach Orange 98 Basic Closed
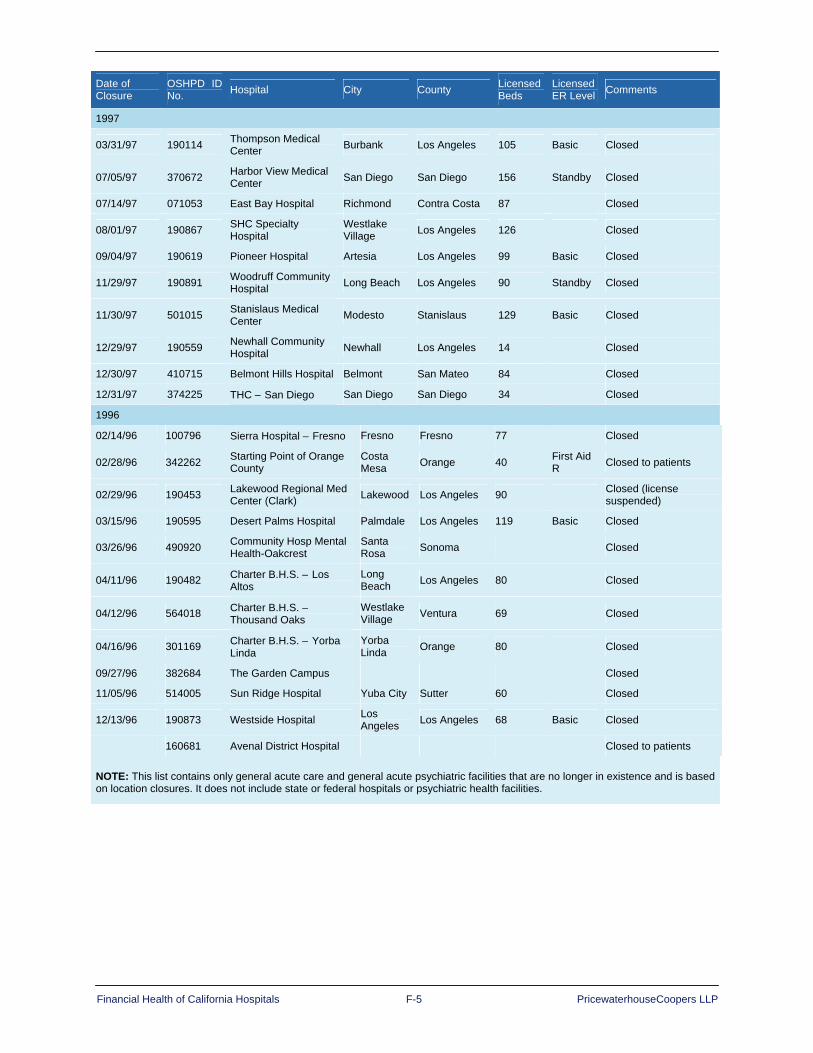
Financial Health of California Hospitals F-5 PricewaterhouseCoopers LLP
Date of Closure
OSHPD ID No. Hospital City County Licensed
Beds Licensed ER Level Comments
1997
03/31/97 190114 Thompson Medical Center Burbank Los Angeles 105 Basic Closed
07/05/97 370672 Harbor View Medical Center San Diego San Diego 156 Standby Closed
07/14/97 071053 East Bay Hospital Richmond Contra Costa 87 Closed
08/01/97 190867 SHC Specialty Hospital
Westlake Village Los Angeles 126 Closed
09/04/97 190619 Pioneer Hospital Artesia Los Angeles 99 Basic Closed
11/29/97 190891 Woodruff Community Hospital Long Beach Los Angeles 90 Standby Closed
11/30/97 501015 Stanislaus Medical Center Modesto Stanislaus 129 Basic Closed
12/29/97 190559 Newhall Community Hospital Newhall Los Angeles 14 Closed
12/30/97 410715 Belmont Hills Hospital Belmont San Mateo 84 Closed
12/31/97 374225 THC – San Diego San Diego San Diego 34 Closed
1996
02/14/96 100796 Sierra Hospital – Fresno Fresno Fresno 77 Closed
02/28/96 342262 Starting Point of Orange County
Costa Mesa Orange 40 First Aid
R Closed to patients
02/29/96 190453 Lakewood Regional Med Center (Clark) Lakewood Los Angeles 90 Closed (license
suspended)
03/15/96 190595 Desert Palms Hospital Palmdale Los Angeles 119 Basic Closed
03/26/96 490920 Community Hosp Mental Health-Oakcrest
Santa Rosa Sonoma Closed
04/11/96 190482 Charter B.H.S. – Los Altos
Long Beach Los Angeles 80 Closed
04/12/96 564018 Charter B.H.S. – Thousand Oaks
Westlake Village Ventura 69 Closed
04/16/96 301169 Charter B.H.S. – Yorba Linda
Yorba Linda Orange 80 Closed
09/27/96 382684 The Garden Campus Closed
11/05/96 514005 Sun Ridge Hospital Yuba City Sutter 60 Closed
12/13/96 190873 Westside Hospital Los Angeles Los Angeles 68 Basic Closed
160681 Avenal District Hospital Closed to patients
NOTE: This list contains only general acute care and general acute psychiatric facilities that are no longer in existence and is based on location closures. It does not include state or federal hospitals or psychiatric health facilities.

Financial Health of California Hospitals F-6 PricewaterhouseCoopers LLP
Closures from 1995 to 2000 A 2001 study by the Petris Center on Health Care Markets and Consumer Welfare reviewed the closure of 23 California hospitals between 1995 and 2000, and profiled the typology of those hospitals. (Note: this dataset is distinct from others used in this study and findings will not match.) Interestingly, Petris reported that only seven of the 23 closures prompted a significant public reaction. These included concerns about the reduction or elimination of reproductive health services, complaints about the short notice of closure, questions about whether the remaining facilities would adequately be able to handle a higher patient load, anticipated problems connected to longer travel time to an existing hospital, and criticism of the hospital owner’s commitment to the community.187
This study identified the following characteristics of these closed facilities:
Ownership: A disproportionate number of the closures were for-profit hospitals (11 hospitals or 48 percent) even though for-profits made up less than one-third of hospitals statewide in 1996 and 1999. Of the closed hospitals, 10 had changed ownership within three years prior to closure. Tenet owned the most hospitals that closed (five), and Catholic Healthcare West owned the second most (three).
Geography: The majority of closures occurred in urban areas, with only four in rural areas. Most of the closures were in Southern California (15 hospitals or 65 percent). The Los Angeles area experienced the greatest number of closures (11), and the San Diego area had four. In two cases, the closure meant residents within a 15-mile radius lost all hospital services. In another two cases, the remaining open hospitals were near the limit of that 15-mile radius.
Size: More than half of the closed hospitals had fewer than 100 licensed beds.
Financial performance: All of the closed hospitals experienced declining reimbursements, income per bed and utilization in the year prior to closure.188
Mergers and Acquisitions Under most circumstances, hospitals’ management and board make the decision to merge to improve their chances of survival. Based on a comparison to national hospital merger and acquisition activity, California activity, for most of the previous seven years, mirrored national trends. A peak in merger/acquisition activity occurred in 1995 and 1996, followed by a steady decline through 2003. Consolidation activity rebounded in 2004 with 236 hospital transactions nationally. In the period 1999 through 2005, 49 California hospitals were involved in mergers or acquisitions. State merger/acquisition activity peaked in 2004 with 12 transactions.
Figure F.3 summarizes California hospital mergers and acquisitions. (Note: The source for this table is different from that used elsewhere in this report; thus reported findings are not the same.)

Financial Health of California Hospitals F-7 PricewaterhouseCoopers LLP
Figure F.3: California Hospital Mergers and Acquisitions 1999-2005 1999 2000 2001 2002 2003 2004 2005
Number of Deals 9 9 7 3 5 12 4
Number of Beds 1967 1193 3872 474 2579 5422 912
Total Acquired Revenue $562,604,776 $337,945,106 $1,379,600,000 $195,600,000 $942,900,000 $2,129,900,000 $245,046,366
Average Revenue/Deal $62,511,642 $42,243,138 $197,085,714 $65,200,000 $188,580,000 $177,491,667 $61,261,592
Deal Count 9 8 7 3 5 12 4
Total Purchase Price $69,600,000 $156,500,000 $798,000,000 $61,000,000 $832,800,000 $656,550,000 $53,220,000
Average Price/Deal $13,920,000 $22,357,143 $133,000,000 $20,333,333 $166,560,000 $54,712,500 $13,305,000
Deal Count 5 7 6 3 5 12 4
Price/Revenue 0.4320 0.4631 0.5968 0.3119 0.8832 0.3083 0.2172
Deal Count 5 7 6 3 5 12 4
Price/Bed Average $131,321 $142,015 $214,863 $128,692 $322,916 $121,090 $58,355
US Price/Bed Average $243,226 $183,517 $163,653 $239,370 $215,265 $378,198 $251,461
Deal Count 5 7 6 3 5 12 3
CA Net Revenue/Bed Average $286,022 $286,152 $356,302 $412,658 $365,607 $392,826 $268,691
US Net Revenue/Bed Average $351,360 $301,903 $347,830 $445,576 $373,036 $430,372 $297,237
Deal Count 5 8 7 3 5 12 4
CA M&A Average Profit Ratio -10.2% -0.7% -6.5% 3.9% 1.3% 0.6% -13.5%
CA Average Operating Margin -0.3% 0.1% 0.8% 0.6% 2.2% 1.7% N/A
US Average Operating Margin 0.4% 0.7% 0.9% 1.5% 1.7% 2.0% N/A
Source: The Health Care Acquisition Report, Sixth-Twelfth Editions, 2000-2006.
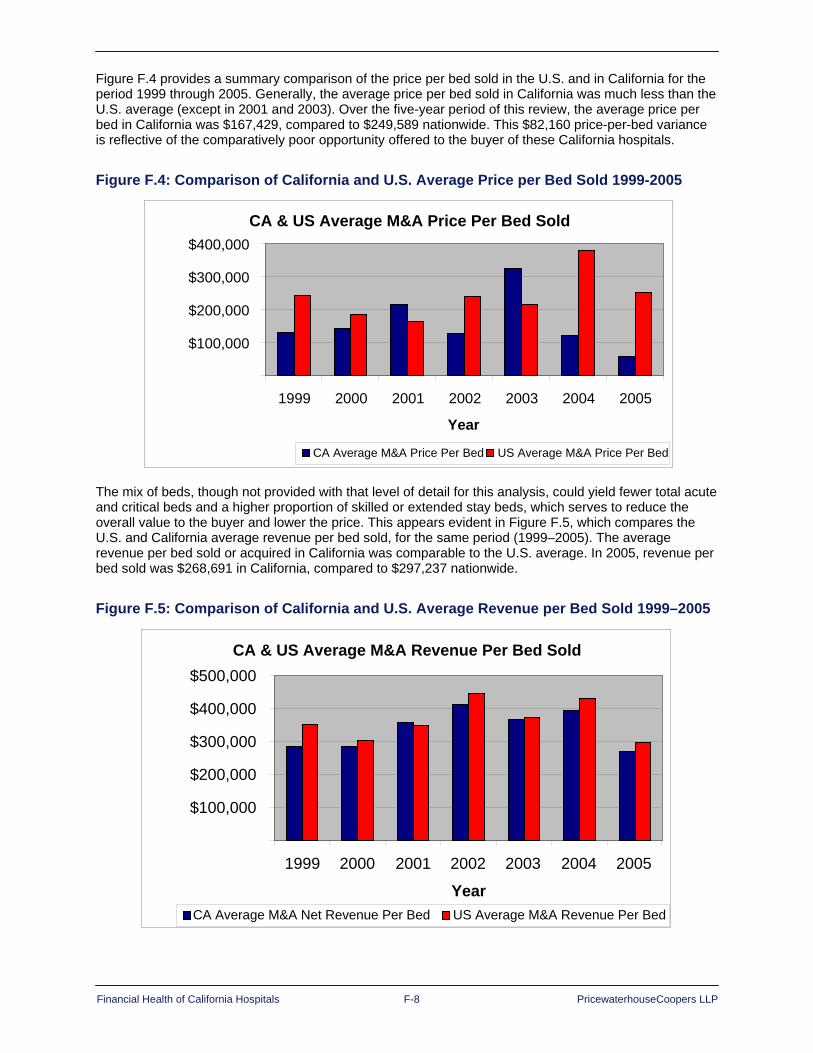
Financial Health of California Hospitals F-8 PricewaterhouseCoopers LLP
Figure F.4 provides a summary comparison of the price per bed sold in the U.S. and in California for the period 1999 through 2005. Generally, the average price per bed sold in California was much less than the U.S. average (except in 2001 and 2003). Over the five-year period of this review, the average price per bed in California was $167,429, compared to $249,589 nationwide. This $82,160 price-per-bed variance is reflective of the comparatively poor opportunity offered to the buyer of these California hospitals.
Figure F.4: Comparison of California and U.S. Average Price per Bed Sold 1999-2005
The mix of beds, though not provided with that level of detail for this analysis, could yield fewer total acute and critical beds and a higher proportion of skilled or extended stay beds, which serves to reduce the overall value to the buyer and lower the price. This appears evident in Figure F.5, which compares the U.S. and California average revenue per bed sold, for the same period (1999–2005). The average revenue per bed sold or acquired in California was comparable to the U.S. average. In 2005, revenue per bed sold was $268,691 in California, compared to $297,237 nationwide.
Figure F.5: Comparison of California and U.S. Average Revenue per Bed Sold 1999–2005
CA & US Average M&A Price Per Bed Sold
$100,000
$200,000
$300,000
$400,000
1999 2000 2001 2002 2003 2004 2005
Year
CA Average M&A Price Per Bed US Average M&A Price Per Bed
CA & US Average M&A Revenue Per Bed Sold
$100,000
$200,000
$300,000
$400,000
$500,000
1999 2000 2001 2002 2003 2004 2005
YearCA Average M&A Net Revenue Per Bed US Average M&A Revenue Per Bed

Financial Health of California Hospitals F-9 PricewaterhouseCoopers LLP
1 California Office of Statewide Health Planning and Development (OSHPD), http://www.oshpd.ca.gov/HQAD/Hospital/financial/hospAF.htm. 2 Ibid. 3 California Office of Statewide Health Planning and Development (OSHPD), http://www.oshpd.ca.gov/HQAD/Hospital/financial/annualSData/hospAFdata.htm. 4 Kaiser Permanente, http://members.kaiserpermanente.org/kpweb/facilitydir/entrypage.do?rop=MRN. 5 California Office of Statewide Health Planning and Development (OSHPD), http://oshpd.ca.gov/hqad/patientlevel/CMI/ExampleCalculation.pdf. 6 California Health Interview Survey website, http://www.chis.ucla.edu/BER/geoSelect.asp. 7 American Hospital Association (AHA), “HIPAA” (Retrieved January 12, 2007) http://www.aha.org/aha_app/issues/HIPAA/index.jsp. 8 Phoenix Health Systems, “HIPAA Primer,” HIPAAAdvisory (Retrieved January 15, 2007) http://www.hipaadvisory.com/regs/HIPAAprimer.htm. 9 American Health Information Management Association (AHIMA), The State of HIPAA Privacy and Security Compliance (Chicago: 2004), 5. 10 Ibid. 11 Ibid., 35-36. 12 Health Data Management, “Keeping Up with HIPAA Compliance” (Health Data Management: December 1, 2006, Retrieved January 15, 2007) http://www.healthdatamanagement.com/portals/article.cfm?type=government&articleId=14367. 13 Phoenix Health Systems, “US Healthcare Industry HIPAA Compliance Survey Results: Winter 2006,” HIPAAdvisory (Retrieved January 15, 2007) http://www.hipaadvisory.com/action/surveynew/results/winter2006.htm. 14 Ibid. 15 Phoenix Health Systems, “HIPAA Primer.” 16 Simon P. Cohn, “Letter to Secretary Leavitt: HIPAA Lessons Learned” (June 22, 2006, Retrieved January 11, 2007) http://www.ncvhs.hhs.gov/060622lt2.htm. 17 Ibid. 18 Ibid. 19 Ibid. 20 Centers for Medicare and Medicaid Services (CMS), “National Provider Identifier Standard (NPI)” (Retrieved January 12, 2007) http://www.cms.hhs.gov/HIPAAGenInfo/. 21 U.S. General Accounting Office, EMTALA Implementation and Enforcement Issues GAO-01-747 (Washington, D.C.: June 2001), 1. 22 Ibid. 23 Ibid., 5. 24 Ibid., 2. 25 Ibid., 10. 26 Ibid., 2. 27 Glenn A. Melnick, Amar C. Nawathe, Anil Bamezal and Lois Green, “Emergency Department Capacity and Access in California, 1990–2001: An Economic Analysis” (Health Affairs: March 24, 2004, Retrieved January 16, 2007), 1. 28 U.S. General Accounting Office, EMTALA Implementation and Enforcement Issues, 2. 29 Melnick, et al., 3. 30 Ibid., 3.

Financial Health of California Hospitals F-10 PricewaterhouseCoopers LLP
31 Ibid., 4. 32 Charles Mead and Jonathan Kulick, SB1953 and the Challenge of Hospital Seismic Safety in California (RAND Corporation for the California HealthCare Foundation, January 2007), 26. 33 California Office of Statewide Health Planning & Development (OSHPD), California’s Hospital Seismic Safety Law (2005), 1. 34 Ibid., 8. 35 William T. Holmes, “Background and History of the Seismic Hospital Program in California” (no date). 36 OSHPD, California’s Hospital Seismic Safety Law, 8. 37 Ibid. 38 Ibid., 11-12. 39 Ibid., 9. 40 Charles Mead and Jonathan Kulick, SB1953 and the Challenge of Hospital Seismic Safety in California, 22-23. 41 California Healthcare Association, “SB 1953: Hospitals Facilities Seismic Safety Act Fact Sheet.” 42 Meade and Kulick, SB1953 and the Challenge of Hospital Seismic Safety in California, 9. 43 Ibid., 10. 44 Ibid. 45 Ibid., 17. 46 Alicia Chang, “California Hospitals Could Find Reprieve in Seismic Inspections” (Associated Press: July 2, 2006, Retrieved from Factiva, Dow Jones Reuters Business Interactive LLC, October 26, 2006). 47 Davis Langdon, “Construction Costs Escalation in California Healthcare Projects” (Davis Langdon Firm: January 2006), 1-4. 48 OSHPD, California’s Hospital Seismic Safety Law, 14-15. 49 Ibid., 18. 50 Meade and Kulick, SB1953 and the Challenge of Hospital Seismic Safety in California, 5. 51 Charles Meade, Jonathan Kulick and Richard Hillestad, Estimating the Compliance Costs for California SB 1953 (RAND Corporation for California HealthCare Foundation, April 2002), vii. 52 Meade and Kulick, SB1953 and the Challenge of Hospital Seismic Safety in California, 20. 53 Ibid., 6. 54 Ibid., 29-31. 55 Ibid., 34. 56 Ibid., 36. 57 Ibid., 4-5, 27. 58 Meade and Kulick, SB1953 and the Challenge of Hospital Seismic Safety in California, 49. 59 “Sutter Health Announces Closure of Santa Rosa Hospital” (Los Angeles Times: January 11, 2007; Retrieved from California Healthline January 11, 2007) http://www.californiahealthline.org. 60 “California Hospitals Are Not Earthquake Safe; Healthcare Workers Union Encourage Funding” (Science Letter via NewsRX.com: June 2, 2006, Retrieved from Factiva, Dow Jones Reuters Business Interactive LLC, October 26, 2006). 61 “Tenet Announces Major Restructuring of Operations,” Tenet press release, January 28, 2004. 62Dianne Feinstein, “Senator Feinstein Announces $5.6 million in FEMA Funding for Seismic Retrofits of Northern California Hospitals” (CQ Transcriptions: September 27, 2006, retrieved from Factiva, Dow Jones Reuters Business Interactive LLC, October 26, 2006). 63 Chang, “California Hospitals Could Find Reprieve in Seismic Inspections.” 64 Meade and Kulick, SB1953 and the Challenge of Hospital Seismic Safety in California, 16-17.

Financial Health of California Hospitals F-11 PricewaterhouseCoopers LLP
65 Ibid., 17. 66 Meade and Kulick, SB1953 and the Challenge of Hospital Seismic Safety in California, 39. 67 California HealthCare Association, “Implementation of California’s Nurse Ratio Law: History of the Law” (Sacramento, CA, no date). 68 California Department of Health Services, “Nurse-to-Patient Staffing Ratios for General Acute Care Hospitals: Frequently Asked Questions” (January 2004). 69 AFL-CIO AFL-CIO Department for Professional Employees, “Fact Sheet 2006: The Costs and Benefits of Safe Staffing Ratios” (Retrieved January 23, 2007) http://www.dpeaflcio.org/programs/factsheets/fs_2006_staffratio.htm. 70 Ibid. 71 Sage Publications, “New Study Examines Impact of Nurse-Patient Ratios Law: First Study on Impact of Landmark California Staffing Law” (Sage Publications, Retrieved January 23, 2007) http://www.sagepub.com/repository/binaries/press/PPN_CalNOC_Study.pdf, 1. 72 Ibid. 73 P. Daniel Wright , Kurt M Bretthauer, Murray J. Côté, “Re-examining the Nurse Scheduling Problem: Staffing Ratios and Nursing Shortages” Decision Sciences (February 2006, Retrieved January 23, 2007) http://findarticles.com/p/articles/mi_qa3713/is_200602/ai_n16139443, 1. 74 Ibid., 12. 75 AFL-CIO Department for Professional Employees, “Fact Sheet 2006: The Costs and Benefits of Safe Staffing Ratios.” 76 Janet M. Coffman, Jean Ann Seago and Joanne Spetz, “Minimum Nurse-to-Patient Ratios in Acute Care Hospitals in California” Health Affairs, 21 (September 11, 2002, Retrieved January 23, 2007) http://www.medscape.com/viewarticle/440691, 3-4. 77 Joanne Spetz, Jean Ann Seago, Janet Coffman, Emily Rosenoff, Edward O’Neil, Minimum Nurse Staffing Ratios in California Acute Care Hospitals (Oakland, California: California HealthCare Foundation, December 2000), 1. 78 Joanne Spetz and Wendy Dyer, Forecasts of the Registered Nurse Workforce in California (University of California San Francisco for the California board of Registered Nursing: June 7, 2005), 2-3. 79 Kaiser Family Foundation, “Statehealthfacts.org” (Retrieved January 23, 2007) http://www.statehealthfacts.org. 80 Ibid. 81 Ibid., 31. 82 Centers for Medicare and Medicaid Services (CMS), “History” (CMS, Retrieved February 6, 2007) http://www.cms.hhs.gov/history/overview. 83 California HealthCare Foundation (CHCF), Medicare Facts and Figures: A California Perspective (February 2006), 1. 84 CMS, Medicare and You, (2007) http://www.medicare.gov/publications/pubs/pdf/10050.pdf, 8. 85 Ibid., 12-22. 86 Ibid., 44-45. 87 Ibid., 29-31. 88 Ibid., 33-39. 89 CHCF, Medicare Facts and Figures: A California Perspective, 16-17. 90 Shattuck Hammond Partners, The Financial Health of California Hospitals (Oakland, California: California HealthCare Foundation, July 2001), app. B, 2. 91 Ibid., 3. 92 CMS, Medicare and You, 33. 93 Brian Biles, et al., The Cost of Privatization: Extra Payments to Medicare Advantage Plans Updated and Revised (The Commonwealth Fund, November 2006), 1-2.

Financial Health of California Hospitals F-12 PricewaterhouseCoopers LLP
94 American Hospital Association (AHA), “Underpayment by Medicare and Medicaid Fact Sheet” (AHA, October 2006), 2-3. 95 Scott C. Withrow, “The Eight Dimensions of Quality” HFM Magazine (Healthcare Financial Management Association [HFMA], December 2006, Retrieved December 19, 2006) http://www.hfma.org. 96 George Lauer, “Pay for Performance a Factor in Medicare Reform,” California Healthline (California HealthCare Foundation, December 6, 2006, Retrieved December 8, 2006) http://www.californiahealthline.org. 97 Premier Inc. “Improved Quality Means More Patients Receiving Recommended Treatments” (Charlotte, N.C.: Premier Inc., January 26, 2007, Retrieved February 2, 2007) http://www.premierinc.com/about/news. 98 Medicare Payment Advisory Commission, Report to the Congress: Rural Payment Provisions in the Medicare Prescription Drug, Improvement, and Modernization Act of 2003 (Washington, D.C.: Medicare Payment Advisory Commission, December 2006), v-vi. 99 Ibid. 100 Ibid. 101 Committee on Ways and Means, U.S. House of Representatives, “Medicare Provisions in the Deficit Reduction Act” (December 19, 2005, Retrieved February 8, 2007) http://waysandmeans.house.gov/ResourceKits.asp?section=22331-2. 102 Medicare Payment Advisory Commission, Report to the Congress: Rural Payment Provisions in the Medicare Prescription Drug, Improvement, and Modernization Act of 2003, 3. 103 California HealthCare Foundation (CHCF), Medi-Cal Facts and Figures: A Look at California’s Medicaid Program (January 2006), 2-4. 104 Ibid. 105 Ibid., 31. 106 California Department of Health Services, “November 2006 Medi-Cal Estimate: Medi-Cal Expenditures by Service Category Fiscal Year 2006-2007” (December 29, 2006, Retrieved February 8, 2007) http://www.dhs.ca.gov/admin/ffdmb/estimates/2006nov/pdf/N06_BY_Page_06.pdf. 107 CHCF, Medi-Cal Facts and Figures: A Look at California’s Medicaid Program, 49-50. 108 Shattuck Hammond, app. B, 4. 109 California Medical Assistance Commission (CMAC), “Annual Report to the Legislature” (Sacramento: CMAC, 2006) http://www.cmac.ca.gov/files/annualreport2k6.pdf, 14-15. 110 Ibid., 3. 111 Ibid., 5-9. 112 Shattuck Hammond, app. B, 4. 113 California Department of Health Services (CDHS), “November 2006 Medi-Cal Estimate: Medi-Cal Expenditures by Service Category Fiscal Year 2006–2007.” 114 California Association of Public Hospitals and Health Systems (CAPH), “The California Hospital Financing Medicaid Waiver: Year One Implementation and Results for Public Hospitals” (CAPH, November 2006). 115 Ibid. 116 Peter Harbage and Jennifer Ryan, “Questions and Answers about the 2005 Medi-Cal Hospital Waiver” (California HealthCare Foundation, August 23, 2005, Retrieved February 8, 2007) http://www.chcf.org/documents/policy/MediCalWaiverQandA.pdf, 9. 117 CAPH, “The California Hospital Financing Medicaid Waiver: Year One Implementation and Results for Public Hospitals.” 118 Harbage and Ryan, “Questions and Answers about the 2005 Medi-Cal Hospital Waiver,” 8. 119 California HealthCare Foundation (CHCF), “Examining the 2005 Medi-Cal Hospital Waiver” (CHCF, April 2006), 1. 120 California Medical Assistance Commission (CMAC), “Annual Report to the Legislature,” 16-20. 121 Congressional Budget Office, “Medicaid Spending Growth and Options for Controlling Costs” (Washington, D.C.: CBO, July 13, 2006), 21-22.

Financial Health of California Hospitals F-13 PricewaterhouseCoopers LLP
122 Ibid. 123 Ibid. 124 California Department of Health Services (CDHS), “Capitation Rates Unit” (Retrieved February 7, 2007) http://www.dhs.ca.gov/mcs/mcpd/rdb/cru/default.htm. 125 Medi-Cal Policy Institute, “Medi-Cal Managed Care,” Medi-Cal Facts (March 2000), No. 8. 126 CMAC, “Annual Report to the Legislature,” 22. 127 Ibid. 128 California State Assembly, “Agenda: Assembly Budget Subcommittee No. 1 on Health and Human Services” (May 20, 2004, Retrieved February 8, 2007) http://www.assembly.ca.gov/acs/committee/c1/hearing/2004/05-20-2004-reco-md.doc. 129 California Department of Health Services (CDHS), “Medi-Cal Managed Care Division” (Retrieved February 8, 2007) http://www.dhs.ca.gov/mcs/mcmcd/. 130 CHCF, “Examining the 2005 Medi-Cal Hospital Waiver,” 5. 131 Harbage and Ryan, “Questions and Answers about the 2005 Medi-Cal Hospital Waiver,” 9. 132 Ibid. 133 CHCF, “Examining the 2005 Medi-Cal Hospital Waiver,” 4. 134 Shattuck Hammond, app. B, 8. 135 Harbage and Ryan, “Questions and Answers about the 2005 Medi-Cal Hospital Waiver,” 10-11. 136 Ibid., 15. 137 Ibid., 13. 138 California HealthCare Foundation (CHCF), “County Programs for the Medically Indigent in California” (CHCF, August 2006), 1. 139 Ibid., 2. 140 Ibid. 141 Shattuck Hammond, The Financial Health of California Hospitals, app. D, 2. 142 Healthcare Financial Management Association (HFMA), “Financing the Future II Report 2: Strategies for Effective Capital Structure Management” (Westchester, IL: 2005), 10. 143 Healthcare Financial Management Association (HFMA), “Financing the Future Report I: How Are Hospitals Financing the Future? Access to Capital in Health Care Today” (Westchester, IL: 2003), 24-26. 144 HFMA, “Financing the Future II Report 2,” 9-11. 145 Ibid., 18-19. 146 Congressional Budget Office, “Nonprofit Hospitals and Tax Arbitrage” (Congress of the United States, December 2006), 1. 147 Ibid. 148 Ibid., 3. 149 Ibid., 5. 150 Shattuck Hammond, The Financial Health of California Hospitals, app. D, 3. 151 Ibid., 4. 152 Ibid., 6. 153 Lisa Zuckerman, Joseph Marinucci, David P. Peknay and James Cortez, “The California Health Care Market: Recent Strength Defies Expectations” (Standard & Poor’s, June 2, 2004), 1. 154 Martin D. Arrick, Lisa Zuckerman and Stephan Infranco, “U.S. Not-for-Profit Health Care 2006 Outlook: Emerging Evidence of a Turning Tide” (Standard & Poor’s, February 6, 2006), 1.

Financial Health of California Hospitals F-14 PricewaterhouseCoopers LLP
155 John E. Wells, et al., “Health Care Special Report: 2007 Nonprofit Hospitals and Health Care Systems Outlook,” (Fitch Ratings, January 10, 2007). 156 David Peknay, “S&P Credit Market Services View: Overall Credit Environment Remains Weak,” Healthcare: Facilities Industry Survey (Standard & Poor’s, December 28, 2006), 6. 157 Healthcare Financial Management Association, “Financing the Future Report I: Access to Capital in Health Care Today,” 7. 158 Zuckerman et al., “The California Health Care Market: Recent Strength Defies Expectations,” 9. 159 Ibid., 1. 160 Kelly J. Devers, Linda R. Brewster, and Lawrence P. Casalino, “Changes in Hospital Competitive Strategy: A New Medical Arms Race?” 161 Healthcare Financial Management Association, “Financing the Future II Report 6: The Outlook for Capital Access and Spending” (Westchester, IL: 2006), 8-9. 162 Arrick, Zuckerman and Infranco, “U.S. Not-for-Profit Health Care 2006 Outlook: Emerging Evidence of a Turning Tide,” 10-12. 163 Zuckerman et al., “The California Health Care Market: Recent Strength Defies Expectations,” 10. 164 Tommy Chan, et al., “Health Care Special Report: Health Care Rating Actions for the 12 Months Ended December 31, 2006” (Fitch Ratings, January 10, 2007), 3-4. 165 Ibid., 4. 166 Ibid., 4. 167 Ibid., 10. 168 Ibid., 12. 169 Arrick, Zuckerman and Infranco, “U.S. Not-for-Profit Health Care 2006 Outlook: Emerging Evidence of a Turning Tide,” 7-8. 170 Marcelo Olarte, et al., “Health Care Special Report: 2006 Median Ratios for Nonprofit Hospitals and Health Care Systems” (Fitch Ratings, August 10, 2006), 1 171 John E. Wells, et al., “Health Care Special Report: 2007 Nonprofit Hospitals and Health Care Systems Outlook,” 1. 172 Ibid., 9. 173 Ibid., 1. 174 Arrick, Zuckerman and Infranco, “U.S. Not-for-Profit Health Care 2006 Outlook: Emerging Evidence of a Turning Tide,” 3. 175 Cameron Lavey, “Uncompensated Care Continues to Pressure Providers,” Healthcare: Facilities Industry Survey (Standard & Poor’s, December 28, 2006), 1. 176 Shattuck Hammond, The Financial Health of California Hospitals, app. D, 6. 177 Ibid. 178 John E. Wells et al., “Health Care Special Report: 2006 Nonprofit Hospitals and Health Care Systems Outlook,” 4. 179 Richard Haugh, “California: Can This Sinking Ship Be Saved?” Hospitals and Health Networks (February 15, 2005, Retrieved February 12, 2007) http://www.hospitalconnect.com. 180 Tenet Healthcare, “Tenet Announces Restructuring of Operations” (January 28, 2004, Retrieved February 12, 2007) http://www.tenethealth.com/TenetHealth/PressCenter/PressReleases/. 181 Tenet Healthcare, “Tenet Announces Civil Settlement in San Diego Hospital Case” (May 17, 2006, Retrieved February 14, 2007) http://www.tenethealth.com/TenetHealth/PressCenter/PressReleases/. 182 Tenet Healthcare, “Tenet Completes Sale of Alvarado Medical Center” (January 1, 2007, Retrieved February 14,2007) http://www.tenethealth.com/TenetHealth/PressCenter/PressReleases/. 183 Haugh, “California: Can This Sinking Ship Be Saved?” 184 Linda Everett, “California’s Hospitals Closing, More Cuts Ahead,” Executive Intelligence Review (October 1, 2004, Retrieved February 12, 2007) http://www.new-federalist.com/other/2004/3138cal_hosp_cuts.html.

Financial Health of California Hospitals F-15 PricewaterhouseCoopers LLP
185 Cattaneo & Stroud, Inc., “California Statewide Medi-Cal Enrollment by County for the Months of March 1999–2005” (Retrieved February 13, 2007) http://www.cattaneostroud.com/2005HMO_Study/table_5c.pdf. 186 Meade and Kulick, SB 1953 and the Challenge of Hospital Seismic Safety in California, 10. 187 Nicholas C. Petris Center on Health Care Markets and Consumer Welfare, “California’s Closed Hospitals 1995–2000” (Berkeley: University of California School of Public Health, January 2001, Rev. April 2001), 1-2. 188 Ibid.

pwc.com © 2007 PricewaterhouseCoopers LLP. All rights reserved. PricewaterhouseCoopers LLP refers to the PricewaterhouseCoopers LLP (a Delaware limited liability partnership) or, as the context requires, other member firms of PricewaterhouseCoopers International Limited, each of which is a separate and independent legal entity. SF-07-0694-A SL 04/07
Related Documents