Financial Forecasting

Financial Forecasting. Forecasting and Pro Forma Analysis Timing of financial needs Amount of financial needs Flow of funds Check the covenants.
Dec 29, 2015
Welcome message from author
This document is posted to help you gain knowledge. Please leave a comment to let me know what you think about it! Share it to your friends and learn new things together.
Transcript

Financial Forecasting

Forecasting and Pro Forma Analysis
Timing of financial needs Amount of financial needs Flow of funds Check the covenants

Pro forma Income
Statement
Pro forma Balance
Sheet
Plug Figure Financing Options
Depreciation
Capital ExpendituresChange in Net Plant & Equipment
SalesForecast
Net Income
Dividend Policy Change in Retained
Earnings
Working Capital Accounts External
FinancingRequired
Short-Term Debt
Long-Term Debt

Steps in Financial Forecasting
Forecast sales Project the assets needed to support
sales Project internally generated funds Project outside funds needed Decide how to raise funds See effects of plan on ratios and stock
price

Sales Forecast
Seasonal changes Business cycle
Recession Expansion
Market segment High growth Contraction
Inflation

2001 Balance Sheet (Millions of $)
Cash & sec. $20 Accts. pay. &
accruals $100
Accounts rec. 240 Notes payable 100
Inventories 240 Total CL $200
Total CA $500 L-T debt 100
Common stk 500
Net fixed Retained
Assets 500 Earnings 200
Total assets $1000 Total claims $1000
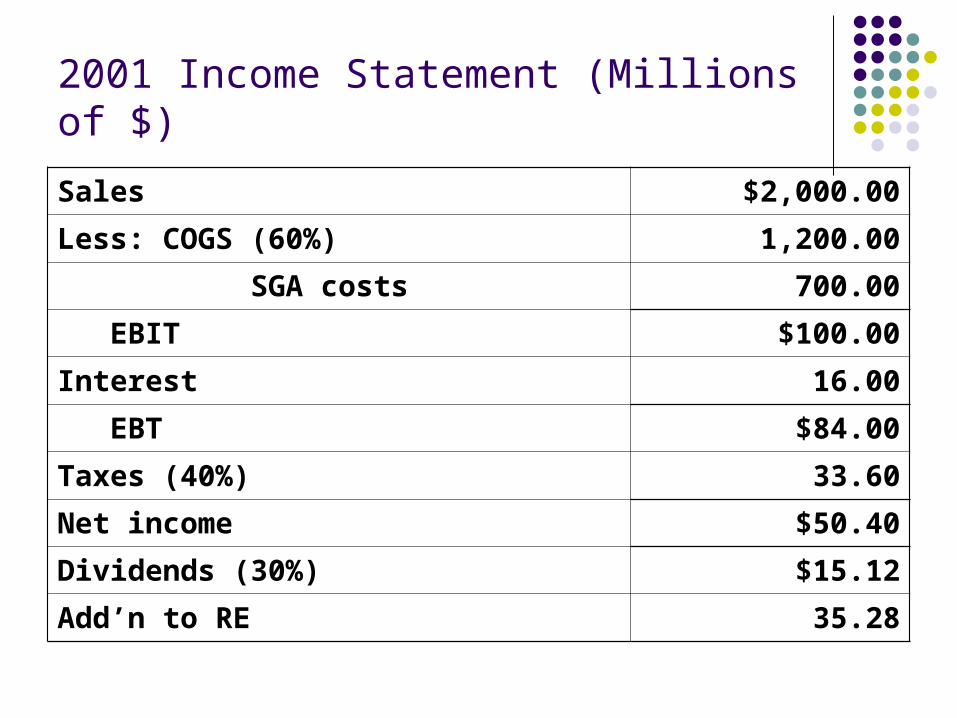
2001 Income Statement (Millions of $)
Sales $2,000.00
Less: COGS (60%) 1,200.00
SGA costs 700.00
EBIT $100.00
Interest 16.00
EBT $84.00
Taxes (40%) 33.60
Net income $50.40
Dividends (30%) $15.12
Add’n to RE 35.28

AFN (Additional Funds Needed)
Key Assumptions Operating at full capacity in 2001. Each type of asset grows proportionally with
sales. Payables and accruals grow proportionally with
sales. 2001 profit margin (2.52%) and payout (30%) will
be maintained. Sales are expected to increase by $500 million.
(%ΔS = 25%)

AFN (Additional Funds Needed)
AFN= (A*/S0) ΔS - (L*/S0) ΔS - M(S1)(1 - d)
= ($1,000/$2,000)($500) - ($100/$2,000)($500) - 0.0252($2,500)(1 - 0.3)
= $180.9 million.

Projecting Pro Forma Statements with the Percent
of Sales Method: Project sales based on forecasted growth rate in sales Forecast some items as a percent of the forecasted sales
Costs Cash Accounts receivable
Items as percent of sales Inventories Net fixed assets Accounts payable and accruals
Choose other items Debt (which determines interest) Dividends (which determines retained earnings)
Common stock

Percent of Sales: Inputs
2001 2002
Actual Proj.
COGS/Sales 60% 60%
SGA/Sales 35% 35%
Cash/Sales 1% 1%
Acct. rec./Sales 12% 12%
Inv./Sales 12% 12%
Net FA/Sales 25% 25%
AP & accr./Sales 5% 5%

Other Inputs
Percent growth in sales 25%
Growth factor in sales (g) 1.25
Interest rate on debt 8%
Tax rate 40%
Dividend payout rate 30%

2002 1st Pass Income Statement 2002
2001 Factor 1st Pass
Sales $2,000 g=1.25 $2,500
Less: COGS Pct=60% 1,500
SGA Pct=35% 875
EBIT $125
Interest 16 16
EBT $109
Taxes (40%) 44
Net. Income $65
Div. (30%) $19
Add. to RE $46

2002 1st Pass Balance Sheet (Assets)
Forecasted assets are a percent of sales.
2002 Sales = $2,500
2002
Factor 1st Pass
Cash Pct= 1% $25
Accts. rec. Pct=12% 300
Inventories Pct=12% 300
Total CA $625
Net FA Pct=25% $625
Total assets $1250

2002 1st Pass Balance Sheet (Claims) 2002 Sales = $2,500
2002
2001 Factor 1st Pass
AP/accruals Pct=5% $125
Notes payable 100 100
Total CL $225
L-T debt 100 100
Common stk. 500 500
Ret. earnings 200 +46* 246
Total claims $1,071

What are the additional funds needed (AFN)?
Forecasted total assets = $1,250 Forecasted total claims = $1,071 Forecast AFN = $ 179
NWC must have the assets to make forecasted sales. The balance sheets must balance. So, we must raise $179 externally

How will the AFN be financed?
Additional notes payable= 0.5 ($179) = $89.50 $90.
Additional L-T debt= 0.5 ($179) = $89.50 $89.
But this financing will add 0.08($179) = $14.32 to interest expense, which will lower NI and retained earnings.

2002 2nd Pass Income Statement
1st Pass Feedback 2nd Pass
Sales $2,500 $2,500
Less: COGS $1,500 $1,500
SGA 875 875
EBIT $125 $125
Interest 16 +14 30
EBT $109 $95
Taxes (40%) 44 38
Net income $65 $57
Div (30%) $19 $17
Add. to RE $46 $40

2002 2nd Pass Balance Sheet (Assets)
1st Pass AFN 2nd Pass
Cash $25 $25
Accts. rec. 300 300
Inventories 300 300
Total CA $625 $625
Net FA 625 625
Total assets $1,250 $1,250

2002 2nd Pass Balance Sheet (Claims)
1st Pass Feedback 2nd Pass
AP/accruals $125 $125
Notes payable 100 +90 190
Total CL $225 $315
L-T debt 100 +89 189
Common stk. 500 500
Ret. earnings 246 -6 240
Total claims $1,071 $1,244

Results After the Second Pass
Forecasted assets= $1,250 (no change) Forecasted claims= $1,244 (higher) 2nd pass AFN = $ 6 (short) Cumulative AFN= $179 + $6 = $185. The $6 shortfall came from the $6
reduction in retained earnings. Additional passes could be made until assets exactly equal claims.

Financial Forecasting and Firm Capacity
Balance Sheet ($ in Millions)
Assets 1999 Liabilities and Owners' Equity
1999
Current Assets Current Liabilities
Cash 200 Accounts Payable 400
Accounts Receivable 400 Notes Payable 400
Inventory 600 Total Current Liabilities 800
Total Current Assets 1200 Long-Term Liabilities
Long-Term Debt 500
Fixed Assets Total Long-Term Liabilities 500
Net Fixed Assets 800 Owners' Equity
Common Stock ($1 Par) 300
Retained Earnings 400
Total Owners' Equity 700
Total Assets 2000 Liab. and Owners' Equity 2000

Income Statement ($ in Millions), 1999
Sales 1200
Cost of Goods Sold 900
Taxable Income 300
Taxes 90
Net Income 210
Dividends 70
Addition to Retained Earnings 140

Full Capacity
The equation used to calculate EFN when fixed assets are being utilized at full capacity is given below.

S0 = Current Sales, S1 = Forecasted Sales = S0(1 + g), g = the forecasted growth rate is Sales, A*0 = Assets (at time 0) which vary directly with
Sales, L*0 = Liabilities (at time 0) which vary directly with
Sales, PM = Profit Margin = (Net Income)/(Sales), and b = Retention Ratio = (Addition to Retained
Earnings)/(Net Income).

Full Capacity Example
Given that Fixed Assets are being utilized at full capacity and the forecasted growth rate in Sales is 25%.
Forecasted Sales: S1 = 1200(1 + .25) = $1500

Excess Capacity If the firm has excess capacity in its Fixed Assets then the Fixed
Assets may not have to increase in order to support the forecasted sales level. Moreover, if the Fixed Assets do need to increase in order to support the forecasted sales level, then they will not have to increase by as much as would be required if they were being used at full capacity.
If Forecasted Sales are less than Full Capacity Sales, then fixed assets do not need to increase to support the forecasted sales level. On the other hand, if Forecasted Sales are greater than Full Capacity Sales, then Fixed Assets will have to increase.

Case 1: S1 Less Than SFC
Given that Fixed Assets are currently being utilized at 60% of capacity and the forecasted growth rate in Sales is 25%.
S1 = 1200(1 + .25) = $1500 SFC = 1200/.60 = $2000 Forecasted Sales are less than Full Capacity Sales the EFN can
be found in one step. Here A*0 is equal to Total Current Assets
which equals $1200.

Case 2: S1 Greater Than SFC When the Forecasted Sales are greater than Full
Capacity Sales, EFN can be determined in two steps. The first step, EFN1, finds the EFN needed to get to Full Capacity Sales. The second step, EFN2, finds the additional EFN to get from Full Capacity Sales to the Forecasted Sales.
The total EFN is simply EFN1 plus EFN2.

Excess Capacity Example: S1 > SFC Given that Fixed Assets are currently being utilized at
90% of capacity and the forecasted growth rate in Sales is 25%.
S1 = 1200(1 + .25) = $1500 SFC = 1200/.90 = $1333.33
Related Documents