a Politeknik Merlimau, Melaka, Malaysia. b Accounting Research Institute, Universiti Teknologi MARA, and Universiti Teknologi MARA Johor, Malaysia. FINANCIAL DIFFICULTIES AND PERFORMANCE AMONG FRAUDULENT FIRMS EVIDENCE FROM MALAYSIA Noor Azira Sawal a , Nor Balkish Zakaria b and NorhidayahAbdullah b Abstract: This study aims to examine the effect of financial difficulties faced by the fraudulent firms. The population for this study is 175 fraudulent firms which identified as PN17 based on media released by Bursa Malaysia from 2001 to 2012. The results of this studyshow that default risk and financial distress has significant negative effect on Tobin Q. The result of this study could pave way to any agency that monitors the misconducts among listed firms as financial difficulties may give early signal of any fraud possibility in the future. Keywords: performance, default risk, financial distress 1. INTRODUCTION Financial frauds typically involve complex methods for misusing funds, overstating revenues and misappropriation of assets. In Malaysia, a mini Enron scandal has been alerting those corporate governance players such as directors, managers, accountants, Bursa Malaysia and other agencies. The revealed financial scandal of Transmile Group Berhad, probably become the highlight for being the highest- profile scandal among Malaysian firms that involved in financial irregularities 1 . When the financial statement can no longer portray a true picture of financial position of business, the element of financial irregularities already exist and can be connected with fraud. On the other hand, prior studies highlight that the financial distressed firms were likely to involve in the fraudulent activities (Liou 2008; Rosner, 2003; Spathis, 2002). Fraudulent firms commit several violations such as breaching listing requirement, asset misappropriation and litigation. There could be several possible factors that contributed to the existence of fraudulent firms and these factors could be financial or non-financial. As for financial factors, the fraudulent firms may suffered financial difficulties like financial distress or high default risk. Besides I J A B E R, Vol. 13, No. 1, (2015): 161-175

Welcome message from author
This document is posted to help you gain knowledge. Please leave a comment to let me know what you think about it! Share it to your friends and learn new things together.
Transcript
a Politeknik Merlimau, Melaka, Malaysia.b Accounting Research Institute, Universiti Teknologi MARA, and Universiti Teknologi MARA Johor,
Malaysia.
FINANCIAL DIFFICULTIES AND PERFORMANCEAMONG FRAUDULENT FIRMS EVIDENCE FROM
MALAYSIA
Noor Azira Sawala, Nor Balkish Zakariab and NorhidayahAbdullahb
Abstract: This study aims to examine the effect of financial difficulties faced by the fraudulentfirms. The population for this study is 175 fraudulent firms which identified as PN17 based onmedia released by Bursa Malaysia from 2001 to 2012. The results of this studyshow that defaultrisk and financial distress has significant negative effect on Tobin Q. The result of this studycould pave way to any agency that monitors the misconducts among listed firms as financialdifficulties may give early signal of any fraud possibility in the future.
Keywords: performance, default risk, financial distress
1. INTRODUCTION
Financial frauds typically involve complex methods for misusing funds, overstatingrevenues and misappropriation of assets. In Malaysia, a mini Enron scandal hasbeen alerting those corporate governance players such as directors, managers,accountants, Bursa Malaysia and other agencies. The revealed financial scandal ofTransmile Group Berhad, probably become the highlight for being the highest-profile scandal among Malaysian firms that involved in financial irregularities1.When the financial statement can no longer portray a true picture of financialposition of business, the element of financial irregularities already exist and canbe connected with fraud.
On the other hand, prior studies highlight that the financial distressed firmswere likely to involve in the fraudulent activities (Liou 2008; Rosner, 2003; Spathis,2002). Fraudulent firms commit several violations such as breaching listingrequirement, asset misappropriation and litigation. There could be several possiblefactors that contributed to the existence of fraudulent firms and these factors couldbe financial or non-financial. As for financial factors, the fraudulent firms maysuffered financial difficulties like financial distress or high default risk. Besides
I J A B E R, Vol. 13, No. 1, (2015): 161-175
162 � Noor Azira Sawal, Nor Balkish Zakaria and Norhidayah Abdullah
that, fraudulent firmsalso suffered non-financial problems such as poor corporategovernance, weak internal control or less ethical business conduct (Law, 2011).
PN 17 classification highlights the business misconducts by Malaysian listedfirm such as firms with capital inadequacy, suffers an adverse or disclaimer opinionon the latest audited financial statements, the auditors have expressed an emphasisof matter of the ability of the firm to continue as a going concern, business hasceased its operation and etc.Nevertheless, there were scarce findings that relatethe financial difficulties of PN 17 firms to its worthiness. Common prior studiesserved evidences on the earnings quality of PN 17, initial public offering, valuerelevance and other ethical behaviour.
Thus, this study aims to investigate the effect of financial difficulties on firm’sworthiness among these PN 17 firms. The fraudulent firms were identified basedon Bursa Malaysia media released and categorised as PN17with the exclusion ofany firms charged with financial litigations or under financial distressed positionsince the financial difficultyaspects that will be examined in this study are basedon default risk and financial distress. This study hence expects to see the extent offinancial difficulties that may affect the firms’ performance among identifiedfraudulent firms in Malaysia from 2001 to 2012.
The remainder of this paper will be followed by a prior studies review sectionwith developed hypotheses. This is then followed by methodology section thatexplain the research methods that have been carried out in this study and this nextsection is the finding and discussion section. Finally a summary section concludethe whole study.
2. LITERATURE REVIEW AND HYPOTHESIS DEVELOPMENT
According to Elliot and Willingham (1980) the management fraud can be describedas deliberate actions by management through misleading financial statements thatimpairs investors and creditors. According to Crawford and Weirich (2011) fraudcan be categorized into two categories namely; financial reporting fraud and assetmisappropriation. Financial reporting fraud is known as management fraud arisesfrom misstatements with intention, amounts omitted and financial statementsdisclosures while assetmisappropriation involves the theft of an entity’sassets.Fraudulent firms are those firms involved in various types of fraudulentactivities such as financial reporting fraud, misappropriation of assets and couldalso be the one that involved with litigation, fraud guilty and alleged misconduct(Crawford & Weirich, 2011). According to Martin and Cullen (2006) firms that areinvolved in corporate misconduct adopts a ‘bad barrels’ or perspectives of howorganizational behavior and cultures adapt with unethical behavior. Firms shouldcompete and cooperate with other firms that could influence their behavior andnorms.

Financial Difficulties and Performance among Fraudulent Firms... � 163
In Malaysia, Securities Commission (SC) is a statutory body with enforcementand investigation powers to protect the investors. Any listed firms that committedwith any fraudulent activities will be penalized by Securities Commission.Mohamed Sadique, Roudaki, Clark and Alias (2010) examine the fraud cases asreported by the Malaysian Securities Commission in 2007 and found thataccounting and auditing offences were higher than the other offences comparedto the previous years2. In this study, the fraud firms will be known as fraudulentfirms as these firms commit both fraudulent financial reporting and other allegedmisconduct like misappropriation of assets, involved with litigation and fraudguilty. Generally, the financial needs and problems could affect the sustainabilityof the firm. Successful firm will understand, anticipate, and mostly avoid financialproblems or financial difficulties because it may severely result in insolvency. Ofek(1993) finds that financial difficulties may result in default debts payments,modified terms and structure of debt in financing the operation of business andthe worst part, bankruptcy filings or financial distress.Thus, the effects of financialdifficulties are severe and will impair the performance of firms.
2.1. Default Risk
A common proxy for financial difficulties is default risk. According to Vassalouand Xing (2004) a firm is said as default when it fails to service its debt obligation.Therefore, the default risk is the risk that firms unable to make the required paymenton their debt obligation. Another key factor in determining default risk is a firm’sleverage.Chow and Rice (1982) suggest that leverage increases when the potentialfor wealth transfer from debt holders to managers increases. However, Pearson(1995) poses an open question whether high debt could be associated withfraudulent financial statements since high structure of debt may increase thelikelihood of fraudulent financial statements.Higher debt may expose the borrowera higher default risk. Creditors may also fear of the same risk and debt covenantsare one of their protections to ensure the debt repayment obligation meets itsschedule. However, management may manipulate financial statements, given theneed to meet certain debt covenants (Spathis, 2002). DeFond and Park (1997)highlighted in their studies that the higher leveraged company lead to greater therisk on defaulting the debt agreements. The finding is consistent with the studyby Zeitun, Tian and Keen (2007) which highlight that firm with higher leveragewould have higher probability of default3. Therefore, high leverage may lead tohigh default risk.
Meanwhile, the default risk is connected with financial leverage. Higherfinancial leverage will decrease firm value due to increasing bankruptcy risk.Pioneering in the Theory of Agency Cost, Jensen and Meckling (1976) alsodemonstrate that by constraining or encouraging managers to act more in theinterest of shareholders, the amount of leverage in a ûrm’s capital structure affects

164 � Noor Azira Sawal, Nor Balkish Zakaria and Norhidayah Abdullah
the agency conflicts between managers and shareholders. Higher financial leveragewill decrease firm value by increasing bankruptcy risk. Therefore, to enhance themarket value of the firm, every firm has to have a sound optimal capital structure.Chiang, Chang and Hui (2002) have used sample of construction firms in HongKong and investigate the relationship between capital structure and firm’sperformance. Their finding shows that high gearing negatively related with firmperformance. The study shows that high gearing negatively related with firmperformance among construction firms. Previous studies such as Foong and Razak(2012) and Whiting and Gilkison (2000) also have highlight that financial leveragehas negative effect on the firm’s performance.However, the findings of the studytowards firms in Pakistan conducted by Rasool,Asif, Kayani and Zafar (2011)contradicted the above studies4. This studystates that larger firms have highertarget debt levels and stable cash flows. These stable cash flows lead to lessendown the bankruptcy chances as well as the costs of default risk.This is supportedby the findings of Gill and Obradovich (2012) who examine the relationshipbetween financial leverage and firm’s performance among American firms. Theirfinding shows that financial leverage has positive impact the firm’s performance5.
2.2. Financial Distress
Another common proxy for financial difficulties is financial distress. Rosner (2003)agrees financial distressed firms also tend to engage in fraudulent financialreporting to disguise their financial condition6. According to Kahl (2002), financialdistress is an imperfect indicator of economy sustainability due to creditors are incontrol and may liquidate the firm against the will of management after a firm’sdefault. There are many techniques and models to predict financial distress. Oneof the techniquesis known as Analytical Procedure (AP). Thornhill (1995) positAPs to be a useful tool for identifying fraud. AP was referred to a variety oftechniques the auditors use to assess the risk of material misstatements in financialrecords. Besides, analysis of trends, ratios, and reasonableness tests derived froman entity’s financial and operating data were also involve in AP procedures(Kaminski, Wetzel & Guan, 2004). Meanwhile, Hill, Perry and Andes (1988) useevent history analysis from 1977 to 1987. Their study compares the magnitude ofcoefficient across the dependent variables (stable and financial distress). They findthat when leverage increases, the likelihood of financial distress or bankruptcyalso increases.According to Altman (1968) the model consists of five ratios selectedto be the Z score model variables and highlights that Z-score below 1.10 indicatesa distress condition7.
The performance of the fraudulent firm is essential and important to be knownsince if a firm suffers financial difficulties,firms might embrace loss of reputationand the worst part losing the shareholders and potential investors’ confidence.The fraud revelation may negatively affect the performance of the fraudulent firms

Financial Difficulties and Performance among Fraudulent Firms... � 165
(Tan, 1999). Consequently, the share price of the firm may experience a contractionand become volatile particularly in the short run. Prior literature, Tan (1999) usesa sample of 277 firms from eight East Asian countries during the Asian FinancialCrisis from 1997 to 1998 to study the relationship between financial distress andfirm’s performance. The result shows that financial distress is negatively relatedto firm’s performance8. The study by Smith and Graves (2005) which takes 183distressed companies (exhibited negative Z score) from London Stock Exchangefor the period of 1980 to 1990 shows that there is negative relationship betweenfinancial distress and firm’s performance. Chan, Munusamy, Chelliah and Mandari(2011) study the performance of Malaysian companies after suffering from afinancial distress condition and the finding reveals that the distress conditioncompanies for second time affect firm’s performance negatively9.Abidali and Harris(1995) take 11 failed and 20 non-failed companies and used a modiûed Z-score topredict the failure. Their results indicate that all the failed companies have exhibitednegative Z-scores for several years before failure. The more years the company isclassed as at risk, the lower the Z-score for the company and the more likely thecompany will fail. Thus, they conclude that the Z-score can be used to rank thesolvency of the company.
Thus, this study aims to examinethe effect of financial difficulties on firmperformance among the fraudulent firms. The research questions are: 1) Does thedefault risk affect the firm performance among the fraudulent firms? And 2) Doesthe financial distress position affect the performance among the fraudulent firms?Default risk and financial distress position are the proxies of financial difficulties.Using these proxies, it is hypothesized that the default risk and financial distressposition will give negative relationship with firm performance. Thus, the followinghypotheses are predicted:
H1: There is significant negative effect between the default risk and firmperformance among fraudulent firms.
H2: There is significant negative effect between the financial distress positionand firm performance among fraudulent firms.
3. METHODOLOGY
3.1. Population and Sample
This study examines 175 fraudulent firms in Malaysia whichcategorized underthe PN17 Listing from year 2001 to 2012. The offences committed by thesecompanies have been segregated into three (3) major offences namely financialreporting fraud, asset misappropriation and faced with litigation. Under PracticeNotes 17 of Bursa Malaysia Listing Requirements which relates to the businessoperations of listed firms, it is clear that any listed firm that trigger the criteria ofthe Practice Notes will fall under the category of PN17 Companies10. In addition,

166 � Noor Azira Sawal, Nor Balkish Zakaria and Norhidayah Abdullah
Securities Commission has taken intensive surveillance on these PN17 firms andrevealed the several misconducts and breaches by directors and management. Theenforcement activities are dealt with the perpetrators and actions are taken againstthe wrongdoers based on Securities Act 1993. Firm’s financial data was downloadedfrom Datastream database and each firm’s annual report respectively. Data ispooled and analyzed using SPSS.
3.2. Data Variables
This research will use debt to equity ratio as proxy for default risk. Zeitun, Tianand Keen (2007) measure and investigate the effect of firm’s default probability byusing total debt over total equity. This also consistent with the study by Foongand Idris (2012) which also use debt to equity ratio to measure leverage of 94 generalinsurance companies for the year 2006 to 2009 in Malaysia.The financial distresswill be measured by Altman Z-score. Z-score is a discrimination and predictionmodel developed by Edward Altman in 1968 to measure the distance to default ofmanufacturing companies (Al Zaabi, 2011). Altman (1968) and Beaver (1968) wereamong the pioneer researchers to use the analysis prediction on probability ofdefault among bank borrowers. Meanwhile, the firm’s performance will bemeasured by Tobin Q. Tobin (1969) has developed Tobin Q statistic that is widelyused as a proxy for the ûrm’s value from the perspective of investors and acts as aforward-looking measure of the ûrm’s economic performance (Wolfe &Sauaia,2003;Anderson, Fornell&Mazvancheryl (2004). The study further employs severalfirm level variables which are size of the firms proxied by total assets (Belkaoui &Pavlik, 1993; Abor, 2005), firm growth proxied by changes in sales (Summers &Sweeney, 1998) and leverage proxied by debt to total assets (Cuong&Canh, 2012;Berger & Bonaccorsi, 2006).
4. FINDINGS AND DISCUSSIONS
The regression analysisis employedfor Model (1) and Model (2). Model (1) usesdebt to equity ratio to measure default risk (DR) on the firm’s performance(TOBINQ) while Model (2) uses Altman Z Score (ZSCORE) as a measurement offinancial distress on firm’s performance (TOBINQ).
TOBINQit-1 = �0 + �1DRit-1+ �2SIZEit-1 + �3GRWit-1 + �4 LEVit-1 + e (1)
TOBINQit-1 = �0 + �1ZSCOREit-1+�2SIZEit-1 + �3GRWit-1 +��4LEVit-1+ e (2)
TOBINQ is the proxy of firm’s performance measured by market capitalizationover average total assets. DR is the proxy of default risk measured by total liabilitiesover shareholder’s equity. SIZE is the proxy of firm size measured by total assets.GRW is the proxy of firm growth measured by changes in sales. LEV is the proxyof leverage measured by total debts over total assets. The sample is represented byN=175.

Financial Difficulties and Performance among Fraudulent Firms... � 167
Table 4.1Panel A: Descriptive statistics
N Minimum Maximum Mean Std. Deviation Skewness Kurtosis
TOBINQ 175 .00 2.85 .5378 .56 1.87 1.57DR 175 -8.15 10.71 .1126 3.18 -1.72 1.55SIZE 175 .910 209.00 225.47 251.37 1.75 .178GRW 175 .00 552.00 296.83 114.84 1.156 .95LEV 175 .00 10.66 .55 1.72 1.81 .08
Table 4.1Panel B: Descriptive Statistics (Z Score)
Safe Grey Distressed
Z SCORE N 31 55 89(%) 17.71 31.42 57.14
ZSCORE is the proxy of financial distress measured by using Atman Z score model. The Zscore values are assigned to a dummy as follows: 1: Z > 2.6 represents the “Safe” zone; 2: 1.1 <Z < 2. 6 represent the “Grey” zone or 3: Z < 1.1 which represents the “Distressed” zone.
From Table 4.1 Panel A, the firm’s performance (TOBINQ) had minimum valueof 0.28 and 2.85 for the maximum value. The mean value is 0.54. The table alsohighlights that the standard deviation of 0.56.The mean and standard deviation isclose and there is no normality problem. The default risk (DR) is explained by themeasurement of debt to equity ratio. The minimum value for default risk (DR) is -8.15 and the maximum value is 10.71. The mean column indicates that the defaultrisk has a mean of 0.11 and the standard deviation is 3.18. This figure shows nonormality problem due to acceptable range of standard deviation. Skewness andKurtosis results shows no normality problem since figure is below 2.
According to Table 4.1 Panel B, there are 31 firms (17.71%) of total samplefirmsthat fall under category of Safe firms. In other words, even though thesefirms are fraudulent firms, they are still financially sound and safe. There are 55firms (31.42%) fell under the category of Grey which shown some extent of problemin their financial position and any further financial problem may lead to financialdistress. As highlight by Smith and Graves (2005) companies with a negative Zscore are financially distressed and in danger of failure, while those with a positiveZ score are classified as solvent. Nonetheless, 89 firms fell under the category ofDistressed firms which means that these firms are having financial difficulties.This represents that more than 50% (57.14%) of the sample firms were financiallydistress firms. In other word, these firms were unhealthy and close to insolvency.Therefore, from the results obtained, it can be concluded that more than half of thesample firms (57.14%) in this study were having financial difficulties prior yearbefore classified as PN17.
168 � Noor Azira Sawal, Nor Balkish Zakaria and Norhidayah Abdullah
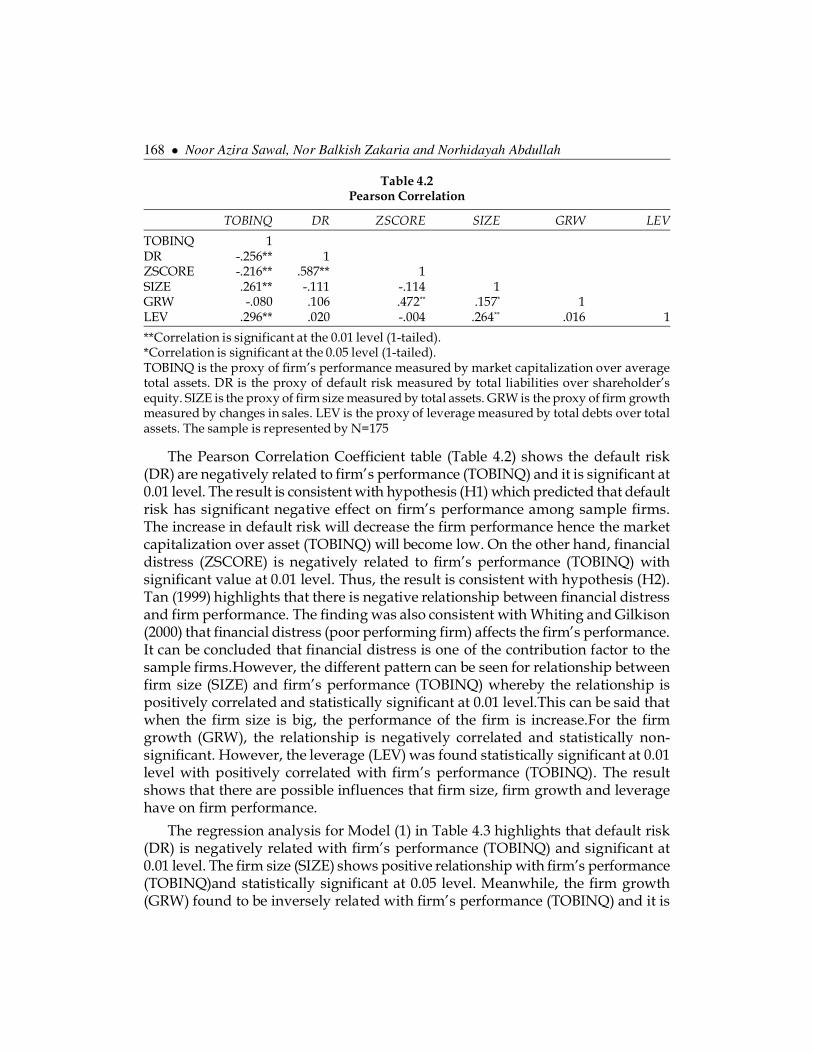
Table 4.2Pearson Correlation
TOBINQ DR ZSCORE SIZE GRW LEV
TOBINQ 1DR -.256** 1ZSCORE -.216** .587** 1SIZE .261** -.111 -.114 1GRW -.080 .106 .472** .157* 1LEV .296** .020 -.004 .264** .016 1
**Correlation is significant at the 0.01 level (1-tailed).*Correlation is significant at the 0.05 level (1-tailed).TOBINQ is the proxy of firm’s performance measured by market capitalization over averagetotal assets. DR is the proxy of default risk measured by total liabilities over shareholder’sequity. SIZE is the proxy of firm size measured by total assets. GRW is the proxy of firm growthmeasured by changes in sales. LEV is the proxy of leverage measured by total debts over totalassets. The sample is represented by N=175
The Pearson Correlation Coefficient table (Table 4.2) shows the default risk(DR) are negatively related to firm’s performance (TOBINQ) and it is significant at0.01 level. The result is consistent with hypothesis (H1) which predicted that defaultrisk has significant negative effect on firm’s performance among sample firms.The increase in default risk will decrease the firm performance hence the marketcapitalization over asset (TOBINQ) will become low. On the other hand, financialdistress (ZSCORE) is negatively related to firm’s performance (TOBINQ) withsignificant value at 0.01 level. Thus, the result is consistent with hypothesis (H2).Tan (1999) highlights that there is negative relationship between financial distressand firm performance. The finding was also consistent with Whiting and Gilkison(2000) that financial distress (poor performing firm) affects the firm’s performance.It can be concluded that financial distress is one of the contribution factor to thesample firms.However, the different pattern can be seen for relationship betweenfirm size (SIZE) and firm’s performance (TOBINQ) whereby the relationship ispositively correlated and statistically significant at 0.01 level.This can be said thatwhen the firm size is big, the performance of the firm is increase.For the firmgrowth (GRW), the relationship is negatively correlated and statistically non-significant. However, the leverage (LEV) was found statistically significant at 0.01level with positively correlated with firm’s performance (TOBINQ). The resultshows that there are possible influences that firm size, firm growth and leveragehave on firm performance.
The regression analysis for Model (1) in Table 4.3 highlights that default risk(DR) is negatively related with firm’s performance (TOBINQ) and significant at0.01 level. The firm size (SIZE) shows positive relationship with firm’s performance(TOBINQ)and statistically significant at 0.05 level. Meanwhile, the firm growth(GRW) found to be inversely related with firm’s performance (TOBINQ) and it is
Financial Difficulties and Performance among Fraudulent Firms... � 169
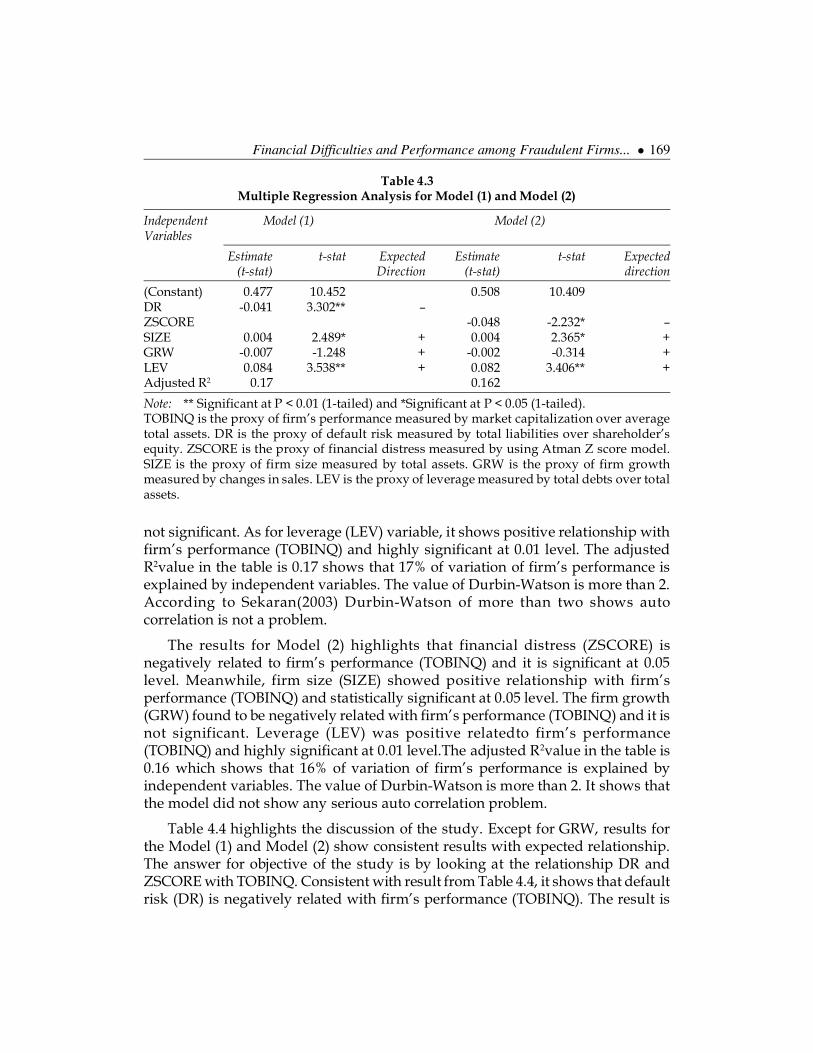
Table 4.3Multiple Regression Analysis for Model (1) and Model (2)
Independent Model (1) Model (2)Variables
Estimate t-stat Expected Estimate t-stat Expected(t-stat) Direction (t-stat) direction
(Constant) 0.477 10.452 0.508 10.409DR -0.041 3.302** –ZSCORE -0.048 -2.232* –SIZE 0.004 2.489* + 0.004 2.365* +GRW -0.007 -1.248 + -0.002 -0.314 +LEV 0.084 3.538** + 0.082 3.406** +Adjusted R2 0.17 0.162
Note: ** Significant at P < 0.01 (1-tailed) and *Significant at P < 0.05 (1-tailed).TOBINQ is the proxy of firm’s performance measured by market capitalization over averagetotal assets. DR is the proxy of default risk measured by total liabilities over shareholder’sequity. ZSCORE is the proxy of financial distress measured by using Atman Z score model.SIZE is the proxy of firm size measured by total assets. GRW is the proxy of firm growthmeasured by changes in sales. LEV is the proxy of leverage measured by total debts over totalassets.
not significant. As for leverage (LEV) variable, it shows positive relationship withfirm’s performance (TOBINQ) and highly significant at 0.01 level. The adjustedR2value in the table is 0.17 shows that 17% of variation of firm’s performance isexplained by independent variables. The value of Durbin-Watson is more than 2.According to Sekaran(2003) Durbin-Watson of more than two shows autocorrelation is not a problem.
The results for Model (2) highlights that financial distress (ZSCORE) isnegatively related to firm’s performance (TOBINQ) and it is significant at 0.05level. Meanwhile, firm size (SIZE) showed positive relationship with firm’sperformance (TOBINQ) and statistically significant at 0.05 level. The firm growth(GRW) found to be negatively related with firm’s performance (TOBINQ) and it isnot significant. Leverage (LEV) was positive relatedto firm’s performance(TOBINQ) and highly significant at 0.01 level.The adjusted R2value in the table is0.16 which shows that 16% of variation of firm’s performance is explained byindependent variables. The value of Durbin-Watson is more than 2. It shows thatthe model did not show any serious auto correlation problem.
Table 4.4 highlights the discussion of the study. Except for GRW, results forthe Model (1) and Model (2) show consistent results with expected relationship.The answer for objective of the study is by looking at the relationship DR andZSCORE with TOBINQ. Consistent with result from Table 4.4, it shows that defaultrisk (DR) is negatively related with firm’s performance (TOBINQ). The result is

170 � Noor Azira Sawal, Nor Balkish Zakaria and Norhidayah Abdullah
Table 4.4Findings for Model (1) and Model (2)
Model (1) Model (2)
Independent Expected Results Supported/ Expected Results Supported/Variables relationship (Significant Not relationship Not supported
level) supported
DR (H1) – –(**) SupportedZSCORE(H2) – –(*) SupportedSIZE + + (*) Supported + + (*) SupportedGRW + –(Not Not –(Not Not
significant) supported + significant) SupportedLEV + + (**) Supported + + (**) Supported
TOBINQ is the proxy of firm’s performance measured by market capitalization over averagetotal assets. DR is the proxy of default risk measured by total liabilities over shareholder’sequity. ZSCORE is the proxy of financial distress measured by using Atman Z score model.SIZE is the proxy of firm size measured by total assets. GRW is the proxy of firm growthmeasured by changes in sales. LEV is the proxy of leverage measured by total debts over totalassets. H1 represents hypothesis of Model 1 and H2 represents hypothesis of Model 2. The (-)and (+) represent negative relationship and positive relationship respectively. Significant valueof * and ** indicate value of 0.05 level and 0.01 level respectively.
consistent with hypothesis (H1) which predicted that default risk has significantnegative effect on firm’s performance among fraudulent firms. The result isconclusive since the relationship of default risk (DR) is statistically significant at0.01 level with firm’s performance (TOBINQ).It shows that high debt to equityratio (DR) will lead to low market capitalization over asset (TOBINQ). Some othersupportive results came from Hill, Perry and Andes (1988) that highlight whenleverage increase, the likelihood of bankruptcy increase as well. This is alsosupported by Cheng,Liu and Chien (2010) that when the firms incur highlyleverage, it generates to increasing considerable agency costs of outside debt andlead to higher expected costs of bankruptcy or liquidation.Ebaid (2009) also foundthat leverage in firm’s capital structure could alter management’s behavior andoperating decision. High leverage increase the probability of being default andtherefore it could affect firm’s performance. As for this study, the results showthat the default risk has significant negative effect on firm’s performance amongfraudulent firms. This implies that default risk of fraudulent firms could negativelyaffect the firm’s performance.
On the other hand, the result for relationship of financial distress (ZCORE)and firm performance (TOBINQ) also shows negative relationship with 0.01significant value. Thus, it is consistent with hypothesis (H2) which predicted thatfinancial distress position has significant negative effect on firm’s performanceamong fraudulent firms. According to Tan (1999) the fraud revelation maynegatively affect the performance of the fraudulent firms and the share price of
Financial Difficulties and Performance among Fraudulent Firms... � 171
the firm may experience a contraction and become volatile particularly in the shortrun. This further supported by study by Smith and Graves (2005) which showsthat there is negative relationship between financial distress and firm’sperformance. Chan, Munusamy, Chelliah and Mandari (2011) also reveal that thedistress condition companies for second time affect firm’s performance negatively.Moreover, Abidali and Harris (1995) indicate that the more years the company isclassed as at risk, the lower the Z-score for the company and the more likely thecompany will fail. Therefore this implies that financial distress position offraudulent firms could negatively affect the firm’s performance.
Table 4.4 also shows that firm size (SIZE) statistically significant positiverelationship with firm’s performance (TOBINQ) at 0.05 level. This was consistentwith the finding by Almajali,Alamro and Al-Soub (2012) which found that size andfinancial performance relationship is positive. Gill and Obradovich (2012) also findthat firm size and firm value has positive relationship. The firm growth (GRW) hasnegative relationship with firm performance (TOBINQ) and statistically non-significant. Cuong and Canh (2012) shows that growth has no significant effects onfirm performance and Lin (2010) also find that growth is not significantly related tofirm value.As for leverage (LEV), the relationship with firm’s performance (TOBINQ)is positive and statistically significant at 0.01 level. This is also consistent with Gilland Obradovich (2012) which also find that financial leverage has positively impactthe value of American manufacturing firms from 2009 to 2011. Moreover, Chengand Tzeng (2011) also find a positive relationship between leverage and firm value.
5. CONCLUSION
Financial fraud can usually be classified as either financial reporting fraud or assetmisappropriation (Crawford and Weirich, 2011). In this research, the fraud firmswill be known as fraudulent firms commit either fraudulent financial reporting,or other alleged misconducts like misappropriation of assets, involved withlitigation and fraud guilty.The financial difficulties or financial distress severelyresult in insolvency. Financial difficulties may result in default debts payments,modified terms and structure of debt in financing the operation of business andthe worst part, bankruptcy filings or financial distress. Financial distress may bedue to borrower speciûc factors like reputation, leverage, volatility of earnings,collateral or may also be due to market specific factors like the economic conditionand level of interest rates (Ehab, Rahim & Ananth, 2011).
The result of the study highlight that default risk was negatively related withfirm’s performance. The study is conclusive since the relationship of default riskwith firm’s performance is significant. The finding is consistent with Foong andIdris (2012) whereby they also obtained the finding of negative relationship betweenleverage and firm’s performance. The same pattern also showed by the financialdistress which is negatively related to firm’s performance. The study is again

172 � Noor Azira Sawal, Nor Balkish Zakaria and Norhidayah Abdullah
conclusive since the relationship of financial distress position with firm’sperformance is significant. The finding was consistent with Whiting and Gilkison(2000) that financial distress (poor performing firm) affects firm’s performance.Theresult of this study could pave way to any agency that monitors the misconductsamong listed firms as financial difficulties may give early signal to warn a companyof the possibility of severe fraud occurrence in the future.Besides, this study couldalso help in formulating the guidelines on how to mitigate the effect of fraud amongfirms that faced financial difficulties.In addition to this, the effect of financialdifficulties will give some extent of indicators to public on the tendency to commitfraud due to financial desperation. The performance of the fraudulent firms isvery essential to be known as this would help in recovery process of these firms.
AcknowledgementsAuthors would like to acknowledge supports from Accounting Research Institute of UniversitiTeknologi MARA.
Notes1. Transmile Group Berhad’s revenue has been overstated by a total of RM530 million in
2005 and 2006.
2. Sadique et al. (2010) reveal that among the violation of Bursa Malaysia listing requirementsreported by them were misleading of financial statements which contain material omissionand incorrect figure; and other disclosure including breach of trust, manipulation of shareprice and unauthorized fund collection.
3. Zeitun, Tian and Keen (2007) use sample of 167 Jordanian companies in 1989 to 2003.Theobjective of the study is to outline the relationship between firms’ financial health and theprobability of default by using LOGIT models. Total debt over total equity (TDTE) is usedto measure and investigate the effect of capital structure on the firm’s probability of default.
4. Rasool et al. (2011) study the relationship between the leverage levels, performance andprofitability of the 19 Pakistanis firms from 2004 to 2010. There are three sectors involved;commercial banking, cement and fertilizer sector starting. Arithmetic Mean (A.M) andstandard deviation (S.D) are used to check the trend of data.
5. Gill and Obradovich (2012) use sample of 333 firms listed on New York Exchange for 3years from 2009 to 2011.
6. Altman (1968) define financial distress ûrms as enterprises that have become legallyinsolvent or undergoing restructuring.
7. The function of Z-score is to address the prediction ability of corporate bankruptcy. Weightsare assigned to each variable. The 5 variables appeared in the original model were liquidity,profitability, leverage, solvency and activity.
8. The eight East Asian countries are Hong Kong, Indonesia, Malaysia, Philippines, Singapore,South Korea, Taiwan, and Thailand.
9. The duration of study covers two financial year periods and post to the date of reclassificationback into the normal listings as a listed company.
Financial Difficulties and Performance among Fraudulent Firms... � 173
10. Among the criteria are the firm failed to meet the minimum capital or equity of 25% or lesson consolidated basis and paid up capital less than RM40 million, the external auditorshave issued an adverse or disclaimer opinion on the latest audited financial statements,the auditors have expressed an emphasis of matter of the ability of the firm to continue asa going concern and the business has ceased its operation and etc.
ReferencesAlmajali, A. Y., Alamro , S. A., & Al-Soub , Y. Z. (2012), Factors affecting the financial performance
of Jordanian insurance companies listed at Amman Stock Exchange. Journal of ManagementResearch, 4(2), 266-289.
Abidali, A. F., & Harris, F. (1995), A methodology for predicting company failure in theconstruction company. Construction Management and Economic, 13(3), 189-196.
Abor, J. (2005), The effect of capital structure on profitability:an empirical analysis of listedfirms in Ghana. Journal of Risk Finance, 6(5), 438-445.
Al Zaabi, O. S. (2011), Potential for the application of emerging market Z-score in UAE Islamicsbanks. International Journal of Islamic and Middle Eastern Finance and Management, 4(2), 158-173.
Altman, E.I. (1968), Financcial ratios, discriminant analysis and the prediction of corporatebankruptcy. The Journal of Finance, 589-609.
Anderson, F. W., Fornell, C., & Mazvancheryl, S. K. (2004), Customer satisfaction and shareholdervalue. Journal of Marketing, 68, 172-185.
Beaver, W. H. (1968), Alternative accounting measures as predictors of failure. The AccountingReview, 43, 113-122.
Belkaoui, A., & Pavlik, E. (1993), Effects of ownership structure, firm performance, size anddiversification strategy on CEO compensation: A path analysis. Managerial Finance, 19(2),33-54.
Berger, A. N., & Bonaccorsi, D. E. (2006), Capital structure and firm performance :a new approachto testing ageny theory and application to banking industry. Journal of Banking & Finance,30(4), 1066-1102.
Chan, S. L., Munusamy, J., Chelliah, S., & Mandari, A. (2011). Effects of financial distressCondition on the Company Performance: A Malaysian Perspective. Review of Economics &Finance, 86-99.
Cheng, M. C., & Tzeng, Z. C. (2011), The effect of leverage on firm value and how the firmfinancial quality influence on this effect. World Journal of Management, 3(2), 30-53.
Cheng, Y.-S., Liu, Y.-P., & Chien, C.-Y. (2010), Capital structure and firm value in China: Apanel threshold regression analysis. African Journal of Business Management, 4(12), 2500-2507.
Chiang, Y. A., Chang, P. C., & Hui, C. M. (2002), Capital structure and profitability of theproperty and construction sectors in Hong Kong. Journal of Property Investment & Finance,20(6), 434-453.
Chow, C., & Rice, S. (1982), Quialified audit opinions and share prices : an investigation. Auditing:A Journal of Practice and Theory, 1, 35-53.

174 � Noor Azira Sawal, Nor Balkish Zakaria and Norhidayah Abdullah
Crawford, R. L., & Weirich, T. R. (2011), Fraud guidance for corporate counsel reviewing financialstatements and reports. Journal of Financial Crime, 18(4), 347-360.
Cuong, N. T., & Canh, N. T. (2012), The effect of capital structure on firm value for Vietnam’sseafood processing enterprise. International Research Journal of Finance and Economics(89),222-233.
Defond, M. L., & Park, C. W. (1997), Smoothing income in anticipation of future earnings.Journal of Accounting and Economics, 23(2), 115-39.
Ehab, Z., Rahim, B., & Ananth, R. (2011), Assessing probabilities of financial distress of banksin UAE. International Journal of Managerial Finance, 7(3), 304-320.
Ebaid, I. E. (2009), The impact of capital-structure choice on firm performance : empiricalevidence from Egypt. The Journal of Risk Finance, 10(5), 477-487.
Elliot, R. K., & Willingham, J. J. (1980), Management fraud: Detection and deterrence. Petrocelli.Foong, S. Y., & Idris, R. (2012), Leverage, product diversity and performance of general insurers
in Malaysia. The Journal of Risk Finance, 13(4), 347-361.
Gill, A., & Obradovich, J. (2012), The impact of corporate governance and financial leverage onthe value of Americans firms. International Research Journal of Finance and Economics, 91, 46-56.
Hill, N. T., Perry, S., & Andes, S. (1988), Evaluating firms in financial distress : An event historyanalysis. Journal of Applied Business Research, 12(3), 60-71.
Jensen, M. (1986), Agency cost of free cash flow, corporate finace and takeovers. AmericanEconomics Review (76), 323-329.
Kahl, M. (2002), Economic Distress, Financial Distress and Dynamic Liquidation. The Journal OfFinance, 18(1), 1-34.
Kaminski, K. A., Wetzel, T. S., & Guan, L. (2004), Can financial ratio detect fraudulent financialreporting. Managerial Auditing Journal, 19(1), 15-28.
Law, P. (2011), Corporate govrnance and no fraud occurance in organizations. ManagerialAuditing Journal, 26(6), 501-518.
Lin, F.-L. (2010), A panel threshold model of institutional ownership and firm value in Taiwan.International Research Journal of Finance and Economics(42), 54-62.
Martin, K. D., & Cullen, J. B. (2006), Continuities and extensions of ethical climate theory : Ameta-analytical review. Journal of Business Ethics, 69, 175-194.
Mohamed Sadique, R. B., Roudaki, J., Clark, M. B., & Alias, N. (2010), Corporate fraud : Ananalysis of Malaysian. World Academy of Science, Engineering and Technology, 42, 1199-1208.
Ofek, E. (1993), Capital Structure and Firm Response to Poor Performance: An EmpiricalAnalysis. Journal of Financial Economics, 34(1), 3-30.
Pearson, O. (1995), Using financial statement data to identify factors associated with fraudulentfinancial reporting. Journal of Applied Business Research, 11(3), 38-46.
PN17 Practise Note 17.Criteria and Obligations of PN17 Issuers (2005), Retrieved from BursaMalaysia www.bursamalaysia.com.
Rassol, W., Asif, A., Kayani, F., & Zafar, M. (2011), The impact of leverage levels on firm’sperformance and profitability : a case of Pakistani industries. Information Management andBusiness Review, 3(5), 242-249.
Financial Difficulties and Performance among Fraudulent Firms... � 175
Rosner, R. L. (2003), Earning management in failing firms. Contemporary Accounting Research,20(2), 361-408.
Sekaran, U. (2003), Research methods for business: A skill building approach (4th ed.). New York.:John Wiley & Son, Inc.
Smith, M., & Graves, C. (2005), Corporate turnaround and financial distress. Managerial AuditingJournal, 20(3), 304-320.
Spathis, C. T. (2002), Detecting false financial statements using published data: some evidencefrom Greece. Managerial Auditing Journal, 17(4), 179-191.
Summers, S. L., & Sweeney, J. T. (1998), Fraudulently misstated financial statements and insidertrading: an empirical analysis. The Accounting Review, 73(1), 131-146.
Tan, T. K. (1999), Financial distress and firm performance : Evidence from the Asian financialcrisis. Journal of Finance and Accountancy, 1-11.
Thornhill, W. T. (1995), How to investigate financial fraud. Forensic Accounting.
Tobin, J. (1969),A general equilibrium approach to monetary theory. Journal of Money, Creditand Banking, 1(1), 15-29.
Vassalao, M., & Xing, Y. (2004), Default Risk in Equity Returns. The Journal Of Finance, 16(2),831-867.
Whiting, R. H., & Gilkison, S. J. (2000). Financial leverage and firm response to poor performance.Pacific Accounting Review, 12(2), 1-35.
Wolfe, J., & Sauaia, A. (2003), The Tobin Q as a company performance indicator. Development inBusiness Simulation and Experiental Learning, 30, 155-159.
Zeitun , R., Tian , G., & Keen, K. (2007), Default probability for the Jordanian companies: a testof cash flow theory. International Research Journal of Finance and Economics,, 8, 147-162.

Related Documents


