1 Financial Development, Political Connection, and Bank Profitability: Evidence from the Financial Crisis of 2008 Huis-I Ting * * Associate Professor, Department of Money and Banking, College of Finance and Banking, National Kaohsiung First University of Science and Technology ABSTRACT This paper investigates the effects of financial development and political connections on bank profitability during the financial crisis of 2008. Findings show that banks located in developed countries suffered more negative abnormal returns around the crisis period, and the size of a banking sector improves bank profitability and asset quality, which strengthen the role of banking sector development. Supporting the view of external capital dependence, financial liberalization is found to be negatively associated with bank profitability and asset quality. Banks with weakened political connections highlight the positive effect of financial development improvement. The negative effect of external capital dependence is minor for banks with consolidated political connections. Keywords: Financial development; Political connections; Financial crisis; Bank profitability; Asset quality 1. Introduction Previous empirical studies have documented the existence of a strong positive link between the functioning of a financial system and various aspects of economic activity such as investment, employment, and economic growth (Al-Yousif, 2002; Demirgüç-Kunt and Detragiache, 1999; King and Levine, 1993; Levine, 2003, 2005; Rajan and Zingales, 1998). 1 Several recent studies not only prove the Granger causality running from financial development to economic growth (Bojanic, 2012), but also suggest that financial development facilitates the efficient allocation of resources (Bena and Ondko, 2012), contributes to the effectiveness of R&D investment (Chowdhury and Maung, 2012) and an increase in the benefits of foreign direct investment in South Asia (Anwar and Cooray, 2012), and reduces corruption in developed and developing 1 Levine (2005) suggest that financial development involves improvements in the (i) production of ex ante information about possible investments, (ii) monitoring of investments and implementation of corporate governance, (iii) trading, diversification, and management of risk, (iv) mobilization and pooling of savings, and (v) exchange of goods and services. Each of these financial functions may influence savings and investment decisions and hence economic growth.

Welcome message from author
This document is posted to help you gain knowledge. Please leave a comment to let me know what you think about it! Share it to your friends and learn new things together.
Transcript

1
Financial Development, Political Connection, and Bank Profitability: Evidence from the Financial Crisis of 2008
Huis-I Ting*
*Associate Professor, Department of Money and Banking, College of Finance and Banking, National Kaohsiung First University of Science
and Technology
ABSTRACT This paper investigates the effects of financial development and political connections on bank profitability during the financial crisis of 2008. Findings show that banks located in developed countries suffered more negative abnormal returns around the crisis period, and the size of a banking sector improves bank profitability and asset quality, which strengthen the role of banking sector development. Supporting the view of external capital dependence, financial liberalization is found to be negatively associated with bank profitability and asset quality. Banks with weakened political connections highlight the positive effect of financial development improvement. The negative effect of external capital dependence is minor for banks with consolidated political connections. Keywords: Financial development; Political connections; Financial crisis; Bank profitability; Asset quality
1. Introduction
Previous empirical studies have documented the existence of a strong positive link between the functioning of a financial system and various aspects of economic activity such as investment, employment, and economic growth (Al-Yousif, 2002; Demirgüç-Kunt and Detragiache, 1999; King and Levine, 1993; Levine, 2003, 2005; Rajan and Zingales, 1998).1 Several recent studies not only prove the Granger causality running from financial development to economic growth (Bojanic, 2012), but also suggest that financial development facilitates the efficient allocation of resources (Bena and Ondko, 2012), contributes to the effectiveness of R&D investment (Chowdhury and Maung, 2012) and an increase in the benefits of foreign direct investment in South Asia (Anwar and Cooray, 2012), and reduces corruption in developed and developing
1 Levine (2005) suggest that financial development involves improvements in the (i) production of ex ante information about possible investments, (ii) monitoring of investments and implementation of corporate governance, (iii) trading, diversification, and management of risk, (iv) mobilization and pooling of savings, and (v) exchange of goods and services. Each of these financial functions may influence savings and investment decisions and hence economic growth.

2
coutries (Altunbas and Thornton, 2012). The studies above support the notion that a well-developed financial
system can facilitate a country’s economic growth. Economic growth tends to stimulate the development of a banking sector - for example, the banking sector becomes more specilized and thus more cost-effective (Harrison et al., 1999). However, financial liberalization, widely considered critical in delivering a more efficient and competitive banking sector, has frequently been followed by financial instability, especially where institutions such as the rule-of-law and regulations are weak (Arestis and Demetriades, 1999; Demirgüç-Kunt and Detragiache, 1999; Kaminsky and Reinhart, 1999).
Under the ongoing process of financial market development, financial globalization, and with banks seeking to internationalize their operations, the global financial crisis of 2008 had an unprecedented negative impact on the global banking system. The subprime mortgage after-effect in the United States soon expanded to a global financial crisis due to the tight interconnectedness and complexity of financial markets in which an enormous number of CDOs were distributed and turned out to be toxic. However, China’s banking system recovered quickly from the crisis of 2008, and Liang (2012) illustrates the case given three factors: (i) capital-control policies limited China’s exposure to international capital and credit markets; (ii) its domestic banking is focused on traditional banking rather than securitization activities; and (iii) China’s market is dominated by state-owned banks that avail themselves of public trust. Can the financial development reflected in China’s banking system be applied to banking sectors all over the world? Does it matter for bank profitability whether a country’s financial system is more or less developed? The financial crisis of 2008 provides a good opportunity to critically review the impact of financial development on banking sectors throughout the world.
The credit freeze brought the global financial system to the brink of collapse, bringing immediate and dramatic responses from the U.S. Federal Reserve, the European Central Bank, and other central banks. During the last quarter of 2008, these central banks purchased US$2.5 trillion of government debt and troubled private assets from banks. This was the largest liquidity injection into the credit markets and the largest monetary policy action in world history. Governments bailed out a variety of firms, incurring large financial obligations. Political connections influence the allocation of capital through the mechanism of financial assistance when companies with connections confront economic distress (Faccio et al., 2006). Politics matters for financial development (Becerra
3
et al., 2012).2 Do political connections make a difference for bank profitability in the post-crisis period? If they do, does a bank benefit from political connections when the level of a country’s financial development is given?
A study closely related to this paper is Wu et al. (2007), however, important differences exist between their paper and mine. First, they examine the impact of financial development (measured by moneterization (M2/GDP), financial interrelations ratio, and the level of capitalization) on the operational performance of 14 commercial banks in China and conclude that a high level of moneterization improves bank performance (ROA). I look at the impact of financial development, political connections, and their interactions on bank profitability and asset quality during the global financial crisis of 2008, with a sample of 521 banks from 42 countries, including both developed and developing countries. Second, I use two comprehensive proxies to capture financial development for each country. One measures the overall size of the banking sector and the other measures financial liberalization. Finally, I use state ownership of a bank to consider political connections as a possible solution to improve bank profitability for a bank under a given financial sector development level.
This paper first examines the reactions of banks in response to the financial crisis of 2008. I investigate the economic shock among banks across the globe. The bankruptcy announcement by Lehman Brothers, which is widely accepted as the unfolding event of the global financial crisis, presents a significantly negative impact on the global banking industry. I find overall that banks have significantly negative abnormal returns of -0.37% to -0.72% during the five-day period (from t=-2 to t=2) around the announcement. Since the financial crisis was triggered by developed countries, banks from those countries suffered more severe negative impacts - for example, in developed countries the abnormal returns are -0.65% to -1.40% over the same five-day period, or almost twice lower than those in the overall countries.
Banks from developed countries have a slightly lower ROA (0.15% versus 0.69%) and slightly lower non-performing loan (NPL) ratio (5.01% versus 6.10%) than banks from developeing countries during the period of 2008 to 2009, but the differences are insignificant. Banks from 2 Becerra et al. (2012) argue that while financial development increases overall welfare in the long run, it also affects the distribution of rents in the short run. Incumbents may see their profit margins shrink, countries may face a higher probability of a negative shock, and governments may lose some of their sources of revenue. The combination of interest groups that try to safeguard their rents and governments that vie for political survival may prove lethal for financial development. They conclude that lower opposition to financial development leads to an effective increase in credit markets’ development only in those countries that have high government capabilities. Moreover, improvements in government capabilities have a significant impact on credit market development in those countries where credit dependency is high.
4
countries with a larger banking sector size and lower financial liberalization have positive cumulative abnormal returns (CARs). Banking sector size is positively, whereas financial liberalization is negatively, associated with bank asset quality. Financial liberalization reduces bank profitability as well.
In line with the arguments of King and Levine (1993), Rajan and Zingales (1998), and Levine (2005), the fact that banking sector size facilitates a sound banking industry supports the financial development improvement hypothesis. To augment the points of Arestis and Demetriades (1999) and Demirgüç-Kunt and Detragiache (1999), I find that the negative effect of financial liberalization on the banking sector is prominent during an unstable economic period, and it is not just under a weak institutional environment.
The positive effect of political connections on CARs turns negative from the pre- to post-announcement period. The negative effect for the post-announcement period is consistent with previous findings by La Porta et al. (2002) and Dinç (2005). State ownership is positively associated with profitability for banks from developed countries, but negatively associated with profitability and asset quality for banks from developing countries. In line with the points of Mian (2003) and Micco et al. (2007), the negative effect of political connections applies to banks located in developing countries.
I finally find interaction effects of financial development and political connections for banks in developed countries. Although a bank cannot determine its country’s financial development level, it can manipulate its political connections to offset the macroeconomic impact. For example, banks from countries with a small banking sector size or high financial liberalization should consolidate their political connections to improve profitability.
The remainder of the paper is organized as follows. Section 2 reviews the literature and develops the hypotheses. Section 3 describes the data sources, variables, and methodology. Section 4 estimates the abnormal returns and examines the effects of financial development and political connections on CARs, bank profitability, and asset quality. Section 5 concludes the paper.
2. Literature review and empirical hypotheses
2.1 Financial development improvement hypothesis The role of financial development on economic growth is
highlighted in the theories of financial structure. Better developed financial systems ease any external financing constraints facing firms, reflecting one mechanism through which financial development

5
influences economic growth (Levine, 2005). Financial development can enhance the benefits of foreign direct investment (Hermes and Lensink, 2003; Kose et al., 2009) and also plays an important role in influencing firm survival. When stock markets become larger or more liquid, firms’ survival chances improve (Tsoukas, 2011). Levine (2005) finds that both financial intermediaries and markets matter for growth. The financial system of a country affects saving and investment decisions, which are the major determinants of long-run economic growth (Anwar and Cooray, 2012). The financial sector provides real services, and its development not only helps to identify profitable business opportunities, but also improves corporate governance, risk management, and diversification (Levine, 2005; Roubini and Sala-i-Martin, 1992).
The credit contraction that came about hampered the global financial system and brought the banking sector to the brink of collapse during the crisis of 2008. Several major financial institutions, including Lehman Brothers, Merrill Lynch, HBOS, Fannie Mae, Freddie Mac, Washington Mutual, Wachovia, and AIG, collapsed, were bought out, or were bailed out by the government. Although banks can help to mobilize resources and reduce risk (Beck and Levine, 2004; Levine, 2002, 2005), whether the development of a country’s financial system helps bank profitability during a turmoil period remains an empirical question. This paper proposes the financial development improvement hypothesis and suggests that financial development, particularly the size of banking sectors, plays an important role in influencing bank profitability during a financial crisis. 2.2 External capital dependence hypothesis
Financial liberalization, by fostering financial development, can increase the long-run growth rate of an economy (King and Levine, 1993). At the international level, financial globalization contributes to a better allocation of financial resources, not only by channelling capital to its most productive uses, but also by allocating financial resources efficiently, thereby reducing a country’s vulnerability to economic, financial, and currency crises (Anwar and Cooray, 2012). However, Demirgüç-Kunt and Detragiache (1999) argue that financial liberalization has been somewhat clouded by the marked increase in financial fragility experienced by both industrial and developing countries in the 1980s and 1990s. For example, banking sector problems emerged shortly after Chile’s financial sector was deregulated in 1981. The benefits of financial liberalization may have to be weighed against the cost of increased financial fragility (Demirgüç-Kunt and Detragiache, 1999). In a panel of 53 countries for the period of 1980-1995, Demirgüç-Kunt and Detragiache (1999) find that banking crises are more likely to occur in liberalized financial systems. The effect of financial liberalization on the fragility of a banking

6
sector is weaker when the institutional environment is strong. The global financial crisis of 2008 was triggered by a liquidity
shortfall in the U.S. banking system and then damaged financial institutions gloablly. The effect of financial liberalization on banking sectors could become comprehensive during the crisis. Using data from 38 developed and developing countries that experienced financial crises for the period of 1980-2000, Kroszner et al. (2007) note that those sectors that are highly dependent on external finance tend to experience a substantially greater contraction of value added during a banking crisis in countries with deeper financial systems than in countries with shallower financial systems. Since an economy experiences a great contraction during a crisis, the need for capital need is extraordinarily essential. I propose the external capital dependence hypothesis and expect that the banking sector is more likely to be impaired when a country is highly dependent on external finance. 2.3 Political connections
There are two broad views of a government’s participation in financial markets, as summarized by La Porta et al. (2002): the development view versus the political view. The development view argues that state-owned banks are better at promoting economic development than private banks, because projects funded by state-owned banks may generate positive externalities, especially in strategic economic sectors. Public banks are less profitable, because they address market imperfections that would leave socially profitable but financially unprofitable investments underfinanced (Gerschenkron, 1962).
The political view argues that the main motivation for governments to control banks is to provide employment, subsidies, and other benefits to supporters, who return the favor in the form of votes, political contributions, and bribes.3 State-owned banks are inefficient, because they are captured by politicians only interested in maximizing their personal objectives (Dinç, 2005; La Porta et al., 2002).4 State ownership of banks allows the government to have extensive control over the choice of projects being financed, but the projects the government finances are likely to be inefficient and have an adverse effect on productivity growth (Xiao and Zhao, 2012). Cole (2009) also rejects the development view of state ownership of banks.5 He concludes that state ownership initially 3 For example, Faccio et al. (2006) find that politically connected firms are significantly more likely to be bailed out than similar non-connected firms. Politically connected firms are disproportionately more likely to be bailed out when the International Monetary Fund or the World Bank provides financial assistance to the firm’s home government. 4 Dinç (2005) provides evidence that politicians can reward their allies and punish their opponents by using their influence on state-owned banks. La Porta et al. (2002) document that government ownership of banks is associated with lower subsequent economic growth and argue that politicians use state-owned banks to further their own political goals. 5 Barth et al. (2000) provide empirical evidence that government ownership of banks is associated with

7
increases the quantity, and substantially lowers the quality, of financial intermediation.6 Many tests have been conducted on the negative impact of state ownership of banks on profitability, margins, and efficiency on samples of transition nations or emerging economies (Berger et al., 2009; Bonin et al., 2005; Drakos, 2003; Garcia-Herrero et al., 2009; Lin and Zhang, 2009; Mian, 2003; Micco et al., 2007).7
Various U.S. government agencies have committed or spent trillions of dollars in loans, asset purchases, guarantees, and direct spending during the financial crisis of 2008. Given the above opposing views, how state ownership affects bank profitability ultimately during a financial crisis remains an empirical issue. This paper uses state ownership of banks to examine the impact of political connections. Does state ownership of banks provide obligations and confidence to the public during a turmoil period when weaknesses in the global financial system have surfaced and trust in the whole financial system starts to fail? If this is true, then I expect a positive impact of state ownership on bank profitability in the post-crisis period.
3. Methodology
3.1 Data I obtain details of bank ownership, size, assets, and balance sheet
from the BankScope dataset, which provides bank-level annual financial information. The version of the dataset used in this paper covers 30,475 banks located in 190 countries over the period 2001-2009. Following previous studies (La Porta et al., 2002; Laeven and Levine, 2009; Micco et al., 2007), I collect information on the 10 largest banks (as defined by total assets at the end of 2007) in each country. If these banks represent
a low level of financial development. Beck and Levine (2002) also fail to find any positive effect of government ownership of banks on industry growth. 6 Cole (2009) suggests that state ownership does have a lasting effect on the sectoral allocation of credit, leading to increased lending to agriculture and rural areas. It also has a substantial effect on the price and quality of intermediation: markets with more state-owned banks have much higher delinquent loan rates and lower average interest rates. However, the development lending goals are met, but have no impact on the real economy. 7 Using data on over 1,600 banks in 100 emerging eocnomies, Mian (2003) compares bank performance among private domestic banks, foreign banks, and government banks. Since government banks have poor cash flow incentives and suffer from the moral hazard problem of the government being both the owner and the regulator, government banks perform uniformly poorly and only survive due to strong government support. Drakos (2003) analyzes the reform in transition banking and finds that banks’ net interest rate margins are affected by the ownership status, where state-owned banks typically set significantly narrower margins. Bonin et al. (2005) document that foreign-owned banks are more cost efficient, while state-owned banks are less efficient, in providing services in transition countries. Micco et al. (2007) suggest that state-owned banks located in developing countries tend to have lower profitability and higher costs than their private counterparts. Public banks from industrial countries have ceased to play a development role. Lin and Zhang (2009) observe that the “Big Four” state-owned commercial banks in China are less profitable and efficient and have worse asset quality than other types of banks.

8
less than 70% of total assets in the banking system, then I code all banks up to 70% of total assets in the banking system. I code all banks when the total number of banks from countries (Afghanistan, Anguilla, Barbados, Belize, Bhutan, Chad, Chile, Cuba, Gambia, Haiti, and Zimbabwe) in the database is less than ten. This process generates a sample of 1,669 banks from 190 countries.
The country-level financial development data are collected from the Financial Development Report (2008, 2009) published by the World Economic Forum. After merging the data from this report and BankScope and excluding the missing data, 521 banks from 42 countries remain. Macroeconomic variables (real GDP growth and inflation rate) are collected from World Bank. I winsorize the top and bottom 1% of each variable to exclude the effect of outliers. 3.2 Variables 3.2.1 Abnormal returns
I employ an event study methodology to estimate the abnormal returns of banks during the financial crisis of 2008. The event date is when Lehman Brothers filed for Chapter 11 bankruptcy protection, September 15, 2008. The filing marked the largest bankruptcy in U.S. history and is widely accepted to have played a major role in the unfolding of the global financial crisis. Following the method of Chandar et al. (2009), I exclude the first 120 days before the event from the estimation to prevent the parameters from being biased due to news leakages. The model is estimated for a 255-day period prior to t-120. Because the event date for all sample banks is the same day, the model is likely to exhibit cross-sectional dependence in the errors, which could result in the assumption that cross-section independence does not hold. Moreover, the variance of abnormal returns will rise and the power of observing abnormal returns will decrease.
This paper adopts the following seeming unrelated regression (SUR) proposed by Zellner (1962) to solve the problem:
4
1
,t
it i i mt i itt
R R D
(1)
where Rit is the stock return of bank i at time t, t = [t1, t4] ([t1, t2] is the estimation window, and [t3, t4] is the event window), Rmt is the market return of the country which bank i belongs to, Dτ is an event window dummy, Dτ = 1, if τ = [t3, t4]; otherwise Dτ = 0; and γiτ is the estimated parameter of Dτ, which represents the abnormal return of bank i at time τ.
I combine Equation (1) with the multi-factor model of Chandar et al. (2009) as:
9
4
1
( ) ( ) ( ) ,
it Localt
t
i i mt Localt i i Worldt USt i Emergt USt itt
R Rf
R Rf D R Rf R Rf
(2)
where RfLocalt is the daily return on the one-month local risk-free rate8 at time t, RWorldt is daily return on the MSCI World index in US dollars, RfUSt is the daily thirty-day US treasury rate, and REmergt is the daily return on the MSCI Emerging Market index in US dollars. 3.2.2 Bank profitability and asset quality
Previous studies use ROA (Garcia-Herrero et al., 2009; Micco et al., 2007), ROE (Goddard et al., 2004), or both (Vennet, 2002) as the bank profit proxy. However, I consider ROA more than ROE, as the capital adequacy ratio, which affects the level of bank equity, differs in countries (Schuser, 1984). This is particularly the case in a cross-country study. Many developing countries use fiscal incomes to support the banking system. Therefore, ROE may be overvalued, because the equity fund is relatively low. I refer to the method of Garcia-Herrero et al. (2009) and use the NPL ratio (problem loans over total loans) to measure bank asset quality. 3.2.3 Financial development
Previous studies use different proxies to capture financial development. The ratio of deposits (commercial banks plus saving banks) to GDP (Rajan and Zingales, 2003) and domestic credit from the private sector to GDP (Hassan et al., 2011; Rajan and Zingales, 2003; Tsoukas, 2011) are used as the measures of banking sector development. Private credit provided by the banking sector to GDP proxies the extent to which firms have opportunities to obtain bank finance (Altunbas and Thornton, 2012; Baltagi et al., 2009; Kroszner et al., 2007; Tsoukas, 2011). The ratio of broad money stock (M2) to GDP, which is often called the monetization variable, is used as a proxy for market size (Al-Yousif, 2002). An increase in the M2 to GDP ratio implies an expansion in the financial sector relative to the rest of the economy. Some other studies use financial sector liberalization to measure financial development. Rajan and Zingales (2003) take the sum of trade volume (includes exports and imports of goods) to GDP to measure openness. Baltagi et al. (2009) employ the financial globalization indicator (the volume of a country’s foreign assets and liabilities to GDP) constructed by Lane and Milesi-Ferretti (2006) to measure capital account openness.
This paper uses the Financial Development Index (FDI) from the Financial Development Report9 as the financial development proxy. The 8 If the one-month risk-free rate is missing, I adopt the risk-free rate that is closest to the one-month rate. 9 The weight regime and sub-pillars of the FDI are described in The Financial Development Report (2008) pp. 24-25 and 331-338 and The Financial Development Report (2009) pp. 25-27 and 351-359.

10
FDI is constructed by seven pillars for 55 countries: (1) Institutional environment, (2) Business environment, (3) Financial stability, (4) Banking financial services, (5) Non-banking financial services, (6) Financial market, and (7) Financial access. In line with the financial development literature, I use two aggregate indicators that proxy for financial development. The first proxy is extracted from one of the sub-pillars from the banking financial services - that is, the size index. The size index includes deposit money bank assets to GDP, central bank assets to GDP, financial system deposits to GDP, M2 to GDP, private credit to GDP, bank deposits to GDP, and money market instruments to GDP.10 The size index is a comprehensive proxy and includes the measures described in the above studies. I use this index to capture the banking sector’s overall size. A higher size index value indicates investors have confidence in the ability of the financial sector to channel funds into the most efficient projects. I use this index to examine the financial development improvement hypothesis.
Countries ease or lift bank interest rate ceilings and floors, lower compulsory reserve requirements and entry barriers, and allow deposits in foreign currency. Some countries actively encourage entry of foreign financial intermediaries. The second proxy is extracted from one of the sub-pillars of the first pillar (institutional environment) - that is, financial sector liberalization as the proxy. This index, which measures the degree of domestic financial sector liberalization within a country, is standardized as the size index to a 1 to 7 scale. It includes three items: capital account liberalization, commitments to the WTO agreement on
10 Each item of the size index except money market instruments is calculated using the deflation
method: 1
1
0.5_ _
_
t t
t t
t
t
F F
P e P eGDP
P a
, where F denotes the measure for each item - that is, deposit money
bank claims, central bank claims, demand and time and savings deposits, money and quasi-money, credit to the private sector, and demand and time and savings deposits, respectively; P_e is end-of-period CPI; P_a is average annual CPI. Money market instruments to GDP are total money market instruments (US$ billion) as a percentage of GDP; the figures are based on residence of the issuer. The size index is standardized to a 1 to 7 scale by the following formula:
6 1country score sample minimum
sample maximum sample minimun
, where the sample minimum and sample maximum are
respectively the lowest and highest country scores in the sample of countries covered by the FDI. A higher index value implies a larger size of banking financial services. The ratio of deposit money bank assets to GDP denotes the claims on the domestic real non-financial sector by deposit money banks as a share of GDP. The ratio of central bank assets to GDP denotes the claims on the domestic real non-financial sector by the central bank as a share of GDP. The ratio of financial system deposits to GDP denotes the demand, time, and savings deposits in deposit money banks and other financial institutions as a share of GDP. The ratio of private credit to GDP is the private credit by deposit money banks and other financial institutions as a percentage of GDP. Bank deposits to GDP show the demand, time, and savings deposits in deposit money banks as a share of GDP. Money market instruments to GDP show total money market instruments (US$ billions) as a percentage of GDP.
11
trade in services, and domestic financial sector liberalization.11 This measure provides a useful summary of a country’s financial openness. I use this measure to examine the external capital dependence hypothesis. Although the literature widely uses stock market capitalization to GDP (Baltagi et al., 2009; Tsoukas, 2011) to capture capital market development, it fluctuates excessively over time, reflecting excess volatility in stock prices (Baltagi et al., 2009). Therefore, this indicator is particularly not suitable in the sample period of a financial crisis. 3.2.4 Political connections
Countries have reduced government interference in credit allocation decisions by privatizing banks and insurance companies. Boubakri et al. (2008) define that a company is politically-connected if at least one of the directors or supervisory board members is or was a politician. They find that political connections are positively related to government residual ownership. They consider political connections as an indirect means of control, as opposed to direct control exerted by the government through residual ownership. Several studies in the banking related literature (Dinç, 2005; Micco et al., 2007) show significant political influence on state-owned banks. Therefore, I use state ownership as a proxy for political connection. 3.3 Methodology
I originally collect 934 banks located in 75 countries. The sample reduces to 266 banks from 54 countries after eliminating missing (or unobservable) data on the risk-free rate and market stock returns. The examination of banks’ abnormal returns is stagnant due to the large amount of data. Binder (1985) proposes a method to simplify the process that regards all observations at time t as a portfolio and computes the average returns of the portfolio. By replacing the subscript i by p in model (2), I estimate the model as follows:
4
1
( ) ( ) ( ) ,
pt Localt
t
p p mt Localt p p Worldt USt p Emergt USt ptt
R Rf
R Rf D R Rf R Rf
(3)
where γpτ shows the abnormal return of portfolio p at time τ. When I investigate the impacts of financial development and
political connections on bank abnormal returns during the financial crisis, I adopt the financial development measures from The Financial 11 Capital account liberalization measures specifically the level of capital controls based on information from the IMF’s Annual Report on Exchange Arrangements and Exchange Restrictions (AREAER) and is standardized on a scale from 1 to 7. The index of commitments to the WTO agreement on trade in services measures the extent of commitments to the WTO’s General Agreement on Trade in Services (GATS) within the financial services sector, standardized on a 1 to 7 (most liberalized) scale. The index of domestic financial sector liberalization is calculated on the basis of whether or not controls (ceilings and floors) on interest rates and credit exist, and whether or not deposits in foreign currency are allowed.

12
Development Report 2008 and other independent variables from year 2008 to match the abnormal return data of 2009, thus employing cross-sectional regression analyses. To examine the effects of financial development and political connections on bank profitability and asset quality during the post-crisis period, the financial development measures are from The Financial Development Report 2009 and other variables adopted in the cross-sectional regression are the values of the year 2009.
I employ the following ordinary least squares (OLS) model, considering the White (1980) heteroskedasticity standard error and covariance to cope with heteroskedasticity:
0 1 2
, ,
,
ij ij ij
ij ij ij
CAR ROA NPL
FD PC control variables
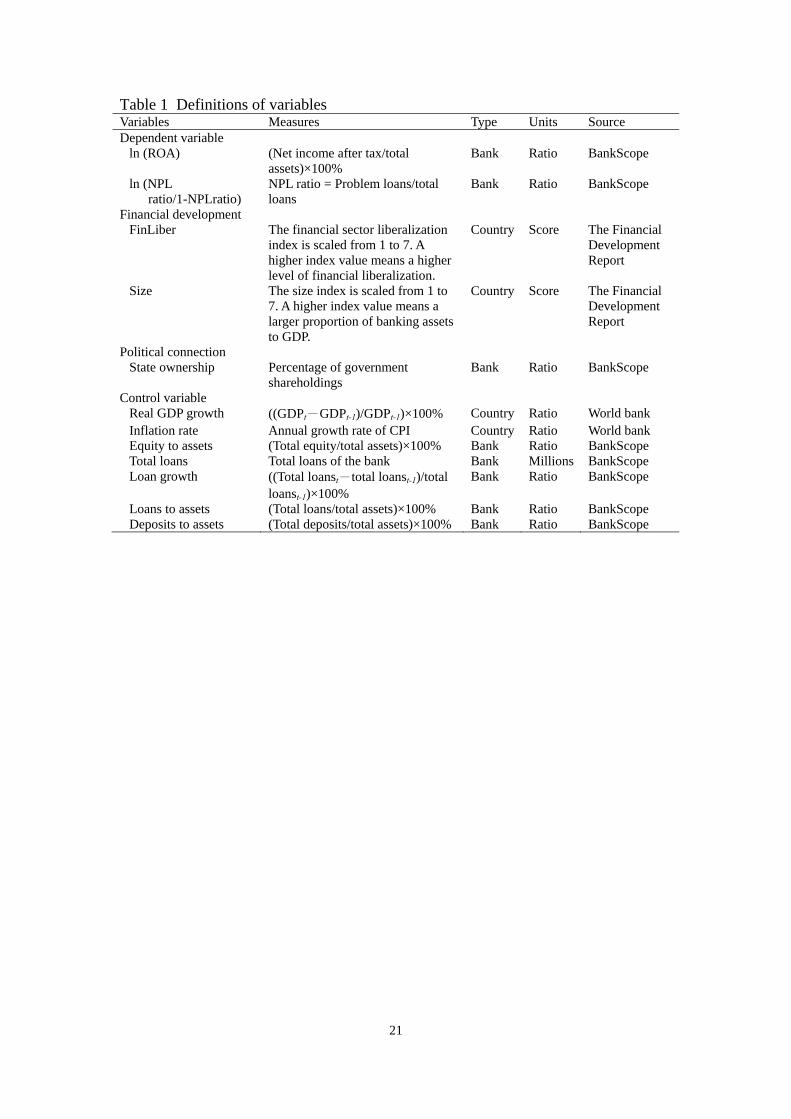
(4)where i denotes bank i and j denotes country j. Following Garcia-Herrero et al. (2009), I use ln (ROA) and ln (NPL ratio/1-NPL ratio) to estimate ROA and NPL regressions, respectively. The independent variables are financial development (FD) and political connections (PC). I rely on important prior contributions, such as Garcia-Herrero et al. (2009), for guidance on control variables. Macroeconomic and bank-specific variables that are known to influence bank profitability and asset quality are taken up as control variables. Macroeconomic variables include real GDP growth and the inflation rate, where GDP and inflation rate data are collected from the World Bank. Bank-specific control variables contain loan growth, deposits to assets, equity to assets, total loans, and loans to assets. Among the control variables, deposits to assets, equity to assets, total loans, and loans to assets are expressed in logarithmic form and loan growth and equity to assets are expressed with their lag values. Table 1 describes the variable definitions and data sources. PLACE TABLE 1 HERE
4. Empirical results
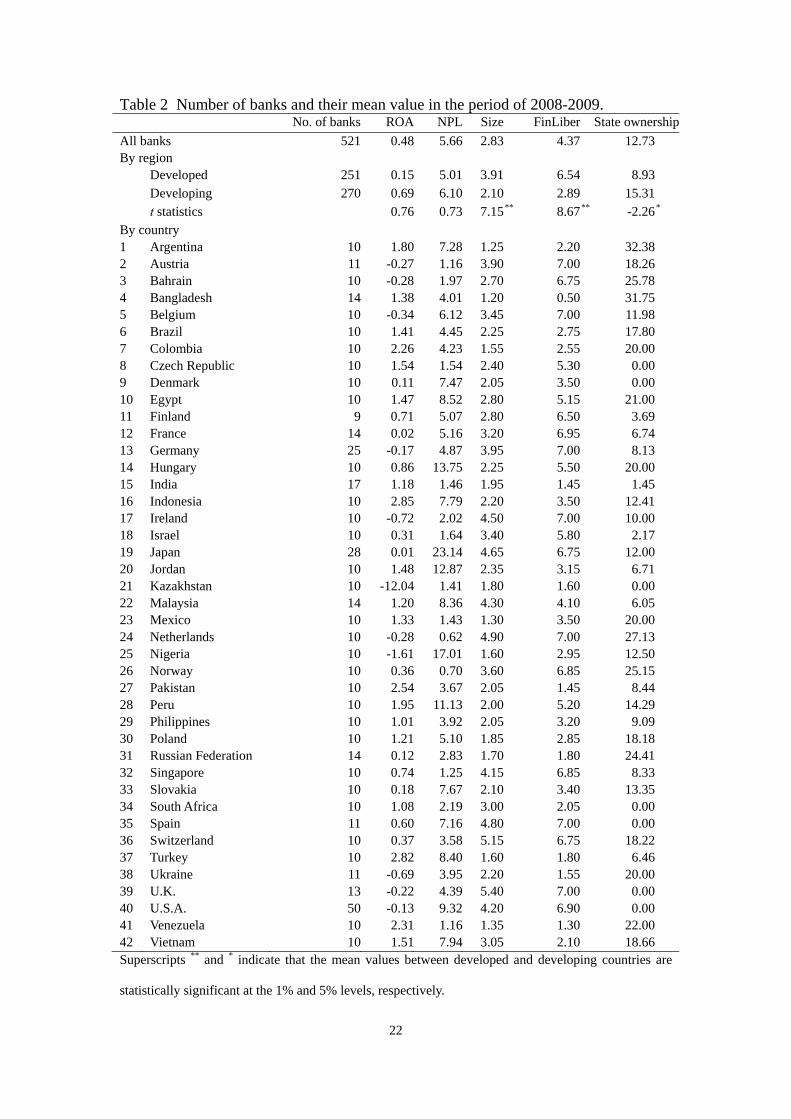
Table 2 presents the mean values of the main variables for the total sample of 521 banks. According to the classification of the International Monetary Fund (IMF, 2011), I categorize the sample into developed and developing countries (251 and 270 banks, respectively). The average ROA is 0.48% for the full sample, 0.15% for the banks from developed countries, and 0.69% for those from developing countries. Among the sample countries, the highest average ROA is in Indonesia at 2.85%, and the lowest is in Kazakhstan at -12.04%. The average NPL is 5.01% for banks from developed countries, 6.10% for those from developing countries, and 5.66% for the full sample. The highest NPL value is from the banks in Japan (23.14%) and the lowest value is from the banks in Netherlands (0.62%). The average banking sector size index (Size) is
13
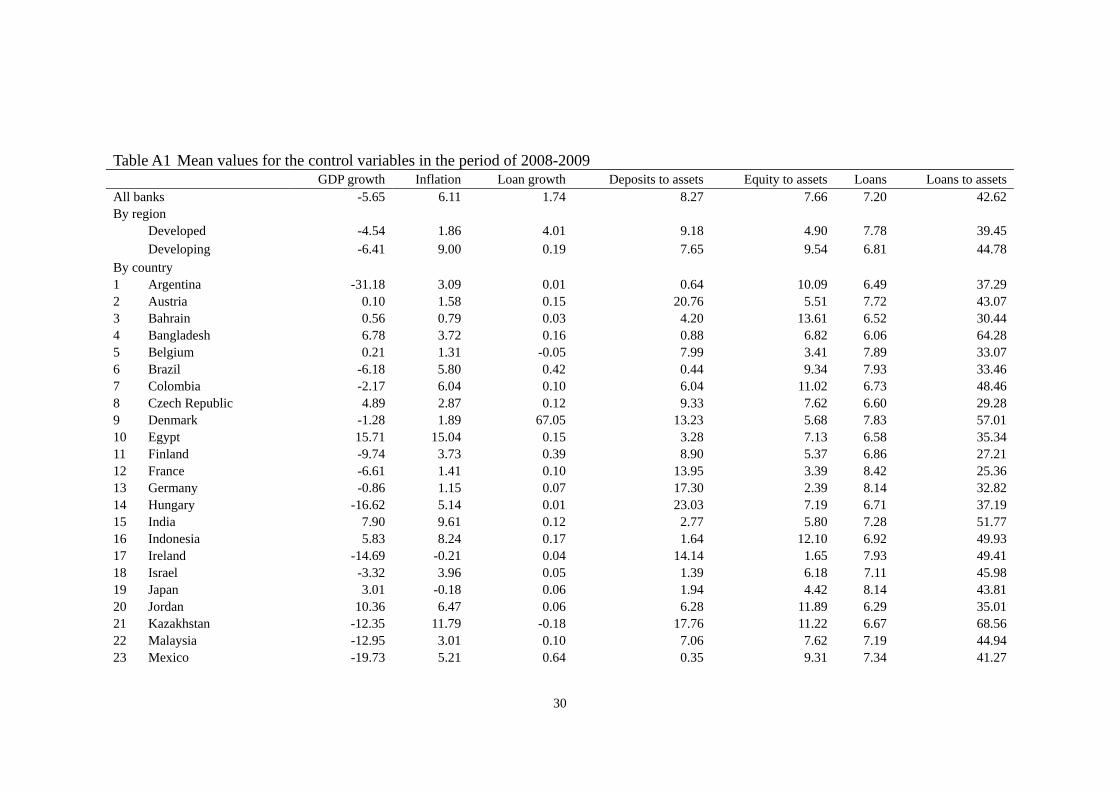
2.83 for the full sample. The largest banking sector size is in U.K. at 5.40. The mean value of the financial sector liberalization index (FinLiber) is 4.37 for all banks. The banking sector size (3.91 versus 2.10) and financial liberalization (6.54 versus 2.89) are significantly higher in developed countries than in developing countries (t = 7.15 and 8.67, respectively, both p < 0.01). Among the sample countries, the financial sector liberalization index of seven countries12 reaches the highest scale of 7. Bangladesh has the smallest banking sector size of 1.20 and the lowest financial sector liberalization of 0.5. The average state ownership is 12.73% for the full sample. State ownership is significantly lower for banks from developed countries than those from developing countries (8.93% versus 15.31%, t = -2.26, p < 0.05). Table A1 presents the mean values of control variables for the whole sample, by region, and by country. PLACE TABLE 2 HERE
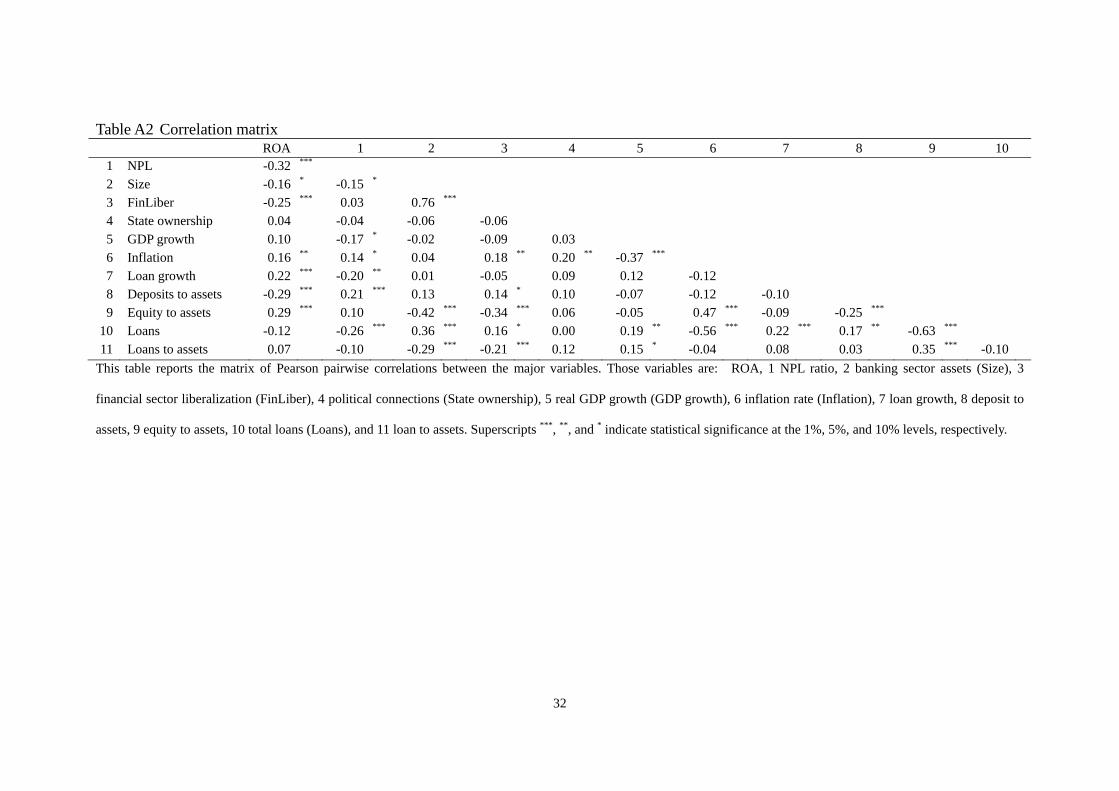
Table A2 presents the matrix of Pearson pairwise correlations between the major variables. Since banking sector assets and financial sector liberalization capture different aspects of financial development, their correlation coefficient of 0.76 is the highest absolute value in the correlation matrix. However, Studenmund (2006) indicates that when the absolute value of the correlation coefficient is higher than 0.8, it indicates a significant multicollinearity issue. Thus, multicollinearity among the regressors should not be a concern. 4.1 Abnormal returns
To investigate the announcement effect of the bankruptcy of Lehman Brothers, Table 3 presents the average abnormal returns of the portfolio estimated by SUR. To save space, this table only reports the coefficients of the event window dummies (Dτ, τ = -10 to 10), which examine whether the banks experience abnormal returns. The bankruptcy announcement of Lehman Brothers presents a significantly negative impact on the global banking industry. For the full sample of 266 banks, we note significantly negative abnormal returns of -0.37% to -0.72% from t=-2 to t=2.
I separate the sample into developed and developing countries and find that banks in developed countries suffer under a longer negative impact period. Banks from developed countries have significantly negative abnormal returns from t=-3 to t=2. Banks from developed countries have more negative abnormal returns than the full sample for five out of six days. However, banks from developing countries have significantly negative abnormal returns only at t=-1 and 3. PLACE TABLE 3 HERE 4.2 The effects of financial development and political connections on
12 Those countries are Austria, Belgium, Germany, Ireland, Netherlands, Spain, and U.K.
14
CARs To investigate whether the abnormal returns are affected by the
different levels of country-level financial development and bank-level political connections, I estimate the cross-sectional regression using CAR(-5, -1) and CAR(0, +2), respectively, as dependent variables. Table 4 presents the results of the model, including financial development, political connections, and both measures, respectively. PLACE TABLE 4 HERE
The size index shows a significantly positive effect and financial sector liberalization shows a significantly negative effect on CARs. When the overall banking sector size is large, investors have confidence in the ability of the financial sector to channel funds into the most efficient projects. Banks enjoy positive abnormal returns around the financial crisis, which is consistent with the financial development improvement hypothesis. A high level of a country’s financial openness increases the dependence on external capital, which is withdrawn quickly during a financial crisis. When the level of a country’s financial liberalization is high, banks suffer negative abnormal returns due to the contraction of capital. Consistent with the finding of Kroszner et al. (2007), the result supports the external capital dependence hypothesis. Political connections show opposite effects around the financial crisis: state ownership exhibits a positive effect on CAR(-5, -1), but a negative effect on CAR(0, +2). Political connections benefit banks’ abnormal returns before the announcement. However, banks with political connections that are expected to support the banking sector have lower abnormal returns after the announcement. 4.3 Bank profitability and asset quality
To investigate the effects of financial development and political connections on bank profitability and asset quality after the crisis, I estimate the regressions of ROA and NPL. Table 5 presents the result of cross-sectional regression using data from the year 2009. The size index shows a negative impact on NPL, indicating that banks from larger banking sector asset countries have better asset quality. The financial liberalization index shows a negative effect on ROA and a positive effect on NPL. A country’s financial openness reduces its bank profitability and asset quality in the post-crisis period.
Rajan and Zingales (2003) suggest that openness brings foreign competitors to domestic markets. Foreign entry drives down domestic profits, resulting in established firms having lower internal cash flow and making them more reliant on external finance. The result is similar to their argument. The effect of political connections is limited. Only a significantly positive coefficient on state ownership is found in the NPL model, indicating that banks with political connections have poor asset
15
quality. I will estimate the regression using subsamples to clarify the influence of political connections in the next section. PLACE TABLE 5 HERE
The degree to which financial development affects economic growth depends to a great extent on the quality of governance (Anwar and Cooray, 2012). In a robustness check, to control for government governance in each country, I augment the baseline regressions with the worldwide governance indicators constructed by Kaufmann et al. (2009). The indicator contains six dimensions of governance: voice and accountability, political stability and absence of violence/terrorism, government effectiveness, regulatory quality, rule of law, and control of corruption. The results of Tables 4 and 5 remain the same. I also eliminate deposits to assets and equity to assets from the ROA model and loan growth and total loans from the NPL model to exclude any possible multicollinearity among the control variables. The results also remain unchanged. 4.4 Political connections: developed and developing countries
Since public banks in developing countries still play a development role and their low profitability is due to the fact that they respond to a social mandate (Micco et al., 2007), developed and developing countries may have different coefficients on state ownership. I run separate regressions in Table 6 (Micco et al. (2007) also estimate separate regressions for industrial and developing countries) for those two groups of countries to clarify the influence of political connections. High state ownership for banks from developed countries tends to have higher bank profitability. Although Andrianova et al. (2008) suggest that state banks die a natural death when they are less efficient and no longer useful, the empirical result suggests that these banks likely increase depositors’ confidence in banking institutions, by preventing or curbing any default tendencies that are likely to be present in the aftermath of a crisis. High state ownership for banks from developing countries tends to have lower profitability and asset quality. The result may due to the fact that public banks in developing countries have a development mandate, whereas public banks in developed countries merely imitate the behavior of private banks (Micco et al., 2007). PLACE TABLE 6 HERE 4.5 Interactions of financial development and political connections
Barth et al. (2000) provide empirical evidence that state ownership of banks is associated with a low level of financial development. A country’s openness to trade and capital flows is also a matter of government policy (Rajan and Zingales, 2003). Thus, I consider the interaction effect of financial development and political connections. Since political connections show different impacts on banks from
16
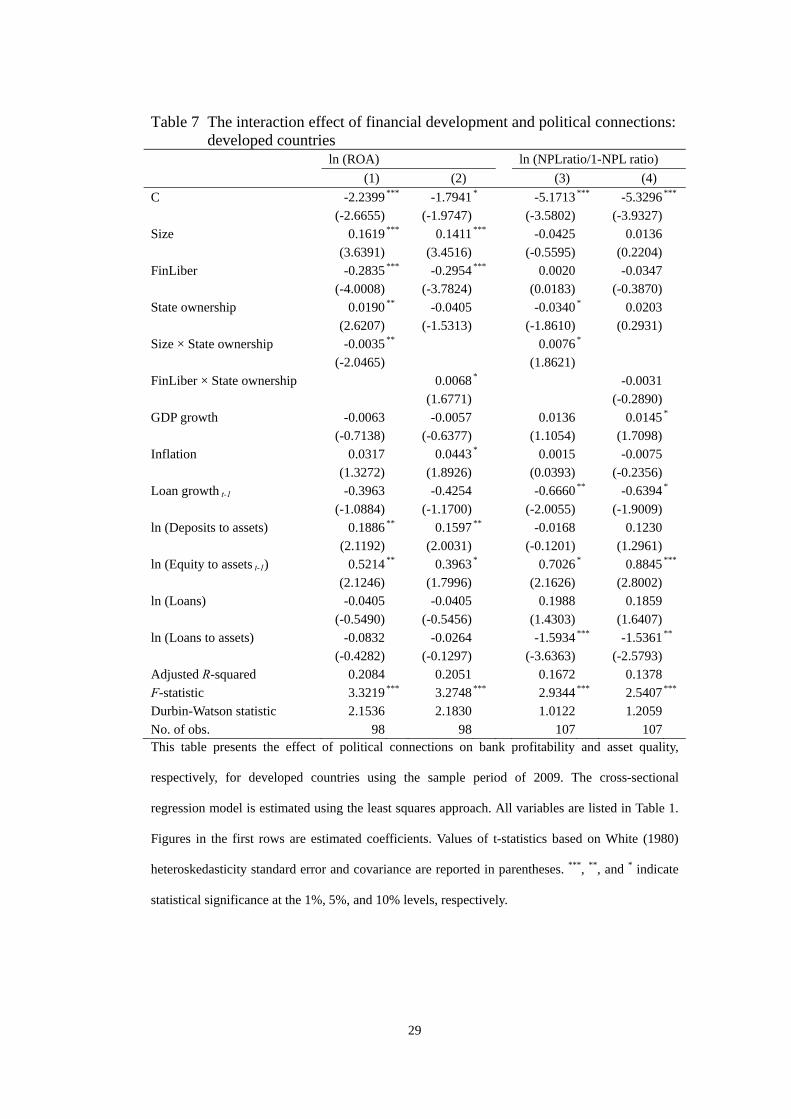
developed and developing countries, I run separate regressions including interaction terms for the two groups of countries. For banks in developing countries, I do not find a significant interaction effect of financial development and political connections on bank profitability or on asset quality.13 Table 7 presents the estimated results for banks in developed countries. PLACE TABLE 7 HERE
The interaction term of the size index and state ownership enters negatively in model (1) and positively in model (3). Better political connections are particularly positive for the profitability and asset quality of banks in developed countries having a small banking sector size. Put differently, high levels of political connections are less important for the profitability and asset quality of banks in developed countries with a large banking sector size. The interaction term of the financial liberalization index and state ownership is significantly positive in the ROA regression. Better political connections alleviate the negative effect of financial liberalization on the profitability of banks in developed countries. The positive effect of the size index and the negative effect of financial liberalization on bank profitability remain and still support the financial development improvement and external capital dependence hypotheses. Banks with few political connections emphasize the positive effect of financial development improvement. The negative impact of external capital dependence is less important for banks with better political connections.
5. Conclusions
Banks located in developed countries suffered more negative abnormal returns around the bankruptcy of Lehman Brothers than banks located in developing countries. I present that cumulative abnormal returns are associated with a larger banking sector size and lower financial liberalization. The main advantage of this research strategy herein is that it allows me to examine the impact of financial development on bank profitability and asset quality during the global financial crisis of 2008. The result echoes the three factors discussed in Liang (2012). The size of a banking sector improves bank profitability and asset quality, which strengthen the role of banking sector development. Financial sector liberalization reduces bank profitability and asset quality. This contributes to one of the main reasons of the global financial crisis of 2008 - that is, financial markets are tightly interconnected while many banks around the world held internationally traded toxic securities. The result is in line with the argument of Demirgüç-Kunt and Detragiache 13 The estimated results are available upon request.

17
(1999) in that financial liberalization should be approached cautiously whn the institutions necessary to ensure law and contract enforcement and effective prudential regulation and supervision are not fully developed, even if macroeconomic stabilization has been achieved.
Although a bank cannot control its country’s financial development level, banks in developed countries can build appropriate political connections to manipulate their country-level situations. For example, banks from countries with a small banking sector size or high financial liberalization should strengthen their political connections in order to boost bank profitability. However, this is not the case for banks in developing countries.
References
Al-Yousif, Y.K., 2002. Financial development and economic growth: Another look at the evidence from developing countries. Review of Financial Economics 11, 131-150.
Altunbas, Y., Thornton, J., 2012. Does financial development reduce corruption? Economics Letters 114, 221-223.
Andrianova, S., Demetriades, P., Shortland, A., 2008. Government ownership of banks, institutions, and financial development. Journal of Development Economics 85, 218-252.
Anwar, S., Cooray, A., 2012. Financial development, political rights, civil liberties and economic growth: Evidence from south asia. Economic Modelling 29, 974-981.
Arestis, P., Demetriades, P., 1999. Financial liberalization: The experience of developing countries. Eastern Economic Journal 25, 441-457.
Baltagi, B.H., Demetriades, P.O., Law, S.H., 2009. Financial development and openness: Evidence from panel data. Journal of Development Economics 89, 285-296.
Barth, J.R., Caprio, G., Levine, R., 2000. Banking systems around the globe: Do regulation and ownership affect the performance and stability? The World Bank.
Becerra, O., Cavallo, E., Scartascini, C., 2012. The politics of financial development: The role of interest groups and government capabilities. Journal of Banking and Finance 36, 626-643.
Beck, T., Levine, R., 2002. Industry growth and capital allocation: Does having a market- or bank-based system matter? Journal of Financial Economics 64, 147-180.
Beck, T., Levine, R., 2004. Stock markets, banks, and growth: Panel evidence. Journal of Banking and Finance 28, 423-442.
Bena, J., Ondko, P., 2012. Financial development and the allocation of

18
external finance. Journal of Empirical Finance 19, 1-25. Berger, A.N., Hasan, I., Zhou, M., 2009. Bank ownership and efficiency
in china: What will happen in the world's largest nation? Journal of Banking and Finance 33, 113-130.
Binder, J.J., 1985. On the use of the multivariate regression model in event studies. Journal of Accounting Research 23, 370-383.
Bojanic, A.N., 2012. The impact of financial development and trade on the economic growth of bolivia. Journal of Applied Economics 15, 51-70.
Bonin, J.P., Hasan, I., Wachtel, P., 2005. Bank performance, efficiency and ownership in transition countries. Journal of Banking and Finance 29, 31-53.
Boubakri, N., Cosset, J.-C., Saffar, W., 2008. Political connections of newly privatized firms. Journal of Corporate Finance 14, 654-673.
Chandar, N., Patro, D.K., Yezegel, A., 2009. Crises, contagion and cross-listings. Journal of Banking and Finance 33, 1709-1729.
Chowdhury, R.H., Maung, M., 2012. Financial market development and the effectiveness of r&d investment: Evidence from developed and emerging countries. Research in International Business and Finance 26, 258-272.
Cole, S., 2009. Financial development, bank ownership, and growth: Or, does quantity imply quality? Review of Economics and Statistics 91, 33-51.
Demirgüç-Kunt, A., Detragiache, E., 1999. Financial liberalization and financial fragility, World Bank Policy Research. The World Bank.
Dinç, I.S., 2005. Politicians and banks: Political influences on government-owned banks in emerging markets. Journal of Financial Economics 77, 453-479.
Drakos, K., 2003. Assessing the success of reform in transition banking 10 years later: An interest margins analysis. Journal of Policy Modeling 25, 309-317.
Faccio, M., Masulis, R.W., McConnell, J.J., 2006. Political connections and corporate bailouts. Journal of Finance 61, 2597-2635.
Garcia-Herrero, A., Gavila, S., Santabárbara, D., 2009. What explains the low profitability of chinese banks? Journal of Banking and Finance 33, 2080-2092.
Gerschenkron, A., 1962. Economic backwardness in historical perspective. Harvard University Press, Cambridge, MA.
Goddard, J., Molyneux, P., Wilson, J.O.S., 2004. The profitability of european banks: A cross-sectional and dynamic panel analysis. The Manchester School 72, 363-381.
Harrison, P., Sussman, O., Zeira, J., 1999. Finance and growth: Theory and new evidence. Board of Governors of the Federal Reserve
19
System (U.S.). Hassan, M.K., Sanchez, B., Yu, J.-S., 2011. Financial development and
economic growth: New evidence from panel data. Quarterly Review of Economics and Finance 51, 88-104.
Hermes, N., Lensink, R., 2003. Foreign direct investment, financial development and economic growth. Journal of Development Studies 40, 142-163.
IMF, 2011. World economic outlook. International Monetary Fund Paper 1-9.
Kaminsky, G.L., Reinhart, C.M., 1999. The twin crises: The causes of banking and balance-of-payments problems. American Economic Review 89, 473-500.
Kaufmann, D., Kraay, A., Mastruzzi, M., 2009. Governance matters viii: Aggregate and individual governance indicators, 1996-2008. SSRN eLibrary.
King, R.G., Levine, R., 1993. Finance and growth: Schumpeter might be right. Quarterly Journal of Economics 108, 717-737.
Kose, M.A., Prasad, E.S., Taylor, A.D., 2009. Thresholds in the process of international financial integration, National Bureau of Economic Research Working Paper Series.
Kroszner, R.S., Laeven, L., Klingebiel, D., 2007. Banking crises, financial dependence, and growth. Journal of Financial Economics 84, 187-228.
La Porta, R., Lopez-de-silanes, F., Shleifer, A., 2002. Government ownership of banks. Journal of Finance 57, 265-301.
Laeven, L., Levine, R., 2009. Bank governance, regulation and risk taking. Journal of Financial Economics 93, 259-275.
Lane, P.R., Milesi-Ferretti, G.M., 2006. The external wealth of nations mark ii: Revised and extended estimates of foreign assets and liabilities, 1970-2004, IMF Working Paper 06/69.
Levine, R., 2002. Bank-based or market-based financial systems: Which is better? Journal of Financial Intermediation 11, 398-428.
Levine, R., 2003. More on finance and growth: More finance more gorwth? Federal Reserve Bank of St. Louis Review 85, 31-46.
Levine, R., 2005. Finance and growth: Theory and evidence, in: Aghion, P., Durlauf, S. (Ed.), Handbook of economic growth. Elsevier Science, New York, pp. 865-934.
Liang, Y., 2012. Development finance: China's banking system in light of the global financial crisis. Chinese Economy 45, 8-27.
Lin, X., Zhang, Y., 2009. Bank ownership reform and bank performance in china. Journal of Banking and Finance 33, 20-29.
Mian, A., 2003. Foreign, private domestic, and government banks: New evidence from emerging markets, University of Chicago Working
20
Paper. Micco, A., Panizza, U., Yañez, M., 2007. Bank ownership and
performance. Does politics matter? Journal of Banking and Finance 31, 219-241.
Rajan, R.G., Zingales, L., 1998. Financial dependence and growth. American Economic Review 88, 559-586.
Rajan, R.G., Zingales, L., 2003. The great reversals: The politics of financial development in the twentieth century. Journal of Financial Economics 69, 5-50.
Roubini, N., Sala-i-Martin, X., 1992. Financial repression and economic growth. Journal of Development Economics 39, 5-30.
Schuser, L., 1984. Profitability and market share of banks. Journal of Bank Research 15, 56-61.
Studenmund, A.H., 2006. Using econometrics: A practical guide, 5th ed. The Financial Development Report, 2008. World Economic Forum, New
York. The Financial Development Report, 2009. World Economic Forum, New
York. Tsoukas, S., 2011. Firm survival and financial development: Evidence
from a panel of emerging asian economies. Journal of Banking and Finance 35, 1736-1752.
Vennet, R.V., 2002. Cost and profit efficiency of financial conglomerates and universal banks in europe. Journal of Money, Credit, and Banking 34, 254-282.
White, H., 1980. A heteroskedasticity-consistent covariance matrix estimator and a direct test for heteroskedasticity. Econometrica 48, 817-838.
Wu, H.-L., Chen, C.-H., Shiu, F.-Y., 2007. The impact of financial development and bank characteristics on the operational performance of commercial banks in the chinese transitional economy. Journal of Economic Studies 34, 401-414.
Xiao, S., Zhao, S., 2012. Financial development, government ownership of banks and firm innovation. Journal of International Money and Finance 31, 880-906.
Zellner, A., 1962. An efficient method of estimating seemingly unrelated regressions and tests for aggregation bias. Journal of the American Statistical Association 57, 348-368.
21
Table 1 Definitions of variables Variables Measures Type Units Source Dependent variable
ln (ROA) (Net income after tax/total assets)×100%
Bank Ratio BankScope
ln (NPL ratio/1-NPLratio)
NPL ratio = Problem loans/total loans
Bank Ratio BankScope
Financial development FinLiber The financial sector liberalization
index is scaled from 1 to 7. A higher index value means a higher level of financial liberalization.
Country Score The Financial Development Report
Size The size index is scaled from 1 to 7. A higher index value means a larger proportion of banking assets to GDP.
Country Score The Financial Development Report
Political connection State ownership Percentage of government
shareholdings Bank Ratio BankScope
Control variable Real GDP growth ((GDPt-GDPt-1)/GDPt-1)×100% Country Ratio World bank Inflation rate Annual growth rate of CPI Country Ratio World bank Equity to assets (Total equity/total assets)×100% Bank Ratio BankScope Total loans Total loans of the bank Bank Millions BankScope Loan growth ((Total loanst-total loanst-1)/total
loanst-1)×100% Bank Ratio BankScope
Loans to assets (Total loans/total assets)×100% Bank Ratio BankScope Deposits to assets (Total deposits/total assets)×100% Bank Ratio BankScope
22
Table 2 Number of banks and their mean value in the period of 2008-2009. No. of banks ROA NPL Size FinLiber State ownership
All banks 521 0.48 5.66 2.83 4.37 12.73By region
Developed 251 0.15 5.01 3.91 6.54 8.93
Developing 270 0.69 6.10 2.10 2.89 15.31
t statistics 0.76 0.73 7.15** 8.67** -2.26* By country 1 Argentina 10 1.80 7.28 1.25 2.20 32.382 Austria 11 -0.27 1.16 3.90 7.00 18.263 Bahrain 10 -0.28 1.97 2.70 6.75 25.784 Bangladesh 14 1.38 4.01 1.20 0.50 31.755 Belgium 10 -0.34 6.12 3.45 7.00 11.986 Brazil 10 1.41 4.45 2.25 2.75 17.807 Colombia 10 2.26 4.23 1.55 2.55 20.008 Czech Republic 10 1.54 1.54 2.40 5.30 0.009 Denmark 10 0.11 7.47 2.05 3.50 0.0010 Egypt 10 1.47 8.52 2.80 5.15 21.0011 Finland 9 0.71 5.07 2.80 6.50 3.6912 France 14 0.02 5.16 3.20 6.95 6.7413 Germany 25 -0.17 4.87 3.95 7.00 8.1314 Hungary 10 0.86 13.75 2.25 5.50 20.0015 India 17 1.18 1.46 1.95 1.45 1.4516 Indonesia 10 2.85 7.79 2.20 3.50 12.4117 Ireland 10 -0.72 2.02 4.50 7.00 10.0018 Israel 10 0.31 1.64 3.40 5.80 2.1719 Japan 28 0.01 23.14 4.65 6.75 12.0020 Jordan 10 1.48 12.87 2.35 3.15 6.7121 Kazakhstan 10 -12.04 1.41 1.80 1.60 0.0022 Malaysia 14 1.20 8.36 4.30 4.10 6.0523 Mexico 10 1.33 1.43 1.30 3.50 20.0024 Netherlands 10 -0.28 0.62 4.90 7.00 27.1325 Nigeria 10 -1.61 17.01 1.60 2.95 12.5026 Norway 10 0.36 0.70 3.60 6.85 25.1527 Pakistan 10 2.54 3.67 2.05 1.45 8.4428 Peru 10 1.95 11.13 2.00 5.20 14.2929 Philippines 10 1.01 3.92 2.05 3.20 9.0930 Poland 10 1.21 5.10 1.85 2.85 18.1831 Russian Federation 14 0.12 2.83 1.70 1.80 24.4132 Singapore 10 0.74 1.25 4.15 6.85 8.3333 Slovakia 10 0.18 7.67 2.10 3.40 13.3534 South Africa 10 1.08 2.19 3.00 2.05 0.0035 Spain 11 0.60 7.16 4.80 7.00 0.0036 Switzerland 10 0.37 3.58 5.15 6.75 18.2237 Turkey 10 2.82 8.40 1.60 1.80 6.4638 Ukraine 11 -0.69 3.95 2.20 1.55 20.0039 U.K. 13 -0.22 4.39 5.40 7.00 0.0040 U.S.A. 50 -0.13 9.32 4.20 6.90 0.0041 Venezuela 10 2.31 1.16 1.35 1.30 22.0042 Vietnam 10 1.51 7.94 3.05 2.10 18.66Superscripts ** and * indicate that the mean values between developed and developing countries are
statistically significant at the 1% and 5% levels, respectively.

23
Table 3 Abnormal returns of the portfolio
This table shows the result of the estimated SUR regression model following Binder’s (1985) method. To
save space, this table only reports the coefficients of the event window dummy, Dτ. The coefficients
represent the abnormal returns of portfolio p at time τ. Figures in parentheses are t-statistics. Superscripts
*** and ** indicate statistical significance at the 1% and 5% levels, respectively.
Full sample (266 banks)
Developed countries (114 banks)
Developing countries (152 banks)
D-10 0.0312 ( 0.2519) -0.1869 (-1.3052) 0.1855 ( 0.9821)
D-9 0.6895 ( 5.4397) *** 0.9148 ( 6.3969) *** 0.5438 ( 2.7963) ***
D-8 0.2696 ( 1.9651) ** 0.3683 ( 2.5741) ** 0.1763 ( 0.8197)
D-7 -0.0469 (-0.3497) -0.3953 (-2.7528) *** 0.2241 ( 1.0740)
D-6 0.0397 ( 0.3065) 0.4127 ( 2.8690) *** -0.2155 (-1.0787)
D-5 0.7367 ( 5.9488) *** 1.4841 (10.3180) *** 0.1742 ( 0.9252)
D-4 0.4312 ( 2.6741) *** 0.8441 ( 5.8906) *** 0.1453 ( 0.5563)
D-3 -0.2031 (-1.5488) -0.4951 (-3.4567) *** 0.0301 ( 0.1484)
D-2 -0.3665 (-2.6257) *** -0.6511 (-4.5377) *** -0.1449 (-0.6601)
D-1 -0.4058 (-3.2733) *** -0.3678 (-2.5615) ** -0.4210 (-2.2321) **
D0 -0.5329 (-3.7412) *** -1.4297 (-9.9397) *** 0.1235 ( 0.5490)
D+1 -0.4862 (-2.1632) ** -1.0656 (-7.3726) *** -0.0481 (-0.1272)
D+2 -0.7176 (-4.2540) *** -1.3989 (-9.7636) *** -0.2239 (-0.8135)
D+3 -0.0109 (-0.0828) 0.6398 ( 4.4467) *** -0.4642 (-2.2680) **
D+4 1.9429 ( 9.2656) *** 3.8924 (26.1960) *** 0.3910 ( 1.1178)
D+5 -0.9069 (-7.1447) *** -0.7479 (-5.2222) *** -1.0261 (-5.2696) ***
D+6 -0.1614 (-1.1701) -0.4180 (-2.9192) *** 0.0530 ( 0.2450)
D+7 -0.0300 (-0.2422) 0.1729 ( 1.2095) -0.1719 (-0.9116)
D+8 -0.1050 (-0.8321) -0.1274 (-0.8886) -0.0957 (-0.4954)
D+9 -0.8647 (-5.7988) *** -1.5824 (-11.0329) *** -0.3317 (-1.3936)
D+10 -1.2714 (-7.7435) *** -2.7885 (-19.0136) *** -0.1181 (-0.4444)

24
Table 4 The effects of financial development and political connections on CARs CAR(-5,-1) CAR(0,+2)
(1) (2) (3) (4) (5) (6) C 113.4156 -225.4285 -68.7016 584.2328 578.5308 449.2834 (0.3246) (-0.7054) (-0.2140) (1.5538) (1.3542) (0.9387) Size 1.1570 ** 1.9801
*** 1.7075 ** 1.5031
(2.1652) (3.5307) (2.2392) (1.4724) FinLiber -1.1335 *** -1.7733
*** -1.4899 *** -1.7364
***
(-2.9306) (-4.0235) (-3.1174) (-3.1158) State ownership 0.1211 ***
0.1234 *** -0.0855
**-0.0989
**
(5.6441) (4.5010) (-2.1279) (-2.3100) GDP growth 6.0219 16.5965 **
17.9042 *** -3.2827 5.7470 -3.0202
(0.8770) (2.6236) (3.3861) (-0.3786) (0.6206) (-0.3395) Inflation -0.2770 ** -0.3035 **
-0.6459 *** -0.0975 -0.1085 -0.2020
(-2.1263) (-2.5724) (-2.8407) (-0.9315) (-0.6878) (-1.3619) Loan growth t-1 -2369.5160 4600.5040 1700.9380 -11400.9000 -11082.9400 -8407.1420 (-0.3388) (0.7160) (0.2637) (-1.5120) (-1.2921) (-0.8753) ln (Deposits to assets) 1.1820 1.1573 3.1991
** 1.4200 1.7636 2.1026 (1.1570) (1.2460) (2.3407) (1.6088) (1.1401) (1.5591) ln (Equity to assets t-1) 2.2760 2.2646 3.4430
* 6.7962 ***
4.8020 *
7.0627 ***
(0.9441) (1.2512) (1.7210) (2.7218) (1.8540) (2.6581) ln (Loans) 1.7481 ** 0.6027 0.0502 -0.4925 -2.0047
**-1.6289
*
(2.1634) (0.9850) (0.0701) (-0.5539) (-2.3079) (-1.9822) ln (Loans to assets) -0.5981 3.2400 -0.0305 7.7437
*12.3064
**12.2600
**
(-0.1805) (0.9796) (-0.0079) (1.8424) (2.2535) (2.0156) Adjusted R-squared 0.0816 0.1436 0.2282 0.1165 0.1412 0.2450 F-statistic 2.6287 *** 3.4109 *** 3.9871 *** 3.4174 *** 3.3627 *** 4.2776 ***
Durbin-Watson statistic 1.6281 1.9768 2.2299 1.5681 2.0093 2.2934
25
No. of obs. 166 116 102 166 116 102 This table presents the effect of financial development and political connections on CAR (-5, -1) and CAR (0, +2), respectively, using the sample period of 2008. The
cross-sectional regression model is estimated using the least squares approach. Independent variables include two financial development measures, the size index (Size)
and financial sector liberalization (FinLiber), and political connections (state ownership). The control variables are the variables listed in Table 1. Figures in the first
rows are estimated coefficients. Values of t-statistics based on White (1980) heteroskedasticity standard error and covariance are reported in parentheses. ***, **, and *
indicate statistical significance at the 1%, 5%, and 10% levels, respectively.

26
Table 5 Bank profitability and asset quality ln (ROA) ln (NPL ratio/1-NPL ratio)
(1) (2) (3) (4) (5) (6) C -3.7717 *** -3.5943 *** -3.6503 *** -1.1078 -2.2733 *** -0.5718 (-8.3397) (-9.2496) (-5.9323) (-1.5160) (-3.5098) (-0.6964) Size 0.0190 -0.0096 -0.0675 -0.1283 **
(0.7490) (-0.3111) (-1.4922) (-2.1974) FinLiber -0.0365 ** -0.0294 0.0254 0.0630 **
(-2.0416) (-1.3686) (0.9621) (2.0164) State ownership -0.0010 -0.0006 0.0022 * -0.0011 (-1.0345) (-0.5597) (1.7205) (-0.6906) GDP growth 0.0032 0.0066 *** 0.0039 -0.0090 ** -0.0065 *** -0.0030 (1.2184) (3.3760) (1.3881) (-2.2031) (-2.7756) (-0.6218) Inflation 0.0068 * 0.0120 *** 0.0130 ** 0.0001 0.0001 0.0020 (1.7551) (4.8322) (2.0867) (0.0168) (0.0135) (0.1447) Loan growth t-1 0.0694 0.0229 0.1368 -0.0749 -0.2930 ** -0.0936 (0.6009) (0.2408) (0.9372) (-0.4914) (-2.2837) (-0.7530) ln (Deposits to assets) -0.0846 *** -0.0624 *** -0.0818 ** 0.1323 ** 0.0870 ** 0.1969 ***
(-3.1182) (-2.6256) (-2.5573) (2.3138) (2.1796) (3.6148) ln (Equity to assets t-1) 0.7610 *** 0.6149 *** 0.6316 *** 0.1435 0.4225 ** 0.0368 (6.5969) (6.6961) (4.6892) (0.7384) (2.5869) (0.1903) ln (Loans) -0.0829 *** -0.0630 *** -0.0468 -0.0827 ** -0.0489 -0.0998 *
(-3.4933) (-2.6245) (-1.3261) (-2.1812) (-1.4978) (-1.9226) ln (Loans to assets) -0.2466 ** -0.1674 -0.3749 *** -0.3475 -0.4204 -0.5981 (-1.9745) (-1.5436) (-2.6142) (-1.1131) (-1.5908) (-1.6331) Adjusted R-squared 0.4531 0.3204 0.4173 0.0988 0.0764 0.1503 F-statistic 23.2811 *** 28.5765 *** 11.9576 *** 3.6080 *** 5.6753 *** 3.5826 ***
Durbin-Watson statistic 1.7558 1.6489 1.9175 1.2801 0.9757 1.0602
27
No. of obs. 243 469 154 215 453 147 This table presents the effect of financial development and political connections on bank profitability and asset quality, respectively, using the sample period of 2009.
The cross-sectional regression model is estimated using the least squares approach. All variables are listed in Table 1. Figures in the first rows are estimated coefficients.
Values of t-statistics based on White (1980) heteroskedasticity standard error and covariance are reported in parentheses. ***, **, and * indicate statistical significance at
the 1%, 5%, and 10% levels, respectively.

28
Table 6 Political connections: developed and developing countries ln (ROA) ln (NPLratio/1-NPL ratio) (1) (2) (3) (4)
C -3.2395 *** -3.7835 *** -4.3758 *** -0.6053 (-4.6192) (-7.1159) (-3.2031) (-0.8970) State ownership 0.0031 ** -0.0024 ** 0.0005 0.0022 *
(2.2069) (-2.1517) (0.1271) (1.7357) GDP growth -0.0037 0.0065 0.0093 * -0.0082 ***
(-0.4933) (3.2007) (1.0124) (-3.2377) Inflation 0.0128 0.0088 ** 0.0208 ** -0.0042 (0.5697) (3.4569) (0.7241) (-0.8843) Loan growth t-1 -0.2083 0.0644 *** -0.4960 ** -0.2948 ***
(-0.6881) (0.6461) (-1.6892) (-2.7534) ln (Deposits to assets) -0.0177 -0.0678 *** 0.0736 0.0786 *
(-0.2344) (-3.0463) (0.8381) (1.9176) ln (Equity to assets t-1) 0.4415 ** 0.5381 0.7044 -0.0397 (2.1423) (3.9956) (2.0679) (-0.2167) ln (Loans) -0.0601 -0.3628 *** 0.0882 -0.0654 *
(-1.2843) (-2.5226) (1.2152) (-1.7587) ln (Loans to assets) 0.0466 0.0043 *** -1.4235 0.0400 (0.2195) (0.1685) (-2.6120) (0.1605) Adjusted R-squared 0.0524 0.1645 0.0991 0.0606 F-statistic 1.8507 * 9.3902 *** 2.7880 *** 3.5811 ***
Durbin-Watson statistic 1.7419 1.5486 1.1281 1.0915 No. of obs. 124 342 131 321 Sample Developed Developing Developed DevelopingThis table presents the effect of political connections on bank profitability and asset quality, respectively,
using the sample period of 2009. The cross-sectional regression model is estimated using the least squares
approach. All variables are listed in Table 1. Figures in the first rows are estimated coefficients. Values of
t-statistics based on White (1980) heteroskedasticity standard error and covariance are reported in
parentheses. ***, **, and * indicate statistical significance at the 1%, 5%, and 10% levels, respectively.
29
Table 7 The interaction effect of financial development and political connections: developed countries
ln (ROA) ln (NPLratio/1-NPL ratio)
(1) (2) (3) (4) C -2.2399 *** -1.7941 * -5.1713 *** -5.3296 ***
(-2.6655) (-1.9747) (-3.5802) (-3.9327) Size 0.1619 *** 0.1411 *** -0.0425 0.0136 (3.6391) (3.4516) (-0.5595) (0.2204) FinLiber -0.2835 *** -0.2954 *** 0.0020 -0.0347 (-4.0008) (-3.7824) (0.0183) (-0.3870) State ownership 0.0190 ** -0.0405 -0.0340 * 0.0203 (2.6207) (-1.5313) (-1.8610) (0.2931) Size × State ownership -0.0035 ** 0.0076 * (-2.0465) (1.8621) FinLiber × State ownership 0.0068 * -0.0031 (1.6771) (-0.2890) GDP growth -0.0063 -0.0057 0.0136 0.0145 *
(-0.7138) (-0.6377) (1.1054) (1.7098) Inflation 0.0317 0.0443 * 0.0015 -0.0075 (1.3272) (1.8926) (0.0393) (-0.2356) Loan growth t-1 -0.3963 -0.4254 -0.6660 ** -0.6394 *
(-1.0884) (-1.1700) (-2.0055) (-1.9009) ln (Deposits to assets) 0.1886 ** 0.1597 ** -0.0168 0.1230 (2.1192) (2.0031) (-0.1201) (1.2961) ln (Equity to assets t-1) 0.5214 ** 0.3963 * 0.7026 * 0.8845 ***
(2.1246) (1.7996) (2.1626) (2.8002) ln (Loans) -0.0405 -0.0405 0.1988 0.1859 (-0.5490) (-0.5456) (1.4303) (1.6407) ln (Loans to assets) -0.0832 -0.0264 -1.5934 *** -1.5361 **
(-0.4282) (-0.1297) (-3.6363) (-2.5793) Adjusted R-squared 0.2084 0.2051 0.1672 0.1378 F-statistic 3.3219 *** 3.2748 *** 2.9344 *** 2.5407 ***
Durbin-Watson statistic 2.1536 2.1830 1.0122 1.2059 No. of obs. 98 98 107 107 This table presents the effect of political connections on bank profitability and asset quality,
respectively, for developed countries using the sample period of 2009. The cross-sectional
regression model is estimated using the least squares approach. All variables are listed in Table 1.
Figures in the first rows are estimated coefficients. Values of t-statistics based on White (1980)
heteroskedasticity standard error and covariance are reported in parentheses. ***, **, and * indicate
statistical significance at the 1%, 5%, and 10% levels, respectively.
30
Table A1 Mean values for the control variables in the period of 2008-2009 GDP growth Inflation Loan growth Deposits to assets Equity to assets Loans Loans to assets
All banks -5.65 6.11 1.74 8.27 7.66 7.20 42.62 By region
Developed -4.54 1.86 4.01 9.18 4.90 7.78 39.45
Developing -6.41 9.00 0.19 7.65 9.54 6.81 44.78 By country 1 Argentina -31.18 3.09 0.01 0.64 10.09 6.49 37.29 2 Austria 0.10 1.58 0.15 20.76 5.51 7.72 43.07 3 Bahrain 0.56 0.79 0.03 4.20 13.61 6.52 30.44 4 Bangladesh 6.78 3.72 0.16 0.88 6.82 6.06 64.28 5 Belgium 0.21 1.31 -0.05 7.99 3.41 7.89 33.07 6 Brazil -6.18 5.80 0.42 0.44 9.34 7.93 33.46 7 Colombia -2.17 6.04 0.10 6.04 11.02 6.73 48.46 8 Czech Republic 4.89 2.87 0.12 9.33 7.62 6.60 29.28 9 Denmark -1.28 1.89 67.05 13.23 5.68 7.83 57.01 10 Egypt 15.71 15.04 0.15 3.28 7.13 6.58 35.34 11 Finland -9.74 3.73 0.39 8.90 5.37 6.86 27.21 12 France -6.61 1.41 0.10 13.95 3.39 8.42 25.36 13 Germany -0.86 1.15 0.07 17.30 2.39 8.14 32.82 14 Hungary -16.62 5.14 0.01 23.03 7.19 6.71 37.19 15 India 7.90 9.61 0.12 2.77 5.80 7.28 51.77 16 Indonesia 5.83 8.24 0.17 1.64 12.10 6.92 49.93 17 Ireland -14.69 -0.21 0.04 14.14 1.65 7.93 49.41 18 Israel -3.32 3.96 0.05 1.39 6.18 7.11 45.98 19 Japan 3.01 -0.18 0.06 1.94 4.42 8.14 43.81 20 Jordan 10.36 6.47 0.06 6.28 11.89 6.29 35.01 21 Kazakhstan -12.35 11.79 -0.18 17.76 11.22 6.67 68.56 22 Malaysia -12.95 3.01 0.10 7.06 7.62 7.19 44.94 23 Mexico -19.73 5.21 0.64 0.35 9.31 7.34 41.27

31
24 Netherlands -6.47 2.09 0.14 11.01 3.52 8.26 42.87 25 Nigeria -16.47 11.56 0.75 4.32 14.39 6.54 32.89 26 Norway -15.34 2.97 0.09 4.82 3.48 7.46 40.21 27 Pakistan -1.10 16.11 -0.06 6.53 9.53 6.48 49.73 28 Peru 1.16 4.17 0.16 10.77 8.92 6.49 41.74 29 Philippines -3.24 6.27 0.10 0.70 10.30 6.51 31.87 30 Poland -17.46 4.14 0.10 8.52 8.81 7.10 57.10 31 Russian Federation -26.10 12.88 1.11 18.75 10.98 7.18 41.52 32 Singapore -5.74 3.56 0.04 5.26 12.80 6.97 36.56 33 Slovakia -10.99 3.11 0.19 5.98 7.65 6.53 48.81 34 South Africa 3.22 9.33 0.01 7.96 6.15 7.49 37.17 35 Spain -5.54 1.77 0.01 3.31 5.52 8.17 69.27 36 Switzerland 3.02 0.33 0.03 10.57 5.05 7.98 37.82 37 Turkey -15.85 8.35 0.04 8.37 10.58 7.24 34.13 38 Ukraine -34.84 19.96 0.18 34.06 10.42 6.65 74.65 39 U.K. -17.26 1.64 -0.03 8.53 2.70 8.67 31.93 40 U.S.A. -1.58 1.71 -0.04 3.60 4.63 8.16 24.91 41 Venezuela 4.70 30.01 0.23 1.12 9.76 6.71 41.18 42 Vietnam 10.85 15.09 0.27 9.83 7.78 6.51 50.69
32
Table A2 Correlation matrix ROA 1 2 3 4 5 6 7 8 9 10
1 NPL -0.32 *** 2 Size -0.16 * -0.15 * 3 FinLiber -0.25 *** 0.03 0.76 *** 4 State ownership 0.04 -0.04 -0.06 -0.06 5 GDP growth 0.10 -0.17 * -0.02 -0.09 0.03 6 Inflation 0.16 ** 0.14 * 0.04 0.18 ** 0.20 ** -0.37 *** 7 Loan growth 0.22 *** -0.20 ** 0.01 -0.05 0.09 0.12 -0.12 8 Deposits to assets -0.29 *** 0.21 *** 0.13 0.14 * 0.10 -0.07 -0.12 -0.10 9 Equity to assets 0.29 *** 0.10 -0.42 *** -0.34 *** 0.06 -0.05 0.47 *** -0.09 -0.25 ***
10 Loans -0.12 -0.26 *** 0.36 *** 0.16 * 0.00 0.19 ** -0.56 *** 0.22 *** 0.17 ** -0.63 *** 11 Loans to assets 0.07 -0.10 -0.29 *** -0.21 *** 0.12 0.15 * -0.04 0.08 0.03 0.35 *** -0.10
This table reports the matrix of Pearson pairwise correlations between the major variables. Those variables are: ROA, 1 NPL ratio, 2 banking sector assets (Size), 3
financial sector liberalization (FinLiber), 4 political connections (State ownership), 5 real GDP growth (GDP growth), 6 inflation rate (Inflation), 7 loan growth, 8 deposit to
assets, 9 equity to assets, 10 total loans (Loans), and 11 loan to assets. Superscripts ***, **, and * indicate statistical significance at the 1%, 5%, and 10% levels, respectively.
Related Documents