Financial Crisis and Economic Depression: “Post Hoc ergo Propter Hoc” ? Implications for Financial Asset Valuation and Financial Regulation Nikos STRAVELAKIS Department of Economics National Kapodistrian University of Athens, Greece [email protected] Abstract: It was more than four decades ago when James Tobin stressed the fallacy underlying the Latin motto "Post Hoc ergo Propter Hoc". His point was that a causal relation, back then between money and income, must rely on something more than time precedence. However, this fact has not received proper attention, contemporary literature explains the current depression from the financial crisis which preceded it and its' resolution depends on proper rules of financial regulation. This paper argues different, the current depression resulted from weak growth reflecting weak profitability. We show that under this reasoning financial crisis episodes are highly probable, serving as the trigger of depressions. The latter implies that financial assets valuation depends on a highly variable required rate of return, contrary to the postulations of modern investment theory. Highly volatile asset returns places financial markets in a world of true uncertainty as opposed to calculable risk. This shred of realism gives different meaning and limitations to financial regulation. Any regulatory policy monitoring liquidity or solvency ratios can prove insufficient as zero or weak growth turns unstable, an event usually preceded by increased amounts of speculative investments. Therefore,

Welcome message from author
This document is posted to help you gain knowledge. Please leave a comment to let me know what you think about it! Share it to your friends and learn new things together.
Transcript

Financial Crisis and Economic Depression:“Post Hoc ergo Propter Hoc” ?
Implications for Financial Asset Valuation andFinancial Regulation
Nikos STRAVELAKISDepartment of Economics
National Kapodistrian University of Athens, [email protected]
Abstract: It was more than four decades ago when James Tobin stressed the
fallacy underlying the Latin motto "Post Hoc ergo Propter Hoc". His point was
that a causal relation, back then between money and income, must rely on
something more than time precedence. However, this fact has not received
proper attention, contemporary literature explains the current depression
from the financial crisis which preceded it and its' resolution depends on
proper rules of financial regulation. This paper argues different, the current
depression resulted from weak growth reflecting weak profitability. We show
that under this reasoning financial crisis episodes are highly probable,
serving as the trigger of depressions. The latter implies that financial assets
valuation depends on a highly variable required rate of return, contrary to
the postulations of modern investment theory. Highly volatile asset returns
places financial markets in a world of true uncertainty as opposed to
calculable risk. This shred of realism gives different meaning and limitations
to financial regulation. Any regulatory policy monitoring liquidity or solvency
ratios can prove insufficient as zero or weak growth turns unstable, an event
usually preceded by increased amounts of speculative investments. Therefore,

financial regulation should focus on what kind of assets financial
intermediaries can sell and what kind of assets banks, pension funds,
corporations and the broad public can hold to protect taxpayers from future
bailout costs at least in part.
Keywords: Crisis, Financial Crisis, Asset Valuation, Rateof Profit, Rate of Profit of Enterprise, Financialization.
JEL classification: E11, E32, G12
Introduction: Following the dramatic times of subprime market
failure in the U.S. extensive debates are taking place on
how we can avoid similar events in the future. The
postulation underlying these discussions is that
financial crisis emerged from the structure of the post
Bretton-Woods financial system and the depression which
followed was actually caused by financial crisis itself.
This type of reasoning appeared both in mainstream and
heterodox economics. Mainstream economists are
elaborating on the idea of "moral hazard" (Farhi & Tirole
2009) and heterodox economists on the "lethal mix of
consumer credit with investment banking" (Lapavitsas
2009).
Reasonably the discussion turned to financial system
regulation policies. Suggestions on: separation of credit

from investment banking, implementation of a new Bretton
Woods treaty ensuring and regulating capital flows from
surplus to deficit countries and regulation on bank
executive bonuses are some of the ideas appearing in
literature. Following the academic research legislators
and policy makers are undertaking financial regulatory
measures aiming to remove the causes of the crisis,
thereby establishing the prerequisites for sustainable
growth.
In the meantime, however, the crisis is taking its'
own course. Despite trillions spent to avoid meltdown in
global financial markets, stagnation prevails in major
economies, whereas sovereign debt crisis haunts
peripheral countries in the EU south and Latin America,
recently threatening also BRIC countries like India and
Brazil. The duration and severity of the crisis has led
economists like Paul Krugman (Krugman 2012), Bradford de
Long and Lawrence Summers (De Long & Summers 2012) to
acknowledge that we are facing a depression.
Contrary to the majority opinion in the profession,
this paper argues that major financial crisis episodes
are manifestations of deteriorating conditions in

production and growth, and not the opposite. This causal
link can explain the subprime market failure and asses
the likelihood of major financial crisis episodes in the
current phase.
Following the subprime market collapse banks were
given vast state funds through capital injection and
asset purchases, while enjoying unlimited central bank
accommodation usually against low-grade collateral. The
greatest part of these funds, however, were either held
as "safety cushion" against further deterioration of bank
asset side and depository base, or to finance corporate
and sovereign bond issues (because it is acceptable
collateral for central banks), or otherwise to support
short-term investments in equities and derivatives. Only
a small part extended corporate and consumer lending.
This is not surprising, since in a depression
corporations are looking for means of payment to stay in
business so they lack proper collateral, whereas
households also lack creditworthiness at low levels of
wages and employment. In light of the above, we
analytically investigate major financial crisis episodes
in the mix of fragile, zero or weak, growth trends with

bank exposure to loans, bonds, equities and derivatives.
In this context the ongoing gradual relinquishment of
central bank accommodation policies may play an important
part.
Generalizing, this paper analytically explores
financial crisis as reflection of weak growth which in
turn implies weak profitability. In short financial
panics are the trigger and not the cause of depressions.
Important implications on crisis theory, economic policy,
finance and financial regulation arise from this
reasoning. Financialization, in this context, develops
from the inherent contradictions of profit motivated
growth as elaborated in Marx (Stravelakis 2012).
Furthermore, the idea that in normal accumulation
financial crises are shallow and rare has important
implications for finance theory, asset pricing and
financial regulation. In this regard we will theorize on
empirical evidence initially elaborated by Robert Shiller
(Shiller 1980) who showed that volatility in dividends
cannot explain volatility in stock prices. If however
equity prices directly reflect corporate sector
fundamentals as elaborated here a more realistic view of

equity markets appears. This reasoning encompasses also
derivatives and asset backed securities valuation as
elaborated bellow. Finally in a world of true uncertainty
as opposed to calculable risk financial regulation
assumes different meaning and limitations. The focus
moves from monitoring liquidity and solvency ratios to
regulating what kind of assets financial intermediaries
can sell and what kind of assets banks, pension funds,
corporations and the broad public can hold.
The paper structure is as follows: The first section
(I) presents a simple framework which imitates the growth
pattern in the period following the great stagflation of
70 s' and its' contradictions. The second section (II)
explores financial crisis episodes with regard to
equities, derivatives and asset backed securities. The
third (III) section comments on the analytical findings
focusing on financial regulation and the last section
summarizes.
I. The Aftermath of the Great Stagflation,Financialization and Growth:
Persistently declining profit rates characterized
post war capitalism. This led to a depression in the 1970
s' referred in literature as the "great stagflation".

Severe labor market deregulation and wage suppression was
the response to the crisis. State policies demolished the
post war welfare state and in turn reduced the wage
share.
However, no vast destruction of capital took place
and so profit rates stabilized but never increased to
growth sustainable levels. In order to restore growth
interest rates declined to historical lows, supported by
low central bank intervention rates and severe
deregulation of the financial sector. The aim was to
boost the rate of profit of enterprise1 and enhance
corporate investment. Mild growth returned, but increased
leverage ratios triggered an unprecedented growth of the
financial sector. Banks extended their balance sheets to
exceptional levels based on moderate corporate deposits,
while undertaking new forms of debt and supporting new
assets, markets and non-bank financial intermediaries.
Finance fused in all aspects of life and economists named
the phenomenon: financialization of capital.
The model which follows imitates the growth pattern
in the years following the great stagflation. However,
1 The rate of profit of enterprise is equal to the rate of profit minus the rate of interest.

contrary to a good part of financialization literature,
in our context, the increased weight of finance is
triggered by low profitability and is also limited from
it. In other words when financial expansion exceeds a
certain limit imposed by the rate of profit the system
collapses. This understanding of financialization removes
the focus from the variety of assets and debt recipients
and places it in the underlying conditions of production
and growth.
Some introductory remarks are appropriate at this
point. Our model rests on the contention that
profitability is the driver of growth. This implies of
course that investment depends on profitability2. Because
capitalism is an inherently dynamic system, where balance
is reached through the succession of boom and crisis
2 Although this reasoning may seem obvious it is not, at least for
economists. A good part of heterodox literature argues that corporate
investment slowdown, following the depression of the 1970 s’, is
independent of profitability. In this regard they explain
financialization and the current crisis by applying monopoly theory
in relation either to under-consumption arguments, or to the
incentives of a rentier strata emerging from monopoly dominance.
Below I make express reference to this literature a complete survey,
however, is included in Tome 2011.

periods, the model is formulated in ratios and rates of
growth rather than variable levels (Goodwin 19673). In
this regard the basic assumption is that the rate of
growth of capital advanced (investment over total capital
advanced) depends on the net (corporate) rate of profit,
the rate of savings and the rate of effective demand. The
latter relies on the share of corporate profit out of
total gross profit and the “leverage ratio” as shown
below (Eq. I.4’). Furthermore, we make two additional
introductory assumptions: 1) production takes time
capital is advanced at the beginning of the production
period whereas profits are realized at the end of the
period and 2) corporate retained earnings are equal to
total social savings. The second assumption (2) suggests
that total wage, dividend and interest incomes are fully
consumed. Notation and definitions appear in brief
following model equations in the main text and are fully
laid out in appendix 1 for easy reference.
3 The sited paper is a path-breaking dynamic formulation of an
economic model in terms of ratios and growth rates. Equilibrium is
reached through the equalization of growth rates rather than variable
levels.

Since profitability is the driver of investment a
modified Cambridge equation4 (Pasinetti 1963, Marx 1893)
is suitable to picture growth. The equation reads as
follows:
Equation (I.1) tells us that the rate of growth of
capital advanced (K) depends on the rate of savings (s),
the gross rate of profit (r) and the ratio of the share
of corporate profits (NP) to total gross profits (Pr)
divided by its' maximum value. The latter measures
denoted by: (y=NP/Pr) for the share of corporate profit
and (y max) for the maximum value. The first two elements
(s, r) on the right hand side constitute the typical
Cambridge equation. Peculiarity of (I.1) comes from the
ratio (y/y max), which implies that growth depends on the
net (corporate) rate of profit: nropt=
NPtKt−1
=r⋅yt rather
than the gross measure: r=
PrtKt−1 . Furthermore no assumption
equalizing investment with savings is made, instead a
4 The Cambridge equation is attributed to Pasinetti 1963, however
here it is used in the sense presented in Capital VII i.e. the
reinvestment of surplus value in expanded reproduction.

positive leverage ratio equal to ( 1 /ymax =a/r, a>r) appears.
Proof of this last point follows.
Assuming constant profit (r) and interest (i) rates
implies that the leverage ratio (capital over equity) is
constant as well. For y max=r/a<1, s=i/r5 constant and
assuming further that variations in equity (EQ) are equal
to retained earnings: EQt−EQt−1=s⋅NPt , equation (I.1)
reads as follows:
Consequently it holds:
Equation (I.2) indicates also that parameter
(a=Pr/EQ) is the gross return on equity. If (a=r) this
implies that capital advanced equals equity or in other
words that total debt is zero, which at this level of
aggregation means that total investment always equals
total savings (see initial assumption 2 above and
equation I.4 below). For a>r, which is equivalent to a
positive rate of interest (see equation I.8 below),5 The definition of the rate of savings suggests that corporations
adjust retained earnings to the rate of interest. High interest rates
imply a high retention ratio and the opposite.

excess demand appears in the event of corporate profits
and excess supply for corporate losses6. This last result
is made evident in equation (I.4’) below.
Motivation behind this growth pattern becomes clear
from further modification in equation (I.1) in light of
(I.2). Since the product ( ) is the net corporate
rate of profit (I.1) takes the following form:
Where, ROE is net return on equity (ROEt=
s⋅NPtEQt−1 ). In
a world of roughly constant gross profit rates, like the
times following the great stagflation, corporations,
unable to influence the rate of profit, turned to a
strategy aimed to increase returns on their own capital.
Banks on the other hand came before two options: to raise
lending rates near profit rates keeping borrowing roughly6 I have shown elsewhere (Stravelakis 2012) that for a sufficiently
high rate of profit and variable interest rates, the latter
determined by borrower lender competition, secular or chaotic growth
prevails. In this context periods of excess demand are followed by
excess supply the two motions dynamically cancelling each other. The
model elaborated here implies deficit financed growth because of the
constant, suppressed interest rate assumption, which in turn implies
low profit rates.

constant, or to suppress interest rates and extend their
asset side. I have argued elsewhere (Stravelakis 2012)
that if interest rates are left to borrower-lender
competition in a low profit rate environment then they
will rise to rate of profit levels turning the rate of
profit of enterprise to zero. Banks picked the most
profitable option, offering lower interest rates and
lending grew from 1980 onwards.
One final assumption suggesting that change in total
debt is equal to total investment minus total savings
closes the model. In our notation this reads as follows:
Where (L) denotes aggregate borrowing7. If debt increases(ΔL>0) this implies
excess demand, if it declines (ΔL<0) excess supply.Dividing both sides of (I.4) with
( ) we can rewrite the relation in terms ofratios:
7 The time subscript (t+1) in (I.4) means that mobilization in excess
of savings is reflected in next years’ debt. In other words
corporations spend their own capital before drawing down new debt
facilities.

Equation (I.4’), mentioned in passing in various
occasions above, indicates the deficit financed growth
pattern underlying our model which approximates the
actual growth pattern experienced during the last thirty
years. Because (a) is assumed greater than (r), the
corporate profit rate triggers excess demand, which
accelerates investment but also debt growth. The opposite
holds in the event of corporate losses. In order to
assess the sustainability of this growth pattern we move
to model solution.
Equations I.1-I.4 together with the definition (
)) (see appendix 1) solve
the model as elaborated in appendix 2. The following non-
linear difference map determines the time path of the
share of corporate profit and thereby the rate of growth:
Equation (I.5) is a discrete time "logistic map" (May
1975) well-known and broadly used in biology to picture
population dynamics. The following convenient forms (also
derived in appendix 2) are helpful in analyzing the
complex dynamics of (I.5):

Equation (I.6) is the typical "logistic map" format
where dynamics depend on the value of parameter (φ). But
the most intuitive form is equation (I.7) where the term
i2⋅φ denotes the system "carrying capacity", in other
words the maximum value ROE can take. For parameter
values (φ<4) maximum ROE remains below carrying capacity
and the system exhibits secular or chaotic growth. But
for φ>4 ROE at some point pierces the maximum value
following which the system collapses. These two states
appear in the simulation charts which follow:

Chart 1 Φ=3.9
0
0,1
0,2
0,3
0,4
0,5
0,6
1 3 5 7 9 11
13
15
17
19
21
23
25
27
29
31
33
35
37
39
ROE Carrying Capacity
Chart 2 Φ=4.06
-0,2
-0,1
0
0,1
0,2
0,3
0,4
0,5
1 3 5 7 9 11
13
15
17
19
21
23
25
27
29
31
33
35
37
39
ROE Carrying Capacity
In Chart 1 the value of φ is 3.9 and although the
rate of growth follows a chaotic pattern involving milder
or more severe fluctuations the value of ROE never
exceeds "carrying capacity". In the second chart φ=4.06,
although a chaotic pattern appears again after several
fluctuations the value of ROE slightly exceeds "carrying
capacity" (point marked on chart), following this the
rate of growth collapses, return on equity receives
negative values, indicating corporate losses, which keep
coming period after period until meltdown.
What are the underlying economics explaining stable
or semi-stable fluctuations and alternatively collapse?

To understand the mechanics we will use a second property
of the logistic equation that of competition. The main
idea underlying the biological application of the
equation is that limited resources constrain population
growth. In other words a population competes for survival
until it exhausts subsistence means following which it
declines. In our context this means a limit value beyond
which ROE begins to drop. We can determine this value
rewriting (I.7) as follows:
The greater the value of the parameter ( (φ−1)⋅i2 ) the
greater the value ROE can take before declining.
Therefore it is reasonable for corporations and banks to
seek a rate of interest that will maximize ( (φ−1)⋅i2 ).
The form has a maximum (derived in appendix 3) for:
Equation (I.8) suggests that positive interest rates
appear only for a>r justifying the assumption made so
far. However, our reasoning supports further elaboration
on parameter values. Since the strategy presented is
meaningful for a positive rate of profit of enterprise,

then there exists a minimum leverage ratio required for
growth. The following expression specifies the minimum:
From (I.9) it is clear that the strategy applies for
leverage ratios greater than two (2), otherwise
corporations will have no reason to undertake production
risks.
Furthermore, the growth rate associated with a
particular rate of profit of enterprise is sustainable
for ( φ≤4 ). Substituting (I.8) into Eq. (I.7) (definition
of φ) above the following sustainability condition
appears:
Equation I.10 tells us that sustainable growth
prevails for profit rates greater than a certain minimum
(in our case 1/3). Keeping in mind that the need to
suppress interest rates comes from low profit rates in
the first place, it follows that the growth path
prevailing under this strategy is either unsustainable in
the first place, or turns unsustainable following a
slight decline in the rate of profit or the rate of

interest. Moreover, dynamics pictured in Chart 2, where
sudden collapse follows a long period of secular growth,
demonstrate that instability can remain hidden for long
making things look stable on the surface.
This superficial stability was the basis of
mainstream contentions that unimpeded growth would
persist for the foreseeable future. It was only a
minority of heterodox economists who raised concerns on
the sustainability of deficit financed growth (Godley
1999, Papadimitriou et.al 2004). However, mainstream
approaches insisted that economic expansion was
“structural” and unrelated to rising demand (Phelps
2000). As usual policy makers concurred with the
mainstream (Greenspan 2000) and the deficit financed
accumulation pattern continued unchecked until the
outburst of the crisis in 2007.
But there is more to read out of this simple
framework. From equations (I.4), (I.7) and the identity
(y=NP/Pr) the following equation of debt growth appears
(derivation in appendix 4):

Although credit expands, during the period which
precedes collapse, capital and profits grow faster than
debt in most cases8. This means that banks experience
increased liquidity which is not absorbed from corporate
debt growth. It was this liquidity which made banks turn
to consumer credit, speculative short term investments,
new classes of assets and financial intermediaries. Good
part of heterodox literature has focused on this side of
financialization disregarding at the same time that it
results from a pattern designed to restore growth in a
low profit rate environment. Explanations on the rising
weight of finance range from increased monopolization
(Magdoff & Sweezy 1997, Lapavitsas 2011) to the
prevalence of “rentiers” motivated by “perverse
incentives” (Crotty 2009, Epstein 2005). We will
critically assess these views in various occasions in the
next section.
Returning to our main argument, it is clear from
(I.11) that financial assets assume a substantial portion8 Since profits grow at a rate equal to the return on equity (ROE),
it is not difficult to ascertain that ifROE<
a−ra2 then profits will
grow faster than debt. The reader can verify that the inequality
holds for plausible parameter values.

of corporate and bank asset side as deficit financed
growth proceeds. The latter “sets the scenery” of
financial crisis. To explain how it bursts we need to
turn to finance theory and asset pricing.
II. Asset Pricing from the Fundamentals, Implications forFinancial Crisis:
Alongside with the debt market, incorporated in our
framework, we assume, there exists an equity market where
trades on corporate and banking shares take place.
Following the unanimously accepted principle that capital
mobility tends to equalize risk free returns between
sectors (Dybvig & Ross 1992 ), returns in our equity
market remain in line with an underlying "required rate
of return" (hereafter rror). However, contrary to
mainstream wisdom (Campbell 1991)9, but very much in line
with empirical findings (Shiller 1980), this required
rate of return is not assumed constant and equal to the
lifetime rate of return of a particular investment. The
reason is that fluctuations in demand produce secular
growth patterns, as pictured in Charts 1, 2 above, which
in turn alter the rate of return of the corporate sector9Actually in the sited paper Campbell acknowledges the limitations of
constant required rates of return also suggested by the efficient
market hypothesis.

creating arbitrage positions in the equity market. Equity
holdings are therefore inherently short-term reflecting
short-term corporate sector returns. This in turn implies
that equity market risk is roughly equal to that of the
corporate sector (Shaikh 1997). A measure closely
associated with the required rate of return is the short-
term rate of profit:
Where (u) is capacity utilization. The measure (
) pictured in (II.1) is a measure of short-term
profitability of corporate investment, as opposed to
lifetime rate of return which is equal, in our context,
to the rate of profit (r). The latter prevails in full
capacity utilization. When capacity is underutilized
(capacity utilization is bellow unity) gross return on
total capital outstanding falls below the basic gross
rate of profit, the opposite holds when capacity is over-
utilized. Furthermore, variable (irf), appearing in
(II.1), measures the risk free interest rate in the
current conditions of production and growth. The risk
free interest rate is equal to the constant interest rate
(i) minus yearly standard deviation of the rate of

growth. It enters as negative factor in (II.1) since it
represents returns foregone when equity investments are
undertaken.
Assuming that capacity utilization (u) equals to the
ratio of capital advanced to year-end corporate total
capital (equity capital plus borrowed capital) we can
denote the measure as follows:
When capital advanced is less than year-end total
capital this indicates under-utilization of existing
capacity. In the event that capital advanced exceeds
total capital, for example when customers advance funds
against yet undelivered commodities, capacity is over
utilized. From equation (I.2), the identity (y=NP/Pr) and
dividing the numerator and denominator with capital
advanced (K), (II.2) takes the following form:
Increased capacity utilization implies an increased
share of corporate profits in the next period. In times
of relatively low debt (compared to gross profit)

corporations employ their excess capacity which leads to
an increased share of corporate profits. As capacity
utilization approaches or exceeds unity, corporations
accumulate debt to extend productive capacity and the
share of corporate profit declines because of increased
interest payments. Corporations downsize production,
reducing capacity utilization, to release liquidity and
profit growth declines until the corporate debt/ gross
profit ratio is sufficiently reduced. In normal
accumulation the process roughly repeats itself, however
when the economy reaches breakdown things change
dramatically. Although production contracts, corporations
remain illiquid, since any reduction in outstanding debt
goes together with extended corporate losses.
At the bottom of the cycle banks and financial
capital in general observe increasing capacity
utilization and turn part of their liquidity to equity
investments, in order to enjoy capital gains coming from
increased corporate profitability. As result the price of
both corporate and banking shares increases, discounting
the expected increase in profitability. When loan demand
accelerates banks liquidate most of their equity holdings
realizing their gains and boosting their liquidity in
light of increasing loan demand. Things again change when
breakdown times arrive. Although banks dispose most of
their equity holdings when debt accelerates and before
the time growth exceeds systemic "carrying capacity",
liquidity is not restored, because the depository base
deteriorates from corporate losses. Banks dispose any
remaining equity holdings at a loss to increase their
liquidity and corporations having exhausted their
reserves soon turn to them seeking means to finance their
losses.
A good part of past and contemporary economic
literature interprets equity market breakdown as the
cause of a depression because it precedes it. By
extending our framework to encompass equity market
arbitrage, stock market collapse again precedes the
outburst of depressions without causing it.
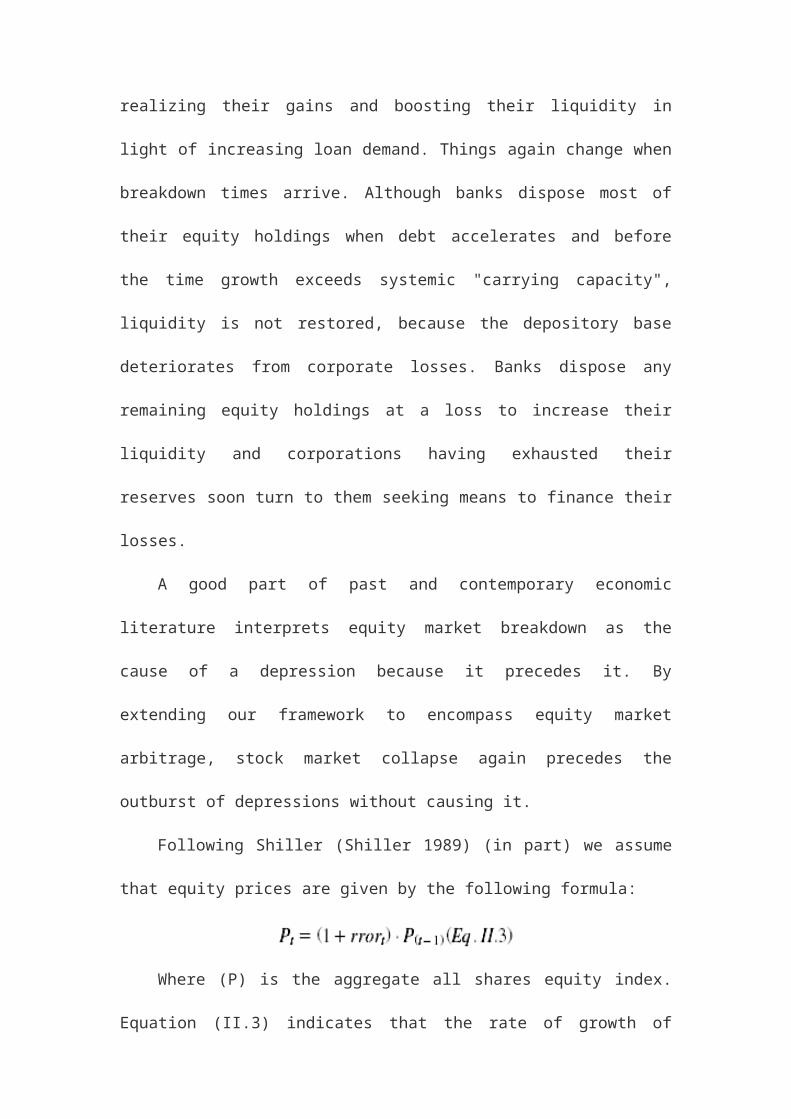
Following Shiller (Shiller 1989) (in part) we assume
that equity prices are given by the following formula:
Where (P) is the aggregate all shares equity index.
Equation (II.3) indicates that the rate of growth of

Chart 3
-0,3
-0,2
-0,1
0
0,1
0,2
0,3
0,4
0,5
1 2 3 4 5 6 7 8 9 10
11
12
13
14
15
16
17
18
19
20
21
22
stocks returns
ROE
stock prices equals to the net required rate of return.
When capacity utilization is high the "gross required
rate of return" ( ) exceeds the "default free"
interest rate and stock prices rise, the opposite holds
in low capacity utilization. But increased capacity
utilization reflects next year corporate profitability,
as shown in equation (II.2'). It is for this reason that
stock price reductions/ increases precede reductions/
increases in output and profitability. The simulation
chart which follows pictures this result.
Chart 3 presents an unstable return on equity (ROE)
path and the stock returns associated with it (blue
line). Although sharp corrections and longer losing
strings can appear, as market on the chart (red arrow),
stock returns remain overall positive as long as ROE
remains positive and consequently corporate profits keep

growing. But when ROE turns negative indicating a
breakdown (black arrow) a sharp stock market correction
precedes corporate profitability decline. It is the lead
of stock market crash over actual depression episodes
which creates the impression that the stock market crash
is the cause, although causality runs the other way
around.
We can take this reasoning further, assuming also
that a derivative market is in operation. Mainstream
economists suggest that trading of derivative contracts
improves “efficiency” for the underlying asset market, by
broadening the portfolio selection perspectives and
reducing transaction costs (Pyle 1993). On this
intellectual justification a 457 trillion dollar
“notional amount outstanding” market stood in mid-2008
(Mai 2008). Of this notional amount only 16% trades in
organized exchanges whereas the remainder involves “over
the counter” (OTC) transactions. But the most astonishing
fact is that despite financial crisis the OTC derivatives
market grew further exceeding the world GDP and reaching
the unbelievable amount of 693 trillion dollars in mid-
2013 (Bank of International Settlements Statistical
Bulletin Nov. 2013). Finally, recent studies (Avellaneda
& Cont 2011) indicate that almost 90% of equity OTC
derivative contracts take place between dealers and only
10% between dealers and “end users”. The latter indicates
that most of derivative transactions are of speculative
nature.
Given the risks undertaken and the nature of
transactions, one would expect that strong arguments
supporting market efficiency underlie mainstream
postulations. Regretfully, the whole argument rests on
modern investment theory assumptions concerning
underlying asset returns. Indicative in this regard is
standard pricing of equity index forwards, used hereafter
as an example derivative, where the risk free interest
rate is the constant required rate of return. In other
words “strike price” determination comes from the
application of a constant risk free rate (see equation
(II.6) below). This same argument is extended further, by
assuming normally distributed equity returns, to price
“option contracts” under the celebrated Black-Scholes
framework.

We can price an outright equity forward from our
simple framework. Given the simulated data in hand, we
can find a time path for index prices from (II.3), and
the yearly standard deviation of growth from figures
generated by (I.7). This data together with the constant
rate of interest are sufficient to price the equity
forward under the following standard formulas:
Where (cifr) is (ifr) in compound form and (F) stands
for the yearly forward. Equation (II.4) determines the
default free interest rate at the beginning of the
period, (II.5) is the compound form of (II.4) and (II.6)
the formula of the one year forward. Given our framework
of stock returns, but also actual data, it is evident
that derivatives are systematically miss-priced since
their pricing rely on a theory which has no relevance
with actual data. Many economists, professionals and
mathematicians have acknowledged the fact (Mandelbrot &
Hutson 2006).

The systematic pattern of derivative pricing against
the underlying asset gave rise to a wide range of
speculative financial intermediaries seeking higher
returns by exploiting derivatives and these
intermediaries are no other than the hedge funds. Banks
supported hedge fund growth by granting them credit and
derivative lines. Derivative lines support equity
purchases without cash advances, limiting at the same
time maximum contract value (notional amount
outstanding). Each contract occupies a part of the line
determined by the product of underlying asset volatility
and contract notional value. This practice, however,
relies on the assumption that underlying asset returns
follow the normal distribution. In other words that
volatility remains roughly stable. If volatility varies
and it does, the line may suddenly become insufficient
and the borrower will either have to come up with cash or
liquidate his positions. For positions "in the money"
this is not a problem, actually the bank will extend the
line to cover the customer, problems begin when
derivatives are "out of the money". But again in a
relatively stable growth environment banks will finance

derivative losses (by turning the derivative line to a
credit line or by rolling over the derivative position)
it is again in times of breakdown that things turn
dramatic.
By elaborating on the strategy of Macro Hedge Funds
we will see how financial crisis becomes possible. Macro
Hedge Funds speculate on big fluctuations in asset prices
(in our context equity and derivative prices) assuming
that it reflects a discrepancy between the market and the
underlying fundamentals. By exploiting the discrepancy
the hedge fund anticipates extraordinary profits. But
this can imply that the normality assumption holds for
equity returns as some hedge fund managers suggest
(Nicholas 2008). More specifically, returns falling more
than one standard deviation away from the mean reflect
potential miss-pricing, since from the properties of the
normal distribution 85% of asset returns should fall
within one standard deviation from the mean. Furthermore,
if asset returns are "normally distributed" this implies
also that the underlying fundamentals are roughly stable
as well. Therefore, any diversion will generate an
opposite motion, since it comes from random occurrences.

Chart 4
00,05
0,1
0,15
0,2
0,25
0,3
0,35
0,4
0,45
-0,4
-0,3
-0,2
-0,1
0 0,1
0,2
0,3
0,4equity
returns-mean
prob
abil
itie
s
Dagum Distr.
Normal Distr
The chart which follows (chart 4) compares the
distribution optimally fitting equity returns generated
from (II.1) (blue line), with a normal distribution
calculated from the mean and standard deviation of the
same data (purple line).
The distribution best fitting the data is a four
parameter Dagum distribution (Dagum 1975). Returns on the
horizontal axis are differences from the mean and
probabilities appear on the vertical axis. The two shaded
regions picture the areas of interest for macro hedge
funds. For return values in the left hand side shaded
area the hedge fund builds long forward positions. In the
same fashion short forward positions are appropriate for

returns in the shaded area on the right hand side10.
However, the hedge fund miscalculates risk in both
occasions. The most important miscalculation appears in
the left hand side tail of the two distributions marked
by the black arrow on Chart 4. Actual return distribution
(blue line) has a long tail where finite probabilities
appear for very low returns whereas in the assumed normal
distribution (purple line) this probability is
practically zero. Hedge funds assuming normally
distributed returns took long derivative positions at
this level of returns anticipating strong recovery.
Instead they witnessed market collapse. Banks
experiencing, during the same period, deterioration of
their depository base were reluctant to finance these
losses. This was the reason many macro hedge funds failed
in the period of the financial crisis.
Economists and market professionals have used this
finding to make a case for the causes of the current
depression. The financial analyst Nicholas Taleb (Taleb
10 This is by no means an exhaustion of potential hedge fund
strategies but only a simplistic example. However, we can safely
claim that almost every macro hedge fund strategy is vulnerable to
extreme negative returns.

2009) argued that underestimation in the likelihood of
extreme surprise events, "black swans" in his
terminology, is responsible for the meltdown. Heterodox
economists argue that "financialization" is the child of
neo-liberal ideology (Fine 2011) which reached a climax
in the theory of self – regulated markets, i.e. markets
which could calculate risks correctly, thereby self-
constraining any excesses. Under this reasoning,
deregulated financial institutions undertook extensive
derivative positions generating losses in excess of the
underlying asset price reduction. This resulted to the
depression caused from financial crisis spillover. What
the argument misses is that excessive impairment of
"fictitious capital", for example capital recorder in the
“notional amount” of derivative contracts, reflects
breakdown in the valorization of real capital as argued
here.
Finally we will consider asset backed securities
valuation, since the collapse of the mortgage-backed
securities market triggered the current depression.
Although these assets entered our everyday vocabulary
following the subprime market collapse, they are by no

means new. U.S. government owned or government-sponsored
enterprises with a history going back to the years of the
great depression have been issuing this type of
securities for decades. For government agencies (Ginnie
Mae) and government – sponsored agencies (Fannie Mae and
Freddie Mac) securities rated triple A (AAA) were issued,
since markets consider(ed) these assets backed by the
U.S. government. This is the “prime” mortgage backed
securities market. But as bank liquidity grew in the
fashion pictured by our equation (I.11) and banks turned
good part of this liquidity to consumer lending, lower
quality mortgages were turned to “collateralized debt
obligations” (CDOs). The latter is the “subprime”
mortgage backed securities market which triggered the
depression. As interest rates were suppressed to
historical lows from 1980 onwards mortgage backed
securities gradually assumed the greatest part of bond
markets. The reason is simple they offered a premium
over corporate and sovereign bonds of the same rating,
the premium representing compensation against the
uncertainty of mortgage refinance. Consequently as
interest rates declined and the likelihood of mortgage

refinance was reduced these securities became more and
more attractive. However, the market underplayed the risk
that banks would be unable or reluctant to refinance bad
mortgages, in other words the market underplayed the
likelihood of a depression as elaborated below.
Although we can only consider securities "backed" by
corporate loans in our context, the valuation method is
valid for other types of asset backed securities. For
reasons of simplicity we will assume that half of the
bank loan portfolio comprises of productive corporations
paying interest at a rate below the average (i), while
the other half pays interest at a rate above average. We
will assume further that banks pool their loans in two
units (tranches) one involving productive low-interest
corporate loans and the other unproductive high interest
loans. They then issue one year securities on each unit
which they sell through "special purpose vehicles".
Returns, risks and excess returns for both units appear
in the equations which follow:

Where (rtr) stands for return on tranches 1 and 2 and
(rope) denotes the rate of profit of enterprise for the
two corporate groups. Expected excess returns, denoted as
(ertr), are equal to half the annual volatility of growth
for group 1 and one and a half (1.5) times volatility of
growth for group 2. Although the first unit will have a
positive rate of profit of enterprise if r>i (II.7), the
second unit may experience negative (rope) even if the
corporations included have an average rate of profit
equal to the economy average (II.8). Therefore in highly
volatile growth security holders rely on the willingness
of banks to refinance these loans, which in turn rests on
the conviction that growth will resume enabling the
borrower to perform. This is of course the case when
banks are liquid. But when bank liquidity deteriorates
like the times close to breakdown things change. The
simulation chart which follows pictures the risk
associated with unit 2 securities in various states of
the economy.

Chart 5
-0,5
-0,4
-0,3
-0,2
-0,1
00,1
0,2
0,3
0,4
0,5
1 3 5 7 9 11
13
15
17
19
21
23
25
27
29
31
33
35
37
39
41
rope
ROE gPr-gL
The blue line is the rate of profit of enterprise of
unit 2 calculated as in (II.8). The purple line is the
return on equity (gross profit growth) for the whole
economy as before and the black line the rate of growth
of profit less the rate of growth of debt. The latter is
a measure of bank liquidity growth. Although the rate of
profit of enterprise turns negative in many occasions,
profits catch up quickly and banks refinance low-grade
debt. At the eve of breakdown however (marked by the
arrow on chart 5) as the rate of profit of enterprise of
unit 2 turns negative banks experience a huge decline in
liquidity, because the corporate sector as a whole
experiences losses. As result low-grade loans do not get
refinanced and asset backed security holders experience
huge losses.

The scenario presented roughly imitates the collapse
of the sub-prime market in the U.S. Securities issued on
low-grade mortgages, the so-called "toxic" unit, were
held on the assumption that the housing market will keep
growing and collateral will cover the loan. This in turn
implied that banks would refinance mortgages when turned
problematic protecting the security holders from capital
losses. When this did not happen in 2007 the market
collapsed.
A good deal of contemporary heterodox literature
understood the sub-prime collapse as the cause of the
crisis, in a "post hoc ergo propter hoc" (Tobin 1970)
reasoning elucidated above and the level of wages as the
cause of the sub-prime collapse. The wage incomes
expropriation theory (Lapavitsas 2009) and the monopoly
version of the under-consumption argument fall in this
category. In the latter capitalism is stagnant by nature
and growth resulted from consumer credit expansion
(Magdoff & Sweezy 1987). Both versions arrive to an
amazing conclusion: world capitalism entered a depression
because wages were low limiting commercial credit
expansion!

We have used a simple framework to show that an
unstable growth path emerging from low profitability
produces financial crisis episodes because corporate
growth cannot absorb bank liquidity. In this context,
financial crisis reflected in spiky reductions of returns
on various asset categories (stocks, derivatives, asset
backed securities) precede sharp reductions in output and
employment. This result rests on the assumption that
returns on financial assets reflect (short-term)
underlying fundamentals. The latter follow patterns quite
different from those anticipated by neoclassical theory
and elaborated by "modern investment theory". This
reasoning has important implications for economic policy
and financial regulation demonstrated in the following
section.
III. The World Economy in the Post Bear Sterns Era:
The failure of the investment bank Bear Sterns in
2007 marked the beginning of the current depression. At
first regulators thought it was an isolated case which
could be contained through traditional monetary policy
tools. By mid-2008, however, the subprime market failure
made clear that the situation required extraordinary

measures, since most of the U.S. banking system had
collapsed. The main policy followed aimed to securitize
banks through capital injection, troubled asset purchases
and central bank accommodation against low-grade
collateral. Governments supported this policy with state
budgets. The state issued bonds to raise central bank
capital and support the "socialization" of financial
sector losses. In the U.S. alone public debt increased
from about 8.7 trillion dollars in 2007 to 16.4 trillion
dollars in the end of 2012.
These monies prevented meltdown mainly by enabling
banks to revolve or turn corporate debt to equity,
maintaining consumer credit as well. Most of economic
activity remained in place instead of collapsing and
world economy entered a period of stagnation and high
unemployment. In our context this means that parameter
(a) reduced to sustainable levels. But this involves also
an increase in the effective interest rate (Eq.I.8) and a
stagnant rate of profit of enterprise (Eq.I.9). The
latter explains stagnation, high unemployment and
impoverishment of big parts of the world population.

For contemporary mainstream literature crisis
persistence is unanimously accepted nowadays.
Explanations vary, ranging from high debt (mainly public
debt) hampering growth (Reinhart & Rogoff 2013)11, to
blaming austerity policies applied to contain debt
(actually to suppress wages). The latter approach
stresses the limitations of monetary policy summarized in
the so-called "zero interest limit" and promotes fiscal
expansion (Krugman 2012). However, the first explanation
disregards that low returns brought about the debt crisis
in the first place, while the second ignores that in a
depression corporations and banks sequester monies rather
than invest them. Therefore, Keynesian "trickle down"
policies justifying fiscal expansion have limited effect.
The reasoning detailed in this paper suggests
alternative policies promoting direct state investments
(Shaikh 2011). That is policies restoring economic
activity and bank liquidity through increases in
employment. As we have shown profit motivated growth
11 I site the last paper of the two authors because in it they admit
on one hand that the crisis persist over the last six years and
second that austerity measures cannot turn debt sustainable as argued
so far by austerity policy proponents.

breaks down in a depression, it is state investments
following social goals that can offer employment to those
who need it the most and have a “rise up” effect on
businesses serving the increased demand.
Nevertheless, official policies support different
trends. As public debts pile up and bank liquidity surges
speculative financial investments are taking up
substantial part of bank portfolios. Meantime stock
exchanges have hit record prices, not supported by
corporate fundamentals. All these are raising concerns
that a new financial crisis is around the corner. As
response central banks are downsizing accommodation
policies and governments are issuing new bank regulation
directives at the same time. The most clear policy
outline is the "Volcker rule" passed on Dec 10th 2013 by
the U.S. legislative bodies. A similar but slower process
is taking place in the E.U. around the so-called "banking
union".
Sticking to the "Volcker rule" because of
concreteness we note that its' main aim is to prevent
banks from assuming equity and derivative risk through
hedge funds and other vehicles, but does not prevent them

from running that risk directly in their balance sheet.
The only factor discouraging assimilation of risk is
increasing capital requirements. This is a policy relying
on the assumption that financial assets carry a
particular amount of relatively stable risk. If risk is
stable banks can securitize depositors by assigning the
appropriate amount of additional capital to back risky
assets appropriations. But, as we have shown above, this
does not hold especially when growth trends turn
unstable, in such times capital requirements will prove
insufficient and the taxpayer will again lift the burden.
The "Volcker rule" is the latest chapter in a long series
of regulations going back to the "Peel act"12 in mid-19th
century England. Marx in Capital VIII (Marx 1959) mocked
this early policy for being useless when the system was
12 The Peel act of 1844 named after the British premier Sir Robert
Peel on one hand prevented commercial banks from issuing their own
banknotes and on the other placed restrictions on the bank of England
in issuing banknotes. The idea was that with the restrictions in
place inflation would remain stable and financial panics would seize
to appear. Marx scorns the fact that the restrictions of the act were
never needed /applied in normal accumulation and the act was
abandoned altogether when the system entered a depression.

in normal accumulation and was withdrawn in the crisis of
the 1850 s' to avoid bank failures.
The target of bank regulation is to protect the broad
public, at least in part. Given uncertainty underlying
financial markets, the rules applied must focus on what
kind of assets pension funds, banks and the broad public
can hold and to what proportions, in order to contain
future damages. Depressions cannot be managed away
through appropriate policies, because they emerge from
the contradictions of profit motivated growth. This is
why depressions appear every thirty to forty years the
first on record dated as back as 1790. In this regard
financial crises will always be a potential trigger of
such events and regulation policies can only mediate
losses by directly constraining risk. This means that
institutions which take deposits or pension plan
installments cannot hold just any kind of risky asset and
the assets permitted cannot assume just any proportion of
the asset side.
Returning to the present, the likelihood of a new
major financial crisis depends on how stable is the
roughly stagnant growth path prevailing. Stability seems

to rely on the extraordinary liquidity measures primarily
of the Fed, the Bank of Japan and secondarily of the ECB.
These policies are keeping interest rates low. Capital
impairment that would boost the rate of profit leading to
gradual recovery seems to move in a slow and
contradictory pace. Therefore when these policies are
withdrawn financial panics and sharp corrections cannot
be ruled out.
Overall the resolution of the present depression is
proceeding at a very slow pace so far. Looking back to
the history of crises it resembles the 1870-1890
depression, the longest on record. Therefore policy
makers should be very cautious in declaring the end of
the crisis and should focus on its’ devastating
consequences instead.
Summary:
We presented a simple framework analytically
supporting the notion that profit driven growth turns
unstable when the rate of profit is below a certain
limit. Furthermore, if low profit rates are associated
with suppressed interest rates finance assumes increasing
weight like the period following the great stagflation of

the 70 s'. The latter implies that major financial crisis
episodes become likely triggering sharp reductions in
output and employment. Model dynamics picture a path of
secular growth followed by a sudden collapse imitating
the growth pattern following the “great stagflation” and
the subprime meltdown which triggered the current
depression.
Besides implications on financial asset valuation
this rationale indicates that financial regulation cannot
rule out future crises, because crises emerge from the
underlying contradictions of profit motivated growth.
Regulatory policies can only temper future financial
losses if implemented on the type and amounts of
financial assets held by Banks, Pension funds and the
broad public.
This approach differs from the reasoning underlying
recent regulatory legislation like the “Volker rule”. The
latter relies on the contention that stable calculable
risk is associated with every asset and in this regard
appropriate capital requirements constrain risks
undertaken by financial institutions. Regulation is
thereby limited to monitoring sound liquidity and

solvency ratios by forcing banks to assume risk directly
on their balance sheet. The latter indicates further,
that regulators blame the “shadow” banking system (hedge
funds, special vehicles etc.) for the current depression.
We showed that if asset returns depend on corporate
sector fundamentals financial asset risk is highly
unstable and any solvency ratio will prove insufficient
when the economy reaches breakdown point. Similar
empirical results on financial asset risk are common
knowledge in the economic profession following the path
breaking work of Shiller (Shiller 1980).
The framework presented indicates further that
depression will be over when sufficient capital is
impaired on a world scale to support an increase in the
rate of profit. In this regard crisis resolution lies
ahead of us. Securitization of banking capital prevented
economic meltdown, but, at the same time, initiated a
contradictory process where capital is impaired at a very
slow pace while stagnation prevails. If this stagnant
growth path is dependent on central bank liquidity
measures, in the sense that central bank policies keep
effective interest rates low, then the relinquishment of

these policies will mark the return of financial panics.
In a panel, during the January 2014 conference of the
American Economic Association, chief IMF economist
Olivier de Blanchard arrived to a similar conclusion. He
suggested that multiple equilibrium positions stand
before world economy depending on the rate of interest
prevailing after the abandonment of central bank
extraordinary liquidity policies.
It is beyond doubt that recent mainstream literature
(Reinhart & Rogoff 2013, Krugman 2012, De Long & Summers
2012) acknowledges that we are in the middle of a
depression. However, economic reasoning underlying these
arguments has important policy implications. Neoclassical
economists reach the conclusion that high debt /GDP
ratios are the cause of the crisis suggesting fiscal
austerity as the resolution. Neo-Keynesians, on the other
hand, consider austerity policies as the cause, preaching
in favor of fiscal expansion. Good part of heterodox
literature has shown that wage suppression, standing
behind austerity policies, is not sufficient for
restoring the rate of profit. Moreover, Keynesian
“trickle down” policies justifying fiscal expansion are

not effective in depression times when profit rates are
low.
Alternative policies relying on state direct
investment in order to boost employment are appropriate
now that profit motivated growth has broken down.
Elaborating on the characteristics and limitations of
such policy will be the focus of future work.
Appendix 1 Notation and Definitions

Appendix 2 Model Solution
Letting: LtPt
=lt and using I.1-I.4

LtPt
=lt→lt=1i⋅(1−yt )→lt+1−lt=−
1i⋅(yt+1−yt)
lt+1−lt=Kt−Kt−1−s⋅NPtPrt
−Prt+1−PrtPrt
⋅lt=(1r
−lt )⋅i⋅ar
⋅yt−s⋅yt
lt+1−lt=(ar
−a⋅lt−1)⋅s⋅yt
−(yt+1−yt )=(a⋅ir
−a⋅(1−yt)−i)⋅s⋅yt
yt+1−yt=(i⋅r+a⋅(r−i)r
−a⋅yt )⋅s⋅yt
yt+1=((i2+1)⋅r+a⋅i⋅(r−i)r −a⋅i⋅yt )⋅
1r⋅yt
yt+1=(1−a⋅r(1+r)⋅r⋅i+(r−i)⋅a
⋅yt)⋅(1+r )⋅r⋅i+(r−i)⋅ar2⋅i
⋅yt
φ=(1+r)⋅r⋅i+(r−i)⋅ar2⋅i
=1+rr +
(r−i)r⋅i ⋅a
zt=a⋅r(1+r)⋅r⋅i+(r−i)⋅a
⋅yt→yt=(1+r)⋅r⋅i+(r−i)⋅aa⋅r
⋅zt
→ytφ
=r⋅ia
⋅zt→yt=r⋅ia
⋅φ⋅zt→ROEt=i2⋅φ⋅zt
zt+1=(1−zt)⋅φ⋅zt
ROEt+1=(1−1i2⋅φ
⋅ROEt )⋅φ⋅ROEt
Appendix 3: Carrying Capacity Maximization Interest Rate

d(φ−1)⋅i2di =(
r⋅i2+(r−i)⋅a⋅ir2
)=2⋅r⋅i+r⋅a−2⋅i⋅ar2
=2⋅i⋅(r−a)+r⋅ar2
2⋅i⋅(r−a)+r⋅a=0→i=−12⋅r⋅a(r−a)
Appendix 4: Debt Growth
Lt+1−Lt=Kt−Kt−1−s⋅NPt→Lt+1−Lt=1r⋅ROEt⋅Prt−s⋅yt
⋅Prt
Lt+1−Lt=1r⋅ROEt⋅Prt−s⋅yt⋅Prt=(a−r)⋅
ROEt2⋅(a−r)−a2⋅ROEt
⋅Lt
REFERENCES
1Avellaneda M. & Cont M. (2011) "Transparency in OTC Equity Derivatives Markets: a Quantitative Study" Finance Concepts
2 Campbell J.Y. (1991) “A Variance Decomposition for Stock Returns” The Economic Journal, March pp. 157-178.
3
Crotty J. (2009) “Structural Causes of the Global Financial Crisis: a Critical Assessment of the New Financial Architecture” Cambridge Journal of Economics, 33 pp.563-580
4Dagum C. (1975) “A Model of Income and the Conditionsof Existence of Moments of Finite Order”. Bulletin ofInternational Statistical Institute, 46 p.199-205.
5De Long B.J. & Summers H.L. (2012) “Fiscal Policy in aDepressed Economy” Draft 1.32 Harvard University & U.C.Berkeley March.
6Dybvig P.H. & Ross S.A. (1992) “Arbitrage” in J.Eatwell, M. Milgate and P. Newman (eds) “The New PalgraveDictionary of Money and Finance” London Mcmillan V1 p. 43-50.
7 Epstein G (2005) (ed.) “Financialization and the World Economy”Northampton, MA: Edward Elgar
8Farhi E. & Tirole J. (2009) “Collective Moral Hazard,Maturity Mismatch and Systemic Bailouts” NBER WorkingPaper No. w15138 July.
9Fine B. (2011) “Beyond Financialization” in A. Vlahou,N. Theocharakis, D. Mylonakis (eds) “Economic Crisis andGreece” Guttenberg Publications Athens.
10
Godley W. (1999) "Seven Unsustainable Processes: Medium TermProspects and Policies for the United States and the World" StrategicAnalysis, The Levy Economics Institute of Bard College.

11
Goodwin, R. (1967) "A Growth Cycle." In: Socialism, Capitalism and Economic Growth, by A. Fenstein (ed).
12
Greenspan A. (2000) "The Federal Reserve's Report on MonetaryPolicy" Testimony before the Committee on Banking,Housing and Urban Affairs, U.S. Senate July 20.
13
Krugman P. (2012) “End this Depression Now!” W. W Norton &Company New York.
14
Lapavitsas C. (2009)“Financialized Capitalism : Crisisand Financial Expropriation” RMF series Discussion Paper1, February.
15
Lapavitsas C. (2011) “Theorizing Financialization” Work,employment and society 25(4) pp. 611-626
16
Magdoff H. & Sweezy P. (1987) “Stagnation and the FinancialExplosion” Monthly Review Press, New York.
17
Mai S. (2008) "The Global Derivatives Market: An Introduction" Deutsche Borse A.G., Frankfurt.
18
Mandelbrot B. & Hutson R. (2006) “The (mis) Behavior ofMarkets” Travlos Publications, Athens.
19
Marx K. (1893) Capital VII International Publishers NewYork 1984.
20
Marx K. (1893) “Capital VIII” International Publishers N.Y. 1953.
21
May R. (1975) “Biological Populations ObeyingDifference Equations: Stable Points, Stable Cycles andChaos. Journal of Theoretical Biology p. 511-524.
22
Nicholas J.G. (2008) “Introduction to Global Macro Hedge Funds”J. Zamora publications N.Y.
23
Papadimitriou D., Shaikh A., Dos Santos C. & Zezza G.(2004) "Is Deficit -Financed Growth Limited?" StrategicAnalysis April 2004 The Levy Economics Institute of BardCollege.
24
Pasinetti LL (1962) “Rate of Profit Income Distributionin Relation to the Rate of Economic Growth” Review ofEconomic Studies pp. 267-279.
25
Phelps E. (2000) "Europe s' Stony Ground for the Seedsof Growth" Financial Times, August 9.
26
Pyle D. (1993) "The Economic Functions of Derivatives:An Academian' s Point of View" Finance Working Paper No 229Institute of Business and Economic Research Universityof California at Berkeley
27
Reinhart C. & Rogoff K. (2013)“Financial and SovereignDebt Crises: Some Lessons Learned and Those Forgotten”IMF Working Paper WP/13/266 December 2013
2 Shaikh A. (1997) “The Stock Market and the Corporate

8Sector. A Profit Based Approach.” In “Markets Employmentand Economic Policy” Essays in Honor of Geoff Harcourt VII,Routledge London and New York.
29
Shaikh A. (2011) “The First Great Depression of the 21st
Century” Socialist Register 30
Shiller R.J. (1989) “Market Volatility” The MIT Press,Cambridge Mass.
31
Shiller R.J. (1980) “Do Stock Prices Move too Much to be Justified by Subsequent Changes in Dividends” NBER Working Paper 456 Febr.
32
Stravelakis N. (2012) “Marx s’ Theory of Crisis in theContext of Financialization. Analytical Insights on theCurrent Crisis” Journal of Advanced Studies in Finance Winter2012 pp. 171-191.
33 Taleb N. (2009) “The Black Swan” Random House N.Y.
34
Tobin J. (1970) “Money and Income: Post Hoc ErgoPropter Hoc?” The Quarterly Journal of Economics V.84 pp. 301-317.
35
Tome P.J. (2011) "Financialization as a Theory of Crisis in a Historical Perspective: Nothing New Under the Sun" Working Paper Series No 262 PERI UMASS at Amherst
Related Documents