Financial vulnerability and capability across the life course: A theoretical and empirical exploration “Financial capability across the life course: A focus on vulnerable populations” Center for Social Development Center for Aging Washington University in St. Louis October 25-26, 2012 Margaret S. Sherraden, Professor, University of Missouri – St Louis William R. Emmons, Economist, Federal Reserve Bank of St. Louis Bryan J. Noeth, Policy Analyst, Federal Reserve Bank of St. Louis Nancy Morrow-Howell, Professor, Washington University

Welcome message from author
This document is posted to help you gain knowledge. Please leave a comment to let me know what you think about it! Share it to your friends and learn new things together.
Transcript

Financial vulnerability and capability across the life course: A theoretical
and empirical exploration
“Financial capability across the life course: A focus on vulnerable populations”
Center for Social Development
Center for Aging
Washington University in St. Louis
October 25-26, 2012
Margaret S. Sherraden, Professor, University of Missouri – St Louis
William R. Emmons, Economist, Federal Reserve Bank of St. Louis
Bryan J. Noeth, Policy Analyst, Federal Reserve Bank of St. Louis
Nancy Morrow-Howell, Professor, Washington University
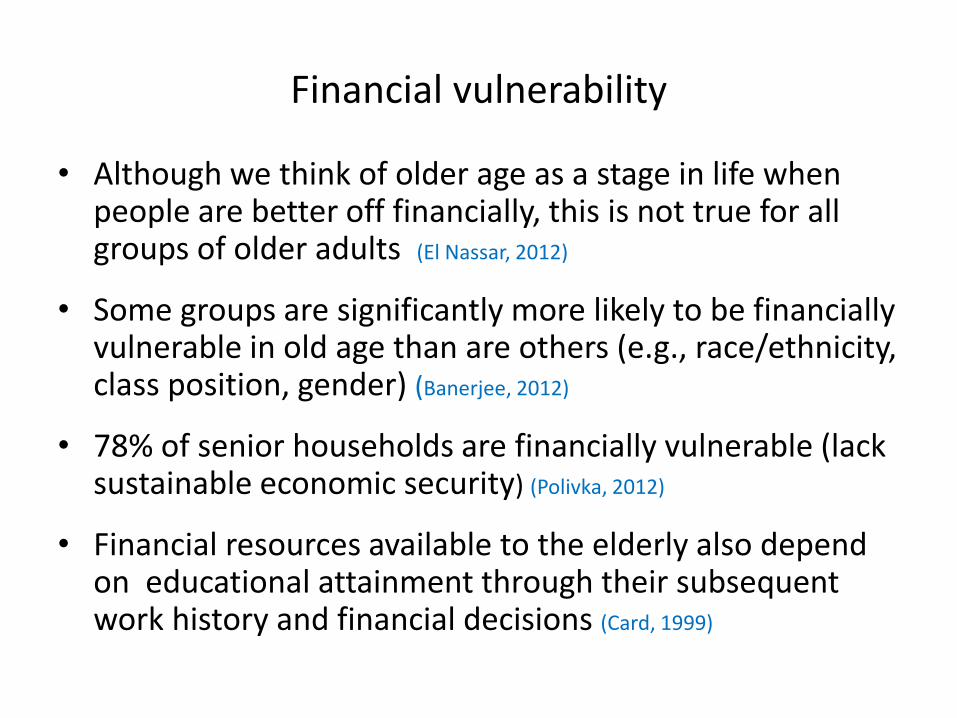
Financial vulnerability
• Although we think of older age as a stage in life when people are better off financially, this is not true for all groups of older adults (El Nassar, 2012)
• Some groups are significantly more likely to be financially vulnerable in old age than are others (e.g., race/ethnicity, class position, gender) (Banerjee, 2012)
• 78% of senior households are financially vulnerable (lack sustainable economic security) (Polivka, 2012)
• Financial resources available to the elderly also depend on educational attainment through their subsequent work history and financial decisions (Card, 1999)
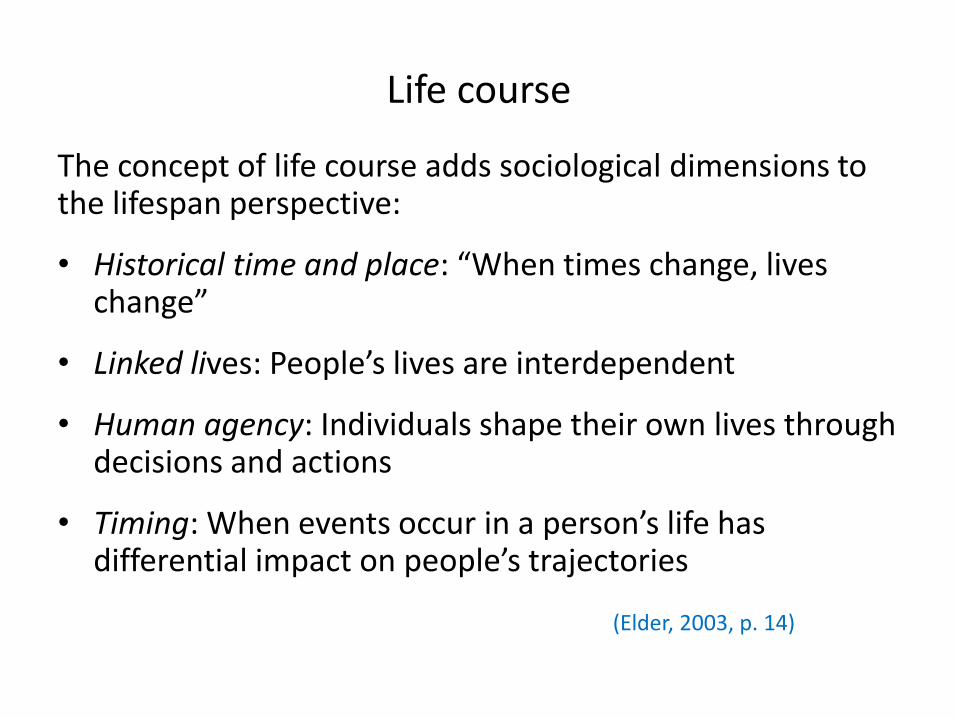
Life course
The concept of life course adds sociological dimensions to the lifespan perspective:
• Historical time and place: “When times change, lives change”
• Linked lives: People’s lives are interdependent
• Human agency: Individuals shape their own lives through decisions and actions
• Timing: When events occur in a person’s life has differential impact on people’s trajectories
(Elder, 2003, p. 14)
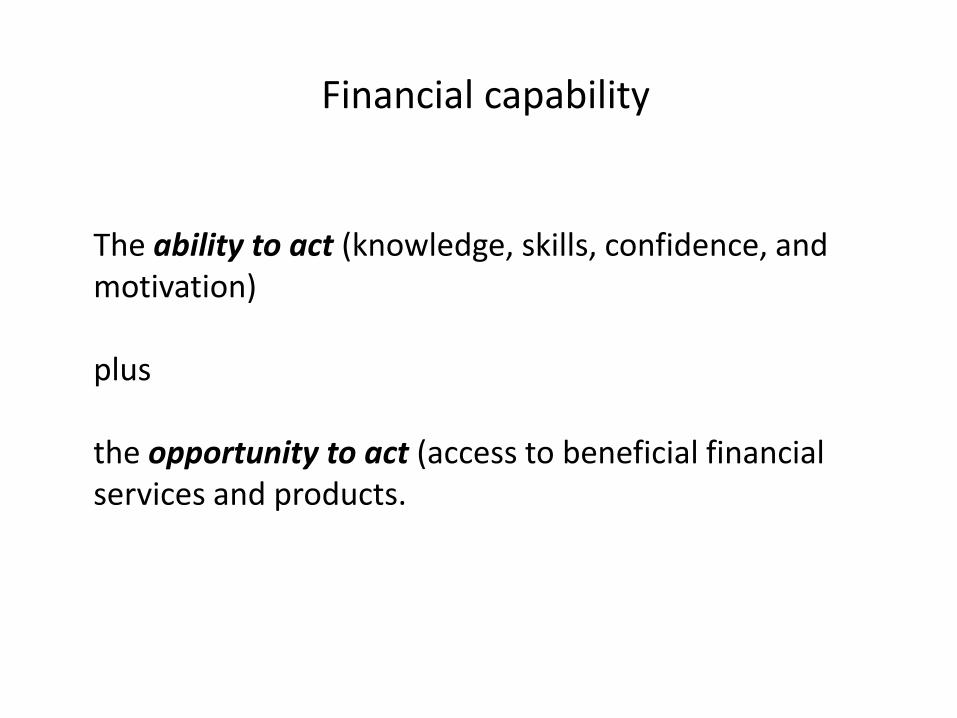
Financial capability
The ability to act (knowledge, skills, confidence, and motivation) plus the opportunity to act (access to beneficial financial services and products.

An illustration: Financial capability across the life course
• Transitions in an individual’s life span
• Life events that have significant financial implications
• Financial knowledge and skills that help people successfully navigate life events
• Financial products and services that make it possible for people to navigate life events successfully
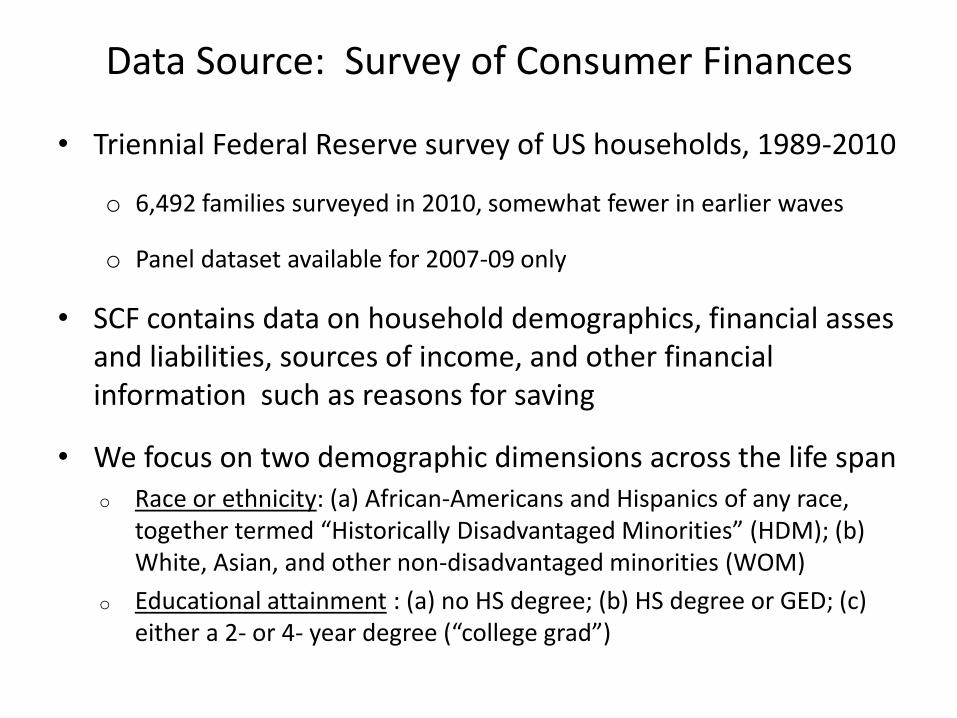
Data Source: Survey of Consumer Finances
• Triennial Federal Reserve survey of US households, 1989-2010
o 6,492 families surveyed in 2010, somewhat fewer in earlier waves
o Panel dataset available for 2007-09 only
• SCF contains data on household demographics, financial asses and liabilities, sources of income, and other financial information such as reasons for saving
• We focus on two demographic dimensions across the life span o Race or ethnicity: (a) African-Americans and Hispanics of any race,
together termed “Historically Disadvantaged Minorities” (HDM); (b) White, Asian, and other non-disadvantaged minorities (WOM)
o Educational attainment : (a) no HS degree; (b) HS degree or GED; (c) either a 2- or 4- year degree (“college grad”)
For off-line discussion: Why use race and education to sort families?
• Race and educational attainment are stable for a given individual—we can track and group people with these characteristics over time and place
o In contrast, income, wealth, homeownership status, state of residence, etc. may change over time for many individuals
o The SCF is a series of cross-sectional samples, so we need stable identifying characteristics to link successive survey waves
• Using demography rather than outcomes like income or wealth to sort people effectively rules out reverse causation, the bane of much empirical work
o Example of reverse causation: “High income causes high wealth” but “High wealth causes high income”, also… a “chicken-or-egg problem”
o Our approach: “Low education causes low income” but “Low income does not cause low education”, which is pre-determined

FAMILY INCOME
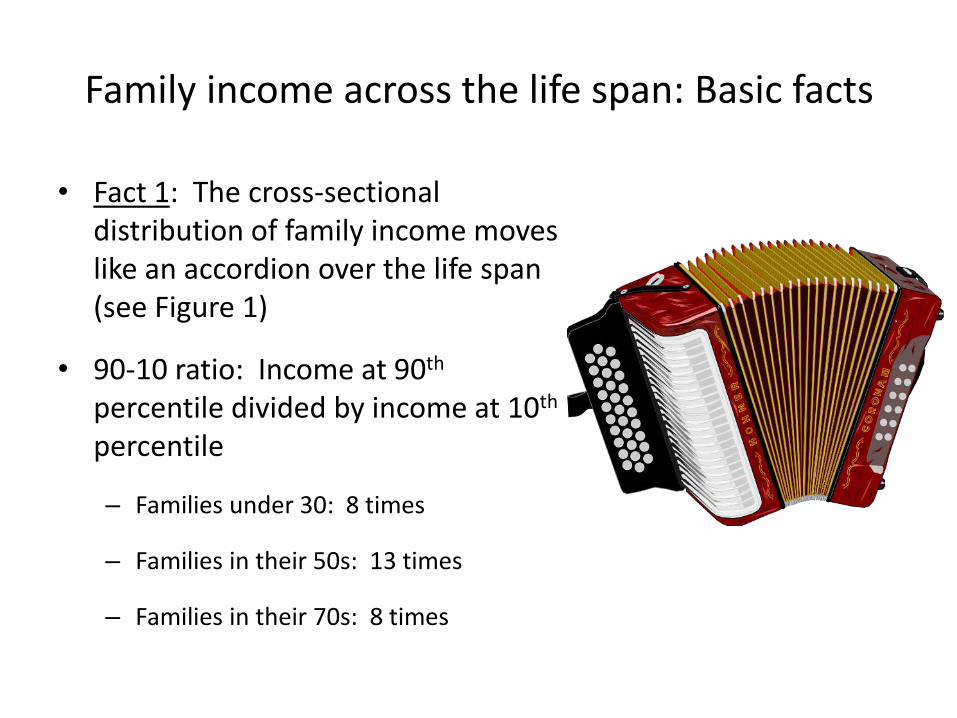
Family income across the life span: Basic facts
• Fact 1: The cross-sectional distribution of family income moves like an accordion over the life span (see Figure 1)
• 90-10 ratio: Income at 90th percentile divided by income at 10th percentile
– Families under 30: 8 times
– Families in their 50s: 13 times
– Families in their 70s: 8 times

-
20,000
40,000
60,000
80,000
100,000
120,000
140,000
160,000
180,000
200,000
18-29 30-39 40-49 50-59 60-69 70-79 80 or older
Fam
ily in
com
e in
do
llars
Age of respondent
2010 Distributions of Family Incomes by Age Group
90th percentile
80th percentile
70th percentile
60th percentile
50th percentile (median)
40th percentile
30th percentile
20th percentile
10th percentile
Figure 1
Source: Federal Reserve Survey of Consumer Finances, 2012

The role of race and ethnicity
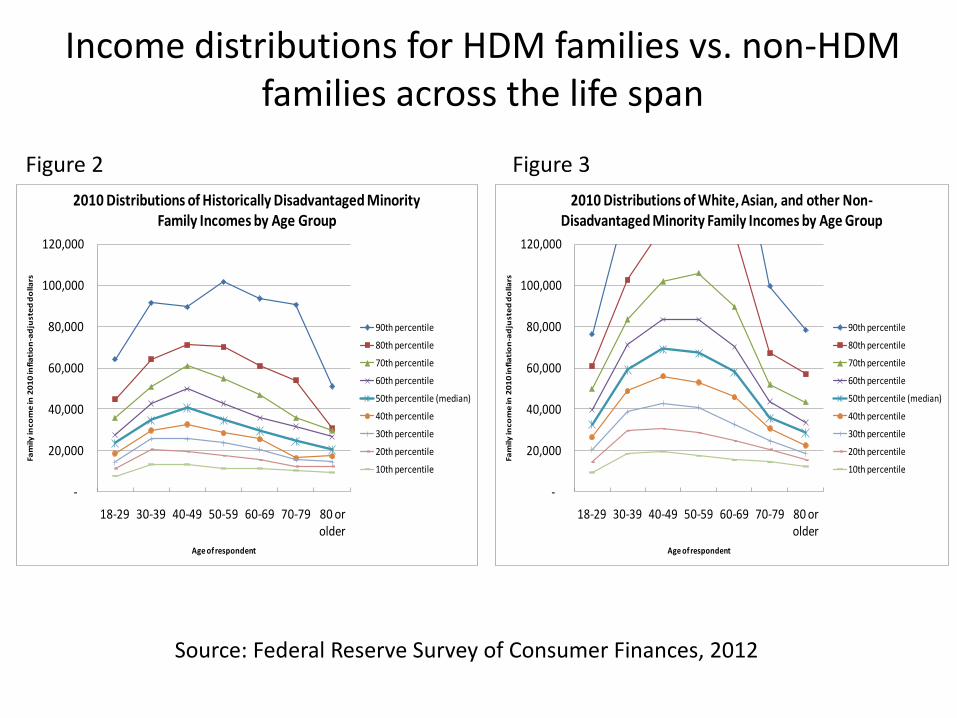
Fact 2: The historically disadvantaged minority income distribution lies substantially below that of non-minorities (see Figures 2 and 3)
o Among HDM families across all ages, median family income was about 61% of non-minority families in 2010 ($31,735 vs. $52,289)
o Disparities were largest when comparing middle-aged minority
families to their non-minority counterparts.
-
20,000
40,000
60,000
80,000
100,000
120,000
18-29 30-39 40-49 50-59 60-69 70-79 80 or older
Fam
ily in
com
e in
20
10
infl
ati
on
-ad
just
ed
do
llars
Age of respondent
2010 Distributions of Historically Disadvantaged Minority Family Incomes by Age Group
90th percentile
80th percentile
70th percentile
60th percentile
50th percentile (median)
40th percentile
30th percentile
20th percentile
10th percentile
Figure 2
Source: Federal Reserve Survey of Consumer Finances, 2012
-
20,000
40,000
60,000
80,000
100,000
120,000
18-29 30-39 40-49 50-59 60-69 70-79 80 or older
Fam
ily in
com
e in
20
10
infl
ati
on
-ad
just
ed
do
llars
Age of respondent
2010 Distributions of White, Asian, and other Non-Disadvantaged Minority Family Incomes by Age Group
90th percentile
80th percentile
70th percentile
60th percentile
50th percentile (median)
40th percentile
30th percentile
20th percentile
10th percentile
Figure 3
Income distributions for HDM families vs. non-HDM families across the life span
The role of education
Fact 3: The distribution of income for less-educated families lies substantially below that for more-educated families (see Figs 4 & 5)
o Among families without a high-school degree across all ages, median family income was about 26% of non-minority families in 2010 ($33,698 vs. $128,567)
o Disparities are largest among middle-aged less-educated families vs. their better-educated counterparts.
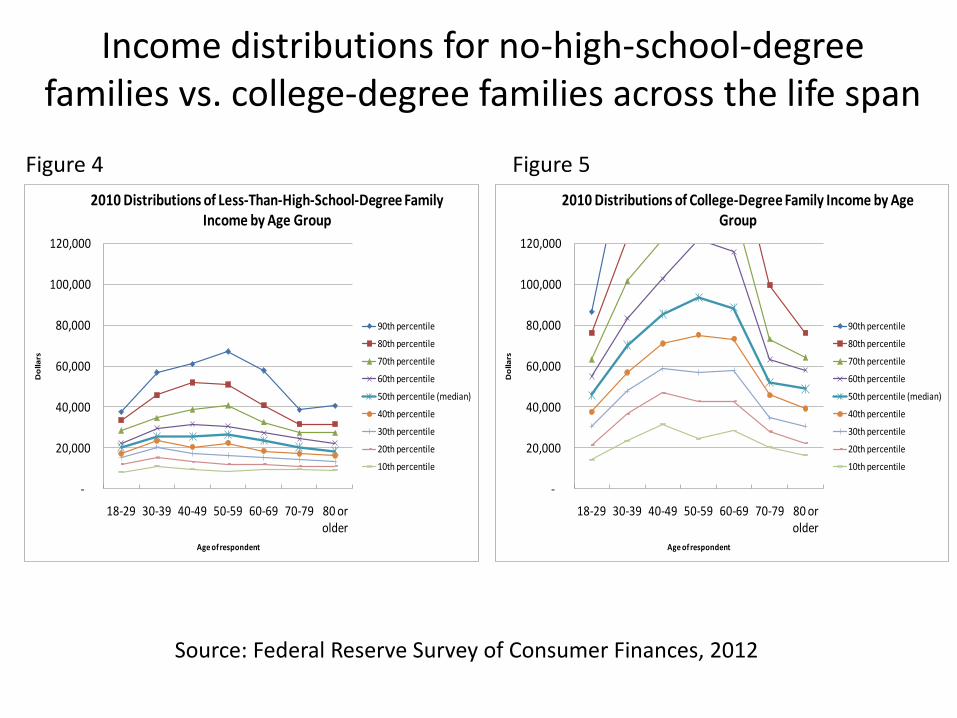
Figure 4
Source: Federal Reserve Survey of Consumer Finances, 2012
Figure 5
Income distributions for no-high-school-degree families vs. college-degree families across the life span
-
20,000
40,000
60,000
80,000
100,000
120,000
18-29 30-39 40-49 50-59 60-69 70-79 80 or older
Do
llars
Age of respondent
2010 Distributions of Less-Than-High-School-Degree Family Income by Age Group
90th percentile
80th percentile
70th percentile
60th percentile
50th percentile (median)
40th percentile
30th percentile
20th percentile
10th percentile
-
20,000
40,000
60,000
80,000
100,000
120,000
18-29 30-39 40-49 50-59 60-69 70-79 80 or older
Do
llars
Age of respondent
2010 Distributions of College-Degree Family Income by Age Group
90th percentile
80th percentile
70th percentile
60th percentile
50th percentile (median)
40th percentile
30th percentile
20th percentile
10th percentile
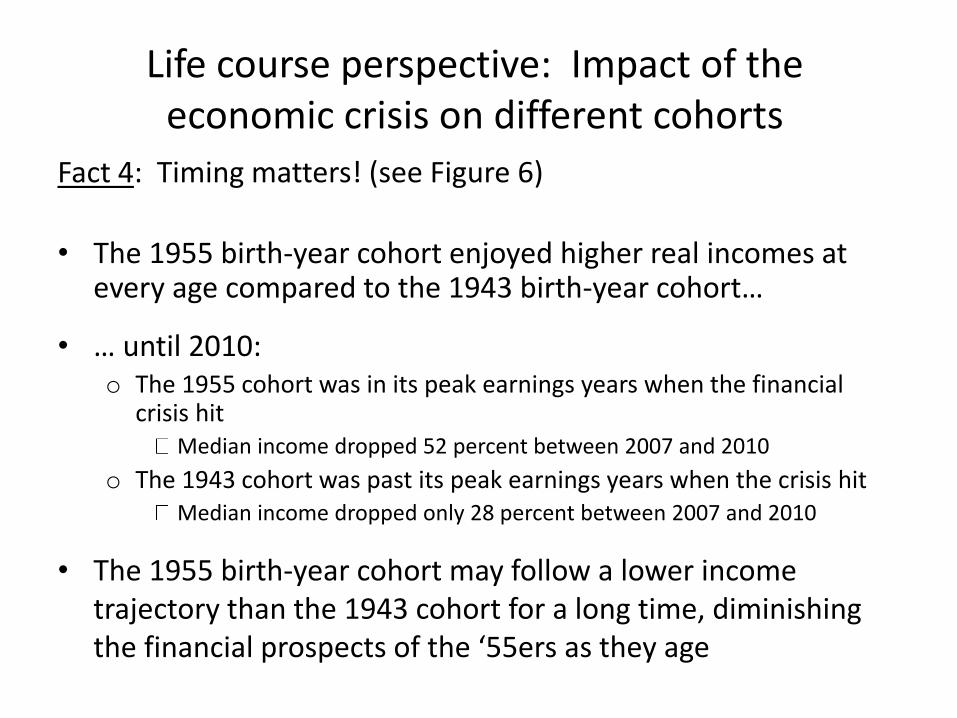
Life course perspective: Impact of the economic crisis on different cohorts
Fact 4: Timing matters! (see Figure 6)
• The 1955 birth-year cohort enjoyed higher real incomes at every age compared to the 1943 birth-year cohort…
• … until 2010: o The 1955 cohort was in its peak earnings years when the financial
crisis hit Median income dropped 52 percent between 2007 and 2010
o The 1943 cohort was past its peak earnings years when the crisis hit Median income dropped only 28 percent between 2007 and 2010
• The 1955 birth-year cohort may follow a lower income trajectory than the 1943 cohort for a long time, diminishing the financial prospects of the ‘55ers as they age
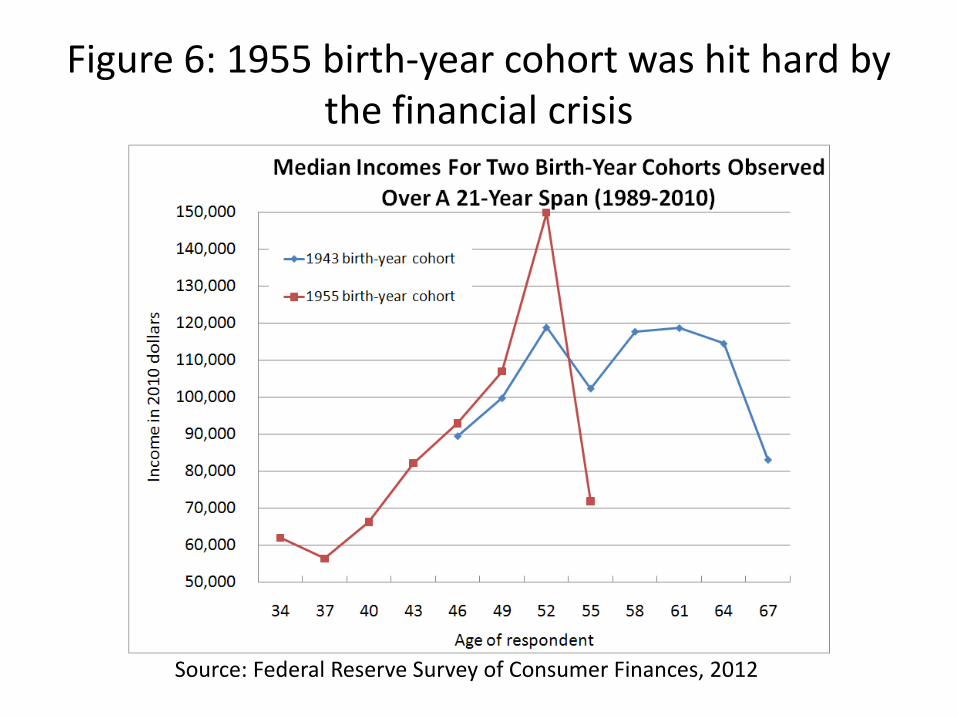
Figure 6: 1955 birth-year cohort was hit hard by the financial crisis
Source: Federal Reserve Survey of Consumer Finances, 2012

FAMILY NET WORTH
Net worth across the life span: Basic facts
• Fact 1: Unlike income, net worth generally does not fall in old age back to the level of youth (Figs. 7 and 8)
• Net worth (total assets minus total liabilities):
o Rises steadily through the 60s
o Retreats somewhat among most higher wealth groups after 60
o Remains roughly constant among families with median wealth or below as they age
• Fact 2: Dispersion between the wealthiest and the poorest families becomes and remains very large over the life span (Figs. 7 and 8)

Net worth distributions across the life span: The role of race and ethnicity
Fact 3: Disparities in net worth are even larger across racial and ethnic groups than income gaps
• Net worth of older HDM families in the 90th percentile of income was only 22 percent as much as the wealth of its non-HDM counterpart ($479,200 vs. $2,189,400).
• Figures 7 and 8: Distributions of family net worth for 7 age groups in HDM and non-HDM families

(100,000)
-
100,000
200,000
300,000
400,000
500,000
600,000
18-29 30-39 40-49 50-59 60-69 70-79 80 or older
Fam
ily in
com
e in
do
llars
Age of respondent
2010 Distributions of Historically Disadvantaged Minority Family Net Worth by Age Group
90th percentile
80th percentile
70th percentile
60th percentile
50th percentile (median)
40th percentile
30th percentile
20th percentile
10th percentile
(100,000)
-
100,000
200,000
300,000
400,000
500,000
600,000
18-29 30-39 40-49 50-59 60-69 70-79 80 or older
Fam
ily in
com
e in
do
llars
Age of respondent
2010 Distributions of White, Asian, and Non-Disadvantaged Minority Family Net Worth by Age Group
90th percentile
80th percentile
70th percentile
60th percentile
50th percentile (median)
40th percentile
30th percentile
20th percentile
10th percentile
Source: Federal Reserve Survey of Consumer Finances, 2012
Figure 7 Figure 8
Net worth for HDM families vs. non-HDM families across the life span

Net worth distributions across the life span: The role of education
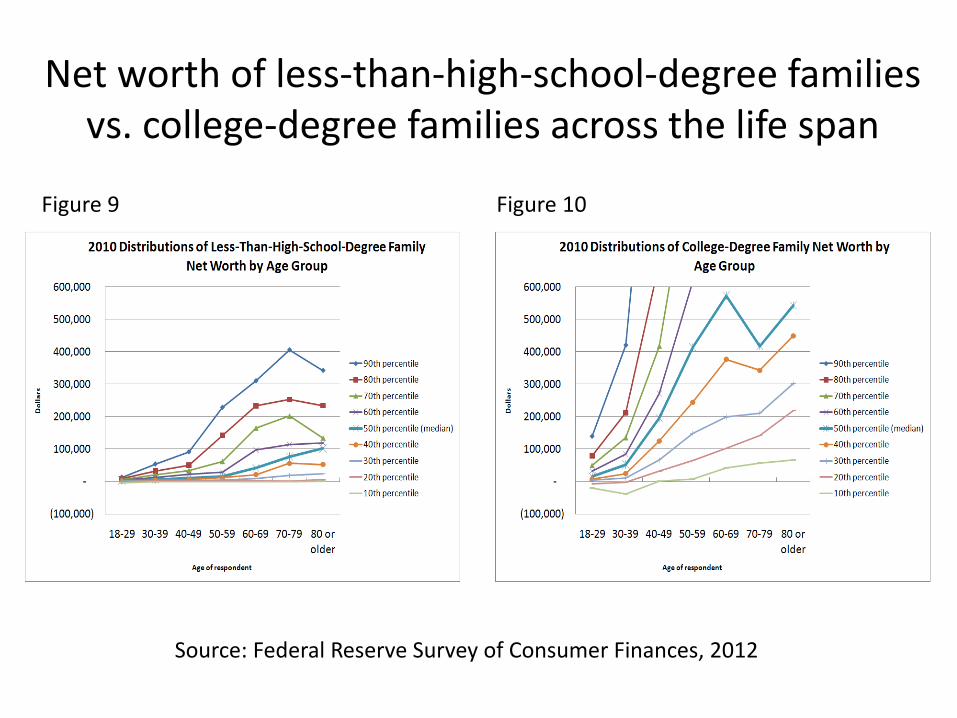
Fact 4: Disparities in net worth are enormous between families with very low and very high levels of education (Figs. 9 and 10)
• The median net worth of a family in their 50s without a high-school degree is just 4% of the median net worth of a college-educated family in their 50s ($15,800 vs. $413,600)
Fact 5: Disparities in net worth continue to expand over the entire life span (Figs. 9 and 10)
Source: Federal Reserve Survey of Consumer Finances, 2012
Figure 9 Figure 10
Net worth of less-than-high-school-degree families vs. college-degree families across the life span
Life course perspective: Impact of economic crisis on net worth across cohorts
• Among all families, mean net worth declined 15.2%, median net worth declined by 39% (2007-2010).
• Younger and middle-aged groups suffered higher losses of net worth (43.9% and 17.4%) compared to older adults (10.3%).
• Older adults’ (62 and over) average debt increased 5 times ($12,201 to $60,846) between 1989-2010.
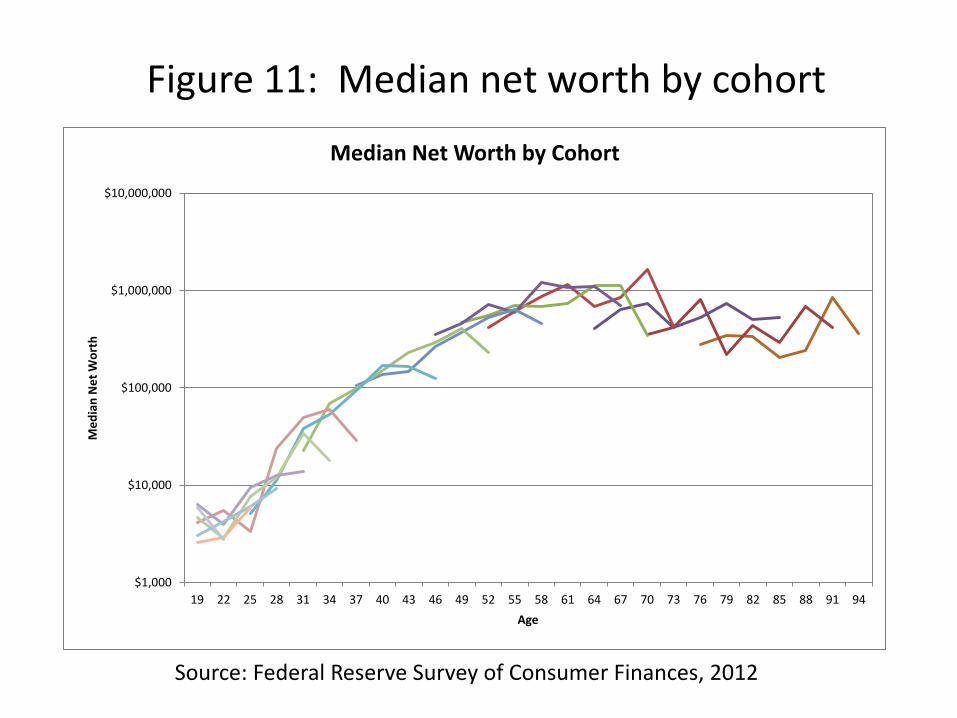
Figure 11: Median net worth by cohort
$1,000
$10,000
$100,000
$1,000,000
$10,000,000
19 22 25 28 31 34 37 40 43 46 49 52 55 58 61 64 67 70 73 76 79 82 85 88 91 94
Me
dia
n N
et
Wo
rth
Age
Median Net Worth by Cohort
Source: Federal Reserve Survey of Consumer Finances, 2012
Older minority families in debt
Figure 12: Elderly minority families have more trouble paying off debt—especially after the financial crisis
• Minority families generally carry more debt later in life than non-minority families (measured by the debt-to-assets ratio).
• The financial crisis was a setback for older families reducing their debt burdens, especially for minority families at the extreme high end of the debt-to-assets ratio.

Figure 12
Older minority families have more trouble paying off debt—especially after the financial crisis
Elderly minorities pre-crisis
Elderly non-minorities pre-crisis
Elderly minorities post-crisis
Elderly non-minorities post-crisis
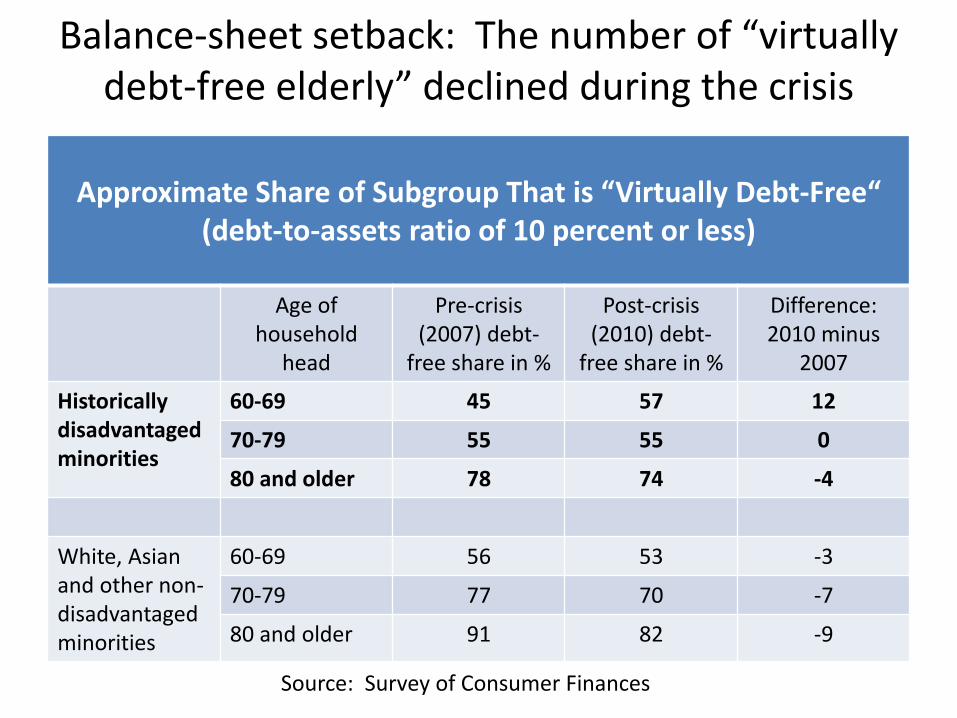
Balance-sheet setback: The number of “virtually debt-free elderly” declined during the crisis
Approximate Share of Subgroup That is “Virtually Debt-Free“ (debt-to-assets ratio of 10 percent or less)
Age of household
head
Pre-crisis (2007) debt-
free share in %
Post-crisis (2010) debt-
free share in %
Difference: 2010 minus
2007
Historically disadvantaged minorities
60-69 45 57 12
70-79 55 55 0
80 and older 78 74 -4
White, Asian and other non-disadvantaged minorities
60-69 56 53 -3
70-79 77 70 -7
80 and older 91 82 -9
Source: Survey of Consumer Finances
Summary
• People come to old age with financial vulnerabilities because of their race/ethnicity, class position, and gender.
• The most vulnerable older families are most likely to be among those we identify as vulnerable in earlier life stages: minorities, low education levels, and/or low incomes.
• Since the recession, as a whole, older adults are doing better than younger families, because (a) they are less likely to have lost wage income during the recession and (b) they were less exposed to housing debt and had much less debt.
Effects of the crisis on future generations of older adults?
• It may take a long time for hard-hit families to recover from the economic crisis.
• Younger (especially minority) homeowners appear to have been hit the worst but they have longer to recover.
• Older families were least affected, but those who were have less time and means to recover.
• Understanding full effects of the crisis on future generations of older adults requires more research.
• We need panel data to determine long term effects of the crisis.

Financial capability
• Can interventions that increase financial capability change the financial life course?
• Or are initial conditions dominant?
• It remains to be seen if by building financial capability throughout a person’s lifetime can help them catch up with those who are more well-endowed.
Related Documents