Issuer Hudson Malta p.l.c. (C 83425) Guarantor Hudson Malta Sales Ltd (formerly Time International (Sport) Limited) (C 32438) Financial Analysis Summary 28 June 2021

Welcome message from author
This document is posted to help you gain knowledge. Please leave a comment to let me know what you think about it! Share it to your friends and learn new things together.
Transcript

Issuer
Hudson Malta p.l.c.
(C 83425)
Guarantor
Hudson Malta Sales Ltd (formerly Time International (Sport) Limited) (C 32438)
Financial Analysis Summary
28 June 2021

Hudson Malta p.l.c. Hudson House Burmarrad Road, Burmarrad St Paul’s Bay SPB 9060 Malta 28 June 2021 Dear Sirs Hudson Malta p.l.c. Financial Analysis Summary In accordance with your instructions, and in line with the requirements of the Listing Authority Policies, we have compiled the Financial Analysis Summary (“Analysis”) set out in the following pages and which is being forwarded to you together with this letter. The purpose of the financial analysis is that of summarising key financial data appertaining to Hudson Holdings Limited (the “Hudson Group” or “HHL”), Hudson Malta p.l.c. (the “Company”, “Issuer” or “Malta Group”), and Hudson Malta Sales Ltd (formerly Time International (Sport) Limited) (the “Guarantor”). The data is derived from various sources or is based on our own computations as follows: (a) Historical financial data for the years ended 31 December 2018 to 31 December 2020 has been
extracted from the audited consolidated financial statements of HHL; and the audited consolidated financial statements of the Issuer for the years ended 31 December 2018 and 31 December 2020.
(b) The forecast data of the Malta Group for the year ending 31 December 2021 has been provided by management of the Company.
(c) Our commentary on the results of the Hudson Group, Malta Group and on their respective financial position is based on the explanations provided by the Company.
(d) The ratios quoted in the Financial Analysis Summary have been computed by us applying the definitions set out in Part 4 of the Analysis.

(e) Relevant financial data in respect of the companies included in Part 3 has been extracted from
public sources such as websites of the companies concerned, financial statements filed with the Registrar of Companies or websites providing financial data.
The Analysis is meant to assist investors in the Company’s securities and potential investors by summarising the more important financial data of the Hudson Group and Malta Group. The Analysis does not contain all data that is relevant to investors or potential investors. The Analysis does not constitute an endorsement by our firm of any securities of the Company and should not be interpreted as a recommendation to invest in any of the Company’s securities. We shall not accept any liability for any loss or damage arising out of the use of the Analysis. As with all investments, potential investors are encouraged to seek professional advice before investing in the Company’s securities. Yours faithfully,
Evan Mohnani Senior Financial Advisor MZ Investment Services Ltd 63, St Rita Street, Rabat RBT 1523, Malta Tel: 2145 3739

HUDSON MALTA PLC FINANCIAL ANALYSIS SUMMARY 1
TABLE OF CONTENTS
PART 1 – INFORMATION ABOUT THE HUDSON GROUP AND THE MALTA GROUP ............................ 2
1. The Hudson Group ......................................................................................................... 2
1.1 An Overview ............................................................................................................................. 2
1.2 Organisational Structure .......................................................................................................... 3
1.3 Directors .................................................................................................................................. 4
1.4 Executive Management Team ................................................................................................. 5
1.5 Senior Management ................................................................................................................ 5
2. The Malta Group ............................................................................................................ 6
2.1 Key Activities of the Issuer ....................................................................................................... 6
2.2 Key Activities of the Guarantor ................................................................................................ 6
2.3 Overview of Leased Stores and Third Party Operated Stores ................................................. 7
3. Market Overview ........................................................................................................... 8
3.1 Economic Update ..................................................................................................................... 8
3.2 Fashion Retail Sector ............................................................................................................... 9
4. The Impact of COVID-19 ............................................................................................... 12
5. Trend Analysis and Business Strategy ............................................................................ 12
PART 2 – PERFORMANCE REVIEW ............................................................................................... 13
6. Financial Information – Hudson Group .......................................................................... 13
7. Financial Information – Malta Group............................................................................. 20
8. Variance Analysis – Malta Group .................................................................................. 27
PART 3 - COMPARABLES ............................................................................................................. 30
PART 4 - EXPLANATORY DEFINITIONS .......................................................................................... 32
HUDSON MALTA PLC FINANCIAL ANALYSIS SUMMARY 2
PART 1 – INFORMATION ABOUT THE HUDSON GROUP AND THE MALTA GROUP
1. THE HUDSON GROUP
1.1 AN OVERVIEW
The Hudson Group is involved in the retail and distribution of branded fashion and sportswear in Southern Europe (incl. Malta) and Africa. Central operations are based in Malta which includes the logistics and supply chain, human resources, financial reporting, business support, strategy and the Group’s leadership team.
Some of the key brands presently managed by the Hudson Group are NIKE, Converse, Intersport, Kiabi, New Look, Tommy Hilfiger, Ted Baker, Alcott and River Island, most of which are subject to franchise or distribution agreements which have been in effect for a significant number of years and which, to date, have been renewed by the respective franchisors – the indication is that such pattern will carry on in the foreseeable future.
In terms of an agreement dated 5 March 2018 between Hudson Holdings Limited (“HHL”) and the Issuer, all business activity carried out in Malta relating to sports and fashion business where Hudson Group acts as franchisee or operator, shall be performed exclusively through the Issuer or Hudson Malta Sales Ltd.
1.1.1 Local Operations
Malta Group is a leading retailer (brick-and-mortar and online) and distributor of fashion and sportswear products in Malta. It represents numerous sport brands such as NIKE, Converse, Timberland, Crocs, Eastpak, and Intersport as well as its own franchise concepts - Urban Jungle and Urban Bratz – of which the former is also present in Italy and Africa. In fashion retail, Malta Group operates New Look, River Island, Ted Baker, Alcott, Kiabi and more recently Missguided.
Intersport was introduced to Malta in 2020 with the opening of the brand’s first store in Tower Road, Sliema. Since then, the Group has transformed several of the Group’s other sport stores operating under the Go Sport and House of Sport banners to Intersport.
1.1.2 International Operations
Hudson Group has a direct retail presence in Southern European and African countries as well as distribution contracts some of which cover 30 territories. Urban Jungle is present online (www.urbanjunglestore.com) and in Rome, Naples, Casablanca, and Algiers. In Africa, Hudson Group has retail operations in Algeria and Morocco, and distributes NIKE products in 20 countries in Africa with the right to distribute to another 10 countries. These are served from Hudson Group’s logistic hub in Malta and through in country offices. Hudson Group also undertakes the distribution of other brands, mainly in the sportswear sector (such as Converse) for parts of Africa, with a current focus on

HUDSON MALTA PLC FINANCIAL ANALYSIS SUMMARY 3
the North African and Sub Saharan countries. During 2020, the Group halted its operations in Spain which were severely impacted by the COVID-19 pandemic. In 2021, the Group is targeting to launch its first retail operation in Cyprus.
1.2 ORGANISATIONAL STRUCTURE
The diagram hereunder illustrates the organisational structure of the Hudson Group.
100% 100%
99.9%
99.9%
99.9%
100%
100%
99.9%
65%
100%
100%
43.56%
100%
100%
1 The remaining 0.01% shareholding in Hudson Brand Development Nigeria Limited is held by Hudson Holdings Limited, while the remaining 0.01% shareholding in each of BD Tunisia SARL and BD Morocco SARL is held by Time International Company Limited.
2 Sports Alliance Limited, BD International Group Limited and BD Tunisia SARL are in liquidation.
Hudson Malta p.l.c. (Malta) ISSUER
Hudson Holdings Limited (Malta)
Time International Company Limited
(Malta)
Italian Operations Limited SRL (Italy)
Hudson Malta Sales Ltd (formerly Time
International (Sport) Limited) (Malta)
GUARANTOR
Hudson Libya UMOS Joint Venture SC Company (Libya)
Sports Alliance Limited2
(British Virgin Islands)
Hudson Cyprus Ltd (Cyprus)
UJ International Co Limited (Malta)
BD International Group Limited
(Malta)
Hudson Brand Development Nigeria
Limited (Nigeria)1
Premium Brands SPA (Algeria)
BD International Group Limited2
(British Virgin Islands)
BD Morocco SARL1 (Morocco)
BD Tunisia SARL1, 2 (Tunisia)
MALTA PILLAR AFRICA PILLAR EUROPE PILLAR
HUDSON MALTA PLC FINANCIAL ANALYSIS SUMMARY 4
On 7 March 2019, BD International Group Limited (C 61540) (a wholly owned subsidiary of HHL) signed a 65-year emphyteutical concession with Malta Industrial Parks Limited, pursuant to which BD International Group Limited was granted by title of temporary emphyteusis a portion of land situated in the Hal Far Industrial Estate measuring approximately 5,000m2, together with all buildings being erected thereon. Construction and fit-out works were concluded in Q1 2021 for the aggregate amount of €3.5 million. In terms of a prospectus dated 23 March 2018, an amount of €2.5 million out of the net proceeds of the bond issue were utilised to part finance the development of the said distribution centre. With this investment the Hudson Group has tripled its previous storage capacity and, with dedicated areas for specific aspects of the distribution process, allows for more capacity in handling more products and different brands.
With effect on 14 March 2021, Hudson Malta Sales Ltd (formerly Time International (Sport) Limited) (“HMSL”) completed the merger by acquisition of Hudson International Company Limited (“HICL”). In virtue of the said merger by acquisition, HMSL, as the acquiring company, succeeded to all the assets, rights, liabilities and obligations of HICL, which, in turn, ceased to exist and has been struck off.
Hudson Italia SRL, Times 5 Limited and Urban Jungle Sneakers S.L were liquidated on 4 February 2021, 28 February 2021 and 10 June 2021 respectively and as such have been excluded from the above organisational structure.
1.3 DIRECTORS
1.3.1 Directors of the Issuer
The Issuer is managed by a Board consisting of six directors entrusted with the overall direction and management of the Company.
George Amato Executive Director
Alfred Borg Executive Director
Christopher Muscat Executive Director
Victor Spiteri Independent Non-Executive Director
Kevin Valenzia Independent Non-Executive Director
Brian Zarb Adami Independent Non-Executive Director
1.3.2 Directors of the Guarantor
The Guarantor is managed by a Board of Directors entrusted with its overall direction and management, and is composed as follows:
Alfred Borg Executive Director
Felice Ilacqua Executive Director
Christopher Muscat Executive Director

HUDSON MALTA PLC FINANCIAL ANALYSIS SUMMARY 5
1.4 EXECUTIVE MANAGEMENT TEAM
The executive committee (EXCO) is responsible and empowered to manage the Hudson Group’s operations. The EXCO is a decision-making entity set up to implement the Board’s strategic business plans and policies consistent with the organisation’s vision, values and behaviours in order to meet the Hudson Group’s business objectives and targets. The EXCO advises the Board on decision and business matters such as strategy, policy and investment risk and is composed of the following individuals: Alfred Borg, Christopher Muscat, George Amato, Jonathan Briffa and Martin Gregory. The EXCO also includes a Non-Executive member and to this date this role is being filled by Kevin Valenzia. Other members of the Senior Management (listed in section 1.5 below) are invited to contribute as required.
1.5 SENIOR MANAGEMENT
In the day-to-day operations of the Hudson Group, the EXCO is supported by the senior management team composed of the following individuals:
Alfred Borg Chairman
Christopher Muscat Chief Executive Officer
Jonathan Briffa Finance Director
George Amato Supply Chain Director
Peter Gauci IT Manager
Martin Gregory Human Resources Director
Ritianne Grech Territories – Malta Retail
Felice Ilaqua Territories – Malta & Africa Wholesale Sports Brands
Luca Moscati Territories – Italy
Nicolas Vidal Territories – Africa – Retail and Wholesale
Indrek Heinmets Brands – Nike
Gianluca Salute Brands – UJ & Blackbox
Animesh Kumar Head of Digital
Despina Vamvoukli Product and Planning Director

HUDSON MALTA PLC FINANCIAL ANALYSIS SUMMARY 6
2. THE MALTA GROUP
2.1 KEY ACTIVITIES OF THE ISSUER
The Issuer was established on 10 November 2017 and is a wholly-owned subsidiary of HHL (the ultimate parent of the Hudson Group), and is the parent company of the Malta operations of the Hudson Group. The principal object of the Issuer is to purchase or otherwise acquire, under any title whatsoever, to hold and manage, by any title, movable and immovable property or other assets, including but not limited to securities and other financial interests. The issue of bonds falls within the objects of the Issuer.
The Issuer’s intended purpose is to further expand the Malta Group's retail and wholesale distribution operations in Malta of branded fashion and sportswear, and part-finance the Group’s retail and wholesale expansion overseas. In FY2020, business operations were performed by the Guarantors: Hudson Malta Sales Ltd (formerly Time International (Sport) Limited) (“HMSL”) and Hudson International Company Limited. Pursuant to the merger of the Guarantors, as of 1 January 2021, operational activities are conducted by HMSL. Accordingly, the Issuer is mainly dependent on the business prospects of HMSL.
2.2 KEY ACTIVITIES OF THE GUARANTOR
HMSL is principally engaged in the importation, distribution and retailing of branded fashion wear and sportswear in Malta. The company operates retail stores in Malta and Gozo. The complete list of stores is provided in section 2.3 below.
The flagship sports brand operated by HMSL is NIKE, the largest brand of athletic footwear and apparel globally. In addition, HMSL operates and franchises two multi-brand franchise concepts, namely Intersport and Urban Jungle, and sells NIKE product to the Urban Jungle stores operating in Europe.
The most significant fashion wear brands operated by HMSL include Kiabi, New Look, Ted Baker and River Island. In May 2021, HMSL opened a Missguided store at Bay Street Shopping Complex, St Julians.

HUDSON MALTA PLC FINANCIAL ANALYSIS SUMMARY 7
2.3 OVERVIEW OF LEASED STORES AND THIRD PARTY OPERATED STORES
A description of stores in operation as at the date of this report is provided in the following table:
Name of Store Location Status/Comments1 Alcott Qormi Open
2 KIABI Qormi Open
3 KIABI Burmarrad Open
4 KIABI The Point, Sliema Open
5 Missguided Bay Street Complex Open
6 New Look Fgura Open
7 River Island The Point, Sliema Open
8 River Island Qormi Open
9 Ted Baker The Point, Sliema Open
10 Intersport Qormi Open
11 Intersport Burmarrad Open
12 Intersport Fgura Open
13 Intersport Sliema Open
14 Intersport Pjazzetta, Sliema Open
15 Intersport Paceville Open
16 NIKE The Point, Sliema Open
17 Crocs Sliema Open
18 Urban Jungle The Point, Sliema Open
19 Urban Jungle PAMA, Mosta Open
20 Urban Jungle Paceville Open
21 Urban Bratz Bay Street Complex Open
FRANCHISED STORES
1 Intersport Valletta Open
2 Intersport Gozo Open
3 Timberland Sliema Open

HUDSON MALTA PLC FINANCIAL ANALYSIS SUMMARY 8
3. MARKET OVERVIEW
3.1 ECONOMIC UPDATE1
Malta’s economy should see a robust recovery 2022, provided that the tourism sector opens up safely. The recovery is expected to be driven by a rebound in tourism-related services exports, household consumption and investment. Given the supportive fiscal policy stance, the general government deficit is set to widen further in 2021 before improving in 2022 on the back of an accelerating recovery and a winding-down of fiscal support measures.
The COVID-19 pandemic has decimated tourism proceeds and made a deep dent in consumption. Malta’s GDP2 fell significantly in 2020 with services exports and household consumption contracting sharply under the pressure of the pandemic and related safety measures. On the contrary, financial services and gaming sector exports continued to perform robustly. Although the pandemic has clearly depressed economic activity in Malta, the government’s sizeable stimulus package has managed to partially offset some of the impact. Wage supplement schemes and other business support measures appear to have cushioned the drop in consumption.
Consumption and investment are expected to pick up as the recovery takes hold, helped by high levels of accumulated savings, although the very recent FATF decision may have a negative impact on investment. The faster-than-expected rollout of vaccinations in Malta, the high rate of vaccination in the UK, and a gradual easing of restrictions in the EU, should put the tourism sector back on the path to recovery in the second half of 2021 and re-invigorate domestic demand. In 2021, real GDP growth is expected to reach 4.6%, mainly driven by domestic consumption and net exports, as inbound tourism and global trade recover. Robust government expenditure is likely to continue supporting the economy, including via public investment. With both exports and imports recovering, the current account deficit is still expected to widen this year before starting to decrease in 2022.
Supported strongly by policy measures, headcount employment actually increased in 2020 especially in the public sector, professional services, and construction, while there was only a limited increase in Malta’s unemployment rate, to 4.3% from 3.6% in 2019. As employment is expected to continue growing at a slow pace, the decrease in unemployment is expected to be gradual.
Harmonised Index of Consumer Prices (HICP)3 inflation averaged 0.8% in 2020, contained mainly by lower energy and services inflation against a backdrop of contracting demand. In 2021, inflation is expected to rise to 1.2% as domestic demand and tourism services recover. In line with a stronger economic recovery in 2022, inflation is set to increase further to 1.5%.
The government deficit increased to over 10% of GDP in 2020. The major increase in expenditure related to pandemic-mitigating measures was the main reason behind the deteriorating fiscal balance.
1 Economic Forecast – Spring 2021 (European Commission Institutional Paper 149 May ’21). 2 Gross Domestic Product (GDP) is an estimate of the value of goods and services produced in the economy over a period of time. 3 The Harmonised Indices of Consumer Prices (HICP) measure the changes over time in the prices of consumer goods and services acquired by households.

HUDSON MALTA PLC FINANCIAL ANALYSIS SUMMARY 9
These measures included a wage support scheme, a voucher scheme to support the hospitality and retail sectors, utility and rent subsidies for businesses, and healthcare-related outlays, which overall amounted to somewhat less than 6.5% of GDP in 2020. On the revenue side, the steep fall in household and tourist consumption led to a drop in indirect tax revenue. Corporate tax revenues plunged, reflecting the worsened profitability of companies. Sustained by government measures and the relatively good performance of the labour market, revenue from social contributions actually increased.
In 2021, the government deficit is projected to increase further to 11.8% of GDP reflecting ongoing supportive fiscal policy. Growing private consumption and a gradual revival of tourism are expected to support the government’s intake from indirect taxes. Revenue from income taxes is projected to grow in line with modest wage growth and the stabilised operating environment for businesses. Proceeds from the investor citizenship scheme are expected to stabilise at last year’s level. The measures to sustain the recovery including the extended wage supplement scheme, a new round of the voucher scheme, and newly introduced measures to restore the tourism sector, are expected to continue in 2021. As the economy accelerates and economic support measures wear off, the deficit is forecast to decline in 2022 to around 5.5% of GDP.
The government debt-to-GDP ratio surged to 54.3% in 2020 following the deterioration of the fiscal position. Reflecting ongoing high primary deficits, the debt ratio is set to increase further and reach 65.5% in 2022.
3.2 FASHION RETAIL SECTOR
Data in relation to the size of the apparel market in Malta is not published. Notwithstanding, an estimate of the retail store market has been derived from data obtained from the National Statistics Office of Malta (the latest available information relates to calendar year 2019). Data with respect to online sales generated in Malta is not available and therefore is excluded from the analysis below.
The table below sets out statistics in relation to sales of apparel (excluding textiles, footwear and leather goods) by retail outlets in Malta. The information has been analysed by size of outlet on the basis of the number of staff employed by a retail store.

HUDSON MALTA PLC FINANCIAL ANALYSIS SUMMARY 10
During the period under review (2009 – 2019), the average total number of outlets amounted to 684 units. Further analysis shows that in the small stores category (0-9 employees), number of stores decreased by 19% from 706 units in 2009 to 571 units in 2019. In contrast, the medium (10-49 employees) and large (50-249 employees) stores categories reported an increase (in aggregate) over the period from 28 units in 2009 to 48 units in 2019 (+71%).
Furthermore, consumer spending has also changed and shows a preference towards the larger stores. In fact, during the period 2009 to 2019, small and mid-sized outlets registered a compounded annual increase in turnover of only 0.7% and 0.6% respectively, while the larger outlets recorded a compounded annual growth rate in turnover of 9.8%. Overall, consumer spending in apparel retail in Malta increased at a compounded annual growth rate of 5.1% over the reviewed period from €159 million in 2009 to €262 million in 2019.
Turnover of Apparel Retail Stores in Malta2009 2010 2011 2012 2013 2014 2015 2016 2017 2018 2019 2009-19
0-9 employeesTotal turnover (€'million) 63 52 54 59 57 60 62 67 61 65 68 0.7%No. of outlets (units) 706 667 675 677 657 660 602 632 614 595 571 Average turnover (€'million) 0.09 0.08 0.08 0.09 0.09 0.09 0.10 0.11 0.10 0.11 0.12 Year-on-year growth -13% 2% 10% -1% 5% 14% 2% -5% 10% 9%
10-49 employeesTotal turnover (€'million) 33 50 51 45 48 43 47 49 47 39 35 0.6%No. of outlets (units) 17 28 29 28 27 26 32 33 31 28 31 Average turnover (€'million) 1.92 1.77 1.76 1.61 1.76 1.64 1.47 1.50 1.52 1.40 1.11 Year-on-year growth -8% -1% -8% 9% -7% -10% 2% 2% -8% -21%
50-249 employeesTotal turnover (€'million) 63 68 64 78 81 91 114 121 137 144 159 9.8%No. of outlets (units) 11 12 13 14 14 14 15 15 16 17 17 Average turnover (€'million) 5.69 5.64 4.92 5.55 5.78 6.50 7.57 8.07 8.55 8.47 9.36 Year-on-year growth -1% -13% 13% 4% 13% 16% 7% 6% -1% 10%
Total Turnover (€'million) 159 169 169 182 185 193 223 237 245 249 262 5.1%Year-on-year growth 7% 0% 8% 2% 4% 15% 6% 4% 1% 5%
Source: National Statistics Office Malta (NACE 47.71 data)
63 52 54 59 57 60 62 67 61 65 68
33 50 51 45 48 43 47 49 47 39 35
63 68 64 78 81 91114 121 137 144 159
0
50
100
150
200
250
300
2009 2010 2011 2012 2013 2014 2015 2016 2017 2018 2019
Reve
nue
€ '0
00,0
00
Turnover of Apparel Retail Stores in Malta
0-9 employees 10-49 employees 50-249 employees

HUDSON MALTA PLC FINANCIAL ANALYSIS SUMMARY 11
The above chart provides an indication of the trend in performance of the overall retail sector in Malta as compared to the European Union (2015 being the base year = 100). According to the EU trend line above, retail trade was marginally in decline between 2010 and 2013 but increased at a constant rate of growth thereafter, up to Q2 2020. Pursuant to the COVID-19 outbreak in March 2020, retail activity declined 5% in Q2 2020 compared to Q4 2019 but recovered to some extent by Q4 2020.
Retail activity in Malta has broadly tracked the EU average, except for the outperformance registered in 2018 and 2019. Various factors have contributed to this strong performance, including: (i) the robust overall growth of the Maltese economy and a strong labour market which has outpaced the EU average; and (ii) the increase in population of the expat community in Malta.
In Q2 2020, the fashion retail sector in Malta decreased by 18% as a result of the pandemic. Due to the imposition of a lockdown by Government, all non-essential retail outlets were closed during March 2020 till end of April 2020 and re-opened for business on 4 May 2020. Notwithstanding the re-opening, turnover generated by the fashion retail sector in Malta was considerably lower in Q2 2020 but improved in both Q3 2020 and Q4 2020. The situation is still very fluid and the full impact on the subject industry is yet to be determined and assessed.
85.0
90.0
95.0
100.0
105.0
110.0
115.0
120.0
125.0
130.0
2010
2011
2012
2013
2014
2015
2016
2017
2018
2019
2020
Retail Trade (2015 = 100)
European Union - 27 countries (from 2020) Malta
Source: Eurostat NACE Rev.2 (retail trade except motor vehicles and motor cycles quarterly data)

HUDSON MALTA PLC FINANCIAL ANALYSIS SUMMARY 12
4. THE IMPACT OF COVID-19
The pandemic has impacted the Malta Group’s revenue streams due to lower footfall and store closures as well as supply chain issues. To manage the situation the Malta Group needed to change the way it does business in general, look for efficiencies and continue with its efforts to digitalise the business.
From the initial stages of the pandemic, the Malta Group took mitigating action to protect its cash position whilst continuing significant projects that will enable future growth. Specifically, the Malta Group:
Postponed retail investments originally planned for 2020 and is now undertaking these investments in 2021.
Cancelled or postponed the intake of inventory to ensure that its inventory levels are well managed.
Obtained extended payment terms from key suppliers. Availed itself of government support. Obtaining moratoria on repayment of loan facilities with its bankers, a temporary increase of
its overdraft facility to ensure it has adequate working capital headroom and secured MDB loans amounting to €1.85 million to further strengthen its long-term liquidity position. These are in place in 2021.
Launched an eCommerce site in Malta to be able to support customers with their retail needs even when physical stores were closed.
Closely managed its cost base including wage reductions led by the senior leadership team and obtained lease concessions from lessors.
The pandemic will continue to impact performance even in 2021 with the retail stores in Malta closed again for a seven-week period from 11 March to 26 April 2021. Management is reviewing the situation on a regular basis and adapting operations as the situation develops. The Group has and is continuously looking at ways to improve performance from existing operations.
5. TREND ANALYSIS AND BUSINESS STRATEGY
The retail market in Malta is subject to stiff competition, both from local retailers as well as from online sales (through the internet). In addition, retailers face competition for consumers’ disposable income from gastronomy outlets, the property market and consumers’ propensity to save. Furthermore, the retail industry continues to evolve due to shifts in consumer preferences, product trends and shopping habits. Pre COVID-19, Malta’s economy was performing well, resulting in an expansion of the labour market and higher income levels, to the benefit of retailers.
Since March 2020, the Malta Group’s earnings have been adversely impacted by COVID-19. During this uncertain period, the Directors has continued to maintain vigilance and adjust operational activities as necessary to protect the Group’s financial position. Nonetheless, the Malta Group remains focused on

HUDSON MALTA PLC FINANCIAL ANALYSIS SUMMARY 13
adapting to the afore-mentioned trends and the Directors feel that the business strategy of the Malta Group is aligned to capitalise on these opportunities in the future.
The Malta Group’s strong focus is to provide a high level of customer service and use information systems to maintain tight controls over inventory and operating costs. The Directors believe that having strong logistics support is a critical element of the Malta Group’s growth strategy and is central to the business to maintain a low-cost operating structure and optimal inventory levels.
A key objective of the Malta Group is to continue to strengthen recognition of each of its brands within their respective target markets through advertising campaigns, sponsorships, and customer loyalty schemes. At the same time, the Directors will continue to explore opportunities to invest in other retail concepts that offer features that are attractive to the Malta Group in terms of benefits from possible synergies and revenue expansion.
In this regard, the Hudson Group has entered into a conditional share-for-share exchange agreement to acquire Trilogy Limited (C 42528), a premium fashion retail company operating in Malta with brands such as Calvin Klein, Armani Exchange, Mango, Tommy Hilfiger and Tommy Jeans. The agreement is subject to the satisfaction of certain conditions precedent and upon their completion, an intra-group restructuring is to be carried out, whereby Trilogy Limited will form part of the Malta Group.
The Malta Group has expanded its e-commerce platform, thus further enabling the Malta Group to engage with customers specifically in the digital commerce channel. Although revenue generation through retail stores will continue to be a cornerstone of the Malta Group’s strategy, the e-commerce initiative should provide a platform to ensure an outstanding customer experience regardless of channel.
PART 2 – PERFORMANCE REVIEW
6. FINANCIAL INFORMATION – HUDSON GROUP
As an entity external to the Issuer and the Malta Group, HHL is not bound by the continuing obligations of the Listing Rules. However, the board of directors of HHL has resolved to publish on an annual basis HHL’s audited consolidated financial statements, by not later than two months after the publication of the Issuer’s audited financial statements, through a company announcement. Furthermore, condensed financial information relating to HHL and the Hudson Group shall be provided in the annual publication of the Issuer’s financial analysis summary. This commitment is being made to provide Bondholders and prospective investors with full access to financial information on the Hudson Group.

HUDSON MALTA PLC FINANCIAL ANALYSIS SUMMARY 14
The following financial information is extracted from the consolidated audited financial statements of Hudson Holdings Limited (“Hudson Group” or “HHL”) for the three years ended 31 December 2018 to 31 December 2020.
Hudson Holdings LimitedConsolidated Statement of Comprehensive Incomefor the year ended 31 December 2018 2019 2020
€’000 €’000 €’000Actual Actual Actual
Revenue 105,029 113,216 84,755 Retail 40,687 44,246 33,005 Wholesale 64,342 68,970 51,750 Cost of sales (78,932) (82,178) (62,449) Gross profit 26,097 31,038 22,306 Net operating costs (21,293) (19,356) (14,130) EBITDA1 4,804 11,682 8,176 Depreciation & amortisation (1,446) (6,414) (6,519) Operating profit 3,358 5,268 1,657 Share of profit/(loss) in associate (41) 472 (202) Net finance costs (956) (2,063) (2,230) Profit (loss) before tax 2,361 3,677 (775) Taxation (1,381) (1,980) 1 Profit (loss) for the year 980 1,697 (774)
Other comprehensive incomeCurrency translation differences 375 442 (103) Fair value movements equity investments, net of deferred tax (244) (976) (321)
131 (534) (424)
Total comprehensive income (expense) 1,111 1,163 (1,198)
1 EBITDA - Earnings before Interest, Tax, Depreciation and Amortisation.

HUDSON MALTA PLC FINANCIAL ANALYSIS SUMMARY 15
During FY2018, the Hudson Group operated 53 stores in 5 countries (FY2017: 37 stores) and employed 544 staff members (FY2017: 502 staff members). The 16 new store openings in FY2018 are located overseas, mainly Morocco. In addition, the Hudson Group acquired the remaining 50% shareholding in BD International Group Limited to hold all voting and ownership rights. This company is the contract party to the NIKE Africa business having distribution rights to 30 countries in Africa.
Revenue increased by 21% from €86.5 million in FY2017 to €105.0 million in FY2018 driven by new store openings and further expansion of the Nike Africa business (notwithstanding the loss of a significant client in 2017). The growth in turnover resulted in an increase in EBITDA of €0.5 million, from €4.3 million in FY2017 to €4.8 million in FY2018. The EBITDA margin remained constant at 5% in FY2018 (FY2017: 5%) but return on capital employed decreased from 31% in FY2017 to 21%.
Depreciation & amortisation was higher when compared to the prior year by €0.3 million. Net finance costs were also higher y-o-y by €0.2 million to €956,000, which lowered interest cover from 5.65 times in FY2017 to 5.03 times. Profit before tax was unchanged at €2.4 million (FY2017: €2.4 million). Overall, HHL reported total comprehensive income of €1.1 million in FY2018 compared to €1.2 million in the prior year.
In FY2019, the Hudson Group opened 7 new stores, of which 4 are located in Malta and 3 in Morocco. As at year end, the Hudson Group operated 43 stores in 4 countries (FY2018: 53 stores) and employed 590 staff members (FY2018: 544 staff members).
Hudson Holdings LimitedKey Accounting Ratios FY2018 FY2019 FY2020
Actual Actual Actual
Gross profit margin 25% 27% 26%(Gross profit/revenue)
Operating profit margin 5% 10% 10%(EBITDA/revenue)
Interest cover (times) 5.03 5.66 3.67(EBITDA/net finance cost)
Net profit margin 1% 1% -1%(Profit after tax/revenue)
Earnings per share (€) 26.82 46.45 -21.18(Profit after tax/number of shares)
Return on equity 10% 17% -9%(Profit after tax/shareholders’ equity)
Return on capital employed 21% 25% 18%(EBITDA/total assets less current liabilities)
Return on assets 2% 2% -1%(Profit after tax/total assets)
Source: MZ Investment Services Ltd

HUDSON MALTA PLC FINANCIAL ANALYSIS SUMMARY 16
Revenue generated by the Hudson Group in FY2019 amounted to €113.2 million, an increase of €8.2 million (+8%) over the prior year. Further analysis shows that revenue from retail increased by €3.6 million or 9% (y-o-y) to €44.2 million (FY2018: €40.7 million), while wholesale revenue increased by €4.6 million or 7% (y-o-y) to €69.0 million.
Gross profit increased by 19% to €31.0 million (FY2018: €26.1 million) due to higher business activity as well as a two-percentage point improvement in gross profit margin to 27%. The Hudson Group reported a substantial increase in EBITDA of €6.9 million, from €4.8 million in FY2018 to €11.7 million, mainly on account of the adoption of IFRS 16 in replacement of IAS 17 (leases).
The Hudson Group adopted IFRS 16 on 1 January 2019 using the Standard’s modified retrospective approach with transition date taken as the lease commencement date. Under this approach, the right-of-use asset equals the lease liability on transition date, and no equity adjustment is recognised on initial application of IFRS 16. Comparative information is not restated. Accordingly, as of FY2019, the Hudson Group is recognising a right-of-use asset and a lease liability in the statement of financial position for the lease of premises currently treated as operating leases. With regard to the impact in the consolidated income statement, the nature of the relevant expense has changed from being an operating lease expense to depreciation and interest expense.
The income statement reflects the following amounts relating to leases:
€
Depreciation charge of right-of-use assets 4,316,624 Interest expense (including in finance costs) 1,032,808 Expense relating to variable lease payments not included in lease liabilities (included in administrative expenses) 382,049 ------------- 5,731,481 ======== The impact on profit before tax for FY2019 had IFRS 16 not been adopted, would have resulted in a favourable movement of €788,756.
Total comprehensive income reported by Hudson Group in FY2019 was broadly unchanged when compared to the previous year and amounted to €1.16 million (FY2018: €1.11 million).
FY2020 has been an unprecedented one for the Hudson Group with the impact of COVID-19 negatively impacting revenue generation across its retail and wholesale business, with periods of enforced store closures, lower traffic when open and supply chain issues. Consequently, the Hudson Group curtailed its physical retail expansion, delayed planned retail openings when possible, with the result that physical retail store openings were limited to 3, whilst closing 4 retail stores including the store in Spain. In the meantime, the Hudson Group expanded its online presence by opening a new online store. At the end of 2020, the Hudson Group operated 46 stores in 4 countries and 3 e-commerce sites.
The average number of persons employed during the year amounted to 451 (FY2019: 590 employees).

HUDSON MALTA PLC FINANCIAL ANALYSIS SUMMARY 17
In view of the above, revenue generated by the Hudson Group in FY2020 decreased by 25% (y-o-y) to €84.8 million (FY2019: €113.2 million). Revenue from retail was lower by €11.2 million or -25.4% (y-o-y) to €33.0 million (FY2019: €44.2 million), while wholesale revenue decreased by €17.2 million or -25.0% (y-o-y) to €51.8 million (FY2019: €69.0 million).
As a result, gross profit decreased by 28% to €22.3 million (FY2019: €31.0 million) which impacted the gross profit margin by 1 percentage point (26% vs 27% in FY2019).
Due to their fixed nature, depreciation & amortisation and net finance costs were mainly unchanged from a year earlier at €6.5 million and €2.2 million respectively. An adverse movement of €0.7 million was registered in share of results of associate, from €0.5 million profit in FY2019 to a loss of €0.2 million in FY2020. Overall, the Hudson Group reported a loss for the year of €0.8 million, compared to a profit of €1.7 million in FY2019, and reported total comprehensive expense amounting to €1.2 million, compared to total comprehensive income of €1.2 million in FY2019.
In FY2020, net cash from operating activities decreased by 63% from the prior year to €5.9 million, mainly due to lower operating profit and adverse movements in working capital.
Net cash used in investing activities amounted to €2.6 million in FY2020 and was principally utilised for the development of the distribution centre, and to a lesser extent for the purposes of improvements to premises, refitting and other capital expenditure in relation to the Group’s stores (FY2019: €6.6 million).
Net cash inflows from financing activities in FY2020 amounted to €2.1 million (FY2019: outflow of €6.2 million). During the year, the Hudson Group increased net borrowings by €4.2 million (FY2019: net repayments of €1.3 million) and settled lease payments of €2.1 million compared to €4.1 million in the prior year.
Hudson Holdings LimitedConsolidated Cash Flow Statementfor the year ended 31 December 2018 2019 2020
€’000 €’000 €’000Actual Actual Actual
Net cash from operating activities (606) 15,942 5,938 Net cash from investing activities (3,802) (6,584) (2,566) Net cash from financing activities 8,950 (6,199) 2,053 Net movement in cash and cash equivalents 4,542 3,159 5,425 Cash and cash equivalents at beginning of year 4,066 8,608 11,767 Cash and cash equivalents at end of year 8,608 11,767 17,192

HUDSON MALTA PLC FINANCIAL ANALYSIS SUMMARY 18
Hudson Holdings LimitedConsolidated Statement of Financial Positionas at 31 December 2018 2019 2020
€’000 €’000 €’000Actual Actual Actual
ASSETSNon-current assetsIntangible assets 1,263 1,263 1,259 Property, plant & equipment 6,500 10,840 10,752 Right-of-use assets - 26,751 23,632 Investment in associates 285 763 533 Equity investments 1,500 321 - Receivables 499 166 164 Deferred tax assets 394 844 860
10,441 40,948 37,200
Current assetsInventories 19,387 15,039 14,138 Trade and other receivables 17,888 17,689 13,703 Other current assets 19 33 167 Cash and cash equivalents 8,907 12,192 17,686
46,201 44,953 45,694 Total assets 56,642 85,901 82,894
EQUITYCapital and reservesShare capital 85 85 85 Reserves 3,031 2,498 2,073 Retained earnings 6,477 7,372 6,596 Non-controlling interest (167) (167) (163)
9,426 9,788 8,591
LIABILITIESNon-current liabilitiesBorrowings 12,166 12,263 16,189 Lease liabilities - 23,715 20,589 Other non-current liabilities 1,238 55 45
13,404 36,033 36,823
Current liabilitiesBank overdrafts 299 425 494 Borrowings 8,194 6,752 7,022 Lease liabilities - 2,982 3,475 Trade and other payables 24,482 27,386 25,408 Other current liabilities 837 2,535 1,081
33,812 40,080 37,480 47,216 76,113 74,303
Total equity and liabilities 56,642 85,901 82,894

HUDSON MALTA PLC FINANCIAL ANALYSIS SUMMARY 19
The Group’s total assets as at 31 December 2020 amounted to €82.9 million, a decrease of €3.0 million on a comparable basis (FY2019: €85.9 million). The principal movement include the following:
(i) cash and cash equivalents increased by €5.5 million to €17.7 million following an increase in borrowings;
(ii) right-of-use assets decreased y-o-y by €3.1 million due to a number of store closures; (iii) pursuant to lower business activities, inventories and receivables were lower on a
comparable basis by €4.9 million to €27.8 million (in aggregate).
Total liabilities in FY2020 amounted to €74.3 million compared to €76.1 million in FY2019, mainly on account of an increase in borrowings of €4.3 million, and a decrease in lease liabilities and other current liabilities of €2.6 million and €1.5 million respectively.
The gearing ratio of the Hudson Group in FY2020 was unchanged at 78% compared to the prior year, due to the fact that the net increase in borrowings were held as cash balances as at year end. Net debt to EBITDA (being an alternative measure for leverage) weakened from 2.91 years in FY2019 to 3.68 years due to the substantial decline in EBITDA.
The liquidity ratio improved in FY2020 to 1.22 times (FY2019: 1.12 times), while the quick ratio was also higher, from 0.75 times in FY2019 to 0.84 times.
Hudson Holdings LimitedKey Accounting Ratios FY2018 FY2019 FY2020
Actual Actual Actual
Gearing ratio 55% 78% 78%(Total net debt/net debt and shareholders’ equity)
Gearing ratio 2 (times) 1.25 3.47 3.50(Total net debt/shareholders’ equity)
Net debt to EBITDA (years) 2.45 2.91 3.68(Net debt/EBITDA)
Net assets per share (€) 257.99 267.90 235.14(Net asset value/number of shares)
Liquidity ratio (times) 1.37 1.12 1.22(Current assets/current liabilities)
Quick ratio (times) 0.79 0.75 0.84(Current assets less inventories/current liabilities)
Source: MZ Investment Services Ltd

HUDSON MALTA PLC FINANCIAL ANALYSIS SUMMARY 20
7. FINANCIAL INFORMATION – MALTA GROUP
The financial information for the period 10 November 2017 to 31 December 2018 and for the years ended 31 December 2019 and 31 December 2020 is extracted from the respective audited consolidated financial statements of Hudson Malta p.l.c. The financial information for the forecast year ending 31 December 2021 has been provided by management. The projections do not take into consideration the proposed acquisition of Trilogy Limited referred to in section 1.2 of this report.
The projected financial statements relate to events in the future and are based on assumptions which the Malta Group believes to be reasonable. Consequently, the actual outcome may be adversely affected by unforeseen situations and the variation between forecast and actual results may be material.
Hudson Malta p.l.c.Statement of Comprehensive Incomefor the year ended 31 December 2018 2019 2020 2021
Actual Actual Actual Forecast€’000 €’000 €’000 €’000
Revenue 42,414 42,815 30,129 37,544 Retail 29,682 30,469 21,707 27,156 Wholesale and other income 12,732 12,346 8,422 10,388 Cost of sales (29,303) (29,549) (21,092) (25,478) Gross profit 13,111 13,266 9,037 12,066 Net operating costs (10,280) (8,775) (4,491) (8,211) Net impairment losses on financial and contract assets - 9 (1,577) - EBITDA 2,831 4,500 2,969 3,855 Depreciation & amortisation (755) (2,984) (3,282) (3,286) Operating profit (loss) 2,076 1,516 (313) 569 Finance income 399 593 446 428 Finance costs (605) (1,289) (1,387) (1,255) Profit (loss) before tax 1,870 820 (1,254) (258) Taxation (702) (301) 371 - Profit (loss) for the year 1,168 519 (883) (258)
Total comprehensive income (expense) 1,168 519 (883) (258)

HUDSON MALTA PLC FINANCIAL ANALYSIS SUMMARY 21
The principal business activities of the Malta Group include the operation of retail stores in Malta, the online portal hudsonstore.com and distribution of NIKE products to Urban Jungle Italy and a number of third-party stores in Malta.
In FP2018, revenue generated from retail operations increased by €4.8 million (+19%) from €24.8 million in pro forma FY2017 to €29.7 million in FP2018, primarily on account of new store openings, whilst wholesale income amounted to €12.7 million, an increase of €2.0 million (+19%) when compared to pro forma FY2017. In aggregate, revenue in FP2018 was higher than in pro forma FY2017 by €6.7 million (+19%) and amounted to €42.4 million.
EBITDA improved by 19% or €0.4 million to €2.8 million in FP2018 (FY2017: €2.4 million). Profit after tax was higher in FP2018 by €0.3 million, when compared to the prior year, to €1.2 million.
Revenue in FY2019 increased marginally by €0.4 million (+0.9%) and amounted to €42.8 million (FP2018: €42.4 million). Further analysis shows that retail sales increased by €0.8 million (+3%, y-o-y) to €30.5 million, while wholesale & other income declined by €0.4 million (-3%, y-o-y) to €12.3 million. Gross profit in FY2019 amounted to €13.3 million compared to €13.1 million in the prior year, while gross profit margin was unchanged at 31%.
Hudson Malta p.l.c.Key Accounting Ratios FP2018 FY2019 FY2020 FY2021
Actual Actual Actual Forecast
Gross profit margin 31% 31% 30% 32%(Gross profit/revenue)
Operating profit margin 7% 11% 10% 10%(EBITDA/revenue)
Interest cover (times) 4.68 3.49 2.14 3.07(EBITDA/finance cost)
Net profit margin 3% 1% -3% -1%(Profit after tax/revenue)
Earnings per share (€) 0.07 0.03 -0.05 -0.02(Profit after tax/number of shares)
Return on equity 19% 8% -16% -5%(Profit after tax/shareholders’ equity)
Return on capital employed 16% 13% 9% 12%(EBITDA/total assets less current liabilities)
Return on assets 4% 1% -2% -1%(Profit after tax/total assets)
Source: MZ Investment Services Ltd

HUDSON MALTA PLC FINANCIAL ANALYSIS SUMMARY 22
EBITDA increased from €2.8 million in FP2018 to €4.5 million (+59%, €1.7 million), primarily due to the impact of IFRS 16. As such, operating profit margin improved in FY2019 from 7% in the prior year to 11%. On the other hand, the adoption of IFRS 16 has increased net finance costs with the consequence of a decline in interest cover ratio to 6.47 times in FY2019 from 13.74 times in FP2018.
The Malta Group adopted IFRS 16 on 1 January 2019 using the Standard’s modified retrospective approach with transition date taken as the lease commencement date. Under this approach, the right-of-use asset equals the lease liability on transition date, and no equity adjustment will be recognised on initial application of IFRS 16. Comparative information is not restated. Accordingly, as of FY2019, the Malta Group has recognised a right-of-use asset and a lease liability in the statement of financial position for the lease of premises currently treated as operating leases. With regard to the impact in the consolidated income statement, the nature of the relevant expense has changed from being an operating lease expense to depreciation and interest expense.
The income statement reflects the following amounts relating to leases:
€
Depreciation charge of right-of-use assets 2,124,864 Interest expense (including in finance costs) 657,075 Expense relating to variable lease payments not included in lease liabilities (included in administrative expenses) 195,195 ------------- 2,977,134 ======== The impact on profit before tax for FY2019 had IFRS 16 not been adopted, would have resulted in a favourable movement of €0.5 million. Accordingly, the Malta Group reported a decrease of €0.6 million in total comprehensive income, from €1.2 million in FP2018 to €0.5 million in FY2019.
During the initial two months of FY2020, the Malta Group’s operational performance was in line with Board expectations. Thereafter, revenues were impacted following the Authorities’ decision to close inter alia non-essential retail outlets until the end of April 2020.
Revenue in FY2020 decreased by €12.7 million (-26% y-o-y) to €30.1 million on account of the complete shutdown of the retail sector during April 2020 and the curtailment of operations in fashion retail between June and December 2020.
Cost of sales was lower by 29% compared to the previous year, thereby resulting is a decrease of €4.2 million (-32% y-o-y) in gross profit, from €13.3 million in FY2019 to €9.0 million. Careful management of inventory and sales ensured that the Malta Group retained broadly the same gross profit margin percentage as 2019.
The net impairment losses on financial and contract assets of €1.6 million include €1.4 million of amounts written off or provided for relating to amounts due from fellow subsidiaries following Hudson Group’s decision to close its Spanish operations due to the impact that COVID-19 had on these operations.

HUDSON MALTA PLC FINANCIAL ANALYSIS SUMMARY 23
Strong cost reduction measures taken by management, support from the Hudson Group (including additional support in view of the Spanish closure impact in the form of reduced management charges), rent abatement by landlords and support from Government through wage subsidiaries resulted in a significant reduction in net operating costs by €4.3 million from €8.8 million in FY2019 to €4.5 million.
After accounting for depreciation & amortisation and net finance costs of €3.3 million and €0.9 million respectively, the Malta Group reported a loss before tax of €1.3 million compared to a profit before tax of €0.8 million in FY2019. Overall, total comprehensive expense amounted to €0.9 million (FY2019: income of €0.5 million).
In FY2021, the Malta Group is projected to generate revenue amounting to €37.5 million, an increase of €7.4 million (+25%) from the prior year, which represents 88% of aggregate turnover achieved in FY2019 (pre-pandemic). The better performance in FY2021 should result in an increase in EBITDA of €0.9 million (+30%), from €3.0 million in FY2020 to €3.9 million, with EBITDA margin remaining stable at 10% on a comparable basis.
No material changes are expected in depreciation & amortisation and net finance costs. As such, net interest cover is forecasted to improve from 2.14 times in FY2020 to 3.07 times in FY2021.
Overall, the Malta Group is projected to register total comprehensive expense of €258,000 in FY2021 compared to €883,000 in the prior year.
Net movement in cash and cash equivalents amounted to an inflow of €2.2 million in FP2018 (FY2017: -€1.2 million), principally due to the net proceeds from the bonds of €11.8 million, partly offset by repayments made to banks and related parties of €3.7 million. Net capital used in investing activities amounted to €5.5 million, mainly on account of loans and receivables granted to related undertakings of €7.0 million, which balance was offset against cash amounts of HMSL following the business combination to form the Malta Group.
In FY2019, net cash from operating activities increased from a deficiency of €451,000 in FP2018 to a surplus of €5.3 million, mainly due to the reclassification of lease payments from operating activities to financing activities in terms of IFRS 16, and favourable movements in working capital. Net cash flows
Hudson Malta p.l.c.Cash Flow Statementfor the year ended 31 December 2018 2019 2020 2021
Actual Actual Actual Forecast€’000 €’000 €’000 €’000
Net cash from operating activities (451) 5,277 3,626 2,566 Net cash from investing activities (5,463) (2,277) (865) (749) Net cash from financing activities 8,068 (2,435) (1,412) (1,083) Net movement in cash and cash equivalents 2,154 565 1,349 734 Cash and cash equivalents at beginning of year - 2,154 2,719 4,068 Cash and cash equivalents at end of year 2,154 2,719 4,068 4,802

HUDSON MALTA PLC FINANCIAL ANALYSIS SUMMARY 24
used in investing activities in FY2019 amounted to €2.3 million, which was utilised for the purposes of refitting the Malta Group’s outlets. Net cash outflows from financing activities in FY2019 amounted to €2.4 million and comprised lease payments of €2.2 million and dividends paid amounting to €250,000.
In FY2020, the Malta Group reported a positive net movement in cash balances of €1.3 million, mainly on account of net cash inflows from operating activities of €3.6 million compared to €5.3 million in the prior year.
In terms of investing activities, the Malta Group utilised €0.9 million for capital expenditure relating to refitting of stores, which is a reduction of €1.4 million compared to the previous year. Net cash from financing activities amounted to €1.4 million which mainly comprised payments of lease obligations.
The Malta Group is projected to register a net movement in cash and cash equivalents of €0.7 million in FY2021 compared to €1.3 million generated in FY2020. Net cash inflows from operating activities is expected to amount to €2.6 million (FY2020: €3.6 million). On the other hand, cash outflows are expected to primarily comprise stores-related capital expenditure and lease payment obligations. In this regard, net cash used in investing and financing activities is projected to amount to €1.8 million (in aggregate).

HUDSON MALTA PLC FINANCIAL ANALYSIS SUMMARY 25
Hudson Malta p.l.c.Statement of Financial Positionas at 31 December 2018 2019 2020 2021
Actual Actual Actual Forecast€’000 €’000 €’000 €’000
ASSETSNon-current assetsIntangible assets 1,207 1,204 1,202 1,202 Property, plant & equipment 2,470 3,810 3,486 3,293 Right-of-use assets - 18,591 16,422 13,417 Other non-current assets 547 750 1,035 1,035 Loan to related undertakings 6,914 6,914 6,914 6,914
11,138 31,269 29,059 25,861
Current assetsInventories 4,126 3,900 3,494 4,220 Trade and other receivables 10,560 9,855 6,719 8,287 Amounts due from related undertakings 58 - - - Cash and cash equivalents 2,284 2,995 4,111 4,802
17,028 16,750 14,324 17,309 Total assets 28,166 48,019 43,383 43,170
EQUITYCapital and reservesShare capital and reserves 16,450 16,450 16,450 16,450 Other reserves (15,995) (15,995) (15,995) (15,995) Retained earnings 5,680 5,950 5,067 4,808
6,135 6,405 5,522 5,263
LIABILITIESNon-current liabilitiesBorrowings and bonds 11,793 11,821 11,971 13,701 Lease liabilities - 16,988 15,087 12,083
11,793 28,809 27,058 25,784
Current liabilitiesBank overdrafts 130 276 43 - Borrowings - - 29 72 Lease liabilities - 1,352 1,478 1,671 Trade and other payables 9,958 11,081 9,238 10,380 Other current liabilities 150 96 15 -
10,238 12,805 10,803 12,123 22,031 41,614 37,861 37,907
Total equity and liabilities 28,166 48,019 43,383 43,170

HUDSON MALTA PLC FINANCIAL ANALYSIS SUMMARY 26
As at 31 December 2020, the Malta Group’s total assets amounted to €43.4 million, the main items being right-of-use assets of €16.4 million, trade & other receivables of €6.7 million, loan to related undertakings of €6.9 million and inventories amounting to €3.5 million. Cash and cash equivalents in FY2020 amounted to €4.1 million compared to €3.0 million in the prior year. Due to the disruptions caused by the COVID-19 pandemic, inventories and trade & other receivables were lower on a comparable basis by €0.4 million and €3.1 million respectively. On the other hand, cash balances as at 31 December 2020 were higher y-o-y by €1.1 million to €4.1 million.
Total liabilities amounted to €37.9 million and mainly included lease liabilities of €16.6 million, borrowings and bonds amounting to €12.0 million and trade & other payables of €9.1 million. The Malta Group’s gearing ratio was marginally higher in FY2020 at 82% (FY2019: 81%) while net debt to EBITDA weakened from 6.10 years in FY2019 to 8.25 years due to the lower EBITDA.
The liquidity ratio was marginally higher from 1.31 times in FY2019 to 1.33 times but the quick ratio was unchanged at 1.00 times.
No material movements in the statement of financial position have been projected for FY2021 compared to FY2020.
Hudson Malta p.l.c.Key Accounting Ratios FP2018 FY2019 FY2020 FY2021
Actual Actual Actual Forecast
Gearing ratio 61% 81% 82% 81%(Total net debt/net debt and shareholders’ equity)
Gearing ratio 2 (times) 1.57 4.28 4.44 4.32(Total net debt/shareholders’ equity)
Net debt to EBITDA (years) 3.40 6.10 8.25 5.89(Net debt/EBITDA)
Net assets per share (€) 0.37 0.39 0.34 0.32(Net asset value/number of shares)
Liquidity ratio (times) 1.66 1.31 1.33 1.43(Current assets/current liabilities)
Quick ratio (times) 1.26 1.00 1.00 1.08(Current assets less inventories/current liabilities)
Source: MZ Investment Services Ltd

HUDSON MALTA PLC FINANCIAL ANALYSIS SUMMARY 27
8. VARIANCE ANALYSIS – MALTA GROUP
The following financial information relates to the variance analysis between the forecasted financial information of the Malta Group for the year ended 31 December 2020 included in the prior year’s Financial Analysis Summary dated 28 August 2020 and the audited consolidated financial statements of the Group for the year ended 31 December 2020.
As presented in the above table, revenue generated by the Group in FY2020 was marginally lower than expected by €263,000 on account of wholesale & other income which was lower than expected by €285,000. Despite the lower sales, the Group still achieved a better gross profit from its retail channel.
The net impairment losses on financial and contract assets of €1.6 million were not anticipated in the forecast and mainly related to the closure of the Hudson Group’s Spanish operations. Notwithstanding, such losses were mitigated by stronger than expected cost reduction measures taken by management, support from the Hudson Group (including additional support in view of the Spanish closure impact in the form of reduced management charges), rent abatement by landlords and support from Government through wage subsidiaries which resulted in lower than projected net operating costs of €1.8 million. As such, EBITDA was higher than expected by €415,000.
Higher finance costs were partly offset by higher finance income, while a tax credit amounting to €371,000 was not factored into the projections. Overall results were better than expected by €617,000.
Hudson Malta p.l.c.Statement of Comprehensive Incomefor the year ended 31 December 2020
Actual Forecast Variance€’000 €’000 €’000
Revenue 30,129 30,392 (263) Cost of sales (21,092) (21,519) 427 Gross profit 9,037 8,873 164 Net operating costs (4,491) (6,319) 1,828 Net impairment losses on financial and contract assets (1,577) - (1,577) EBITDA 2,969 2,554 415 Depreciation & amortisation (3,282) (3,251) (31) Operating loss (313) (697) 384 Finance income 446 - 446 Finance costs (1,387) (803) (584) Loss before tax (1,254) (1,500) 246 Taxation 371 - 371 Loss for the year (883) (1,500) 617
Total comprehensive expense (883) (1,500) 617

HUDSON MALTA PLC FINANCIAL ANALYSIS SUMMARY 28
Actual net movement in cash and cash equivalents was higher than projected by €4.6 million which mainly emanated from a positive variance in cashflows from operating activities. Management was expecting an adverse movement in working capital which did not materialise and thus resulted in a positive variance of €7.6 million.
The variance in net cash from investing activities was negative by €1.3 million. The projections had assumed cash inflows of €1.0 million from disposal of property, plant & equipment (principally store furniture) less capital expenditure of €0.6 million (net amount of €0.4 million). Actual figures comprise capital expenditure amounting to €0.9 million.
Projected net cash from financing activities amounted to €0.4 million which assumed a new bank loan facility of €2.7 million less €2.3 million of lease payment obligations. Actual net cash used in financing activities amounted to €1.4 million on account of €1.6 million of lease payment obligations less proceeds from borrowings amounting to €149,500.
Hudson Malta p.l.c.Cash Flow Statementfor the year ended 31 December 2020
Actual Forecast Variance€’000 €’000 €’000
Net cash from operating activities 3,626 (3,997) 7,623 Net cash from investing activities (865) 414 (1,279) Net cash from financing activities (1,412) 364 (1,776) Net movement in cash and cash equivalents 1,349 (3,219) 4,568 Cash and cash equivalents at beginning of year 2,719 2,719 - Cash and cash equivalents at end of year 4,068 (500) 4,568

HUDSON MALTA PLC FINANCIAL ANALYSIS SUMMARY 29
Hudson Malta p.l.c.Statement of Financial Positionas at 31 December 2020
Actual Forecast Variance€’000 €’000 €’000
ASSETSNon-current assetsIntangible assets 1,202 1,203 (1) Property, plant & equipment 3,486 3,701 (215) Right-of-use assets 16,422 20,422 (4,000) Other non-current assets 1,035 420 615 Loan to related undertakings 6,914 6,914 (0)
29,059 32,660 (3,601)
Current assetsInventories 3,494 4,178 (684) Trade and other receivables 6,719 7,688 (969) Cash and cash equivalents 4,111 - 4,111
14,324 11,866 2,458 Total assets 43,383 44,526 (1,143)
EQUITYCapital and reservesShare capital and reserves 16,450 16,450 - Other reserves (15,995) (15,995) - Retained earnings 5,067 4,450 617
5,522 4,905 617
LIABILITIESNon-current liabilitiesBorrowings and bonds 11,971 11,836 135 Lease liabilities 15,087 14,816 271
27,058 26,652 406
Current liabilitiesBank overdrafts 43 500 (457) Borrowings 29 2,700 (2,671) Lease liabilities 1,478 1,187 291 Trade and other payables 9,238 8,582 656 Other current liabilities 15 - 15
10,803 12,969 (2,166) 37,861 39,621 (1,760) 0
Total equity and liabilities 43,383 44,526 (1,143)

HUDSON MALTA PLC FINANCIAL ANALYSIS SUMMARY 30
Non-current assets were lower than expected by €3.6 million mainly on account of a variance in value of right-of use assets of €4.0 million. In contrast, current assets were higher than projected by €2.5 million due to a cash balance of €4.1 million compared to a nil forecast balance which was partly offset by adverse variances in inventories and receivable.
Actual total liabilities were lower than forecast by €1.8 million and amounted to €37.9 million (forecast amount €39.6 million). In particular, current borrowings were lower than expected by €3.1 million, while current payables and lease liabilities were higher than projected by €1.2 million.
PART 3 - COMPARABLES
The table below compares the Malta Group and the Issuer’s bond issue to other debt issuers listed on the Malta Stock Exchange and their respective debt securities. Although there are significant variances between the activities of the Malta Group and other issuers (including different industries, principal markets, competition, capital requirements etc.), and material differences between the risks associated with the Malta Group’s business and that of other issuers, the comparative analysis provides an indication of the financial performance and strength of the Malta Group.
Comparative Analysis Nominal Yield to Interest Total Net Asset GearingValue Maturity Cover Assets Value Ratio
(€) (%) (times) (€’000) (€’000) (%)
5.80% International Hotel Investments plc 2021 20,000,000 4.30 0.61- 1,544,099 773,176 41.87 3.65% GAP Group plc Secured € 2022 30,049,800 1.24 2.24 103,895 15,134 73.44 6.00% Pendergardens Developments plc Secured € 2022 Series II 21,845,300 3.53 1.79 60,578 29,491 36.39 4.25% GAP Group plc Secured € 2023 19,247,300 2.66 2.24 103,895 15,134 73.44 5.30% United Finance Plc Unsecured € Bonds 2023 8,500,000 4.62 1.44 36,921 8,038 70.88 5.80% International Hotel Investments plc 2023 10,000,000 4.47 0.61- 1,544,099 773,176 41.87 6.00% AX Investments Plc € 2024 40,000,000 4.76 0.76 348,657 217,449 25.57 6.00% International Hotel Investments plc € 2024 35,000,000 4.16 0.61- 1,544,099 773,176 41.87 5.30% Mariner Finance plc Unsecured € 2024 35,000,000 3.55 3.66 100,350 50,297 48.12 5.00% Hal Mann Vella Group plc Secured € 2024 30,000,000 4.04 2.04 122,396 47,319 52.86 5.10% 1923 Investments plc Unsecured € 2024 36,000,000 4.31 3.09 135,492 45,574 27.66 4.25% Best Deal Properties Holding plc Secured € 2024 14,776,400 3.03 - 27,453 4,128 81.72 3.7% GAP Group plc Secured € 2023-2025 Series 1 21,000,000 3.45 2.24 103,895 15,134 73.44 5.75% International Hotel Investments plc Unsecured € 2025 45,000,000 4.34 0.61- 1,544,099 773,176 41.87 5.10% 6PM Holdings plc Unsecured € 2025 13,000,000 4.56 7.33 160,836 54,602 29.84 4.50% Hili Properties plc Unsecured € 2025 37,000,000 3.96 1.46 149,639 62,675 54.94 4.35% Hudson Malta plc Unsecured € 2026 12,000,000 4.18 3.16 43,383 5,522 81.61 4.25% Corinthia Finance plc Unsecured € 2026 40,000,000 3.79 0.51- 1,717,057 828,470 42.64 4.00% International Hotel Investments plc Secured € 2026 55,000,000 3.46 0.61- 1,544,099 773,176 41.87 3.75% Premier Capital plc Unsecured € 2026 65,000,000 3.32 7.39 278,759 53,003 75.22 4.00% International Hotel Investments plc Unsecured € 2026 60,000,000 3.64 0.61- 1,544,099 773,176 41.87 3.25% AX Group plc Unsec Bds 2026 Series I 15,000,000 2.28 0.76 348,657 217,449 25.57 4.35% SD Finance plc Unsecured € 2027 65,000,000 3.96 6.86 324,427 137,612 28.31 4.00% Eden Finance plc Unsecured € 2027 40,000,000 3.94 0.50- 190,466 108,369 31.32 4.00% Stivala Group Finance plc Secured € 2027 45,000,000 3.21 2.30 354,069 231,437 26.54 3.85% Hili Finance Company plc Unsecured € 2028 40,000,000 3.53 3.87 628,916 110,128 77.11 3.65% Stivala Group Finance plc Secured € 2029 15,000,000 3.34 2.30 354,069 231,437 26.54 3.80% Hili Finance Company plc Unsecured € 2029 80,000,000 3.80 3.87 628,916 110,128 77.11 3.75% AX Group plc Unsec Bds 2029 Series II 10,000,000 2.69 0.76 348,657 217,449 25.57
Source: Malta Stock Exchange, Audited Accounts of Listed Companies, MZ Investment Services Ltd
31-May-21

HUDSON MALTA PLC FINANCIAL ANALYSIS SUMMARY 31
To date, there are no corporate bonds which have a redemption date beyond 2032. The Malta Government Stock yield curve has been included as it is the benchmark risk-free rate for Malta.
The bonds are trading at a yield of 4.18%, which is in line with other corporate bonds maturing in the same year. The premium over FY2026 Malta Government Stock is 423 basis points.
-1.00
0.00
1.00
2.00
3.00
4.00
5.00
Bond Yield to Maturity
Malta GovernmentStock
Malta CorporateBonds
4.35% Hudson Malta plc Unsecured € 2026
%
Source: Malta Stock Exchange, Central Bank of Malta, MZ Investment Services Ltd 31 May 2021
HUDSON MALTA PLC FINANCIAL ANALYSIS SUMMARY 32
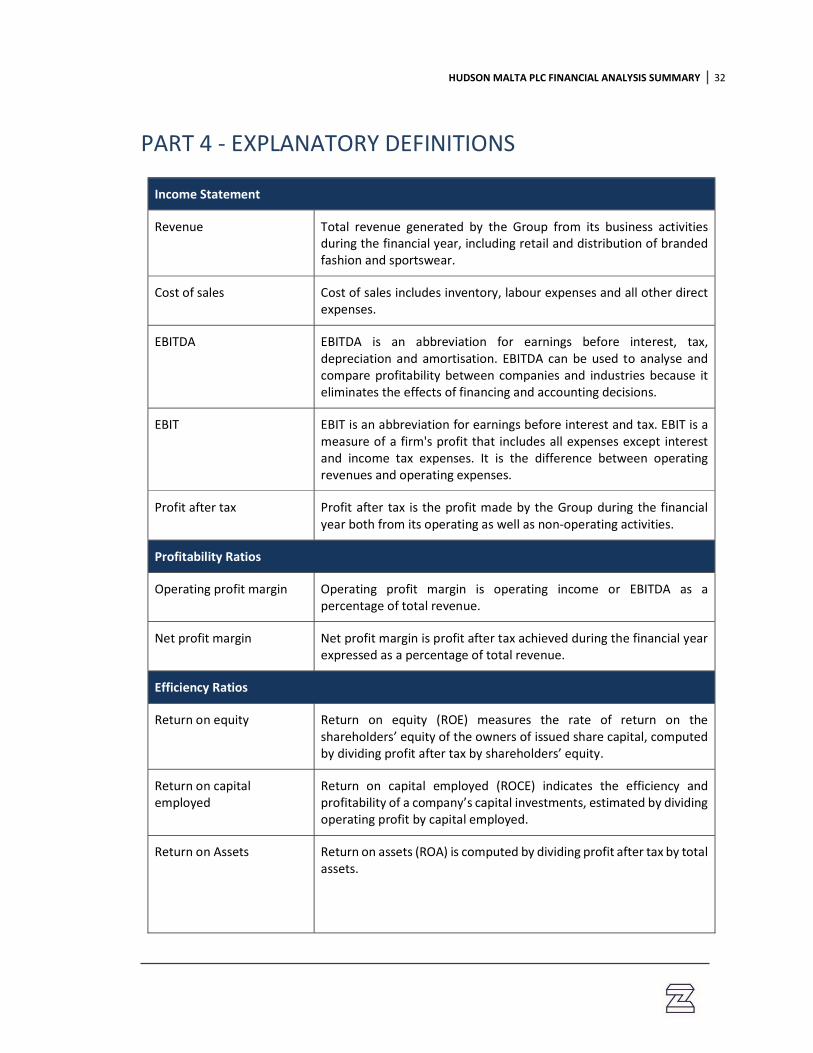
PART 4 - EXPLANATORY DEFINITIONS
Income Statement
Revenue Total revenue generated by the Group from its business activities during the financial year, including retail and distribution of branded fashion and sportswear.
Cost of sales Cost of sales includes inventory, labour expenses and all other direct expenses.
EBITDA EBITDA is an abbreviation for earnings before interest, tax, depreciation and amortisation. EBITDA can be used to analyse and compare profitability between companies and industries because it eliminates the effects of financing and accounting decisions.
EBIT EBIT is an abbreviation for earnings before interest and tax. EBIT is a measure of a firm's profit that includes all expenses except interest and income tax expenses. It is the difference between operating revenues and operating expenses.
Profit after tax Profit after tax is the profit made by the Group during the financial year both from its operating as well as non-operating activities.
Profitability Ratios
Operating profit margin Operating profit margin is operating income or EBITDA as a percentage of total revenue.
Net profit margin Net profit margin is profit after tax achieved during the financial year expressed as a percentage of total revenue.
Efficiency Ratios
Return on equity Return on equity (ROE) measures the rate of return on the shareholders’ equity of the owners of issued share capital, computed by dividing profit after tax by shareholders’ equity.
Return on capital employed
Return on capital employed (ROCE) indicates the efficiency and profitability of a company’s capital investments, estimated by dividing operating profit by capital employed.
Return on Assets Return on assets (ROA) is computed by dividing profit after tax by total assets.

HUDSON MALTA PLC FINANCIAL ANALYSIS SUMMARY 33
Equity Ratios
Earnings per share Earnings per share (EPS) is the amount of earnings per outstanding share of a company’s share capital. It is computed by dividing net income available to equity shareholders by total shares outstanding as at balance sheet date.
Cash Flow Statement
Cash flow from operating activities
Cash generated from the principal revenue-producing activities of the Group.
Cash flow from investing activities
Cash generated from activities dealing with the acquisition and disposal of long-term assets and other investments of the Group.
Cash flow from financing activities
Cash generated from the activities that result in change in share capital and borrowings of the Group.
Balance Sheet
Non-current assets Non-current asset are the Group’s long-term investments, which full value will not be realised within the accounting year. Non-current assets are capitalised rather than expensed, meaning that the Group allocates the cost of the asset over the number of years for which the asset will be in use, instead of allocating the entire cost to the accounting year in which the asset was purchased. Such assets include intangible assets; property, plant & equipment; and loans receivable.
Current assets Current assets are all assets of the Group, which are realisable within one year from the balance sheet date. Such amounts include accounts receivable, inventory, and cash and bank balances.
Current liabilities All liabilities payable by the Group within a period of one year from the balance sheet date, and include accounts payable and short-term debt.
Net debt Borrowings before unamortised issue costs less cash and cash equivalents.
Non-current liabilities The Group’s long-term financial obligations that are not due within the present accounting year. The Group’s non-current liabilities include long-term borrowings, bonds and deferred taxation.
Total equity Total equity includes share capital, reserves & other equity components, retained earnings and minority interest.

HUDSON MALTA PLC FINANCIAL ANALYSIS SUMMARY 34
Financial Strength Ratios
Liquidity ratio The liquidity ratio (also known as current ratio) is a financial ratio that measures whether or not a company has enough resources to pay its debts over the next 12 months. It compares a company’s current assets to its current liabilities.
Quick ratio The quick ratio is an indicator of a company’s short-term liquidity position and measures a company’s ability to meet its short-term obligations with its most liquid assets.
Net debt to EBITDA The net debt to EBITDA is a measurement of leverage, calculated as a company’s interest bearing liabilities minus cash or cash equivalents, divided by its EBITDA. This ratio shows how many years it would take for a company to pay back its debt if net debt and EBITDA are held constant.
Interest cover The interest coverage ratio is calculated by dividing a company’s EBITDA of one period by the company’s interest expense of the same period.
Gearing ratio The gearing ratio indicates the relative proportion of shareholders’ equity and debt used to finance a company’s assets, and is calculated by dividing a company’s net debt by net debt plus shareholders’ equity. Alternatively, the gearing ratio can be calculated by dividing a company’s net debt by shareholders’ equity.
Related Documents