Company Assessment Project Hindustan Motors Ltd Submitted By, Group B11 Group Members SRINIDHI K S 14161 SRISTI ROY 14162 SUMAN SADHUKHAN 14163 TONY SEBASTIAN 14171 V H L KASYAPA DAGUUBATIA 14172

Financial Analysis of Hindustan motorsLtd
Jul 16, 2015
Welcome message from author
This document is posted to help you gain knowledge. Please leave a comment to let me know what you think about it! Share it to your friends and learn new things together.
Transcript

Company Assessment Project
Hindustan Motors Ltd
Submitted By,
Group B11
Group Members
SRINIDHI K S 14161
SRISTI ROY 14162
SUMAN SADHUKHAN 14163
TONY SEBASTIAN 14171
V H L KASYAPA DAGUUBATIA 14172

Cash Flows of a company
Cost of Equity and cost of debt
Working Capital Management
Key Learnings

Hindustan Motors is an Indian automotive manufacturing Company, established
during the pre-independence era.
Flagship vehicle – Ambassador: vehicle of choice for Government of India, and the
official car for almost every Indian Prime Minister after independence.
HM suspended production of Ambassador in May 2014.
After 1990’s the rise of other automotive companies like Maruti Udyog caused a
fall in HM’s market share.
Currently the company produce only one product: HM Winner truck.
Due to low sales and poor management the company is making a huge loss for the
last few years.
Introduction
Share Holding Pattern
No of Shares % Share Holding
Indian (Promoter & Group) 67,473,254 32.33%
Non Promoter (Institution) 30,089,189 14.42%
Non Promoter (Non-Institution) 111,096,850 53.24%
Grand Total 208,659,293 100%

Revenue Split
Vechile Sale(Ambassador & Winner)
77%
Spare Parts17%
Job Works4%
Services2%
PERCENTAGE SPLIT OF TOTAL REVENUE
This Data is based on 2014 sales.

Cash Flow
The firm’s stated operating income and cash flows are negative.
The firm is performing very poorly.
2014 2013 2012 2011 2010
Operating Profit -44.79 -119.01 -98.51 -65.42 -56.07
Net cash flow from Operations -24.06 -109.06 -100.03 -88.23 10.68
The company is making loss consecutively for the last 4 years.
In 2014 the loss decreased because they closed one of their production plants and a laid off
many employees.
This helped then to reduce some of their accumulated loss.

Historical growth rate of the company’s earnings
Growth Pattern
2014 2013 2012 2011 2010
Net Sales 182.78 385.2 495.48 850.04 735.99
Growth Rate -53% -22% -42% 15%
-60
-50
-40
-30
-20
-10
0
10
20
2011 2012 2013 2014
Growth Rate

How fast do analysts expect this company’s earnings to grow in the future?
The company is making loss for the last few years. The company stoppedproduction of Ambassador in May 2014 due to low sales. The cashmanagement of the company is very poor. Drastic measures are required toturn the company into profit.
2014 2013 2012 2011 2010
Earnings per share -0.17 -3.85 -1.73 -0.05 -3.17

If you are anticipating high growth, what are the barriers to entry that willallow high growth to continue?
Currently no future growth can be expected from the company. The mainreasons for the declining growth are:
Failure to introduce new models of cars.
Failed to understand the market and introduce products for the needs of thecustomer.
Failed to adapt new technologies.
The car market is very competitive. The company was not able to withstandcompetition from other companies offering superior products.
The company is making loss for the last 5 years.

Hindustan Motors likely to concentrate on Component Manufacturingfor GM, Tata etc. than ambassador manufacturing for its revival.
The company most probably will try for a Joint venture instead ofintroducing any new product.
From September 2014 the price of the companies share price has beenconstantly reducing. So it is better to sell the shares.
Analyst View Points

The cost of equity is the return that stockholders require for theirinvestment in a company. Using capital asset pricing model (CAPM), thecost of equity is expressed formulaically below:
Re = rf + (rm – rf) * β
Where:
Re = the required rate of return on equity
rf = the risk free rate
rm – rf = the market risk premium
β = beta coefficient
Cost of Capital & Performance
Cost of Equity

Beta Coefficient
Beta (Time Period)
HM
2011-2015 1.235
Risk Free Rate
10 year Indian Government bond yield = 7.728%
Market Rate of ReturnMarket rate of return is calculated using compound annual growth rate (CAGR) method.
CAGR = (P1/P0)^(1/y) -1
Where,
P1= current Index
P0= base Index
y= number of years
Market Return (Rm) = 13.88%
Market Risk Premium = 6.12%
Cost of Equity
Hindustan Motors
16.785 %

Cost of Debt
Cost of debt is the effective rate that a company pays on its current debt.
Effective cost of Debt = Nominal Rate (1-Tax)
Nominal rate = Interest Expense / (Average Debt of 2 years)
Tax Rate = 30%
Values in Cr.2014 (year)
Interest Expense 12.5
Average Debt 67.245
Nominal Rate 19%
Cost of Debt 13.3%

Equity Value per share =
Equity Value per share
Total Common Stockholders Equity = 1,043,300,000
Number of Common Shares = 2,08,659,293
Equity value Per Share = 5

Comparison: Equity Value per Share V/s Market Value per Share
0
2
4
6
8
10
12
3/1/2014 4/1/2014 5/1/2014 6/1/2014 7/1/2014 8/1/2014 9/1/2014 10/1/2014 11/1/2014 12/1/2014 1/1/2015 2/1/2015
Comparison of Market Value & Equity Value Per Share
Market Value of Share Equity Value Per Share

Working Capital Management Consists of four main components:
Cash
Marketable securities
Inventories
Accounts receivable
Basic goal of working capital management is to manage the current assets and current liabilities
Working capital management polices of a firm has a great impact on the profitability, liquidity and structural health of the organization

Working Capital of Hindustan Motors2014 2013 2012 2011 2010
Current Assets 34.23 109.14 117.26 144.91 89.48
Current Liablilites 187.67 211.06 187.32 257.54 255
Working Capital -153.44 -101.92 -70.06 -112.63 -165.52
The companies working capital is negative for the last few years. This is because of low sales and poor cash management.
This is one of the reasons for stopping the production of Ambassador cars.

Hindustan Motors
2014 2013 2012 2011 2010
Receivables Collection Period/DSO 35.9 25.51 13.953 16.208 11.44
Total Asset turnover
0.77 1.13 1.05 1.46 1.28
Debtors Turnover12.41 30.83 23.98 40.62 42.37
Inventory turnover 38 45 48 38 43
Current ratio 0.29 0.42 0.34 0.53 0.76
Quick ratio 0.16 0.21 0.30 0.44 0.67
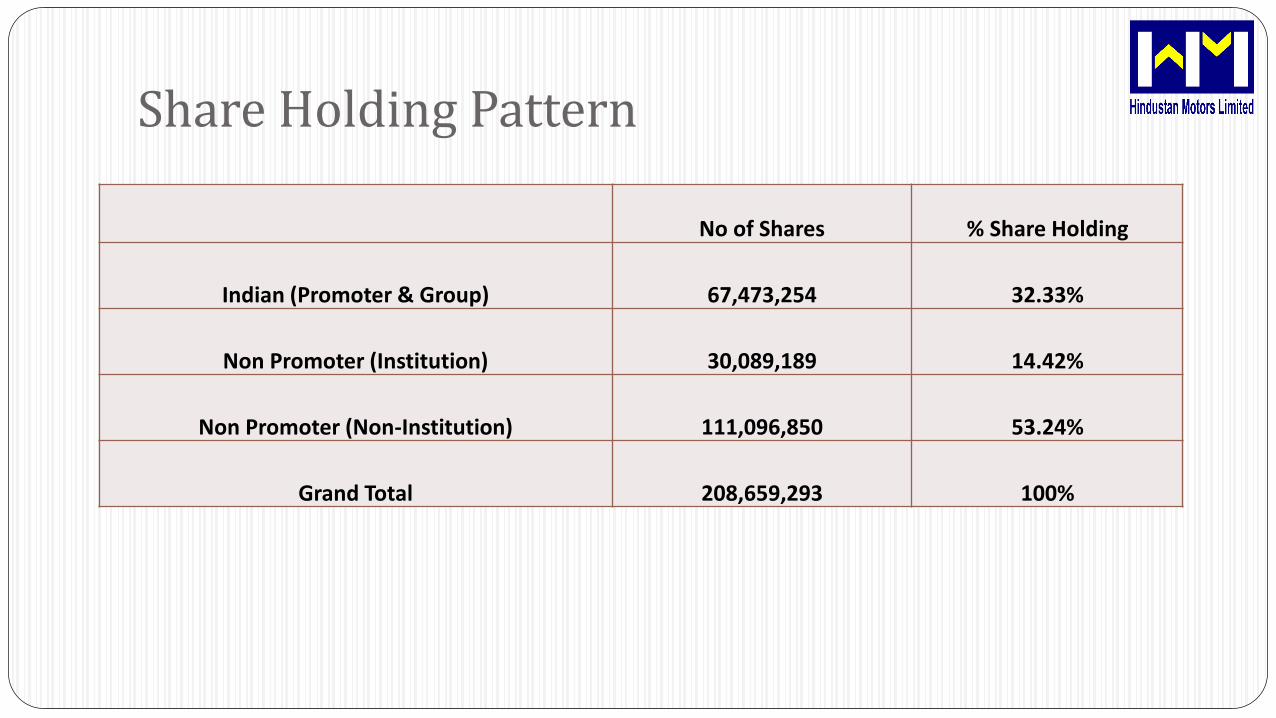
Receivables
Collection
Period/DSO 2014 2013 2012 2011 2010
HM 35.9 25.51 13.953 16.208 11.44
Challenges in the existing position of Working Capital and its impact on the Company’s Profitability
Receivables Collection Period/DSO for Hindustan Motors is very high compared to the industry average of 15.5 (www.stock-analysis-on.net)
Delays in receipt of dues result in loss of interest on working capital and the risk of bad debts increases.
This in turn decrease the company’s profits.

2014 2013 2012 2011 2010
Inventory
Conversion
Period 38.5 45.8 48.7 38.2 43.7
Challenges in the existing position of Working Capital and its impact on the Company’s Profitability
Inventory Conversion Period is the average time required to convertmaterials into finished goods.
This should be reduced by processing and selling the goods more quicklyso as to increase profit.
With high Conversion Period there will be more liquidity risk in that levelof inventory.

What improvements in WCM can bring about positive financial impact?
The company should take steps to increase its inventory turnover ratio. A
lower inventory turnover ratio of HM is an indication of over-stocking which
may pose risk of obsolescence and increased inventory holding costs.
The receivable collection period is high for Hindustan Motors. So the company
should try to collect the receivables fast so that they have more working capital
available.
The Inventory conversion period is also high. This causes block of working
capital in the form of inventories. This should be minimised.
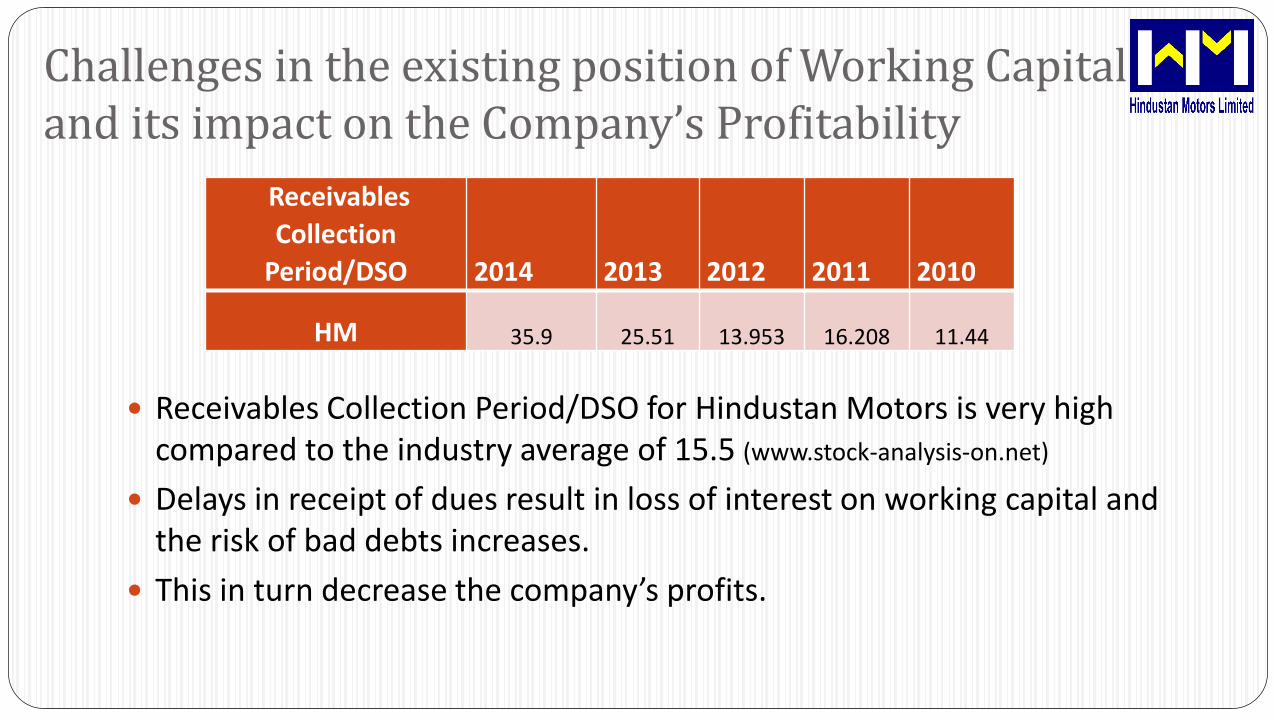
2014 2013 2012 2011
Debt Equity Ratio -1.176 -2.114 4.72 3.13
Total assets to debt
ratio
0.471 0.985 1.297 1.399
Current Debt Position and Financial Risk.
HM had problems raising money to cover its historical net losses. Those net
losses accrued and eventually surpassed the equity from issued stock.
Total assets to debt ratio indicates that HM does not have sufficient capacity to
meet its long term debts out of its investment in total assets.

Competitive Advantages of the company
The vehicles of Hindustan Motors are sturdy and tough.
Old age people prefer to have ambassador than any other car due to itsimpressive record against accidents.
Emotional Attachment with the customers.
The company has a good brand recognition.
The company has a broad network of service centres. It consists of 115 strongdealers, 50 parts dealers and 60 additional exclusive parts dealers.

Current Scenario of the company (The big picture)
Currently the company has only one product, the winner truck.
This truck was not able to capture the market due to huge competition and less
promotion.
The company offered VRS to its employees in the month of November 2014.
The company had been facing a huge cash crunch because of poor cash management
and lack of leadership.
The company reported to BIFR (Board for Industrial and Financial Reconstruction) to
declare it as a sick company in 2014.

Conclusion
From the analysis we can conclude that with changing time the company shouldfocus on the ongoing conditions as well as it should be prepared of future.
Unless and until Government is helping and infusing blood or HM is coming upwith some restructuring plan which will attract the investors, it cannot recoveror else the company has to wind up.

THANK YOU
Related Documents