Financial Analysis VS

Financial Analysis of Abercrombie & Fitch vs Polo Ralph Lauren
Dec 16, 2014
Company Analysis of Polo Ralph Lauren Corp. versus Abercrombie & Fitch (financial ratios, ERR/RRR, beta, companies profiles and financial statements)
Welcome message from author
This document is posted to help you gain knowledge. Please leave a comment to let me know what you think about it! Share it to your friends and learn new things together.
Transcript

Financial Analysis
VS
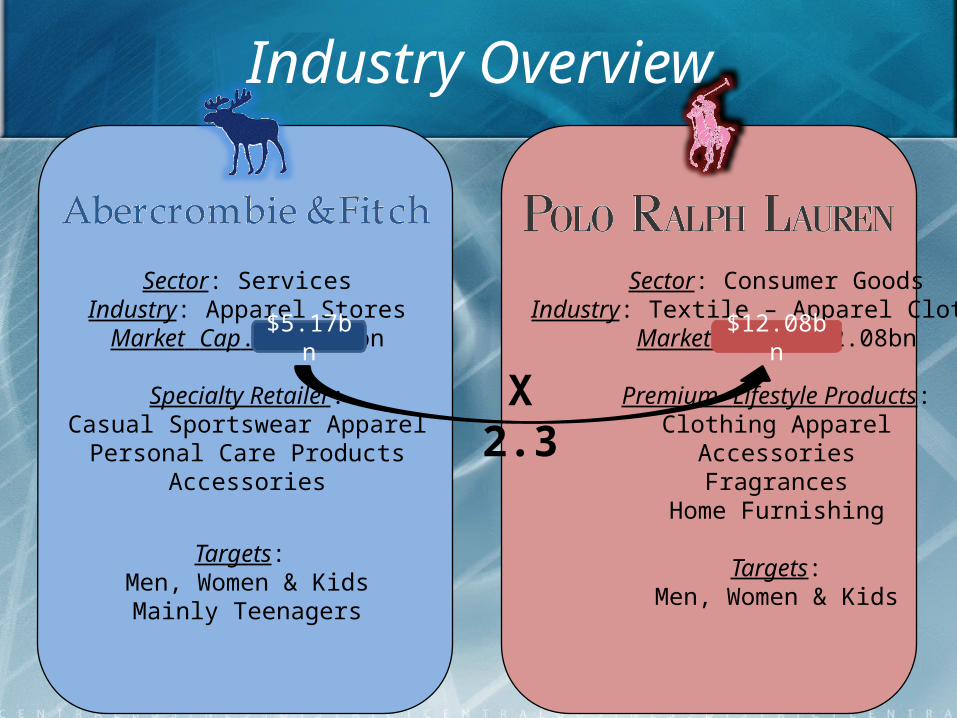
Industry Overview
Sector: ServicesIndustry: Apparel Stores
Market Cap.: $5.17bn
Specialty Retailer:Casual Sportswear Apparel
Personal Care ProductsAccessories
Targets: Men, Women & Kids
Mainly Teenagers
Sector: Consumer GoodsIndustry: Textile – Apparel Clothing
Market Cap.: $12.08bn
Premium Lifestyle Products:Clothing Apparel
AccessoriesFragrances
Home Furnishing
Targets:Men, Women & Kids
$5.17bn $12.08bn
X 2.3
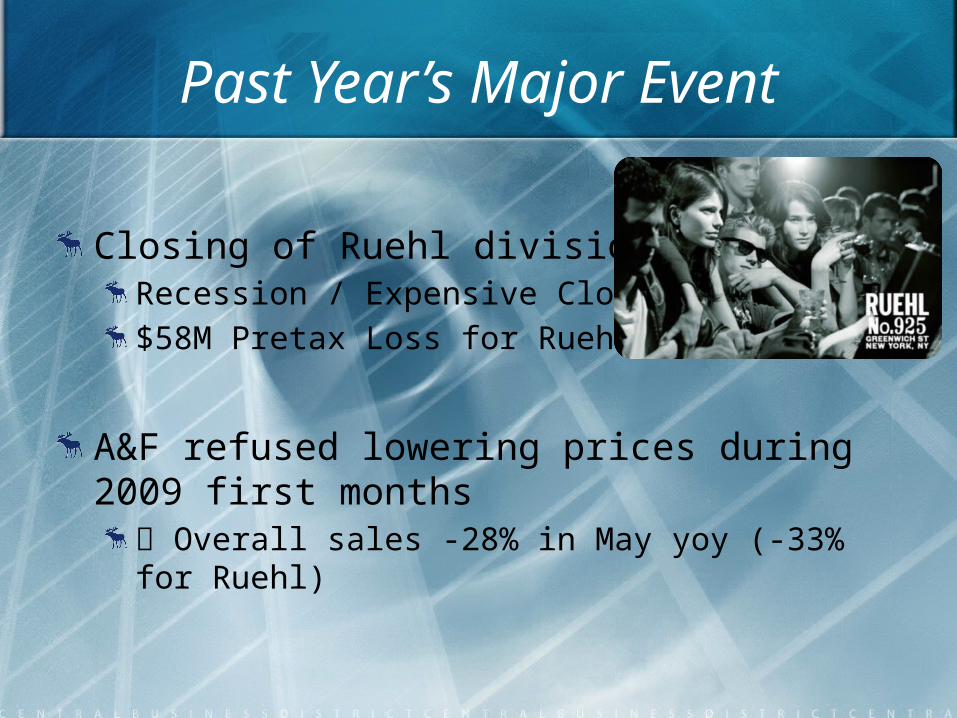
Closing of Ruehl divisionRecession / Expensive Clothes Prices$58M Pretax Loss for Ruehl in 2008
A&F refused lowering prices during 2009 first months Overall sales -28% in May yoy (-33% for Ruehl)
LATimes.com
Past Year’s Major Event
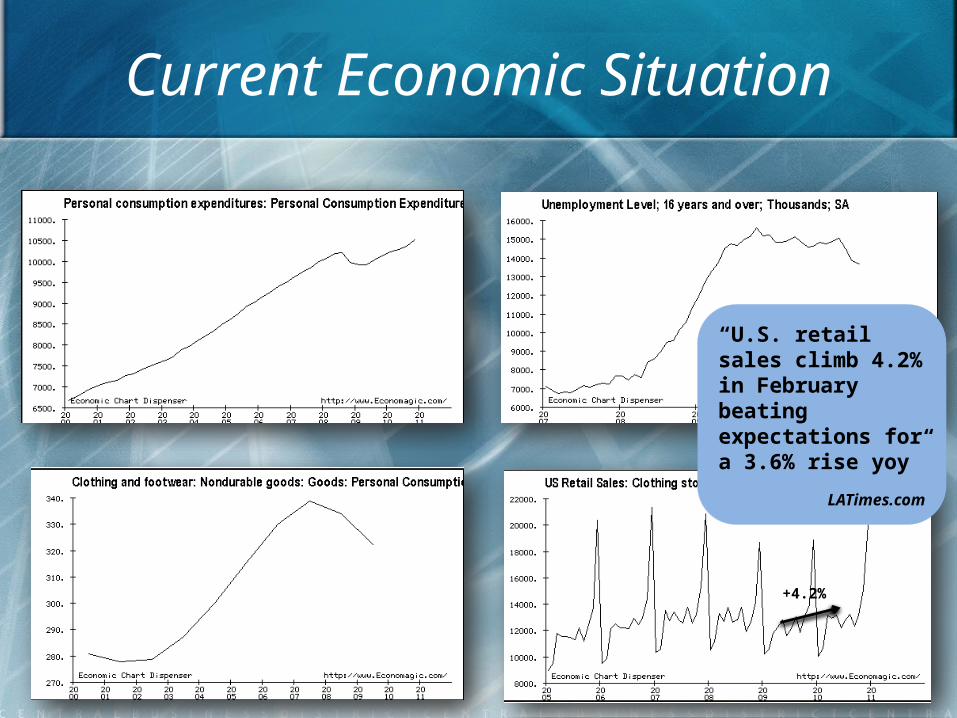
Current Economic Situation
“U.S. retail sales climb 4.2% in February beating expectations for a 3.6% rise yoy”
LATimes.com
+4.2%
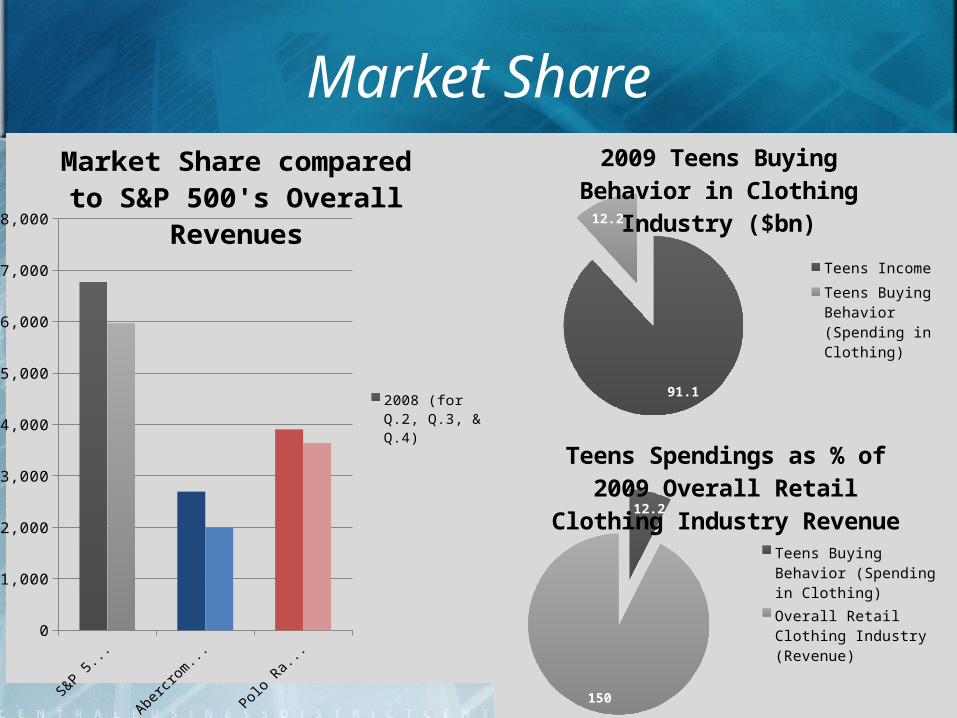
Market Share
0
1,000
2,000
3,000
4,000
5,000
6,000
7,000
8,000
Market Share compared to S&P 500's Overall Revenues
2008 (for Q.2, Q.3, & Q.4)
2009 (for Q.1, Q.2, & Q.3)
91.1
12.2
2009 Teens Buying Behavior in Clothing Industry ($bn)
Teens Income
Teens Buying Behavior (Spending in Clothing)
12.2
150
Teens Spendings as % of 2009 Overall Retail Clothing Industry
Revenue
Teens Buying Behavior (Spending in Clothing)
Overall Retail Clothing Industry (Revenue)
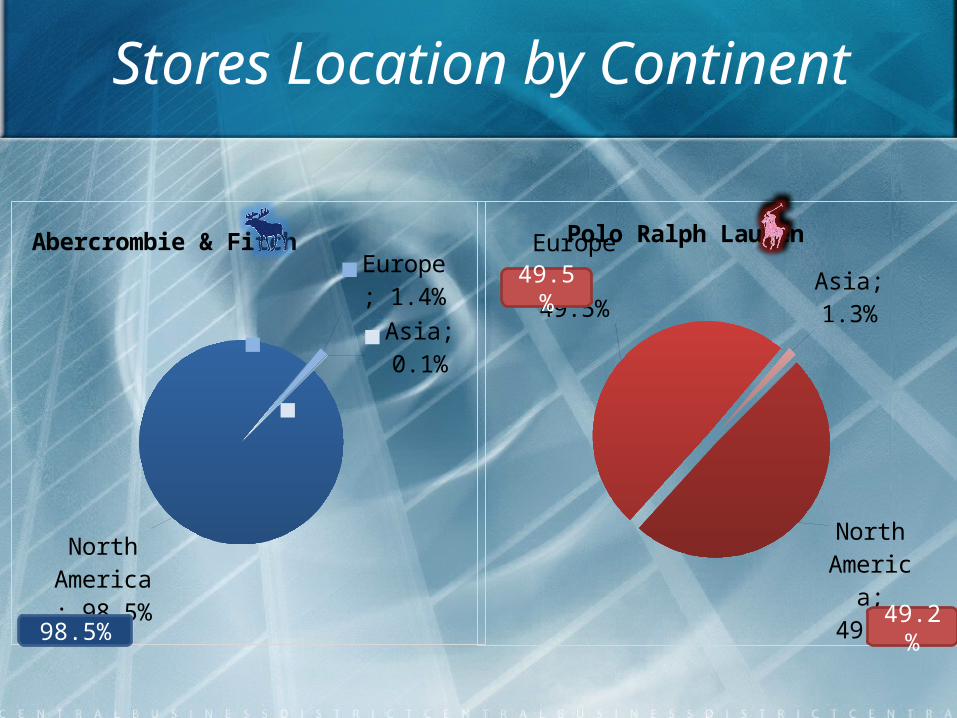
Stores Location by Continent
North America;
98.5%
Europe; 1.4%
Asia; 0.1%
Abercrombie & Fitch
North Amer-
ica; 49.2%
Eu-rope; 49.5%
Asia; 1.3%
Polo Ralph Lauren
98.5%
49.5%
49.2%
EUR/USD WeeklyFiscal Year 2009
Open: 1.2962 Close: 1.4141
+9%
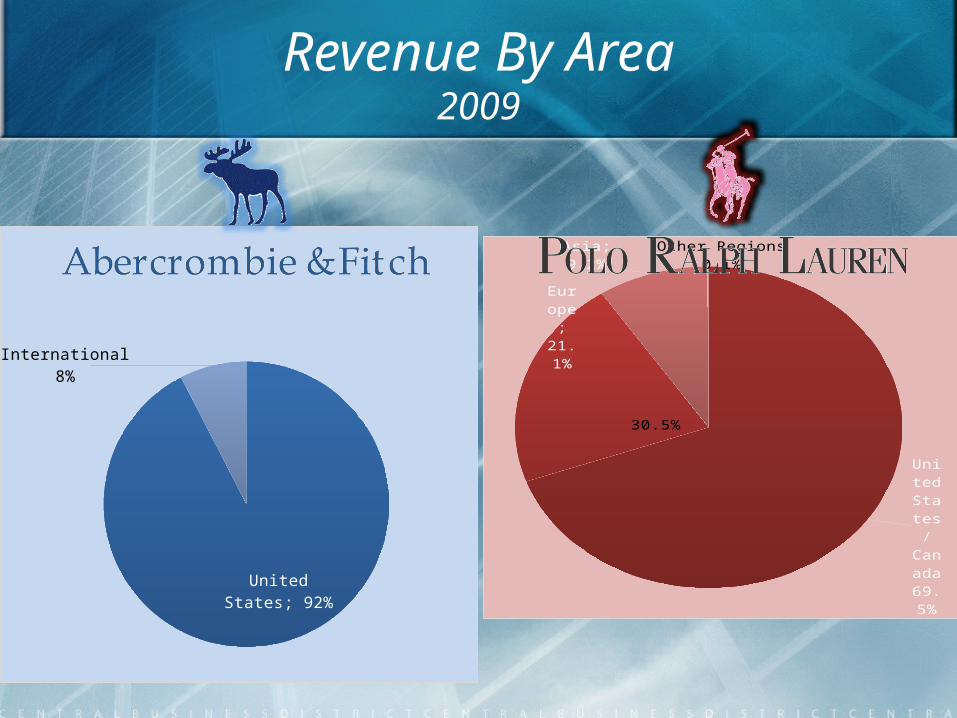
Revenue By Area2009
United States; 92%
International8%
United
States /
Canada
69.5%
Eu-rope;21.1
%
Asia;9.2%
Other Regions0.1%
30.5%
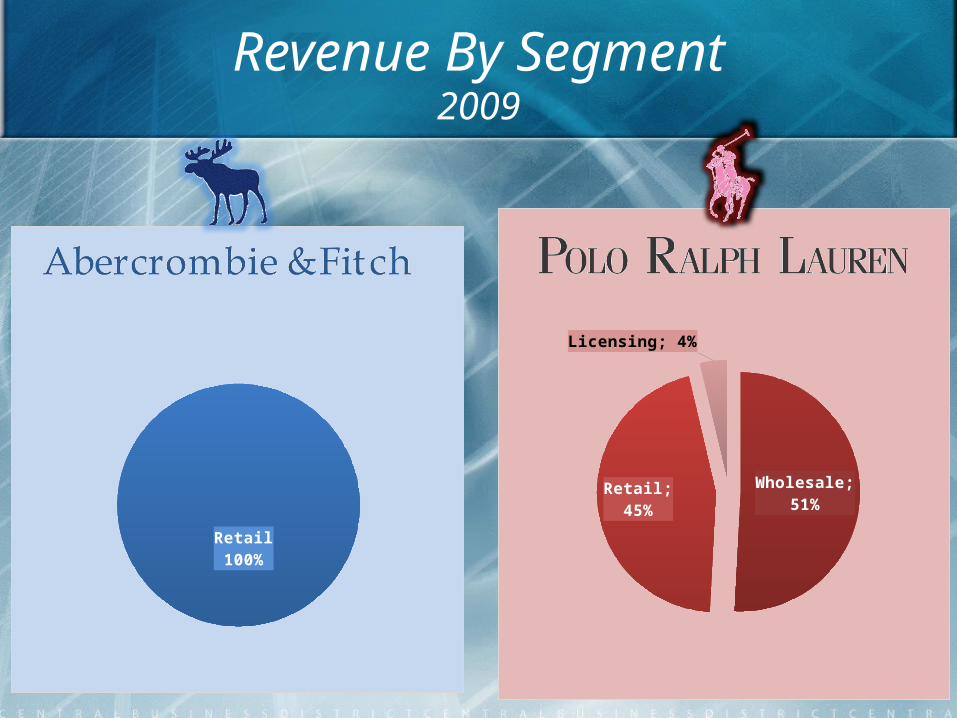
Revenue By Segment2009
Wholesale; 51%Retail; 45%
Licensing; 4%
Retail100%
Stores Sales Sales per Store ($M)
Sales per Square Foot
($)Polo Ralph Lauren
0
1,000
2,000
3,000
4,000
5,000
6,000
7,000
8,000
9,000
10,000
8,918
4,823.7
0.540894819466249 115.133323921283
8,940
4,795.5
0.536409395973154 114.178571428571
20082009
+63,7%
X 2.3Stores Sales ($M) Sales per
Store ($M)Sales per
Square Foot ($)
Abercombie & Fitch
0
500
1,000
1,500
2,000
2,500
3,000
3,500
4,000
1,097
3,484.1
3.17602552415678
448.981958762885
1,096
2,928.6
2.6720802919708373.165137614679
20082009
Stores, Sales, Sales per Store &Sales per Square Foot
3 484.1
2 928.6
4 823.7 4 795.5
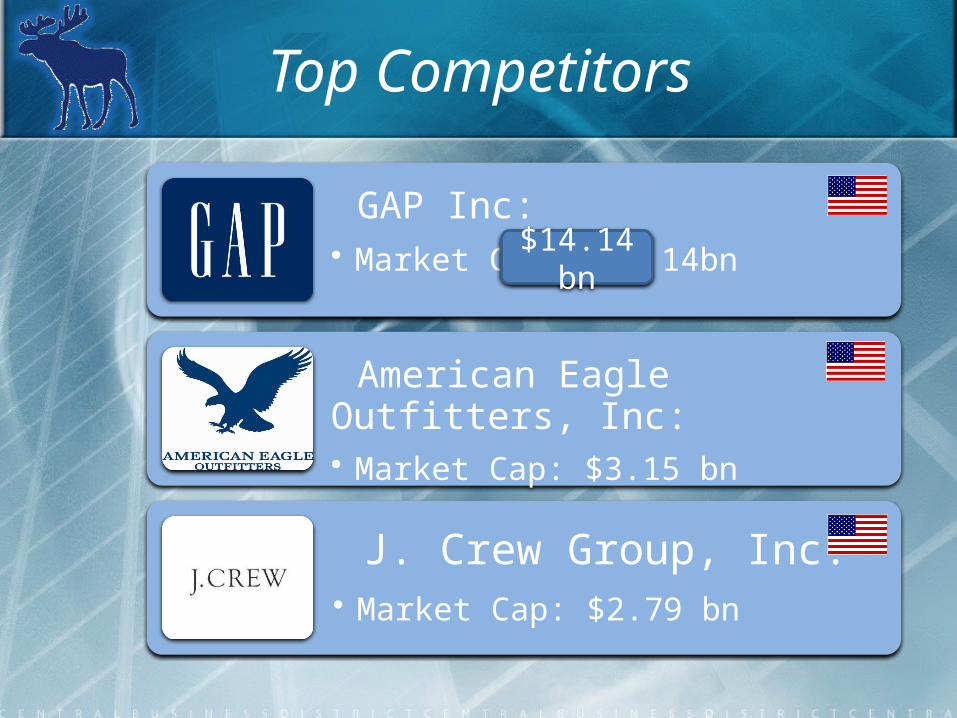
Top Competitors
GAP Inc: • Market Cap: $14.14bn
American Eagle Outfitters, Inc:• Market Cap: $3.15 bn
J. Crew Group, Inc:• Market Cap: $2.79 bn
$14.14bn
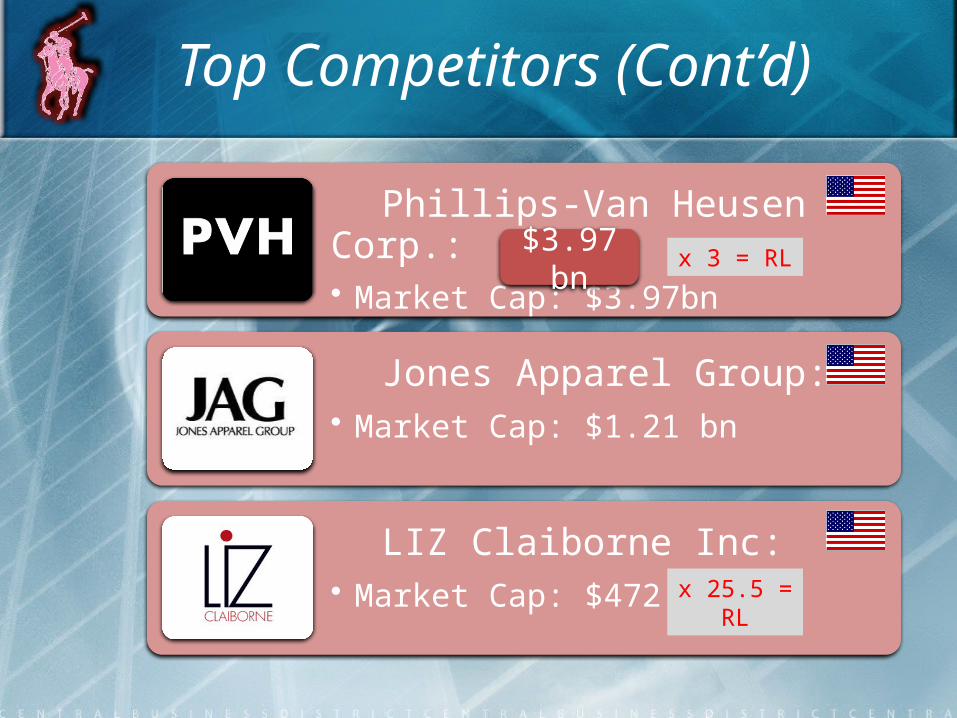
Top Competitors (Cont’d)
Phillips-Van Heusen Corp.:• Market Cap: $3.97bn
Jones Apparel Group:• Market Cap: $1.21 bn
LIZ Claiborne Inc:• Market Cap: $472.37 M
$3.97bn x 3 = RL
x 25.5 = RL
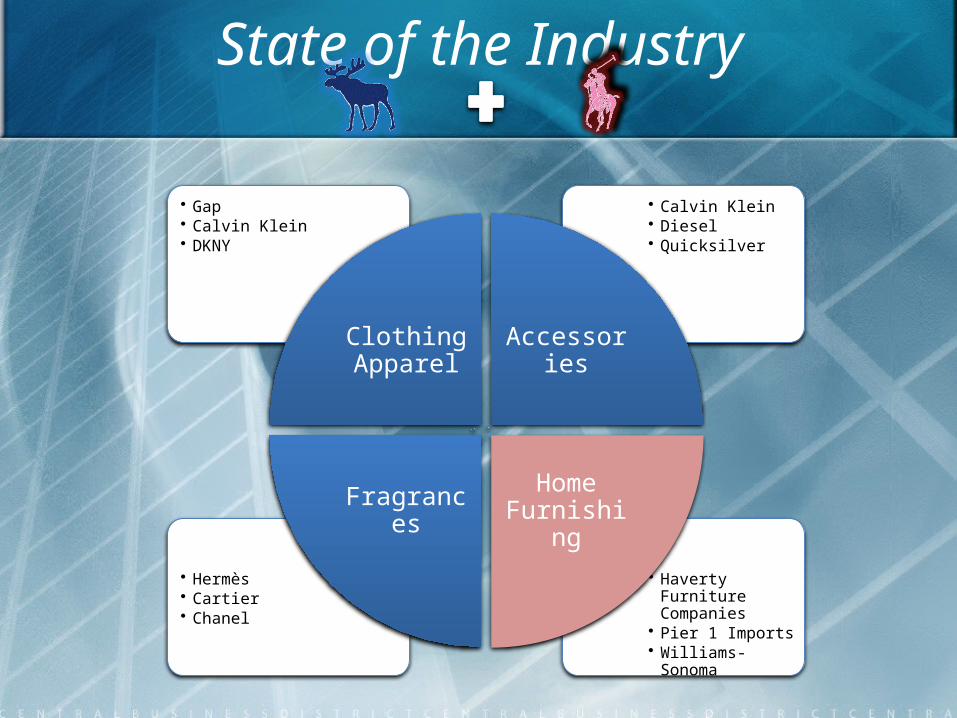
State of the Industry
• Haverty Furniture Companies
• Pier 1 Imports• Williams-Sonoma
• Hermès• Cartier• Chanel
• Calvin Klein• Diesel• Quicksilver
• Gap• Calvin Klein• DKNY
Clothing Apparel Accessories
Home FurnishingFragrances
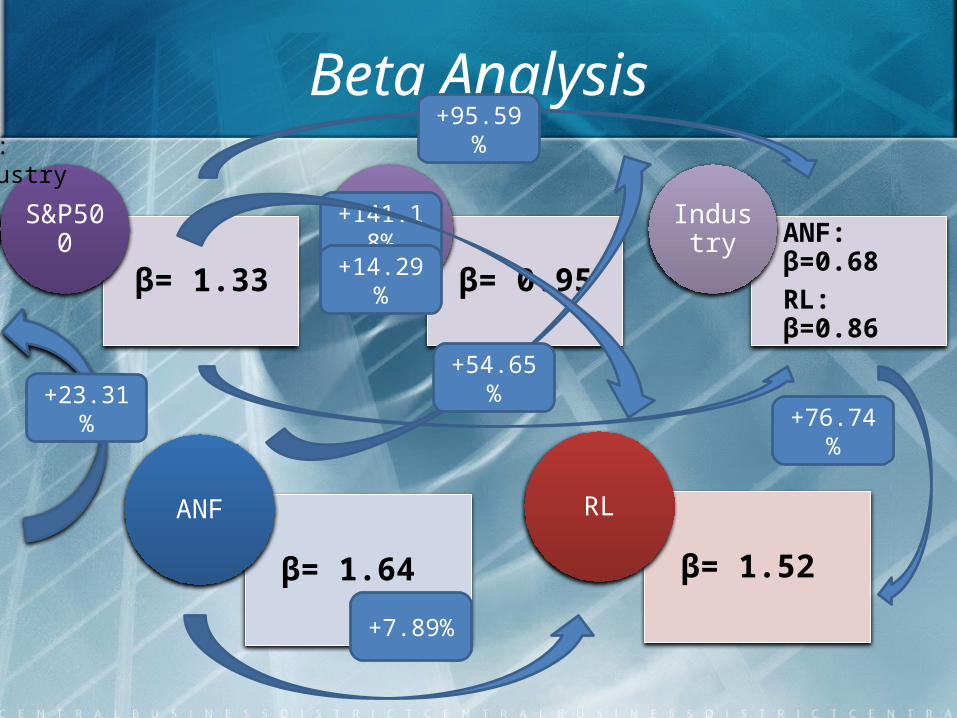
Beta Analysis
β= 1.33
S&P500
β= 0.95
SectorANF: β=0.68RL: β=0.86
Industry
ANF β higher than industry and RLHigher volatility’s stock, higher risk however higher rate of return demandedAlso lower present value placed on ANF’s future cash flowsThis is due to:- High elasticity of demand- High volatility in fashion trends- High competition- Fewer and bad differentiation products strategy- Higher raw material and labor costs due to external economic factors
β= 1.52
RL
β= 1.64
ANF
+23.31%
+141.18%
+95.59%
+54.65%
+76.74%
+7.89%
+14.29%

Similar Marketing Strategies
High Competition: Constant changes in products Constant design renewal (fashion perpetuity)
Quality, design, brand, and image-focusing: products quality long-term similarity in design, style advertising similarity (magazines, e-marketing) seasonal marketing campaigns (Spring & Fall) large products availability corporate image brand affiliation
Price segmentation: Ralph Lauren and Abercrombie & Fitch can both be competitors (or not)
according to the prices they practice onto the market
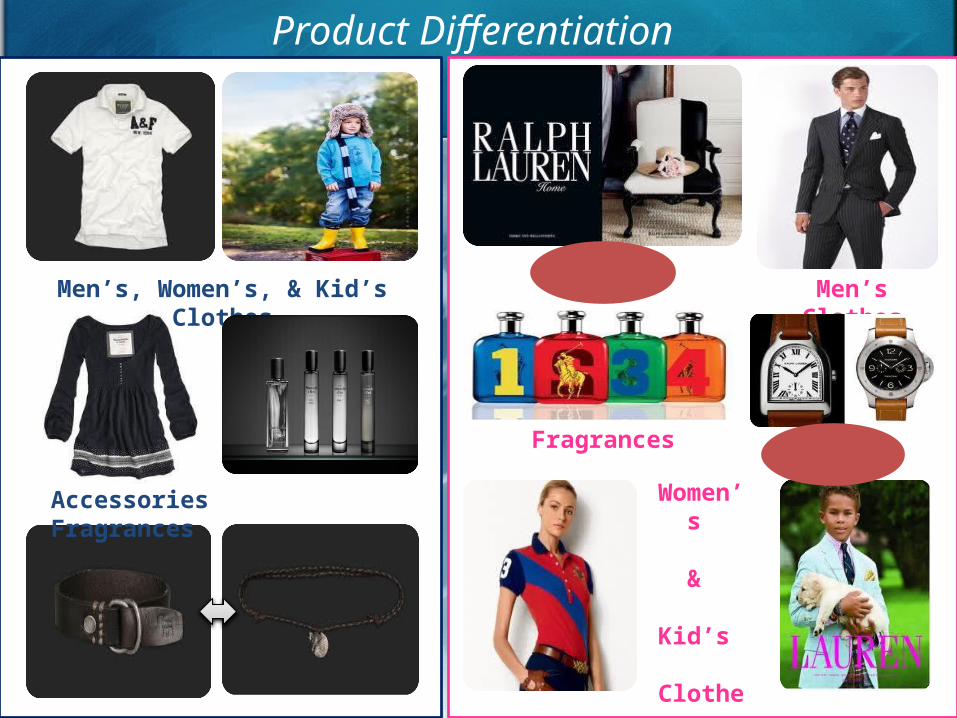
Product Differentiation
Men’s Clothes
WatchesFragrances
Women’s
&
Kid’s
Clothes
Home Line Men’s, Women’s, & Kid’s Clothes
Accessories Fragrances
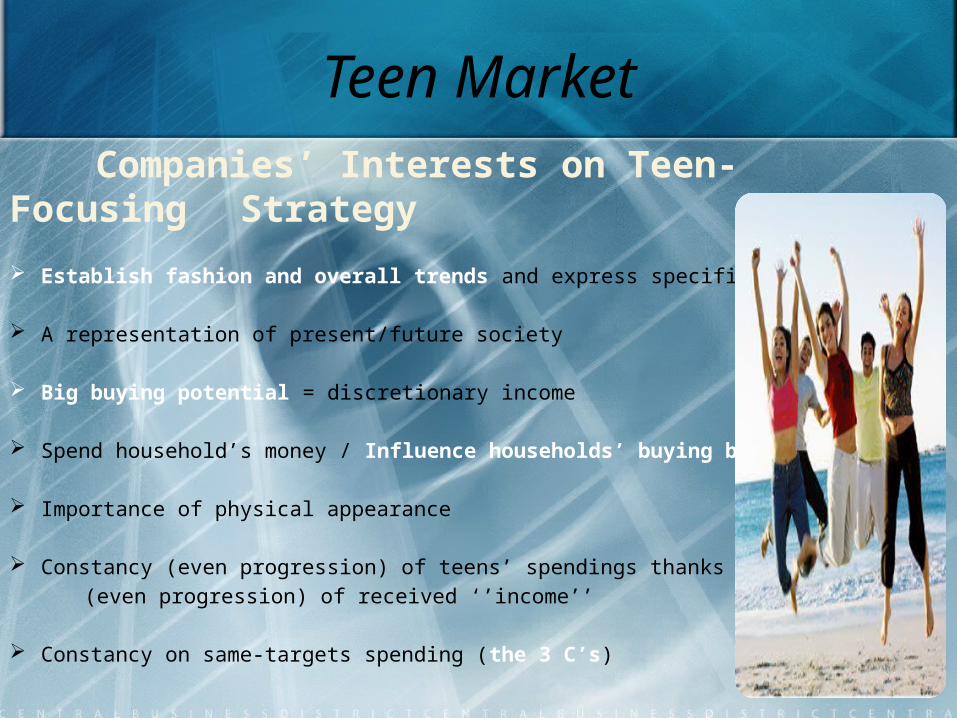
Teen Market Companies’ Interests on Teen-Focusing
Strategy
Establish fashion and overall trends and express specific lifestyles
A representation of present/future society
Big buying potential = discretionary income
Spend household’s money / Influence households’ buying behaviors
Importance of physical appearance
Constancy (even progression) of teens’ spendings thanks to constancy (even progression) of received ‘’income’’
Constancy on same-targets spending (the 3 C’s)
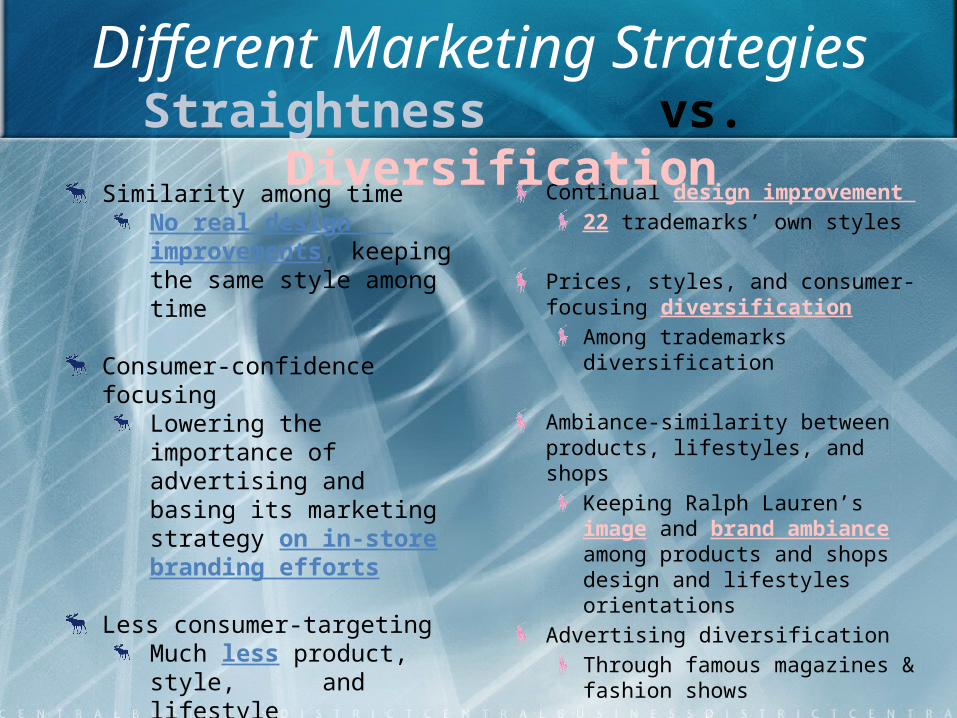
Different Marketing Strategies
Continual design improvement 22 trademarks’ own styles
Prices, styles, and consumer-focusing diversification
Among trademarks diversification
Ambiance-similarity between products, lifestyles, and shops
Keeping Ralph Lauren’s image and brand ambiance among products and shops design and lifestyles orientations
Advertising diversificationThrough famous magazines & fashion shows
Straightness vs. Diversification
Similarity among timeNo real design improvements, keeping the same style among time
Consumer-confidence focusingLowering the importance of advertising and basing its marketing strategy on in-store branding efforts
Less consumer-targetingMuch less product, style, and lifestyle diversification through only 4 trademarks
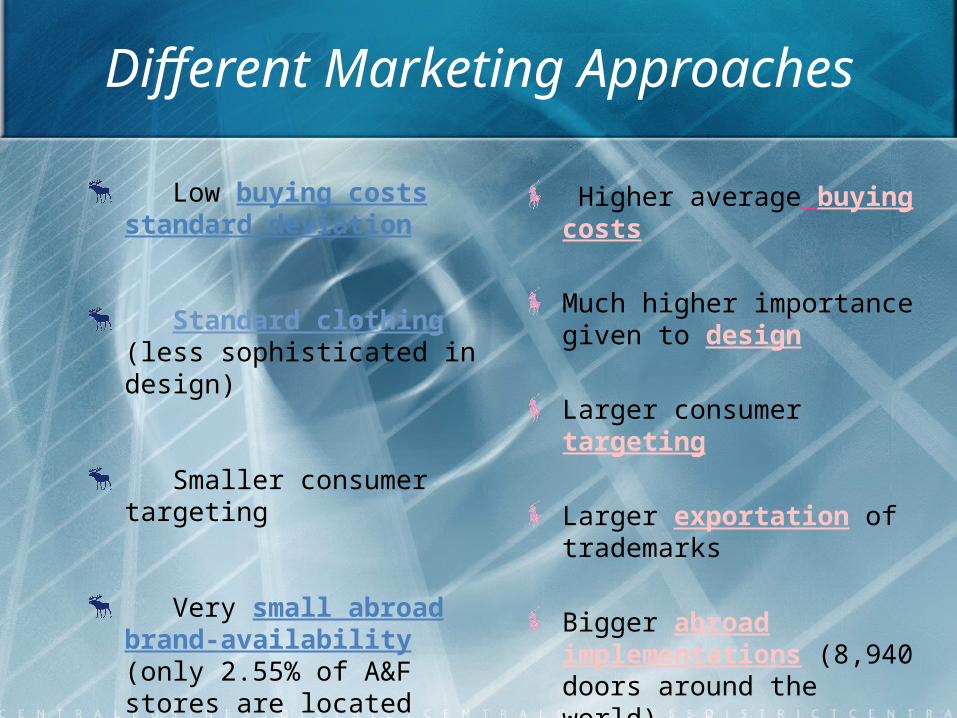
Different Marketing Approaches
Higher average buying costs
Much higher importance given to design
Larger consumer targeting
Larger exportation of trademarks
Bigger abroad implementations (8,940 doors around the world)
Low buying costs standard deviation
Standard clothing (less sophisticated in design)
Smaller consumer targeting
Very small abroad brand-availability (only 2.55% of A&F stores are located outside the United States)
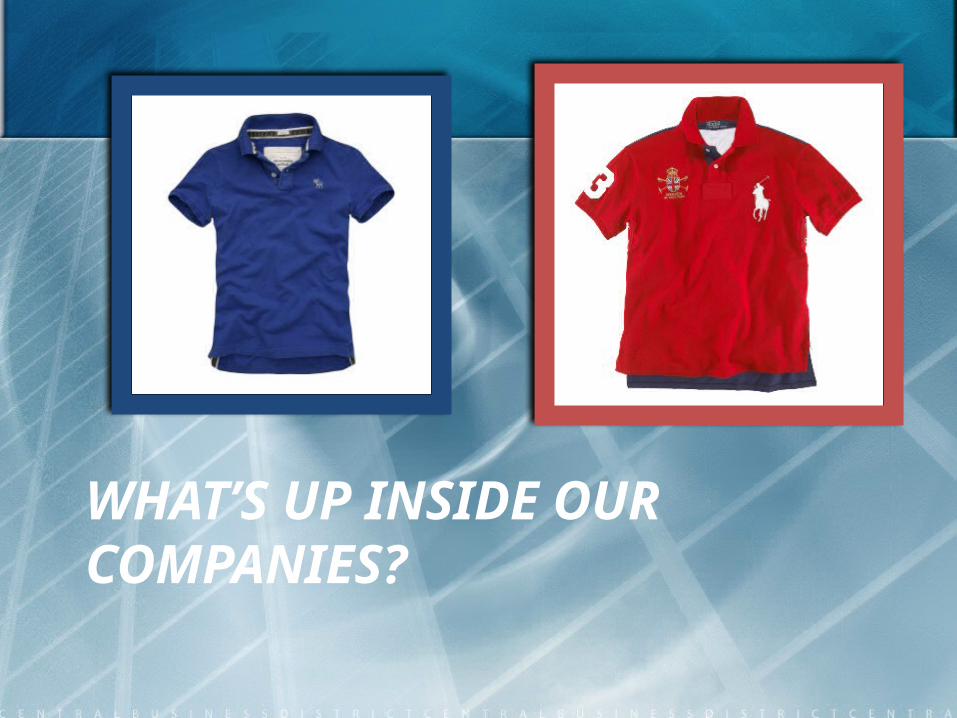
WHAT’S UP INSIDE OUR COMPANIES?
Quarterly Loading of Sales and Income
Q1 Q2 Q3 Q40%
5%
10%
15%
20%
25%
30%
35%
21% 22%
26%
32%
23% 24%25%
28%
Abercrombie & Fitch: Quarterly Sales as Percent of Year Sales
20092008
Q1 Q2 Q3 Q4
-30000%
-20000%
-10000%
0%
10000%
20000%
30000%
0%
5%
10%
15%
20%
25%
30%
-23050% -10407%
15091%
18467%
22%
28%25%
25%
Abercrombie & Fitch: Quarterly Net Income as Percent of Year Net Income
2009
2008
Q4 Q1 Q2 Q30%
5%
10%
15%
20%
25%
30%
35%
40%
45%
24%
16%
37%
23%
11%
23%
40%
26%
Polo Ralph Lauren: Quarterly Net Income as Percent of Year Net Income
20092008
Q4 Q1 Q2 Q30%
5%
10%
15%
20%
25%
30%27%
21%
28%25%24%
22%
28%
25%
Polo Ralph Lauren : Quarterly Sales as Percent of Year Sales
20092008
Spread+11% Spread+7%
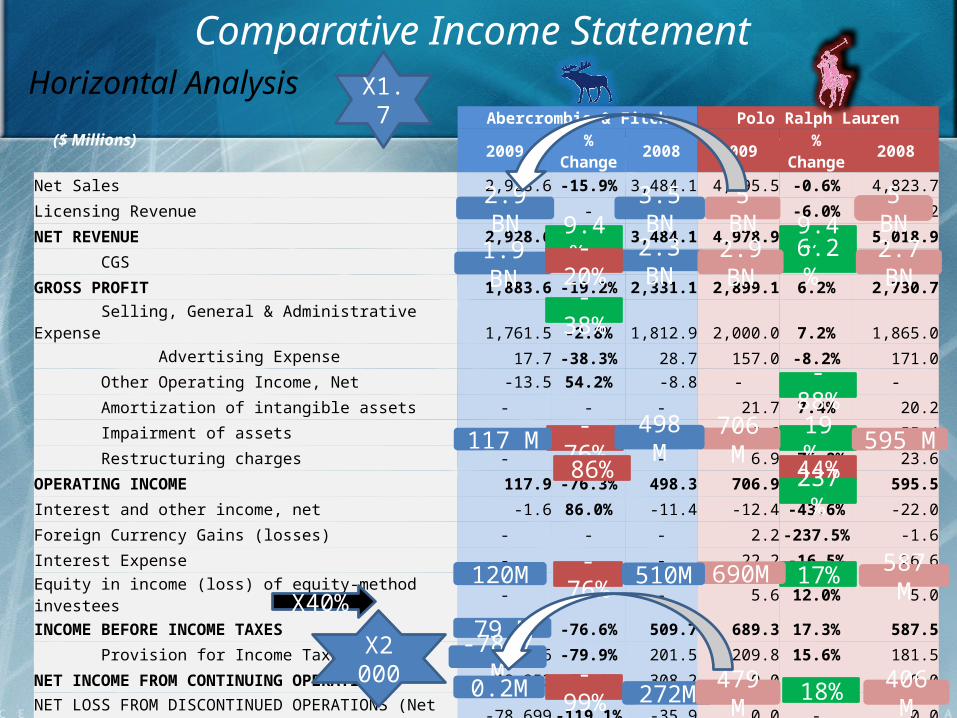
Comparative Income Statement
($ Millions) Abercrombie & Fitch Polo Ralph Lauren2009 % Change 2008 2009 % Change 2008
Net Sales 2,928.6 -15.9% 3,484.1 4,795.5 -0.6% 4,823.7
Licensing Revenue - - - 183.4 -6.0% 195.2
NET REVENUE 2,928.6 -15.9% 3,484.1 4,978.9 -0.8% 5,018.9
CGS 1,045.0 -9.4% 1,153.0 2,079.8 -9.1% 2,288.2
GROSS PROFIT 1,883.6 -19.2% 2,331.1 2,899.1 6.2% 2,730.7
Selling, General & Administrative Expense 1,761.5 -2.8% 1,812.9 2,000.0 7.2% 1,865.0 Advertising Expense 17.7 -38.3% 28.7 157.0 -8.2% 171.0 Other Operating Income, Net -13.5 54.2% -8.8 - - -
Amortization of intangible assets - - - 21.7 7.4% 20.2
Impairment of assets - - - 6.6 -88.1% 55.4
Restructuring charges - - - 6.9 -70.8% 23.6
OPERATING INCOME 117.9 -76.3% 498.3 706.9 18.7% 595.5
Interest and other income, net -1.6 86.0% -11.4 -12.4 -43.6% -22.0
Foreign Currency Gains (losses) - - - 2.2 -237.5% -1.6
Interest Expense - - - 22.2 -16.5% 26.6
Equity in income (loss) of equity-method investees - - - 5.6 12.0% 5.0
INCOME BEFORE INCOME TAXES 119.5 -76.6% 509.7 689.3 17.3% 587.5
Provision for Income Taxes 40.6 -79.9% 201.5 209.8 15.6% 181.5
NET INCOME FROM CONTINUING OPERATIONS 78.953 -74.4% 308.2 0.0 - 0.0
NET LOSS FROM DISCONTINUED OPERATIONS (Net of taxes) -78.699 -119.1% -35.9 0.0 - 0.0
NET INCOME 0.254 -99.9% 272.3 479.5 18.1% 406.0
2.9 BN 3.5 BN 5 BN 5 BN9.4 % 9.4 %
1.9 BN 2.3 BN 6.2 % -20% 2.9 BN 2.7 BN
Horizontal Analysis
-76% 19 %
17% -76%
-99% 18%
86% 44%237%
706 M 595 M117 M 498 M
X40%79 M
-78.7 M
690M 587 M510M120M
0.2M 272M 406 M479 M
X1.7
X2 000
-38%
-88%
Comparative Income StatementVertical Analysis
$ MillionsAbercrombie & Fitch Polo Ralph Lauren
2009 % V 2008 %V 2009 %V 2008 %V
Net Sales 2,928.6 100.0% 3,484.1 100% 4,795.5 100.0% 4,823.7 100%
Licensing Revenue - - - - 183.4 3.8% 195.2 4%
NET REVENUE 2,928.6 100.0% 3,484.1 100% 4,978.9 103.8% 5,018.9 104%
CGS 1,045.0 35.7% 1,153.0 33% 2,079.8 43.4% 2,288.2 47%
GROSS PROFIT 1,883.6 64.3% 2,331.1 67% 2,899.1 60.5% 2,730.7 57%
Selling, General & Administrative Expense 1,761.5 60.1% 1,812.9 52% 2,000.0 41.7% 1,865.0 39%
Advertising Expense 17.7 0.6% 28.7 1% 157.0 3.3% 171.0 4%
Other Operating Income, Net -13.5 0.5% -8.8 0% - - -
Amortization of intangible assets - - - - 21.7 0.5% 20.2 0%
Impairment of assets - - - - 6.6 0.1% 55.4 1%
Restructuring charges - - - - 6.9 0.1% 23.6 0%
OPERATING INCOME 117.9 4.0% 498.3 14% 706.9 14.7% 595.5 12%
Interest and other income, net -1.6 -0.1% -11.4 0% -12.4 -0.3% -22.0 0%
Foreign Currency Gains (losses) - - - - 2.2 0.0% -1.6 0%
Interest Expense - - - - 22.2 0.5% 26.6 1%
Equity in income (loss) of equity-method investees - - - - 5.6 0.1% 5.0 0%
INCOME BEFORE INCOME TAXES 119.5 4.1% 509.7 15% 689.3 14.4% 587.5 12%
Provision for Income Taxes 40.6 1.4% 201.5 6% 209.8 4.4% 181.5 4%
NET INCOME FROM CONTINUING OPERATIONS 78.953 2.7% 308.2 9% 0.0 0.0% 0.0 0%
NET LOSS FROM DISCONTINUED OPERATIONS (Net of taxes) -78.699 -2.7% -35.9 -1% 0.0 0.0% 0.0 0%
NET INCOME 0.254 0.0% 272.3 8% 479.5 10.0% 406.0 8%
64%
4%
4.1%
0%
3BN 3.5BN
67%
14%
15%
8%
5BN5BN
57%60%
12%15%
12%14.5%
8%10%
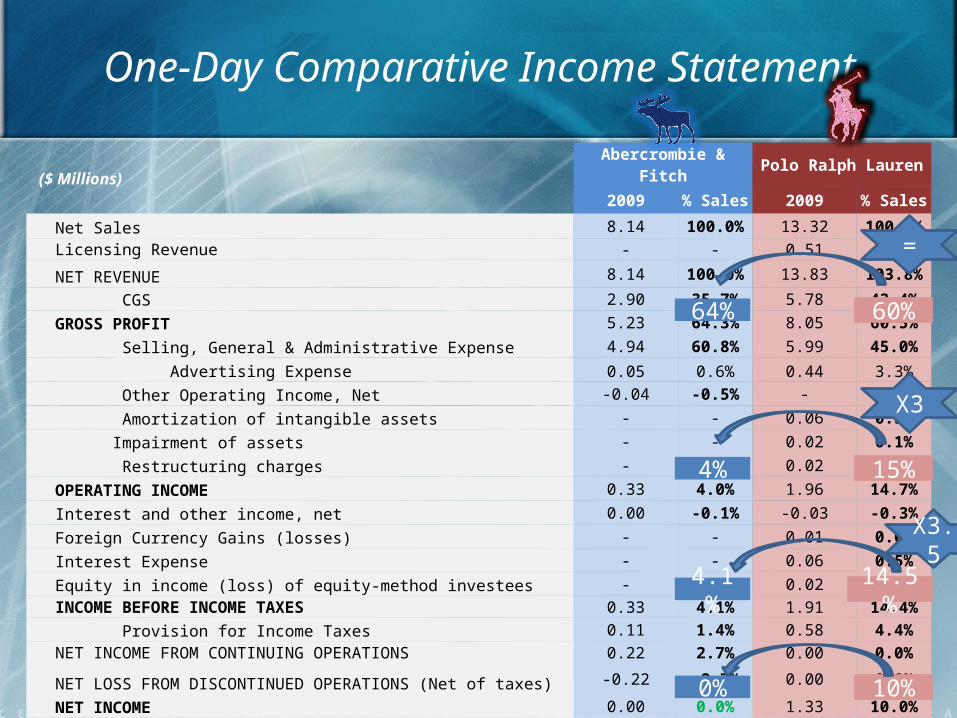
One-Day Comparative Income Statement
($ Millions)Abercrombie & Fitch Polo Ralph Lauren
2009 % Sales 2009 % Sales
Net Sales 8.14 100.0% 13.32 100.0%
Licensing Revenue - - 0.51 3.8%
NET REVENUE 8.14 100.0% 13.83 103.8%
CGS 2.90 35.7% 5.78 43.4%
GROSS PROFIT 5.23 64.3% 8.05 60.5%
Selling, General & Administrative Expense 4.94 60.8% 5.99 45.0%
Advertising Expense 0.05 0.6% 0.44 3.3% Other Operating Income, Net -0.04 -0.5% - -
Amortization of intangible assets - - 0.06 0.5%
Impairment of assets - - 0.02 0.1%
Restructuring charges - - 0.02 0.1%
OPERATING INCOME 0.33 4.0% 1.96 14.7%
Interest and other income, net 0.00 -0.1% -0.03 -0.3%
Foreign Currency Gains (losses) - - 0.01 0.0%
Interest Expense - - 0.06 0.5%
Equity in income (loss) of equity-method investees - - 0.02 0.1% INCOME BEFORE INCOME TAXES 0.33 4.1% 1.91 14.4%
Provision for Income Taxes 0.11 1.4% 0.58 4.4% NET INCOME FROM CONTINUING OPERATIONS 0.22 2.7% 0.00 0.0%
NET LOSS FROM DISCONTINUED OPERATIONS (Net of taxes) -0.22 -2.7% 0.00 0.0%
NET INCOME 0.00 0.0% 1.33 10.0%
64%
4%
4.1%
0%
60%
15%
14.5%
10%
=
X3
X3.5
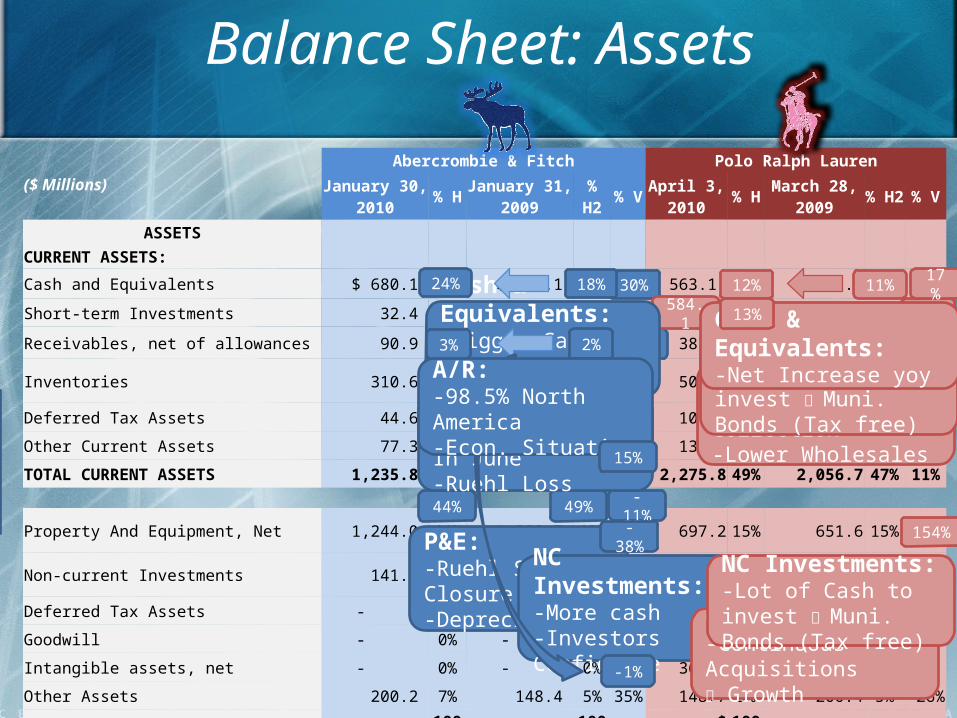
Balance Sheet: Assets
($ Millions)Abercrombie & Fitch Polo Ralph Lauren
January 30, 2010 % H January 31,
2009 % H2 % V April 3, 2010 % H March 28,
2009 % H2 % V
ASSETS CURRENT ASSETS:
Cash and Equivalents $ 680.1 24% $ 522.1 18% 30% $ 563.1 12% $ 481.2 11% 17%
Short-term Investments 32.4 1% - - - 584.1 13% 338.7 8% 72%
Receivables, net of allowances 90.9 3% 53.1 2% 71% 381.9 8% 474.9 11% -20%
Inventories 310.6 11% 372.4 13% -17% 504.0 11% 525.1 12% -4%
Deferred Tax Assets 44.6 2% 43.4 2% 3% 103.0 2% 101.8 2% 1%
Other Current Assets 77.3 3% 80.9 3% -5% 139.7 3% 135.0 3% 3%
TOTAL CURRENT ASSETS 1,235.8 44% 1,072.0 38% 15% 2,275.8 49% 2,056.7 47% 11%
Property And Equipment, Net 1,244.0 44% 1,398.7 49% -11% 697.2 15% 651.6 15% 7%
Non-current Investments 141.8 5% 229.1 8% -38% 75.5 2% 29.7 1% 154%
Deferred Tax Assets - 0% - 0% 0% 101.9 2% 102.8 2% -1%
Goodwill - 0% - 0% 0% 986.6 21% 966.4 22% 2%
Intangible assets, net - 0% - 0% 0% 363.2 8% 348.9 8% 4%
Other Assets 200.2 7% 148.4 5% 35% 148.7 3% 200.4 5% -26%TOTAL ASSETS $ 2,821.9 100% $ 2,848.2 100% -1% $ 4,648.9 100% $ 4,356.5 100% 7%
71% -20%
ANF Inv. Value decreased by anticipation of future prices decline necessary to sell it + loss of Ruehl items that weren’t sold (p43)
-17%
30%
72%
154%
-11%49%44%
P&E:-Ruehl Stores Closure-Depreciation
-38%
NC Investments:-More cash-Investors ConfidenceGoodwill:
-Continuous Acquisitions Growth
22%21%NC Investments:-Lot of Cash to invest
Muni. Bonds (Tax free)
A/R:-Increased Cash Collection-Lower Wholesales
ST Investments:-Lot of Cash to invest
Muni. Bonds (Tax free)
584.1
17%
Cash & Equivalents:-Net Increase yoy
12% 11%
Inventories:-Lowered Prices In June-Ruehl Loss
Cash & Equivalents:-Bigger Cash Position Comfort Investors
2%3%
-1%
A/R:-98.5% North America-Econ. Situation
18%24%
13%
15%
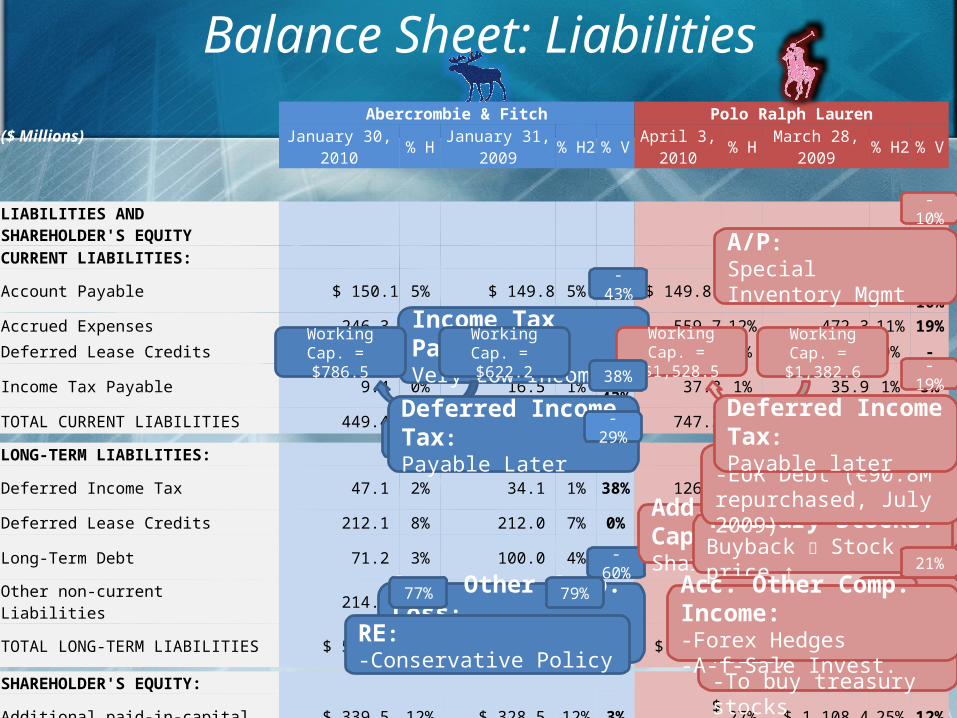
Balance Sheet: Liabilities($ Millions) Abercrombie & Fitch Polo Ralph Lauren
January 30, 2010 % H January 31, 2009 % H2 % V April 3, 2010 % H March 28, 2009 % H2 % V
LIABILITIES AND SHAREHOLDER'S EQUITYCURRENT LIABILITIES: Account Payable $ 150.1 5% $ 149.8 5% 0% $ 149.8 3% $ 165.9 4% -10%
Accrued Expenses 246.3 9% 241.2 8% 2% 559.7 12% 472.3 11% 19%
Deferred Lease Credits 43.6 2% 42.4 1% 3% 0.0 0% 0.0 0% -
Income Tax Payable 9.4 0% 16.5 1% -43% 37.8 1% 35.9 1% 5%
TOTAL CURRENT LIABILITIES 449.4 16% 449.8 16% 0% 747.3 16% 674.1 15% 11%
LONG-TERM LIABILITIES: Deferred Income Tax 47.1 2% 34.1 1% 38% 126.0 3% 154.8 4% -19%
Deferred Lease Credits 212.1 8% 212.0 7% 0% 0.0 0% 0.0 0% -
Long-Term Debt 71.2 3% 100.0 4% -29% 282.1 6% 406.4 9% -31%
Other non-current Liabilities 214.2 8% 206.7 7% 4% 376.9 8% 386.1 9% -2%
TOTAL LONG-TERM LIABILITIES $ 544.6 19% $ 552.8 19% -1% $ 785.0 17% $ 947.3 22% -17%
SHAREHOLDER'S EQUITY: Additional paid-in-capital $ 339.5 12% $ 328.5 12% 3% $ 1,243.8 27% $ 1,108.4 25% 12%Accumulated Other Comprehensive Loss, Income -9.0 0% -22.7 -1% -60% 154.0 3% 126.8 3% 21%
Retained Earnings 2,183.7 77% 2,244.9 79% -3% 2,915.3 63% 2,465.5 57% 18%Common Stocks 1.0 0% 1.0 0% 0% 1.2 0% 1.1 0% 9%Treasury Stocks -687.3 -24% -706.2 -25% -3% -1,197.7 -26% -966.7 -22% 24%
TOTAL SHAREHOLDERS’ EQUITY 1,827.9 65% 1,845.6 65% -1% 3,116.6 67% 2,735.1 63% 14%TOTAL LIABILITIES AND SHAREHOLDERS’ EQUITY $ 2,821.9 100% $ 2,848.2 100% -1% $ 4,648.9 100% $ 4,356.5 100% 7%
Income Tax Payable:Very Low Income
-43%
-10%
-19%
-31%
12%
-60%
24%
Working Cap. = $786.5
Working Cap. = $1,528.5
Working Cap. = $622.2
Working Cap. = $1,382.6
+26.4% +10.6%
A/P:Special Inventory Mgmt
38%
Deferred Income Tax:Payable Later
Acc. Other Comp. Loss:-Derivatives-Forex
Add. Paid In Capital:Share Price Growth
Treasury Stocks:Buyback Stock price ↑
18%57%63%
RE:-Conservative Policy-To buy treasury stocks
LT Debt:-EUR Debt (€90.8M repurchased, July 2009)
79%77%
RE:-Conservative Policy
21%
Acc. Other Comp. Income:-Forex Hedges-A-f-Sale Invest.
Deferred Income Tax:Payable later
-29%
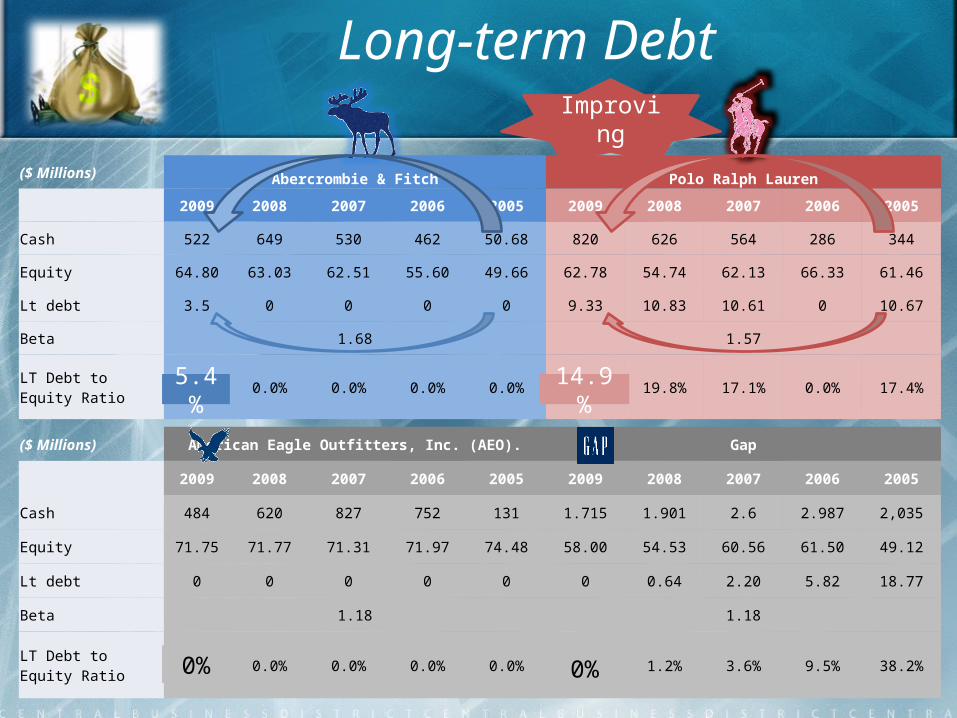
Long-term Debt
($ Millions) Abercrombie & Fitch Polo Ralph Lauren
2009 2008 2007 2006 2005 2009 2008 2007 2006 2005
Cash 522 649 530 462 50.68 820 626 564 286 344
Equity 64.80 63.03 62.51 55.60 49.66 62.78 54.74 62.13 66.33 61.46
Lt debt 3.5 0 0 0 0 9.33 10.83 10.61 0 10.67
Beta 1.68 1.57
LT Debt to Equity Ratio 5.4% 0.0% 0.0% 0.0% 0.0% 14.9% 19.8% 17.1% 0.0% 17.4%
($ Millions) American Eagle Outfitters, Inc. (AEO). Gap
2009 2008 2007 2006 2005 2009 2008 2007 2006 2005
Cash 484 620 827 752 131 1.715 1.901 2.6 2.987 2,035
Equity 71.75 71.77 71.31 71.97 74.48 58.00 54.53 60.56 61.50 49.12
Lt debt 0 0 0 0 0 0 0.64 2.20 5.82 18.77
Beta 1.18 1.18
LT Debt to Equity Ratio 0.0% 0.0% 0.0% 0.0% 0.0% 0.0% 1.2% 3.6% 9.5% 38.2%
14.9%5.4%
0%0%
Improving
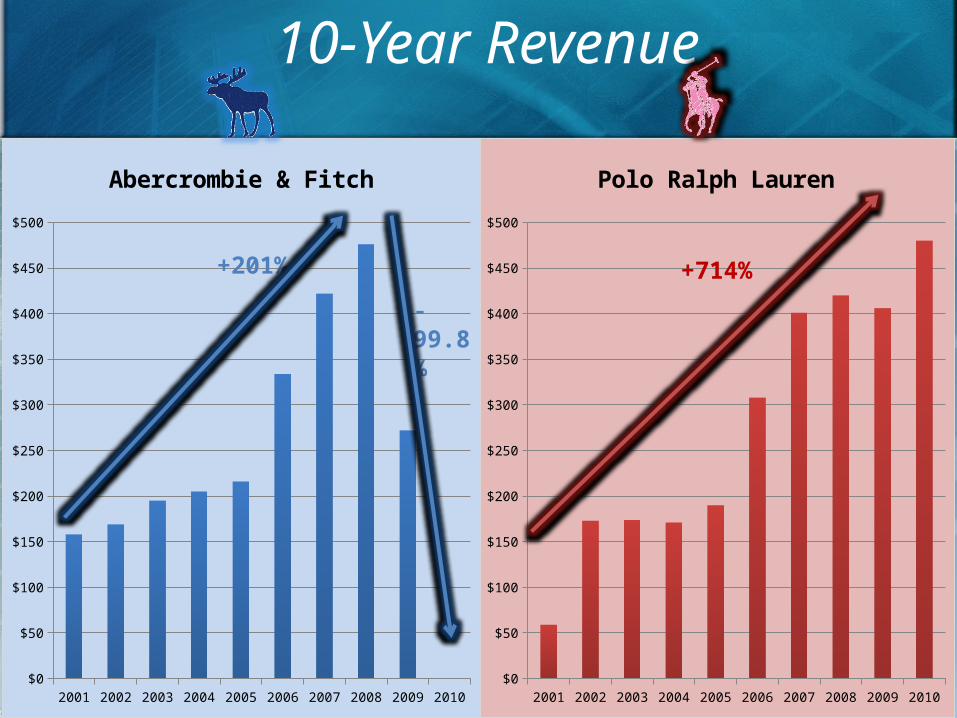
2001 2002 2003 2004 2005 2006 2007 2008 2009 2010$0
$50
$100
$150
$200
$250
$300
$350
$400
$450
$500
Polo Ralph Lauren
2001 2002 2003 2004 2005 2006 2007 2008 2009 2010$0
$50
$100
$150
$200
$250
$300
$350
$400
$450
$500
Abercrombie & Fitch
10-Year Revenue
+201%
-99.8%
+714%
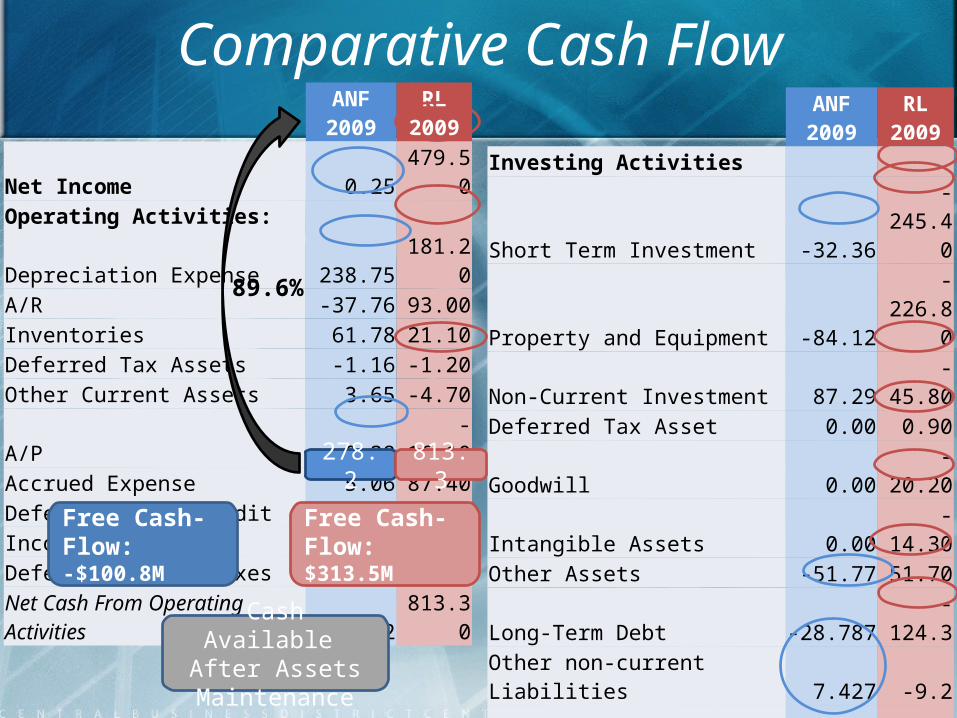
Comparative Cash FlowANF 2009 RL 2009
Net Income 0.25 479.50Operating Activities:Depreciation Expense 238.75 181.20A/R -37.76 93.00Inventories 61.78 21.10Deferred Tax Assets -1.16 -1.20Other Current Assets 3.65 -4.70A/P 0.38 -16.10Accrued Expense 5.06 87.40Deferred Lease Credit 1.31 0.00Income Tax Payable -7.10 1.90Deferred Income Taxes 13.1 -28.8
Net Cash From Operating Activities 278.22 813.30
ANF 2009 RL 2009Investing ActivitiesShort Term Investment -32.36 -245.40Property and Equipment -84.12 -226.80Non-Current Investment 87.29 -45.80Deferred Tax Asset 0.00 0.90Goodwill 0.00 -20.20Intangible Assets 0.00 -14.30Other Assets -51.77 51.70Long-Term Debt -28.787 -124.3Other non-current Liabilities 7.427 -9.2Net Cash From Investing Activities -102.32 -633.40
Financing ActivitiesAdditional Paid-in Capital 10.97 135.40Accumulated Other Compr. Gain 13.71 27.20Common Stocks 0.00 0.10Treasury Stocks 18.91 -231.00Dividends -61.50 -29.70Net Cash From Financial Activities -17.92 -98.00
Net increase in Cash 157.99 81.90Cash at Beginning 522.12 481.20Cash at End 680.11 563.10
278.2 813.3
Free Cash-Flow:-$100.8M
Free Cash-Flow:$313.5M
89.6%
Cash Available After Assets Maintenance
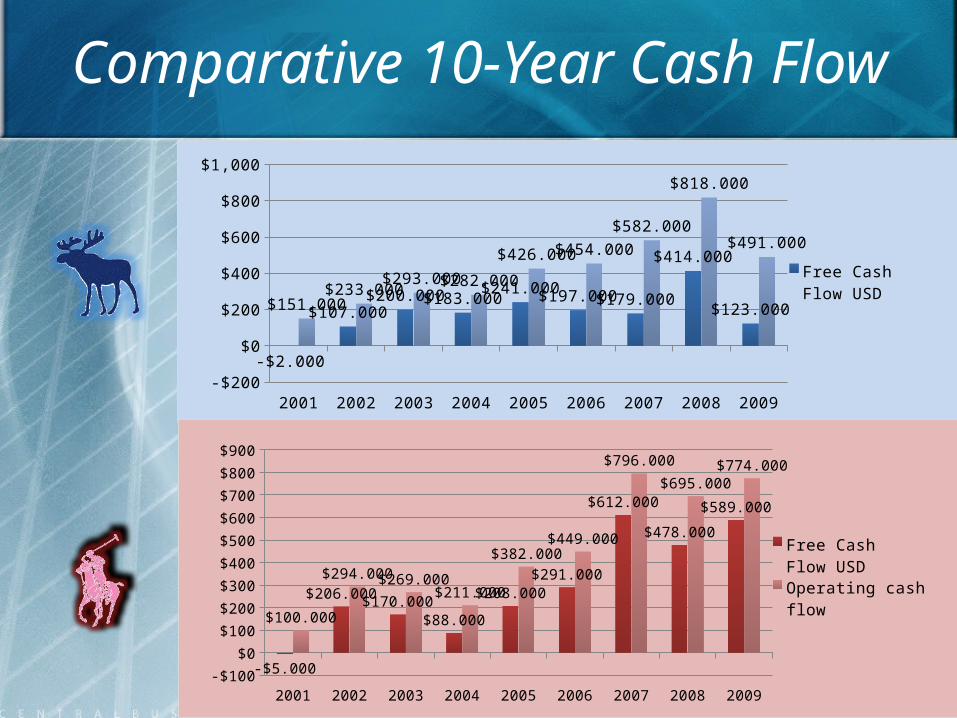
Comparative 10-Year Cash Flow
2001 2002 2003 2004 2005 2006 2007 2008 2009-$100
$0$100$200$300$400$500$600$700$800$900
-$2.000
$107.000$200.000$183.000
$241.000$197.000$179.000
$414.000
$123.000$151.000$233.000
$293.000$282.000
$426.000$454.000
$582.000
$818.000
$491.000
Free Cash Flow USD Operating cash flow
2001 2002 2003 2004 2005 2006 2007 2008 2009-$100
$0
$100
$200
$300
$400
$500
$600
$700
$800
$900
-$5.000
$206.000$170.000$88.000
$208.000$291.000
$612.000
$478.000
$589.000
$100.000
$294.000$269.000$211.000
$382.000$449.000
$796.000
$695.000$774.000
Free Cash Flow USD
Operating cash flow
DOL-29.54
DFL0.02
DTL-0.59
DOL4.67
DFL1.31
DTL6.09
DOL / DFL / DTL
-29.54
0.02
4.67
6.09 -0.59
1.31
20082009
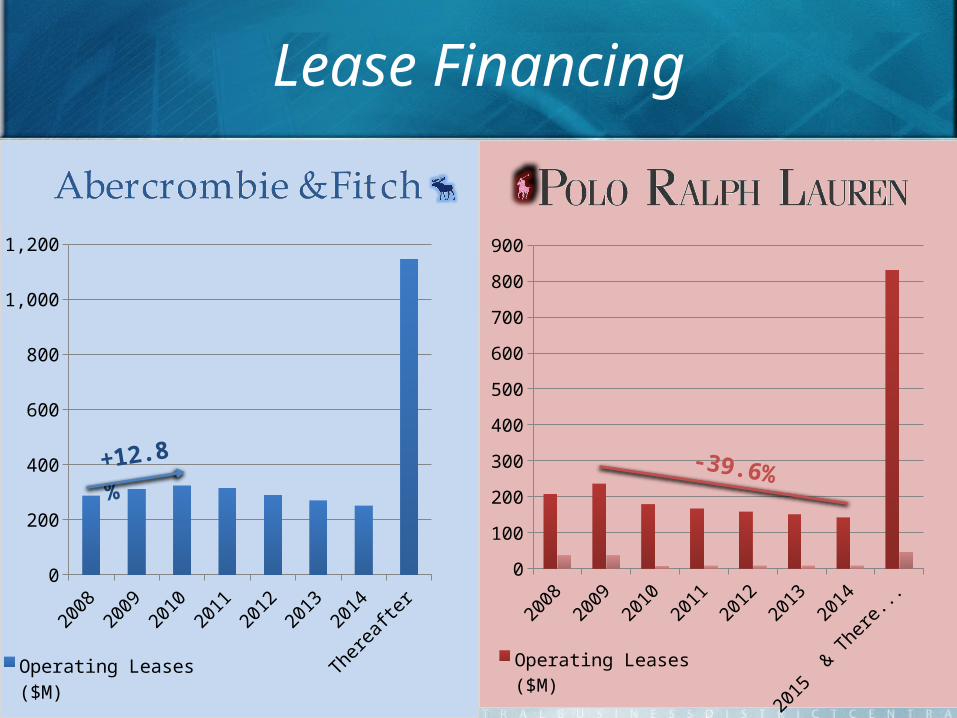
20102011
20122013
2014
2015 & Thereafter
0
100
200
300
400
500
600
700
800
900
Operating Leases ($M)Capital Leases ($M)
-39.6%
20082009
20102011
20122013
2014
Thereafter0
200
400
600
800
1,000
1,200
Operating Leases ($M)
+12.8%
Lease Financing
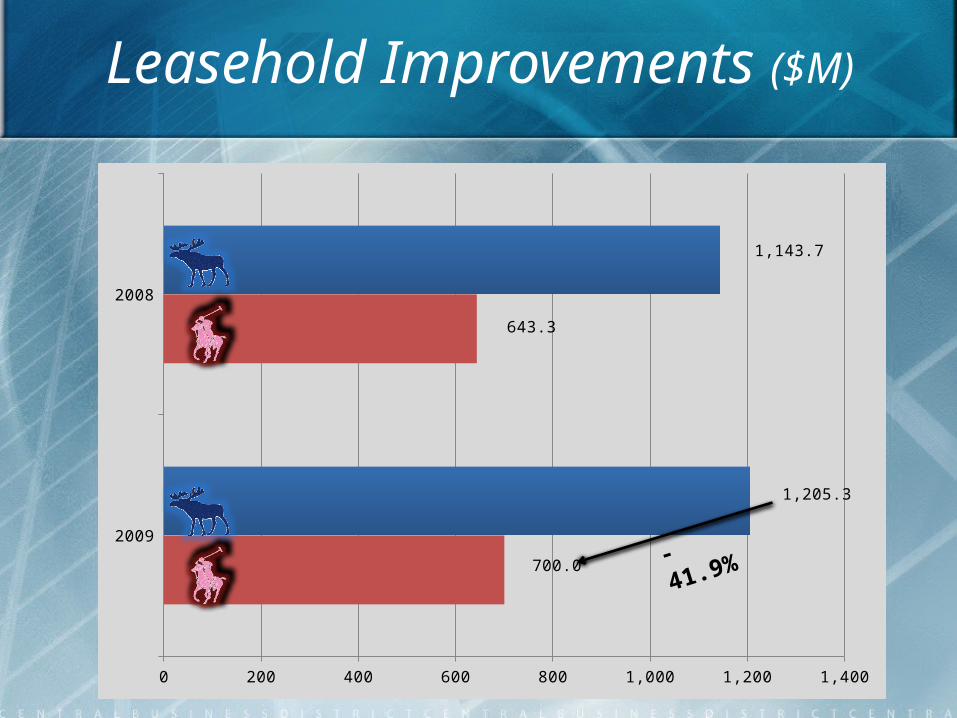
Leasehold Improvements ($M)
2009
2008
0 200 400 600 800 1,000 1,200 1,400
700.0
643.3
1,205.3
1,143.7
-41.9%
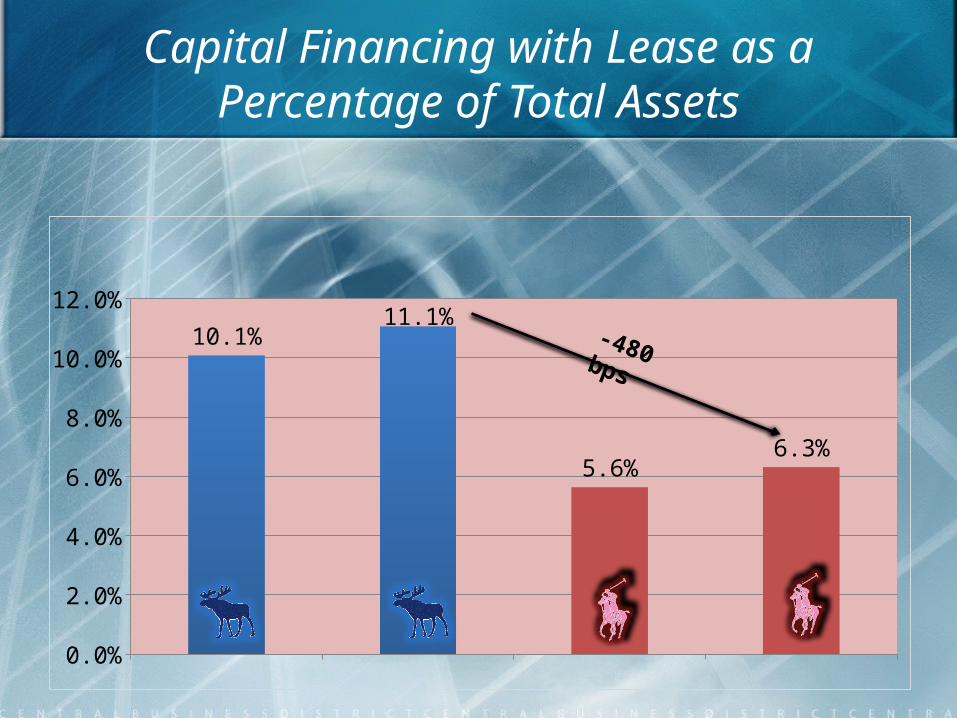
Capital Financing with Lease as a Percentage of Total Assets
2008 2009 2008 20090.0%
2.0%
4.0%
6.0%
8.0%
10.0%
12.0%
10.1%11.1%
5.6%6.3%
-480 bps
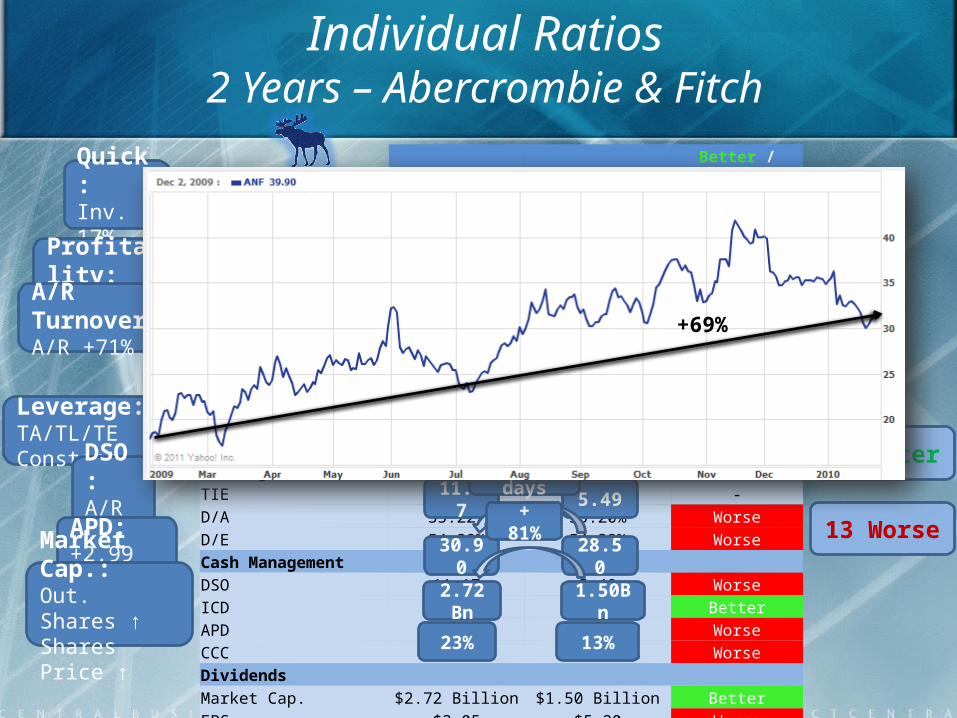
Individual Ratios2 Years – Abercrombie & Fitch
2009 2008 Better / WorseLiquidityCurrent 2.75 2.38 BetterQuick 2.06 1.56 BetterProfitabilityROA 0.01% 9.56% WorseROE 0.01% 14.75% WorseROS 0.01% 7.81% WorseTurnoverReceivables Turnover 32.23 65.60 WorseAsset Turnover 1.04 1.22 WorseInventory Turnover 9.43 9.36 BetterLeverageTIE 0.00 0.00 -D/A 35.22% 35.20% WorseD/E 54.38% 54.32% WorseCash ManagementDSO 11.17 5.49 WorseICD 38.19 38.48 BetterAPD 18.46 15.47 WorseCCC 30.90 28.50 WorseDividendsMarket Cap. $2.72 Billion $1.50 Billion BetterEPS $3.05 $5.20 WorsePayout Ratio 23% 13% BetterProductivitySales/Employee $36,608 $43,551 WorseNi/Employee $3 $3,403 Worse
6 Better
13 Worse
Quick:Inv. -17%
Profitability:NI ≈ 0
A/R Turnover:A/R +71% 32.23 65.60
-51%
Leverage:TA/TL/TE Constant
DSO:A/R ↑ 11.17 5.49
+5.68 days
APD:+2.99 days 30.90 28.50
+2.49 days
Market Cap.:Out. Shares ↑Shares Price ↑
2.72Bn 1.50Bn
+ 81%
23% 13%
+69%
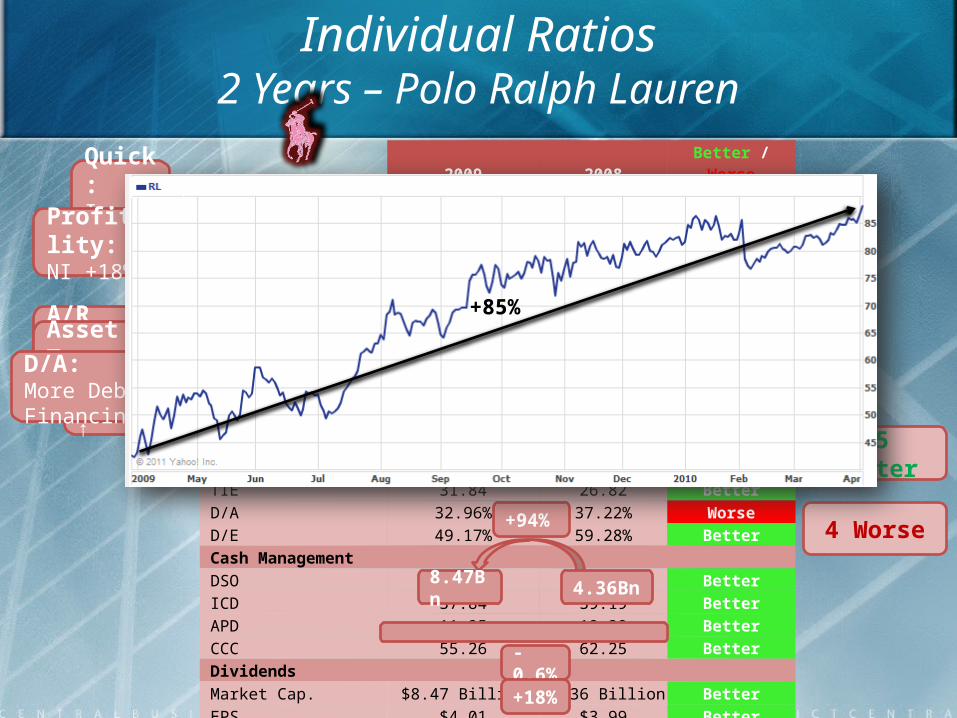
Individual Ratios2 Years – Polo Ralph Lauren
2009 2008 Better / Worse Liquidity Current 3.05 3.05 No Change Quick 2.37 2.27 Better Profitability ROA 10.31% 9.32% Better ROE 15.39% 14.84% Better ROS 10.00% 8.42% Better Turnover Receivables Turnover 12.56 10.16 Better Asset Turnover 2.11 2.35 Worse Inventory 9.51 9.19 Better Leverage TIE 31.84 26.82 Better D/A 32.96% 37.22% Worse D/E 49.17% 59.28% Better Cash Management DSO 28.67 35.44 Better ICD 37.84 39.19 Better APD 11.25 12.38 Better CCC 55.26 62.25 Better Dividends Market Cap. $8.47 Billion $4.36 Billion Better EPS $4.01 $3.99 Better Payout Ratio 17% 18% Worse Productivity Sales/Employee (M) $ 252,395 $ 253,879 Worse Ni/Employee (M) $ 25,237 $ 21,368 Better
15 Better
4 Worse
Quick:Inv. -4%
Profitability:NI +18%
+11%+4%+19%
A/R Turn.:A/R -20%
+24%
12.56 10.16Asset Turn.:CA↑ STI
-10.2%
2.11 2.35
TIE:EBIT ↑
+19%
31.84 26.82
+11%
31.84 26.82
-17%
49.17 59.28
D/A:More Debt Financing
+94%
8.47Bn 4.36Bn
+85%
-0.6%
+18%
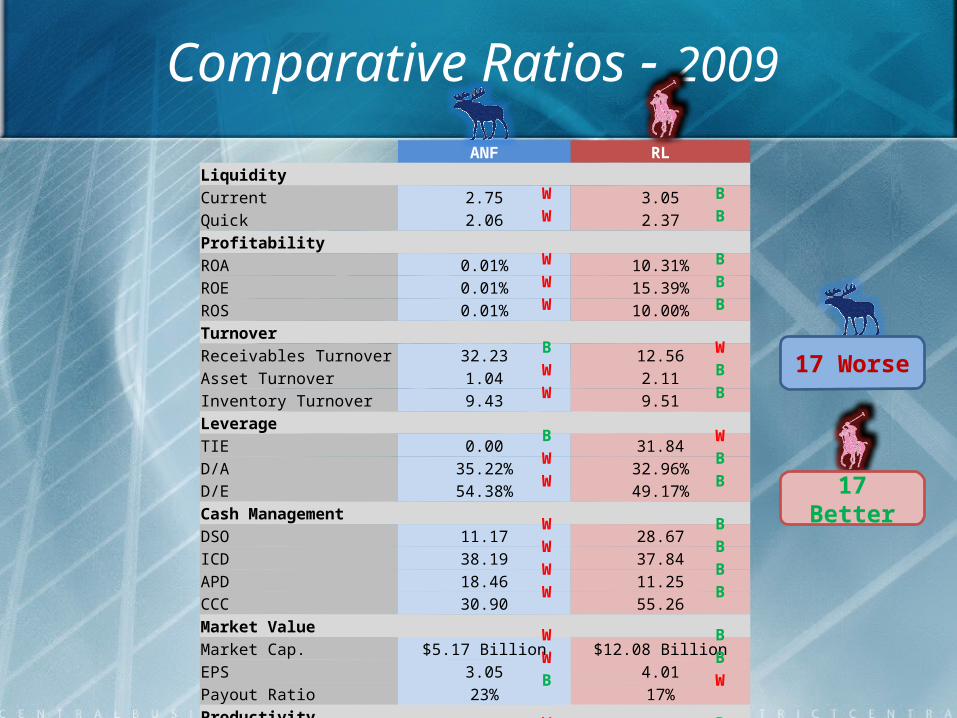
Comparative Ratios - 2009
ANF RLLiquidityCurrent 2.75 3.05Quick 2.06 2.37ProfitabilityROA 0.01% 10.31%ROE 0.01% 15.39%ROS 0.01% 10.00%TurnoverReceivables Turnover 32.23 12.56Asset Turnover 1.04 2.11Inventory Turnover 9.43 9.51LeverageTIE 0.00 31.84D/A 35.22% 32.96%D/E 54.38% 49.17%Cash ManagementDSO 11.17 28.67ICD 38.19 37.84APD 18.46 11.25CCC 30.90 55.26Market ValueMarket Cap. $5.17 Billion $12.08 BillionEPS 3.05 4.01Payout Ratio 23% 17%ProductivitySales/Employee $ 154,138 $ 252,395 Ni/Employee $ 13 $ 25,237
W BW B
W BW BW B
B WW BW B
B WW BW B
W BW BW BW B
W BW BB W
W BW B
17 Worse
17 Better
Reuters RatioAbercrombie
& Fitch % Difference Sector % Difference Polo Ralph Lauren
% Difference ANF/RL
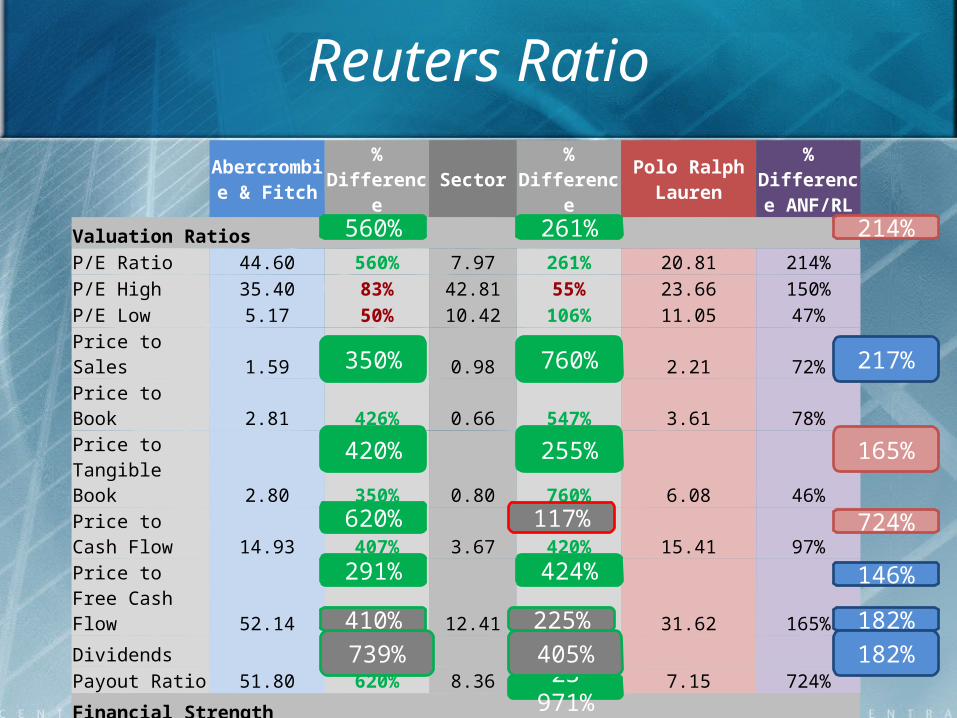
Valuation RatiosP/E Ratio 44.60 560% 7.97 261% 20.81 214%P/E High 35.40 83% 42.81 55% 23.66 150%P/E Low 5.17 50% 10.42 106% 11.05 47%Price to Sales 1.59 162% 0.98 226% 2.21 72%Price to Book 2.81 426% 0.66 547% 3.61 78%Price to Tangible Book 2.80 350% 0.80 760% 6.08 46%Price to Cash Flow 14.93 407% 3.67 420% 15.41 97%Price to Free Cash Flow 52.14 420% 12.41 255% 31.62 165%
DividendsPayout Ratio 51.80 620% 8.36 86% 7.15 724%
Financial StrengthQuick Ratio 1.57 291% 0.54 424% 2.29 69%Current Ratio 2.51 369% 0.68 466% 3.17 79%LT Debt to Equity 4.42 24% 18.15 44% 8.06 55%Total Debt to Equity 4.42 14% 32.68 25% 8.06 55%Interest Coverage N/A - 0.17 23 971% 40.75 N/A
214%
217%
182%
724%
165%
146%
182%23 971%
739% 405%410% 225%
420%
760%350%
560% 261%
255%
291% 424%
620% 117%
Reuters Ratio (Cont’d)Abercrombie &
Fitch%
Difference Sector % Difference Polo Ralph Lauren
% Difference
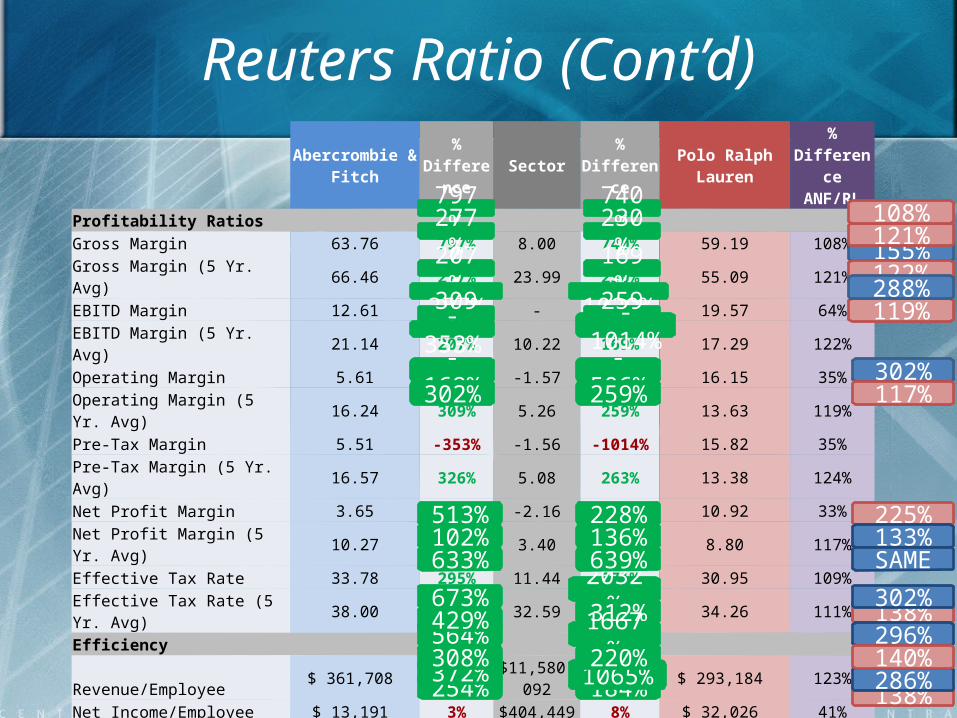
ANF/RLProfitability RatiosGross Margin 63.76 797% 8.00 740% 59.19 108%Gross Margin (5 Yr. Avg) 66.46 277% 23.99 230% 55.09 121%EBITD Margin 12.61 - - - 19.57 64%EBITD Margin (5 Yr. Avg) 21.14 207% 10.22 169% 17.29 122%Operating Margin 5.61 -357% -1.57 -1029% 16.15 35%Operating Margin (5 Yr. Avg) 16.24 309% 5.26 259% 13.63 119%Pre-Tax Margin 5.51 -353% -1.56 -1014% 15.82 35%Pre-Tax Margin (5 Yr. Avg) 16.57 326% 5.08 263% 13.38 124%Net Profit Margin 3.65 -169% -2.16 -506% 10.92 33%Net Profit Margin (5 Yr. Avg) 10.27 302% 3.40 259% 8.80 117%Effective Tax Rate 33.78 295% 11.44 271% 30.95 109%Effective Tax Rate (5 Yr. Avg) 38.00 117% 32.59 105% 34.26 111%EfficiencyRevenue/Employee $ 361,708 3% $11,580,092 3% $ 293,184 123%Net Income/Employee $ 13,191 3% $404,449 8% $ 32,026 41%Receivable Turnover 41.67 513% 8.13 228% 18.54 225%Inventory Turnover 2.75 102% 2.69 136% 3.66 75%Asset Turnover 1.14 633% 0.18 639% 1.15 99%Management EffectivenessReturn on Assets 4.17 673% 0.62 2032% 12.60 33%Return on Assets (5 Yr. Avg) 14.40 429% 3.36 312% 10.47 138%Return on Investment 5.08 564% 0.90 1667% 15.00 34%Return on Investment (5 Yr. Avg) 18.24 308% 5.92 220% 13.02 140%Return on Equity 6.55 372% 1.76 1065% 18.75 35%Return on Equity (5 Yr. Avg) 23.39 254% 9.20 184% 16.92 138%
155%121%
122%
119%288%
108%
302%
225%
117%
133%SAME
138%
138%
296%
286%
302%
140%
797% 740%
169%207%-357%
230%277%
-1029%309% 259%
-169%
-1014%-353%
-506%302% 259%
2032%312%
184%
639%136%228%
1667%
254%372%308%564%429%673%
633%102%513%
1065%220%
2001 2002 2003 2004 2005 2006 2007 2008 2009 20100%
10%
20%
30%
40%
50%
60%
70%
Polo Ralph Lauren: Gross Margin
2001 2002 2003 2004 2005 2006 2007 2008 2009 20100%
5%
10%
15%
20%
25%
ROA (%)ROE (%)ROS (%)
2001 2002 2003 2004 2005 2006 2007 2008 2009 20100%
5%
10%
15%
20%
25%
30%
35%
40%
45%
50%
ROA (%)ROE (%)ROS (%)
2001 2002 2003 2004 2005 2006 2007 2008 2009 20100%
10%
20%
30%
40%
50%
60%
70%
Abercrombie & Fitch: Gross Margin
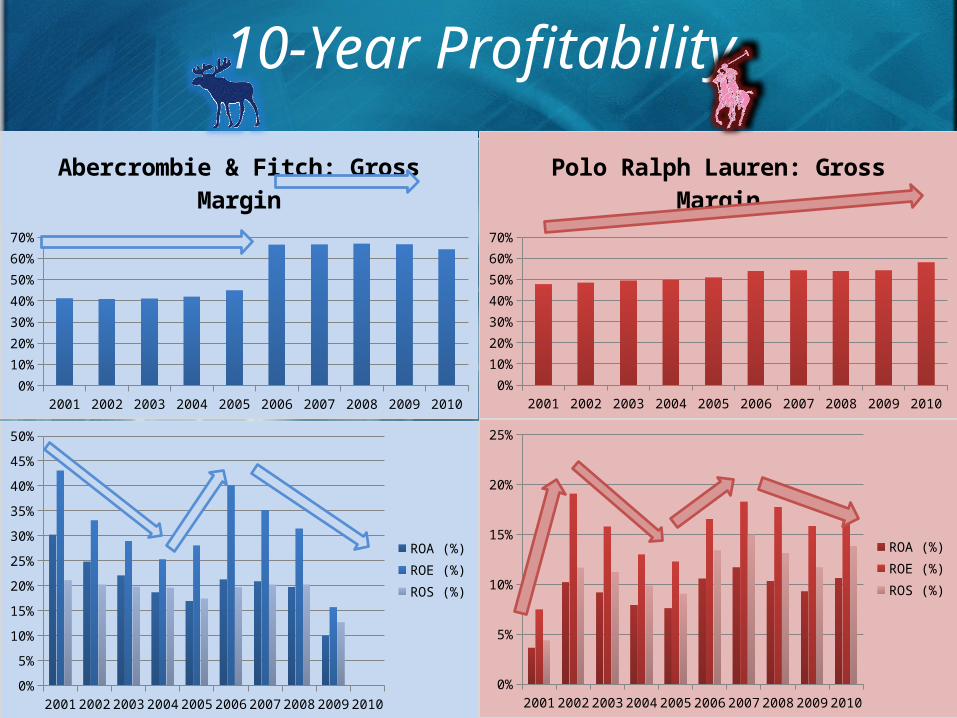
10-Year Profitability
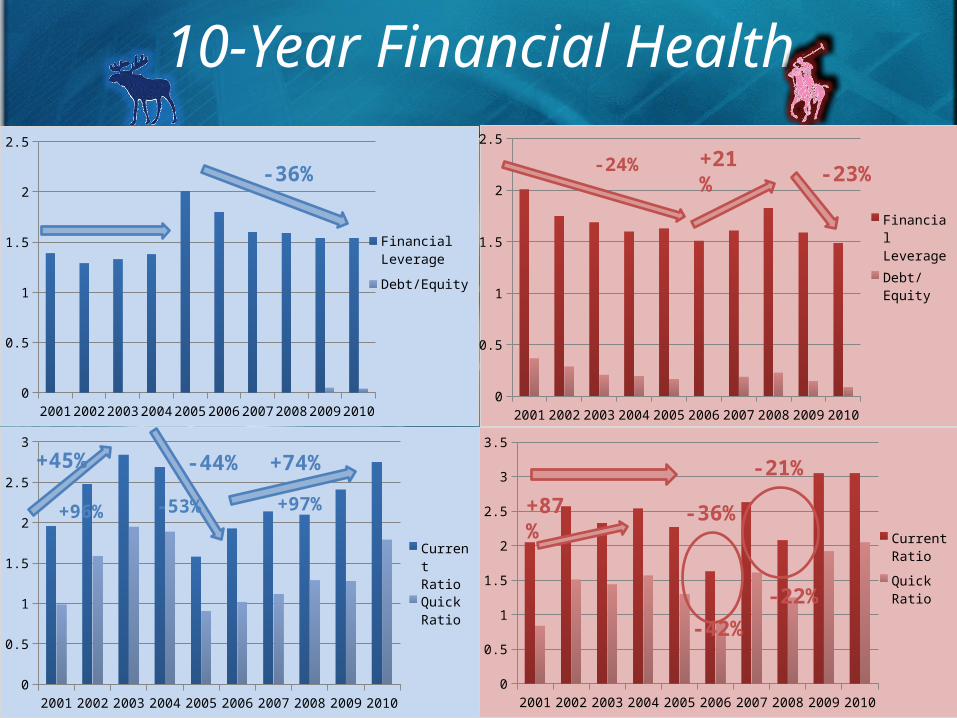
10-Year Financial Health
2001 2002 2003 2004 2005 2006 2007 2008 2009 20100
0.5
1
1.5
2
2.5
3
Current Ratio
Quick Ra-tio
2001 2002 2003 2004 2005 2006 2007 2008 2009 20100
0.5
1
1.5
2
2.5
3
3.5
Current Ratio
Quick Ra-tio
2001 2002 2003 2004 2005 2006 2007 2008 2009 20100
0.5
1
1.5
2
2.5
Financial Leverage
Debt/Equity
2001 2002 2003 2004 2005 2006 2007 2008 2009 20100
0.5
1
1.5
2
2.5
Financial Leverage
Debt/Equity
-36% -23%-24% +21%
-36%
-21%
-42%-22%
+87%
+45% -44% +74%
-53% +97%+96%
2001 2002 2003 2004 2005 2006 2007 2008 2009 20100
20
40
60
80
100
120
140
160
Days Inventory DSO Payable Period CCC
2001 2002 2003 2004 2005 2006 2007 2008 2009 20100
20
40
60
80
100
120
140
Days Inventory DSO Payable Period CCC
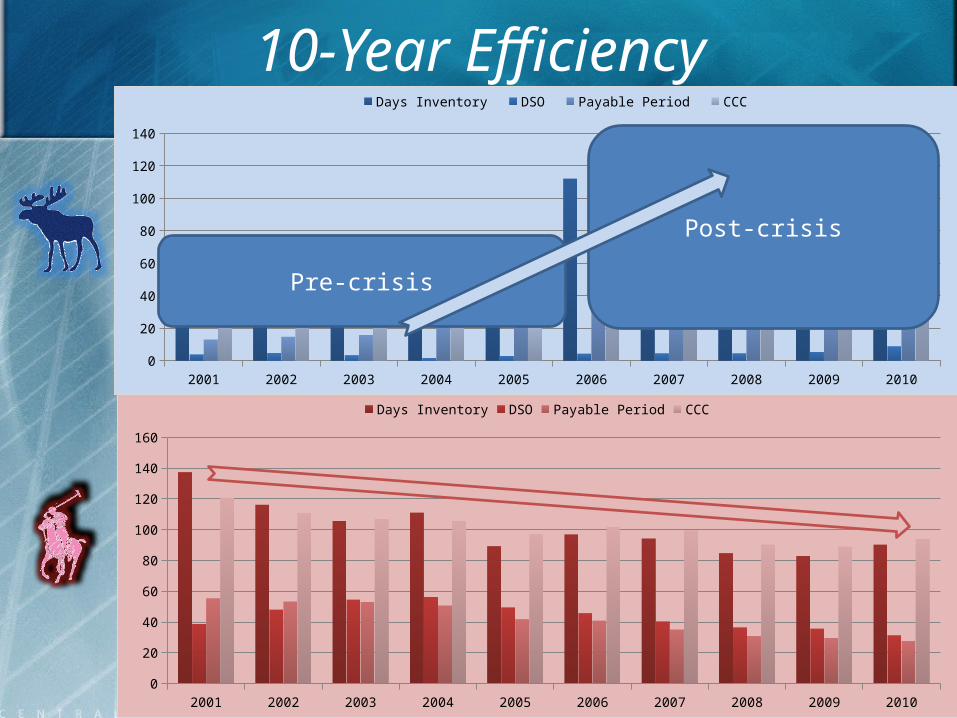
10-Year Efficiency
Pre-crisis
Post-crisis
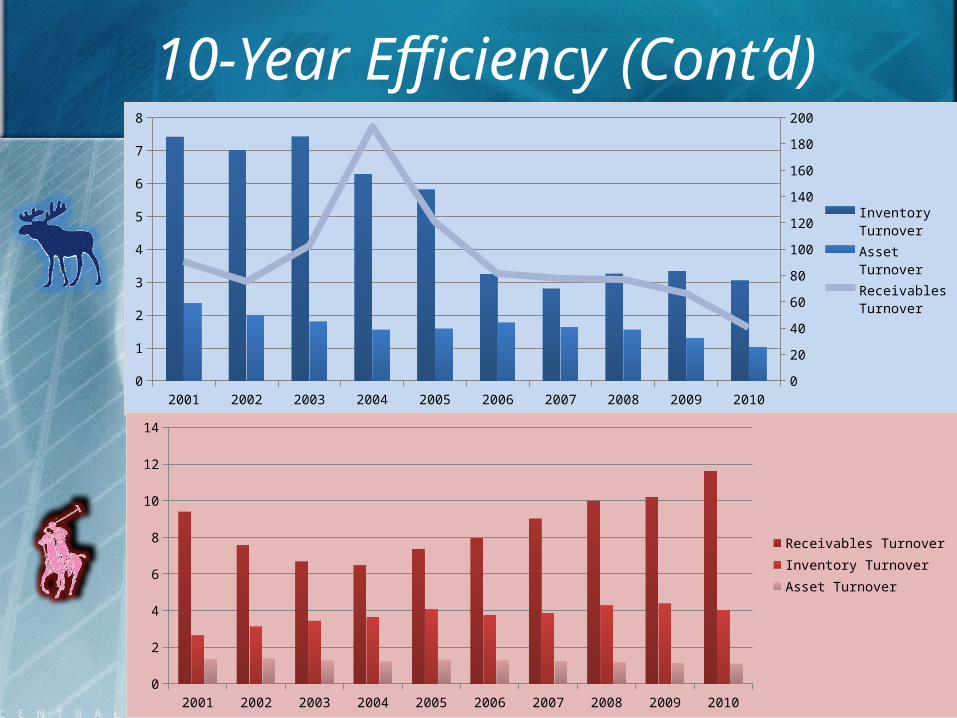
10-Year Efficiency (Cont’d)
2001 2002 2003 2004 2005 2006 2007 2008 2009 20100
1
2
3
4
5
6
7
8
0
20
40
60
80
100
120
140
160
180
200
Inventory Turnover
Asset Turnover
Receivables Turnover
2001 2002 2003 2004 2005 2006 2007 2008 2009 20100
2
4
6
8
10
12
14
Receivables TurnoverInventory TurnoverAsset Turnover
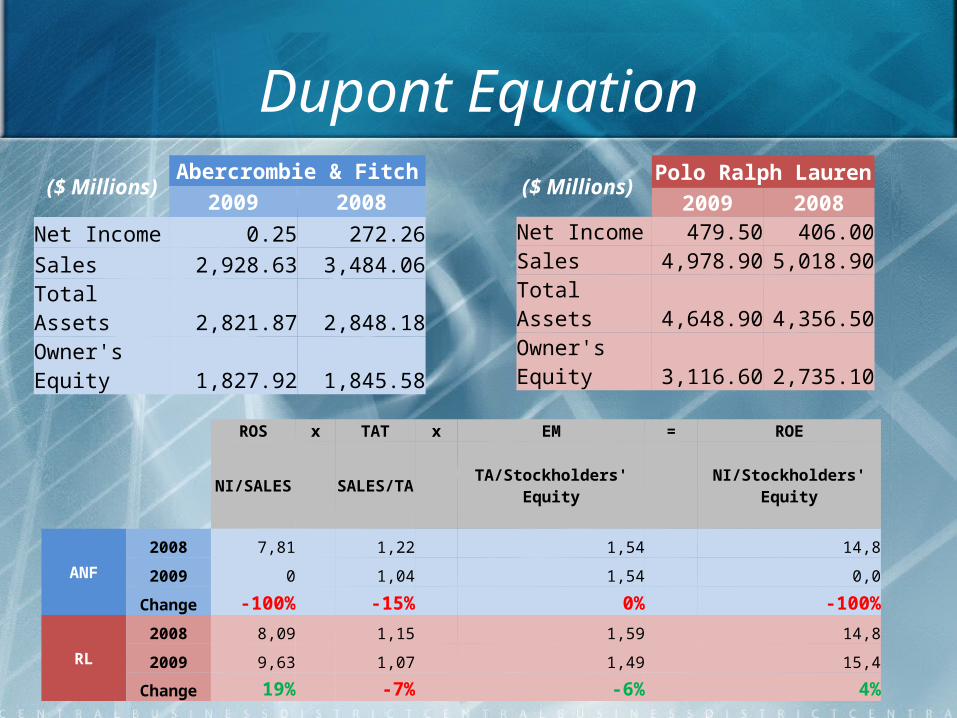
Dupont Equation ($ Millions)
Abercrombie & Fitch2009 2008
Net Income 0.25 272.26Sales 2,928.63 3,484.06Total Assets 2,821.87 2,848.18
Owner's Equity 1,827.92 1,845.58
ROS x TAT x EM = ROE
NI/SALES SALES/TA TA/Stockholders' Equity NI/Stockholders' Equity
ANF
2008 7,81 1,22 1,54 14,8
2009 0 1,04 1,54 0,0
Change -100% -15% 0% -100%
RL
2008 8,09 1,15 1,59 14,8
2009 9,63 1,07 1,49 15,4
Change 19% -7% -6% 4%
($ Millions)Polo Ralph Lauren2009 2008
Net Income 479.50 406.00Sales 4,978.90 5,018.90Total Assets 4,648.90 4,356.50
Owner's Equity 3,116.60 2,735.10
Polo Ralph Lauren
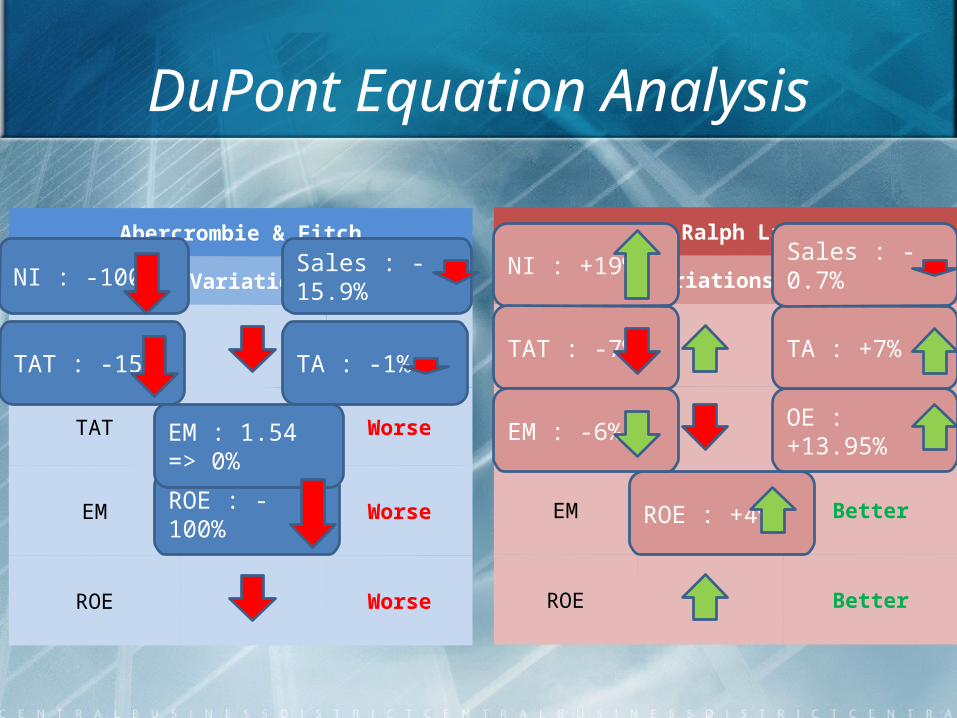
Ratios Variations Status
ROS Better
TAT Worse
EM Better
ROE Better
DuPont Equation Analysis
Abercrombie & Fitch
Ratios Variations Status
ROS Worse
TAT Worse
EM Worse
ROE Worse
NI : -100% Sales : -15.9%
TAT : -15% TA : -1%
ROE : - 100%
EM : 1.54 => 0%
NI : +19%
TAT : -7%
ROE : +4%
OE : +13.95%EM : -6%
TA : +7%
Sales : -0.7%
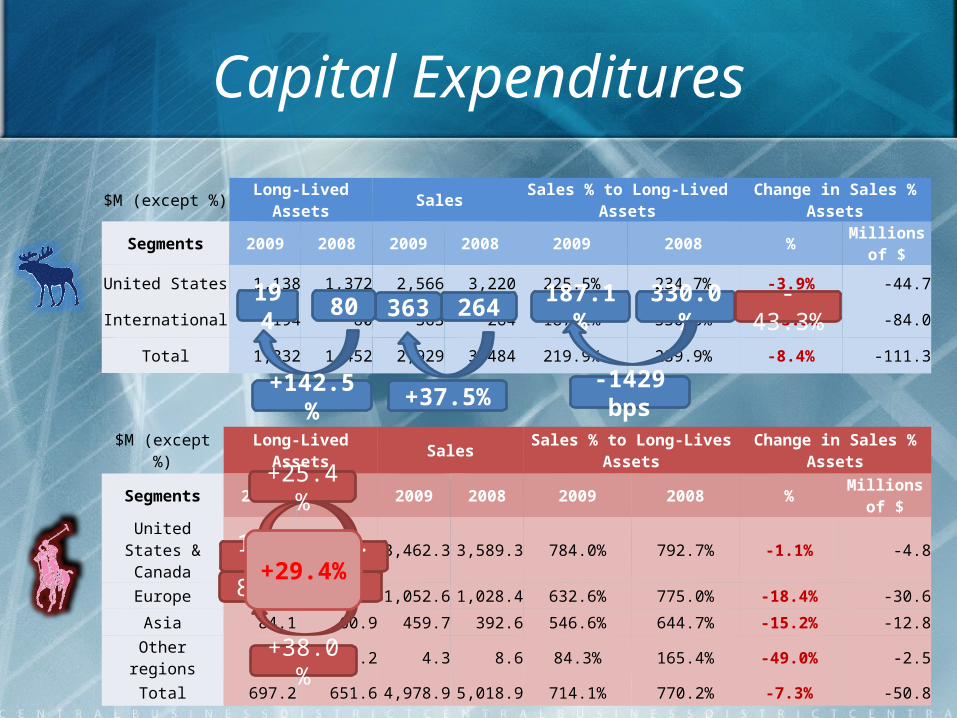
Capital Expenditures
$M (except %) Long-Lived Assets Sales Sales % to Long-Lived Assets Change in Sales % Assets
Segments 2009 2008 2009 2008 2009 2008 % Millions of $
United States 1,138 1,372 2,566 3,220 225.5% 234.7% -3.9% -44.7
International 194 80 363 264 187.1% 330.0% -43.3% -84.0
Total 1,332 1,452 2,929 3,484 219.9% 239.9% -8.4% -111.3
$M (except %) Long-Lived Assets Sales Sales % to Long-Lives Assets Change in Sales % Assets
Segments 2009 2008 2009 2008 2009 2008 % Millions of $
United States & Canada 441.6 452.8 3,462.3 3,589.3 784.0% 792.7% -1.1% -4.8
Europe 166.4 132.7 1,052.6 1,028.4 632.6% 775.0% -18.4% -30.6
Asia 84.1 60.9 459.7 392.6 546.6% 644.7% -15.2% -12.8
Other regions 5.1 5.2 4.3 8.6 84.3% 165.4% -49.0% -2.5
Total 697.2 651.6 4,978.9 5,018.9 714.1% 770.2% -7.3% -50.8
187.1% 330.0%
-1429 bps
-43.3%
+38.0%
60.984.1
26436380194
+37.5%+142.5%
132.7166.4
+25.4%
+29.4%

ONCE UPON A TIME ON THE STOCK MARKET…
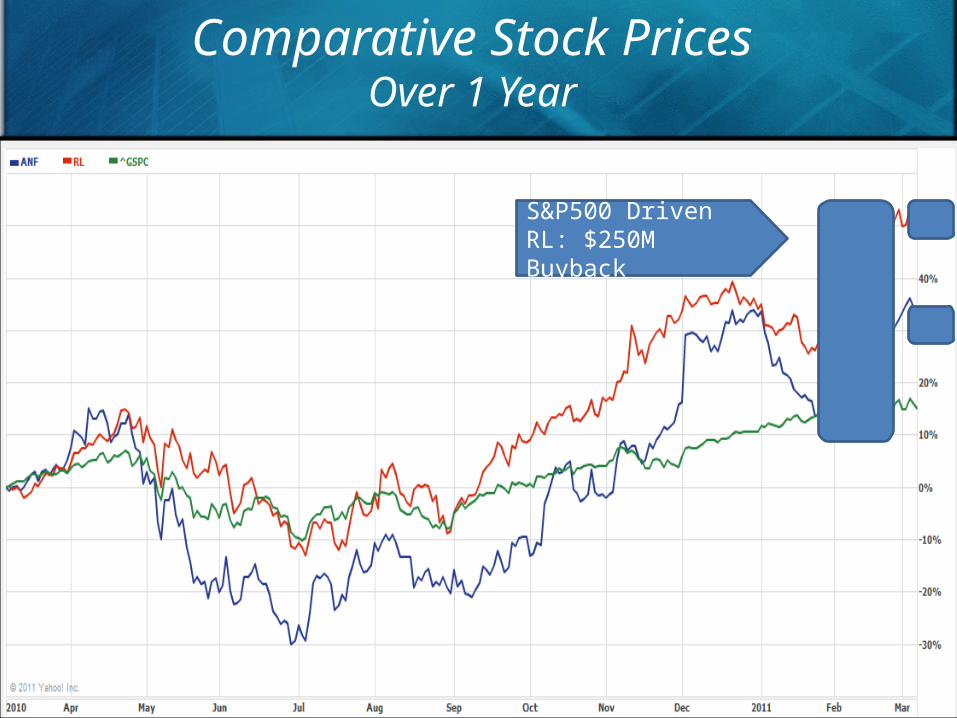
Comparative Stock PricesOver 1 Year
S&P500 DrivenRL: $250M Buyback
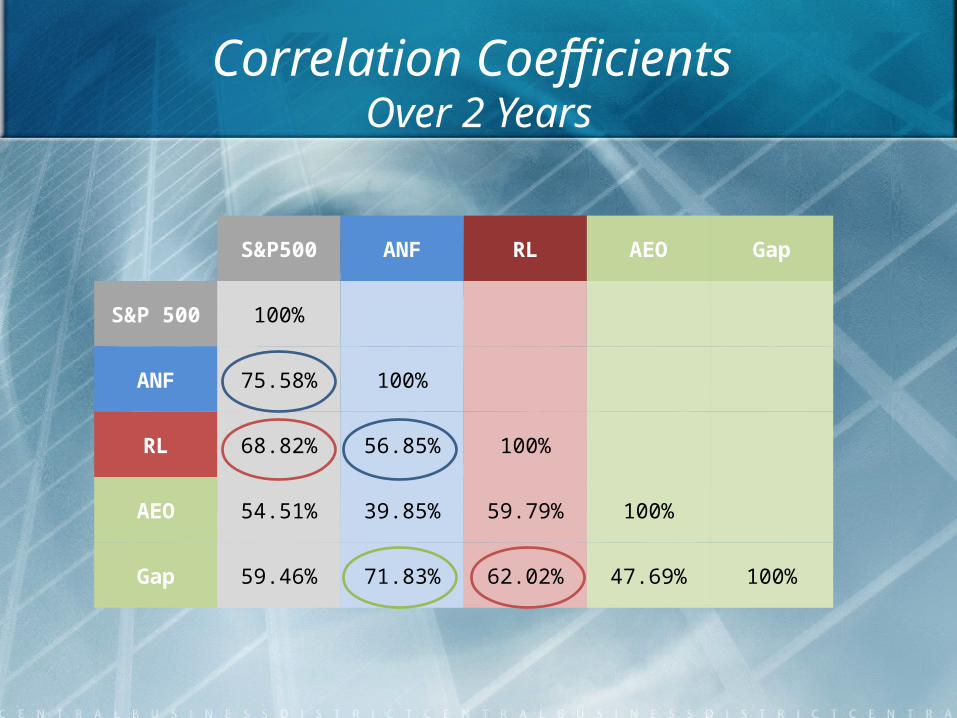
Correlation Coefficients Over 2 Years
S&P500 ANF RL AEO Gap
S&P 500 100%
ANF 75.58% 100%
RL 68.82% 56.85% 100%
AEO 54.51% 39.85% 59.79% 100%
Gap 59.46% 71.83% 62.02% 47.69% 100%
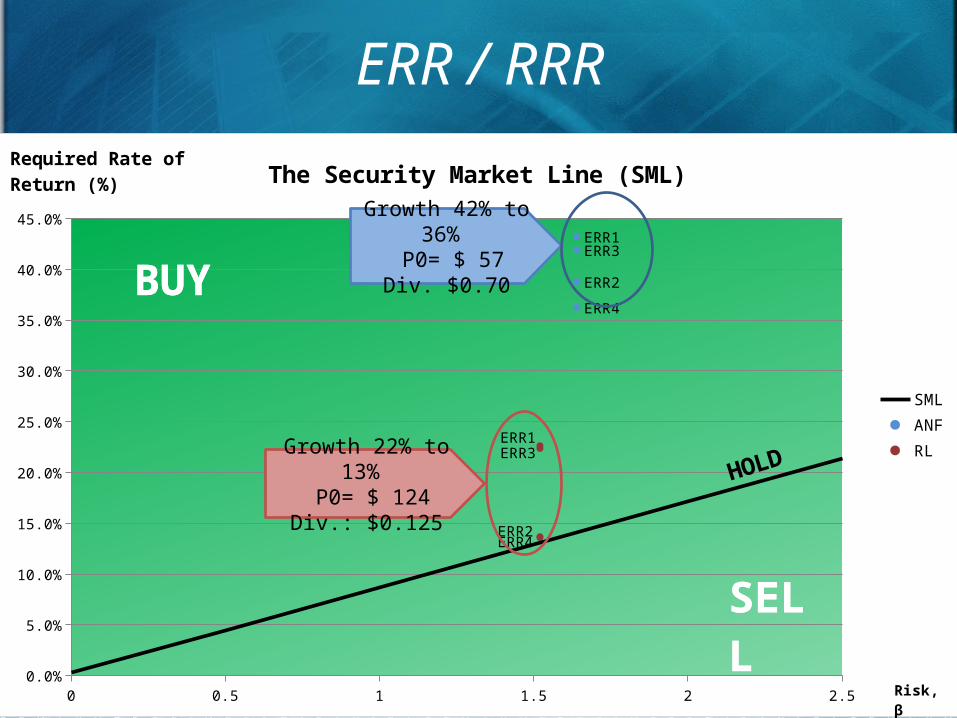
0 0.5 1 1.5 2 2.50.0%
5.0%
10.0%
15.0%
20.0%
25.0%
30.0%
35.0%
40.0%
45.0%
ERR1
ERR2
ERR3
ERR4
ERR1
ERR2
ERR3
ERR4
The Security Market Line (SML)
SMLANFRL
Required Rate of Return (%)
Risk, β
BUY
SELL
BUY
SELL
HOL
D
ERR / RRR
Growth 42% to 36% P0= $ 57Div. $0.70
Growth 22% to 13% P0= $ 124
Div.: $0.125
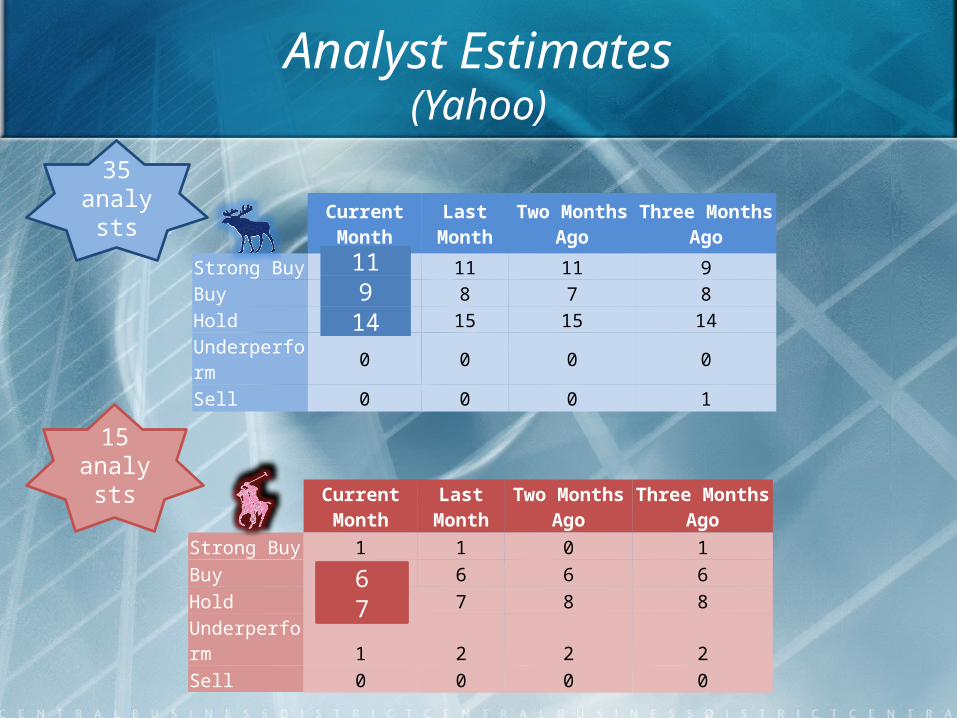
Analyst Estimates(Yahoo)
Current Month
Last Month
Two Months Ago
Three Months Ago
Strong Buy 11 11 11 9Buy 9 8 7 8Hold 14 15 15 14Underperform 0 0 0 0Sell 0 0 0 1
Current Month
Last Month
Two Months Ago
Three Months Ago
Strong Buy 1 1 0 1Buy 6 6 6 6Hold 7 7 8 8Underperform 1 2 2 2Sell 0 0 0 0
35 analysts
15 analysts
11
6
914
7
Analyst Estimates (Cont’d)(Morningstar)
ANF Industry RL5 Y Growth 20.3% 15.4 9%Forward P/E 14.3 - 19.0
30-Year T-Bond Yield
S&P500 Dividen Yield
S&P500 Earning Yield
Cash Return
Dividend Yield
Earning Yield
0 2 4 6 8
4.6
2.1
6.2
3.5
1.2
2.3
30-Year T-Bond Yield
S&P500 Dividen Yield
S&P500 Earning Yield
Cash Return
Dividend Yield
Earning Yield
0 2 4 6 8
4.6
2.1
6.2
3.9
0.3
4.9
2.3%
4.9%
20.3%14.3
9%19
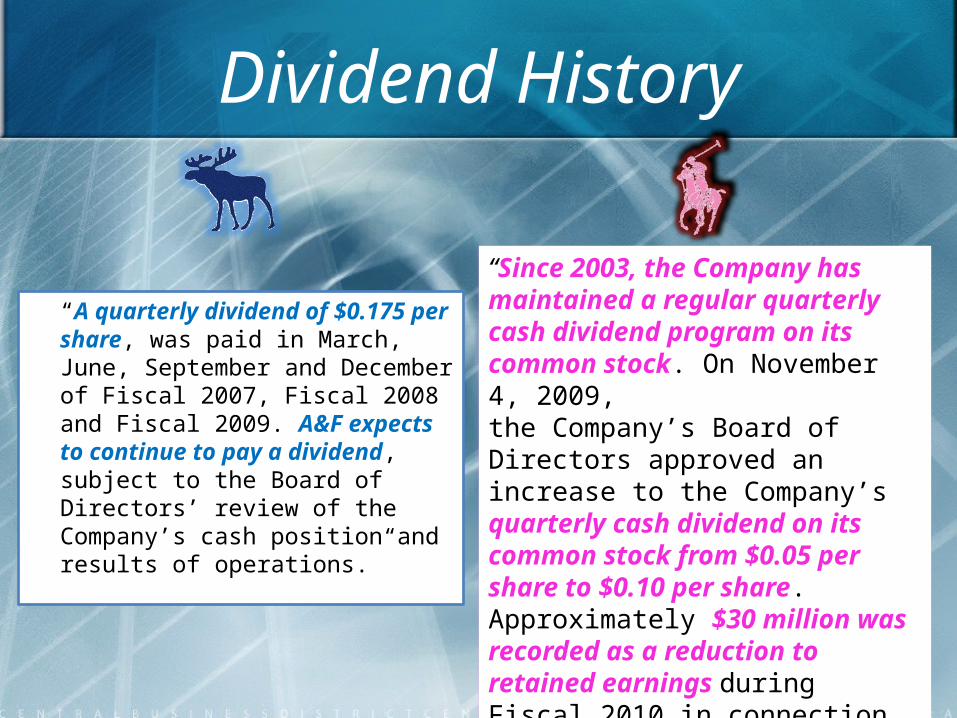
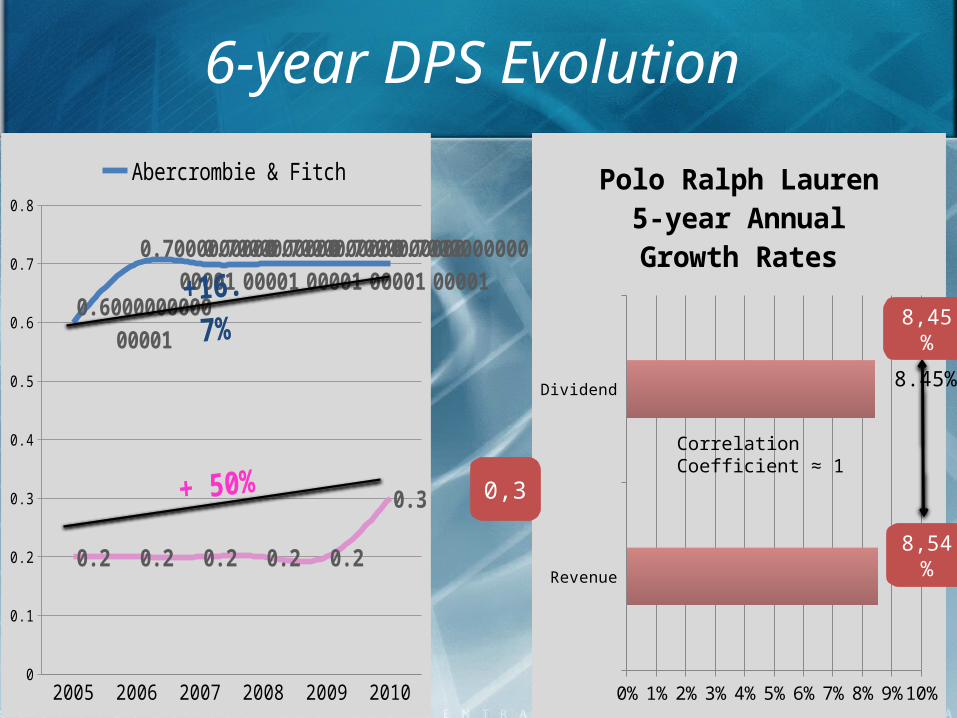
Dividend History
“A quarterly dividend of $0.175 per share, was paid in March, June, September and December of Fiscal 2007, Fiscal 2008 and Fiscal 2009. A&F expects to continue to pay a dividend, subject to the Board of Directors’ review of the Company’s cash position and results of operations.”
“Since 2003, the Company has maintained a regular quarterly cash dividend program on its common stock. On November 4, 2009,the Company’s Board of Directors approved an increase to the Company’s quarterly cash dividend on its common stock from $0.05 pershare to $0.10 per share. Approximately $30 million was recorded as a reduction to retained earnings during Fiscal 2010 in connectionwith the Company’s dividends.”
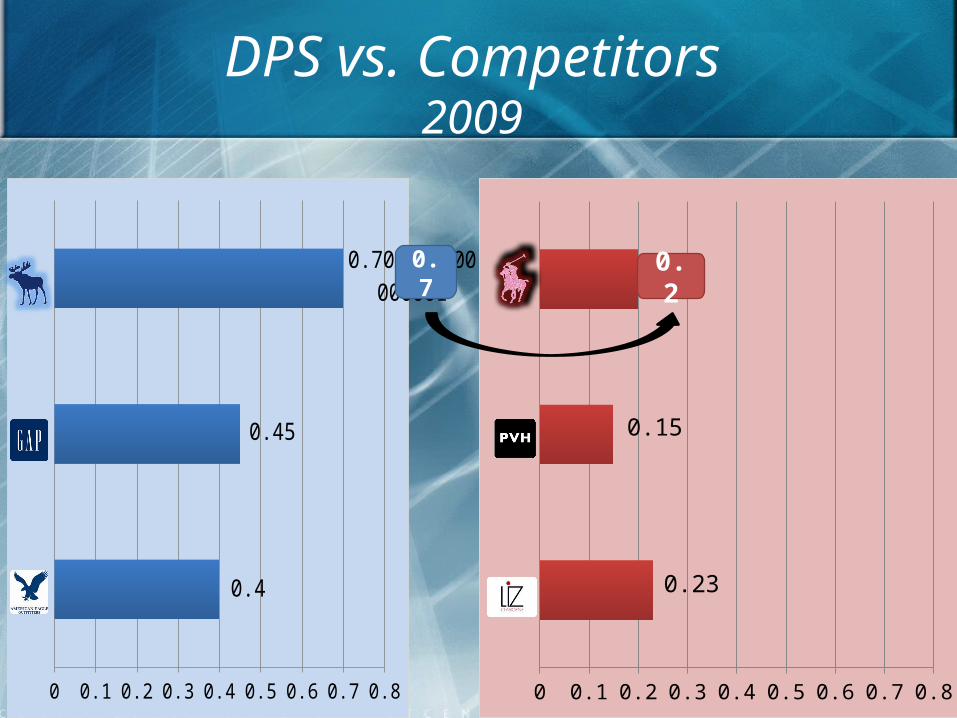
DPS vs. Competitors2009
0 0.1 0.2 0.3 0.4 0.5 0.6 0.7 0.8
0.4
0.45
0.700000000000001
0 0.1 0.2 0.3 0.4 0.5 0.6 0.7 0.8
0.23
0.15
0.20.20.7
2005 2006 2007 2008 2009 20100
0.1
0.2
0.3
0.4
0.5
0.6
0.7
0.8
0.600000000000001
0.7000000000000010.7000000000000
010.7000000000000
010.7000000000000
010.7000000000000
01
0.2 0.2 0.2 0.2 0.2
0.3
Abercrombie & FitchPolo Ralph Lauren
6-year DPS Evolution
Revenue
Dividend
0% 1% 2% 3% 4% 5% 6% 7% 8% 9% 10%
8.54%
8.45%
Polo Ralph Lauren 5-year Annual Growth Rates
Correlation Coefficient ≈ 1
8,45%
8,54%
0,3
84.8%
15.2%
85.2%
14.8%
Outstanding SharesTreasury Stocks
2008
2009
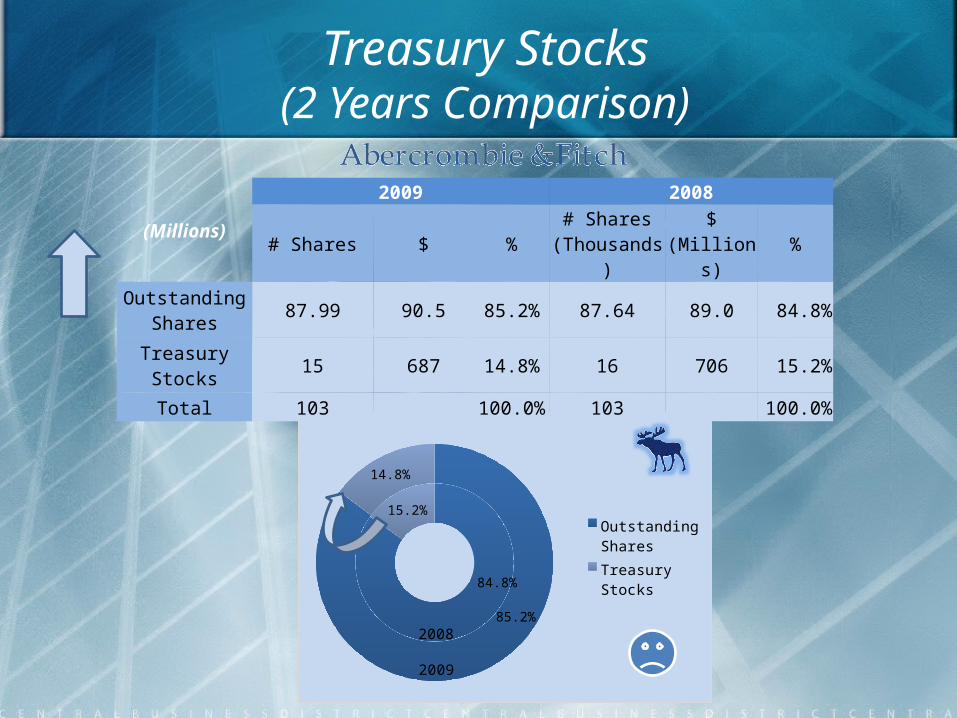
Treasury Stocks(2 Years Comparison)
(Millions)2009 2008
# Shares $ % # Shares (Thousands) $ (Millions) %
Outstanding Shares 87.99 90.5 85.2% 87.64 89.0 84.8%
Treasury Stocks 15 687 14.8% 16 706 15.2%
Total 103 100.0% 103 100.0%
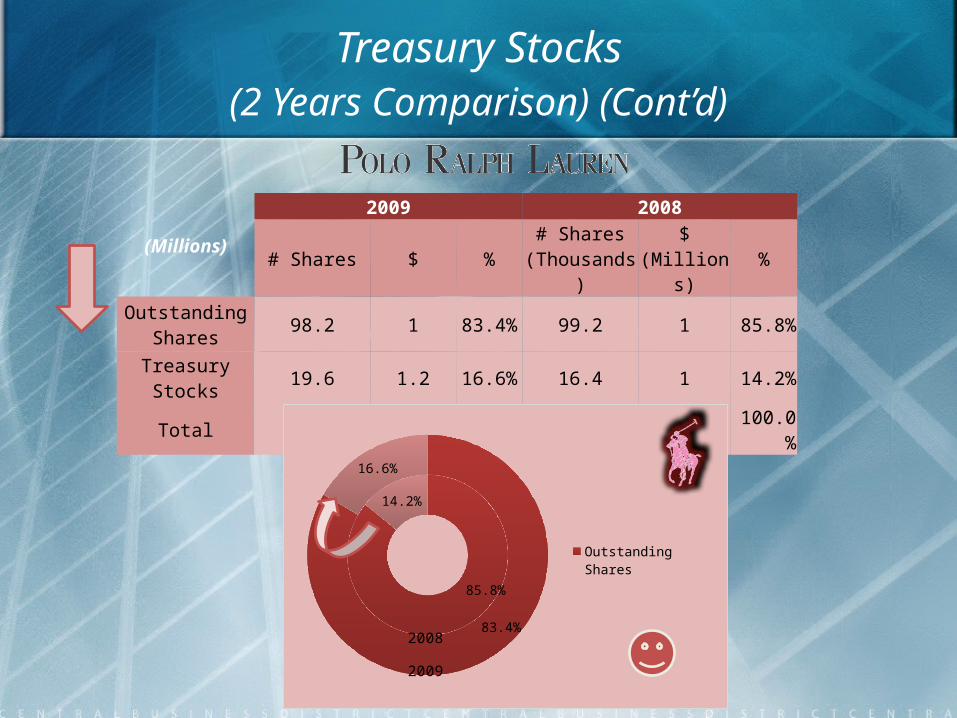
Treasury Stocks(2 Years Comparison) (Cont’d)
(Millions)2009 2008
# Shares $ % # Shares (Thousands) $ (Millions) %
Outstanding Shares 98.2 1 83.4% 99.2 1 85.8%
Treasury Stocks 19.6 1.2 16.6% 16.4 1 14.2%
Total 118 100.0% 116 100.0%
85.8%
14.2%
83.4%
16.6%
Outstanding SharesTreasury Stocks
2008
2009

FURTHER INVESTIGATIONS
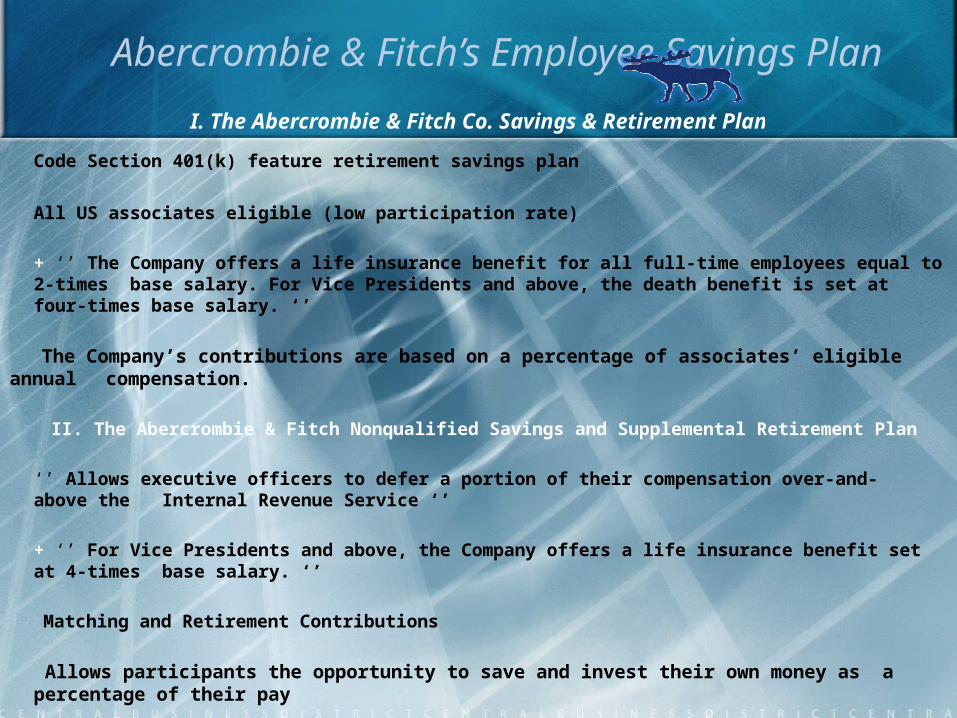
Abercrombie & Fitch’s Employee Savings Plan
I. The Abercrombie & Fitch Co. Savings & Retirement Plan
Code Section 401(k) feature retirement savings plan
All US associates eligible (low participation rate)
+ ‘’ The Company offers a life insurance benefit for all full-time employees equal to 2-times base salary. For Vice Presidents and above, the death benefit is set at four-times base salary. ‘’
The Company’s contributions are based on a percentage of associates’ eligible annual compensation.
II. The Abercrombie & Fitch Nonqualified Savings and Supplemental Retirement Plan
‘’ Allows executive officers to defer a portion of their compensation over-and-above the Internal Revenue Service ‘’
+ ‘’ For Vice Presidents and above, the Company offers a life insurance benefit set at 4-times base salary. ‘’
Matching and Retirement Contributions
Allows participants the opportunity to save and invest their own money as a percentage of their pay
Abercrombie & Fitch
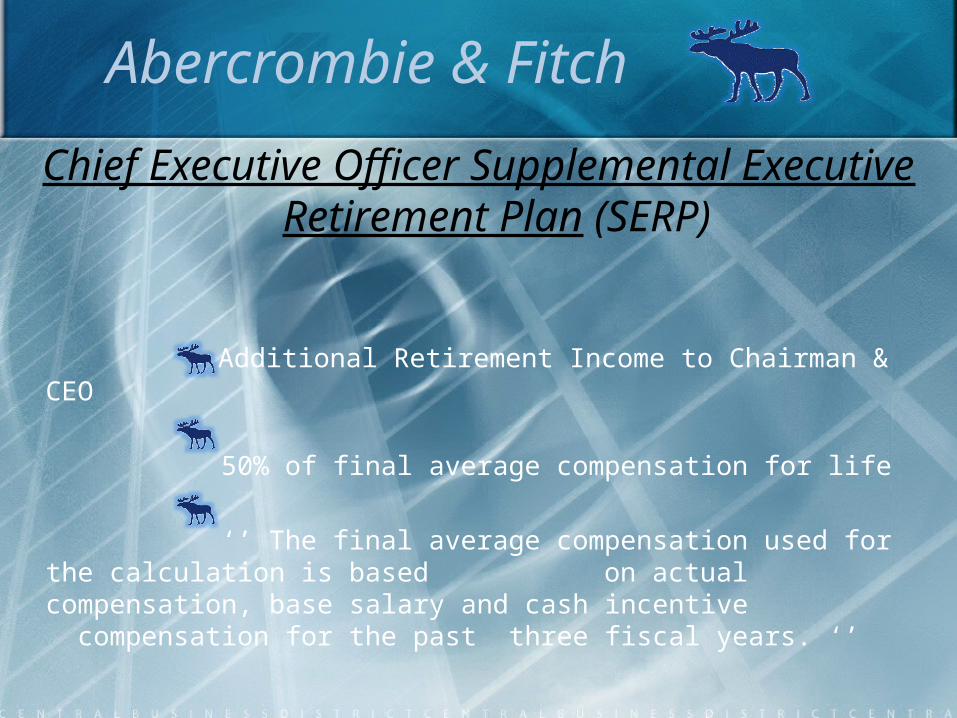
Chief Executive Officer Supplemental Executive Retirement Plan (SERP)
Additional Retirement Income to Chairman & CEO
50% of final average compensation for life
‘’ The final average compensation used for the calculation is based on actual compensation, base salary and cash incentive
compensation for the past three fiscal years. ‘’
Polo Ralph Lauren
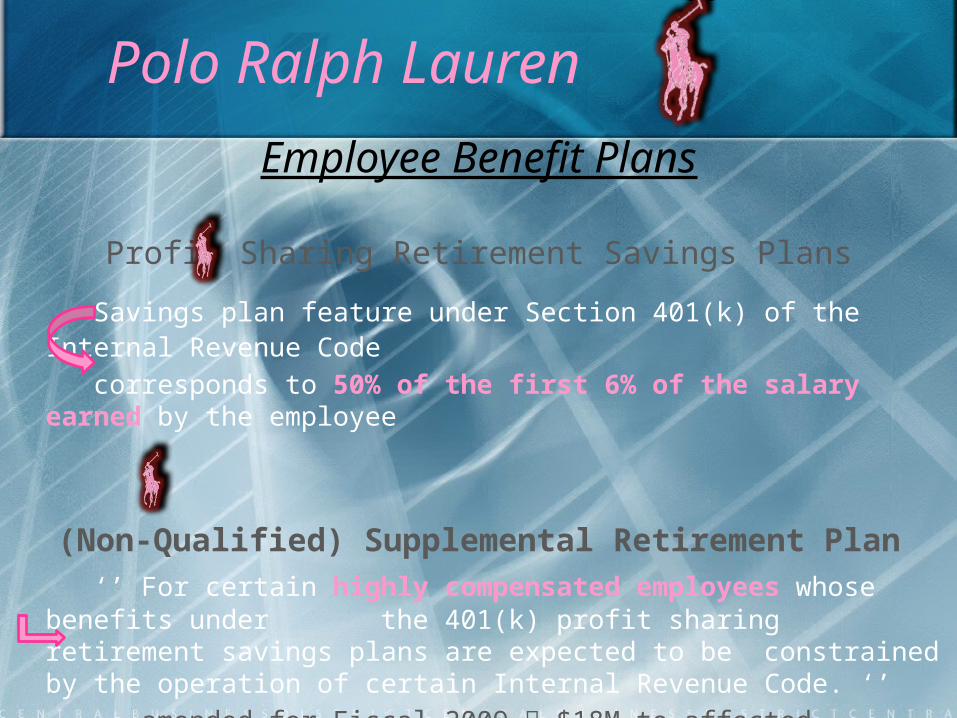
Employee Benefit Plans
Profit Sharing Retirement Savings Plans
Savings plan feature under Section 401(k) of the Internal Revenue Codecorresponds to 50% of the first 6% of the salary earned by the employee
(Non-Qualified) Supplemental Retirement Plan‘’ For certain highly compensated employees whose benefits under the 401(k) profit sharing retirement savings plans are expected to be
constrained by the operation of certain Internal Revenue Code. ‘’ amended for Fiscal 2009 $18M to affected participants during 1st Q. 2010
Employee Benefit Plans (cont’d)
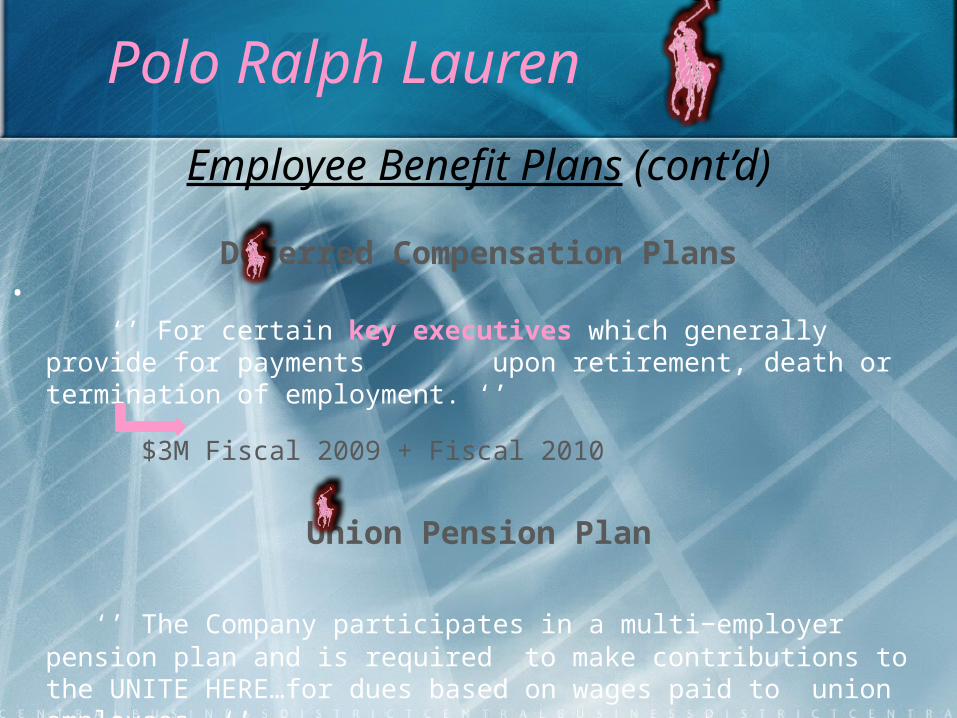
Deferred Compensation Plans•
‘’ For certain key executives which generally provide for payments upon retirement, death or termination of employment. ‘’
$3M Fiscal 2009 + Fiscal 2010
Union Pension Plan
‘’ The Company participates in a multi−employer pension plan and is required to make contributions to the UNITE HERE…for dues based on wages paid to union employees. ‘’
Polo Ralph Lauren
Abercrombie & Fitch
Environmental matters: federal, state, and local regulations / general economic and financial conditions
Consumer spending Bad weather conditions
Changes in credit & lending market conditions (interest rates)
Impact of competition & pricing measures (including raw materials)
Currency & exchange risks / change in tariffs & quotas
Political events / acts of terrorism, threats, or wars
Risks
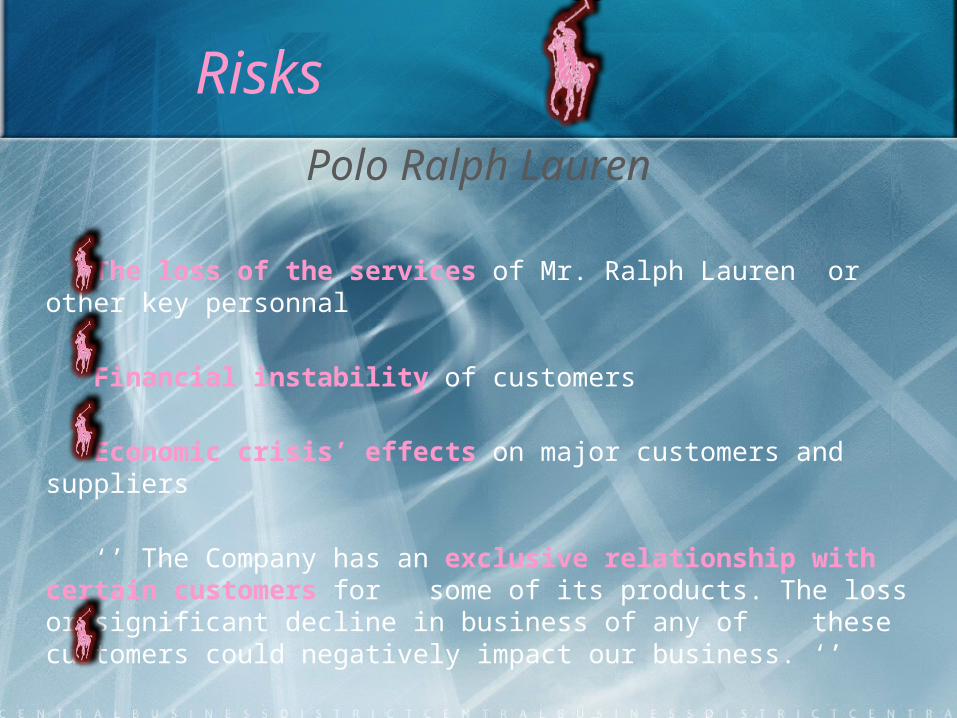
Risks Polo Ralph Lauren
The loss of the services of Mr. Ralph Lauren or other key personnal
Financial instability of customers
Economic crisis’ effects on major customers and suppliers
‘’ The Company has an exclusive relationship with certain customers for some of its products. The loss or significant decline in business of any of these customers could negatively impact our business. ‘’
+ ENVIRONMENTAL FACTORS (Natural & Economic (or Fiscal))
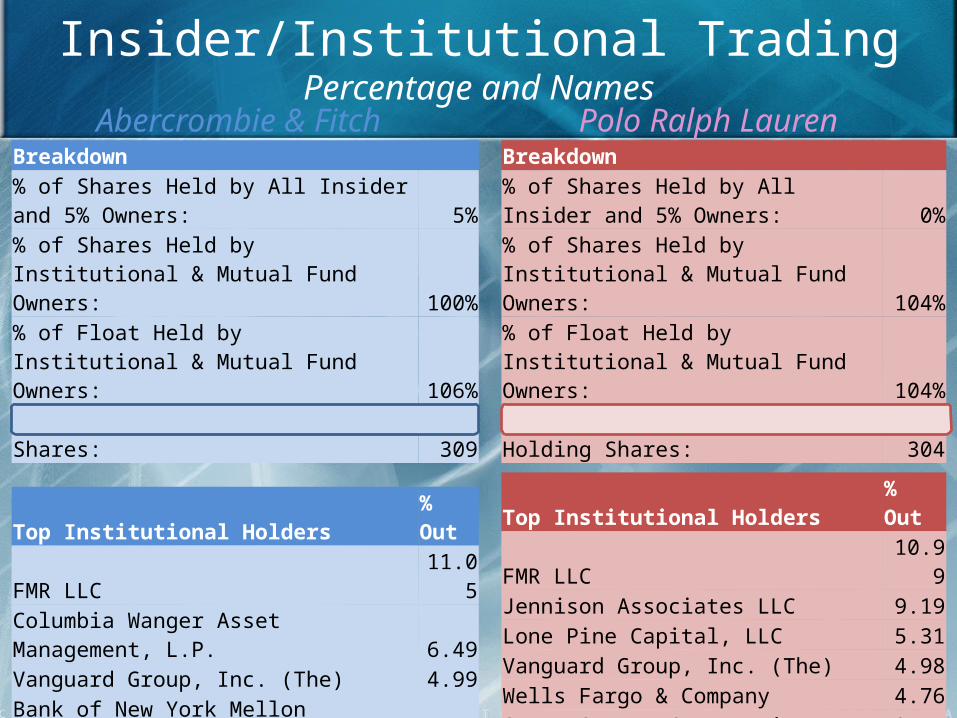
Insider/Institutional TradingPercentage and Names
Breakdown% of Shares Held by All Insider and 5% Owners: 5%% of Shares Held by Institutional & Mutual Fund Owners: 100%% of Float Held by Institutional & Mutual Fund Owners: 106%Number of Institutions Holding Shares: 309
Top Institutional Holders % OutFMR LLC 11.05Columbia Wanger Asset Management, L.P. 6.49Vanguard Group, Inc. (The) 4.99Bank of New York Mellon Corporation 4.13Pennant Capital Management, LLC 3.83State Street Corporation 3.83Massachusetts Financial Services Co - Other 3.82Orbis Holdings Ltd 3.33Maverick Capital Ltd. 2.54BlackRock Institutional Trust Company, N.A. 2.46
Breakdown% of Shares Held by All Insider and 5% Owners: 0%% of Shares Held by Institutional & Mutual Fund Owners: 104%% of Float Held by Institutional & Mutual Fund Owners: 104%Number of Institutions Holding Shares: 304
Top Institutional Holders % OutFMR LLC 10.99Jennison Associates LLC 9.19Lone Pine Capital, LLC 5.31Vanguard Group, Inc. (The) 4.98Wells Fargo & Company 4.76State Street Corporation 3.51Artisan Partners Limited Partnership 3.3Goldman Sachs Group Inc 3.02Franklin Resources, Inc 2.56BlackRock Institutional Trust Company, N.A. 2.41
Abercrombie & Fitch Polo Ralph Lauren
+477%+64,74%
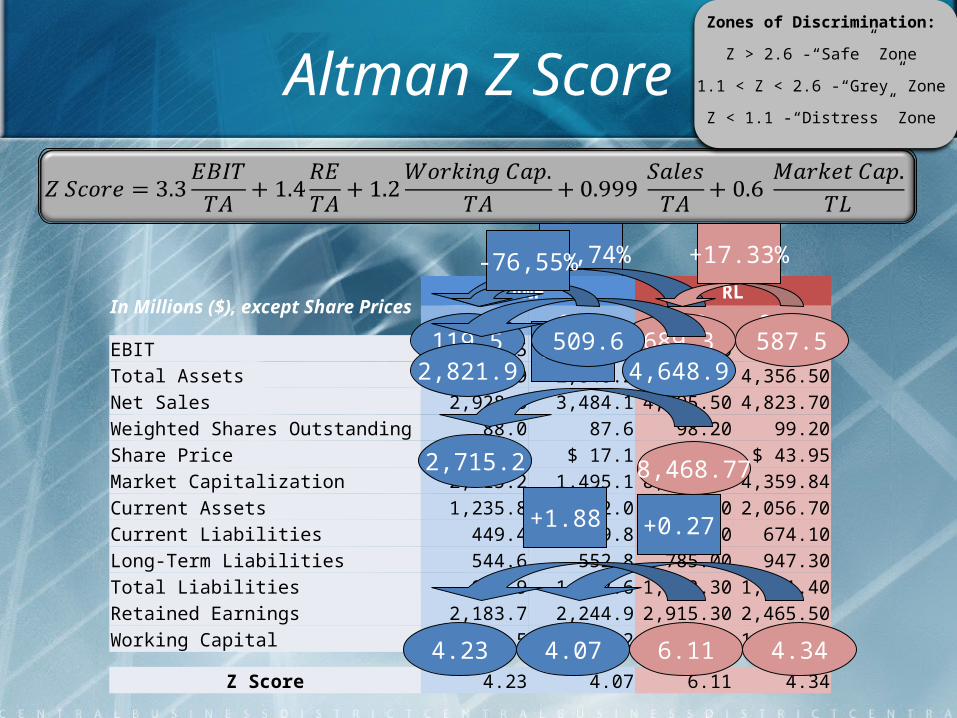
Altman Z Score
In Millions ($), except Share PricesANF RL
2009 2008 2009 2008EBIT 119.5 509.6 689.30 587.50Total Assets 2,821.9 2,848.2 4,648.90 4,356.50Net Sales 2,928.6 3,484.1 4,795.50 4,823.70Weighted Shares Outstanding 88.0 87.6 98.20 99.20Share Price $ 30.9 $ 17.1 $ 86.24 $ 43.95Market Capitalization 2,715.2 1,495.1 8,468.77 4,359.84Current Assets 1,235.8 1,072.0 2,275.80 2,056.70Current Liabilities 449.4 449.8 747.30 674.10Long-Term Liabilities 544.6 552.8 785.00 947.30Total Liabilities 993.9 1,002.6 1,532.30 1,621.40Retained Earnings 2,183.7 2,244.9 2,915.30 2,465.50Working Capital 786.5 622.2 1,528.50 1,382.60
Z Score 4.23 4.07 6.11 4.34
Zones of Discrimination:
Z > 2.6 -“Safe” Zone
1.1 < Z < 2.6 -“Grey” Zone
Z < 1.1 -“Distress” Zone
4.07 6.114.23 4.34
+0.27+1.88
8,468.772,715.2
+212% 689.3119.5 509.62,821.9 4,648.9
-76,55%
587.5
+17.33%
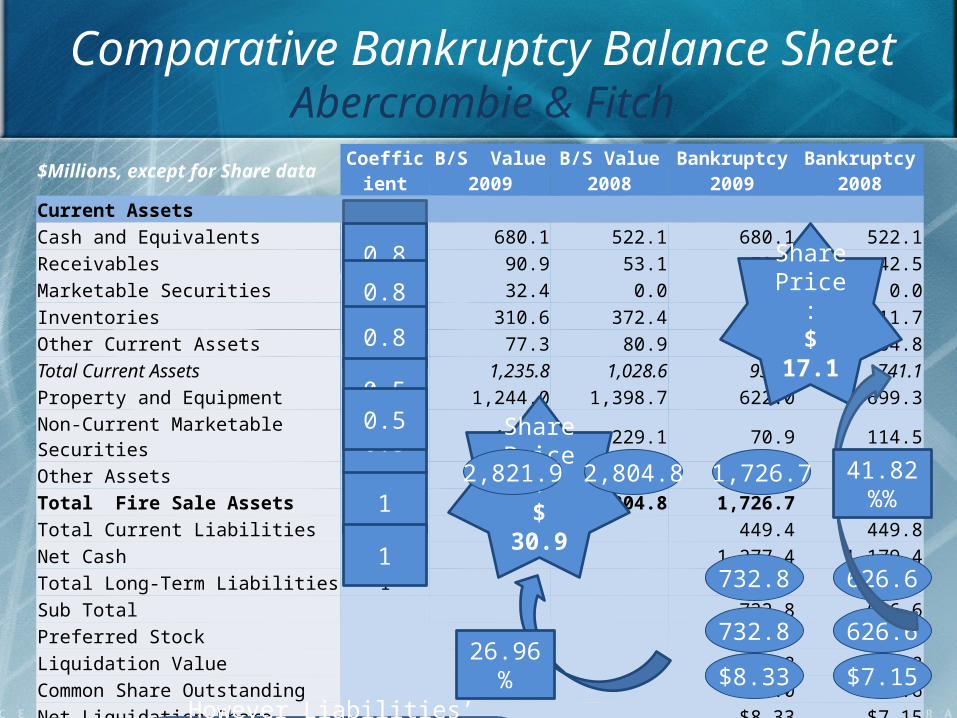
Comparative Bankruptcy Balance SheetAbercrombie & Fitch
$Millions, except for Share data Coefficient B/S Value 2009
B/S Value 2008
Bankruptcy 2009
Bankruptcy 2008
Current AssetsCash and Equivalents 1 680.1 522.1 680.1 522.1Receivables 0.8 90.9 53.1 72.7 42.5Marketable Securities 0.8 32.4 0.0 25.9 0.0Inventories 0.3 310.6 372.4 93.2 111.7Other Current Assets 0.8 77.3 80.9 61.8 64.8Total Current Assets 1,235.8 1,028.6 933.7 741.1Property and Equipment 0.5 1,244.0 1,398.7 622.0 699.3Non-Current Marketable Securities 0.5 141.8 229.1 70.9 114.5Other Assets 0.5 200.2 148.4 100.1 74.2Total Fire Sale Assets 2,821.9 2,804.8 1,726.7 1,629.2Total Current Liabilities 1 449.4 449.8Net Cash 1,277.4 1,179.4Total Long-Term Liabilities 1 544.6 552.8Sub Total 732.8 626.6Preferred Stock 0.0 0.0Liquidation Value 732.8 552.8Common Share Outstanding 88.0 87.6Net Liquidation Share $8.33 $7.15
Share Price:$ 30.9
Share Price:$ 17.1
However Liabilities’ coefficients are one because even if the company
goes bankrupt, all the liabilities, such as accounts payable, all kind of
expenses, lease credits, debt,… will remain the same
10.8
0.30.8
0.8
1
0.5
1
0.50.5
626.6
$8.33
732.8
1,629.21,726.72,804.82,821.9
732.8 626.6
$7.1526.96%
41.82%%
$Millions, except for Share data Coefficient B/S Value 2009 B/S Value 2008 Bankruptcy 2009 Bankruptcy 2008
Current AssetsCash and Equivalents 1 563.1 481.2 563.1 481.2Receivables 0.8 381.9 474.9 305.5 379.9Marketable Securities 0.8 0.0 0.0 0.0 0.0Short-Term Investments 0.8 584.1 338.7 467.3 271.0Inventories 0.3 504.0 525.1 151.2 157.5Deferred Tax Assets 0 103.0 101.8 0.0 0.0Other Current Assets 0.8 139.7 135.0 111.8 108.0Total Current Assets 2,275.8 2,056.7 1,598.9 1,397.6Property and Equipment 0.5 697.2 651.6 348.6 325.8Non-Current Investments 0.5 75.5 29.7 37.8 14.9Deferred Tax Assets 0 101.9 102.8 0.0 0.0Goodwill 1 986.6 966.4 493.3 483.2Intangible Assets 1 363.2 348.9 109.0 104.7Other Assets 0.5 148.7 200.4 74.4 100.2Total Fire Sale Assets 4,648.9 4,356.5 3,409.4 3,153.8Total Current Liabilities 1 747.3 674.1Net Cash 2,662.1 2,479.7Total Long-Term Liabilities 1 785.0 947.3Sub Total 1,877.1 1,532.4Preferred Stock 0.0 0.0Liquidation Value 1,877.1 1,532.4Common Share Outstanding 98.2 99.2Net Liquidation Share $19.11 $15.45
0.8
0.3
0.8
1
0.8
0.5
00.5
0.80
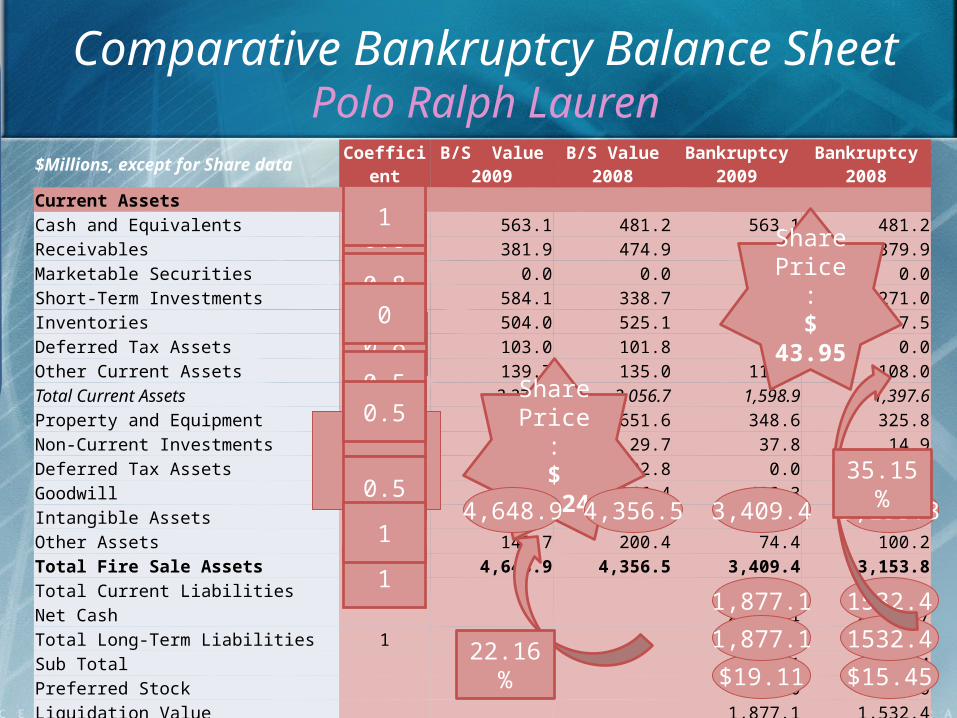
Comparative Bankruptcy Balance SheetPolo Ralph Lauren
Share Price:
$ 86.24
Share Price:
$ 43.95
Both liquidation value per share for 2009 and 2008 are lower than the share prices.
It means that RL will not go out of business and that their stocks prices were
not under evaluate. Liquidation value/share increase by
23.69%, which is a huge increase (7.19% increase more than ANF), however as the
price of share increase by 96.22%, it means that stockholders would have to
put more money inside the company but in case of bankrupt they will receive less.
(35.15% of the share price in 2008 and only 22.16% in 2009) Therefore, less
compensations for the stockholders in case of bankruptcy
0.5
1
1
14,648.9 4,356.5
1,877.1
3,409.4 3,153.8
$19.11 $15.45
1532.4
1,877.1 1532.422.16%
35.15%
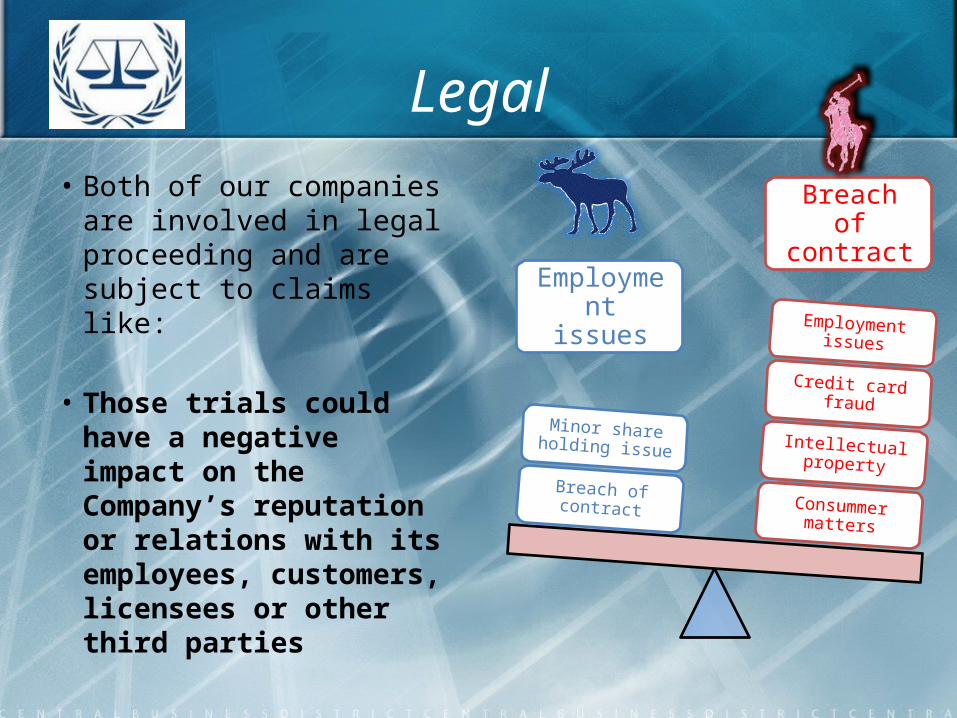
Legal• Both of our companies are
involved in legal proceeding and are subject to claims like:
• Those trials could have a negative impact on the Company’s reputation or relations with its employees, customers, licensees or other third parties
Employment issues
Breach of contract
Consummer matters
Intellectual property
Credit card fraud
Employment issues
Breach of contract
Minor share holding issue

ANF AND RL IN THE NEWS
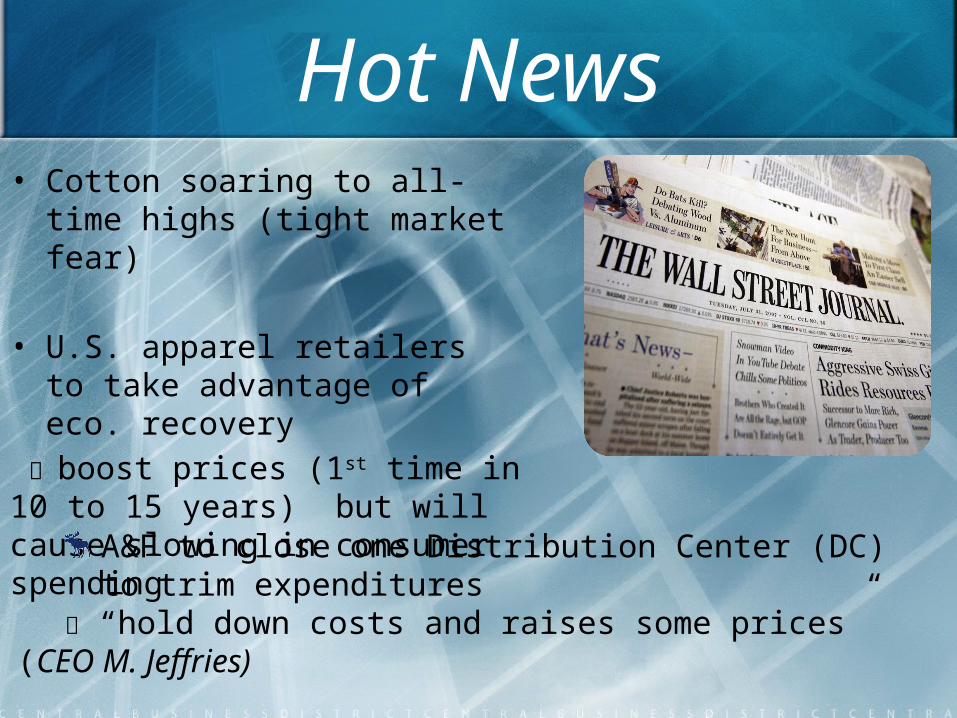
Hot News• Cotton soaring to all-time highs
(tight market fear)
• U.S. apparel retailers to take advantage of eco. recovery
boost prices (1st time in 10 to 15 years) but will cause slowing in consumer spending
A&F to close one Distribution Center (DC) to trim expenditures “hold down costs and raises some prices” (CEO M. Jeffries)
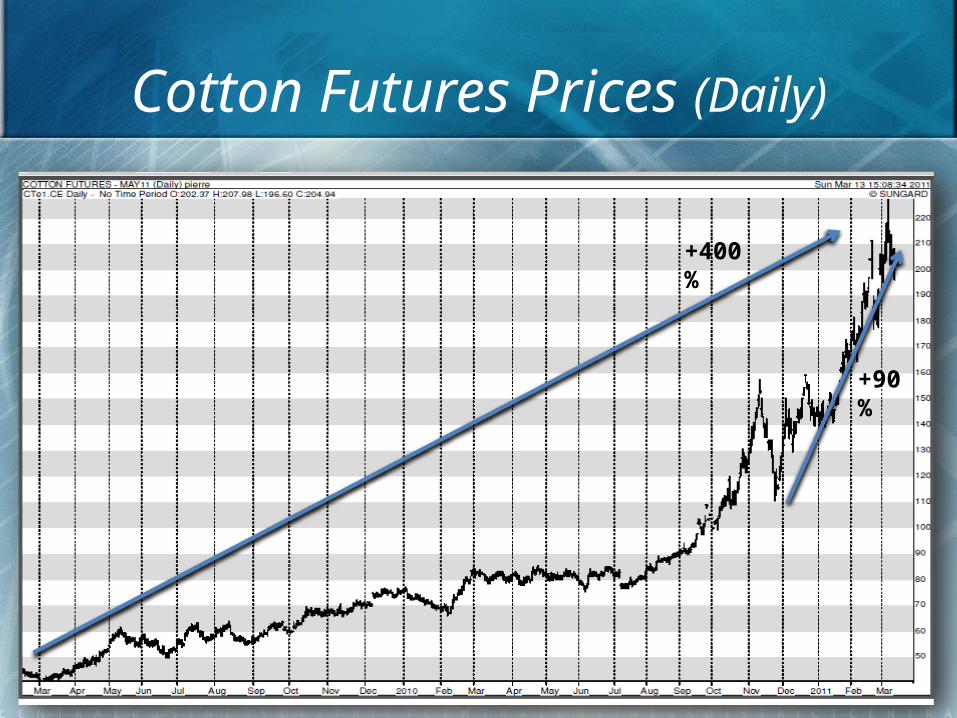
Cotton Futures Prices (Daily)
+400%
+90%
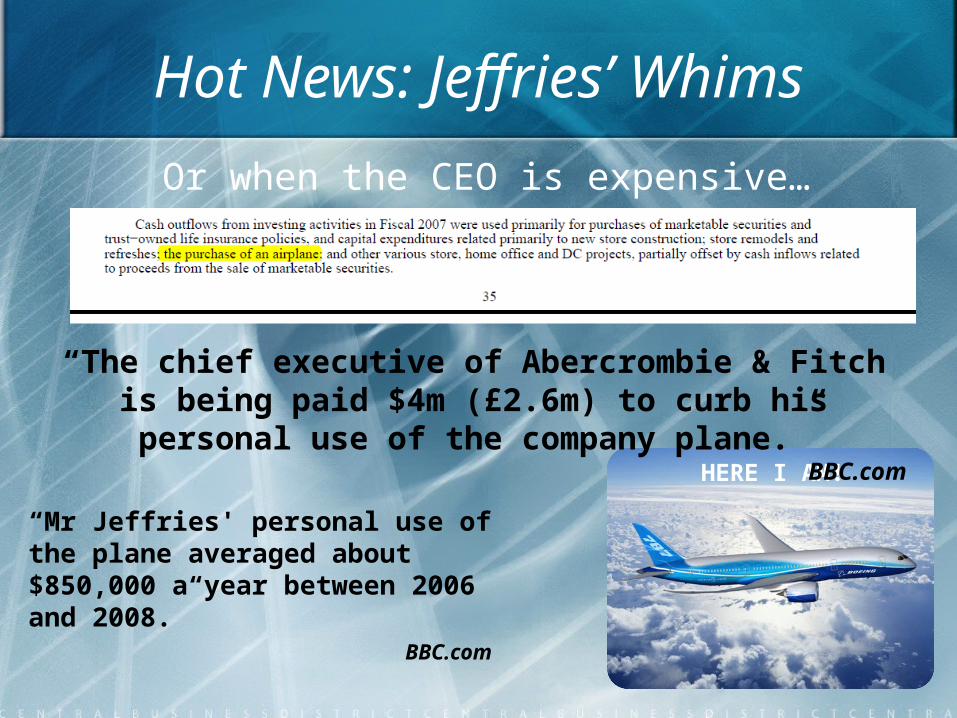
Hot News: Jeffries’ Whims
Or when the CEO is expensive…
HERE I AM!
“The chief executive of Abercrombie & Fitch is being paid $4m (£2.6m) to curb his personal use of the company plane.”
BBC.com
“Mr Jeffries' personal use of the plane averaged about $850,000 a year between 2006 and 2008.”
BBC.com
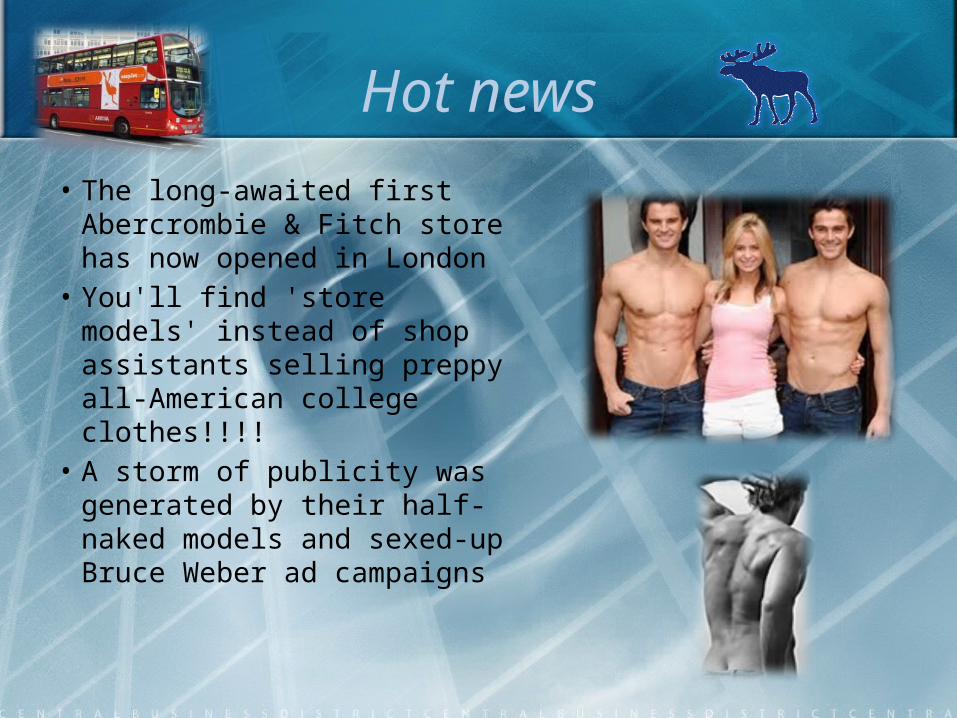
Hot news
• The long-awaited first Abercrombie & Fitch store has now opened in London
• You'll find 'store models' instead of shop assistants selling preppy all-American college clothes!!!!
• A storm of publicity was generated by their half-naked models and sexed-up Bruce Weber ad campaigns
Hot News
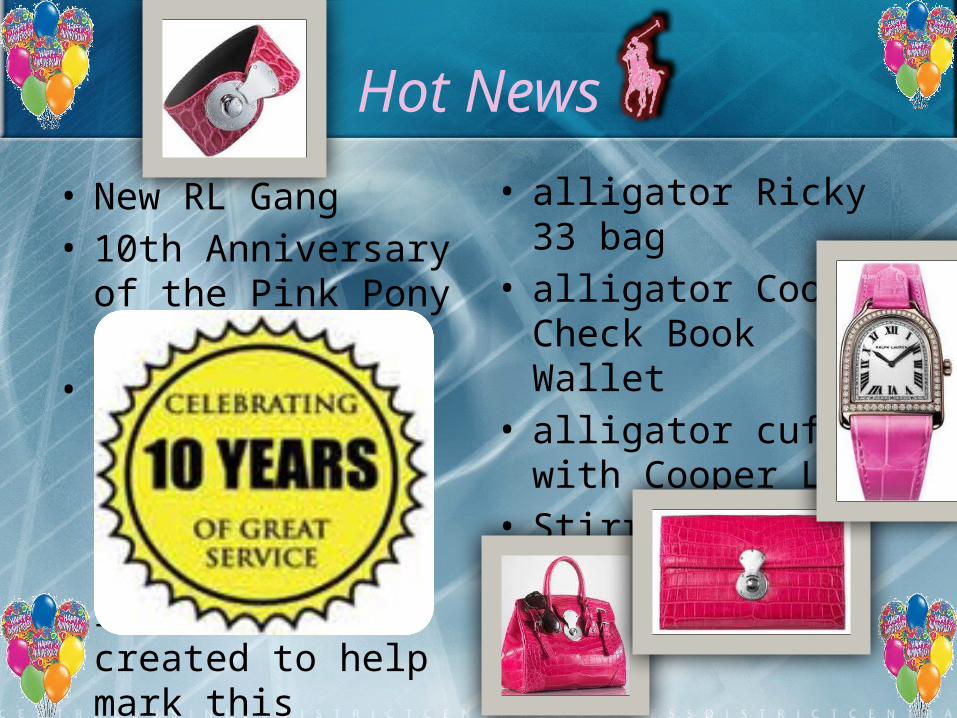
• New RL Gang• 10th Anniversary of the
Pink Pony collection• In support of the 10th
anniversary, four pink limited edition items were created to help mark this momentous occasion
• alligator Ricky 33 bag• alligator Cooper Check
Book Wallet• alligator cuff with
Cooper Lock• Stirrup timepiece in
rose gold

Thank you for your attention
Related Documents