FINANCIAL ANALYSIS OF SCANIA AND VOLVO By : Kaan Aydin Ataoglu - 14123053

Welcome message from author
This document is posted to help you gain knowledge. Please leave a comment to let me know what you think about it! Share it to your friends and learn new things together.
Transcript

FINANCIAL ANALYSIS OFSCANIA AND VOLVO
By : Kaan Aydin Ataoglu - 14123053

TABLE OF CONTENT
Background of Scania & Volvo
Ratio Analysis with graph and data
Conclusion

SCANIA & VOLVO
• IT ALL BEGAN IN 1891 WITH THE FOUNDATION OF A FACTORY IN SÖDERTÄLJE FOR THE MANUFACTURE OF RAILWAY CARRIAGES. (SWEDISH FOR “WAGON FACTORY LTD IN SÖDERTÄLJE), SHORTENED TO VABIS.
• IN 1936 SCANIA-VABIS INTRODUCED ITS FIRST IN-HOUSE DIESEL ENGINE.
• IN 1949 SCANIA-VABIS LAUNCHED ITS DIRECT-INJECTION DIESEL ENGINE. WHICH KNOWN AS THE “400,000-KILOMETRE ENGINE”.
• IN 2000 11 FACTORIES IN FIVE COUNTRIES JOINED IN THE MANUFACTURE OF SCANIA’S 1-MILLIONTH TRUCK.
• IN 2008 VOLKSWAGEN BECAME THE MAIN OWNER OF SCANIA, WITH 68.6 PERCENT OF THE VOTING RIGHTS AND 37.73 PERCENT OF THE CAPITAL RIGHTS.
IN 1915, ESTABLISHED, THE SWEDISH BALL BEARING MANUFACTURER.
IN 1924, ASSAR GABRIELSSON AND GUSTAF LARSON, THE TWO FOUNDERS, DECIDED TO START CONSTRUCTION OF A SWEDISH CAR
IN 1940, THE QUEEN ELIZABETH SET SAIL ON HER MAIDEN VOYAGE FROM LIVERPOOL TO NW YORK. VOLVO'S FIRST TERRAIN VEHICLE,
IN 1980, FIRST TIME IN CARS MANUFACTURED IN JAPAN EXCEEDED THE USA, 7.0 MILLION AS OPPOSED TO 6.4 MILLION.
IN 2002, VOLVO RENAMED IT RENAULT TRUCKS . RENAULT BECAME VOLVO'S BIGGEST SHAREHOLDER WITH A 19.9% STAKE
IN 2007, VOLVO ENGINEERING RESOURCES AND COMPONENTS USED IN VARIOUS FORD, LAND ROVER AND ASTON MARTIN PRODUCTS
IN 2010, VOLVO TRUCKS PRESENTED A NEW RANGE OF HEAVY-DUTY TRUCKS.

Current Ratio= Current Assets Current Liabilities
2013 Scania = 150965 = 0.77 195616
CURRENT RATIO
2010 2011 2012 20130
0.2
0.4
0.6
0.8
1
1.2
1.4
1.61.4
0.92
0.670.77
1.27 1.23 1.241.13
SCANIA VOLVO
SCANIA VOLVO
2010 1.40 1.27
2011 0.92 1.23
2012 0.67 1.24
2013
0.77 1.13
The ratio is mainly used to give an idea of the company's ability to pay back its short-term liabilities (debt and pay ables) with its short-term assets (cash, inventory, receivables). Normally between 1.5 – 2
If less than 1 (current liabilities > current assets)

QUICK RATIO
2010 2011 2012 20130
0.2
0.4
0.6
0.8
1
1.2
0.9
0.61
0.38
0.53
1.13
1.01
0.860.92
SCANIA VOLVO
SCANIA VOLVO
2010 0.90 1.13
2011 0.61 1.01
2012 0.38 0.86
2013 0.53 0.92
Quick Ratio= Current Assets – Stock Current Liabilities
2013 Scania = 150965 – 47175 = 0.53 195616
An indicator of a company’s short-term liquidity. The quick ratio measures a company’s ability to meet its short-term obligations with its most liquid assets.
Should be normally between 0.7-1 (to be absolutely safe) which indicates that quick assets exceed current liabilities
The higher the quick ratio, the better the company's liquidity position.
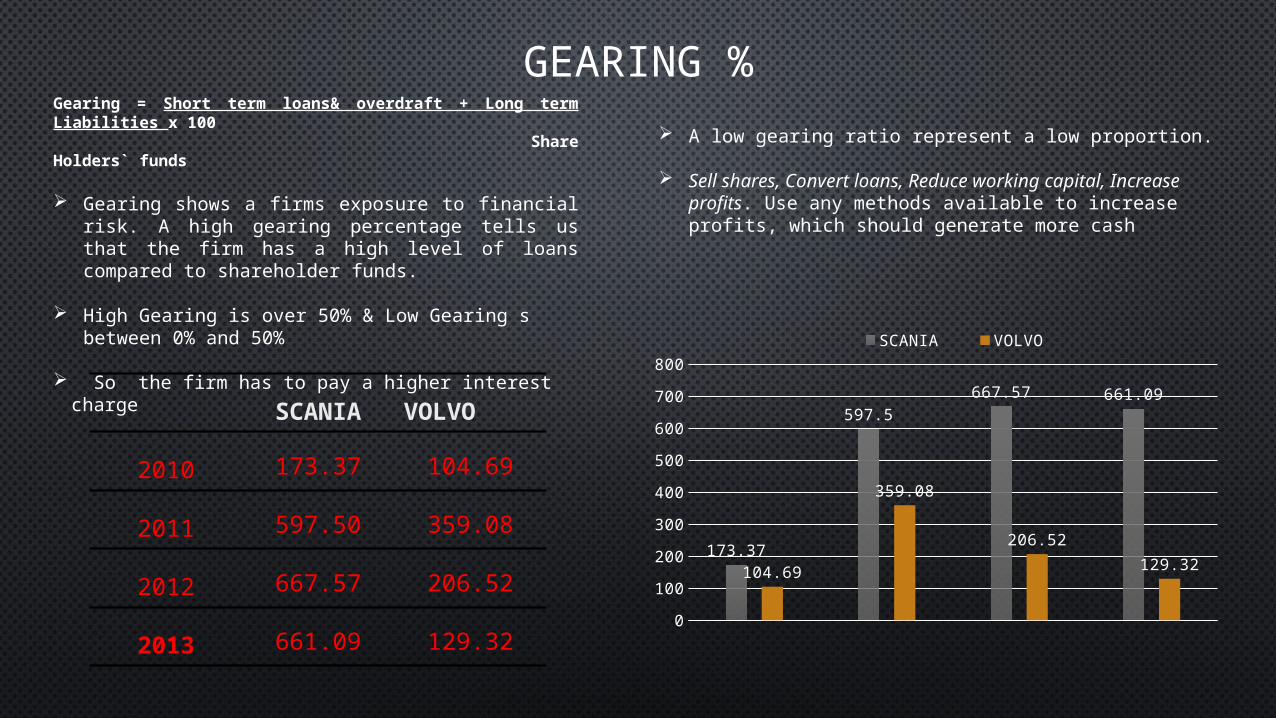
GEARING %
SCANIA VOLVO
2010 173.37 104.69
2011 597.50 359.08
2012 667.57 206.52
2013 661.09 129.32 2010 2011 2012 20130
100
200
300
400
500
600
700
800
173.37
597.5667.57 661.09
104.69
359.08
206.52
129.32
SCANIA VOLVO
A low gearing ratio represent a low proportion.
Sell shares, Convert loans, Reduce working capital, Increase profits. Use any methods available to increase profits, which should generate more cash
Gearing = Short term loans& overdraft + Long term Liabilities x 100 Share Holders` funds
Gearing shows a firms exposure to financial risk. A high gearing percentage tells us that the firm has a high level of loans compared to shareholder funds.
High Gearing is over 50% & Low Gearing s between 0% and 50%
So the firm has to pay a higher interest charge

STOCK TURNOVER RATIO
SCANIA VOLVO
2010 11.92 44.59
2011 14.14 22.19
2012 13.16 15.28
2013 15.54 16.902010 2011 2012 2013
0
5
10
15
20
25
30
35
40
45
50
11.9214.14 13.16
15.54
44.59
22.19
15.28 16.9
SCANIA VOLVO
Stock Turnover Ratio= Cost of Sales Stock Level
A ratio showing how many times a company's inventory
is sold and replaced over a period.
A high ratio implies either strong sales or ineffective buying.
Higher the stock turnover ratio the quicker it is for the stock to reach the customer.
May need to approximate by using sales competitor. (Might find how they doing their business. So they can spurt against to competitor)

GROSS PROFIT MARGIN
SCANIA VOLVO
2010 20.77 7.50
2011 18.72 7.29
2012 18.85 6.08
2013 18.29 6.39
2010 2011 2012 20130
5
10
15
20
25
20.7718.72 18.85 18.29
7.5 7.29 6.08 6.39
SCANIA VOLVO
Gross Profit Margin= Gross Profit Sales( Turnover)
A financial metric used to assess a firm's financial health by revealing the proportion of money left over from revenues after accounting for the cost of goods sold.
More efficient companies will usually see higher profit margins.

NET PROFIT MARGIN ( %)
SCANIA VOLVO
2010 5.73 0.67
2011 6.66 0.32
2012 5.63 -0.30
2013 6.36 0.452010 2011 2012 2013
-1
0
1
2
3
4
5
6
7
8
5.73
6.66
5.63
6.36
0.670.32
-0.3
0.45
SCANIA VOLVO
Net Profit Margin= PBIT x 100 SALE
It measures how much out of every dollar of sales a company actually keeps in earnings.
A higher profit margin indicates a more profitable company that has better control over its costs compared to its competitors.
A low profit margin can indicate pricing strategy and/or the impact competition has on margins.

RETURN ON CAPITAL EMPLOYED (%)
SCANIA VOLVO
2010 26.52 14.99
2011 13.51 6.50
2012 12.04 -6.48
2013 14.01 10.85 2010 2011 2012 2013
-10
-5
0
5
10
15
20
25
30
26.52
13.5112.04
14.0114.99
6.5
-6.48
10.85
SCANIA VOLVO
ROCE= PBIT x 100 Total Cap. Employed (Total Assets less. Cur. Liabilities)
Measures a company's profitability and the efficiency with which its capital is employed.
A higher ROCE indicates more efficient use of capital.
Which means that Scania does a better job of deploying its capital than Volvo.

CONCLUSION
Result of analysis: SCANIA VOLVO
Current Ratio - Quick Ratio - Gearing(%) - ST Ratio - Gross P Margin
-
Net P Margin -ROCE -
Scania is a better company to invest in because, they retain more profit than Volvo and the Return on capital employed ratio shows better value.

REFERENCE LIST
History of Scania:(http://www.scania.co.uk/about-scania/history/)
History of Volvo:http://www.volvogroup.com/group/global/engb/volvo%20group/history/ourhistory/1920/Pages/1920.aspx#sthash.ONlb57Mi.dpuf
Information on ratios:(http://www.investopedia.com/)
Data used for analysis and verification: Scania(http://fame.bvdinfo.com/version20141127/Report.serv?
_CID=63&context=21MLAHV0JZYSBYK&SeqNr=1)
Volvo(http://fame.bvdinfo.com/version20141127/Report.serv?_CID=233&context=21MLAHV0JZYSBYK&SeqNr=0)

THANK YOU FOR YOUR ATTENTION
Related Documents