Financial Accounting Prof. Varadraj Bapat School of Management Indian Institute of Technology, Bombay Lecture - 31 Ratio Analysis and Interpretation 2 [FL]. In last two sessions we have been discussing about Analysis and Interpretation of financial statements. We have already discussed that raw data in itself is not much useful it needs to be analysed from the view point of a particular stakeholder, then it becomes far more useful it becomes comparable and it can be also used for projections. We have also discussed that we can do horizontal as well as vertical analysis, but the most important type of analysis is ratio analysis and large number of ratios can be calculated serving variety of purposes. (Refer Slide Time: 01:10) In our early sessions we had started the discussion on liquidity ratios, then capital structure as well as you have also discussed the activity ratios. Do you remember: what is liquidity ratios stand for? These are also known as working capital ratios because they tell you about availability of funds for day to day management of the business. So, which are the important ratios in the category? The first one is current ratio perhaps the most important ratio and very often used by variety of users where we compare the

Welcome message from author
This document is posted to help you gain knowledge. Please leave a comment to let me know what you think about it! Share it to your friends and learn new things together.
Transcript

Financial AccountingProf. Varadraj Bapat
School of ManagementIndian Institute of Technology, Bombay
Lecture - 31Ratio Analysis and Interpretation 2
[FL]. In last two sessions we have been discussing about Analysis and Interpretation of
financial statements. We have already discussed that raw data in itself is not much useful
it needs to be analysed from the view point of a particular stakeholder, then it becomes
far more useful it becomes comparable and it can be also used for projections.
We have also discussed that we can do horizontal as well as vertical analysis, but the
most important type of analysis is ratio analysis and large number of ratios can be
calculated serving variety of purposes.
(Refer Slide Time: 01:10)
In our early sessions we had started the discussion on liquidity ratios, then capital
structure as well as you have also discussed the activity ratios. Do you remember: what
is liquidity ratios stand for? These are also known as working capital ratios because they
tell you about availability of funds for day to day management of the business.
So, which are the important ratios in the category? The first one is current ratio perhaps
the most important ratio and very often used by variety of users where we compare the
relationship of current assets to current liabilities. So, for day to day transactions this is
very important, so for taking a decision of giving credit often suppliers will look at the
current ratio of the customer to see whether customer will be able to repay the debt in the
repay that particular debt in time.
It is also seen by bankers, it is also useful for internal management to see how is the
working capital management of the company. The other liquidity ratio was quick ratio
which is more conservative way of calculating current ratio. Then going to capital
structure or leverage ratios we had seen that long term funds can be obtained from two
ways: one is equity that is owners fund, the other is debt.
Now, capital structure is a mixture of in what percentage you debt equity versus what
percentage you can debt you have you can raise the debt, it can be 100 versus 0 that will
be called as no debt or all equity company. In such a scenario the risk is less, the stability
of the company is more because debt leads to possibility of liquidation because firm has
to pay interest and instalment on certain due date. But, having less debt affects our
returns or profitability to some extent that is why a good mix is required between debt
and equity.
One of the most important ratios in this segment is debt equity ratio which is extensively
used by lenders or bankers. They decide as to what debt equity ratio is acceptable, it is
also useful and is used by long term investors; in case of M and A or such deals also this
ratio plays an important role. The next type of ratios are known as activity ratios they are
also known as turnover or efficiency ratios.
So, here we see how efficiently an asset being used for example, if you have fixed assets
of let us say 1 crore how much revenue we are able to generate from them. Suppose, we
can generate a revenue of 4 crore it will mean turnover of 4 crore divided by fixed assets
of 1 crore giving a ratio of 4; 4 is to 1 that is known as fixed asset turnover ratio, very
important ratio to know the utilisation of fixed asset. This ratio is also useful and similar
ratio is also calculated for working capital turnover.
Now, within working capital you can know the efficiency in management of each of the
current assets. So, what ratio do you calculate for it do you remember? We calculate
debtors turnover ratio which is sales upon debtors, but we need to refine it a bit because
debtors or receivables are mainly from credit sales. So, we can refine it a bit and say it

call it as credit sales upon average debtors; same way it can be cost of sales upon average
stock or average inventory for inventory turnover ratio. Now, both these ratios I will just
show you the ratios for more clarity.
(Refer Slide Time: 05:54)
(Refer Slide Time: 06:00)
So, we were here working capital turnover ratio which is sales upon working capital. For
inventory turnover we take cost of sales because, the inventory is at cost instead of sales
generally better ratio would be cost of sales divided by average inventory.

(Refer Slide Time: 06:16)
Now, this ratio can also be represented in terms of number of days, then it is called as a
stock holding period. So, we take average inventory divide it by cost of sales and
multiplied by 365 or multiply it by 12; if you want to know it in terms of months.
(Refer Slide Time: 06:44)
So, this is the stock holding period, same way for debtors we can calculate debtors
turnover ratio we can also calculate debtors velocity that is number of days of debtors.
Now, this is useful for knowing how well the company is managing inventory or debtors,
we can compare it with their standard credit policy that for how many days they are

giving credit; let us say as per policy they give credit for 30 days, but the ratio is 33 it
will mean that they are slightly slow in collection.
If the ratio is much more let us say the ratio is 50 versus standard of 30 it will mean that
they are very slow in collection, it can also mean from audit angle or from investigation
angle that there is a possibility of some over statement of debtors. Then we will go for
aging schedule or some more techniques to know the components in the debtors or how
long those receivables are pending to be collected; like that these ratios are of more used
for the management of the company.
(Refer Slide Time: 07:51)
We also have creditor’s turnover ratio that is credit purchase upon average accounts
payable.

(Refer Slide Time: 07:58)
We can also calculate creditor’s velocity that is company takes how many days to make
the credit a make the payment. We also know that how many days the company is getting
credit. So, in a way we know what is the reputation of the company in the market, are
they getting any credit. So, that if we want to take a credit decision we can know the
credit period for the customer which other people are giving that particular party. Now,
let us go with this I think a turnover ratios is clear to you.
(Refer Slide Time: 08:43)
Now, we will go to the next type of ratios they are known as profitability ratios. In fact,
our discussion on the ratio itself we had started with this ratio that is known as net profit
ratios. These ratios are also known as P and L ratios because both numerator and
denominator we are getting from P and L and as the name suggest we know about the
profitability of the business in relation to the turnover generated or in relation to sales ok.
So, one of the important ratios is net profit ratio, net profit upon sales you can also take
net profit before tax, but more common is the final profit that is net profit after tax
divided by sales. If you want to know the gross ratio, then we go for gross profit ratio
which is gross profit upon sales this is also known as gross margin. Now, both this now
this particular ratio instead of finding for the whole company it can be calculated for a
particular division or particular range of products or sometimes on a single product.
So, that we know that from that product how much is a gross profit generated, see gross
profit is more linked to sales because for calculating net profit we charge various other
things which could be fixed charges. But, gross profit is mainly related to sales that is
why gross margin or GP ratio is very much useful to know the profitability of a particular
segment.
We can compare this ratio with other players in the market, so that we know are our
prices being fixed a properly do we have in a profitability, do we have more profitability
are we overcharging is there a scope for reducing the price to increase the sales or are we
undercharging that is our margins are too thin as like that various calculations can be
done using gross profit margin or gross profit ratio. It can also be calculated at a
operating profit level where in it is operating profit upon sales. So, we will know the
profitability of our operations from the sale.

(Refer Slide Time: 11:15)
Now, within profitability ratios there are other ratios which are known as return ratios
this is profitability in the context of capital employed or resources used by the
undertaking. The earlier profitability ratios they were profitability in relation to sales, but
for the investor what is more important will be the money put by him or her and what
return the company is able to generate those ratios are profitability.
(Refer Slide Time: 11:57)
So, one of the important ratios is return on equity as the name suggests this is the most
important ratio from the owners view point because owners want to know how much

money they have put and what return they are able to get from the company for that
profit after tax upon net worth is a usual formula, net worth you know is also known as
equity. So, we can also say profit after tax upon equity or we can say profit after tax upon
owner’s fund.
Now, this ratio is very important because owners will know the return from a particular
company, they can compare this ROE across different companies or for the whole
market, so as to choose which company they can invest in. Now, the other important
ratio even more important I would say is known as ROI Return on Investment, it can also
be called as return on capital employed.
(Refer Slide Time: 12:55)
Now, in the in the numerator we write return and in the denominator we write capital
employed; that means, capital which is invested sometimes it is also known as return on
invested capital. Now, what is a written here? Written refers to profit, but it may not be
profit after tax we may often take profit before tax and add back interest.
Because remember in the denominator we are writing total capital employed in the first
ratio that is ratio a we had taken only owners fund in the denominator. But, in ratio b the
denominator capital employed includes equity plus debt that is all first used since the
denominator has debt numerator also we need to add interest.

So, we take profit after tax, add back tax, add interest many times we make adjustment
for non trading or non operating income because we were using this ratio to know the
returns from that particular business activity or that particular company. So, if there are
any non operating items they can be removed and we will calculate the return related to
that particular business. Now, this ratio can be calculated for the whole company, but it
can also be calculated for a particular segment of business.
Like for example, one factory or one plant, it can be calculated for one project. Now, this
is used by investors to know the return it is also a very much used in project
management. In fact, most of the project decisions are driven by ROI, before deciding
any project you have to make projection and find out how much is the return expected
from that project.
So, if company wants to invest 50 crore in some project it must know how much return it
is likely to get suppose that return let us say is 10 percent. So, we will invest 50 crore and
we are likely to get 50 lakhs it is 50 lakhs by 50 crore which is just 1 percent, then
definitely we will not be interested. If we are getting 5 crore on a return on investment of
50 crore it becomes a return of 10 percent perhaps steel company may not be interested if
their cost of funds is say 12 percent and the project is giving only 10 percent then it is not
worth to enter that particular business
So, viability of a project very much depends on ROI generated by the project. Now, this
ratio not only for the company even in the individual life it is useful. Suppose you are
taking the decision to purchase some asset or if you are taking a decision to go for higher
education it will be good for you to know the ROI on your investment because you are
investing money you are investing your time.
So, how much return it is likely to generate becomes useful. So, this ratio is extensively
used in different types by different types of users from the investors at to the company as
they themselves want to start a new project ok.
(Refer Slide Time: 16:43)
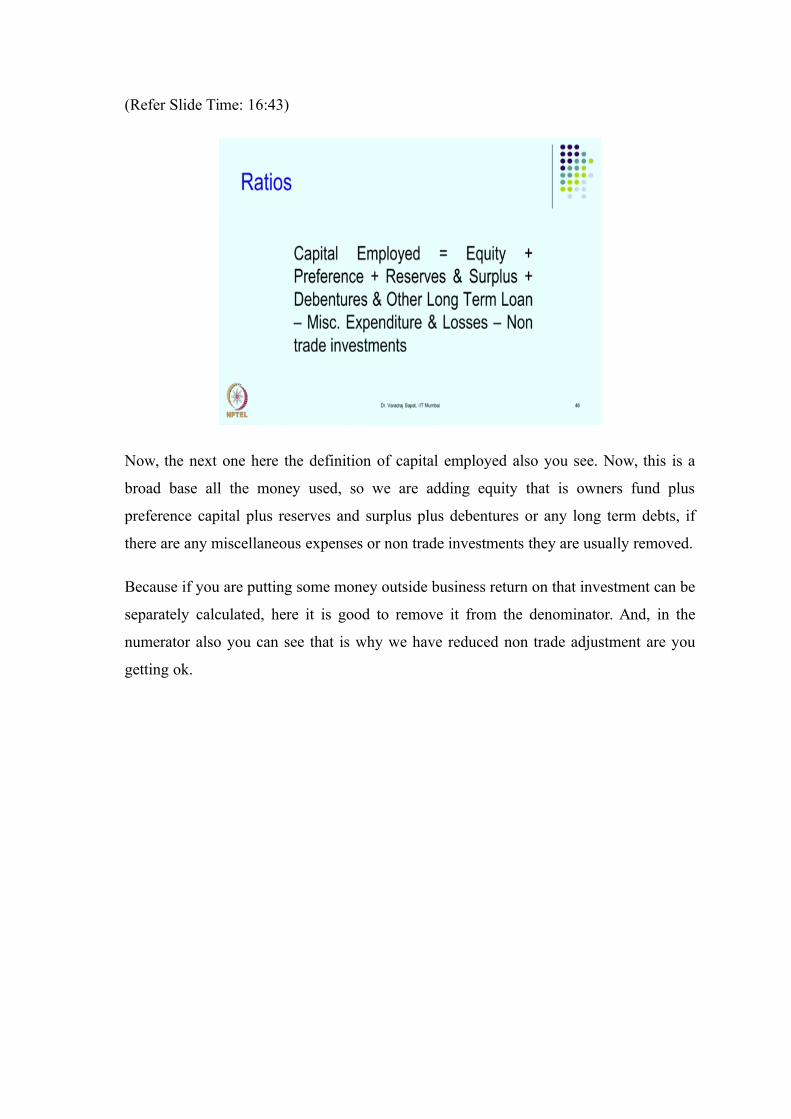
Now, the next one here the definition of capital employed also you see. Now, this is a
broad base all the money used, so we are adding equity that is owners fund plus
preference capital plus reserves and surplus plus debentures or any long term debts, if
there are any miscellaneous expenses or non trade investments they are usually removed.
Because if you are putting some money outside business return on that investment can be
separately calculated, here it is good to remove it from the denominator. And, in the
numerator also you can see that is why we have reduced non trade adjustment are you
getting ok.

(Refer Slide Time: 17:25)
Now, let us go to another formula of calculating ROI, we have already seen turnover
ratios we have already seen profitability ratios. Now, one way of calculating TOI is by
multiplying the profitability into capital turnover,
If you remember capital turnover had sales in the numerator divided by capital employed
and profitability had PAT upon sales. So, if you multiply both you will get profit upon
capital employed which is precisely what is ROI are you getting. Now, there can be some
variations like one can take operating profit ratio or one can take net profit before tax
ratio and so on.

(Refer Slide Time: 18:27)
Now, the next ratio in the return ratios is return on assets. Now, we are using fixed assets
or some any asset, so we can take that particular asset in the denominator and find out
the profit generated by that asset. So, net profit after tax here it need not be the net profit
of the whole company, it can be the profit from that particular plant or that particular
activity divided by average fixed assets this is bit of improved one because instead of
taking yearend figures we have taken average figures.
See in the in the numerator the profit is calculated for the whole year, so it makes sense
to instead of taking the closing take the average fixed assets. Now, this can be calculated
for different assets you can instead of fixed assets you can also take average total assets
if you want to know the return on total assets.

(Refer Slide Time: 19:35)
So, now, from return ratios we will go to next ratio which is in a way a return ratio, but
this is extremely important from stock market angle known as earning per share. We can
calculate the net profit from net profit, if there are any payments to be made to
preference shareholders extra they removed. So, that we know the profit available for the
equity owners and we will divide it by number of shares. Now, this is very important
because if you tell somebody that total net profit of our company is let us say 1300
crores.
Now, shareholder does not know what exactly he or she gets on his or her own shares.
So, instead of telling 1300 crores, if you divide it by number of shares you will get a
more understandable figure. Let us say it comes to 150 rupees per share, then it becomes
very simple to understand that is why in stock market parlance EPS plays a very
important role. Whenever any data is reported about the share like market price it is
immediately compared with earning per share as to what that share is able to earn for the
shareholders or for the owners.
Now, from this EPS some market related ratios like PE ratio are calculated where we
compare the market price with earning per share are you getting. So, this is very
important ratio in the stock market from the investor’s angle especially from small
investor’s angle.

(Refer Slide Time: 21:23)
Now, from EPS as I told you we are able to calculate PE ratio price earning ratio. Now,
in the numerator we have taken market price per share and divided it by earning per
share. Now, what will this ratio tell you? Suppose earning per share of a particular
company is 10 rupees and it has a market price of 150 rupees, so 150 upon 10 it means
15 times it is earning is the market price. Now, what does it tell you, is it good to have
high or PE ratio or low PE ratio? As of now PE ratio of Indian market now instead of
taking one company average PE is calculated for the whole capital market. Currently
capital market has a average PE of around 25.
Now, suppose company has a PE ratio of 15 is it a good or bad sign? Perhaps for a new
investor it is a good sign because while other shares are putting at 25 PE we are getting
this particular share at a 15 PE. That means, it is comparatively available at a lesser price
it could be a good bye of course, such decisions should not be taken only by PE I am just
giving an example because we will have to study other aspects.
But as far as the PE is concerned for a fresh investors it shows that the price of the share
is relatively low which is a good sign from a buying angle, but from the company's angle
it reflects upon the goodwill of the company when other companies in the market are
able to command a PE of 25, if our company has a PE of only 15; that means, this
company is not much respected by the market either its earnings are not considered very
reliable or market feel that the future is not very good that is why PE ratio could be low.

Whereas for some company if PE ratio is high let us say company b has a PE ratio of 50
while the market PE is 25; that means, this company has a higher recognition in the
market. So, in stock market parlance PE ratio is very important whenever a price is
quoted normally PE is also quoted for that share. Now, will this ratio change every year
or will it change every day? Now, this is one ratio which will change every day not only
everyday it will change every minute.
Because numerator that is market price changes every minute denominator may change
only on yearly basis, suppose the results are balance sheet P and L etcetera prepared at
the end of the year you will get EPS only at the end of the year or all earlier ratios which
we calculated they would be yearly most of the companies declared their results
quarterly. So, you will be able to calculate the ratios for each quarter, but as far as PE is
concerned you can calculate these ratio every minute as the market is moving the PE
ratio will also keep improving itself.
These two ratios are very important, so we devoted little more time I will request you
have already have a company and if you have seen the annual report go to some stock
market website look at the market price of the share and calculate the PE ratio mostly in
the side PE ratio will also be given that will give you market flavour. All earlier ratios
where only financial statement ratios, this is related to what is happening in the market.
(Refer Slide Time: 25:39)

There are one or two more ratios which are useful for stock market or for investors that is
known as dividend per share. Now, in the numerator we take dividend, so that we know
how much is a dividend paid by the company on per share basis. So, dividend distributed
upon number of shares. Now, we have seen variety of ratios either for liquidity or for
profitability or for return then from stock market angle.
Now, many of these ratios can be used in combination and that will give you good
insight about the performance or stability of the company, it can also be used for other
purposes by various stakeholders. In the next session, we will be calculating the ratios
and try to interpret them taking real data from the actual company. So, I will request you
to revise whatever ratios we have done right.
Now let us stop [FL].
Related Documents