Munich Personal RePEc Archive Finance-growth Nexus in China: A Channel Decomposition Analysis Jia Li International Center for Chinese Studies, Aichi University, Japan 23. March 2009 Online at http://mpra.ub.uni-muenchen.de/14409/ MPRA Paper No. 14409, posted 6. April 2009 08:40 UTC

Welcome message from author
This document is posted to help you gain knowledge. Please leave a comment to let me know what you think about it! Share it to your friends and learn new things together.
Transcript
MPRAMunich Personal RePEc Archive
Finance-growth Nexus in China: AChannel Decomposition Analysis
Jia Li
International Center for Chinese Studies, Aichi University, Japan
23. March 2009
Online at http://mpra.ub.uni-muenchen.de/14409/MPRA Paper No. 14409, posted 6. April 2009 08:40 UTC
ICCS Journal of Modern Chinese Studies Vol.1 (1) 2009
51
Finance-growth Nexus in China: A Channel Decomposition Analysis
Jia LI*
AbstractThis study aims to reassess the finance-growth nexus debate in China, and consequently
illustrate the channels through which financial development gives impact on China’s economicgrowth after 1978. Specifically, this study addresses two channels through which the effects operate,i.e., physical capital accumulation and productivity improvement. The study adopts an approachcalled channel decomposition which combines the conventional accounting framework and regres-sion analysis.
The empirical analysis, using a panel dataset of Chinese provinces between 1980 and 2004,argues that: (1) the relationship between financial development and economic growth in China tendsto be a long-run one; (2) the direction of causality between financial development and economicgrowth has presumably run from the former to the latter in China; (3) the impacts induced by variousmeasures of financial system exert on economic growth are different, and the channels throughwhich they give impact on the growth are different as well; (4) the existence of inter-regional het-erogeneity in the context of China’s finance-growth nexus tends to be sensitive to the selection offinancial variables.
Keywords: financial development, economic growth, nexus, channel decomposition
*Postdoctoral fellow, International Center for Chinese Studies (ICCS), Aichi University.Correspondence: [email protected]
1. Introduction
It is now commonly accepted that fi-
nancial development exerts positive impact
on a country’s economic growth. However,
regarding Chinese case, the empirics have not
been able to provide unequivocal conclusions1.
This study aims to reassess the finance-
growth nexus debate in China. In particular,
the study emphasizes the channels through
which financial development effects Chinese
economic growth. We will propose an ana-
lytical framework which may overcome four
shortcomings observed in the literature, and
consequently make the attempt to give con-
clusive remarks on the finance-growth nexus
debate.
This study complements the literature in
the following four aspects. First, the study
論文
ICCS Journal of Modern Chinese Studies Vol.1 (1) 2009
52
addresses the issue of time span in the dis-
cussions of finance-growth relationship.
Secondly, the study systematically inves-
tigates the relationship between financial
development and two ‘primitive’ 2 compo-
nents of economic growth, namely physical
capital accumulation and efficiency improve-
ment. Since one primary drawback in growth
regressions is the lack of concern of causality,
the methodology at least to some extent ame-
liorates the concern. Thirdly, a broad range
of measures are included to capture various
aspects of China’s financial development
after 1978. Fourthly, in addition to the analysis
at the national level, the study also sheds
light on the inter-provincial heterogeneity of
finance-growth nexus by splitting the sample
provinces into two groups, i.e., coastal prov-
inces and inner provinces.
The remainder of the paper is organized as
follows. Section 2 provides a brief review of the
literature. The section goes further to address
several possible reasons causing the discrepan-
cies in the findings of previous empirical
studies. Section 3 presents our analytical
framework and the results of empirical investi-
gation. Exactly, the section adopts a methodol-
ogy called ‘channel decomposition exercise’3
which combines the accounting approach and
regression analysis. Finally, section 4 provides
the summary of the main findings.
2. Literature Review on Finance-Growth
Nexus
2.1 Finance-Growth Nexus: A Brief Review4
The efforts to identify the empirical
evidence of finance-growth relationship can
date back to the pioneering study of Gold-
smith (1969) 5 . Especially, huge empirical
studies have emerged since the 1990s. Put
briefly, those studies have mostly concluded
that financial development positively con-
tributes to the economic growth, although
more country-specific researches are required
to explain the heterogeneity across the coun-
tries. Those studies can be roughly divided
into two lines. While cross-country studies
usually start with the priori assumption that
finance influences growth, time series studies
are largely devoted to finding the causality
patterns suggested by Patrick (1966)’s
hypotheses6.
With respect to the cross-country studies,
influential works including King and Levine
(1993), Levine and Zervos (1998), Levine et
al (2000), Beck et al (2000), and Beck and
Levine (2004) provided strong evidence for
the positive relationship between financial
development and economic growth7. In ad-
dition, they found that the initial level of
financial development predicts the subse-
quent values of economic growth, capital
accumulation and productivity improvement.
However, Andersen and Tarp (2003), after
splitting the full cross-country sample used in
Levine et al (2000) into regional sub-samples,
found that the correlation is negative or
statistically insignificant in poorest countries
albeit significantly positive correlation in full
sample. Similarly, Ram (1999), using a sample
of 95 countries, found that despite the sig-
nificantly positive association between
ICCS Journal of Modern Chinese Studies Vol.1 (1) 2009
53
financial development and economic growth
in pooling data, the individual-country and
sub-sample cross-country analyses did not
support the evidence.
With respect to the time-series studies,
the empirics exerted substantial variations
across countries. Demetriades and Hussein
(1996), after examining the patterns of finance-
growth relationship in 16 countries, detected
a bidirectional causal relationship between
finance and growth in about half of the sample
countries, but unidirectional causal relation-
ship from growth to finance in others. The
consequent studies including Arestis and
Demetriades (1997), Luintel and Khan
(1999), Shan et al (2001) and Shan (2005)
also found various patterns of causality across
their sample countries8.
2.2 The Finance-Growth Nexus in China:
Divided Views
Recently, finance-growth nexus in
China has attracted much of the attention of
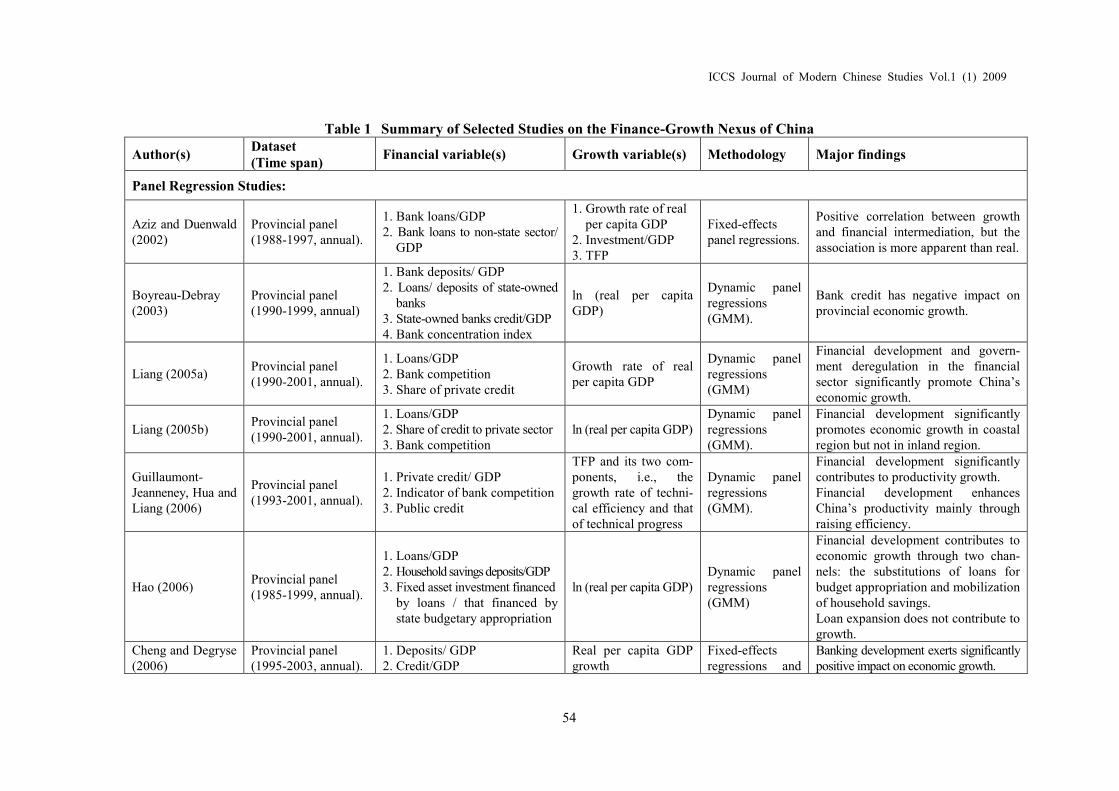
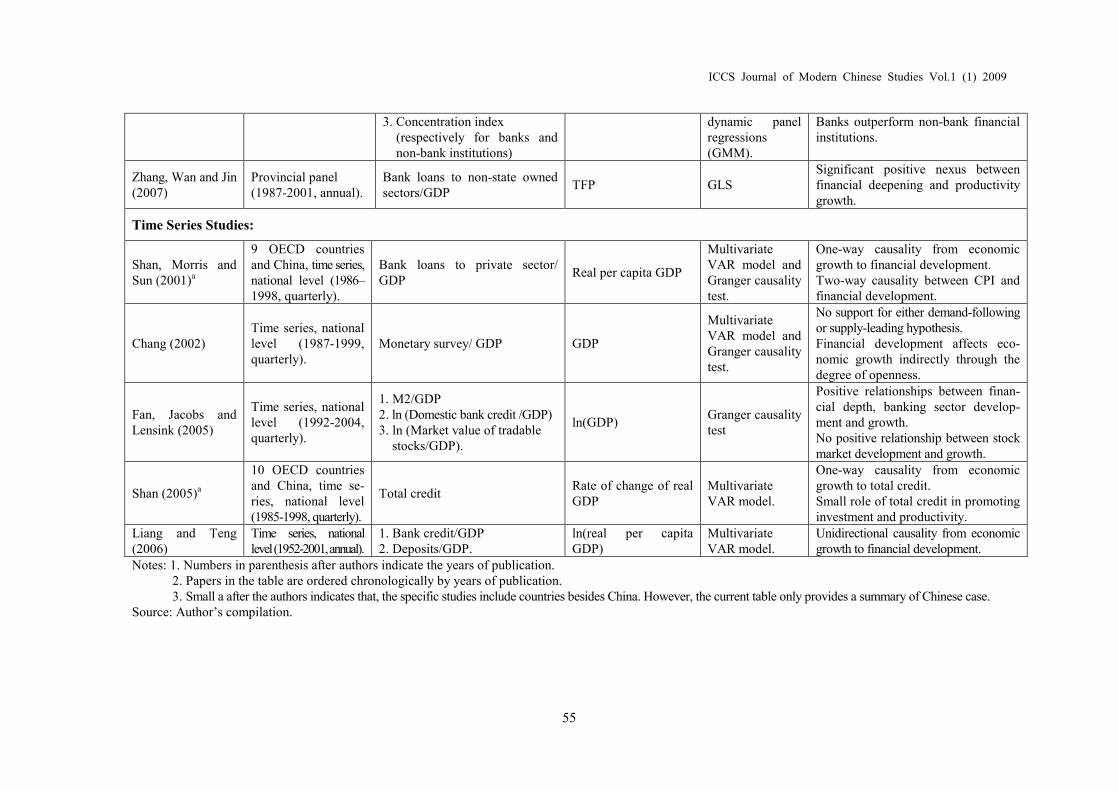
economists. Table 1 presents a summary of
selected studies regarding the debate. Obvi-
ously, the empirical evidence based on these
studies is inconclusive.
Similar to the cross-country studies, the
Chinese case studies have also applied two
approaches:
(1) Growth regressions based on the
panel datasets of Chinese provinces.
The studies applying this approach ran
regression models which incorporate the
indicator(s) of financial development as
additional explanatory variable(s) to ex-
plain various aspects of economic
growth. Dynamic panel techniques, es-
pecially GMM techniques, have been
frequently used in recent studies to con-
trol for the simultaneity bias. The con-
clusions of these studies showed mixed
picture. The early studies including Aziz
and Duenwald (2002) and Boyreau-Debray
(2003) found little support for the posi-
tive relationship between financial de-
velopment and economic growth in
China. The recent studies, on the other
hand, showed rather encouraging pictures.
(2) VAR model and Granger causality test.
Among the time-series studies, Shan et al
(2001), Chang (2002), Fan et al (2005)
and Shan (2005) used quarterly data
which covered a short time period,
mostly covering the period from late
1980s to late 1990s. The study of Liang
and Teng (2006) was an exception
which used annual data covering long
time period from 1952 to 2001. The re-
sults of these studies again are conflict-
ing. Shan et al (2001), Shan (2005) and
Liang and Teng (2006) found unidirec-
tional causality from economic growth
to financial development, while Chang
(2002) found neither direction of causality.
Meanwhile, Fan et al (2005) found the
feedback relations among financial
depth, banking sector development and
growth.
2.3 Sources of Discrepancies in the Empirics
As mentioned above, the empirics from
both cross-country studies and Chinese case
studies presented rather ambiguous pictures
ICCS Journal of Modern Chinese Studies Vol.1 (1) 2009
54
Table 1 Summary of Selected Studies on the Finance-Growth Nexus of China
Author(s)Dataset(Time span)
Financial variable(s) Growth variable(s) Methodology Major findings
Panel Regression Studies:
Aziz and Duenwald(2002)
Provincial panel(1988-1997, annual).
1. Bank loans/GDP2. Bank loans to non-state sector/
GDP
1. Growth rate of realper capita GDP
2. Investment/GDP3. TFP
Fixed-effectspanel regressions.
Positive correlation between growthand financial intermediation, but theassociation is more apparent than real.
Boyreau-Debray(2003)
Provincial panel(1990-1999, annual)
1. Bank deposits/ GDP2. Loans/ deposits of state-owned
banks3. State-owned banks credit/GDP4. Bank concentration index
ln (real per capitaGDP)
Dynamic panelregressions(GMM).
Bank credit has negative impact onprovincial economic growth.
Liang (2005a)Provincial panel(1990-2001, annual).
1. Loans/GDP2. Bank competition3. Share of private credit
Growth rate of realper capita GDP
Dynamic panelregressions(GMM)
Financial development and govern-ment deregulation in the financialsector significantly promote China’seconomic growth.
Liang (2005b)Provincial panel(1990-2001, annual).
1. Loans/GDP2. Share of credit to private sector3. Bank competition
ln (real per capita GDP)Dynamic panelregressions(GMM).
Financial development significantlypromotes economic growth in coastalregion but not in inland region.
Guillaumont-Jeanneney, Hua andLiang (2006)
Provincial panel(1993-2001, annual).
1. Private credit/ GDP2. Indicator of bank competition3. Public credit
TFP and its two com-ponents, i.e., thegrowth rate of techni-cal efficiency and thatof technical progress
Dynamic panelregressions(GMM).
Financial development significantlycontributes to productivity growth.Financial development enhancesChina’s productivity mainly throughraising efficiency.
Hao (2006)Provincial panel(1985-1999, annual).
1. Loans/GDP2. Household savings deposits/GDP3. Fixed asset investment financed
by loans / that financed bystate budgetary appropriation
ln (real per capita GDP)Dynamic panelregressions(GMM)
Financial development contributes toeconomic growth through two chan-nels: the substitutions of loans forbudget appropriation and mobilizationof household savings.Loan expansion does not contribute togrowth.
Cheng and Degryse(2006)
Provincial panel(1995-2003, annual).
1. Deposits/ GDP2. Credit/GDP
Real per capita GDPgrowth
Fixed-effectsregressions and
Banking development exerts significantlypositive impact on economic growth.
ICCS Journal of Modern Chinese Studies Vol.1 (1) 2009
55
3. Concentration index(respectively for banks andnon-bank institutions)
dynamic panelregressions(GMM).
Banks outperform non-bank financialinstitutions.
Zhang, Wan and Jin(2007)
Provincial panel(1987-2001, annual).
Bank loans to non-state ownedsectors/GDP
TFP GLSSignificant positive nexus betweenfinancial deepening and productivitygrowth.
Time Series Studies:
Shan, Morris andSun (2001)a
9 OECD countriesand China, time series,national level (1986–1998, quarterly).
Bank loans to private sector/GDP
Real per capita GDP
MultivariateVAR model andGranger causalitytest.
One-way causality from economicgrowth to financial development.Two-way causality between CPI andfinancial development.
Chang (2002)Time series, nationallevel (1987-1999,quarterly).
Monetary survey/ GDP GDP
MultivariateVAR model andGranger causalitytest.
No support for either demand-followingor supply-leading hypothesis.Financial development affects eco-nomic growth indirectly through thedegree of openness.
Fan, Jacobs andLensink (2005)
Time series, nationallevel (1992-2004,quarterly).
1. M2/GDP2. ln (Domestic bank credit /GDP)3. ln (Market value of tradable
stocks/GDP).
ln(GDP)Granger causalitytest
Positive relationships between finan-cial depth, banking sector develop-ment and growth.No positive relationship between stockmarket development and growth.
Shan (2005)a
10 OECD countriesand China, time se-ries, national level(1985-1998, quarterly).
Total creditRate of change of realGDP
MultivariateVAR model.
One-way causality from economicgrowth to total credit.Small role of total credit in promotinginvestment and productivity.
Liang and Teng(2006)
Time series, nationallevel(1952-2001,annual).
1. Bank credit/GDP2. Deposits/GDP.
ln(real per capitaGDP)
MultivariateVAR model.
Unidirectional causality from economicgrowth to financial development.
Notes: 1. Numbers in parenthesis after authors indicate the years of publication.2. Papers in the table are ordered chronologically by years of publication.3. Small a after the authors indicates that, the specific studies include countries besides China. However, the current table only provides a summary of Chinese case.
Source: Author’s compilation.
ICCS Journal of Modern Chinese Studies Vol.1 (1) 2009
56
regarding finance-growth debate. These dis-
crepancies in the empirical findings might be
caused by various reasons. Here, we address
following four reasons which presumably
cause the discrepancies. Note that the current
discussions are common for both cross-country
studies and Chinese case studies, and our
analytical framework will be designed to
overcome the problems.
First, the lack of concern about the time
span makes it difficult to distinguish long-run
and short-run dimensions in the context of
finance-growth nexus.
In the literature, economic growth vari-
ables have been selected rather arbitrarily.
Some authors use level terms, whilst some
others use growth terms. Luintel and Khan
(1999), in a sample of ten countries, found
that there is a negative correlation between
the financial indicator and the growth rate of
real per capita income in seven out of ten
countries. In contrast, they found that there is
strong positive correlation between the same
financial indicator and the level of real per
capita income in all sample countries9. They
consequently concluded that the relationship
between financial development and economic
growth tends to be a long-run one.
Secondly, the results from two different
approaches, i.e., growth regression approach
and causality approach, connote different
interpretations on the relationship between
financial development and economic growth.
The selection of either approach is difficult
to be fully justified.
Compared to the causality approach, the
growth regression approach stresses on the
deduction of economic theory rather than
pure statistical evidence. However, in the
case of growth regressions, the question of
directions of causality is largely unanswered
because they usually impose the predetermined
assumption of a causal relationship running
from financial development to economic
growth. In contrast, the causality approach
makes allowance for the reverse causality as
well. Certainly, the approach often bears the
criticism of lacking sound theoretical back-
ground. Moreover, it is questionable whether
the causality observed in the statistical sense
can be interpreted as the causality in our
common sense or not.
Thirdly, regarding the definition of fi-
nancial variables, on the one hand, any single
indicator may not capture various aspects of
financial development; on the other hand, in
country-specific studies, indicators commonly
used in the cross-country studies may not
reflect country-specific features which vary
across countries.
Since Goldsmith (1969), economists have
constructed various indicators for financial
development10. However, as pointed out by
Demirguc-Kunt and Levine (2008: 3), designing
good empirical proxies of financial development
still represents a valuables area for future
research. Meanwhile, in single country case
such as China, its financial development
process bears specific features11. It is hence
questionable whether the indicators used in
cross-country studies could capture those
country-specific features well or not. As seen
ICCS Journal of Modern Chinese Studies Vol.1 (1) 2009
57
in the Chinese literature, efforts have been
made to construct appropriate measures
which reflect the Chinese features of financial
development.
Fourthly, the finance-growth debate to
date has rarely addressed the issue at
sub-national level. However, recent researches
suggest the existence of inter-regional hetero-
geneity within a country.
Guiso et al (2002) argued that even in
an economy with integrated financial market,
local financial development is still an impor-
tant determinant of the local economic
growth. After studying the case of Italy,
wherein no frictions of capital movement,
they found that economic activities in a certain
region are strongly affected by the level of
financial development in the region albeit
weaker effects for larger firms. Alternatively,
in another study of China, Liang (2005b)
found that financial development significantly
contributes to the economic growth in coastal
region but not in the inland regions. His
study suggested that, in China, financial
functions provided by the financial sector
might vary across the regions although the
structure and the size of financial sector are
essentially same.
3. Finance-Growth Nexus in China: Channel
Decomposition Exercise
Our empirical analysis builds on an ag-
gregate production function framework. The
hypothesis is that financial development is
one of the fundamental factors which indirectly
give impact on economic growth through two
channels, namely, physical capital accumulation
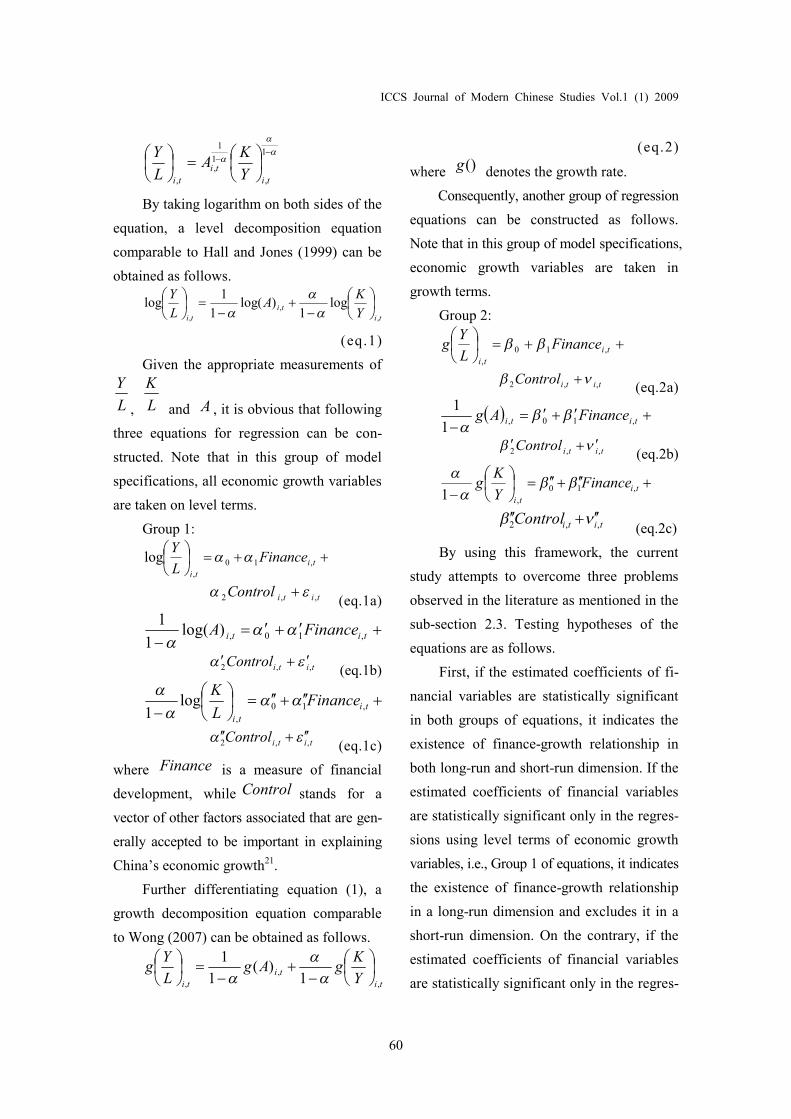
and productivity improvement. Figure 1 pre-
sents the conceptual framework for empirical
analysis12.
Figure 1 Finance-Growth Nexus: A
Framework
Financial Development
Productivity
Improvement
Physical Capital
Accumulation
Economic Growth
Source: Author’s compilation.
In the literature, it is well-documented
that financial development gives impact on
economic growth mainly through two channels,
namely, physical capital accumulation and
productivity improvement13. Once these two
channels are accounted for, the overall impact
of financial development on economic
growth turns out to be ambiguous14.
With respect to the first channel, the
impact is complicated and ambiguous. Cer-
tainly, financial development may facilitate
the process of agglomerating small savings
from scattering savers and channeling them
to corporate sector. The corporate sector in
turn may use the capital for physical invest-
ment. This increases the volume of resources
available to finance investment15. However,
financial development may raise or reduce
the savings rate. On the one hand, increase of
the liquidity, ease of access and inter-temporal
risk sharing may make financial assets more
attractive instruments for savings. In addition,
better financial services may encourage sav-
ICCS Journal of Modern Chinese Studies Vol.1 (1) 2009
58
ings by raising the returns to savings. On the
other hand, since the savers can achieve their
target stocks of wealth at a lower savings rate,
higher interest rates which raise the returns
to savings may lower savings rate.
With respect to the second channel, it is
obvious that financial development can pro-
mote efficient capital allocation by lowering
information costs, identifying promising in-
vestment and facilitating corporate govern-
ance, which in turn leads to the productivity
improvement. On the one hand, financial
development reduces the costs of collecting
and processing information. Before providing
finance, a well-functioning financial system
can produce ex ante information about the
investment at lower costs than individual
investors. Consequently, financial development
furthers technological innovation by facilitat-
ing the allocation of capital to the investors
(projects) who (which) have the best chances
to be successful in the future. On the other hand,
after providing finance, a well-functioning
financial system can exert ex post corporate
governance by monitoring the activities of
borrowers. Financial development conse-
quently ensures the efficient uses of capital
and makes savers more willing to finance
production and innovation.
3.1 Framework for Empirical Analysis
Our empirical analysis adopts a method-
ology termed by Wong (2007), i.e., channel
decomposition exercise. The methodology
involves two steps: first, applying accounting
approach to decompose the economic growth
into two components, i.e., the contribution
from physical capital accumulation and the
contribution from the improvement of total
factor productivity; secondly, regressing the
growth variable and its two components on
the fundamental determinants of growth
including financial development. The dif-
ferentiation between the overall impact on
economic growth and the decomposed impacts
on two components makes it possible to
explore the channels through which the
fundamental determinants effect on economic
growth. Note that the focus determinant in
the context of this analysis is financial
development albeit some other determinants
are also included to control for the unspecified
influences from a vector of other factors.
Literature Review of Channel Decomposition
The idea analogous to the channel
decomposition can be found in previous
studies although it was recently termed by
Wong (2007). For instance, Fisher (1993)
and Bosworth et al (1995) examined the
channels through which various determinants
impact on economic growth16. In finance-
growth literature, as early as King and Levine
(1993), the channels of capital accumulation
and productivity growth have been addressed.
Similar examinations have been frequently
highlighted in the consequent literature. Es-
pecially, Rioja and Valve (2004) and Ben-
hanbib and Spiegel (2000) are worth men-
tioning. The former found that channels
through which finance affects growth vary
among countries at the different stages of
economic development, i.e., in rich countries,
finance boosts growth mainly through pro-
ICCS Journal of Modern Chinese Studies Vol.1 (1) 2009
59
ductivity improvement, while in poorer
countries, mainly through capital accumulation.
The latter found that factor accumulation and
productivity improvement channels exist
contemporaneously although the two were
associated with different financial indicators17.
These aforementioned studies distinguished
the primitive determinants from the fundamental
determinants of economic growth. Consequently,
they addressed the impacts of fundamental
determinants on growth running through the
channels of primitives. However, these studies
did not systematically decompose the overall
impact of fundamental determinants on
growth into the impacts running through the
primitives. In contrast, Hall and Jones (1999),
Frankel and Romer (1999) and Wong (2007)
provided the ideas of decomposition exercises.
With the purpose to investigate the
effects of social infrastructure on economic
growth, Hall and Jones (1999) decomposed
the output per worker into the contributions
from factor accumulation and productivity
improvement. The components of economic
growth were then regressed on the indicator
of social infrastructure18. Frankel and Romer
(1999) adopted the same decomposition
method as Hall and Jones (1999) to examine
the effects of trade on economic growth and its
component 19 . Alternatively, Wong (2007)
followed the standard growth accounting
framework in which the growth rate of out-
put per worker was decomposed into the
contributions from the growth of physical
capital accumulation, growth of human capi-
tal accumulation and TFP growth. They
were then regressed on a set of fundamental
determinants20. Note that the decomposition
approach of Hall and Jones (1999) was per-
formed on levels, and the consequent regres-
sion analyses were conducted using level
terms of growth variables. While, the decom-
position approach of Wong (2007) was per-
formed on growth, and the consequent regres-
sion analyses were conducted using growth
terms of growth variables. Accordingly, the
approaches of Wong (2007) and Hall and
Jones (1999) differ from each other in
whether the analysis is conducted on levels
terms or on growth terms.
Framework for Current Analysis
Combining Wong (2007) and Hall and
Jones (1999)’s approaches, this current study
proposes a framework which conducts the
decomposition of output on both level and
growth terms.
Consider a simple Cobb-Douglas produc-
tion function of constant returns to scale as
follows. 1
,,,, titititi LKAY
where K and L are physical capital and
labor, A is an overall efficiency factor
including not only the technological progress
but also efficiency improvement induced by
institutional factors, whereas subscript i
and t stands for province and time respectively.
This aggregate production function is assumed
to be common across provinces and over
whole sample period.
With simple manipulation, it is possible
to rearrange the above production function
as:
ICCS Journal of Modern Chinese Studies Vol.1 (1) 2009
60
1
,
1
1
,
, ti
ti
ti Y
KA
L
Y
By taking logarithm on both sides of the
equation, a level decomposition equation
comparable to Hall and Jones (1999) can be
obtained as follows.
ti
ti
ti Y
KA
L
Y
,
,
,
log1
)log(1
1log
(eq.1)
Given the appropriate measurements of
L
Y
, L
K
and A , it is obvious that following
three equations for regression can be con-
structed. Note that in this group of model
specifications, all economic growth variables
are taken on level terms.
Group 1:
ti
ti
FinanceL
Y,10
,
log
titiControl ,,2 (eq.1a)
titi FinanceA ,10,)log(1
1
titiControl ,,2 (eq.1b)
ti
ti
FinanceL
K,10
,
log1
titiControl ,,2 (eq.1c)
where Finance is a measure of financial
development, while Control stands for a
vector of other factors associated that are gen-
erally accepted to be important in explaining
China’s economic growth21.
Further differentiating equation (1), a
growth decomposition equation comparable
to Wong (2007) can be obtained as follows.
ti
ti
ti Y
KgAg
L
Yg
,
,
, 1)(
1
1
(eq.2)
where ()g denotes the growth rate.
Consequently, another group of regression
equations can be constructed as follows.
Note that in this group of model specifications,
economic growth variables are taken in
growth terms.
Group 2:
ti
ti
FinanceL
Yg ,10
,
titiControl ,,2 (eq.2a)
titi FinanceAg ,10,1
1
titiControl ,,2 (eq.2b)
ti
ti
FinanceY
Kg ,10
,1
titiControl ,,2 (eq.2c)
By using this framework, the current
study attempts to overcome three problems
observed in the literature as mentioned in the
sub-section 2.3. Testing hypotheses of the
equations are as follows.
First, if the estimated coefficients of fi-
nancial variables are statistically significant
in both groups of equations, it indicates the
existence of finance-growth relationship in
both long-run and short-run dimension. If the
estimated coefficients of financial variables
are statistically significant only in the regres-
sions using level terms of economic growth
variables, i.e., Group 1 of equations, it indicates
the existence of finance-growth relationship
in a long-run dimension and excludes it in a
short-run dimension. On the contrary, if the
estimated coefficients of financial variables
are statistically significant only in the regres-
ICCS Journal of Modern Chinese Studies Vol.1 (1) 2009
61
sions using growth terms of economic
growth variables, i.e., Group 2 of equations,
it indicates the existence of finance-growth
relationship in a short-run dimension and
excludes it in a long-run dimension22.
Secondly, if the estimated coefficients
of financial variables on two channels are
statistically significant, we may conclude that
physical capital accumulation and productivity
improvement are two viable channels through
which finance gives impact on growth.
Furthermore, if the estimated coefficients of
financial variables on growth are statistically
significant only when the estimated coeffi-
cients of financial variables on both or either
of two channels are statistically significant,
we may conclude that the direction of cau-
sality between financial development and
economic growth most possibly runs from
the former to the latter.
Thirdly, the estimations will be con-
ducted at both national and sub-national levels.
In the estimations carried out at sub-national
level, all sample provinces are classified into
two groups, i.e., costal provinces and inner
provinces23. If the signs and values of esti-
mated coefficients of financial variables vary
across two groups of provinces at the
sub-national level, it suggests the existence
of the heterogeneity of finance-growth rela-
tionship across Chinese regions. If they are
common over two groups of sample provinces,
it suggests the non-existence of the hetero-
geneity.
3.2 Description and Sources of Data
The dataset used in this study applies to
1980-2004 period24 and contains 26 Chinese
provinces (or provincial-level autonomous
regions and municipalities). Hainan, Chongqing,
Sichuan, Xizang (Tibet) and Qinghai are ex-
cluded from the sample due to missing data.
For the set of sample provinces, data are
available for all variables. Hence the estima-
tions reported in sub-section 3.3 are carried
out with balanced panel dataset. The original
data to construct the variables are collected
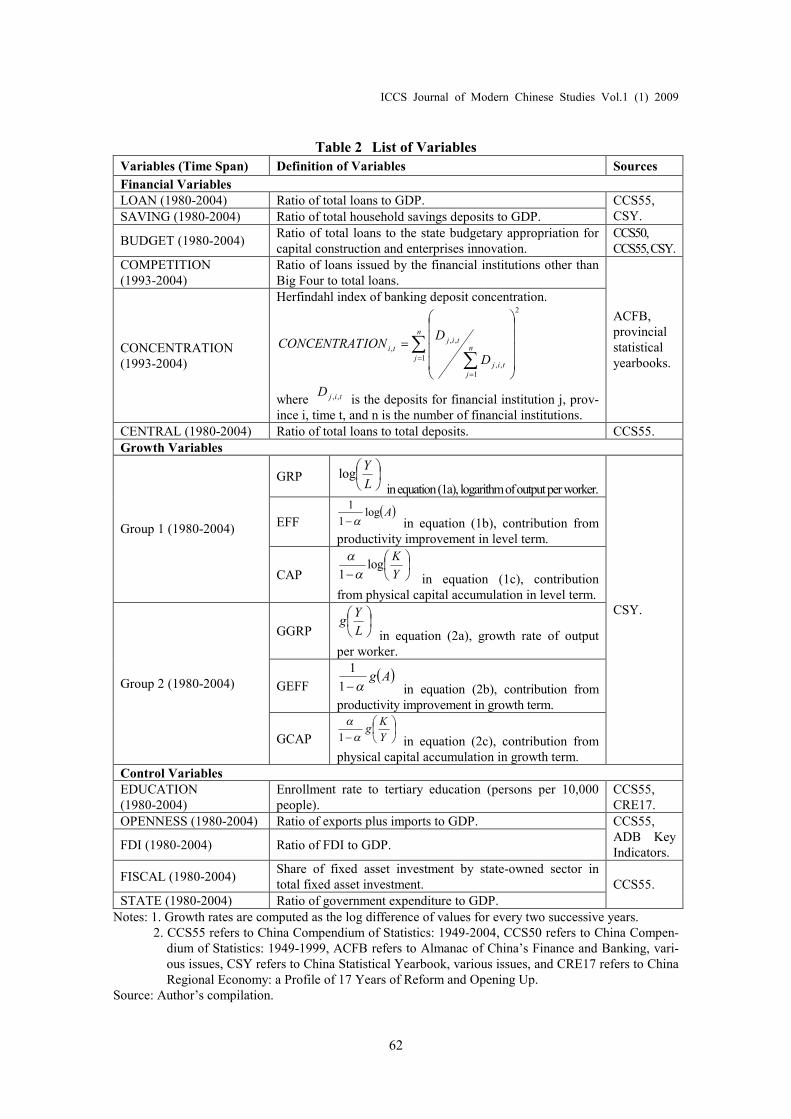
from officially published statistics. Table 2
provides the detailed definition of variables
and statistical sources.
Indicators of Financial Development
In order to overcome the problem of
indicator selection with respect to the finan-
cial development, we include six financial
variables which represent various aspects of
financial development in China. These six
financial variables can be classified into two
groups based on the connotations of financial
development. LOAN, SAVING and
BUDGET capture the process of financial
development from the perspective of the
expansion of quantity of financial sector in
providing financial services, while the other
three capture the process of financial devel-
opment from the perspective of the changes
of quality of financial sector in providing
financial services.
The six financial variables are con-
structed based on the literature.
(1) LOAN, SAIVNG and BUDGET are
computed following Hao(2006). He
argued that financial development in
China after 1978 has been featured by
ICCS Journal of Modern Chinese Studies Vol.1 (1) 2009
62
Table 2 List of Variables
Variables (Time Span) Definition of Variables Sources
Financial VariablesLOAN (1980-2004) Ratio of total loans to GDP.SAVING (1980-2004) Ratio of total household savings deposits to GDP.
CCS55,CSY.
BUDGET (1980-2004)Ratio of total loans to the state budgetary appropriation forcapital construction and enterprises innovation.
CCS50,CCS55,CSY.
COMPETITION(1993-2004)
Ratio of loans issued by the financial institutions other thanBig Four to total loans.
CONCENTRATION(1993-2004)
Herfindahl index of banking deposit concentration.2
1
1,,
,,,
n
j
n
jtij
tijti
D
DIONCONCENTRAT
where tijD ,, is the deposits for financial institution j, prov-ince i, time t, and n is the number of financial institutions.
ACFB,provincialstatisticalyearbooks.
CENTRAL (1980-2004) Ratio of total loans to total deposits. CCS55.Growth Variables
GRP
L
Ylog
inequation(1a), logarithmofoutputperworker.
EFF Alog
1
1
in equation (1b), contribution fromproductivity improvement in level term.
Group 1 (1980-2004)
CAP
Y
Klog
1
in equation (1c), contributionfrom physical capital accumulation in level term.
GGRP
L
Yg
in equation (2a), growth rate of outputper worker.
GEFF Ag
1
1
in equation (2b), contribution fromproductivity improvement in growth term.
Group 2 (1980-2004)
GCAP
Y
Kg
1 in equation (2c), contribution fromphysical capital accumulation in growth term.
CSY.
Control VariablesEDUCATION(1980-2004)
Enrollment rate to tertiary education (persons per 10,000people).
CCS55,CRE17.
OPENNESS (1980-2004) Ratio of exports plus imports to GDP.
FDI (1980-2004) Ratio of FDI to GDP.
CCS55,ADB KeyIndicators.
FISCAL (1980-2004)Share of fixed asset investment by state-owned sector intotal fixed asset investment.
STATE (1980-2004) Ratio of government expenditure to GDP.CCS55.
Notes: 1. Growth rates are computed as the log difference of values for every two successive years.2. CCS55 refers to China Compendium of Statistics: 1949-2004, CCS50 refers to China Compen-
dium of Statistics: 1949-1999, ACFB refers to Almanac of China’s Finance and Banking, vari-ous issues, CSY refers to China Statistical Yearbook, various issues, and CRE17 refers to ChinaRegional Economy: a Profile of 17 Years of Reform and Opening Up.
Source: Author’s compilation.
ICCS Journal of Modern Chinese Studies Vol.1 (1) 2009
63
three main aspects: first, loan expan-
sion; secondly, mobilization of
household savings; and thirdly, sub-
stitution of loans for state budget
appropriation as the primary source
of external financing. The three vari-
ables are respectively computed to
capture these three aspects25.
(2) COMPETITION is computed fol-
lowing Liang (2005a and 2005b)
and Guillaumont- Jeanneney et al.
(2006). The variable reflects the de-
gree of competition in the financial
sector.
(3) CONCENTRATION and CENTRAL
are constructed following Boyreau-
Debray (2003) 26 . The former ac-
counts for the structure of banking
sector in the provinces27, while the
latter accounts for the intervention
by central bank in loan extension
practices28.
Indicators of Economic Growth and its
Components
This study includes two groups of eco-
nomic growth indicators, three for each. In
order to obtain appropriate measurements of
the growth variables, capital stock series for
each province are constructed first, and then
two proxies of productivity improvement are
computed as the residuals respectively from
equation (1) and (2).
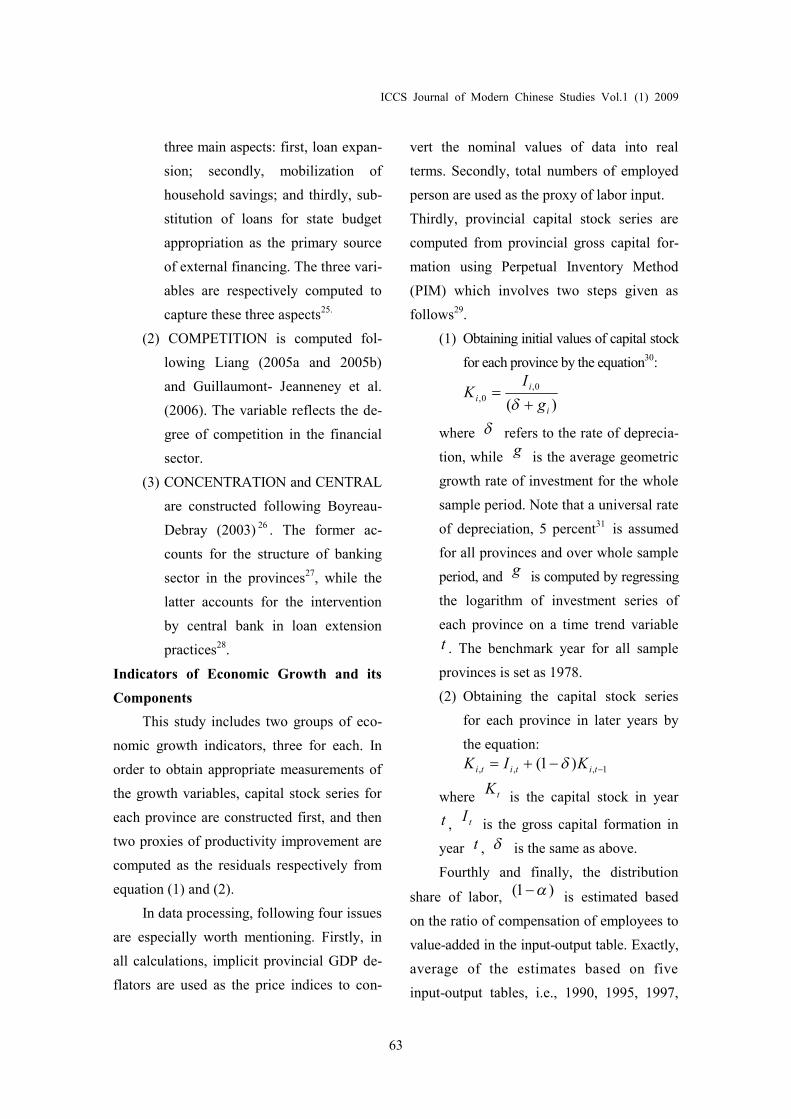
In data processing, following four issues
are especially worth mentioning. Firstly, in
all calculations, implicit provincial GDP de-
flators are used as the price indices to con-
vert the nominal values of data into real
terms. Secondly, total numbers of employed
person are used as the proxy of labor input.
Thirdly, provincial capital stock series are
computed from provincial gross capital for-
mation using Perpetual Inventory Method
(PIM) which involves two steps given as
follows29.
(1) Obtaining initial values of capital stock
for each province by the equation30:
)(
0,
0,
i
i
ig
IK
where refers to the rate of deprecia-
tion, while g is the average geometric
growth rate of investment for the whole
sample period. Note that a universal rate
of depreciation, 5 percent31 is assumed
for all provinces and over whole sample
period, and g is computed by regressing
the logarithm of investment series of
each province on a time trend variable
t . The benchmark year for all sample
provinces is set as 1978.
(2) Obtaining the capital stock series
for each province in later years by
the equation:
1,,, )1( tititi KIK
where tKis the capital stock in year
t , tIis the gross capital formation in
year t , is the same as above.
Fourthly and finally, the distribution
share of labor, )1( is estimated based
on the ratio of compensation of employees to
value-added in the input-output table. Exactly,
average of the estimates based on five
input-output tables, i.e., 1990, 1995, 1997,
ICCS Journal of Modern Chinese Studies Vol.1 (1) 2009
64
2000 and 2002 input-output tables, is used in
the data processing32. It gives the share of
0.493 which is regarded as common for all
provinces and over the whole sample period.
3.3 Regression Results
This sub-section reports the regression
results of Group 1 of equations (in level
terms). Table 3 presents the regression results
for the panel covering all sample provinces.
Table 4 presents the corresponding results
for two sub-samples (coastal and inner prov-
inces). Our analysis starts by estimating three
equations for the sample including all prov-
inces (entire sample). The same estimations
are then carried out for each of two
sub-samples, i.e., coastal provinces and inner
provinces. In addition, as explained above,
the main aim of this study is to empirically
investigate the channels through which
post-1978 financial development influences
the economic growth in China. Therefore, the
estimations are conducted to include GRP,
i.e., economic growth indicator as the de-
pendent variable first, which followed by the
estimations to explore the effects of financial
indicators respectively on two channels
(CAP and EFF). It is worthy to note that: (1)
six financial indicators are included one at a
time to avoid the collinearity of explanatory
variables; (2) in order to test the robustness
of coefficient estimates of financial variables
over various model specifications, three
different methods of panel estimation in-
cluding common constant method (pooled
OLS method), fixed effects method and
random effects method, are adopted.
These estimation results are of our
interest in the following four respects.
First, the regression results are sensitive to
the selection of growth variables. Specifically,
financial variables are significantly associated
with the level terms of growth variables
while insignificantly associated with the
growth terms. Therefore, the relationship
between financial development and economic
growth in China tends to be a long-run one.
Table 3 and Table 4 show that the coef-
ficient estimates of financial variables are
statistically significant over model specifica-
tions and different estimation methods. It
implies the existence of a relationship between
financial development and economic growth
in a long-run dimension. However, with respect
to the Group 2 of equations, the estimated
coefficients of financial variables are not
statistically significant in almost all model
specifications. It implies that financial de-
velopment has not been able to generate
impacts on economic growth in a short run.
The fact that a significant association between
the financial variables and the level terms of
growth variables contemporaneously exists
with an insignificant association between the
financial variables and the growth terms of
growth variables suggests that the relation-
ship between financial development and
economic growth is a log-run one in China33.
Secondly, the empirical evidence sug-
gests the existence of two channels, i.e.,
physical capital accumulation and productivity
improvement. The direction of causality
between financial development and economic
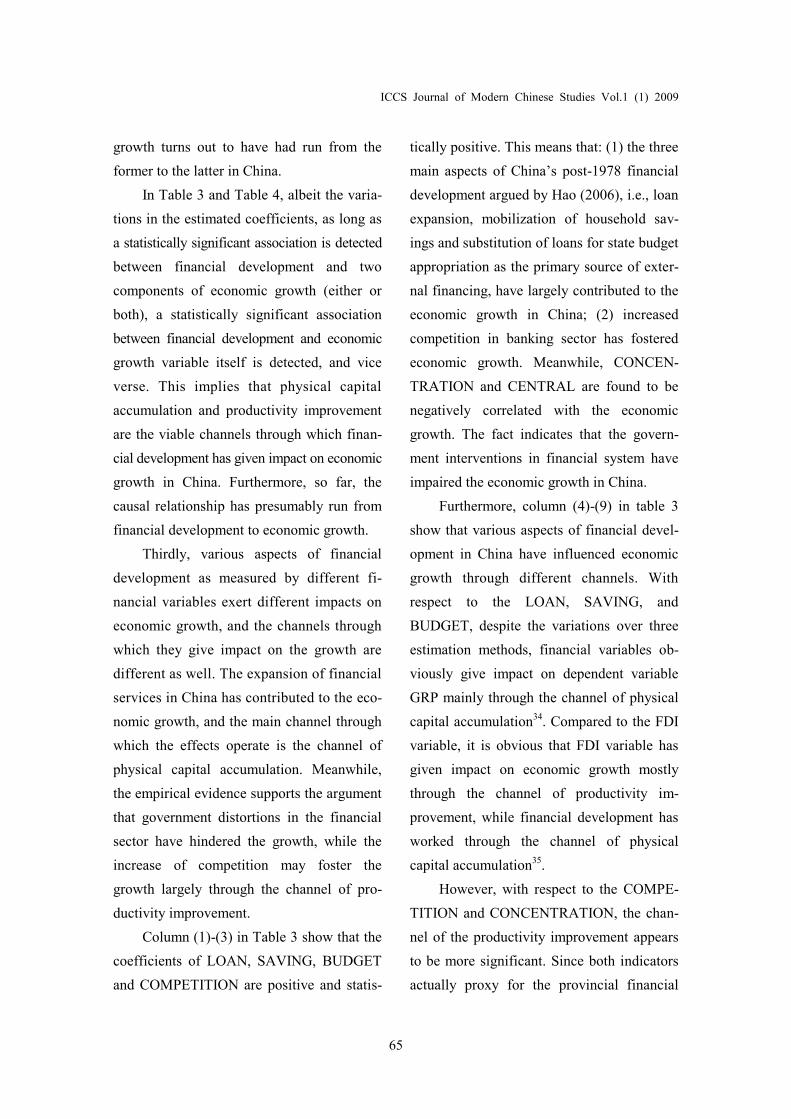
ICCS Journal of Modern Chinese Studies Vol.1 (1) 2009
65
growth turns out to have had run from the
former to the latter in China.
In Table 3 and Table 4, albeit the varia-
tions in the estimated coefficients, as long as
a statistically significant association is detected
between financial development and two
components of economic growth (either or
both), a statistically significant association
between financial development and economic
growth variable itself is detected, and vice
verse. This implies that physical capital
accumulation and productivity improvement
are the viable channels through which finan-
cial development has given impact on economic
growth in China. Furthermore, so far, the
causal relationship has presumably run from
financial development to economic growth.
Thirdly, various aspects of financial
development as measured by different fi-
nancial variables exert different impacts on
economic growth, and the channels through
which they give impact on the growth are
different as well. The expansion of financial
services in China has contributed to the eco-
nomic growth, and the main channel through
which the effects operate is the channel of
physical capital accumulation. Meanwhile,
the empirical evidence supports the argument
that government distortions in the financial
sector have hindered the growth, while the
increase of competition may foster the
growth largely through the channel of pro-
ductivity improvement.
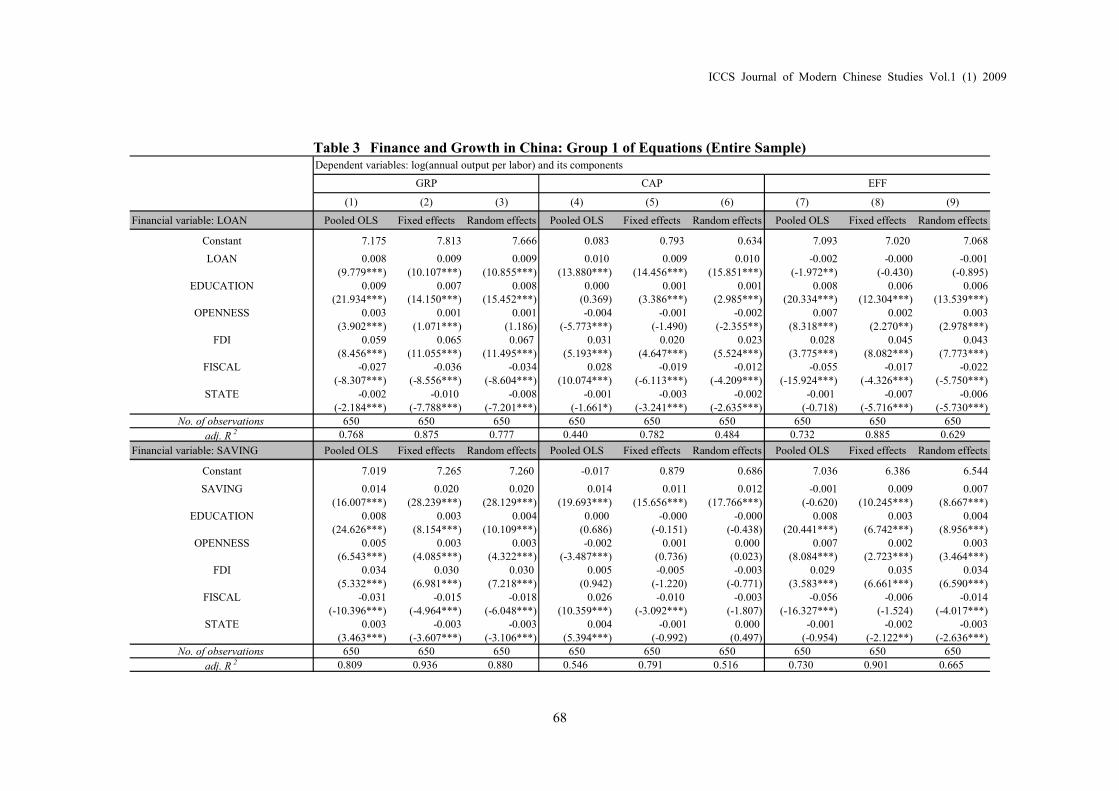
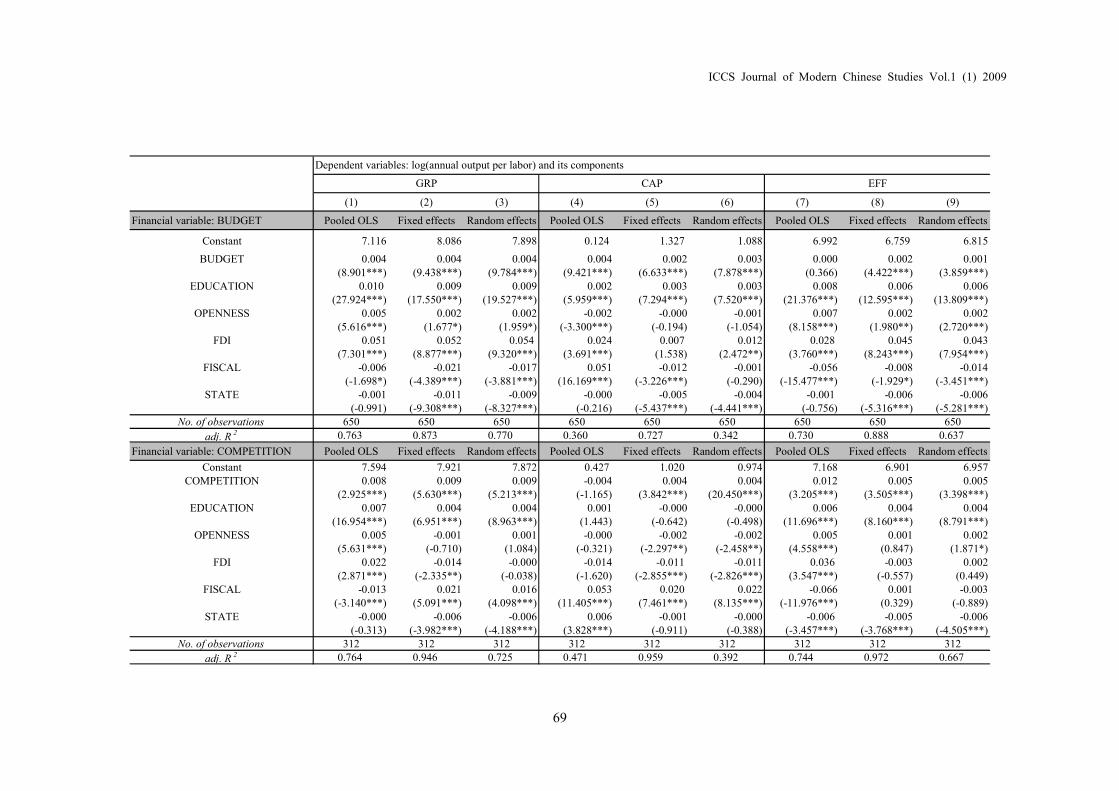
Column (1)-(3) in Table 3 show that the
coefficients of LOAN, SAVING, BUDGET
and COMPETITION are positive and statis-
tically positive. This means that: (1) the three
main aspects of China’s post-1978 financial
development argued by Hao (2006), i.e., loan
expansion, mobilization of household sav-
ings and substitution of loans for state budget
appropriation as the primary source of exter-
nal financing, have largely contributed to the
economic growth in China; (2) increased
competition in banking sector has fostered
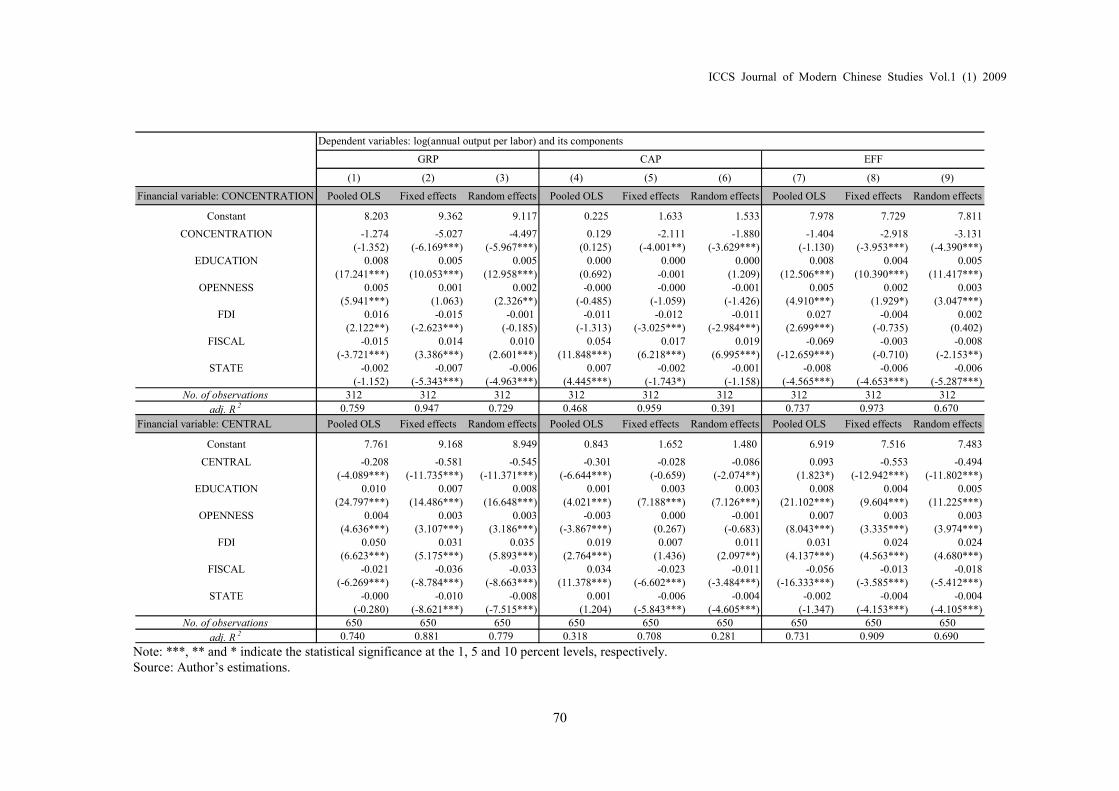
economic growth. Meanwhile, CONCEN-
TRATION and CENTRAL are found to be
negatively correlated with the economic
growth. The fact indicates that the govern-
ment interventions in financial system have
impaired the economic growth in China.
Furthermore, column (4)-(9) in table 3
show that various aspects of financial devel-
opment in China have influenced economic
growth through different channels. With
respect to the LOAN, SAVING, and
BUDGET, despite the variations over three
estimation methods, financial variables ob-
viously give impact on dependent variable
GRP mainly through the channel of physical
capital accumulation34. Compared to the FDI
variable, it is obvious that FDI variable has
given impact on economic growth mostly
through the channel of productivity im-
provement, while financial development has
worked through the channel of physical
capital accumulation35.
However, with respect to the COMPE-
TITION and CONCENTRATION, the chan-
nel of the productivity improvement appears
to be more significant. Since both indicators
actually proxy for the provincial financial
ICCS Journal of Modern Chinese Studies Vol.1 (1) 2009
66
structures, the results suggest that increased
competition in financial sector might help
improve the efficiency of resource allocation,
and consequently contribute to the economic
growth. Finally, with respect to CENTRAL,
although the overall impact on GRP is
significantly negative, the decomposed impacts
on CAP and EFF are ambiguous. It is thus
difficult to distinguish relatively more sig-
nificant channel36.
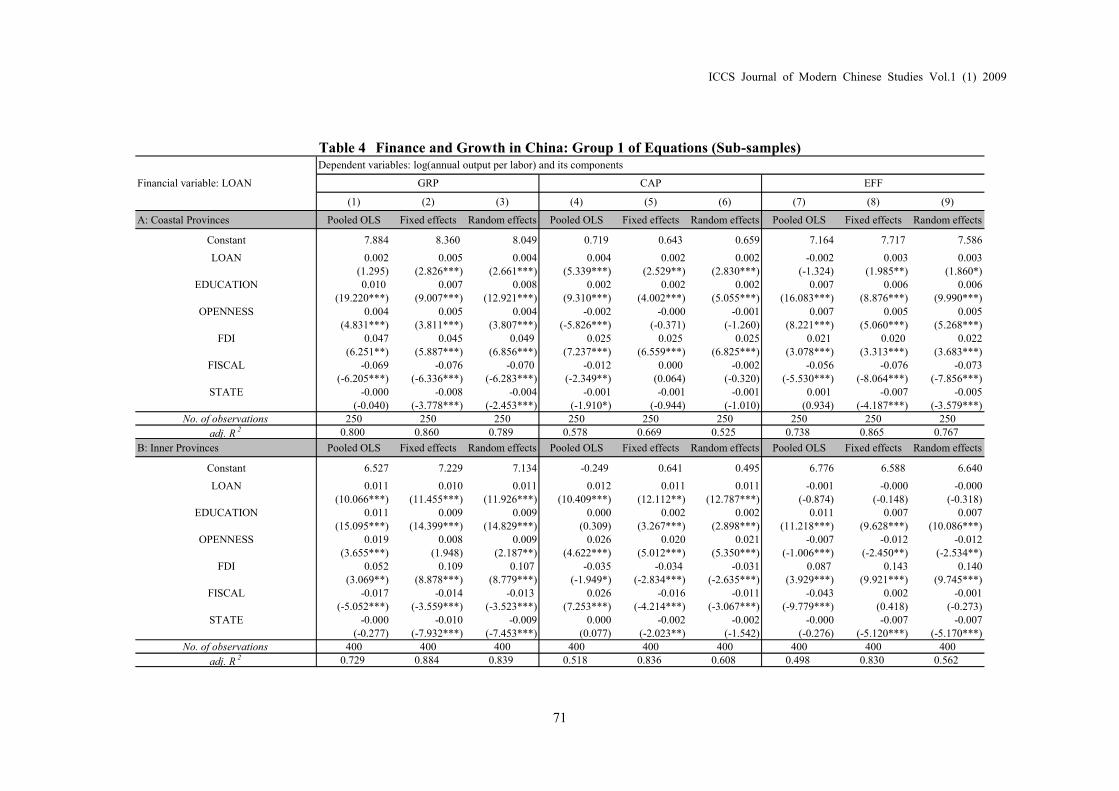
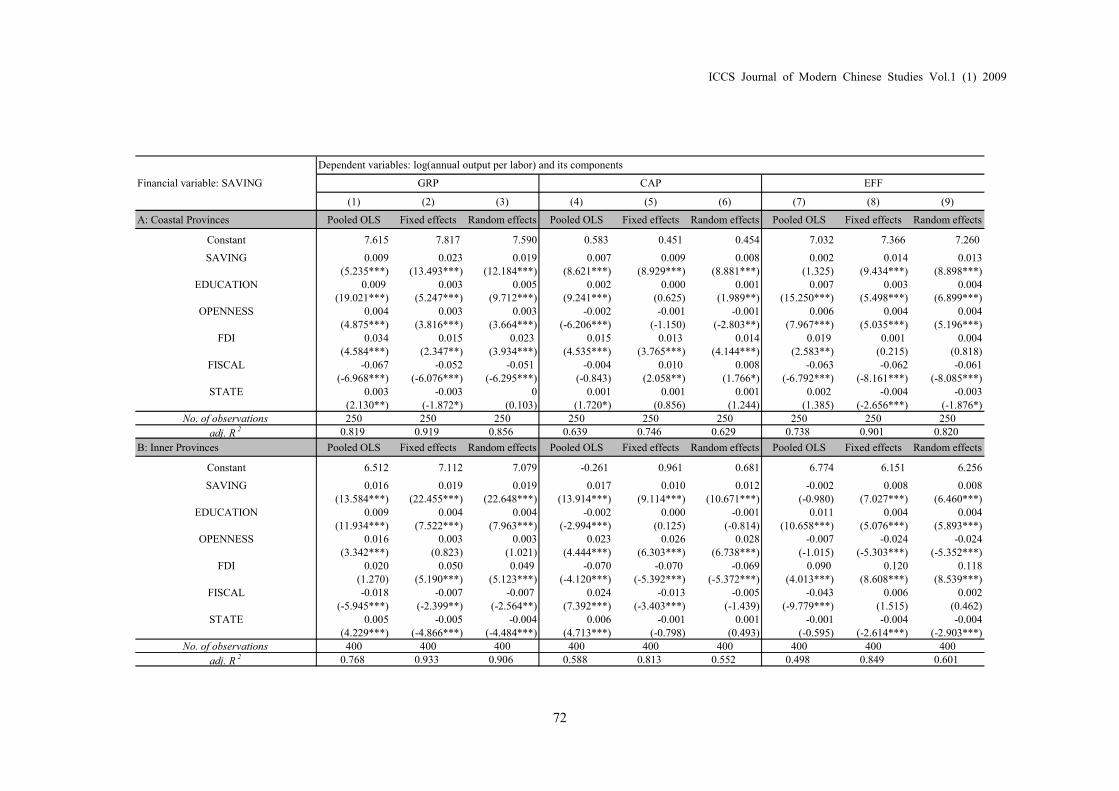
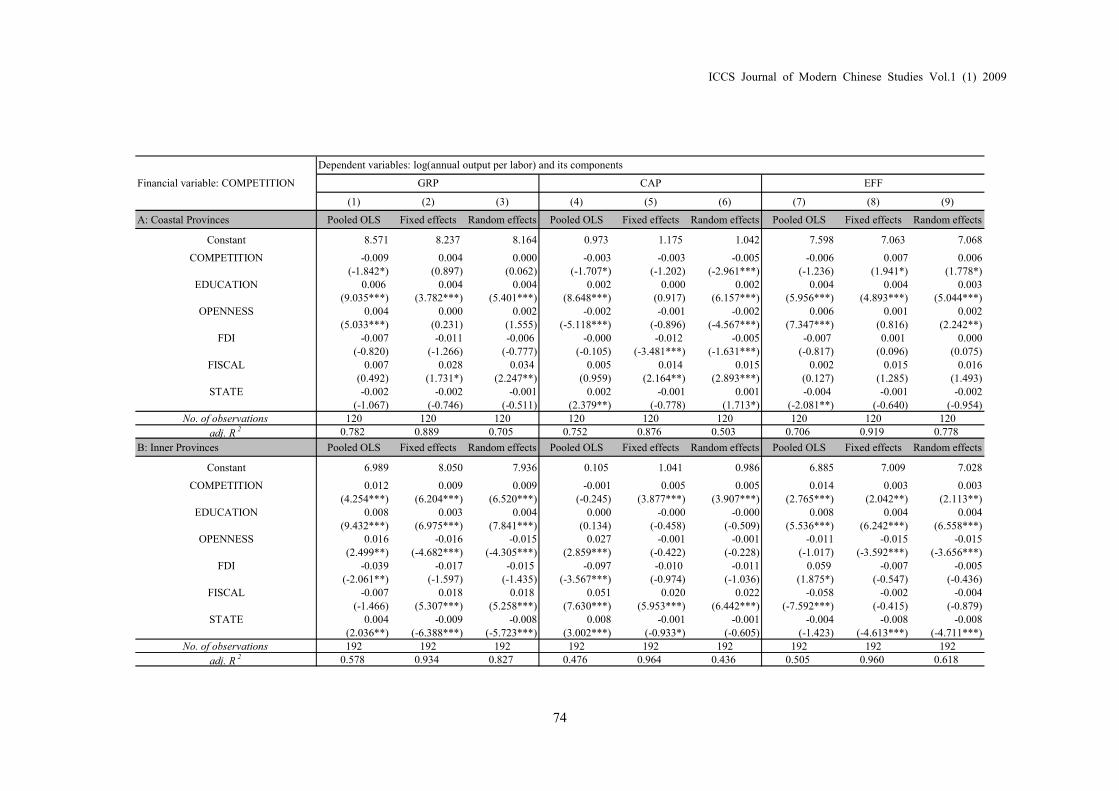
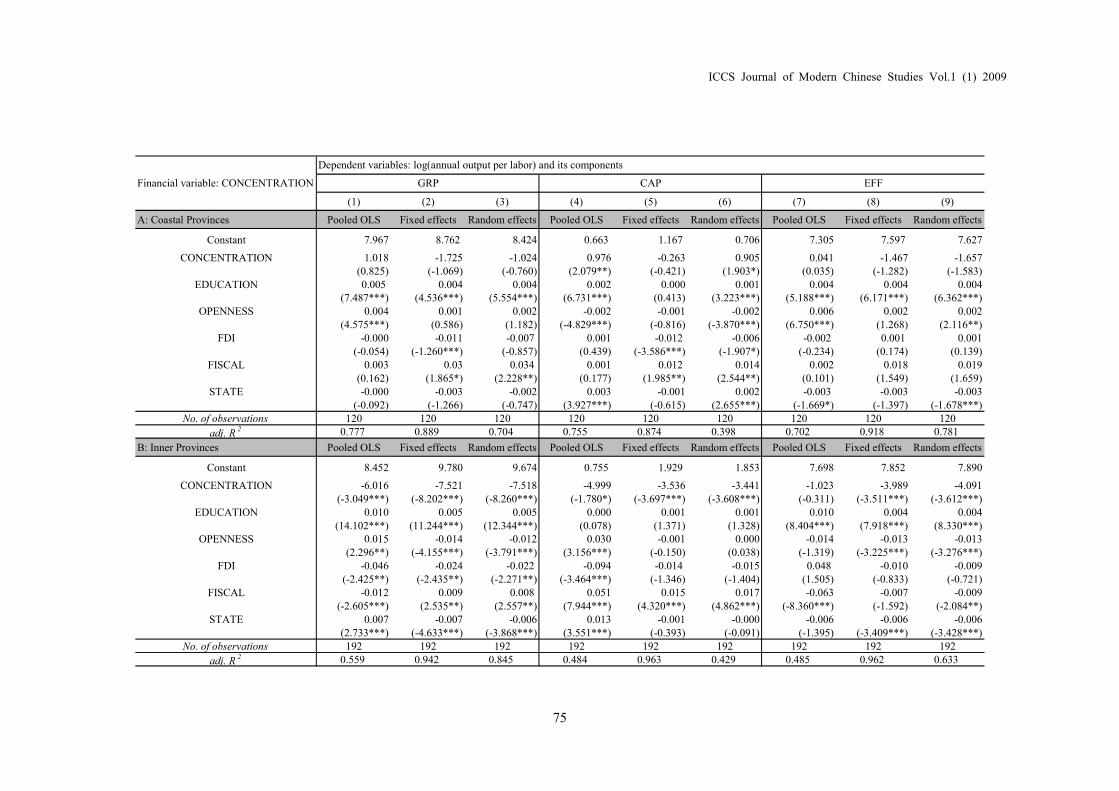
Fourthly, the existence of inter-regional
heterogeneity tends to be sensitive to the
selection of financial variables, at least in the
case of the comparison between coastal
provinces and inner provinces.
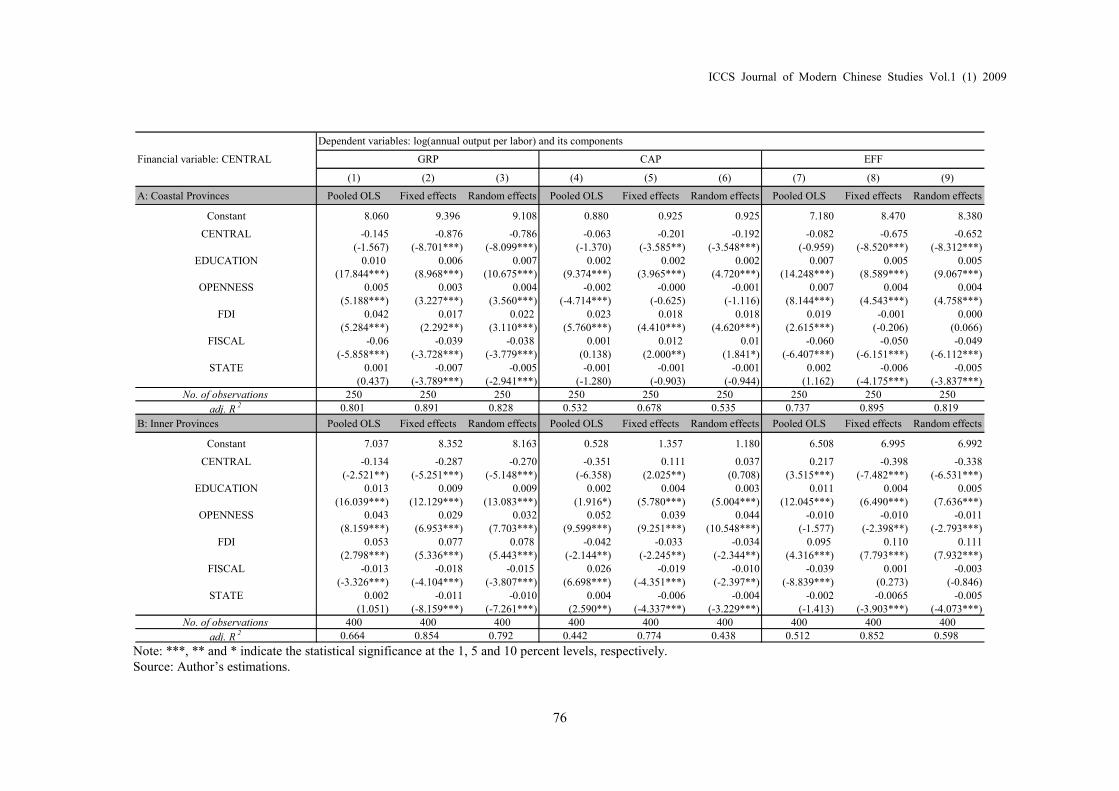
Different from Liang (2005b), who argued
that financial development significantly
promotes economic growth in coastal prov-
inces but not in inner provinces, we found
that LOAN, SAVING and BUDGET are sig-
nificantly associated with GRP in both
sub-samples, and the main channel turns out
to be capital accumulation 37 . Therefore,
concerning the relationship between the
expansion of financial services and economic
growth, there is probably no significant in-
ter-regional heterogeneity. Similarly, with
respect to the estimations of CENTRAL, the
distortions of central bank in credit extension
have impaired the economic growth in both
coastal and inner provinces. In this case,
there seems no inter-regional heterogeneity
either.
However, the estimation results of
COMPETITION and CONCENTRATION
do present inter-regional heterogeneity. In
both cases, financial variables are not signifi-
cantly correlated with the growth variables in
coastal provinces, but in inner provinces,
they are significantly correlated with the
growth variables. This probably indicates
that the inner provinces have relied more on
the formal financial sector for financing,
and consequently influenced more by the
changes in the structure of banking sector in
the provinces.
4. Concluding Remarks
This study re-investigates the relationship
between financial development and economic
growth in China. Unlike many of the previous
studies, this study stresses on two channels
through which financial development might
influence on the economic growth, i.e.,
physical capital accumulation and productivity
improvement. In the empirical analysis, an
approach combining the conventional ac-
counting framework and regression analysis
are adopted. The accounting framework
makes it possible to obtain a decomposition
of economic growth into the contributions
respectively from physical capital accumulation
and productivity improvement, while the
growth regression approach makes it possible
to explore the channels through which the
financial indicators exert impacts on economic
growth.
The main findings of this study are
summarized as follows. First, the regression
results are sensitive to the selection of
growth variables. The relationship between
financial development and economic growth
ICCS Journal of Modern Chinese Studies Vol.1 (1) 2009
67
in China tends to be a long-run one. Secondly,
the existence of two channels is supported by
the empirical evidence. The direction of
causality between financial development and
economic growth turns has presumably run
from the former to the latter in China.
Thirdly, the impacts induced by various
measures of financial system exert on eco-
nomic growth are different, and the channels
through which they give impact on the
growth are different as well. The expansion
of financial services in China has contributed
to the economic growth, and the main chan-
nel through which the effects operate is the
channel of physical capital accumulation.
Meanwhile, the government distortions in the
financial sector appear to have hindered the
growth. The increase of competition may
foster the growth mostly through the channel
of productivity improvement. Fourthly, the
existence of inter-regional heterogeneity tends
to be sensitive to the selection of financial
variables. The improvement in the financial
intermediation process appears to have con-
tributed to the economic growth in both
coastal and inner provinces, while the proxies
of provincial financial structures do appear
heterogeneity over two groups of provinces.
ICCS Journal of Modern Chinese Studies Vol.1 (1) 2009
68
Table 3 Finance and Growth in China: Group 1 of Equations (Entire Sample)
(1) (2) (3) (4) (5) (6) (7) (8) (9)
Financial variable: LOAN Pooled OLS Fixed effects Random effects Pooled OLS Fixed effects Random effects Pooled OLS Fixed effects Random effects
Constant 7.175 7.813 7.666 0.083 0.793 0.634 7.093 7.020 7.068
LOAN 0.008 0.009 0.009 0.010 0.009 0.010 -0.002 -0.000 -0.001(9.779***) (10.107***) (10.855***) (13.880***) (14.456***) (15.851***) (-1.972**) (-0.430) (-0.895)
EDUCATION 0.009 0.007 0.008 0.000 0.001 0.001 0.008 0.006 0.006(21.934***) (14.150***) (15.452***) (0.369) (3.386***) (2.985***) (20.334***) (12.304***) (13.539***)
OPENNESS 0.003 0.001 0.001 -0.004 -0.001 -0.002 0.007 0.002 0.003(3.902***) (1.071***) (1.186) (-5.773***) (-1.490) (-2.355**) (8.318***) (2.270**) (2.978***)
FDI 0.059 0.065 0.067 0.031 0.020 0.023 0.028 0.045 0.043(8.456***) (11.055***) (11.495***) (5.193***) (4.647***) (5.524***) (3.775***) (8.082***) (7.773***)
FISCAL -0.027 -0.036 -0.034 0.028 -0.019 -0.012 -0.055 -0.017 -0.022(-8.307***) (-8.556***) (-8.604***) (10.074***) (-6.113***) (-4.209***) (-15.924***) (-4.326***) (-5.750***)
STATE -0.002 -0.010 -0.008 -0.001 -0.003 -0.002 -0.001 -0.007 -0.006(-2.184***) (-7.788***) (-7.201***) (-1.661*) (-3.241***) (-2.635***) (-0.718) (-5.716***) (-5.730***)
No. of observations 650 650 650 650 650 650 650 650 650
adj. R 2 0.768 0.875 0.777 0.440 0.782 0.484 0.732 0.885 0.629
Financial variable: SAVING Pooled OLS Fixed effects Random effects Pooled OLS Fixed effects Random effects Pooled OLS Fixed effects Random effects
Constant 7.019 7.265 7.260 -0.017 0.879 0.686 7.036 6.386 6.544
SAVING 0.014 0.020 0.020 0.014 0.011 0.012 -0.001 0.009 0.007(16.007***) (28.239***) (28.129***) (19.693***) (15.656***) (17.766***) (-0.620) (10.245***) (8.667***)
EDUCATION 0.008 0.003 0.004 0.000 -0.000 -0.000 0.008 0.003 0.004(24.626***) (8.154***) (10.109***) (0.686) (-0.151) (-0.438) (20.441***) (6.742***) (8.956***)
OPENNESS 0.005 0.003 0.003 -0.002 0.001 0.000 0.007 0.002 0.003(6.543***) (4.085***) (4.322***) (-3.487***) (0.736) (0.023) (8.084***) (2.723***) (3.464***)
FDI 0.034 0.030 0.030 0.005 -0.005 -0.003 0.029 0.035 0.034(5.332***) (6.981***) (7.218***) (0.942) (-1.220) (-0.771) (3.583***) (6.661***) (6.590***)
FISCAL -0.031 -0.015 -0.018 0.026 -0.010 -0.003 -0.056 -0.006 -0.014(-10.396***) (-4.964***) (-6.048***) (10.359***) (-3.092***) (-1.807) (-16.327***) (-1.524) (-4.017***)
STATE 0.003 -0.003 -0.003 0.004 -0.001 0.000 -0.001 -0.002 -0.003(3.463***) (-3.607***) (-3.106***) (5.394***) (-0.992) (0.497) (-0.954) (-2.122**) (-2.636***)
No. of observations 650 650 650 650 650 650 650 650 650
adj. R 2 0.809 0.936 0.880 0.546 0.791 0.516 0.730 0.901 0.665
Dependent variables: log(annual output per labor) and its components
GRP CAP EFF
ICCS Journal of Modern Chinese Studies Vol.1 (1) 2009
69
(1) (2) (3) (4) (5) (6) (7) (8) (9)
Financial variable: BUDGET Pooled OLS Fixed effects Random effects Pooled OLS Fixed effects Random effects Pooled OLS Fixed effects Random effects
Constant 7.116 8.086 7.898 0.124 1.327 1.088 6.992 6.759 6.815
BUDGET 0.004 0.004 0.004 0.004 0.002 0.003 0.000 0.002 0.001(8.901***) (9.438***) (9.784***) (9.421***) (6.633***) (7.878***) (0.366) (4.422***) (3.859***)
EDUCATION 0.010 0.009 0.009 0.002 0.003 0.003 0.008 0.006 0.006(27.924***) (17.550***) (19.527***) (5.959***) (7.294***) (7.520***) (21.376***) (12.595***) (13.809***)
OPENNESS 0.005 0.002 0.002 -0.002 -0.000 -0.001 0.007 0.002 0.002(5.616***) (1.677*) (1.959*) (-3.300***) (-0.194) (-1.054) (8.158***) (1.980**) (2.720***)
FDI 0.051 0.052 0.054 0.024 0.007 0.012 0.028 0.045 0.043(7.301***) (8.877***) (9.320***) (3.691***) (1.538) (2.472**) (3.760***) (8.243***) (7.954***)
FISCAL -0.006 -0.021 -0.017 0.051 -0.012 -0.001 -0.056 -0.008 -0.014(-1.698*) (-4.389***) (-3.881***) (16.169***) (-3.226***) (-0.290) (-15.477***) (-1.929*) (-3.451***)
STATE -0.001 -0.011 -0.009 -0.000 -0.005 -0.004 -0.001 -0.006 -0.006(-0.991) (-9.308***) (-8.327***) (-0.216) (-5.437***) (-4.441***) (-0.756) (-5.316***) (-5.281***)
No. of observations 650 650 650 650 650 650 650 650 650
adj. R 2 0.763 0.873 0.770 0.360 0.727 0.342 0.730 0.888 0.637
Financial variable: COMPETITION Pooled OLS Fixed effects Random effects Pooled OLS Fixed effects Random effects Pooled OLS Fixed effects Random effects
Constant 7.594 7.921 7.872 0.427 1.020 0.974 7.168 6.901 6.957COMPETITION 0.008 0.009 0.009 -0.004 0.004 0.004 0.012 0.005 0.005
(2.925***) (5.630***) (5.213***) (-1.165) (3.842***) (20.450***) (3.205***) (3.505***) (3.398***)EDUCATION 0.007 0.004 0.004 0.001 -0.000 -0.000 0.006 0.004 0.004
(16.954***) (6.951***) (8.963***) (1.443) (-0.642) (-0.498) (11.696***) (8.160***) (8.791***)OPENNESS 0.005 -0.001 0.001 -0.000 -0.002 -0.002 0.005 0.001 0.002
(5.631***) (-0.710) (1.084) (-0.321) (-2.297**) (-2.458**) (4.558***) (0.847) (1.871*)FDI 0.022 -0.014 -0.000 -0.014 -0.011 -0.011 0.036 -0.003 0.002
(2.871***) (-2.335**) (-0.038) (-1.620) (-2.855***) (-2.826***) (3.547***) (-0.557) (0.449)FISCAL -0.013 0.021 0.016 0.053 0.020 0.022 -0.066 0.001 -0.003
(-3.140***) (5.091***) (4.098***) (11.405***) (7.461***) (8.135***) (-11.976***) (0.329) (-0.889)STATE -0.000 -0.006 -0.006 0.006 -0.001 -0.000 -0.006 -0.005 -0.006
(-0.313) (-3.982***) (-4.188***) (3.828***) (-0.911) (-0.388) (-3.457***) (-3.768***) (-4.505***)No. of observations 312 312 312 312 312 312 312 312 312
adj. R 2 0.764 0.946 0.725 0.471 0.959 0.392 0.744 0.972 0.667
Dependent variables: log(annual output per labor) and its components
GRP CAP EFF
ICCS Journal of Modern Chinese Studies Vol.1 (1) 2009
70
(1) (2) (3) (4) (5) (6) (7) (8) (9)
Financial variable: CONCENTRATION Pooled OLS Fixed effects Random effects Pooled OLS Fixed effects Random effects Pooled OLS Fixed effects Random effects
Constant 8.203 9.362 9.117 0.225 1.633 1.533 7.978 7.729 7.811
CONCENTRATION -1.274 -5.027 -4.497 0.129 -2.111 -1.880 -1.404 -2.918 -3.131(-1.352) (-6.169***) (-5.967***) (0.125) (-4.001**) (-3.629***) (-1.130) (-3.953***) (-4.390***)
EDUCATION 0.008 0.005 0.005 0.000 0.000 0.000 0.008 0.004 0.005(17.241***) (10.053***) (12.958***) (0.692) -0.001 (1.209) (12.506***) (10.390***) (11.417***)
OPENNESS 0.005 0.001 0.002 -0.000 -0.000 -0.001 0.005 0.002 0.003(5.941***) (1.063) (2.326**) (-0.485) (-1.059) (-1.426) (4.910***) (1.929*) (3.047***)
FDI 0.016 -0.015 -0.001 -0.011 -0.012 -0.011 0.027 -0.004 0.002(2.122**) (-2.623***) (-0.185) (-1.313) (-3.025***) (-2.984***) (2.699***) (-0.735) (0.402)
FISCAL -0.015 0.014 0.010 0.054 0.017 0.019 -0.069 -0.003 -0.008(-3.721***) (3.386***) (2.601***) (11.848***) (6.218***) (6.995***) (-12.659***) (-0.710) (-2.153**)
STATE -0.002 -0.007 -0.006 0.007 -0.002 -0.001 -0.008 -0.006 -0.006(-1.152) (-5.343***) (-4.963***) (4.445***) (-1.743*) (-1.158) (-4.565***) (-4.653***) (-5.287***)
No. of observations 312 312 312 312 312 312 312 312 312
adj. R 2 0.759 0.947 0.729 0.468 0.959 0.391 0.737 0.973 0.670
Financial variable: CENTRAL Pooled OLS Fixed effects Random effects Pooled OLS Fixed effects Random effects Pooled OLS Fixed effects Random effects
Constant 7.761 9.168 8.949 0.843 1.652 1.480 6.919 7.516 7.483
CENTRAL -0.208 -0.581 -0.545 -0.301 -0.028 -0.086 0.093 -0.553 -0.494(-4.089***) (-11.735***) (-11.371***) (-6.644***) (-0.659) (-2.074**) (1.823*) (-12.942***) (-11.802***)
EDUCATION 0.010 0.007 0.008 0.001 0.003 0.003 0.008 0.004 0.005(24.797***) (14.486***) (16.648***) (4.021***) (7.188***) (7.126***) (21.102***) (9.604***) (11.225***)
OPENNESS 0.004 0.003 0.003 -0.003 0.000 -0.001 0.007 0.003 0.003(4.636***) (3.107***) (3.186***) (-3.867***) (0.267) (-0.683) (8.043***) (3.335***) (3.974***)
FDI 0.050 0.031 0.035 0.019 0.007 0.011 0.031 0.024 0.024(6.623***) (5.175***) (5.893***) (2.764***) (1.436) (2.097**) (4.137***) (4.563***) (4.680***)
FISCAL -0.021 -0.036 -0.033 0.034 -0.023 -0.011 -0.056 -0.013 -0.018(-6.269***) (-8.784***) (-8.663***) (11.378***) (-6.602***) (-3.484***) (-16.333***) (-3.585***) (-5.412***)
STATE -0.000 -0.010 -0.008 0.001 -0.006 -0.004 -0.002 -0.004 -0.004(-0.280) (-8.621***) (-7.515***) (1.204) (-5.843***) (-4.605***) (-1.347) (-4.153***) (-4.105***)
No. of observations 650 650 650 650 650 650 650 650 650
adj. R 2 0.740 0.881 0.779 0.318 0.708 0.281 0.731 0.909 0.690
Dependent variables: log(annual output per labor) and its components
GRP CAP EFF
Note: ***, ** and * indicate the statistical significance at the 1, 5 and 10 percent levels, respectively.Source: Author’s estimations.
ICCS Journal of Modern Chinese Studies Vol.1 (1) 2009
71
Table 4 Finance and Growth in China: Group 1 of Equations (Sub-samples)
(1) (2) (3) (4) (5) (6) (7) (8) (9)
A: Coastal Provinces Pooled OLS Fixed effects Random effects Pooled OLS Fixed effects Random effects Pooled OLS Fixed effects Random effects
Constant 7.884 8.360 8.049 0.719 0.643 0.659 7.164 7.717 7.586
LOAN 0.002 0.005 0.004 0.004 0.002 0.002 -0.002 0.003 0.003(1.295) (2.826***) (2.661***) (5.339***) (2.529**) (2.830***) (-1.324) (1.985**) (1.860*)
EDUCATION 0.010 0.007 0.008 0.002 0.002 0.002 0.007 0.006 0.006(19.220***) (9.007***) (12.921***) (9.310***) (4.002***) (5.055***) (16.083***) (8.876***) (9.990***)
OPENNESS 0.004 0.005 0.004 -0.002 -0.000 -0.001 0.007 0.005 0.005(4.831***) (3.811***) (3.807***) (-5.826***) (-0.371) (-1.260) (8.221***) (5.060***) (5.268***)
FDI 0.047 0.045 0.049 0.025 0.025 0.025 0.021 0.020 0.022(6.251**) (5.887***) (6.856***) (7.237***) (6.559***) (6.825***) (3.078***) (3.313***) (3.683***)
FISCAL -0.069 -0.076 -0.070 -0.012 0.000 -0.002 -0.056 -0.076 -0.073(-6.205***) (-6.336***) (-6.283***) (-2.349**) (0.064) (-0.320) (-5.530***) (-8.064***) (-7.856***)
STATE -0.000 -0.008 -0.004 -0.001 -0.001 -0.001 0.001 -0.007 -0.005(-0.040) (-3.778***) (-2.453***) (-1.910*) (-0.944) (-1.010) (0.934) (-4.187***) (-3.579***)
No. of observations 250 250 250 250 250 250 250 250 250
adj. R 2 0.800 0.860 0.789 0.578 0.669 0.525 0.738 0.865 0.767
B: Inner Provinces Pooled OLS Fixed effects Random effects Pooled OLS Fixed effects Random effects Pooled OLS Fixed effects Random effects
Constant 6.527 7.229 7.134 -0.249 0.641 0.495 6.776 6.588 6.640
LOAN 0.011 0.010 0.011 0.012 0.011 0.011 -0.001 -0.000 -0.000(10.066***) (11.455***) (11.926***) (10.409***) (12.112**) (12.787***) (-0.874) (-0.148) (-0.318)
EDUCATION 0.011 0.009 0.009 0.000 0.002 0.002 0.011 0.007 0.007(15.095***) (14.399***) (14.829***) (0.309) (3.267***) (2.898***) (11.218***) (9.628***) (10.086***)
OPENNESS 0.019 0.008 0.009 0.026 0.020 0.021 -0.007 -0.012 -0.012(3.655***) (1.948) (2.187**) (4.622***) (5.012***) (5.350***) (-1.006***) (-2.450**) (-2.534**)
FDI 0.052 0.109 0.107 -0.035 -0.034 -0.031 0.087 0.143 0.140(3.069**) (8.878***) (8.779***) (-1.949*) (-2.834***) (-2.635***) (3.929***) (9.921***) (9.745***)
FISCAL -0.017 -0.014 -0.013 0.026 -0.016 -0.011 -0.043 0.002 -0.001(-5.052***) (-3.559***) (-3.523***) (7.253***) (-4.214***) (-3.067***) (-9.779***) (0.418) (-0.273)
STATE -0.000 -0.010 -0.009 0.000 -0.002 -0.002 -0.000 -0.007 -0.007(-0.277) (-7.932***) (-7.453***) (0.077) (-2.023**) (-1.542) (-0.276) (-5.120***) (-5.170***)
No. of observations 400 400 400 400 400 400 400 400 400
adj. R 2 0.729 0.884 0.839 0.518 0.836 0.608 0.498 0.830 0.562
Financial variable: LOAN
Dependent variables: log(annual output per labor) and its components
GRP CAP EFF
ICCS Journal of Modern Chinese Studies Vol.1 (1) 2009
72
(1) (2) (3) (4) (5) (6) (7) (8) (9)
A: Coastal Provinces Pooled OLS Fixed effects Random effects Pooled OLS Fixed effects Random effects Pooled OLS Fixed effects Random effects
Constant 7.615 7.817 7.590 0.583 0.451 0.454 7.032 7.366 7.260
SAVING 0.009 0.023 0.019 0.007 0.009 0.008 0.002 0.014 0.013(5.235***) (13.493***) (12.184***) (8.621***) (8.929***) (8.881***) (1.325) (9.434***) (8.898***)
EDUCATION 0.009 0.003 0.005 0.002 0.000 0.001 0.007 0.003 0.004(19.021***) (5.247***) (9.712***) (9.241***) (0.625) (1.989**) (15.250***) (5.498***) (6.899***)
OPENNESS 0.004 0.003 0.003 -0.002 -0.001 -0.001 0.006 0.004 0.004(4.875***) (3.816***) (3.664***) (-6.206***) (-1.150) (-2.803**) (7.967***) (5.035***) (5.196***)
FDI 0.034 0.015 0.023 0.015 0.013 0.014 0.019 0.001 0.004(4.584***) (2.347**) (3.934***) (4.535***) (3.765***) (4.144***) (2.583**) (0.215) (0.818)
FISCAL -0.067 -0.052 -0.051 -0.004 0.010 0.008 -0.063 -0.062 -0.061(-6.968***) (-6.076***) (-6.295***) (-0.843) (2.058**) (1.766*) (-6.792***) (-8.161***) (-8.085***)
STATE 0.003 -0.003 0 0.001 0.001 0.001 0.002 -0.004 -0.003(2.130**) (-1.872*) (0.103) (1.720*) (0.856) (1.244) (1.385) (-2.656***) (-1.876*)
No. of observations 250 250 250 250 250 250 250 250 250
adj. R 2 0.819 0.919 0.856 0.639 0.746 0.629 0.738 0.901 0.820
B: Inner Provinces Pooled OLS Fixed effects Random effects Pooled OLS Fixed effects Random effects Pooled OLS Fixed effects Random effects
Constant 6.512 7.112 7.079 -0.261 0.961 0.681 6.774 6.151 6.256
SAVING 0.016 0.019 0.019 0.017 0.010 0.012 -0.002 0.008 0.008(13.584***) (22.455***) (22.648***) (13.914***) (9.114***) (10.671***) (-0.980) (7.027***) (6.460***)
EDUCATION 0.009 0.004 0.004 -0.002 0.000 -0.001 0.011 0.004 0.004(11.934***) (7.522***) (7.963***) (-2.994***) (0.125) (-0.814) (10.658***) (5.076***) (5.893***)
OPENNESS 0.016 0.003 0.003 0.023 0.026 0.028 -0.007 -0.024 -0.024(3.342***) (0.823) (1.021) (4.444***) (6.303***) (6.738***) (-1.015) (-5.303***) (-5.352***)
FDI 0.020 0.050 0.049 -0.070 -0.070 -0.069 0.090 0.120 0.118(1.270) (5.190***) (5.123***) (-4.120***) (-5.392***) (-5.372***) (4.013***) (8.608***) (8.539***)
FISCAL -0.018 -0.007 -0.007 0.024 -0.013 -0.005 -0.043 0.006 0.002(-5.945***) (-2.399**) (-2.564**) (7.392***) (-3.403***) (-1.439) (-9.779***) (1.515) (0.462)
STATE 0.005 -0.005 -0.004 0.006 -0.001 0.001 -0.001 -0.004 -0.004(4.229***) (-4.866***) (-4.484***) (4.713***) (-0.798) (0.493) (-0.595) (-2.614***) (-2.903***)
No. of observations 400 400 400 400 400 400 400 400 400
adj. R 2 0.768 0.933 0.906 0.588 0.813 0.552 0.498 0.849 0.601
Financial variable: SAVING
Dependent variables: log(annual output per labor) and its components
GRP CAP EFF

ICCS Journal of Modern Chinese Studies Vol.1 (1) 2009
73
(1) (2) (3) (4) (5) (6) (7) (8) (9)
A: Coastal Provinces Pooled OLS Fixed effects Random effects Pooled OLS Fixed effects Random effects Pooled OLS Fixed effects Random effects
Constant 7.482 8.100 7.68 0.341 0.434 0.406 7.141 7.665 7.492
BUDGET 0.004 0.005 0.004 0.004 0.003 0.003 -0.000 0.002 0.002(4.263***) (6.695***) (6.087***) (10.695***) (9.301***) (9.520***) (-0.289) (2.841***) (2.446**)
EDUCATION 0.010 0.007 0.009 0.002 0.001 0.002 0.007 0.006 0.006(21.210***) (10.232***) (15.518***) (12.630***) (4.536***) (6.125***) (16.578***) (9.670***) (11.346***)
OPENNESS 0.004 0.005 0.004 -0.002 -0.000 -0.001 0.007 0.005 0.005(5.146***) (4.114***) (4.182***) (-6.091***) (-0.649) (-1.625) (8.091***) (5.252***) (5.550***)
FDI 0.048 0.043 0.049 0.026 0.024 0.025 0.021 0.019 0.022(6.599***) (6.051***) (7.424***) (8.525***) (7.343***) (7.821***) (3.116***) (3.151***) (3.690***)
FISCAL -0.049 -0.05 -0.044 0.014 0.014 0.014 -0.063 -0.065 -0.061(-4.826***) (-4.727***) (-4.465***) (3.149***) (2.934***) (2.990***) (-6.449***) (-7.242***) (-7.037***)
STATE 0.002 -0.007 -0.002 0.001 -0.000 0.000 0.001 -0.007 -0.005(1.532) (-3.483***) (-1.111) (1.923*) (-0.152) (0.355) (0.749) (-4.059***) (-3.130***)
No. of observations 250 250 250 250 250 250 250 250 250
adj. R 2 0.813 0.878 0.810 0.679 0.752 0.642 0.736 0.867 0.768
B: Inner Provinces Pooled OLS Fixed effects Random effects Pooled OLS Fixed effects Random effects Pooled OLS Fixed effects Random effects
Constant 6.713 7.838 7.672 0.063 1.421 1.220 6.650 6.417 6.456
BUDGET 0.003 0.003 0.003 0.002 0.001 0.001 0.001 0.002 0.002(5.368***) (5.425***) (5.649***) (2.623***) (1.350) (1.471) (2.021**) (3.968***) (4.006***)
EDUCATION 0.013 0.011 0.011 0.002 0.004 0.003 0.010 0.007 0.007(16.781***) (16.323***) (16.876***) (2.794***) (5.534***) (5.311***) (11.290***) (10.475***) (10.872***)
OPENNESS 0.036 0.019 0.022 0.049 0.038 0.041 -0.013 -0.019 -0.019(6.782***) (4.313***) (4.955***) (8.278***) (8.350***) (9.176***) (-2.019**) (-4.017***) (-4.199***)
FDI 0.026 0.077 0.075 -0.046 -0.048 -0.045 0.072 0.125 0.122(1.348) (5.288***) (5.213***) (-2.149**) (-3.289***) (-3.068***) (3.093***) (8.399***) (8.232***)
FISCAL 0.002 -0.009 -0.005 0.040 -0.017 -0.010 -0.038 0.008 0.005(0.520) (-1.868*) (-1.241) (8.688***) (-3.655***) (-2.165**) (-7.569***) (1.780*) (1.206)
STATE -0.001 -0.013 -0.011 0 -0.005 -0.004 -0.001 -0.007 -0.007(-0.582) (-9.335***) (-8.584***) (0.181) (-3.956***) (-3.306***) (-0.649) (-5.210***) (-5.237***)
No. of observations 400 400 400 400 400 400 400 400 400
adj. R 2 0.682 0.854 0.796 0.396 0.773 0.451 0.502 0.836 0.579
Financial variable: BUDGET
Dependent variables: log(annual output per labor) and its components
GRP CAP EFF
ICCS Journal of Modern Chinese Studies Vol.1 (1) 2009
74
(1) (2) (3) (4) (5) (6) (7) (8) (9)
A: Coastal Provinces Pooled OLS Fixed effects Random effects Pooled OLS Fixed effects Random effects Pooled OLS Fixed effects Random effects
Constant 8.571 8.237 8.164 0.973 1.175 1.042 7.598 7.063 7.068
COMPETITION -0.009 0.004 0.000 -0.003 -0.003 -0.005 -0.006 0.007 0.006(-1.842*) (0.897) (0.062) (-1.707*) (-1.202) (-2.961***) (-1.236) (1.941*) (1.778*)
EDUCATION 0.006 0.004 0.004 0.002 0.000 0.002 0.004 0.004 0.003(9.035***) (3.782***) (5.401***) (8.648***) (0.917) (6.157***) (5.956***) (4.893***) (5.044***)
OPENNESS 0.004 0.000 0.002 -0.002 -0.001 -0.002 0.006 0.001 0.002(5.033***) (0.231) (1.555) (-5.118***) (-0.896) (-4.567***) (7.347***) (0.816) (2.242**)
FDI -0.007 -0.011 -0.006 -0.000 -0.012 -0.005 -0.007 0.001 0.000(-0.820) (-1.266) (-0.777) (-0.105) (-3.481***) (-1.631***) (-0.817) (0.096) (0.075)
FISCAL 0.007 0.028 0.034 0.005 0.014 0.015 0.002 0.015 0.016(0.492) (1.731*) (2.247**) (0.959) (2.164**) (2.893***) (0.127) (1.285) (1.493)
STATE -0.002 -0.002 -0.001 0.002 -0.001 0.001 -0.004 -0.001 -0.002(-1.067) (-0.746) (-0.511) (2.379**) (-0.778) (1.713*) (-2.081**) (-0.640) (-0.954)
No. of observations 120 120 120 120 120 120 120 120 120
adj. R 2 0.782 0.889 0.705 0.752 0.876 0.503 0.706 0.919 0.778
B: Inner Provinces Pooled OLS Fixed effects Random effects Pooled OLS Fixed effects Random effects Pooled OLS Fixed effects Random effects
Constant 6.989 8.050 7.936 0.105 1.041 0.986 6.885 7.009 7.028
COMPETITION 0.012 0.009 0.009 -0.001 0.005 0.005 0.014 0.003 0.003(4.254***) (6.204***) (6.520***) (-0.245) (3.877***) (3.907***) (2.765***) (2.042**) (2.113**)
EDUCATION 0.008 0.003 0.004 0.000 -0.000 -0.000 0.008 0.004 0.004(9.432***) (6.975***) (7.841***) (0.134) (-0.458) (-0.509) (5.536***) (6.242***) (6.558***)
OPENNESS 0.016 -0.016 -0.015 0.027 -0.001 -0.001 -0.011 -0.015 -0.015(2.499**) (-4.682***) (-4.305***) (2.859***) (-0.422) (-0.228) (-1.017) (-3.592***) (-3.656***)
FDI -0.039 -0.017 -0.015 -0.097 -0.010 -0.011 0.059 -0.007 -0.005(-2.061**) (-1.597) (-1.435) (-3.567***) (-0.974) (-1.036) (1.875*) (-0.547) (-0.436)
FISCAL -0.007 0.018 0.018 0.051 0.020 0.022 -0.058 -0.002 -0.004(-1.466) (5.307***) (5.258***) (7.630***) (5.953***) (6.442***) (-7.592***) (-0.415) (-0.879)
STATE 0.004 -0.009 -0.008 0.008 -0.001 -0.001 -0.004 -0.008 -0.008(2.036**) (-6.388***) (-5.723***) (3.002***) (-0.933*) (-0.605) (-1.423) (-4.613***) (-4.711***)
No. of observations 192 192 192 192 192 192 192 192 192
adj. R 2 0.578 0.934 0.827 0.476 0.964 0.436 0.505 0.960 0.618
Financial variable: COMPETITION
Dependent variables: log(annual output per labor) and its components
GRP CAP EFF
ICCS Journal of Modern Chinese Studies Vol.1 (1) 2009
75
(1) (2) (3) (4) (5) (6) (7) (8) (9)
A: Coastal Provinces Pooled OLS Fixed effects Random effects Pooled OLS Fixed effects Random effects Pooled OLS Fixed effects Random effects
Constant 7.967 8.762 8.424 0.663 1.167 0.706 7.305 7.597 7.627
CONCENTRATION 1.018 -1.725 -1.024 0.976 -0.263 0.905 0.041 -1.467 -1.657(0.825) (-1.069) (-0.760) (2.079**) (-0.421) (1.903*) (0.035) (-1.282) (-1.583)
EDUCATION 0.005 0.004 0.004 0.002 0.000 0.001 0.004 0.004 0.004(7.487***) (4.536***) (5.554***) (6.731***) (0.413) (3.223***) (5.188***) (6.171***) (6.362***)
OPENNESS 0.004 0.001 0.002 -0.002 -0.001 -0.002 0.006 0.002 0.002(4.575***) (0.586) (1.182) (-4.829***) (-0.816) (-3.870***) (6.750***) (1.268) (2.116**)
FDI -0.000 -0.011 -0.007 0.001 -0.012 -0.006 -0.002 0.001 0.001(-0.054) (-1.260***) (-0.857) (0.439) (-3.586***) (-1.907*) (-0.234) (0.174) (0.139)
FISCAL 0.003 0.03 0.034 0.001 0.012 0.014 0.002 0.018 0.019(0.162) (1.865*) (2.228**) (0.177) (1.985**) (2.544**) (0.101) (1.549) (1.659)
STATE -0.000 -0.003 -0.002 0.003 -0.001 0.002 -0.003 -0.003 -0.003(-0.092) (-1.266) (-0.747) (3.927***) (-0.615) (2.655***) (-1.669*) (-1.397) (-1.678***)
No. of observations 120 120 120 120 120 120 120 120 120
adj. R 2 0.777 0.889 0.704 0.755 0.874 0.398 0.702 0.918 0.781
B: Inner Provinces Pooled OLS Fixed effects Random effects Pooled OLS Fixed effects Random effects Pooled OLS Fixed effects Random effects
Constant 8.452 9.780 9.674 0.755 1.929 1.853 7.698 7.852 7.890
CONCENTRATION -6.016 -7.521 -7.518 -4.999 -3.536 -3.441 -1.023 -3.989 -4.091(-3.049***) (-8.202***) (-8.260***) (-1.780*) (-3.697***) (-3.608***) (-0.311) (-3.511***) (-3.612***)
EDUCATION 0.010 0.005 0.005 0.000 0.001 0.001 0.010 0.004 0.004(14.102***) (11.244***) (12.344***) (0.078) (1.371) (1.328) (8.404***) (7.918***) (8.330***)
OPENNESS 0.015 -0.014 -0.012 0.030 -0.001 0.000 -0.014 -0.013 -0.013(2.296**) (-4.155***) (-3.791***) (3.156***) (-0.150) (0.038) (-1.319) (-3.225***) (-3.276***)
FDI -0.046 -0.024 -0.022 -0.094 -0.014 -0.015 0.048 -0.010 -0.009(-2.425**) (-2.435**) (-2.271**) (-3.464***) (-1.346) (-1.404) (1.505) (-0.833) (-0.721)
FISCAL -0.012 0.009 0.008 0.051 0.015 0.017 -0.063 -0.007 -0.009(-2.605***) (2.535**) (2.557**) (7.944***) (4.320***) (4.862***) (-8.360***) (-1.592) (-2.084**)
STATE 0.007 -0.007 -0.006 0.013 -0.001 -0.000 -0.006 -0.006 -0.006(2.733***) (-4.633***) (-3.868***) (3.551***) (-0.393) (-0.091) (-1.395) (-3.409***) (-3.428***)
No. of observations 192 192 192 192 192 192 192 192 192
adj. R 2 0.559 0.942 0.845 0.484 0.963 0.429 0.485 0.962 0.633
Financial variable: CONCENTRATION
Dependent variables: log(annual output per labor) and its components
GRP CAP EFF
ICCS Journal of Modern Chinese Studies Vol.1 (1) 2009
76
(1) (2) (3) (4) (5) (6) (7) (8) (9)
A: Coastal Provinces Pooled OLS Fixed effects Random effects Pooled OLS Fixed effects Random effects Pooled OLS Fixed effects Random effects
Constant 8.060 9.396 9.108 0.880 0.925 0.925 7.180 8.470 8.380
CENTRAL -0.145 -0.876 -0.786 -0.063 -0.201 -0.192 -0.082 -0.675 -0.652(-1.567) (-8.701***) (-8.099***) (-1.370) (-3.585**) (-3.548***) (-0.959) (-8.520***) (-8.312***)
EDUCATION 0.010 0.006 0.007 0.002 0.002 0.002 0.007 0.005 0.005(17.844***) (8.968***) (10.675***) (9.374***) (3.965***) (4.720***) (14.248***) (8.589***) (9.067***)
OPENNESS 0.005 0.003 0.004 -0.002 -0.000 -0.001 0.007 0.004 0.004(5.188***) (3.227***) (3.560***) (-4.714***) (-0.625) (-1.116) (8.144***) (4.543***) (4.758***)
FDI 0.042 0.017 0.022 0.023 0.018 0.018 0.019 -0.001 0.000(5.284***) (2.292**) (3.110***) (5.760***) (4.410***) (4.620***) (2.615***) (-0.206) (0.066)
FISCAL -0.06 -0.039 -0.038 0.001 0.012 0.01 -0.060 -0.050 -0.049(-5.858***) (-3.728***) (-3.779***) (0.138) (2.000**) (1.841*) (-6.407***) (-6.151***) (-6.112***)
STATE 0.001 -0.007 -0.005 -0.001 -0.001 -0.001 0.002 -0.006 -0.005(0.437) (-3.789***) (-2.941***) (-1.280) (-0.903) (-0.944) (1.162) (-4.175***) (-3.837***)
No. of observations 250 250 250 250 250 250 250 250 250
adj. R 2 0.801 0.891 0.828 0.532 0.678 0.535 0.737 0.895 0.819
B: Inner Provinces Pooled OLS Fixed effects Random effects Pooled OLS Fixed effects Random effects Pooled OLS Fixed effects Random effects
Constant 7.037 8.352 8.163 0.528 1.357 1.180 6.508 6.995 6.992
CENTRAL -0.134 -0.287 -0.270 -0.351 0.111 0.037 0.217 -0.398 -0.338(-2.521**) (-5.251***) (-5.148***) (-6.358) (2.025**) (0.708) (3.515***) (-7.482***) (-6.531***)
EDUCATION 0.013 0.009 0.009 0.002 0.004 0.003 0.011 0.004 0.005(16.039***) (12.129***) (13.083***) (1.916*) (5.780***) (5.004***) (12.045***) (6.490***) (7.636***)
OPENNESS 0.043 0.029 0.032 0.052 0.039 0.044 -0.010 -0.010 -0.011(8.159***) (6.953***) (7.703***) (9.599***) (9.251***) (10.548***) (-1.577) (-2.398**) (-2.793***)
FDI 0.053 0.077 0.078 -0.042 -0.033 -0.034 0.095 0.110 0.111(2.798***) (5.336***) (5.443***) (-2.144**) (-2.245**) (-2.344**) (4.316***) (7.793***) (7.932***)
FISCAL -0.013 -0.018 -0.015 0.026 -0.019 -0.010 -0.039 0.001 -0.003(-3.326***) (-4.104***) (-3.807***) (6.698***) (-4.351***) (-2.397**) (-8.839***) (0.273) (-0.846)
STATE 0.002 -0.011 -0.010 0.004 -0.006 -0.004 -0.002 -0.0065 -0.005(1.051) (-8.159***) (-7.261***) (2.590**) (-4.337***) (-3.229***) (-1.413) (-3.903***) (-4.073***)
No. of observations 400 400 400 400 400 400 400 400 400
adj. R 2 0.664 0.854 0.792 0.442 0.774 0.438 0.512 0.852 0.598
Financial variable: CENTRAL
Dependent variables: log(annual output per labor) and its components
GRP CAP EFF
Note: ***, ** and * indicate the statistical significance at the 1, 5 and 10 percent levels, respectively.Source: Author’s estimations.
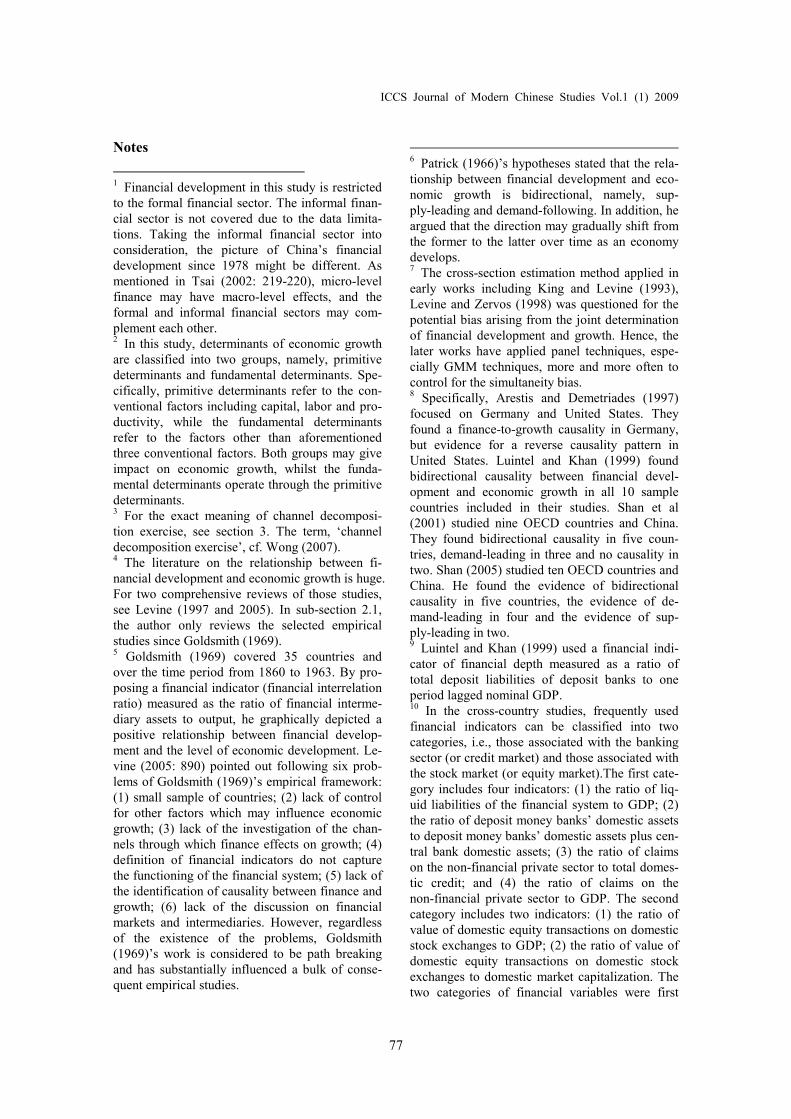
ICCS Journal of Modern Chinese Studies Vol.1 (1) 2009
77
Notes
1 Financial development in this study is restrictedto the formal financial sector. The informal finan-cial sector is not covered due to the data limita-tions. Taking the informal financial sector intoconsideration, the picture of China’s financialdevelopment since 1978 might be different. Asmentioned in Tsai (2002: 219-220), micro-levelfinance may have macro-level effects, and theformal and informal financial sectors may com-plement each other.2 In this study, determinants of economic growthare classified into two groups, namely, primitivedeterminants and fundamental determinants. Spe-cifically, primitive determinants refer to the con-ventional factors including capital, labor and pro-ductivity, while the fundamental determinantsrefer to the factors other than aforementionedthree conventional factors. Both groups may giveimpact on economic growth, whilst the funda-mental determinants operate through the primitivedeterminants.3 For the exact meaning of channel decomposi-tion exercise, see section 3. The term, ‘channeldecomposition exercise’, cf. Wong (2007).4 The literature on the relationship between fi-nancial development and economic growth is huge.For two comprehensive reviews of those studies,see Levine (1997 and 2005). In sub-section 2.1,the author only reviews the selected empiricalstudies since Goldsmith (1969).5 Goldsmith (1969) covered 35 countries andover the time period from 1860 to 1963. By pro-posing a financial indicator (financial interrelationratio) measured as the ratio of financial interme-diary assets to output, he graphically depicted apositive relationship between financial develop-ment and the level of economic development. Le-vine (2005: 890) pointed out following six prob-lems of Goldsmith (1969)’s empirical framework:(1) small sample of countries; (2) lack of controlfor other factors which may influence economicgrowth; (3) lack of the investigation of the chan-nels through which finance effects on growth; (4)definition of financial indicators do not capturethe functioning of the financial system; (5) lack ofthe identification of causality between finance andgrowth; (6) lack of the discussion on financialmarkets and intermediaries. However, regardlessof the existence of the problems, Goldsmith(1969)’s work is considered to be path breakingand has substantially influenced a bulk of conse-quent empirical studies.
6 Patrick (1966)’s hypotheses stated that the rela-tionship between financial development and eco-nomic growth is bidirectional, namely, sup-ply-leading and demand-following. In addition, heargued that the direction may gradually shift fromthe former to the latter over time as an economydevelops.7 The cross-section estimation method applied inearly works including King and Levine (1993),Levine and Zervos (1998) was questioned for thepotential bias arising from the joint determinationof financial development and growth. Hence, thelater works have applied panel techniques, espe-cially GMM techniques, more and more often tocontrol for the simultaneity bias.8 Specifically, Arestis and Demetriades (1997)focused on Germany and United States. Theyfound a finance-to-growth causality in Germany,but evidence for a reverse causality pattern inUnited States. Luintel and Khan (1999) foundbidirectional causality between financial devel-opment and economic growth in all 10 samplecountries included in their studies. Shan et al(2001) studied nine OECD countries and China.They found bidirectional causality in five coun-tries, demand-leading in three and no causality intwo. Shan (2005) studied ten OECD countries andChina. He found the evidence of bidirectionalcausality in five countries, the evidence of de-mand-leading in four and the evidence of sup-ply-leading in two.9 Luintel and Khan (1999) used a financial indi-cator of financial depth measured as a ratio oftotal deposit liabilities of deposit banks to oneperiod lagged nominal GDP.10 In the cross-country studies, frequently usedfinancial indicators can be classified into twocategories, i.e., those associated with the bankingsector (or credit market) and those associated withthe stock market (or equity market).The first cate-gory includes four indicators: (1) the ratio of liq-uid liabilities of the financial system to GDP; (2)the ratio of deposit money banks’ domestic assetsto deposit money banks’ domestic assets plus cen-tral bank domestic assets; (3) the ratio of claimson the non-financial private sector to total domes-tic credit; and (4) the ratio of claims on thenon-financial private sector to GDP. The secondcategory includes two indicators: (1) the ratio ofvalue of domestic equity transactions on domesticstock exchanges to GDP; (2) the ratio of value ofdomestic equity transactions on domestic stockexchanges to domestic market capitalization. Thetwo categories of financial variables were first
ICCS Journal of Modern Chinese Studies Vol.1 (1) 2009
78
proposed by King and Levine (1993) and Levineand Zervos (1998), respectively.11 The China-specific features mostly refer to: (1)the over-concentration of Big Four banks in thefinancial system; (2) the over-lending to ineffi-cient state-owned enterprises, while good privateenterprises left without access to external finance.Due to the facts, China is often cited as a coun-terexample to the finance-growth literature (Allenet al: 2005). Big Four refers to the Industrial andCommercial Bank of China (ICBC), the Agricul-tural Bank of China (ABC), the Bank of China(BOC) and the China Construction Bank (CCB).12 This framework can be considered as a simpli-fied form of Levine (1997: 691)’s theoretical ap-proach. Note that the productivity improvement inthis framework refers to the increases in total fac-tor productivity (TFP), i.e., Solow residual whichreflects technological progress and other elements.In Levine (1997), the term technological innova-tion is used.13 The discussions on the conceptual frameworkborrow from World Bank (1989), Levine (1997,2005), Demirguc-Kunt and Levine (2008),Greenwood and Jovanovic (1990) and Bencivengaand Smith (1991). In Demirguc-Kunt and Levine(2008: 7 and 12), it mentioned that financial de-velopment may also promote the accumulation ofhuman capital. Also note that financial intermedi-aries and financial market perform differently inproviding even same functions. However, the dis-cussions here ignore those differences.14 Similarly, while examining the impact of de-mocracy on growth, Tavares and Wacziarg (2001)found that, democracy fosters growth by improv-ing the accumulation of human capital and lower-ing income inequality. In addition, they also foundthat democracy hinders growth by reducing therate of physical capital accumulation and raisingthe ratio of government consumption to GDP.These two give negative overall impact of de-mocracy on growth.15 By facilitating risk sharing among savers andinvestors, financial development may promotehigh-return investment which often is high-risk.Meanwhile, by ameliorating liquidity risk, finan-cial development may promote the investmentwhich requires either huge amount or long-termcommitment of capital.16 Specifically, Fisher (1993) examined the im-pacts of macroeconomic policy indicators on eco-nomic growth and its three sources, i.e., growthrate of the real capital stock, Solow residual andthe growth rate of the labor force. Bosworth et al
(1995) investigated the impacts of three sets ofdeterminants including initial conditions and theexternal environment, macroeconomic policy in-dicators and trade policy regime, on economicgrowth and its two sources, i.e., capital per workerand TFP.17 In addition, Benhanbib and Spiegel (2000)found that the regression results were sensitive tothe inclusion of country fixed effects. The findingled to the conclusion that financial developmentindicators proxied for broader country character-istics.18 Hall and Jones (1999)’s decomposition ap-proach assumed a production function which in-corporated the human capital accumula-tion: 1)(AHKY . The production function is
rearranged as:
1
Y
K
L
HA
L
Y . The output per
labor in this context is consequently decomposedinto three components: differences in the capi-tal-output ratio, differences in education attain-ment and differences in productivity. The ac-counting equation follows by:
Y
K
L
HA
L
Ylog
1logloglog
The structural model was then constructed tocapture the quantitative effects of social infra-structure on growth and each of three components.19 In Frankel and Romer (1999), another simplerdecomposition method was also conducted. Itdecomposed the logarithm of output per workerinto its initial value at the beginning of sampleperiod and its changes over the sample period.20 Wong (2007) assumed a production function as
in Mankiw et al (1992), 1)(ALHKY . It
follows by:
)(11
AgY
Hg
Y
Kg
L
Yg
The three components at the right-hand sideof the equation stand for the contributions fromthe growth of physical capital accumulation, thegrowth of human capital accumulation and TFPgrowth. He further argued that, while regressingeconomic growth and its each component on sameset of determinants, with any linear estimator, theestimated coefficient of the growth of output perworker would equal to the sum of estimated coef-ficients of the three components.21 List of control variables is provided in 3.2.Note that the variables of capital accumulationand productivity improvement are not included inthe control variables. The Barro-type growth re-gressions which incorporate financial indicators as
ICCS Journal of Modern Chinese Studies Vol.1 (1) 2009
79
additional explanatory variables implicitly assumethat financial indicators do not hold any relation-ship with other included explanatory variables.However, if financial development influencesgrowth through capital accumulation and produc-tivity improvement, the incorporation of financialvariables might induce spurious regression results.See also Benhabib and Spiegel (2000: 341).22 As shown in 3.2, financial variables and controlvariables are computed as ratio indicators. There-fore, they maintain unchanged over two groups ofregressions.23 The entire dataset used in this study include 26provinces, of which coastal provinces (10) includeBeijing, Tianjin, Hebei, Liaoning, Shanghai, Ji-angsu, Zhejiang, Fujian, Shandong and Guang-dong. All other sample provinces (16) are classi-fied as inner provinces.24 Among six financial indicators constructed inthis study, COMPETITION and CONCENTRA-TION only cover the time period from 1993 to2004 due to the limitation of original data.25 Note that our computation processes of LOAN,SAVING and BUDGET are different from Hao(2006). First, the computation of financial indica-tors often bears the criticism of dividing stockstatistics by flow statistics, therefore followingBeck et al. (2002), we first deflate the total loansand total household savings deposits using RPI,then estimate the financial flow in year t by theaverage of deflated stock statistics in year t andt-1. LOAN and SAVING are accordingly com-puted as the ratio of the estimated flow statistics toGDP in year t, which is deflated by GDP deflator.Indeed, Beck et al (2002) proposed the using ofCPI to deflate financial stock statistics, however,CPI is not available over whole time period forseveral provinces included in this study. Secondly,in Hao (2006), BUDGET is computed as the ratioof fixed assets investment by domestic loans rela-tive to that financed by state budgetary appropria-tion. In our definition, BUDGET is computed asthe ratio of total loans to the state budgetary ap-propriation for capital construction and enter-prises innovation. The appropriation for capitalconstruction and enterprises innovation are twomain items in the total fixed assets investment.26 CENTRAL was also used in previous studiesincluding Lardy (1998) and Dayal-Gulati andHusain (2000).27 Boyreau-Debray (2003) found that the bankingconcentration has negative effects on economicgrowth in China. While computing CONCEN-TRATION, we classify financial institutions into
six categories, i.e., Big Four, Rural Credit Coop-eratives and the other financial institutions. InBoyreau-Debray (2003), he classified financialinstitutions into seven categories, i.e., Big Four,the Bank of Communications, Rural Credit Coop-eratives and the other financial institutions. Welose one category because the data for the Bank ofCommunications is not available over whole timeperiod in our dataset.28 Until the removement of credit plan in 1998,credit quotas were unevenly distributed amongprovinces. Rapidly growing provinces might beassigned with a low credit quota, while slowergrowing provinces might be assigned with a highquota. Central bank’s lending to the localbranches of commercial banks had been used as away to circumvent the credit quota and extendcredit. CENTRAL therefore measures the centralbank’s lending to the provinces.29 Gross capital formation consists of two parts,i.e., gross fixed capital formation and changes ininventory. PIM method was used by Wang andYao (2003) in computing the human capital stock.However, the calculation here is restricted to thephysical capital stock.30 The procedure to estimate the initial capitalstock in 1978 might be too simple. However, asargued by Zhang and Tan (2004: 23), “given therelatively small capital stocks in 1978 and thehigh levels of investment, the estimates for lateryears are not sensitive to the 1978 benchmarkvalues of the capital stocks”.31 Same depreciation rate was also assumed inPerkins (1988) and Wang and Yao (2003). As forother studies, 5.4 percent was used in Chow andLi (2002), 4.9 percent was used in Ezaki and Sun(1999).32 1990 input-output table gives the labor share of0.420, 1995 input-output table gives the laborshare of 0.469, 1997 input-output table gives thelabor share of 0.549, 2000 input-output tablegives the labor share of 0.541, while 2002 in-put-output table gives the labor share of 0.484.They give the average of 0.493.33 The regression results of Group 2 of equations(in growth terms) are not included in the main textbecause financial indicators are not significantlyrelated to any one of growth variables in the esti-mation results of the group. The estimation resultsof Group 2 of equations are available upon re-quest.34 For instance, in the case of SAVING, taken theestimation using common constant method, 100percent (0.014/0.014=1.000) of the impact on
ICCS Journal of Modern Chinese Studies Vol.1 (1) 2009
80
GRP runs through the CAP, that is, physical capi-tal accumulation channel. While, taken the esti-mation using fixed effects method, 55 percent(0.011/0.020=0.550) of the impact on GRP runsthrough CAP, with the remaining impacts accountfor EFF, that is, the channel of productivity im-provement. These calculations hold valid for thecases using other financial variables. It is worthyto note that we do not focus on the percentagesbecause they may lead to the confusion. Instead,we simply focus on the comparison of the coeffi-cient estimates of CAP and EFF.35 For instance, in the same estimations men-tioned in footnote 36, taken the estimation usingcommon constant method, 85.3 percent(0.029/0.034=0.853) of the FDI’s impact on GRPruns through the physical capital accumulationchannel, with the remaining impacts account forthe channel of productivity improvement36 In the case of EFF as dependent variable, theestimation using common constant method (seecolumn (7)) shows a confusing coefficient esti-mate of 0.093. It makes us difficult to give a con-clusive comment, but the results of other two es-timation methods suggest that productivity im-provement might be the main channel.37 For instance, in the case of SAVING, taken theestimation using common constant method, interms of coastal provinces, 77.8 percent(0.007/0.009=0.778) of the impact on GRP runsthrough the CAP, with the remaining impacts ac-count for EFF; in terms of inner provinces, 106.3percent (0.017/0.016=1.063) of the impact onGRP runs through the CAP.
References
Allen, Franklin, Jun Qian and Meijun Qian.2005. Law, Finance, and EconomicGrowth in China. Journal of FinancialEconomics. Vol. 77 (1): 57-116.
Andersen, Thomas Barnebeck, and Finn Tarp.2003. Financial Liberalization, FinancialDevelopment and Economic Growth inLDCs. Journal of International Devel-opment. Vol. 15 (2): 189-209.
Arestis, Philip, and Panicos Demetriades.1997. Financial Development and Eco-nomic Growth: Assessing the Evidence.The Economic Journal.Vol. 107 (442):783-799.
Aziz, Jahangir and Christoph K Duenwald.
2002. Growth-Financial IntermediationNexus in China. IMF Working Paper No.02/194.
Beck, Thorsten, and Ross Levine. 2004.Stock Markets, Banks, and Growth:Panel Evidence. Journal of Banking &Finance. Vol. 28 (3): 423-442.
Beck, Thorsten, Ross Levine, and NormanLoayza. 2000. Finance and the Sourcesof Growth. Journal of Financial Eco-nomics. Vol. 58 (1-2): 261-300.
Bencivenga, Valerie R., and Bruce D. Smith.1991. Financial Intermediation and En-dogenous Growth. The Review of Eco-nomic Studies. Vol. 58 (2): 195-209.
Benhabib, Jess, and Mark M. Spiegel. 2000.The Role of Financial Development inGrowth and Investment. Journal of Eco-nomic Growth. Vol. 5 (4): 341-360.
Bosworth, Barry, Susan M. Collins andYu-chin Chen. 1995. Accounting forDifferences in Economic Growth.Brookings Institution - Working Papers,No. 115. Paper prepared for the October5-6, 1995 conference Structural Ad-justment Policies in the 1990s: Experi-ence and Prospects, organized by the In-stitute of Developing Economies, Tokyo,Japan.
Boyreau-Debray, Genevieve. 2003. FinancialIntermediation and Growth: ChineseStyle. World Bank Working Paper No.3027.
Chang, Tsangyao. 2002. Financial Develop-ment and Economic Growth inMainland China: A Note on TestingDemand-Following and Supply-LeadingHypothesis. Applied Economics Letters.Vol. 9 (13): 869-873.
Cheng, Xiaoqiang and Degryse, Hans. 2006.The Impact of Bank and Non-Bank Fi-nancial Institutions on Local EconomicGrowth in China. Center for TransitionEconomics, LICOS Discussion Papers,171/2006. Katholieke Universiteit Leu-ven.
Chow, Gregory and Kui-Wai Li. 2002.China's Economic Growth: 1952-2010.Economic Development and Cultural
ICCS Journal of Modern Chinese Studies Vol.1 (1) 2009
81
Change. Vol. 51 (1): 247-256.Dayal-Gulati, Anuradha and Aasim Husain.
2000. Centripetal Forces in China’sEconomic Take-off. IMF working pa-pers No. 00/86.
Demirguc-Kunt, Asli and Ross Levine. 2008.Finance, Financial Sector Policies, andLong-run Growth. World Bank PolicyResearch Working Paper, WPS 4469.
Detriades, Panicos, and Khaled Hussein.1996. Does Financial DevelopmentCause Economic Growth? Time-SeriesEvidence from 16 Countries. Journal ofDevelopment Economics. Vol. 51 (2):387-411.
Ezaki, Mituso and Lin Sun. 1999. GrowthAccounting in China for National, Re-gional, and Provincial Economies:1981-1995. Asian Economic Journal.Vol. 13 (1): 39-71.
Fan, Xuejun, Jan Jacobs and Robert Lensink.2005. Chicken or Egg: Financial Devel-opment and Economic Growth in China,1992-2004. CCSO Working Papers, No.200509. Center for Economic Research,University of Groningen.
Fischer, Stanley. 1993. The Role of Macro-economic Factors in Growth. Journal ofMonetary Economics. Vol. 32 (3):485-512.
Frankel, Jeffrey A. and David Romer. 1999.Does Trade Cause Growth? The Ameri-can Economic Review. Vol. 89 (3):379-399.
Goldsmith, Raymond. 1969. Financial Struc-ture and Development. New Haven: YaleUniversity Press.
Greenwood, Jeremy, and Boyan Jovanovic.1990. Financial Development, Growth,and the Distribution of Income. TheJournal of Political Economy. Vol. 98(5): 1076-1107.
Guillaumont Jeanneney, Sylviane, Hua, Pingand Zhicheng Liang. 2006. FinancialDevelopment, Economic Efficiency, andProductivity Growth: Evidence fromChina. The Developing Economies. Vol.44 (1): 27-52.
Guiso, Luigi, Paola Sapienza, and Luigi Zin-
gales. 2002. Does Local Financial De-velopment Matter? NBER Working Pa-per No. 8923.
Hall, Robert E., and Charles I. Jones. 1999.Why Do Some Countries Produce SoMuch More Output Per Worker ThanOthers? Quarterly Journal of Economics.Vol.114 (1): 83-116.
Hao, Chen. 2006. Development of FinancialIntermediation and Economic Growth:The Chinese Experience. China Eco-nomic Review. Vol. 17 (4): 347-462.
King, Robert G., and Ross Levine. 1993. Fi-nance and Growth: Schumpeter MightBe Right. The Quarterly Journal ofEconomics. Vol. 108 (3): 717-737.
Lardy, Nicholas R. 1998. China’s UnfinishedEconomic Revolution. Brookings Insti-tute Press, Washington, D.C.
Levine, Ross. 2005. Finance and Growth:Theory and Evidence. In Handbook ofEconomic Growth. Edited by PhilippeAghion and Steven N. Durlauf.865-934. Elsevier B.V.
Levine, Ross. 1997. Financial Developmentand Economic Growth: Views andAgenda. Journal of Economic Literature.Vol. 35 (2): 688-726.
Levine, Ross, Norman Loayza, and ThorstenBeck. 2000. Financial Intermediationand Growth: Causality and Causes.Journal of Monetary Economics. Vol.46(1): 31-77.
Levine, Ross, and Sara Zervos. 1998. StockMarkets, Banks, and Economic Growth.The American Economic Review. Vol.88 (3): 537-558.
Liang, Qi and Teng Jian-Zhou. 2006. Finan-cial Development and EconomicGrowth: Evidence from China. ChinaEconomic Review. Vol. 17: 395-411.
Liang, Zhicheng. 2005a. Financial Develop-ment, Market Deregulation and Growth:Evidence from China. Journal of Chi-nese Economic and Business Studies.Vol. 3 (3): 247-262.
Liang, Zhicheng. 2005b. Financial Develop-ment, Growth and Regional Disparity inPost-reform China. Presented at the
ICCS Journal of Modern Chinese Studies Vol.1 (1) 2009
82
UNU-WIDER project meeting Inequal-ity and Poverty in China. Helsinki,26-27 August 2005.
Luintel, Kul, and Mosahid Khan. 1999. AQuantitative Reassessment of the Fi-nance-Growth Nexus: Evidence from aMultivariate VAR. Journal of Develop-ment Economics. Vol. 60 (2): 381-405.
Patrick, Hugh. 1966. Financial Developmentand Economic Growth in Underdevel-oped Countries. Economic Developmentand Cultural Change. Vol. 14 (2):174-189.
Perkins, Dwight Heald. 1988. ReformingChina’s Economic System. Journal ofEconomic Literature. Vol. 26 (2):601-645.
Ram, Rati. 1999. Financial Development andEconomic Growth: Additional Evidence.Journal of Development studies. Vol. 35(4): 164-174.
Rioja, Felix, and Neven Valev. 2004. Fi-nance and the Sources of Growth atVarious Stages of Economic Develop-ment. Economic Inquiry. Vol. 42 (1):127-140.
Shan, Jordan. 2005. Does Financial Devel-opment 'Lead' Economic Growth? AVector Auto-Regression Appraisal. Ap-plied Economics. Vol. 37 (12):1353-1367.
Shan, Jordan Z., Alan G. Morris, and FionaSun. 2001. Financial Development andEconomic Growth: An Egg-and-ChickenProblem? Review of International Eco-nomics. Vol. 9 (3): 443-454.
Tavares, Jose, and Romain Wacziarg. 2001.How Democracy Affects Growth. Euro-pean Economic Review. Vol. 45 (8):1341-1378.
Tsai, Kellee. 2002. Back-Alley Banking: Pri-vate Entrepreneurs in China. CornellUniversity Press.
Wang, Yan and Yudong Yao(2003): Sourcesof China's Economic Growth1952–1999: Incorporating Human Capi-tal Accumulation. China Economic Re-view, Vol. 14 (1): 32-52.
Wong, Wei-Kang. 2007. Economic Growth:
A Channel Decomposition Exercise.Topics in Macroeconomics. BerkeleyElectronic Press. Vol. 7 (1): 1464-1464.
World Bank. 1989. World Development Re-port 1989: Financial Systems and De-velopment. Washington, D.C. OxfordUniversity Press.
Zhang Jun, Guanghua Wan and Yu Jin. 2007.The Financial Deepening-ProductivityNexus in China: 1987-2001. Journal ofChinese Economic and Business Studies.Vol. 5 (1): 37-49.
Zhang, Xiaobo and Kong-Yam Tan. 2004.Reform and the Transformation of Rentsin China. Paper presented in the confer-ence Growing Inequality in China, Cor-nell University, USA, September 25-26,2004.
Related Documents