FINANCE 7311 FINANCE 7311 Review & Financial Statement Analysis Dr. Ashvin Vibhakar Fall 2000

Welcome message from author
This document is posted to help you gain knowledge. Please leave a comment to let me know what you think about it! Share it to your friends and learn new things together.
Transcript

FINANCE 7311FINANCE 7311
Review & Financial
Statement Analysis
Dr. Ashvin Vibhakar Fall 2000

OutlineOutlineReview of Basic FinanceThe CorporationThe Accounting ModelCash FlowsFinancial Statement Analysis

Review of Basic FinanceReview of Basic Finance
Efficient MarketsRates of ReturnTime Value of MoneyBond ValuationStock Valuation

EFFICIENT MARKETSEFFICIENT MARKETSMarkets are in equilibriumExpected Returns = Required returnsExpectations are rationalInformation is reflected in price
– Information– Reflected in Price
No Arbitrage

EFFICIENT MARKETSEFFICIENT MARKETS Why do we care whether or not markets
are efficient?
Prices direct economic activity Rates of return (cost of capital) Valuation (market multiples)

RATES OF RETURNRATES OF RETURNREQUIRED RETURN
– required by investor– depends on RISK
EXPECTED RETURN– given current price & expected future CF’s
REALIZED RETURN– actual return

RISKRISKRepresents the CHANCE that ACTUAL
returns turn out to be much different than EXPECTED
Statistically: Variance Standard Deviation

TIME VALUE OF MONEYTIME VALUE OF MONEYSINGLE CASH FLOWS
Vn = Vo x (1 + R)n
FV = PV x (1 + R)n
PV = FV x (1 + R)-n
MULTIPLE CASH FLOWS PERPETUITY
PV = CF / R

TIME VALUE OF $, cont.TIME VALUE OF $, cont.ANNUITY
PV = CF X [1/ R (1 - 1/(1 + R)n ] Calculator:
PV - present value FV - future value CF - periodic payment amount R - discount rate N - number of CF’s or periods
Ordinary - end of period Due - beginning of period

BOND VALUATIONBOND VALUATION CF = coupon rate x par ÷ 2 (semi-ann.) N = number of semi-annual periods FV = par amount of bond R = investor’s required rate of return PV = price of bond
Solving for R ===> Yield to Maturity
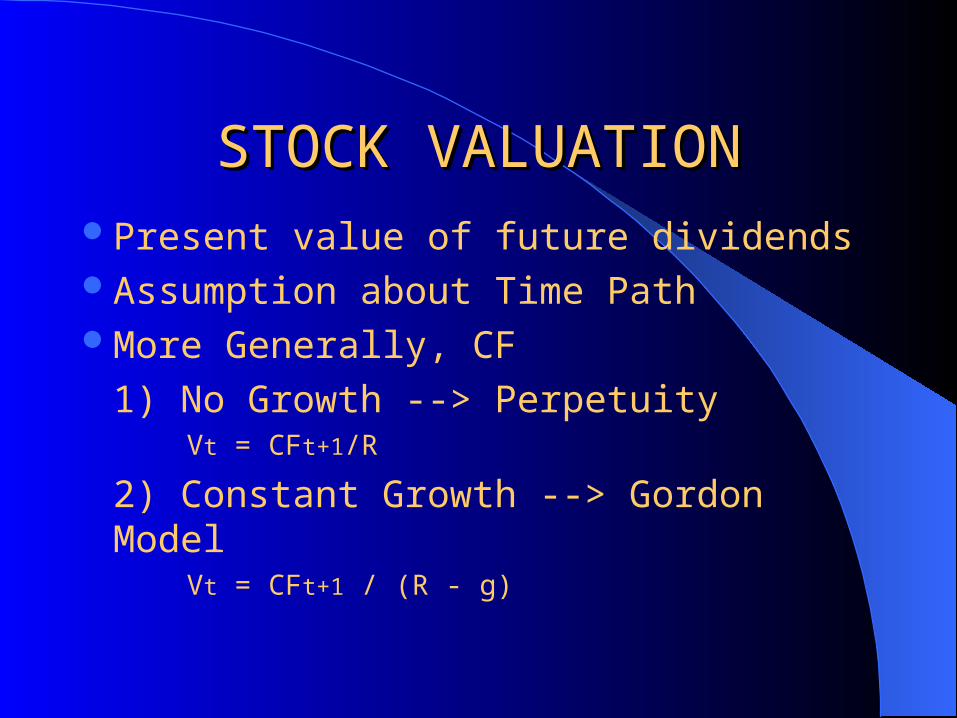
STOCK VALUATIONSTOCK VALUATIONPresent value of future dividendsAssumption about Time PathMore Generally, CF 1) No Growth --> Perpetuity
Vt = CFt+1/R
2) Constant Growth --> Gordon Model Vt = CFt+1 / (R - g)

THE CORPORATIONTHE CORPORATIONREAL ASSETS ----> CASH FLOWS
CLAIMANTS ----> - EMPLOYEES/CREDITORS- BONDHOLDERS- STOCKHOLDERS
MANAGEMENT TEAM

A Picture of the CorporationA Picture of the Corporation Real Assets & Financial Assets
ASSETS
Bondholders
Shareholders
3rd PartiesGovt; other
CF’s
Business RiskFinancial Risk
Investment Financing

MANAGEMENTMANAGEMENTOBJECTIVE: ALLOCATE COPORATE
RESOURCES IN A WAY WHICH:- Maximizes the value of the firm- Maximizes current share price
AGENCY PROBLEM- Management makes decisions which are
inconsistent with the above

MANAGEMENT DECISIONSMANAGEMENT DECISIONSINVESTMENT DECISION --> What
should be in the circle 1) Short-term assets --> Working capital
- inventory policy- A/R and A/P policy- nature and amount of S-T financing
2) L-T Assets --> Capital Budgeting- Which assets add most VALUE to the firm?

Mgmt Decisions, cont.Mgmt Decisions, cont.FINANCING DECISION- How Should Assets Be Financed?- What is the Proper Mix of Debt and Equity?
How much debt should a company have?- Risk- Taxes- Costs of financial distress- Over / Under Investment Problem

BUSINESS RISKBUSINESS RISK Assets are the SOURCE of BUSINESS
RISK DEMAND & SUPPLY VARIABILITY COMPETITION (ease of entry) TECHNOLOGY REGULATION MGMT DEPTH & BREADTH OPERATING LEVERAGE

THE ACCOUNTING MODELTHE ACCOUNTING MODELCONFORMS TO PICTURE:
NWC DEBT L-T ASSETS EQUITY
LHS = CIRCLE
RHS = RECTANGLES

DebtDebt
Interest Bearing - ‘Permanent’ Capital
Reclassify S-T portion of notes payable
Lines of Credit
Include as part of NWC

ACCOUNTING PRINCIPLESACCOUNTING PRINCIPLESCOST PRINCIPLE:
ONLY TRANSACTIONS RECORDED COST ≠ MARKET IN GENERAL
MATCHING PRINCIPLE PERFORMANCE MEASUREMENT ACCRUAL V. CASH BASIS ACCTG.

FINANCIAL STATEMENTSFINANCIAL STATEMENTSBALANCE SHEET
- Assets & Liab. as of a point in time
INCOME STATEMENT- Period of time- Include effect of accruals- Not the same as Cash Flow. Why?

BALANCE SHEETBALANCE SHEETASSETS -> something owned
- Listed in order of liquidity- NWC & Long-term
Liability -> something owed- listed in order of Claim Priority
Retained Earnings -> owned - owed- Cum. Earnings not paid as dividends

INCOME STATEMENTINCOME STATEMENT GENERAL FORMAT SALES - COS GROSS PROFIT - OPERATING EXPENSES EBIT (OPERATING PROFIT)
– EARNINGS W/O REGARD TO DEBT & TAX SITUATION

Income Statement, cont.Income Statement, cont. EBIT - INTEREST EBT (TAXABLE INCOME) - Taxes NET INCOME
NET INCOME ≠ CASH FLOW WHY?

Cash Flow v. Net IncomeCash Flow v. Net Income
Non-Cash ExpensesDepreciationAmortizationWrite-offs
AccrualsTiming Differences

CASH FLOWCASH FLOWASSETS = DEBT + EQUITY
CF FROM ASSETS = CF’S TO D + E
USES:- CF’S CONSISTENT W/ PICTURE- SOURCES / USES OF CASH- VALUATION (PROJECTED CF’S)

CF’S FROM ASSETSCF’S FROM ASSETSOperating Cash Flow EBIT + DEPRECIATION (NON-CASH ITEMS) - TAXES
- ∆NWC- CAPITAL SPENDING

CF’S TO B/H & S/HCF’S TO B/H & S/HCF’S TO B/H:
INTEREST – NET CHANGE IN DEBT
CF’S TO S/H: DIVIDENDS - NET CHANGE IN COMMON STOCK

Taxes and Cash FlowTaxes and Cash Flow
Historical - Analyzing company’s CF Use Tax number from Income Stmt
Projections - Free Cash Flow for valuation purposes
Use Tax Rate x EBIT

RATIO ANALYSISRATIO ANALYSISFINANCIAL COMPARISON TOOLRAW FINANCIAL STATEMENTS
- SIZE DIFFERENCES- DOLLAR AMOUNTS SAY LITTLE
KEY: COMPARABILITYDEFINITIONS DIFFER

BENCHMARKSBENCHMARKSHistorical Ratios of Company
- Trend Analysis- Assumes: Continuation of past
Other Companies / Industry- RMA, S&P, Hoover- Industry Publications
Projections (Forecasts)

COMMON SIZE F/SCOMMON SIZE F/SBALANCE SHEET
EXPRESS EACH ITEM AS % OF ASSETS
INCOME STATEMENT EXPRESS EACH ITEM AS % OF SALES
COMMON BASE EXPRESS EACH ITEM AS % OF BASE YEAR
(GROWTH RATE)
RATIO GROUPSRATIO GROUPSLIQUIDITYACTIVITYLEVERAGEPROFITABILITYMARKET

LIQUIDITYLIQUIDITY Ability to meet current Obligations Of Interest to Short-term Creditors
CURRENT RATIO QUICK RATIO

ACTIVITY RATIOSACTIVITY RATIOS Measures Effective Asset Use Of Interest to management & investors
ASSET TURNOVERINVENTORY TURNOVERDAYS SALES IN INVENTORYDAYS SALES OUTSTANDING

LEVERAGE RATIOSLEVERAGE RATIOS USE OF DEBT FINANCING
Ability to meet debt payments Important to long-term creditors
DEBT RATIOTIMES INTEREST EARNEDDAYS PAYABLE O/S

PROFITABILITY RATIOSPROFITABILITY RATIOS COMBINED USE OF DEBT & ASSETS IMPORTANT TO MGMT & INVESTORS
PROFIT MARGINGROSS MARGINOPERATING MARGINRETURN ON ASSETS (ROA)RETURN ON EQUITY (ROE)

DUPONT & ROICDUPONT & ROICDUPONT DECOMPOSITION OF ROE
Profitability X Asset Turnover X Leverage
ROIC EBIT X (1 - T) / (EQUITY + DEBT)
NOT AFFECTED BY LEVERAGE COMPARE WITH WACC

MARKET RATIOSMARKET RATIOSP/E RATIO
What investors are willing to pay for a $ of earnings (Current / Forecast)
What creates a high P/E?
MARKET/BOOK Usually much different than 1. EX: S&P 500 CURRENTLY = 6.4 WHY?

LIMITATIONSLIMITATIONSNO THEORY TO DEFINE ‘GOOD’ #’S HISTORICAL; NOT ECONOMICMOST AS OF SINGLE POINT IN TIME
– SEASONAL OPERATIONS– ONE-TIME EFFECTS
DESIGNED FOR MANUFACTURERS

ECONOMIC V. ACCTG. ECONOMIC V. ACCTG. EARNINGSEARNINGS
UNREALIZED GAINS & LOSSESCOST OF EQUITY
‘HIGH’ CORPORATE PROFITS
EVA - attempts to account for cost of equity
Related Documents