Mobile Phone Operating System MKT 418-Marketing Research and Analytics Team 1 Gordon, Lester, Nath, Sauer, Welhoelter

Welcome message from author
This document is posted to help you gain knowledge. Please leave a comment to let me know what you think about it! Share it to your friends and learn new things together.
Transcript

Mobile Phone Operating System
MKT 418-Marketing Research and Analytics Team 1
Gordon, Lester, Nath, Sauer, Welhoelter
Apple Overview Our client is Apple, the world’s largest information technology company and a leader in the
smartphone industry. Apple’s phones are known for their products’ design and user-friendliness. The
newest software update for the iPhone, iOS 10, was released in September 2016 and includes many new
features and drastic changes to the interface and user experience compared to iOS 9. In such a scenario, it
is crucial that Apple puts a heavy emphasis on customer reactions and on incorporating those into feature
updates consumers actually want.
The decision problem being addressed in this research is the level of customer satisfaction on the
latest iOS update, which is iOS10. For this, we would like to understand what iOS features a consumer
appreciates on their phone and how Apple’s newest iOS update compares to those needs. iOS 10 seems to
have received mixed reviews. Apple will need to decide, based on customer feedback, whether it is to the
company’s advantage to keep features new to iOS 10 active in its next update.
We will be exploring the following research questions:
● What iOS features do smartphone users desire and value the most?
● How does this information compare with the features offered in iOS 10 update?
● How satisfied are the current Apple iOS users with the newest update?
● Are iOS features distinct enough compared to Android OS features?
The aforementioned research questions will allow us to understand how consumers interact with
the iOS 10 features and whether they like them or not. Since iOS 10 was released recently, we will be
capturing the initial responses of users. We also look at data on the mobile phone industry, to understand
consumers in the entire market space. This analysis will be later supported by primary research through
surveying on diagnosis of consumers’ reactive enthusiasm.
Phone Industry Analysis
Analysis of Apple’s position in the phone industry reveals that it has a 15% market share, trailing
behind Android, which holds 82% of the overall market. Android and Apple are, by far, the two largest
players in the smartphone industry and together comprise 74% of mobile app users (Nielsen 2011).There
are, however, additional competitors (i.e. Blackberry, Firefox, Sailfish, Tizen, and Ubuntu) which
combine to make up the remaining 3% (Gartner). This comes in contrast to the common belief that iPhone
is the leader in its market. Hence, we will conduct a more in depth analysis to include features of the
Android operating system, including their latest update Android 7.0 Nougat released August 2016.
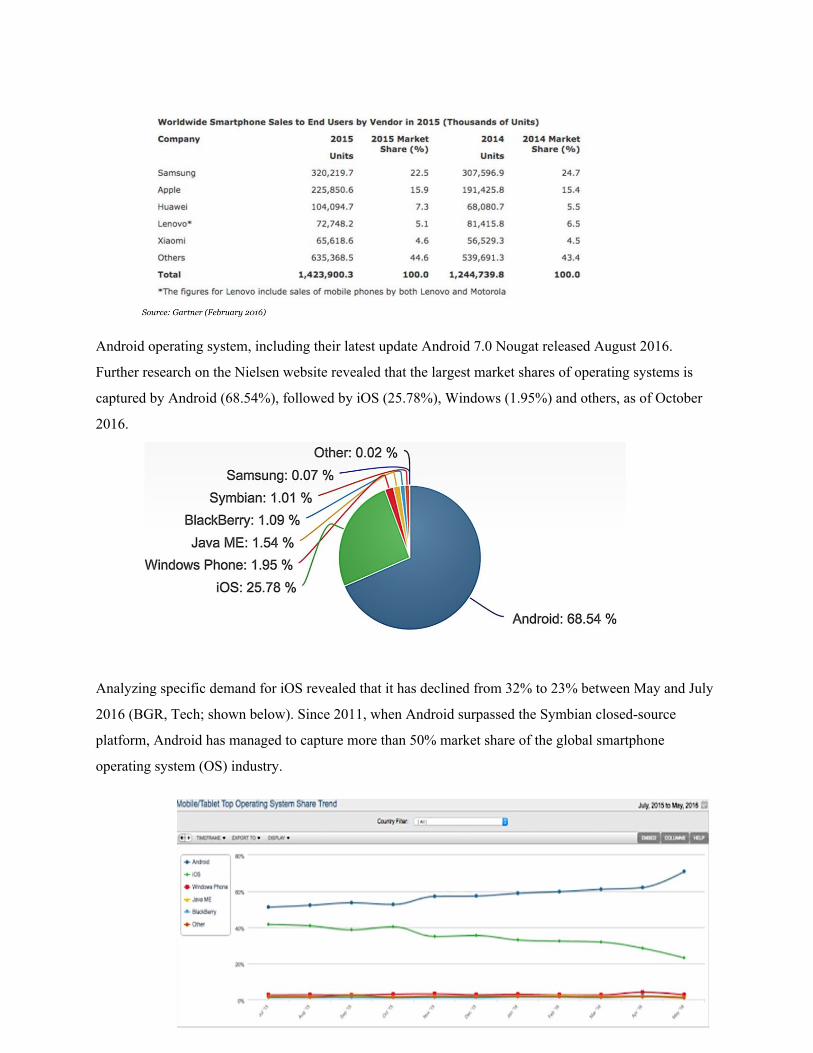
Further research on the Nielsen website revealed that the largest market shares of operating systems is
captured by Android (68.54%), followed by iOS (25.78%), Windows (1.95%) and others, as of October
2016.
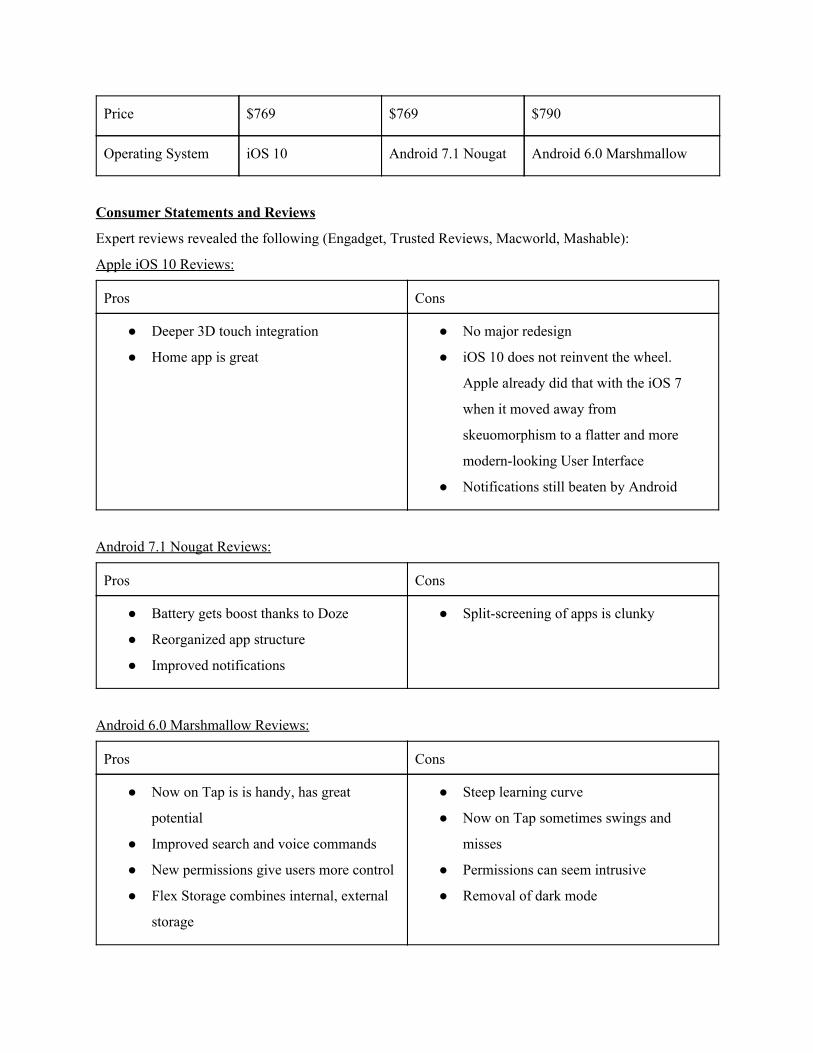
Analyzing specific demand for iOS revealed that it has declined from 32% to 23% between May and July
2016 (BGR, Tech; shown below). Since 2011, when Android surpassed the Symbian closed-source
platform, Android has managed to capture more than 50% market share of the global smartphone
operating system (OS) industry.

iOS 10 vs. iOS 9 Comparison
Features of iOS 10 Features of iOS 9
Lock Screen: new unlocking feature, faster setting control, raise to wake phone, widgets on lock screen, updated notification center, press home to unlock
Siri: an artificial intelligence and voice recognition software.
Text updates - digital touch, tap back, invisible ink, sticker animation, handwrite text message, quicktype, emoji replacement, bubble and screen effects
Search : A method to search entire phone for keywords
Photos/Camera: Advanced machine vision, memories, markup
Apple Pay Enhancements
Siri: Opens apps, understands errors, take selfies, makes whatsapp calls
Notes: A required application which creates a space for quick thoughts to be recorded
Other: Maps improvements, interface redesign, events feature
Apple Maps: Upgraded to include public transportation in route creation
Competitor Analysis
Apple has become accustomed to competing with the likes of Samsung in its search to dominate
the smartphone market. This year, the market saw a major change with the addition of Google, which
released its first smartphone on October 20th. The Pixel, Google’s newly minted creation, looks almost
identical to Apple’s iPhone 7. Inspecting the product further, however, reveals that it offers significantly
different features from its competition. For a feature comparison between the Apple iPhone 7, the Google
Pixel, and the Samsung Galaxy, please refer to the table below.
Apple iPhone 7 Google Pixel Samsung Galaxy S7 Edge
Weight 188 Grams 168 Grams 157 Grams
Water Resistance Moderate No Yes
Headphone Jack No Yes Yes
Resolution 401 ppi 534 ppi 534 ppi
Camera Megapixels 12MP, 7MP front 12MP, 8MP front 12MP, 5MP front
Battery Life (3G talk time)
21 hours 32 hours 36 hours
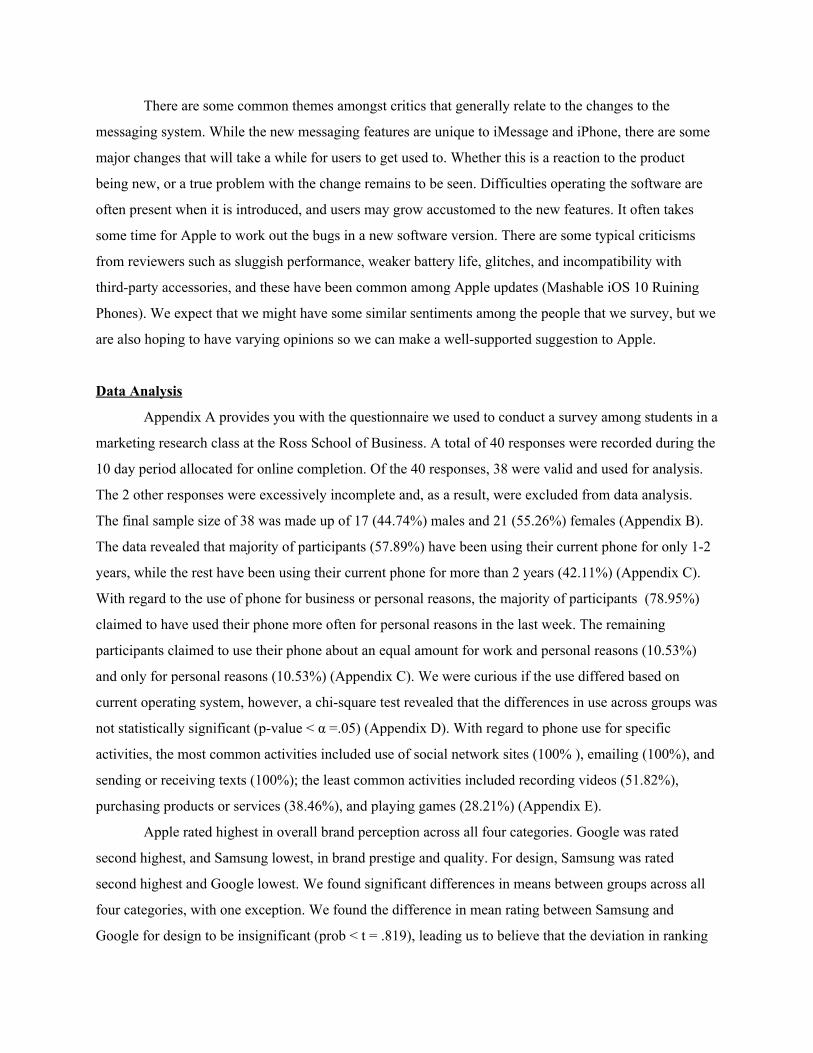
Price $769 $769 $790
Operating System iOS 10 Android 7.1 Nougat Android 6.0 Marshmallow
Consumer Statements and Reviews
Expert reviews revealed the following (Engadget, Trusted Reviews, Macworld, Mashable):
Apple iOS 10 Reviews:
Pros Cons
● Deeper 3D touch integration
● Home app is great
● No major redesign
● iOS 10 does not reinvent the wheel.
Apple already did that with the iOS 7
when it moved away from
skeuomorphism to a flatter and more
modern-looking User Interface
● Notifications still beaten by Android
Android 7.1 Nougat Reviews:
Pros Cons
● Battery gets boost thanks to Doze
● Reorganized app structure
● Improved notifications
● Split-screening of apps is clunky
Android 6.0 Marshmallow Reviews:
Pros Cons
● Now on Tap is is handy, has great
potential
● Improved search and voice commands
● New permissions give users more control
● Flex Storage combines internal, external
storage
● Steep learning curve
● Now on Tap sometimes swings and
misses
● Permissions can seem intrusive
● Removal of dark mode
There are some common themes amongst critics that generally relate to the changes to the
messaging system. While the new messaging features are unique to iMessage and iPhone, there are some
major changes that will take a while for users to get used to. Whether this is a reaction to the product
being new, or a true problem with the change remains to be seen. Difficulties operating the software are
often present when it is introduced, and users may grow accustomed to the new features. It often takes
some time for Apple to work out the bugs in a new software version. There are some typical criticisms
from reviewers such as sluggish performance, weaker battery life, glitches, and incompatibility with
third-party accessories, and these have been common among Apple updates (Mashable iOS 10 Ruining
Phones). We expect that we might have some similar sentiments among the people that we survey, but we
are also hoping to have varying opinions so we can make a well-supported suggestion to Apple.
Data Analysis
Appendix A provides you with the questionnaire we used to conduct a survey among students in a
marketing research class at the Ross School of Business. A total of 40 responses were recorded during the
10 day period allocated for online completion. Of the 40 responses, 38 were valid and used for analysis.
The 2 other responses were excessively incomplete and, as a result, were excluded from data analysis.
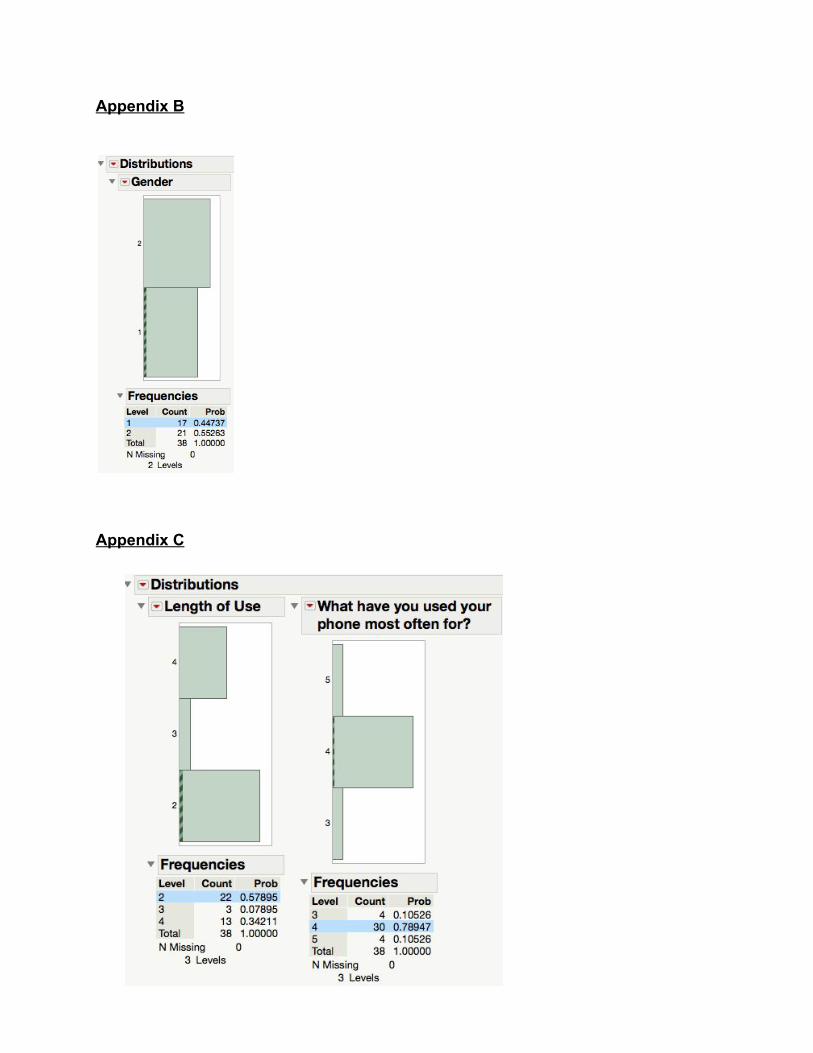
The final sample size of 38 was made up of 17 (44.74%) males and 21 (55.26%) females (Appendix B).
The data revealed that majority of participants (57.89%) have been using their current phone for only 1-2
years, while the rest have been using their current phone for more than 2 years (42.11%) (Appendix C).
With regard to the use of phone for business or personal reasons, the majority of participants (78.95%)
claimed to have used their phone more often for personal reasons in the last week. The remaining
participants claimed to use their phone about an equal amount for work and personal reasons (10.53%)
and only for personal reasons (10.53%) (Appendix C). We were curious if the use differed based on
current operating system, however, a chi-square test revealed that the differences in use across groups was
not statistically significant (p-value < α =.05) (Appendix D). With regard to phone use for specific
activities, the most common activities included use of social network sites (100% ), emailing (100%), and
sending or receiving texts (100%); the least common activities included recording videos (51.82%),
purchasing products or services (38.46%), and playing games (28.21%) (Appendix E).
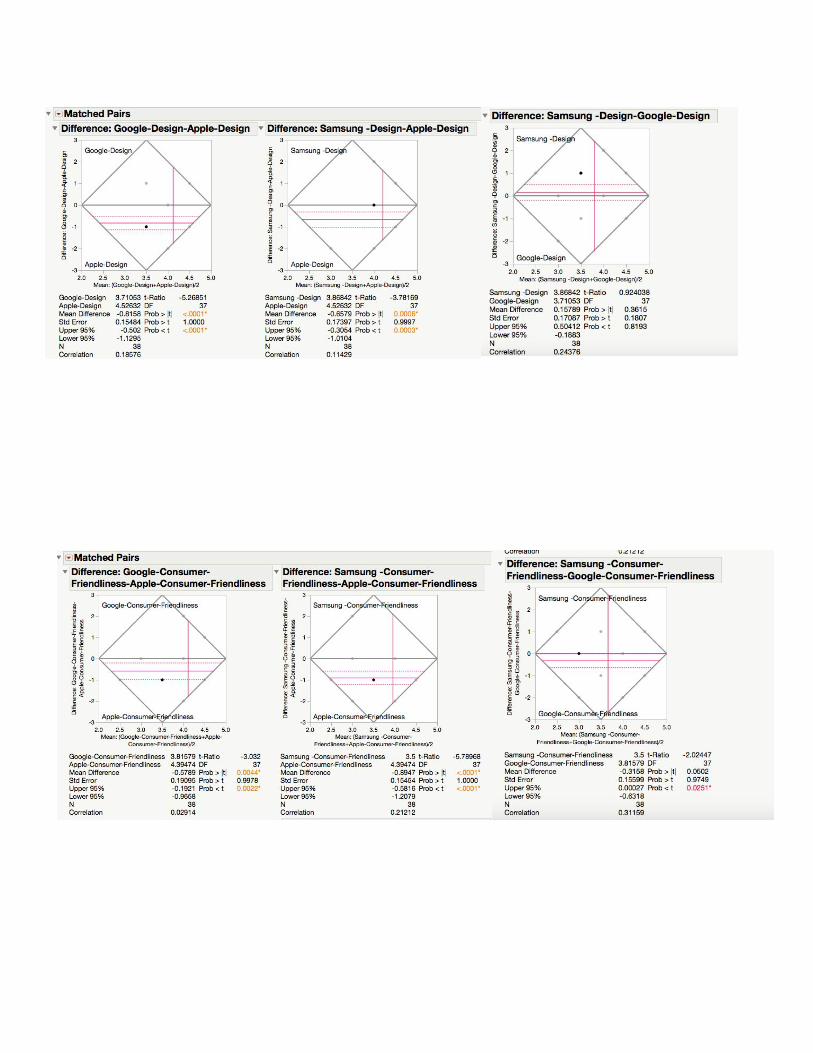
Apple rated highest in overall brand perception across all four categories. Google was rated
second highest, and Samsung lowest, in brand prestige and quality. For design, Samsung was rated
second highest and Google lowest. We found significant differences in means between groups across all
four categories, with one exception. We found the difference in mean rating between Samsung and
Google for design to be insignificant (prob < t = .819), leading us to believe that the deviation in ranking
pattern for Google and Samsung in the design category is insignificant. Therefore, overall, Apple has the
highest brand perception, Google the second highest, and Samsung the lowest (Appendix F).
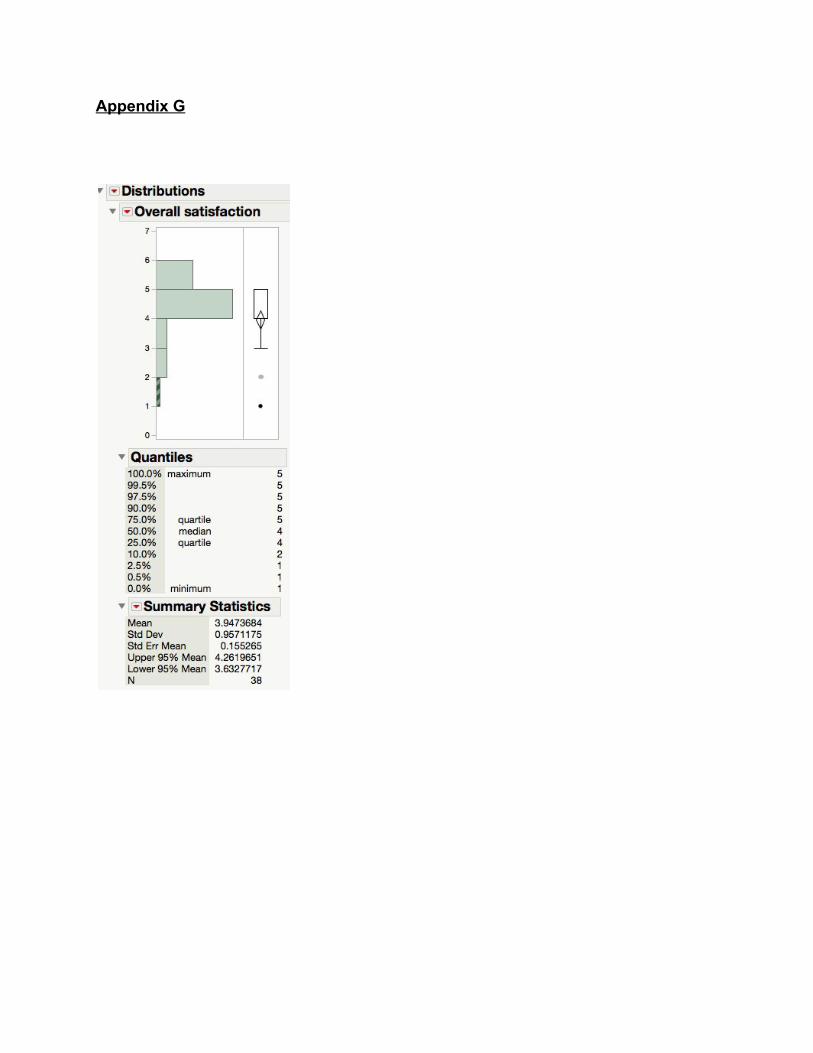
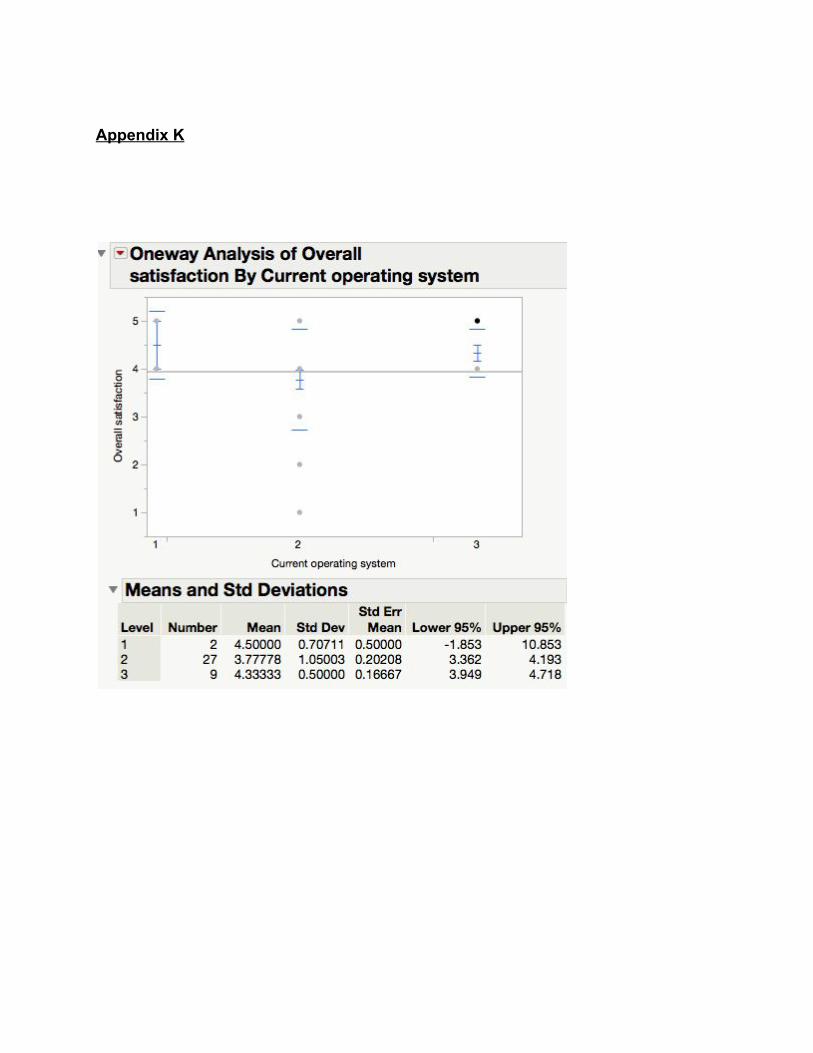
Overall satisfaction is relatively high (mean= 3.95, std dev= .96) (Appendix G). There are also no
significant differences in overall satisfaction ratings across the different user groups (a one-way ANOVA
test of the relationship between overall satisfaction and user group was not statistically significant at
p-value= .23 > α= .05). Given that the ANOVA test is not significant, the subsequent samples t-test also
showed that there is no significant difference in overall satisfaction between any pairs of groups
(Appendix E).
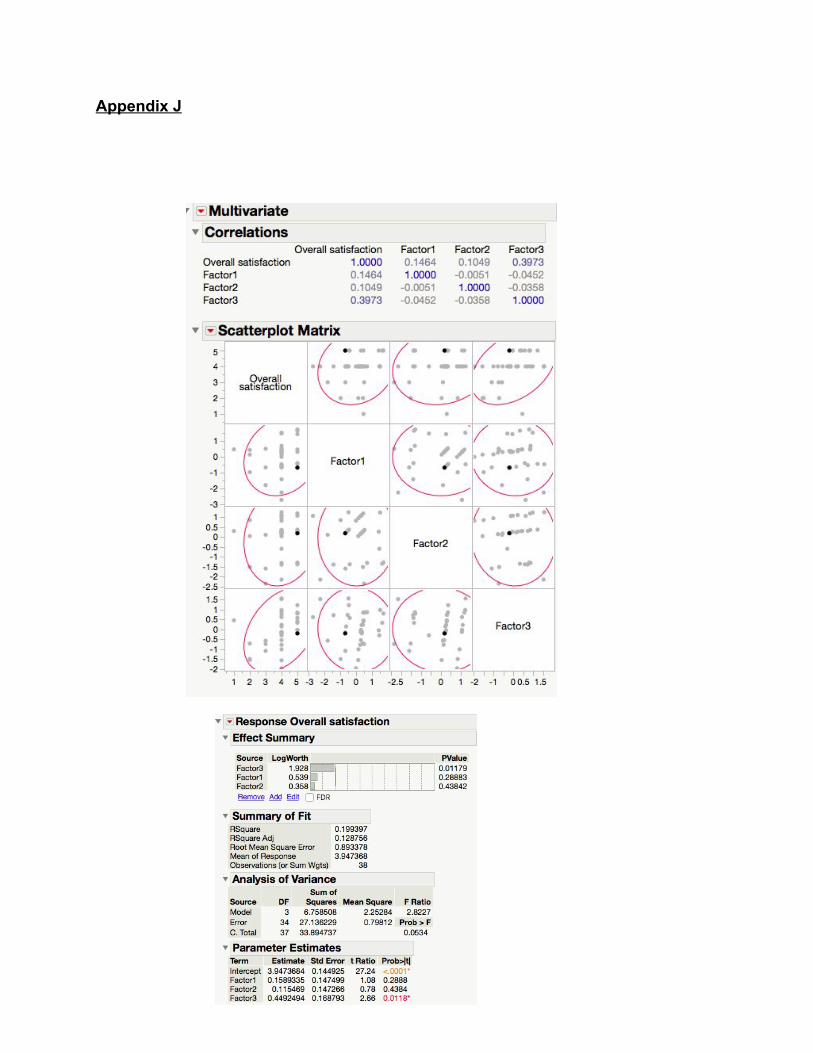
Factor analysis was done for the ten features based on satisfaction using principal component
analysis with Varimax (orthogonal) rotation. The analysis yielded three factor groups. We labeled Factor
1 “Basic”, Factor 2 “Add-ons”, and factor 3 “Ease of use” (Appendix I). Using these factors, we ran a 1
multiple linear regression with overall satisfaction as the dependent variable. The regression results
suggest that factor 3 contributed the most to overall satisfaction (Appendix J).
Among feature satisfaction, everyone, across all groups, seemed to be fairly satisfied with their
experiences. Android OS had a satisfaction rating of 4.33 (std dev= .5) and Apple iOS 10 a rating of 3.78
(std dev= 1.1). This suggests that Android is doing better than Apple when it comes to our selected
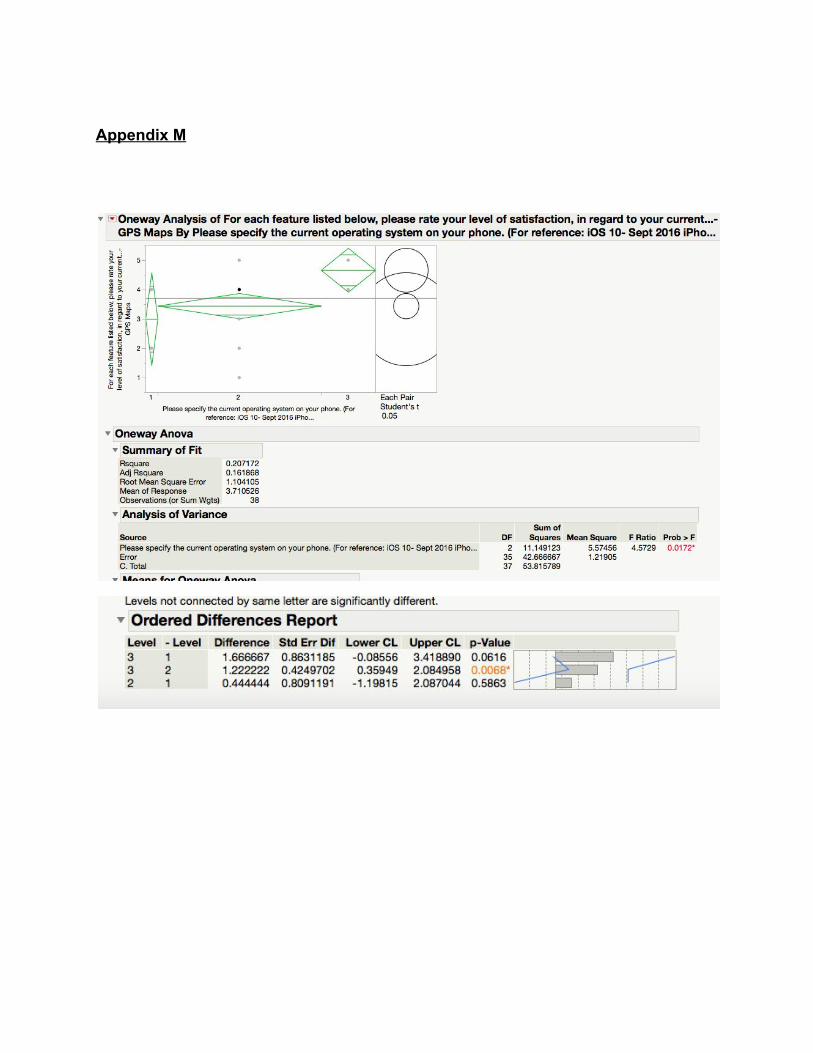
features (Appendix K). By conducting multiple Independent Samples T Tests for each feature with regard
to satisfaction, we found the only significant difference to be in GPS Maps (p-value= .0068) (Appendix
M). Android OS had a satisfaction rating of 4.67, while Apple iOS had a rating of 3.41, suggesting Apple
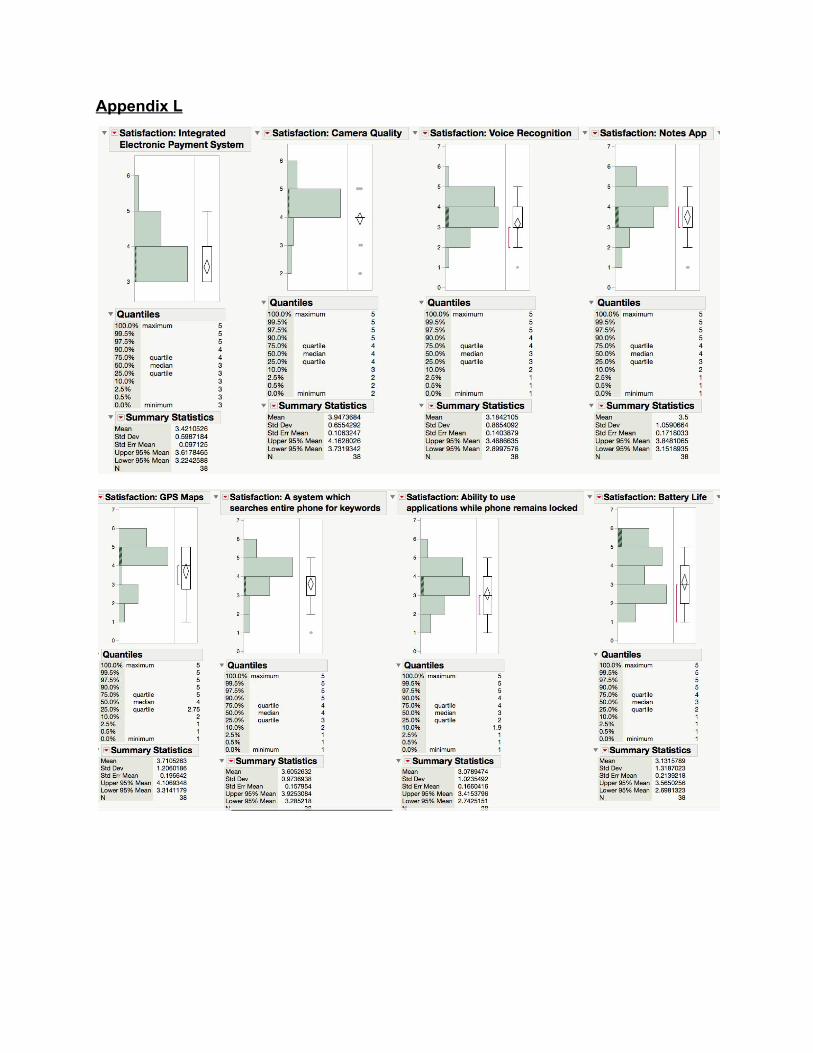
has some room for improvement. Among feature importance, battery life was most important (mean=
4.67, std dev= .85), followed by easy to use interface (mean= 4.53, std dev= .6) and GPS Maps (mean=
4.3, std dev= 1.1) (Appendix L). Across the board, there were no significant differences among the ratings
of feature importance by Apple iOS users and Android OS users.
Our question that asked if the respondent had considered switching phones in the last 6 months
was meant to see how high the switch rate might be among the different phones owned in class. Out of 38
responses, 14 (38%) had considered switching their phone. Of those, 4 said they were considering an
1 Factor 1(Basic) : A system which searches entire phone for keywords, Voice recognition, Ability to use applications while phone remains locked, Battery life, Integrated Electronic Payment System, Easy to Use Interface Factor 2 (Add ons ) : Voice recognition, GPS maps, Integrated Electronic Payment System
Factor 3 (Ease of Use) : Voice recognitions, Notes app, Easy to Use Interface

upgrade of their current phone. 2 said they were interested in the new Google phone, which is something
Apple needs to keep in mind. None said they were considering switching based on the operating system
of their current phone.
Recommendations
After analyzing the data from our survey, we have drafted a list of recommendations for Apple to
consider regarding their smartphone strategy in the immediate future. Firstly, we suggest that, as quickly
as possible, Apple begins preparing iOS 11 with a focus on user interface, battery life, and GPS guidance.
The reasoning behind our group’s selection of these three specific areas of focus is two-fold. These three
categories not only represented areas of high importance for the respondents of our survey, but also
features for which Apple was outscored by Android in terms of feature satisfaction. As such, we feel that
spending adequate resources on making drastic improvements in these areas will be of utmost importance
for Apple.
Given that we have recommended that Apple increases resources on the areas mentioned above,
we also must account for areas from which they can draw the money and time previously being focused
elsewhere. Consequently, we have identified features that, based on our data, can be deprioritized.
Employing the same selection strategy as we used previously, we simply selected areas of low importance
rather than high importance, and high satisfaction rather than low satisfaction. Keyword search, lock
screen app usage, and the mobile payment system, according to the data, comprise the lowest values for
overall importance. Additionally, Apple outscored Android regarding satisfaction in two of the three
features, trailing Android in lock screen app usage by a nearly negligible .04. We feel that because these
areas are relatively unimportant to consumers and Apple already has a lead on Android, Apple will not be
hurt by spending minimal resources on immediate improvement.
Brand prestige is an area of massive importance for Apple. Our data reveals that, in terms of pure
feature differentiation, Apple and Android are extremely similar. In fact, the only area that illustrated a
significant difference following an independent sample T-test is the GPS map app. As a result, we credit
much of Apple’s industry success to a huge advantage in brand prestige. Our prediction regarding this
hypothesis was backed up by our data, which revealed a perceived brand prestige score of 4.86/5 for
Apple, much higher than Android’s 3.32/5. Our group believes that because of this advantage, a large
degree of consumers who perceive little differentiation in specific features end up choosing Apple
products simply because they are of the Apple brand. If our assumption resembles the truth, it is crucial
that Apple continues to carry out the actions (commercials, physical store appearances, etc.) that
distinguish the brand from competitors. Without continuation of perceived value, Apple will surely begin
to relinquish market share.
In line with the consideration of competitors, our group stresses the importance of monitoring
future strategies and decisions relevant to Google’s new smartphone, the Pixel. Google is a relatively new
player in the smartphone industry, having released its premier product just under two months ago. With
that in mind, it is important to take its small market share with a grain of salt. Above, we described the
role that brand prestige plays in the technology industry. If there is a brand in the technology industry that
can compete with Apple on brand prestige alone, it’s Google. Accordingly, Apple needs to make sure that
it continues to innovate in an attempt to stand apart from Google on a product vs. product basis. The boost
that Apple receives over Android based on brand prestige is significantly reduced in the case of Google.
In summation, Apple’s focus to keep up with Android in terms of product features should be met by its
efforts to positively differentiate its products from those of Google.
Finally, the lack of differentiation in product offerings illustrates a highly competitive
marketplace. In this situation, any chance to poach wavering consumers from opposing brands should be
capitalized on as often as possible. Our data reveals that 22% of Android users have recently considered
switching phones. Although our data may not be fully representative of the complete smartphone market,
this figure hints that there is a readily available market of current Android users for Apple to focus on. To
appeal to this consumers, we once again stress the importance of improving iOS’ interface in its next
update. Android consumers value this feature highly, and our group believes that even a slight
improvement may be just enough to convince soft Android users to switch over to Apple.
Limitations
There are some issues which could hinder the data we collected from accurately reflecting the
general population. The data which has been accumulated may not be representative of an individual’s
actual values and beliefs. The respondents filling the questionnaire may be hesitant to reveal the actual
preferences and usage of their phones, due to social judgements. There may also be a possibility that
people’s opinion of their phones is influenced by their mood while they fill the questionnaire. Further, it
may also be the possibility that the respondents face distractions and don’t answer the questions with
complete sincerity. Everyone had to complete 7 other surveys. This very well may have limited the
attention each person put into the survey, leading to a lack of statistically significant data. Hence the data
accumulated may be limited by it’s accuracy.
Another limitation to our data was the incredibly small sample size we surveyed. There were only
38 eligible responses, which potentially limits how strongly the data represents the population. In
addition, a majority of the respondents were iPhone users, which is not indicative of the population, where
iPhones are a minority. Also, all of our respondents were of college age, and did not use their phones for
work nearly as much as the general population does. This led to us only approaching a small portion of
the smartphone market, as well as one which has characteristics most of the smartphone using population
may not.
To improve our research, it is necessary to survey a much larger and more diverse group. Getting
different types of phone users to respond will increase the accuracy of our data, and allow for stronger
recommendations to be delivered. Moving forward, we would also benefit from incorporating our
enhanced understanding of the respondents psychology, by rephrasing certain questions to get more
targeted responses. This would help improve both the accuracy and the usability of the data.
Conclusion
Each member of our group, to a degree, is a tech consumer in their own right. As college students
who use smartphones and laptops on a daily basis, we are all fairly tuned into consumer trends in the
technology industry. As a result, certain pieces of our data (strong brand presence for Apple, for example)
came as no surprise. That said, our data definitely brought to light some hidden details that are crucial to
success in the smartphone industry. For example, while we know that competition is intense between
major competitors, we severely overestimated the difference between Apple and Android smartphones on
a feature by feature basis. If we were given the opportunity to conduct further research for Apple directly,
we would be inclined to expand our research to a more diverse demographic to see if our results hold true
for a fully representative population. If the results indeed remained the same, we would feel an even
greater boost of validation to the recommendations listed above, and we would confidently move forward
with the strategies we devised using the results of our initial survey.

Appendix A
Phone Operating System Survey: GP2
The purpose of this research is to understand how consumers evaluate different features of a smartphone. In this questionnaire, you will find a variety of questions related to your smartphone experience. The survey will take approximately 5 minutes to complete and your answers will be kept anonymous. Please indicate your thoughts as closely and as thoroughly as possible. We appreciate your time and thank you for your valuable inputs. Consumer Thoughts 1. How long have you been using your Smartphone?
❏ Never ❏ 1-2 Years ❏ 3-4 Years ❏ >6 Years
2. In the last week, what have you used your phone most often for? Work, personal reasons, or equally both?
❏ Only for work ❏ More often for work ❏ About an equal amount for work and personal reasons ❏ More often for personal reasons ❏ Only for personal reasons
3. For which of the following activities do you presently use your phone? (Please check all that apply)
❏ Send or receive photos ❏ Play videos/movies ❏ Send or receive texts ❏ Play games ❏ Purchase products or services ❏ Record videos ❏ Play music ❏ Phone calls ❏ Emails ❏ General internet use (other than using social network sites)
❏ Use social networking websites ❏ Other (please specify)
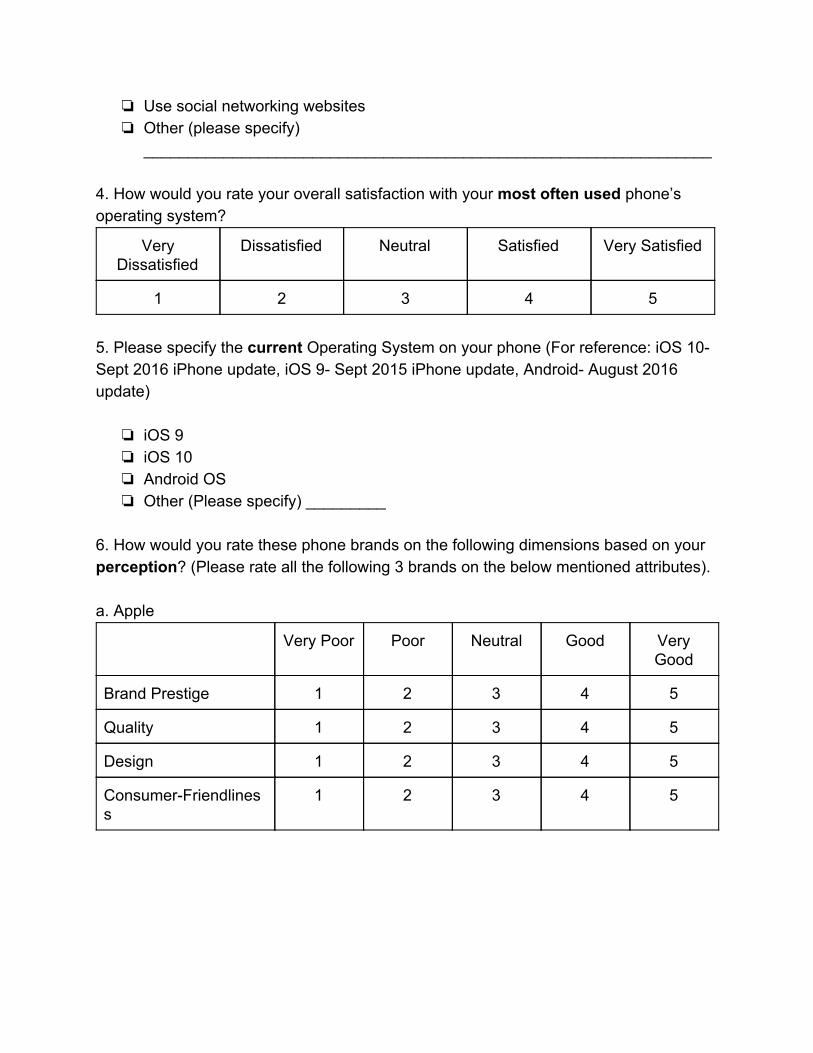
________________________________________________________________ 4. How would you rate your overall satisfaction with your most often used phone’s operating system?
Very Dissatisfied
Dissatisfied Neutral Satisfied Very Satisfied
1 2 3 4 5 5. Please specify the current Operating System on your phone (For reference: iOS 10- Sept 2016 iPhone update, iOS 9- Sept 2015 iPhone update, Android- August 2016 update)
❏ iOS 9 ❏ iOS 10 ❏ Android OS ❏ Other (Please specify) _________
6. How would you rate these phone brands on the following dimensions based on your perception? (Please rate all the following 3 brands on the below mentioned attributes). a. Apple
Very Poor Poor Neutral Good Very Good
Brand Prestige 1 2 3 4 5
Quality 1 2 3 4 5
Design 1 2 3 4 5
Consumer-Friendliness
1 2 3 4 5
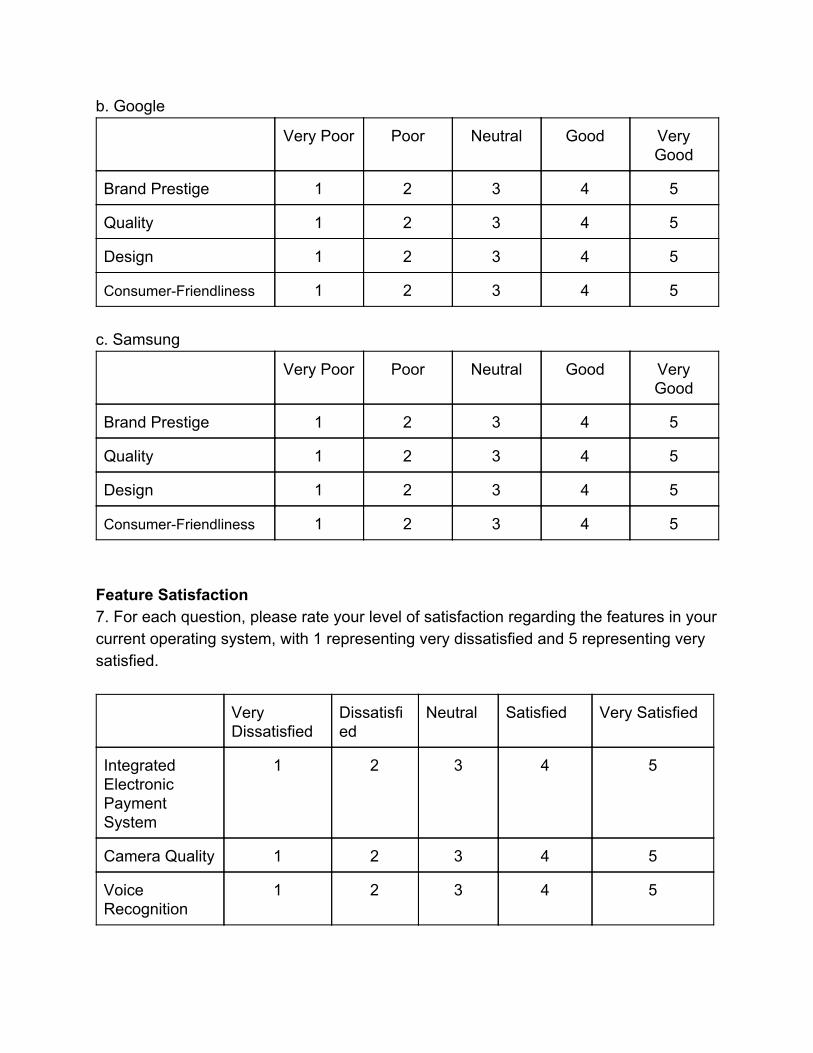
b. Google
Very Poor Poor Neutral Good Very Good
Brand Prestige 1 2 3 4 5
Quality 1 2 3 4 5
Design 1 2 3 4 5
Consumer-Friendliness 1 2 3 4 5 c. Samsung
Very Poor Poor Neutral Good Very Good
Brand Prestige 1 2 3 4 5
Quality 1 2 3 4 5
Design 1 2 3 4 5
Consumer-Friendliness 1 2 3 4 5 Feature Satisfaction 7. For each question, please rate your level of satisfaction regarding the features in your current operating system, with 1 representing very dissatisfied and 5 representing very satisfied.
Very Dissatisfied
Dissatisfied
Neutral Satisfied Very Satisfied
Integrated Electronic Payment System
1 2 3 4 5
Camera Quality 1 2 3 4 5
Voice Recognition
1 2 3 4 5
Notes App 1 2 3 4 5
GPS Maps 1 2 3 4 5
A system which searches entire phone for keywords
1 2 3 4 5
Ability to use applications while phone remains locked
1 2 3 4 5
Battery Life 1 2 3 4 5
Easy to Use Interface
1 2 3 4 5
Customizable User Interface
1 2 3 4 5
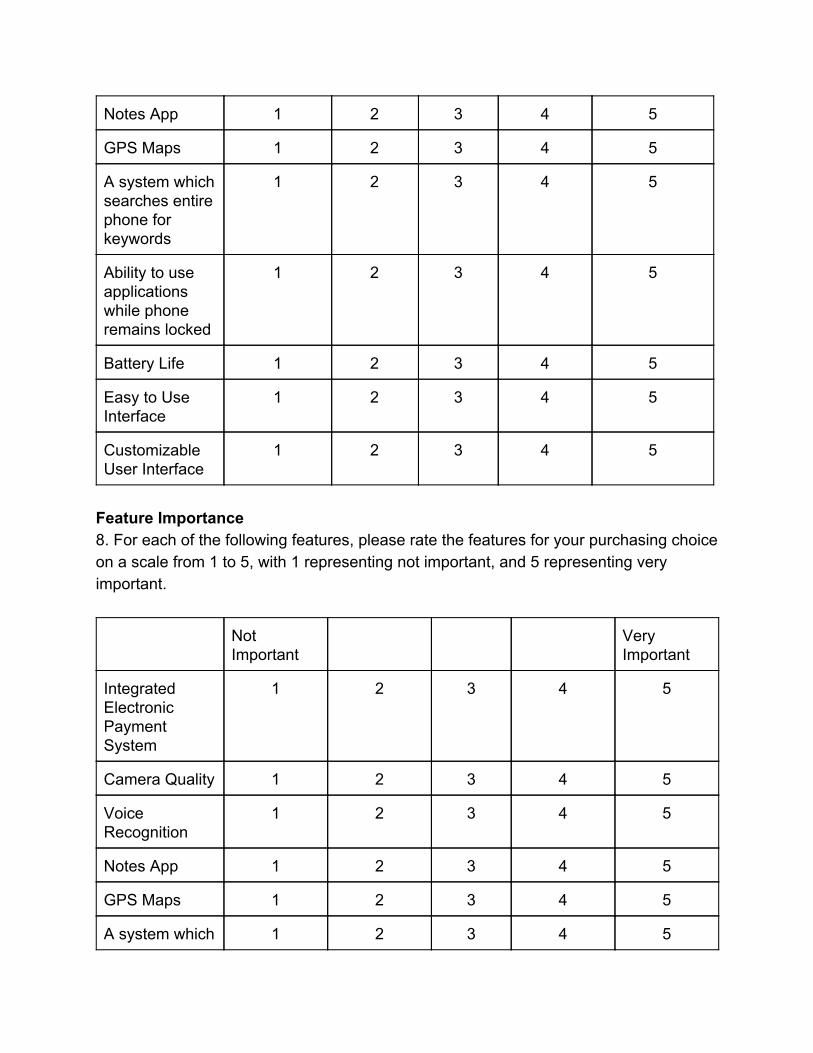
Feature Importance 8. For each of the following features, please rate the features for your purchasing choice on a scale from 1 to 5, with 1 representing not important, and 5 representing very important.
Not Important
Very Important
Integrated Electronic Payment System
1 2 3 4 5
Camera Quality 1 2 3 4 5
Voice Recognition
1 2 3 4 5
Notes App 1 2 3 4 5
GPS Maps 1 2 3 4 5
A system which 1 2 3 4 5

searches entire phone for keywords
Ability to use applications while phone remains locked
1 2 3 4 5
Battery Life 1 2 3 4 5
Easy to Use Interface
1 2 3 4 5
Customizable User Interface
1 2 3 4 5
9. Have you considered switching your phone in the last 6 months? Please explain briefly. __________________________________________________________________________________________________________________________________________________________________________________________________________________ Demographics 10. Gender (Please circle the best option)
❏ Male ❏ Female
Appendix B
Appendix C

Appendix D

Appendix E

Appendix F
Appendix G

Appendix H

Appendix I

Appendix J
Appendix K
Appendix L


Appendix M
Research Links
● http://newatlas.com/iphone-7-plus-vs-pixel-xl-comparison/45885/
● http://newatlas.com/iphone-7-plus-galaxy-s7-edge-comparison/45433/?li_source
=LI&li_medium=default-widget
● https://www.engadget.com/2016/09/16/ios-10-review/
● https://www.engadget.com/2016/08/29/android-7-0-nougat-review/
● https://www.engadget.com/2015/10/23/android-6-0-marshmallow-review-all-abou
t-polish-and-power/
● http://mashable.com/2016/09/13/apple-ios-10-review/#Ub959Kxu8Pqb
● http://www.trustedreviews.com/ios-10-review
● http://bgr.com/2016/06/02/apples-mobile-market-share-sees-big-drop-in-may-as-
android-skyrockets/
● http://www.forbes.com/sites/chuckjones/2016/02/21/apples-iphone-market-share-
vs-profits/#703af44f46f8
● http://mashable.com/2016/09/13/ios10-ruining-phones/#KFIKq1vdhiqP
Related Documents
![Bachelor of Science Degree Course · PDF file• Written Paper (Summer) One of: ... • Written Paper PH422 Solid State Physics [5] ... Inference [5] • Written Paper](https://static.cupdf.com/doc/110x72/5aa4d8067f8b9ac8748c6e5e/bachelor-of-science-degree-course-written-paper-summer-one-of-written.jpg)