CENTRAL DISTRICT • MIDDLE ST. JOHNS RIVER BASIN Final TMDL Report Nutrient TMDL for Blue Spring (Volusia County) and Blue Spring Run (Volusia County), WBIDs 28933 and 28933A Kathryn Holland and Kristina Bridger Ground Water Management Section Division of Environmental Assessment and Restoration Florida Department of Environmental Protection July 2014 2600 Blair Stone Road Mail Station 3575 Tallahassee, FL 32399-2400

Welcome message from author
This document is posted to help you gain knowledge. Please leave a comment to let me know what you think about it! Share it to your friends and learn new things together.
Transcript
CENTRAL DISTRICT • MIDDLE ST. JOHNS RIVER BASIN
Final TMDL Report
Nutrient TMDL for Blue Spring (Volusia County) and
Blue Spring Run (Volusia County), WBIDs 28933 and 28933A
Kathryn Holland and Kristina Bridger Ground Water Management Section
Division of Environmental Assessment and Restoration Florida Department of Environmental Protection
July 2014
2600 Blair Stone Road Mail Station 3575
Tallahassee, FL 32399-2400
Final TMDL Report: Middle St. Johns River Basin, Blue Spring (Volusia County) and Blue Spring Run (Volusia County), WBIDs 28933 and 28933A, Nutrients, July 2014
Acknowledgments
Thanks for contributions from Rick Hicks, Brian Katz, Gary Maddox, Edgar Wade, and Kirstin Eller in
the Florida Department of Environmental Protection’s Water Quality Evaluation and TMDL Program,
Ground Water Management Section.
Map production was carried out by Janis Morrow in the Department’s Data Services Section.
Rob Mattson, Stan Williams, Don Boniol, and Nathan Johnson at the St. Johns River Water Management
District, and Megan Keserauskis at Blue Spring State Park, provided valuable hydrologic and vegetation
data, and information on the springs and river.
Editorial assistance was provided by Linda Lord.
For additional information on the watershed management approach and impaired waters in the Middle St.
Johns River Basin, contact:
Charles Gauthier Florida Department of Environmental Protection Bureau of Watershed Restoration Watershed Planning and Coordination Section 2600 Blair Stone Road, Mail Station 3565 Tallahassee, FL 32399-2400 Email: [email protected] Phone: (850) 245–8418 Fax: (850) 245-8434 Access to all data used in the development of this report can be obtained by contacting:
Richard Hicks, P.G. Florida Department of Environmental Protection Water Quality Evaluation and TMDL Program Ground Water Management Section 2600 Blair Stone Road, Mail Station 3575 Tallahassee, FL 32399-2400 [email protected] Phone: (850) 245–8229 Fax: (850) 245–8236
Page ii of vi
Final TMDL Report: Middle St. Johns River Basin, Blue Spring (Volusia County) and Blue Spring Run (Volusia County), WBIDs 28933 and 28933A, Nutrients, July 2014
Contents
Chapter 1: INTRODUCTION ________________________________________________________1 1.1 Purpose of Report _________________________________________________________1 1.2 Background ______________________________________________________________1 1.3 Identification of Waterbodies ________________________________________________2 1.4 Ground Water Hydrology ___________________________________________________3 1.5 Blue Spring Springshed _____________________________________________________6 1.6 Population ________________________________________________________________7 1.7 Climate __________________________________________________________________8
Chapter 2: DESCRIPTION OF WATER QUALITY PROBLEM __________________________13 2.1 Statutory Requirements and Rulemaking History ______________________________13 2.2. Information on Verified Impairment _________________________________________13 2.3 Nutrients ________________________________________________________________14 2.4 Ecological Issues Related to Nutrients ________________________________________14 2.5 Other Ecological Issues ____________________________________________________19 2.6 Water Quality ____________________________________________________________19
2.6.1 Monitoring Sites and Monitoring Results _________________________________19 2.6.2 Nitrate ____________________________________________________________19 2.6.3 Phosphorus ________________________________________________________25
2.7 Discharge _______________________________________________________________26 Chapter 3. DESCRIPTION OF APPLICABLE WATER QUALITY STANDARDS AND
TARGETS ___________________________________________________________28 3.1 Classification of the Waterbody and Criterion Applicable to the TMDL ___________28 3.2 Applicable Water Quality Standards and Numeric Water Quality Targets _________28
3.2.1 Nutrients ___________________________________________________________28 3.2.2 Numeric Nutrient Criterion for Spring Vents ______________________________29 3.2.3 Outstanding Florida Water (OFW) and Other Designations __________________29
Chapter 4: ASSESSMENT OF SOURCES _____________________________________________31 4.1 Types of Sources __________________________________________________________31 4.2 Information on Potential Sources of Nitrate in the Blue Spring Springshed _________31
4.2.1 Discharge Sources Permitted under the NPDES Program ____________________32 4.2.2 Land Uses and Additional Nonpoint Sources ______________________________37
Chapter 5: DETERMINATION OF ASSIMILATIVE CAPACITY ________________________42 5.1 Determination of Loading Capacity __________________________________________42 5.2 TMDL Development Process _______________________________________________43
5.2.1 Target Setting _______________________________________________________43 5.3 Setting the Monthly Average Concentration for Nutrients _______________________43 5.4 Critical Conditions/Seasonality _____________________________________________45 5.5 Calculation of TMDL Percent Reduction _____________________________________47
Page iii of vi
Final TMDL Report: Middle St. Johns River Basin, Blue Spring (Volusia County) and Blue Spring Run (Volusia County), WBIDs 28933 and 28933A, Nutrients, July 2014
Chapter 6: DETERMINATION OF THE TMDL _______________________________________48
6.1 Expression and Allocation of the TMDL ______________________________________48 6.2 Load Allocation __________________________________________________________50 6.3 Wasteload Allocation ______________________________________________________50
6.3.1 NPDES Wastewater Discharges ________________________________________50 6.3.2 NPDES Stormwater Discharges ________________________________________51
6.4 Margin of Safety __________________________________________________________51 Chapter 7: NEXT STEPS: IMPLEMENTATION PLAN DEVELOPMENT AND
BEYOND ____________________________________________________________52 7.1 Basin Management Action Plan _____________________________________________52
References 54 Appendix A: Background Information on Federal and State Stormwater Programs __________59
List of Tables Table 2.1. Verified impaired spring-related segments in the Middle St. Johns Basin ____________14 Table 2.2. Summary data for nitrate in Blue Spring and Blue Spring Run by year,
1975–2013_____________________________________________________________25 Table 2.3. Summary data for orthophosphate (mg/L) in Volusia Blue Spring (WBID
28933) and Volusia Blue Spring Run (WBID 28933A), 2001–12 __________________26 Table 4.1. Permitted WWTFs in the Blue Spring springshed (Department WAFR) _____________34 Table 4.2. Major land uses in the springshed (SJRWMD 2009 land use coverage) _____________37 Table 5.1. Monthly average nitrate concentrations and rainfall for Blue Spring and
Blue Spring Run (January 2001–May 2013 ___________________________________45 Table 6.1. Daily maximum for target nitrate concentration (mg/L) _________________________48 Table 6.2. TMDL components for Blue Spring and Blue Spring Run _______________________50
List of Figures Figure 1.1. Major geopolitical and hydrologic features in the vicinity of Blue Spring
and Blue Spring Run ______________________________________________________4 Figure 1.2. Location of the two impaired WBIDs in Volusia County _________________________5 Figure 1.3. Conceptualized aquifer cross-section in the Blue Spring area (Source:
German 2008) ___________________________________________________________6 Figure 1.4. Aquifer Recharge Rates for the Volusia Blue Springshed _________________________9 Figure 1.5. Springshed for Blue Spring and Blue Spring Run (Source: SJRWMD) _____________10 Figure 1.6. Floridan aquifer vulnerability in the Blue Spring springshed ______________________11 Figure 1.7. Population density in the Blue Spring springshed (based on 2010 Census
data)__________________________________________________________________12 Figure 2.1. Blue Spring vent, 1997. Dark patches are algae and detritus. _____________________16 Figure 2.2. Blue Spring Run, 1997. Note fish beds and algae. _____________________________16
Page iv of vi
Final TMDL Report: Middle St. Johns River Basin, Blue Spring (Volusia County) and Blue Spring Run (Volusia County), WBIDs 28933 and 28933A, Nutrients, July 2014
Figure 2.3. Blue Spring Run south of vent, 2009. Algal growth on bare bottom
(Source: Ground Water Management Section [GWMS]). ________________________17 Figure 2.4. Algal mats north of spring vent, 2011. Greenish tint of water is due to
chlorophyll in water column (Source: GWMS). _______________________________17 Figure 2.5. Blue Spring Run looking upstream, 2010. Dark areas are algae (Source:
FGS). _________________________________________________________________18 Figure 2.6. Surface water monitoring sites associated with Blue Spring and Blue
Spring Run ____________________________________________________________21 Figure 2.7. Mean comparison by station for the verified period, plus more recent data
(2001–13) _____________________________________________________________22 Figure 2.8. Annual average nitrate concentrations in Blue Spring (WBID 28933) and
Blue Spring Run (WBID 28933A) during the period of record (1975–2013) _________________________________________________________________23
Figure 2.9. Long-term nitrate concentrations in the impaired WBIDs, 1974–2013 ______________24 Figure 2.10. Discharge in Blue Spring Run, USGS Station 02235500 (Source: USGS
2013) _________________________________________________________________27 Figure 4.1. Domestic and industrial wastewater facilities in the Blue Spring
springshed _____________________________________________________________35 Figure 4.2. Permitted MS4s in the Blue Spring springshed ________________________________36 Figure 4.3. Principal land uses in the Blue Spring springshed (based on 2006–08 GIS
coverages) _____________________________________________________________38 Figure 4.4. Density of OSTDS (septic tanks) in the Blue Spring springshed (FDOH
November 2011) ________________________________________________________41 Figure 5.1. Rainfall and Nitrate Concentrations in the Volusia Blue Springs and
Volusia Blue Spring Run, 2001–13 _________________________________________46 Figure 5.2. Flow Data (Station USGS 2235500) and Paired Nitrate Concentrations in
the Volusia Blue Springs and Volusia Blue Spring Run, 2001–13 _________________47
Page v of vi
Final TMDL Report: Middle St. Johns River Basin, Blue Spring (Volusia County) and Blue Spring Run (Volusia County), WBIDs 28933 and 28933A, Nutrients, July 2014
Websites Florida Department of Environmental Protection, Bureau of Watershed Restoration
TMDL Program
http://www.dep.state.fl.us/water/tmdl/index.htm
Identification of Impaired Surface Waters Rule
http://www.dep.state.fl.us/legal/Rules/shared/62-303/62-303.pdf
Florida STORET Program
http://www.dep.state.fl.us/water/storet/index.htm
2014 Integrated Report
http://www.dep.state.fl.us/water/docs/2014_integrated_report.pdf
Criteria for Surface Water Quality Classifications
http://www.dep.state.fl.us/legal/Rules/shared/62-302/62-302.pdf
Basin Status Report and Water Quality Assessment Report: Middle St. Johns
http://www.dep.state.fl.us/water/basin411/sj_middle/status.htm
Florida Springs
http://www.floridasprings.org/
U.S. Environmental Protection Agency, National STORET Program
Region 4: TMDLs in Florida
http://www.epa.gov/region4/water/tmdl/florida/
National STORET Program
http://www.epa.gov/storet/
Page vi of vi
Final TMDL Report: Middle St. Johns River Basin, Blue Spring (Volusia County) and Blue Spring Run (Volusia County), WBIDs 28933 and 28933A, Nutrients, July 2014
Chapter 1: INTRODUCTION
1.1 Purpose of Report This report presents the Total Maximum Daily Load for nitrate (NO3), which was determined to be a cause
of the impairment of Blue Spring (Volusia County) and Blue Spring Run (Volusia County), in the Lake
Woodruff Planning Unit of the Middle St. Johns River Basin. These waterbodies were verified by the
Florida Department of Environmental Protection as impaired for nutrients (algal mats) and included on
the Verified List of impaired waters for the Middle St. Johns River Basin that was adopted by Secretarial
Order on May 19, 2009. The TMDL establishes the allowable level of nutrient loadings to Blue Spring
and Blue Spring Run that would restore these waterbodies so that they meet their applicable water quality
criteria for nutrients. This report will be used as the basis for discussions during the development of the
Basin Management Action Plan.
1.2 Background This report was developed as part of the Department’s watershed management approach for restoring and
protecting state waters and addressing TMDL Program requirements. The watershed approach, which is
implemented using a cyclical management process that rotates through the state’s 52 river basins over a
five-year cycle, provides a framework for implementing the TMDL Program–related requirements of the
1972 federal Clean Water Act and the 1999 Florida Watershed Restoration Act (FWRA) (Chapter 99-223,
Laws of Florida).
A TMDL represents the maximum amount of a given pollutant that a waterbody can assimilate and still
meet water quality standards, including its applicable water quality criteria and its designated uses.
TMDLs are developed for waterbodies that are verified as not meeting their water quality standards and
provide important water quality restoration goals that will guide restoration activities. This TMDL report
will be followed by the development and implementation of a BMAP to reduce the amount of nutrients
that caused the verified impairment of Blue Spring and Blue Spring Run. The restoration of these
waterbodies will depend heavily on the active participation of stakeholders in the contributing area,
including Volusia County, the cities of DeLand, Deltona, DeBary, Lake Helen and Orange City, Blue
Spring Alliance, St. Johns River Water Management District (SJRWMD), Florida Department of
Agriculture and Consumer Services (FDACS), other local governments, landowners, businesses, and
private citizens.
Page 1 of 57
Final TMDL Report: Middle St. Johns River Basin, Blue Spring (Volusia County) and Blue Spring Run (Volusia County), WBIDs 28933 and 28933A, Nutrients, July 2014
The 2,644-acre Blue Spring State Park provides significant economic value to Volusia County, and that
value depends directly on the physical and biological health of the system. The park attracted nearly
500,000 visitors between 2011 and 2012 and provided over $22 million in direct economic impact while
supporting approximately 450 jobs. Visitors come to the park to swim, kayak, dive, fish, tube, and watch
the endangered West Indian manatee (Trichechus manatus latirostris) during winter months. The
numbers of visitors to the park are greatest in the colder months when manatees congregate in the spring
run, and also in the early summer when the spring and spring run are most popular for swimming and
diving (SJRWMD 2006).
Blue Spring Run, which was recognized by the Manatee Sanctuary Act of 1978 (Rule 68C-22-.012,
Florida Administrative Code [F.A.C.]) as important manatee habitat, provides the primary warm-water
winter refuge for manatees on the St. Johns River. Park records indicate that the winter manatee
population has increased since counts began in the early 1970s, from about 20 manatees counted in the
spring run during the winter of 1975 to 1976 to over 320 manatees during the winter of 2012 to 2013.
Blue Spring Run also provides the only known habitat for two endemic snail species, the Blue Spring
hydrobe (Aphaostracon asthenes) and the Blue Spring siltsnail (Floridobia parva) (Franz 1982). Other
important species that utilize these waterbodies include wading birds (herons, egrets, and limpkins),
various sportfish, and a number of marine fish species that penetrate up the St. Johns River (e.g., tarpon,
striped millet, ladyfish).
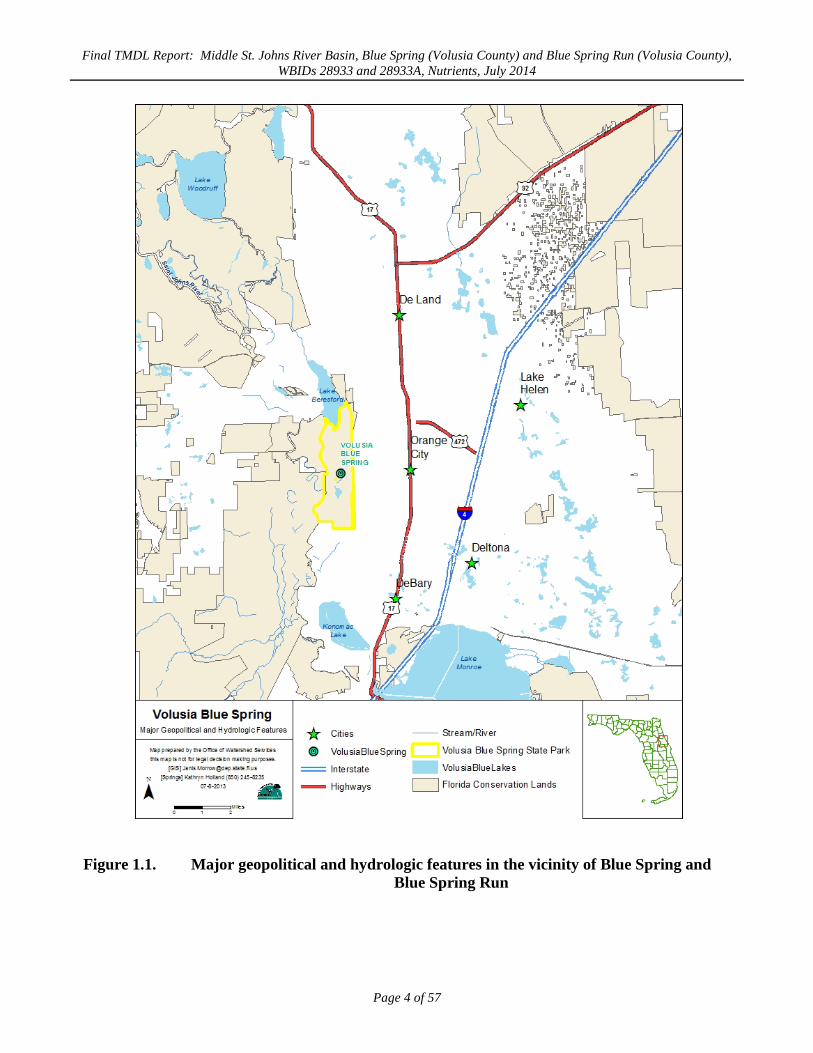
1.3 Identification of Waterbodies For assessment purposes, the Department has divided the Middle St Johns River Basin into water
assessment polygons with a unique waterbody identification (WBID) number for each watershed or
stream reach. Blue Spring and Blue Spring Run are WBIDs 28933 and 28933A, respectively. They are
located in Volusia County, Florida, about two miles west of Orange City in Blue Spring State Park (Figure
1.1).
Blue Spring (WBID 28933), the largest first-magnitude spring on the St. Johns River, discharges from an
elongated limestone opening or “vent” about 20 feet beneath the surface, and a cave system has been
mapped to a depth of about 125 feet. The spring pool is circular with a limestone and sand bottom, and
measures about 135 feet from north to south and 105 feet from east to west. Steep, sandy banks between
15 and 20 feet high surround the spring pool. Blue Spring Run (WBID 28933A) flows about 0.4 miles
Page 2 of 57
Final TMDL Report: Middle St. Johns River Basin, Blue Spring (Volusia County) and Blue Spring Run (Volusia County), WBIDs 28933 and 28933A, Nutrients, July 2014
from Blue Spring to the St. Johns River and ranges from 70 to 100 feet wide with steep, sandy banks and
steeply wooded slopes. Figure 1.2 shows the impaired WBIDs.
Evidence of human activity along an ancient sea shoreline is found in the prehistoric shell middens and
seashells in the spring run. The topography to the north and east of the impaired WBIDs is primarily deep,
well-drained sands at higher elevations (~115 feet above mean sea level [AMSL]) along the DeLand
Ridge. The land surface slopes gradually westward to less than five feet AMSL in elevation towards the
St. Johns River floodplain.
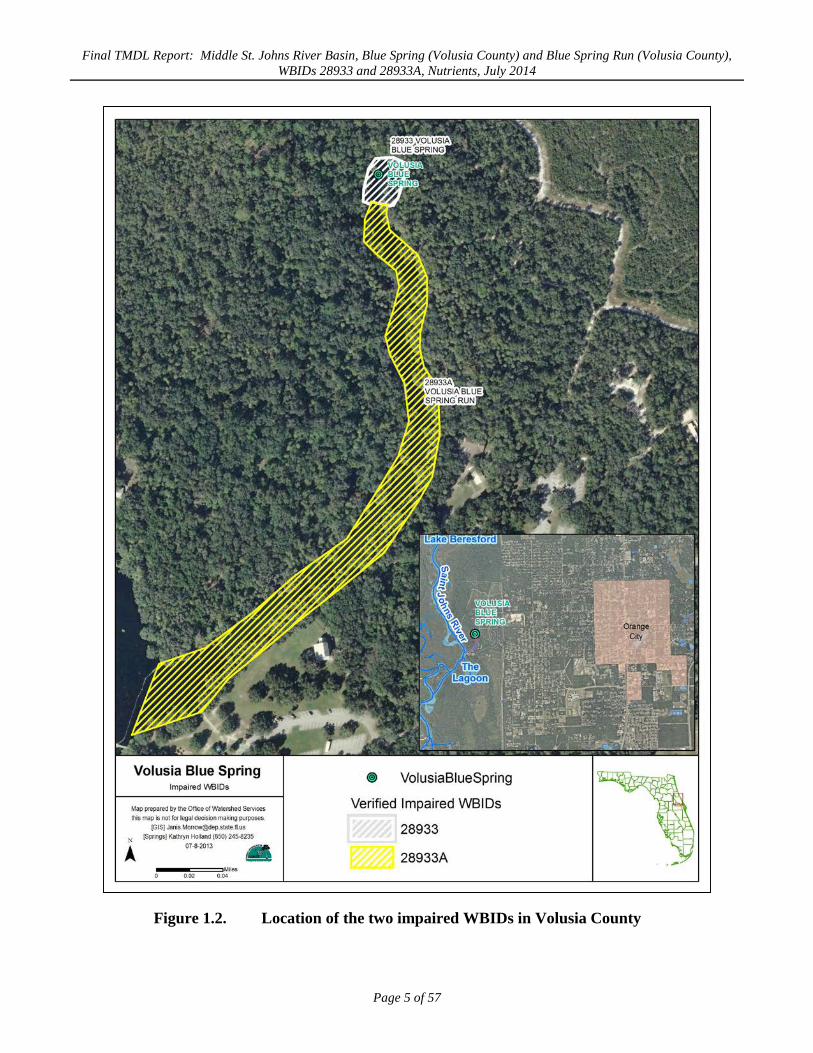
1.4 Ground Water Hydrology The upper Floridan aquifer (UFA), which occurs in Eocene-era limestone and dolostone in Volusia
County, is the primary water source that discharges from Blue Spring. The UFA lies approximately 100
feet below the land surface. The shallower surficial aquifer system (SAS), which occurs between the land
surface and up to 100 feet below the land surface, is composed of Holocene and Pleistocene sands, clays,
and shell material, and is also present in the area of Blue Spring (Wyrick 1960; Rutledge 1985; Kimrey
1990). Water movement between the SAS and the UFA is slowed by a low-permeability layer of clay,
silt, and fine sand, which form an intermediate confining unit that is perforated by sinkholes. Figure 1.3
depicts a generalized cross-section of the aquifer system in the area of Blue Spring.
Blue Spring is located on the western edge of the DeLand Ridge, which is a large area of karst development
that occurs in western Volusia County. Karst features, such as sinkholes and disappearing springs, are
developed by the dissolution of limestone. The DeLand Ridge is an area of particularly high recharge to
the underlying Floridan aquifer (Knochenmus and Beard 1971). According to the SJRWMD’s Floridan
aquifer recharge geographic information system (GIS) coverage (2005), potential recharge rates in the
Deland Ridge area range from 12 to greater than 20 inches per year.
Water discharging from Blue Spring contains higher levels of sodium and chloride than other springs
discharging from the UFA (Toth and Katz 2006; German 2008). A higher concentration of saline
indicators may be present in this spring water due to the upwelling of relict seawater from the lower
Floridan aquifer (LFA), (Toth and Katz 2006), although the percentage of LFA water is relatively small
in Blue Spring discharge (B. Katz, pers. comm., July 2013). Tibbals (1990) speculated that the north-
south trending geologic fault underlying the St. Johns River in the Blue Spring area provides hydraulic
connectivity between the UFA and the LFA. Chloride concentrations at Blue Spring appear to cycle over
time, with concentrations increasing during periods of low discharge (German 2008).
Page 3 of 57
Final TMDL Report: Middle St. Johns River Basin, Blue Spring (Volusia County) and Blue Spring Run (Volusia County), WBIDs 28933 and 28933A, Nutrients, July 2014
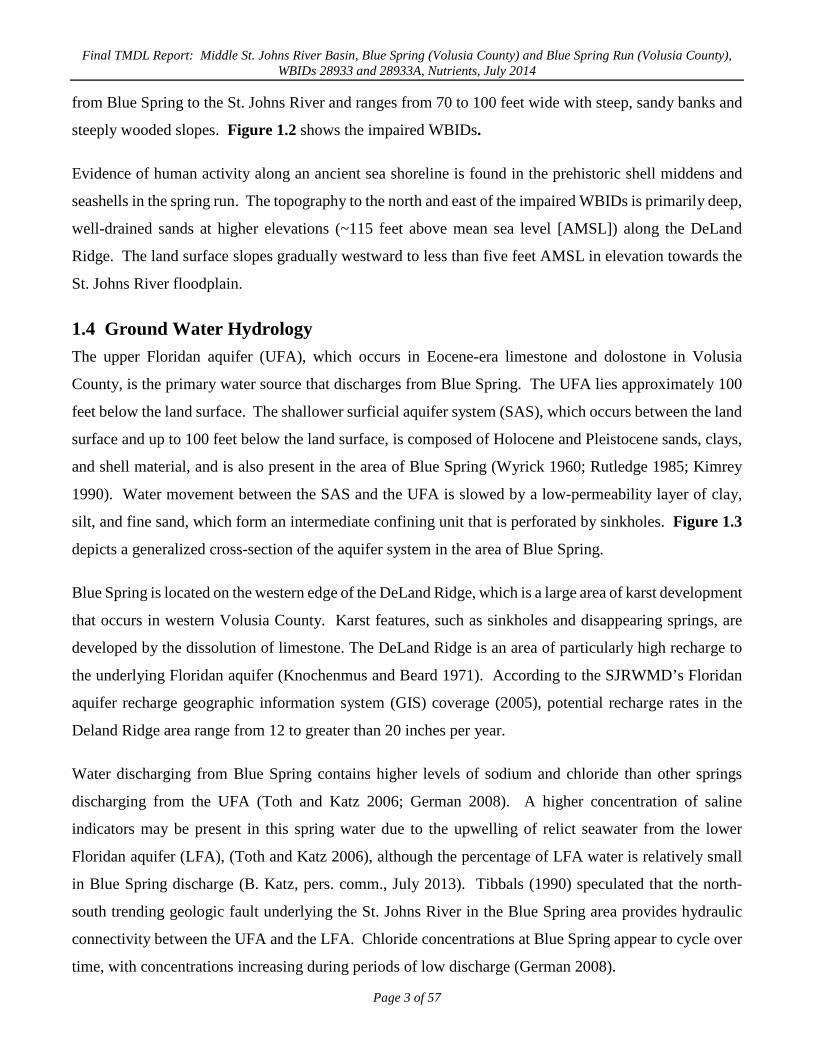
Figure 1.1. Major geopolitical and hydrologic features in the vicinity of Blue Spring and Blue Spring Run
Page 4 of 57
Final TMDL Report: Middle St. Johns River Basin, Blue Spring (Volusia County) and Blue Spring Run (Volusia County), WBIDs 28933 and 28933A, Nutrients, July 2014
Figure 1.2. Location of the two impaired WBIDs in Volusia County
Page 5 of 57
Final TMDL Report: Middle St. Johns River Basin, Blue Spring (Volusia County) and Blue Spring Run (Volusia County), WBIDs 28933 and 28933A, Nutrients, July 2014
Figure 1.3. Conceptualized aquifer cross-section in the Blue Spring area (Source: German 2008)
Age dating indicates that spring flow is dominated by ground water with an average estimated age of less than
43 years (SJRWMD; available: http://www.sjrwmd.com/springs/blue-volusia.html). Toth (1999) found that
water discharging at Blue Spring flowed through a short, shallow system and that a majority of the water
had been in the aquifer for only a few decades. Toth and Katz (2006) measured concentrations of specific
tracers and used geochemical modeling to conclude that water discharging from Blue Spring was a mixture
of water recharged during 1965, 1975, and 1990. However, spring response to rainfall events suggests
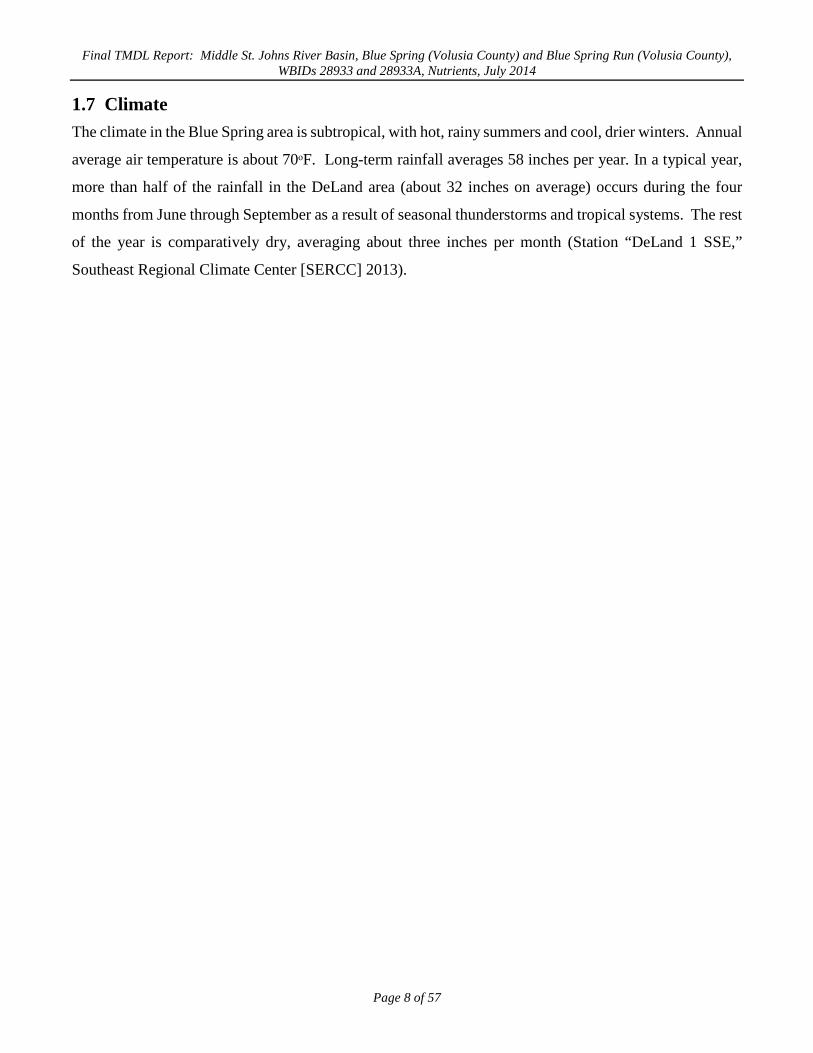
that there is also a shallower, more recent component of flow from Blue Spring. Figure 1.4 displays the
aquifer recharge rates.
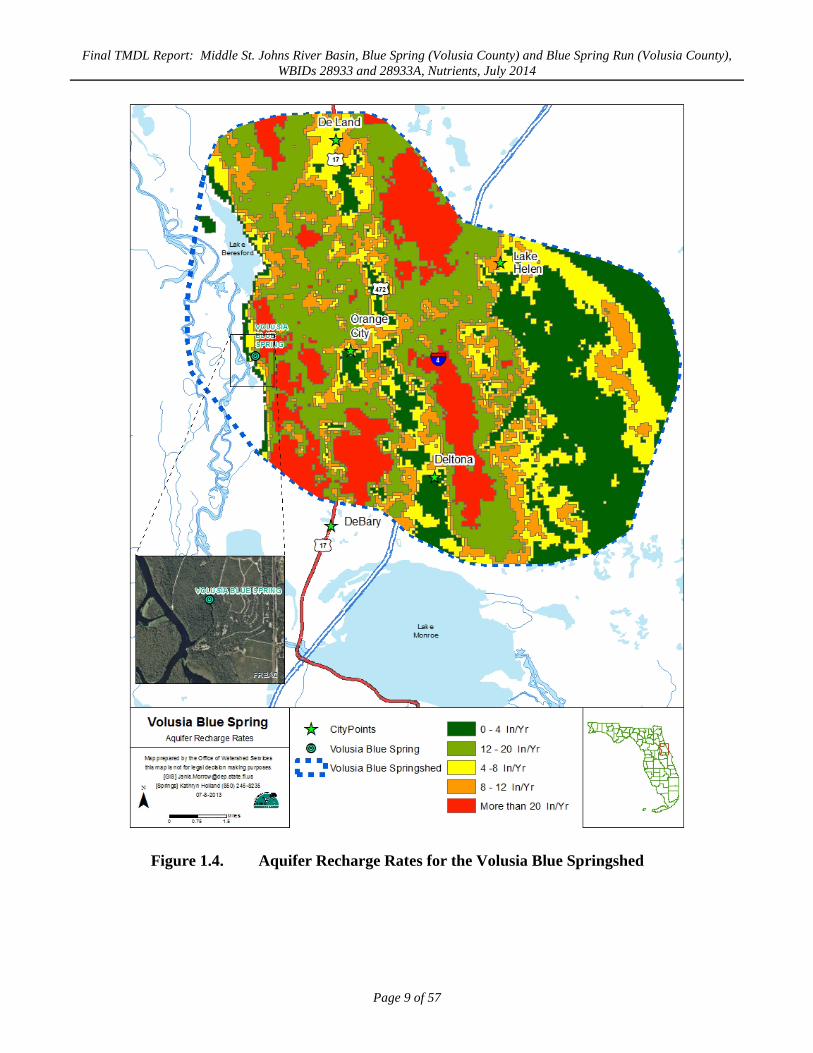
1.5 Blue Spring Springshed The area of land that contributes to spring water via ground water recharge and migration and surface
water inputs (e.g., sinkholes) is known as its springshed. The terms “recharge area” and “ground water
Page 6 of 57
Final TMDL Report: Middle St. Johns River Basin, Blue Spring (Volusia County) and Blue Spring Run (Volusia County), WBIDs 28933 and 28933A, Nutrients, July 2014
contributing area” are also used to describe a springshed. Figure 1.4 displays the aquifer recharge rates
for the Volusia Blue springshed. For this report, the Department uses the term “springshed” and the
springshed boundary developed by the SJRWMD, which is based on MODPATH/MODFLOW particle
tracking methodology (Shoemaker et al. 2004) (Figure 1.5). It is important to note that all delineated
springshed areas are indefinite and dynamic, depending on precipitation and withdrawals. The Blue Spring
springshed is about 104.3 square miles, and all of the drainage in this area is internal and entirely
dependent on recharge by local rainfall. A portion of the springshed lies west of the St. Johns River, but
the majority of the springshed is east of the river (Shoemaker et al. 2004).
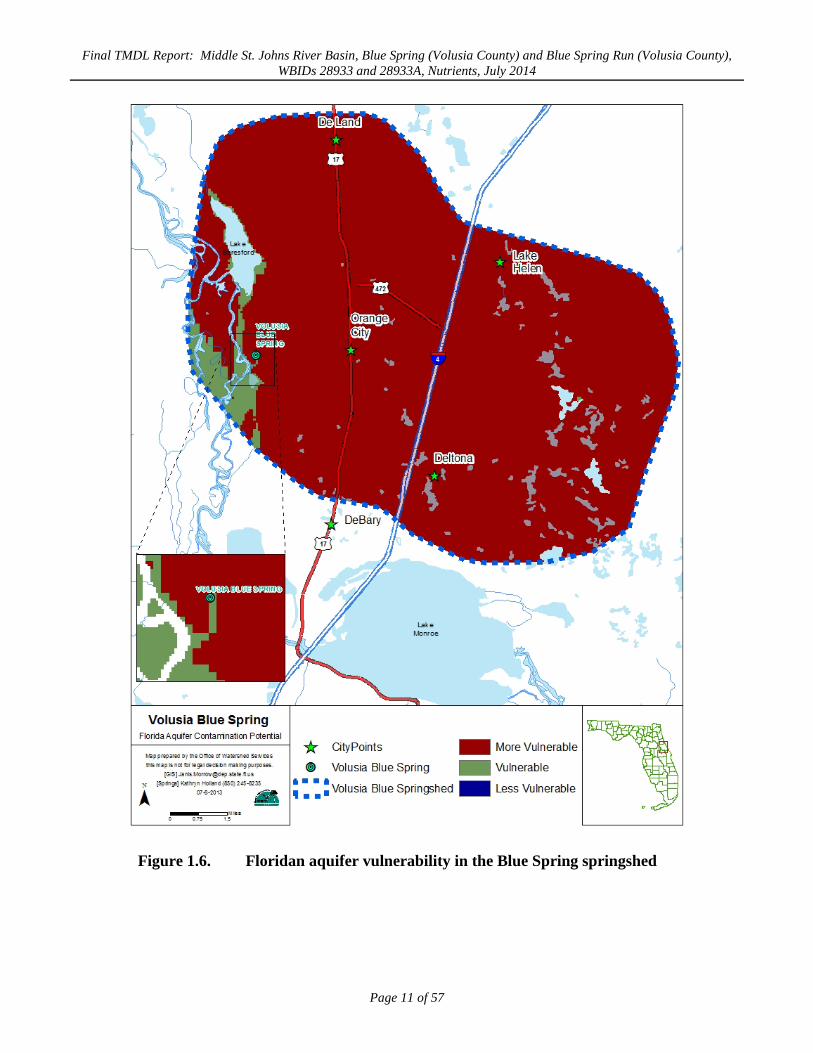
The Department evaluated potential sources of nitrogen impacting the spring and spring run in the
estimated springshed. Aquifer Vulnerability Assessments, or AVAs, are useful tools for evaluating the
potential for pollutants to enter ground water for a specific area. Modeled aquifer vulnerability is a
function of several factors, including the nature of confining sediments above the aquifer, depth to ground
water, and the presence or absence of karst features. The relative vulnerability of the FAS in the Blue
Spring springshed was assessed using the statewide Floridan Aquifer Vulnerability Assessment (FAVA)
model developed by the Florida Geological Survey (FGS) (Arthur et al. 2007). The model indicates that
the majority of the springshed is classified as “more vulnerable” to contamination (Figure 1.6).
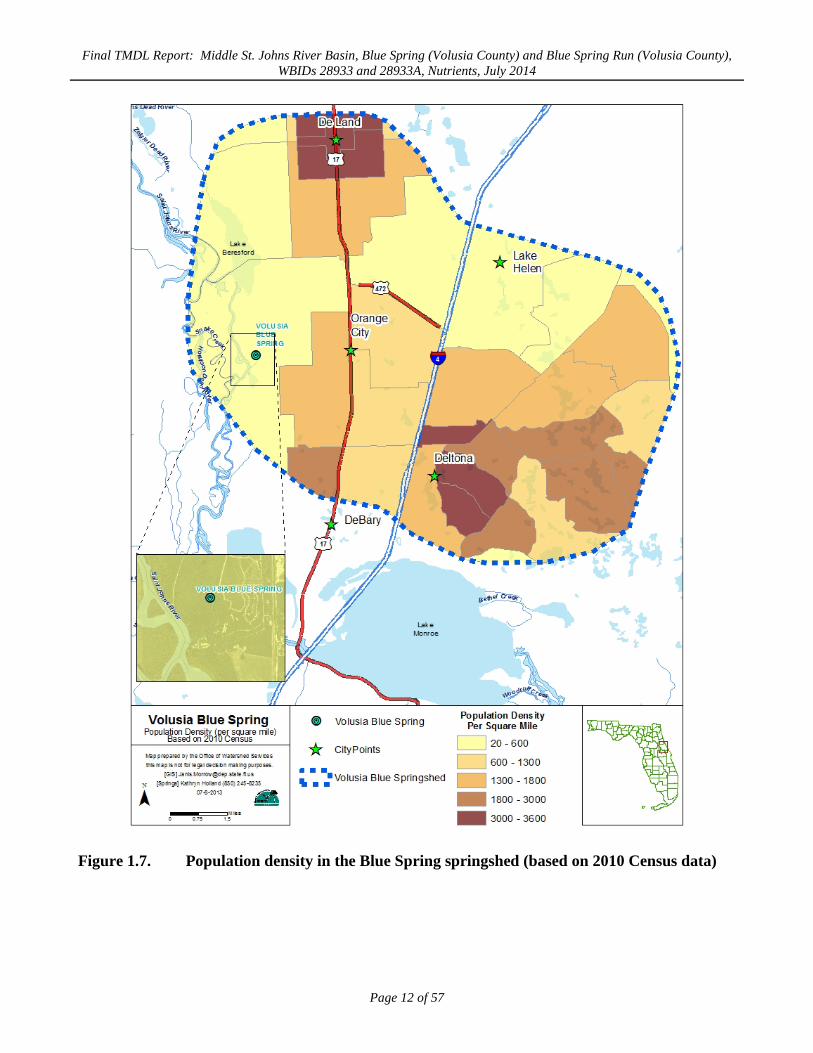
1.6 Population The total estimated population in the Blue Spring springshed is 128,920, or an average of 1,236 people
per square mile, based on the 2010 United States Census tract information (Figure 1.7). Estimated
population is based on the actual number of people in a given tract at the time of the Census and the
percentage of each tract that falls within the springshed. This calculation method assumes an even
distribution within the Census tracts.
Population centers in the springshed include Deltona, Orange City, DeBary, Lake Helen, and DeLand.
Approximately 47% of the springshed is zoned residential, the majority of which is medium-density
residential, allowing for two to five dwelling units per acre. Low-density residential allows for fewer than
two dwelling units per acre.
Page 7 of 57
Final TMDL Report: Middle St. Johns River Basin, Blue Spring (Volusia County) and Blue Spring Run (Volusia County), WBIDs 28933 and 28933A, Nutrients, July 2014
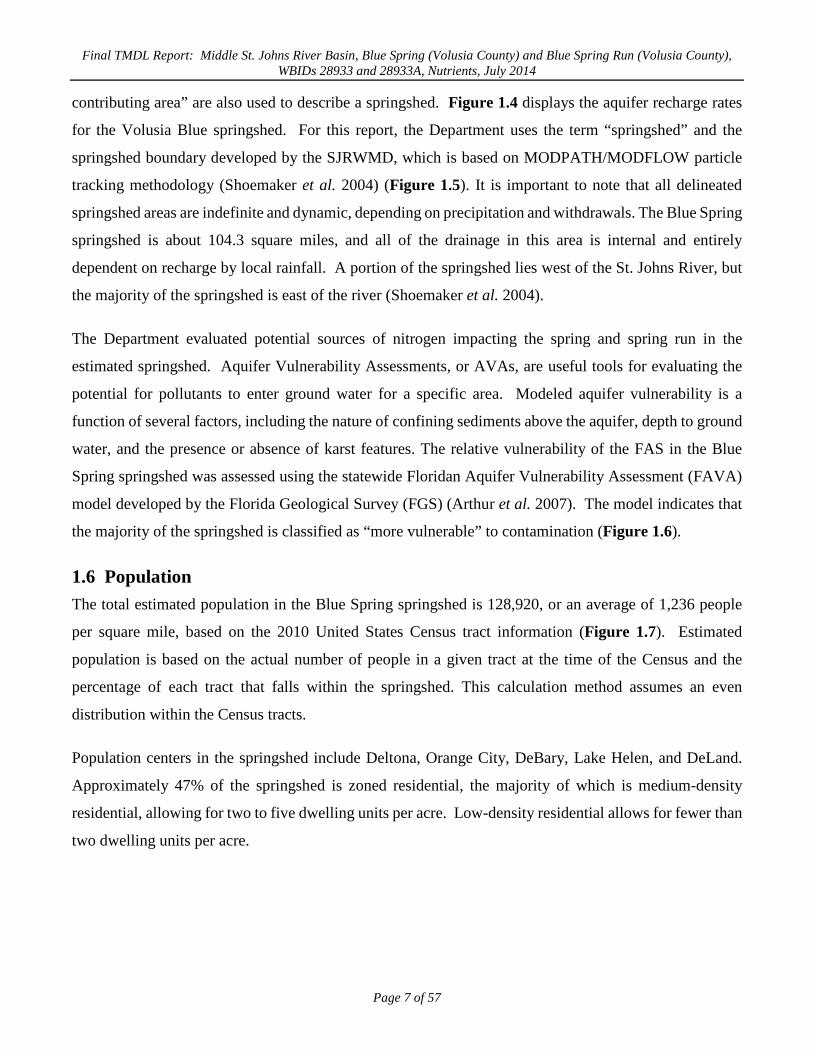
1.7 Climate The climate in the Blue Spring area is subtropical, with hot, rainy summers and cool, drier winters. Annual
average air temperature is about 70ᵒF. Long-term rainfall averages 58 inches per year. In a typical year,
more than half of the rainfall in the DeLand area (about 32 inches on average) occurs during the four
months from June through September as a result of seasonal thunderstorms and tropical systems. The rest
of the year is comparatively dry, averaging about three inches per month (Station “DeLand 1 SSE,”
Southeast Regional Climate Center [SERCC] 2013).
Page 8 of 57
Final TMDL Report: Middle St. Johns River Basin, Blue Spring (Volusia County) and Blue Spring Run (Volusia County), WBIDs 28933 and 28933A, Nutrients, July 2014
Figure 1.4. Aquifer Recharge Rates for the Volusia Blue Springshed
Page 9 of 57
Final TMDL Report: Middle St. Johns River Basin, Blue Spring (Volusia County) and Blue Spring Run (Volusia County), WBIDs 28933 and 28933A, Nutrients, July 2014
Figure 1.5. Springshed for Blue Spring and Blue Spring Run (Source: SJRWMD)
Page 10 of 57
Final TMDL Report: Middle St. Johns River Basin, Blue Spring (Volusia County) and Blue Spring Run (Volusia County), WBIDs 28933 and 28933A, Nutrients, July 2014
Figure 1.6. Floridan aquifer vulnerability in the Blue Spring springshed
Page 11 of 57
Final TMDL Report: Middle St. Johns River Basin, Blue Spring (Volusia County) and Blue Spring Run (Volusia County), WBIDs 28933 and 28933A, Nutrients, July 2014
Figure 1.7. Population density in the Blue Spring springshed (based on 2010 Census data)
Page 12 of 57
Final TMDL Report: Middle St. Johns River Basin, Blue Spring (Volusia County) and Blue Spring Run (Volusia County), WBIDs 28933 and 28933A, Nutrients, July 2014
Chapter 2: DESCRIPTION OF WATER QUALITY PROBLEM
2.1 Statutory Requirements and Rulemaking History Section 303(d) of the federal Clean Water Act requires states to submit to the United States Environmental
Protection Agency (EPA) a list of surface waters that do not meet applicable water quality standards (i.e.,
impaired waters) and establish a TMDL for each pollutant causing the impairment of listed waters on a
schedule. The Department has developed such lists, commonly referred to as 303(d) lists, since 1992.
The list of impaired waters in each basin, referred to as the Verified List, is also required by the FWRA
(Subsection 403.067[4], Florida Statutes [F.S.]), and the state’s 303(d) list is amended annually to include
basin updates.
Florida’s 1998 303(d) list included Blue Spring; however, the FWRA (Section 403.067, F.S.) stated that
all previous Florida 303(d) lists were for planning purposes only and directed the Department to develop,
and adopt by rule, a new science-based methodology to identify impaired waters. After a long rulemaking
process, the Environmental Regulation Commission adopted the new methodology as Rule 62-303, F.A.C.
(Identification of Impaired Surface Waters Rule, or IWR), in April 2001. The IWR was subsequently
modified in 2006 and 2007.
2.2. Information on Verified Impairment Rule 62-303, F.A.C., now includes a methodology for listing nutrient-impaired surface waters based on
documentation that supports the determination of an imbalance of flora or fauna. In 2009, the Department
used available water quality data provided by the SJRWMD, United States Geological Survey (USGS),
data in the IWR database, Department Springs Monitoring Network data from 2001 to 2009, Department
EcoSummaries, and other available information to document nitrate concentrations and the effects of
nutrient enrichment in the spring. WBIDs 28933 and 28933A were listed as impaired for nutrients because
of their consistently elevated concentrations of nitrate (above 0.6 milligrams per liter [mg/L]) and the
corresponding evidence of an imbalance of flora and fauna downstream. This information, documented
by Hicks et al. (2009), supplemented the determination of impairment for the 2010 Verified List of
impaired waters. Table 2.1 lists the waterbodies in the Middle St. Johns River Basin on the Cycle 2
Verified List that are addressed in this report.
Page 13 of 57
Final TMDL Report: Middle St. Johns River Basin, Blue Spring (Volusia County) and Blue Spring Run (Volusia County), WBIDs 28933 and 28933A, Nutrients, July 2014
Table 2.1. Verified impaired spring-related segments in the Middle St. Johns Basin
WBID Waterbody Segment
Parameters Assessed Using the
IWR
Projected Year of TMDL
Development
28933 Blue Spring (Volusia County)
Nutrients (Algal Mats) 2013
28933A Blue Spring Run (Volusia County)
Nutrients (Algal Mats) 2013
To ensure that this nutrient TMDL was developed based on current conditions in the spring and spring
run and that recent water quality trends in these waterbodies were adequately captured, monitoring data
collected from January 1, 2001, to May 22, 2013 were used to develop the TMDL.
2.3 Nutrients Nutrient overenrichment can cause the impairment of many surface waters, including springs. The two
major nutrient groups monitored are nitrogen (N) and phosphorus (P), which are essential nutrients to
plant life. For aquatic vegetation and algae to grow, both nutrients must be present. One nutrient can be
present in excess, but if the other is absent, the overgrowth of vegetation or algae is unlikely to occur.
Historically, many spring systems have had sufficient naturally occurring phosphorus to promote an
overgrowth of vegetation or algae, but this did not occur because nitrogen was only a minor constituent
of spring water.
Nitrate concentrations in many of Florida’s springs have increased since the 1970s. With sufficient
phosphorus in the water column, seemingly low nitrogen concentrations can cause a significant shift in
the balance of spring ecological communities, leading to the degradation of biological systems due to the
overgrowth of algae and proliferation of invasive aquatic plants (Harrington et al. 2010). Several studies
suggest that other attributes such as dissolved oxygen (DO), flow, conductivity, and salinity may also
contribute to increased algal coverage (Cowell and Botts 1994; Stevenson et al. 2004; Heffernan et al.
2010).
2.4 Ecological Issues Related to Nutrients The problems caused by increasing nutrient concentrations are not completely understood, although nitrate
levels above the natural background concentration of 0.05 mg/L support increased algal growth and
growth of the invasive exotic plant Hydrilla (Maddox et al. 1992; Harrington et al. 2010). Stevenson et
al. (2007) provides evidence of algae growth fueled by nitrate in spring-run river systems.
Page 14 of 57
Final TMDL Report: Middle St. Johns River Basin, Blue Spring (Volusia County) and Blue Spring Run (Volusia County), WBIDs 28933 and 28933A, Nutrients, July 2014
The Department’s Environmental Assessment Section documented the biological health of the spring run
on multiple occasions between October 2000 and May 2007, and the results are presented in 13
EcoSummaries (available: http://www.dep.state.fl.us/labs/cgi-bin/reports/results.asp). The high
percentage of diatoms and some blue-green algae, which are indicative of eutrophic conditions, and the
lack of macroinvertebrate habitat contributed to an overall stream health score in the “impaired” range in
12 of the 13 Ecosummaries. The first assessment scored the stream (i.e., spring run) health in the “fair”
range. Additional biological sampling results by the Department in 2007 and 2008 noted that while the
dominant algal group was Bacillariophyta (diatoms), filamentous algae dominated the periphyton
community and were in greater abundance in the upper and middle portions of the spring run, contributing
to a poor-quality macroinvertebrate community (Department 2008).
J. Hand used chemical parameters and algal measurements taken by Stevenson et al. (2004) to develop an
algal ranking system in springs. Hand determined that macroalgae thickness was in the “high” range (50%
to 75%) and the algal mat coverage was in the “very high” range (>75% coverage) at Blue Spring
(Department unpublished data). The epiphyte thickness was in the “low” range (<25%) because of the
lack of aquatic plant growth in the spring run.
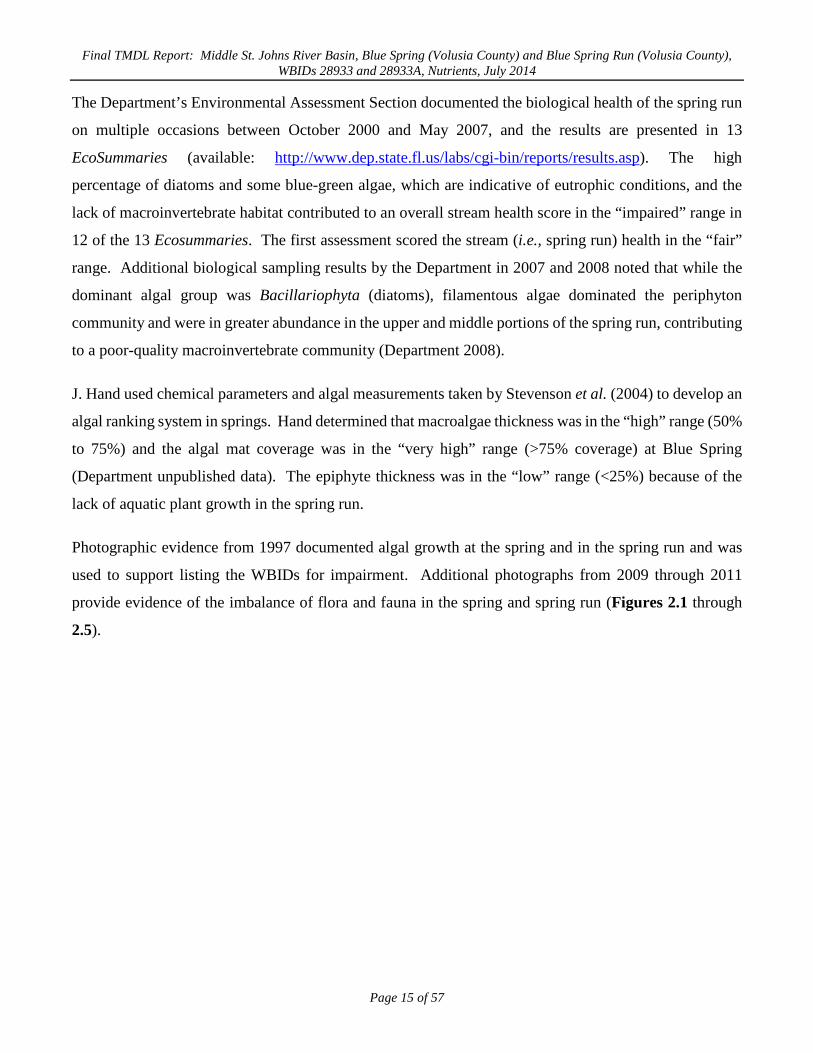
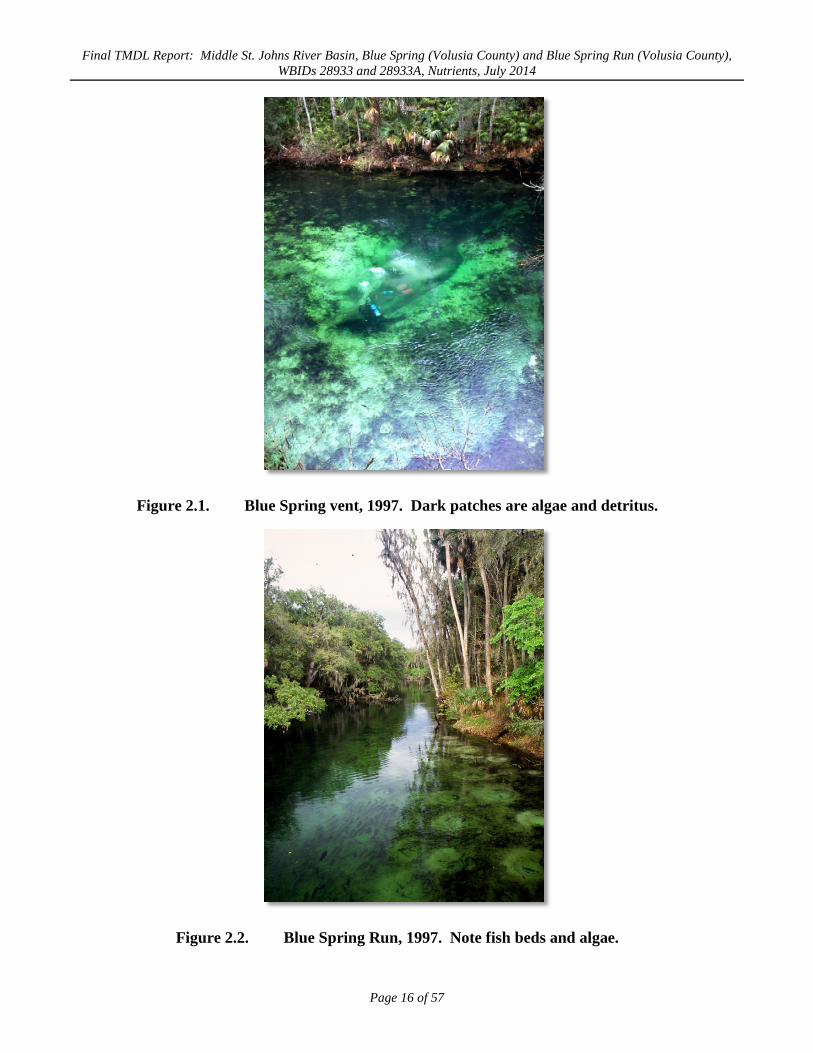
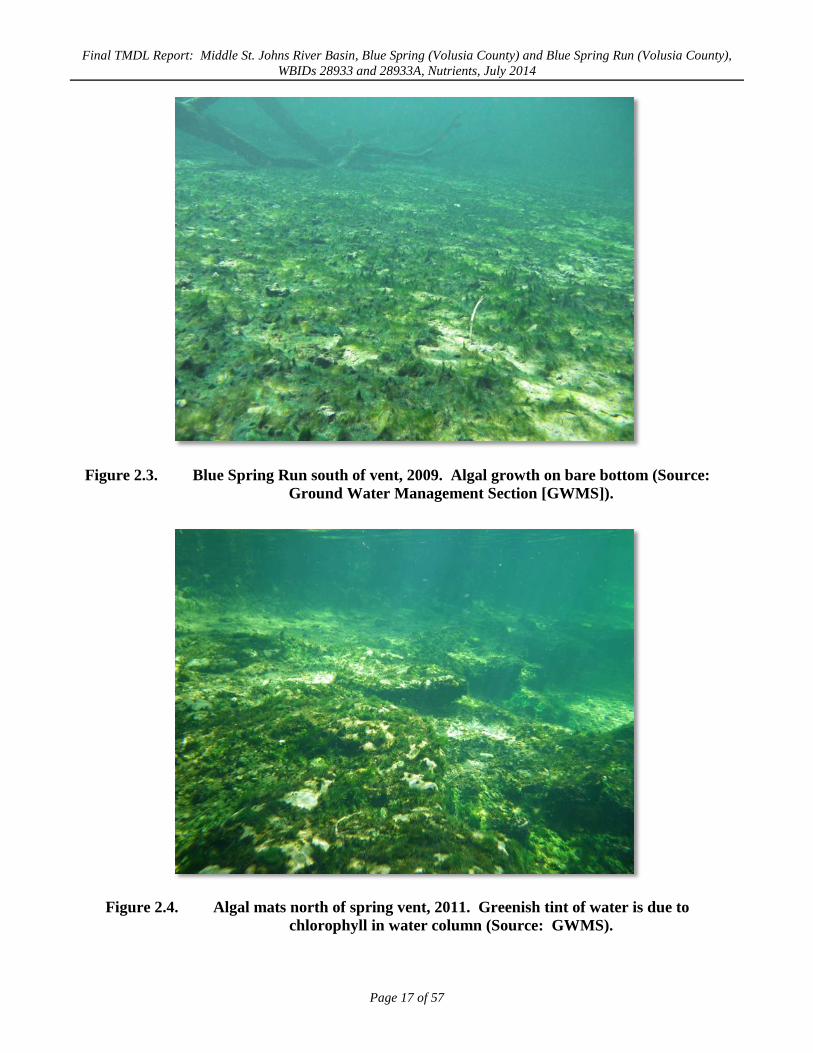
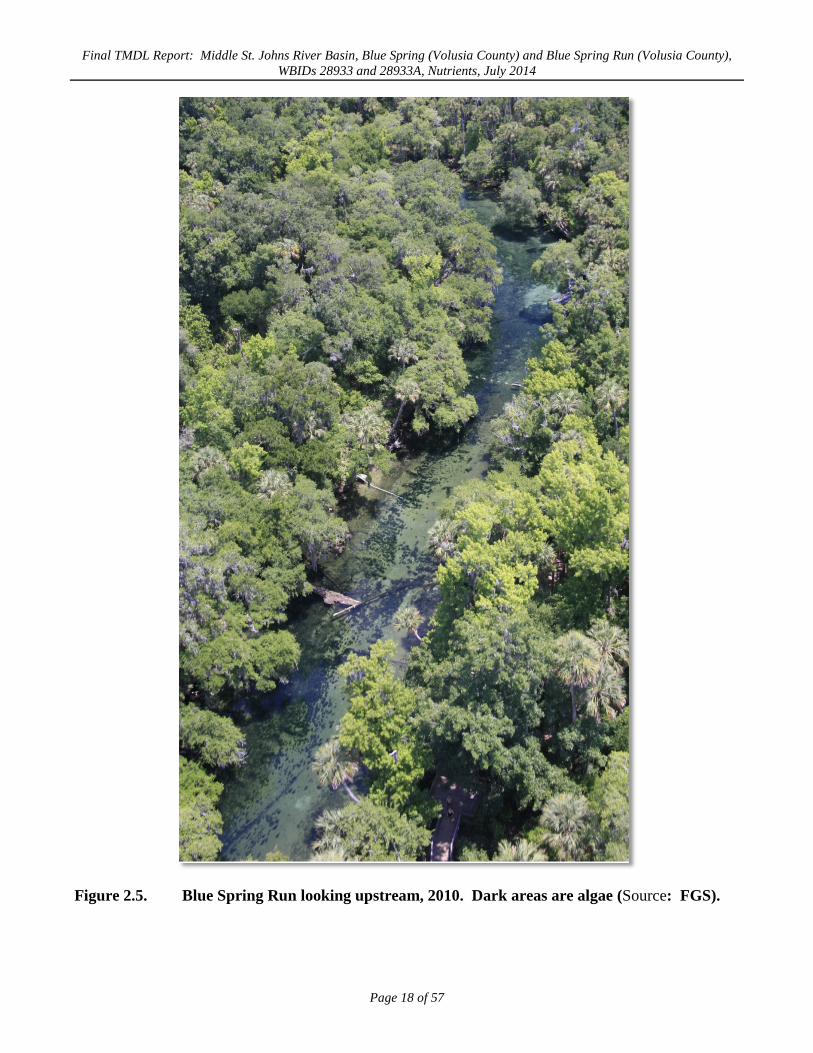
Photographic evidence from 1997 documented algal growth at the spring and in the spring run and was
used to support listing the WBIDs for impairment. Additional photographs from 2009 through 2011
provide evidence of the imbalance of flora and fauna in the spring and spring run (Figures 2.1 through
2.5).
Page 15 of 57
Final TMDL Report: Middle St. Johns River Basin, Blue Spring (Volusia County) and Blue Spring Run (Volusia County), WBIDs 28933 and 28933A, Nutrients, July 2014
Figure 2.1. Blue Spring vent, 1997. Dark patches are algae and detritus.
Figure 2.2. Blue Spring Run, 1997. Note fish beds and algae.
Page 16 of 57
Final TMDL Report: Middle St. Johns River Basin, Blue Spring (Volusia County) and Blue Spring Run (Volusia County), WBIDs 28933 and 28933A, Nutrients, July 2014
Figure 2.3. Blue Spring Run south of vent, 2009. Algal growth on bare bottom (Source: Ground Water Management Section [GWMS]).
Figure 2.4. Algal mats north of spring vent, 2011. Greenish tint of water is due to chlorophyll in water column (Source: GWMS).
Page 17 of 57
Final TMDL Report: Middle St. Johns River Basin, Blue Spring (Volusia County) and Blue Spring Run (Volusia County), WBIDs 28933 and 28933A, Nutrients, July 2014
Figure 2.5. Blue Spring Run looking upstream, 2010. Dark areas are algae (Source: FGS).
Page 18 of 57
Final TMDL Report: Middle St. Johns River Basin, Blue Spring (Volusia County) and Blue Spring Run (Volusia County), WBIDs 28933 and 28933A, Nutrients, July 2014
2.5 Other Ecological Issues In addition to contributing to increased algal problems, excess nutrients in springs may also contribute to
decreased plant and animal diversity and productivity, increased organic matter deposition, and reduced
aesthetics of the spring ecosystems (Department 2012). The potential consequences of nitrate enrichment
in springs include an increase in opportunistic primary producers, increased organic matter deposition,
greater number of nuisance algae species and algal biomass, decreased plant and animal productivity and
diversity, reduced water quality, and faunal toxicity (Mattson et al. 2007). It should be noted that factors
such as the degree of recreational use, decreased DO concentrations in Blue Spring discharge, increased
abundance of non-native, invasive fish, and elevated conductivity may either magnify or mask the effects
of nutrient enrichment (Department 2012).
A kow abundance and diversity of aquatic plants may also be a result of the high level of manatee feeding
and use of the spring run during the winter months, although observations from the 1960s and 1970s
suggest that manatee grazing is not entirely responsible for the loss of submersed aquatic vegetation (SAV)
in this system (R. Mattson, pers. comm.)
2.6 Water Quality
2.6.1 Monitoring Sites and Monitoring Results
Historical water quality data for Blue Spring and Blue Spring Run provide an indication of current versus
“background” water quality. Water quality data have been collected from various locations at the spring
and in the spring run since the 1960s. Figure 2.6 shows the locations of current and past water quality
and biological sampling stations monitored by the Department, SJRWMD, USGS, and Volusia County.
Of the 15 stations depicted, water quality data were not collected at two of the stations, which were used
for biological sampling by the Volusia County Environmental Health Department. One station was
sampled by the Department in the early 1970s, but the sampling method is no longer in use and those data
were excluded. One additional station reported results from one sample collected in 2000, and that result
is included in long-term trend analysis but not in the verified period analysis. The bulk of the water quality
data used in this evaluation were collected by the Department.
2.6.2 Nitrate
Nitrogen is found in several forms and is ubiquitous in the environment. Nitrate (NO3) is the form of
nitrogen that occurs in the highest concentrations in ground water and springs. Nitrite (NO2), an
Page 19 of 57
Final TMDL Report: Middle St. Johns River Basin, Blue Spring (Volusia County) and Blue Spring Run (Volusia County), WBIDs 28933 and 28933A, Nutrients, July 2014
intermediate form of oxidized nitrogen, is almost entirely converted to nitrate in the nitrogen cycle in the
presence of oxygen. While nitrate and nitrite are frequently analyzed and reported together as one
concentration (nitrate + nitrite), the nitrite contribution is almost always insignificant. In this report
“nitrate” is the sum of NO3 and NO2 total mg/L as nitrogen.
Nitrate data ranges from the 11 water quality sampling stations with data were assessed for spatial trend.
Based on the means and standard deviations for each station, the results indicate that the data ranges for
individual stations are similar (Figure 2.7). Therefore, the datasets from the spring vent and run were
combined and analyzed together for verified period trend analysis and target setting.
Page 20 of 57
Final TMDL Report: Middle St. Johns River Basin, Blue Spring (Volusia County) and Blue Spring Run (Volusia County), WBIDs 28933 and 28933A, Nutrients, July 2014
Figure 2.6. Surface water monitoring sites associated with Blue Spring and Blue Spring Run
Page 21 of 57
Final TMDL Report: Middle St. Johns River Basin, Blue Spring (Volusia County) and Blue Spring Run (Volusia County), WBIDs 28933 and 28933A, Nutrients, July 2014
Figure 2.7. Mean comparison by station for the verified period, plus more recent data (2001–13)
For this TMDL, long-term data were assessed to detect temporal trends. Older sampling and analysis
methods were excluded, resulting in a long-term dataset with a period of record from 1975 until 2013,
although there are some years in which no nitrate data were available (1982–84; 1986–93). The
nonparametric Mann-Kendall statistical test was used to detect temporal trends in nitrate concentrations,
and the results indicate that concentrations are increasing over time (N [results] = 28, Kendall tau = 0.51,
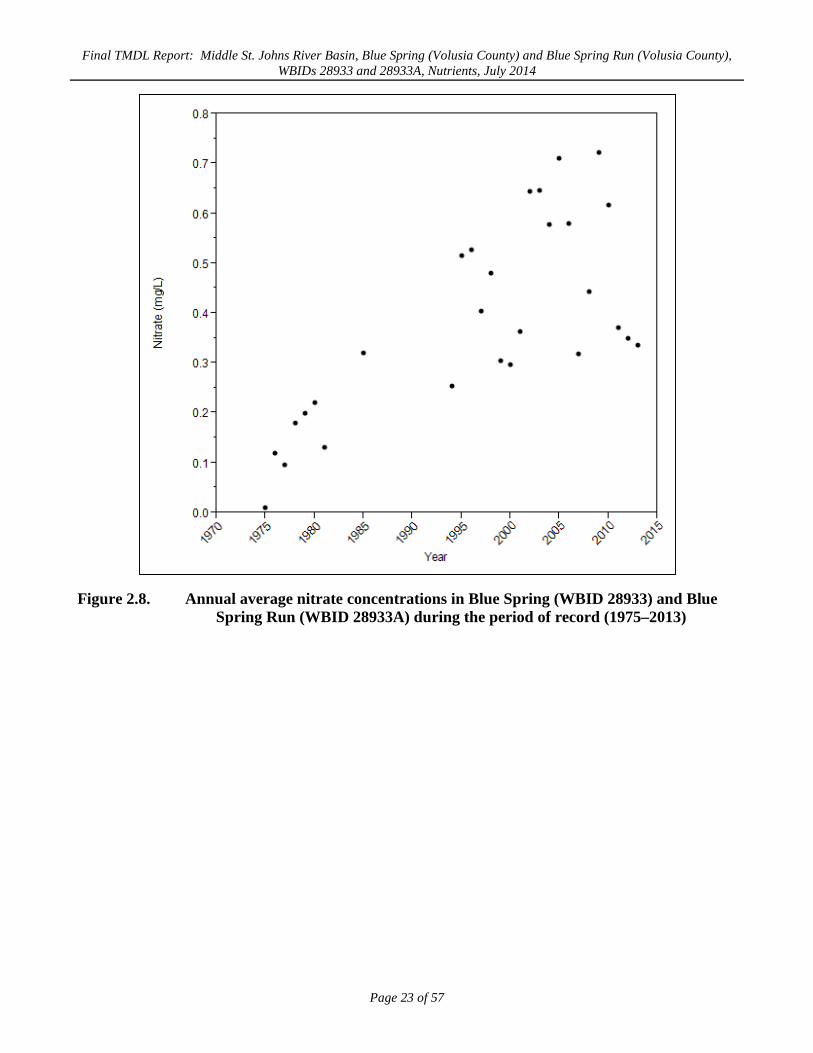
prob = 0.0001) (Figure 2.8). The long-term annual mean concentration is 0.49 mg/L, with actual
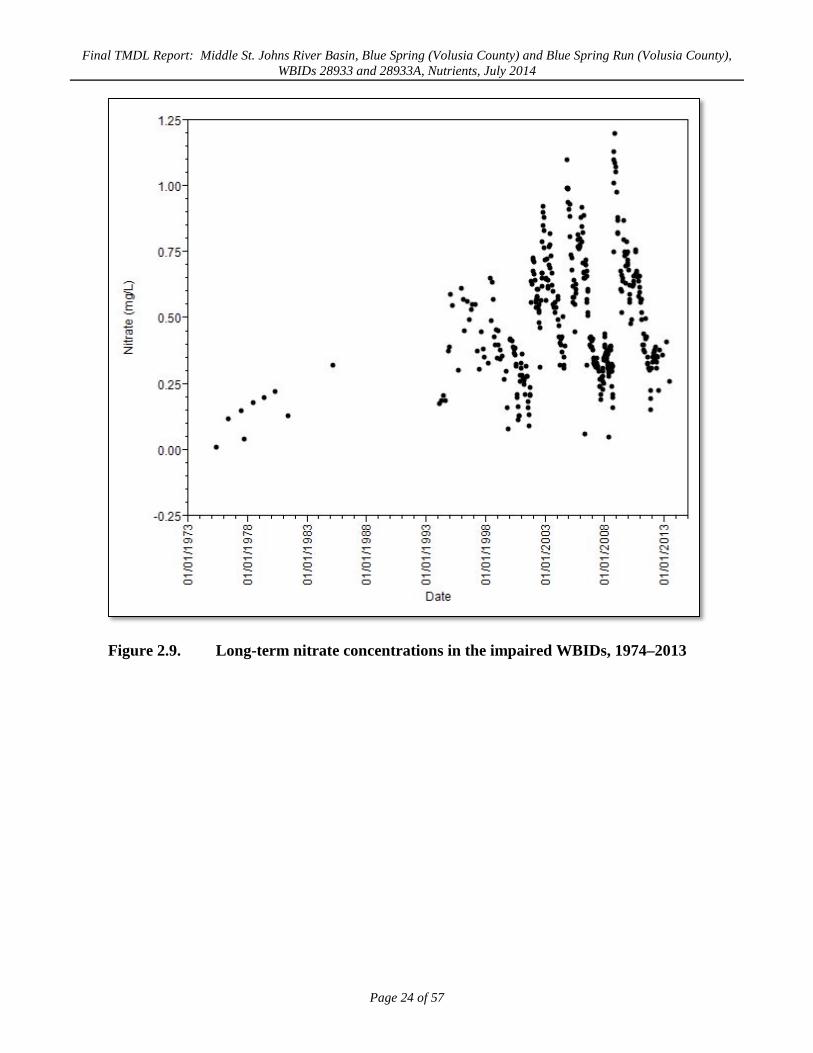
concentrations ranging from 0.01 mg/L in May 1975, to 1.20 mg/L in October 2008 (Figure 2.9). Figure
2.9 also depicts a discernible fluctuation in nitrate levels that may indicate an influence from precipitation
events. Table 2.2 summarizes the long-term nitrate results for all samples collected.
Page 22 of 57
Final TMDL Report: Middle St. Johns River Basin, Blue Spring (Volusia County) and Blue Spring Run (Volusia County), WBIDs 28933 and 28933A, Nutrients, July 2014
Figure 2.8. Annual average nitrate concentrations in Blue Spring (WBID 28933) and Blue Spring Run (WBID 28933A) during the period of record (1975–2013)
Page 23 of 57
Final TMDL Report: Middle St. Johns River Basin, Blue Spring (Volusia County) and Blue Spring Run (Volusia County), WBIDs 28933 and 28933A, Nutrients, July 2014
Figure 2.9. Long-term nitrate concentrations in the impaired WBIDs, 1974–2013
Page 24 of 57

Final TMDL Report: Middle St. Johns River Basin, Blue Spring (Volusia County) and Blue Spring Run (Volusia County), WBIDs 28933 and 28933A, Nutrients, July 2014
Table 2.2. Summary data for nitrate in Blue Spring and Blue Spring Run by year, 1975–2013
Year n Mean Minimum Maximum 1975 1 0.01 0.01 0.01 1976 1 0.12 0.12 0.12 1977 2 0.10 0.04 0.15 1978 1 0.18 0.18 0.18 1979 1 0.20 0.20 0.20 1980 1 0.22 0.22 0.22 1981 1 0.13 0.13 0.13 1985 1 0.32 0.32 0.32 1994 6 0.25 0.18 0.39 1995 4 0.51 0.30 0.62 1996 6 0.53 0.45 0.57 1997 6 0.40 0.31 0.55 1998 9 0.48 0.33 0.65 1999 9 0.30 0.08 0.45 2000 20 0.30 0.11 0.42 2001 24 0.36 0.09 0.73 2002 34 0.64 0.32 0.93 2003 21 0.65 0.52 0.82 2004 22 0.58 0.31 1.10 2005 25 0.71 0.45 0.93 2006 34 0.58 0.06 0.92 2007 41 0.32 0.19 0.44 2008 55 0.44 0.05 1.20 2009 24 0.72 0.52 0.88 2010 26 0.62 0.48 0.76 2011 26 0.37 0.15 0.57 2012 13 0.35 0.22 0.39 2013 2 0.34 0.26 0.41
2.6.3 Phosphorus
Phosphorus is naturally abundant in the geologic material in much of Florida and is often present in both
surface water and ground water. Total phosphorus (TP) is a measurement of phosphorus that includes
organic particulate forms of phosphorus found in sources such as stormwater runoff and decomposing
vegetation, and orthophosphate (PO4), which is the dissolved inorganic form of phosphorus. In general,
orthophosphate is the main form of phosphorus found in ground water in Florida, and its occurrence is
usually related to the natural abundance of phosphate in geologic material. This is also the case for most
springs. Page 25 of 57
Final TMDL Report: Middle St. Johns River Basin, Blue Spring (Volusia County) and Blue Spring Run (Volusia County), WBIDs 28933 and 28933A, Nutrients, July 2014
The annual average TP concentration was calculated from 1972 to 2012 and plotted over time. Phosphorus
does not show an increasing temporal trend in the Blue Spring system, and concentrations remain close to
levels found in the 1970s. Table 2.3 displays the annual averages for TP in Blue Spring and Blue Spring
Run. The median TP concentration is 0.07 mg/L. Florida has not established numeric criteria for TP in
springs or spring runs; however, an in-stream protection value not exceeding 0.12 mg/L of TP more than
once within a three-year period was established in the Peninsula (Department 2012). Phosphorus was not
considered a target nutrient for the listing of Blue Spring or Blue Spring Run or for this TMDL because
the available data indicate that its occurrence is due to natural sources.
Table 2.3. Summary data for orthophosphate (mg/L) in Volusia Blue Spring (WBID 28933) and Volusia Blue Spring Run (WBID 28933A), 2001–12
Year N Mean Minimum Maximum 2001 2 0.069 0.063 0.074 2002 3 0.072 0.064 0.078 2003 4 0.067 0.062 0.07 2004 6 0.066 0.05 0.079 2005 9 0.060 0.05 0.07 2006 14 0.065 0.0595 0.071 2007 22 0.060 0.045 0.07 2008 52 0.068 0.02 0.118 2009 26 0.063 0.052 0.072 2010 26 0.070 0.05 0.079 2011 26 0.066 0.055 0.074 2012 2 0.070 0.063 0.074
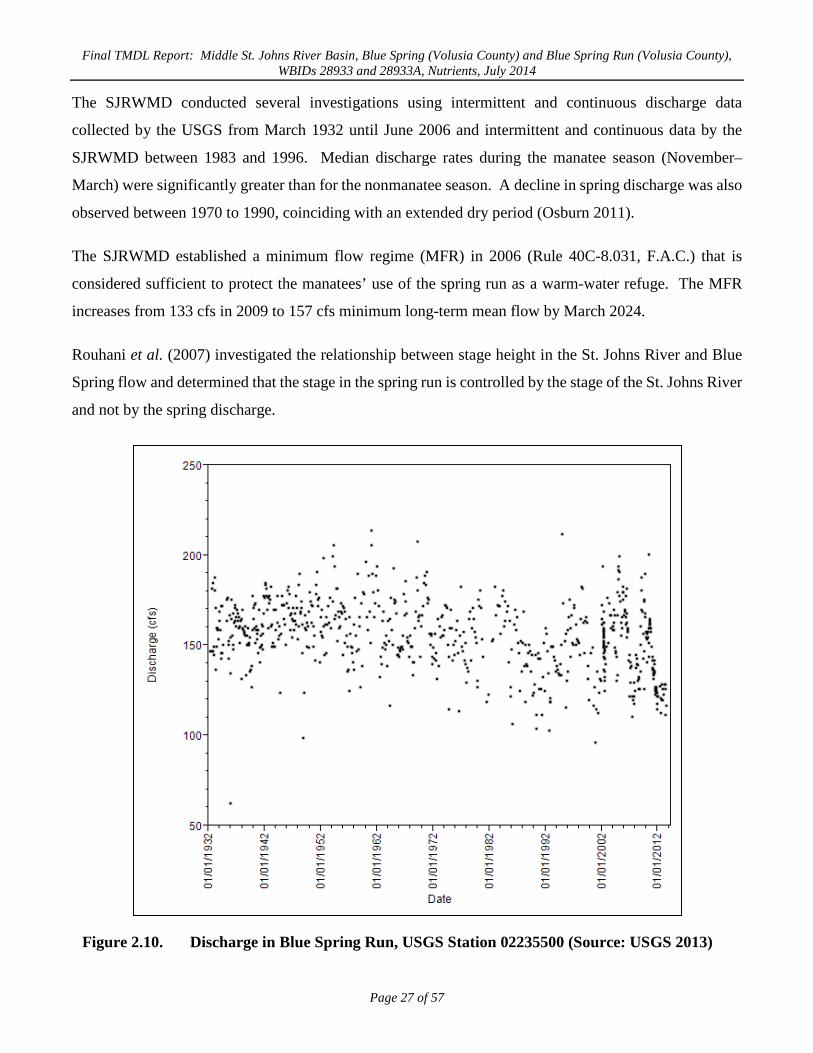
2.7 Discharge Long-term discharge measured from 1932 to May 2013 indicates the annual average discharge from Blue
Spring is 155.3 cubic feet per second (cfs), or about 100.4 million gallons per day (MGD). A maximum
discharge of 214 cfs was measured in November 1960, and a minimum discharge of 62.7 cfs was measured
in November 1935. Blue Spring discharge varies seasonally and has been shown to correlate directly with
rainfall. The mean monthly average computed between 1935 and 2013 was lowest in August (147.2 cfs)
and highest in December (163.4 cfs) (USGS National Water Information System [NWIS] 2012). The
Mann-Kendall statistical test was used to detect temporal trends in discharge, and the results indicate that
discharge is decreasing over time (N [results] = 723, Kendall tau = -0.21, prob = 0.0001) for the period
from March 7, 1932, to May 30, 2013 (Figure 2.10).
Page 26 of 57
Final TMDL Report: Middle St. Johns River Basin, Blue Spring (Volusia County) and Blue Spring Run (Volusia County), WBIDs 28933 and 28933A, Nutrients, July 2014
The SJRWMD conducted several investigations using intermittent and continuous discharge data
collected by the USGS from March 1932 until June 2006 and intermittent and continuous data by the
SJRWMD between 1983 and 1996. Median discharge rates during the manatee season (November–
March) were significantly greater than for the nonmanatee season. A decline in spring discharge was also
observed between 1970 to 1990, coinciding with an extended dry period (Osburn 2011).
The SJRWMD established a minimum flow regime (MFR) in 2006 (Rule 40C-8.031, F.A.C.) that is
considered sufficient to protect the manatees’ use of the spring run as a warm-water refuge. The MFR
increases from 133 cfs in 2009 to 157 cfs minimum long-term mean flow by March 2024.
Rouhani et al. (2007) investigated the relationship between stage height in the St. Johns River and Blue
Spring flow and determined that the stage in the spring run is controlled by the stage of the St. Johns River
and not by the spring discharge.
Figure 2.10. Discharge in Blue Spring Run, USGS Station 02235500 (Source: USGS 2013)
Page 27 of 57
Final TMDL Report: Middle St. Johns River Basin, Blue Spring (Volusia County) and Blue Spring Run (Volusia County), WBIDs 28933 and 28933A, Nutrients, July 2014
Chapter 3. DESCRIPTION OF APPLICABLE WATER QUALITY STANDARDS AND TARGETS
3.1 Classification of the Waterbody and Criterion Applicable to the TMDL Florida’s surface waters are protected for six designated use classifications, as follows (available:
http://www.dep.state.fl.us/water/wqssp/classes.htm):
Class I Potable water supplies Class II Shellfish propagation or harvesting Class III Fish consumption, recreation, propagation, and maintenance of a
healthy, well-balanced population of fish and wildlife Class III-Limited Fish consumption, recreation or limited recreation, and/or
propagation and maintenance of a limited population of fish and wildlife
Class IV Agricultural water supplies Class V Navigation, utility, and industrial use (there are no state waters
currently in this class)
Blue Spring and Blue Spring Run are Class III fresh waterbodies (with designated uses of fish
consumption, recreation, propagation, and maintenance of a healthy, well-balanced population of fish and
wildlife). The Class III water quality criterion applicable to the impairment addressed by this TMDL is
excessive nutrients, which have been demonstrated to adversely affect flora or fauna.
3.2 Applicable Water Quality Standards and Numeric Water Quality Targets
3.2.1 Nutrients
Thresholds of nutrient impairment for streams have been interpreted in the IWR, Rule 62-303.351, F.A.C.
(Nutrients in Streams) to include stream segments if an imbalance of flora or fauna occurs due to nutrient
enrichment. This imbalance includes algal blooms, changes in alga species richness, excessive
macrophyte growth, a decrease in the coverage or density of seagrasses or other SAV, and excessive diel
oxygen variation. In 2009, Blue Spring and Blue Spring Run were included in Florida’s list of impaired
waters based on these narrative criteria (algal mats). At that time, elevated nitrate in the water was
determined to cause excessive algal growth.
Excessive algal growth can result in a variety of adverse ecological impacts, including reduced water
clarity, habitat smothering, the provision of nutrition and habitat for pathogenic bacteria, the production
of toxins that may affect biota, the reduction of oxygen levels, and an increase in diurnal swings of the
Page 28 of 57
Final TMDL Report: Middle St. Johns River Basin, Blue Spring (Volusia County) and Blue Spring Run (Volusia County), WBIDs 28933 and 28933A, Nutrients, July 2014
DO regime in the stream. Ongoing research on many Florida springs has resulted in significant progress
in understanding the threshold concentrations of nutrients that cause nuisance macroalgae growth
(Stevenson et al. 2007).
3.2.2 Numeric Nutrient Criterion for Spring Vents
The Department’s numeric nutrient criterion (NNC) of 0.35 mg/L nitrate for spring vents was adopted in
Rule 62-302, F.A.C., by the Environmental Regulation Commission on December 8, 2011. Following
legal challenges and federal rulemaking actions on November 30, 2012 the EPA approved the
Department's NNC for spring vents. The NNC for springs is 0.35 mg/L nitrate-nitrite as an annual
geometric mean, not to be exceeded more than once in any 3 calendar year period. The complete technical
support document on how the Department calculated the NNC is available at:
http://www.dep.state.fl.us/water/wqssp/nutrients/docs/tsd-nnc-lakes-springs-streams.pdf.
Paragraph 62-302.530(47)(b), F.A.C., states that “in no case shall nutrient concentrations of a body of
water be altered so as to cause an imbalance in natural populations of aquatic flora or fauna.” This
narrative criteria is still applicable statewide, but the Department's hierarchical approach gives preference
to the numeric nutrient value of 0.35 mg/L nitrate-nitrite for springs based on quantifiable stressor-
response relationships between nutrients and biological response. In addition, if there are sufficient site-
specific data for a particular spring, a site-specific alternative criterion can be set. However, the
Department did not find sufficient algal growth response data to support a different site-specific criterion
for Blue Springs and Blue Spring Run. Chapter 5 discusses the nitrate impairment and the setting of the
TMDL target concentration of nitrate.
3.2.3 Outstanding Florida Water (OFW) and Other Designations
Blue Spring and Blue Spring Run together are designated as an OFW pursuant to Chapter 62-302, F.A.C.
Portions of the spring run are within the Wekiva/Middle St. Johns River/Tomoka Marsh Aquatic Preserve
as designated under the Florida Aquatic Preserve Act of 1975, Section 258.35, F.S.). These waterbodies
were also registered in the Florida Natural Features Program in 1980.
The FAS in Volusia County is designated by the EPA as the sole-source Volusia-Floridan aquifer (VFA)
because it provides nearly all of the area’s drinking water (available:
http://www.epa.gov/region4/water/groundwater/r4ssa.html). This sole-source designation provides the
Page 29 of 57

Final TMDL Report: Middle St. Johns River Basin, Blue Spring (Volusia County) and Blue Spring Run (Volusia County), WBIDs 28933 and 28933A, Nutrients, July 2014
EPA with the authority to determine if federally financed projects in the area contaminate or create public
health hazards to the VFA (EPA 1987).
Page 30 of 57
Final TMDL Report: Middle St. Johns River Basin, Blue Spring (Volusia County) and Blue Spring Run (Volusia County), WBIDs 28933 and 28933A, Nutrients, July 2014
Chapter 4: ASSESSMENT OF SOURCES
4.1 Types of Sources Nitrogen is present in the environment in many forms, and each form is a possible pollutant source to Blue
Spring and Blue Spring Run. An important part of the TMDL analysis is the identification of pollutant
source categories, source subcategories, or individual sources of nutrients in the watershed and the
magnitude of pollutant loading contributed by each of these sources.
Pollutant sources occur in two broad categories, “point sources” and “nonpoint sources.” Historically, the
term “point sources” meant discharges to surface waters that typically have a continuous flow via a
discernible, confined, and discrete conveyance, such as a pipe. Wastewater treatment facilities (WWTFs)
that discharge treated effluent directly into surface waters are examples of traditional point sources. The
term “nonpoint sources” was used to describe intermittent, rainfall-driven, diffuse sources of pollution
associated with everyday human activities, and sources not directly discharged to the impaired surface
water, such as stormwater runoff, wastewater sprayfield sites, agricultural fields, mining sites, septic
system drain fields, and atmospheric deposition.
The 1987 amendments to the Clean Water Act redefined certain nonpoint sources of surface water
pollution as point sources subject to regulation under the EPA’s National Pollutant Discharge Elimination
System (NPDES) Program. These nonpoint sources included certain urban stormwater discharges to
surface water, such as those from local government master drainage systems, construction sites over five
acres, and a wide variety of industries (see Appendix A for background information on the federal and
state stormwater programs).
To be consistent with Clean Water Act definitions, the term “point source” is used in this document to
describe traditional point sources (such as domestic and industrial wastewater discharges to surface water)
and urban stormwater system discharges to impaired surface waters that require an NPDES stormwater
permit when allocating pollutant load reductions required by a TMDL (see Section 6.1).
4.2 Information on Potential Sources of Nitrate in the Blue Spring Springshed The nitrate in the impaired spring and spring run may have come from a variety of sources in the
springshed. Relationships between the ratios of stable isotopes of nitrogen (δ15N/ δ14N) in water samples
can provide information on the predominant nitrate sources. Values of less than six per mil (i.e., parts per
thousand) are generally indicative of inorganic sources (primarily fertilizers) while values greater than
Page 31 of 57
Final TMDL Report: Middle St. Johns River Basin, Blue Spring (Volusia County) and Blue Spring Run (Volusia County), WBIDs 28933 and 28933A, Nutrients, July 2014
nine per mil indicate organic sources of nitrogen such as wastewater or animal waste (Katz et al. 1999).
The further evaluation of δ15N and δ18O ratios can also provide information on sources and possible
denitrification trends.
The results from isotope sampling by the Department between 2011 and 2012 display a distinct
denitrification trend, and predenitrification isotopic signatures may indicate a mixture of inorganic and
organic sources; however, the degree of denitrification in the samples is uncertain (Department
unpublished data). This finding supports conclusions from Albertin et al. (2012), who found high δ15N
and δ18O values and evidence of denitrification in water samples taken from Blue Spring in 2008, which
was considered a relatively dry year. These researchers speculated that the mixing of older FAS water
during drier conditions provides a greater potential for denitrification. Residential development in the
springshed and associated septic tanks, wastewater reuse, and fertilizer application to lawns and
commercial properties may provide sources of nitrogen, while conditions in the FAS may provide an
environment that is favorable for denitrification of these sources. The reuse of treated domestic
wastewater effluent (initially an organic form of nitrogen) for irrigation may also increase the appearance
of denitrification in water samples in the springshed.
Sucralose is used as an artificial sweetener. Because it passes through water treatment systems largely
intact, it has recently been used as a human wastewater tracer. Low levels of sucralose were detected in
samples from Blue Spring collected during 2012, indicative of possible wastewater influences in the
springshed.
4.2.1 Discharge Sources Permitted under the NPDES Program
WWTF Discharges
There are 29 permitted facilities in the Blue Spring springshed that treat industrial and domestic
wastewater, according to the Department’s Wastewater Facilities Regulation (WAFR) database. Four of
the facilities (concrete batch plants) have NPDES permits to discharge to surface water, but none discharge
to the impaired waters, and concrete batch plants are not significant sources of nitrogen. Four other
facilities have industrial wastewater permits, but these facilities include minor sources that are not likely
to have appreciable impacts on Blue Spring or Blue Spring Run.
Twenty-one of the facilities in the springshed treat domestic wastewater, which is a more significant
potential source of nitrogen than the industrial facilities (Table 4.1 and Figure 4.1). These facilities are
Page 32 of 57
Final TMDL Report: Middle St. Johns River Basin, Blue Spring (Volusia County) and Blue Spring Run (Volusia County), WBIDs 28933 and 28933A, Nutrients, July 2014
permitted to discharge to nonsurface waters, including ground water via drain fields, rapid infiltration
basins (RIBs), or spray irrigation, and are therefore considered nonpoint sources. However, it is difficult
to evaluate potential nitrogen inputs to ground water from domestic wastewater application sites, as they
vary in treatment methods, nitrogen concentrations in effluent, and method of application, as well as in
the amount of attenuation in the soil profile.
Five domestic WWTFs in the springshed have design flows of greater than 0.1 MGD, the largest being
the City of DeLand Wiley M. Nash Water Reclamation Facility with a design capacity of 6 MGD. This
facility has a permitted outfall in the St. Johns River but has not discharged any reclaimed water to the
river for more than two years. Most of the plant’s effluent is used as reclaimed water for irrigation, stored
for future use, or disposed of in RIBs (K. Riger, pers. comm., July 2013).
In addition to treated wastewater application sites, municipal wastewater sewer systems contribute to
losses of nitrogen through sewer line leaks, lift station overflows, and other incidents.
Stormwater Discharges
A municipal separate storm sewer system (MS4) is a publicly owned conveyance or system of
conveyances (i.e., ditches, curbs, catch basins, underground pipes, etc.) that is designed or used for
collecting or conveying stormwater and that discharges to surface waters of the state. There are six Phase
II MS4 permits in the Blue Spring springshed: city of DeLand (FLR04E078), Lake Helen (FLR04E125),
city of Orange City (FLR04E126), city of DeBary (FLR04E120), Florida Department of Transportation
District 5 (FDOT D5) (FLR04E099), Deltona (FLR04E099), and Volusia County (FLR04E078) (Figure
4.2). None of the permittees discharge directly to Blue Spring or Blue Spring Run.
While it may not be appropriate to assign a specific allocation or reduction to the existing NPDES entities
as potential point sources, some of them may still be included in the BMAP process because of their
nonpoint source contributions. These nonpoint source discharges include discharges of stormwater to the
UFA via retention ponds and sinkholes.
Page 33 of 57
Final TMDL Report: Middle St. Johns River Basin, Blue Spring (Volusia County) and Blue Spring Run (Volusia County), WBIDs 28933 and 28933A, Nutrients, July 2014
Table 4.1. Permitted WWTFs in the Blue Spring springshed (Department WAFR)
1 Permit limit for volume treated and discharged in MGD 2 DW = Domestic waste; IW = Industrial waste; CBP = Concrete batch plant; WRF = Water reclamation facility 3 NPDES Permit = Federal National Pollutant Discharge Elimination System permit for discharge to surface water. Note: Facilities shown in boldface type with yellow highlighting have design flows greater than 0.1 MGD.
Facility ID Facility Name Design
Capacity1 Facility Type2
NPDES Permit
FLG110451 CEMEX Construction Materials FL LLC - Orange City CBP 0.00 CBP Yes FLG110780 CEMEX Construction Materials FL LLC - Deland Ready Mix Plant 0.00 CBP Yes FLG110324 Maschmeyer Concrete 0.00 CBP Yes FLG110687 Tarmac - Deland Concrete Batch Plant 0.02 CBP Yes FLA011216 Tropical Resort and Marina WWTF 0.00 DW No FLA011220 Days Inn of Orange City 0.00 DW No FLA011276 Hontoon Island State Park 0.01 DW No FLA011197 Arlington Square Apartments 0.01 DW No FLA011263 St Johns River Club Condominium WWTF 0.01 DW No FLA011203 Quality Inn 0.01 DW No FLA011223 1876 Heritage Inn 0.01 DW No FLA011198 Lakeview Terrace WWTF 0.01 DW No FLA016691 Volusia Pines Elementary School WWTF 0.01 DW No FLA011204 Holly Bluff Marina, Inc. 0.01 DW No FLA011234 Paradise Lakes Campground 0.02 DW No FLA011237 Clark Family Campground KOA WWTF 0.02 DW No FLA011279 Blue Spring State Park 0.02 DW No FLA011219 Land O Lakes WWTF 0.03 DW No FLA011265 Candlelight WWTF 0.03 DW No FLA011199 Lake Helen Mobile Home Villas 0.03 DW No FLA011118 Volusia County - Four Townes WWTF 0.60 DW No FLA011121 Volusia County - Deltona North WWTF 1.20 DW No FLA011128 Volusia County - Southwest WRF 1.20 DW No FLA111724 Deltona Lakes 1.40 DW No FL0020303 Deland, City of - Wiley M Nash WRF 6.00 DW Yes FLA626848 Enterprise Carwash 0.00 IW No FLA724891 Deland Truck Center Inc 0.00 IW N FLA625655 Circle K #9753 Car Wash 0.00 IW N FLA011180 TG Lee Foods 0.07 IW N
Page 34 of 57
Final TMDL Report: Middle St. Johns River Basin, Blue Spring (Volusia County) and Blue Spring Run (Volusia County), WBIDs 28933 and 28933A, Nutrients, July 2014
Figure 4.1. Domestic and industrial wastewater facilities in the Blue Spring springshed
Page 35 of 57
Final TMDL Report: Middle St. Johns River Basin, Blue Spring (Volusia County) and Blue Spring Run (Volusia County), WBIDs 28933 and 28933A, Nutrients, July 2014
Figure 4.2. Permitted MS4s in the Blue Spring springshed
Page 36 of 57
Final TMDL Report: Middle St. Johns River Basin, Blue Spring (Volusia County) and Blue Spring Run (Volusia County), WBIDs 28933 and 28933A, Nutrients, July 2014
4.2.2 Land Uses and Additional Nonpoint Sources
Most of the nitrogen input in the springshed comes from nonpoint sources that discharge to ground water.
These sources typically include fertilizer applied to lawns, golf courses, and agricultural areas (although
this is a minor land use in the springshed), septic tanks, domestic wastewater application sites, and
atmospheric deposition.
Land Use and Land Cover
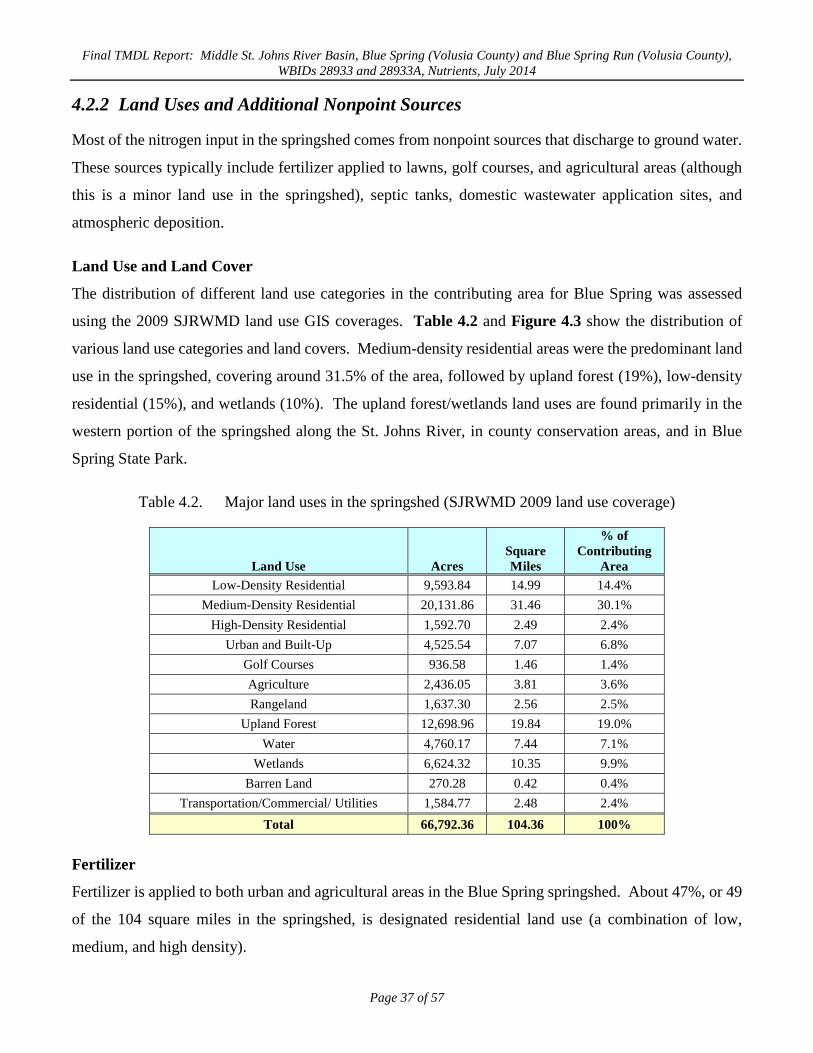
The distribution of different land use categories in the contributing area for Blue Spring was assessed
using the 2009 SJRWMD land use GIS coverages. Table 4.2 and Figure 4.3 show the distribution of
various land use categories and land covers. Medium-density residential areas were the predominant land
use in the springshed, covering around 31.5% of the area, followed by upland forest (19%), low-density
residential (15%), and wetlands (10%). The upland forest/wetlands land uses are found primarily in the
western portion of the springshed along the St. Johns River, in county conservation areas, and in Blue
Spring State Park.
Table 4.2. Major land uses in the springshed (SJRWMD 2009 land use coverage)
Land Use Acres Square Miles
% of Contributing
Area Low-Density Residential 9,593.84 14.99 14.4%
Medium-Density Residential 20,131.86 31.46 30.1% High-Density Residential 1,592.70 2.49 2.4%
Urban and Built-Up 4,525.54 7.07 6.8% Golf Courses 936.58 1.46 1.4% Agriculture 2,436.05 3.81 3.6% Rangeland 1,637.30 2.56 2.5%
Upland Forest 12,698.96 19.84 19.0% Water 4,760.17 7.44 7.1%
Wetlands 6,624.32 10.35 9.9% Barren Land 270.28 0.42 0.4%
Transportation/Commercial/ Utilities 1,584.77 2.48 2.4% Total 66,792.36 104.36 100%
Fertilizer
Fertilizer is applied to both urban and agricultural areas in the Blue Spring springshed. About 47%, or 49
of the 104 square miles in the springshed, is designated residential land use (a combination of low,
medium, and high density).
Page 37 of 57
Final TMDL Report: Middle St. Johns River Basin, Blue Spring (Volusia County) and Blue Spring Run (Volusia County), WBIDs 28933 and 28933A, Nutrients, July 2014
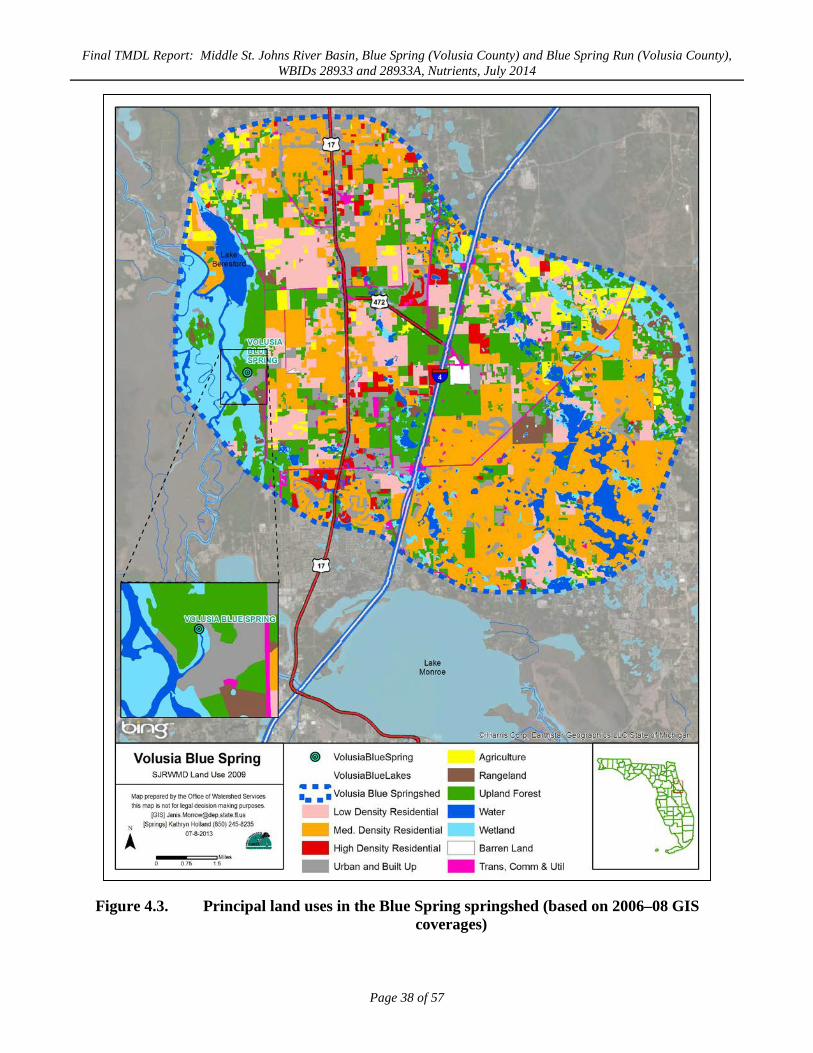
Figure 4.3. Principal land uses in the Blue Spring springshed (based on 2006–08 GIS coverages)
Page 38 of 57
Final TMDL Report: Middle St. Johns River Basin, Blue Spring (Volusia County) and Blue Spring Run (Volusia County), WBIDs 28933 and 28933A, Nutrients, July 2014
Onsite Sewage Treatment and Disposal Systems (OSTDS)
OSTDS, also known as septic systems, are used for the disposal of domestic waste at homes that are not
on central sewer, often because providing central sewer is not cost-effective or practical. When properly
sited, designed, constructed, maintained, and operated, OSTDS are a sanitary means of disposing of
domestic waste. The effluent from a well-functioning OSTDS is generally higher in TN concentration
than secondarily treated wastewater from a sewage treatment plant, although the wastewater profile can
vary from home to home.
On average, the TN concentration released to the environment by a typical OSTDS is 57.7 mg/L (Hazen
and Sawyer 2009). However, septic tank effluent may undergo some denitrification in and below the
drain field, resulting in an even lower TN input to ground water. Under a low-density residential setting,
nitrogen inputs from OSTDS may not be significant unless the OSTDS sources are close to the spring, but
under a higher density setting, one could expect a TN input of 129 pounds per acre per year (lb/ac/yr)
(Harrington et al. 2010). The actual load to ground water is a portion of this amount. For the Wekiva
River Basin, MACTEC (2010) estimated that the load to ground water from septic systems was
approximately 56% of the input (the amount discharged from the tank to the drain field).
According to the Florida Department of Health (FDOH), as of November 2011, there were about 16,406
OSTDS in the Blue Spring springshed. Data for estimating septic tank numbers in the springshed are
based on the FDOH statewide inventory of permitted OSTDS GIS layer (FDOH 2011), which is updated
annually (Figure 4.4). There is some uncertainty about the septic tank counts in this inventory, depending
on how current the records are at local health departments and if older paper records are included in the
inventory. As a result, the actual numbers of septic tanks may be undercounted.
Atmospheric Deposition
Atmospheric deposition was also identified as an important potential nitrogen source. Atmospheric
deposition from wet fall was estimated from the closest National Atmospheric Deposition Program
(NADP) monitoring station located in Orlando, Florida (Station FL32). This station has been in operation
since December 14, 2005; however, 2005 data were excluded from the calculation due to the limited
dataset (NADP website).
Wet deposition is computed by multiplying the precipitation-weighted mean ion concentration (mg/L) for
valid samples by the total precipitation amount in centimeters for the summary period and dividing by 10.
Records indicate an annual average input of nitrogen from wet deposition to be 2.97 kilograms per hectare
Page 39 of 57
Final TMDL Report: Middle St. Johns River Basin, Blue Spring (Volusia County) and Blue Spring Run (Volusia County), WBIDs 28933 and 28933A, Nutrients, July 2014
(kg/ha) at the station from 2006 to 2012, or about 2.7 lb/ac/yr. Wet deposition and dry deposition of
nitrogen are not proportional, with dry deposition sometimes exceeding wet deposition in arid regions or
in urban areas where air emissions are high. Dry deposition data were not available for this area.
Invasive Fish
Vermiculated sailfin catfish (Pterygoplichthys disjunctivus) and blue tilapia (Oreochromis aureus) have
recently become a problem in Blue Spring and are common in the spring-run, potentially disrupting the
reproduction of native fish species. Sailfin catfish use Blue Spring Run as a thermal refuge during cold
weather, and studies indicated that their feces may contribute a significant nutrient source to the spring
run through recycling, even though they consume algae (K. Work and M. Gibbs, pers. comm.).
Page 40 of 57
Final TMDL Report: Middle St. Johns River Basin, Blue Spring (Volusia County) and Blue Spring Run (Volusia County), WBIDs 28933 and 28933A, Nutrients, July 2014
Figure 4.4. Density of OSTDS (septic tanks) in the Blue Spring springshed (FDOH November 2011)
Page 41 of 57
Final TMDL Report: Middle St. Johns River Basin, Blue Spring (Volusia County) and Blue Spring Run (Volusia County), WBIDs 28933 and 28933A, Nutrients, July 2014
Chapter 5: DETERMINATION OF ASSIMILATIVE CAPACITY
The Department often uses hydraulic and water quality models to simulate loading and the effect of the
loading within a given waterbody. However, there are other appropriate methods to develop a TMDL that
are as credible as a modeling approach. Such an alternative approach was used to estimate existing
conditions and calculate TMDLs for Blue Spring and Blue Spring Run.
5.1 Determination of Loading Capacity Typically, the target loading and existing loading for a stream or watershed are based on hydrologic and
water quality modeling. Many of these models depend on the relationship between flow and surface water
drainage area, as well as the relationship between land use and soils and pollutant delivery. The
predominant source of nitrate loading to Blue Spring and Blue Spring Run is ground water, which
discharges from the major spring vent and from smaller seeps near the spring boil and along the spring
run. Thus, a direct relationship between surface water loadings in the watershed is not appropriate. This
atypical situation requires the use of an alternative approach for establishing the nutrient TMDL.
Existing stream (spring run) loading can sometimes be estimated by multiplying the measured stream flow
by the measured pollutant concentrations in the stream. To estimate the pollutant loading this way,
synoptic flow and concentration data measured at the outlet of the stream segment being analyzed are
required. These types of data are not always available for all sources covering the same period. Estimates
of current nutrient loads from the ground water of Blue Spring and Blue Spring Run could possibly be
made based on spring flow and concentration. However, as both current and TMDL loads would be
generated from the same flow data, there would be a linear or proportional relationship based on current
and target concentrations. Therefore, the loads of nitrate were not explicitly calculated.
Instead, the percent load reduction required to achieve the nitrate concentration target was calculated
assuming the percent loading reduction would be the same as the percent concentration reduction. The
percent reduction required to achieve the water quality target was calculated using the following formula:
[(existing mean concentration – target concentration)/existing mean concentration] x 100 Once the target concentration is consistently achieved, the WBID will be reevaluated to determine if
nitrogen continues to contribute to an imbalance of flora and fauna. If such a condition still exists, the
TMDL will be reassessed as part of the Department’s watershed assessment cycle. The target
concentration may be changed if the Department determines that further reductions in the nitrogen
Page 42 of 57
Final TMDL Report: Middle St. Johns River Basin, Blue Spring (Volusia County) and Blue Spring Run (Volusia County), WBIDs 28933 and 28933A, Nutrients, July 2014
concentration are needed to address the imbalance. The purpose of a TMDL is to set a pollutant reduction
goal that, if achieved, will result in attainment of the designated uses for that waterbody.
5.2 TMDL Development Process
5.2.1 Target Setting
The Department’s numeric nutrient criterion (NNC) of 0.35 mg/L nitrate for spring vents was adopted in
Rule 62-302, F.A.C., by the Environmental Regulation Commission on December 8, 2011. Following
legal challenges and federal rulemaking actions on November 30, 2012 the EPA approved the
Department's NNC for spring vents. The NNC for springs is 0.35 mg/L nitrate-nitrite as an annual
geometric mean, not be exceeded more than once in any 3 calendar year period. The complete technical
support document on how the Department calculated the NNC is available at:
http://www.dep.state.fl.us/water/wqssp/nutrients/docs/tsd-nnc-lakes-springs-streams.pdf.
Paragraph 62-302.530(47)(b), F.A.C., states that “in no case shall nutrient concentrations of a body of
water be altered so as to cause an imbalance in natural populations of aquatic flora or fauna.” This
narrative criteria is still applicable statewide, but the Department's hierarchical approach gives preference
to the numeric nutrient value of 0.35 mg/L nitrate-nitrite for springs based on quantifiable stressor-
response relationships between nutrients and biological response. In addition, if there are sufficient site-
specific data for a particular spring, a site-specific alternative criterion can be set. However, the
Department did not find sufficient algal growth response data to support a different site-specific criterion
for Blue Springs and Blue Spring Run. For that reason, the Department believes that a monthly average
nitrate concentration of 0.35 mg/L should be sufficiently protective of the aquatic flora or fauna in Blue
Spring and Blue Spring Run. A monthly average is considered to be the appropriate time frame, because
algal growth is not instantaneously responsive to a nitrate concentration increase or decrease, but rather
the response of algae to nutrients is on the order of weeks. In addition, a monthly average is more
appropriate than an annual average considering the significant fluctuations of nitrate concentrations that
occur in Blue Spring (discussed in Section 5.4).
5.3 Setting the Monthly Average Concentration for Nutrients Nitrate
Based on the adoption of the NNC for springs, the Department has determined that a monthly average of
0.35 mg/L nitrate (nutrients) should be established as the TMDLs for Blue Spring and Blue Spring Run,
mainly because changes in aquatic vegetation biomass do not respond to the change of nutrient
Page 43 of 57
Final TMDL Report: Middle St. Johns River Basin, Blue Spring (Volusia County) and Blue Spring Run (Volusia County), WBIDs 28933 and 28933A, Nutrients, July 2014
concentration instantaneously. Therefore, short-term exceedances of the target concentration may not
produce negative biological or ecological effects. The nitrate TMDL target established as the NNC was
based primarily on multiple lines of evidence, including relationships between long-term average nitrate
concentrations and periphyton cell density and biomass on the Suwannee River, ecosystem metabolism
data from spring-run streams in the St. Johns River, and the Department’s periphyton bioassessment data.
Therefore, the TMDL target should be considered a long-term average target instead of an instantaneous
value.
Natural processes such as competition between other periphyton and plants, grazing from aquatic animals,
removal effects from the shearing force of stream flow, and light attenuation from changing water color
in natural systems such as Blue Spring and Blue Spring Run could significantly influence the response of
algae to changes in water column nitrate concentrations. Therefore, treating the nitrate concentration as
an exact instantaneous value is not necessary. It is more appropriate to treat the target value as an average
concentration over a certain period. The Department established the nitrate TMDL for the Wekiva and
Suwannee Rivers and Wakulla, Silver, and Rainbow Springs as a monthly average target. Expressing the
target as a monthly average provides a margin of safety because restoration activities designed to address
the highest monthly average nitrate concentrations should help to ensure that average nitrate
concentrations over the rest of the year are even lower.
Since the nitrate target will be established as a monthly average in this TMDL, monthly average
concentrations were calculated for each month based on measured concentrations over the verified period
(January 1, 2001–June 30, 2008) plus more recent data (2001–13). To ensure that the monthly average
concentrations will meet the concentration target even under the worst-case scenario, the highest monthly
average nitrate concentrations were used as existing monthly mean concentrations to calculate the percent
reduction required to achieve the nitrate target. This approach adds to the margin of safety of the TMDL
and was also the approach used for the TMDLs for the Wekiwa and Suwannee Rivers and Wakulla, Silver,
and Rainbow Springs.
For Blue Spring and Blue Spring Run, the percent reductions required for this TMDL were calculated
using the monthly values for nitrate averaged over the period from January 2001 through May 2013. The
maximum monthly average was then considered in the calculation of a target for percent reduction (Table
5.1). Table 5.1 summarizes the monthly averages with monthly average rainfall. These data show that
elevated nitrate concentrations occur in September through January during the verified period.
Page 44 of 57
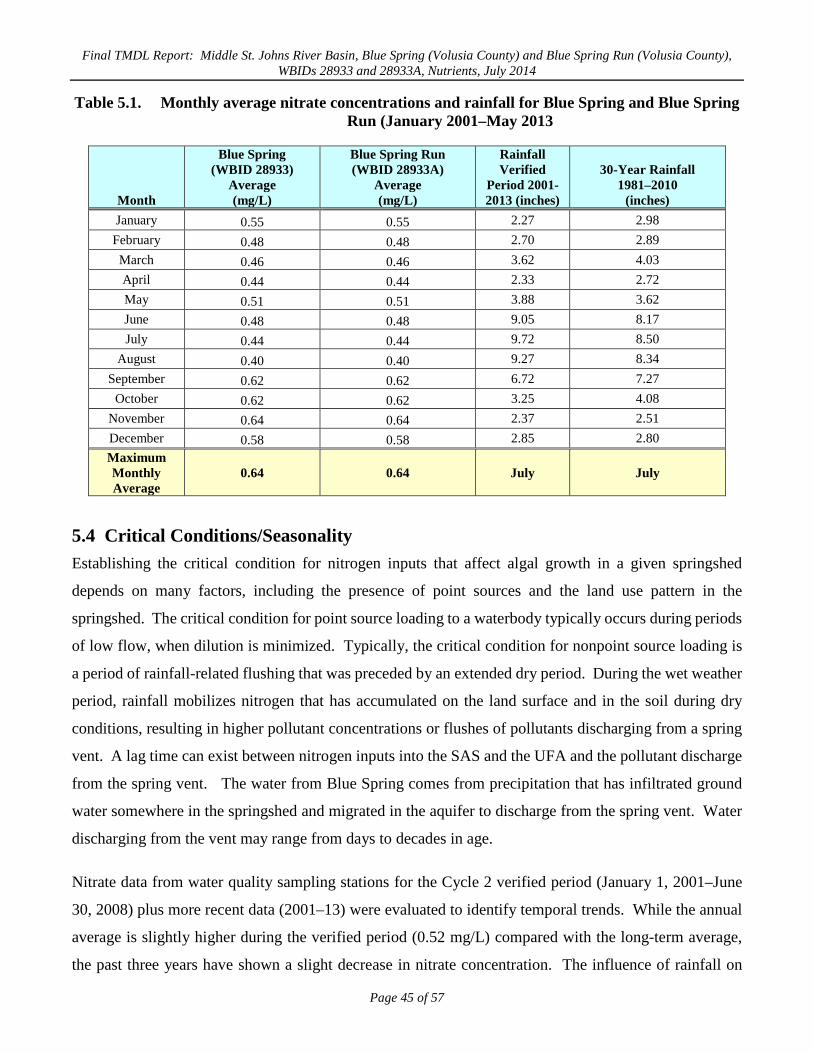
Final TMDL Report: Middle St. Johns River Basin, Blue Spring (Volusia County) and Blue Spring Run (Volusia County), WBIDs 28933 and 28933A, Nutrients, July 2014
Table 5.1. Monthly average nitrate concentrations and rainfall for Blue Spring and Blue Spring
Run (January 2001–May 2013
Month
Blue Spring (WBID 28933)
Average (mg/L)
Blue Spring Run (WBID 28933A)
Average (mg/L)
Rainfall Verified
Period 2001-2013 (inches)
30-Year Rainfall 1981–2010
(inches) January 0.55 0.55 2.27 2.98
February 0.48 0.48 2.70 2.89 March 0.46 0.46 3.62 4.03 April 0.44 0.44 2.33 2.72 May 0.51 0.51 3.88 3.62 June 0.48 0.48 9.05 8.17 July 0.44 0.44 9.72 8.50
August 0.40 0.40 9.27 8.34 September 0.62 0.62 6.72 7.27
October 0.62 0.62 3.25 4.08 November 0.64 0.64 2.37 2.51 December 0.58 0.58 2.85 2.80 Maximum Monthly Average
0.64 0.64 July July
5.4 Critical Conditions/Seasonality Establishing the critical condition for nitrogen inputs that affect algal growth in a given springshed
depends on many factors, including the presence of point sources and the land use pattern in the
springshed. The critical condition for point source loading to a waterbody typically occurs during periods
of low flow, when dilution is minimized. Typically, the critical condition for nonpoint source loading is
a period of rainfall-related flushing that was preceded by an extended dry period. During the wet weather
period, rainfall mobilizes nitrogen that has accumulated on the land surface and in the soil during dry
conditions, resulting in higher pollutant concentrations or flushes of pollutants discharging from a spring
vent. A lag time can exist between nitrogen inputs into the SAS and the UFA and the pollutant discharge
from the spring vent. The water from Blue Spring comes from precipitation that has infiltrated ground
water somewhere in the springshed and migrated in the aquifer to discharge from the spring vent. Water
discharging from the vent may range from days to decades in age.
Nitrate data from water quality sampling stations for the Cycle 2 verified period (January 1, 2001–June
30, 2008) plus more recent data (2001–13) were evaluated to identify temporal trends. While the annual
average is slightly higher during the verified period (0.52 mg/L) compared with the long-term average,
the past three years have shown a slight decrease in nitrate concentration. The influence of rainfall on
Page 45 of 57
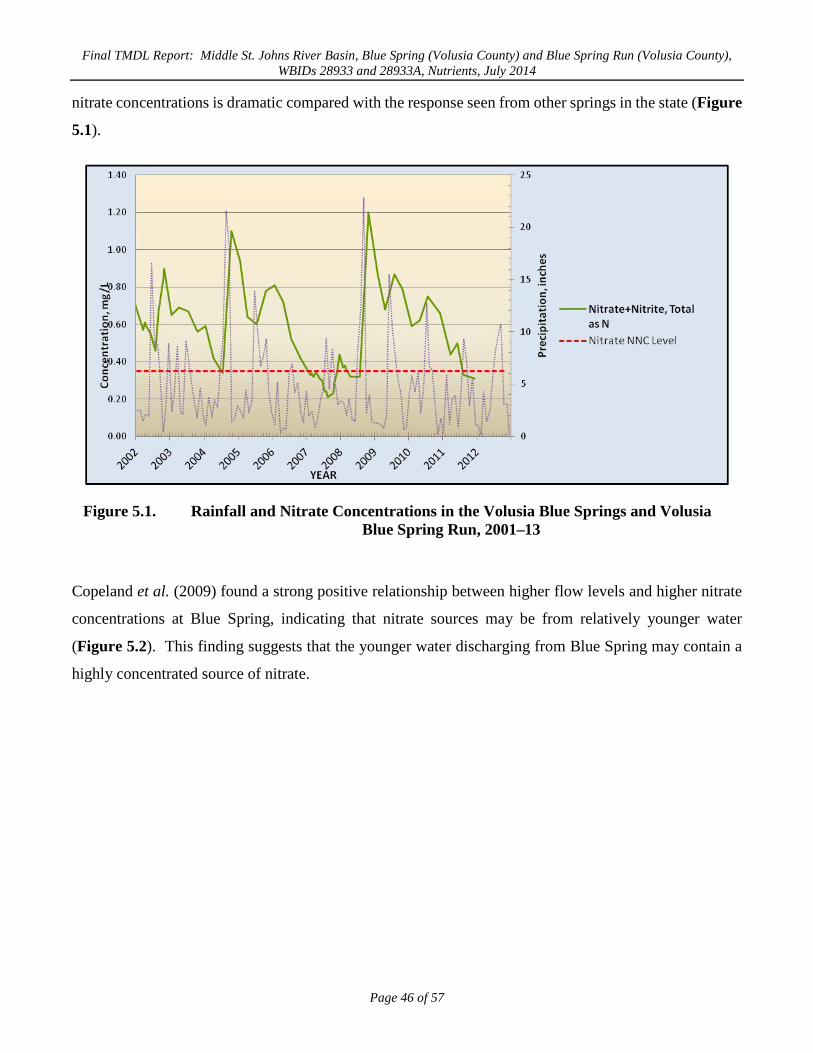
Final TMDL Report: Middle St. Johns River Basin, Blue Spring (Volusia County) and Blue Spring Run (Volusia County), WBIDs 28933 and 28933A, Nutrients, July 2014
nitrate concentrations is dramatic compared with the response seen from other springs in the state (Figure
5.1).
Figure 5.1. Rainfall and Nitrate Concentrations in the Volusia Blue Springs and Volusia Blue Spring Run, 2001–13
Copeland et al. (2009) found a strong positive relationship between higher flow levels and higher nitrate
concentrations at Blue Spring, indicating that nitrate sources may be from relatively younger water
(Figure 5.2). This finding suggests that the younger water discharging from Blue Spring may contain a
highly concentrated source of nitrate.
Page 46 of 57
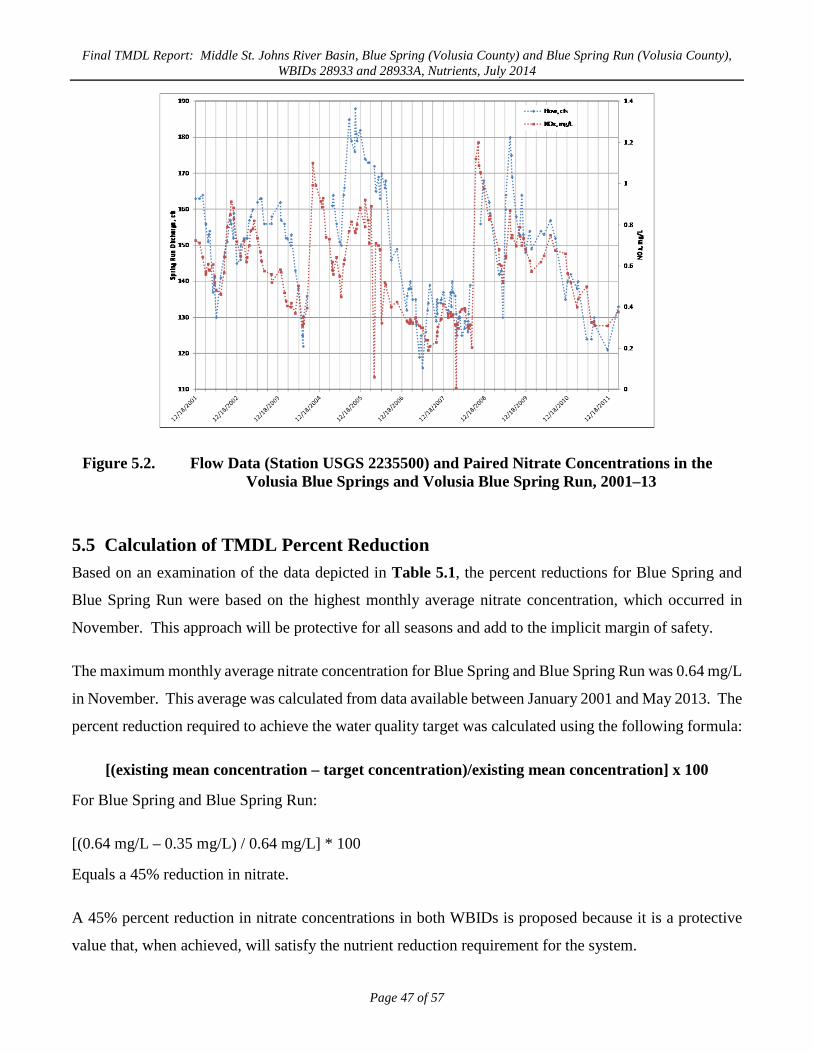
Final TMDL Report: Middle St. Johns River Basin, Blue Spring (Volusia County) and Blue Spring Run (Volusia County), WBIDs 28933 and 28933A, Nutrients, July 2014
Figure 5.2. Flow Data (Station USGS 2235500) and Paired Nitrate Concentrations in the Volusia Blue Springs and Volusia Blue Spring Run, 2001–13
5.5 Calculation of TMDL Percent Reduction Based on an examination of the data depicted in Table 5.1, the percent reductions for Blue Spring and
Blue Spring Run were based on the highest monthly average nitrate concentration, which occurred in
November. This approach will be protective for all seasons and add to the implicit margin of safety.
The maximum monthly average nitrate concentration for Blue Spring and Blue Spring Run was 0.64 mg/L
in November. This average was calculated from data available between January 2001 and May 2013. The
percent reduction required to achieve the water quality target was calculated using the following formula:
[(existing mean concentration – target concentration)/existing mean concentration] x 100 For Blue Spring and Blue Spring Run:
[(0.64 mg/L – 0.35 mg/L) / 0.64 mg/L] * 100 Equals a 45% reduction in nitrate.
A 45% percent reduction in nitrate concentrations in both WBIDs is proposed because it is a protective
value that, when achieved, will satisfy the nutrient reduction requirement for the system.
Page 47 of 57
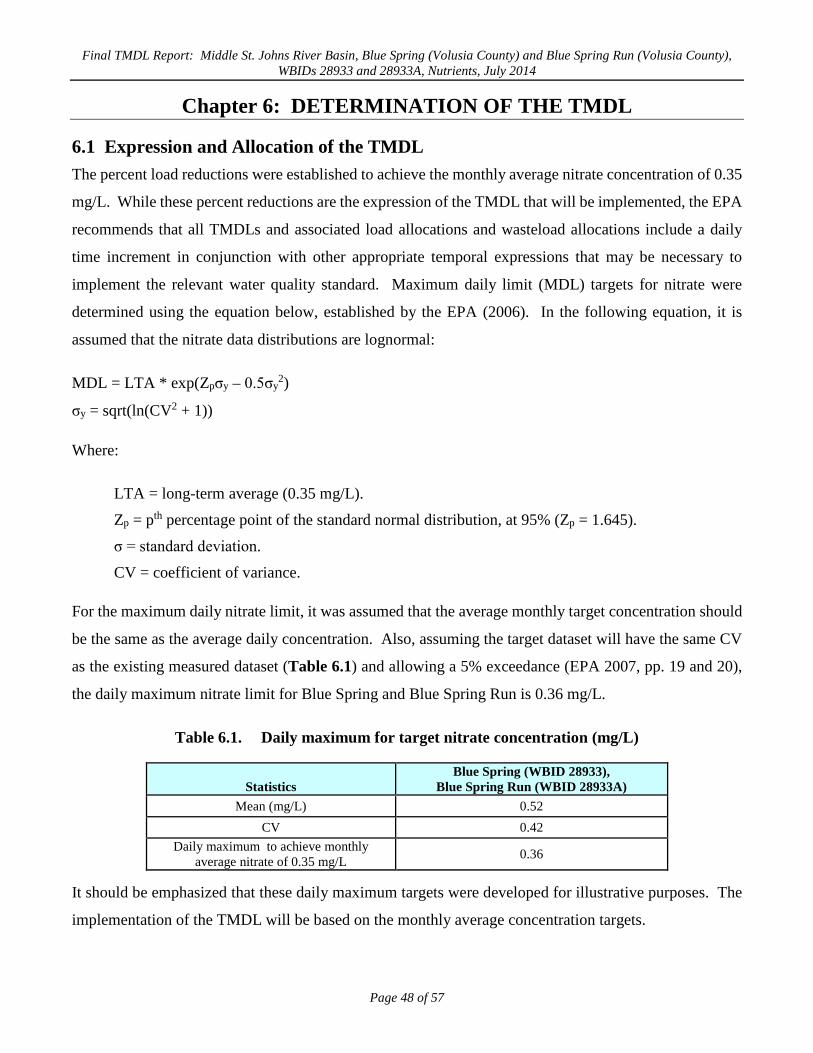
Final TMDL Report: Middle St. Johns River Basin, Blue Spring (Volusia County) and Blue Spring Run (Volusia County), WBIDs 28933 and 28933A, Nutrients, July 2014
Chapter 6: DETERMINATION OF THE TMDL
6.1 Expression and Allocation of the TMDL The percent load reductions were established to achieve the monthly average nitrate concentration of 0.35
mg/L. While these percent reductions are the expression of the TMDL that will be implemented, the EPA
recommends that all TMDLs and associated load allocations and wasteload allocations include a daily
time increment in conjunction with other appropriate temporal expressions that may be necessary to
implement the relevant water quality standard. Maximum daily limit (MDL) targets for nitrate were
determined using the equation below, established by the EPA (2006). In the following equation, it is
assumed that the nitrate data distributions are lognormal:
MDL = LTA * exp(Zpσy – 0.5σy2)
σy = sqrt(ln(CV2 + 1)) Where:
LTA = long-term average (0.35 mg/L).
Zp = pth percentage point of the standard normal distribution, at 95% (Zp = 1.645).
σ = standard deviation.
CV = coefficient of variance. For the maximum daily nitrate limit, it was assumed that the average monthly target concentration should
be the same as the average daily concentration. Also, assuming the target dataset will have the same CV
as the existing measured dataset (Table 6.1) and allowing a 5% exceedance (EPA 2007, pp. 19 and 20),
the daily maximum nitrate limit for Blue Spring and Blue Spring Run is 0.36 mg/L.
Table 6.1. Daily maximum for target nitrate concentration (mg/L)
Statistics Blue Spring (WBID 28933),
Blue Spring Run (WBID 28933A) Mean (mg/L) 0.52
CV 0.42 Daily maximum to achieve monthly
average nitrate of 0.35 mg/L 0.36
It should be emphasized that these daily maximum targets were developed for illustrative purposes. The
implementation of the TMDL will be based on the monthly average concentration targets.
Page 48 of 57
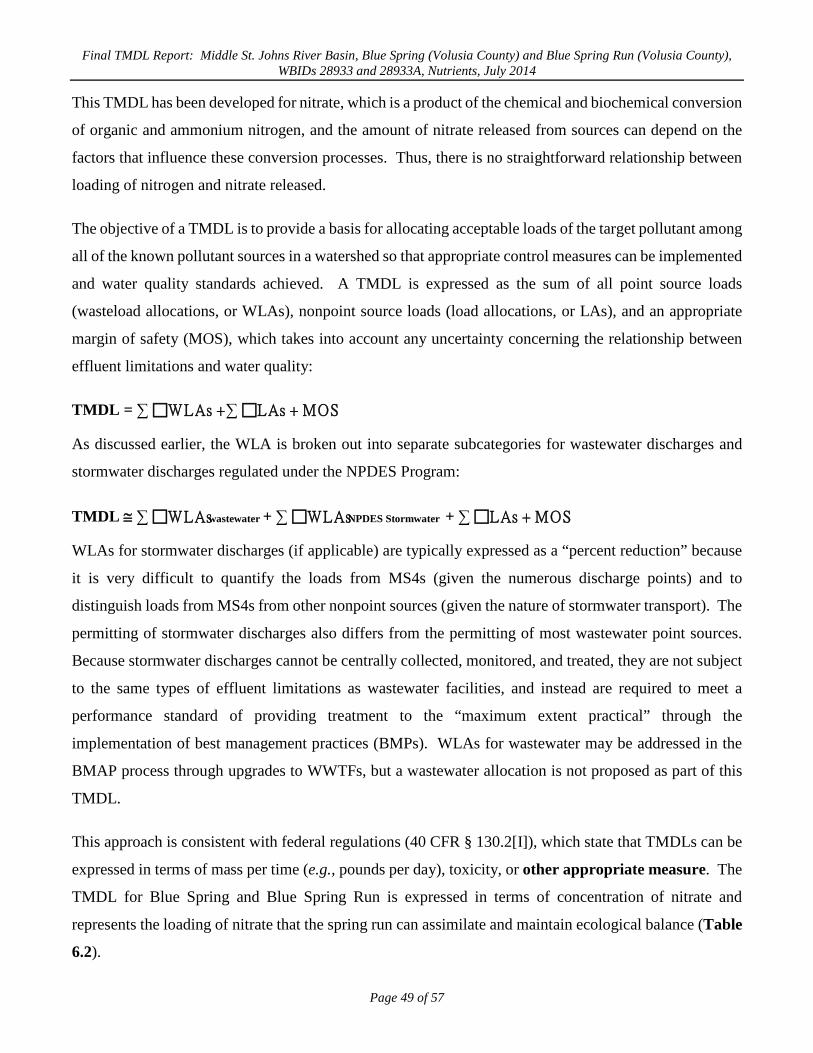
Final TMDL Report: Middle St. Johns River Basin, Blue Spring (Volusia County) and Blue Spring Run (Volusia County), WBIDs 28933 and 28933A, Nutrients, July 2014
This TMDL has been developed for nitrate, which is a product of the chemical and biochemical conversion
of organic and ammonium nitrogen, and the amount of nitrate released from sources can depend on the
factors that influence these conversion processes. Thus, there is no straightforward relationship between
loading of nitrogen and nitrate released.
The objective of a TMDL is to provide a basis for allocating acceptable loads of the target pollutant among
all of the known pollutant sources in a watershed so that appropriate control measures can be implemented
and water quality standards achieved. A TMDL is expressed as the sum of all point source loads
(wasteload allocations, or WLAs), nonpoint source loads (load allocations, or LAs), and an appropriate
margin of safety (MOS), which takes into account any uncertainty concerning the relationship between
effluent limitations and water quality:
TMDL = ∑ WLAs + ∑ LAs + MOS
As discussed earlier, the WLA is broken out into separate subcategories for wastewater discharges and
stormwater discharges regulated under the NPDES Program:
TMDL ≅ ∑ WLAswastewater + ∑ WLAsNPDES Stormwater + ∑ LAs + MOS
WLAs for stormwater discharges (if applicable) are typically expressed as a “percent reduction” because
it is very difficult to quantify the loads from MS4s (given the numerous discharge points) and to
distinguish loads from MS4s from other nonpoint sources (given the nature of stormwater transport). The
permitting of stormwater discharges also differs from the permitting of most wastewater point sources.
Because stormwater discharges cannot be centrally collected, monitored, and treated, they are not subject
to the same types of effluent limitations as wastewater facilities, and instead are required to meet a
performance standard of providing treatment to the “maximum extent practical” through the
implementation of best management practices (BMPs). WLAs for wastewater may be addressed in the
BMAP process through upgrades to WWTFs, but a wastewater allocation is not proposed as part of this
TMDL.
This approach is consistent with federal regulations (40 CFR § 130.2[I]), which state that TMDLs can be
expressed in terms of mass per time (e.g., pounds per day), toxicity, or other appropriate measure. The
TMDL for Blue Spring and Blue Spring Run is expressed in terms of concentration of nitrate and
represents the loading of nitrate that the spring run can assimilate and maintain ecological balance (Table
6.2).
Page 49 of 57
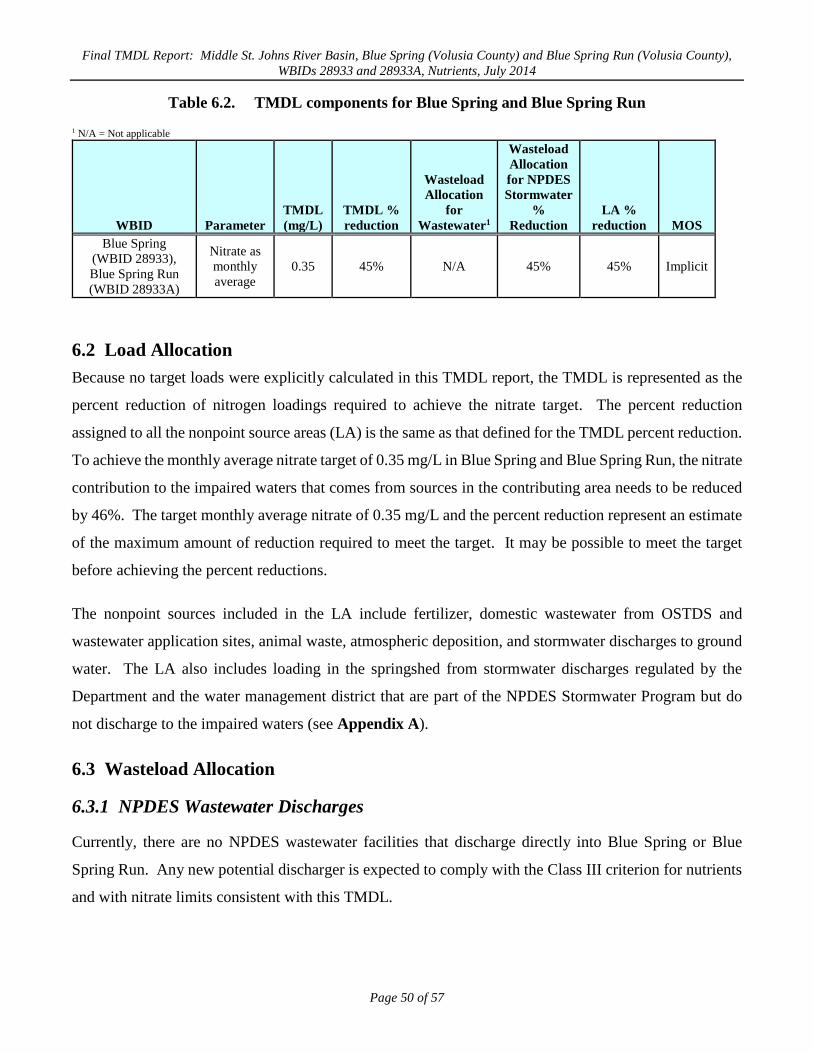
Final TMDL Report: Middle St. Johns River Basin, Blue Spring (Volusia County) and Blue Spring Run (Volusia County), WBIDs 28933 and 28933A, Nutrients, July 2014
Table 6.2. TMDL components for Blue Spring and Blue Spring Run
1 N/A = Not applicable
WBID Parameter TMDL (mg/L)
TMDL % reduction
Wasteload Allocation
for Wastewater1
Wasteload Allocation for NPDES Stormwater
% Reduction
LA % reduction MOS
Blue Spring (WBID 28933), Blue Spring Run (WBID 28933A)
Nitrate as monthly average
0.35 45% N/A 45% 45% Implicit
6.2 Load Allocation Because no target loads were explicitly calculated in this TMDL report, the TMDL is represented as the
percent reduction of nitrogen loadings required to achieve the nitrate target. The percent reduction
assigned to all the nonpoint source areas (LA) is the same as that defined for the TMDL percent reduction.
To achieve the monthly average nitrate target of 0.35 mg/L in Blue Spring and Blue Spring Run, the nitrate
contribution to the impaired waters that comes from sources in the contributing area needs to be reduced
by 46%. The target monthly average nitrate of 0.35 mg/L and the percent reduction represent an estimate
of the maximum amount of reduction required to meet the target. It may be possible to meet the target
before achieving the percent reductions.
The nonpoint sources included in the LA include fertilizer, domestic wastewater from OSTDS and
wastewater application sites, animal waste, atmospheric deposition, and stormwater discharges to ground
water. The LA also includes loading in the springshed from stormwater discharges regulated by the
Department and the water management district that are part of the NPDES Stormwater Program but do
not discharge to the impaired waters (see Appendix A).
6.3 Wasteload Allocation
6.3.1 NPDES Wastewater Discharges
Currently, there are no NPDES wastewater facilities that discharge directly into Blue Spring or Blue
Spring Run. Any new potential discharger is expected to comply with the Class III criterion for nutrients
and with nitrate limits consistent with this TMDL.
Page 50 of 57
Final TMDL Report: Middle St. Johns River Basin, Blue Spring (Volusia County) and Blue Spring Run (Volusia County), WBIDs 28933 and 28933A, Nutrients, July 2014
6.3.2 NPDES Stormwater Discharges
There are currently no direct stormwater outfalls from NPDES MS4 stormwater facilities to the Blue
Spring or Blue Spring Run. If any occur in the future, they must meet the wasteload allocation for
permitted stormwater discharges.
6.4 Margin of Safety Consistent with the recommendations of the Allocation Technical Advisory Committee (Department
2001), an implicit MOS was used in the development of this TMDL, and was provided by the conservative
decisions associated with a number of assumptions and the development of assimilative capacity. For
example, the NNC nitrate target for springs was established based on a conservative concentration from
multiple lines of evidences (Department 2012). Requiring the 0.35 mg/L target to be met every month
should result in a nitrate concentration even lower than the target concentration during the summer algal
growth season based on a seasonal analysis of the nitrate concentration, and therefore adds to the MOS.
In addition, when estimating the required percent reduction to achieve the water quality target, the highest
long-term monthly average of measured nitrate concentrations was used instead of the average of the
monthly averages. This will make estimating the required percent load reduction more conservative and
therefore adds to the MOS.
Page 51 of 57
Final TMDL Report: Middle St. Johns River Basin, Blue Spring (Volusia County) and Blue Spring Run (Volusia County), WBIDs 28933 and 28933A, Nutrients, July 2014
Chapter 7: NEXT STEPS: IMPLEMENTATION PLAN DEVELOPMENT AND BEYOND
7.1 Basin Management Action Plan Following the adoption of this TMDL by rule, the Department will determine the best course of action
regarding its implementation. Depending on the pollutant(s) causing the waterbody impairment and the
significance of the waterbody, the Department will select the best course of action leading to the
development of a plan to restore the waterbody. Often this will be accomplished cooperatively with
stakeholders by creating a Basin Management Action Plan, referred to as the BMAP. BMAPs are the
primary mechanism through which TMDLs are implemented in Florida (see Subsection 403.067[7], F.S.).
A single BMAP may provide the conceptual plan for the restoration of one or many impaired waterbodies.
A BMAP will be needed to support the implementation of this TMDL. The BMAP will be developed
through a transparent, stakeholder-driven process intended to result in a plan that is cost-effective, is
technically feasible, and meets the restoration needs of the applicable waterbodies. The restoration plan
will take into account the sources of nitrogen in the contributing area, including legacy loads from past
land use activities, as well as the complexity of the aquifer system that conveys pollutants to the impaired
waters.
Once adopted by order of the Department Secretary, BMAPs are enforceable through wastewater and
municipal stormwater permits for point sources and through BMP implementation for nonpoint sources.
Among other components, BMAPs typically include the following:
• Water quality goals (based directly on the TMDL).
• Refined source identification.
• Load reduction requirements for stakeholders (quantitative detailed allocations, if
technically feasible).
• A description of the load reduction activities to be undertaken, including
structural projects, nonstructural BMPs, and public education and outreach.
• A description of further research, data collection, or source identification needed
in order to achieve the TMDL.
Page 52 of 57
Final TMDL Report: Middle St. Johns River Basin, Blue Spring (Volusia County) and Blue Spring Run (Volusia County), WBIDs 28933 and 28933A, Nutrients, July 2014
• Timetables for implementation.
• Implementation funding mechanisms.
• An evaluation of future increases in pollutant loading due to population growth.
• Implementation milestones, project tracking, water quality monitoring, and
adaptive management procedures.
• Stakeholder statements of commitment (typically a local government resolution).
BMAPs are updated through annual meetings and may be officially revised every five years. Completed
BMAPs in the state have improved communication and cooperation among local stakeholders and state
agencies; improved internal communication within local governments; applied high-quality science and
local information to the management of water resources; clarified the obligations of wastewater point
source, MS4, and non-MS4 stakeholders in TMDL implementation; enhanced transparency in the
Department’s decision making; and built strong relationships between the Department and local
stakeholders that have benefited other program areas.
Page 53 of 57
Final TMDL Report: Middle St. Johns River Basin, Blue Spring (Volusia County) and Blue Spring Run (Volusia County), WBIDs 28933 and 28933A, Nutrients, July 2014
References
Albertin, A., J.O. Sickman, A. Pinowska, R.J. Stevenson and M. Anderson. 2012. Identification of
nitrogen sources and transformations within karst springs using isotope tracers of nitrogen.
Biogeochemistry. DOI 10.1007/s10533-011-9592-0.
Arthur, J.D., H.A.R. Wood, A.E. Baker, J.R. Chichon, and G.L. Raines. 2007. Development and
implementation of a Baysean-based aquifer vulnerability assessment in Florida. Natural Resources
Research 16(2), 93–107.
Climate Information for Management and Operational Decisions. 2011. Southeast Regional Climate
Center. Available: http://climod.meas.ncsu.edu/.
Copeland, R., N.A. Doran, A.J. White, and S.B. Upchurch. 2011. Regional and statewide trends in
Florida’s spring and well groundwater quality (1991 – 2003). Bulletin No. 69 (Revised).
Published for the Florida Geological Survey, Tallahassee, FL.
Cowell, B.C., and C.J. Dawes. 2004. Growth and nitrate-nitrogen uptake by the cyanobacterium
Lyngbya wollei. Notes. Journal Aquatic Plant Management 42: 69–71.
Florida Department of Environmental Protection. 2005. Blue Spring and Hontoon Island State Parks
unit management plan. Tallahassee, FL: Division of Parks and Recreation.
———. 2008. General biological structure of Volusia Blue Spring Run. Tallahassee, FL: Division of
Water Resource Management, Bureau of Assessment and Restoration.
———. 2011. Florida State Park system economic impact assessment, FY 2010/2011. Prepared by the
Division of Recreation and Parks. Available: http://www.nasorlo.org/wp-
content/uploads/2011/11/FPS-2010-2011-Economic-Impact-Assessment1.pdf..
———. 2012. Technical support document: Development of numeric nutrient criteria for Florida
lakes, spring vents, and streams. Prepared by the Standards and Assessment Section. Unpublished
report. Tallahassee, FL.
Florida Department of Health. 2010. Onsite sewage - Treatment and disposal systems vector digital
data.
Page 54 of 57
Final TMDL Report: Middle St. Johns River Basin, Blue Spring (Volusia County) and Blue Spring Run (Volusia County), WBIDs 28933 and 28933A, Nutrients, July 2014
———. 2011. Available: http://www.doh.state.fl.us/.
Franz, R. 1982. Rare and endangered biota of Florida, Volume six, Invertebrates. Gainesville, FL:
University Press of Florida.
German, E.R. 2008. Volusia Blue Spring – A hydrological treasure. United States Geological Survey
Fact Sheet 2008-3035. Available: http://pubs.usgs.gov/fs/2008/3035/.
Hand, J. 2009. Typical Florida spring values. Unpublished PowerPoint presentation for the
Department.
Harrington, D., G. Maddox, and R. Hicks. February 2010. Florida Springs Initiative Monitoring
Network report and recognized sources of nitrate. Tallahassee, FL: Florida Department of
Environmental Protection, Division of Environmental Assessment and Restoration, Bureau of
Watershed Restoration, Ground Water Protection Section.
Hazen and Sawyer. August 2009. Florida onsite sewage nitrogen reduction strategies study: Task A.2,
Final report, Literature review of nitrogen reduction technologies for onsite sewage treatment
systems. Florida Department of Health Contract CORCL.
Heffernan, J.B., D.M. Liebowitz, T.K. Frazer, J.M. Evans, and M.J. Cohen. 2010. Algal blooms and
the nitrogen-enrichment hypothesis in Florida springs: Evidence, alternatives, and adaptive
management. Ecol. Applications 20(3), 816–829.
Hicks, R., D. Harrington, and G. Maddox. March 2009. Documentation to support listing of nutrient
impaired springs and spring runs (Volusia Blue Spring and Volusia Blue Spring Run; DeLeon
Spring; Jackson Blue Spring and Merritts Mill Pond; Silver Springs, Silver Springs Group, and
Upper Silver River; Rainbow Springs Group and Rainbow Springs Group Run; and Weeki Wachee
Spring and Weeki Wachee Spring Run. Tallahassee, FL: Florida Department of Environmental
Protection, Division of Environmental Assessment and Restoration, Bureau of Watershed
Restoration, Ground Water Protection Section.
Katz, B.G., H.D. Hornsby, J.K. Bohlke, and M.F. Mokray. 1999. Sources and chronology of nitrate
contamination in spring waters, Suwannee River Basin, Florida. U.S. Geological Survey Water-
Resources Investigations Report 99-4252.
Page 55 of 57
Final TMDL Report: Middle St. Johns River Basin, Blue Spring (Volusia County) and Blue Spring Run (Volusia County), WBIDs 28933 and 28933A, Nutrients, July 2014
Kimrey, J.O. 1990. Potential for ground-water development in central Volusia County, Florida. United
States Geological Survey Water-Resources Investigations Report 90-4010.
Knochenmus, D.D., and M.E. Beard. 1971. Evaluation of the quantity and quality of the water
resources of Volusia County, Florida. Florida Bureau of Geology RI No. 57.
MACTEC. March 2010. Wekiva River Basin nitrate sourcing study. Final report. Prepared for the St.
Johns River Water Management District and Florida Department of Environmental Protection.
MACTEC Project No. 6063090160A.
Maddox, G.L., J.M. Lloyd, T.M. Scott, S.B. Upchurch, and R. Copeland (eds). 1992. Florida’s Ground
Water Quality Monitoring Program, background geochemistry. Florida Geological Survey Special
Publications 34.
Mattson, R.A., M. Lehmensiek, and E.F. Lowe. 2007. Nitrate toxicity in Florida springs and spring-
run streams: A review of the literature and its implications. St. Johns River Water Management
District Professional Paper SJ2007-PP1. Available:
http://floridaswater.com/technicalreports/pdfs/PP/SJ2007-PP1.pdf.
National Atmospheric Deposition Program. 2014. Available: http://nadp.sws.uiuc.edu/.
National Oceanic and Atmospheric Administration. 2010. Online meteorological data.
Osburn, W.L. 2011. Evaluation of discharge data for Blue Spring, Volusia County, Florida, for the
period 1392–2006. St. Johns River Water Management District Professional Paper SJ 2011-PP1.
Rouhani, S., P. Sucsy, G. Hall, W. Osburn, and M. Wild. 2007. Analysis of Blue Spring discharge to
determine a minimum flow regime. St.Johns River Water Management District Special Publication
SJ2007-SP17.
Rutledge, A.T. 1985. Ground-water hydrology of Volusia County, Florida, with emphasis on
occurrence and movement of brackish water. United States Geological Survey Water-Resources
Investigations Report 84-4206.
Page 56 of 57
Final TMDL Report: Middle St. Johns River Basin, Blue Spring (Volusia County) and Blue Spring Run (Volusia County), WBIDs 28933 and 28933A, Nutrients, July 2014
Sartain, J.B., L.T. Trenholm, E.F. Gilman, T.A. Obreza, and G. Toor. 2009. Frequently asked questions
about landscaping fertilization for Florida-friendly landscaping ordinances. University of Florida
Institute of Food and Agricultural Sciences, ENH1115.
Shoemaker, B., A.M. O’Reilly, N. Sepulveda, S.A.M. Williams, L.H. Motz, and Q. Sun. 2004.
Comparison of estimated areas contributing recharge to selected spring in north-central Florida by
using multiple ground-water flow models. United States Geological Survey Open-File Report 03-
448.
Stevenson, R.J., A. Pinowska, and Y.K. Wang. 2004. Ecological condition of algae and nutrients in
Florida springs. Tallahassee, FL: Florida Department of Environmental Protection.
Stevenson, R.J., A. Pinowska, A. Albertin, and J.O. Sickman. 2007. Ecological condition of algae and
nutrients in Florida springs: The synthesis report. Submitted to the Florida Department of
Environmental Protection.
St. Johns River Water Management District. 2006. Human use and ecological evaluation of the
recommended minimum flow regime for Blue Spring and Blue Spring Run, Volusia County, Florida.
Prepared by Wetland Solutions, Inc. Special Publication SJ2007-SP19.
Tibbals, C.H. 1990. Hydrology of the Floridan aquifer system in east-central Florida. United States
Geological Survey Professional Paper 1403-E.
Toth, D.J. 1999. Water quality and isotope concentrations from selected springs in the St. Johns River
Water Management District. St. Johns River Water Management District Technical Publication
SJ1999-2.
Toth, D.J., and B.G. Katz. 2006. Mixing of shallow and deep groundwater as indicated by the
chemistry and age of karstic springs. Hydrogeology Journal 14: 1060–1080.
United States Census Bureau. 2010. Available: http://www.census.gov/.
United States Environmental Protection Agency. November 1987. Fact sheet – Volusia-Floridan sole
source aquifer. Atlanta, GA.
Page 57 of 57
Final TMDL Report: Middle St. Johns River Basin, Blue Spring (Volusia County) and Blue Spring Run (Volusia County), WBIDs 28933 and 28933A, Nutrients, July 2014
——— . November 2006. Memorandum establishing TMDL “daily” loads in light of the decision by
the U.S. Court of Appeals for the D.C. Circuit in Friends of the Earth, Inc. v. EPA et al., No.05-
5015 (D.C. Cir. 2006) and implications for NPDES permits. Washington, DC.
——— . June 2007. Options for expressing daily load in TMDLs (The Option).
United States Geological Survey. 2008.
——— . 2012. National Water Information System web interface. Available:
http://waterdata.usgs.gov/nwis.
Wyrick, G.G. 1960. The ground-water resources of Volusia County, Florida. Report of Investigations
No. 22. Tallahassee, FL: United States Geological Survey.
Page 58 of 57
Final TMDL Report: Middle St. Johns River Basin, Blue Spring (Volusia County) and Blue Spring Run (Volusia County), WBIDs 28933 and 28933A, Nutrients, July 2014
Appendix A: Background Information on Federal and State Stormwater Programs
In 1982, Florida became the first state in the country to implement statewide regulations to address the
issue of nonpoint source pollution by requiring new development and redevelopment to treat stormwater
before it is discharged. The Stormwater Rule, as authorized in Chapter 403, F.S., was established as a
technology-based program that relies on the implementation of BMPs that are designed to achieve a
specific level of treatment (i.e., performance standards) as set forth in Chapter 62-40, F.A.C. In 1994, the
Department’s stormwater treatment requirements were integrated with the stormwater flood control
requirements of the water management districts, along with wetland protection requirements, into the
Environmental Resource Permit (ERP) regulations.
Chapter 62-40, F.A.C., also requires the state’s water management districts to establish stormwater
pollutant load reduction goals (PLRGs) and adopt them as part of a Surface Water Improvement and
Management (SWIM) plan, other watershed plan, or rule. Stormwater PLRGs are a major component of
the load allocation part of a TMDL. To date, stormwater PLRGs have been established for Tampa Bay,
Lake Thonotosassa, the Winter Haven Chain of Lakes, the Everglades, Lake Okeechobee, and Lake
Apopka.
In 1987, the United States Congress established Section 402(p) as part of the federal Clean Water Act
Reauthorization. This section of the law amended the scope of the federal NPDES permitting program to
designate certain stormwater discharges as “point sources” of pollution. The EPA promulgated
regulations and began implementing the Phase I NPDES Stormwater Program in 1990. These stormwater
discharges include certain discharges that are associated with industrial activities designated by specific
standard industrial classification (SIC) codes, construction sites disturbing five or more acres of land, and
the master drainage systems of local governments with a population above 100,000, which are better
known as MS4s. However, because the master drainage systems of most local governments in Florida are
interconnected, the EPA implemented Phase I of the MS4 permitting program on a countywide basis,
which brought in all cities (incorporated areas), Chapter 298 urban water control districts, and FDOT
throughout the 15 counties meeting the population criteria. The Department received authorization to
implement the NPDES Stormwater Program in 2000.
An important difference between the federal NPDES and the state’s Stormwater/ERP Programs is that the
NPDES Program covers both new and existing discharges, while the state’s program focuses on new
Page 59 of 57
Final TMDL Report: Middle St. Johns River Basin, Blue Spring (Volusia County) and Blue Spring Run (Volusia County), WBIDs 28933 and 28933A, Nutrients, July 2014
discharges only. Additionally, Phase II of the NPDES Program, implemented in 2003, expands the need
for these permits to construction sites between one and five acres, and to local governments with as few
as 1,000 people. While these urban stormwater discharges are now technically referred to as “point
sources” for the purpose of regulation, they are still diffuse sources of pollution that cannot be easily
collected and treated by a central treatment facility, as are other point sources of pollution such as domestic
and industrial wastewater discharges. It should be noted that all MS4 permits issued in Florida include a
reopener clause that allows permit revisions to implement TMDLs when the implementation plan is
formally adopted.
Page 60 of 57
Related Documents