Final Report to Review of the Cost of Providing Quality Childcare Services in Ireland March 2020

Welcome message from author
This document is posted to help you gain knowledge. Please leave a comment to let me know what you think about it! Share it to your friends and learn new things together.
Transcript

Final Report to
Review of the Cost of Providing Quality
Childcare Services in Ireland
March 2020

Final Report to Department of Children & Youth Affairs: Cost of Providing Quality Childcare i
Contents
Summary Report ................................................................................................................... 1
Background ................................................................................................................................... 1
Review of the Literature & Market Analysis .................................................................................. 1
Stakeholder Engagement ............................................................................................................. 2
Survey Administration & Dataset .................................................................................................. 2
Survey Findings- Quantitative ....................................................................................................... 2
Survey Findings – Qualitative ....................................................................................................... 4
Advanced Analysis of Dataset: Regression .................................................................................. 5
Cost Modelling Tool & Unit Cost ................................................................................................... 6
Overall Cost Breakdown ............................................................................................................... 7
Concluding Comments.................................................................................................................. 7
Background and Context ..................................................................................................... 8
1 Introduction .................................................................................................................. 9
1.1 Background ......................................................................................................................... 9
1.2 Terms of Reference ............................................................................................................ 9
1.3 Oversight Group ............................................................................................................... 11
1.4 Overall Project Approach .................................................................................................. 11
1.5 Structure of this Report ..................................................................................................... 13
2 Evidence and Documentation Review ..................................................................... 14
2.1 Setting the Context for the Review of Costs of Childcare Provision ................................ 14
2.2 Call for Evidence .............................................................................................................. 15
2.3 Literature and Policy Documentation ............................................................................... 15
2.4 The Relationship Between Quality and Costs .................................................................. 16
2.5 Developing a Unit-Cost Model .......................................................................................... 17
2.6 Engagement with the Sector ............................................................................................ 26
3 High-Level Market Analysis ...................................................................................... 28
3.1 Market Profile and Composition ....................................................................................... 28
3.2 Features of the Irish Childcare Market ............................................................................. 29
3.3 Market Factors .................................................................................................................. 31
3.4 Profile of the Irish Childcare Market ................................................................................. 32
3.5 Fees .................................................................................................................................. 36
3.6 Economic Analysis of Reasonable Profit .......................................................................... 38
Methodologies ..................................................................................................................... 41
4 Development of the Survey Tool .............................................................................. 42
4.1 Methodological Approach to the Survey ........................................................................... 42
4.2 Key Areas Addressed in Survey Tool ............................................................................... 42
4.3 Drafting and Refining ........................................................................................................ 43
4.4 Challenges in Developing the Survey .............................................................................. 43
4.5 Piloting .............................................................................................................................. 44
4.6 Childminder Survey .......................................................................................................... 44

Final Report to Department of Children & Youth Affairs: Cost of Providing Quality Childcare ii
4.7 Survey Target Population ................................................................................................. 44
4.8 Issues Relating to the Operation of the Survey ................................................................ 45
5 Data Cleaning and Robustness ................................................................................ 46
5.1 Survey Responses and Cleaned Dataset Overview ........................................................ 46
5.2 Need for Data Cleaning .................................................................................................... 46
5.3 Data Cleaning Approach .................................................................................................. 47
5.4 Types of Correction .......................................................................................................... 48
5.5 Alignment of Dataset to Existing Sector Data .................................................................. 49
5.6 Data Issues and Limitations ............................................................................................. 52
6 Regression Analysis Methodology .......................................................................... 54
6.1 Preamble .......................................................................................................................... 54
6.2 Method .............................................................................................................................. 54
6.3 Development of Regression Model .................................................................................. 55
Findings and Outputs ......................................................................................................... 57
7 Childcare Provider Survey Findings ........................................................................ 58
7.1 Overview ........................................................................................................................... 58
7.2 Profile of Survey Responses ............................................................................................ 58
7.3 Premises ........................................................................................................................... 64
7.4 Services ............................................................................................................................ 69
7.5 Capacity ............................................................................................................................ 72
7.6 Rooms .............................................................................................................................. 73
7.7 Charges and Discounts .................................................................................................... 74
7.8 Staffing .............................................................................................................................. 77
7.9 Staff Development ............................................................................................................ 78
7.10 Staffing Resources and Turnover ..................................................................................... 80
7.11 Survey Findings – Qualitative ........................................................................................... 83
8 Regression Analysis Outputs ................................................................................... 84
8.1 Introduction ....................................................................................................................... 84
8.2 Results .............................................................................................................................. 84
8.3 Conclusions ...................................................................................................................... 91
9 Sample Cost Modelling Tool Outputs ...................................................................... 94
9.1 Overview ........................................................................................................................... 94
9.2 Average Unit Cost per Hour of Childcare Provision ......................................................... 94
9.3 Sample Scenario Modelled: Staff-Child Ratios in School-Age Childcare ........................ 97
9.4 Key Components of Cost within the Cost Modelling Tool ................................................ 97
Conclusions ...................................................................................................................... 102
10 Concluding Comments ........................................................................................... 103
10.1 Project Learnings ............................................................................................................ 103
10.2 Key Findings ................................................................................................................... 104
10.3 Next Steps ...................................................................................................................... 105
References ......................................................................................................................... 106
Appendix 1: Survey Questionnaire ................................................................................. 108
Appendix 2: Detail on Data Cleaning .............................................................................. 132

Final Report to Department of Children & Youth Affairs: Cost of Providing Quality Childcare iii
Appendix 3: Detail on Regression Analysis ................................................................... 141

Final Report to Department of Children & Youth Affairs: Cost of Providing Quality Childcare iv
Glossary CCS – Community Childcare Subvention
CPD – Continuing Professional Development
CSO – Central Statistics Office
DCYA – Department of Children and Youth Affairs
DES – Department of Education and Skills
DfE – Department for Education
ECCE – Early Childhood Care and Education
ECEC – Early Childhood Education and Care
EE – East of England
EM – East Midlands
EU – European Union
FTE – Full-time Equivalent
GDP – Gross Domestic Product
LA – Local Authorities
NAHT – National Association of Head Teachers
NCS – National Childcare Scheme
NFQ – National Framework of Qualifications
NGO – Non-Governmental Organisation
NLH – Nigel Lloyd Healthcare
NI – Northern Ireland
NUTS – Nomenclature of Territorial Units of Statistics
OECD – Organisation for Economic Co-operation and Development
OLS – Ordinary Least Squares
PIP – Programme Implementation Platform
PRSI – Pay Related Social Insurance
PSO – Public Service Obligation
PVI – Private Voluntary Initiative
QAP – Quality Assurance Programme
QE – Quantitative Easing
SEED – Study of Early Education and Development
SGEI – Services of General Economic Interest
TFEU – Treaty of the Functioning of the European Union
UCD – University College Dublin
WM – West Midlands

Final Report to Department of Children & Youth Affairs: Cost of Providing Quality Childcare 1
Summary Report
Background
Crowe (formerly Crowe Horwath), in association with Apteligen, were commissioned by the
Department of Children and Youth Affairs (DCYA) to undertake an independent review on the cost of
providing quality childcare in Ireland. The project was part of a wider commitment by the DCYA to
establish an evidence base for the development and support of quality Early Learning and Care (ELC)
and School Age Childcare (SAC) provision in Ireland. This contract was awarded in Autumn 2017.
The brief included:
analysing the current costs of providing ELC and SAC and the factors that impact on these
costs;
the development and delivery of a model of the unit costs of providing ELC and SAC that allows
analysis of policy changes and variation in cost-drivers, including the potential impact of
professionalisation; and
providing an objective, high-level market analysis of the sector in Ireland, including analysis of
fee levels charged to parents.
An Oversight Group for this work was established by DCYA, comprising representatives from the
DCYA, the Department of Education and Skills (DES), and Pobal. The Oversight Group met regularly
to provide insight, review outputs, discuss and sign off on key project decisions, including the design
of the survey tool. An overall approach and methodology was decided upon in partnership with the
Oversight Group and Crowe/Apteligen and a number of key activities have been undertaken to date.
These include:
review of literature, context, existing data, and reports, including those submitted via a call for
evidence and literature searches (comprising peer-reviewed and “grey” literature);
an initial scoping exercise of early-stage informative engagement with 19 providers of different
sizes, types, and locations comprising an overview of the providers’ business models and
financial records to understand the cost drivers and key issues impacting on the operation of
the providers’ businesses;
engagement with key stakeholders from the sector, including the Early Years Forum, provider
representative organisations, the City/County Childcare Committees, Statutory bodies,
professional training bodies, and academics;
the administration of a survey to all centre-based providers nationally, to provide the data on
which the cost modelling tool would be based;
the development of a cost modelling tool (and guidance document) to present the baseline cost
data and enable the impact of a range of scenarios on unit cost, to be tested; and
the production of a final report.
Outputs from the independent review of costs were subject to an independent peer review.
Review of the Literature & Market Analysis
A high-level literature review was undertaken to inform the review, including the Irish and international
context for ELC and SAC provision, quality, and costs. Examples of international research into
determining the costs of ELC and SAC provision and the principal components and drivers of such
costs were examined, including studies from England, Scotland, and New Zealand.

Final Report to Department of Children & Youth Affairs: Cost of Providing Quality Childcare 2
A high-level market analysis is also undertaken, examining the ELC and SAC market in Ireland as it
pertained at the time of the provider survey, including features of the market such as the current
structure of Exchequer funding in Ireland, market drivers, and the profile of centre-based providers in
terms of size, type, urban/rural location. Consideration was also given to “reasonable profit” for State
aid in respect of ELC and SAC services and brief analysis of this issue was undertaken to inform
future policy decisions in terms of setting the levels of subvention for these services in Ireland.
Stakeholder Engagement
In addition to the literature review, there was a consultation process with key stakeholders, principally
via the Early Years Forum, and direct engagement with a number of providers. These providers were
selected by Crowe to cover the various aspects of provision, and varied in size, location (in terms of
geographic and urban/rural mix), and type (private and community providers). Irish-language
providers were included in the cohort of providers visited. These engagements included reviewing the
financial accounts of the provider to understand key cost issues and provided a useful insight on key
cost items recorded, and how this information was typically captured.
The stakeholder engagement was informative in relation to understanding the primary concerns and
insights of providers to inform the process and to assist in developing a survey tool to capture
information to examine some of the issues involved in a more structured way.
Survey Administration & Dataset
All ELC and SAC services were invited to participate in the survey. The list of relevant services and
contact details was provided by Pobal. This list totalled 4,504 services at the time the survey was
launched. Over the course of the survey roll-out, in order to encourage a higher participation rate, the
deadline to return completed surveys was extended; the Minister for Children and Youth Affairs and
the DCYA issued several press releases to encourage participation and called upon members of the
Early Years Forum to encourage participation among their membership bases; and Crowe engaged
with stakeholder organisations to promote the survey among their membership. The survey responses
totalled 859, yielding a 19% response rate.
As is typical with exercises of this nature, it was necessary to undertake a cleaning process to
“correct” or remove data, which were considered to be implausible. During the cleaning, a variety of
common inaccuracies were discovered and rectified, including missing values, mistyping, and
misinterpretation. The final cleaned dataset used for analysis totalled 573 responses. The profile of
the cleaned dataset is closely aligned to the overall profile of the sector in terms of geographic
distribution, urban/rural location, and provider type.
Survey Findings- Quantitative
The survey responses were analysed and key descriptive outputs are set out in the report. Key
findings are as follows:
Profile
Services in Dublin accounted for 25% of respondents while services in Leitrim accounted for less than
1%. Just under 70% of services were private, with the remainder community services. The Mid-East

Final Report to Department of Children & Youth Affairs: Cost of Providing Quality Childcare 3
had the lowest proportion of community provider respondents, with the highest in the South-West
(46%). Almost half (49%) of respondents stated that they were a sole trader, with company limited by
guarantee being the next most popular answer at 31%. Of the 4% that indicated Other, the responses
included “community-based”, “limited company”, and “associated with a school”. Community
organisations primarily (88%) consist of companies limited by guarantee. Conversely, 70% of private
services responding were sole traders.
When asked if the service was part of a chain or multiple-centre provider with a central or head-office
function, the majority of participants who answered the question (91%) indicated that they were stand-
alone; only a minority of respondents were part of a chain of providers. This varies only slightly
between community and private providers, with a slightly higher proportion (12%) of community
providers indicating they were part of a multiple-centre organisation with 7% of private providers
indicating this.
For those that own the building used for services (28% of respondents), they were then asked if grant
aid was availed of for building, extending, or renovating the premises. A number of providers (22%)
indicated that they had availed of grant aid. The total grant aid availed of was €23m, the vast majority
of which (€20.9m) was for building rather than extending or renovating. The distribution of grants
among provider types revealed a significant difference between community and private providers.
Although more individual private provider respondents reported receiving grants (82 private versus 36
community providers), the amounts received by those in the community sector for building grants are
substantially more than those reported by private providers in the survey.
Services
The majority of respondents (91%) indicated that they provided, at a minimum, sessional services in
the mornings. Only a very small number of providers (7%) stated that they provide services other than
ELC and SAC. Community providers who responded indicated that they more frequently offered
afterschool, out-of-term, and part-time services than the overall profile or that of private providers.
Almost all services offering other services were in the community sector. Half (50%) of providers who
responded to the question stated that they had a waiting list. However, when asked if there were
plans to change the capacity of the service, 76% of the respondents indicated that there was no plan
to change capacity. Only 2% stated that they planned to decrease capacity.
Rooms, Sibling Discounts and Provision of Food
The number of rooms available to and in use in the services ranged from one room to 15 rooms. Of
providers who responded, 66% operate with only one or two available rooms. Just under a quarter
(23.3%) have more than three rooms available. As might be expected, those providers only offering
the ECCE Programme typically have fewer rooms available and in use, with 69% of ECCE
Programme-only respondents having only one room available and in use.
Less than half of providers (41%) indicated that they offered sibling discounts. In addition, the
provision and inclusion of food within the fees varies by the type of service provided. For services
providing full-day places, nearly 90% of services indicated they provided food included within their
fees. Sessional services were less likely to provide food, with 73% of morning sessional services and
68% of afternoon sessional services not providing food.

Final Report to Department of Children & Youth Affairs: Cost of Providing Quality Childcare 4
Staffing
The survey asked for details in relation to managers, ELC and SAC staff, and ancillary staff in the
services. The numbers varied considerably, from one to four in the case of managers; one to 45 in the
case of ELC and SAC staff; and from zero to nine for ancillary staff. The average number of
managerial staff across all respondents is 1.2 while the average number of ELC and SAC staff is 5.3.
Only 36% of services provided any numbers for ancillary staff – average 0.9. Community providers
who responded had higher average numbers of ELC and SAC and ancillary staff than private
providers. The average ELC and SAC staff numbers in ECCE Programme-only services are
considerably lower than the overall average, at 2.2.
Over half of providers (57%) considered CPD to be mandatory for all employees, regardless of if they
worked directly with children or not. When looking at private enterprises and community organisations,
there is still a strong emphasis across both provider types on CPD. However, a larger percentage of
community organisations considered CPD to be mandatory for all employees. More than two-thirds
(69%) of respondents stated that the employer pays for all CPD, with a smaller proportion (23%)
stating that the employer part-pays for CPD. Other options for payment of staff CPD activities were in
the minority. Funding of CPD was broadly similar across the different provider types. For these CPD
activities, 56% of providers noted that CPD is undertaken outside work hours only, with no leave
available. Paid leave or overtime was available from 32.5% of respondents, and 11% made unpaid
leave available for CPD.
The majority of respondents indicated that they had no plans to change staffing resources, with no
change planned for either number of staff or staff hours. Only 5% of providers who answered the
question planned to decrease in the coming 12 months and only 6% of those responding planned to
decrease hours in the coming months. Slightly more planned to increase staff or hours in the coming
12 months (27% and 21% respectively), but, overall, providers were not planning on making any
changes to staffing resources in the following year.
Across all respondents, the average percentage of staff leaving within the past 12 months was 12%,
ranging from 0 to 100%. However, 59% reported no staff leaving in the preceding 12 months. The
majority of respondents (83%) indicated that the capacity to offer attractive wages or salary levels was
a key concern. Another key concern for many providers (72%) was the difficulty of attracting suitably
qualified and experienced staff. The responses less commonly highlighted by respondents included
difficulty attracting staff with appropriate language competency, and competition from other providers.
Survey Findings – Qualitative
The survey included some opportunities for participants to express their opinion on the key issues. A
brief overview of these qualitative responses is set out here.
Providers believed that the low salaries within the sector impact on the ability of providers to
both recruit and retain qualified staff.
The part-time nature of work in the sector, including services that lay off staff in the summer
months as services are not funded year-round (e.g. ECCE Programme), was also cited by
providers as a significant challenge to recruitment and retention of staff.
Providers also reported experiencing difficulty in finding appropriately qualified, capable, and
motivated staff.
All providers reported experiencing significant financial challenges and pressures.
Some providers indicated they perceived a great of deal of financial uncertainty operating in the
sector, reportedly reducing the ability of providers to plan ahead, particularly with regards to

Final Report to Department of Children & Youth Affairs: Cost of Providing Quality Childcare 5
staffing decisions, stemming from not being able to predict income due to not knowing how
many numbers they will have until the beginning of a term.
Providers reported a perception of poor morale amongst those working in the sector, driven by
some of the issues listed above and a more general sense of the work of the sector not being
fully valued.
A common frustration expressed by a number of providers was the perceived complex level of
administration required to operate in the sector and comply with regulations; this administrative
workload was reported as onerous and time-consuming.
A number of providers who worked in rural areas referenced specific challenges due to their
operating environment, including low population numbers which impact on income,
(in)accessibility of training events for staff, and operating in areas of lower income.
Many of the issues cited by Irish language providers were aligned with those of English-
language providers, such as difficulty in recruiting staff, paperwork, and so on.
Advanced Analysis of Dataset: Regression
A statistical technique known as regression analysis was undertaken on the survey dataset to better
determine cost drivers. Regression allows for a more robust understanding of the relationship
between variables. The design of the regression approach was informed by review of documentation
to develop a set of hypothetical cost drivers and this was used to identify key hypothesised drivers of
unit costs.
The principal findings from the regression analysis are summarised below:
Size played a key role in the variation in unit cost, with large services cheaper than smaller
services. Much of the advantage in size may be due to efficiencies that come with scale. Other
efficiencies were also important, however. For example, those services where all the hours
were filled had a lower unit cost than those with vacancies. Similarly, the effect of the age of the
children on cost was apparent, with school age children being cheaper to provide for than
younger children. This is likely related to regulations concerning the number of staff required
(adult-child ratio) for different age groups.
Where there was more non-contact time, the service was generally more expensive.
There also appeared to be cost savings for particular entity and premises types, and this may
be due to differences in overheads. For example, sole traders appeared to have lower unit
costs, and those services which did not have a formal lease also benefitted. This may be
related to very small service providers operating out of their homes.
The model shows that the service characteristics play a clear role in driving variation in unit cost
and suggests there may be some potential value in segmenting services into categories to
support policy decision-making. In particular, there appear to be some distinct service types,
with a contrast between smaller services that primarily focus on ECCE provision, and larger
services that offer a range of different session types.
The unit cost was higher in services with higher capitation, presumably as the costs of
employing staff are higher. This is consistent with the findings in other studies.
Services that opened all year appeared to have a lower unit cost than those that did not. This
contrasts a UK study, which found that all year opening was associated with a higher cost than
term only. It may be that the association of all-year opening with size is responsible for this
(very large services tended to open all year).
In terms of geographic variables, the final model retained an indicator for rurality, with urban
services being more expensive than those in rural areas.

Final Report to Department of Children & Youth Affairs: Cost of Providing Quality Childcare 6
Cost Modelling Tool & Unit Cost
A cost modelling tool was developed for the DCYA using the survey data. The cost modelling tool
has been designed to allow the DCYA to test a range of different assumptions and scenarios and
identify the impact of these on unit cost.
The average unit cost per hour is based on the cost modelling tool outputs from the data supplied by
providers. Whilst every individual provider is different and will have a different actual cost per hour,
this will be reflected in the average unit cost per hour. The cost modelling tool does not attempt to
reflect differences in operating models or any local circumstances that may impact on cost.
Unit costs were calculated using filled places, hours per place per year (derived from hours per
week/day and service weeks per year), and total costs.
The cost modelling tool assessed the average unit cost per hour of ELC and SAC provision as
€4.14. This is averaged across all age groups, staff ratios, service types, and so on. There is a
wide distribution of unit costs (see main report for further details as well as average unit cost
for a range of service characteristics).
This average unit cost is closely aligned to comparative cost data found in other jurisdictions. For
example, a detailed study of costs and income for childcare providers in Scotland in 2016 provided a
detailed breakdown of the per hour costs to providers as being on average £3.70/hour (roughly
€4.20). In New Zealand, in 2013 the average cost per child per hour of childcare was calculated as
ranging from $5.80NZ to $10.20NZ (somewhere in the region of €3 to €6). Findings from work
undertaken on behalf of the Department for Education in England is also provided (below)
Age Group
Provider Type 2-year-olds 3- & 4-year-olds
1:3.2 Ratio 1:4 Ratio 1:6 Ratio 1:8 Ratio
Private group-based £5.87 £5.00 £4.25 £3.56
Voluntary group-based £5.39 £4.54 £3.81 £3.14
1:10 Ratio 1:13 Ratio
Primary schools – nursery n/a n/a £4.37 £3.60
(Source: Review of Childcare Costs: the Analytical Report, DfE, 2015)

Final Report to Department of Children & Youth Affairs: Cost of Providing Quality Childcare 7
Overall Cost Breakdown
The broad components of cost identified suggests a pattern consistent with those found in other
jurisdictions: a dominance of staff costs in the make-up of the overall cost figures, as illustrated below:
Concluding Comments
Over time the cost modelling tool will need to be updated to reflect changes in costs through normal
inflationary pressures or as a result of policy changes. These policy changes may be reflective of
sector-specific initiatives but may also encompass wider governmental decisions that may impact on
the cost base of providers.
These findings should be useful to the DCYA in the consideration of future policy decisions in respect
of childcare subsidy rates.
The capacity to examine further the impact of different cost drivers and scenarios within the cost
modelling tool will further support the DCYA in policy formation.
Payroll68%
Other Employee Costs
1%
Premises Costs8%
Rates1%
Insurance1%
Materials & Equipment
3%
Other Premises Costs4%
Consumables3%
Professional and bank fees
2%
Vehicles1%
Utilities4%
Other costs4%
Breakdown of Key Cost Components - Overall

Final Report to Department of Children & Youth Affairs: Cost of Providing Quality Childcare 8
Background and Context

Final Report to Department of Children & Youth Affairs: Cost of Providing Quality Childcare 9
1 Introduction
1.1 Background
Crowe (formerly Crowe Horwath), in association with Apteligen1, was commissioned by the
Department of Children and Youth Affairs (DCYA) to undertake an independent review on the
cost of providing quality childcare2 in Ireland.
The project was part of a wider commitment by the DCYA to establish an evidence base for
the development and support of quality childcare provision in Ireland. This is in the context of
more than ten years of an expansion of childcare in Ireland, an associated increase in
investment in childcare by the State and a series of initiatives aimed at addressing the
affordability, and improving the quality, of childcare. Such initiatives include the introduction
and roll-out of Aistear and Síolta, the National Practice Frameworks; the introduction of the
ECCE pre-school programme in 2010, with subsequent expansions in 2016/2017 and in
2018/2019; new regulations and a registration system for pre-school childcare and school-age
childcare providers; and the introduction of the National Childcare Scheme (NCS).
The 2016 Programme for Government included a commitment to “conduct and publish an
independent review of the cost of providing quality childcare in private and community
settings, consistent with the principle of on-going professionalisation of the sector”. This
project was commissioned in order to deliver on this commitment.
The DCYA indicated that the cost modelling tool developed through this project would form a
key input into the setting of capitation and subvention rates for future childcare funding
schemes, with a particular focus on the roll-out of the NCS.
1.2 Terms of Reference
The Terms of Reference for the review were articulated by the DCYA as follows:
In order to understand the true cost of providing childcare, a complex set of interlinked variables must
be considered and accounted for. The recent ‘Review of Childcare Costs’ in England (Department for
Education, 2015) did this by developing a representative cost model, based on inputs that represent
variable cost components.
By adopting a ‘bottom-up’ approach to cost calculation, a standardised cost framework will be
developed which is transparent and transferable, allowing comparisons between childcare settings
types and other variables.
The Client requires the development of such a cost model (or similar), which can be used for
sensitivity (what-if?) analysis, in terms of the impact that certain policy or practice changes would
have on unit costs. The approach also allows for a longitudinal perspective.
The successful Tenderer shall:
1 Apteligen, based in London, provides specialist consultancy services to the public sector, with expertise in, among
other things, modelling and decision analysis, forecasting, and simulation. Apteligen were technical experts on the
project team, working with Crowe, who in consultation with the DCYA, had principal responsibility for the development
of the modelling tool and the statistical analysis of cost drivers. 2 Throughout this report, the term “childcare” is used to encompass early learning and care and school age childcare.

Final Report to Department of Children & Youth Affairs: Cost of Providing Quality Childcare 10
Develop a methodology for calculating the unit cost/costs (the cost model) of providing
childcare in Ireland (i.e. cost per child per hour), including factors that result in variation in the
cost of provision.
Identify what data is available through the Client and other Departments/Agencies (e.g. DES
and Pobal) to support this cost model.
Undertake primary research (primarily quantitative with some qualitative also required) where
current data is not sufficient. This will at minimum include a survey to examine issues of costs
and fee structures. The survey should be designed and tested in consultation with childcare
providers to ensure reliability of the results, with these results being validated and triangulated
against qualitative research.
Calculate the unit cost of providing childcare for a range of session-types, provider-types and
age of children, and provide supporting documentation, to support the objective setting of
capitation and subvention rates within childcare funding schemes.
Develop and provide a usable cost calculator which can be used by the Client for future
planning and financial policy sensitivity analysis.
Provide a report which includes the following:
The methodology for developing the outputs above;
The methodology for the data collation and collection (both qualitative and
quantitative);
A high level market analysis of the childcare sector in Ireland, which should include
analysis of fee data;
The current costs of providing childcare under a number of pre-determined headings
and service types;
A statistical analysis of costs including the attributes and variables associated with
costs;
A statistical analysis of costs or variables associated with costs as they relate to
objective quality measures (e.g. Early Years Education-Focused Inspection Ratings of
the Inspectorate at DES and Síolta QAP validation ratings);
An analysis of the main drivers of cost, including the extent to which certain factors
drive cost as well as an analysis of why and under what circumstances they affect cost;
and
The projected costs of providing childcare under a number of scenarios (to be agreed
between the successful Tenderer and the Client), including scenarios related to
increased professionalisation in the childcare sector.
The cost model should include all costs associated with the provision of childcare services. The cost
model is therefore likely to include factors such as staffing costs (e.g. qualification levels, pay rates,
staff hours and contracted weeks, average and minimum adult-child ratios, non-contact time),
overheads (e.g. rental, capital costs, commercial rates, degree of cost-sharing within and across
services), service types (e.g. community / private / childminder, session types, age bands of children,
opening hours, size of service, range of activities provided), environmental factors (e.g. geographic
location, socio-economic profile of the area) as well as occupancy rates.
The cost model should also include analysis of what constitutes a measure of ‘reasonable profit’ in
the childcare sector in Ireland, based on the considerations set out in Article 5 of European
Commission Decision 2012/21/EU3.
3 Commission Decision of 20 December 2011 on the Application of Article 106(2) of the Treaty on the Functioning of
the European Union to State Aid in the Form of Public Service Compensation Granted to Certain Undertakings
Entrusted with the Operation of Services of General Economic Interest. 2012/21/EU.

Final Report to Department of Children & Youth Affairs: Cost of Providing Quality Childcare 11
1.3 Oversight Group
To oversee the project and provide key input to the review, the DCYA established an
Oversight Group comprising representatives from the DCYA, the Department of Education
and Skills, and Pobal.
The Oversight Group met regularly to provide insight, review outputs, discuss and sign off on
key project decisions, assist with the design of the survey questionnaires, work with the
Crowe and Apteligen teams in developing the cost modelling tool, and review the draft and
final reports. We would like to thank the members of the Oversight Group for their support and
input to the review.
1.4 Overall Project Approach
Crowe agreed an approach and methodology with the Oversight Group, which was reviewed
and refined over the course of the assignment. The principal elements of the approach were
as follows:
Key Activities in the Review
Stakeholder engagement
This entailed interviews with key sector stakeholders, principally drawn from
the membership of the Early Years Forum, including provider representative
organisations, the City and County Childcare Committees, statutory bodies,
childcare professional training bodies, academics, etc. The key themes
arising from this engagement are set out in Section 2.
Initial scoping exercise
Comprising direct engagement with childcare providers, the timing and
format of this element was refined from the original proposal whereby it was
decided to engage with providers at a much earlier stage than originally
envisaged, to inform the survey and other aspects of the review and
modelling. In addition, the number of providers was increased to 19 from an
initial plan of 11, all randomly selected by Crowe without input from the
Department or other stakeholders. As outlined in Section 2, this engagement
comprised an overview of the providers’ business models and financial
records to understand the cost drivers and key issues impacting on the
operation of the providers’ businesses.
Review of literature, context, existing data, and reports
A call for evidence was issued, aimed at childcare providers; parents;
representative / umbrella bodies within the childcare sector; academics with
an interest in the childcare sector; voluntary organisations; statutory
agencies; and other stakeholders. The call for evidence requested the
submission of:
Existing studies and research about the cost of childcare in Ireland;
Evidence from childcare providers about the factors that make up the
cost of providing childcare, and how much of the total cost they
represent;
Evidence on the additional cost of providing childcare of high quality;

Final Report to Department of Children & Youth Affairs: Cost of Providing Quality Childcare 12
Evidence from other jurisdictions in respect of establishing, reviewing,
or modelling the costs of childcare provision.
Crowe conducted a literature review using the material submitted via the call
for evidence, additional literature searches (examining a mix of peer-
reviewed and “grey” literature, i.e. published and unpublished reports,
reviews, and other documentation produced by, for example, government
agencies, NGOs, sector representative bodies, and other relevant
organisations), and material submitted by stakeholders arising from our
engagement with them. The key findings from this element of the assignment
are set out in Section 2.
Development and roll-out of a survey of childcare providers
As described in Section 4, the development of a comprehensive survey tool
to be rolled out to all of the approximately 4,500 centre-based childcare
providers nationally was a critical element of the methodology, intended to
provide the majority of the data on which the cost modelling tool would be
based. The survey, seeking details in respect of childcare providers’
services, staffing, premises, operating costs, fees, and other key data, was
originally intended to be run earlier in the review’s timeline, but changes to
the approach, such as engaging with providers earlier in the process, and
the process of drafting, refining, and piloting taking longer than anticipated,
resulted in the survey rolling out over March and April 2018.
An Irish-language version of the survey, and a shorter, tailored survey for
registered childminders, were developed and rolled out following the launch
of the main survey.
Analysis of data gathered
The survey served to provide a dataset on which the cost modelling tool
would be based, and once the survey data collection process was complete,
data cleaning and testing was undertaken to shape the cost modelling tool
and the dataset on which it has been based. This is set out in Section 5. In
addition, quantitative and qualitative outputs from the survey, set out in
Section 7, were analysed as key information for the development of the
overall findings from the review.
Development of cost modelling tool
This aspect of the review comprised the development of a cost modelling
tool to present the baseline cost data and enable the testing of the impact of
a range of scenarios in respect of changes to cost drivers on the unit costs of
delivering childcare services.
Production of final project outputs
At the close of the project, the final outputs were drafted, refined, and
following external peer review, finalised. Final outputs include this report and
a cost modelling tool for internal use only, with an associated guidance
document.
This report was developed to set out the elements of the review, the
methodologies and approaches used, and the key outputs and findings for
the DCYA and the sector.

Final Report to Department of Children & Youth Affairs: Cost of Providing Quality Childcare 13
1.5 Structure of this Report
This report is structured as follows:
Background & Context
1. Introduction
2. Evidence and Documentation Review
3. High-Level Market Analysis
Methodologies
4. Survey Development
5. Data Robustness and Cleaning
6. Regression Analysis
Outputs and Findings
7. Childcare Provider Survey Findings
8. Analysis of Cost Data
9. Highlighted Modelling Outputs
Conclusion
10. Concluding Comments

Final Report to Department of Children & Youth Affairs: Cost of Providing Quality Childcare 14
2 Evidence and Documentation Review
2.1 Setting the Context for the Review of Costs of Childcare Provision
2.1.1 Sources of Evidence
Prior to the design and development of the survey questionnaire for the primary research
stage of the project, and in order to inform our approach to analysis and reporting, we
examined a range of evidence sources in respect of establishing the cost of providing
childcare services. These include:
Literature searches in respect of childcare provider costs, approaches to determining
these for policy purposes, approaches to the analysis of cost drivers in childcare
provision, and the issue of quality in the provision of childcare;
Sources arising from a call for evidence at an early stage of the project;
Engagement with stakeholders from the childcare sector;
Site visits to and interviews with a small selection of childcare providers to inform the
design of the survey questions and to inform the analysis.
The literature search strategy sought a mix of peer-reviewed and “grey” literature, i.e.
published and unpublished reports, reviews, and other documentation produced by, for
example, government agencies, NGOs, sector representative bodies, and other relevant
organisations. As much of the focus of this project is intended to inform and support
policymaking in respect of government support and development of the childcare sector to
drive access and quality, it was appropriate to examine, where possible, some examples of
how other jurisdictions have approached the issue of the cost of childcare provision.
Relevant literature was searched using search terms in Google Scholar and UCD’s
OneSearch4 search engines. A range of relevant search terms was used, such as:
childcare provision costs
childcare delivery costs
“early education” provision costs
“early education” delivery costs
“early childhood care” provision costs
“early childhood care” delivery costs
childminding provision costs
childminding delivery costs
each of the above with “quality” as an additional term
At this stage, the initial search was restricted to material from the past 10 years. English-
language literature was selected as there was insufficient time and resources to undertake
translations of literature published in other languages. Countries of most interest included the
following:
4 UCD library’s OneSearch facility enables the simultaneous searching of a wide number of online databases, publishers,
and other sources of peer-reviewed and other material, including PubMed, ProQuest, EBSCOHost, JStor, BioMed
Central, ScienceDirect, Taylor and Francis, and Emerald Insight.

Final Report to Department of Children & Youth Affairs: Cost of Providing Quality Childcare 15
United Kingdom and its individual jurisdictions;
Other EU countries;
Canada and its individual provinces;
New Zealand;
Australia and its individual states.
The results of the literature searches identified more than 10,000 potential matches. However,
when these were reviewed for relevance, it was evident that most were not directly relevant,
as search terms including costs and the term childcare or similar terms generated large
numbers of results that refer to the market cost to parents of childcare services, i.e. the fees
paid by families accessing childcare, which has been the subject of much research.
2.2 Call for Evidence
In the early stages of the review, a call for evidence was issued, aimed at childcare providers
(crèches, preschool providers, after-school childcare providers, childminders, etc.); parents;
representative / umbrella bodies within the childcare sector; academics with an interest in the
childcare sector; voluntary organisations; statutory agencies; and any other stakeholders. The
call for evidence specifically sought the following:
Existing studies and research about the cost of childcare in Ireland;
Evidence from childcare providers about the factors that make up the cost of providing
childcare, and how much of the total cost they represent;
Evidence on the additional cost of providing childcare of high quality;
Evidence from other jurisdictions in respect of establishing, reviewing, or modelling the
costs of childcare provision.
The call for evidence elicited approximately 60 documentary sources, mostly grey literature, in
relation to the value of quality childcare, the need to support such provision with subsidies,
costs to families to access childcare, the funding structures for childcare in Ireland, and cost
reviews from other jurisdictions. Much of the material provided was from sources that had
already been identified as part of the literature searches.
2.3 Literature and Policy Documentation
2.3.1 Overview
In the following paragraphs, we present a high-level review of the academic literature and the
public policy discourse concerning approaches to improving quality in formal childcare
provision and the development of cost models to inform childcare subvention in Ireland and in
international comparator jurisdictions. This is intended to inform an understanding of quality
indicators and cost drivers in childcare, and to provide context for the interpretation of the
analysis described in this report.
2.3.2 The Need for High-Quality Childcare
The availability of childcare in society is important for a number of reasons, including
encouraging parental labour market participation, in particular for mothers; benefits in social
and cognitive development for children, especially those in situations of disadvantage; and

Final Report to Department of Children & Youth Affairs: Cost of Providing Quality Childcare 16
reduced social costs at a later point (by addressing inequality and disadvantage) (Himmelweit,
et al., 2014; McGinnity, et al., 2013). State support and public funding of childcare is linked to
realising these benefits within national policy objectives, such as the improvement of
educational and social objectives for children and employment activation and economic
objectives for families – particularly mothers (Bertram & Pascal, 2016; Evers, et al., 2005).
However, the evidence points to the importance of quality within childcare in delivering
positive benefits to children (Himmelweit, et al., 2014; Parker, 2013). It is necessary,
therefore, to try to obtain high quality provision of childcare in order for the social benefits and
policy objectives to be most effectively achieved.
2.3.3 What Constitutes High-Quality Childcare?
Whilst quality within childcare can be difficult to define, comprising a range of complex
interactions between provider and child (Parker, 2013), it is generally internationally agreed
that there are certain common indicators of the quality of childcare provision (Bertram &
Pascal, 2016, p. 81; Rentzou, 2017).
These are generally divided into structural indicators which are amenable to regulation, and
dynamic (or process) characteristics of the service, which are more difficult to directly
measure and regulate. Examples of the former indicators include:
Staff to child ratios and group sizes.
The level of competence, training, and qualification of the staff.
The existence of other regulatory standards – which typically focus on the health and
safety of the children and the standard of the care environment.
The existence and standard of any preschool curriculum for delivery.
Dynamic or process indicators include the processes operating within the childcare settings,
such as the quality of the interactions between carers and children, or the way in which
activities are organised (Parker, 2013). Structural quality factors have been associated with
better outcomes, and can be used as proxies for process ones: for example, it can be
assumed that more highly qualified staff who have more time with individual children will more
frequently engage those children in quality activities. Nevertheless, process factors need to be
considered in assessing quality (Parker, 2013).
2.4 The Relationship Between Quality and Costs
2.4.1 Key Cost Drivers
The evidence internationally points to staffing as the principal cost driver for the delivery of
childcare services, as would be expected for human service providers (Cleveland &
Krashinsky, 2004).
In England, a survey of childcare providers published in 2012 by the Department for
Education suggested the proportion of provider costs represented by staff was 77%, with 7%
rent or mortgage costs, 7% on materials, including food, and the remainder for administration
and other overheads (Brind, et al., 2012). This survey is examined in more detail later in this
section, along with others illustrating the strong relationship between total costs and staffing
costs (Arnold, 2013; Martin, et al., 2016; Department for Education, 2015).

Final Report to Department of Children & Youth Affairs: Cost of Providing Quality Childcare 17
Cleveland & Krashinsky (2004, p. 7) identify a clear relationship between costs and staffing:
“costs are very sensitive to staff:child ratio (they rise rapidly as the staff-child ratio improves)
in the region of 1:6 to 1:3 …as staff compensation levels rise, the annual cost of care rises by
close to the same percentage”.
2.4.2 Quality and Costs
Because of this strong relationship between staffing and costs, it is unsurprising to see a
similar relationship between quality indicators (many of which relate to staffing) and costs of
provision:
major drivers of quality are lower user-staff ratios … higher staff qualifications, an
overall staff profile that has a high proportion of people who have significant
qualifications and experience, and adequate remuneration to ensure the attraction
and retention of good staff… these are precisely the major cost drivers for human
service providers” (Davidson, 2009, p. 49)
This is reinforced by Penn & Lloyd (2013), who note that the general finding in the literature,
and assumed by the OECD, is that the quality of childcare service provision is linked to
staffing, principally “child staff ratios and levels of training” (Penn & Lloyd, 2013, p. 25).
Higher staff ratios and employing more highly qualified staff are likely to result in increased
costs. Staff qualifications are one of the most significant element of cost (Penn, 2014), and as
previously mentioned, a structural indicator of quality of service (Gorry & Thomas, 2017;
Doherty, 2014).
Using a policy approach to improve quality through specific indicators like staff ratios and
qualifications, therefore, can lead to increased unit costs for providers: “regulations on child–
staff ratios, group size restrictions, and education requirements are all associated with higher
care prices” (Gorry & Thomas, 2017, p.4139).
2.5 Developing a Unit-Cost Model
2.5.1 Overview
Although the charging policies and cost bases of providers are not normally comprehensively
documented internationally (Bertram & Pascal, 2016), and the development of cost models for
supply-side public funding of childcare providers is not discussed in significant detail in the
literature, a number of countries have undertaken exercises to obtain data on the costs to
providers of delivering childcare services.

Final Report to Department of Children & Youth Affairs: Cost of Providing Quality Childcare 18
2.5.2 England
England has a legacy of childcare and early years provision under three strands: childcare,
welfare, and early education, which, over many years and under different government
policies, have been differently administered and costed (Penn & Lloyd, 2013, p. 13).
2015 Review of Childcare Costs
The DCYA’s specification for this review made reference to a major review of childcare costs
conducted in 2015 by the Department for Education (DfE) to inform decisions about early
years funding rates, ahead of the introduction of an entitlement to 30 hours of free childcare to
three- and four-year-olds (Department for Education, 2015). This report, supported by
research by Deloitte, comprised an economic assessment of the early education and
childcare market and providers’ costs. The DCYA’s project terms of reference suggested that
this study from 2015 should form the basis of the approach to the review of childcare provider
costs in Ireland.
The review compiled data from a range of sources, including primary research in the form of a
survey, along with data available from local authority childcare services and other sources.
As part of the primary research, Deloitte sent a survey questionnaire to 1,821 childcare
providers (from a list of providers supplied by the Department for Education along with
additional contacts provided by local authorities). 282 responses were received, a 15%
response rate for the sample selected. The estimated market size is 25,500 group-based
providers; 17,900 school-based providers; and 46,600 registered childminders in England.
This DfE report put forward assumed average unit costs per hour of childcare for different
provider types and age groups, for different staff ratios in each case, as illustrated in the
following table5:
Age Group
Provider Type 2-year-olds 3- & 4-year-olds
1:3.2 Ratio 1:4 Ratio 1:6 Ratio 1:8 Ratio
Private group-based £5.87 £5.00 £4.25 £3.56
Voluntary group-based £5.39 £4.54 £3.81 £3.14
1:10 Ratio 1:13 Ratio
Primary schools – nursery n/a n/a £4.37 £3.60
(Source: Review of Childcare Costs: the Analytical Report, DfE, 2015)
These costs were calculated by combining data on staffing levels, pay rates, staff
qualifications, and related information to establish average staff costs, which were then added
to a non-staff cost estimate covering cost of premises, utilities, rates, maintenance, interest,
insurance, food costs, and others.
5 The table set out here with the cost figures from this review is to illustrate how the report presented the breakdown of
costs across ages and provider types, and the relative differences between them; they do not imply a relationship
with childcare provider costs in Ireland. They are therefore not presented in euro equivalents as this might be
misleading.

Final Report to Department of Children & Youth Affairs: Cost of Providing Quality Childcare 19
In this review, as suggested by the international evidence, staff costs represented the bulk of
the provider costs. For private providers, the review estimated that staff costs represented
between 58% and 74% of the hourly cost of delivering care, depending on the staff ratios
involved for different age groups. Voluntary providers’ staff costs were between 64% and 79%
of total costs.
Proportion of hourly unit costs represented by staff costs
Provider Type Private
group-based
Voluntary
group-based
Primary
school
nursery Childminders
Highest staff-child ratios 74% 79% 76% 77%
Lowest staff-child ratios 58% 64% 71% 63%
(Source: Review of Childcare Costs: the Analytical Report, DfE, 2015)
Other cost factors varied in significance, although none represented more than a small
percentage of total costs. For private group-based providers, rent or mortgage costs
represented around 8% of the highest hourly cost and 14% of the lowest, with materials costs
representing between 5% and 8%. For voluntary providers, rent and mortgage costs were
lower, and materials was the highest cost factor after staffing costs (between 5% and 8% of
hourly costs). For primary school nurseries, rent or mortgage costs were negligible, with again
materials representing the next biggest cost component after staffing, at between 6% and
8%).
According to the Department for Education, the findings of the review formed the evidence
base for their decision to allocate funding for a substantial uplift to the funding rate, entailing
additional investment in the sector of more than £1 billion more per year by 2019-20, including
£300 million for an increase in the rate paid for the two-, three- and four- year-old entitlements
(Department for Education, 2015, p. 2).
An evaluation of the programme one year after its roll-out (Paull & La Valle, 2018) found that
capacity issues were not proving to be a problem, with providers capable of accommodating
the demand under the new entitlements. However, a substantial proportion of providers
reported negative financial impacts, with between 29% and 47% of providers of different types
reporting a decrease in profit or surplus; the most-affected providers were in the private
sector. The qualitative interviews with providers indicated that reviews to their operating
models would be needed after a further settling-in period with the new funding structures, and
there was concern expressed by providers in relation to the long-term viability of operating the
programme.
Other Studies in England on the Cost of Delivering Childcare
A report in 2017 as part of the SEED (Study of Early Education and Development) project, a
major eight-year study commissioned by the Department for Education to explore how
childcare and early education can give children the best start in life and the factors which are
important for the delivery of high quality provision, summarised the various approaches to
cost assessments undertaken in recent years, as summarised in the following table taken
from the report (Blainey & Paull, 2017, pp. 102-104):

Final Report to Department of Children & Youth Affairs: Cost of Providing Quality Childcare 20
Methodologies, samples and timing for previous delivery cost estimates
Sources, methodology, samples and timing
This study (Blainey & Paull (2017)):
Methodology: Primary data from face-to-face interviews on child numbers, staff use
and salaries, room use and venue costs; and other costs for each session and core
running. Calculations: salaries imputed for staff not paid directly; rents imputed for
venues used at no direct cost; employer NI and pension added to gross salaries
where needed; staff session costs allocated equally across children; venue session
costs allocated by room size; core costs allocated by child hours
Type of provider: separate estimates for 7 types
Regional distribution: 36% north + East Midlands (EM); 51% West Midlands (WM) +
East of England (EE) + south; 13% London
Timing: March – December 2015
Sample sizes: 66 private, 28 voluntary, 3 independent, 18 nursery class, 11
maintained nursery school, 16 LA/children’s centres and 24 childminder settings
Gaheer & Paull (2016)
Methodology: as per Blainey & Paull, 2017, above
Type of provider: children’s centres
Regional distribution: 38% north + EM; 46% WM + EE + south; 17% London
Timing: data collected in 2012-2014 and indexed to March 2014
Sample size: 14 children’s centres
Ceeda (2014)
Methodology: Primary data from child attendance and staff activity diaries in each
room completed by staff over two weeks and pro-forma data on gross salaries and
other financial expenditure. Calculations: employer NI, 1% pension and time for
sickness, training and holiday added to gross salaries (approx. 16%); staff session
costs allocated within session by child age; staff core costs, venue and other costs
allocated by number of places in rooms; costs calculated for funded children
Type of provider: funded children in PVI nurseries and playgroups (59% private and
41% voluntary) with good or outstanding Ofsted rating
Regional distribution: 41% north + EM; 52% WM + EE + south; 7% London
Timing: June/July 2014
Sample size: 100 settings
NLH Partnership (2015) (DfE Childcare Cost Review)
Methodology: Primary pro forma data on total hours delivered in each age group;
total expenditures on staff and 6 other categories and data on staff:child ratios from
interviews. Calculations: staff costs allocated by observed staff:child ratios and child
hours; venue and other costs allocated by child hours; statistics weighted by region,
deprivation level and ownership type
Type of provider: PVI settings from NLH network (58% private 37% voluntary 5%
independent) offering funded places
Regional distribution: 30% north + EM; 49% WM + EE + south; 21% London
Timing: June/July 2015
Sample size: 47 settings

Final Report to Department of Children & Youth Affairs: Cost of Providing Quality Childcare 21
Methodologies, samples and timing for previous delivery cost estimates
Sources, methodology, samples and timing
KPMG (2015)
Methodology: Primary data pro-forma data (checked by follow-up telephone
interview where needed) on weeks and hours open; number of children in each age
group; number of FTE staff; average gross hourly pay; overtime payments; all other
costs. Calculations: staff costs allocated according to statutory staff:child ratios and
child hours; venue and other costs allocated by child hours
Type of provider: PVIs and childminders (81% PVI 19% childminders) offering
funded places
Regional distribution: Birmingham
Timing: 2014/2015 (collected over 5-week period)
Sample size: 79 settings
Green et al (2015)
Methodology: Primary pro-forma data on expenditures and take-up of places for two
year olds.
Type of provider: schools with good or outstanding Ofsted rating participating in the
two-year-olds in schools demonstration project for DfE
Regional distribution: 48% north; 10% WM; 29% London (EM, EE and south
unreported)
Timing: June and August 2014
Sample size: 12 schools
DfE Analytical Report (DfE (2015a)) (DfE Childcare Cost Review)
Methodology: Secondary data and some primary data by type of provider on (a)
Child attendance using number of places, opening weeks and days per week,
distribution by child age and occupancy rates from DfE Providers Survey 2013,
Ceeda (2014), and Deloitte survey/interviews (which were at the time of writing this
report unpublished); (b) Staff hours using staff:child ratios, number of contact hours
and ratios of non-contact to contact hours from DfE Providers Survey 2013, NLH
(2015), NAHT (2015), Ceeda (2014), DfE Providers Finances Survey 2012, and
Deloitte survey/interviews; (c) Staff costs using hourly gross pay by qualification,
10% allowances for training, sickness and holidays, addition of employers’ NIC and
pensions from DfE Providers Survey 2013, Deloitte survey/interviews and
regulations; and (d) Mark-up for non-staff costs using DfE Providers Finances
Survey 2012.
Type of provider: separate estimates for private, voluntary, nursery class and
childminder settings
Regional distribution: varies by original data sources
Timing: varies by original data sources (2012 to 2015) but rebased to 2014/15 prices
using GDP deflator
Sample size: varies by original data sources

Final Report to Department of Children & Youth Affairs: Cost of Providing Quality Childcare 22
Methodologies, samples and timing for previous delivery cost estimates
Sources, methodology, samples and timing
NEF (2014)
Methodology: Secondary data on (a) Staff composition and average staff salaries for
three grades of staff from DfE Providers Survey 2011 and (b) Proportion of
noncontact time for staff and proportion of total costs that are non-wage costs from
DfE Providers Finances Survey 2012. Calculations: employers NI and 3 percent
pensions added to staff salaries and staffing assumed to be at the legal staff-to-child
ratios.
Type of provider: all types
Regional distribution: varies by original data sources
Timing: varies by original data sources (2011-2012)
Sample size: varies by original data sources
(Source: Study of Early Education and Development: Cost and Funding, DfE, 2017)
These studies are often characterised by small sample sizes, albeit with more in-depth data
gathering for each provider than would be possible with just a survey approach. Few have
undertaken explicit cost driver analysis although most present cost component breakdowns.
2.5.3 New Zealand
In New Zealand in 2013 the average cost per child per hour of early childhood care was
calculated as ranging from $5.80NZ to $10.20NZ (somewhere in the region of €3 to €6)
(Arnold, 2013). This was determined by dividing the operating expenditure of the provider by
the number of child-hours accounted for in a variety of settings. However, this figure was
heavily caveated in the report by noting that:
Teacher salaries were by far the biggest cost, except where volunteer labour was used;
The New Zealand Government subsidy towards 20 hours of free childcare for zero to
one-year olds did not cover most providers’ costs (it covered about 80%) and the
subsidy for two to five-year olds covered up to 75% of costs;
The estimates of cost had fairly large margins for error, which was complicated by the
variety of settings and types of provider.
Expenditure was determined through periodic surveys of provider organisations, and
depended on accurate reporting of costs. The 2013 survey had an overall response rate of
44%, comprising 1,895 providers from a total of 4,284 (Arnold, 2013). The survey does not
address school-age care services.
The costs per hour for each type of childcare in the 2013 report are as follows:6
6 As with the previous example, the table is included here to illustrate how the report presented the breakdown of costs
across provider types, and the relative differences between them; they do not imply a relationship with childcare
provider costs in Ireland. They are therefore not presented in euro equivalents as this might be misleading.

Final Report to Department of Children & Youth Affairs: Cost of Providing Quality Childcare 23
2011 2013
Change
2011-
2013
Provider Type
Average
cost
Margin of
error
Average
cost
Margin of
error
Education and care $9.20 $0.15 $10.20 $0.40 11%*
Kindergarten $9.10 $0.10 $9.70 $0.05 6%*
Home-based $8.10 $0.20 $8.90 $0.15 9%*
Playcentre $5.70 $0.25 $5.80 $0.20 1%
Kōhanga reo7 n/a n/a $7.40 $0.05 n/a
(Source: Income, Expenditure and Fees of Early Childhood Education Providers, NZ Ministry of
Education, 2013)
The lower costs in playcentres are due to the use of volunteer labour. The report provides a
breakdown of cost components, as illustrated in the following table:
Provider Type
Teacher
salaries
Other staff
costs
Ongoing
property
costs
Other
operational
costs
Education and care 65% 12% 12% 12%
Kindergarten 69% 11% 8% 13%
Home-based 78% 11% 2% 9%
Playcentre 15% 3% 9% 72%
Kōhanga reo 72% 0% 8% 20%
(Source: Income, Expenditure and Fees of Early Childhood Education Providers, NZ Ministry of
Education, 2013)
As can be seen, the report indicates that teacher salaries made up around two-thirds of costs
for kindergartens and education and care services, and more for kōhanga reo (72%) and
home-based services (78% of costs). When both salaries and other staff costs are considered
together, the proportion increases to between 72% and 89% of total costs for most services,
with the exception of playcentres, where staff costs are exceptionally low, at only 15%,
because these services are structured around volunteer staff.
The report in 2013 was part of a series of regular reviews of childcare provider costs,
following the introduction in 2005 of a new funding system, one of the aims of which was to
link funding more explicitly to costs and to incentivise quality by providing higher funding rates
to services achieving high quality standards (such as the number of qualified teaching staff)
(Arnold, 2013).
Whilst the introductory text makes reference to the survey and its predecessors being focused
on “cost drivers”, it does not appear that the cost components have been analysed specifically
in relation to the drivers of cost.
7 “Kōhanga reo” are “language nests” which are part of a national initiative in New Zealand, designed to promote,
reinforce and strengthen the use the Māori language.

Final Report to Department of Children & Youth Affairs: Cost of Providing Quality Childcare 24
2.5.4 Scotland
A detailed study of costs and income for childcare providers in Scotland in 2016 provided a
detailed breakdown of the per hour costs to providers as being on average £3.70/hour
(roughly €4.20) (Martin, et al., 2016). Costs were determined through survey questions across
a variety of headings including staff, mortgages and utilities and so on.
The aim of the research was to inform Scottish Government analysis of options for extending
free ELC provision from the current 600 hours to 1,140 hours for eligible two, three and four
year-olds by August 2020.
This survey appears to have taken a census approach, albeit to a subsection of the market,
targeting 965 for-profit and not-for-profit providers who provided funded childcare places (not
including local authority provision, which comprised a further 1,500 sites). An online survey
tool was used and 222 responses were received, representing a 22% response rate.
The number of hours was calculated by multiplying the number of weeks per year the provider
was open by the average hours per child per session by the number of children were currently
in attendance. This approach also allowed the researchers to determine detailed regional and
sectoral breakdowns of costs in specific categories.
In line with other research, the Scottish survey found staffing costs represented the lion’s
share of the costs of delivering care, as illustrated in the following chart:
(Source: Costs and Early Learning and Childcare Provision in Partner Provider Settings
(Technical Report), Martin et al, 2016)
Staff costs represented 72.5% of total annual costs for voluntary providers in the survey;
private providers’ staff costs were 67.5% of their total costs for the year. However, rent and
mortgage costs comprised 7% of total annual costs for private providers but only 4% for
voluntary providers.
This study did not undertake analysis of cost drivers.
70%7%
4%
3%
2%
3%3%
4%4%
Breakdown of Unit Cost per Hour
Staff
Rent/mortgage
Utilities
Consumables
Play & learning equipment
Business rates and other taxes
Building maintenance / services
Other costs (transport, play activities, catering, ICT, stafftraining)Other unspecified costs

Final Report to Department of Children & Youth Affairs: Cost of Providing Quality Childcare 25
2.5.5 Considerations
Process for Establishing Provider Costs
Some of the various cost determination exercises discussed above included in the reports
concerns about the provision of complete and accurate cost data by providers. For example,
the Scottish study notes issues in some data provision by providers, resulting in “a relatively
high volume of missing data, particularly in relation to non-staff costs” (Martin, et al., 2016, p.
13). According to Campbell-Barr (2009), some providers may have capability gaps on the
business side of their operations to understand and develop their business and cost
structures.
Many of these cost calculation exercises have small samples and/or low survey response
rates. Some mitigate this by relying to a greater extent on extrapolation and assumptions from
other data sources. However, it is also evident that different reporting requirements in respect
of publicly-funded or subsidised service provision can allow for greater accuracy in data
validation and analysis, and the capacity to combine data sources to calculate costs of
provision.
In considering the approach to the survey for the DCYA, we took account of some of these
considerations; for example, we undertook a census approach rather than a small sample of
providers, and validated the responses against the consultation with service providers in the
early part of the project, and against existing datasets, principally Pobal’s contemporaneous
survey of the sector.
Principal Cost Factors
It is unequivocal from the findings of these cost reviews that the evidence demonstrates that
staff costs represent by far the greatest component of the cost of delivering childcare. The
proportion represented by staffing costs range from just under 60% to more than 80%
depending on the provider type and the staff ratios applicable. Rent and mortgage costs are
frequently the next most significant cost component for private providers, but less so for those
in the voluntary sector.
Cost Drivers
The work undertaken in more recent years (see below for more details), such as the SEED
project and other work in the UK (Paull & Xu, 2019), has identified cost drivers including
higher costs associated with settings with higher average staff qualifications, lower child-to-
staff ratios and smaller group sizes, all associated with quality indicators as discussed above.
These findings are in line with the outputs from the regression analysis of the dataset of Irish
provider cost data as set out in Section 8 of this report.
2.5.6 Taking More Recent Research into Account
The bulk of the literature and documentation review was undertaken in early 2018 to inform
the design of the survey. However, a key piece of research from England was published in
2019 which informed the regression analysis of cost drivers: the Early Years Providers Cost
Study 2018, another report arising from the SEED project which assessed hourly costs and
undertook regression analysis to identify key drivers of cost (Paull & Xu, 2019).

Final Report to Department of Children & Youth Affairs: Cost of Providing Quality Childcare 26
Data on costs and income was collected from 120 early years settings providing
childcare for children under the age of five during March to July 2018. The sample of
childcare providers was randomly selected from two administrative data sources
covering all providers in England. The sample was balanced across provider types and
regions in order to ensure sufficient sample numbers in each region and for each
provider type to analyse differences in cost by region and provider type. A total of 278
providers were approached to take part in the study and visits were completed with 132
settings, generating a response rate of 46 percent. The final sample consisted of 120
settings who provided complete data. (Paull & Xu, 2019, p. 8)
This research identified some key cost drivers including staff qualifications, provider size,
proximity to London, and higher staff-to-child ratios. However, the limitations and possibility of
bias in the small sample is noted in the report.
Another recent report from the Department for Education (Cattoretti, et al., 2019) failed to find
strong associations between staff qualifications and unit cost, although some associations
were identified between lower staff-child ratios and unit cost. Provider type, size, and location
were associated with unit costs, as was providing care to children under two.
2.6 Engagement with the Sector
2.6.1 Overview
To gain an in-depth understanding of the context for this review, we engaged with a range of
stakeholders. These included individual providers, representative bodies, and funding
providers. This engagement was to inform the review overall and the survey development in
particular: the views of the stakeholders were taken into account in the design and content of
the survey questionnaire.
2.6.2 Consultation Process
The process involved meeting with an agreed list of stakeholders: members of the Early
Years Forum. Meetings were also held with a small number of individual providers, with Pobal
staff, and with the DCYA.
The project team randomly selected a small number of providers from around the country to
meet with and discuss the costs of provision. These providers were selected to comprise a
diverse group including geographic spread with a mix of urban and rural locations, and to
include both community and private providers. These meetings were an opportunity for the
project team to understand how providers would normally capture, report on, and manage key
costs. For instance, staff pay is normally measured in terms of hourly rates.
2.6.3 Provider Selection and Site Visits
It was agreed at the outset of the project that the team would engage with approximately 20
individual providers. These providers were selected by the project team to cover the various
aspects of childcare provision, and varied in size, location (in terms of geographic and
urban/rural mix), and type (private and community providers). Irish-language providers were
included in the cohort of providers visited.

Final Report to Department of Children & Youth Affairs: Cost of Providing Quality Childcare 27
To ensure impartiality, Crowe selected the sample without reference to the Department or any
other stakeholder. No details of the individual providers selected have been provided as part
of the project to any stakeholder. The services were selected on a random basis to meet the
criteria above.
At these meetings, we discussed the financial accounts of the provider to understand key cost
issues and how they may relate to other similar service providers. This on-the-ground
engagement with the sector provided a useful insight to the key cost items recorded, and how
this information was typically captured. This information was then utilised for the development
of the survey tool, in informing what questions should be asked to elicit key data from
providers participating in the survey. The providers with whom we engaged directly also
assisted us in the piloting of the survey (see Section 4 below).
Some of the principal common themes arising from the consultations with providers are set
out briefly below. It was useful to understand the primary concerns and insights of providers to
inform the process and to assist in developing a survey tool to capture information to examine
some of the issues involved in a more structured way.
The key costs that were highlighted by the sector were:
Staffing and pay: the providers we spoke to estimated their staffing costs at 70% to
80% of total costs and therefore by far the most significant driver of the cost of
providing care. They expressed concern about the balance of pay rates and the desire
to increase quality, and highlighted a common perception about differences in pay and
other conditions of employment between community and private providers.
Premises: the cost and availability of premises was another cost driver raised by many
providers. Costs were reported to be rising and there was a concern that the economic
recovery would drive rents up further and reduce availability of facilities, limiting
expansion and in some cases even threatening the sustainability of existing service
provision.
Rates: private providers with whom we engaged expressed concerns in relation to the
level of rates payable by service providers who are not solely providing ECCE services,
and the limitations on expansion or diversification of service type (e.g. from ECCE-only
to provide additional services) that this issue poses for some.
Insurance: for many providers to whom we spoke, insurance costs were an issue and
were reported to have risen in recent years.

Final Report to Department of Children & Youth Affairs: Cost of Providing Quality Childcare 28
3 High-Level Market Analysis
3.1 Market Profile and Composition
3.1.1 Overview
This section sets out a high-level analysis of the childcare market in Ireland as it pertained at
the time of the childcare provider survey, i.e. the first half of 2018, and provides an overview
of the sector in respect of the childcare services within the scope of the review. This analysis
is designed to set out a high-level perspective on the profile of the childcare sector and to
contextualise the childcare provider survey and the data emerging from that research. Data is
drawn primarily from Pobal’s Programme Implementation Platform (PIP).
3.1.2 Definition of Childcare Provider for the Purposes of this Assignment
Childcare services are provided in a number of ways. The main types of childcare (other than
care provided by parents and other relatives) are divided into three categories:
Centre-based services, where children are cared for in a group setting in a space for
this purpose;
Childminders, who provide childcare for children in the childminder’s home on a self-
employed basis;
Nannies and au pairs, who care for children in the children’s home.
Preschool sessional services (almost all now funded entirely through the Early Childhood
Care and Education (ECCE) Scheme, but in some cases with additional private fee income
for children not qualifying for ECCE or for additional hours or services offered) are sometimes
delivered in the home of the provider, albeit in a space set aside for this purpose. In some
such cases, a childminder may also be classified as a centre-based provider if, for example,
they are providing an ECCE service in the mornings and a childminding service in the
afternoons.
It has been estimated in the Draft Childminding Action Plan published by the Department of
Children and Youth Affairs that there may be up to 19,000 childminders nationally (DCYA,
2019). As there is no regulatory requirement to register as a childminder (unless one is caring
for seven or more children, or four or more pre-school children) there is extremely sparse
reliable data in respect of this aspect of the childcare market. Similarly, there is no registration
or regulation of nannies or au pairs, and a similar lack of reliable data on childcare delivered
in this context. A requirement for school-age childcare providers to register with Tusla only
came into force in 2019, and so there is also little data available on school-age childcare.
Given this absence of data and the exclusion of home-based childcare and non-Tusla-
registered childminders from the scope of this review, the analysis presented here relates to
centre-based childcare provision in Ireland only.

Final Report to Department of Children & Youth Affairs: Cost of Providing Quality Childcare 29
3.2 Features of the Irish Childcare Market
3.2.1 Public versus Private Provision
Countries vary substantially in their mix of public and private provision: Sweden, for example,
has a predominantly public provision model, with over 80% of formal ECEC places provided
by municipalities, with low parental fee contributions (7% of preschool fees and 17% of after-
school fees are provided by parents). Norway, by contrast, has roughly half of its childcare
provision from private providers, although state subsidies to private and public providers are
the same8. The capacity of policymakers and funders to establish the costs of childcare may
be dependent on the visibility of costs, which may be higher for State-delivered service
provision rather than independent provision.
Ireland’s childcare market is almost entirely independently operated (with a mix of for-profit
provision and not-for-profit provision), with the State subsidising at varying levels but not
directly delivering the majority of childcare services.
The State subsidies are an important part of providing childcare across Ireland, especially in
disadvantaged areas. There are a number of childcare providers that rely heavily on State
funding in order to provide childcare in their areas, especially to disadvantaged families that
would not otherwise be able to avail of childcare.
3.2.2 Government Funding
Public funding of childcare is linked to incentivising achievement of national policy objectives.
Typically, these relate to the improvement of educational and social objectives for children
and employment activation and economic objectives for families – particularly mothers9.
Many mothers’ choice on whether or not to return to work following maternity leave is based
on the cost of childcare and if the income from returning to work would be higher than the cost
of childcare minus any forgone welfare10.
A public policy intention to encourage economic agency among mothers and to increase
participation and resulting benefits for children in childcare settings must be supported by
funding which is linked to either the opportunity cost of not returning to work (sufficient
demand-side funding), or the real cost of providing the service (sufficient supply-side funding).
The scope and nature of government funding plays an important role in the marketplace –
specifically in determining the structure and costs of childcare. The level of government
funding can also influence the number of childcare places available. Funding models
internationally are complex and can be “fully publicly funded, fully privately funded, or receive
a mixture of public and private funding”11. Funding models and approaches vary
internationally, and indeed within countries by region and/or by the age and socio-economic
status of the child.
8 Dr Ingela Naumann and others, ‘Early Childhood Education And Care Provision: International Review Of Policy,
Delivery And Funding Final Report’, 2013. 9 Pascal and Bertram; Evers, Lewis, and Riedel. 10 Devon Gorry and Diana W. Thomas, ‘Regulation and the Cost of Childcare’, Applied Economics, (2017). 11 Chris Pascal and Tony Bertram, Early Childhood Policies and Systems in Eight Countries: Findings from IEA’s Early
Childhood Education Study. (New York: Springer, 2016), p. 56.

Final Report to Department of Children & Youth Affairs: Cost of Providing Quality Childcare 30
Funding can be provided on the demand side or the supply side, or, as in many countries, a
combination of both. Supply-side funding, i.e. funding paid to the providers of childcare
services, is designed to defray the various costs of providing childcare (facilities, resources,
salaries, etc.) or to increase the quality of provision through, for example, staff training.
Cost-based supply-side funding often takes the form of subsidisation of funded places for
children in regulated providers. Some countries provide funding against costs on a per capita
basis, as with ECCE funding in Ireland. Typically, this funding is linked to regulatory
requirements, quality assurance indicators and public policy objectives12.
Demand-side funding is designed to defray the cost of procuring care for families. It is often
means-tested and may take the form of tax relief, vouchers, reduced fees, and allowances.
Demand-side funding is described by some as ‘pump-priming’ funding to stimulate the
childcare market by allowing families a choice13, and is traditionally seen as a way to reduce
costs to families whilst maintaining parental choice14.
Demand-side funding usually takes place in the context of at least some supply-side funding,
such as capital grants and/or subsidisation.
The current structure of funding in Ireland is a mix of demand-side and supply-side: there are
a range of funding schemes paid directly to childcare providers, along with capital grants and
other supports for providers. Furthermore, child benefit payments are a universal statutory
payment to parents; in addition, parents have flexibility in relation to their choice of care
provider, the extent to which they opt for childcare, and the type of service of which they wish
to avail.
3.2.3 Education or Care?
Early years services are often considered from two perspectives: childcare and early
education. Countries differ in their approach to responsibility for policy in relation to early
years services, whereby it may be split across different government departments or ministries,
with some providing support or policy measures from the perspective solely of childcare,
usually for infants and younger children, and others responsible for the preschool education
elements of policy, which may be linked in to school-age education services.
Others have an integrated approach with policy responsibility within a single department or
ministry. This can extend to structure and delivery of services, with a clear ‘break’ in some
countries between the services provided to children in the earlier years (typically 0-35 months)
and the later ones (3 years to school starting age, usually around 5 or 6). In other jurisdictions
all services provided to children before entering formal schooling are provided within one
structure15.
12 Helen Penn, ‘The Business of Childcare in Europe’, European Early Childhood Education Research Journal, 22.4
(2014); Linda A. White and Martha Friendly, ‘Public Funding, Private Delivery: States, Markets, and Early Childhood
Education and Care in Liberal Welfare States – A Comparison of Australia, the UK, Quebec, and New Zealand’,
Journal of Comparative Policy Analysis: Research and Practice, (2012). 13 Helen Penn, ‘Childcare Market Management: How the United Kingdom Government Has Reshaped Its Role in
Developing Early Childhood Education and Care’, Contemporary Issues in Early Childhood, (2007); Adalbert Evers,
Jane Lewis, and Birgit Riedel, ‘Developing Child-Care Provision in England and Germany: Problems of Governance’,
Journal of European Social Policy, (2005). 14 Gordon Cleveland and Michael Krashinsky, The Benefits and Costs of Good Child Care: The Economic Rationale for
Public Investment in Young Children. A Policy Study. 1998. 15 Naumann and others.

Final Report to Department of Children & Youth Affairs: Cost of Providing Quality Childcare 31
In Ireland, a more integrated approach is taken. Key policy responsibility and oversight in
relation to childcare lies with the Department of Children & Youth Affairs, with support from
the Department of Education & Skills. This integrates policy approaches to care at the earliest
age with pre-school and school-age education and childcare.
3.3 Market Factors
3.3.1 Female Participation in Workforce
Mothers’ participation in the workforce is a key driver for market demand for childcare and
vice-versa, i.e. the availability of childcare increases maternal participation in the workforce16.
The availability of childcare places on the market simultaneously influences the participation
of mothers in employment and is influenced by it in terms of driving demand. Early
developments in respect of statutory support for childcare services in Ireland were driven
principally by objectives relating to labour force participation by – and equality of opportunity
for – women and were led by the then-Department of Equality and Law Reform.
The maternal labour force participation rates in Ireland increased from 37% in 1992 to 60% in
2008, supported by substantial investment in the childcare sector by a series of programmes
funded by that Department, including:
the Pilot Childcare Initiative 1994-1996 for the purpose of facilitating participation by
socially excluded mothers in employment, development, training, or education;
the Equal Opportunities Childcare Programme (2000–2006) and its successor, the
National Childcare Investment Programme (2006–2010), which resulted in the creation
and retention of more than 40,000 childcare places through capital funding and
subvention of the cost of delivery of services17.
Following a dip in female participation in the workforce over the course of the economic
downturn (along with an overall rise in unemployment and a reduction in workforce
participation for all), the current rates are similar to those pre-recession, and will need to be
supported by an expanding childcare market.
The National Childcare Scheme (originally called the Affordable Childcare Scheme), has
replaced a multiplicity of existing targeted schemes and will continue to provide some
universal benefits.
3.3.2 Staff Resources in the Sector
There were 22,132 staff working directly with children in childcare services in 2017/18
(according to the Pobal Early Years Sector Profile 2017/2018 report), excluding ancillary and
relief staff. Almost half of the staff reported working in the sector worked on a part-time basis.
In addition, around a quarter (26%) of services in Pobal’s survey stated that they had at least
one staff vacancy, indicating a level of unmet demand for staff resources in the market.
16 Lefebvre Pierre and Philip Merrigan, ‘Child‐Care Policy and the Labor Supply of Mothers with Young Children: A
Natural Experiment from Canada’, Journal of Labour Economics, 26.3 (2008). 17 Frances McGinnity and others, Mothers’ Return to Work and Childcare Choices for Infants in Ireland, 2013.

Final Report to Department of Children & Youth Affairs: Cost of Providing Quality Childcare 32
3.3.3 Qualifications
Qualifications levels of staff working directly with children have increased over time. 94%
(20,698) of staff working directly with children are qualified to NFQ level 5 or above. This is an
increase on previous years: 92% in 2016/17 and 88% in 2015/16. 65% of staff have NFQ
Level 6 (or above) qualifications, which again, represents an increase on previous years.
Numbers of staff with no formal childcare qualifications have been decreasing in the sector,
with only 6% of staff holding no formal childcare qualification in 2017/18. This is a decrease
from previous years: 7% in 2016/17 and 11% in 2015/16.
This increase in staff qualifications (in total numbers and level) can be directly tied to a 2016
amendment to the Child Care Act 199118 which required all staff working directly with children
to hold a minimum of a NFQ Level 5 qualification or to sign a ‘Grandfather Declaration’, which
stated the staff member’s intention to retire or resign before 1 September 2021 if they do not
hold such a qualification. This requirement did not extend to staff working in school-age
childcare.
3.4 Profile of the Irish Childcare Market
3.4.1 Market Description
The childcare sector consists of a variety of centre-based providers: these range from small
sole-trader operations to large group providers. There is a range of provision types, with some
providers only offering ECCE, while others offer a full suite of services including full and part-
time care. There is also a mix of for-profit and not-for-profit operators.
There are minimal constraints to entering the sector: besides the requisite capital costs, there
are some regulatory requirements. The cost of compliance with these requirements is an
additional expense for providers; however, they are recognised as important in driving service
quality within the sector.
3.4.2 Geographic Distribution
According to Pobal data at the time of this research there were 4,523 registered childcare
providers across Ireland19. The breakdown of these providers across the State is set out in the
table below:
18 Child Care Act 1991 (Early Years Services) (Amendment) Regulations, 2016. 19 This is the figure as per the Pobal PIP database as at February 2019. It is marginally different from the figure of 4,504
in the database as at March 2018, used as the basis for the survey target population. As services enter and leave the
childcare market, the live PIP database reflects a snapshot of Pobal-registered services at a point in time, hence the
slight variation in figures in this report.

Final Report to Department of Children & Youth Affairs: Cost of Providing Quality Childcare 33
Childcare providers
Region Number Percentage
Dublin 1,194 26.4%
Rest of Leinster 1,260 27.9%
Munster 1,218 26.9%
Connacht 571 12.6%
Ulster 280 6.2%
Total 4,523 100.0%
Source: Pobal PIP database, September 2018
3.4.3 Urban/Rural Profile
Pobal categorises providers at a more granular level than simply ‘urban or rural’. The more
nuanced categories comprise the following:
Cities (Urban) Small Towns
Large Towns Mixed
Medium Towns Rural
The blend of these categories are illustrated below:
Approximately 30% of providers fall into each of the traditional urban and rural categories with
the remaining 40% being distributed across the more nuanced categories.
3.4.4 Provider Type
The childcare provider market consists of a combination of private, for-profit enterprises and
community/voluntary not –for profit enterprises.
Private enterprises are (generally) for-profit providers offering childcare services as a
commercial operation. Private operators have been eligible for ECCE payments since the
inception of the scheme, and have recently also become eligible to access other childcare
funding schemes.
Community/voluntary enterprises were established to address the need for low-cost
subsidised childcare in areas with lower incomes or higher deprivation and were established
30% 18% 8% 11% 4% 30%
0% 10% 20% 30% 40% 50% 60% 70% 80% 90% 100%
Urban/Rural Profile Mix
Cities Large Towns Medium Towns Small Towns Mixed Rural
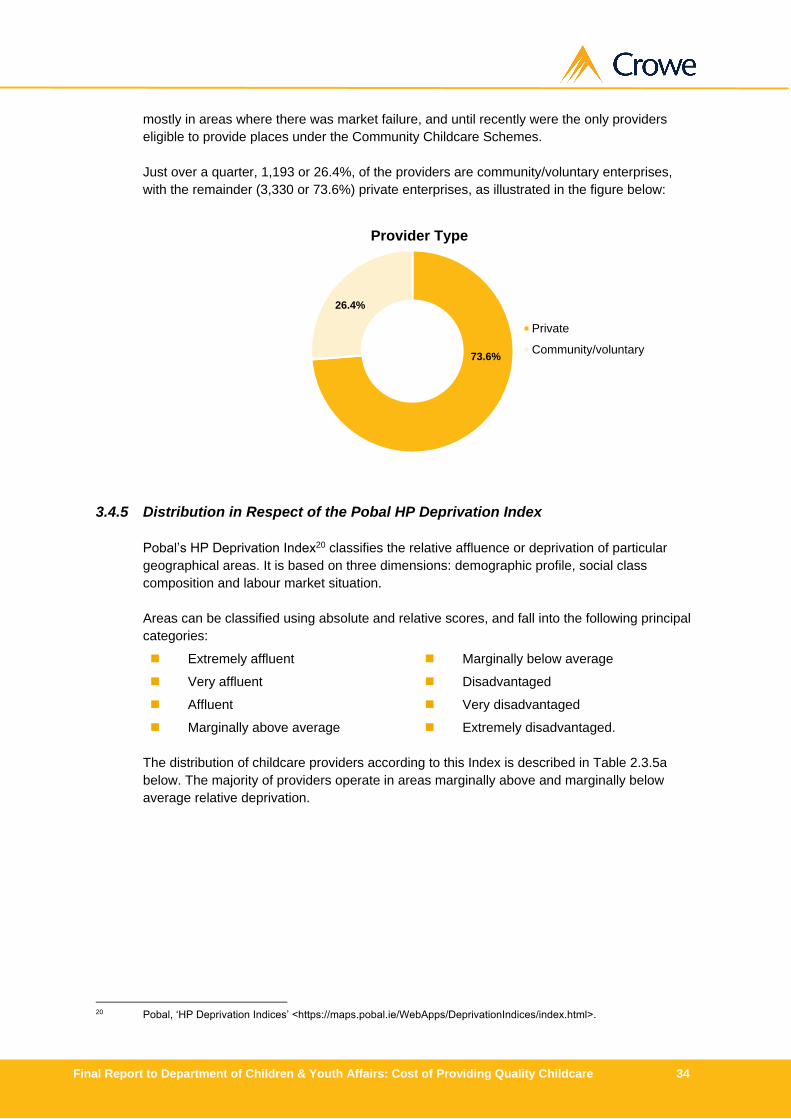
Final Report to Department of Children & Youth Affairs: Cost of Providing Quality Childcare 34
mostly in areas where there was market failure, and until recently were the only providers
eligible to provide places under the Community Childcare Schemes.
Just over a quarter, 1,193 or 26.4%, of the providers are community/voluntary enterprises,
with the remainder (3,330 or 73.6%) private enterprises, as illustrated in the figure below:
3.4.5 Distribution in Respect of the Pobal HP Deprivation Index
Pobal’s HP Deprivation Index20 classifies the relative affluence or deprivation of particular
geographical areas. It is based on three dimensions: demographic profile, social class
composition and labour market situation.
Areas can be classified using absolute and relative scores, and fall into the following principal
categories:
Extremely affluent Marginally below average
Very affluent Disadvantaged
Affluent Very disadvantaged
Marginally above average Extremely disadvantaged.
The distribution of childcare providers according to this Index is described in Table 2.3.5a
below. The majority of providers operate in areas marginally above and marginally below
average relative deprivation.
20 Pobal, ‘HP Deprivation Indices’ <https://maps.pobal.ie/WebApps/DeprivationIndices/index.html>.
73.6%
26.4%
Provider Type
Private
Community/voluntary

Final Report to Department of Children & Youth Affairs: Cost of Providing Quality Childcare 35
Deprivation Score Percentage
Advantaged 8.4%
Marginally above average 43.0%
Marginally below average 40.6%
Disadvantaged 6.0%
Very disadvantaged 0.4%
Information not available 1.6%
Total 100.0%
As expected and given the rationale for community/voluntary enterprises providing childcare,
the distribution of community and private providers differs in respect of the deprivation of the
areas in which they operate. As illustrated in the figure below, many community providers are
located in areas with disadvantage or below average.
3.4.6 Trends
The market is characterised by relatively small but consistent changes in scale over time.
Between 2016/17 and 2017/18, there was an increase of 95 providers – a 2% increase, the
same increase as in the previous year (2015/16 to 2016/17). There was a 1% increase
between 2014/15 and 2015/16; a 3% increase between 2013/14 and 2014/15; and a 3%
decrease between 2012/13 and 2013/14.
The number of community service providers has remained somewhat constant, while private
service providers are slightly increasing. There has also been a decline in the proportion of
services that are rural (40% rural in 2016/17 to 30% rural in 2017/18).
3%
10%
29%
48%
52%
37%
14%
3%
1% 2%
2%
0% 10% 20% 30% 40% 50% 60% 70% 80% 90% 100%
Community/Voluntary Organisation
Private Enterprise
Distribution of Childcare Provider Type / Pobal HP Deprivation Index
Advantaged Marginally above average Marginally below average
Disadvantaged Very disadvantaged No information available

Final Report to Department of Children & Youth Affairs: Cost of Providing Quality Childcare 36
3.5 Fees
3.5.1 Overview
This section sets out the landscape of fees charged in the childcare market in Ireland
alongside some of the factors influencing these. The fee information set out here is drawn
from data and information published by Pobal21.
3.5.2 Average Fees
The average weekly fees by session and provider type are set out in Table 3.2a below:
Average Weekly Fee
Session Type All providers Community Private
Full Day Care €177.92 €161.24 €184.08
Part-Time Day Care €101.82 €84.14 €110.52
Sessional €68.95 €61.05 €71.89
Table 3.2a: Average weekly fees by session and provider type
There is significant variability in fee rates when examined with regard to geographic location,
as illustrated in the figure below. Fees tend to be higher in Dublin and the surrounding
counties; and in Cork city and county, with the lowest fee rates seen in Carlow, Monaghan,
and Longford. These fee rates correlate with the Deprivation Index scores for the relevant
counties: the counties with the highest scores for affluence have the highest fees; likewise,
the counties with the lowest fees score low on the Deprivation Index.
21 Pobal, Early Years Sector Profile Report, 2018 2017.

Final Report to Department of Children & Youth Affairs: Cost of Providing Quality Childcare 37
€0.00 €50.00 €100.00 €150.00 €200.00 €250.00
Longford
Monaghan
Carlow
Roscommon
Sligo
Tipperary
Mayo
Leitrim
Cavan
Waterford
Clare
Limerick
Galway
Kilkenny
Offaly
Laois
Wexford
Donegal
Westmeath
Louth
Kerry
Kildare
Meath
Cork County
Dublin - Dublin City
Wicklow
Dublin - South Dublin
Dublin - Fingal
Cork City
Dublin - Dún Laoghaire-Rathdown
Fee Distribution - by County
Full day care Part-time care Sessional

Final Report to Department of Children & Youth Affairs: Cost of Providing Quality Childcare 38
3.6 Economic Analysis of Reasonable Profit
3.6.1 Background and Purpose
This section sets out a brief analysis of the “reasonable profit” for State aid in respect of
childcare services, to inform future policy decisions in terms of setting the levels of subvention
for these services in Ireland. It is important to note that this is a discussion of reasonable profit
and does not seek to propose or set a reasonable profit rate. The points made are illustrative
only and not intended to be definitive, recommended, or proposed.
For context: the Treaty of the Functioning of the European Union (TFEU)22 provides for EU
Member States granting special or exclusive rights to public or private sector organisations to
perform “services of general economic interest” (SGEI). These special or exclusive rights are
generally related to the performance of a public service obligation (PSO).
When granting these rights, Member States must comply with EU competition rules, including
State aid rules (set out in Article 106(1) of the TEFU). Member States have some flexibility in
defining what constitutes a SGEI.
3.6.2 Key Principles
As outlined in Competition Law – A Practitioner’s Guide:
“Payments by the State to an undertaking for performing public service obligations could
give rise to State aid if the amount paid is too high and gives the undertaking more than
a reasonable profit. However, if there is a sufficient degree of equivalence between the
compensation paid and the additional costs incurred in performing the public service
obligation, the undertaking ‘will not be enjoying any real advantage’ for the purposes of
Article 107(1) and therefore the payment will not give rise to State aid.”23
This raises the question: where is the borderline between acceptable compensation and an
overpayment that confers an economic advantage?
In the Altmark case (2003), the Court of Justice laid down four conditions, which, if satisfied,
would show that the compensation paid for public service obligations (PSOs) is not State aid,
namely:
The recipient undertaking must actually have PSOs to discharge, and the obligations
must be clearly defined.
The parameters on the basis of which the compensation is calculated must be
established in advance in an objective and transparent manner.
The compensation cannot exceed what is necessary to cover all or part of the costs
incurred in the discharge of PSOs, taking into account the relevant receipts and a
reasonable profit for discharging those obligations.
Where the undertaking is not chosen pursuant to a public procurement procedure
which allows for the selection of the tenderer capable of providing the services at the
least cost, the level of compensation must be determined on the basis of an analysis of
the costs that a typical efficient undertaking with the means to meet the PSOs would
22 The Treaty on the Functioning of the European Union. 23 Nathan Dunleavy, Competition Law: A Practitioner’s Guide, 2010, p. 754.

Final Report to Department of Children & Youth Affairs: Cost of Providing Quality Childcare 39
have incurred in discharging those obligations, taking into account relevant receipts and
a reasonable profit.
Following the landmark Altmark case, the European Commission adopted a Decision (2005)
and Framework (2005, which applied until November 2011), which set out the conditions
under which State aid in the form of public service compensation can be considered
compatible with the common market. The Decision was effectively a block exemption,
designed to facilitate competition within organisations performing PSOs.
After November 2011, the Commission adopted a new package of State aid rules for SGEI.
They also include a Decision and a Framework (December 2011). These allow compensation
for SGEIs subject to certain conditions, including the amount of compensation and reasonable
profit. Specifically, the amount of compensation may not exceed the net costs to the
organisation, plus a reasonable profit.
3.6.3 Assessment
Reasonable profit is to be determined as the rate of return on capital that would be required
by an organisation considering whether or not to provide the PSO, taking into account the
degree of risk. In simple terms, the rate should be the point at which a childcare provider
considers it worth investing and taking on the risk.
Self-employed childcare providers and registered businesses have an obligation to ensure
proper financial reporting and tax compliance. Therefore, specification of a reasonable profit
should not present a major difficulty in terms of the treatment of costs or the measurement of
profit for these businesses, or create a difference between sole traders and companies.
A profit below the relevant swap rate (which is assumed to be equal to risk-free investment)
plus a liquidity premium of 100 basis points is considered to be reasonable. This approach
under the EU Framework reflects the evolution from an accounting approach to an economic
approach for SGEI, in regulated PSOs, such as childcare.
The relatively low swap rate of the Eurozone members currently reflects the very (historically)
low interest rate environment in the Eurozone that has persisted since the 2008 economic
crisis. The quantitative easing (QE) employed since the onset of the crisis was reversed in the
US to a small extent and there was an expectation that interest rates would increase in other
advanced economies (such as the UK and the EU) over the past year. However, international
economic uncertainty (arising from Brexit, international trade conflicts) have meant that the
‘quantitative tightening’ in the US has been paused. Accordingly, the anticipated upward
movement in interest rates in the EU, including in Ireland, has also paused. Due to the various
uncertainties in the global economy (particularly Brexit), it is unlikely that interest rates will rise
in Ireland in the near future either (as at the end of 2019).
3.6.4 Risks to Market Provision
The EU framework and decision regarding SGEI is designed to support the effective
functioning of the market and not to protect any particular segment within this. This includes
the specification of a reasonable profit rate to fundamentally ensure that supply is aligned with
demand and that quality is assured.

Final Report to Department of Children & Youth Affairs: Cost of Providing Quality Childcare 40
In considering the influence of risk, there is a fine balance to be struck in setting or suggesting
a reasonable profit that incentivises supply (including new entrants) to respond to the strong
demand in the market. The strong demand should in principle obviate the need to set a higher
reasonable profit rate.
According to the aforementioned Commission Decision of December 2011 (Article 5,
Compensation, paragraph 5, p. 9):
“The level of risk depends on the sector concerned, the type of service and the
characteristics of the compensation.”
A key source of risk is the structure of the market and in particular the number and relative
sizes of the providers of childcare services, where reasonable profit may serve to confer an
economic advantage to some providers over others, and distort or threaten to distort
competition in the market.
The question may then be posed: what are the risks of a low reasonable profit rate calculated
based on the currently low interest rate environment outlined above? The possible risks
include:
It will confer an advantage on larger providers over smaller providers;
It will make entry to the childcare market in Ireland less attractive;
There will be lower or less developed childcare services in certain parts of the country,
where population density is lower and/or where transport networks are less developed,
and;
It will or may lead to excess demand.
It is, however, worth bearing in mind that Ireland is approaching full employment and the
strong demand for childcare services will likely act as an incentive for existing providers as
well as for new entrants to the market.
3.6.5 Concluding Remarks on Reasonable Profit
The assessment above provides the principles by which reasonable profit can be
calculated. In order to identify the reasonable profit a further study would be
required to calculate an appropriate range.

Final Report to Department of Children & Youth Affairs: Cost of Providing Quality Childcare 41
Methodologies

Final Report to Department of Children & Youth Affairs: Cost of Providing Quality Childcare 42
4 Development of the Survey Tool
4.1 Methodological Approach to the Survey
As outlined in Section 2, a range of survey approaches have been used in Ireland and in other
jurisdictions to gather data on the cost of providing childcare services. Many surveys of this
nature have identified a sample of the overall provider numbers to use as the target
population for the survey tool. In considering a sample-based approach, some concerns were
raised in relation to how a sample might be selected in a manner that would not be perceived
to be biased or (intentionally or otherwise) to reflect an inaccurate picture of costs of providing
childcare.
It was decided to conduct this survey for the DCYA using a census approach, i.e. to send an
invitation to the questionnaire to all those in the target population, and to track the responses
to try to ensure a response profile that was closely aligned to the overall sector profile (using
data such as that collected by Pobal in both the PIP reporting system and the annual Early
Years Sector Profile survey).
Variables considered for comparative purposes included:
Geographic distribution;
Urban / rural profile;
Provider type (i.e. community and private);
Size in terms of staff and number of places;
Type of service provision (age range and number of hours offered);
Proportion of ECCE-only services.
4.2 Key Areas Addressed in Survey Tool
The survey tool was developed with a structure grouping together related questions under the
following headings:
Profile: key profiling information about each provider, including legal structure and
questions in relation to the premises in which the service operates;
Services: types of service provided, capacity, and waiting lists for services;
Rooms: detailed description of each room used for childcare, with numbers of staff and
children in each room, area of room, and access to sanitary facilities;
Management: questions in relation to each manager working at the relevant location,
including hours, qualifications, experience, and remuneration;
Childcare staff: questions in relation to each staff member working with children at the
relevant location, including hours, qualifications, experience, and remuneration;
Ancillary staff: questions in relation to each ancillary staff member working at the
relevant location, including role, hours, and remuneration;
Staff development: questions in relation to continuous professional development of
childcare staff in each provider;
Fees: information in respect of fees charged for services provided at the relevant site;

Final Report to Department of Children & Youth Affairs: Cost of Providing Quality Childcare 43
Financial data: summary financial statements, including income and expenditure
details;
Opinion: opportunity for participants to provide opinion in respect of the issues
explored in the survey and any other comment they wished to provide.
4.3 Drafting and Refining
The survey tool was detailed and was developed in collaboration with the Department and the
Oversight Group, with several drafts and refinements undertaken to reach a draft ready for
piloting.
Key areas discussed during the development of the survey tool included aligning terminology
and questions with those used by Pobal, both in PIP reporting and in its Early Years Sector
Profile survey. The Oversight Group also considered the level of detail required in respect of
individual staff members (as opposed to, for example, asking for collective or average details
on rates of pay, qualifications, or hours for different roles). Whilst it was recognised that filling
in details for each individual staff member was more onerous, the capacity required for
modelling scenarios with the data collected meant it was important to be able to clearly link
qualifications, experience, hours, and remuneration in a way that would not be feasible with
less detailed breakdowns of the data from providers.
4.4 Challenges in Developing the Survey
A key area of concern in seeking to develop the survey tool was how to strike the balance
between the amount of information desired in order to have the most flexible and robust
modelling capacity and the practicalities for providers in completing a long and detailed
survey. The more information sought, the more questions in the survey and the greater the
level of detail requested, resulting in a more burdensome and time-consuming process for
participants.
The survey tool was helpful in this regard because it only presented questions to participants
as relevant, i.e. each respondent had the shortest possible route through the survey because
any “dependent” or “conditional” questions, i.e. questions arising from the responses to earlier
ones in the survey, appeared on-screen only when an earlier response triggered this. Survey
respondents did not have to skip irrelevant questions or assess for themselves if they had to
answer any particular question. For example, participants were asked how many staff
members they had in each category (management, childcare staff, and ancillary staff),
following which only the questions for that number of staff appeared on-screen to each
respondent.
However, the requirements of the review and the needs of the DCYA in relation to modelling
for variables such as qualifications and remuneration, as discussed above, meant that the
survey was detailed and for larger services in particular, time-consuming to complete.
Another challenge was the capacity to facilitate those services who operate through the Irish
language, including both Gaeltacht-region services and non-Gaeltacht Irish-language
providers such as naíonraí. This was addressed by having the survey tool translated into Irish
through the translation service used by the Department. Providers were then given the option
to complete an Irish-language or English-language version of the survey. Of those who opted
to complete the survey in Irish, 20 full responses were received. Quantitative responses were
able to be combined with the main survey as the coding was kept identical. Qualitative

Final Report to Department of Children & Youth Affairs: Cost of Providing Quality Childcare 44
responses were collated and translated using the same translators, but this was kept entirely
separate from the Department, i.e. the material went to the translation firm and was returned
with the translated output without having been routed through DCYA.
4.5 Piloting
A small number (10) of the providers who had participated in the direct provider engagement
described in earlier sections of the report also agreed to take the time to pilot the survey. A
variety of service types, sizes, and locations were represented in the pilot providers.
The results of the piloting exercise included useful feedback: the survey was considered clear
and easy to use, albeit with a recognition that it would be time-consuming for larger services
to complete. Pilot participants suggested that it needed to be more explicit about the “why”:
why services should give up time to complete the survey, and why we were asking particular
questions. The pilot process also suggested a small number of additional questions and some
minor refinements to those in the pilot survey, including the addition of more explanatory and
help text to clarify the purpose and value of the questions being asked, which were
implemented in the final version of the survey tool rolled out subsequently.
4.6 Childminder Survey
As part of the review of the cost of delivering childcare, the DCYA wished to include those
childminders (i.e. self-employed individuals operating single-handedly in providing childcare in
their own homes) registered with Tusla, the Child and Family Agency.
The vast majority of the estimated 19,000 childminders in Ireland are not registered with any
statutory body. A number are voluntarily notified to their local City or County Childcare
Committee. However, any childminder who provides childcare for four or more pre-school
children must register with Tusla, Tusla-registered childminders are subject to inspection by
Tusla’s Early Years’ Inspectorate. Only approximately 120 childminders were registered with
Tusla at the time of the research.
A survey similar to that for centre-based childcare providers was developed for childminders
registered with Tusla. This survey was considerably shorter and simpler, given that it did not
require details of staff members or premises, for example.
However, only ten responded to the survey. The cohort of Tusla-registered childminders
was already very small in relation to the overall dataset of childcare providers, and the tiny
number of responses to the survey makes any meaningful analysis of this data impossible.
4.7 Survey Target Population
As outlined above, it was decided to conduct a census survey, that is, to invite all those
included to participate, rather than a selected sample thereof. The target population for the
main survey was all centre-based childcare services. The list of relevant services and contact
details was provided by Pobal. This list totalled 4,504 services at the time the survey was
launched.

Final Report to Department of Children & Youth Affairs: Cost of Providing Quality Childcare 45
4.8 Issues Relating to the Operation of the Survey
A challenge with the survey, once launched, was its timing. There were two dimensions to
this: the first was that the survey launched just before the Easter break for many services.
This meant that some services were closed entirely and others had a much-reduced service
with fewer staff and children at this time. However, some providers welcomed the opportunity
to complete the survey at a quieter time when there was less demand on their time in relation
to the day-to-day operation of their services.
The second issue was the fact that the annual Pobal Early Years Sector Profile survey was
rolled out just as this survey was closing to respondents. Whilst it would have been preferable
in some ways to separate the two exercises more fully, it had been discussed and agreed with
the Oversight Group that it was also a potential benefit to providers, as it would be easier to
complete the Pobal survey having already brought together the data required to complete the
cost survey. However, there was some confusion among providers as to which survey was
which; this was explained and clarified to providers who contacted Crowe by email or phone.
In order to encourage a higher participation rate, the deadline to return completed surveys
was extended; the Minister for Children and Youth Affairs and the DCYA issued several press
releases to encourage participation and called upon members of the EY Forum to encourage
participation among their membership bases; and Crowe engaged with stakeholder
organisations to promote the survey among their membership.
The eventual response rate of 19% was considerably below the response rate to the Pobal
Early Years Sector Profile survey, which had a response rate of 85%.

Final Report to Department of Children & Youth Affairs: Cost of Providing Quality Childcare 46
5 Data Cleaning and Robustness
5.1 Survey Responses and Cleaned Dataset Overview
The target population for the childcare provider survey was the total number of centre-based
providers (including childminders who provided ECCE services) on Pobal’s PIP database at
the time of distribution, i.e. 4,50424.
An initial total of 835 completed surveys were submitted using the main survey tool. A number
of these had to be discarded as they did not have a valid DCYA reference or had submitted a
survey that had little or no actual response content. We added further survey responses from
the Irish-language survey, and a small number of incomplete responses from the main survey
where the providers had answered all or nearly all of the survey but had failed to formally
submit the response online. Crowe contacted these providers to ask permission to include
their responses in the dataset. Inclusive of these responses, the initial dataset for the
survey totalled 859 responses, or 19% of the target population.
5.2 Need for Data Cleaning
As is typical with any self-reporting data collection exercise, it was necessary to check the
data provided by respondents for errors or omissions. In some cases, errors were obvious
and easily corrected, in others they were less clear despite being suspected. To ensure the
data used in the cost modelling tool and regression analysis was as accurate and reliable as
possible, a range of checks were undertaken to validate the data and attempt to correct any
suspected errors. The data were checked for completion, the presence of extreme outliers,
and misinterpretation of the questions. Answers on a theme were cross-referenced where
they should logically relate to one another, and variables derived from the data were also
checked.
During the cleaning, a variety of common inaccuracies were discovered and rectified:
Occasional missing values, particularly where the same data had to be repeatedly
entered;
Mistyping, e.g. where an additional zero has been added to a salary, etc.;
Misinterpretation of questions, e.g. where hours/day had been entered instead of
hours/week;
Duplication of data, e.g. where a respondent could not decide how to enter salary data
and did so in both hourly and monthly amounts.
As with any data cleaning of this nature, there is some degree of subjectivity around how data
cleaning rules are determined and applied. Decisions were made based on our own
experience and professional judgement where appropriate, but also through discussions with
the Oversight Group to confirm where it appeared to be necessary to make adjustments to
apparent outlying values. Whilst in an ideal world we would have sought to go back to all the
24 This is the figure as per the Pobal PIP database as at March 2018. As noted in Section 3, it is marginally different
from the figure of 4,523 in the database as at February 2019, used as the basis for the market analysis. As services
enter and leave the childcare market, the live PIP database reflects a snapshot of Pobal-registered services at a point
in time, hence the slight variation in figures in this report.

Final Report to Department of Children & Youth Affairs: Cost of Providing Quality Childcare 47
services and ask for their support in addressing the queries, the scale of this task was not
possible within the timeframe and budget available.
5.3 Data Cleaning Approach
Of the 859 services who provided a response, all services had at least one variable cleaned.
However, for 217 services (25%) only one field was corrected. 164 had three or more
changes, of which 90 were subsequently included in the dataset for the cost modelling tool
and regression analysis.
The overall profile of the of responses cleaned and what was included in the analysis is
represented in the diagram below. In total, 573 services were considered to have data usable
for the unit cost calculations, with a further 118 excluded from the cost calculations and core
cost modelling tool, but usable when an uplift was applied to complete near-complete staff
data. This is implemented by weighting up the hours worked by staff with complete data to
compensate for the number of staff with incomplete data. The maximum possible weighting
was a 50% increase (i.e. two employees could be weighted up to three, for example) and the
calculations were made separately for managers and employees.
Overview of number of services cleaned and their use in the cost modelling tool

Final Report to Department of Children & Youth Affairs: Cost of Providing Quality Childcare 48
5.4 Types of Correction
The following chart shows the types of corrections that were made, and the number of data
points corrected. The chart shows only the data for the 573 services where the data was
cleaned and subsequently used within the analysis.
Number of services where the type of correction was applied for the included services

Final Report to Department of Children & Youth Affairs: Cost of Providing Quality Childcare 49
A list of all the corrections and brief description of the context for each of these can be found
in Appendix 3.
The edit which impacted on the largest number of services was in relation to room data.
Whilst a sizeable change, it should be noted that this does not impact on the unit cost
calculations, and was required for the cost modelling tool to undertake scenario changes.
The next two listed, which account for 30% of all the remaining edits, relate to changes
because of the incorrect entry of available places. This was due to an apparent
misinterpretation of what was meant by “available” places, with respondents interpreting this
as places which had not been filled, rather than the total number of available places. A further
6% were due to adding in data where the filled places had been left blank and which were
filled by the median.
The next most common error was services failing to complete the data fields in relation to the
number of employee and manager weeks. In these cases, the data was filled with the median
value. For managers this involved setting the number of weeks worked to a value of 47, and
for employees this involved setting the number of weeks to 52.
5.5 Alignment of Dataset to Existing Sector Data
5.5.1 Geographic Profile
To validate the robustness of the cleaned dataset, we compared key profiling variables to
data from the Pobal PIP database. A close match is indicative that it is reasonable to assume
the representativeness of the dataset. Further validation comparisons were used with various
survey findings as indicated in the following section.
The geographic profile of responses matched closely with existing data from Pobal (extracted
from the PIP database at the time of the survey) on the distribution of services. Similarly, the
response dataset aligned well with existing data such as the urban/rural split. The alignment
of the dataset against Pobal data geographically is illustrated in the following chart. This
shows the county-by-county distribution of providers according to Pobal PIP data compared
against the survey responses included in the final dataset.

Final Report to Department of Children & Youth Affairs: Cost of Providing Quality Childcare 50
3.8%
3.1%
1.9%
2.2%
3.8%
1.7%
1.3%
1.6%
1.3%
4.4%
2.8%
2.6%
0.7%
4.3%
0.7%
1.9%
2.2%
4.4%
3.0%
6.1%
26.4%
3.4%
10.5%
3.1%
1.4%
1.2%
4%
4%
1%
1%
5%
2%
1%
2%
1%
5%
2%
3%
1%
3%
0%
2%
3%
4%
3%
7%
25%
2%
11%
3%
2%
1%
0% 5% 10% 15% 20% 25% 30%
Wicklow
Wexford
Westmeath
Waterford
Tipperary
Sligo
Roscommon
Offaly
Monaghan
Meath
Mayo
Louth
Longford
Limerick
Leitrim
Laois
Kilkenny
Kildare
Kerry
Galway
Dublin
Donegal
Cork
Clare
Cavan
Carlow
Distribution by County
Final dataset Pobal PIP data

Final Report to Department of Children & Youth Affairs: Cost of Providing Quality Childcare 51
5.5.2 Distribution by Other Factors
When we compare other key profiling data in the responses, the following charts show the
distribution of the dataset sample against Pobal data by entity type (community and private),
urban/rural mix, and level of deprivation as indicated by the Pobal Deprivation Index. As can
be seen, the dataset is closely aligned with the overall sector profile, increasing the reliability
and robustness of the analysis using this data.
Wages
A further validator is a comparison of the average staff hourly wage between the cost
modelling tool outputs and the Pobal Early Years Sector Profile Report 2017-2018. For
example, childcare/early years assistant wages are on average (across all levels of
experience) €11.35 as calculated within the cost modelling tool, differing just over 1% from the
average hourly rate of €11.20 for early years assistants in the Pobal data. This indicates a
close match in respect of wage costs.
31.2%
26.4%
68.8%
73.6%
0% 10% 20% 30% 40% 50% 60% 70% 80% 90% 100%
Final dataset
Pobal PIP Data
Entity Type
Community/Voluntary Organisation Private Enterprise
0.3%
0.0%
7.2%
8.4%
41.7%
43.0%
43.5%
40.6%
6.8%
6.0%
0.3%
0.4%
0.2%
0.0%
0.0%
1.6%
0% 10% 20% 30% 40% 50% 60% 70% 80% 90% 100%
Final dataset
Pobal PIP data
Pobal Deprivation Index
Very Affluent Affluent Maringally above average
Marginally below average Disadvantaged Very Disadvantaged
Extremely Disadvantaged N/A

Final Report to Department of Children & Youth Affairs: Cost of Providing Quality Childcare 52
5.6 Data Issues and Limitations
There were some broader considerations relevant to the accuracy of the data, which were not
always able to be rectified by the data cleaning. In many cases, the staffing component of the
services’ accounts did not match well with the staffing costs calculated using a bottom-up
approach. In many cases, this was to be expected, as the accounts information tended to be
from previously submitted accounts (from the previous year). In some cases, however, the
difference was unexpectedly large. Due to the cost modelling tool requiring bottom-up
calculation (based on staffing data) to investigate many of the policy scenarios of interest, it
was decided to rely on this approach, and effectively replace the staffing component of the
accounts with the figures calculated from the underlying staffing data.
However, a number of services (n=118) were excluded due to missing staffing data had
missing items or staff members in their staffing data. This may have been due to this part of
the survey requiring considerable effort to complete. Because of this, the modelling was
designed to be based on the subset of services where all the required data is complete.
However, a weight has been added to services with incomplete staffing data, so that they can
be included in models if desired. This weight effectively up-weights the available staffing data
for these services. By doing so, it assumes that the missing staff are well-approximated as an
average of the complete staff in that service.
Also, in some modelled scenarios, the data did not lend itself ideally to making the necessary
calculations. For example, some scenarios involved complex data, with some characteristics
not collected at a sufficiently granular level, e.g. the number of CPD hours for those who
currently have paid leave or overtime for their CPD. There were added complications where
policy scenarios under consideration were not easy to analyse, given the way that childcare
services are structured. As an example, the modelling of adult-child ratios relates to
regulations on the number of children of specific ages a childcare professional can care for.
However, the data collected reflected the reality of provision, which is quite complex –
children of mixed ages are often cared for in various sessions by multiple adults, which is
often related to the rooms available at the service. In this case, averages across sessions
were calculated at the service level, and assumptions were made regarding which regulation
to apply for modelling. Similar issues arose with regard to CPD and benefits (see the cost
modelling tool guidance for further information).
There were a number of challenges encountered. Firstly, the sample is not statistically
random, despite the good coverage in comparison to key variables (county, service size,
deprivation, etc.) This means that the results may have some degree of bias. Secondly, there
were some issues with data reliability and validity, including responses where the providers:
failed to complete parts of the survey;
interpreted questions incorrectly;
made errors in data entry.
A significant amount of effort was expended in attempting to validate the data and correct
errors, but it is likely that not all have been captured or amended correctly. However, the use
of average costs and the complexity of the cost modelling tool are mechanisms to mitigate
this issue.
The fact that there are so many elements which make up the unit cost means that a number
of services (286) had to be excluded from the main analysis, due to overlapping errors. The

Final Report to Department of Children & Youth Affairs: Cost of Providing Quality Childcare 53
unit costs returned by the cost modelling tool are averages across services. There is a large
amount of diversity in the calculated unit costs per service. Relying on averages across
services allows us to be more confident that anomalous responses or data issues are not
unduly influencing the results.
As with all exercises of this nature, without perfect information from all service providers in the
sector, we cannot be certain that the sample is not biased in any way. However, our validation
of the profile of responses against external data in the form of the Pobal survey dataset and
the information collected during the consultation with providers promotes confidence in the
cost modelling tool’s representativeness. Likewise, when using this dataset in the cost
modelling tool, a reliance on averages across services and relative change in unit costs acts
to minimise the influence of data discrepancies on the resulting scenarios. The cost modelling
tool is designed to be used to investigate possible relative effects of policy scenarios on unit
costs.
Future research of childcare provision and costs would benefit greatly from reviewing the
challenges of data collection and modelling in this study, such as following up with non-
participating services to explore the reasons why they did not take part.

Final Report to Department of Children & Youth Affairs: Cost of Providing Quality Childcare 54
6 Regression Analysis Methodology
6.1 Preamble
The analysis has been undertaken using the services that were included within the cleaned
dataset used for the cost modelling tool and the survey findings (n=573) in order to ensure
consistency, and the use of the most robust dataset available. In addition to the survey data,
other local geographical data such as local deprivation classification was considered for
inclusion.
6.2 Method
The work began with a review of documentation to develop a set of conceptual drivers and
clarify causal pathways. We undertook a detailed review of the Frontier Economics Paull and
Xu study (Paull and Xu, 2019) and compared this to the findings of our own research. This
review process was used to identify key hypothesised drivers of unit cost. We documented
any potential complexities of the causal pathway relating drivers to unit cost such as:
Mediation: where factors can lie on a sequential causal path between an initial driver
and the outcome.
Moderation: where interactions in model terms are appropriate because one driver can
combine with another to produce a differentiated effect on unit cost.
Endogeneity: a common infringement of the distributional assumptions of regression
models (related to the error term), which occurs where a driver does not have an
independent effect on the outcome.
Each of these complexities can affect the way in which researchers specify and test their
models, and the resulting estimates produced. They also aid in the interpretation of estimates
and caveating of proposed causal explanations. Through this process we were able to identify
where particular care in model specification was required.
Following the development of this framework, we began the process of specifying the
necessary variables to draw from the raw data and identified where there were potential gaps.
Where there were gaps, we sought suitable proxies. Proxy variables were derived from those
available in the survey when the available data did not precisely match the ideal specification.
The data preparation was undertaken in Microsoft Excel (see appendix, Table A10 for more
information on the review).
Once the regression dataset had been created, we undertook a descriptive analysis of each
of the variables. This allowed us to explore the overall profile of the services and identify any
issues with the data to makes sure that the variables were suitably defined. The findings from
this work are presented in the results section of this report.
The analysis was undertaken using the services that were included within the cost modelling
tool with the exception of five outliers where the unit cost was €15 or more25. To prevent these
outliers from unduly influencing the regression, the dataset was limited to those services with
a unit cost of less than €15, leaving 568 services. In addition to the survey data, other local
geographical data such as local deprivation and a rurality indicator were included.
25 The range of the outliers’ unit cost values was €15 to €38.

Final Report to Department of Children & Youth Affairs: Cost of Providing Quality Childcare 55
We estimated pairwise correlations between the variables to identify both (a) those which are
nominally associated with unit cost, and (b) those with a risk of problematic collinearity.
Pairwise correlations can influence model specification decisions (identifying the
strongest/weakest candidates for drivers) and identify where problems might arise due to
covariates being strongly correlated with one another (this can lead to instability in the
estimation of standard errors and associated p-values). They also help to identify variables
which may mediate one another. As with the descriptive analysis, more details on the pairwise
correlations can be found in the results section of this document. We also estimated the
bivariate associations of our explanatory variables with unit cost by estimating models of unit
cost with each explanatory variable included separately. This provided an early indication of
which of our variables might have a statistically significant association with unit cost (without
statistically controlling for all other variables).
We then analysed the missing data to identify patterns of missingness and available sample
sizes based on listwise deletion (where only complete cases are used to estimate the model).
This enabled us to identify where the inclusion of certain drivers would have a notable impact
on the sample size available for analysis. This informed which variables we incorporated
when specifying the model, as missing data can lead to bias in the resulting estimates and
reduce statistical power by reducing available sample size. We did not employ any imputation
methods for filling-in missing data as there was generally very little missing data and this
would have been a considerable undertaking in and of itself.
6.3 Development of Regression Model
At this point we had developed a dataset that we understood well and were able to start
developing the regression model. Analyses were undertaken in Stata (version 13.1 SE) and
the steps involved are set out below. There are also associated plots set out in the appendix
which show outputs from the tests and checks involved.
Estimating an initial, saturated model using ordinary least squares (OLS), which
contains all the explanatory variables. This is simply the initial model from which we
used backward selection to arrive at a more parsimonious model.
Backward selection by removing non-significant terms from the model, to arrive at a
parsimonious model which contains only those drivers that are reliably associated with
unit costs. Likelihood ratio tests were used to compare nested models.
Repeating this process with fixed effects included for (1) the county in which the service
is based, and (2) the region in which the service is based, to identify whether there are
area level effects which have not been accounted for.
Running residual-based diagnostics to determine whether there is any infringement of
model assumptions. OLS models usually assume that the error term is random-normal
distributed and has constant variance and infringements can bias estimates. By
comparing the calculated unit cost with the unit cost predicted by the model, the
distribution of residuals can be examined, and any problems identified.
Running leverage-based diagnostics to determine whether there are outliers with undue
influence on the estimates. Extreme outliers (cases with unusual values on a variable)
can have a large influence on the estimation of regression coefficients, causing bias.
Leverage-based methods (such as Cook’s distance) were used to identify any services
which are having an extreme effect on estimates. It was not necessary to remove any
data prior to re-estimation.

Final Report to Department of Children & Youth Affairs: Cost of Providing Quality Childcare 56
Estimating the risk of problematic collinearity using variance inflation factors.
Collinearity amongst explanatory variables can lead to instability in the estimation of
standard errors and associated p-values, affecting model specification decisions. This
occurs when two variables are so closely correlated that they largely explain the same
variance in the outcome. When this occurs, it is usual to discard one variable in
preference of the other. In this case, the morning session variable was highly correlated
with the ECCE only variable, and so dropped (after correlation analysis). No other
variables were dropped.

Final Report to Department of Children & Youth Affairs: Cost of Providing Quality Childcare 57
Findings and Outputs

Final Report to Department of Children & Youth Affairs: Cost of Providing Quality Childcare 58
7 Childcare Provider Survey Findings
7.1 Overview
These survey findings are intended to provide context for the dataset used for the regression
analysis and the development and operation of the cost modelling tool, to enable comparison
with other sector profile data for validation, and to add to the body of knowledge in relation to
the operation of childcare services in Ireland.
7.2 Profile of Survey Responses
7.2.1 Introduction
In order to reduce the scale of the survey slightly, in recognition of the time it would take to
complete, we had not included some profiling questions in the survey, instead using the
DCYA reference to extrapolate profiling quantitative data by cross-referring to pre-existing
data in the Pobal PIP database, such as geographic location and provider type (i.e. whether
respondents were private or community providers). Data for Crowe survey respondents in
relation to these variables is illustrated below:
7.2.2 Geographic Distribution
As we have noted in the preceding section, this is closely aligned with the overall geographic
distribution of centre-based providers in the sector as indicated by Pobal PIP data.
1%2%
3%
11%
2%
25%
7%
3%4%
3%2%
0%
3%
1%
3% 2%
5%
1% 2%1%
2%
5%
1% 1%
4% 4%
0
20
40
60
80
100
120
140
160
Responses by County

Final Report to Department of Children & Youth Affairs: Cost of Providing Quality Childcare 59
We can also consider the distribution in respect of the NUTS 3 regional definitions, as set out
in the following table:
Region Name Local government areas included
Border Region Cavan, Donegal, Leitrim, Monaghan, Sligo
West Region Mayo, Roscommon, Galway and Galway City
Mid-West Region Clare, Tipperary, Limerick City and County
South-East Region Carlow, Kilkenny, Wexford, Waterford City and County
South-West Region Kerry, Cork City and County
Dublin Region Dun Laoghaire-Rathdown, Fingal, South Dublin and Dublin City
Mid-East Region Kildare, Meath, Wicklow, Louth
Midlands Region Laois, Longford, Offaly, Westmeath
Following this classification, the survey response profile across the NUTS 3 regions is
illustrated below:
25%
16%
14%
12%
10%9%
8%
6%
0
20
40
60
80
100
120
140
160
Dublin Mid-East South-West Mid-West West South-East Border Midlands
Locations in NUTS3 Regions

Final Report to Department of Children & Youth Affairs: Cost of Providing Quality Childcare 60
7.2.3 Provider Type
Just over two-thirds (n=394; 68.8%) of respondents were private providers, with the remaining
179 (31.2%) of responses coming from those in the community and voluntary sector.
Of the providers, approximately 37% (n=214) provided ECCE services only.
7.2.4 Distribution of Provider Type by Region
The split in each region between community/voluntary organisations and private enterprises
can be seen below:
Community / Voluntary
31.2%
Private 68.8%
Provider Type
27%
12%
46%
34%
40%
33%
44%
21%
73%
88%
54%
66%
60%
67%
56%
79%
0% 10% 20% 30% 40% 50% 60% 70% 80% 90% 100%
Dublin
Mid-East
South-West
Mid-West
West
South-East
Border
Midlands
Provider Type by Region
Community/Voluntary Organisation Private Enterprise

Final Report to Department of Children & Youth Affairs: Cost of Providing Quality Childcare 61
The region with the lowest proportion of community/ voluntary respondents was the Mid-East
region. This is consistent with the findings of the Pobal Early Years Sector Profile Report
2017-2018, which noted that the counties with the lowest proportions of community services
were in Dublin and the Mid-Eastern Region.
7.2.5 Legal Form
We asked providers to indicate the legal form of their services, as set out in the chart below:
As the chart above illustrates, almost half (49%; n=272) of respondents to this question stated
that they were a sole trader, with company limited by guarantee being the next most popular
answer at 31% (n=173). Of the 4% (n=24) that indicated Other, the responses included
“community-based”, “unlimited company”, and “associated with a school”.
This breakdown corresponds closely with data provided by Pobal from their 2017/2018 Sector
Profile Survey, which indicated that 49% of responding providers were sole traders and 24%
were companies limited by guarantee.
31%
12%
4%4%
49%
Legal Form of Service Provider
Company limited by guarantee
Company limited by shares
Other
Partnership
Sole trader

Final Report to Department of Children & Youth Affairs: Cost of Providing Quality Childcare 62
7.2.6 Legal Form of Different Types of Provider
We have considered the legal form types across different categories of providers. The
following chart illustrates the different profile of legal forms between community and private
providers:
As can be seen, community/voluntary organisations primarily (88%; n=154) consist of
companies limited by guarantee, whilst 5% (n=19) of private enterprises indicated that they
were companies limited by guarantee. Conversely, 70% (n=272) of private enterprises
responding were sole traders whereas only 1% of community/voluntary organisations
indicated they were sole traders.
As a further example, ECCE-only providers’ responses indicated they were predominantly
sole traders (69%; n=147), with the next largest group being company limited by guarantee
(20%; n=42), as illustrated below:
88%
5%
1%
18%
0%
70%
1%
6%
11%
1%
0% 10% 20% 30% 40% 50% 60% 70% 80% 90% 100%
Community/Voluntary Organisation
Private Enterprise
Legal Form by Provider Type
Company limited by guarantee Company limited by shares Sole trader Partnership Other
20% 3% 69% 4% 3%
0% 10% 20% 30% 40% 50% 60% 70% 80% 90% 100%
Legal Form: ECCE-Only Providers
Company limited by guarantee Company limited by shares Sole trader Partnership Other

Final Report to Department of Children & Youth Affairs: Cost of Providing Quality Childcare 63
7.2.7 Length of Time in Sector
Providers were asked what year their service was established. The earliest year given was
1954, and the most recent was 2018. As can be seen from the graph below, the majority of
respondents (85%; n=473) were established in 1995 or later, with 38% (n=211) of responding
providers established in 2008 or after.
A clear uptick in service providers is evident in line with the announcement in 2009 of the free
pre-school year, and another correlates with the expansion of the ECCE scheme in 2016.
7.2.8 Individual Versus Chain Providers
When asked if the service was part of a chain or multiple-centre provider with a central or
head-office function, the majority of participants who answered the question (91.4%; n=513 of
561 respondents) indicated that they were stand-alone; only a minority of respondents were
part of a chain of childcare providers. This varies only slightly between community/voluntary
and private providers, with a slightly higher proportion (12%; n=21) of community/voluntary
providers indicating they were part of a multiple-centre organisation with 7% (n=27) of private
providers indicating this. This may be influenced by the participation of a network of
community Irish-language service providers in Gaeltacht areas supported by a central
administration office.
0
5
10
15
20
25
30
35
40
Year service was established

Final Report to Department of Children & Youth Affairs: Cost of Providing Quality Childcare 64
7.3 Premises
7.3.1 Premises Type
The table and chart below indicates the types of premises in which the service is provided.
When we consider the dataset as a whole, the responses were fairly spread across the five
options, with the largest being domestic building owned by service provider (156 or 28% of
respondents). Only 30% (n=170) of providers’ premises were commercial in nature
(commercial building owned by service provider or premises with a commercial lease).
Type of premises Number %
Domestic building owned by service provider 156 28%
Premises without formal lease arrangement 118 21%
Premises with non-commercial lease 112 20%
Commercial building owned by service provider 97 17%
Premises with a commercial lease 73 13%
Total responses 556 100%
The Pobal Early Years Report 2017-2018 had a slightly different categorisation, but could be
roughly compared to the data above. The table below shows the Pobal data compared to the
survey findings:
Premises ownership Pobal Data % Survey %
Leased 42% 34%
No formal agreement 10% 21%
Owned 48% 45%
Total 100% 100%
The survey findings do vary from the Pobal data, mostly in the “no formal agreement”
category. It is unclear why this may be the case, but there may be some differing
interpretation in relation to “non-commercial lease” and “without a formal lease arrangement”;
this is further explored below in examining the key differences in private and community
providers by comparison with the Pobal survey data.
28% 21% 20% 17% 13%
0% 10% 20% 30% 40% 50% 60% 70% 80% 90% 100%
Premises Type
Domestic building owned by service provider Premises without formal lease arrangement
Premises with a non-commercial lease Commercial building owned by service provider
Premises with a commercial lease

Final Report to Department of Children & Youth Affairs: Cost of Providing Quality Childcare 65
There is a clear difference between private providers and community/voluntary organisations
in premises type, as set out in the chart below:
72% (n=119) of community/voluntary organisations who responded are operating in leased
premises with non-commercial leases or without formal lease agreements, with 18% (n=30) in
owned commercial premises. Private enterprises indicated that more than a third (38%;
n=148) of such providers operate in a domestic building owned by the service provider, with a
similar percentage (33%; n=130) operating in commercial premises, either owned or leased.
We compared these findings to Pobal’s 2017/2018 Sector Survey data, as follows:
Private Community/Voluntary
Premises ownership Pobal Data % Survey % Pobal Data % Survey %
Leased 40% 28% 48% 46%
No formal agreement 7% 17% 17% 32%
Owned 53% 55% 35% 23%
Total responses 100% 100% 100% 100%
The biggest differences are in relation to “leased” and “no formal agreement” in the private
sector whereby Pobal data shows a higher proportion of their respondents falling into the
former category with a lower number indicating a lack of formal agreements than in the Crowe
survey, and vice versa. There is a significant difference in the community sector in respect of
buildings owned versus those with no formal agreement. It is not clear why these differences
between the different surveys exist.
5%
38%
18%
17%
32%
17%
40%
12%
6%
16%
0% 10% 20% 30% 40% 50% 60% 70% 80% 90% 100%
Community
Private
Premises Type: Private & Community/Voluntary
Domestic building owned by service provider Commercial building owned by service provider
Premises without formal lease arrangement Premises with a non-commercial lease
Premises with a commercial lease

Final Report to Department of Children & Youth Affairs: Cost of Providing Quality Childcare 66
ECCE-only providers use a much higher percentage (44%; n=93) of domestic buildings
owned by the provider, with only 14% (n=28) operating in commercial premises either owned
or leased, as the following chart illustrates.
7.3.2 Mortgages
For those survey respondents that owned the property where the service was provided
(n=253), only 16% (n=41) had a commercial mortgage. Just over half of respondents (58%;
n=146) stated that they had any mortgage, with 42% (n=105) having no mortgage at all.
Of those that had a mortgage, respondents were asked how long was left on the loan. The
answers ranged from 1 year to 40 years, with the median being 14 years.
When we further examine the responses by provider type, it is still clear that commercial
mortgages are the minority. The charts below illustrate that none of the community/voluntary
44% 22% 20% 8% 6%
0% 10% 20% 30% 40% 50% 60% 70% 80% 90% 100%
Premises Type: ECCE-Only
Domestic building owned by service provider Premises without formal lease arrangement
Premises with a non-commercial lease Commercial building owned by service provider
Premises with a commercial lease
16%
40%
42%
2%
Mortgages
Commercial mortgage
Domestic mortgage
No mortgage
Other mortgage

Final Report to Department of Children & Youth Affairs: Cost of Providing Quality Childcare 67
providers in the dataset have mortgages on the premises, with 19% (n=41) of private
providers holding a commercial mortgage.
7.3.3 Grants
For those that own the building used for childcare, they were then asked if grant aid was
availed of for building, extending, or renovating the premises. A number of providers (n=124;
22%) indicated that they had availed of grant aid for any of the activities; see the table below.
Type of Grant Aid Number
For building premises 66 (12%)
For extending premises 28 (5%)
For renovating premises 30 (5%)
The total grant aid availed of by these 124 respondents to the survey totals €23m, the vast
majority of which (€20.9m) was for building rather than extending or renovating.
When we look at the distribution of grants among provider types, there is a significant
difference between community and private providers. Although more individual private
provider respondents reported receiving grants (82 private versus 36 community providers),
the amounts received by those in the community and voluntary sector for building grants are
substantially more than those reported by private providers in the survey. This is illustrated in
the following table.
Number of Providers
Receiving Grants Grant Amounts % of grant amounts
Grant Type Community Private Community Private Community Private
Building 25 41 €18,288,186 €2,572,000 88% 12%
Extending 2 26 €335,156 €816,747 29% 71%
Renovating 6 24 €100,000 €1,117,273 8% 92%
As can be seen, the bulk of the value of the grants for building premises was for community
rather than private providers, which is reflective of the target of the Large Scale Capital
Investment Programmes.
47% 19%
2%
100%
31%
0% 10% 20% 30% 40% 50% 60% 70% 80% 90% 100%
Community/Voluntary Organisation
Private Enterprise
Mortgages by provider type
Domestic mortgage Commercial mortgage Other mortgage No mortgage

Final Report to Department of Children & Youth Affairs: Cost of Providing Quality Childcare 68
7.3.4 Leased Premises
For those participants that did not own, but leased, the premises used for childcare (n=185;
33% of overall responses), they were asked where the leased premises were based.
Approximately 38% (n=69) of respondents who leased their premises stated that the premises
were solely for the service. Of the respondents who indicated that the premises were based at
a location shared with another service or agency, many indicated their service was based at a
community centre (24%; n=44) or a school (20%; n=37). Only a minority are based with other
organisations, agencies, or family resource centres.
38%
24%
20%
9%
7%
1% 1%
Location of Leased Premises
Premises solely for the service
Community centre
School
Other organisation premises
Other community or voluntaryagency premises
Employer's premises
Family Resource Centre

Final Report to Department of Children & Youth Affairs: Cost of Providing Quality Childcare 69
7.4 Services
7.4.1 Overview
We asked providers a series of questions in relation to the services provided, the responses
to which are set out here.
7.4.2 Services Offered
When asked what services they offered, the results were as set out in the chart below. (Note:
Because many providers can and do offer more than one service, e.g. full-time and sessional
care, the totals exceed the total dataset responses.)
As illustrated above, the majority of respondents (n=520; 91%) indicated that they provided at
a minimum sessional services in the mornings. Only a very small number of providers (n=40;
7%) stated that they provide services other than childcare, other childcare services, or drop-
in/occasional care.
When compared with Pobal’s sector profile data, the breakdown of service type is very
similar, as can be seen in the following chart:
17
12
129
11
189
216
114
175
520
175
0 100 200 300 400 500 600
Services other than childcare/early educationservices
Other childcare/early education services
Out-of-term care for school-age children
Drop-in/occasional care
Part-time care
After-school care
Breakfast club
Sessional services - afternoon
Sessional services - morning
Full-day care
Services Offered

Final Report to Department of Children & Youth Affairs: Cost of Providing Quality Childcare 70
We can see when we compare the provider types that the overall distribution of services
provided is broadly similar between private and community providers, as the following chart
indicates.
2%
33%
38%
20%
31%
91%
31%
2%
38%
41%
19%
29%
89%
34%
0% 10% 20% 30% 40% 50% 60% 70% 80% 90% 100%
Drop-in/occasional care
Part-time care
After-school care
Breakfast club
Sessional services - afternoon
Sessional services - morning
Full-day care
Comparison of services provided: Pobal survey/Crowe survey responses
Pobal Survey

Final Report to Department of Children & Youth Affairs: Cost of Providing Quality Childcare 71
(Note: because providers could select more than one service, the percentages do not add up
to 100%. The percentages represent the proportion of providers who indicated they provided
the service in question, i.e. 91% of all providers provide full-day care; 32% of private providers
offer after-school care, etc.)
Community providers who responded indicated that they more frequently offered after-school,
out-of-term, and part-time care services than the overall profile or that of private providers.
Almost all services offering non-childcare services were in the community and voluntary
sector.
8%
6%
31%
3%
46%
50%
26%
34%
84%
39%
1%
1%
19%
2%
27%
32%
17%
29%
94%
27%
3%
2%
23%
2%
33%
38%
20%
31%
91%
31%
0% 10% 20% 30% 40% 50% 60% 70% 80% 90% 100%
Services other than childcare/early educationservices
Other childcare/early education services
Out-of-term care for school-age children
Drop-in/occasional care
Part-time care
After-school care
Breakfast club
Sessional services - afternoon
Sessional services - morning
Full-day care
Services Offered
All Private Community

Final Report to Department of Children & Youth Affairs: Cost of Providing Quality Childcare 72
7.5 Capacity
Half (50%; n=283) of providers who responded to the question stated that they had a waiting
list. However, when asked if there were plans to change the capacity of the service, 76%
(n=432) of the respondents indicated that there was no plan to change capacity. Only 2%
(n=9) stated that they planned to decrease capacity. (This does not vary across provider
type.)
76%
22%
2%
Plans to change the capacity of the service
No plan to change capacity
Plan to increase capacity/number ofplaces available
Plan to decrease capacity/number ofplaces available

Final Report to Department of Children & Youth Affairs: Cost of Providing Quality Childcare 73
7.6 Rooms
Providers were asked to provide information regarding the number of rooms available and the
number of rooms currently being used by the service.
Note that where the number of rooms in use looks higher than the number of rooms available,
this is due to, for example, where 52 providers have four rooms available but four of these are
not using all four available rooms, which then explains why it appears that the number of
providers using three rooms is higher than providers with a maximum of three rooms
available.
The number of rooms available to and in use in the services for the provision of childcare
services ranged from one room to 15 rooms. Of providers who responded, 66% (n=366)
operate with only one or two available rooms. Just under a quarter (23.3%; n=130) have more
than three rooms available.
As might be expected, those providers only offering ECCE services typically have fewer
rooms available and in use, with 68/69% (n=146/148) of ECCE-only respondents having only
one room available and in use. A mere 5% (n=10) of these providers had more than two
rooms available and 4% (n=8) had more than two rooms in use. The chart below illustrates
the rooms available and in use for ECCE-only providers:
239
127
62
52
32
22
10 83 1 0 0 1 0 1
247
111
64
48
32
22
9 81 1 0 0 1 0 1
0
50
100
150
200
250
300
1 2 3 4 5 6 7 8 9 10 11 12 13 14 15
Number of Rooms
Rooms Available and in use in all providers
Available In Use

Final Report to Department of Children & Youth Affairs: Cost of Providing Quality Childcare 74
7.7 Charges and Discounts
7.7.1 Sibling Discounts
Less than half of providers (41%; n=235) indicated that they offered sibling discounts. When
asked the amount of the discount, responses for the second child ranged between €3 and
€80, with an average of €12.00. Discounts for the third child ranged between €3.85 and €70,
with the average at being €13.76. For a fourth child or more, the discount ranged between
€3.85 and €100, with an average of €15.39.
7.7.2 Food
The provision and inclusion of food within the fees varies by the type of care provided. For
services providing full-day care, nearly two-thirds (65%; n=158) of services indicated they
provided food included within their fees. Sessional services were less likely to provide food,
with 73% (n=357) of morning sessional services and 68% (n=166) of afternoon sessional
services not providing food. For those services that did provide food at an extra cost to the
parents, the cost ranged between €2 and €25 per child per week.
The table overleaf sets out the responses in relation to the provision of food and cost to
parents for different service types.
146
54
73
148
43
80
0
20
40
60
80
100
120
140
160
1 2 3 4
Rooms available and in use in ECCE-only providers
Available In Use

Final Report to Department of Children & Youth Affairs: Cost of Providing Quality Childcare 75
Food included
within fees
Food provided at
extra cost
Food not provided
Type of Care % N % N % N
Full-day care 65% 158 1% 2 34% 83
Sessional services – a.m. 23% 115 4% 19 73% 357
Sessional services – p.m. 30% 74 2% 5 68% 166
Breakfast club 61% 112 2% 4 37% 69
After-school care 69% 180 3% 8 28% 72
Part-time care 63% 155 2% 6 35% 86
Drop-in/occasional care 32% 39 2% 3 66% 81
Out-of-term care 64% 125 1% 2 35% 68
7.7.3 Transport
Providers were asked if transport was provided for school-age children to drop to and collect
them from school. The majority of providers (74%; n=354) stated that transport was not
provided. Approximately 26% (n=122) indicated that transport was available, whilst only 7%
(n=33) stated that it was provided at an extra cost to parents. The extra weekly cost for
transport ranged between €5.00 and €50, with an average of €15.30.
354, 74%
89, 19%
33, 7%
Transport provided to drop to and collect from school
Transport is not provided
Transport is provided and includedwithin the fees
Transport is provided at an extracost to parents

Final Report to Department of Children & Youth Affairs: Cost of Providing Quality Childcare 76
7.7.4 Additional Services for ECCE-Only Attendees
Providers were asked about additional optional services offered to families availing of ECCE
only. A little over half (57%; n=321) indicated that there were no additional optional services
offered.
Of those who did offer additional optional services, these included the following, amongst
others:
Additional hours of care, including options for early drop-off and late collection;
School tours;
Educational and physical classes, such as music and yoga;
Camps, such as summer camp;
Outings;
Gymboree.
43%
57%
Additional optional services offered to families availing of ECCE
Yes
No

Final Report to Department of Children & Youth Affairs: Cost of Providing Quality Childcare 77
7.8 Staffing
The survey asked for details in relation to managers, childcare staff, and ancillary staff in the
services. The numbers varied considerably, from one to four in the case of managers; one to
45 in the case of childcare staff; and from zero to nine for ancillary staff. A little over one-third
of the providers (n=207) responding indicated that they employed any ancillary staff.
The average numbers of managerial, childcare, and ancillary staff working in the respondents’
services are illustrated in the chart below.
As can be seen, the average number of managerial staff across all respondents is 1.2; the
average number of childcare staff is 5.3, and ancillary staff – where these are employed: as
above, only 36% of services provided any numbers for ancillary staff – average 0.9.
Community provider who responded had higher average numbers of childcare and ancillary
staff than private providers. The average childcare staff numbers in ECCE-only services are
considerably lower than the overall average, at 2.2.
1.2
5.3
0.91.1
7.1
1.7
1.2
4.4
0.5
1.0
2.2
0.2
0.0
1.0
2.0
3.0
4.0
5.0
6.0
7.0
8.0
Managers Childcare staff Ancillary staff
Average number of staff
Overall Community Private ECCE Only
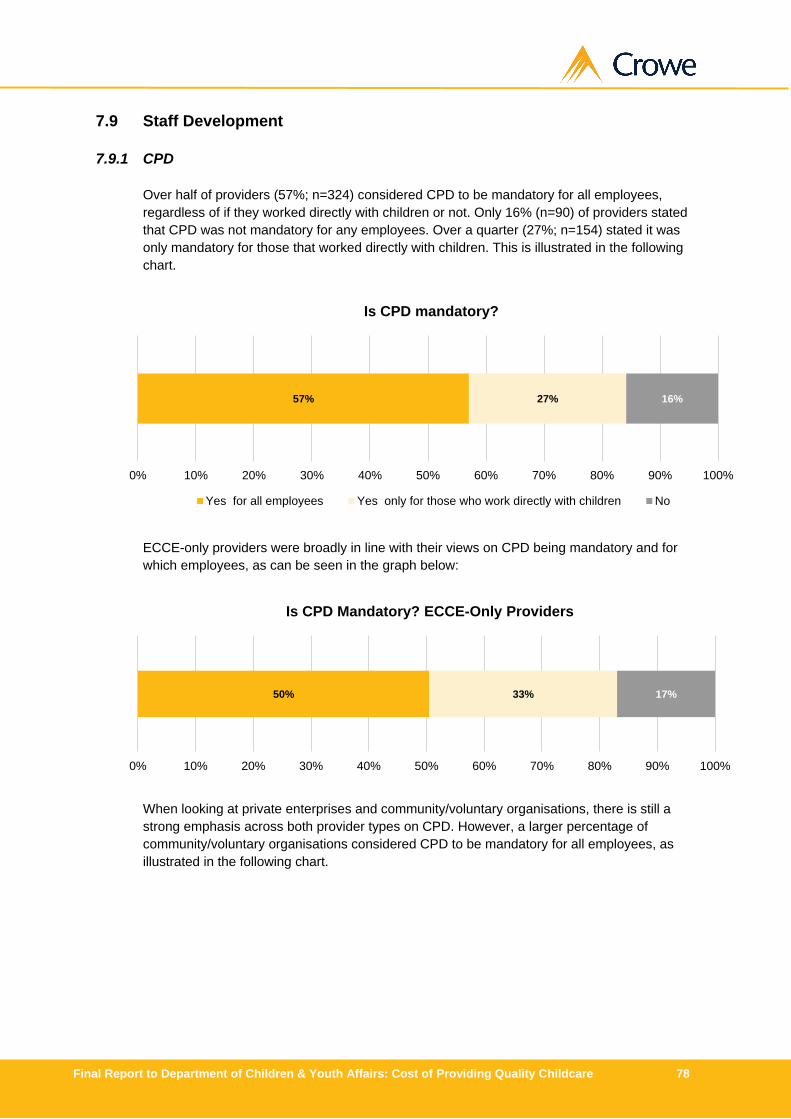
Final Report to Department of Children & Youth Affairs: Cost of Providing Quality Childcare 78
7.9 Staff Development
7.9.1 CPD
Over half of providers (57%; n=324) considered CPD to be mandatory for all employees,
regardless of if they worked directly with children or not. Only 16% (n=90) of providers stated
that CPD was not mandatory for any employees. Over a quarter (27%; n=154) stated it was
only mandatory for those that worked directly with children. This is illustrated in the following
chart.
ECCE-only providers were broadly in line with their views on CPD being mandatory and for
which employees, as can be seen in the graph below:
When looking at private enterprises and community/voluntary organisations, there is still a
strong emphasis across both provider types on CPD. However, a larger percentage of
community/voluntary organisations considered CPD to be mandatory for all employees, as
illustrated in the following chart.
57% 27% 16%
0% 10% 20% 30% 40% 50% 60% 70% 80% 90% 100%
Is CPD mandatory?
Yes for all employees Yes only for those who work directly with children No
50% 33% 17%
0% 10% 20% 30% 40% 50% 60% 70% 80% 90% 100%
Is CPD Mandatory? ECCE-Only Providers

Final Report to Department of Children & Youth Affairs: Cost of Providing Quality Childcare 79
7.9.2 Funding of CPD
As can be seen from the chart above, more than two-thirds (69%; n=395) of respondents
stated that the employer pays for all CPD, with a smaller proportion (23%; n=131) stating that
the employer part-pays for CPD. Other options for payment of staff CPD activities were in the
minority. Funding of CPD was broadly similar across the different provider types.
For these CPD activities, 56% (n=310) of providers noted that CPD is undertaken outside
work hours only, with no leave available. Paid leave or overtime was available from 32.5%
(n=179) of respondents, and 11% (n=62) made unpaid leave available for CPD.
63%
54%
23%
29%
14%
17%
0% 10% 20% 30% 40% 50% 60% 70% 80% 90% 100%
Community
Private
Is CPD Mandatory? Provider Type
Yes for all employees Yes only for those who work directly with children No
395
131
4356
3453
34
0
50
100
150
200
250
300
350
400
450
Employer paysfor all CPD
Employer part-pays for CPD
Staff memberpays for all
CPD
Staff memberpart-pays for
CPD
CPD is fullyfunded by
DCYA
CPD is part-funded by
DCYA
Other
How CPD is funded

Final Report to Department of Children & Youth Affairs: Cost of Providing Quality Childcare 80
7.10 Staffing Resources and Turnover
7.10.1 Plans for Staffing Resources
When asked about plans to change staffing resources over the coming year, the majority of
respondents indicated that they had no plans to change staffing resources, with no change
planned for either number of staff or staff hours. Only 5% (n=27) of providers who answered
the question planned to decrease in the coming 12 months and only 6% (n=23) of those
responding planned to decrease hours in the coming months. Slightly more planned to
increase staff or hours in the coming 12 months (27%; n=139; and 21%, n=76; respectively),
but, overall, providers were not planning on making any changes to staffing resources in the
following year. The following charts illustrate this.
352, 68%
139, 27%
27, 5%
Plan to change number of staff over coming year
No change in the coming 12months
Plan to increase in the coming12 months
Plan to decrease in thecoming 12 months

Final Report to Department of Children & Youth Affairs: Cost of Providing Quality Childcare 81
7.10.2 Staff Turnover
To gather information around staff turnover, questions were asked about the number of staff
who left the service within the last 12 months, staff who joined within the past 12 months, and
current vacancies. We examined the turnover by considering the figures for staff who left as a
percentage of the overall staff of each provider. Across all respondents, the average
percentage of staff leaving within the past 12 months was 12%, ranging from 0 to 100%
However, 59% (n=319) reported no staff leaving in the preceding 12 months.
This table sets out the regional averages for turnover as a percentage of overall staff, the
range of percentages across the responses, and the number of respondents that answered
this particular question.
NUTS3 Region Total staff No. of staff leaving
post in year
Staff turnover
Dublin 1,088 167 15%
Mid-East 630 76 12%
South-West 553 49 9%
Mid-West 580 53 9%
West 347 28 8%
South-East 298 43 14%
Border 394 58 15%
Midlands 272 30 11%
Total 4,162 504 12%
Average turnover percentages did not vary across provider type, i.e. private and community
providers had similar averages and ranges to the overall figures.
The average turnover figures indicated in the survey are substantially lower than those
reported to Pobal in the Early Years Sector Profile Report 2017-2018, which indicates
272, 73%
76, 21%
23, 6%
Plans to change hours of existing staff over coming year
No change in the coming 12months
Plan to increase in the coming12 months
Plan to decrease in the coming12 months

Final Report to Department of Children & Youth Affairs: Cost of Providing Quality Childcare 82
reported turnover of on average 24% across the sector. It is not clear why this difference
exists.
When analysing turnover without single-employee owner-managed providers, the turnover
percentage did not change significantly.
7.10.3 Staff Recruitment, Retention, and Development Issues
Providers were asked about their key concerns in respect of recruiting, retaining, developing,
and maximising the skills of appropriately qualified and experience employees. The majority
of respondents (83%; n=475) indicated that the capacity to offer attractive wages or salary
levels was a key concern. Another key concern for many providers (72%; n=414) was the
difficulty of attracting suitably qualified and experienced childcare staff. The responses less
commonly highlighted by respondents included difficulty attracting staff with appropriate
language competency, and competition from other childcare providers.
The following diagram illustrates the key concerns (note that because more than one concern
could be selected, the total of the responses exceeds 100%).
81
84
123
207
322
330
346
414
475
0 50 100 150 200 250 300 350 400 450 500
Difficulty attracting staff with appropriate languagecompetency
Other concerns
Competition from other childcare/early yearsproviders
Competition from other sectors
Capacity to fund staff training or development
Capacity to facilitate leave for staff training anddevelopment
Capacity to offer attractive additional staff benefits
Difficulty of attracting suitably qualified andexperienced childcare/early years staff
Capacity to offer attractive wage/salary levels
Key concerns in relation to attracting and retaining staff

Final Report to Department of Children & Youth Affairs: Cost of Providing Quality Childcare 83
7.11 Survey Findings – Qualitative
The survey included some opportunities for participants to express their opinion on the key
issues relating to the cost of providing quality childcare. A brief overview of these qualitative
responses is set out here.
Low Salaries: Providers believed that the low salaries within the sector impact on the
ability of providers to both recruit and retain qualified staff.
Part-Time Conditions: The part-time nature of work in the childcare sector, including
services that lay off staff in the summer months as services are not funded year-round
(e.g. ECCE), was also cited by providers as a significant challenge to recruitment and
retention of staff.
Difficulty Finding Staff: In addition to low salaries and part-time working year,
providers also reported experiencing difficulty in finding appropriately qualified, capable,
and motivated staff. In addition, some providers reported difficulty in finding staff with
the appropriate language skills, including English and/or – in Gaeltacht areas and for
Irish-language services – Irish.
Financial Challenges: All providers reported experiencing significant financial
challenges and pressures.
Uncertainty: Some providers indicated they perceived a great of deal of financial
uncertainty operating in the childcare sector, reportedly reducing the ability of providers
to plan ahead, particularly with regards to staffing decisions, stemming from not being
able to predict income due to not knowing how many numbers they will have until the
beginning of a term.
Poor Morale across Sector: Providers reported a perception of poor morale amongst
those working in the sector, driven by some of the issues listed above and a more
general sense of the work of the childcare sector not being fully valued.
Administration Workload: A common frustration expressed by a number of providers
was the perceived complex level of administration required to operate in the sector and
comply with regulations; this administrative workload was reported as onerous and
time-consuming.
Rural Challenges: A number of providers who worked in rural areas referenced
specific challenges due to their operating environment, including low population
numbers which impact on income, (in)accessibility of training events for staff, and
operating in areas of lower income.
Irish-Language Providers: Many of the issues cited by Irish language providers were
aligned with those of English-language childcare providers, such as difficulty in
recruiting staff, paperwork, and so on. Providers perceived that their work was not
afforded the recognition they believe it deserves, with a reported lack of support for the
additional costs of equipment and translation services required to provide childcare
services through the Irish language.

Final Report to Department of Children & Youth Affairs: Cost of Providing Quality Childcare 84
8 Regression Analysis Outputs
8.1 Introduction
This paper sets out of the details of the outputs from the regression analysis undertaken to
improve the understanding of the drivers of costs in relation to childcare. The work develops
on the data cleaning, data analysis, and development of the cost modelling tool undertaken in
2018 and 2019, drawing on the same dataset, as well as some additional geographical
factors.
As discussed in Section 6, the work involved reviewing findings from the current research
project alongside previous work by Paull and Xu for Frontier Economics (2019). These
findings were used to compile a range of potential drivers of unit costs. We then sought to
operationalise these drivers using the data available to us. This dataset was analysed
descriptively before being incorporated into multivariate regression models. The aim of this
study was to identify and quantify the independent associations of these drivers with the
calculated unit costs of the childcare services previously surveyed.
8.2 Results
8.2.1 Overview
This section shows the results from both the data preparation and checking as well as the
final regression model developed.
8.2.2 Descriptive Analysis
A descriptive analysis of the data identified several interesting features (see appendix, Table
A1 for frequency tables of categorical variables).
Unit cost:
The original unit cost variable was highly positively skewed (skewness = 5.44, see
Figure 1). This was mostly due to several outliers above €15. Five cases with very high
unit cost values (€15 to €38) were therefore removed from the analysis so that they
would not unduly affect the results of the regression. This reduced the skewness to
0.83. The remaining sample size was N=568. (See Figure A1 for the histogram with
outliers excluded).
The mean of the unit cost variable (trimmed of outliers) was €3.93, and the median was
€3.77. Standard deviation was €1.87.

Final Report to Department of Children & Youth Affairs: Cost of Providing Quality Childcare 85
Figure 1: Histogram of original calculated service-level unit cost (€ per child-hour)
Size:
There was an almost equal split in services across the four different size categories of
small, medium, large and very large, with 25% in each category. This was due to the
size variable being derived from the available hours in services, split into quartiles.
Small represents approximately 13,000 hours or less per year; medium between
13,000 and 25,000 hours per year; large between 25,000 and 90,000 per year; and
very large more than 90,000 hours per year.
Ownership profile:
Just over two thirds (69%) were private enterprises.
Most of the services (78%) were either companies limited by guarantee (30%) or sole
traders (48%).
There was a mix of the location in which services were based with the most notable
being a domestic building owned by service provider (28%), premises without formal
lease arrangements (21%) and premises with a non-commercial lease (20%)
Not many providers had multiple sites (8%).
Service categorisation:
Only 10% of services did not provide ECCE-funded services.
Just under half of all the services were in receipt of the ECCE higher capitation rate
(48%).
Geographical profile:
Nearly all of the services were categorised as being in localities either marginally above
(44%) or below (42%) average deprivation. There were some very low incidence
categories – very and extremely disadvantaged (N=2 and N=1 respectively) – which
050
10
015
020
0
Fre
quen
cy
0 10 20 30 40Calculated unit cost (€)

Final Report to Department of Children & Youth Affairs: Cost of Providing Quality Childcare 86
were subsequently grouped with the disadvantaged category for inclusion in the
regression analysis.
The services were fairly evenly split between urban (58%) and rural (42%).
The largest number of services was located in the Dublin region (25%), with the
smallest in the Midlands region (6%).
The county of Dublin was the largest in terms of service numbers (25%, 143 services).
Three counties had 5 or fewer services.
Services provided:
Just under a third (30%) provided full-day services and 29% part-time services. 91%
provided morning services and only around a third (31%) provided afternoon services.
19% provided breakfast services and 37% provided after school services. 21%
provided an out-of-term service, but almost none provided drop-in services (1%). As a
result of this, the drop-in service indicator was excluded from the remainder of the
analysis.
Around 37% of services had at least 95% of their available hours filled (see appendix,
Figure A2) but a large minority of services (36%) had more than 20% of their available
hours unfilled.
The average percent of non-contact hours across services was 22% (see appendix,
Figure A3), with the vast majority (91%) falling between 0% and 40% of total hours.
Only 17 services (3%) were recorded as having a quality award (i.e. Síolta accreditation
and/or excellent scores in DES inspections).
Around 29% of services were open nearly the whole year, with the rest mostly (63%)
open during the school year (38 weeks).
Staff qualifications, child contact and turnover:
Two thirds of the services (61%) were graduate led (either a manager or room leader
being a graduate).
The average qualification level of staff in services (see appendix, Figure A4) was just
above level 6 (6.2). There was considerable variation around this, however, with some
services (14%) having an average level of 7 and above. There was a definite peak at
level 6, indicating that this is a commonly required level of qualification for staff.
Most services had mandatory CPD (81%) for either all (55%), or for care staff (26%).
However, this tended to be outside work hours (49%), with a smaller proportion (33%)
getting paid CPD (overtime or leave).
Staff turnover was zero for the majority of services (61%). Eighteen percent (18%) of
services had a staff turnover of 20% or less and a further 18% had a turnover of more
than 20%, up to 50%.
Child profile:
The youngest children for many services (54%) were aged between 3 and 5 years. A
minority only provided for school age children (4%). 17% of services provided for
children less than 12 months of age.

Final Report to Department of Children & Youth Affairs: Cost of Providing Quality Childcare 87
Staff-child ratios:
The average staff-child factors26 suggested that most sessions safely conformed to
regulations with more adults per child than the legal limits (see appendix, Figure A6).
The average factor was 86%, meaning that there was 86% of the maximum number of
children permitted by the regulation applicable in sessions on average. The standard
deviation was 22%27.
The average group size in rooms was 15 children, with a standard deviation of 5.8.
Considering the child-to-adult regulations, this suggests that many sessions had
multiple staff members looking after larger groups of children in a room (see appendix,
Figure A7).
Income:
The income of services was strongly dependent on ECCE (see appendix, Figures A8
and A9).
For around half of the services 75% or more of their income was from ECCE, and for
more than a quarter of them, 95% or more of their income was from ECCE. This was
reflected in the proportion of income from fees, which showed that for two-thirds of
services, fees made up 25% or less of their income.
8.2.3 Missing Data
Some variables suffered from missing values for some services (see appendix, Table A2). An
average staff-child factor could not be estimated (or imputed during the data cleaning
process) for one service, nor could the average staff qualification level. The data on children
being provided services in rooms was not complete for 19 services (and so the average group
size and youngest children could not be calculated); the type of premises was missing for 17
services, and the entity type was missing for 11 services. Also, the level of local deprivation
was missing for two services. The most missing data related to CPD: 22 services did not
respond as to whether CPD was mandatory, and 35 did not state whether leave was provided
for CPD or not. The overlapping combinations of these variables (see appendix, Table A3)
meant that a sample size of N = 487 was available for a complete case analysis.
8.2.4 Pairwise Correlations
The estimation of pairwise correlations between all variables (see appendix, Table A4)
identified one particular issue. Services which provided morning sessional care were almost
perfectly (negatively) correlated (-0.99) with those which did not provide ECCE services. This
high correlation is a problem in regression modelling and can lead to instability in standard
errors due to multicollinearity. Therefore, this indicator for morning sessional services was
excluded from the regression modelling.
26 Rather than use a simple adult-child ratio (which is uninformative when varying regulations are relevant according to
the ages of the children), we calculated a factor which was the comparison of the adult-child ratio to the relevant
regulation. Thus, a factor of one implies that the number of children meets the limit of the regulation. Less than one
means there is spare capacity before the regulation limit is reached, etc. 27 At the time of the survey, no regulatory requirement for staff-child ratios for school age children was in place: a limit of
20 was used within the modelling here as an upper limit was required and this was considered appropriate. It would
be misleading to use the new regulation of 1:12 here as this would imply services were not in line with regulatory
requirements at the time of data collection.

Final Report to Department of Children & Youth Affairs: Cost of Providing Quality Childcare 88
The estimates of pairwise correlation between variables identified many associations
indicative of the characterisation of services. The indicators of service provision were
correlated with one another in many cases. Full day, breakfast, after school, and out-of-term
services were correlated with one another (r = 0.53 to 0.64), suggesting that services
providing one of these services also often provided the others. These service types were also
correlated with the opening weeks of the service (r = 0.41 to 0.76) and the ages of the
youngest children provided for. Generally, these service types were less likely to be provided
where the youngest children were 3-5 years old (r = -0.26 to -0.60).
Non-provision of ECCE services was almost perfectly negatively correlated with provision of
morning services (r = -0.99). This multicollinearity motivated the exclusion of the morning
service indicator from the regression modelling. Essentially, the service types, opening weeks
and ages of the youngest children appeared to collectively provide a characterisation of the
service. There appeared to be services that were predominantly providing morning ECCE
services, and services which offered a broader range of provision. Indeed, the income of
services from fees was correlated with these broader ranges of provision (r = 0.39 to 0.64),
and negatively correlated with provision to the ECCE eligible age group (3-5 years, r = -0.54).
Likewise, income from fees and ECCE were also associated with opening weeks (r = 0.60, -
0.67), as might be expected for ECCE’s school year-only provision.
There appeared to be a distinct type of service that was very large (in terms of available hours
of service provision). The indicator for this group (which was in the top quartile of the
distribution of available hours) was correlated with service types, opening weeks, ECCE only
status and the age of the youngest children provided for. The very large services were
strongly correlated with provision of full day care (r = 0.74) and being open most of the year (r
= 0.71), with breakfast, after school, part-time and out-of-term provision also being associated
with this size of organisation (r = 0.47 to 0.58). They were less likely to only provide ECCE
services (-0.45) and tended not to have 3-5-year-old children as the youngest they catered for
(r = -0.55).
Finally, services with higher average levels of staff qualification were also more likely to be
graduate led (r = 0.60), and services that were graduate led were predominantly in receipt of
the higher capitation rate for ECCE funding (r = 0.73).
8.2.5 Bivariate Associations
A table of results from the models identifying bivariate associations with unit cost are shown in
Table A5 in the appendix. These models showed that many of the bivariate associations with
unit cost were statistically significant at the = 5% level. These results provide a simple way
to calculate the average unit cost for particular levels of the explanatory variables. However,
they do not statistically control for other variables, and so are of limited use for identifying the
drivers of unit cost. Thus, for the remainder of this report we focus on the results of the
multivariate regression modelling.
8.2.6 Regression Modelling
A saturated model (excluding county and region) was estimated first. This is a model that
included all the identified possible explanatory variables (see appendix, Table A6). All models
were specified as ordinary least squares models with unit cost as the response variable.

Final Report to Department of Children & Youth Affairs: Cost of Providing Quality Childcare 89
Model selection proceeded by backward selection in order of significance. The = 5% level of
significance was used as a general guideline by which to identify whether terms could be
dropped from the model. The sample was restricted to complete cases so that likelihood ratio
tests could be employed to test for significance (this is particularly useful for testing
categorical variables which consist of multiple terms).
The following variables were dropped from the model:
provides after-school service;
CPD mandatory;
multisite provider;
service is graduate led;
average group size;
CPD leave;
provides breakfast service;
organisation type;
average staff-child factor;
staff turnover;
local deprivation;
average staff qualification level;
provides full-day service;
quality award;
provides out-of-term service;
provides part-time service.
The model was then re-estimated with no restriction on case completeness, so that any
services with complete data for the retained variables were included. The results are shown in
Table 1.
This selection process was repeated for models including (1) indicators for which county the
services were located in, and (2) indicators for which region the services were located in. The
results of the final models in these cases are shown in the appendix in Tables A7 and A8.
8.2.7 Characteristics Independently Associated with Unit Cost
The resulting estimates identified various characteristics that were independently associated
with unit cost.
There was a definite association with the size of the service, with larger services having
lower unit costs (-0.44 to -2.93) than smaller services; this likely reflects efficiencies of
scale.
There appeared to be cost savings associated with the type of premises a service
occupied. Those services with no formal lease arrangement appeared to benefit from
reduced costs (-0.41). This could have been due to special arrangements reducing their
premises costs substantially or even resulting in free premises (perhaps where
community space was being used).

Final Report to Department of Children & Youth Affairs: Cost of Providing Quality Childcare 90
In contrast to the effects for the size of the service, sole traders had lower unit costs (-
0.49) than other entity types, presumably because many overheads are avoided by
small, solo providers.
Services which did not offer ECCE services were more expensive (1.95) than those
that only offered ECCE services (0.69), compared to those which offered both (i.e.
mixed).
Those services in receipt of the ECCE higher capitation rate were also more expensive
(0.46) as is expected, and urban services were more expensive than rural services
(0.45).
In terms of services provided, only afternoon sessional provision was associated with
unit cost. Those services providing afternoon sessions were more expensive (0.47) on
average.
Services which managed to fill more of their available hours also had lower unit costs
on average (-1.05).
The percentage of staff hours which were involved in non-contact work was associated
with higher unit costs (1.83).
Services open most of the year were less expensive (-0.73) than those that were open
only during the school year.
The age of the youngest children the service provided for was associated with unit cost.
The older the children, the lower the unit cost, with school age children being
associated with a far lower unit cost (-3.20) than the younger age groups.
Both the percent of income from fees and ECCE were associated with lower unit costs.
Considering these measures were strongly associated with one another (-0.77), this
suggests that higher proportions of ECCE income were associated with slight
reductions in unit cost (approximately -0.56), accounting for the associated reductions
in fees income.
The models including fixed effects for county and region were similar to this, except that the
indicator for rurality was dropped from both models. The area level indicators in each case
serve as proxies for this rural indicator, alongside other unmeasured area level
characteristics. In both cases, the area level indicators were significantly associated with unit
cost at the = 5% level of significance.
8.2.8 Model Diagnostics
Various diagnostic tests were undertaken to determine whether the final model infringed any
of the assumptions on which ordinary least squares regression models are based. A plot of
residuals against fitted values (see appendix, Figure A10) and a plot of residuals against
quantiles of the normal distribution (see appendix, Figure A11) showed some evidence of
heteroskedasticity and outliers, but nothing very alarming. Plots of leverage (see appendix,
Figure A12) and Cook’s distance (see appendix, Figure A13) showed that the outliers were
unlikely to have very dramatic effects on the estimates from the model and were reasonable
considering the heteroskedasticity. Variance inflation factors (see appendix, Table A9)
identified no variables at risk of multicollinearity (those with moderately high inflation factors
were generally part of categorical variables where the dummy indicators would necessarily be
correlated).

Final Report to Department of Children & Youth Affairs: Cost of Providing Quality Childcare 91
8.3 Conclusions
The table at the end of this section sets out the estimates from the final regression model
(without fixed effects for county and region) after backward selection. Those variables that do
not have estimates listed were dropped from the model. The final model was based on 530
services after those with missing data on the retained variables were excluded.
Size played a key role in the variation in unit cost, with large services cheaper than smaller
services. Much of the advantage in size may be due to efficiencies that come with scale.
Other efficiencies were also important, however. For example, those services where all the
hours were filled had a lower unit cost than those with vacancies. Similarly, the effect of the
age of the children on cost was apparent, with school age children being cheaper to provide
for than younger children. This is undoubtedly related to regulations concerning the number of
childcare staff required (adult-child ratio) for different age groups.
In contrast, non-contact hours acted as an inefficiency as these are hours which are not
available for greater room capacity. However, this may be indicative of a more professional
service. In our dataset, there were very few services with a quality award, and so it was not
possible to explore the relationship between costs and objective measures of quality using the
quality indicator available.
There also appeared to be cost savings for particular entity and premises types, and this may
be due to differences in overheads. For example, sole traders appeared to have lower unit
costs, and those services which did not have a formal lease also benefitted. This may be
related to small service providers operating out of their homes.
The model shows that the service characteristics play a clear role in driving variation in unit
cost and suggests there may be some potential value in segmenting services into categories
to support policy decision making. In particular, there appear to be some distinct service
types, with a contrast between smaller services that primarily focus on ECCE provision, and
larger services that offer a range of different session types.
The unit cost was higher in services with higher capitation, presumably as the costs of
employing staff are higher. This is consistent with the findings in the Frontier Economics Paull
and Xu study. As is consistent with the Frontier Economics study, the model does not include
the variables in relation to CPD, whether the service is graduate-led, and average staff
qualifications.
Curiously, services that opened all year appeared to have a lower unit cost than those that did
not. This contrasts with the Paull and Xu study, which found that all-year opening was
associated with a higher cost than term only. It may be that the association of all-year opening
with size is responsible for this (very large services tended to open all year).
In terms of geographic variables, the final model retained an indicator for rurality, with urban
services being more expensive than those in rural areas. This is likely related to city prices
being higher than those in rural areas. The models which were estimated with the inclusion of
fixed effects for county and region found that this rurality indicator dropped out of the
modelling, its effect being supplanted by these indicators. However, the county effects did not
provide a very clear picture of differences in unit cost (one might expect Dublin to be the most
expensive, but this was not the case according to the estimates). This might be due to the
varying sample sizes for each of the counties. The regional effects appeared to offer a more

Final Report to Department of Children & Youth Affairs: Cost of Providing Quality Childcare 92
predictable result, with Dublin being associated with the highest coefficient for unit cost in the
model.
As with most research, this study leads naturally onto further avenues for investigation.
Although the regression results have identified associations of individual characteristics of
services with unit costs, the descriptive analysis suggested that there are particular service
types that share characteristics. Large services that offer a multitude of services year-round
are very different to smaller services which might have a much more informal and community-
based approach. Future work could look at segmenting the services to see whether they do
indeed form relatively homogenous, yet distinct, groups. The differences in unit costs between
these groups (taking into account combinations of characteristics at once) could then be
estimated.
Table 1: Results of regression analysis after backward selection from saturated model
(with no region or county fixed effects, n=530, R2=0.40828)
Variable Category Coef.
Std. Err.
P-value
lower CI
upper CI
Size Size small (ref. category)
Size medium -0.435 0.204 0.034 -0.836 -0.034 *
Size large -0.886 0.267 0.001 -1.410 -0.362 ***
Size v.large -2.931 0.358 0.000 -3.634 -2.227 ***
Organisation type Community/voluntary org. (ref. category)
Private enterprise
Premises type Commercial owned (ref. category)
Domestic owned 0.048 0.224 0.831 -0.393 0.489
Commercial lease 0.120 0.252 0.634 -0.375 0.616
Non-commercial lease -0.168 0.231 0.469 -0.623 0.287
No formal lease -0.414 0.231 0.074 -0.869 0.041
Entity type Limited by guarantee (ref. category)
Limited by shares -0.186 0.250 0.456 -0.677 0.304
Other -0.443 0.344 0.199 -1.120 0.234
Partnership -0.003 0.353 0.993 -0.696 0.690
Sole trader -0.491 0.187 0.009 -0.858 -0.124 **
Multisite provider Yes (ref. category: No)
ECCE only Mixed (ref. category)
No 1.948 0.305 0.000 1.349 2.546 ***
Yes 0.689 0.213 0.001 0.272 1.107 ***
High capitation Yes (ref. category: No) 0.457 0.139 0.001 0.183 0.731 ***
Local deprivation Affluent (ref. category)
Disadvantaged
Marginally below average
Marginally above average
Rurality Urban (ref. category: Rural) 0.448 0.143 0.002 0.167 0.730 **
Services provided Full day
Afternoon sessions 0.467 0.164 0.005 0.145 0.789 **
Breakfast club
After school club
Part-time
Out of term
Percent hours filled -1.049 0.369 0.005 -1.774 -0.324 **
Percent non-cont. hours
1.833 0.555 0.001 0.742 2.924 ***
Quality award Yes (ref. category: No)
28 R2 is the square of correlation between two variables, x and y. The correlation R tells the strength of linear
association between x and y and R2 tells about the amount of variability in y (unit cost in this case) that is explained
by the model.

Final Report to Department of Children & Youth Affairs: Cost of Providing Quality Childcare 93
Variable Category Coef.
Std. Err.
P-value
lower CI
upper CI
Open most of year Yes (ref. category: No) -0.731 0.277 0.008 -1.275 -0.188 **
Graduate led Yes (ref. category: No)
Ave. staff qual. level
CPD mandatory No (ref. category)
Yes - all staff
Yes - care staff
CPD leave Outside work hours (ref. category)
Paid leave
Paid overtime
Unpaid leave
Staff turnover
Youngest children Less than 12 months (ref. category)
12-23 months -0.237 0.304 0.436 -0.835 0.361
24-35 months -0.770 0.316 0.015 -1.390 -0.149 *
3-5 years -0.903 0.322 0.005 -1.536 -0.271 **
School age -3.196 0.530 0.000 -4.236 -2.156 ***
Ave. staff-child factor
Ave. group size
Percent fees income -1.963 0.442 0.000 -2.832 -1.094 ***
Percent ECCE income
-2.524 0.454 0.000 -3.417 -1.631 ***
_model_constant 7.786 0.670 0.000 6.470 9.103 ***

Final Report to Department of Children & Youth Affairs: Cost of Providing Quality Childcare 94
9 Sample Cost Modelling Tool Outputs
9.1 Overview
The cost modelling tool developed for the DCYA using the data from this review is intended
as a scenario modelling support alongside other inputs to considerations of policy in relation
to childcare subsidies. We set out here some illustrative outputs from the cost modelling tool
to demonstrate the types of outputs of which it is capable in supporting policy decision-
making.
9.2 Average Unit Cost per Hour of Childcare Provision
9.2.1 Overview
The average unit cost per hour outlined below is based on the cost modelling tool outputs
from the data supplied by childcare providers. Whilst every individual provider is different and
will have a different actual cost per hour, this will be reflected in the average unit cost per
hour. The cost modelling tool does not attempt to reflect differences in operating models or
any local circumstances that may impact on cost.
The cost modelling tool provides average unit cost under a range of scenarios. These include:
Providers with designated quality standards29
Urban and rural settings
Region (based on NUTS3)
Type of childcare provided
Unit costs were calculated using filled places, hours per place per year (derived from hours
per week/day and service weeks per year), and total costs.
9.2.2 Overall Average Unit Cost per Hour
The cost modelling tool assessed the average unit cost per hour of childcare provision
as €4.14. This is averaged across all age groups, staff ratios, service types, and so on.
This average unit cost is closely aligned to comparative cost data found in other jurisdictions
(see Section 2).
9.2.3 Distribution of Unit Cost
The average unit cost per hour as outlined above arises from a range of modelled unit costs,
as illustrated in the following tables.
29 Services who have achieved Síolta QAP validation ratings or those achieving excellent scores in DES inspection
reports

Final Report to Department of Children & Youth Affairs: Cost of Providing Quality Childcare 95
All sitesOnly offer
ECCE
Does not offer
ECCE
Both ECCE
and non-ECCE
N=573 N=215 N=56 N=302
€0 to €0.5 10 0 0 10
€0.6 to €1 13 0 2 11
€1.1 to €1.5 29 2 3 24
€1.6 to €2 31 3 2 26
€2.1 to €2.5 57 8 8 41
€2.6 to €3 48 12 2 34
€3.1 to €3.5 71 24 4 43
€3.6 to €4 72 31 6 35
€4.1 to €4.5 55 33 3 19
€4.6 to €5 56 31 3 22
€5.1 to €5.5 33 19 1 13
€5.6 to €6 23 12 4 7
€6.1 to €6.5 24 15 6 3
€6.6 to €7 16 8 2 6
€7.1 to €7.5 9 6 1 2
€7.6 to €8 6 3 0 3
€8.1 to €8.5 4 2 2 0
€8.6 to €9 1 0 1 0
€9.1 to €9.5 4 2 2 0
€9.6 to €10 3 1 1 1
More than €10 8 3 3 2
Costs
All sitesOnly offer
ECCE
Does not offer
ECCE
Both ECCE
and non-ECCE
N=573 N=215 N=56 N=302
€0 to €0.5 2% 0% 0% 3%
€0.6 to €1 2% 0% 4% 4%
€1.1 to €1.5 5% 1% 5% 8%
€1.6 to €2 5% 1% 4% 9%
€2.1 to €2.5 10% 4% 14% 14%
€2.6 to €3 8% 6% 4% 11%
€3.1 to €3.5 12% 11% 7% 14%
€3.6 to €4 13% 14% 11% 12%
€4.1 to €4.5 10% 15% 5% 6%
€4.6 to €5 10% 14% 5% 7%
€5.1 to €5.5 6% 9% 2% 4%
€5.6 to €6 4% 6% 7% 2%
€6.1 to €6.5 4% 7% 11% 1%
€6.6 to €7 3% 4% 4% 2%
€7.1 to €7.5 2% 3% 2% 1%
€7.6 to €8 1% 1% 0% 1%
€8.1 to €8.5 1% 1% 4% 0%
€8.6 to €9 0% 0% 2% 0%
€9.1 to €9.5 1% 1% 4% 0%
€9.6 to €10 1% 0% 2% 0%
More than €10 1% 1% 5% 1%
Costs

Final Report to Department of Children & Youth Affairs: Cost of Providing Quality Childcare 96
9.2.4 Average Unit Cost per Hour for Services with Quality Designations
The average unit cost for providers with designated quality standards (i.e. Síolta accreditation
and/or excellent scores in DES inspections; n=18) in the cost modelling tool is €4.26
compared with €4.13 for all other providers. This is a possible indicator that providing
increased quality may have some impact on the cost.
The number of providers included in this cohort is very small (n=18), so wider conclusions
cannot be drawn nor specific cost drivers identified, but it is an interesting illustration of the
possible additional costs associated with high-quality service delivery. it is not possible to
confidently identify cost drivers for these services in any way other than by qualitatively
identifying potential candidate drivers for future research.
9.2.5 Urban Versus Rural
The average unit cost per hour in the cost modelling tool is 63 cent higher for providers
operating in urban settings versus those in rural areas. The urban rural split is based on the
CSO classification of services. The average unit cost in urban settings is €4.37 as opposed to
an average unit cost of €3.74 for those providing childcare in rural settings.
While this shows there is a difference in cost for those operating in urban and rural settings, it
does not take into account the variation in cost within these settings.
9.2.6 Regional Average Unit Costs
The average unit cost by NUTS 3 region varies from €3.07 in the Border region to €4.74 in the
West. The average unit cost for Dublin is €4.58 which is the second highest region. The
average unit cost for the West is 54% higher than that in the Border region.
The figure below illustrates the range of average unit cost across the eight NUTS 3 regions.
€ 3.07
€ 4.58 € 4.48
€ 3.32 € 3.42
€ 4.04 € 4.16
€ 4.74
€ 2.00
€ 2.25
€ 2.50
€ 2.75
€ 3.00
€ 3.25
€ 3.50
€ 3.75
€ 4.00
€ 4.25
€ 4.50
€ 4.75
€ 5.00
Border Dublin Mid-East Midlands Mid-west South East South-West West
Average unit cost by region from the cost model

Final Report to Department of Children & Youth Affairs: Cost of Providing Quality Childcare 97
9.2.7 Type of Childcare Provided
Based on the information provided, the cost modelling tool indicates that the average unit cost
is highest for those services that do not provide ECCE services. The average unit cost for
services that do not provide ECCE is €5.20; this compares to €4.91 for ECCE only providers,
and €3.39 for those that provide ECCE alongside other childcare services.
9.3 Sample Scenario Modelled: Staff-Child Ratios in School-Age Childcare
At the time of the survey, there were no regulatory requirements in respect of staff-child ratios
for school-age childcare. Since that time, a limit of 1:12 has been introduced as an upper limit
for school-age services. As an example of the scenario modelling that the cost modelling tool
can provide to DCYA, the impact on overall average unit cost from this change was explored.
Including a staff-child ratio of 1:12 for school-age childcare results in an overall average unit
cost per hour of €4.22.
9.4 Key Components of Cost within the Cost Modelling Tool
9.4.1 Overview
We examined the principal components of cost within the cost modelling tool dataset, to
identify the key cost factors within the average unit cost figures.
9.4.2 Overall Cost Breakdown
When we examine the data in the cost modelling tool from the perspective of the components
of the cost, we can see a pattern consistent with those found in other jurisdictions: a
dominance of staff costs in the make-up of the overall cost figures, as illustrated below:

Final Report to Department of Children & Youth Affairs: Cost of Providing Quality Childcare 98
*Note: 29% of these providers pay rates, ranging from 0.04% of their costs to 8.85% of their costs
At an average of 68%, the staff cost percentage as the single biggest cost component is
consistent with findings from other countries, as discussed in Section 2. Likewise, the average
cost for premises (i.e. rent or mortgage costs), at 8%, is not dissimilar to the averages in
England, Scotland, and New Zealand.
9.4.3 Cost Components: Comparison of Community and Private Providers
When we examine the cost components across a number of categories of provider, we can
see some of the differences between them. For example, a comparison of private and
community providers indicates that premises costs represent a much higher percentage of
total costs for the former, with staff costs a higher percentage in community providers, as can
be seen in the following chart:
Payroll68%
Other Employee Costs1%
Premises Costs8%
Rates1%
Insurance1%
Materials & Equipment3%
Other Premises Costs4%
Consumables3%
Professional and bank fees2%
Vehicles1%
Utilities4%
Other costs4%
Breakdown of Key Cost Components - Overall

Final Report to Department of Children & Youth Affairs: Cost of Providing Quality Childcare 99
9.4.4 Cost Components: Comparison of Urban- and Rural-Based Providers
When we compare urban and rural services, we can see there is little variation in the cost
breakdowns, with a slight increase in the premises cost component for urban-based
providers.
Payroll, 67%
Payroll, 71%
Premises Costs, 8%
Premises Costs, 6%
0% 10% 20% 30% 40% 50% 60% 70% 80% 90% 100%
Private
Community
Cost Components: Private/Community Providers
Payroll Other Employee Costs Premises Costs
Rates Insurance Materials & Equipment
Other Premises Costs Consumables Professional and bank fees
Vehicles Utilities Other costs
Payroll, 67%
Payroll, 68%
Premises Costs, 7%
Premises Costs, 8%
0% 10% 20% 30% 40% 50% 60% 70% 80% 90% 100%
Rural
Urban
Cost Components: Urban/Rural
Payroll Other Employee Costs Premises Costs
Rates Insurance Materials & Equipment
Other Premises Costs Consumables Professional and bank fees
Vehicles Utilities Other costs

Final Report to Department of Children & Youth Affairs: Cost of Providing Quality Childcare 100
9.4.5 Cost Components: Comparison by Region
Looking at the cost components by region, there are some variations in premises cost
percentages and staff cost percentages within the breakdowns, as illustrated below:
We can see that the percentage represented by staff costs is lower in some regions, generally
corresponding to a higher proportional percentage taken up by premises costs.
Payroll, 67%
Payroll, 69%
Payroll, 68%
Payroll, 66%
Payroll, 67%
Payroll, 67%
Payroll, 70%
Payroll, 64%
Premises Costs, 7%
Premises Costs, 5%
Premises Costs, 6%
Premises Costs, 8%
Premises Costs, 8%
Premises Costs, 9%
Premises Costs, 8%
Premises Costs, 7%
0% 10% 20% 30% 40% 50% 60% 70% 80% 90% 100%
West
South-West
South-East
Mid-West
Midlands
Mid-East
Dublin
Border
Cost Components: Regions
Payroll Other Employee Costs Premises Costs
Rates Insurance Materials & Equipment
Other Premises Costs Consumables Professional and bank fees
Vehicles Utilities Other costs

Final Report to Department of Children & Youth Affairs: Cost of Providing Quality Childcare 101
9.4.6 Cost Components: Comparison by Pobal Deprivation Index
Finally, in respect of the relative deprivation of the locations in which providers are operating,
we can see the cost components vary only slightly, with the proportion represented by
premises costs being slightly higher in very and extremely disadvantaged areas.
9.4.7 Comment on Cost Components
As can be seen, the cost modelling tool outputs support the evidence that the principal cost
factor across the sector as a whole and within every service type or location is staffing costs.
Whilst the proportion of total cost represented by staffing costs varies, it is at a minimum more
than two-thirds of the total cost regardless of different provider types, locations, and so on.
Premises costs are typically the next most significant cost component; however, in line with
international examples, this represents a fraction of the staffing costs.
Payroll, 67%
Payroll, 70%
Payroll, 68%
Payroll, 68%
Payroll, 67%
Premises Costs, 11%
Premises Costs, 7%
Premises Costs, 7%
Premises Costs, 8%
Premises Costs, 9%
0% 10% 20% 30% 40% 50% 60% 70% 80% 90% 100%
Very/Extremely Disadvantaged
Disadvantaged
Marginally below average
Marginally above average
Affluent
Cost Components: Pobal Deprivation Index
Payroll Other Employee Costs Premises Costs
Rates Insurance Materials & Equipment
Other Premises Costs Consumables Professional and bank fees
Vehicles Utilities Other costs

Final Report to Department of Children & Youth Affairs: Cost of Providing Quality Childcare 102
Conclusions

Final Report to Department of Children & Youth Affairs: Cost of Providing Quality Childcare 103
10 Concluding Comments
10.1 Project Learnings
This review has attempted to gather and analyse data in relation to the costs of the provision
of quality childcare in Ireland. It has engaged with the sector, reviewed documentation and
literature, conducted primary research, and used the data collected to produce findings in
respect of cost factors and drivers in the delivery of childcare services.
The challenges faced over the course of this review are useful to reflect on in terms of
learning for future reviews of this nature and/or other approaches to establishing and
analysing the cost of childcare provision. Some of these include:
The challenges in collecting accurate and comprehensive cost data from providers.
This has a number of associated issues, including the extent to which services
themselves are accurately and regularly capturing, recording, and analysing their costs;
the most appropriate and effective mechanisms for cost data to be provided for the
purposes of policymaking; the commercial sensitivities for private providers; and the
extent to which the Department may wish to consider what data could be required to be
reported on a regular basis as a condition of statutory funding schemes.
The willingness and capacity of providers to respond to this review’s detailed cost
survey. The response rate to this survey was significantly lower than that for Pobal’s
Early Years Sector Profile, which, although not seeking the same data, is nonetheless a
substantial survey and yet achieves high response rates (19% versus 85%). The DCYA
may wish consider how future approaches to collecting cost data can improve the
response rates.
The accuracy and completeness of the data provided. Survey responses included
issues such as respondents who failed to complete parts of the survey, interpreted
questions incorrectly, and made errors in data entry. Whilst the approach to the
development of the cost modelling tool was designed to mitigate these issues, future
reviews will need to consider how best to ensure that the data provided is accurate and
complete, in recognition that to provide such data may be burdensome on providers.

Final Report to Department of Children & Youth Affairs: Cost of Providing Quality Childcare 104
10.2 Key Findings
10.2.1 Childcare Provider Survey Findings
The survey responses were analysed and key descriptive outputs are set out in the report.
This material is intended to provide context for the dataset used for the regression analysis
and the development and operation of the cost modelling tool, to enable comparison with
other sector profile data for validation, and to add to the body of knowledge in relation to the
operation of childcare services in Ireland.
10.2.2 Regression Outputs
Some of the highlighted findings from the regression analysis include the following:
Size played a key role in the variation in unit cost, with large services cheaper than
smaller services.
Some other observed efficiencies included occupancy and the age of children in the
service.
Non-contact hours acted as an inefficiency as these are hours which are not available
for greater room capacity.
It was not possible to explore the relationship between costs and objective measures of
quality using the quality indicator available due to a low number of services in the
dataset with this designation.
There appeared to be cost savings for particular entity and premises types, and this
may be due to differences in overheads.
Service characteristics play a clear role in driving variation in unit cost.
Unit cost was higher in services with higher capitation.
Services that opened all year appeared to have a lower unit cost than those that did
not.
Urban services appeared to be more expensive than those in rural areas.
Future work could look at whether groups of different service types are capable of being
identified with clear shared characteristics. The differences in unit costs between these
groups (taking into account combinations of characteristics at once) could then be estimated.
10.2.3 Sample Cost Modelling Tool Outputs
The cost modelling tool developed for the DCYA using the data from this review is intended
as a scenario modelling support alongside other inputs to considerations of policy in relation
to childcare subsidies. The report sets out a small sample of outputs from the cost modelling
tool.
The cost modelling tool assessed the average unit cost per hour of childcare provision as
€4.14. This is averaged across all age groups, staff ratios, service types, and so on.

Final Report to Department of Children & Youth Affairs: Cost of Providing Quality Childcare 105
10.3 Next Steps
These findings should be useful to the DCYA in the consideration of future policy decisions in
respect of childcare subsidy rates.
The capacity to examine further the impact of different cost drivers and scenarios within the
cost modelling tool will further support the DCYA in policy formation. As outlined previously,
the cost modelling tool is intended for use in the support of policymaking, and is not a
decision-making process in its own right. It is most useful in the assessment of the impact of
change across the modelled scenarios given the complexity of the many intersecting variables
for any individual provider, service, or child.
Over time the cost modelling tool will need to be updated to reflect changes in costs through
normal inflationary pressures or as a result of policy changes. These policy changes may be
reflective of sector-specific initiatives but may also encompass wider governmental decisions
that may impact on the cost base of providers. The frequency of updates should reflect policy
changes. Considering the relationship between the timing of policy changes and cost
modelling tool updates will ensure that any impacts are fully reflected.
This review has provided some key findings and useful learning for future considerations of
childcare provider costs. Whilst there have been challenges within the process, the outputs
from the review will be supportive of childcare subsidy policymaking for the DCYA into the
future.

Final Report to Department of Children & Youth Affairs: Cost of Providing Quality Childcare 106
References Arnold, J., 2013. Income, Expenditure and Fees of Early Childhood Education Providers, Wellington,
NZ: New Zealand Ministry of Education.
Bertram, T. & Pascal, C., 2016. Early Childhood Policies and Systems in Eight Countries, s.l.:
International Association for the Evaluation of Education Achievement.
Blainey, S. & Paull, G., 2017. Study of Early Education and Development: Cost and Funding, London:
Department for Education.
Brind, R., Norden, O. & Oseman, D., 2012. Childcare Provider Finances Survey, London: Department
for Education.
Campbell-Barr, V., 2009. Care and business orientations in the delivery of childcare. Journal of early
childhood research, 7(1), pp. 76-93.
Cattoretti, G., Paull, G. & Marshall, L., 2019. Providers’ finances: Evidence from the Survey of
Childcare and Early Years Providers 2018, London: Department for Education.
Cleveland, G. & Krashinsky, M., 2004. Financing early learning and child care in Canada, s.l.:
Canadian Council on Social Development.
Davidson, B., 2009. For-profit organisations in managed markets for human services. In: D. King & G.
Meagher, eds. Paid care in Australia: politics, profits, practices. Sydney: Sydney University
Press, pp. 43-79.
DCYA, 2019. Draft Childminding Action Plan, Dublin: Department of Children & Youth Affairs.
Department for Education, 2015. Review of Childcare Costs: the Analytical Report, London:
Department for Education.
Doherty, G., 2014. Quality in Family Child Care: A Focus Group Study with Canadian Providers. Early
Childhood Education Journal, Volume 43, pp. 157-167.
Gorry, D. & Thomas, D. W., 2017. Regulation and the cost of childcare. Applied Economics, 49(41),
pp. 4138-4147.
Himmelweit, J. M., Coote, A. & Hough, J., 2014. The Value of Childcare: Quality, Cost and Time,
London: New Economics Foundation.
Martin, C., Ormston, R. & Zubairi, S., 2016. Costs and Early Learning and Childcare Provision in
Partner Provider Settings (Technical Report), Edinburgh, Scotland: Children, Education and
Skills.
Martin, C., Ormston, R. & Zubairi, S., 2016. Costs and Early Learning and Childcare Provision in
Partner Provider Settings (Technical Report), Edinburgh, Scotland: Children, Educaiton and
Skills.
McGinnity, F., Murray, A. & McNally, S., 2013. Growing Up in Ireland: Mothers’ Return to Work and
Childcare Choices for Infants in Ireland, Dublin: Department of Children & Youth Affairs.
Parker, I., 2013. Early Developments: Bridging the Gap between Evidence and Policy in Early-Years
Education, London: Institute for Public Policy Research.
Paull, G. & La Valle, I., 2018. Evaluation of the first year of the national rollout of 30 hours free
childcare, London: Department for Education.
Paull, G. & Xu, X., 2019. Early years providers cost study 2018, London: Department for Education.

Final Report to Department of Children & Youth Affairs: Cost of Providing Quality Childcare 107
Penn, H., 2014. The business of childcare in Europe. European Early Childhood Education Research
Journal, 22(4), pp. 432-456.
Penn, H. & Lloyd, E., 2013. The Costs of Childcare, London: Childhood Wellbeing Research Centre.
Rentzou, K., 2017. Using rating scales to evaluate quality early childhood education and care:
reliability issues. European Early Childhood Education Research Journal, 25(5), pp. 667-681.

Final Report to Department of Children & Youth Affairs: Cost of Providing Quality Childcare 108
Appendix 1: Survey Questionnaire

Final Report to Department of Children & Youth Affairs: Cost of Providing Quality Childcare 109
DCYA Review of the Cost of Quality Childcare Provision
Welcome to the survey of childcare and early years service providers being undertaken by Crowe
Horwath on behalf of the Department of Children and Youth Affairs. Please be assured that all
individual survey responses will remain confidential to Crowe Horwath and only collated, anonymised
data stripped of identifying fields will be passed to the Department. The data will not be used by
Crowe Horwath for any other purpose.
This survey is intended to gather a large body of comprehensive data on the cost of providing quality
childcare and early years services in Ireland. Its purpose is to provide data to the Department in
relation to the cost of provision in order to inform the Early Childhood Care and Education Scheme,
the Affordable Childcare Scheme, and other statutory supports in relation to childcare and early years
services. The accuracy and level of detail provided within this survey will be critical to fully inform
future policy.
The survey is presented in groups of questions. You can move back and forth between survey pages
using the appropriate buttons at the bottom of each question group. Questions comprise a mix of
response formats. You can leave the survey by clicking on the “Resume Later” button at the bottom of
each page. This saves your responses and allows you to return to the survey using your link with your
previous answers intact. You can access the survey on different computers / laptops by using the link
issued. Only one user can access the survey at a time. Your link is individual to this service provider
site and ensures your survey is private. Providers with more than one site will be required to complete
separate survey returns for each site.
This survey requires detailed information in respect of premises and staff, along with summary
financial data on income and expenditure. Much of the information is similar to that required for the
Pobal annual Early Years Sector Profile survey. After completing this survey, you will be able to print
(or save as PDF) the answers you have provided, which may be helpful when completing the Pobal
survey at a later date. It will be helpful to have financial accounts and personnel details to hand when
completing this survey.
Should you have any queries or difficulties in accessing or using this survey, please contact Vanya
Sargent ([email protected]) or Katelynne Pilcic ([email protected]).

Final Report to Department of Children & Youth Affairs: Cost of Providing Quality Childcare 110
Section 1: Profile
Please confirm that your DCYA reference for this site is {TOKEN}.
PLEASE NOTE: We are using the DCYA reference number as a unique identifier to enable us to
combine this survey response with existing data held by the Department and Pobal. We will, however,
not be sharing any details with the Department or Pobal in respect of any individual survey response
or linking any response data to DCYA reference numbers in our reporting and analysis to the
Department. All DCYA reference numbers, provider names, and contact data will be removed from
the datasets before issuing any collated data to the Department.
o DCYA reference is correct
o DCYA reference is incorrect
If you have any queries or concerns in relation to this, please do not hesitate to contact us on 01 448
2200.
If this reference is incorrect, please DO NOT PROCEED with the survey at this time. Please contact
Vanya Sargent at [email protected] or 01 448 2200 to ensure you have the correct
survey link before answering any questions.
What type of legal entity describes the service provider?
o Company limited by shares
o Company limited by guarantee
o Partnership
o Sole trader
o Other
If other, please give details.
_________________________________________
What year was this service established?
_________________________________________
Is this service part of a chain or multiple-site provider that has a central or head-office
function?
o Yes
o No
If yes, how are head office costs apportioned or allocated? Please give details.
_________________________________________

Final Report to Department of Children & Youth Affairs: Cost of Providing Quality Childcare 111
Please indicate the type of premises in which the service is provided.
o Commercial building owned by service provider
o Domestic building owned by service provider
o Premises with a commercial lease
o Premises with a non-commercial lease (e.g. from community or statutory organisation)
o Premises without formal lease arrangement
If leased, how long was the lease originally for and how long remains on the lease (in years)?
Length of original lease: ______________ years
Remaining time on lease: ______________ years
If owned, is the title freehold or leasehold?
o Freehold
o Leasehold
If leasehold, how long is the leasehold for?
______________ years
If owned, is there a mortgage on the property?
o Commercial mortgage
o Domestic mortgage
o Other mortgage
o No mortgage
How long is left on this mortgage?
______________ years
Is there any other secured lending on the property?
o Yes
o No
If so, how much time remains on the secured lending?
______________ years

Final Report to Department of Children & Youth Affairs: Cost of Providing Quality Childcare 112
If owned, was grant aid availed of for building, extending, or renovating the premises? Please
tick all that apply.
Grant aid for building premises
Grant aid for extending premises
Grant aid for renovating premises
Please indicate the total amount of any grant aid availed of for building these premises.
€_____________
Please indicate the total amount of any grant aid availed of for renovating these premises.
€_____________
Please indicate the total amount of any grant aid availed of for extending these premises.
€_____________
If the premises are leased, where are they based?
o Premises solely for the service
o School
o Employer’s premises
o Family Resource Centre
o Community centre
o Other community or voluntary agency premises
o Other organisation premises
If Other community or voluntary agency premises, please give details:
_________________________________________
If Other organisation premises, please give details.
_________________________________________
What is the overall size of the premises being used for the service, in terms of indoor floor
area (in square metres)?
______________ m2

Final Report to Department of Children & Youth Affairs: Cost of Providing Quality Childcare 113
Section 2: Services
What services are provided in this location? Please tick all that apply.
Full-day care
Sessional services - morning
Sessional services - afternoon
Breakfast club
After-school care
Part-time care
Drop-in/occasional care
Out-of-term care for school-age children
Other childcare/early education services
Services other than childcare/early education services
If other childcare/early education services are provided, please give details of these.
_________________________________________
If services other than childcare/early education services are provided, please give details.
_________________________________________
Please give details of the number of places available, number of places filled, and hours
available per day for full-day care.
Number of places available for full-day care per week __________
Number of places filled for full-day care per week __________
Maximum number of hours per day per child for full-day care __________
Please give details of the number of places available, places filled, and hours available for
sessional early education services (ECCE and non-ECCE).
Mornings Afternoons
Number of places available for ECCE sessional services __________ __________
Number of places filled for ECCE sessional services __________ __________
Hours available per day for ECCE sessional services __________ __________
Number of places available for non-ECCE sessional services __________ __________
Number of places filled for non-ECCE sessional services __________ __________
Hours available per day for non-ECCE sessional services __________ __________

Final Report to Department of Children & Youth Affairs: Cost of Providing Quality Childcare 114
Please give details of the number of places available, number of places filled, and hours
available per day for breakfast club services.
Number of places available for breakfast club per week __________
Number of places filled for breakfast club per week __________
Maximum number of hours per day per child for breakfast club __________
Please give details of the number of places available, number of places filled, and hours
available per day for afterschool care.
Number of places available for afterschool care per week __________
Number of places filled for afterschool care per week __________
Maximum number of hours per day per child for afterschool care __________
Please give details of the number of places available, number of places filled, and maximum
hours per week for part-time care.
Number of places available for part-time care per week __________
Number of places filled for part-time care per week __________
Maximum number of hours per week per child for part-time care __________
Please give details of the average number of places available, average number of places filled,
and average hours available per week for drop-in/occasional care.
Average number of places available for drop-in/occasional care per week __________
Average number of places filled for drop-in/occasional care per week __________
Average number of hours per week per child for drop-in/occasional care __________
Please give details of the number of places available, number of places filled, and weeks
available per year for out-of-term care for school-age children.
Number of places available for out-of-term care __________
Number of places filled for out-of-term care __________
Number of weeks per year available for out-of-term care __________
Is there a waiting list for any of the services provided?
o Yes
o No

Final Report to Department of Children & Youth Affairs: Cost of Providing Quality Childcare 115
If yes, please give details on the number awaiting places in any of the services that have
waiting lists.
Full-day care __________
Sessional services – morning __________
Sessional services – afternoon __________
Breakfast club __________
After-school care __________
Part-time care __________
Drop-in/occasional care __________
Out-of-term care for school-age children __________
Are there plans to change the capacity of the service?
o Plan to increase capacity/number of places available
o Plan to decrease capacity/number of places available
o No plan to change capacity

Final Report to Department of Children & Youth Affairs: Cost of Providing Quality Childcare 116
Section 3: Rooms
This section asks for information on the size and use of each room used in the service for the care
and education of children. We are seeking this information to be able to assess the current capacity in
the sector and the potential for expansion.
How many rooms are available, and how many are in use, for the provision of childcare and/or
early education services? For each of the rooms in use, you will be asked a series of
questions.
If you have more than 8 rooms at this location used for providing childcare and/or early education
services, please contact us at [email protected] or 01 448 2200.
__________ rooms available
__________ rooms in use
Room 1
What size is the room?
__________ m2
How many children are currently occupying this room, and how many staff? Please give
numbers as relevant for each age group and the number of staff based in this room for both
mornings and afternoons for each day of the week.
Children
under 12
months of
age
Children
between 12
months and
23 months
of age
Children
between 24
and 35
months of
age
Preschool
children
between 3
and 5 years
of age
School-age
children
Number of
staff
Monday morning
Monday afternoon
Tuesday morning
Tuesday afternoon
Wednesday morning
Wednesday
afternoon
Thursday morning
Thursday afternoon
Friday morning
Friday afternoon

Final Report to Department of Children & Youth Affairs: Cost of Providing Quality Childcare 117
Are there sanitary facilities available within this room?
o Yes
o No

Final Report to Department of Children & Youth Affairs: Cost of Providing Quality Childcare 118
Section 4: Management
How many managers work in this service (at this location)? A series of questions for each
manager will appear when you enter the number in question.
__________
Manager 1
Please indicate what type of manager role this person holds.
o Owner-manager (owner-operator)
o Manager employed by service
Is this manager paid an hourly wage or an annual salary?
o Hourly wage
o Annual salary
o Other (e.g. drawing non-fixed income from business)
Please give details of the hourly wage for this manager.
€ __________ per hour
Please give details of the annual salary for this manager.
€ __________ per year
Please give details of the estimated annual income of the manager from the business.
€ __________ per year
Does this manager have any additional benefits as part of their remuneration? Please tick all
that apply.
Employer pension contributions
Paid sick leave
Additional annual leave days (above statutory)
Maternity pay (top-up)
Health insurance policy
Discount on childcare/early education
Other benefits
If there are other benefits, please give details.
_________________________________________

Final Report to Department of Children & Youth Affairs: Cost of Providing Quality Childcare 119
How many hours per week does this manager work?
Contact hours (i.e. delivering childcare/early education to children) __________
Non-contact hours __________
How many weeks per year are paid for this manager (including holidays and other leave
entitlements)?
__________ weeks per year
What childcare/early education qualifications, if any, does this manager hold?
o Lower than Level 5
o Level 5
o Level 6
o Level 7
o Level 8
o Level 9/10
o Don't know
o Not applicable: manager does not work directly with children
Does this manager hold any relevant non-childcare/early education qualifications (e.g.
management, business, financial, HR, etc.)?
o Yes
o No
If yes, please give details of the relevant qualifications.
_________________________________________
How many years' experience do they have?
o Less than 3 years
o 3-5 years
o 6-10 years
o More than 10 years
o Don't know

Final Report to Department of Children & Youth Affairs: Cost of Providing Quality Childcare 120
Section 5: Childcare Staff
This section asks details for each individual staff member working directly with children in the
service (other than managers), including hourly pay rates, hours worked, qualifications, and
experience. We will use this information to assess the current rates of pay and other terms of
employment in the sector and to consider how these might be impacted by increasing levels of
qualification and experience and by changes in the levels of support provided through
statutory schemes.
How many staff work directly with children in this service?
(Please note: if there are more than 35 staff who work directly with children in this service,
please contact us by emailing [email protected].) When you enter the number of staff,
a series of questions for each of the staff members will appear below.
No. of staff working with children __________
Please include the total number of individual staff members rather than the whole-time equivalent.
Staff Member 1
What position does this staff member have in this service?
o ECCE room leader
o Non-ECCE room leader
o Childcare/early education assistants
o Aim Level 7 Support staff
o Childcare/early years work placement staff
o Other childcare/early years staff
If other childcare/early years staff, please give details.
_________________________________________
Is this staff member paid an hourly wage or an annual salary?
o Hourly wage
o Annual salary
o Not applicable (e.g. work placement)
Please give details of the hourly wage for this staff member.
€ __________ per hour
Please give details of the annual salary for this staff member.
€ __________ per year

Final Report to Department of Children & Youth Affairs: Cost of Providing Quality Childcare 121
Does this staff member have any additional benefits as part of their remuneration? Please tick
all that apply.
Employer pension contributions
Paid sick leave
Additional annual leave days (above statutory)
Maternity pay (top-up)
Health insurance policy
Discount on childcare/early education
Other benefits
If there are other benefits, please give details.
_________________________________________
How many hours per week does this person work?
Contact hours (i.e. delivering childcare/early education to children) __________
Non-contact hours __________
How many weeks per year are paid for this staff member (including holidays and other leave
entitlements)?
__________weeks per year
What childcare/early education qualification(s) does this staff member have?
o Lower than Level 5
o Level 5
o Level 6
o Level 7
o Level 8
o Level 9/10
o Don't know
How many years' experience do they have?
o Less than 3 years
o 3-5 years
o 6-10 years
o More than 10 years
o Don't know

Final Report to Department of Children & Youth Affairs: Cost of Providing Quality Childcare 122
Section 6: Ancillary Staff
How many ancillary staff, that is, staff that do not work directly with children, work in this
service?
No. of ancillary staff __________
Ancillary staff member 1
What role does this person have in the service?
o Administration
o Cleaning/maintenance/janitorial
o Food preparation
o Community employment scheme
o Tús placement
o Rural Social Scheme placement
o Other non-childcare work placement
o Other non-childcare role
If other, please give details.
_________________________________________
Is this staff member paid an hourly wage or an annual salary?
o Hourly wage
o Annual salary
o Not applicable (e.g. work placement)
Please give details of the hourly wage for this staff member.
€ __________ per hour
Please give details of the annual salary for this staff member.
€ __________ per year

Final Report to Department of Children & Youth Affairs: Cost of Providing Quality Childcare 123
Does this staff member have any additional benefits as part of their remuneration? Please tick
all that apply.
Employer pension contributions
Paid sick leave
Additional annual leave days (above statutory)
Maternity pay (top-up)
Health insurance policy
Discount on childcare/early education
Other benefits
If there are other benefits, please give details.
_________________________________________
How many hours per week does this staff member work?
__________ hours/week
How many weeks per year are paid for this staff member (including holidays and other leave
entitlements)?
__________ weeks per year

Final Report to Department of Children & Youth Affairs: Cost of Providing Quality Childcare 124
Section 7: Staff Development
Is CPD mandatory for employees?
o Yes – for all employees
o Yes – only for those who work directly with children
o No
What continuing professional development (CPD) do staff undertake?
_________________________________________
Who pays for staff CPD activities? Please tick all that apply.
Employer pays for all CPD
Employer part-pays for CPD
Staff member pays for all CPD
Staff member part-pays for CPD
CPD is fully funded by DCYA
CPD is part-funded by DCYA
Other
If Other, please give details.
_________________________________________
Is leave available to staff for CPD activities?
o Paid leave is available for CPD
o Unpaid leave is available for CPD
o Paid overtime is available for CPD
o CPD is undertaken outside work hours only
Is there a plan to change the staffing resources over the coming year?
Number of staff
Hours for existing
staff
Plan to increase in the coming 12 months
Plan to decrease in the coming 12 months
No change in the coming 12 months

Final Report to Department of Children & Youth Affairs: Cost of Providing Quality Childcare 125
How many staff left the service within the past 12 months, how many joined, and how many
current vacancies do you have, if any?
Number of staff who left within past 12 months __________
Number of staff who joined within past 12 months __________
Number of current vacancies __________
If you have vacancies, for what roles?
_________________________________________
What are your key concerns in respect of recruiting, retaining, developing, and maximising the
skills of appropriately qualified and experienced employees? Please tick all that apply.
Difficulty of attracting suitably qualified and experienced childcare/early years staff
Capacity to offer attractive wage/salary levels
Capacity to offer attractive additional staff benefits
Difficulty attracting staff with appropriate language competency
Competition from other childcare/early years providers
Competition from other sectors
Capacity to fund staff training or development
Capacity to facilitate leave for staff training and development
Other concerns
If you have other issues or concerns in relation to attracting, recruiting, retaining, or
developing staff, please give details here.
_________________________________________

Final Report to Department of Children & Youth Affairs: Cost of Providing Quality Childcare 126
Section 8: Fees
Please give details of the fees charged to parents for each service provided.
Age <12
months
Age 12-23
months
Age 24-35
months
Age 3-5
(preschool)
Full-time care per week €_________ €_________ €_________ €_________
Part-time care per week €_________ €_________ €_________ €_________
Non-ECCE sessional care per week €_________ €_________ €_________ €_________
Drop-in/occasional care per hour €_________ €_________ €_________ €_________
Please give details of the fees for school-age care services, where relevant.
School-age
children
Breakfast club per week €_________
After-school care per week €_________
Drop-in/occasional care per hour €_________
Do you offer a sibling discount?
o Yes
o No
If so, how much is the discount?
Discount for second child _________
Discount for third child __________
Discount for fourth child or more __________

Final Report to Department of Children & Youth Affairs: Cost of Providing Quality Childcare 127
Is food provided within the service?
Food is provided and
included within the
fees
Food is provided at
an extra cost to
parents
Food is not provided
Full-day care
Sessional services –
morning
Sessional services –
afternoon
Breakfast club
After-school care
Part-time care
Drop-in/occasional
care
Out-of-term care for
school-age children
If there is an additional charge for food provision, how much is this per child per week?
€_________
Is transport provided for school-age children to drop to and collect from school?
o Transport is provided and included within the fees
o Transport is provided at an extra cost to parents
o Transport is not provided
If there is a charge for transport in addition to the fee for school-age childcare, how much is
this per week per child?
€_________
Are there additional optional services offered to families availing of ECCE only?
o Yes
o No
If so, please give details and costs for these.
_________________________________________

Final Report to Department of Children & Youth Affairs: Cost of Providing Quality Childcare 128
Section 9: Financial Data
This section looks for summary financial data on income and in particular costs, as this is critical
information for the development of a robust dataset on the real cost of providing childcare and early
years services. As with all the data collected within this survey, the individual financial data provided
here will not be reported to the Department or to Pobal but will be used to develop a collated and
anonymised dataset and cost modelling tool.
Please enter summary financial data relating to the last complete financial year for the childcare
and/or early education services provided at this site.
If the service operates on more than one site, please enter the financial data for each site in separate
survey responses.
Please ensure to include costs only for the childcare/early years service and not for any other services
provided at the same site where relevant. This may involve allocating a portion of the site costs to the
childcare/early years service.
Amounts should be rounded to the nearest euro.
INCOME / REVENUE
Income from fees charged to parents €
ECCE payments €
Payments from other schemes (CCS, etc.) €
AIM €
Programme Support Payment €
Other income €
If you have "other income", please give details of the source of this.
_________________________________________
Please give details of the following in relation to deposits:
Total value of deposits received within the last full financial year €
Total value of deposits returned to parents within the last full financial year €
Total value of deposits currently held €

Final Report to Department of Children & Youth Affairs: Cost of Providing Quality Childcare 129
Are deposits held in a separate account?
o Yes
o No
COSTS
Wages/salaries €
Employer's PRSI €
Employer's pension contributions €
Training costs €
Rent €
Mortgage €
Rates €
Insurance Materials & equipment €
Premises maintenance & repairs €
Depreciation €
Food preparation/provision €
Cleaning & cleaning materials €
Bank charges €
Accounting & legal fees €
Outsourced services €
Vehicle tax & insurance €
Vehicle running costs (fuel & maintenance/ repairs) €
Light & heat €
Water rates €
Telephone €
Broadband/internet €
Waste disposal €
Office stationery and supplies €
Computer & printer maintenance €

Final Report to Department of Children & Youth Affairs: Cost of Providing Quality Childcare 130
Bad debt write-offs €
Subscriptions & membership fees €
Advertising €
Recruitment €
Head office apportioned costs (where relevant) €
Other costs €

Final Report to Department of Children & Youth Affairs: Cost of Providing Quality Childcare 131
Section 10: Opinion
If you have any comment in relation to the cost of providing childcare and/or early education
services, please include it here.

Final Report to Department of Children & Youth Affairs: Cost of Providing Quality Childcare 132
Appendix 2: Detail on Data Cleaning

Final Report to Department of Children & Youth Affairs: Cost of Providing Quality Childcare 133
Data Cleaning Detailed Count
The table below shows a more detailed count of the corrections made, both by number of data points and at a service level. It also shows the count both
by those services ultimately included in the research (573 services), and for all services.
Services with
correction type Data points corrected
Correction theme Context / correction made
Changed data used
in unit cost
calculation
All
responses
Services
included
in final
573
All
responses
Services
included
in final
573
Edit number of staff in
room where none have
been entered and children
are in the room (predicted
values)
There were many cases where data had been entered
to indicate there were children is a room, but no staff
were indicated to be present. In these cases a predicted
value based on other services was used to calculate a
likely figure.
N 202 142 202 142
Filled places greater than
available places
Addressing misinterpretation of "available places" where
responses took "available" to be spaces not filled. Y 140 85 170 101
Missing available places
replaced with filled
Addressing misinterpretation of "available places" where
respondents seem to understand available as spaces
not filled.
Y 119 79 190 118
Edit zero employee weeks
to median
Where the employee weeks value appeared to have
been missed, this was set to the median value Y 115 48 115 48
Edit zero manager weeks
to median
Where the manager weeks field appeared to have been
missed in the data completion, this was corrected to the
median.
Y 87 45 87 45
Edit zero ECCE session
hours to median
Where the ECCE session hours value appeared to have
been missed, the median value was entered. Y 59 40 68 45
Missing filled places Where the filled places field was not provided, this was
replaced with an imputed value. Y 56 33 56 33

Final Report to Department of Children & Youth Affairs: Cost of Providing Quality Childcare 134
Services with
correction type Data points corrected
Correction theme Context / correction made
Changed data used
in unit cost
calculation
All
responses
Services
included
in final
573
All
responses
Services
included
in final
573
Edit high after school hour
values to median
There appeared to be confusion amongst some
respondents as to how After School club hours should
be entered, as there were some values between 6 and
20, when it was meant to be per day. Excessively high
outliers were changed to the median.
Y 35 20 35 20
Edit high ECCE session
hours to median
ECCE session length should be 3 and whilst some
variation was considered reasonable, some values
varied considerably with some as high as 300.
Excessively high values were set to the median.
Y 28 19 33 21
Edit high non-ECCE
session hours to median
All provision hours are included in the calculations.
Some respondents put in daily hours here rather than
sessional hours (e.g. 8 to 10, though max was 30)
These were edited to be set to the median.
Y 30 18 38 23
Edit zero ancillary staff
weeks to median
Where the ancillary staff weeks field appeared to have
been missed, this was corrected to the median N 33 18 33 18
Edit zero non-ECCE
session hours to median
Where the non-ECCE session hours value appeared to
have been missed, the median value was entered. Y 21 16 23 18
Edit high out-of-term weeks
values to median
It appears that this is a misinterpretation of the question
about care for school children during holidays. Outliers
were corrected to the median.
Y 15 12 15 12
Move manager wage value
to correct column (was in
salary column)
Moved the manager hourly wage into the correct field
when this appeared to have been entered in the salary Y 13 11 13 11
Edit zero employee hours
to median
Where the employee hours value appeared to have
been missed, this was set to the median value Y 23 11 46 22

Final Report to Department of Children & Youth Affairs: Cost of Providing Quality Childcare 135
Services with
correction type Data points corrected
Correction theme Context / correction made
Changed data used
in unit cost
calculation
All
responses
Services
included
in final
573
All
responses
Services
included
in final
573
Where employee salary per
hour is very high edit low
weeks values (multiply by
10)
In some instances, the employee salary per hour
appeared to be very high. In these cases the number of
weeks also appeared to be low and therefore the low
weeks values were multiplied by a factor of 10.
11 7 13 9
Edit high part time hours to
median
In these cases, the hours had usually been entered as
all week (40 to 50 hours, i.e. full-time not part-time with
values for included data ranging from 40 to 187) These
were changed to the median.
Y 7 6 7 6
Edit per week breakfast
club hour values to per day
These seemed to be entered as weekly hours when the
survey asked for daily hours and were divided by 5. Y 6 5 6 5
Edit very high employee
hours to median
Several employs were recorded as having excessively
high weekly hours. For example, one individual was
recorded as working 40,000 hours per week. In these
cases, the value was set to the median. In all but 2 of
the data point changed, the number of hours stated as
being worked per week, was more hours than there are
in a week.
Y 7 5 9 6
Edit zero employee wages
to median
Where the employee wages value appeared to have
been missed, this was set to the median value Y 16 5 16 5
Where employee salary is
missing, calculate from
median salary per hour
Where the employee salary field appears to have been
missed, this was replaced with the median. 13 5 13 5
Edit zero ancillary staff
hours to median
Where the ancillary staff hours field appeared to have
been missed, this was corrected to the median N 10 5 10 5

Final Report to Department of Children & Youth Affairs: Cost of Providing Quality Childcare 136
Services with
correction type Data points corrected
Correction theme Context / correction made
Changed data used
in unit cost
calculation
All
responses
Services
included
in final
573
All
responses
Services
included
in final
573
Edit zero out-of-term weeks
values to median
It appears that this is a misinterpretation of the question
about care for school children during holidays. Where
zero was entered, this was corrected to the median.
Y 5 4 5 4
Edit number of staff in
room where typo (trailing
character removed)
This primarily relates to several data points which
appeared to be excessively high and likely typos, with
an extra digit added at the end. E.g. several with 11, 22
or 33. These were corrected to 1, 2, and 3 respectively.
Trailing characters were removed.
N 8 4 9 5
Edit zero manager salary to
median
Where the manager salary value appeared to have
been missed, this was set to the median value Y 13 4 13 4
Edit employee hours
satisficing (divide by two)
Corrected where the employee hours figure appeared
high and the contact and non-contact hours were the
same and were therefore thought to be duplicated.
Y 6 4 6 4
Move employee wage from
salary column to wage
column
Where respondents appeared to have entered the
employees wage in the salary column, this was moved
to the correct field.
Y 11 4 15 8
Change employee 'salary
type' from salary to wage
where value has been
moved
In several cases, it appeared that in the data entry the
respondent had indicated they were entering a wage but
had entered a figure which appeared to be a wage as it
was very low to be a salary. The salary type was
changed.
Y 11 4 11 4
Edit high full time hours to
median
This edit was required as people appeared to have
entered full-time hours in a week, when the survey
asked for hours per day. Values were set to the median.
Y 5 3 5 3

Final Report to Department of Children & Youth Affairs: Cost of Providing Quality Childcare 137
Services with
correction type Data points corrected
Correction theme Context / correction made
Changed data used
in unit cost
calculation
All
responses
Services
included
in final
573
All
responses
Services
included
in final
573
Edit zero manager hours to
median
Where the manager hours field appeared to have been
missed in the data completion, this was corrected to the
median.
Y 10 3 20 6
Edit zero ancillary staff
salary value to one
calculated from median
salary per hour
Where the ancillary staff salary value appeared to have
been missed, this was calculated from the average
value
5 3 5 3
Edit casual care hours with
a typo zero (divide by 10)
In two instances where the casual care hours appeared
excessively high, these have been divided by ten to
correct a typo.
Y 2 2 2 2
Edit zero part time hours to
median
Where the part time hours value appeared to have been
missed, the median value was entered. Y 4 2 4 2
Edit number of staff in
room where typo (multiply
decimal by 10)
There were also 2 data points where the value was
entered as a decimal which were corrected by
multiplying the value by 10.
N 2 2 2 2
Edit manager salary typo
(divide by 10)
It appeared that there had been a typo which made the
value misaligned with other data by approximately a
value of 10. The existing values were divided by 10 to
correct.
Y 2 2 2 2
Edit zero manager wage to
median
Where the manager wage value appeared to have been
missed, this was set to the median value Y 5 2 5 2
Edit very high employee
salaries due to type (divide
by 10)
Several excessively high employee salaries which
appeared to be outliers were removed. Y 3 2 3 2

Final Report to Department of Children & Youth Affairs: Cost of Providing Quality Childcare 138
Services with
correction type Data points corrected
Correction theme Context / correction made
Changed data used
in unit cost
calculation
All
responses
Services
included
in final
573
All
responses
Services
included
in final
573
Edit zero ancillary staff
wage value to median
Where the ancillary staff average wage value appeared
to have been missed, this was corrected to the median N 7 2 7 2
Where ancillary salary per
hour is very high edit low
weeks values (multiply by
10)
Where ancillary staff were showing as working 4 weeks
per year leading to excessively high hourly pay, the
weeks were corrected to 40.
N 2 2 2 2
Edit zero breakfast club
hours to median
Where the breakfast club hours value appeared to have
been missed, the median value was entered. Y 1 1 1 1
Edit zero full time hours to
median
Where the full time hours value appeared to have been
missed, the median value was entered. Y 3 1 3 1
Edit children in room typo
(trailing characters
removed)
Edits made to specific data points where these
appeared to be excessively large and likely typos. E.g.
111 was corrected to 11, 1010 to 10.
N 3 1 3 1
Edit rooms data where
respondent satisficed
(duplicate entries)
This change relates to where rather than put the
children in the correct boxes by age, the respondent put
the total number of children in all of the boxes.
N 1 1 3 3
Edit manager hours typo
(trailing character removed)
One record showed a manager with an outlier in hourly
wage paid. This was thought to be a typo with an extra
digit at the end. This service was not included in the
final dataset
Y 1 1 1 1
Edit manager hours due to
satisficing
In some cases, managers’ total hours were over 50.
This was considered to be mostly due to satisficing in
the data completion, with respondents putting in the
same figure in both childcare and non-childcare hours.
Y 2 1 4 2

Final Report to Department of Children & Youth Affairs: Cost of Providing Quality Childcare 139
Services with
correction type Data points corrected
Correction theme Context / correction made
Changed data used
in unit cost
calculation
All
responses
Services
included
in final
573
All
responses
Services
included
in final
573
Edit manager salary typo
(multiply by 10)
It appeared that there had been a typo which made the
value misaligned with other data by approximately a
value of 10. The existing values were multiplied by 10 to
correct.
Y 1 1 1 1
Move employee salary
from wage column to salary
column
Move the employee salary value from the wage column
when it appeared to have been entered into the
incorrect field.
Y 1 1 1 1
Edit very high employee
wages to median
There were several instances where the employees’
hourly wages appeared to be excessively high, with
values in excess of 111. These were corrected to the
median.
Y 4 1 5 1
Where ancillary salary per
hour is very high edit low
hours values (multiply by
10)
There were some hourly staff where their calculated
hourly pay was €100 per hour or higher. In this case, the
hours were edited where they were recorded working.
This appeared to be because they had put 3 instead of
30 hours per week. The data was not included in the
final dataset.
N 1 1 1 1
Edit zero after school hours
to median
Data was added for one service where there was no
data, although this service was not then included in the
analysis.
Y 1 0 1 0
Remove mistaken entry in
rooms data
A value of 1010 appeared to have been entered into this
field in error. N 1 0 1 0
Edit manager hours typo to
median
One record showed a manager with an outlier in hourly
wage paid. This was thought to be a typo with an extra 1 Y 1 0 1 0

Final Report to Department of Children & Youth Affairs: Cost of Providing Quality Childcare 140
Services with
correction type Data points corrected
Correction theme Context / correction made
Changed data used
in unit cost
calculation
All
responses
Services
included
in final
573
All
responses
Services
included
in final
573
at the beginning. This service was not included in the
final dataset
Edit error manager weeks
to median
One record showed a manager working 29500 weeks.
This was corrected to the median. Y 1 0 1 0
Edit error manager wage to
median
One excessively high manager wage was corrected to
the median. Y 1 0 1 0
Edit error manager drawing
value to median
Corrected where the figure appeared to be a percentage
rather than an absolute value. Y 1 0 1 0
Move manager salary
value to correct column
(was in weeks column)
Moved the manager salary into the correct field when
this appeared to have been entered in the weeks
column
Y 1 0 1 0
Move manager weeks
value to correct column
(was in salary column)
Moved the manager weeks value into the correct field
when this appeared to have been entered in the salary
column
Y 1 0 1 0
Edit error employee weeks
from 54 to 52
Corrected an impossible value by making a minimal
reduction. Y 1 0 1 0

Final Report to Department of Children & Youth Affairs: Cost of Providing Quality Childcare 141
Appendix 3: Detail on Regression Analysis

Final Report to Department of Children & Youth Affairs: Cost of Providing Quality Childcare 142
Table A1: Descriptive analysis of categorical variables (continues overleaf)
Variable Category Frequency Percent
Size Small 142 25.0
Medium 143 25.2
Large 141 24.8
Very large 142 25.0
Total 568 100
Organisation type Community/Voluntary Organisation 175 30.8
Private Enterprise 393 69.2
Total 568 100
Premises type Commercial building owned by service provider 95 16.7
Domestic building owned by service provider 156 27.5
Premises with a commercial lease 73 12.9
Premises with a non-commercial lease 110 19.4
Premises without formal lease arrangements 117 20.6
(missing) 17 3.0
Total 568 100
Entity type Company limited by guarantee 170 29.9
Company limited by shares 69 12.2
Other 24 4.2
Partnership 23 4.1
Sole trader 271 47.7
(missing) 11 1.9
Total 568 100
Multisite provider No 522 91.9
Yes 46 8.1
Total 568 100
ECCE only mixed 301 53.0
no 55 9.7
yes 212 37.3
Total 568 100
High capitation No 295 51.9
Yes 273 48.1
Total 568 100
Local deprivation Affluent 41 7.2
Disadvantaged 38 6.7
Extremely Disadvantaged 1 0.2
Marginally below average 247 43.5
Marginally above average 237 41.7
Very Disadvantaged 2 0.4
(missing) 2 0.4
Total 568 100

Final Report to Department of Children & Youth Affairs: Cost of Providing Quality Childcare 143
Table A1 (continued): Descriptive analysis of categorical variables (continues overleaf)
Variable Category Frequency Percent
Provides full day service No 399 70.3
Yes 169 29.8
Total 568 100
Provides morning service No 54 9.5
Yes 514 90.5
Total 568 100
Provides afternoon service No 395 69.5
Yes 173 30.5
Total 568 100
Provides breakfast service No 458 80.6
Yes 110 19.4
Total 568 100
Provides after school service No 360 63.4
Yes 208 36.6
Total 568 100
Provides part-time service No 403 71.0
Yes 165 29.1
Total 568 100
Provides out-of-term service No 449 79.1
Yes 119 21.0
Total 568 100
Provides drop-in service No 562 98.9
Yes 6 1.1
Total 568 100

Final Report to Department of Children & Youth Affairs: Cost of Providing Quality Childcare 144
Table A1 (continued): Descriptive analysis of categorical variables (continues overleaf)
Variable Category Frequency Percent
Quality No 551 97.0
Yes 17 3.0
Total 568 100
Open most of year No (38-46 weeks) 403 71.0
Yes (47-52 weeks) 165 29.1
Total 568 100
Graduate led No 224 39.4
Yes 344 60.6
Total 568 100
CPD mandatory No 85 15.0
Yes all 313 55.1
Yes care 145 25.5
(missing) 25 4.4
Total 568 100
CPD leave outside work hours 280 49.3
paid leave 159 28.0
paid overtime 30 5.3
unpaid leave 62 10.9
(missing) 37 6.5
Total 568 100
Youngest child Less than 12 months 99 17.4
12-23 months 44 7.8
24-35 months 75 13.2
3-5 years 309 54.4
School age 22 3.9
(missing) 19 3.4
Total 568 100

Final Report to Department of Children & Youth Affairs: Cost of Providing Quality Childcare 145
Table A1 (continued): Descriptive analysis of categorical variables
Variable Category Frequency Percent
Rurality Rural 238 41.9
Urban 330 58.1
Total 568 100
Region Border 45 7.9
Dublin 143 25.2
Mid-East 88 15.5
Mid-West 70 12.3
Midlands 34 6.0
South East 51 9.0
South-West 81 14.3
West 56 9.9
Total 568 100
County Carlow 6 1.1
Cavan 13 2.3
Clare 20 3.5
Cork 64 11.3
Donegal 13 2.3
Dublin 143 25.2
Galway 40 7.0
Kerry 17 3.0
Kildare 23 4.1
Kilkenny 16 2.8
Laois 11 1.9
Leitrim 1 0.2
Limerick 20 3.5
Longford 5 0.9
Louth 15 2.6
Mayo 11 1.9
Meath 28 4.9
Monaghan 7 1.2
Offaly 10 1.8
Roscommon 5 0.9
Sligo 11 1.9
Tipperary 30 5.3
Waterford 8 1.4
Westmeath 8 1.4
Wexford 21 3.7
Wicklow 22 3.9
Total 568 100

Final Report to Department of Children & Youth Affairs: Cost of Providing Quality Childcare 146
Figure A1: Histogram of unit cost (with outliers removed)
Figure A2: Histogram of percent hours filled
020
40
60
80
Fre
quen
cy
0 5 10 15Calculated unit cost (€)

Final Report to Department of Children & Youth Affairs: Cost of Providing Quality Childcare 147
Figure A3: Histogram of percent non-contact hours
Figure A4: Histogram of weighted average staff qualification level

Final Report to Department of Children & Youth Affairs: Cost of Providing Quality Childcare 148
Figure A5: Histogram of staff turnover
Figure A6: Histogram of average staff-child factor
0
10
020
030
040
0
Fre
quen
cy
0 .2 .4 .6 .8 1Staff turnover (%)
050
10
015
020
0
Fre
quen
cy
0 1 2 3Average staff-child factor

Final Report to Department of Children & Youth Affairs: Cost of Providing Quality Childcare 149
Figure A7: Histogram of average group size
Figure A8: Histogram of percent fees income
020
40
60
80
Fre
quen
cy
0 10 20 30 40 50Average childcare group size
050
10
015
020
025
0
Fre
quen
cy
0 .2 .4 .6 .8 1Percent of income which is from fees (%)

Final Report to Department of Children & Youth Affairs: Cost of Providing Quality Childcare 150
Figure A9: Histogram of percent ECCE income
Table A2: Summary of missing cases by variable
Variable Missing
Ave. staff-child factor 1
Ave. staff qual. level 1
Ave. group size 19
Premises type 17
Entity type 11
Local deprivation 2
CPD type 25
CPD leave 37
Youngest children 19
050
10
015
0
Fre
quen
cy
0 .2 .4 .6 .8 1Percent of income which is from ECCE (%)

Final Report to Department of Children & Youth Affairs: Cost of Providing Quality Childcare 151
Table A3: Summary of missing data patterns by variables with missing data (missing = 0, present = 1)
Patterns of missingness
Local deprivation
Entity type Premises type Youngest children CPD type CPD leave
% of missing cases
Ave. sta
ff-c
hild
facto
r
Ave. sta
ff q
ual. level
Ave. gro
up s
ize
Dis
advanta
ged
Marg
inally
belo
w a
vera
ge
Marg
inally
above a
vera
ge
Lim
ited b
y s
hare
s
Oth
er
Part
ners
hip
Sole
tra
der
Dom
estic o
wned
Com
merc
ial le
ase
Non
-com
merc
ial le
ase
No form
al le
ase
12
-23 m
on
ths
24
-35 m
on
ths
3-5
years
School age
Yes -
all
sta
ff
Yes -
care
sta
ff
Paid
leave
Paid
overt
ime
Unpaid
leave
86% 1 1 1 1 1 1 1 1 1 1 1 1 1 1 1 1 1 1 1 1 1 1 1
4% 1 1 1 1 1 1 1 1 1 1 1 1 1 1 1 1 1 1 0 0 0 0 0
3% 1 1 0 1 1 1 1 1 1 1 1 1 1 1 0 0 0 0 1 1 1 1 1
3% 1 1 1 1 1 1 1 1 1 1 1 1 1 1 1 1 1 1 1 1 0 0 0
1% 1 1 1 1 1 1 0 0 0 0 0 0 0 0 1 1 1 1 1 1 1 1 1
1% 1 1 1 1 1 1 1 1 1 1 0 0 0 0 1 1 1 1 1 1 1 1 1
<1% 1 1 1 1 1 1 1 1 1 1 1 1 1 1 1 1 1 1 0 0 1 1 1
<1% 1 1 1 1 1 1 0 0 0 0 1 1 1 1 1 1 1 1 1 1 1 1 1
<1% 1 1 1 0 0 0 1 1 1 1 1 1 1 1 1 1 1 1 1 1 1 1 1
<1% 0 1 0 1 1 1 1 1 1 1 1 1 1 1 0 0 0 0 1 1 1 1 1
<1% 1 0 1 1 1 1 1 1 1 1 1 1 1 1 1 1 1 1 1 1 1 1 1
<1% 1 1 0 1 1 1 1 1 1 1 0 0 0 0 0 0 0 0 1 1 1 1 1
<1% 1 1 0 1 1 1 1 1 1 1 1 1 1 1 0 0 0 0 1 1 0 0 0

Final Report to Department of Children & Youth Affairs: Cost of Providing Quality Childcare 152
Table A4: Pairwise correlations for all variables except region and country (for the sake of brevity)
Column
Col. Variable Categories 1 2 3 4 5 6 7 8 9 10 11 12 13 14 15 16 17 18 19 20 21 22 23 24 25 26 27 28 29 30 31 32 33 34 35 36 37 38 39 40 41 42 43 44 45 46 47 48
1 Unit cost 1.00
2 Size Medium 0.19 1.00
3 Large -0.33 1.00
4 Very large -0.44 -0.33 -0.33 1.00
5 Organisation type Private enterprise -0.10 -0.12 1.00
6 Premises type Domestic ow ned 0.13 -0.09 -0.21 0.34 1.00
7 Commercial lease 0.22 0.14 -0.25 1.00
8 Non-commercial lease -0.32 -0.31 -0.20 1.00
9 No formal lease 0.09 -0.12 -0.17 -0.33 -0.20 -0.26 1.00
10 Entity type Limited by shares -0.13 -0.16 0.09 0.24 0.24 -0.13 0.21 1.00
11 Other -0.10 -0.22 1.00
12 Partnership 0.14 1.00
13 Sole trader 0.16 -0.12 -0.32 0.65 0.41 -0.22 -0.11 -0.37 -0.21 -0.20 1.00
14 Multisite provider Yes -0.10 0.17 -0.13 0.10 0.32 -0.29 1.00
15 ECCE only No 0.15 -0.18 0.11 -0.18 0.12 1.00
16 Yes 0.30 0.17 -0.30 -0.45 0.18 0.28 -0.16 -0.21 0.33 -0.15 -0.25 1.00
17 High capitation Yes 0.20 0.09 -0.12 -0.16 -0.14 1.00
18 Local deprivation Disadvantaged -0.26 -0.09 0.13 -0.08 0.11 -0.16 0.16 1.00
19 Marginally below average 0.20 0.13 -0.09 0.09 -0.08 0.13 -0.25 1.00
20 Marginally above average -0.12 -0.09 -0.24 -0.75 1.00
21 Rurality Urban 0.16 0.08 0.17 0.16 0.10 0.13 -0.10 0.11 -0.14 1.00
22 Services provided Full day -0.30 -0.36 0.74 -0.13 -0.23 0.19 -0.16 0.27 -0.33 0.12 -0.49 0.21 -0.11 0.11 1.00
23 Morning sessions -0.14 0.17 -0.09 -0.08 0.18 -0.12 -0.99 0.25 0.16 -0.16 -0.13 1.00
24 Afternoon sessions 0.10 0.17 -0.10 -0.20 -0.12 0.17 0.17 0.13 0.21 1.00
25 Breakfast club -0.34 -0.25 0.47 -0.11 -0.13 0.17 -0.22 -0.38 0.20 -0.13 0.41 1.00
26 After school club -0.34 -0.29 0.16 0.53 -0.18 -0.25 0.15 0.23 -0.32 0.11 -0.59 0.13 0.49 0.59 1.00
27 Part-time -0.28 -0.24 0.52 -0.22 -0.21 0.13 -0.29 -0.49 0.16 0.12 -0.14 0.54 0.12 0.30 0.39 1.00
28 Out of term -0.32 -0.28 0.58 -0.13 -0.14 0.09 -0.14 0.21 -0.27 -0.40 0.19 0.57 0.53 0.64 0.39 1.00
29 Percent hours f illed -0.22 -0.10 0.10 -0.10 0.19 -0.09 -0.11 -0.19 -0.13 -0.11 1.00
30 Percent non-contact hours 0.28 0.18 -0.16 -0.35 0.18 0.23 -0.09 -0.16 0.28 0.37 0.10 -0.14 -0.38 -0.15 -0.29 -0.29 -0.31 -0.24 0.13 1.00
31 Quality aw ard Yes 0.10 1.00
32 Open most of year Yes -0.31 -0.34 0.71 -0.25 -0.25 0.14 -0.09 0.21 -0.39 0.15 0.13 -0.49 0.14 0.11 0.76 -0.12 0.12 0.41 0.49 0.60 0.58 -0.09 -0.36 1.00
33 Graduate led Yes 0.23 0.10 -0.11 -0.20 0.73 -0.09 0.09 0.22 0.15 0.16 0.20 0.18 0.18 0.10 0.22 1.00
34 Ave. staff qual. level 0.13 0.10 -0.09 0.12 0.08 0.44 0.09 -0.08 0.19 0.10 -0.10 0.60 1.00
35 CPD type Yes - all staff 0.11 -0.09 -0.11 1.00
36 Yes - care staff -0.12 0.09 -0.10 0.16 -0.70 1.00
37 CPD leave Paid leave 0.11 0.10 1.00
38 Paid overtime -0.09 -0.09 -0.16 1.00
39 Unpaid leave -0.09 -0.09 -0.24 -0.09 1.00
40 Staff turnover 0.13 0.10 0.09 -0.13 0.10 -0.12 0.10 0.14 0.08 -0.09 0.17 0.14 0.09 1.00
41 Youngest children 12-23 months 0.16 -0.09 0.12 0.11 0.09 -0.22 0.10 0.30 -0.09 0.15 0.29 0.18 -0.13 0.27 1.00
42 24-35 months 0.15 -0.25 -0.09 -0.08 -0.11 -0.12 1.00
43 3-5 years 0.19 0.21 -0.55 0.20 0.23 -0.16 -0.17 0.31 -0.11 -0.28 0.62 -0.14 -0.60 0.28 -0.12 -0.26 -0.47 -0.45 -0.41 0.13 0.32 -0.62 -0.16 -0.11 -0.33 -0.45 1.00
44 School age 0.10 -0.10 0.09 -0.11 0.56 -0.14 -0.17 -0.13 -0.57 -0.12 0.25 -0.13 -0.13 0.13 -0.23 1.00
45 Ave. staff-child factor -0.10 0.17 0.12 -0.17 -0.09 0.10 0.19 -0.09 -0.27 1.00
46 Ave. group size 0.13 -0.13 -0.19 0.13 0.14 0.13 0.09 -0.29 -0.21 -0.10 0.19 -0.24 -0.11 -0.16 0.19 0.16 0.16 1.00
47 Percent fees income -0.30 -0.29 0.58 -0.16 0.21 -0.10 -0.15 0.42 -0.28 0.23 0.20 -0.51 0.08 0.10 0.64 -0.20 0.39 0.47 0.41 0.46 -0.37 0.60 0.15 -0.09 0.17 0.19 -0.54 -0.19 1.00
48 Percent ECCE income 0.18 0.24 -0.61 0.28 0.28 -0.17 -0.28 0.44 -0.22 -0.41 0.61 -0.15 0.08 -0.16 -0.66 0.40 -0.42 -0.62 -0.47 -0.50 0.38 -0.67 -0.16 -0.12 -0.23 0.68 -0.30 0.16 0.11 -0.77 1.00

Final Report to Department of Children & Youth Affairs: Cost of Providing Quality Childcare 153
Table A5: Results of bivariate models (one model for each explanatory variable,
continued overleaf)
Variable Category Coef. Std. Err.
P-value lower
CI upper
CI
Size Size small (ref. category)
Size medium -0.089 0.198 0.655 -0.478 0.301
Size large -0.559 0.199 0.005 -0.950 -0.168 **
Size v.large -2.097 0.199 0.000 -2.487 -1.707 ***
_model_constant 4.616 0.141 0.000 4.340 4.892 ***
Organisation type Community/voluntary org. (ref. category)
Private enterprise -0.096 0.170 0.573 -0.430 0.238
_model_constant 3.997 0.141 0.000 3.719 4.275 ***
Premises type Commercial owned (ref. category)
Domestic owned 1.092 0.241 0.000 0.618 1.566 ***
Commercial lease 0.547 0.289 0.059 -0.020 1.114
Non-commercial lease 0.786 0.260 0.003 0.276 1.296 **
No formal lease 0.772 0.256 0.003 0.269 1.275 **
_model_constant 3.229 0.190 0.000 2.855 3.603 ***
Entity type Limited by guarantee (ref. category)
Limited by shares -0.791 0.263 0.003 -1.307 -0.274 **
Other -0.513 0.402 0.202 -1.302 0.276
Partnership -0.345 0.409 0.399 -1.149 0.458
Sole trader -0.027 0.180 0.880 -0.381 0.327
_model_constant 4.074 0.141 0.000 3.797 4.351 ***
Multisite provider Yes (ref. category: No) -0.165 0.288 0.566 -0.731 0.400
_model_constant 3.944 0.082 0.000 3.783 4.105 ***
ECCE only Mixed (ref. category)
No 1.554 0.254 0.000 1.055 2.052 ***
Yes 1.405 0.155 0.000 1.100 1.710 ***
_model_constant 3.256 0.100 0.000 3.060 3.452 ***
High capitation Yes (ref. category: No) -0.113 0.157 0.473 -0.422 0.196
_model_constant 3.985 0.109 0.000 3.771 4.199 ***
Local deprivation Affluent (ref. category)
Disadvantaged -0.342 0.411 0.405 -1.149 0.464
Marginally below average -0.289 0.314 0.357 -0.905 0.327
Marginally above average -0.534 0.315 0.090 -1.152 0.084
_model_constant 4.297 0.290 0.000 3.727 4.868 ***
Rurality Urban (ref. category: Rural) 0.597 0.157 0.000 0.288 0.906 ***
_model_constant 3.584 0.120 0.000 3.349 3.820 ***

Final Report to Department of Children & Youth Affairs: Cost of Providing Quality Childcare 154
Table A5 (continued): Results of bivariate models (continued overleaf)
Variable Category Coef. Std. Err.
P-value lower
CI upper
CI
Services provided Full day -1.207 0.164 0.000 -1.530 -0.885 ***
_model_constant 4.290 0.090 0.000 4.114 4.466 ***
Afternoon sessions -0.045 0.171 0.793 -0.380 0.290
_model_constant 3.945 0.094 0.000 3.760 4.130 ***
Breakfast club -1.630 0.187 0.000 -1.997 -1.263 ***
_model_constant 4.247 0.082 0.000 4.085 4.408 ***
After school club -1.303 0.154 0.000 -1.605 -1.002 ***
_model_constant 4.408 0.093 0.000 4.226 4.591 ***
Part-time -1.154 0.166 0.000 -1.480 -0.828 ***
_model_constant 4.266 0.090 0.000 4.090 4.442 ***
Out of term -1.478 0.183 0.000 -1.837 -1.119 ***
_model_constant 4.241 0.084 0.000 4.076 4.405 ***
Percent hours filled 0.183 0.421 0.664 -0.644 1.011
_model_constant 3.779 0.358 0.000 3.076 4.482 ***
Percent non-cont. hours 3.777 0.552 0.000 2.692 4.862 ***
_model_constant 3.101 0.143 0.000 2.821 3.382 ***
Quality award Yes (ref. category: No) -0.616 0.460 0.181 -1.520 0.288
_model_constant 3.949 0.080 0.000 3.793 4.106 ***
Open most of year Yes (ref. category: No) -1.280 0.164 0.000 -1.603 -0.957 ***
_model_constant 4.303 0.089 0.000 4.129 4.477 ***
Graduate led Yes (ref. category: No) -0.052 0.161 0.746 -0.368 0.264
_model_constant 3.963 0.125 0.000 3.717 4.208 ***
Ave. staff qual. level 0.405 0.128 0.002 0.153 0.657 **
_model_constant 1.404 0.802 0.081 -0.172 2.979
CPD mandatory No (ref. category)
Yes - all staff 0.170 0.230 0.460 -0.282 0.622
Yes - care staff -0.040 0.257 0.876 -0.544 0.465
_model_constant 3.837 0.204 0.000 3.437 4.238 ***
CPD leave Outside work hours (ref. category)
Paid leave 0.028 0.188 0.880 -0.340 0.397
Paid overtime -0.068 0.363 0.852 -0.781 0.646
Unpaid leave 0.130 0.265 0.626 -0.392 0.651
_model_constant 3.906 0.113 0.000 3.684 4.128 ***
Staff turnover -0.708 0.410 0.085 -1.513 0.098
_model_constant 4.012 0.091 0.000 3.833 4.192 ***

Final Report to Department of Children & Youth Affairs: Cost of Providing Quality Childcare 155
Table A5 (continued): Results of bivariate models
Variable Category Coef. Std. Err.
P-value lower
CI upper
CI
Youngest children Less than 12 months (ref. category)
12-23 months 0.962 0.329 0.004 0.315 1.609 **
24-35 months 0.950 0.278 0.001 0.404 1.497 ***
3-5 years 1.349 0.210 0.000 0.936 1.761 ***
School age 1.517 0.428 0.000 0.676 2.359 ***
_model_constant 2.922 0.183 0.000 2.563 3.281 ***
Ave. staff-child factor -0.875 0.351 0.013 -1.564 -0.186 *
_model_constant 4.685 0.313 0.000 4.071 5.300 ***
Ave. group size -0.015 0.014 0.278 -0.042 0.012
_model_constant 4.179 0.226 0.000 3.734 4.624 ***
Percent fees income -2.024 0.269 0.000 -2.552 -1.496 ***
_model_constant 4.377 0.096 0.000 4.190 4.565 ***
Percent ECCE income 0.956 0.222 0.000 0.519 1.392 ***
_model_constant 3.321 0.161 0.000 3.004 3.638 ***
Region Border (ref. category)
Dublin 1.509 0.310 0.000 0.900 2.119 ***
Mid-East 1.148 0.333 0.001 0.495 1.802 ***
Mid-west 0.322 0.347 0.353 -0.359 1.004
Midlands 0.220 0.413 0.594 -0.590 1.030
South 0.675 0.371 0.070 -0.055 1.404
South-West 0.883 0.338 0.009 0.220 1.546 **
West 0.688 0.363 0.059 -0.026 1.402
_model_constant 3.066 0.271 0.000 2.534 3.597 ***
County Carlow (ref. category)
Cavan -1.740 0.898 0.053 -3.505 0.024
Clare -1.997 0.847 0.019 -3.661 -0.333 *
Cork -1.268 0.777 0.103 -2.794 0.258
Donegal -2.130 0.898 0.018 -3.894 -0.366 *
Dublin -0.679 0.758 0.371 -2.169 0.810
Galway -1.630 0.797 0.041 -3.195 -0.065 *
Kerry -1.447 0.864 0.095 -3.144 0.251
Kildare -1.037 0.834 0.215 -2.675 0.602
Kilkenny -1.854 0.871 0.034 -3.565 -0.143 *
Laois -2.120 0.924 0.022 -3.934 -0.306 *
Leitrim -1.561 1.965 0.427 -5.422 2.300
Limerick -1.930 0.847 0.023 -3.594 -0.266 *
Longford -1.462 1.102 0.185 -3.626 0.703
Louth -1.016 0.879 0.248 -2.743 0.711
Mayo -1.110 0.924 0.230 -2.924 0.704
Meath -1.600 0.819 0.051 -3.208 0.008
Monaghan -2.963 1.012 0.004 -4.952 -0.975 **
Offaly -1.679 0.940 0.075 -3.525 0.167
Roscommon -1.325 1.102 0.230 -3.490 0.839
Sligo -2.351 0.924 0.011 -4.166 -0.537 *
Tipperary -1.736 0.814 0.033 -3.335 -0.138 *
Waterford -1.644 0.983 0.095 -3.574 0.287
Westmeath -2.438 0.983 0.013 -4.368 -0.507 *
Wexford -1.638 0.842 0.052 -3.292 0.017
Wicklow -0.348 0.838 0.678 -1.995 1.298
_model_constant 5.254 0.743 0.000 3.795 6.714 ***

Final Report to Department of Children & Youth Affairs: Cost of Providing Quality Childcare 156
Table A6: Results of saturated model (without region or county, N = 487, R2=0.453)
Variable Category Coef. Std. Err.
P-value lower
CI upper
CI
Size Size small (ref. category)
Size medium -0.351 0.218 0.108 -0.780 0.077
Size large -0.812 0.297 0.007 -1.397 -0.228 **
Size v.large -2.694 0.425 0.000 -3.529 -1.860 ***
Organisation type Community/voluntary org. (ref. category)
Private enterprise 0.332 0.369 0.368 -0.392 1.057
Premises type Commercial owned (ref. category)
Domestic owned 0.083 0.238 0.727 -0.384 0.551
Commercial lease 0.026 0.271 0.925 -0.507 0.558
Non-commercial lease -0.116 0.248 0.641 -0.603 0.372
No formal lease -0.422 0.249 0.091 -0.911 0.067
Entity type Limited by guarantee (ref. category)
Limited by shares -0.339 0.386 0.381 -1.099 0.420
Other -0.440 0.357 0.219 -1.141 0.262
Partnership -0.303 0.469 0.519 -1.225 0.619
Sole trader -0.813 0.358 0.023 -1.516 -0.110 *
Multisite provider Yes (ref. category: No) 0.105 0.274 0.702 -0.433 0.642
ECCE only Mixed (ref. category)
No 1.791 0.341 0.000 1.121 2.462 ***
Yes 0.511 0.242 0.036 0.035 0.986 *
High capitation Yes (ref. category: No) 0.323 0.215 0.134 -0.100 0.746
Local deprivation Affluent (ref. category)
Disadvantaged -0.644 0.392 0.101 -1.413 0.126
Marginally below average -0.053 0.295 0.857 -0.633 0.527
Marginally above average -0.297 0.300 0.322 -0.887 0.292
Rurality Urban (ref. category: Rural) 0.378 0.157 0.016 0.070 0.686 *
Services provided Full day 0.373 0.319 0.243 -0.254 1.000
Afternoon sessions 0.460 0.175 0.009 0.116 0.805 **
Breakfast club -0.165 0.235 0.483 -0.627 0.297
After school club -0.002 0.257 0.993 -0.508 0.504
Part-time -0.356 0.210 0.091 -0.769 0.057
Out of term -0.380 0.261 0.145 -0.893 0.132
Percent hours filled -0.842 0.415 0.043 -1.659 -0.026 *
Percent non-cont. hours 1.675 0.612 0.006 0.471 2.878 **
Quality award Yes (ref. category: No) -0.667 0.385 0.084 -1.424 0.091
Open most of year Yes (ref. category: No) -0.713 0.302 0.019 -1.307 -0.119 *
Graduate led Yes (ref. category: No) 0.138 0.254 0.586 -0.360 0.637
Ave. staff qual. level 0.141 0.152 0.355 -0.158 0.441
CPD mandatory No (ref. category)
Yes - all staff -0.013 0.202 0.949 -0.409 0.384
Yes - care staff 0.028 0.226 0.903 -0.417 0.472
CPD leave Outside work hours (ref. category)
Paid leave -0.097 0.159 0.541 -0.410 0.215
Paid overtime -0.217 0.309 0.483 -0.824 0.390
Unpaid leave -0.112 0.231 0.627 -0.567 0.342
Staff turnover -0.546 0.365 0.136 -1.263 0.171
Youngest children Less than 12 months (ref. category)
12-23 months -0.137 0.320 0.670 -0.767 0.493
24-35 months -0.662 0.368 0.073 -1.386 0.062
3-5 years -0.870 0.379 0.022 -1.615 -0.124 *
School age -3.707 0.636 0.000 -4.956 -2.458 ***
Ave. staff-child factor -0.291 0.350 0.405 -0.979 0.396
Ave. group size -0.012 0.015 0.439 -0.041 0.018
Percent fees income -2.490 0.502 0.000 -3.478 -1.503 ***
Percent ECCE income -2.795 0.509 0.000 -3.796 -1.794 ***
_model_constant 7.856 1.262 0.000 5.375 10.337 ***

Final Report to Department of Children & Youth Affairs: Cost of Providing Quality Childcare 157
Table A7: Results of final model including county (N = 530, R2=0.443, dropped variables
omitted)
Variable Category Coef. Std. Err.
P-value lower
CI upper
CI
Size Size small (ref. category)
Size medium -0.450 0.207 0.030 -0.856 -0.044 *
Size large -0.968 0.272 0.000 -1.502 -0.434 ***
Size v.large -2.974 0.368 0.000 -3.697 -2.251 ***
Premises type Commercial owned (ref. category) Domestic owned -0.039 0.229 0.866 -0.488 0.411
Commercial lease 0.114 0.249 0.647 -0.376 0.604
Non-commercial lease -0.222 0.233 0.341 -0.679 0.236
No formal lease -0.464 0.234 0.048 -0.924 -0.005 *
Entity type Limited by guarantee (ref. category)
Limited by shares -0.209 0.254 0.410 -0.708 0.290
Other -0.350 0.349 0.316 -1.035 0.335
Partnership -0.086 0.361 0.811 -0.795 0.622
Sole trader -0.536 0.195 0.006 -0.919 -0.153 **
ECCE only Mixed (ref. category) No 1.789 0.314 0.000 1.173 2.406 ***
Yes 0.660 0.216 0.002 0.235 1.084 **
High capitation Yes (ref. category: No) 0.507 0.147 0.001 0.219 0.795 ***
Services provided Afternoon sessions 0.440 0.168 0.009 0.110 0.770 **
Percent hours filled -1.142 0.387 0.003 -1.901 -0.382 **
Percent non-cont. hours 1.531 0.575 0.008 0.401 2.660 **
Open most of year Yes (ref. category: No) -0.612 0.286 0.033 -1.174 -0.050 *
Youngest children Less than 12 months (ref. category) 12-23 months -0.212 0.314 0.500 -0.828 0.405
24-35 months -0.723 0.326 0.027 -1.363 -0.082 *
3-5 years -0.890 0.330 0.007 -1.539 -0.241 **
School age -2.965 0.549 0.000 -4.044 -1.885 ***
Percent fees income -2.060 0.452 0.000 -2.947 -1.172 ***
Percent ECCE income -2.423 0.460 0.000 -3.326 -1.519 ***
County Carlow (ref. category) Cavan -0.832 0.762 0.276 -2.329 0.666
Clare -0.960 0.715 0.180 -2.365 0.445
Cork -0.794 0.654 0.225 -2.079 0.491
Donegal -0.963 0.749 0.199 -2.436 0.509
Dublin -0.313 0.641 0.626 -1.571 0.946
Galway -1.186 0.673 0.079 -2.509 0.137
Kerry -0.952 0.727 0.191 -2.379 0.476
Kildare -0.292 0.696 0.675 -1.660 1.076
Kilkenny -1.154 0.731 0.115 -2.591 0.282
Laois -1.301 0.766 0.090 -2.806 0.204
Leitrim 0.552 1.636 0.736 -2.663 3.766
Limerick -0.997 0.714 0.163 -2.400 0.405
Longford -0.850 0.908 0.350 -2.634 0.935
Louth 0.109 0.740 0.883 -1.344 1.562
Mayo -0.858 0.799 0.283 -2.428 0.712
Meath -0.973 0.691 0.160 -2.331 0.385
Monaghan -2.427 0.921 0.009 -4.237 -0.618 **
Offaly -1.266 0.795 0.112 -2.827 0.296
Roscommon -0.261 0.930 0.779 -2.090 1.567
Sligo -1.268 0.799 0.113 -2.837 0.301
Tipperary -0.892 0.687 0.195 -2.241 0.457
Waterford -1.418 0.817 0.083 -3.023 0.186
Westmeath -1.188 0.817 0.146 -2.793 0.417
Wexford -1.203 0.711 0.091 -2.600 0.194
Wicklow -0.258 0.708 0.716 -1.648 1.133
_model_constant 8.939 0.905 0.000 7.161 10.716 ***

Final Report to Department of Children & Youth Affairs: Cost of Providing Quality Childcare 158
Table A8: Results of final model including region (N = 530, R2=0.422, dropped variables
omitted)
Variable Category Coef. Std. Err.
P-value lower
CI upper
CI
Size Size small (ref. category)
Size medium -0.421 0.203 0.039 -0.821 -0.021 *
Size large -0.932 0.267 0.001 -1.456 -0.409 ***
Size v.large -2.912 0.360 0.000 -3.618 -2.205 ***
Premises type Commercial owned (ref. category)
Domestic owned 0.009 0.225 0.967 -0.433 0.452
Commercial lease 0.168 0.248 0.498 -0.318 0.654
Non-commercial lease -0.166 0.231 0.471 -0.619 0.287
No formal lease -0.411 0.231 0.077 -0.865 0.044
Entity type Limited by guarantee (ref. category)
Limited by shares -0.212 0.249 0.397 -0.702 0.279
Other -0.431 0.344 0.210 -1.107 0.244
Partnership -0.104 0.354 0.769 -0.798 0.591
Sole trader -0.506 0.189 0.008 -0.876 -0.135 **
ECCE only Mixed (ref. category)
No 1.791 0.311 0.000 1.179 2.402 ***
Yes 0.664 0.213 0.002 0.246 1.082 **
High capitation Yes (ref. category: No) 0.539 0.141 0.000 0.263 0.816 ***
Services provided Afternoon sessions 0.420 0.164 0.011 0.098 0.743 *
Percent hours filled -1.233 0.373 0.001 -1.966 -0.500 ***
Percent non-cont. hours 1.695 0.555 0.002 0.605 2.786 **
Open most of year Yes (ref. category: No) -0.639 0.279 0.022 -1.186 -0.091 *
Youngest children Less than 12 months (ref. category)
12-23 months -0.171 0.304 0.574 -0.769 0.426
24-35 months -0.771 0.315 0.015 -1.390 -0.151 *
3-5 years -0.919 0.321 0.004 -1.549 -0.289 **
School age -3.014 0.532 0.000 -4.060 -1.967 ***
Percent fees income -2.110 0.441 0.000 -2.976 -1.244 ***
Percent ECCE income -2.496 0.452 0.000 -3.385 -1.608 ***
Region Border (ref. category)
Dublin 0.817 0.279 0.004 0.268 1.365 **
Mid-East 0.701 0.289 0.016 0.133 1.269 *
Mid-west 0.183 0.302 0.544 -0.411 0.778
Midlands -0.078 0.350 0.824 -0.766 0.610
South 0.062 0.324 0.850 -0.576 0.699
South-West 0.308 0.293 0.293 -0.267 0.883
West 0.109 0.314 0.728 -0.508 0.727
_model_constant 7.838 0.713 0.000 6.437 9.238 ***

Final Report to Department of Children & Youth Affairs: Cost of Providing Quality Childcare 159
Figure A10: Plot of final model residuals against fitted values
Figure A11: Plot of final model residuals against quantiles of the normal distribution
-4-2
02
46
Resid
uals
0 2 4 6 8Fitted values
-4-2
02
46
Resid
uals
-4 -2 0 2 4Inverse Normal

Final Report to Department of Children & Youth Affairs: Cost of Providing Quality Childcare 160
Figure A12: Plot of final model leverage values against residuals
Figure A13: Plot of Cook’s distance against fitted values
0
.05
.1.1
5
Le
vera
ge
0 .01 .02 .03 .04Normalized residual squared
0
.02
.04
.06
.08
.1
Coo
k's
D
0 2 4 6 8Linear prediction

Final Report to Department of Children & Youth Affairs: Cost of Providing Quality Childcare 161
Table A9: Variance inflation factors (above 1) for explanatory variables
Variable Category VIF
Youngest children 3-5 years 6.15
Percent ECCE income 6.08
Size Size v.large 5.70
Open most of year Yes 3.73
Percent fees income 3.65
Size Size large 3.21
Youngest children 24-35 months 2.84
Youngest children School age 2.71
ECCE only Yes 2.60
Premises type Domestic owned 2.50
Premises type No formal lease 2.21
Entity type Sole trader 2.11
Premises type Non-commercial lease 2.08
ECCE only No 1.92
Size Size medium 1.90
Premises type Commercial lease 1.71
Entity type Limited by shares 1.63
Youngest children 12-23 months 1.53
Services provided Afternoon sessions 1.38
Percent non-contact hours 1.38
Entity type Partnership 1.25
Rurality Urban 1.22
Percent hours filled 1.18
High capitation Yes 1.17
Entity type Other 1.14

Final Report to Department of Children & Youth Affairs: Cost of Providing Quality Childcare 162
Table A10: Driver identification and potential operationalisation
Driver group Potential driver Sources Causal pathway Operationalisation considered
Service efficiency
Occupancy rates F: 9, 10, 32, 34, 36, 39, 47, 48,
Less complete occupancy is likely to introduce an inefficiency which is likely to affect unit costs. For example, overhead costs are likely to be fixed and but with lower occupancy rates and fewer children income is lower. The service therefore operates and a financially less efficient level when there not full occupancy. This potential driver is likely to be related to the child to staff ratio. Note that occupancy rates are likely to have a seasonal impact as they are higher in the summer term and therefore unit costs are at their lowest.
Percentage of places that are filled. Note that the measurement at a specific point in time is used as a proxy for the general occupancy of the service, but that occupancy rates vary over the course of the year.
Child to staff ratio
F: 5, 12,14, 15, 25, 50, 51, 53, 54, 56, 59, 60, 68, 69, 70, 99, 100, 101, 108, 109, 112, 114, 116, 117, 118
For all except school-age children there are legal requirements for the number of children that can be supervised by a single member of appropriate staff. There are different requirements depending on the age of the children in the room. The most financially efficient service would therefore have the maximum level of children to staff. In the Frontier paper the child to staff ratio had a substantial effect on unit costs, with lower costs where the ratio is high. As staff costs are generally the among the highest component of total costs, it would not be surprising to see these have a substantial affect. This potential driver is likely to be linked to occupancy rates and to group size in each room.
The Frontier research used a continuous variable for the ratio as they had a different model for the different age bands. In a model that combines the age band, this is less likely to be realistic. An alternative approach is to use a proxy measure. This might be the percentage of sessions with a related legal requirement that were at the maximum child-staff ratio.
Service characteristics
Service provider type (e.g. private / community / voluntary)
F: 12, 34, 36, 37, 38, 41, 46, 50 52, 54, 55, 56, 72, 74, 83, 92, 96, 99, 100, 102, 104, 105, 106, 107, 108, 110, 111, 115,
The purpose and remit and the associated behavioural incentives (particularly financial constraints) vary by the service provider type. In turn this may impact on delivery choices and costs even controlling for all other characteristics. Provider type is likely to be strongly related to the provider size and also to total opening hours. Research also shows some relationship between the provider type and the parent fee to cost ratio. Type of provider variable
Ownership type (e.g. company limited by shares, sole trader etc)
F: 12, 34, 36, 37, 38, 41, 46, 50 52, 54, 55, 56, 72, 74, 83, 92, 96, 99, 100, 102, 104, 105, 106, 107, 108, 110, 111, 115, As above
Type of ownership / grouped type of ownership variable

Final Report to Department of Children & Youth Affairs: Cost of Providing Quality Childcare 163
Driver group Potential driver Sources Causal pathway Operationalisation considered
Premises type NA
The type of premises (e.g. owned by the service provider, commercial or non commercial lease) etc. influence the total cost of running the service. This is likely to have a direct influence. It may be moderated by other factors such as the rurality / location of the service as costs are likely to be higher in more urban areas. It may also be affected by the ownership type and the size of the setting as these may influence the venues available to the service.
Individual types of premises, but could be grouped. Categories which look at premises type in combination with region may be useful to check for small sample sizes.
Provider size F: 10, 36, 37, 50, 60, 77, 94
The provider's size is likely to have an impact on overall costs, with larger providers benefiting from buying at scale etc. It may also affect staff recruitment and staff retention. This relates to other potential drivers such as whether the service is multi-site or not, the type of provider, the average group size and the ownership type. Frontier found that middle-sized settings have the highest costs controlling for the other factors, but it could reflect some discrete increases in core costs as settings initially grow followed by falling costs as size increases sufficiently to benefit from larger economies of scale.
Defined by the number of hours and split into 4 roughly even groups
Services offered (e.g. full day care, sessional services)
This is likely to be related to other potential drivers such as the type of provider, the age profile of the children, opening hours and whether the service is open all year etc.
It is unlikely that this would feature as a variable in the regression model given the number and combinations of the session types offered. However, it would be useful to explore how this relates to the other potential drivers that may be directly related.
Multi-site setting F: 13, 50, 94, 116, 117
Whether the service is part of a chain or a single site. Multi-site services may be able to make some efficiencies that are not possible in single sites, such as administrative burden, buying services at scale. The Frontier research found weak evidence of multi-site services having lower costs.
A dichotomous variable - either single site or chain
Venue profile (no of rooms, total space, proportion the space is used by the setting, time space is used for the service)
F: 9, 12, 26, 27, 28, 29, 30, 31, 33, 36, 37, 41, 42, 47, 55, 58, 59, 79
The greater the space / time the space is used for, the higher the likely costs. This may be compensated for by the fact the service may be able to accommodate larger numbers of children. This is likely to be highly related to the premises type. It may also vary by other drivers, such as there may be more staff where there are a higher number of rooms. Some services may also have use of free space which might help to reduce the total costs and therefore reduce unit cost. Venue costs are likely to be linked to the area and may therefore be impacted by deprivation, geography.
Likely to be hard to include in the model given the data available
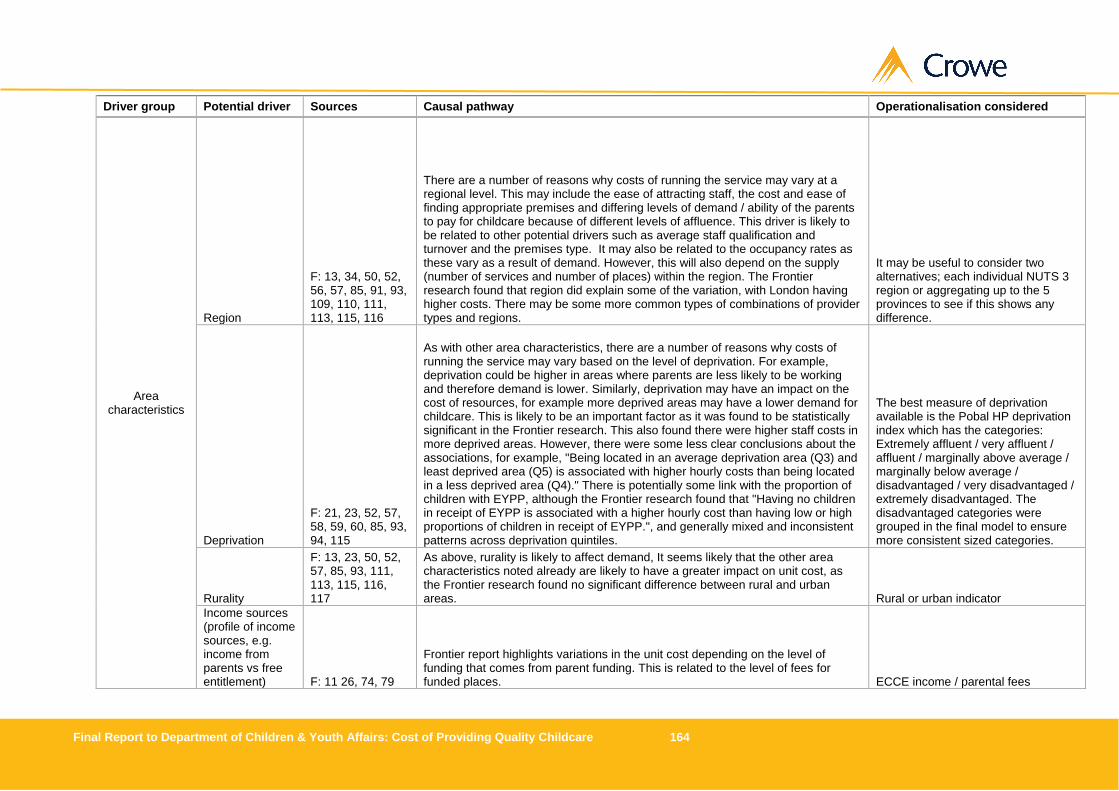
Final Report to Department of Children & Youth Affairs: Cost of Providing Quality Childcare 164
Driver group Potential driver Sources Causal pathway Operationalisation considered
Area characteristics
Region
F: 13, 34, 50, 52, 56, 57, 85, 91, 93, 109, 110, 111, 113, 115, 116
There are a number of reasons why costs of running the service may vary at a regional level. This may include the ease of attracting staff, the cost and ease of finding appropriate premises and differing levels of demand / ability of the parents to pay for childcare because of different levels of affluence. This driver is likely to be related to other potential drivers such as average staff qualification and turnover and the premises type. It may also be related to the occupancy rates as these vary as a result of demand. However, this will also depend on the supply (number of services and number of places) within the region. The Frontier research found that region did explain some of the variation, with London having higher costs. There may be some more common types of combinations of provider types and regions.
It may be useful to consider two alternatives; each individual NUTS 3 region or aggregating up to the 5 provinces to see if this shows any difference.
Deprivation
F: 21, 23, 52, 57, 58, 59, 60, 85, 93, 94, 115
As with other area characteristics, there are a number of reasons why costs of running the service may vary based on the level of deprivation. For example, deprivation could be higher in areas where parents are less likely to be working and therefore demand is lower. Similarly, deprivation may have an impact on the cost of resources, for example more deprived areas may have a lower demand for childcare. This is likely to be an important factor as it was found to be statistically significant in the Frontier research. This also found there were higher staff costs in more deprived areas. However, there were some less clear conclusions about the associations, for example, "Being located in an average deprivation area (Q3) and least deprived area (Q5) is associated with higher hourly costs than being located in a less deprived area (Q4)." There is potentially some link with the proportion of children with EYPP, although the Frontier research found that "Having no children in receipt of EYPP is associated with a higher hourly cost than having low or high proportions of children in receipt of EYPP.", and generally mixed and inconsistent patterns across deprivation quintiles.
The best measure of deprivation available is the Pobal HP deprivation index which has the categories: Extremely affluent / very affluent / affluent / marginally above average / marginally below average / disadvantaged / very disadvantaged / extremely disadvantaged. The disadvantaged categories were grouped in the final model to ensure more consistent sized categories.
Rurality
F: 13, 23, 50, 52, 57, 85, 93, 111, 113, 115, 116, 117
As above, rurality is likely to affect demand, It seems likely that the other area characteristics noted already are likely to have a greater impact on unit cost, as the Frontier research found no significant difference between rural and urban areas. Rural or urban indicator
Income sources (profile of income sources, e.g. income from parents vs free entitlement) F: 11 26, 74, 79
Frontier report highlights variations in the unit cost depending on the level of funding that comes from parent funding. This is related to the level of fees for funded places. ECCE income / parental fees

Final Report to Department of Children & Youth Affairs: Cost of Providing Quality Childcare 165
Driver group Potential driver Sources Causal pathway Operationalisation considered
Quality of care F: 11, 53
The Frontier paper noted that staff, child-to-staff ratios and group sizes are commonly used to assess the structural quality of childcare settings, and identified Gambaro et al (2013) or Munton et al. (2002) as sources of this. It also noted that these structural quality indicators have been shown to be correlated with measures of process quality, which in turn have been shown to affect child development (for example, see Melhuish and Gardiner (2017) and (2018)).
No direct measure for quality available. May consider some of the other staffing variables such as graduate led service, average staff qualification or the level of the owner / managers or room leaders.
Staff profile
Graduate led service
F: 65, 66, 67, 99, 108
This is likely to increase the average unit cost as it is likely to increase wages for staff if they are better educated. The Frontier paper excluded this because it was not found to be statistically significant in any of the regressions.
Highest level of room leaders and managers and owners as used in the model.
Average staff qualification
F: 14, 15, 24, 25, 26, 28, 51, 53, 63, 65, 66, 67, 85, 97, 98, 99, 110, 112, 114, 115, 116, 117
The Frontier research found that services with higher average staff qualifications had higher unit costs.
Mean of levels of qualification across all staff. Would have to make some assumptions about lower than 5 and level 9/10. Could alternatively set levels grouping the levels into 3 or 4 groups.
Staff turnover
F: 25, 53, 65, 66, 67, 68, 98, 99, 108,
There are higher costs associated with retaining and training new staff. This is likely to be linked with geographical factors and the local economy as these will drive how easy it is for staff to find alternative roles. This may also be related to quality, as high turnover is generally perceived to give a less consistent service with highly trained staff who know the service well. It may also impact on staff wages and on training costs. It is unlikely to have a strong link as the Frontier research did not find a statistically significant link.
Percentage turnover rate as a continuous variable or categorical variable with grouped percentages.
Frequency of CPD
F: 25, 65, 67, 68, 98, 99, 108
CPD could potentially increased costs as more cover is needed, although there are several different models for this and in some cases this is done outside of normal work hours and it varies whether this is paid for by the service or not (which may add additional costs). It potentially creates a workforce with less turnover and a more skilled workforce which may impact on staff retention. Not possible within the data collected
Profile of CPD NA
There may be different costs associated with whether CPD is paid for or not and whether it is conducted during work time or outside of usual hours, as this impacts on whether the service is required to also cover for the individuals childcare hours time. This may be a proxy for some of the other CPD fields indicated within the research that are not captured within the Ireland dataset.
Use the four different CPD categories - paid leave, paid overtime, unpaid leave, outside work hours
Frequency of staff supervision
F: 25, 65, 67, 68, 98, 99, 108
Average cost is higher in services where there is less monthly supervision. This may be linked to higher turnover of staff, Not possible within the data collected

Final Report to Department of Children & Youth Affairs: Cost of Providing Quality Childcare 166
Driver group Potential driver Sources Causal pathway Operationalisation considered
Training plan F: 25, 67, 68, 98, 99, 108
Frontier found the average unit cost is higher in services where there is a training plan in place. This may be because of the cost of paying for training and for covering the cost of staff who are being trained. This may be linked to staff turnover. Not possible within the data collected
Staff time attributed to session time
The greater the level of staff time attributed to childcare time, potentially the more staff required in order to maintain adult to child ratios.
Percentage of time spent on direct contact with children (as opposed to development time etc)
Opening
Continuous opening throughout the year or term time
F: 53, 64, 65, 96, 97, 116, 117,
Continuous opening throughout the year may allow for service efficiencies. It may also impact on staff recruitment and associated costs (e.g. staff who are parents preferring a term time opening) but other staff preferring to work all year. The geography and other factors impacting on local employment may influence this. The driver was considered significant enough to be included in the regression models in the Frontier paper, which found that all year opening was associated with a higher cost than term only.
All year or term time only dichotomous variable based on 52 or 38 weeks opening
Continuous opening throughout the day (not closing for lunch)
F: 14, 53, 64, 65, 96, 97, 116, 118
The Frontier research found that the average unit cost is slightly higher for those which are not continuously open through the day. Where the service is not open all year, there are few hours available to receive income, but there may be some fixed costs which cannot be reduced at times when the service is not open. For example, premises costs may apply throughout the year. It may be necessary to pay staff slightly higher wages to compensate for them not having a full year role. This may be correlated with the number of daily opening hours.
Continuous or not continuous opening dichotomous variable
Daily opening hours
F: 11, 14, 25, 53, 64, 96, 97, 108, 109, 110, 115, 116, 117
The Frontier research found that settings with a low number of opening hours (6 or under) each day have a lower mean unit cost than settings opening for longer hours. However, those with a middle number of opening hours (7 to 10) have a higher cost than for settings with longer opening hours. In the 2 year old model there was found to be a statistically significant relationship with the (ungrouped) number of daily open hours: on average, the hourly cost increases by £0.20 for each additional hour that the setting is open. All the potential drivers in relation to opening hours may indicate the level of flexibility offered to parent which in turn may affect the hourly cost.
Average hours open per day In the Frontier research this was used as continuous variables as the grouped variable did not produce different results and the linear specification provides a clearer interpretation of size of association.

Final Report to Department of Children & Youth Affairs: Cost of Providing Quality Childcare 167
Driver group Potential driver Sources Causal pathway Operationalisation considered
Child profile
Proportion of children with SEND statement or EHC plan
F: 9, 14, 47, 51, 62, 63, 95, 96, 113, 115, 116, 117,
Data from the Frontier research shows that there is a likely link between the proportion of children with a SEND statement or EHC plan. However, there were some mixed and counter-intuitive findings which varied across the different age based models. The hourly cost is higher for settings with no children with SEND than for settings with a low proportion of children with SEND. Overall, the hourly cost is higher for settings with a higher proportion of children with SEND.
A continuous variable of the percentage of children with SEND would be ideal. This data is not available to model and no reasonable proxy measures are available.
Proportion of children with EYPP (Early Years Pupil Premium)
F: 51, 53, 62, 63, 64, 95, 96, 110, 111, 115, 116, 117
Across all services there is a variation in the number of children that are in receipt of EYPP. The types of children that a service caters for is likely to influence the amount or the type of resources required (especially staffing) driving variation in hourly cost. The Frontier research found that for settings with no children in receipt of the Early Years Pupil Premium the unit cost is higher. The research also found that settings with proportions of children in receipt of EYPP in the middle (low) group have the lowest mean hourly cost and all differences across the three categories are statistically significant. This potential driver may be related to deprivation indicators and may also be influenced by the location of the service as these can impact the cost of resources and parental ability to pay fees as well as demand for services. Not possible / relevant
Levels of siblings Where there are higher levels of siblings there may be greater discounts applied. Not used
Average group size
F: 12, 14, 15, 50, 51, 64, 68, 69, 70, 100, 101, 108, 109, 112, 114, 115, 116, 117,
Smaller group sizes are likely to have higher costs as there is potentially a higher child to staff ratio (these potential drivers are likely to be related) and therefore have higher staff costs. There may also be an impact of economies of scale in relation to larger services with larger rooms. The Frontier research found some statistically significant findings in relation to group size.
Average number of children by age band. It may be appropriate to also create a grouped variable similar to that used by Frontier, of low, middle and high or similar, with thresholds chosen to give similar group sizes instead of using a continuous variable.
Age of the youngest child
F: 13, 14, 62, 63, 76, 89, 90, , 95, 96, 105, 108, 111, 113, 116, 116, 117
Evidence from the Frontier research shows that having children under 2 is associated with having a lower hourly delivery cost for 3 and 4 year olds. This may be more of a function of other factors, such as those services where there are 2 year olds being larger than the services that do not include them. The research did not identify any obvious reason why this was the case. The Frontier research showed multicollinearity between the age of the youngest child and whether the service is open all year round.
A single age figure for the youngest child in the service's care, or could be grouped variables - e.g., under 2, 2, 3 or 4, school age

Final Report to Department of Children & Youth Affairs: Cost of Providing Quality Childcare 168
Table A1: Descriptive analysis of categorical variables (continues overleaf)
Variable Category Frequency Percent
Size Small 142 25.0
Medium 143 25.2
Large 141 24.8
Very large 142 25.0
Total 568 100
Organisation type Community/Voluntary Organisation 175 30.8
Private Enterprise 393 69.2
Total 568 100
Premises type Commercial building owned by service provider 95 16.7
Domestic building owned by service provider 156 27.5
Premises with a commercial lease 73 12.9
Premises with a non-commercial lease 110 19.4
Premises without formal lease arrangements 117 20.6
(missing) 17 3.0
Total 568 100
Entity type Company limited by guarantee 170 29.9
Company limited by shares 69 12.2
Other 24 4.2
Partnership 23 4.1
Sole trader 271 47.7
(missing) 11 1.9
Total 568 100
Multisite provider No 522 91.9
Yes 46 8.1
Total 568 100
ECCE only mixed 301 53.0
no 55 9.7
yes 212 37.3
Total 568 100
High capitation No 295 51.9
Yes 273 48.1
Total 568 100
Local deprivation Affluent 41 7.2
Disadvantaged 38 6.7
Extremely Disadvantaged 1 0.2
Marginally below average 247 43.5
Marginally above average 237 41.7
Very Disadvantaged 2 0.4
(missing) 2 0.4
Total 568 100

Final Report to Department of Children & Youth Affairs: Cost of Providing Quality Childcare 169
Table A1 (continued): Descriptive analysis of categorical variables (continues
overleaf)
Variable Category Frequency Percent
Provides full day service No 399 70.3
Yes 169 29.8
Total 568 100
Provides morning service No 54 9.5
Yes 514 90.5
Total 568 100
Provides afternoon service No 395 69.5
Yes 173 30.5
Total 568 100
Provides breakfast service No 458 80.6
Yes 110 19.4
Total 568 100
Provides after school service No 360 63.4
Yes 208 36.6
Total 568 100
Provides part-time service No 403 71.0
Yes 165 29.1
Total 568 100
Provides out-of-term service No 449 79.1
Yes 119 21.0
Total 568 100

Final Report to Department of Children & Youth Affairs: Cost of Providing Quality Childcare 170
Table A1 (continued): Descriptive analysis of categorical variables (continues
overleaf)
Variable Category Frequency Percent
Quality No 551 97.0
Yes 17 3.0
Total 568 100
Open most of year No (38-46 weeks) 403 71.0
Yes (47-52 weeks) 165 29.1
Total 568 100
Graduate led No 224 39.4
Yes 344 60.6
Total 568 100
CPD mandatory No 85 15.0
Yes all 313 55.1
Yes care 145 25.5
(missing) 25 4.4
Total 568 100
CPD leave outside work hours 280 49.3
paid leave 159 28.0
paid overtime 30 5.3
unpaid leave 62 10.9
(missing) 37 6.5
Total 568 100
Youngest child Less than 12 months 99 17.4
12-23 months 44 7.8
24-35 months 75 13.2
3-5 years 309 54.4
School age 22 3.9
(missing) 19 3.4
Total 568 100

Final Report to Department of Children & Youth Affairs: Cost of Providing Quality Childcare 171
Table A1 (continued): Descriptive analysis of categorical variables
Variable Category Frequency Percent
Rurality Rural 238 41.9
Urban 330 58.1
Total 568 100
Region Border 45 7.9
Dublin 143 25.2
Mid-East 88 15.5
Mid-West 70 12.3
Midlands 34 6.0
South East 51 9.0
South-West 81 14.3
West 56 9.9
Total 568 100
County Carlow 6 1.1
Cavan 13 2.3
Clare 20 3.5
Cork 64 11.3
Donegal 13 2.3
Dublin 143 25.2
Galway 40 7.0
Kerry 17 3.0
Kildare 23 4.1
Kilkenny 16 2.8
Laois 11 1.9
Leitrim 1 0.2
Limerick 20 3.5
Longford 5 0.9
Louth 15 2.6
Mayo 11 1.9
Meath 28 4.9
Monaghan 7 1.2
Offaly 10 1.8
Roscommon 5 0.9
Sligo 11 1.9
Tipperary 30 5.3
Waterford 8 1.4
Westmeath 8 1.4
Wexford 21 3.7
Wicklow 22 3.9
Total 568 100

Final Report to Department of Children & Youth Affairs: Cost of Providing Quality Childcare 172
Figure A1: Histogram of percent hours filled
Figure A2: Histogram of average staff-child factor
050
10
015
020
0
Fre
quen
cy
0 .2 .4 .6 .8 1percfilled
050
10
015
020
0
Fre
quen
cy
0 1 2 3childadult

Final Report to Department of Children & Youth Affairs: Cost of Providing Quality Childcare 173
Figure A3: Histogram of average group size
Figure A4: Histogram of average staff qualification level
020
40
60
80
Fre
quen
cy
0 10 20 30 40 50avegroupsize
050
10
015
0
Fre
quen
cy
5 6 7 8 9weightedlevel

Final Report to Department of Children & Youth Affairs: Cost of Providing Quality Childcare 174
Figure A5: Histogram of percent non-contact hours
Figure A6: Histogram of staff turnover (percent)
020
40
60
80
Fre
quen
cy
0 .2 .4 .6 .8 1percconthrs
0
10
020
030
040
0
Fre
quen
cy
0 .2 .4 .6 .8 1staffturnover

Final Report to Department of Children & Youth Affairs: Cost of Providing Quality Childcare 175
Figure A7: Histogram of unit cost
Figure A8: Histogram of percent fees income
020
40
60
80
Fre
quen
cy
0 5 10 15unitcost
050
10
015
020
025
0
Fre
quen
cy
0 .2 .4 .6 .8 1percfeesinc

Final Report to Department of Children & Youth Affairs: Cost of Providing Quality Childcare 176
Figure A9: Histogram of percent ECCE income
Table A2: Summary of missing cases by variable
Variable Missing
Ave. staff-child factor 1
Ave. staff qual. level 1
Ave. group size 19
Premises type 17
Entity type 11
Local deprivation 2
CPD type 25
CPD leave 37
Youngest children 19
050
10
015
0
Fre
quen
cy
0 .2 .4 .6 .8 1percecceinc

Final Draft Report to Department of Children & Youth Affairs: Cost of Providing Quality Childcare 177
Table A3: Summary of missing data patterns by variables with missing data (missing = 0)
Patterns of missingness
Local deprivation
Entity type Premises type Youngest children CPD type CPD leave
% of missing cases
Ave. sta
ff-c
hild
facto
r
Ave. sta
ff q
ual. level
Ave. gro
up s
ize
Dis
advanta
ged
Marg
inally
belo
w a
vera
ge
Marg
inally
above a
vera
ge
Lim
ited b
y s
hare
s
Oth
er
Part
ners
hip
Sole
tra
der
Dom
estic o
wned
Com
merc
ial le
ase
Non
-com
merc
ial le
ase
No form
al le
ase
12
-23 m
on
ths
24
-35 m
on
ths
3-5
years
School age
Yes -
all
sta
ff
Yes -
care
sta
ff
Paid
leave
Paid
overt
ime
Unpaid
leave
86% 1 1 1 1 1 1 1 1 1 1 1 1 1 1 1 1 1 1 1 1 1 1 1
4% 1 1 1 1 1 1 1 1 1 1 1 1 1 1 1 1 1 1 0 0 0 0 0
3% 1 1 0 1 1 1 1 1 1 1 1 1 1 1 0 0 0 0 1 1 1 1 1
3% 1 1 1 1 1 1 1 1 1 1 1 1 1 1 1 1 1 1 1 1 0 0 0
1% 1 1 1 1 1 1 0 0 0 0 0 0 0 0 1 1 1 1 1 1 1 1 1
1% 1 1 1 1 1 1 1 1 1 1 0 0 0 0 1 1 1 1 1 1 1 1 1
<1% 1 1 1 1 1 1 1 1 1 1 1 1 1 1 1 1 1 1 0 0 1 1 1
<1% 1 1 1 1 1 1 0 0 0 0 1 1 1 1 1 1 1 1 1 1 1 1 1
<1% 1 1 1 0 0 0 1 1 1 1 1 1 1 1 1 1 1 1 1 1 1 1 1
<1% 0 1 0 1 1 1 1 1 1 1 1 1 1 1 0 0 0 0 1 1 1 1 1
<1% 1 0 1 1 1 1 1 1 1 1 1 1 1 1 1 1 1 1 1 1 1 1 1
<1% 1 1 0 1 1 1 1 1 1 1 0 0 0 0 0 0 0 0 1 1 1 1 1
<1% 1 1 0 1 1 1 1 1 1 1 1 1 1 1 0 0 0 0 1 1 0 0 0

Final Draft Report to Department of Children & Youth Affairs: Cost of Providing Quality Childcare 178
Table A4: Pairwise correlations for all variables except region and county (continued overleaf)
Column
Col. Variable Categories 1 2 3 4 5 6 7 8 9 10 11 12 13 14 15 16 17 18 19 20 21 22 23 24
1 Unit cost 1.00
2 Percent hours f illed 1.00
3 Ave. staff-child factor -0.10 1.00
4 Ave. staff qual. level 0.13 1.00
5 Percent non-contact hours 0.28 0.13 0.19 1.00
6 Percent fees income -0.30 -0.09 -0.37 1.00
7 Percent ECCE income 0.18 0.16 0.38 -0.77 1.00
8 Staff turnover -0.09 0.09 0.17 -0.12 1.00
9 Ave. group size 0.19 0.16 -0.19 0.11 1.00
10 Size Medium 0.19 0.18 -0.29 0.24 0.13 1.00
11 Large -0.22 -0.16 -0.33 1.00
12 Very large -0.44 -0.10 -0.35 0.58 -0.61 0.13 -0.13 -0.33 -0.33 1.00
13 Premises type Domestic ow ned 0.13 0.10 0.23 -0.16 0.28 -0.19 -0.09 -0.21 1.00
14 Commercial lease -0.10 0.21 -0.17 0.10 0.22 -0.25 1.00
15 Non-commercial lease -0.09 -0.10 0.13 -0.31 -0.20 1.00
16 No formal lease -0.15 0.14 0.09 -0.12 -0.33 -0.20 -0.26 1.00
17 Entity type Limited by shares -0.13 -0.09 -0.16 0.42 -0.28 0.09 -0.16 0.09 0.24 -0.13 0.21 1.00
18 Other 0.13 -0.10 1.00
19 Partnership 1.00
20 Sole trader 0.12 0.12 0.28 -0.28 0.44 -0.13 0.16 -0.12 -0.32 0.41 -0.22 -0.11 -0.37 -0.21 -0.20 1.00
21 Multisite provider Yes 0.23 -0.22 0.10 -0.10 0.17 -0.13 0.10 0.32 -0.29 1.00
22 Services provided Full day -0.30 -0.11 -0.08 -0.38 0.64 -0.66 0.14 -0.29 -0.36 0.74 -0.23 0.19 -0.16 0.27 -0.33 0.12 1.00
23 Morning sessions -0.14 0.19 -0.20 0.40 -0.09 -0.08 0.18 -0.12 1.00
24 Afternoon sessions -0.19 -0.15 0.10 0.17 -0.10 0.13 0.21 1.00
25 Breakfast club -0.34 -0.29 0.39 -0.42 -0.25 0.47 -0.13 0.17 -0.22 0.41
26 After school club -0.34 -0.13 -0.09 -0.29 0.47 -0.62 -0.29 0.16 0.53 -0.25 0.15 0.23 -0.32 0.11 0.49
27 Part-time -0.28 -0.11 -0.31 0.41 -0.47 -0.21 -0.24 0.52 -0.21 0.13 -0.29 0.54 0.12
28 Out of term -0.32 -0.24 0.46 -0.50 0.08 -0.10 -0.28 0.58 -0.14 0.09 -0.14 0.21 -0.27 0.57
29 Rurality Urban 0.16 0.09 0.10 -0.16 0.17 0.16 0.10 -0.13 0.17
30 Local deprivation Disadvantaged -0.15 -0.09 0.13 -0.08 0.11 -0.16 -0.16
31 Marginally below average 0.10 0.08 0.13 -0.09 0.09 -0.11
32 Marginally above average -0.09 -0.14 -0.09 0.11
33 Quality aw ard Yes 0.10
34 High capitation Yes 0.10 0.44 0.08 0.10 0.20 -0.12 0.21 0.16 0.17
35 ECCE only No 0.15 -0.17 0.08 0.20 -0.41 0.11 -0.18 0.12 -0.99 -0.20
36 Yes 0.30 0.19 -0.09 0.37 -0.51 0.61 -0.12 0.09 0.17 -0.30 -0.45 0.28 -0.16 -0.21 0.33 -0.15 -0.49 0.25 -0.12
37 Graduate led Yes 0.60 0.15 -0.16 0.14 0.23 0.10 -0.11 0.22 0.15
38 Open most of year Yes -0.31 -0.09 -0.10 -0.36 0.60 -0.67 0.17 -0.24 -0.34 0.71 -0.25 0.14 -0.09 0.21 -0.39 0.15 0.76 -0.12 0.12
39 CPD type Yes - all staff -0.11
40 Yes - care staff -0.12
41 CPD leave Paid leave 0.11
42 Paid overtime -0.09 -0.09
43 Unpaid leave -0.09 -0.11 -0.09
44 Youngest children 12-23 months -0.13 0.19 -0.23 -0.16 0.16 -0.09 0.12 0.11 0.30 -0.09
45 24-35 months -0.11 0.15 -0.09
46 3-5 years 0.19 0.13 0.32 -0.54 0.68 -0.11 0.19 0.21 -0.55 0.23 -0.16 -0.17 0.31 -0.11 -0.60 0.28 -0.12
47 School age -0.27 0.13 -0.30 0.16 0.10 0.09 -0.11 -0.13 -0.57 -0.12
48 Organisation type Private enterprise 0.17 0.10 0.18 0.28 -0.10 -0.12 0.34 0.14 -0.32 -0.17 0.24 -0.22 0.14 0.65 -0.13 0.17

Final Draft Report to Department of Children & Youth Affairs: Cost of Providing Quality Childcare 179
Table A4 (continued): Pairwise correlations for all variables except region and county
Column
Col. Variable Categories 25 26 27 28 29 30 31 32 33 34 35 36 37 38 39 40 41 42 43 44 45 46 47 48
25 Breakfast club 1.00
26 After school club 0.59 1.00
27 Part-time 0.30 0.39 1.00
28 Out of term 0.53 0.64 0.39 1.00
29 Rurality Urban -0.13 1.00
30 Local deprivation Disadvantaged 0.12 0.11 1.00
31 Marginally below average -0.14 -0.25 1.00
32 Marginally above average -0.14 -0.24 -0.75 1.00
33 Quality aw ard Yes 1.00
34 High capitation Yes 0.20 0.13 0.16 0.19 0.10 1.00
35 ECCE only No 0.13 0.16 -0.08 -0.16 1.00
36 Yes -0.38 -0.59 -0.49 -0.40 -0.10 0.13 -0.14 -0.25 1.00
37 Graduate led Yes 0.16 0.20 0.18 0.18 0.09 -0.09 0.10 0.73 -0.20 1.00
38 Open most of year Yes 0.41 0.49 0.60 0.58 0.11 0.14 0.13 -0.49 0.22 1.00
39 CPD type Yes - all staff -0.09 0.11 1.00
40 Yes - care staff -0.10 0.16 0.09 -0.70 1.00
41 CPD leave Paid leave 0.10 1.00
42 Paid overtime -0.16 1.00
43 Unpaid leave -0.24 -0.09 1.00
44 Youngest children 12-23 months 0.15 0.29 0.18 0.10 0.09 -0.22 0.27 1.00
45 24-35 months -0.08 -0.25 -0.12 1.00
46 3-5 years -0.26 -0.47 -0.45 -0.41 -0.14 -0.28 0.62 -0.16 -0.62 -0.33 -0.45 1.00
47 School age 0.25 -0.13 -0.17 0.56 -0.14 -0.13 -0.23 1.00
48 Organisation type Private enterprise -0.11 -0.18 -0.22 -0.13 0.08 -0.26 0.20 -0.12 0.09 -0.18 0.18 -0.25 0.20 -0.10 1.00

Final Draft Report to Department of Children & Youth Affairs: Cost of Providing Quality Childcare 180
Table A5: Results of saturated model (without region or county, N = 487)
Variable Category Coef. Std. Err. P-value lower CI upper CI
Size Medium -0.351 0.218 0.108 -0.780 0.077
Large -0.812 0.297 0.007 -1.397 -0.228 **
Very large -2.694 0.425 0.000 -3.529 -1.860 ***
Percent hours filled -0.842 0.415 0.043 -1.659 -0.026 *
Ave. staff-child factor -0.291 0.350 0.405 -0.979 0.396
Premises type Domestic owned 0.083 0.238 0.727 -0.384 0.551
Commercial lease 0.026 0.271 0.925 -0.507 0.558
Non-commercial lease -0.116 0.248 0.641 -0.603 0.372
No formal lease -0.422 0.249 0.091 -0.911 0.067
Entity type Limited by shares -0.339 0.386 0.381 -1.099 0.420
Other -0.440 0.357 0.219 -1.141 0.262
Partnership -0.303 0.469 0.519 -1.225 0.619
Sole trader -0.813 0.358 0.023 -1.516 -0.110 *
Multisite provider Yes 0.105 0.274 0.702 -0.433 0.642
Services provided Full day 0.373 0.319 0.243 -0.254 1.000
Afternoon sessions 0.460 0.175 0.009 0.116 0.805 **
Breakfast club -0.165 0.235 0.483 -0.627 0.297
After school club -0.002 0.257 0.993 -0.508 0.504
Part-time -0.356 0.210 0.091 -0.769 0.057
Out of term -0.380 0.261 0.145 -0.893 0.132
Rurality Urban 0.378 0.157 0.016 0.070 0.686 *
Local deprivation Disadvantaged -0.644 0.392 0.101 -1.413 0.126
Marginally below average -0.053 0.295 0.857 -0.633 0.527
Marginally above average -0.297 0.300 0.322 -0.887 0.292
Quality award Yes -0.667 0.385 0.084 -1.424 0.091
High capitation Yes 0.323 0.215 0.134 -0.100 0.746
ECCE only No 1.791 0.341 0.000 1.121 2.462 ***
Yes 0.511 0.242 0.036 0.035 0.986 *
Ave. staff qual. level
0.141 0.152 0.355 -0.158 0.441
Graduate led Yes 0.138 0.254 0.586 -0.360 0.637
CPD type Yes - all staff -0.013 0.202 0.949 -0.409 0.384
Yes - care staff 0.028 0.226 0.903 -0.417 0.472
CPD leave Paid leave -0.097 0.159 0.541 -0.410 0.215
Paid overtime -0.217 0.309 0.483 -0.824 0.390
Unpaid leave -0.112 0.231 0.627 -0.567 0.342
Youngest children 12-23 months -0.137 0.320 0.670 -0.767 0.493
24-35 months -0.662 0.368 0.073 -1.386 0.062
3-5 years -0.870 0.379 0.022 -1.615 -0.124 *
School age -3.707 0.636 0.000 -4.956 -2.458 ***
Percent non-contact hours 1.675 0.612 0.006 0.471 2.878 **
Percent fees income
-2.490 0.502 0.000 -3.478 -1.503 ***
Percent ECCE income -2.795 0.509 0.000 -3.796 -1.794 ***
Staff turnover -0.546 0.365 0.136 -1.263 0.171
Ave. group size -0.012 0.015 0.439 -0.041 0.018
Organisation type Private enterprise 0.332 0.369 0.368 -0.392 1.057
Open most of year Yes -0.713 0.302 0.019 -1.307 -0.119 *
_model_constant 7.856 1.262 0.000 5.375 10.337 ***

Final Draft Report to Department of Children & Youth Affairs: Cost of Providing Quality Childcare 181
Table A6: Results of final model with added fixed effects for county (N = 530)
Variable Category Coef. Std. Err. P-value lower CI upper
CI
Size Size medium -0.456 0.206 0.028 -0.862 -0.051 *
Size large -0.958 0.272 0.000 -1.492 -0.425 ***
Size v.large -2.961 0.368 0.000 -3.684 -2.239 ***
Percent hours filled -1.161 0.387 0.003 -1.921 -0.401 **
Premises type Domestic owned -0.077 0.230 0.737 -0.530 0.375
Commercial lease 0.055 0.253 0.829 -0.443 0.552
Non-commercial lease -0.245 0.233 0.294 -0.703 0.213
No formal lease -0.497 0.235 0.035 -0.959 -0.035 *
Entity type Limited by shares -0.241 0.255 0.345 -0.741 0.260
Other -0.348 0.348 0.319 -1.032 0.337
Partnership -0.080 0.360 0.824 -0.788 0.628
Sole trader -0.540 0.195 0.006 -0.923 -0.158 **
Services provided Afternoon sessions 0.413 0.169 0.015 0.082 0.745 *
Rurality Urban 0.220 0.163 0.178 -0.100 0.539
High capitation Yes 0.504 0.146 0.001 0.216 0.791 ***
ECCE only No 1.795 0.313 0.000 1.179 2.411 ***
Yes 0.661 0.216 0.002 0.237 1.085 **
Youngest children 12-23 months -0.232 0.314 0.459 -0.849 0.384
24-35 months -0.724 0.326 0.027 -1.363 -0.084 *
3-5 years -0.874 0.330 0.008 -1.523 -0.225 **
School age -2.943 0.549 0.000 -4.022 -1.864 ***
Percent non-contact hours 1.527 0.574 0.008 0.398 2.656 **
Percent fees income -1.989 0.454 0.000 -2.882 -1.096 ***
Percent ECCE income
-2.349 0.462 0.000 -3.258 -1.441 ***
Open most of year Yes -0.620 0.286 0.030 -1.182 -0.059 *
County Cavan -0.749 0.764 0.327 -2.250 0.752
Clare -0.924 0.715 0.197 -2.328 0.481
Cork -0.743 0.655 0.257 -2.029 0.543
Donegal -0.893 0.751 0.235 -2.368 0.581
Dublin -0.364 0.641 0.570 -1.624 0.896
Galway -1.123 0.674 0.097 -2.448 0.202
Kerry -0.896 0.727 0.218 -2.325 0.533
Kildare -0.331 0.696 0.634 -1.700 1.037
Kilkenny -1.118 0.731 0.127 -2.554 0.318
Laois -1.257 0.766 0.101 -2.762 0.248
Leitrim 0.679 1.637 0.679 -2.538 3.896
Limerick -0.934 0.715 0.192 -2.338 0.470
Longford -0.704 0.914 0.441 -2.500 1.092
Louth 0.126 0.739 0.865 -1.327 1.578
Mayo -0.766 0.801 0.340 -2.340 0.808
Meath -0.930 0.691 0.179 -2.288 0.428
Monaghan -2.343 0.922 0.011 -4.155 -0.531 *
Offaly -1.250 0.794 0.116 -2.810 0.310
Roscommon -0.147 0.934 0.875 -1.981 1.687
Sligo -1.186 0.800 0.139 -2.758 0.387
Tipperary -0.819 0.688 0.235 -2.171 0.533
Waterford -1.348 0.818 0.100 -2.954 0.259
Westmeath -1.223 0.816 0.135 -2.827 0.382
Wexford -1.122 0.713 0.116 -2.523 0.279
Wicklow -0.263 0.707 0.711 -1.652 1.127
_model_constant 8.781 0.912 0.000 6.989 10.572 ***

Final Draft Report to Department of Children & Youth Affairs: Cost of Providing Quality Childcare 182
Table A7: Results of final model with added fixed effects for region (N = 530)
Variable Category Coef. Std. Err. P-value lower CI upper CI
Size Size medium -0.434 0.203 0.033 -0.833 -0.034 *
Size large -0.926 0.266 0.001 -1.449 -0.402 ***
Size v.large -2.902 0.359 0.000 -3.608 -2.196 ***
Percent hours filled -1.247 0.373 0.001 -1.979 -0.515 ***
Premises type Domestic owned -0.027 0.226 0.904 -0.472 0.417
Commercial lease 0.099 0.252 0.694 -0.395 0.593
Non-commercial lease -0.189 0.231 0.412 -0.643 0.264
No formal lease -0.446 0.232 0.056 -0.902 0.011
Entity type Limited by shares -0.250 0.250 0.319 -0.742 0.242
Other -0.428 0.344 0.214 -1.102 0.247
Partnership -0.099 0.353 0.778 -0.793 0.594
Sole trader -0.513 0.188 0.007 -0.883 -0.143 **
Services provided Afternoon sessions 0.391 0.165 0.018 0.067 0.716 *
Rurality Urban 0.235 0.158 0.137 -0.075 0.545
High capitation Yes 0.530 0.141 0.000 0.254 0.807 ***
ECCE only No 1.792 0.311 0.000 1.182 2.403 ***
Yes 0.664 0.213 0.002 0.247 1.082 **
Youngest children 12-23 months -0.189 0.304 0.534 -0.786 0.408
24-35 months -0.774 0.315 0.014 -1.393 -0.155 *
3-5 years -0.904 0.321 0.005 -1.534 -0.274 **
School age -3.000 0.532 0.000 -4.045 -1.955 ***
Percent non-contact hours 1.673 0.555 0.003 0.584 2.763 **
Percent fees income
-2.049 0.442 0.000 -2.918 -1.179 ***
Percent ECCE income -2.425 0.454 0.000 -3.317 -1.533 ***
-0.648 0.278 0.020 -1.195 -0.101
Region Dublin 0.676 0.294 0.022 0.098 1.254 *
Mid-East 0.621 0.294 0.035 0.044 1.198 *
Mid-west 0.161 0.302 0.595 -0.433 0.755
Midlands -0.128 0.351 0.715 -0.819 0.562
South 0.035 0.324 0.914 -0.602 0.673
South-West 0.277 0.293 0.345 -0.299 0.853
West 0.100 0.314 0.750 -0.517 0.717
_model_constant 7.769 0.713 0.000 6.367 9.170 ***

Final Draft Report to Department of Children & Youth Affairs: Cost of Providing Quality Childcare 183
Figure A10: Plot of final model residuals against fitted values
Figure A11: Plot of final model residuals against quantiles of the normal distribution
-4-2
02
46
Resid
uals
0 2 4 6 8Fitted values
-4-2
02
46
Resid
uals
-4 -2 0 2 4Inverse Normal

Final Draft Report to Department of Children & Youth Affairs: Cost of Providing Quality Childcare 184
Figure A12: Plot of final model leverage values against residuals
Figure A13: Plot of Cook’s distance against fitted values
0
.05
.1.1
5
Le
vera
ge
0 .01 .02 .03 .04Normalized residual squared
0
.02
.04
.06
.08
.1
Coo
k's
D
0 2 4 6 8Linear prediction

Final Draft Report to Department of Children & Youth Affairs: Cost of Providing Quality Childcare 185
Table A14: Variance inflation factors (above 1) for explanatory variables
Variable Category VIF
Youngest children 3-5 years 6.15
Percent ECCE income 6.08
Size Size v.large 5.70
Open most of year Yes 3.73
Percent fees income 3.65
Size Size large 3.21
Youngest children 24-35 months 2.84
Youngest children School age 2.71
ECCE only Yes 2.60
Premises type Domestic owned 2.50
Premises type No formal lease 2.21
Entity type Sole trader 2.11
Premises type Non-commercial lease 2.08
ECCE only No 1.92
Size Size medium 1.90
Premises type Commercial lease 1.71
Entity type Limited by shares 1.63
Youngest children 12-23 months 1.53
Services provided Afternoon sessions 1.38
Percent non-contact hours 1.38
Entity type Partnership 1.25
Rurality Urban 1.22
Percent hours filled 1.18
High capitation Yes 1.17
Entity type Other 1.14
Related Documents