….……. Document No.: CDRL A002 Revision: Original Date: May 2014 Page: 1 of 123 Document Title: HAMS Final Report (Technical and Financial) Final Report Technical and Financial Hypoxia, Monitoring, and Mitigation System Contract Number: N00014-13-C-0323 Prepared for Office of Naval Research (ONR) Code 342 For the Period July 24, 2013 to May 31, 2014 Submitted By S. J. Mahoney, Principle Investigator Athena GTX, Inc. Des Moines, IA Approved for public release, distribution unlimited

Welcome message from author
This document is posted to help you gain knowledge. Please leave a comment to let me know what you think about it! Share it to your friends and learn new things together.
Transcript

….…….
Document No.:
CDRL A002 Revision: Original
Date: May 2014 Page: 1 of 123
Document Title: HAMS Final Report (Technical and Financial)
Final Report
Technical and Financial
Hypoxia, Monitoring, and Mitigation System
Contract Number: N00014-13-C-0323
Prepared for
Office of Naval Research (ONR) Code 342
For the Period
July 24, 2013 to May 31, 2014
Submitted By
S. J. Mahoney, Principle Investigator
Athena GTX, Inc.
Des Moines, IA
Approved for public release, distribution unlimited

….…….
Document No.:
CDRL A002 Revision: Original
Date: May 2014 Page: 2 of 123
Document Title: HAMS Final Report (Technical and Financial)

….…….
Document No.:
CDRL A002 Revision: Original
Date: May 2014 Page: 3 of 123
Document Title: HAMS Final Report (Technical and Financial)
Table of Contents
1.0 Summary ....................................................................................................................................................................... 7
2.0 Introduction ................................................................................................................................................................. 8
3.0 Methods, Assumptions, and Procedures .......................................................................................................... 9 3.1 Task 1 – Preliminary Research and Documentation ..................................................................... 9
3.2 Task 2 – Develop Parametric Predictive Models ........................................................................... 9
3.3 Task 3 – Algorithm Development and Refinement ..................................................................... 10
3.4 Task 3a – Update the USN Consciousness Model Implementation ............................................ 10
3.5 Task 3b – Determine Model Deficiencies for Hypoxia ................................................................ 10
3.6 Task 3c – Determine Model Deficiencies – Other ....................................................................... 10
3.7 Task 4 – BETA Model Software Development/Definition ........................................................... 10
3.8 Task 5 – (Option) – Concept System Refinement ....................................................................... 11
3.9 Task 6 – Documentation and Deliverables ................................................................................. 11
4.0 Results and Discussion ......................................................................................................................................... 11 4.1 Task 1 – Preliminary Research and Documentation ................................................................... 11
4.1.1 Significantly Relevant Literature Research Results ............................................................. 12
4.1.2 Correlations between ANS and Hypoxia ............................................................................. 16
4.1.3 Relevant Aspects of USN Annotated Bibliography ............................................................. 19
4.1.4 Additional Relevant Literature Search Results.................................................................... 19
4.1.5 Data Provided by ONR......................................................................................................... 21
4.1.6 File Transfer Protocol Site ................................................................................................... 23
4.2 Task 2 – Develop Parametric Predictive Models ......................................................................... 23
4.3 Task 3 – Algorithm Development and Refinement ..................................................................... 28
4.3.1 Task 3a – Update the USN Consciousness Model Implementation .................................... 28
4.3.2 Task 3b – Determine Model Deficiencies for Hypoxia ........................................................ 37
4.3.3 Task 3c – Determine Model Deficiencies - Other ............................................................... 56
4.4 Task 4 – BETA Model Software Development/Definition ........................................................... 56
4.4.1 Parametric Model ............................................................................................................... 57
4.4.2 Unconsciousness Model ..................................................................................................... 67
….…….
Document No.:
CDRL A002 Revision: Original
Date: May 2014 Page: 4 of 123
Document Title: HAMS Final Report (Technical and Financial)
4.5 Task 5 – (Option) – Concept System Refinement ....................................................................... 73
4.6 Task 6 - Deliverables ................................................................................................................... 73
5.0 Financial Results ..................................................................................................................................................... 73 5.1 FY2013 Funding ($170K) ............................................................................................................. 74
5.2 Benchmarks for FY2014 Funding ($286K) ................................................................................... 74
6.0 Schedule and Deliverables .................................................................................................................................. 75 6.1 Schedule ...................................................................................................................................... 75
6.2 Deliverables ................................................................................................................................. 75
6.2.1 Monthly Updates ................................................................................................................ 75
6.2.2 Quarterly Reports ............................................................................................................... 75
6.2.3 Final Report ......................................................................................................................... 75
6.2.4 BETA Software ..................................................................................................................... 75
6.2.5 Option – Trade-off Analysis and Preliminary Specification ................................................ 76
7.0 Conclusion .................................................................................................................................................................. 76
8.0 Recommendations .................................................................................................................................................. 77
9.0 References .................................................................................................................................................................. 77
10.0 Appendix ..................................................................................................................................................................... 78 10.1 Task 1: Preliminary Research and Documentation ..................................................................... 78
10.1.1 Additional Literature Search Results – Abstracts Only ....................................................... 78
10.1.2 Hams File Sharing Management System ............................................................................. 89
10.2 Task 4: BETA Model ..................................................................................................................... 92
10.2.1 Subject Hypoxia Simulation Runs–Parametric Model ........................................................ 92
10.2.2 Subject Hypoxia Simulation Runs – Unconsciousness Model ............................................. 98
10.3 Detailed Financial Spreadsheets (PDF) ..................................................................................... 121
11.0 List of Symbols, Abbreviations and Acronyms ........................................................................................ 122
12.0 Distribution List .................................................................................................................................................... 123
….…….
Document No.:
CDRL A002 Revision: Original
Date: May 2014 Page: 5 of 123
Document Title: HAMS Final Report (Technical and Financial)
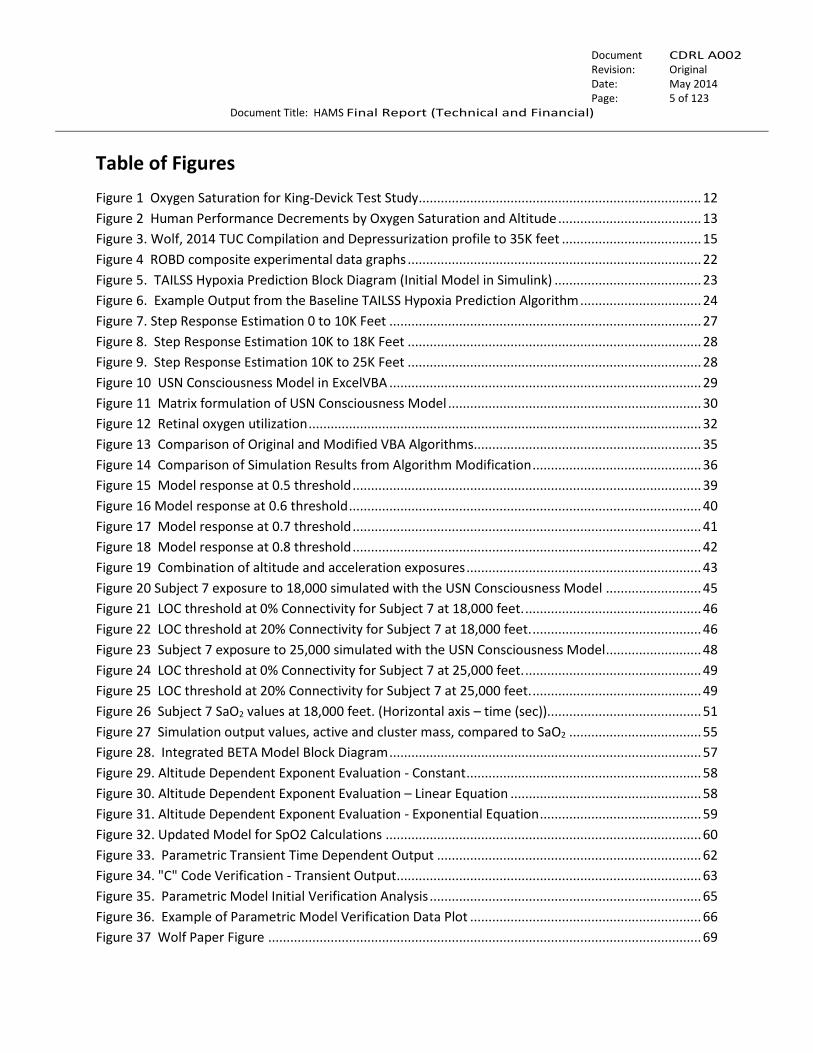
Table of Figures
Figure 1 Oxygen Saturation for King-Devick Test Study ............................................................................. 12
Figure 2 Human Performance Decrements by Oxygen Saturation and Altitude ....................................... 13
Figure 3. Wolf, 2014 TUC Compilation and Depressurization profile to 35K feet ...................................... 15
Figure 4 ROBD composite experimental data graphs ................................................................................ 22
Figure 5. TAILSS Hypoxia Prediction Block Diagram (Initial Model in Simulink) ........................................ 23
Figure 6. Example Output from the Baseline TAILSS Hypoxia Prediction Algorithm ................................. 24
Figure 7. Step Response Estimation 0 to 10K Feet ..................................................................................... 27
Figure 8. Step Response Estimation 10K to 18K Feet ................................................................................ 28
Figure 9. Step Response Estimation 10K to 25K Feet ................................................................................ 28
Figure 10 USN Consciousness Model in ExcelVBA ..................................................................................... 29
Figure 11 Matrix formulation of USN Consciousness Model ..................................................................... 30
Figure 12 Retinal oxygen utilization ........................................................................................................... 32
Figure 13 Comparison of Original and Modified VBA Algorithms.............................................................. 35
Figure 14 Comparison of Simulation Results from Algorithm Modification .............................................. 36
Figure 15 Model response at 0.5 threshold ............................................................................................... 39
Figure 16 Model response at 0.6 threshold ................................................................................................ 40
Figure 17 Model response at 0.7 threshold ............................................................................................... 41
Figure 18 Model response at 0.8 threshold ............................................................................................... 42
Figure 19 Combination of altitude and acceleration exposures ................................................................ 43
Figure 20 Subject 7 exposure to 18,000 simulated with the USN Consciousness Model .......................... 45
Figure 21 LOC threshold at 0% Connectivity for Subject 7 at 18,000 feet. ................................................ 46
Figure 22 LOC threshold at 20% Connectivity for Subject 7 at 18,000 feet. .............................................. 46
Figure 23 Subject 7 exposure to 25,000 simulated with the USN Consciousness Model .......................... 48
Figure 24 LOC threshold at 0% Connectivity for Subject 7 at 25,000 feet. ................................................ 49
Figure 25 LOC threshold at 20% Connectivity for Subject 7 at 25,000 feet. .............................................. 49
Figure 26 Subject 7 SaO2 values at 18,000 feet. (Horizontal axis – time (sec)).......................................... 51
Figure 27 Simulation output values, active and cluster mass, compared to SaO2 .................................... 55
Figure 28. Integrated BETA Model Block Diagram ..................................................................................... 57
Figure 29. Altitude Dependent Exponent Evaluation - Constant ................................................................ 58
Figure 30. Altitude Dependent Exponent Evaluation – Linear Equation .................................................... 58
Figure 31. Altitude Dependent Exponent Evaluation - Exponential Equation ............................................ 59
Figure 32. Updated Model for SpO2 Calculations ...................................................................................... 60
Figure 33. Parametric Transient Time Dependent Output ........................................................................ 62
Figure 34. "C" Code Verification - Transient Output ................................................................................... 63
Figure 35. Parametric Model Initial Verification Analysis .......................................................................... 65
Figure 36. Example of Parametric Model Verification Data Plot ............................................................... 66
Figure 37 Wolf Paper Figure ...................................................................................................................... 69

….…….
Document No.:
CDRL A002 Revision: Original
Date: May 2014 Page: 6 of 123
Document Title: HAMS Final Report (Technical and Financial)
Figure 38 Simulation of the Hoffman Altitude Exposure with arbitrary recovery period ......................... 71
Table of Tables
Table 1. Stages of Hypoxia (from DeHart (1985)) ....................................................................................... 14
Table 2. Baseline Algorithm State and %O2 Saturation ............................................................................. 25
Table 3: Comparison of physiological outputs calculated with the initial model and the current model . 26
Table 4. Model R2 Results .......................................................................................................................... 27
Table 5 Consciousness Model Current Variable Storage Requirements ................................................... 31
Table 6 Consciousness Model Current Variable Storage Requirements ................................................... 34
Table 7 Summary Simulation Results ......................................................................................................... 38
Table 8 Experimental Subjective Response for Subject 7 at 18,000 feet ................................................... 47
Table 9 Experimental Subjective Response for Subject 7 at 25,000 feet .................................................. 50
Table 10 Decision value variations for the Neurological State Model ....................................................... 52
Table 11 "C" Code Output Verification – Steady State Output ................................................................... 63
Table 12 Inputs and Outputs of the Customizable Energy Expenditure ..................................................... 67
Table 13 Result summary compared to Hoffman ....................................................................................... 70
Table 14 Result summary compared to Hoffman ....................................................................................... 72

….…….
Document No.:
CDRL A002 Revision: Original
Date: May 2014 Page: 7 of 123
Document Title: HAMS Final Report (Technical and Financial)
1.0 Summary
This final report discusses the technical and financial program status for the period of July 2013 through
May 2014.
The program consists of four baseline tasks and one optional task:
1. Preliminary Research and Documentation 2. Develop Parametric Predictive Models 3. Algorithm Development and Refinement 4. BETA Model Software Development/Definition 5. Concept System Refinement (Option)
Work has been completed on Tasks 1, 2, 3 and 4. The Task 5 option has been exercised and begins in June 2014. Separate documentation and CDRL deliverable will address the results of these efforts and are due in July 2014.
The concentrated effort on the literature search activity (Task 1) has been completed. A File Transfer Protocol (FTP) site has been created to share references and data among the team members and Office of Naval Research (ONR).
The baseline parametric hypoxia modeling effort (Task 2) has been completed. A model to predict %O2 saturation, aircrew state, alveolar pressure of oxygen (PaO2) and alveolar pressure of carbon dioxide (PaCO2) has been converted over to the C programming language. This will allow the algorithm to eventually run on a micro-controller. Additionally the time based algorithms have been adjusted to better represent the physiological response of the human to high altitude hypoxic events.
The conversion of the United States Navy (USN) Consciousness Model (Task 3) has been completed. Initial
verification and sensitivity analysis has shown positive results and the code has been reduced to a size
and complexity that will run on a modest microcontroller. The addition of a hypoxia component to the
acceleration component of the model has demonstrated good results.
The final baseline task (BETA Model Software Development/Definition – Task 4) has been completed. Software algorithms have been developed and progressively refined to predict hypoxia and near-hypoxia conditions. The focus on implementation in a memory-limited, bit-constrained microcontroller has remained a top priority. Existing data has been used as an initial verification tool and the positive results are included in this report.
The baseline parametric algorithm to predict %O2 saturation and aircrew state and the modification of the USN Consciousness Model to predict LOC due to altitude induced hypoxia remain as viable approaches moving into the next phase of development.
….…….
Document No.:
CDRL A002 Revision: Original
Date: May 2014 Page: 8 of 123
Document Title: HAMS Final Report (Technical and Financial)
2.0 Introduction
Special Notice 13-SN-0003 outlined a research thrust entitled “Hypoxia Monitoring, Alert and Mitigation
System” (HAMS) that was launched under the Long Range Broad Agency Announcement (BAA) for Navy
and Marine Corps Science and Technology: ONRBAA13-001. The desired features of the Hypoxia
Monitoring, Alert, and Mitigation System were to predict/detect/warn warfighters of impending hypoxic
events based on individual physiological, environmental, and cognitive monitoring. The stated goal was
to provide optimal protection of military personnel and equipment through intelligent monitoring and
adaptive modeling that accounted for individual differences in tolerance and provided timely
notification/warning aids so personnel could take corrective action before compromise or loss. The team
of Athena GTX (Athena) and Criterion Analysis Incorporated (CAI) collaborated, proposed and won an
award under this effort.
This final report discusses the technical and financial program status for the period of July 2013 through
May 2014. It is intended to inform the Program Officer and Administrative Contracting Officer of the
technical and financial results of the HAMS program.
This algorithm development effort and the approach taken under this project is within the context that
the algorithms developed will eventually need to run on a “fieldable” solution. Consequently the focus
was on algorithms that can run on micro-controller based platforms. As technology evolves from the
laboratory into actual high altitude environments and is then coupled to stress of military operations the
complexity of the issues this program addresses can be realized.
This initial phase of the larger HAMS project vision was focused on algorithm development only. As this
team has developed the current algorithms there has been an eye towards sensor availability for the
future. Previous efforts to date have showed that attempting to reliably peer into the brain from the scalp
surface through the skull with EEG and f-NIRS is neither comfortable nor feasible in a dynamic
laboratory/simulator environment much less in an aircraft; and hence, in our experience, remains suspect
for operational use. Perhaps this program will deliver such a solution; perhaps it is not feasible with
today’s technology. This by no means concludes that the technologies are not innovative or interesting
or that they do not show promise, but the distance between a quiet, sedentary (perhaps anesthetized
subject) and an aviator in flight or ground troops involves a tremendous leap of “technical courage”. We
believe the technology and processing abilities today will allow for a total change in focus from trying to
integrate a comprehensive sensing solution into a flight or ground helmet to one where the needed
solution is not actually near the head or helmet. This insight changes algorithm design. A small,
lightweight, and comfortable monitoring system might eventually be designed to continuously measure
multiple physiological parameters in an effort to track operator state and hypoxia, e.g., from the arm
alone. Sensors which detect SpO2, pulse/pulse rate, ECG, and skin temperature will be researched and
evaluated for integration feasibility with a tactile vibrator for alerting the user to the suspicion of growing
hypoxia. Novel and non-traditional sensor locations and technologies will be investigated as they impact

….…….
Document No.:
CDRL A002 Revision: Original
Date: May 2014 Page: 9 of 123
Document Title: HAMS Final Report (Technical and Financial)
data and algorithm design issues, and advanced signal processing techniques applied, and compared in
this program for extensive technology leveraging. However, all of this will be directly applicable to
effective algorithm design. Each of the different measurements will be entered into a multi-parameter
evolutionary prediction algorithm which outputs a numerical score that correlates to how prevalent any
effects of hypoxia are to the user and to perhaps suggest or anticipate the onset of hypoxia based on
trend data. Depending on the hypoxia algorithm’s output, a signal potentially will be sent wirelessly to an
alarming device integrated into the sensing platform wirelessly, or located in a key area of the users life
support to vibrate which will alert the user if preventative action needs to be taken. No sensing system is
infallible so key iteration rate considerations will need to be established in the algorithm design earlier
than thought necessary to maximize hypoxia code output characteristics and iteration rates needed.
3.0 Methods, Assumptions, and Procedures This section summarizes the Task descriptions for this project.
3.1 Task 1 – Preliminary Research and Documentation
The primary efforts are to review/document cognitive and psychomotor decline with hypoxia. A literature
search will be conducted in the area of cognitive and psychomotor effects of hypoxic hypoxia and
acceleration-induced hypoxia with the purpose of documenting potential experimental results that could
be used to develop parametric models predicting decrement in cognitive and psychomotor performance
and unconsciousness. Validated sensor technology, criteria for measurement, digital signal processing
techniques and codes and state assessment models which outline physiological trends and normal ranges
which can be used to identify and quantify hypoxia or near –hypoxia states as part of an overall
physiological state assessment tool will be identified. Additionally, the potential for detecting or modeling
“hypoxia-like” symptoms will be explored. Areas to explore include, but are not limited to, the effects of:
toxins, spatial disorientation, fatigue and dehydration. In order to facilitate the most efficient use of time
and resources across all performers on this project, Athena will coordinate with ONR on the areas of the
initial literature search and sources found before they are obtained and reviewed. This will reduce the
potential for duplication of effort. It is expected that ONR will share literature and data as appropriate to
reduce duplication of effort on this task.
3.2 Task 2 – Develop Parametric Predictive Models
Based on Task 1, a subset of criteria and models will be selected for use in conceptualization of a directly
applicable approach and trade study rationale. Parametric models will be developed to predict decrement
in cognitive and psychomotor performance and unconsciousness. Particular emphasis will be placed on
model approaches that would work on small, low power computing devices such as microcontrollers.

….…….
Document No.:
CDRL A002 Revision: Original
Date: May 2014 Page: 10 of 123
Document Title: HAMS Final Report (Technical and Financial)
3.3 Task 3 – Algorithm Development and Refinement
Task 3 has an overall basic approach and three specific subtasks. First pass I/O requirements of the
evolving algorithm will be identified and evolved into a solid first pass hypoxia model which could
integrate the preliminary physiological sensors in a pseudo-concept demonstration. Theoretical sensor
placements and I/O requirements that drive model input, outputs, and iteration rates for all three
identified applications will be determined such that the required signals are attained with minimum
intrusiveness to the operators. Emphasis shall be placed on making the software compatible with a TBD
sensor system that is small, lightweight, and comfortable for the end user.
3.4 Task 3a – Update the USN Consciousness Model Implementation
Under US Navy RDT&E funds an acceleration-induced loss of consciousness model was developed and
implemented using Microsoft Visual Basic 5.0. This approach was subsequently updated to include actual
oxygen saturation measures. This model will be converted into an implementation to allow investigation
of model limitations, possible correlation to literature search results of Task 1-2 and embedded software
definition requirements identified in Task 3.
3.5 Task 3b – Determine Model Deficiencies for Hypoxia
The USN Consciousness model was developed for acceleration-induced unconsciousness but with the
addition of actual oxygen saturation values hypoxic hypoxia effects could also be predicted. This task will
document predictive deficiencies for hypoxic hypoxia and acceleration-induced hypoxia and modification
required to improve predictions.
3.6 Task 3c – Determine Model Deficiencies – Other
A series of models are leveraged over from current and previously sponsored programs: Automated
Combat Casualty System (ACCS) state assessment, Hammerhead™ and mini-Medic®. The existing models
and algorithms will be assessed for their applicability to this project and a determination of what can and
cannot be leveraged will be made. This task will then identify predictive and assessment deficiencies and
the modifications needed to improve prediction, detection, mitigation assurance and avoidance.
3.7 Task 4 – BETA Model Software Development/Definition
We will develop, through sequential iterations, a progressively more refined prediction algorithm for
hypoxia and near-hypoxia conditions. This will be based on the contractor approach used to develop the
multi-parameter assessment prediction, assessment, assurance of state, and the USN Model within the
embedded design vision of this Special Notice. Parameters and conditions will be tailored to recognize
and alert the user of complications specifically due to hypoxia. The necessary design features to convert
a Windows® based implementation to a memory-limited, bit-constrained microcontroller implementation
will be documented for possible realization in an optional task project. For each iteration the algorithms
….…….
Document No.:
CDRL A002 Revision: Original
Date: May 2014 Page: 11 of 123
Document Title: HAMS Final Report (Technical and Financial)
and software will be evaluated using existing data and data provided by ONR as it becomes available and
as it relates to this project.
3.8 Task 5 – (Option) – Concept System Refinement
This option continues to refine the approach to meet the Special Notice Objectives and goals with the USN
in an evolving hardware approach platform(s). This is preliminary integration of prospective hardware
approaches in Task 3-4 and the software developed in Task 4 into a preliminary specification. As the USN
or other contractor’s efforts are finalized and selected for possible integration, the contractor will assist
the USN in understanding the trade-offs of integration to hardware platforms, alarm options, mitigation
strategies.
3.9 Task 6 – Documentation and Deliverables
[1] Quarterly Reports - Two quarterly progress reports (CDRL A001)
[2] Final Report - (CDRL A002)
[3] BETA software - Software developed in Task 4 will be provided (CDRL A003)
[4] Option – Trade-off Analyses and Preliminary Specification (CDRL A004)
[5] Monthly Updates - Monthly email updates in Contractor format will be provided
4.0 Results and Discussion
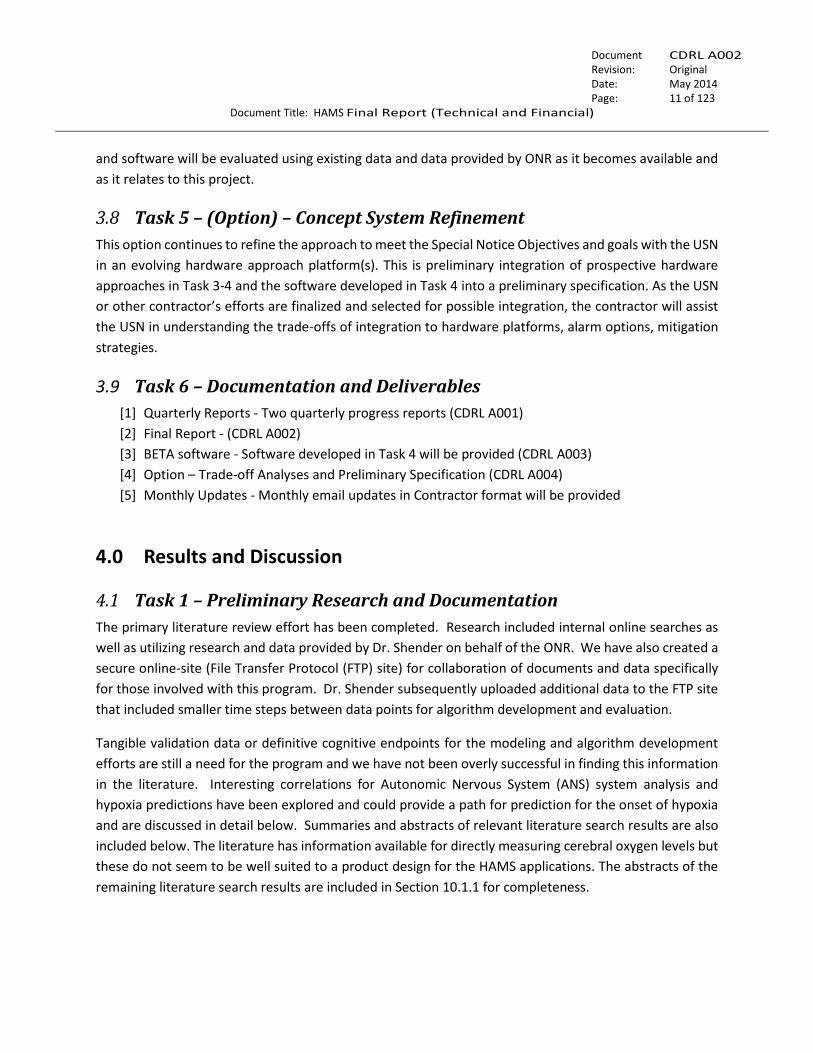
4.1 Task 1 – Preliminary Research and Documentation
The primary literature review effort has been completed. Research included internal online searches as
well as utilizing research and data provided by Dr. Shender on behalf of the ONR. We have also created a
secure online-site (File Transfer Protocol (FTP) site) for collaboration of documents and data specifically
for those involved with this program. Dr. Shender subsequently uploaded additional data to the FTP site
that included smaller time steps between data points for algorithm development and evaluation.
Tangible validation data or definitive cognitive endpoints for the modeling and algorithm development
efforts are still a need for the program and we have not been overly successful in finding this information
in the literature. Interesting correlations for Autonomic Nervous System (ANS) system analysis and
hypoxia predictions have been explored and could provide a path for prediction for the onset of hypoxia
and are discussed in detail below. Summaries and abstracts of relevant literature search results are also
included below. The literature has information available for directly measuring cerebral oxygen levels but
these do not seem to be well suited to a product design for the HAMS applications. The abstracts of the
remaining literature search results are included in Section 10.1.1 for completeness.
….…….
Document No.:
CDRL A002 Revision: Original
Date: May 2014 Page: 12 of 123
Document Title: HAMS Final Report (Technical and Financial)
4.1.1 Significantly Relevant Literature Research Results
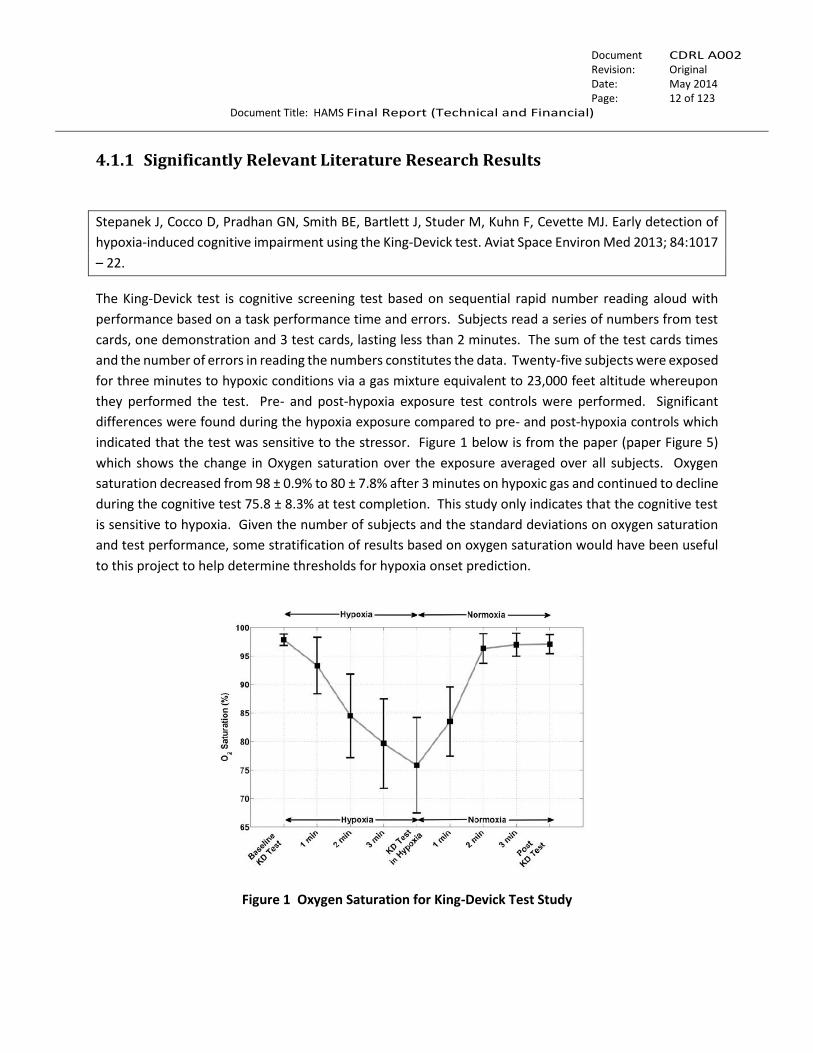
Stepanek J, Cocco D, Pradhan GN, Smith BE, Bartlett J, Studer M, Kuhn F, Cevette MJ. Early detection of
hypoxia-induced cognitive impairment using the King-Devick test. Aviat Space Environ Med 2013; 84:1017
– 22.
The King-Devick test is cognitive screening test based on sequential rapid number reading aloud with
performance based on a task performance time and errors. Subjects read a series of numbers from test
cards, one demonstration and 3 test cards, lasting less than 2 minutes. The sum of the test cards times
and the number of errors in reading the numbers constitutes the data. Twenty-five subjects were exposed
for three minutes to hypoxic conditions via a gas mixture equivalent to 23,000 feet altitude whereupon
they performed the test. Pre- and post-hypoxia exposure test controls were performed. Significant
differences were found during the hypoxia exposure compared to pre- and post-hypoxia controls which
indicated that the test was sensitive to the stressor. Figure 1 below is from the paper (paper Figure 5)
which shows the change in Oxygen saturation over the exposure averaged over all subjects. Oxygen
saturation decreased from 98 ± 0.9% to 80 ± 7.8% after 3 minutes on hypoxic gas and continued to decline
during the cognitive test 75.8 ± 8.3% at test completion. This study only indicates that the cognitive test
is sensitive to hypoxia. Given the number of subjects and the standard deviations on oxygen saturation
and test performance, some stratification of results based on oxygen saturation would have been useful
to this project to help determine thresholds for hypoxia onset prediction.
Figure 1 Oxygen Saturation for King-Devick Test Study

….…….
Document No.:
CDRL A002 Revision: Original
Date: May 2014 Page: 13 of 123
Document Title: HAMS Final Report (Technical and Financial)
This recently published paper is like the majority of papers that put the subjects into a hypoxic state to
measure performance decrement but don’t correlate a measure like oxygen saturation to onset of
cognitive decline.
Thresholds for hypoxia-induced psychomotor and cognitive decrement are needed to serve as warning
indicators based on measured and predicted data. Given the beat-to-beat method in which oxygen
saturation is measured via a pulse oximeter, a certain degree of “inexactness” exists. So it is unlikely that
small differences in SaO2 will matter once a higher level threshold has been crossed. After an
operationally relevant point further impairment thresholds would seem unnecessary. Fulco et al (1988)
summarized the known data on the decrement in human performance in graphical form.
Fulco, C.S. & Cymerman, A. Human performance and acute hypoxia. In: Human Performance Physiology
and Environmental Medicine at Terrestrial Extremes. (Chap 12), K.B. Pandolf, M.N. Sawka, and R.R.
Gonzalez (Eds.) Benchmark Press, Indianapolis, IN: pp 467-495, 1988.
Figure 2 Human Performance Decrements by Oxygen Saturation and Altitude
Figure 2 (ref. Figure 6 in the publication from Fulco et al (1988)) indicates published decrements in human
performance versus altitude and arterial saturation one of which may serve as a preliminary threshold for
the measured pulse oximetry value. Loss of attention and visual acuity at arterial saturation of less than
90% but greater than 85% would be critical initial factors for the pilot or the ground soldier. This graph
can be digitized to get more exact numbers where the original papers may be more difficult to obtain.
This paper also correlates to the discussion in Fundamentals of Aerospace Medicine (DeHart, 1985 page
98) where visual acuity is affected at 3048 meters and SpO2 is between 87% and 98% at altitudes between
….…….
Document No.:
CDRL A002 Revision: Original
Date: May 2014 Page: 14 of 123
Document Title: HAMS Final Report (Technical and Financial)
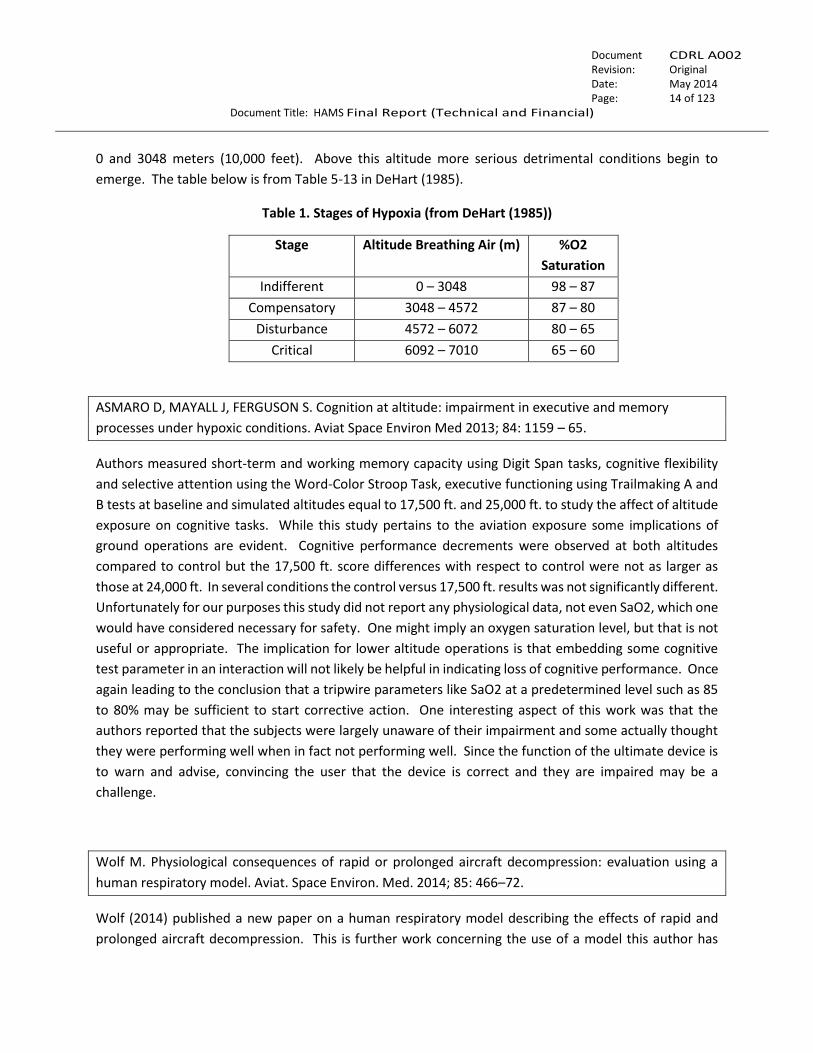
0 and 3048 meters (10,000 feet). Above this altitude more serious detrimental conditions begin to
emerge. The table below is from Table 5-13 in DeHart (1985).
Table 1. Stages of Hypoxia (from DeHart (1985))
Stage Altitude Breathing Air (m) %O2
Saturation
Indifferent 0 – 3048 98 – 87
Compensatory 3048 – 4572 87 – 80
Disturbance 4572 – 6072 80 – 65
Critical 6092 – 7010 65 – 60
ASMARO D, MAYALL J, FERGUSON S. Cognition at altitude: impairment in executive and memory
processes under hypoxic conditions. Aviat Space Environ Med 2013; 84: 1159 – 65.
Authors measured short-term and working memory capacity using Digit Span tasks, cognitive flexibility
and selective attention using the Word-Color Stroop Task, executive functioning using Trailmaking A and
B tests at baseline and simulated altitudes equal to 17,500 ft. and 25,000 ft. to study the affect of altitude
exposure on cognitive tasks. While this study pertains to the aviation exposure some implications of
ground operations are evident. Cognitive performance decrements were observed at both altitudes
compared to control but the 17,500 ft. score differences with respect to control were not as larger as
those at 24,000 ft. In several conditions the control versus 17,500 ft. results was not significantly different.
Unfortunately for our purposes this study did not report any physiological data, not even SaO2, which one
would have considered necessary for safety. One might imply an oxygen saturation level, but that is not
useful or appropriate. The implication for lower altitude operations is that embedding some cognitive
test parameter in an interaction will not likely be helpful in indicating loss of cognitive performance. Once
again leading to the conclusion that a tripwire parameters like SaO2 at a predetermined level such as 85
to 80% may be sufficient to start corrective action. One interesting aspect of this work was that the
authors reported that the subjects were largely unaware of their impairment and some actually thought
they were performing well when in fact not performing well. Since the function of the ultimate device is
to warn and advise, convincing the user that the device is correct and they are impaired may be a
challenge.
Wolf M. Physiological consequences of rapid or prolonged aircraft decompression: evaluation using a
human respiratory model. Aviat. Space Environ. Med. 2014; 85: 466–72.
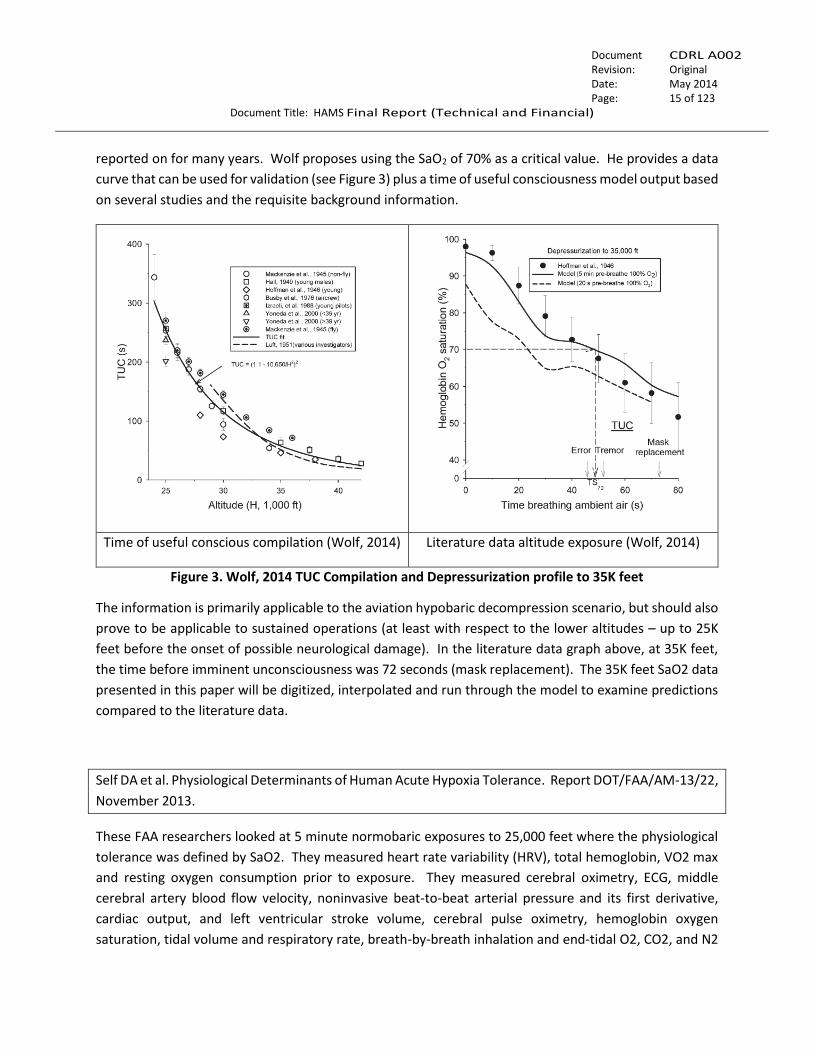
Wolf (2014) published a new paper on a human respiratory model describing the effects of rapid and
prolonged aircraft decompression. This is further work concerning the use of a model this author has
….…….
Document No.:
CDRL A002 Revision: Original
Date: May 2014 Page: 15 of 123
Document Title: HAMS Final Report (Technical and Financial)
reported on for many years. Wolf proposes using the SaO2 of 70% as a critical value. He provides a data
curve that can be used for validation (see Figure 3) plus a time of useful consciousness model output based
on several studies and the requisite background information.
Time of useful conscious compilation (Wolf, 2014) Literature data altitude exposure (Wolf, 2014)
Figure 3. Wolf, 2014 TUC Compilation and Depressurization profile to 35K feet
The information is primarily applicable to the aviation hypobaric decompression scenario, but should also
prove to be applicable to sustained operations (at least with respect to the lower altitudes – up to 25K
feet before the onset of possible neurological damage). In the literature data graph above, at 35K feet,
the time before imminent unconsciousness was 72 seconds (mask replacement). The 35K feet SaO2 data
presented in this paper will be digitized, interpolated and run through the model to examine predictions
compared to the literature data.
Self DA et al. Physiological Determinants of Human Acute Hypoxia Tolerance. Report DOT/FAA/AM-13/22,
November 2013.
These FAA researchers looked at 5 minute normobaric exposures to 25,000 feet where the physiological
tolerance was defined by SaO2. They measured heart rate variability (HRV), total hemoglobin, VO2 max
and resting oxygen consumption prior to exposure. They measured cerebral oximetry, ECG, middle
cerebral artery blood flow velocity, noninvasive beat-to-beat arterial pressure and its first derivative,
cardiac output, and left ventricular stroke volume, cerebral pulse oximetry, hemoglobin oxygen
saturation, tidal volume and respiratory rate, breath-by-breath inhalation and end-tidal O2, CO2, and N2
….…….
Document No.:
CDRL A002 Revision: Original
Date: May 2014 Page: 16 of 123
Document Title: HAMS Final Report (Technical and Financial)
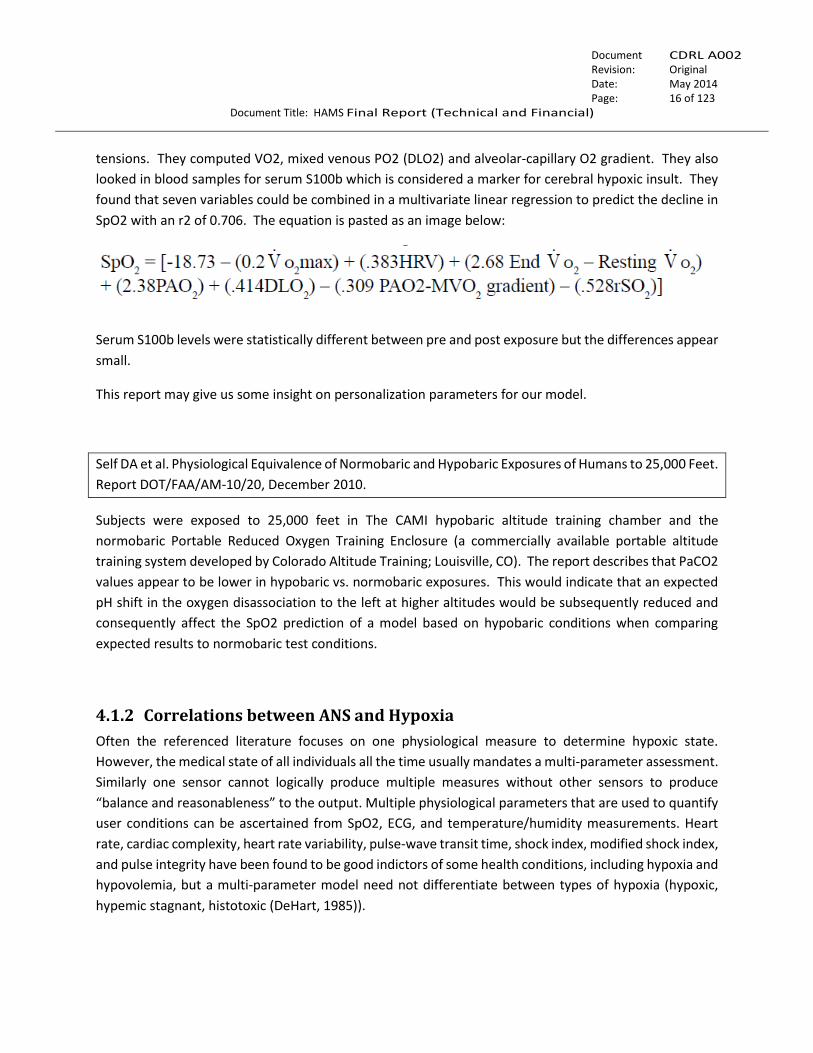
tensions. They computed VO2, mixed venous PO2 (DLO2) and alveolar-capillary O2 gradient. They also
looked in blood samples for serum S100b which is considered a marker for cerebral hypoxic insult. They
found that seven variables could be combined in a multivariate linear regression to predict the decline in
SpO2 with an r2 of 0.706. The equation is pasted as an image below:
Serum S100b levels were statistically different between pre and post exposure but the differences appear
small.
This report may give us some insight on personalization parameters for our model.
Self DA et al. Physiological Equivalence of Normobaric and Hypobaric Exposures of Humans to 25,000 Feet.
Report DOT/FAA/AM-10/20, December 2010.
Subjects were exposed to 25,000 feet in The CAMI hypobaric altitude training chamber and the
normobaric Portable Reduced Oxygen Training Enclosure (a commercially available portable altitude
training system developed by Colorado Altitude Training; Louisville, CO). The report describes that PaCO2
values appear to be lower in hypobaric vs. normobaric exposures. This would indicate that an expected
pH shift in the oxygen disassociation to the left at higher altitudes would be subsequently reduced and
consequently affect the SpO2 prediction of a model based on hypobaric conditions when comparing
expected results to normobaric test conditions.
4.1.2 Correlations between ANS and Hypoxia
Often the referenced literature focuses on one physiological measure to determine hypoxic state.
However, the medical state of all individuals all the time usually mandates a multi-parameter assessment.
Similarly one sensor cannot logically produce multiple measures without other sensors to produce
“balance and reasonableness” to the output. Multiple physiological parameters that are used to quantify
user conditions can be ascertained from SpO2, ECG, and temperature/humidity measurements. Heart
rate, cardiac complexity, heart rate variability, pulse-wave transit time, shock index, modified shock index,
and pulse integrity have been found to be good indictors of some health conditions, including hypoxia and
hypovolemia, but a multi-parameter model need not differentiate between types of hypoxia (hypoxic,
hypemic stagnant, histotoxic (DeHart, 1985)).
….…….
Document No.:
CDRL A002 Revision: Original
Date: May 2014 Page: 17 of 123
Document Title: HAMS Final Report (Technical and Financial)
A multi-variable input and an adaptive scaling code will provide a single numerical value which
corresponds to the urgency of state the subject as well as any trending of state apparent. Specifically, the
diagnosis or reason for that state we express is not as important as the knowledge of the deterioration of
that state as a combined score. Although the common baseline many feel is pulse oximetry we submit
that the difficulty of obtaining a clean pulse oximetry signal in motion is extremely difficult. Similarly,
obtaining a clean cerebral tissue measurement through the scalp is at best highly motion suspect. The
effort cannot therefore overly focus on pulse oximetry and will attempt to derive measurement
techniques centered at early ANS insult leading to hypoxia if uncorrected. But can we understand the role
of the cardiovascular system and ANS relative to generation and management of hypoxia? The review
completed to date has addressed this.
The time course changes in both cardiovascular and autonomic nervous system (ANS) function during
acclimatization to altitude and hypoxia has been widely studied (e.g., Kawaguchi, et. al, 2003; Favret and
Richalet, 2008; Barak, et. al, 2008; Hansen and Sander, 2002; Benoit, et.al., 1997, Iiyori, et. al., 2007/2008
(on line publications); Pellet, et. al., 1997, and Agostoni, et.al, 2000). The bulk of these studies suggest
that the ANS insult defined as a notable change in activity is seen before the cardiovascular change is seen
in many cases and many different trial designs. One might argue that this makes sense since the ANS
drives the vascular response. Although obvious, this is a more difficult measure to take and much harder
to interpret across any individual much less a population. But further, this suggests that looking for a
physiological change in a vital sign recognized by the FDA in HAMS, may suggest that the event has already
occurred and not that it is “going to” occur, i.e., that measure is not considered to be “anticipative” but
“reactive to the event”. In addition, the volatility of data seems to be demographically driven; i.e., the
impact of age, sex and weight are clear. Finally, often the volatility of data is environmentally driven; i.e.,
the effect of cold and heat on the vascular response.
Consider the following, Barak, et.al. (2008) showed, for example, that the tolerance of a group of test
subjects to hypoxia varies substantially among healthy subjects which supported earlier work that some
individuals are simply better performers than others in the hypoxic environment (Stobdan, 2007).
Similarly, the issue of exercise performance and ventilation control and the stimuli driving ventilation as
well as the mechanism of that control in hypoxia, drove a new research trend as much as ten years ago
(Sheel, 2008, Longhurst, 2003). Longhurst’s work neatly outlined the areas of compensation associated
with a subject during progressive ascent to higher altitudes. Although we are not looking at progressive
ascent, it proves a baseline consideration for the mechanisms expected to be seen in HAMS. Longhurst’s
work as well as Sheel's suggest that the HAMS must be reactively able to detect this compensation
dynamically. As the human ascends, changes in cardiovascular parameters of heart rate (tachycardia),
increased cardiac output and changes in flow distribution occur not only at minimal workloads but
certainly at higher levels of stress and performance. In fact, Thompson, et al. (2004) showed that workload
in acute hypoxia further exacerbates the issues of change locally since reduced gas tensions alters not
only skeletal muscle performance, but heart rhythm and in other selected vascular beds such as the
pulmonary arteries and lung tissues. This may lead to leakage, edema and dysfunction (Thompson, et. al,
….…….
Document No.:
CDRL A002 Revision: Original
Date: May 2014 Page: 18 of 123
Document Title: HAMS Final Report (Technical and Financial)
2004). This in turn will impact gas exchange progressively, hence respiratory quotients, tissue oxygenation
and carbon dioxide exhalation. Subsequently, subject acid base balance is progressively changed,
progressive tissue toxicity may occur, and the overall result is that the subject’s performance is expected
to be spiraling downward. The changes or trends therefore become critical to track and measure as they
may provide a better insight to prediction than the values alone.
From the perspective of the cardiovascular system, interactive response neural-hormonal mechanisms
respond quickly during progressive hypoxia including local cardiac and direct vascular control. For
example: studies in normally active subjects produced a three-fold increase in limb blood flow in hypoxia
even in the presence of decreased ventricular stroke volumes (Kennedy, et. al, 2008). In normotensive
environments, local responses are a direct result of autonomic outflow from the brainstem. Hypoxemia
elicits the chemoreceptors, particularly those in the carotid bodies and the medulla, which can essentially
oppose the changes driven by autonomic outflow (Guyton, 1976). Likely in the acute stages of hypoxia
conflicting autonomic drives result in what one subject may manifest as normal ANS activity now
progressively being disrupted. Heart Rate Variability (HRV) and cardiac complexity analysis of ECG RR-
intervals provide measures of ANS tone (Barak, 2008). We know for example that higher workloads
enhance the sympathetic and reduce the parasympathetic responses to the heart. Barak also showed over
five years ago that higher workloads in hypoxemia hinder the typical response and the ratio as described
above. Although the exact mechanisms of control and actions in higher workloads under the presence or
absence of hypoxia are not fully delineated at this point in the literature since then (and likely not
specifically agreed upon by researchers), we feel the near real time tracking of ANS integrity in the subject,
while tracking subject movement or lack of movement via accelerometers, and heart rate complexity may
provide an interesting insight as to the possibility of progressive hypoxia even in the simplest form without
having a measure of blood or cerebral oxygen levels at all. To make this claim would also reap some
disagreement from peers. However, what if this is true? Interestingly, this also suggests that when
peripheral shutdown occurs due to increased sympathetic influences, and pulse oximetry begins to damp
out, this ANS complexity may prove to be even more insightful. The linear stochastic HRV methods are
more commonly known and understood and have been used in hypoxia assessment (Sugimura, et. al.
(2008)). One key thought from Wadhwa, et.al, (2008) however suggests that there is even an undefined
stimulus not currently understood that is absent in normoxia subject states. If correct, this elicits the
subject’s ANS to increase oxygen delivery to the tissues during hypoxia. These stimuli may also be different
in males versus females (Wadhwa, et. al., 2008) Hence, measuring hypoxia via blood oxygen levels alone
or only at the cerebral level may not provide insight as to subjects impending hypoxic condition or state.
We conclude from the research done to date that measurement of autonomic activity, specifically using
novel high speed DSP techniques to separate parasympathetic and sympathetic tone and looking for near
real time changes in the activity as well as trends are clearly a step forward in assessing the progression
of a clinically defined and progressive hypoxic condition well before the hypoxia is seen in any pulse
oximetry system. Our literature support for this hypothesis is present but not overwhelming. However, as
….…….
Document No.:
CDRL A002 Revision: Original
Date: May 2014 Page: 19 of 123
Document Title: HAMS Final Report (Technical and Financial)
a projected product, the HAMS solution approaches should consider this option moving forward into
HAMS II.
4.1.3 Relevant Aspects of USN Annotated Bibliography
Increased age reduces the time before hypoxia appeared, therefore susceptibility to hypoxia
increases with age
Cerebral blood flow velocity was not a good indicator of mental stress during hypoxia
Altitude dependent SaO2 values can be used to predict AMS susceptibility
It took six days of acclimatization for balance to improve over sea-level base value.
Hypoxia leads to a depressed cough reflex
The effects of altitude may be specific to particular cognitive tasks; exercise during altitude results
in decreased mental performance
Hypoxic brain injury is reduce by administration of EPO
Drugs such as alcohol and tobacco can worsen the effects of hypoxia on aviators
Nicergoline offers protective properties against hypoxia-induced injury
Low levels of taurine are associated with a higher susceptibility to hypoxia
Hypobaric hypoxia causes a decrease in olfactory function
HSP70 induced via GGA pretreatment significantly improved tolerance to acute hypoxia
4.1.4 Additional Relevant Literature Search Results
Abraini, J.H., Bouquet, C., Joulia, F., Nicolas, M., & Kriem, B. (1998). Cognitive performance during
simulated climb of Mount Everest: implications for brain function and central adaptive
processes under chronic hypoxic stress. European Journal of Physiology, 463(4), 553-559.
Even though this is a slow ascent, it is controlled, not dynamic in impact and may serve as a corroborating study for establishing thresholds for risk of hypoxia and performance degradation.
Put eight male climbers in a decompression chamber and gradually decompressed them to the altitude of Mount Everest over 31 days. Throughout the 31 days cognitive tests were performed. They found that test subjects performed similar to control subjects up until 5,500 m to 6,500 m, where test subjects performance began to get worse compared to the control subjects.
Limitations: Reasonably the limitations of this work are major. The eight subjects were all experienced climbers. The ascent was gradual rather than fast which would occur in an aircraft. Three subjects had transient strokes during the experiments.
….…….
Document No.:
CDRL A002 Revision: Original
Date: May 2014 Page: 20 of 123
Document Title: HAMS Final Report (Technical and Financial)
Burtscher, Martin, et. al., (2012). Short-term exposure to hypoxia for work and leisure activities in
health and disease: which level of hypoxia is safe? Sleep Breath, 16, 435-442.
May serve as a corroborating study for establishing thresholds for risk of hypoxia and performance degradation.
Looked to determine a safe altitude for people to be at for a “short” amount of time. Found that most high altitude conditions occur above 3000 m, and therefore that altitude is safe for most people. Exceptions include, women who are pregnant, people with diabetes or COPD, and children under 6 weeks.
Limitations: does not ever specify “short” and “extended” periods of time and the exceptions are
common sense. Also, Journal is not commonly seen. Peer review is not established.
Golja, P., Kacin, A., Tipton, M.J., Eiken, O., & Mekjavic, I.B. (Jun 2004). Hypoxia increases the
cutaneous threshold for the sensation of cold. European Journal of Applied Physiology, 92 (1-2),
62-68.
This may lead to looking at additional sensor modalities as part of HAMS to further refine and eliminate false positive/negative indications.
Tested 13 male subjects ability to perceive a temperature change on their toe while breathing a hypoxic gas mixture. They found that a greater difference in temperature was required before a cold sensation was perceived while the test subjects were breathing either a hypobaric or a normobaric hypoxic mixture versus ambient air. There was no significant difference in temperature required to sense a warm sensation.
Allows conclusions that environment impacts sensor performance and perception of the user.
Other thoughts: If temperature perception is hindered, what about other touch sensations such
as pressure, like the controls required to drive the air craft? (Depression in smell sensation during
hypobaric hypoxia was shown in a different study).
King, Allen B., and Robinson, Summer M. (1972) Ventilation Response to Hypoxia and Acute Mountain
Sickness. Aerospace Medicine, 43(4), 419-421.
Information from this study may be used for a subject evaluation algorithm
The study found that subjects who experienced the most severe symptoms of Acute Mountain
Sickness, also shows a significant increase in minute ventilation during the first six hours of a 31
hours simulated decompression at 14,000 ft.
Acute mountain sickness may also have an effect on cognitive ability, especially if symptoms are
severe enough.

….…….
Document No.:
CDRL A002 Revision: Original
Date: May 2014 Page: 21 of 123
Document Title: HAMS Final Report (Technical and Financial)
Martin, Russell L., et. al., (2000). Effect of Normobaric Hypoxia on Sound Localization. Aviation, Space,
and Environmental Medicine, 71, 991-995.
Study found that sound localization was not affected by hypoxia.
May be contrary to other published papers
Have found in numerous studies that some sensations are affected, and some are not, what
causes this differences, and how can we use this to test or evaluate if someone is starting to
become hypoxic.
Tauboll, Erik, et. al., (1997). Cerebral Artery Blood Velocity in Normal Subjects During Acute Decreases
in Barometric Pressure. Aviation, Space, and Environmental Medicine, 70, 692-697.
This may be used to more accurately model the effects of hypoxia
Found that there is an increase in cerebral artery blood velocity due to a decrease in blood oxygen
content rather than the decreased pressure, while studying patients in a hypobaric chamber with
and without supplemental oxygen.
Thoughts: Though a decrease in blood oxygen levels has a similar physiological response at sea
level as when at low air pressure, would the introduction of supplemental oxygen cause the same
physiological response at the same environments?
Yoneda, Ikuo, Tomoda, Masami, Tokumaru, Osamu, Sato, Tetsuo, and Watanabe, Yasuhiro. (2000).
Time of Useful Consciousness Determination in Aircrew Members with Reference to Prior
Altitude Chamber Experience and Age. Aviation, Space, and Environmental Medicine, 71, 72-76.
This may be used to evaluate tolerance to hypoxia based on age
This study compared the time of useful consciousness to the subject’s age, and found that the
younger subjects had a longer time of useful consciousness (TUC) and were more able to tolerate
significantly lower SaO2 levels.
While decompressed to 25,000 ft. TUC of ages 39 and less was 237 seconds, and for those 40 and
older was 202 seconds.
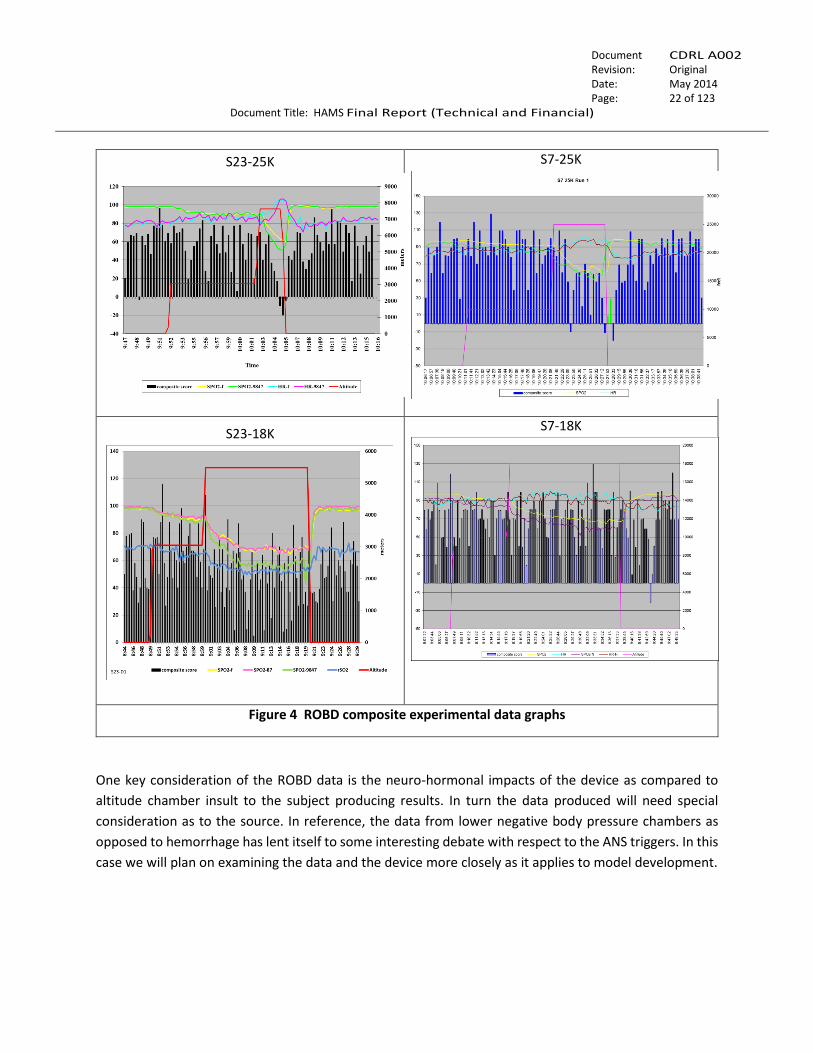
4.1.5 Data Provided by ONR
In addition literature research, we also received data from ONR (Dr. Shender) which examined cognitive
ability while utilizing a ROBD to simulate different altitudes. This data was of tremendous value during
the evaluation phase of this program. A sample of this data is show in Figure 4.
….…….
Document No.:
CDRL A002 Revision: Original
Date: May 2014 Page: 22 of 123
Document Title: HAMS Final Report (Technical and Financial)
S23-25K
S7-25K
S23-18K
S7-18K
Figure 4 ROBD composite experimental data graphs
One key consideration of the ROBD data is the neuro-hormonal impacts of the device as compared to
altitude chamber insult to the subject producing results. In turn the data produced will need special
consideration as to the source. In reference, the data from lower negative body pressure chambers as
opposed to hemorrhage has lent itself to some interesting debate with respect to the ANS triggers. In this
case we will plan on examining the data and the device more closely as it applies to model development.
….…….
Document No.:
CDRL A002 Revision: Original
Date: May 2014 Page: 23 of 123
Document Title: HAMS Final Report (Technical and Financial)
4.1.6 File Transfer Protocol Site
To facilitate collaborative research, the Athena GTX team has created a login protected FTP site where
documents and data can be uploaded. New accounts for each user can be created as necessary and
additional documents and data may be shared using this tool. The procedure for obtaining a user account
and brief instructions on how to use the site are provided in Section 10.1.2.
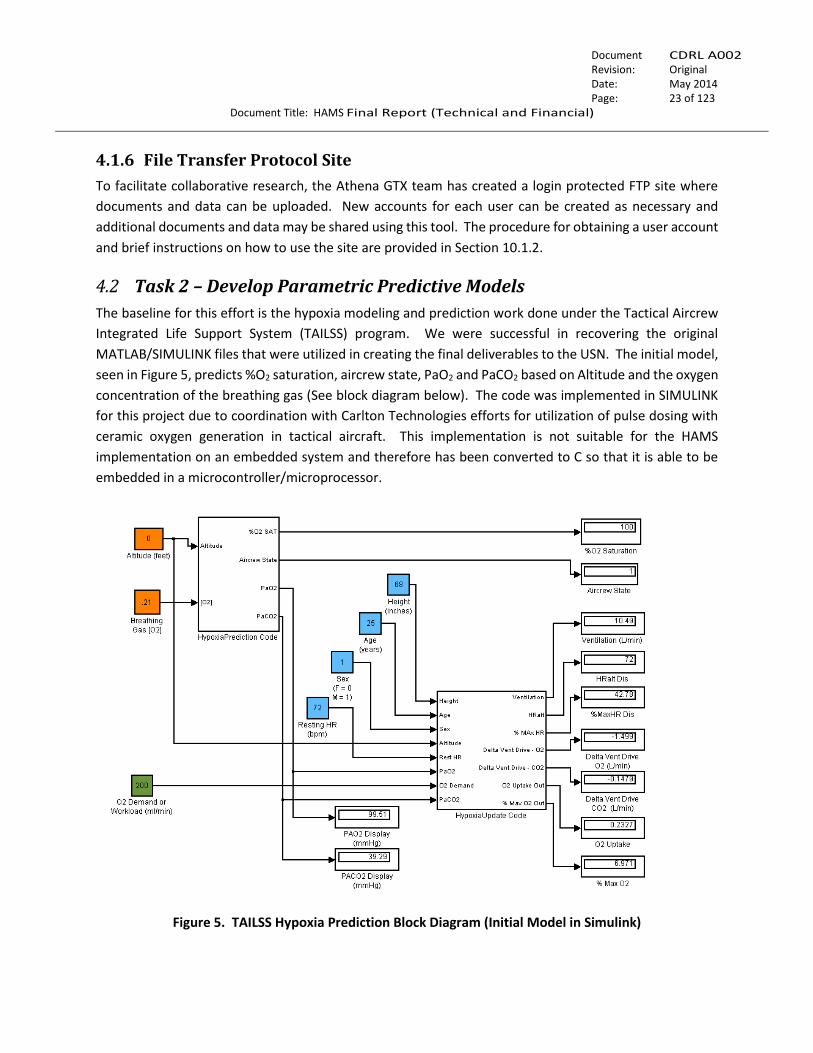
4.2 Task 2 – Develop Parametric Predictive Models
The baseline for this effort is the hypoxia modeling and prediction work done under the Tactical Aircrew
Integrated Life Support System (TAILSS) program. We were successful in recovering the original
MATLAB/SIMULINK files that were utilized in creating the final deliverables to the USN. The initial model,
seen in Figure 5, predicts %O2 saturation, aircrew state, PaO2 and PaCO2 based on Altitude and the oxygen
concentration of the breathing gas (See block diagram below). The code was implemented in SIMULINK
for this project due to coordination with Carlton Technologies efforts for utilization of pulse dosing with
ceramic oxygen generation in tactical aircraft. This implementation is not suitable for the HAMS
implementation on an embedded system and therefore has been converted to C so that it is able to be
embedded in a microcontroller/microprocessor.
Figure 5. TAILSS Hypoxia Prediction Block Diagram (Initial Model in Simulink)

….…….
Document No.:
CDRL A002 Revision: Original
Date: May 2014 Page: 24 of 123
Document Title: HAMS Final Report (Technical and Financial)
The below figure shows an example of the baseline hypoxia prediction algorithm output from the TAILSS
program. The model produces an estimate of %SpO2 as a function of altitude (cabin) and breathing gas
oxygen concentration. It also takes into account pH shifts based on a PaCO2 estimate. The final output
incorporates the following:
Bounds for the SpO2 (0 to 100%),
a delay function and
a transfer function
in order to produce a realistic response to changes in altitude. Although this can be used as a systems
engineering design tool it is not biofidelic enough for HAMS. For the HAMS project further verification
and validation to more closely predict individual physiological responses was undertaken.
Figure 6. Example Output from the Baseline TAILSS Hypoxia Prediction Algorithm
….…….
Document No.:
CDRL A002 Revision: Original
Date: May 2014 Page: 25 of 123
Document Title: HAMS Final Report (Technical and Financial)
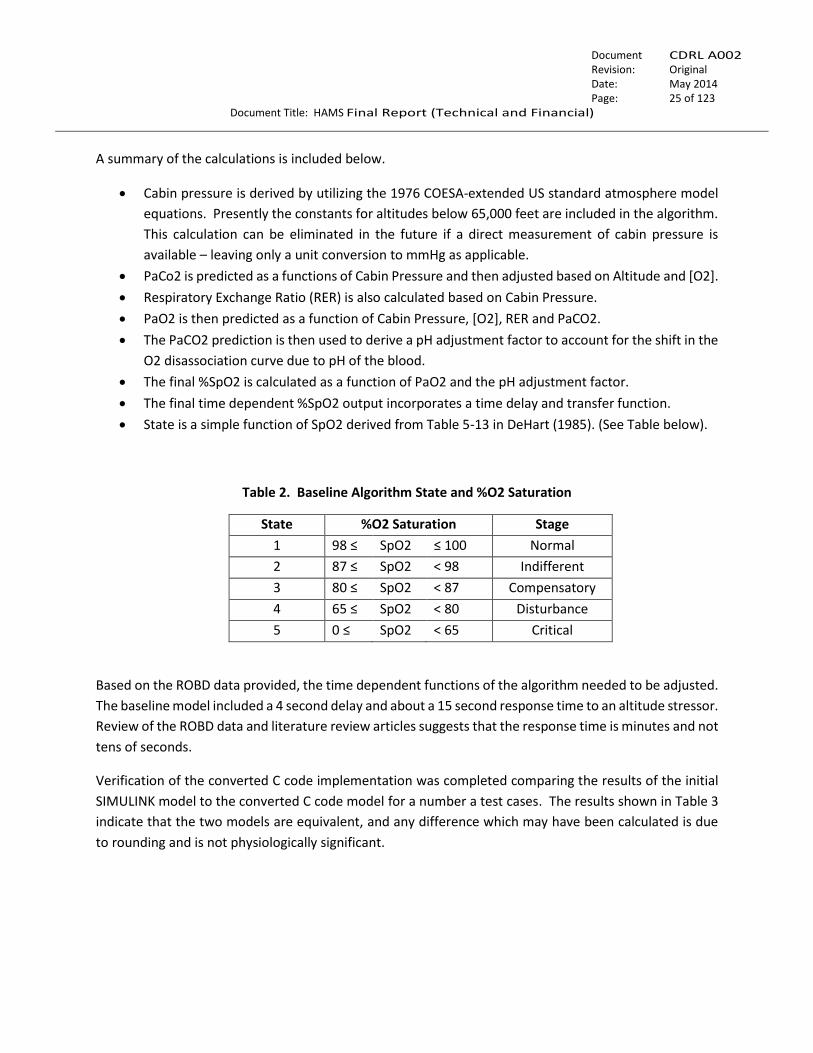
A summary of the calculations is included below.
Cabin pressure is derived by utilizing the 1976 COESA-extended US standard atmosphere model
equations. Presently the constants for altitudes below 65,000 feet are included in the algorithm.
This calculation can be eliminated in the future if a direct measurement of cabin pressure is
available – leaving only a unit conversion to mmHg as applicable.
PaCo2 is predicted as a functions of Cabin Pressure and then adjusted based on Altitude and [O2].
Respiratory Exchange Ratio (RER) is also calculated based on Cabin Pressure.
PaO2 is then predicted as a function of Cabin Pressure, [O2], RER and PaCO2.
The PaCO2 prediction is then used to derive a pH adjustment factor to account for the shift in the
O2 disassociation curve due to pH of the blood.
The final %SpO2 is calculated as a function of PaO2 and the pH adjustment factor.
The final time dependent %SpO2 output incorporates a time delay and transfer function.
State is a simple function of SpO2 derived from Table 5-13 in DeHart (1985). (See Table below).
Table 2. Baseline Algorithm State and %O2 Saturation
State %O2 Saturation Stage
1 98 ≤ SpO2 ≤ 100 Normal
2 87 ≤ SpO2 < 98 Indifferent
3 80 ≤ SpO2 < 87 Compensatory
4 65 ≤ SpO2 < 80 Disturbance
5 0 ≤ SpO2 < 65 Critical
Based on the ROBD data provided, the time dependent functions of the algorithm needed to be adjusted.
The baseline model included a 4 second delay and about a 15 second response time to an altitude stressor.
Review of the ROBD data and literature review articles suggests that the response time is minutes and not
tens of seconds.
Verification of the converted C code implementation was completed comparing the results of the initial
SIMULINK model to the converted C code model for a number a test cases. The results shown in Table 3
indicate that the two models are equivalent, and any difference which may have been calculated is due
to rounding and is not physiologically significant.
….…….
Document No.:
CDRL A002 Revision: Original
Date: May 2014 Page: 26 of 123
Document Title: HAMS Final Report (Technical and Financial)
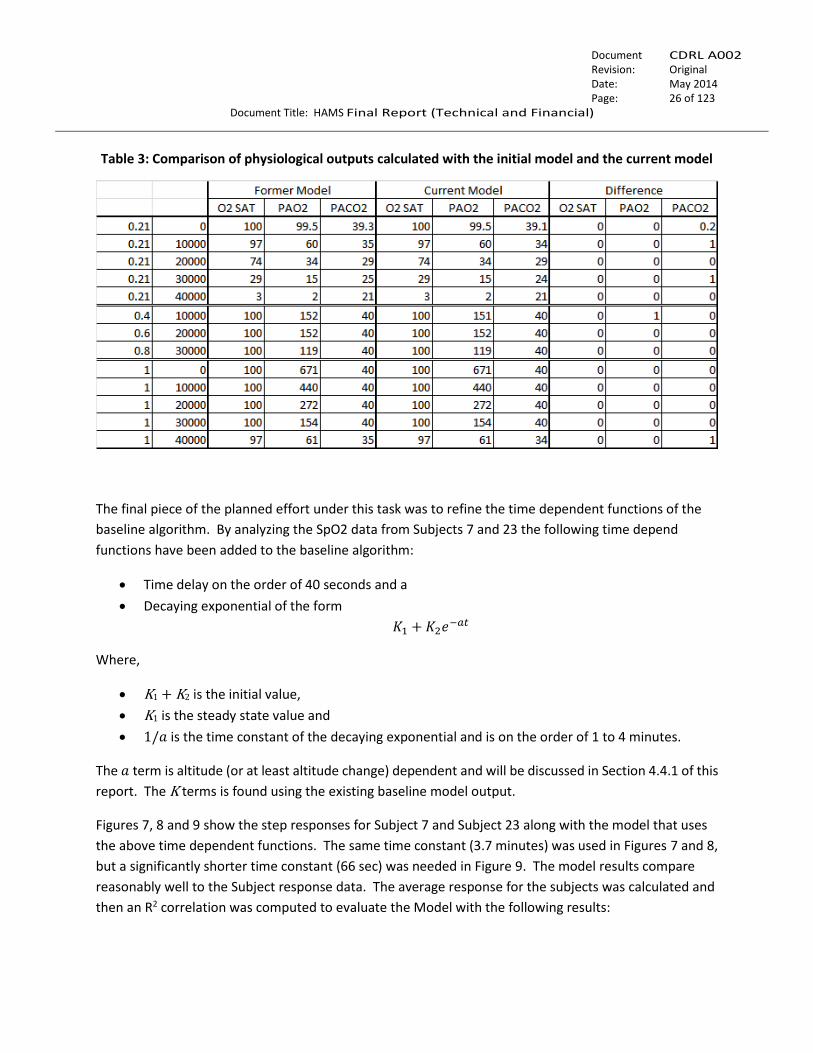
Table 3: Comparison of physiological outputs calculated with the initial model and the current model
The final piece of the planned effort under this task was to refine the time dependent functions of the
baseline algorithm. By analyzing the SpO2 data from Subjects 7 and 23 the following time depend
functions have been added to the baseline algorithm:
Time delay on the order of 40 seconds and a
Decaying exponential of the form
𝐾1 + 𝐾2𝑒−𝑎𝑡
Where,
K1 + K2 is the initial value,
K1 is the steady state value and
1/𝑎 is the time constant of the decaying exponential and is on the order of 1 to 4 minutes.
The 𝑎 term is altitude (or at least altitude change) dependent and will be discussed in Section 4.4.1 of this
report. The K terms is found using the existing baseline model output.
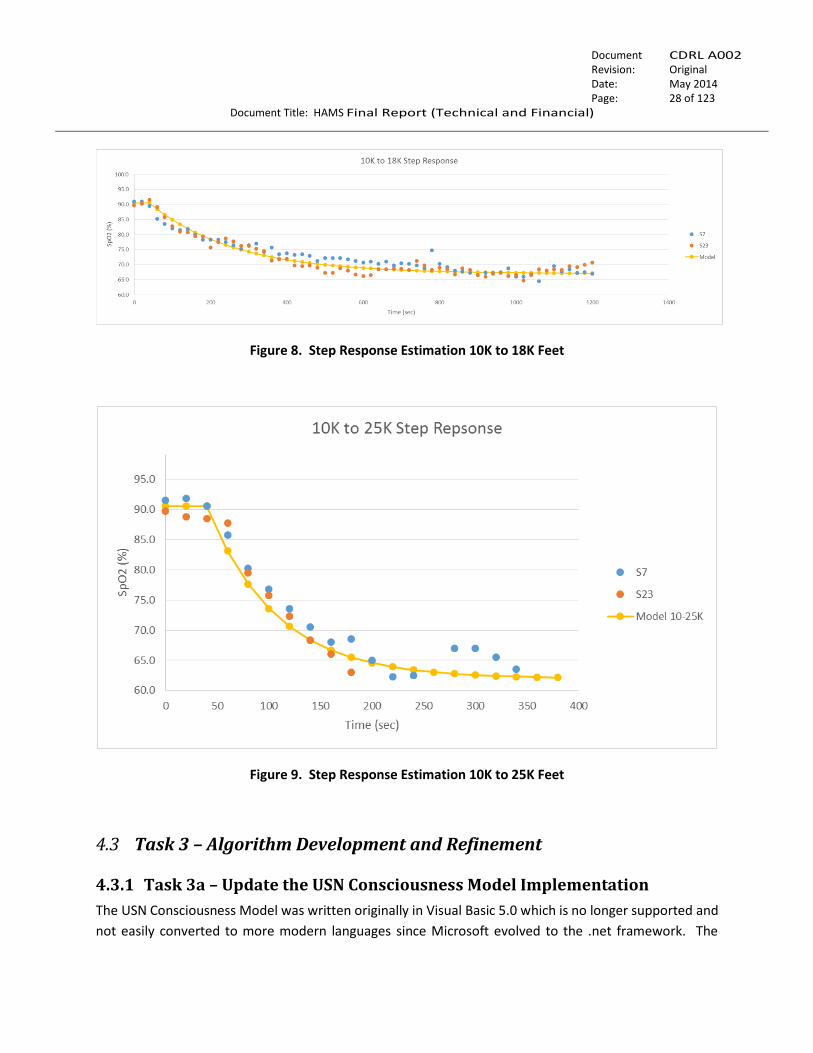
Figures 7, 8 and 9 show the step responses for Subject 7 and Subject 23 along with the model that uses
the above time dependent functions. The same time constant (3.7 minutes) was used in Figures 7 and 8,
but a significantly shorter time constant (66 sec) was needed in Figure 9. The model results compare
reasonably well to the Subject response data. The average response for the subjects was calculated and
then an R2 correlation was computed to evaluate the Model with the following results:

….…….
Document No.:
CDRL A002 Revision: Original
Date: May 2014 Page: 27 of 123
Document Title: HAMS Final Report (Technical and Financial)
Table 4. Model R2 Results
Step Response
(feet)
R2
(Model compared to Subject 7 & 23 Average)
0 to 10K 0.989
10K to 18K 0.970
10K to 25K 0.978
This approach was promising for use as the time dependent functions in the baseline model and was
incorporated.
Figure 7. Step Response Estimation 0 to 10K Feet
….…….
Document No.:
CDRL A002 Revision: Original
Date: May 2014 Page: 28 of 123
Document Title: HAMS Final Report (Technical and Financial)
Figure 8. Step Response Estimation 10K to 18K Feet
Figure 9. Step Response Estimation 10K to 25K Feet
4.3 Task 3 – Algorithm Development and Refinement
4.3.1 Task 3a – Update the USN Consciousness Model Implementation
The USN Consciousness Model was written originally in Visual Basic 5.0 which is no longer supported and
not easily converted to more modern languages since Microsoft evolved to the .net framework. The
….…….
Document No.:
CDRL A002 Revision: Original
Date: May 2014 Page: 29 of 123
Document Title: HAMS Final Report (Technical and Financial)
original code was stripped of Visual Basic 5.0 components and reconfigured for ExcelVBA under Excel
2010. Initial tests showed comparability to the earlier model. This capability allowed for rapid
modification and testing to facilitate development of a smaller package.
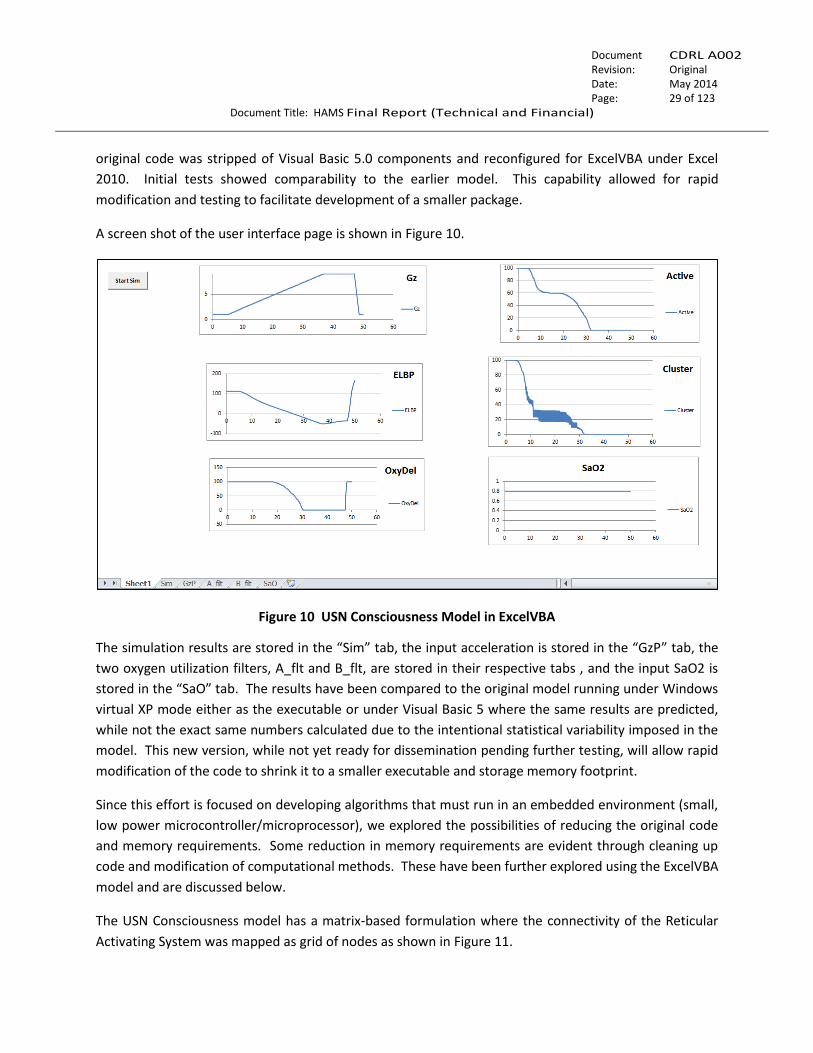
A screen shot of the user interface page is shown in Figure 10.
Figure 10 USN Consciousness Model in ExcelVBA
The simulation results are stored in the “Sim” tab, the input acceleration is stored in the “GzP” tab, the
two oxygen utilization filters, A_flt and B_flt, are stored in their respective tabs , and the input SaO2 is
stored in the “SaO” tab. The results have been compared to the original model running under Windows
virtual XP mode either as the executable or under Visual Basic 5 where the same results are predicted,
while not the exact same numbers calculated due to the intentional statistical variability imposed in the
model. This new version, while not yet ready for dissemination pending further testing, will allow rapid
modification of the code to shrink it to a smaller executable and storage memory footprint.
Since this effort is focused on developing algorithms that must run in an embedded environment (small,
low power microcontroller/microprocessor), we explored the possibilities of reducing the original code
and memory requirements. Some reduction in memory requirements are evident through cleaning up
code and modification of computational methods. These have been further explored using the ExcelVBA
model and are discussed below.
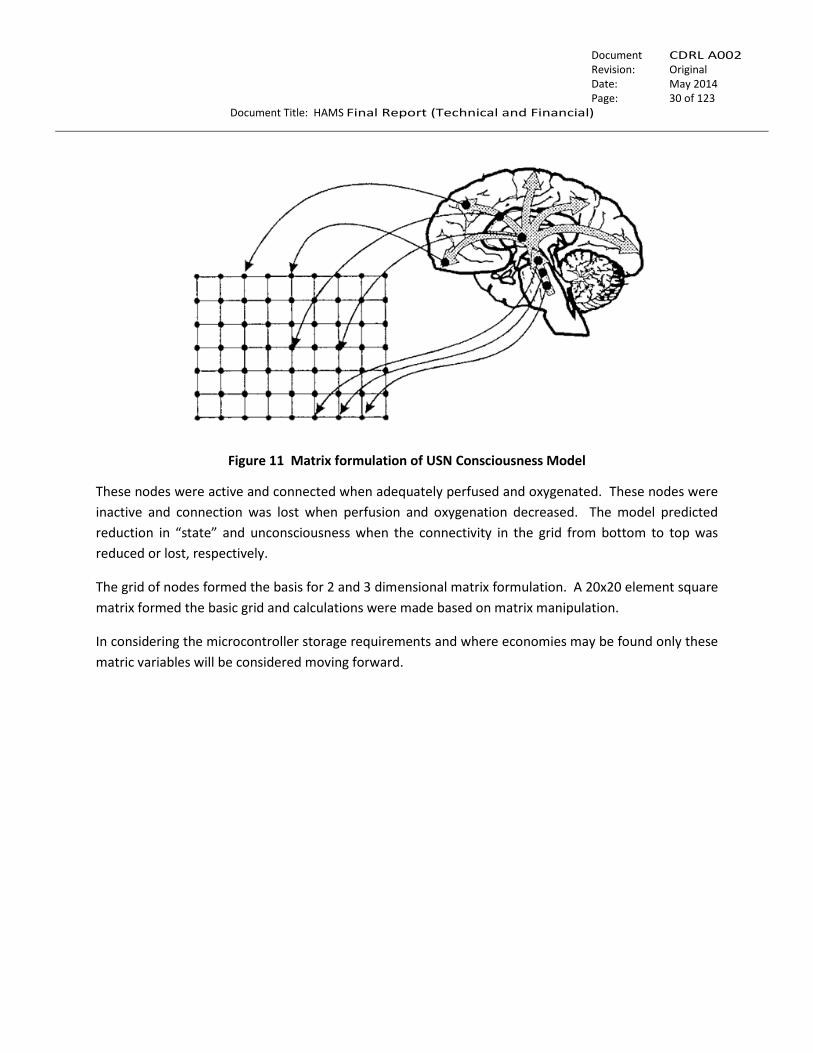
The USN Consciousness model has a matrix-based formulation where the connectivity of the Reticular
Activating System was mapped as grid of nodes as shown in Figure 11.
….…….
Document No.:
CDRL A002 Revision: Original
Date: May 2014 Page: 30 of 123
Document Title: HAMS Final Report (Technical and Financial)
Figure 11 Matrix formulation of USN Consciousness Model
These nodes were active and connected when adequately perfused and oxygenated. These nodes were
inactive and connection was lost when perfusion and oxygenation decreased. The model predicted
reduction in “state” and unconsciousness when the connectivity in the grid from bottom to top was
reduced or lost, respectively.
The grid of nodes formed the basis for 2 and 3 dimensional matrix formulation. A 20x20 element square
matrix formed the basic grid and calculations were made based on matrix manipulation.
In considering the microcontroller storage requirements and where economies may be found only these
matric variables will be considered moving forward.

….…….
Document No.:
CDRL A002 Revision: Original
Date: May 2014 Page: 31 of 123
Document Title: HAMS Final Report (Technical and Financial)
Table 5 Consciousness Model Current Variable Storage Requirements
Variable Elements Precision Bytes Total Program Usage
z0(42, 42) 1764 Single 4 7056 Percolation calculation
OxySat(5, 42, 42) 8820 Single 4 35280 O2 utilization calculation
OxyDel(5, 42, 42) 8820 Single 4 35280 O2 delivery calculation
FilterNum(42, 42) 1764 Single 4
7056
Index into O2 utilization
filter coefficient normal
distribution
OxyOffThresh(42, 42) 1764 Single 4 7056 Randomized node on
OxyOnThresh(42, 42) 1764 Single 4 7056 Randomized node off
AOxy(100, 5) 500 Double 8 4000
O2 utilization filter
coefficients
BOxy(100, 5) 500 Double 8 4000
O2 utilization filter
coefficients
ACV(3) 3 Single 4 12 Eye level BP calc
BCV(3) 3 Single 4 12 Eye level BP calc
Gz(2000) 2000 Single 4 8000 Data-could be in a buffer
EyeBP(3) 3 Single 4 12
Sa(2000) 2000 Single 4 8000 Data-could be in a buffer
GStress(3) 3 Single 4 12
hScale(42, 42) 1764 Single 4 7056
Hydrostatic column
distribution
Total of 129,888 bytes
Possible areas of reduction are the input data for Gz and SaO2 since these will be likely 2-byte values but
computationally as read in as an array into a program may expand. The matrix sizes are all allocated as
42 x 42 but in the code the actual size of the node matrix is 20 x 20. If this was just a convenience left in
while determining the optimum node matrix size, the size can henceforth be easily adjusted. The
….…….
Document No.:
CDRL A002 Revision: Original
Date: May 2014 Page: 32 of 123
Document Title: HAMS Final Report (Technical and Financial)
calculations for oxygen delivery and saturation (level), indicated as highlighted in yellow, have been
identified as having the best chance for memory requirements reduction. The matrix format of these
calculations relate to the node matrix and introduction of statistical variability but some of this may be
calculated as needed and statistical process applied then. Understanding of the oxygen utilization filter
calculation is essential before making any modifications. This is discussed in the next section.
Oxygen Utilization Filter
Examining the model code the oxygen utilization filter A and B coefficients are look-up tables which hold
four coefficients for this calculation. These coefficients are “hard wired” into the code so that they must
take up space of any program code which is at a premium for small, low power processors. The actual
number values from the original software contain a significant number of significant digits. The B
coefficients are quite small, on the order of 10-4, and the A coefficients are more reasonable in terms of
number representation. To be able to reduce or eliminate the memory overhead, one must understand
what is being calculated.
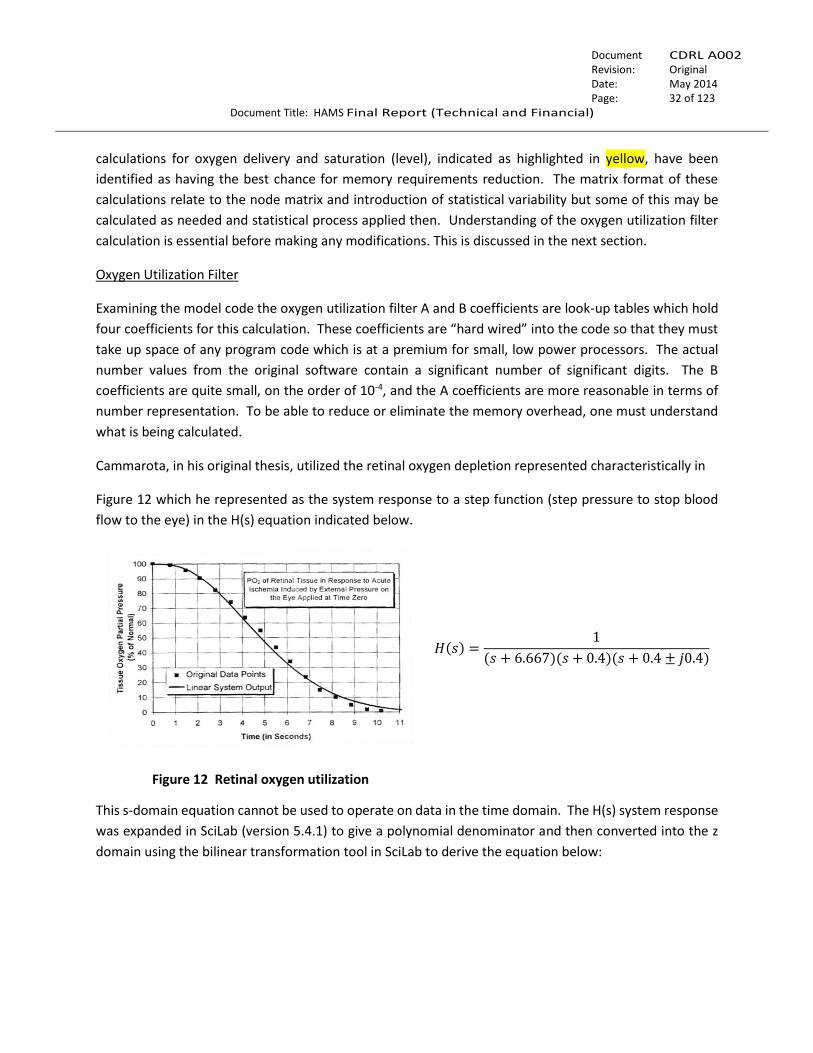
Cammarota, in his original thesis, utilized the retinal oxygen depletion represented characteristically in
Figure 12 which he represented as the system response to a step function (step pressure to stop blood
flow to the eye) in the H(s) equation indicated below.
Figure 12 Retinal oxygen utilization
𝐻(𝑠) =1
(𝑠 + 6.667)(𝑠 + 0.4)(𝑠 + 0.4 ± 𝑗0.4)
This s-domain equation cannot be used to operate on data in the time domain. The H(s) system response
was expanded in SciLab (version 5.4.1) to give a polynomial denominator and then converted into the z
domain using the bilinear transformation tool in SciLab to derive the equation below:
….…….
Document No.:
CDRL A002 Revision: Original
Date: May 2014 Page: 33 of 123
Document Title: HAMS Final Report (Technical and Financial)
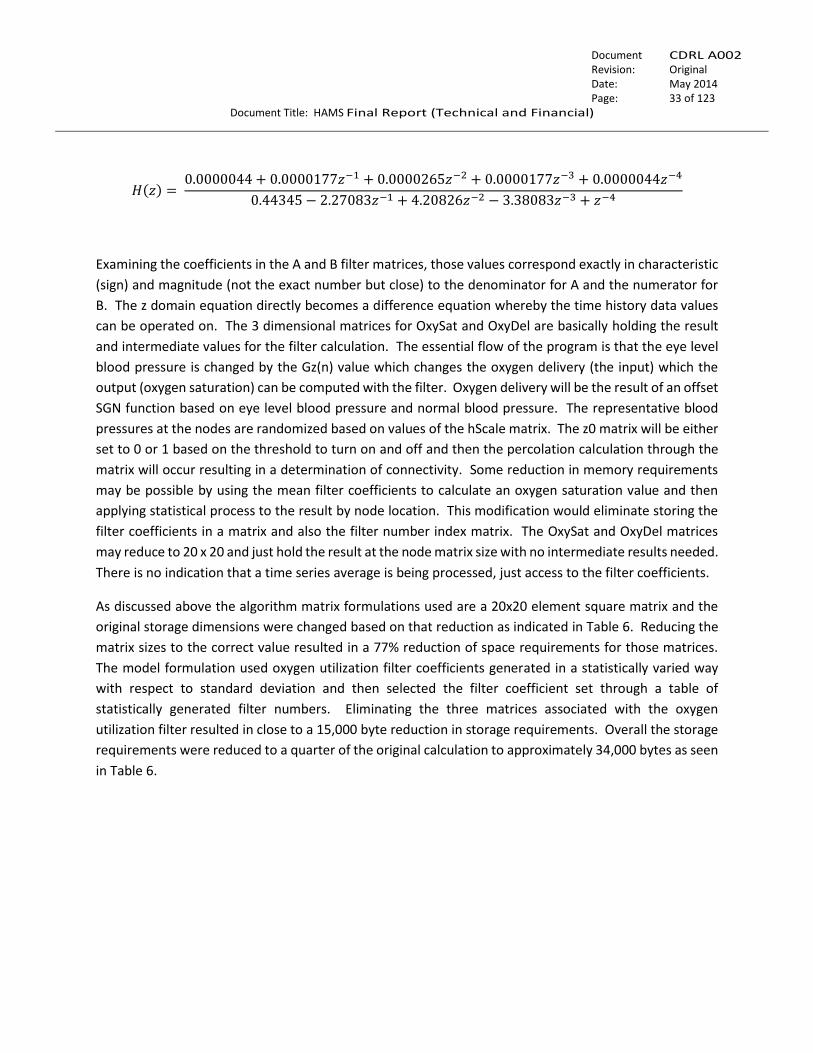
𝐻(𝑧) = 0.0000044 + 0.0000177𝑧−1 + 0.0000265𝑧−2 + 0.0000177𝑧−3 + 0.0000044𝑧−4
0.44345 − 2.27083𝑧−1 + 4.20826𝑧−2 − 3.38083𝑧−3 + 𝑧−4
Examining the coefficients in the A and B filter matrices, those values correspond exactly in characteristic
(sign) and magnitude (not the exact number but close) to the denominator for A and the numerator for
B. The z domain equation directly becomes a difference equation whereby the time history data values
can be operated on. The 3 dimensional matrices for OxySat and OxyDel are basically holding the result
and intermediate values for the filter calculation. The essential flow of the program is that the eye level
blood pressure is changed by the Gz(n) value which changes the oxygen delivery (the input) which the
output (oxygen saturation) can be computed with the filter. Oxygen delivery will be the result of an offset
SGN function based on eye level blood pressure and normal blood pressure. The representative blood
pressures at the nodes are randomized based on values of the hScale matrix. The z0 matrix will be either
set to 0 or 1 based on the threshold to turn on and off and then the percolation calculation through the
matrix will occur resulting in a determination of connectivity. Some reduction in memory requirements
may be possible by using the mean filter coefficients to calculate an oxygen saturation value and then
applying statistical process to the result by node location. This modification would eliminate storing the
filter coefficients in a matrix and also the filter number index matrix. The OxySat and OxyDel matrices
may reduce to 20 x 20 and just hold the result at the node matrix size with no intermediate results needed.
There is no indication that a time series average is being processed, just access to the filter coefficients.
As discussed above the algorithm matrix formulations used are a 20x20 element square matrix and the
original storage dimensions were changed based on that reduction as indicated in Table 6. Reducing the
matrix sizes to the correct value resulted in a 77% reduction of space requirements for those matrices.
The model formulation used oxygen utilization filter coefficients generated in a statistically varied way
with respect to standard deviation and then selected the filter coefficient set through a table of
statistically generated filter numbers. Eliminating the three matrices associated with the oxygen
utilization filter resulted in close to a 15,000 byte reduction in storage requirements. Overall the storage
requirements were reduced to a quarter of the original calculation to approximately 34,000 bytes as seen
in Table 6.

….…….
Document No.:
CDRL A002 Revision: Original
Date: May 2014 Page: 34 of 123
Document Title: HAMS Final Report (Technical and Financial)
Table 6 Consciousness Model Current Variable Storage Requirements
Variable Elements Precision Bytes Total
Bytes
Variable New Total
Bytes
Reduction
z0(42, 42) 1764 Single 4 7056 z0(20, 20) 1600 77%
OxySat(5, 42, 42) 8820 Single 4 35280 OxySat(5, 20, 20) 8000 77%
OxyDel(5, 42, 42) 8820 Single 4 35280 OxyDel(5, 20, 20) 8000 77%
FilterNum(42, 42) 1764 Single 4 7056 eliminated 0 -
OxyOffThresh(42, 42) 1764 Single 4 7056 OxyOffThresh(20, 20) 7056 0%
OxyOnThresh(42, 42) 1764 Single 4 7056 OxyOnThresh(20, 20) 7056 0%
AOxy(100, 5) 500 Double 8 4000 eliminated 40 99%
BOxy(100, 5) 500 Double 8 4000 eliminated 40 99%
ACV(3) 3 Single 4 12 ACV(3) - -
BCV(3) 3 Single 4 12 BCV(3) - -
Gz(2000) 2000 Single 4 8000 Gz(2000) Buffer TBD
EyeBP(3) 3 Single 4 12 EyeBP(3) - -
Sa(2000) 2000 Single 4 8000 Sa(2000) Buffer TBD
GStress(3) 3 Single 4 12 GStress(3) - -
hScale(42, 42) 1764 Single 4 7056 hScale(20, 20) 1600 77%
Starting total of 129,888 bytes compared to current total of 33,392 (excluding data buffers)
A single oxygen utilization calculation was used for each node point and a comparison screenshot of
results is shown in Figure 13.
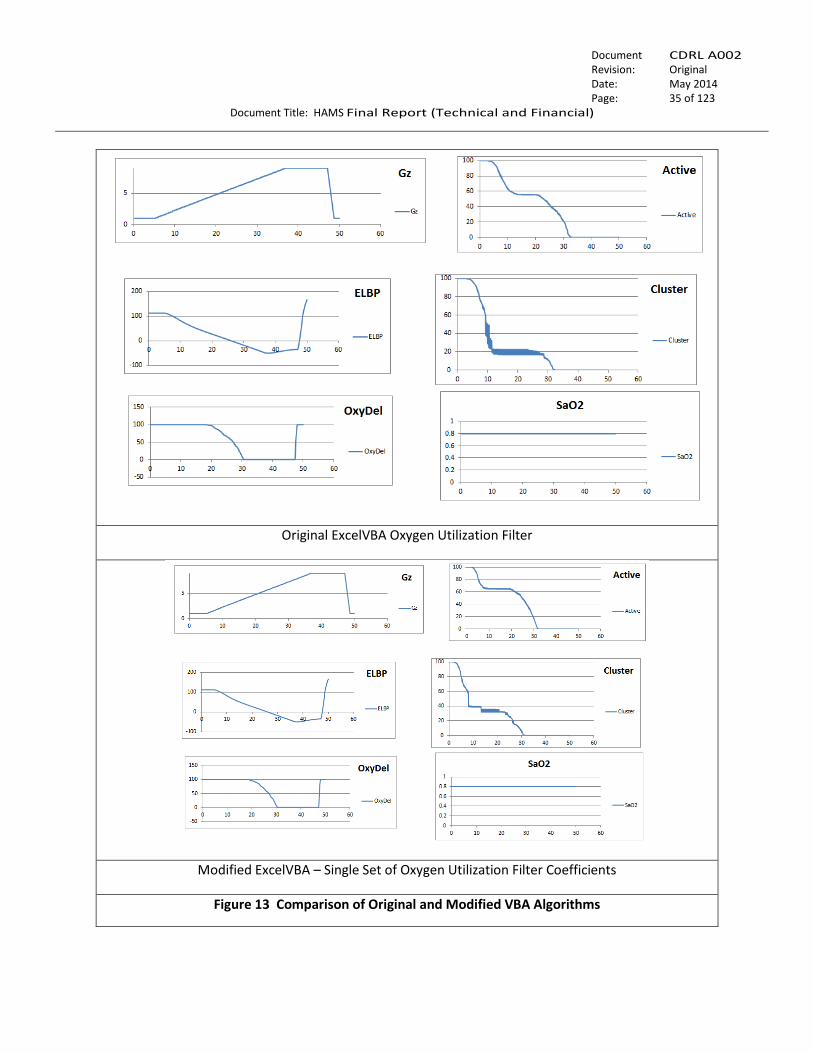
….…….
Document No.:
CDRL A002 Revision: Original
Date: May 2014 Page: 35 of 123
Document Title: HAMS Final Report (Technical and Financial)
Original ExcelVBA Oxygen Utilization Filter
Modified ExcelVBA – Single Set of Oxygen Utilization Filter Coefficients
Figure 13 Comparison of Original and Modified VBA Algorithms

….…….
Document No.:
CDRL A002 Revision: Original
Date: May 2014 Page: 36 of 123
Document Title: HAMS Final Report (Technical and Financial)
Comparison model results are shown in Figure 14.
Oxygen Delivery Active Nodes
Spanning Clusters State
Figure 14 Comparison of Simulation Results from Algorithm Modification
Oxygen delivery should agree closely since no changes are made with that calculation. The percentage of
active nodes and spanning clusters differ somewhat by transition timing and level but generically the
changes occur at about the same time and to the same levels. The predicted states change at essentially
the same times with the modified calculation changing slightly earlier than the original method.
The implementation of the working model must be converted from the Visual Basic for Application version
to a further stripped down Basic language version and then translated into at least a C language
implementation to be hosted on a small sized microcontroller or embedded system. A larger sized process
system such as a tablet or smart phone level approach would still need this conversion under most
….…….
Document No.:
CDRL A002 Revision: Original
Date: May 2014 Page: 37 of 123
Document Title: HAMS Final Report (Technical and Financial)
implementation scenarios. The most up to date code was stripped of the Excel interface aspects and then
converted to C language using BCX, a basic to C translator. The resulting C language code was modified
and examined using the IAR embedded workbench set up for the MSP430 processor. The C code could
be ported to any other processor with slight modification. Example items that were addressed are
unnecessary library references and non-C language array indexing issues.
This processor choice was arbitrary but was influenced by Athena GTX’s history of development with this
device. The free IAR Workbench is code size limited and once all the errors were worked out one could
go no further due to the larger code byte size. Code Composer from Texas Instruments was used to go
further which allows for evaluation of various processor families within Texas Instruments product line.
The MSP430F67791 was chosen for its large Flash ROM size of 512KB and the code came out to be about
2KB over that size. For the sake of finding a microcontroller that would fit for further debugging and
emulation, a TMS470F06607 was used under Code Creator which has 640KB total program flash memory.
Under this processor the program easily fit with some lingering errors that can be fixed without issue.
Reducing the code size further will be discussed further in Task 4. Now that the real embedded system
program storage requirements are understood more clearly we can move on to Task 4 and refine the code
to meet the program objectives. The modified USN Consciousness Model code is able to be implemented
on a micro-controller platform.
4.3.2 Task 3b – Determine Model Deficiencies for Hypoxia
The HAMS consciousness model works on the basis of rapid cessation of perfusion causing tissue/cell level
oxygen reduction without regard for longer time course metabolism having any influence. This approach
will not be sufficient for hypoxic hypoxia and a factor that reduces SaO2 based on metabolism and work
rate is needed even when oxygen delivery is fine to fully encompass the scope of anticipated utilization.
The desired relationship has not been found in the literature. At this point, we theorize that a series of
runs with HumMod is needed to develop an oxygen utilization rate equation based on long time course
hypoxia conditions alone to supplement the current oxygen consumption methodology. Initial work
toward this end is discussed later in this section of the report. We will be exploring the validity of this
approach as well as the potential for using alternate workload prediction algorithms used in previous
Athena GTX projects such as the Hammerhead™ and DogBone™. This is particularly noteworthy for
potential end users in ground operations and deploying to the ground in high altitude conditions.

….…….
Document No.:
CDRL A002 Revision: Original
Date: May 2014 Page: 38 of 123
Document Title: HAMS Final Report (Technical and Financial)
The model mean node “off” threshold setting was varied and the effect examined with the SaO2 time
history from an immediate 40,000 ft. altitude exposure at normal gravity generated using HumMod
(Version 1.6.1) and then acceleration response examined with an arbitrary 7G exposure to induce GLOC.
An optimum mean “off” threshold of 0.8 was determined based on rapidity of predicting impairment and
the altitude and acceleration exposures were combined for a simulation and the results are shown. Table
7 shows the summary prediction times while varying threshold level.
Table 7 Summary Simulation Results
“Off” threshold Impairment Onset
(sec) Impairment Full
Development (sec) Unconsciousness
(sec)
40,000 feet
0.5 27.4 32.4 -
0.6 16.7 19.5 -
0.7 11.6 13.4 41.1
0.8 4.9 6.9 49.5
7 Gz
0.5 9 9 10.9
0.6 8.5 8.5 10.3
0.7 8.2 8.2 10.4
0.8 7.7 7.7 10.3
Figure 15 through Figure 18 shows the time history response while varying the mean “off” threshold for both the 40,000 feet and 7Gz exposures.
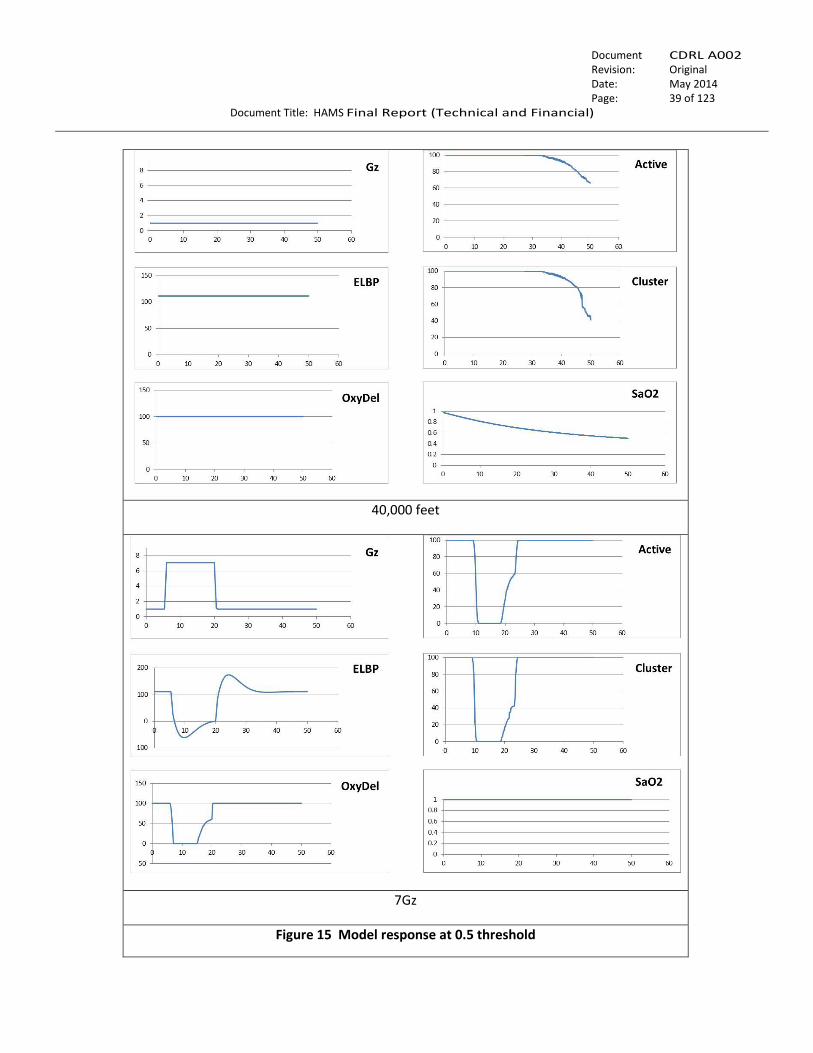
….…….
Document No.:
CDRL A002 Revision: Original
Date: May 2014 Page: 39 of 123
Document Title: HAMS Final Report (Technical and Financial)
40,000 feet
7Gz
Figure 15 Model response at 0.5 threshold
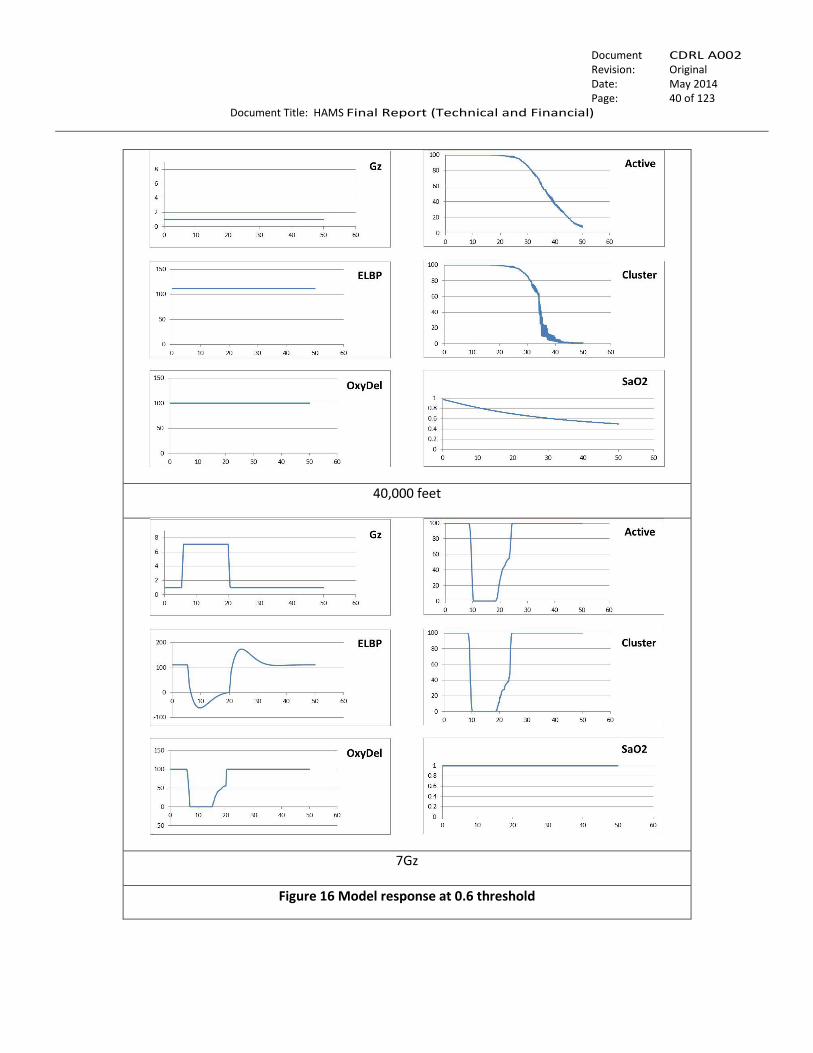
….…….
Document No.:
CDRL A002 Revision: Original
Date: May 2014 Page: 40 of 123
Document Title: HAMS Final Report (Technical and Financial)
40,000 feet
7Gz
Figure 16 Model response at 0.6 threshold

….…….
Document No.:
CDRL A002 Revision: Original
Date: May 2014 Page: 41 of 123
Document Title: HAMS Final Report (Technical and Financial)
40,000 feet
7Gz
Figure 17 Model response at 0.7 threshold
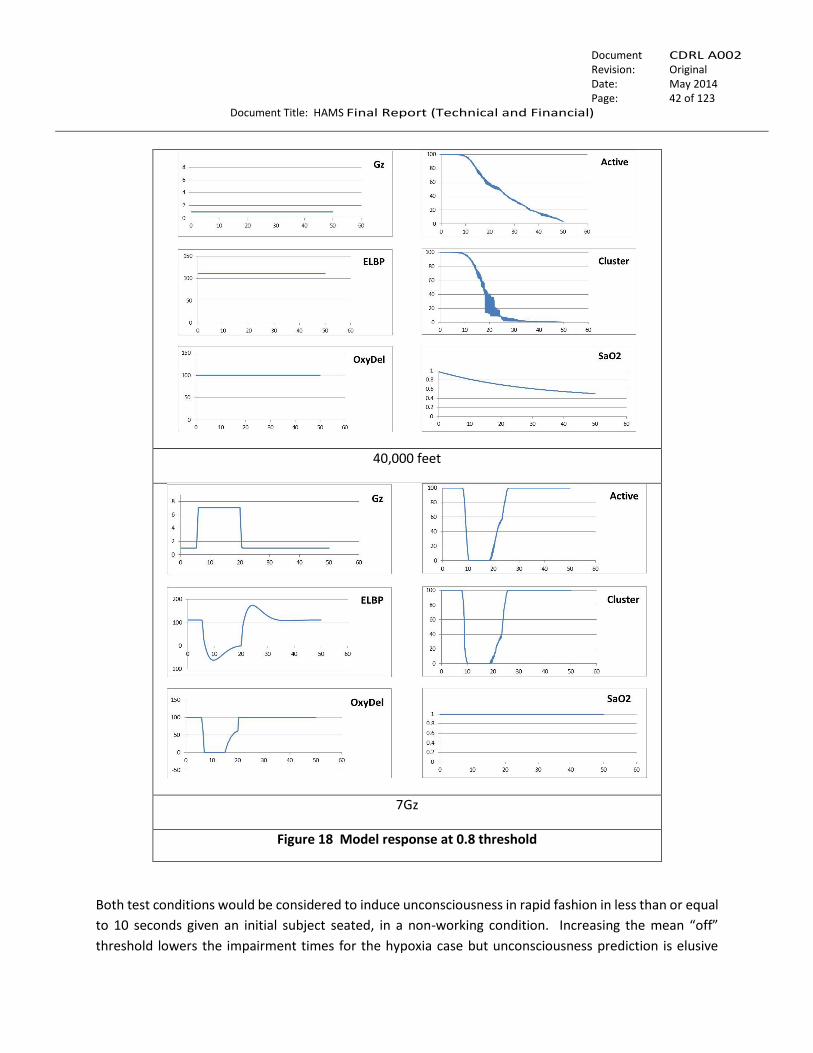
….…….
Document No.:
CDRL A002 Revision: Original
Date: May 2014 Page: 42 of 123
Document Title: HAMS Final Report (Technical and Financial)
40,000 feet
7Gz
Figure 18 Model response at 0.8 threshold
Both test conditions would be considered to induce unconsciousness in rapid fashion in less than or equal
to 10 seconds given an initial subject seated, in a non-working condition. Increasing the mean “off”
threshold lowers the impairment times for the hypoxia case but unconsciousness prediction is elusive
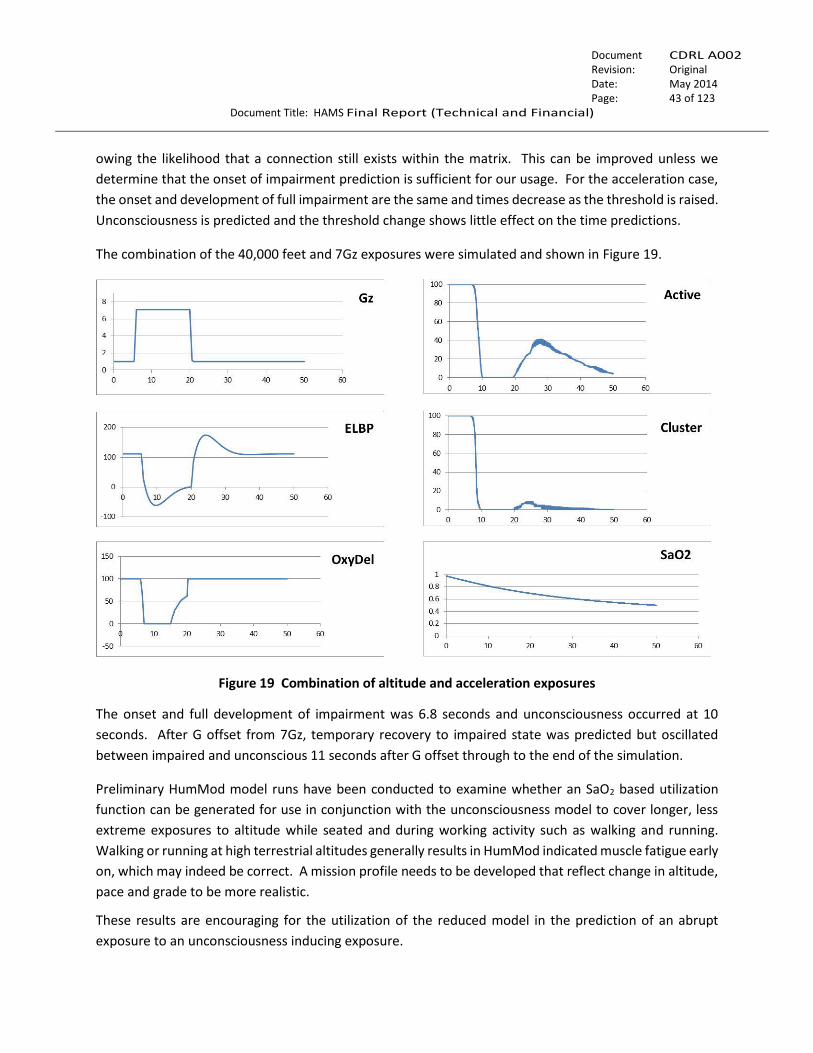
….…….
Document No.:
CDRL A002 Revision: Original
Date: May 2014 Page: 43 of 123
Document Title: HAMS Final Report (Technical and Financial)
owing the likelihood that a connection still exists within the matrix. This can be improved unless we
determine that the onset of impairment prediction is sufficient for our usage. For the acceleration case,
the onset and development of full impairment are the same and times decrease as the threshold is raised.
Unconsciousness is predicted and the threshold change shows little effect on the time predictions.
The combination of the 40,000 feet and 7Gz exposures were simulated and shown in Figure 19.
Figure 19 Combination of altitude and acceleration exposures
The onset and full development of impairment was 6.8 seconds and unconsciousness occurred at 10
seconds. After G offset from 7Gz, temporary recovery to impaired state was predicted but oscillated
between impaired and unconscious 11 seconds after G offset through to the end of the simulation.
Preliminary HumMod model runs have been conducted to examine whether an SaO2 based utilization
function can be generated for use in conjunction with the unconsciousness model to cover longer, less
extreme exposures to altitude while seated and during working activity such as walking and running.
Walking or running at high terrestrial altitudes generally results in HumMod indicated muscle fatigue early
on, which may indeed be correct. A mission profile needs to be developed that reflect change in altitude,
pace and grade to be more realistic.
These results are encouraging for the utilization of the reduced model in the prediction of an abrupt
exposure to an unconsciousness inducing exposure.
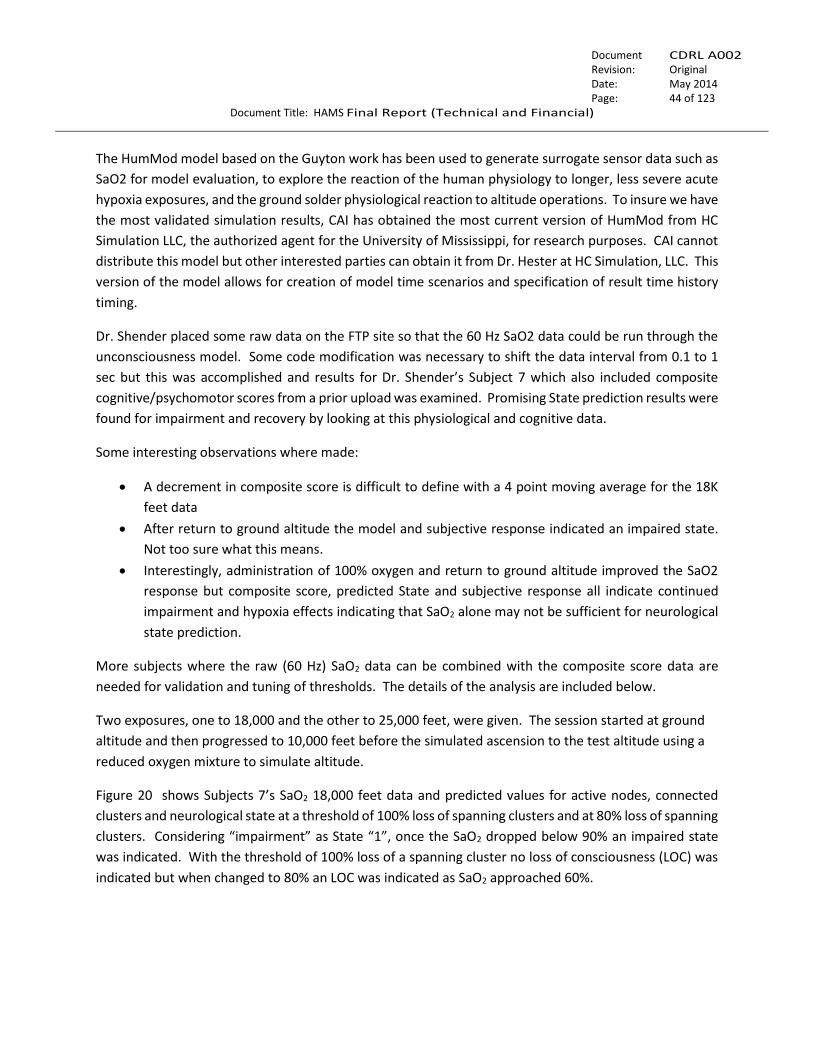
….…….
Document No.:
CDRL A002 Revision: Original
Date: May 2014 Page: 44 of 123
Document Title: HAMS Final Report (Technical and Financial)
The HumMod model based on the Guyton work has been used to generate surrogate sensor data such as
SaO2 for model evaluation, to explore the reaction of the human physiology to longer, less severe acute
hypoxia exposures, and the ground solder physiological reaction to altitude operations. To insure we have
the most validated simulation results, CAI has obtained the most current version of HumMod from HC
Simulation LLC, the authorized agent for the University of Mississippi, for research purposes. CAI cannot
distribute this model but other interested parties can obtain it from Dr. Hester at HC Simulation, LLC. This
version of the model allows for creation of model time scenarios and specification of result time history
timing.
Dr. Shender placed some raw data on the FTP site so that the 60 Hz SaO2 data could be run through the
unconsciousness model. Some code modification was necessary to shift the data interval from 0.1 to 1
sec but this was accomplished and results for Dr. Shender’s Subject 7 which also included composite
cognitive/psychomotor scores from a prior upload was examined. Promising State prediction results were
found for impairment and recovery by looking at this physiological and cognitive data.
Some interesting observations where made:
A decrement in composite score is difficult to define with a 4 point moving average for the 18K
feet data
After return to ground altitude the model and subjective response indicated an impaired state.
Not too sure what this means.
Interestingly, administration of 100% oxygen and return to ground altitude improved the SaO2
response but composite score, predicted State and subjective response all indicate continued
impairment and hypoxia effects indicating that SaO2 alone may not be sufficient for neurological
state prediction.
More subjects where the raw (60 Hz) SaO2 data can be combined with the composite score data are
needed for validation and tuning of thresholds. The details of the analysis are included below.
Two exposures, one to 18,000 and the other to 25,000 feet, were given. The session started at ground
altitude and then progressed to 10,000 feet before the simulated ascension to the test altitude using a
reduced oxygen mixture to simulate altitude.
Figure 20 shows Subjects 7’s SaO2 18,000 feet data and predicted values for active nodes, connected
clusters and neurological state at a threshold of 100% loss of spanning clusters and at 80% loss of spanning
clusters. Considering “impairment” as State “1”, once the SaO2 dropped below 90% an impaired state
was indicated. With the threshold of 100% loss of a spanning cluster no loss of consciousness (LOC) was
indicated but when changed to 80% an LOC was indicated as SaO2 approached 60%.
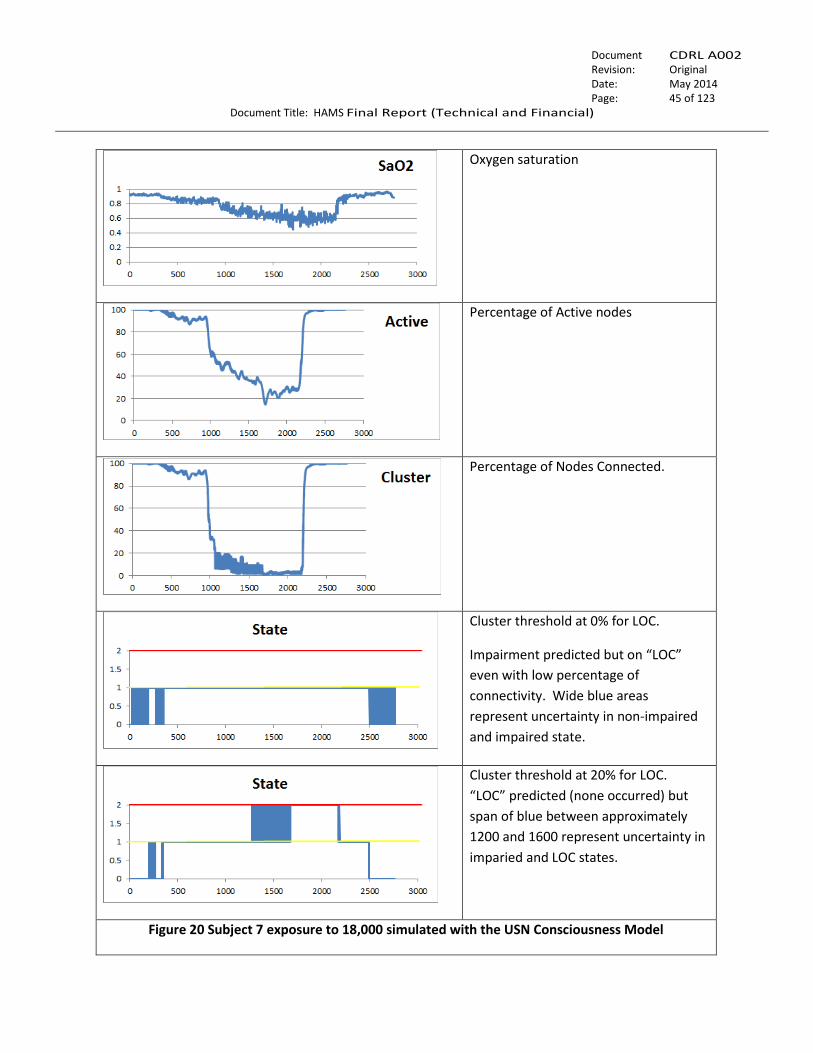
….…….
Document No.:
CDRL A002 Revision: Original
Date: May 2014 Page: 45 of 123
Document Title: HAMS Final Report (Technical and Financial)
Oxygen saturation
Percentage of Active nodes
Percentage of Nodes Connected.
Cluster threshold at 0% for LOC.
Impairment predicted but on “LOC”
even with low percentage of
connectivity. Wide blue areas
represent uncertainty in non-impaired
and impaired state.
Cluster threshold at 20% for LOC.
“LOC” predicted (none occurred) but
span of blue between approximately
1200 and 1600 represent uncertainty in
imparied and LOC states.
Figure 20 Subject 7 exposure to 18,000 simulated with the USN Consciousness Model
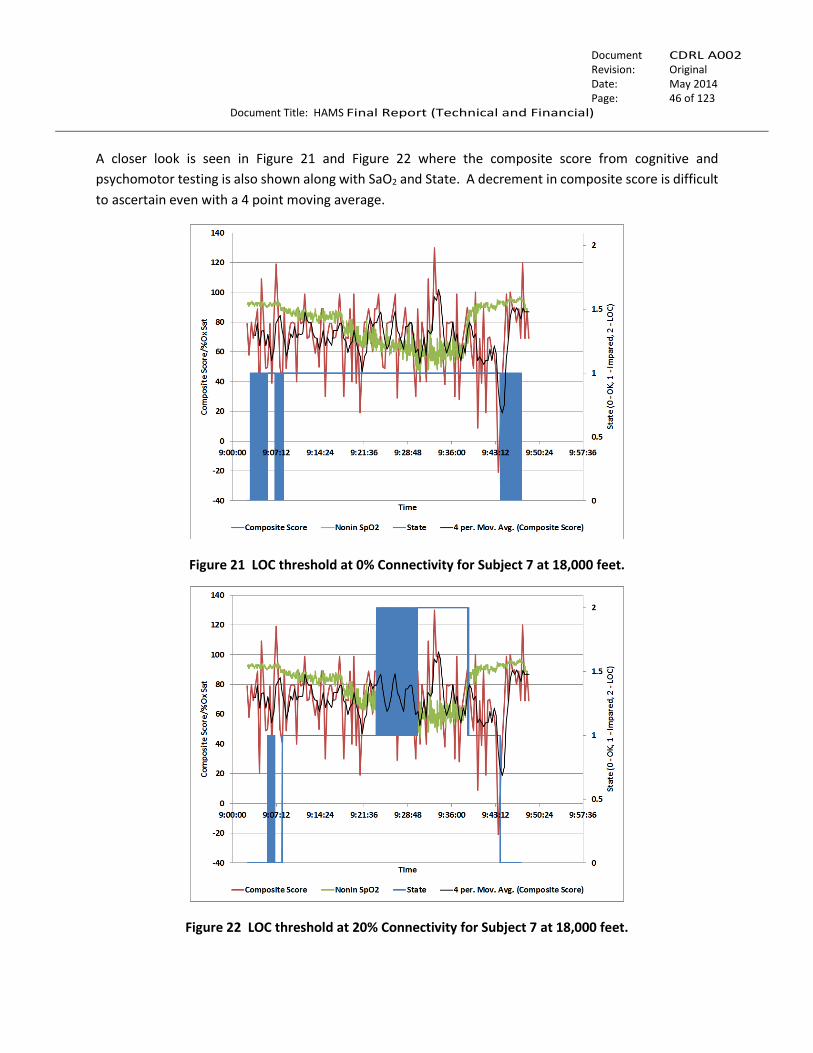
….…….
Document No.:
CDRL A002 Revision: Original
Date: May 2014 Page: 46 of 123
Document Title: HAMS Final Report (Technical and Financial)
A closer look is seen in Figure 21 and Figure 22 where the composite score from cognitive and
psychomotor testing is also shown along with SaO2 and State. A decrement in composite score is difficult
to ascertain even with a 4 point moving average.
Figure 21 LOC threshold at 0% Connectivity for Subject 7 at 18,000 feet.
Figure 22 LOC threshold at 20% Connectivity for Subject 7 at 18,000 feet.

….…….
Document No.:
CDRL A002 Revision: Original
Date: May 2014 Page: 47 of 123
Document Title: HAMS Final Report (Technical and Financial)
Table 8 shows the subjective response for Subject 7 where lightheadedness was indicated at times where
significant loss of active nodes and connectivity were predicted.
Table 8 Experimental Subjective Response for Subject 7 at 18,000 feet
9:07:49 10,000
10,000
9:17:57 18,000
9:19:38 18,000 lightheaded
18,000
9:28:46 18,000 lightheaded
18,000
9:37:54 0
9:40:16 0 lightheaded
Even after return to ground altitude the model and subjective response indicated an impaired state.
Figure 23 shows Subjects 7’s SaO2 25,000 feet data and predicted values for active nodes, connected
clusters and neurological state at a threshold of 100% loss of spanning clusters and at 80% loss of spanning
clusters. Considering “impairment” as State “1”, once the SaO2 dropped below 90% an impaired state
was again indicated. With the threshold of 100% loss of a spanning cluster no loss of consciousness (LOC)
was indicated but when changed to 80% an LOC was indicated as SaO2 approached 60%. The loss of active
nodes and spanning clusters was faster for the 25,000 feet exposure compared to the 18,000 feet
exposure due to the more rapid drop in SaO2.
Looking at Figure 24 and Figure 25 where the composite score from cognitive and psychomotor testing is
shown along with SaO2 and State. A marked drop in composite score is shown that corresponds to the
onset of the oscillation between impaired and LOC states. Subject 7 was administered 100% Oxygen and
while the SaO2 rose towards normal, the composite score and predicted State both showed impairment
indicating that SaO2 alone may not be sufficient for neurological state prediction.
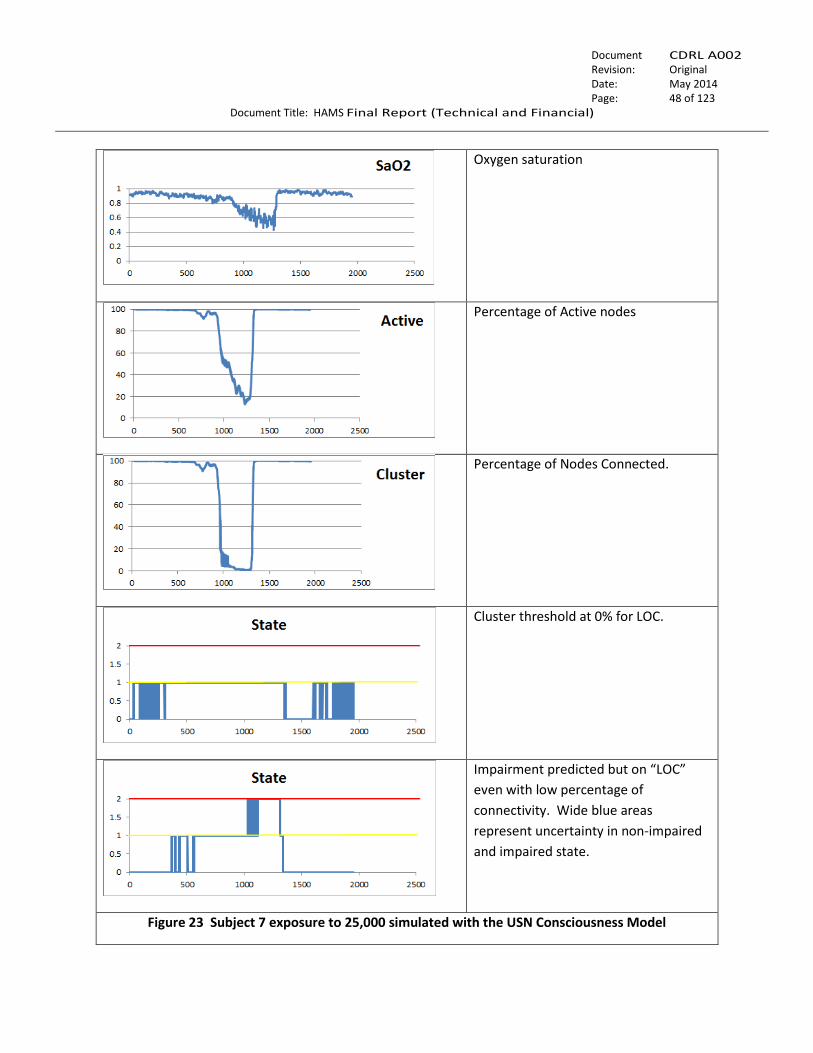
….…….
Document No.:
CDRL A002 Revision: Original
Date: May 2014 Page: 48 of 123
Document Title: HAMS Final Report (Technical and Financial)
Oxygen saturation
Percentage of Active nodes
Percentage of Nodes Connected.
Cluster threshold at 0% for LOC.
Impairment predicted but on “LOC”
even with low percentage of
connectivity. Wide blue areas
represent uncertainty in non-impaired
and impaired state.
Figure 23 Subject 7 exposure to 25,000 simulated with the USN Consciousness Model
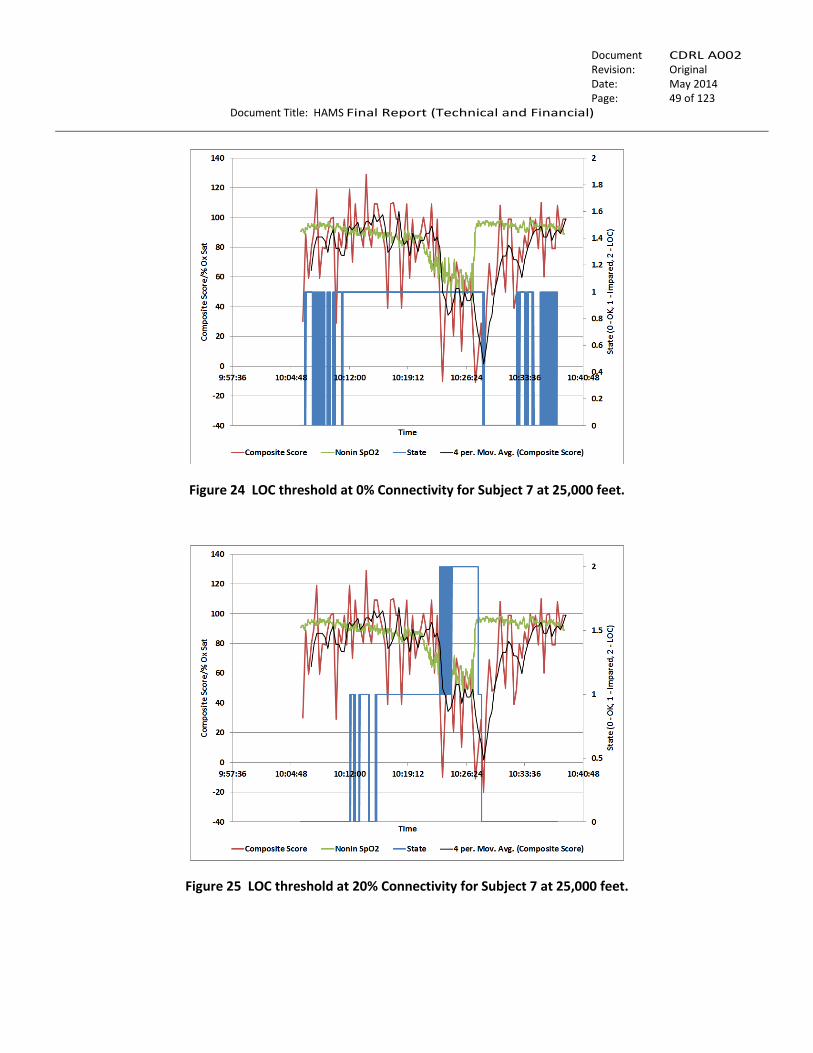
….…….
Document No.:
CDRL A002 Revision: Original
Date: May 2014 Page: 49 of 123
Document Title: HAMS Final Report (Technical and Financial)
Figure 24 LOC threshold at 0% Connectivity for Subject 7 at 25,000 feet.
Figure 25 LOC threshold at 20% Connectivity for Subject 7 at 25,000 feet.
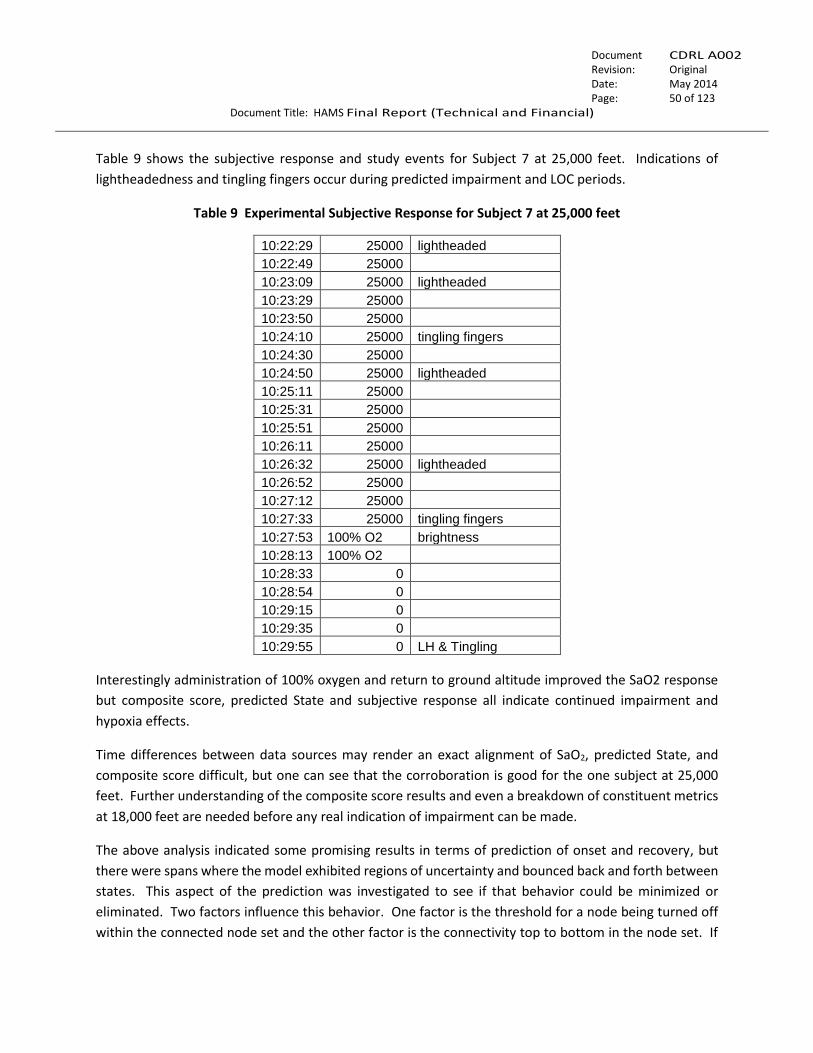
….…….
Document No.:
CDRL A002 Revision: Original
Date: May 2014 Page: 50 of 123
Document Title: HAMS Final Report (Technical and Financial)
Table 9 shows the subjective response and study events for Subject 7 at 25,000 feet. Indications of
lightheadedness and tingling fingers occur during predicted impairment and LOC periods.
Table 9 Experimental Subjective Response for Subject 7 at 25,000 feet
10:22:29 25000 lightheaded
10:22:49 25000
10:23:09 25000 lightheaded
10:23:29 25000
10:23:50 25000
10:24:10 25000 tingling fingers
10:24:30 25000
10:24:50 25000 lightheaded
10:25:11 25000
10:25:31 25000
10:25:51 25000
10:26:11 25000
10:26:32 25000 lightheaded
10:26:52 25000
10:27:12 25000
10:27:33 25000 tingling fingers
10:27:53 100% O2 brightness
10:28:13 100% O2
10:28:33 0
10:28:54 0
10:29:15 0
10:29:35 0
10:29:55 0 LH & Tingling
Interestingly administration of 100% oxygen and return to ground altitude improved the SaO2 response
but composite score, predicted State and subjective response all indicate continued impairment and
hypoxia effects.
Time differences between data sources may render an exact alignment of SaO2, predicted State, and
composite score difficult, but one can see that the corroboration is good for the one subject at 25,000
feet. Further understanding of the composite score results and even a breakdown of constituent metrics
at 18,000 feet are needed before any real indication of impairment can be made.
The above analysis indicated some promising results in terms of prediction of onset and recovery, but
there were spans where the model exhibited regions of uncertainty and bounced back and forth between
states. This aspect of the prediction was investigated to see if that behavior could be minimized or
eliminated. Two factors influence this behavior. One factor is the threshold for a node being turned off
within the connected node set and the other factor is the connectivity top to bottom in the node set. If
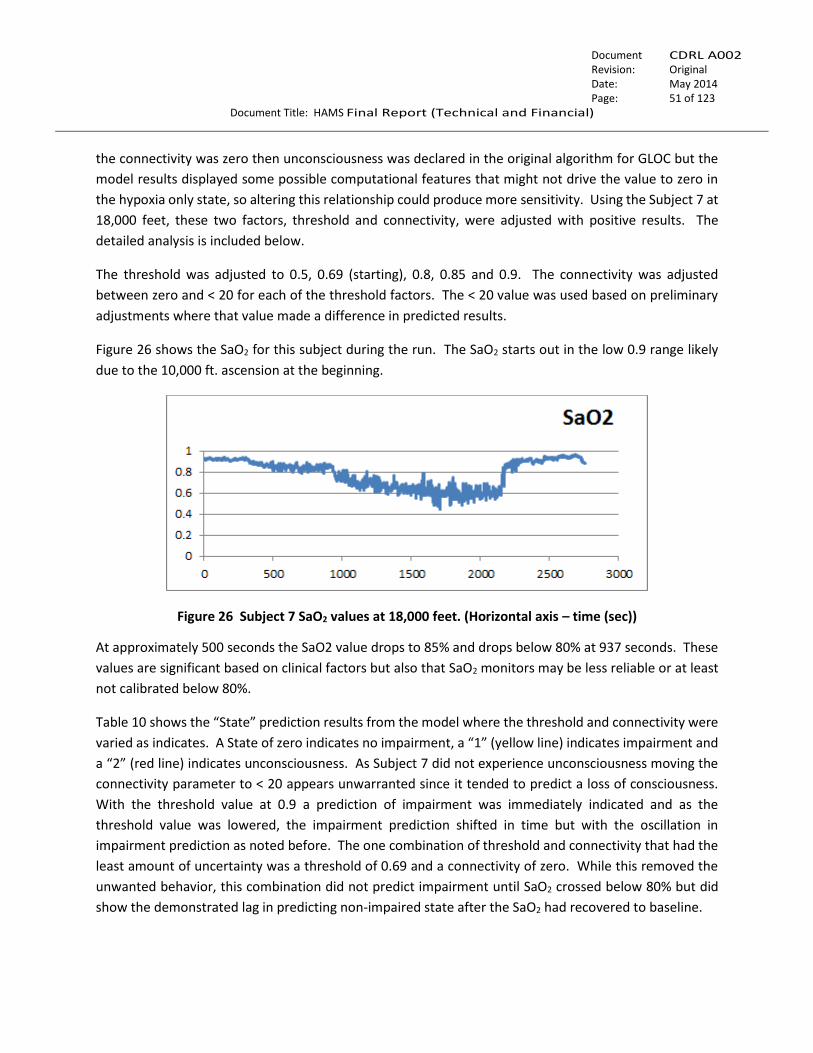
….…….
Document No.:
CDRL A002 Revision: Original
Date: May 2014 Page: 51 of 123
Document Title: HAMS Final Report (Technical and Financial)
the connectivity was zero then unconsciousness was declared in the original algorithm for GLOC but the
model results displayed some possible computational features that might not drive the value to zero in
the hypoxia only state, so altering this relationship could produce more sensitivity. Using the Subject 7 at
18,000 feet, these two factors, threshold and connectivity, were adjusted with positive results. The
detailed analysis is included below.
The threshold was adjusted to 0.5, 0.69 (starting), 0.8, 0.85 and 0.9. The connectivity was adjusted
between zero and < 20 for each of the threshold factors. The < 20 value was used based on preliminary
adjustments where that value made a difference in predicted results.
Figure 26 shows the SaO2 for this subject during the run. The SaO2 starts out in the low 0.9 range likely
due to the 10,000 ft. ascension at the beginning.
Figure 26 Subject 7 SaO2 values at 18,000 feet. (Horizontal axis – time (sec))
At approximately 500 seconds the SaO2 value drops to 85% and drops below 80% at 937 seconds. These
values are significant based on clinical factors but also that SaO2 monitors may be less reliable or at least
not calibrated below 80%.
Table 10 shows the “State” prediction results from the model where the threshold and connectivity were
varied as indicates. A State of zero indicates no impairment, a “1” (yellow line) indicates impairment and
a “2” (red line) indicates unconsciousness. As Subject 7 did not experience unconsciousness moving the
connectivity parameter to < 20 appears unwarranted since it tended to predict a loss of consciousness.
With the threshold value at 0.9 a prediction of impairment was immediately indicated and as the
threshold value was lowered, the impairment prediction shifted in time but with the oscillation in
impairment prediction as noted before. The one combination of threshold and connectivity that had the
least amount of uncertainty was a threshold of 0.69 and a connectivity of zero. While this removed the
unwanted behavior, this combination did not predict impairment until SaO2 crossed below 80% but did
show the demonstrated lag in predicting non-impaired state after the SaO2 had recovered to baseline.

….…….
Document No.:
CDRL A002 Revision: Original
Date: May 2014 Page: 52 of 123
Document Title: HAMS Final Report (Technical and Financial)
Table 10 Decision value variations for the Neurological State Model
State Prediction Threshold Connectivity
0.9 < 20
0.9 0
0.85 < 20
0.85 0
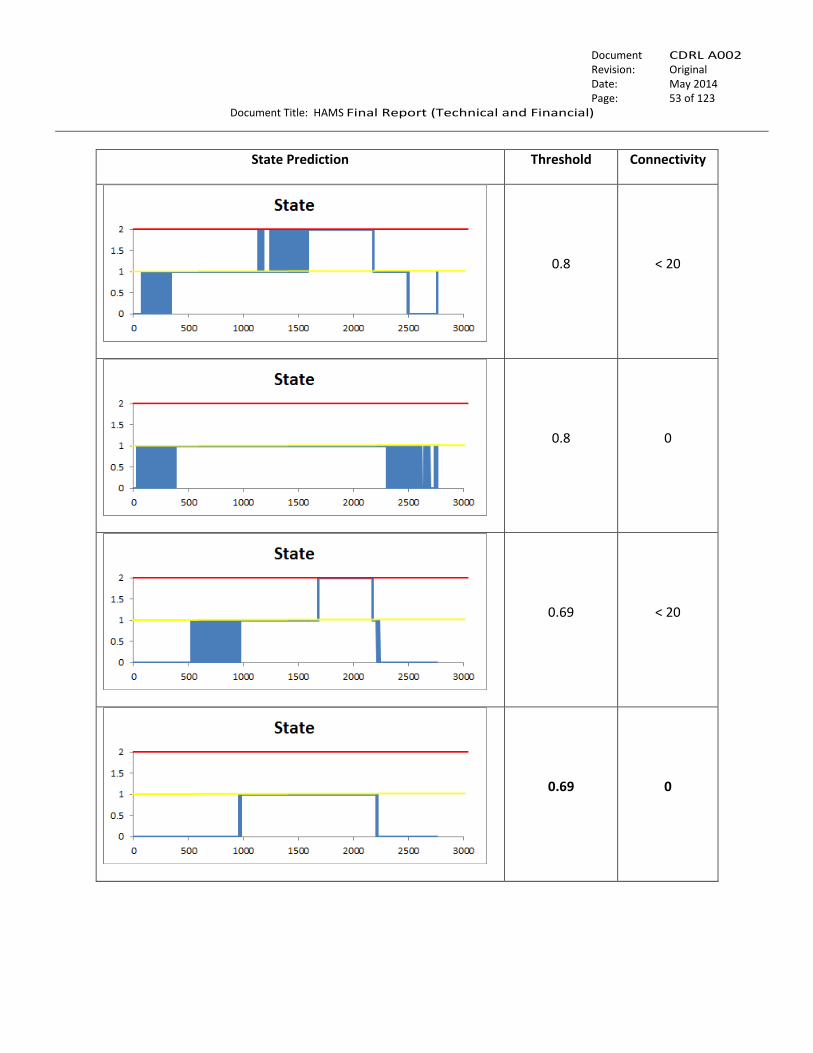
….…….
Document No.:
CDRL A002 Revision: Original
Date: May 2014 Page: 53 of 123
Document Title: HAMS Final Report (Technical and Financial)
State Prediction Threshold Connectivity
0.8 < 20
0.8 0
0.69 < 20
0.69 0
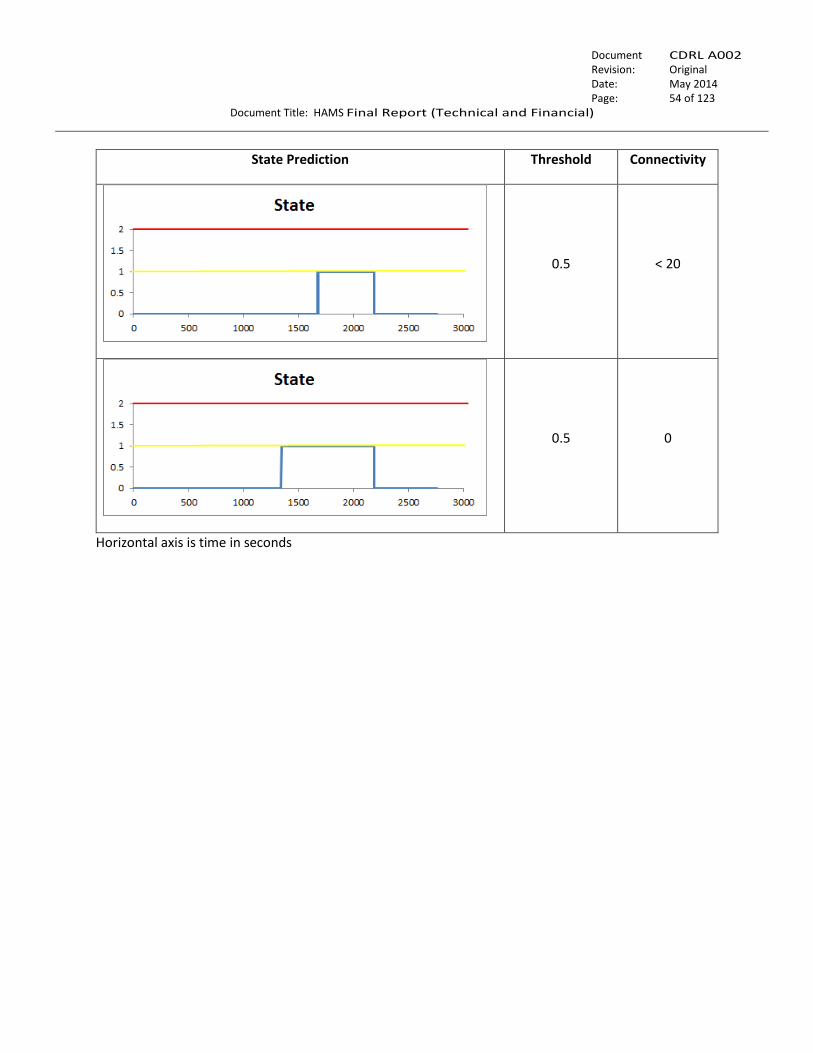
….…….
Document No.:
CDRL A002 Revision: Original
Date: May 2014 Page: 54 of 123
Document Title: HAMS Final Report (Technical and Financial)
State Prediction Threshold Connectivity
0.5 < 20
0.5 0
Horizontal axis is time in seconds
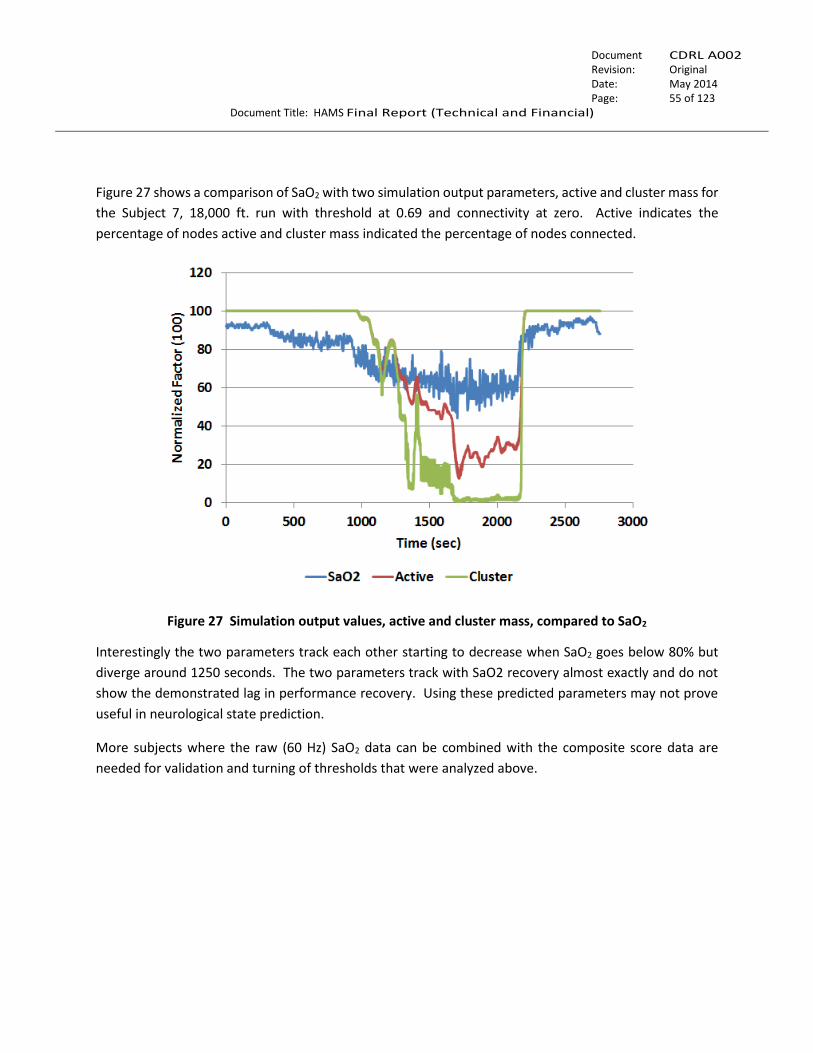
….…….
Document No.:
CDRL A002 Revision: Original
Date: May 2014 Page: 55 of 123
Document Title: HAMS Final Report (Technical and Financial)
Figure 27 shows a comparison of SaO2 with two simulation output parameters, active and cluster mass for
the Subject 7, 18,000 ft. run with threshold at 0.69 and connectivity at zero. Active indicates the
percentage of nodes active and cluster mass indicated the percentage of nodes connected.
Figure 27 Simulation output values, active and cluster mass, compared to SaO2
Interestingly the two parameters track each other starting to decrease when SaO2 goes below 80% but
diverge around 1250 seconds. The two parameters track with SaO2 recovery almost exactly and do not
show the demonstrated lag in performance recovery. Using these predicted parameters may not prove
useful in neurological state prediction.
More subjects where the raw (60 Hz) SaO2 data can be combined with the composite score data are
needed for validation and turning of thresholds that were analyzed above.
….…….
Document No.:
CDRL A002 Revision: Original
Date: May 2014 Page: 56 of 123
Document Title: HAMS Final Report (Technical and Financial)
4.3.3 Task 3c – Determine Model Deficiencies - Other
Several existing models and algorithms from recent and on-going programs at Athena (ACCS state
assessment, Hammerhead™ and mini-Medic®) have been evaluated for their applicability to this project.
The following summarizes the current findings.
Autonomous Combat Casualty Care System (ACCS) – The current algorithm development under the ACCS
program includes a comprehensive multi-parameter medical status determination on the casualty from
point of injury (POI) to definitive care. This diagnostic algorithm includes near real time non-invasive
assessments with closed loop control of therapeutics which includes ventilation, fluid resuscitation and
anesthetics/analgesics. The coding underway for the program includes remote care providers interfacing
directly with both the diagnostics and therapies via wired on site (Tablet) and wireless off site providers
and subject matter experts. As the casualty is transported from the POI transitions to environmental
extremes of altitude exacerbate the pressure, vibratory interferences, and temperature of the patient and
system. In addition specific diagnosis and therapies for suspected mild to moderate TBI are included.
These in turn impact therapies. These codes are directly relevant to the Phase 1 HAMS CASEVAC
application.
Hammerhead – When this task was completed Athena was waiting for permission to use the algorithms
developed under this project in HAMS. These algorithms are particularly applicable to workload and
fatigue at altitude when hypoxia may be apparent. The primary application is ground troop operations.
Permission was granted late in the program and further discussion is included in Section 4.4.1 of this
report.
Mini-Medic – Mini-Medic is a multi-parameter, FDA cleared monitor that incorporates a summary alarm
feature called Murphy Factor. Murphy Factor is a concept for integrating multiple parameters into a single
output alarm signal. Although the exact algorithm would need to be modified for HAMS a similar
approach is applicable to this project and is applicable to both the ground operations and CASEVAC
applications.
4.4 Task 4 – BETA Model Software Development/Definition
The two algorithm approaches developed under this program have both proved to be viable. In their
current form each can provide predictions based on only a few input variables and have the potential to
be further customized to individual tolerances. There are several options that can be implemented
moving forward:
Each model can act independently with a decision fusion for a final outcome,
One can focus on prediction of parameters and one can predict state,
One model can feed the other data during periods of sensor dropouts or
Combinations of the above depending on the data availability.
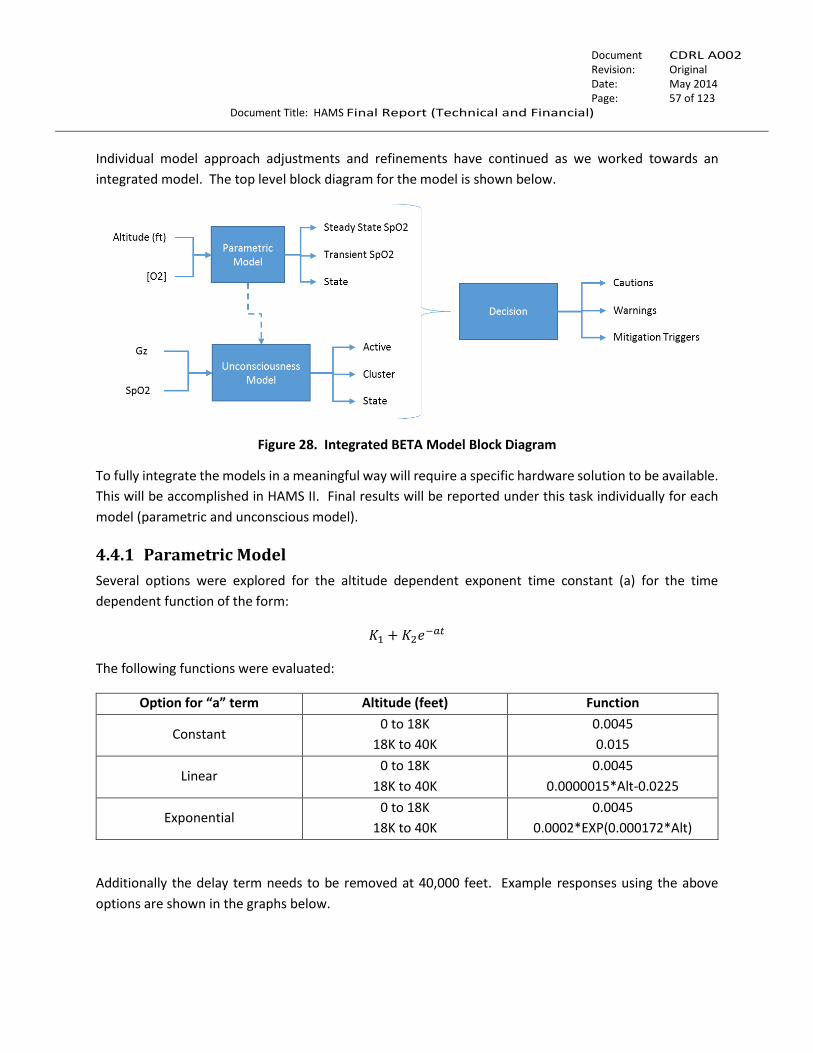
….…….
Document No.:
CDRL A002 Revision: Original
Date: May 2014 Page: 57 of 123
Document Title: HAMS Final Report (Technical and Financial)
Individual model approach adjustments and refinements have continued as we worked towards an
integrated model. The top level block diagram for the model is shown below.
Figure 28. Integrated BETA Model Block Diagram
To fully integrate the models in a meaningful way will require a specific hardware solution to be available.
This will be accomplished in HAMS II. Final results will be reported under this task individually for each
model (parametric and unconscious model).
4.4.1 Parametric Model
Several options were explored for the altitude dependent exponent time constant (a) for the time
dependent function of the form:
𝐾1 + 𝐾2𝑒−𝑎𝑡
The following functions were evaluated:
Option for “a” term Altitude (feet) Function
Constant 0 to 18K
18K to 40K
0.0045
0.015
Linear 0 to 18K
18K to 40K
0.0045
0.0000015*Alt-0.0225
Exponential 0 to 18K
18K to 40K
0.0045
0.0002*EXP(0.000172*Alt)
Additionally the delay term needs to be removed at 40,000 feet. Example responses using the above
options are shown in the graphs below.
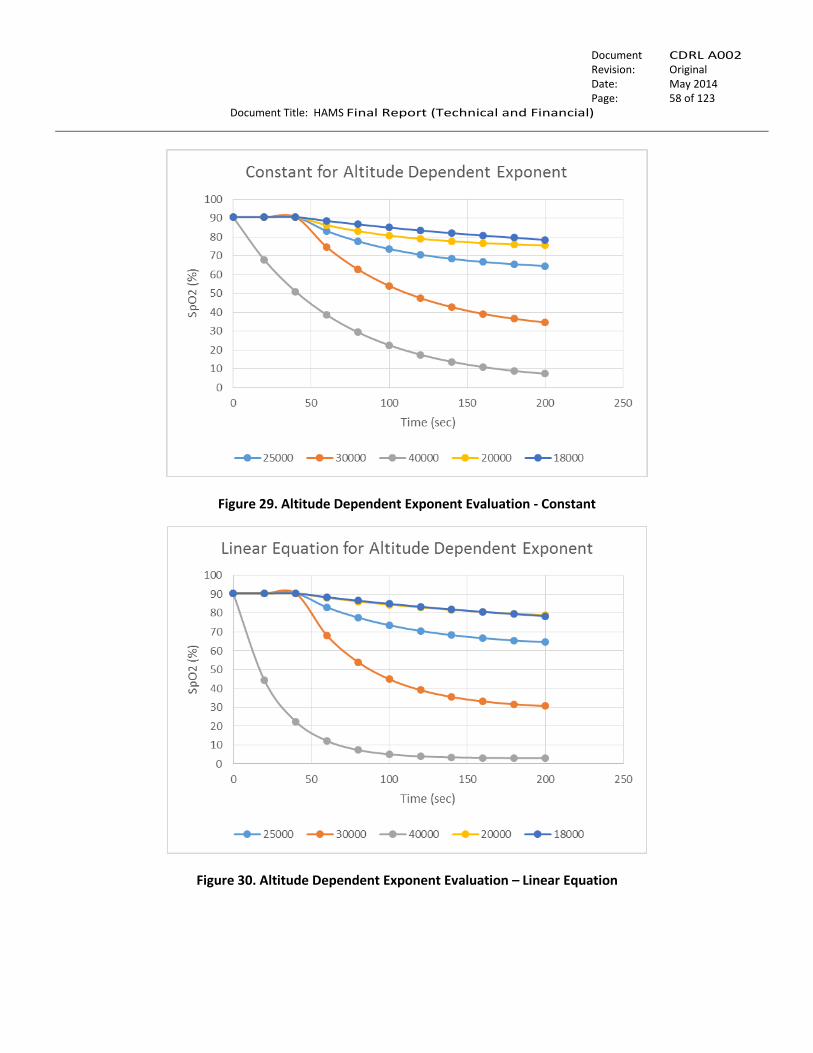
….…….
Document No.:
CDRL A002 Revision: Original
Date: May 2014 Page: 58 of 123
Document Title: HAMS Final Report (Technical and Financial)
Figure 29. Altitude Dependent Exponent Evaluation - Constant
Figure 30. Altitude Dependent Exponent Evaluation – Linear Equation
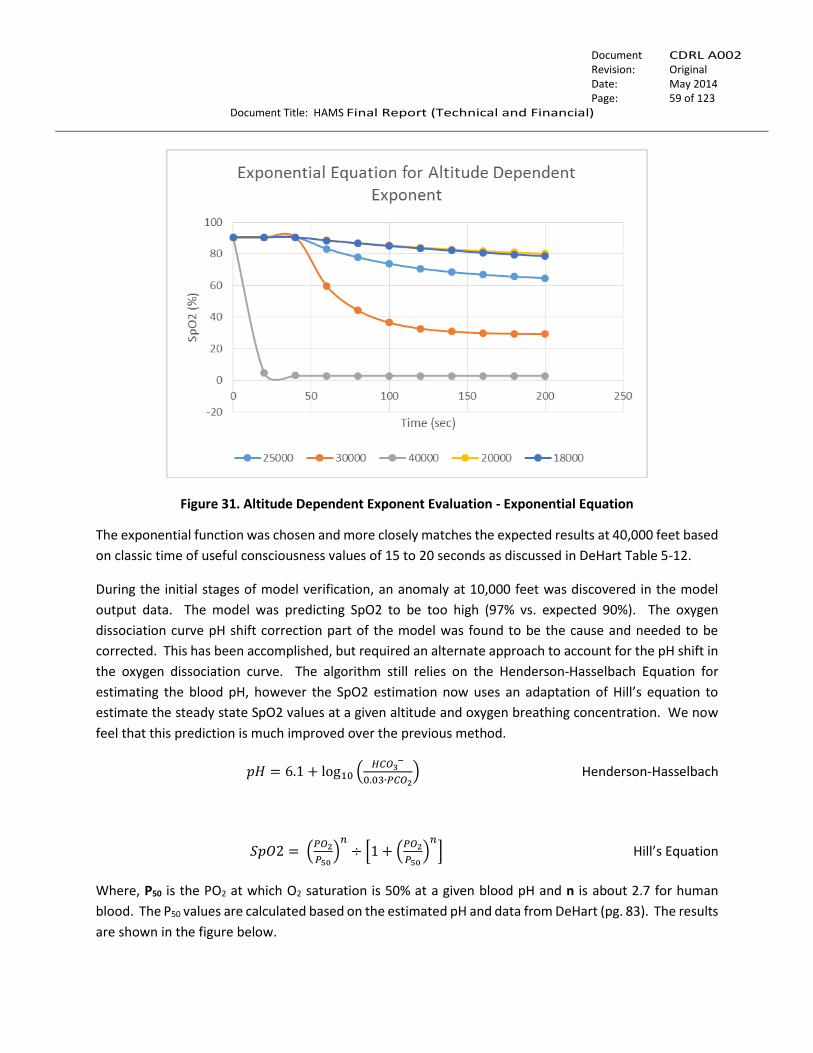
….…….
Document No.:
CDRL A002 Revision: Original
Date: May 2014 Page: 59 of 123
Document Title: HAMS Final Report (Technical and Financial)
Figure 31. Altitude Dependent Exponent Evaluation - Exponential Equation
The exponential function was chosen and more closely matches the expected results at 40,000 feet based
on classic time of useful consciousness values of 15 to 20 seconds as discussed in DeHart Table 5-12.
During the initial stages of model verification, an anomaly at 10,000 feet was discovered in the model
output data. The model was predicting SpO2 to be too high (97% vs. expected 90%). The oxygen
dissociation curve pH shift correction part of the model was found to be the cause and needed to be
corrected. This has been accomplished, but required an alternate approach to account for the pH shift in
the oxygen dissociation curve. The algorithm still relies on the Henderson-Hasselbach Equation for
estimating the blood pH, however the SpO2 estimation now uses an adaptation of Hill’s equation to
estimate the steady state SpO2 values at a given altitude and oxygen breathing concentration. We now
feel that this prediction is much improved over the previous method.
𝑝𝐻 = 6.1 + log10 (𝐻𝐶𝑂3
−
0.03∙𝑃𝐶𝑂2) Henderson-Hasselbach
𝑆𝑝𝑂2 = (𝑃𝑂2
𝑃50)
𝑛÷ [1 + (
𝑃𝑂2
𝑃50)
𝑛] Hill’s Equation
Where, P50 is the PO2 at which O2 saturation is 50% at a given blood pH and n is about 2.7 for human
blood. The P50 values are calculated based on the estimated pH and data from DeHart (pg. 83). The results
are shown in the figure below.
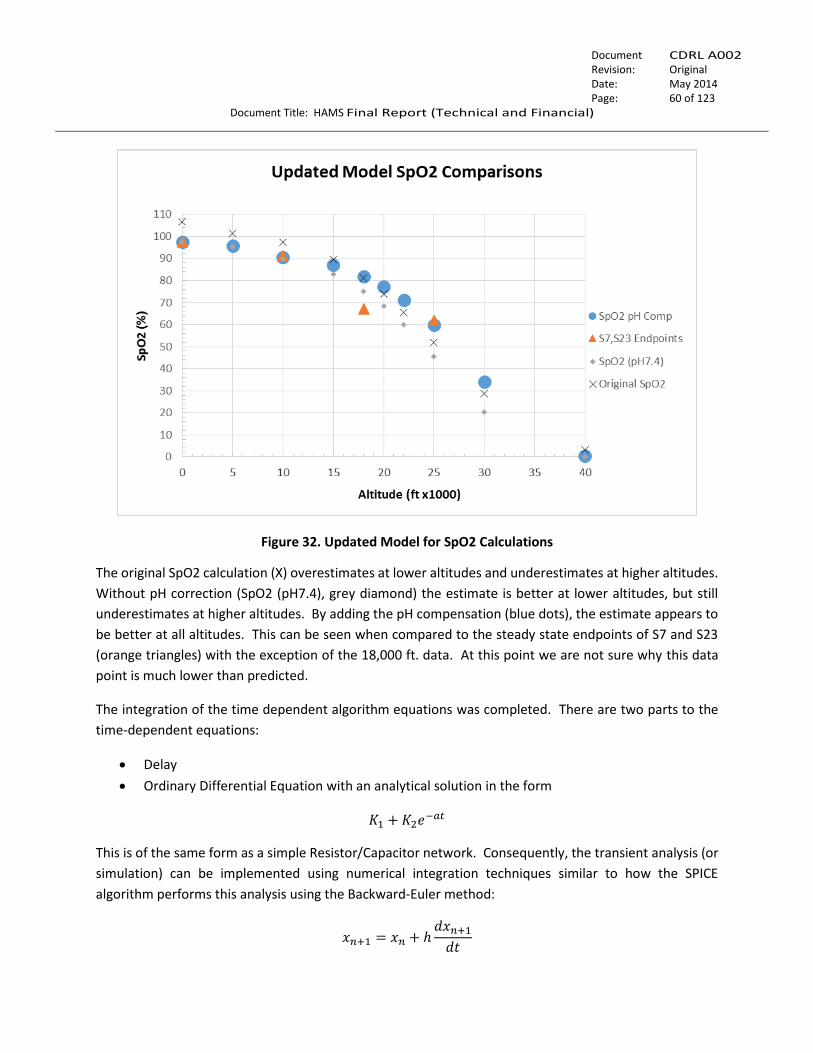
….…….
Document No.:
CDRL A002 Revision: Original
Date: May 2014 Page: 60 of 123
Document Title: HAMS Final Report (Technical and Financial)
Figure 32. Updated Model for SpO2 Calculations
The original SpO2 calculation (X) overestimates at lower altitudes and underestimates at higher altitudes.
Without pH correction (SpO2 (pH7.4), grey diamond) the estimate is better at lower altitudes, but still
underestimates at higher altitudes. By adding the pH compensation (blue dots), the estimate appears to
be better at all altitudes. This can be seen when compared to the steady state endpoints of S7 and S23
(orange triangles) with the exception of the 18,000 ft. data. At this point we are not sure why this data
point is much lower than predicted.
The integration of the time dependent algorithm equations was completed. There are two parts to the
time-dependent equations:
Delay
Ordinary Differential Equation with an analytical solution in the form
𝐾1 + 𝐾2𝑒−𝑎𝑡
This is of the same form as a simple Resistor/Capacitor network. Consequently, the transient analysis (or
simulation) can be implemented using numerical integration techniques similar to how the SPICE
algorithm performs this analysis using the Backward-Euler method:
𝑥𝑛+1 = 𝑥𝑛 + ℎ𝑑𝑥𝑛+1
𝑑𝑡
….…….
Document No.:
CDRL A002 Revision: Original
Date: May 2014 Page: 61 of 123
Document Title: HAMS Final Report (Technical and Financial)
Where “h” is the time step.
We can derive a transient analysis/simulation equation in terms of the time step “h”, time constant “a”,
the current SpO2 value and steady state SpO2 estimate/prediction. The resulting equation is as follows:
𝑆𝑝𝑂2𝑟𝑡𝑛+1 =
1ℎ
∙ 𝑆𝑝𝑂2𝑟𝑡𝑛 + 𝑆𝑝𝑂2 ∙ 𝑎
1ℎ
+ 𝑎
Where SpO2rt is the output estimate of the algorithm at each time step “h”. The “n” is the current state
and “n+1” is the next state of the model output.
To illustrate the implementation of this approach the figure below shows a comparison between how
each method would perform if implemented in a “real-time” mode using the ROBD study run of 0K to 10K
to 18K to 0K. The actual data from one of the sensors from both S7 and S23 are also included. The Outputs
are as follows:
AS out – This represents the model output over time using the Analytical Solution. Notice that
once a sufficient amount of time has elapsed, the decaying exponential becomes negligible and
the output immediately goes to the steady state at the transition points which is not
representative of the actual response we intend to model.
AS out (reset) – To demonstrate the “desired” response using the Analytical Solution, we have to
artificially reset the time to “zero” at each transition. This is relatively easy for our example below
because we know the transition points and they are simple step changes in altitude. “AS out”
shows the results of this approach, but is not practical to implement in real-time.
BE out (Simple) – This represents the Backward-Euler method implementation. The response is
as desired and does not require the time to be “reset to zero” at a transition point. The model
will respond to an input change at any time.
S7 and S23 – These plots are the data from S7 and S23 from one of the sensors of each subject as
a reference point for the model output.

….…….
Document No.:
CDRL A002 Revision: Original
Date: May 2014 Page: 62 of 123
Document Title: HAMS Final Report (Technical and Financial)
Figure 33. Parametric Transient Time Dependent Output
The above example does not include the delay function, but that is a straightforward sample delay and
memory allocation issue that is simple to accommodate and will depend on the “sample rate”. This is left
for the hardware implementation stage.
The modifications made to the model were updated in the “C” Code implementation and verified. The
following table shows the steady state verification table that includes the inputs (Altitude and [O2]) and
corresponding outputs from the Excel and “C” Code implementations. These outputs agree with the
exception of some small rounding errors that are insignificant (0.1 %SpO2 – Only whole number SpO2
values are needed).

….…….
Document No.:
CDRL A002 Revision: Original
Date: May 2014 Page: 63 of 123
Document Title: HAMS Final Report (Technical and Financial)
Table 11 "C" Code Output Verification – Steady State Output
Altitude (feet) [O2] Excel Model Output “C” Code Model Output
0 0.21 97.5 97.5
5000 0.21 95.6 95.6
10000 0.21 92.5 92.5
15000 0.21 87.0 87.0
18000 0.21 81.8 81.8
20000 0.21 77.2 77.1
22000 0.21 71.3 71.3
25000 0.21 59.8 59.8
30000 0.21 34.2 34.1
40000 0.21 0.4 0.5
The time-based function was also verified. The plot below shows an example of this verification using the
S23 D1 subject 18,000 feet exposure profile (0K to 10K to 18K to 0K). The outputs of each implementation
are exactly overlaid as expected.
Figure 34. "C" Code Verification - Transient Output
Once the model was responding in the desired manner, attention was diverted to further verification with
subject data. Since the data already exists in MS EXCEL, each calculation step of the algorithm was
reproduced in EXCEL to facilitate verification tracking and plotting the results. Beginning with data from

….…….
Document No.:
CDRL A002 Revision: Original
Date: May 2014 Page: 64 of 123
Document Title: HAMS Final Report (Technical and Financial)
S23, the input parameters (time, Altitude) were copied from the subject data files and [O2] was fixed at
0.21. The model was allowed to run and the Steady State as well as “real time” prediction of SpO2 were
generated. The results are shown in the figures below as the Red line (SpO2 (Model)). The figures show
subjects that were exposed to the same test profile of 0K, 10K, 18K and 0K feet simulated altitude using a
ROBD. Several observations were made:
1. The model output (red line) is significantly higher than the subject data (Blue line – SpO2 (S23)).
2. The model decay profile is of the desired shape.
3. The Steady State predictions are above what the subject data indicates.
4. The recovery profile is much faster than the model predicts.
Since the subject data was taken under normobaric conditions using the ROBD, we suspected that this
could have an effect on the results. The steady state model is based on hypobaric conditions. One
potential consequence of normobaric testing is that the pH shift is affected due to higher than expected
CO2 in the blood. This would result in a lower pH and a similar lower steady state SpO2 prediction. If we
run the model keeping the pH at 7.4 (See below figures) this significantly reduces the model prediction
(Grey line – SpO2 (Model pH7.4)). However it is still significantly higher than the subject data. Looking at
the subject data more closely, the simulated altitude was assumed to be 0, 10K and 18K exactly (the
intended target altitudes), but in reality it was not perfectly set to these altitudes. The ROBD simulates
the altitude by adjusting the % O2 in the breathing gas. This %O2 concentration is recorded in the data
sets. When this information is used to adjust the “actual” altitude in place of the target test altitude the
results were again significantly affected. The Yellow line (SpO2 (Model pH7.4) TAC) represents the model
prediction that accounts for potential effects of normobaric tests as well as correcting for the test altitude
and shows a much closer representation of the subject data. Individual test days (S23 D1 vs. S23 D2) as
well as individual subject response (S23 vs. S5) are still evident. The S5 SpO2 (Model pH7.4) TAC yellow
line output also includes an initial concept for differentiating the decay vs. recovery transient response of
the model prediction. The recovery portion of the model still requires additional development.
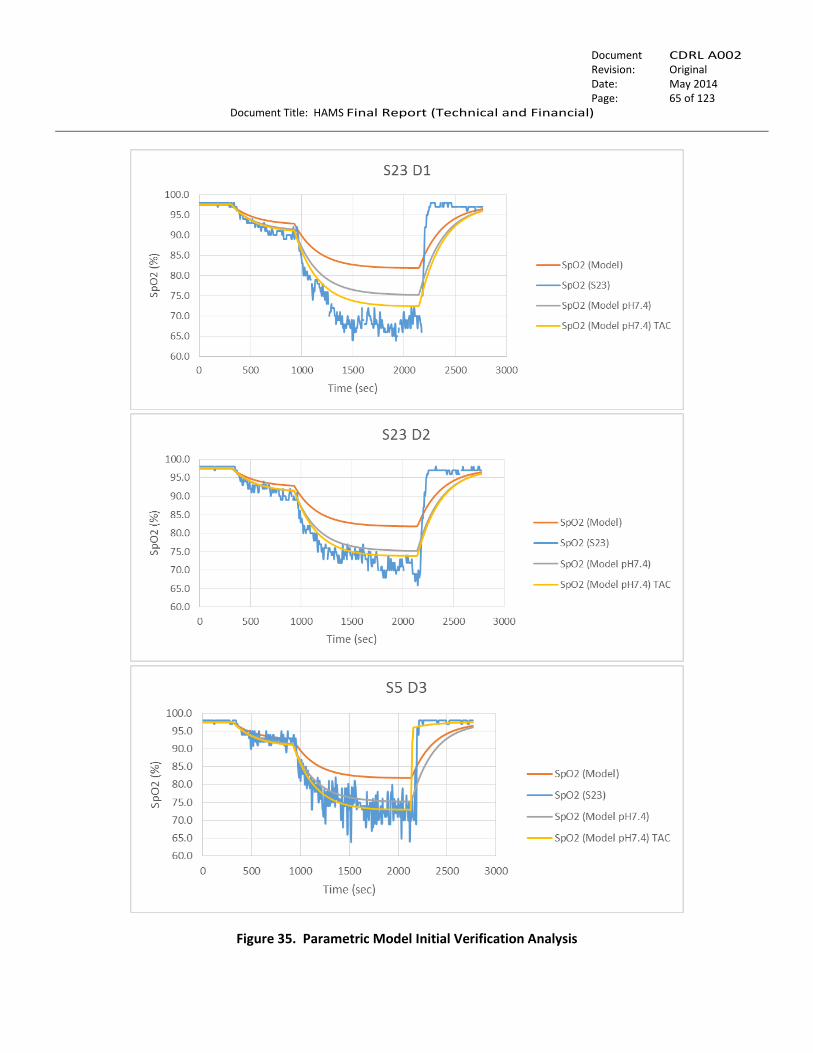
….…….
Document No.:
CDRL A002 Revision: Original
Date: May 2014 Page: 65 of 123
Document Title: HAMS Final Report (Technical and Financial)
Figure 35. Parametric Model Initial Verification Analysis
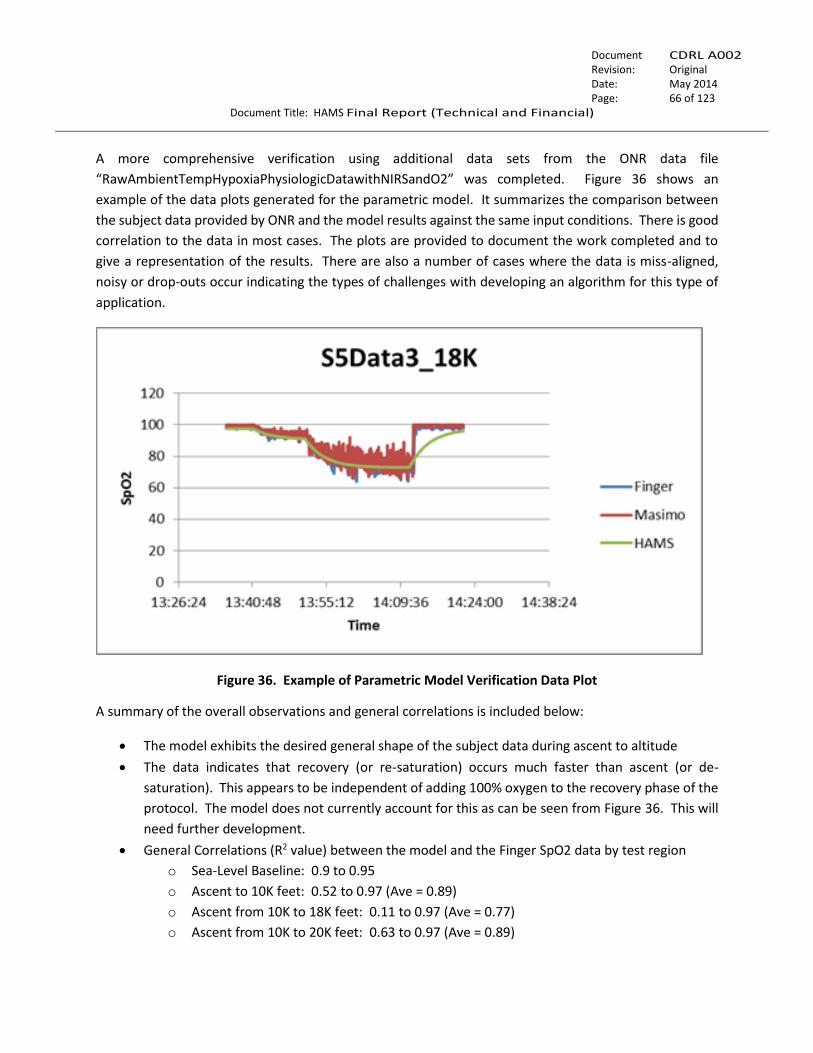
….…….
Document No.:
CDRL A002 Revision: Original
Date: May 2014 Page: 66 of 123
Document Title: HAMS Final Report (Technical and Financial)
A more comprehensive verification using additional data sets from the ONR data file
“RawAmbientTempHypoxiaPhysiologicDatawithNIRSandO2” was completed. Figure 36 shows an
example of the data plots generated for the parametric model. It summarizes the comparison between
the subject data provided by ONR and the model results against the same input conditions. There is good
correlation to the data in most cases. The plots are provided to document the work completed and to
give a representation of the results. There are also a number of cases where the data is miss-aligned,
noisy or drop-outs occur indicating the types of challenges with developing an algorithm for this type of
application.
Figure 36. Example of Parametric Model Verification Data Plot
A summary of the overall observations and general correlations is included below:
The model exhibits the desired general shape of the subject data during ascent to altitude
The data indicates that recovery (or re-saturation) occurs much faster than ascent (or de-
saturation). This appears to be independent of adding 100% oxygen to the recovery phase of the
protocol. The model does not currently account for this as can be seen from Figure 36. This will
need further development.
General Correlations (R2 value) between the model and the Finger SpO2 data by test region
o Sea-Level Baseline: 0.9 to 0.95
o Ascent to 10K feet: 0.52 to 0.97 (Ave = 0.89)
o Ascent from 10K to 18K feet: 0.11 to 0.97 (Ave = 0.77)
o Ascent from 10K to 20K feet: 0.63 to 0.97 (Ave = 0.89)
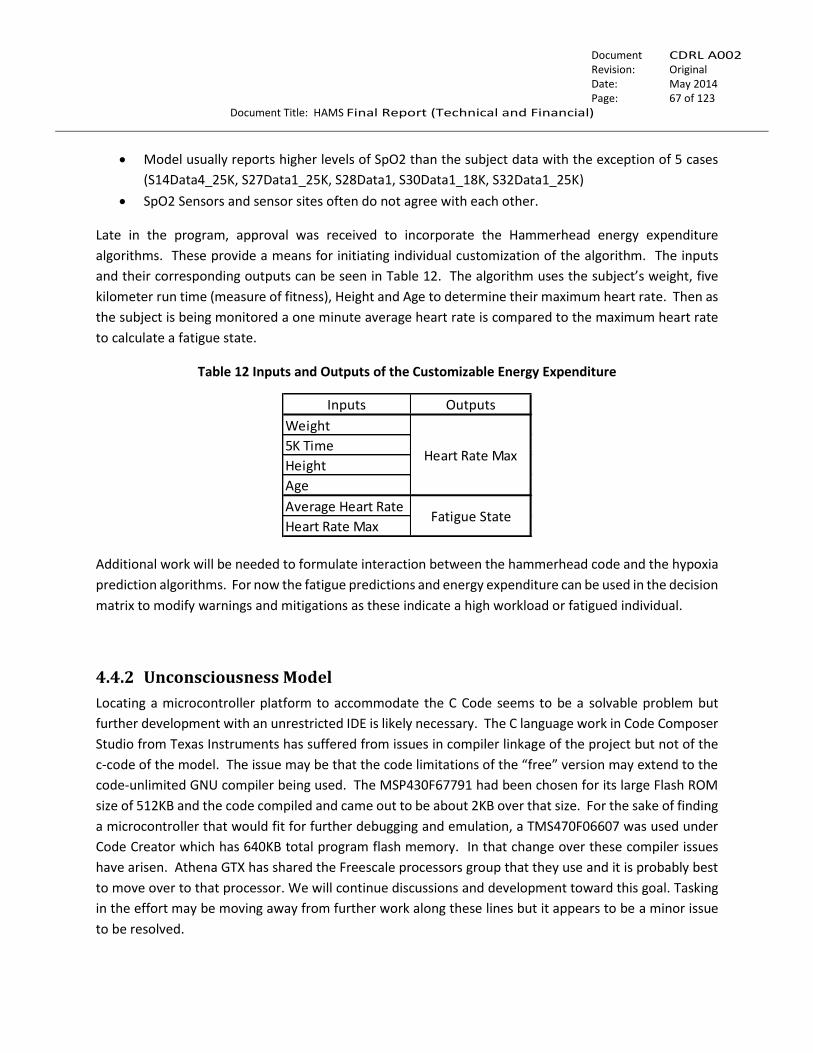
….…….
Document No.:
CDRL A002 Revision: Original
Date: May 2014 Page: 67 of 123
Document Title: HAMS Final Report (Technical and Financial)
Model usually reports higher levels of SpO2 than the subject data with the exception of 5 cases
(S14Data4_25K, S27Data1_25K, S28Data1, S30Data1_18K, S32Data1_25K)
SpO2 Sensors and sensor sites often do not agree with each other.
Late in the program, approval was received to incorporate the Hammerhead energy expenditure
algorithms. These provide a means for initiating individual customization of the algorithm. The inputs
and their corresponding outputs can be seen in Table 12. The algorithm uses the subject’s weight, five
kilometer run time (measure of fitness), Height and Age to determine their maximum heart rate. Then as
the subject is being monitored a one minute average heart rate is compared to the maximum heart rate
to calculate a fatigue state.
Table 12 Inputs and Outputs of the Customizable Energy Expenditure
Additional work will be needed to formulate interaction between the hammerhead code and the hypoxia
prediction algorithms. For now the fatigue predictions and energy expenditure can be used in the decision
matrix to modify warnings and mitigations as these indicate a high workload or fatigued individual.
4.4.2 Unconsciousness Model
Locating a microcontroller platform to accommodate the C Code seems to be a solvable problem but
further development with an unrestricted IDE is likely necessary. The C language work in Code Composer
Studio from Texas Instruments has suffered from issues in compiler linkage of the project but not of the
c-code of the model. The issue may be that the code limitations of the “free” version may extend to the
code-unlimited GNU compiler being used. The MSP430F67791 had been chosen for its large Flash ROM
size of 512KB and the code compiled and came out to be about 2KB over that size. For the sake of finding
a microcontroller that would fit for further debugging and emulation, a TMS470F06607 was used under
Code Creator which has 640KB total program flash memory. In that change over these compiler issues
have arisen. Athena GTX has shared the Freescale processors group that they use and it is probably best
to move over to that processor. We will continue discussions and development toward this goal. Tasking
in the effort may be moving away from further work along these lines but it appears to be a minor issue
to be resolved.
Inputs Outputs
Weight
5K Time
Height
Age
Average Heart Rate
Heart Rate MaxFatigue State
Heart Rate Max

….…….
Document No.:
CDRL A002 Revision: Original
Date: May 2014 Page: 68 of 123
Document Title: HAMS Final Report (Technical and Financial)
Based on the review held on 20 February, three items emerged.
[1] A version of the consciousness model was modified to run as if it were getting time history data
in a real application to understand model response. This modified model is under examination to
insure that it is performing as required. Most of the questions have to do with accessing the data
and displaying the results based on sliding down the Excel data column. This exercise has
generated thought about the continuous running of the model and how to initialize and continue
running without losing the end of data segment results as initial conditions for the next data
segment.
[2] More of Dr. Shender’s data were run through the original version of the Excel model. The datasets
(1 and 2) for the LifeShirt data runs with the Nonin SaO2 data at a 60 Hz rate were used. Thirteen
subjects at 18K and 25K feet were run through the model with the screenshots of the simulation
results reproduced in Section 10.2.2. The problem of data drop outs was addressed by manually
setting the data values to the last known data point which in most cases was for a short period of
time and was contiguous with the next valid data point (the same data value). The general theme
that below 80% SaO2 the model indicated impairment and below 70% the Active and Cluster
values went to zero which triggered a loss of conscious indication by the model. In most cases by
the experimental protocol 100% Oxygen was administered at this point which probably prevented
any loss of consciousness to occur, in which none did occur. The individual subject response was
in no way homogeneous. Some subjects’ SaO2 dropped significantly at 18K feet while some did
not. Most subjects responded with significant loss of SaO2 at 25K feet. Using a calculation of
altitude, pressure and SaO2 may miss some impairment cases unless we can find a way to
personalize the model calculation. The model demonstrated a lag in state change from impaired
to baseline after restoration of greater than 90% SaO2. While these statements are generalized,
more specific statements of timing and SaO2 levels can be generated for the possible
development of some parameter relationships if it is felt it would be beneficial.
[3] More realistic acceleration-decompression scenarios for the model need to be generated and
this will be done.
By modifying data types defined in the original code the C code Model version has been reduced to the
smallest code size to date. The C language code has been compiled and is being debugged under a
standard C99 compiler running under the Eclipse IDE. One large data array within the program held
values from 0 to 2 and the data type for this array was changed to byte/char under both the Excel VBA
and C implementation without problems. The Excel VBA code ran as before the data type change.
Other miscellaneous over-specified data type declarations were changed which including the above
array redefinition have resulted in an executable file of 118,344 bytes. After continued elimination of
miscellaneous over-specified data type declarations and unused declarations were changed or
eliminated the executable file size was 116,854 bytes. The data arrays for acceleration and oxygen
saturation are still specified in the code which would be in RAM on board the embedded system and not
count against the program size. The code was ported to an embedded system IDE where it compiled

….…….
Document No.:
CDRL A002 Revision: Original
Date: May 2014 Page: 69 of 123
Document Title: HAMS Final Report (Technical and Financial)
successfully but could not be debugged on the target embedded system since there was no processor
emulator.
Exploration of the limitations of the neurological model using experimental data continues. The most
recent analysis is discussed below. The data from the Wolf 2014 paper (reported last month) which
cited the Hoffman et al 1946 paper was run in the Excel VBA model operating at 1 second intervals. The
plot below is from the Wolf paper which the Hoffman data points were digitized and then fit with a
model to give 1 second time points for the Excel VBA model.
Wolf M. Physiological consequences of rapid or prolonged aircraft decompression: evaluation using a
human respiratory model. Aviat Space Environ Med 2014; 85: 466 – 72 .
Hoffman CE, Clark RT, Jr., Brown EB, Jr. Blood oxygen saturation and duration of consciousness in anoxia
at high altitude. Am J Physiol 1946 ; 145 : 685 – 92 .
Figure 37 Wolf Paper Figure
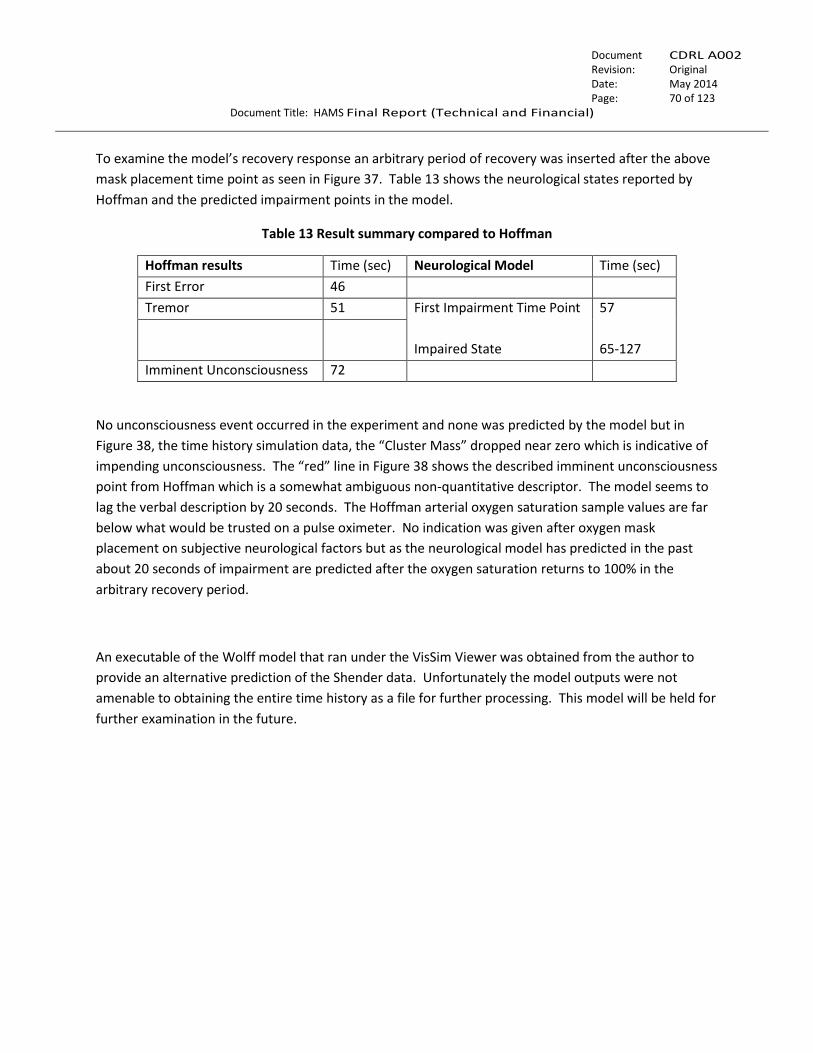
….…….
Document No.:
CDRL A002 Revision: Original
Date: May 2014 Page: 70 of 123
Document Title: HAMS Final Report (Technical and Financial)
To examine the model’s recovery response an arbitrary period of recovery was inserted after the above
mask placement time point as seen in Figure 37. Table 13 shows the neurological states reported by
Hoffman and the predicted impairment points in the model.
Table 13 Result summary compared to Hoffman
Hoffman results Time (sec) Neurological Model Time (sec)
First Error 46
Tremor 51 First Impairment Time Point
Impaired State
57
65-127
Imminent Unconsciousness 72
No unconsciousness event occurred in the experiment and none was predicted by the model but in
Figure 38, the time history simulation data, the “Cluster Mass” dropped near zero which is indicative of
impending unconsciousness. The “red” line in Figure 38 shows the described imminent unconsciousness
point from Hoffman which is a somewhat ambiguous non-quantitative descriptor. The model seems to
lag the verbal description by 20 seconds. The Hoffman arterial oxygen saturation sample values are far
below what would be trusted on a pulse oximeter. No indication was given after oxygen mask
placement on subjective neurological factors but as the neurological model has predicted in the past
about 20 seconds of impairment are predicted after the oxygen saturation returns to 100% in the
arbitrary recovery period.
An executable of the Wolff model that ran under the VisSim Viewer was obtained from the author to
provide an alternative prediction of the Shender data. Unfortunately the model outputs were not
amenable to obtaining the entire time history as a file for further processing. This model will be held for
further examination in the future.
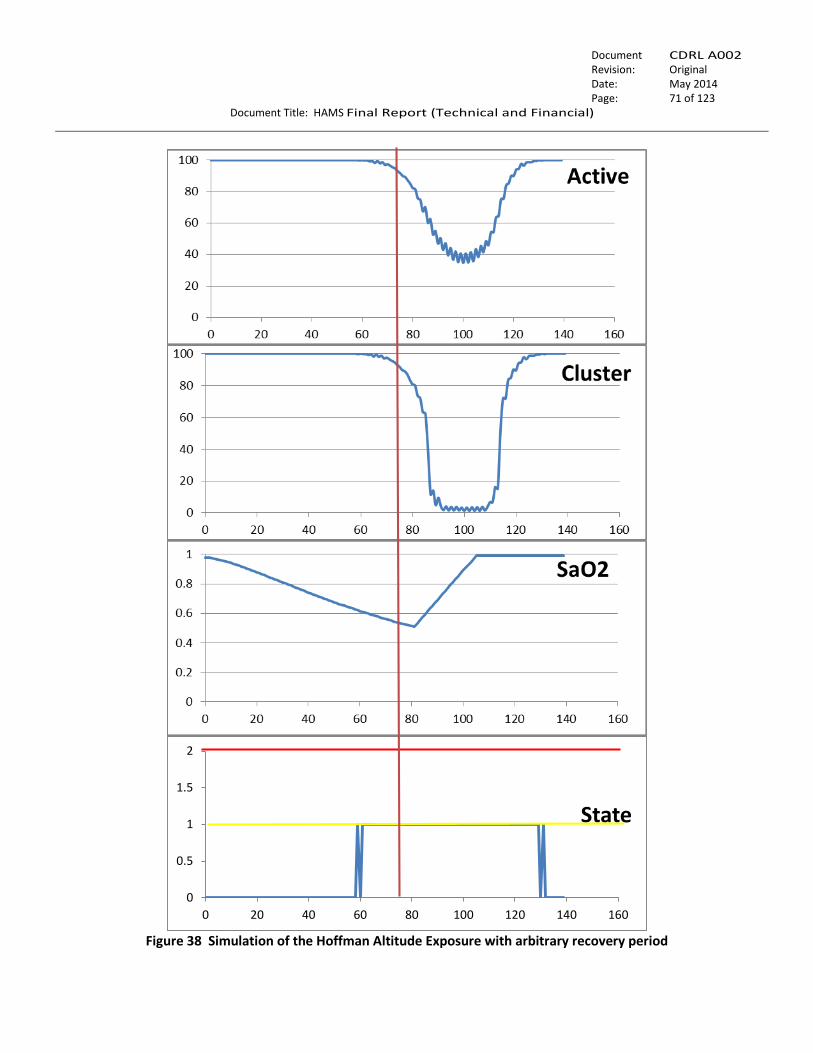
….…….
Document No.:
CDRL A002 Revision: Original
Date: May 2014 Page: 71 of 123
Document Title: HAMS Final Report (Technical and Financial)
Figure 38 Simulation of the Hoffman Altitude Exposure with arbitrary recovery period
0
0.5
1
1.5
2
0 20 40 60 80 100 120 140 160
State
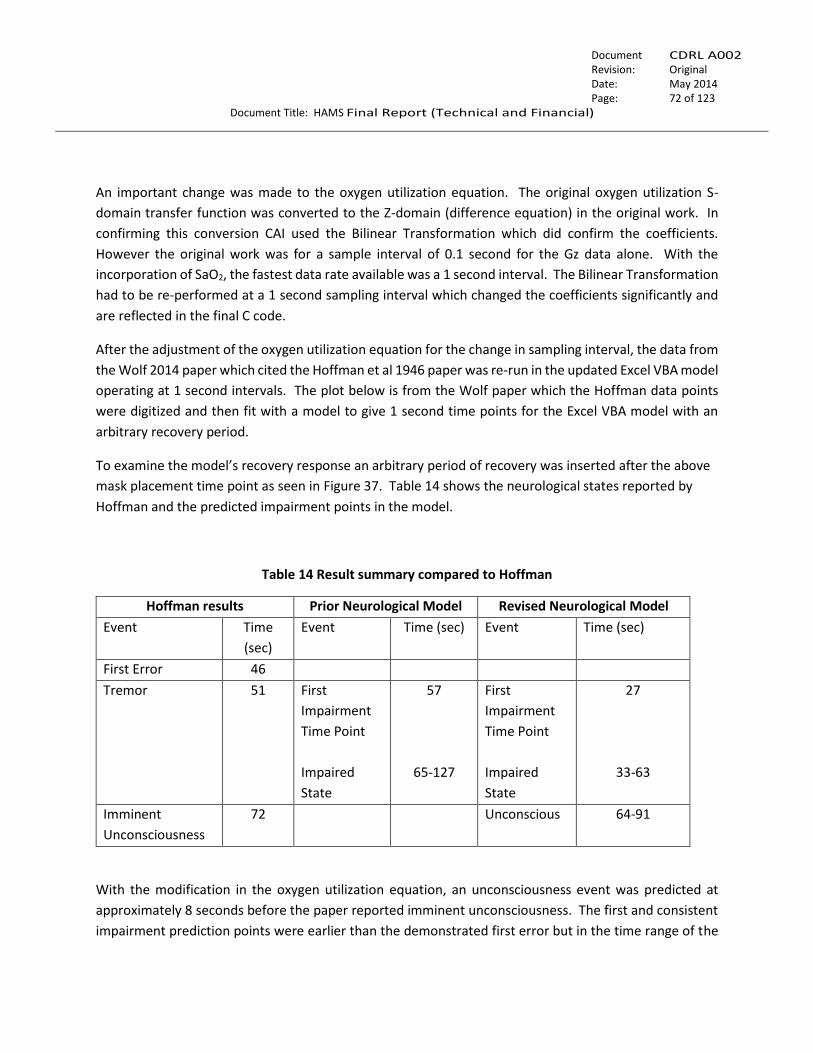
….…….
Document No.:
CDRL A002 Revision: Original
Date: May 2014 Page: 72 of 123
Document Title: HAMS Final Report (Technical and Financial)
An important change was made to the oxygen utilization equation. The original oxygen utilization S-
domain transfer function was converted to the Z-domain (difference equation) in the original work. In
confirming this conversion CAI used the Bilinear Transformation which did confirm the coefficients.
However the original work was for a sample interval of 0.1 second for the Gz data alone. With the
incorporation of SaO2, the fastest data rate available was a 1 second interval. The Bilinear Transformation
had to be re-performed at a 1 second sampling interval which changed the coefficients significantly and
are reflected in the final C code.
After the adjustment of the oxygen utilization equation for the change in sampling interval, the data from
the Wolf 2014 paper which cited the Hoffman et al 1946 paper was re-run in the updated Excel VBA model
operating at 1 second intervals. The plot below is from the Wolf paper which the Hoffman data points
were digitized and then fit with a model to give 1 second time points for the Excel VBA model with an
arbitrary recovery period.
To examine the model’s recovery response an arbitrary period of recovery was inserted after the above
mask placement time point as seen in Figure 37. Table 14 shows the neurological states reported by
Hoffman and the predicted impairment points in the model.
Table 14 Result summary compared to Hoffman
Hoffman results Prior Neurological Model Revised Neurological Model
Event Time
(sec)
Event Time (sec) Event Time (sec)
First Error 46
Tremor 51 First
Impairment
Time Point
Impaired
State
57
65-127
First
Impairment
Time Point
Impaired
State
27
33-63
Imminent
Unconsciousness
72 Unconscious 64-91
With the modification in the oxygen utilization equation, an unconsciousness event was predicted at
approximately 8 seconds before the paper reported imminent unconsciousness. The first and consistent
impairment prediction points were earlier than the demonstrated first error but in the time range of the
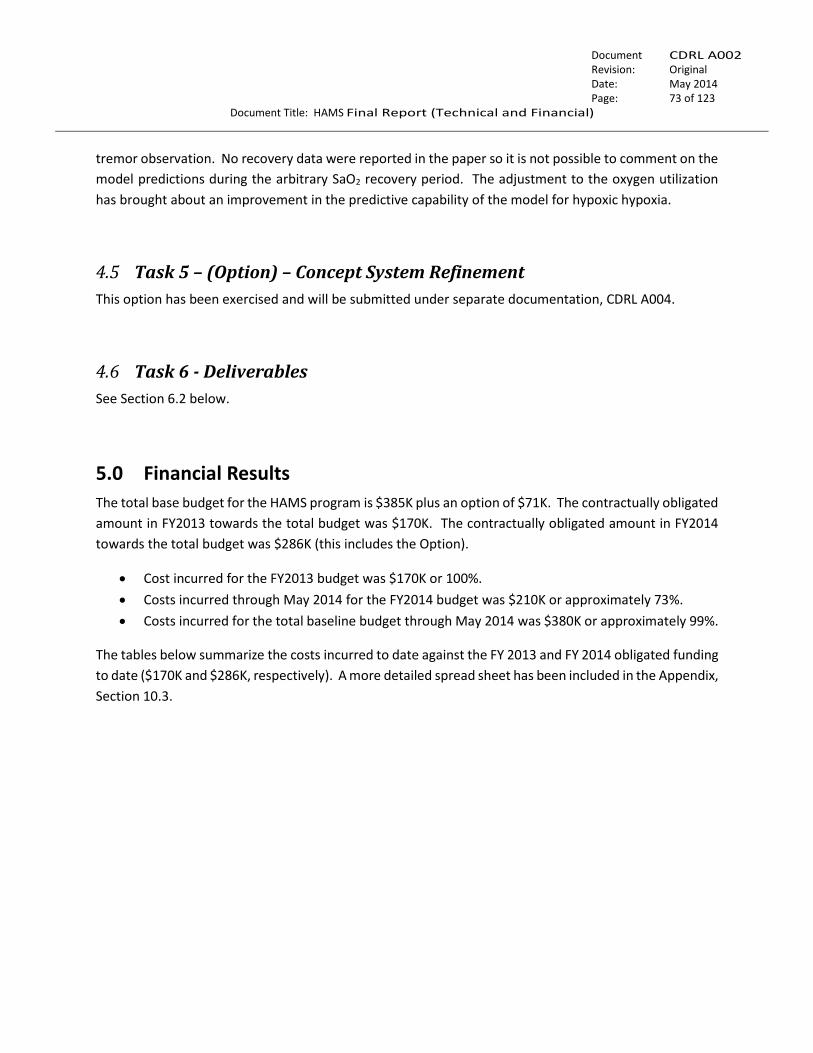
….…….
Document No.:
CDRL A002 Revision: Original
Date: May 2014 Page: 73 of 123
Document Title: HAMS Final Report (Technical and Financial)
tremor observation. No recovery data were reported in the paper so it is not possible to comment on the
model predictions during the arbitrary SaO2 recovery period. The adjustment to the oxygen utilization
has brought about an improvement in the predictive capability of the model for hypoxic hypoxia.
4.5 Task 5 – (Option) – Concept System Refinement
This option has been exercised and will be submitted under separate documentation, CDRL A004.
4.6 Task 6 - Deliverables
See Section 6.2 below.
5.0 Financial Results
The total base budget for the HAMS program is $385K plus an option of $71K. The contractually obligated
amount in FY2013 towards the total budget was $170K. The contractually obligated amount in FY2014
towards the total budget was $286K (this includes the Option).
Cost incurred for the FY2013 budget was $170K or 100%.
Costs incurred through May 2014 for the FY2014 budget was $210K or approximately 73%.
Costs incurred for the total baseline budget through May 2014 was $380K or approximately 99%.
The tables below summarize the costs incurred to date against the FY 2013 and FY 2014 obligated funding
to date ($170K and $286K, respectively). A more detailed spread sheet has been included in the Appendix,
Section 10.3.
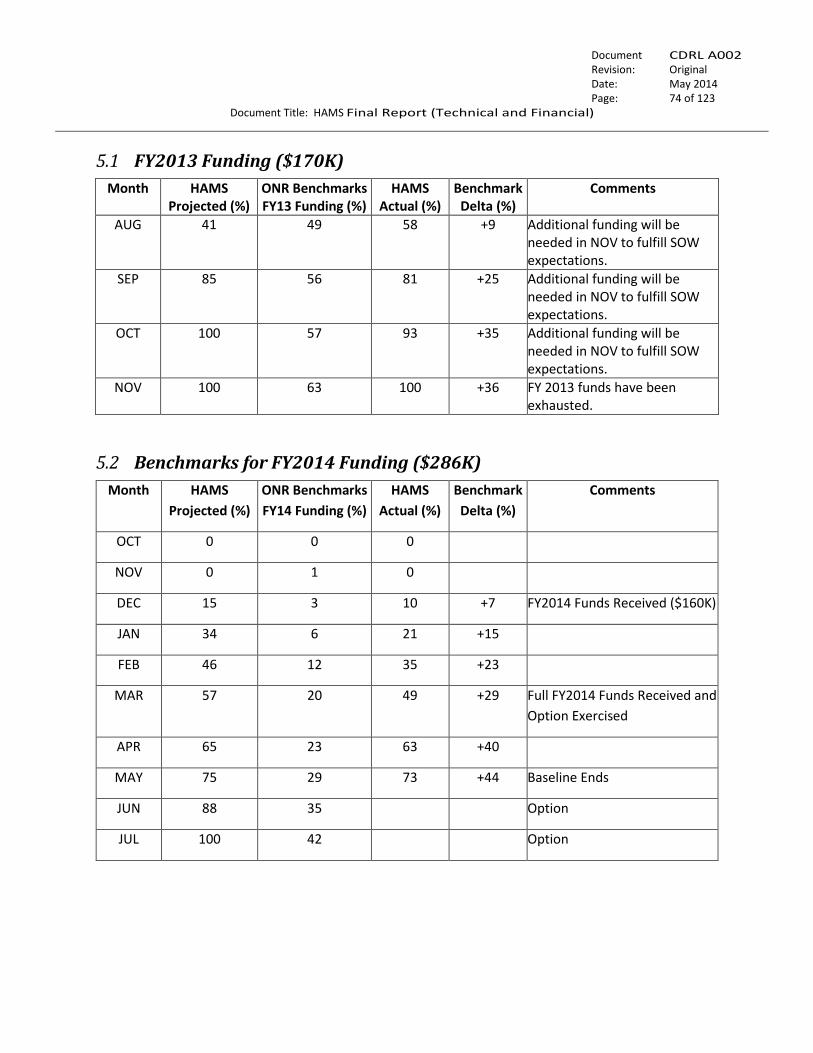
….…….
Document No.:
CDRL A002 Revision: Original
Date: May 2014 Page: 74 of 123
Document Title: HAMS Final Report (Technical and Financial)
5.1 FY2013 Funding ($170K)
Month HAMS Projected (%)
ONR Benchmarks FY13 Funding (%)
HAMS Actual (%)
Benchmark Delta (%)
Comments
AUG 41 49 58 +9 Additional funding will be needed in NOV to fulfill SOW expectations.
SEP 85 56 81 +25 Additional funding will be needed in NOV to fulfill SOW expectations.
OCT 100 57 93 +35 Additional funding will be needed in NOV to fulfill SOW expectations.
NOV 100 63 100 +36 FY 2013 funds have been exhausted.
5.2 Benchmarks for FY2014 Funding ($286K)
Month HAMS
Projected (%)
ONR Benchmarks
FY14 Funding (%)
HAMS
Actual (%)
Benchmark
Delta (%)
Comments
OCT 0 0 0
NOV 0 1 0
DEC 15 3 10 +7 FY2014 Funds Received ($160K)
JAN 34 6 21 +15
FEB 46 12 35 +23
MAR 57 20 49 +29 Full FY2014 Funds Received and
Option Exercised
APR 65 23 63 +40
MAY 75 29 73 +44 Baseline Ends
JUN 88 35 Option
JUL 100 42 Option
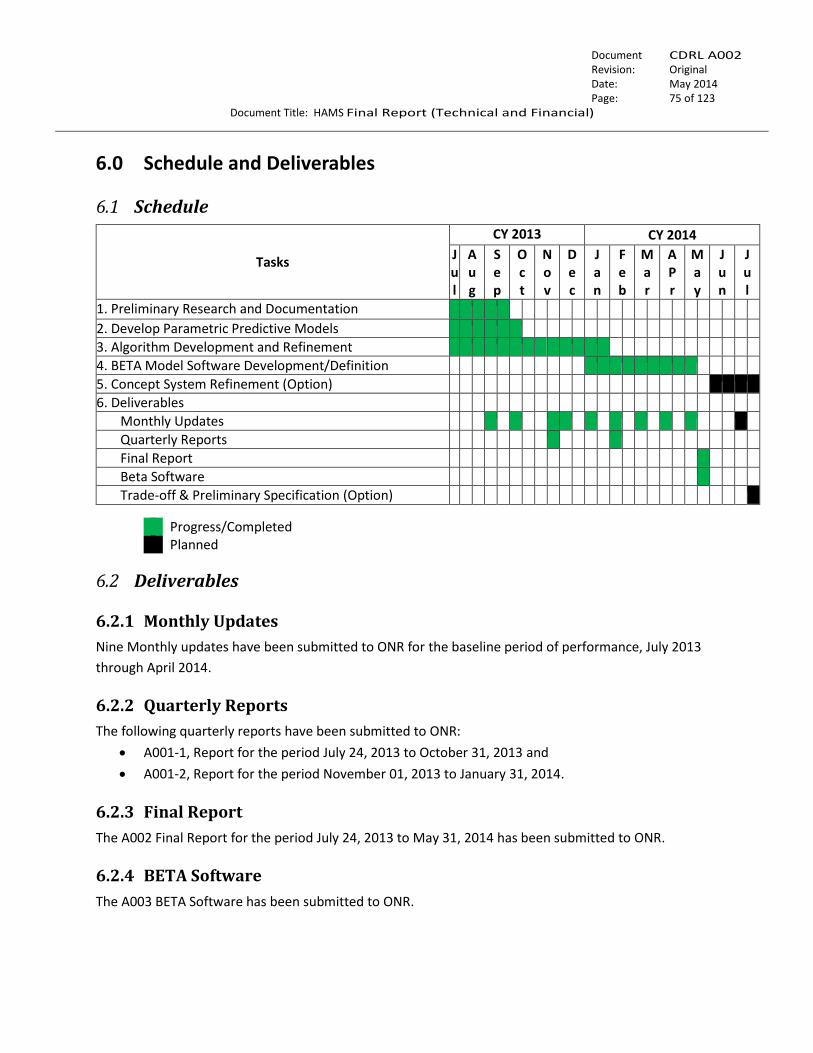
….…….
Document No.:
CDRL A002 Revision: Original
Date: May 2014 Page: 75 of 123
Document Title: HAMS Final Report (Technical and Financial)
6.0 Schedule and Deliverables
6.1 Schedule
Tasks
CY 2013 CY 2014
Jul
A u g
S e p
O c t
N o v
D e c
J a n
F e b
M a r
A P r
M a y
J u n
J u l
1. Preliminary Research and Documentation
2. Develop Parametric Predictive Models
3. Algorithm Development and Refinement
4. BETA Model Software Development/Definition
5. Concept System Refinement (Option)
6. Deliverables
Monthly Updates
Quarterly Reports
Final Report
Beta Software
Trade-off & Preliminary Specification (Option)
Progress/Completed Planned
6.2 Deliverables
6.2.1 Monthly Updates
Nine Monthly updates have been submitted to ONR for the baseline period of performance, July 2013
through April 2014.
6.2.2 Quarterly Reports
The following quarterly reports have been submitted to ONR:
A001-1, Report for the period July 24, 2013 to October 31, 2013 and
A001-2, Report for the period November 01, 2013 to January 31, 2014.
6.2.3 Final Report
The A002 Final Report for the period July 24, 2013 to May 31, 2014 has been submitted to ONR.
6.2.4 BETA Software
The A003 BETA Software has been submitted to ONR.

….…….
Document No.:
CDRL A002 Revision: Original
Date: May 2014 Page: 76 of 123
Document Title: HAMS Final Report (Technical and Financial)
6.2.5 Option – Trade-off Analysis and Preliminary Specification
This option has been exercised and will be submitted under a separate documentation, CDRL A004.
7.0 Conclusion
The Hypoxia Monitoring, Alert and Mitigation System (HAMS) program has progressed as expected and the baseline program has been completed. The optional Task 5 has been exercised and will be documented in a separate deliverable.
The concentrated effort on the literature search activity (Task 1) has been completed. A File Transfer Protocol (FTP) site has been created to share references and data among the team members and Office of Naval Research (ONR).
The baseline parametric hypoxia modeling effort (Task 2) has been completed. A model to predict %O2 saturation, aircrew state, alveolar pressure of oxygen (PaO2) and alveolar pressure of carbon dioxide (PaCO2) has been converted over to the C programming language. This allows the algorithm to eventually run on a micro-controller. Additionally the time based algorithms have been adjusted to better represent the physiological response of the human to high altitude hypoxic events.
The conversion of the United States Navy (USN) Consciousness Model (Task 3) has been completed. Initial
verification and sensitivity analysis has shown positive results and the code has been reduced to a size
and complexity that will run on a modest microcontroller. The addition of a hypoxia component to the
acceleration component of the model has demonstrated good results.
The final baseline task (BETA Model Software Development/Definition – Task 4) has been completed.
Software algorithms have been further developed through sequential iterations that progressively refined
a prediction for hypoxia and near-hypoxia conditions. The focus on implementation in a memory-limited,
bit-constrained microcontroller has remained a top priority. For each iteration the algorithms and
software have been evaluated using existing data provide by ONR.
The baseline parametric algorithm to predict %O2 saturation and aircrew state and the modification of
the USN Consciousness Model to predict LOC due to altitude induced hypoxia remain as viable approaches
moving into the next phase of development.
….…….
Document No.:
CDRL A002 Revision: Original
Date: May 2014 Page: 77 of 123
Document Title: HAMS Final Report (Technical and Financial)
8.0 Recommendations
We recommend that the program continue with the planned HAMS Phase II project as proposed under
the Long Range Broad Agency Announcement (BAA) for Navy and Marine Corps Science and Technology:
ONR BAA 14-001, Special Notice 14-SN-0002 entitled “Hypoxia Monitoring, Alert and Mitigation System”
(HAMS).
9.0 References
Not Applicable. See Section 4.1 for additional literature review results relevant to HAMS.

….…….
Document No.:
CDRL A002 Revision: Original
Date: May 2014 Page: 78 of 123
Document Title: HAMS Final Report (Technical and Financial)
10.0 Appendix
10.1 Task 1: Preliminary Research and Documentation
10.1.1 Additional Literature Search Results – Abstracts Only
The following additional literature review results are included for completeness.
Andersson, J., Linér, M., Rünow, E., Schagatay, E. (2002). Diving response and arterial oxygen
saturation during apnea and exercise in breath-hold divers. Journal of Applied Physiology.
93:882-886.
This study addressed the effects of apnea in air and apnea with face immersion in cold water (10°C) on
the diving response and arterial oxygen saturation during dynamic exercise. Eight trained breath-hold
divers performed steady state exercise on a cycle ergometer at 100 W. During exercise, each subject
performed 30-s apneas in air and 30-s apneas with face immersion. The heart rate and arterial oxygen
saturation decreased and blood pressure increased during the apneas. Compared with apneas in air,
apneas with face immersion augmented the heart rate reduction from 21 to 33% (P <0.001) and the blood
pressure increase from 34 to 42% (P < 0.05). The reduction in arterial oxygen saturation from eupneic
control was 6.8% during apneas in air and 5.2% during apneas with face immersion (P < 0.05). The results
indicate that augmentation of the diving response slows down the depletion of the lung oxygen store,
possibly associated with a larger reduction in peripheral venous oxygen stores and increased anaerobiosis.
This mechanism delays the fall in alveolar and arterial PO2 and, thereby, the development of hypoxia in
vital organs. Accordingly, we conclude that the human diving response has an oxygen-conserving effect
during exercise.
Bailey, D., Bartsch, P., Knauth, M., Baumgartner, R. (2009). Emerging concepts in acute mountain
sickness and high-altitude cerebral edema: from the molecular to the morphological. Cellular and
Molecular Life Sciences.
Acute mountain sickness (AMS) is a neurological disorder that typically affects mountaineers who ascend
to high altitude. The symptoms have traditionally been ascribed to intracranial hypertension caused by
extracellular vasogenic edematous brain swelling subsequent to mechanical disruption of the blood–brain
barrier in hypoxia. However, recent diffusion-weighted magnetic resonance imaging studies have
identified mild astrocytic swelling caused by a net redistribution of fluid from the ‘‘hypoxia-primed’’
extracellular space to the intracellular space without any evidence for further barrier disruption or
additional increment in brain edema, swelling or pressure. These findings and the observation of minor
vasogenic edema present in individuals with and without AMS suggest that the symptoms are not
explained by cerebral edema. This has led to a re-evaluation of the relevant pathogenic events with a
….…….
Document No.:
CDRL A002 Revision: Original
Date: May 2014 Page: 79 of 123
Document Title: HAMS Final Report (Technical and Financial)
specific focus on free radicals and their interaction with the trigeminovascular system. (Part of a multi-
author review.)
Brown, J., Grocott, M. (2013) Humans at Altitude: Physiology and Pathophysiology. Continuing
Education in Anesthesia, Critical Care & Pain j. Volume 13 Number 1.
This article describes the physiological challenge associated with exposure to environmental hypoxia at
high altitude along with adaptive (acclimatization) and pathological (acute high altitude illness)
responses to this challenge.
Gallagher, S., Hackett, P. (2004). High-Altitude Illness. Emergency Medical Clinics of North America.
(2):329-55, viii.
Travel to a high altitude requires that the human body acclimatize to hypobaric hypoxia. Failure to
acclimatize results in three common but preventable maladies known collectively as high-altitude illness:
acute mountain sickness (AMS), high-altitude cerebral edema (HACE), and high-altitude pulmonary edema
(HAPE). Capillary leakage in the brain (AMS/HACE) or lungs (HAPE) accounts for these syndromes. The
morbidity and mortality associated with high-altitude illness are significant and unfortunate, given they
are preventable. Practitioners working in or advising those traveling to a high altitude must be familiar
with the early recognition of symptoms, prompt and appropriate therapy, and proper preventative
measures for high-altitude illness.
GAO, M., WANG, R., JIAYONG3, Z., LIU, Y., SUN, G. (2013). NT-ProBNP levels are moderately increased
in acute high-altitude pulmonary edema. EXPERIMENTAL AND THERAPEUTIC MEDICINE. 5:
1434-1438.
The aim of the present study was to investigate the effect of B-type natriuretic peptides (BNPs) in acute
high-altitude pulmonary edema (HAPE). The study enrolled 46 subjects from lowland Han, including 33
individuals who had acutely ascended to a high altitude (21 individuals with HAPE as the case group and
12 individuals without HAPE as the high-altitude control group) and 13 healthy normal residents as the
plain control group. The serum concentrations of N-terminal probrain natriuretic peptide (NT-proBNP),
erythropoietin (EPO), vascular endothelial growth factor (VEGF) and nitric oxide (NO) were measured.
There were significant differences in the serum concentrations of NT-ProBNP, NO, VEGF and EPO among
the three groups. The serum concentrations of NT-ProBNP, EPO and VEGF were significantly higher in the
HAPE patients and high-altitude control individuals than those of the plain group. No significant
differences were identified between the HAPE patients and the high-altitude control group. In contrast to
these three parameters, the serum concentrations of NO in the high-altitude control group were
significantly higher than those of the HAPE patients and the plain group, while there were no significant
….…….
Document No.:
CDRL A002 Revision: Original
Date: May 2014 Page: 80 of 123
Document Title: HAMS Final Report (Technical and Financial)
differences in the serum concentrations of NO between the HAPE patients and the plain group.
Furthermore, serum concentrations of NT-ProBNP and EPO were significantly reduced following
treatment in the HAPE patients, however, no significant changes were identified in VEGF or NO
concentrations. BNPs are increased in HAPE with severe hypoxia and right ventricular overload, but are
decreased subsequent to treatment. BNPs may therefore be a potential biomarker for the diagnosis and
prognosis of HAPE.
Golja, P., Kacin, A., Tipton, M., Eiken, O., Mekjavic, I.(2004). Hypoxia increases the cutaneous
threshold for the sensation of cold. European Journal of Applied Physiology. 92(1-2):62-8.
Cutaneous temperature sensitivity was tested in 13 male subjects prior to, during and after they breathed
either a hypocapnic hypoxic (HH), or a normocapnic hypoxic (NH) breathing mixture containing 10%
oxygen in nitrogen. Normocapnia was maintained by adding carbon dioxide to the inspired gas
mixture. Cutaneous thresholds for thermal sensation were determined by a thermo sensitivity testing
device positioned on the plantar side of the first two toes on one leg. Heart rate, haemoglobin saturation,
skin temperature at four sites (arm, chest, thigh, calf) and adapting temperature of the skin (T(ad); degrees
centigrade), i.e. the temperature of the toe skin preceding a thermo sensitivity test, were measured at
minute intervals. Tympanic temperature (T(ty); degrees centigrade) was measured prior to the initial
normoxic thermo sensitivity test, during the hypoxic exposure and after the completion of the final
normoxic thermo sensitivity test. End-tidal carbon dioxide fraction and minute inspiratory volume were
measured continuously during the hypoxic exposure. Ambient temperature, T(ty), T(ad) and mean skin
temperature remained similar in both experimental conditions. Cutaneous sensitivity to cold decreased
during both HH (P<0.001) and NH conditions (P<0.001) as compared with the tests undertaken pre- and
post-hypoxia. No similar effect was observed for cutaneous sensitivity to warmth. The results of the
present study suggest that sensitivity to cold decreases during the hypoxic exposure due to the effects
associated with hypoxia rather than hypocapnia. Such alteration in thermal perception may affect the
individual's perception of thermal comfort and consequently attenuate thermoregulatory behaviour
during cold exposure at altitude.
Heiner, M., Sriram, K. (2010). Structural analysis to determine the core of hypoxia response network.
PLoS One. 5(1).
The advent of sophisticated molecular biology techniques allows to deduce the structure of complex
biological networks. However, networks tend to be huge and impose computational challenges on
traditional mathematical analysis due to their high dimension and lack of reliable kinetic data. To
overcome this problem, complex biological networks are decomposed into modules that are assumed to
capture essential aspects of the full network's dynamics. The question that begs for an answer is how to
identify the core that is representative of a network's dynamics, its function and robustness. One of the
….…….
Document No.:
CDRL A002 Revision: Original
Date: May 2014 Page: 81 of 123
Document Title: HAMS Final Report (Technical and Financial)
powerful methods to probe into the structure of a network is Petri net analysis. Petri nets
support network visualization and execution. They are also equipped with sound mathematical and formal
reasoning based on which a network can be decomposed into modules. The structural analysis provides
insight into the robustness and facilitates the identification of fragile nodes. The application of these
techniques to a previously proposed hypoxia control network reveals three functional modules
responsible for degrading the hypoxia-inducible factor (HIF). Interestingly,
the structural analysis identifies superfluous network parts and suggests that the reversibility of the
reactions are not important for the essential functionality. The core network is determined to be the union
of the three reduced individual modules. The structural analysis results are confirmed by numerical
integration of the differential equations induced by the individual modules as well as their composition.
The structural analysis leads also to a coarse network structure highlighting the structural principles
inherent in the three functional modules. Importantly, our analysis identifies the fragile node in this
robust network without which the switch-like behavior is shown to be completely absent.
Jensen, L., Onyskiw, J., Prasad, N. (1998). Meta-Analysis of Arterial Oxygen Saturation Monitoring by
Pulse Oximetry in Adults. Heart & Lung. 27: 387-408.
The purposes of the study were to: (1) describe the aggregate strength of the relationship of arterial
oxygen saturation as measured by pulse oximetry with the standard of arterial blood gas analysis as
measured by co-oximetry, (2) examine how various factors affect this relationship, and (3) describe an
aggregate estimate of the bias and precision between oxygen saturation as measured by pulse oximetry
and the standard in vitro measures.
Karinen, H., Peltonen, J., Kahonen, M., Tikkanen, H. (2010). Prediction of Acute Mountain Sickness by
Monitoring Arterial Oxygen Saturation During Ascent. High Altitude Medicine & Biology.
11:325–332.
Acute mountain sickness (AMS) is a common problem while ascending at high altitude. AMS may progress
rapidly to fatal results if the acclimatization process fails or symptoms are neglected and the ascent
continues. Extensively reduced arterial oxygen saturation at rest (R-Spo2) has been proposed as an
indicator of inadequate acclimatization and impending AMS. We hypothesized that climbers less likely to
develop AMS on further ascent would have higher Spo2 immediately after exercise (Ex-Spo2) at high
altitudes than their counterparts and that these post exercise measurements would provide additional
value for resting measurements to plan safe ascent. The study was conducted during eight expeditions
with 83 ascents. We measured R-Spo2 and Ex-Spo2 after moderate daily exercise [50m walking, target
heart rate (HR) 150 bpm] at altitudes of 2400 to 5300m during ascent. The Lake Louise Questionnaire was
used in the diagnosis of AMS. Ex-Spo2 was lower at all altitudes among those climbers suffering from AMS
during the expeditions than among those climbers who did not get AMS at any altitude during the
expeditions. Reduced R-Spo2 and Ex-Spo2 measured at altitudes of 3500 and 4300m seem to predict

….…….
Document No.:
CDRL A002 Revision: Original
Date: May 2014 Page: 82 of 123
Document Title: HAMS Final Report (Technical and Financial)
impending AMS at altitudes of 4300m ( p<0.05 and p<0.01) and 5300m (both p<0.01). Elevated resting HR
did not predict impending AMS at these altitudes. Better aerobic capacity, younger age, and higher body
mass index (BMI) were also associated with AMS (all p<0.01). In conclusion, those climbers who
successfully maintain their oxygen saturation at rest, especially during exercise, most likely do not develop
AMS. The results suggest that daily evaluation of Spo2 during ascent both at rest and during exercise can
help to identify a population that does well at altitude.
Katayama, K., Fujita, O., Lemitsu, M., Kawana, H., Iwamoto, E., Saito, M., Ishida, K. (2013). The effect
of acute exercise in hypoxia on flow-mediated vasodilation. Eur J Appl Physiol. 113:349–357.
The purpose of this study was to clarify the effect of acute exercise in hypoxia on flow-mediated
vasodilation (FMD). Eight males participated in this study. Two maximal exercise tests were performed
using arm cycle ergometry to estimate peak oxygen uptake _V_ O2peak_ while breathing normoxic
[inspired O2 fraction (FIO2) = 0.21] or hypoxic (FIO2 = 0.12) gas mixtures. Next, subjects performed
submaximal exercise at the same relative exercise intensity 30% _V _ O2peak_ in normoxia or hypoxia for
30 min. Before (Pre) and after exercise (Post 5, 30, and 60 min), brachial artery FMD was measured during
reactive hyperemia by ultrasound under normoxic conditions. FMD was estimated as the percent (%) rise
in the peak diameter from the baseline value at prior occlusion at each FMD measurement %FMD). The
area under the curve for the shear rate stimulus (SRAUC) was calculated in each measurement, and each
%FMD value was normalized to SRAUC (normalized FMD). %FMD and normalized FMD decreased
significantly (P\0.05) immediately after exercise in both condition (mean ± SE, FMD, normoxic trial, Pre:
8.85 ± 0.58 %, Post 5:-0.01 ±1.30 %, hypoxic trial, Pre: 8.84 ± 0.63 %, Post 5: 2.56 ± 0.83 %). At Post 30 and
60, %FMD and normalized FMD returned gradually to pre-exercise levels in both trials (FMD, normoxic
trial, Post 30: 1.51 ± 0.68 %, Post 60: 2.99 ± 0.79 %; hypoxic trial, Post 30: 4.57 ± 0.78 %, Post 60: 6.15 ±
1.20 %). %FMD and normalized FMD following hypoxic exercise (at Post 5, 30, and 60) were significantly
(P\0.05) higher than after normoxic exercise. These results suggest that aerobic exercise in hypoxia has a
significant impact on endothelial-mediated vasodilation.
Levett, D., Fernandez, B., Riley, H., Martin, D., Mitchell, K., Leckstrom, C., Ince, C., Whipp, B., Mythen,
M., Montgomery, H., Grocott, M., Feelisch, M. (2011). The role of nitrogen oxides in human
adaptation to hypoxia. SCIENTIFIC REPORTS. 1: 109.
Lowland residents adapt to the reduced oxygen availability at high altitude through a process known as
acclimatization, but the molecular changes underpinning these functional alterations are not well-
understood. Using an integrated biochemical/whole-body physiology approach we here show that plasma
biomarkers of NO production (nitrite, nitrate) and activity (cGMP) are elevated on acclimatization to high
altitude while S-nitrosothiols are initially consumed, suggesting multiple nitrogen oxides contribute to
improve hypoxia tolerance by enhancing NO availability. Unexpectedly, oxygen cost of exercise and
mechanical efficiency remain unchanged with ascent while microvascular blood flow correlates inversely
….…….
Document No.:
CDRL A002 Revision: Original
Date: May 2014 Page: 83 of 123
Document Title: HAMS Final Report (Technical and Financial)
with nitrite. Our results suggest that NO is an integral part of the human physiological response to hypoxia.
These findings may be of relevance not only to healthy subjects exposed to high altitude but also to
patients in whom oxygen availability is limited through disease affecting the heart, lung or vasculature,
and to the field of developmental biology.
Netzer, N., Strohl, K., Faulhaber, M., Gatterer, H., Burtscher, M. (2013). Hypoxia-Related Altitude
Illnesses. Journal of Travel Medicine. Volume 20 (Issue 4): 247–255.
Acute mountain sickness (AMS) represents the most common and usually benign illness, which however
can rapidly progress to the more severe and potentially fatal forms of high-altitude cerebral edema (HACE)
and high-altitude pulmonary edema (HAPE) 2, 3, 6, 7. As altitude medicine specialists are rare, the primary
care practitioner has to provide advice to the novice traveler. High altitudes may be associated with many
conditions not related to hypoxia per se, e.g., cold, UV radiation, physical exertion, infections, and trauma,
which are not covered in this article. For respective information, the interested reader is referred to the
article by Boggild and colleagues 8. The purpose of this review is to introduce the travel health provider
to basic concepts of hypoxia-related high-altitude conditions and to provide state-of-the art
recommendations for prevention and therapy of high-altitude illnesses.
Parell, J., Becker, G. (1993). Inner ear barotrauma in scuba divers. A long-term follow-up after
continued diving. Arch Otolaryngol Head Neck Surg. 119(4):455-7.
Divers who suffer inner ear barotrauma are usually counseled to permanently avoid diving, reasoning that
the injured inner ear is at increased risk of further damage. Twenty patients who suffered inner
ear barotrauma while diving, but continued to dive against medical advice, were assessed on an interim
basis for 1 to 12 years. As difficulty equalizing the ears during the barotraumatic event was a universal
finding, prior to resuming diving, all patients were reinstructed on methods of maximizing eustachian tube
function. No further deterioration of cochleo-vestibular function was noted. Based on these preliminary
results, we conclude that recommending no further diving after inner ear barotrauma may be
unnecessarily restrictive.
Penneys, R. Thomas, C. (1950). The Relationship between the Arterial Oxygen Saturation and the
Cardiovascular Response to Induced Anoxemia in Normal Young Adults. American Heart
Association: Circulation. 1:415-425.
At the present time the most widely used method of studying the effect of induced anoxemia on the
cardiovascular system consists of giving the subjects low oxygen gas (usually 10 per cent) inhalation for
approximately twenty minutes and making observations during this period. In previous communications
the variability of the degree of anoxemia, as measured by the blood arterial oxygen saturation, during
inhalation of a gas of fixed low oxygen concentration was pointed out. The physiologic importance of
….…….
Document No.:
CDRL A002 Revision: Original
Date: May 2014 Page: 84 of 123
Document Title: HAMS Final Report (Technical and Financial)
standardizing the induced anoxemia test of cardiovascular function according to the level of the arterial
oxygen saturation was discussed and a method of inducing and maintaining a constant degree of
anoxemia by administering a gas of variable oxygen concentration was described. In one of these reports'
the nature of the cardiovascular response of a small group of young men at levels of 85, 80, and 75 per
cent arterial oxygen saturation was presented. It is the purpose of this report to give a detailed description
and analysis of the effect of anoxemia upon the heart rate, blood pressure, and electrocardiogram at
levels of 80, 75, and 70 per cent arterial saturation in a substantial number of normal young adults.
Ren, Y., Cui, F. Lei, Y., Fu, Z., Wu, Z., Cui, B. (2012). High-Altitude Pulmonary Edema Is Associated With
Coagulation and Fibrinolytic Abnormalities. The American Journal of the Medical Sciences.
High-altitude pulmonary edema (HAPE) can develop in unacclimatized persons after acute ascent to high
altitude and is associated with fibrinolytic and coagulation abnormalities. The authors investigated
whether fibrinolytic and coagulation abnormalities were associated with the severity of HAPE. Methods:
Sixty-one patients who developed HAPE after acute ascent to altitudes above 3600 m were recruited.
Twenty unacclimatized controls who acutely ascended to the same altitude and 20 acclimatized
inhabitants served as controls. Tissue plasminogen activator (t-PA) and plasminogen activator inhibitor-1
(PAI-1) levels were measured using chromogenic substrate assays. Plasma fibrinogen concentration was
determined by the sodium sulphite fractionation method. The concentrations of fibrin/fibrinogen
degradation products (FDP) and D-dimer were measured by enzyme linked immunosorbent assay. Results:
The plasma concentrations of D-dimer, fibrinogen, FDP and t-PA and PAI-1 were significantly higher in
patients with HAPE than controls. In addition, these abnormalities were correlated with the severity of
HAPE. The plasma concentrations of D-dimer and fibrinogen recovered to normal upon recovery from
HAPE while t-PA, PAI-1 and FDP levels in HAPE patients still remained significantly increased over those of
unacclimatized controls. Conclusion: The development of HAPE is associated with abnormalities in the
fibrinolysis and coagulation system, and these abnormalities correlate with the severity of HAPE.
Romer, L., Haverkamp, H., Amann, M., Lovering, A., Pegelow, D., Dempsey, J. (2007). Effect of Acute
Severe Hypoxia on Peripheral Fatigue and Endurance Capacity in Healthy Humans. American
Journal of Physiology. Regulatory, Integrative, Comparative Physiology. 292(1):R598-606.
We hypothesized that severe hypoxia limits exercise performance via decreased contractility of limb
locomotor muscles. Nine male subjects [mean +/- SE maximum O(2) uptake (Vo(2 max)) = 56.5 +/- 2.7 ml
x kg(-1) x min(-1)] cycled at > or =90% Vo(2 max) to exhaustion in normoxia [NORM-EXH; inspired O(2)
fraction (Fi(O(2))) = 0.21, arterial O(2) saturation (Sp(O(2))) = 93 +/- 1%] and hypoxia (HYPOX-EXH; Fi(O(2))
= 0.13, Sp(O(2)) = 76 +/- 1%). The subjects also exercised in normoxia for a time equal to that achieved
in hypoxia (NORM-CTRL; Sp(O(2)) = 96 +/- 1%). Quadriceps twitch force, in response to supramaximal
single (non-potentiated and potentiated 1 Hz) and paired magnetic stimuli of the femoral nerve (10-100
….…….
Document No.:
CDRL A002 Revision: Original
Date: May 2014 Page: 85 of 123
Document Title: HAMS Final Report (Technical and Financial)
Hz), was assessed pre- and at 2.5, 35, and 70 min post exercise. Hypoxia exacerbated exercise-induced
peripheral fatigue, as evidenced by a greater decrease in potentiated twitch force in HYPOX-EXH vs.
NORM-CTRL (-39 +/- 4 vs. -24 +/- 3%, P < 0.01). Time to exhaustion was reduced by more than two-thirds
in HYPOX-EXH vs. NORM-EXH (4.2 +/- 0.5 vs. 13.4 +/- 0.8 min, P < 0.01); however, peripheral fatigue was
not different in HYPOX-EXH vs. NORM-EXH (-34 +/- 4 vs. -39 +/- 4%, P > 0.05). Blood lactate concentration
and perceptions of limb discomfort were higher throughout HYPOX-EXH vs. NORM-CTRL but were not
different at end-exercise in HYPOX-EXH vs. NORM-EXH. We conclude that
severe hypoxia exacerbates peripheral fatigue of limb locomotor muscles and that this effect may
contribute, in part, to the early termination of exercise.
Smith, A. (2008). Hypoxia symptoms in military aircrew: long-term recall vs. acute experience in
training. Aviation Space Environmental Medicine. 79:54 – 7.
It has been reported that many aircrew who experience hypoxia-related incidents are able to recognize
hypoxia because of similarity to symptoms they experienced during hypoxia awareness training. This study
aimed to explore the degree of similarity between symptoms reported after acute hypoxia and those
remembered from previous hypoxia awareness training.
Stein, J., Ellsworth, M. (1993). Capillary oxygen transport during severe hypoxia: role of
hemoglobin oxygen affinity. Journal of Applied Physiology. 75(4):1601-7.
The efficacy of an increased hemoglobin oxygen affinity [decreased oxygen half-saturation pressure of
hemoglobin (P50)] on capillary oxygen transport was evaluated in the hamster retractor muscle under
conditions of a severely limited oxygen supply resulting from the combined effects of a 40% reduction in
systemic hematocrit and hypoxic ventilation (inspired oxygen fraction 0.1). Two groups of hamsters were
utilized: one with a normal oxygen affinity (untreated; P50 = 26.1 +/- 2.4 Torr) and one with an
increased oxygen affinity (treated; P50 = 15.7 +/- 1.4 Torr) induced by the chronic short-term
administration of sodium cyanate. Using in vivo video microscopy and image analysis techniques, we
determined oxygen saturation and associated hemodynamics at both ends of the capillary network.
During hypoxic ventilation, the decrease in oxygen saturation across the network was 3.6% for untreated
animals compared with 9.9% for treated animals. During hypoxia, estimated end-capillary PO2 was
significantly higher in the untreated animals. These data indicate that, at the capillary level, a decreased
P50 is advantageous for tissue oxygenation when oxygen supply is severely compromised, because
normal oxygen losses in capillaries are maintained in treated but not in untreated animals. The data are
consistent with the presence of a diffusion limitation for oxygen during severe hypoxia in animals with a
normal hemoglobin oxygen affinity.

….…….
Document No.:
CDRL A002 Revision: Original
Date: May 2014 Page: 86 of 123
Document Title: HAMS Final Report (Technical and Financial)
Still, D., Temme, L. (2012). An independent, objective calibration check for the reduced oxygen
breathing device. Aviation, Space Environmental Medicine. 83(9):902-8.
Normobaric hypoxia, which does not entail an altitude chamber, but reduces the fraction of inspired
oxygen (02) by diluting air with nitrogen, is finding increased use. The reduced oxygen breathing device
(ROBD-2) is one of several commercial devices for generating such normobaric hypoxia. Reported here
are results of a procedure to check the calibration of the ROBD-2 using methods that may be readily
available in physiology and psychophysiology facilities.
Tannheimer, M., Hornung, K., Gasche, M., Kuehlmuss, B., Mueller, M., Welsch, H., Landgraf, K., Guger,
K., Schmidt, R., Steinacker, J. (2012). Decrease of Asymmetric Dimethylarginine Predicts Acute
Mountain Sickness. Journal of Travel Medicine 2012; Volume 19 (Issue 6): 338–343.
Each year, 40 million tourists worldwide are at risk of getting acute mountain sickness (AMS), because
they travel to altitudes of over 2500 m. As asymmetric dimethylarginine (ADMA) is a nitric oxide synthase
(NOS) inhibitor, it should increase pulmonary artery pressure (PAP) and raise the risk of acute mountain
sickness and high-altitude pulmonary edema (HAPE).With this in mind, we investigated whether changes
in ADMA levels (_-ADMA) at an altitude of 4000m can predict an individual’s susceptibility to AMS or
HAPE.
Tyler, I., Tantisira, B., Winter, P., Motoyama, E. (1985). Continuous Monitoring of Arterial Oxygen
Saturation With Pulse Oximetry during Transfer to the Recovery Room. Anesth Analg.
64:1108-12.
The incidence of hypoxemia in the immediate postoperative period was determined using
a pulse oximeter for continuous monitoring of arterial oxygen saturation (SaO2) in 95 ASA class I or II adult
patients breathing room air during their transfer from the operating room to the recovery room.
Hypoxemia was defined as 90% SaO2 (arterial oxygen partial pressure (PaO2) approximately equal to 58
mm Hg). Severe hypoxemia was defined as 85% SaO2 (PaO2 approximately equal to 50 mm Hg).
Hypoxemia occurred in 33 (35%) patients; severe hypoxemia occurred in 11 (12%). Postoperative
hypoxemia did not correlate significantly with anesthetic agent, age, duration of anesthesia, or level of
consciousness. There was a statistically significant correlation (P less than 0.05) between hypoxemia and
obesity. All three patients with a history of mild asthma became severely hypoxemic even though none
had perioperative evidence of obstructive disease, also a statistically significant (P less than 0.003) finding.
….…….
Document No.:
CDRL A002 Revision: Original
Date: May 2014 Page: 87 of 123
Document Title: HAMS Final Report (Technical and Financial)
Wagner, D., Knott, J., Fry, J. (2012). Oximetry Fails to Predict Acute Mountain Sickness or Summit
Success During a Rapid Ascent to 5640 Meters. Wilderness & Environmental Medicine.
The purpose of this study was to determine whether arterial oxygen saturation (SpO2) and heart rate
(HR), as measured by a finger pulse oximeter on rapid arrival to 4260 m, could be predictive of acute
mountain sickness (AMS) or summit success on a climb to 5640 m.
Weathersby, P., Survanshi, S., Homer, L., Parker, E., Thalmann, E. (1992). Predicting The Time of Occurrence of Decompression Sickness. Journal of Applied Physiology. 72: 1541 - 1548.
Probabilistic models and maximum likelihood estimation have been used to predict the occurrence of
decompression sickness (DCS). We indicate a means of extending the maximum likelihood parameter
estimation procedure to make use of knowledge of the time at which DCS occurs. Two models were
compared in fitting a data set of nearly 1,000 exposures, in which MO cases of DCS have known times of
symptom onset. The additional information provided by the time at which DCS occurred gave us better
estimates of model parameters. It was also possible to discriminate between good models, which predict
both the occurrence of DCS and the time at which symptoms occur, and poorer models, which may predict
only the overall occurrence. The refined models may be useful in new applications for customizing
decompression strategies during complex dives involving various times at several different depths.
Conditional probabilities of DCS for such dives may be reckoned as the dive is taking place and the
decompression strategy adjusted to circumstance. Some of the mechanistic implications and the
assumptions needed for safe application of decompression strategies on the basis of conditional
probabilities are discussed.
Westerman, R. (2004).Hypoxia familiarization training by the reduced oxygen breathing method.
Aviation Medicine. 5: 11-15.
Hypoxia familiarization training demonstrates and measures (1) cardiorespiratory adjustments in healthy
volunteers to a simulated altitude of 25000 ft. (7620 m); (2) the spectrum of signs and symptoms
accompanying hypoxia; (3) individual variability in susceptibility to hypoxia and oxygen paradox; and (4)
time of useful consciousness. Trainees experience the insidious onset and obvious performance
decrements resulting from hypoxia. Hypobaric chambers are traditionally used for this purpose, but carry
a risk of inducing decompression sickness in trainees. An alternative is the use of low oxygen gas mixtures
to simulate breathing conditions at high altitude.
….…….
Document No.:
CDRL A002 Revision: Original
Date: May 2014 Page: 88 of 123
Document Title: HAMS Final Report (Technical and Financial)
West, J. (2004). The Physiologic Basis of High-Altitude Diseases. Ann Intern Med. 2004; 141:789-800.
Many physicians are surprised to learn how many people live, work, and play at high altitude. Some 140
million persons reside at altitudes over 2500 m, mainly in North, Central, and South America; Asia; and
eastern Africa (1). Increasingly, people are moving to work at high altitude. For example, there are
telescopes at altitudes over 5000 m (2) and mines at over 4500 m (3), and the Golmud–Lhasa railroad
being constructed in Tibet will have 30 000 to 50 000 workers at high altitudes, including many who work
at more than 4000 m. Skiers, mountaineers, and trekkers go to altitudes of 3000 m to more than 8000 m
for recreation, and sudden ascents to high altitude without the benefits of acclimatization are common.
All of these groups are prone to high-altitude diseases that sometimes have fatal consequences. In
addition, the physiology of hypoxia, which is at the basis of high-altitude medicine, plays an important
role in many lung and heart diseases.
Zhou, Qiquan. (2011). Standardization of Methods for Early Diagnosis and On-Site Treatment of High-
Altitude Pulmonary Edema. Hindawi Publishing Corporation, Pulmonary Medicine.
High-altitude pulmonary edema (HAPE) is a life-threatening disease of high altitude that often affects
nonacclimatized apparently healthy individuals who rapidly ascend to high altitude. Early detection, early
diagnosis, and early treatment are essential to maintain the safety of people who ascend to high altitude,
such as construction workers and tourists. In this paper, I discuss various methods and criteria that can be
used for the early diagnosis and prediction of HAPE. I also discuss the preventive strategies and options
for on-site treatment. My objective is to improve the understanding of HAPE and to highlight the need for
prevention, early diagnosis, and early treatment of HAPE to improve the safety of individuals ascending
to high altitude.

….…….
Document No.:
CDRL A002 Revision: Original
Date: May 2014 Page: 89 of 123
Document Title: HAMS Final Report (Technical and Financial)
10.1.2 Hams File Sharing Management System
To upload files using the Hams File system, you must first register with the system from the home page.
After you have registered an approval email will be sent to your account.
The HAMS File Share home page is accessed by entering the following URL in your browser:
http://hams.athenagtx.com
Clicking on Register brings you to the registration input screen. Fill in the required information and click
the green “Register” button. An approval email will be sent to your account.

….…….
Document No.:
CDRL A002 Revision: Original
Date: May 2014 Page: 90 of 123
Document Title: HAMS Final Report (Technical and Financial)
Once you have been approved, you will be able to log into the system through the home page. Logging
into the system will take you to the documents page. Here you will be able to download, delete, upload
and search documents and folders.
To download a document, click the green (Get) button to the left of the file name. It will then
begin to download in your browser.
To delete a file from the system, click on the red (Delete) button to the right of the file.
All folders are listed in the upper left hand corner of the screen. By clicking on a folder, you may
see the documents that are in that folder. Click the black “All” button above the folders or the
clear button in the upper right corner to see all of the documents.
To create a folder in which to store documents, type the folder name in the input box that reads
“Add Folder” and click the green “Add Folder” button. You may then add documents to that folder
by using file upload.
Upload Files:
Selecting the green “+ Add files” button allows documents or data files to be uploaded.
Select a folder (optional)
Next, click the light blue “Choose” button and a window will pop up. From here, browse and
select the documents you wish to upload and click “Open”.
Then you may change the name of the document you are uploading and select or change the
folder. (optional)
To remove the document(s) select the orange (Remove) button to the left of the file.

….…….
Document No.:
CDRL A002 Revision: Original
Date: May 2014 Page: 91 of 123
Document Title: HAMS Final Report (Technical and Financial)
Once the files are named and folders are selected click the dark blue “Upload All” button.
Note: To upload all the files into a single Folder, select the folder first then select the Choose Button. This
will auto populate the folder field in the upload process. This field can be edited if one or more documents
selected for upload are to go into a different folder.
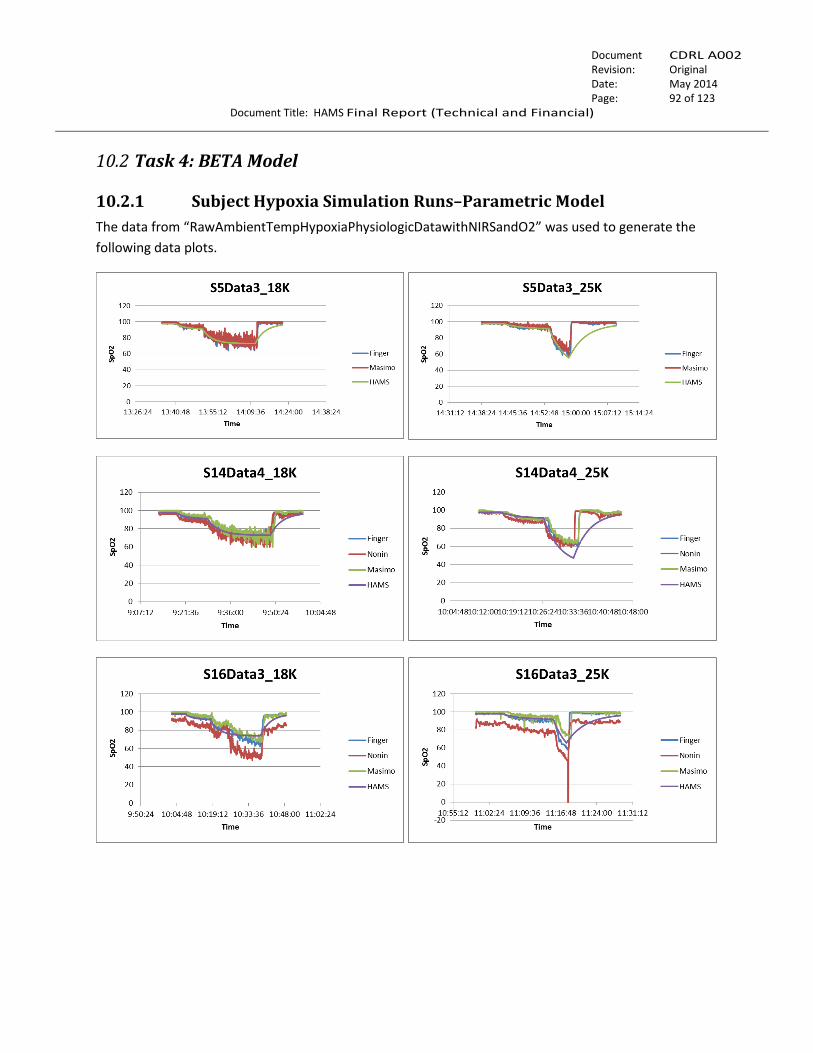
….…….
Document No.:
CDRL A002 Revision: Original
Date: May 2014 Page: 92 of 123
Document Title: HAMS Final Report (Technical and Financial)
10.2 Task 4: BETA Model
10.2.1 Subject Hypoxia Simulation Runs–Parametric Model
The data from “RawAmbientTempHypoxiaPhysiologicDatawithNIRSandO2” was used to generate the
following data plots.
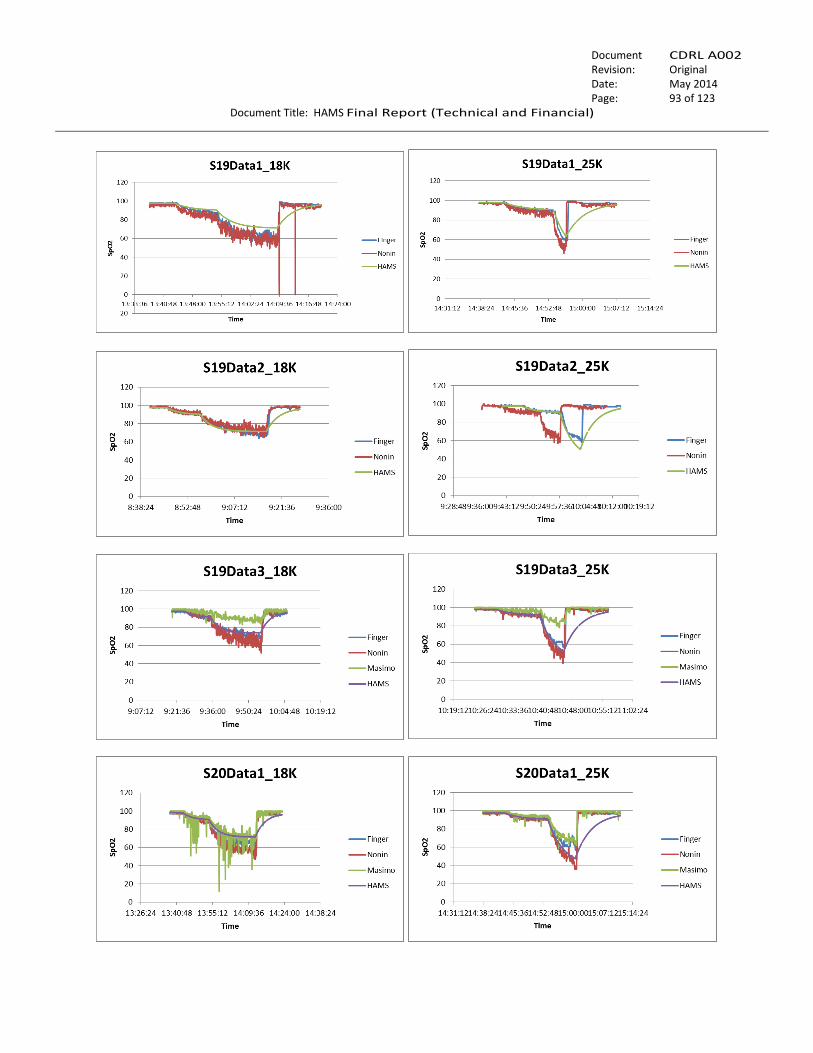
….…….
Document No.:
CDRL A002 Revision: Original
Date: May 2014 Page: 93 of 123
Document Title: HAMS Final Report (Technical and Financial)

….…….
Document No.:
CDRL A002 Revision: Original
Date: May 2014 Page: 94 of 123
Document Title: HAMS Final Report (Technical and Financial)
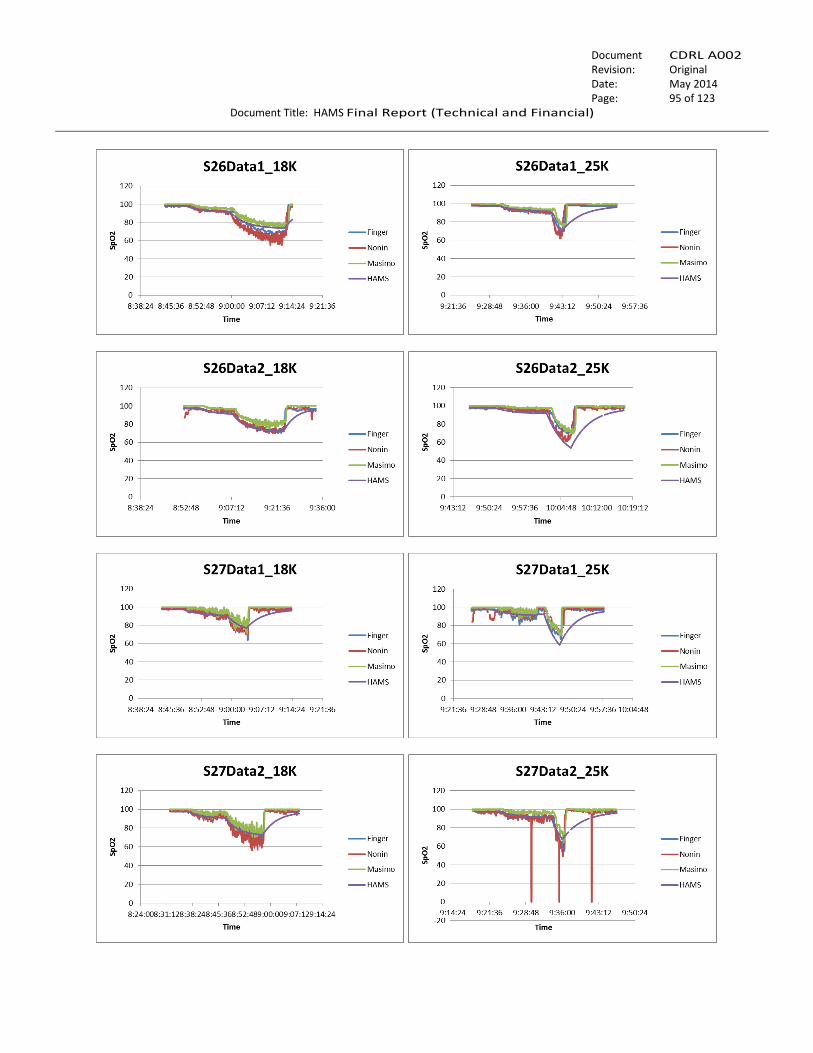
….…….
Document No.:
CDRL A002 Revision: Original
Date: May 2014 Page: 95 of 123
Document Title: HAMS Final Report (Technical and Financial)
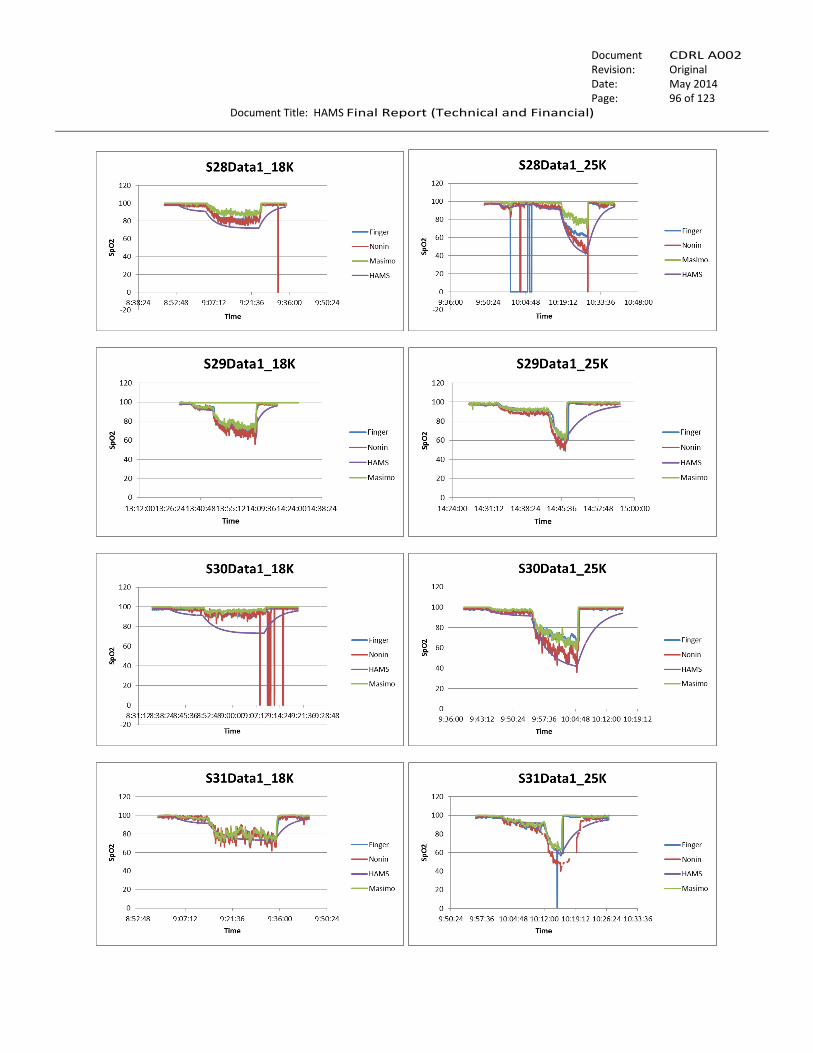
….…….
Document No.:
CDRL A002 Revision: Original
Date: May 2014 Page: 96 of 123
Document Title: HAMS Final Report (Technical and Financial)

….…….
Document No.:
CDRL A002 Revision: Original
Date: May 2014 Page: 97 of 123
Document Title: HAMS Final Report (Technical and Financial)
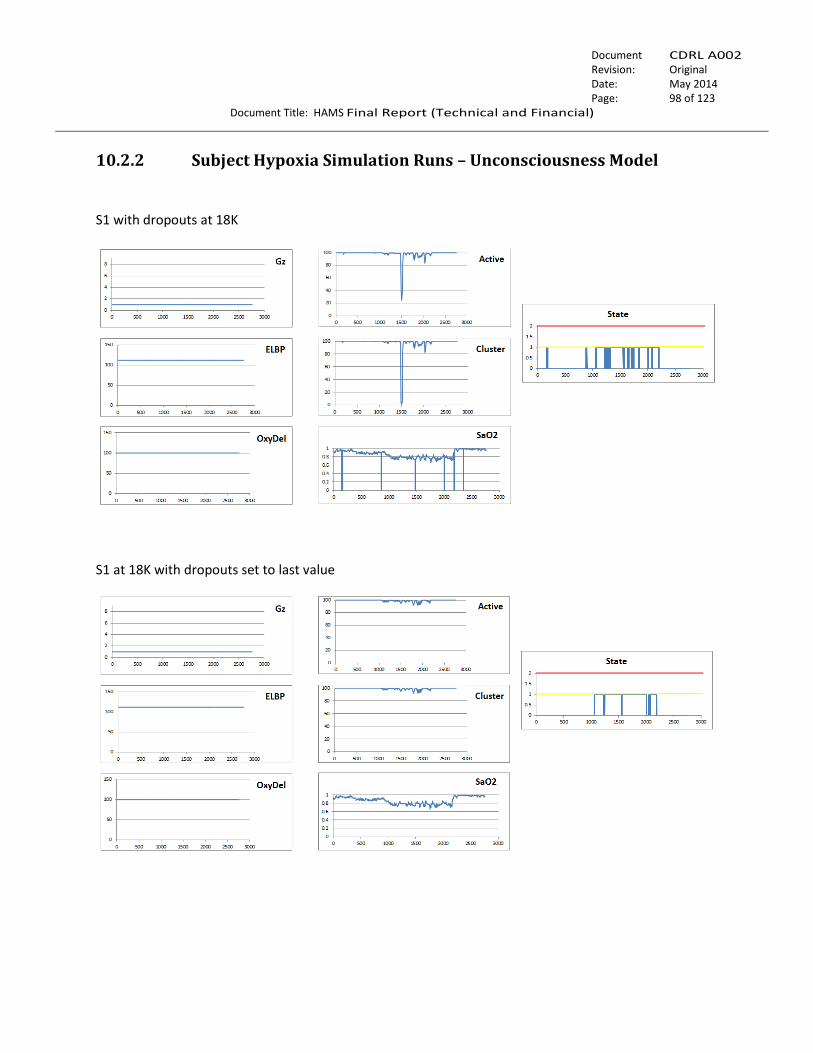
….…….
Document No.:
CDRL A002 Revision: Original
Date: May 2014 Page: 98 of 123
Document Title: HAMS Final Report (Technical and Financial)
10.2.2 Subject Hypoxia Simulation Runs – Unconsciousness Model
S1 with dropouts at 18K
S1 at 18K with dropouts set to last value
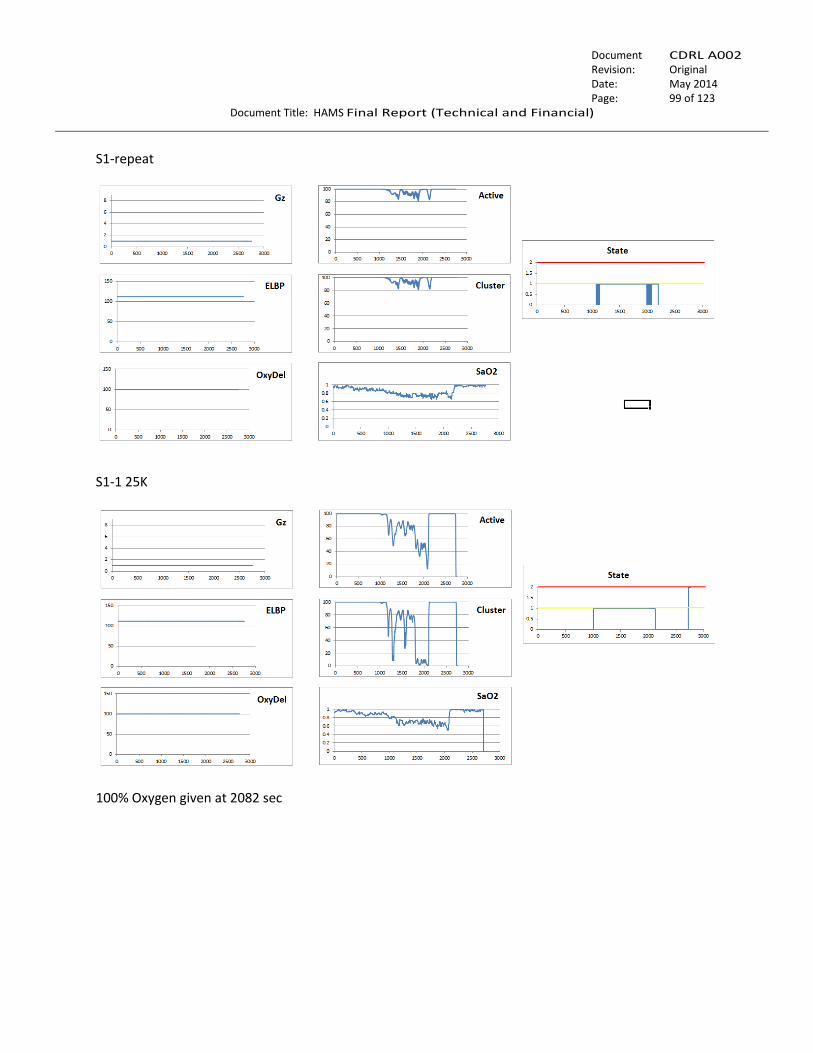
….…….
Document No.:
CDRL A002 Revision: Original
Date: May 2014 Page: 99 of 123
Document Title: HAMS Final Report (Technical and Financial)
S1-repeat
S1-1 25K
100% Oxygen given at 2082 sec

….…….
Document No.:
CDRL A002 Revision: Original
Date: May 2014 Page: 100 of 123
Document Title: HAMS Final Report (Technical and Financial)
S3 – 18K
S3 – 18k - repeat
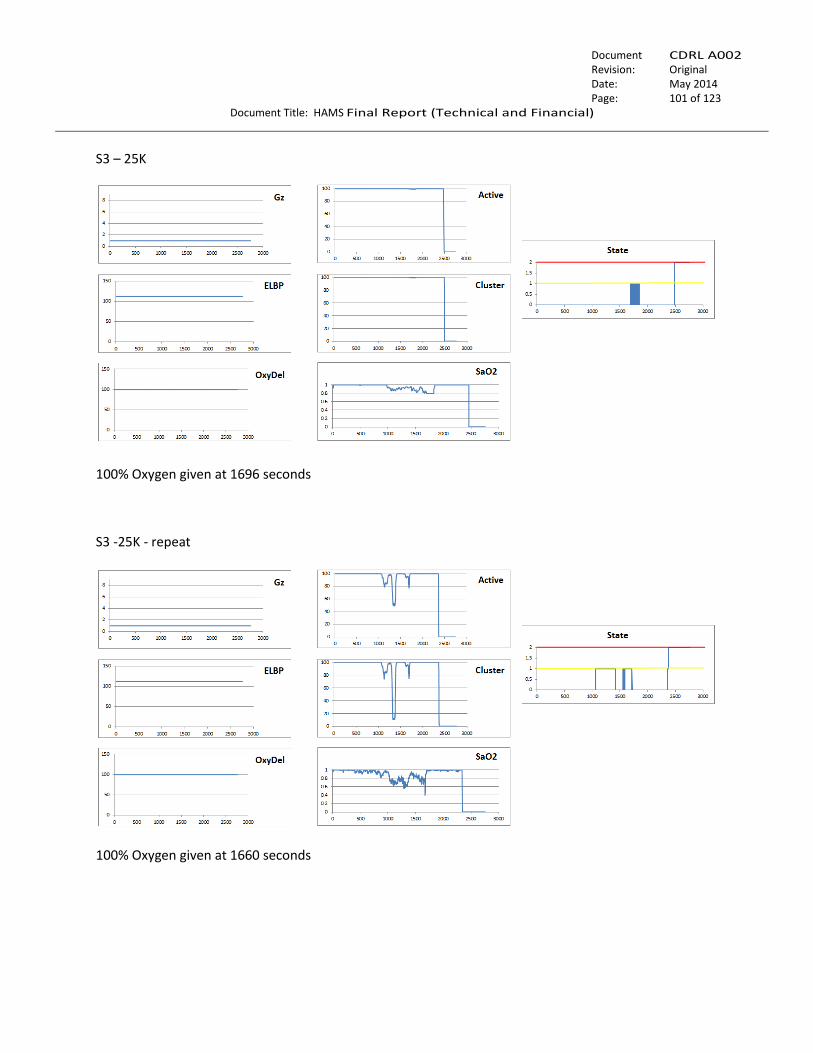
….…….
Document No.:
CDRL A002 Revision: Original
Date: May 2014 Page: 101 of 123
Document Title: HAMS Final Report (Technical and Financial)
S3 – 25K
100% Oxygen given at 1696 seconds
S3 -25K - repeat
100% Oxygen given at 1660 seconds
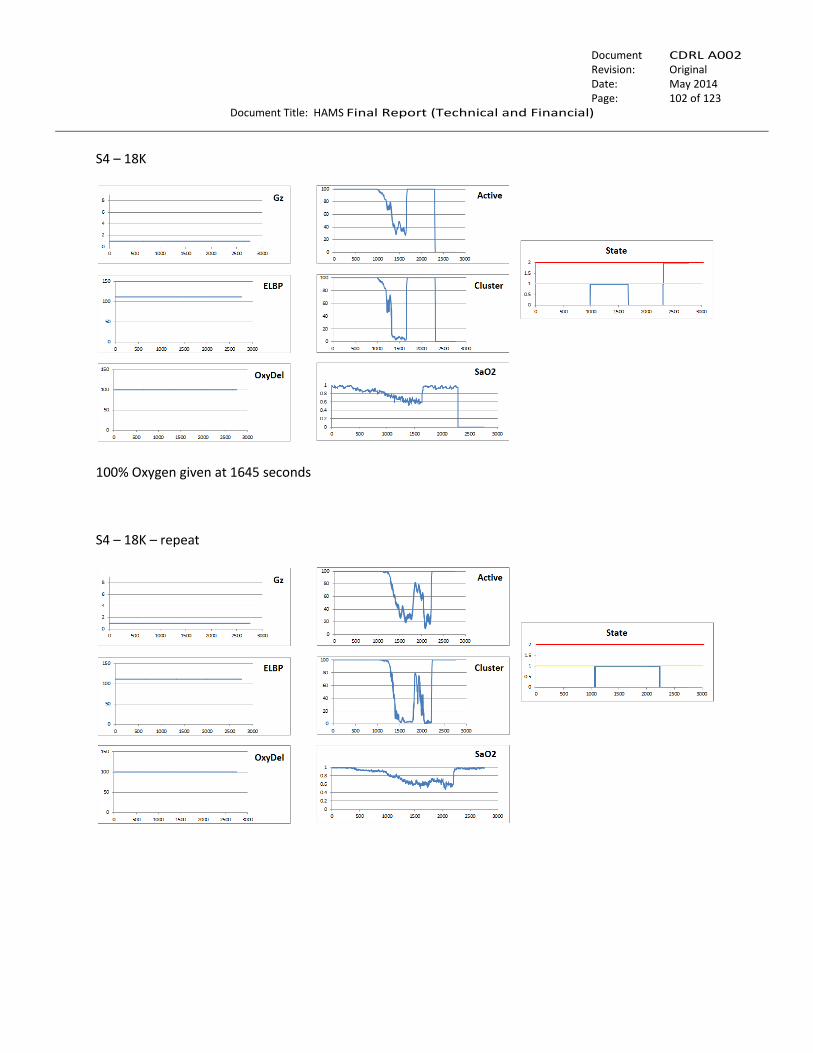
….…….
Document No.:
CDRL A002 Revision: Original
Date: May 2014 Page: 102 of 123
Document Title: HAMS Final Report (Technical and Financial)
S4 – 18K
100% Oxygen given at 1645 seconds
S4 – 18K – repeat
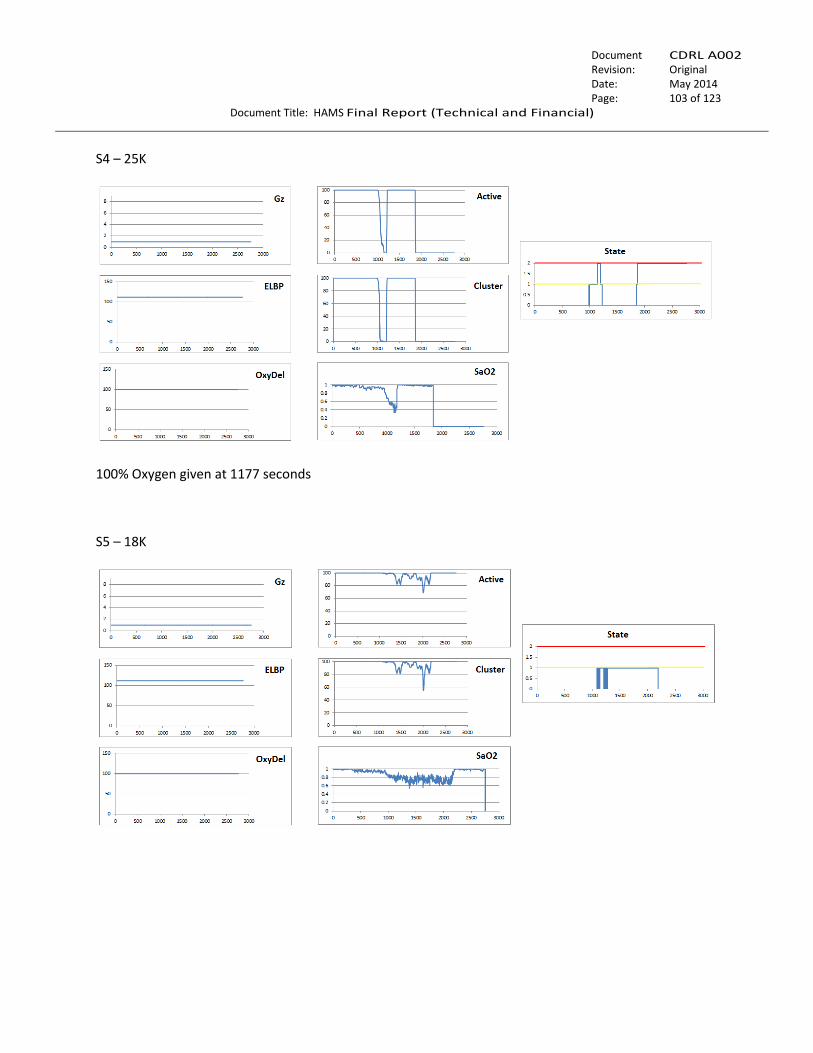
….…….
Document No.:
CDRL A002 Revision: Original
Date: May 2014 Page: 103 of 123
Document Title: HAMS Final Report (Technical and Financial)
S4 – 25K
100% Oxygen given at 1177 seconds
S5 – 18K

….…….
Document No.:
CDRL A002 Revision: Original
Date: May 2014 Page: 104 of 123
Document Title: HAMS Final Report (Technical and Financial)
S5 – 18K – repeat
S5 – 25K
100% Oxygen given at 1145 seconds
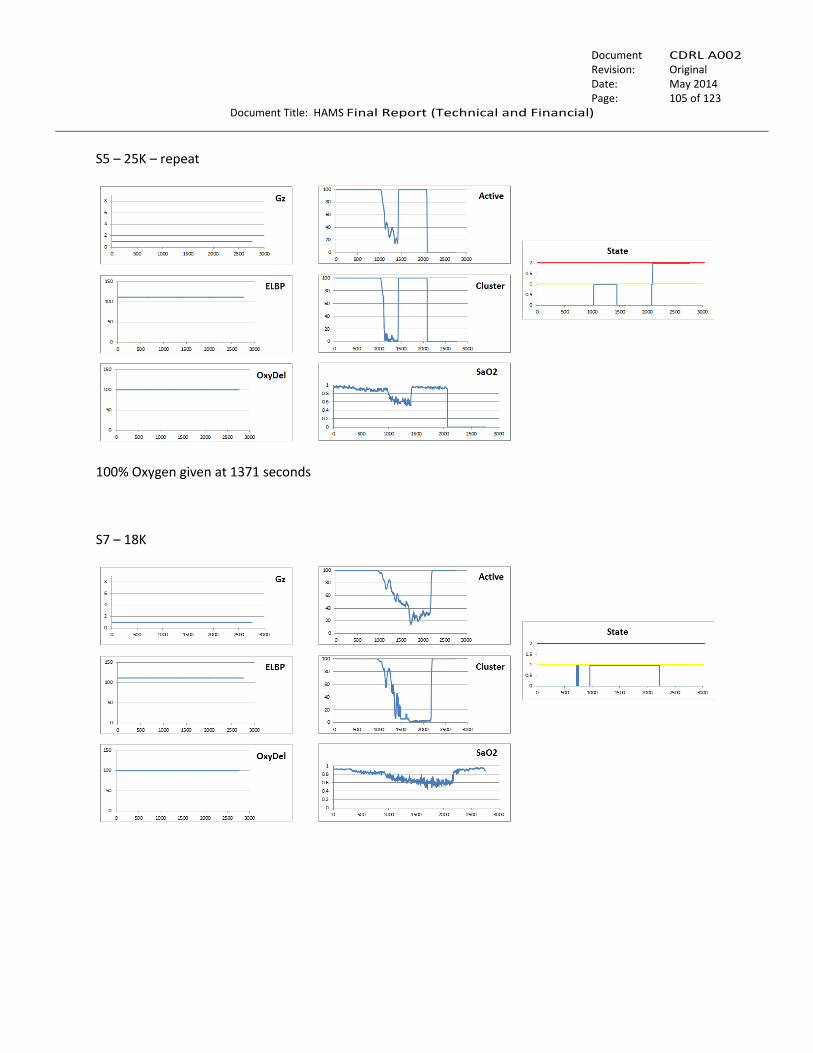
….…….
Document No.:
CDRL A002 Revision: Original
Date: May 2014 Page: 105 of 123
Document Title: HAMS Final Report (Technical and Financial)
S5 – 25K – repeat
100% Oxygen given at 1371 seconds
S7 – 18K
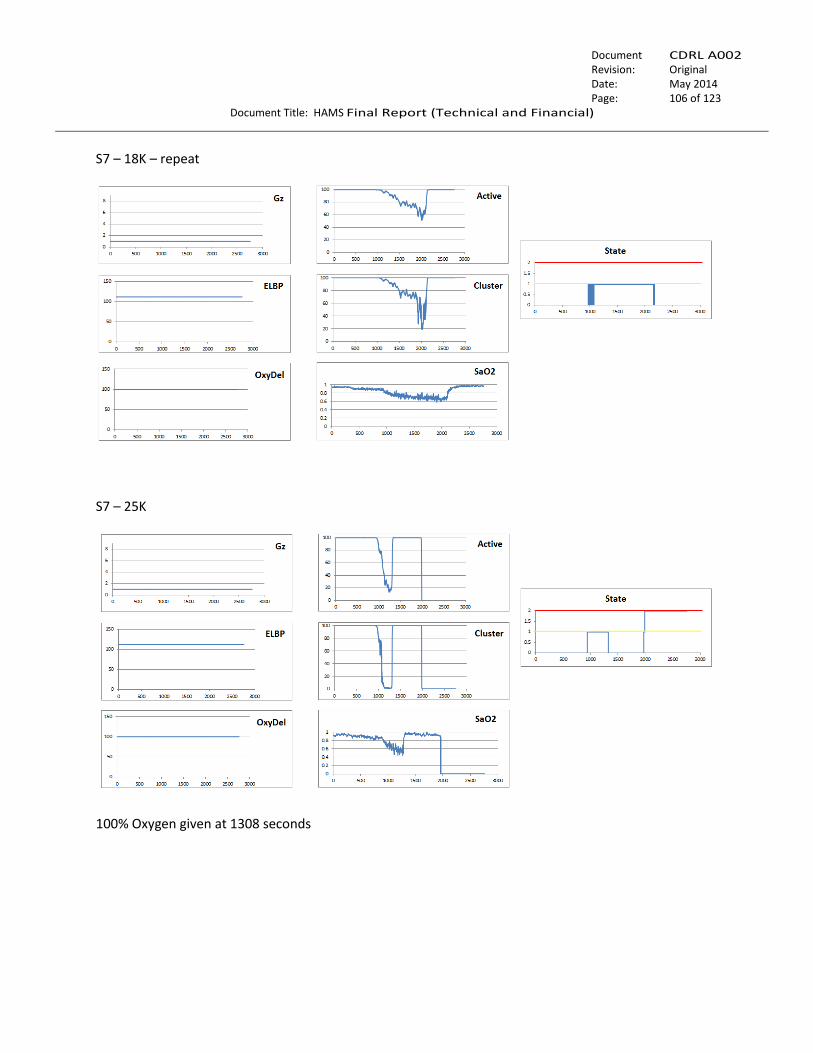
….…….
Document No.:
CDRL A002 Revision: Original
Date: May 2014 Page: 106 of 123
Document Title: HAMS Final Report (Technical and Financial)
S7 – 18K – repeat
S7 – 25K
100% Oxygen given at 1308 seconds
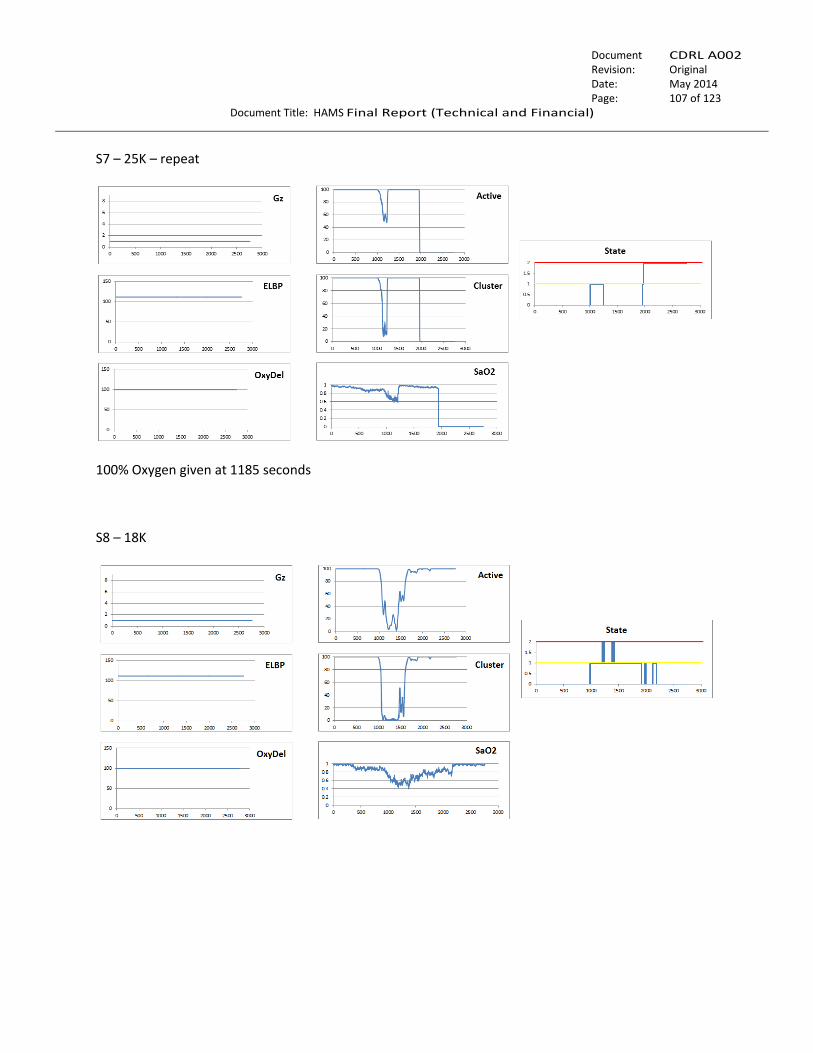
….…….
Document No.:
CDRL A002 Revision: Original
Date: May 2014 Page: 107 of 123
Document Title: HAMS Final Report (Technical and Financial)
S7 – 25K – repeat
100% Oxygen given at 1185 seconds
S8 – 18K
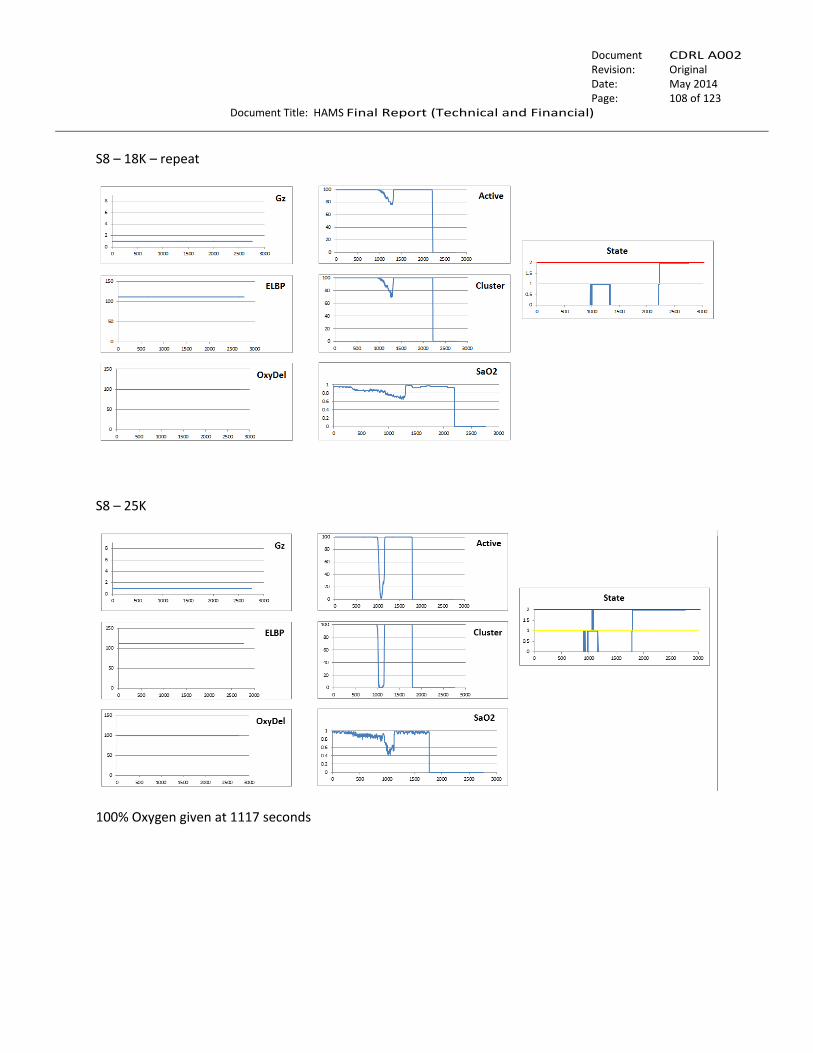
….…….
Document No.:
CDRL A002 Revision: Original
Date: May 2014 Page: 108 of 123
Document Title: HAMS Final Report (Technical and Financial)
S8 – 18K – repeat
S8 – 25K
100% Oxygen given at 1117 seconds
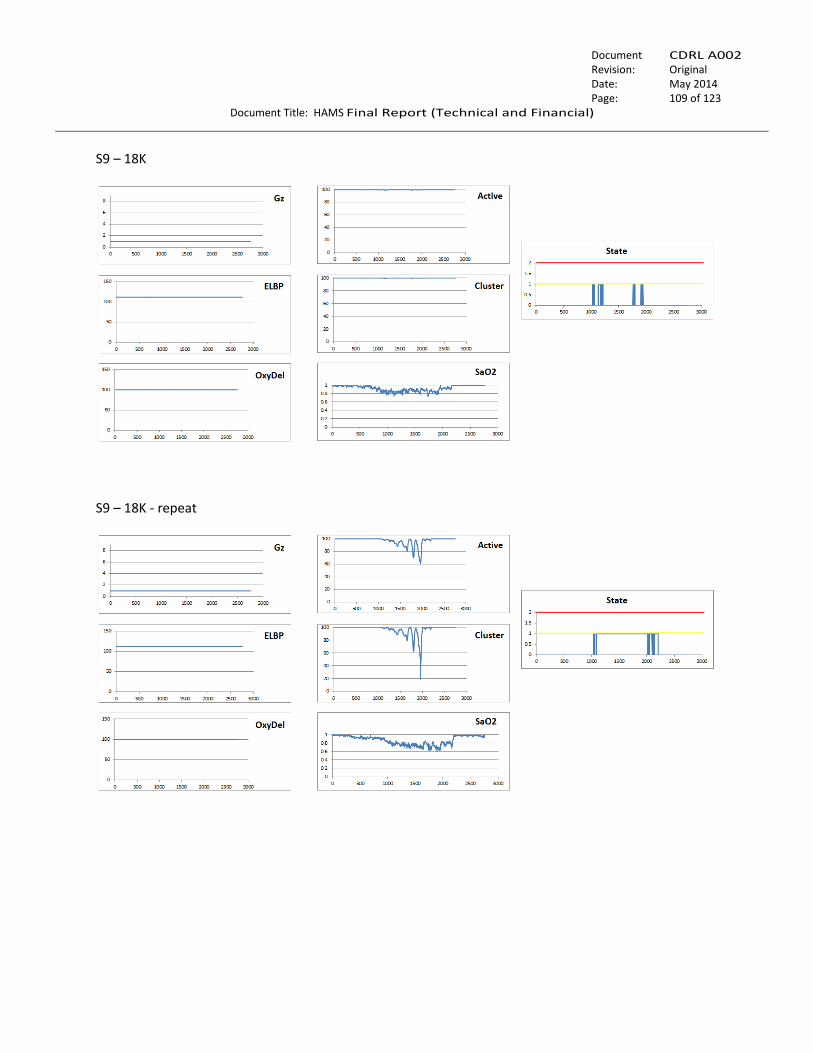
….…….
Document No.:
CDRL A002 Revision: Original
Date: May 2014 Page: 109 of 123
Document Title: HAMS Final Report (Technical and Financial)
S9 – 18K
S9 – 18K - repeat
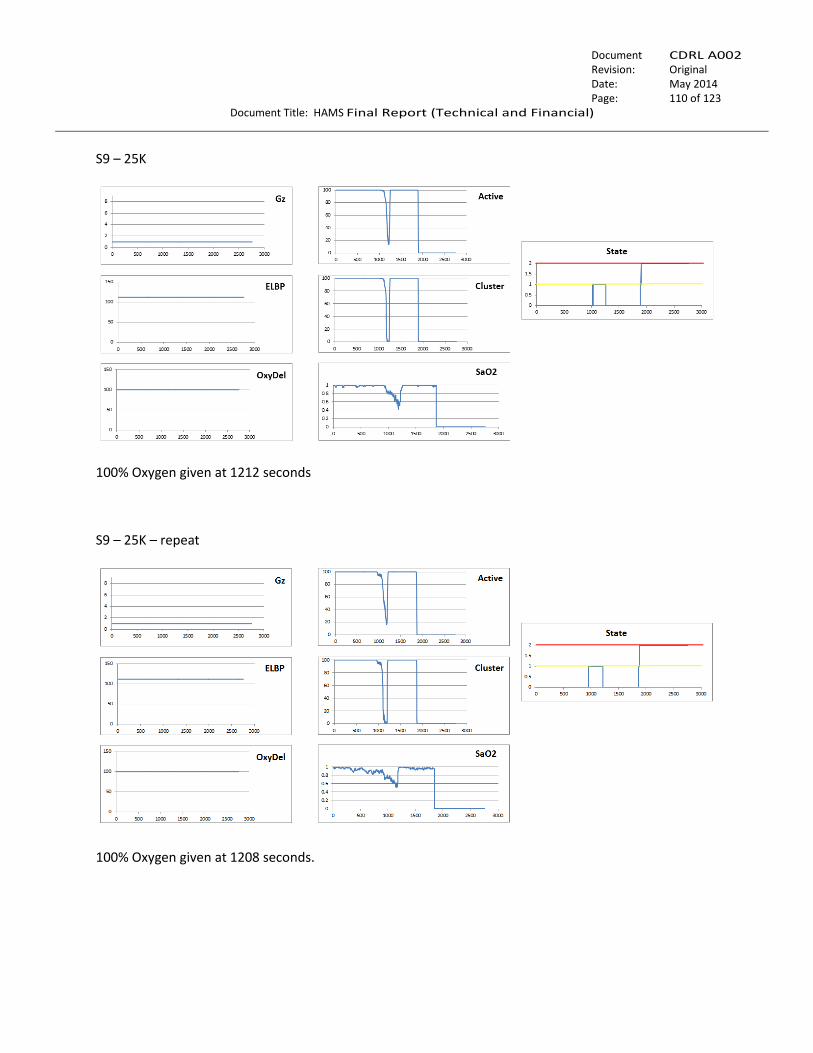
….…….
Document No.:
CDRL A002 Revision: Original
Date: May 2014 Page: 110 of 123
Document Title: HAMS Final Report (Technical and Financial)
S9 – 25K
100% Oxygen given at 1212 seconds
S9 – 25K – repeat
100% Oxygen given at 1208 seconds.

….…….
Document No.:
CDRL A002 Revision: Original
Date: May 2014 Page: 111 of 123
Document Title: HAMS Final Report (Technical and Financial)
S10 – 18K
S10 – 25K
100% Oxygen given at 1208 seconds
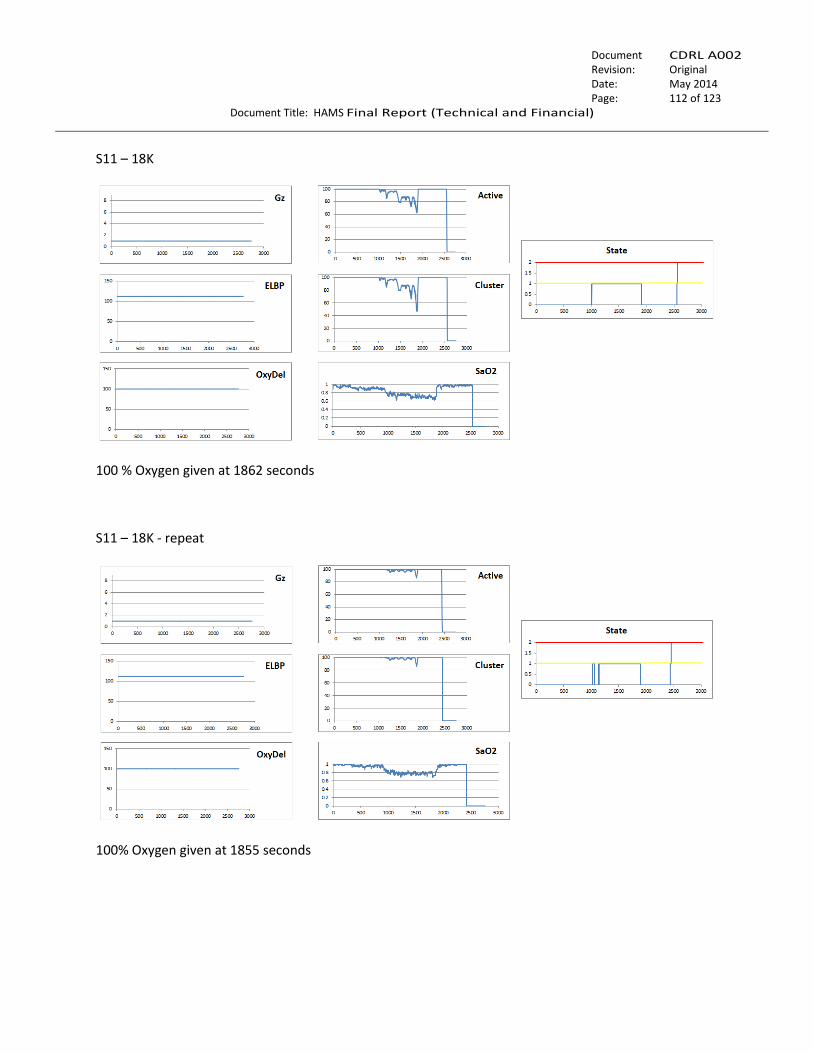
….…….
Document No.:
CDRL A002 Revision: Original
Date: May 2014 Page: 112 of 123
Document Title: HAMS Final Report (Technical and Financial)
S11 – 18K
100 % Oxygen given at 1862 seconds
S11 – 18K - repeat
100% Oxygen given at 1855 seconds
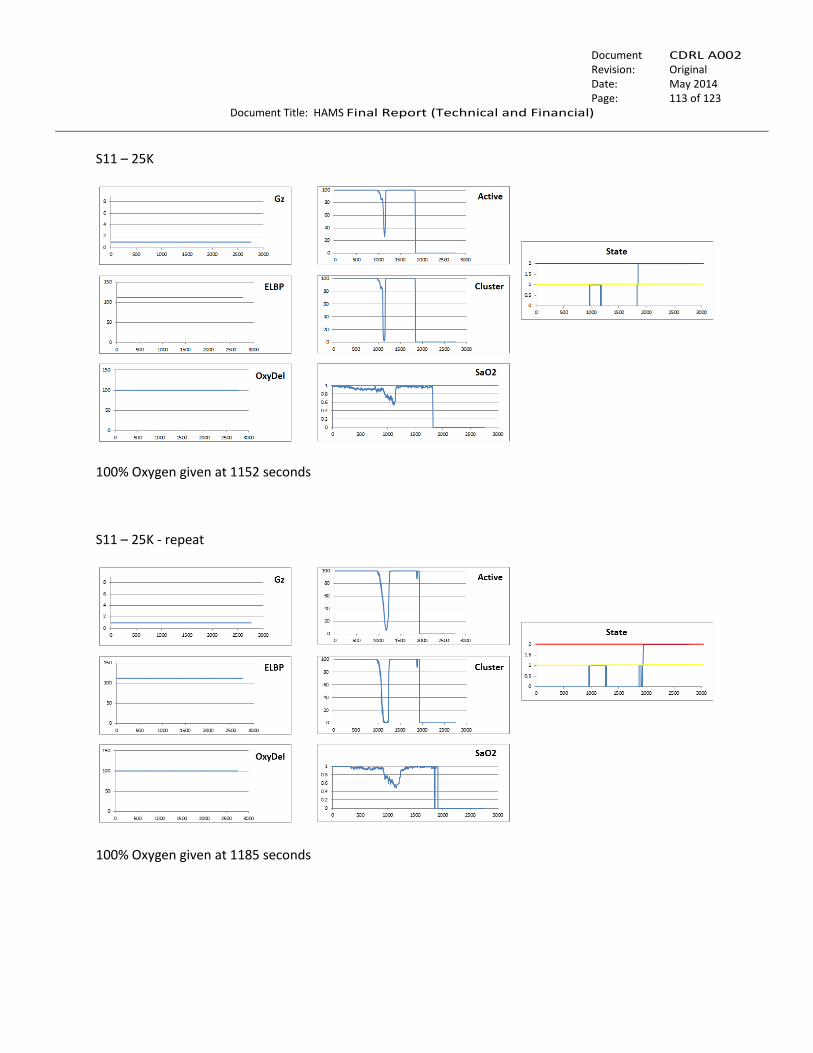
….…….
Document No.:
CDRL A002 Revision: Original
Date: May 2014 Page: 113 of 123
Document Title: HAMS Final Report (Technical and Financial)
S11 – 25K
100% Oxygen given at 1152 seconds
S11 – 25K - repeat
100% Oxygen given at 1185 seconds
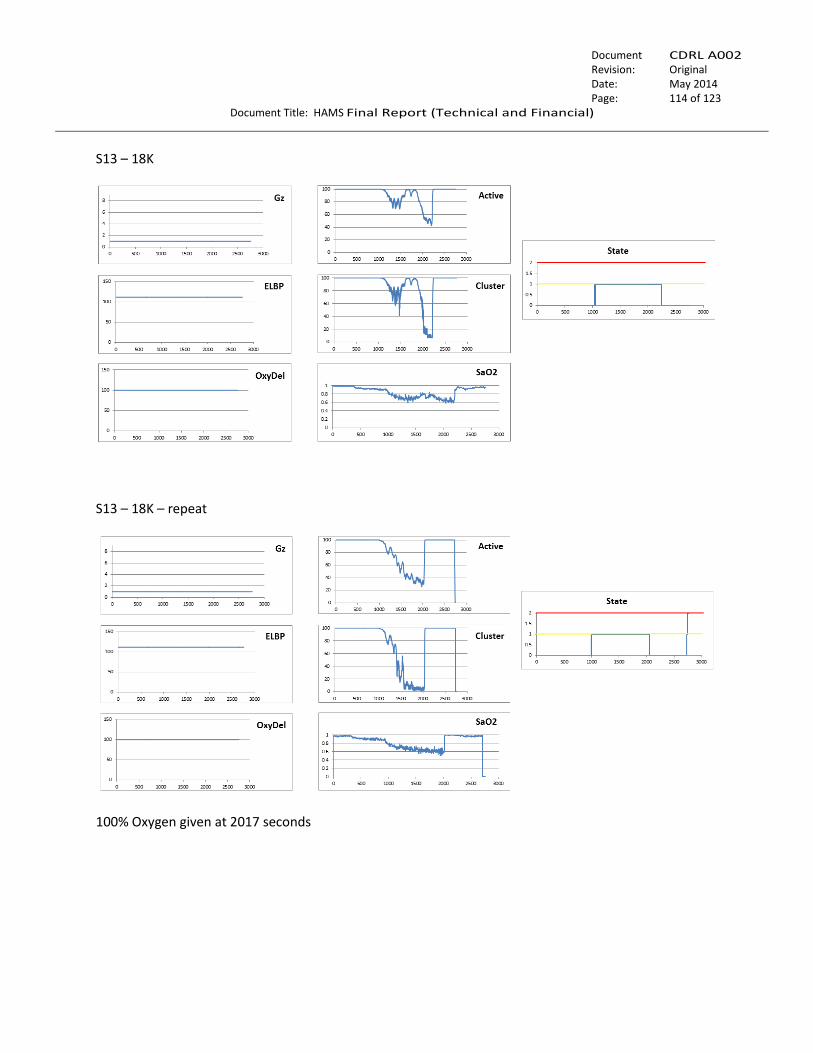
….…….
Document No.:
CDRL A002 Revision: Original
Date: May 2014 Page: 114 of 123
Document Title: HAMS Final Report (Technical and Financial)
S13 – 18K
S13 – 18K – repeat
100% Oxygen given at 2017 seconds
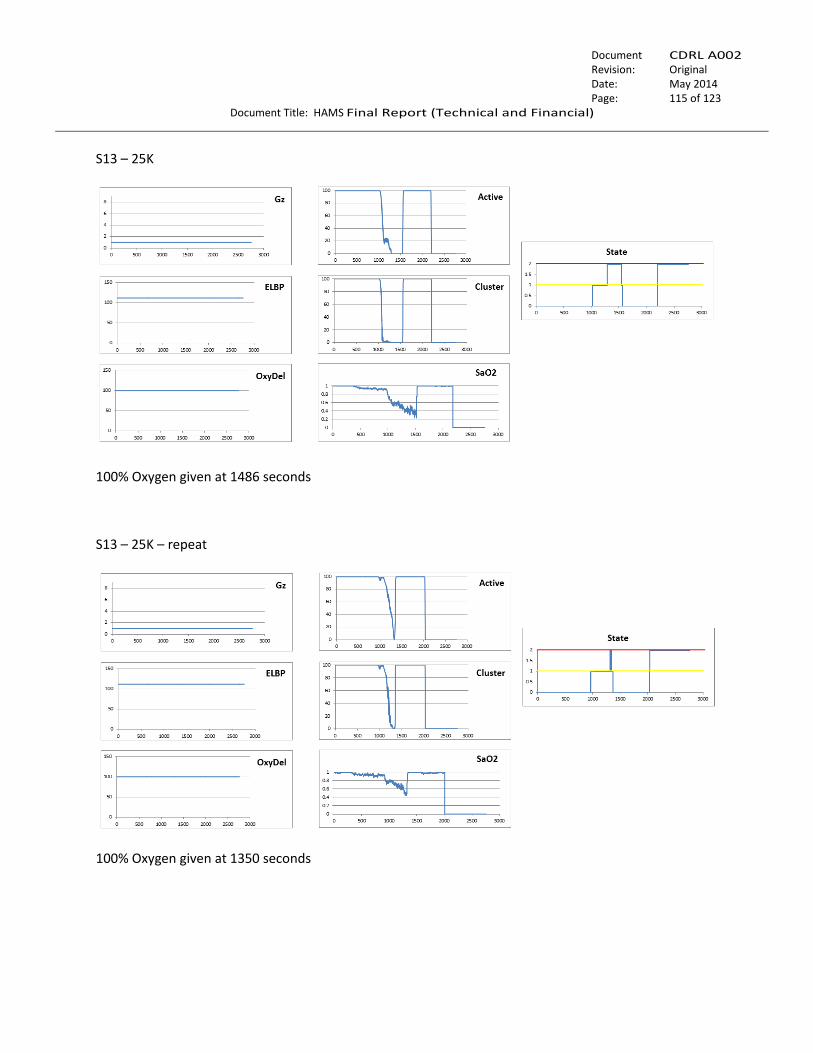
….…….
Document No.:
CDRL A002 Revision: Original
Date: May 2014 Page: 115 of 123
Document Title: HAMS Final Report (Technical and Financial)
S13 – 25K
100% Oxygen given at 1486 seconds
S13 – 25K – repeat
100% Oxygen given at 1350 seconds
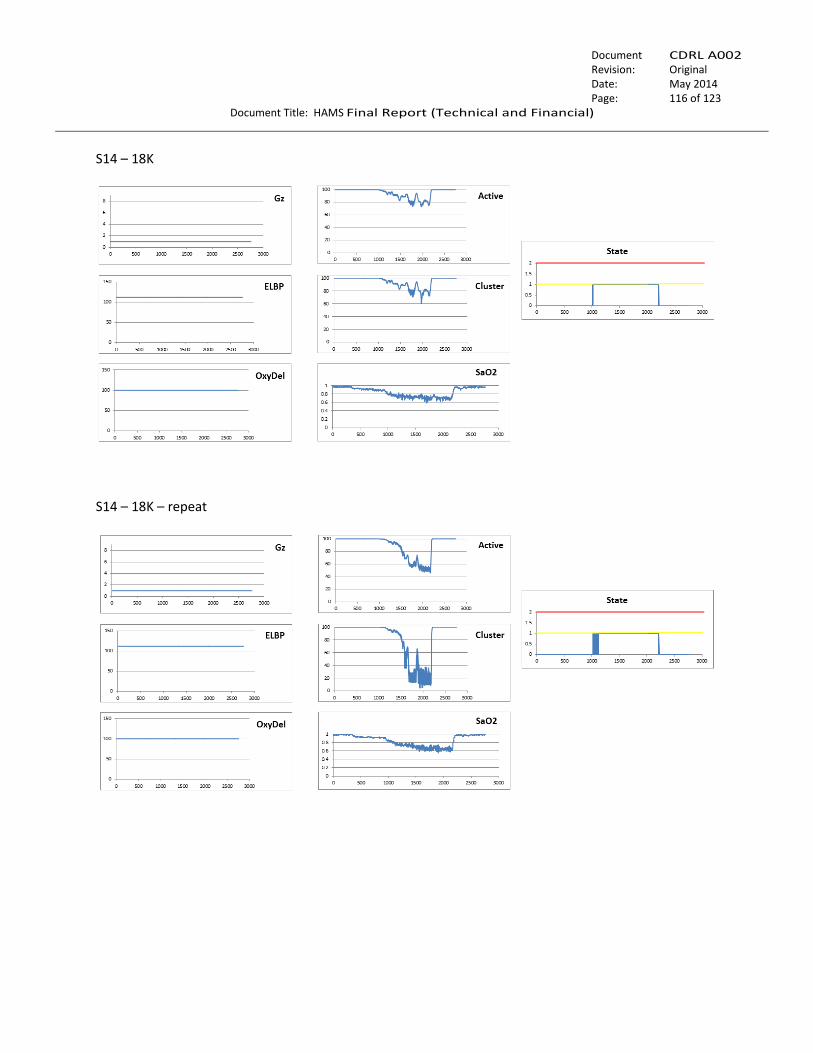
….…….
Document No.:
CDRL A002 Revision: Original
Date: May 2014 Page: 116 of 123
Document Title: HAMS Final Report (Technical and Financial)
S14 – 18K
S14 – 18K – repeat
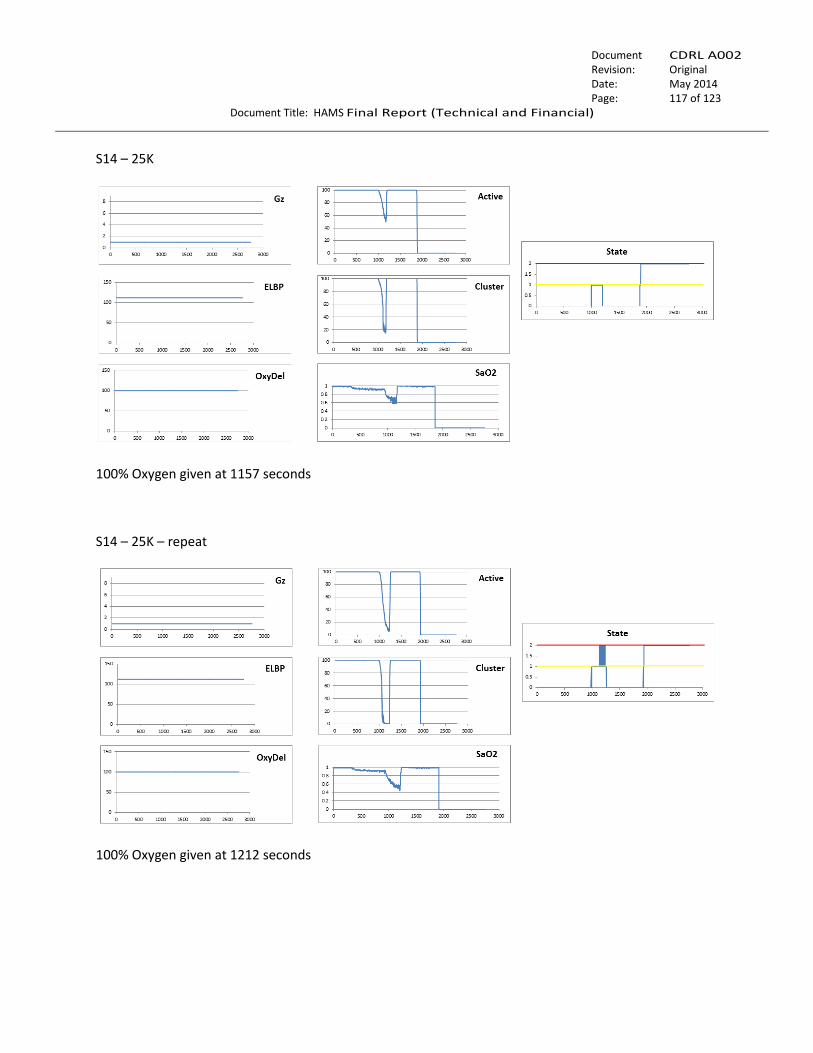
….…….
Document No.:
CDRL A002 Revision: Original
Date: May 2014 Page: 117 of 123
Document Title: HAMS Final Report (Technical and Financial)
S14 – 25K
100% Oxygen given at 1157 seconds
S14 – 25K – repeat
100% Oxygen given at 1212 seconds

….…….
Document No.:
CDRL A002 Revision: Original
Date: May 2014 Page: 118 of 123
Document Title: HAMS Final Report (Technical and Financial)
S16 – 18K
100% Oxygen given at 2150 seconds
S16 – 18K – repeat
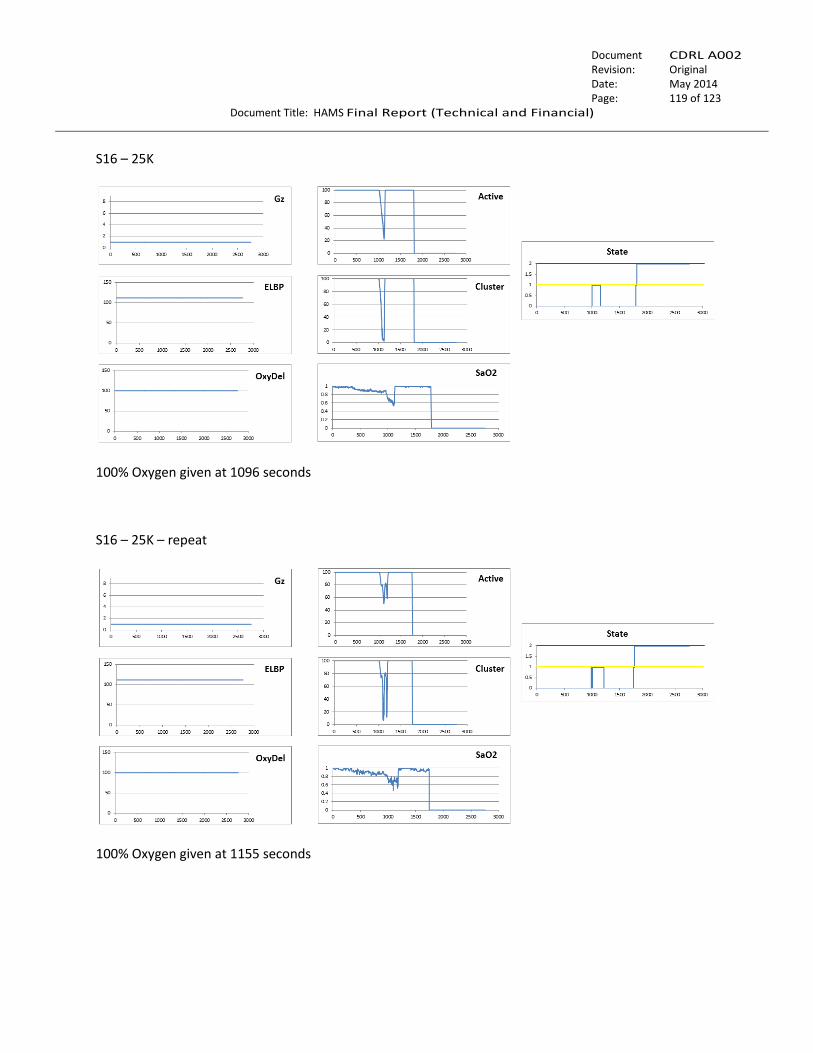
….…….
Document No.:
CDRL A002 Revision: Original
Date: May 2014 Page: 119 of 123
Document Title: HAMS Final Report (Technical and Financial)
S16 – 25K
100% Oxygen given at 1096 seconds
S16 – 25K – repeat
100% Oxygen given at 1155 seconds
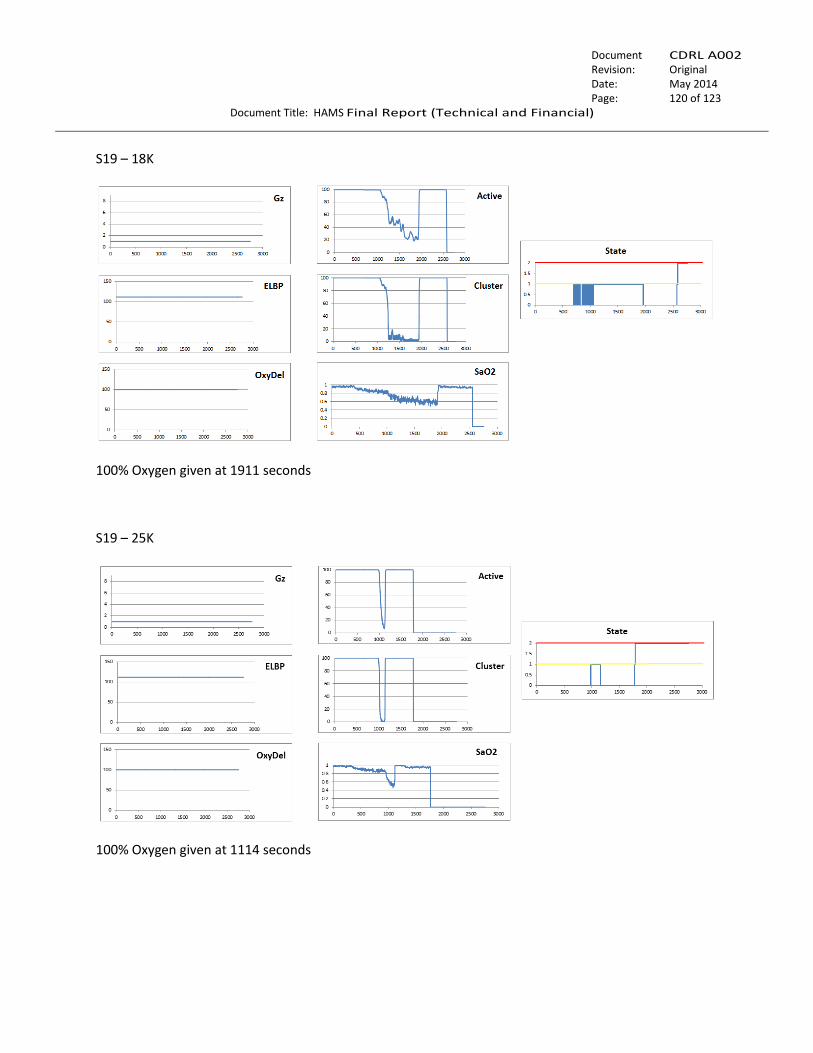
….…….
Document No.:
CDRL A002 Revision: Original
Date: May 2014 Page: 120 of 123
Document Title: HAMS Final Report (Technical and Financial)
S19 – 18K
100% Oxygen given at 1911 seconds
S19 – 25K
100% Oxygen given at 1114 seconds

….…….
Document No.:
CDRL A002 Revision: Original
Date: May 2014 Page: 121 of 123
Document Title: HAMS Final Report (Technical and Financial)
10.3 Detailed Financial Spreadsheets (PDF)

….…….
Document No.:
CDRL A002 Revision: Original
Date: May 2014 Page: 122 of 123
Document Title: HAMS Final Report (Technical and Financial)
11.0 List of Symbols, Abbreviations and Acronyms
[O2] Concentration of Oxygen
AMS Altitude Mountain Sickness
ANS Autonomic Nervous System
COPD Chronic Obstructive Pulmonary Disease
DSP Digital Signal Processing
ECG Electrocardiogram
EPO Erythropoietin
FDA Food and Drug Administration
FTP File Transfer Protocol
HAMS Hypoxia Monitoring, Alert and Mitigation System
HRV Heart Rate Variability
ONR Office of Naval Research
PaCO2 Alveolar Pressure of Carbon Dioxide
PaO2 Alveolar Pressure of Oxygen
RER Respiratory Exchange Ratio
ROBD Reduced Oxygen Breathing Device
SaO2 Arterial Oxygen Saturation Measured via CO-Oximeter
SpO2 Arterial Oxygen Saturation Measured via Pulse-Oximeter
TAILSS Tactical Aircrew Integrated Life Support System
TUC Time of Useful Consciousness
USN United States Navy
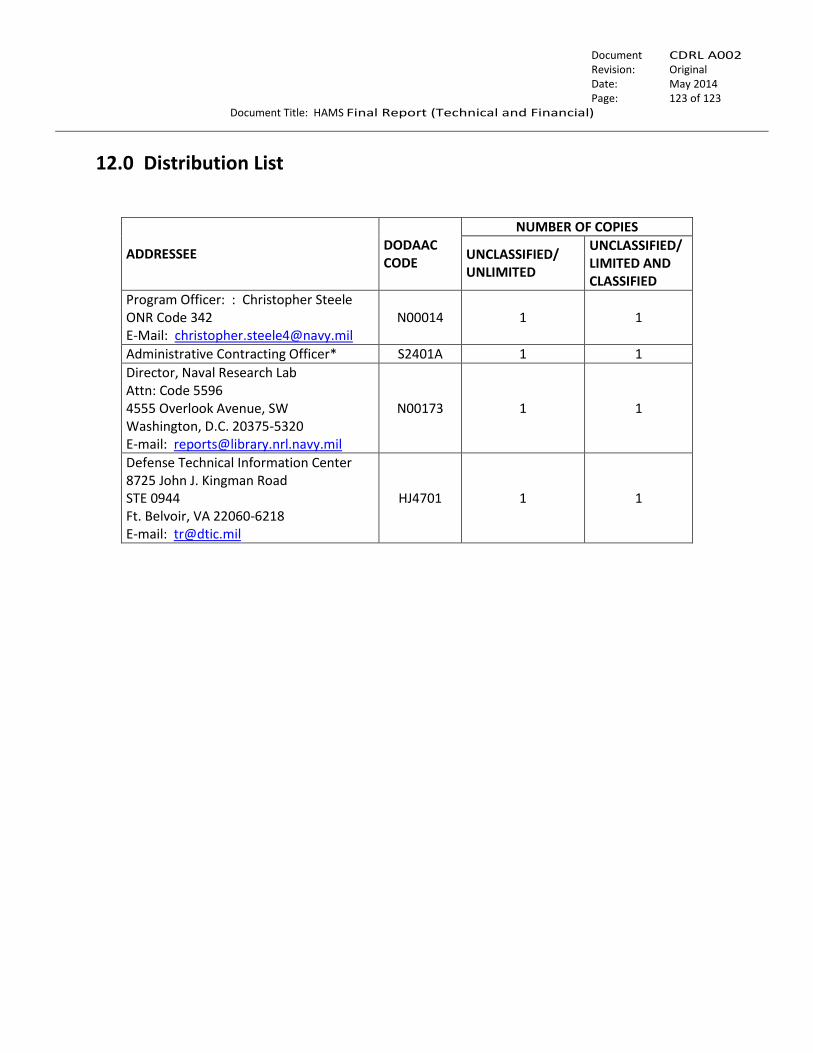
….…….
Document No.:
CDRL A002 Revision: Original
Date: May 2014 Page: 123 of 123
Document Title: HAMS Final Report (Technical and Financial)
12.0 Distribution List
ADDRESSEE DODAAC CODE
NUMBER OF COPIES
UNCLASSIFIED/ UNLIMITED
UNCLASSIFIED/LIMITED AND CLASSIFIED
Program Officer: : Christopher Steele ONR Code 342 E-Mail: [email protected]
N00014 1 1
Administrative Contracting Officer* S2401A 1 1
Director, Naval Research Lab Attn: Code 5596 4555 Overlook Avenue, SW Washington, D.C. 20375-5320 E-mail: [email protected]
N00173 1 1
Defense Technical Information Center 8725 John J. Kingman Road STE 0944 Ft. Belvoir, VA 22060-6218 E-mail: [email protected]
HJ4701 1 1
Related Documents