E-334 RIGA DISTRICT HEATING REHABILITATION PROJECT FINAL REPORT SECTION SIX ENVIRONMENTAL IMPACT REVIEW RiGAS SILTUMS December 21, 1998 A , FVB j j&t&rfafebyr&n o& Public Disclosure Authorized Public Disclosure Authorized Public Disclosure Authorized Public Disclosure Authorized

Welcome message from author
This document is posted to help you gain knowledge. Please leave a comment to let me know what you think about it! Share it to your friends and learn new things together.
Transcript

E-334
RIGA DISTRICT HEATINGREHABILITATION PROJECT
FINAL REPORT
SECTION SIX
ENVIRONMENTAL IMPACT REVIEW
RiGAS SILTUMS
December 21, 1998 A , FVBj j&t&rfafebyr&n o&
Pub
lic D
iscl
osur
e A
utho
rized
Pub
lic D
iscl
osur
e A
utho
rized
Pub
lic D
iscl
osur
e A
utho
rized
Pub
lic D
iscl
osur
e A
utho
rized

Riga District Heating Rehabilitation ProjectFinal Report, Section 6Environmental Impact Review
TABLE OF CONTENTS
6 ENVIRONMENTAL IMPACT ASSESSMENT ............. 1
6.1 Introduction ........................................... 1 6.2 Present situation ........................................... 16.2.1 Location ............................................... 1 6.2.2 Fuels ................................................ 36.2.3 Emissions ............................................... 46.2.4 Air quality in the city ............................................... 6
6.2.5 European standards regarding air ernissions ....................................... 76.2.6 Environment and Economy .................... ........................... 8
6.3 Situation after suggested conversion .................................... 106.3.1 Location ............................................... I 06.3.2 Fuels ............................................... I 16.3.3 Emissions ............................................... I 16.3.4 Air quality in Riga ............................................... 156.3.5 Environment and economy ..................... .......................... 15
6.4 Summary ........................................... 17
December 21, 1998 - FVB - g:lidal97360draftfitnal,rpoflrig,ams.do

Riga District Heating Rehabilitation ProjectFinal Report, Section 6Environmental Impact Review
6 ENVIRONMENTAL IMPACT ASSESSMENT
6.1 IntroductionThe goal for this environmental impact review is to investigate the environmental effects ofrehabilitation project. The environmental situation regarding air emissions, before and afterthe planned rehabilitation, is compared. Handling of rest products and other kinds of wastesuch as asbestos is also being described.
6.2 Present situation
6.2.1 LocationThe district heating system in Riga is mainly supplied with heat from eight large plants:TEC-l, TEC-2, Andrejsala, Imanta, Zasulauks, Daugavgriva, Ziepniekkalns andVecmilgravis.
TEC 1, TEC2 and Andrejsala are owned by Latvenergo and the other district heating plantsbelong to Rigas Siltums.
The plants in Riga had the following capacity/production in 1997:
Table 6.2.1.1 Fuel, ca pacity and produc ion of the district heating plants in Riga.Heating plant Fuel at present Capacity Production 1997
(Gcal /h) (Tcal)TEC-1 gas/heavy fuel 530 634
oil/milled peat _TEC-2 gas/heavy fuel oil 1100 2241Andrejsala gas/heavy fuel oil 250 494Imanta gas/heavy fuel oil 300 424Zasulauks gas/heavy fuel oil 200 286Daugavgriva heavy fuel oil/wood 48 53,3Ziepniekkalns gas/heavy fuel oil 104 186Vecmilgravis gas 140 159small boiler houses gas/coal/wood _ 229Total 2672 4706,3
Source: Riga Siltums Annual report of 1996, Andris Boze facsimile dated 1998 02 02
The district heating system also consists of a large number of small boiler houses.Altogether the small plants produced 228828 Gcal in 1997.
December 21., 1998 - FVB - gwsidai97360drdaffi.dreponrisgsee6dod
Riga District Heating Rehabilitation Project 2Final Report, Section 6Environmental Impact Review
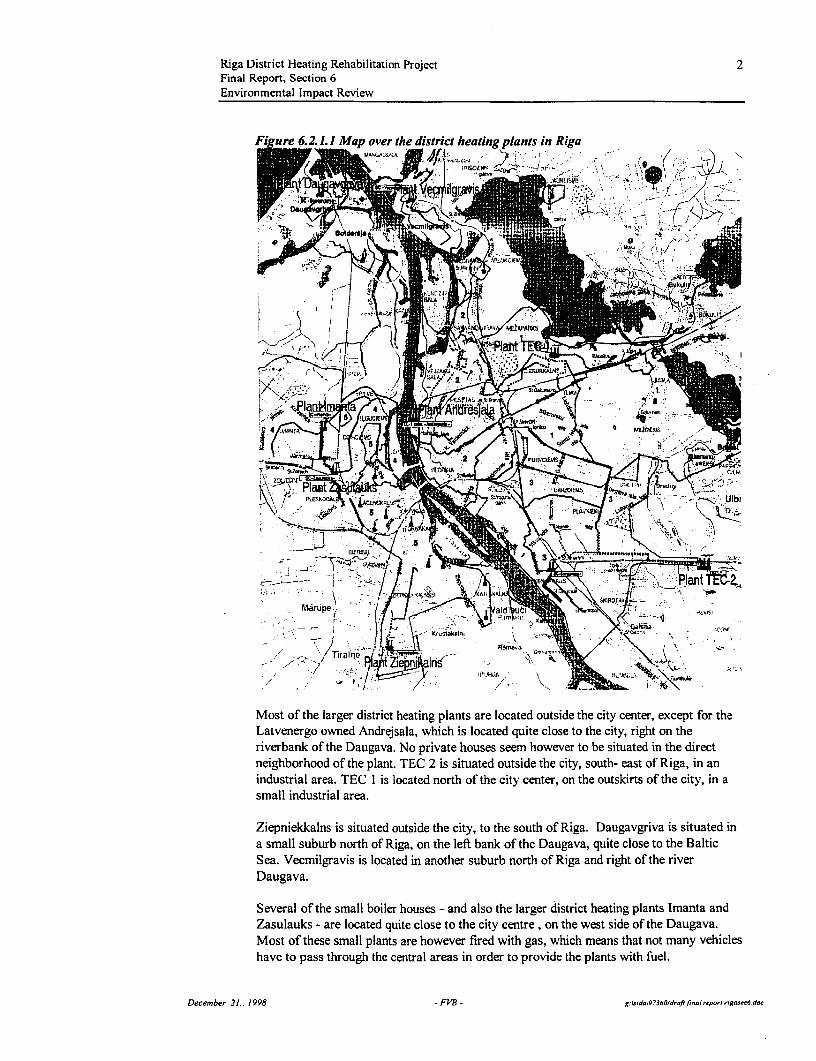
Fi ure 6.2.1.1 Map over the district heating plants in Riga
Mos he lag disbtrict eti pls ar la o t r
r=.~~~~~~~~~~~~.
' . /ran .l t X \4
Most of the larger district heating plants are located outside the city center, except for theLatvenergo owned Andrejsala, which is located quite close to the city, right on theriverbank of the Daugava. No private houses seem however to be situated in the directneighborhood of the plant. TEC 2 is situated outside the city, south- east of Riga, in anindustrial area. TEC I is located north of the city center, on the outskirts of the city, in asmall industrial area.
Ziepniekkalns is situated outside the city, to the south of Riga. Daugavgriva is situated ina small suburb north of Riga, on the left bank of the Daugava, quite close to the BalticSea. Vecmilgravis is located in another suburb north of Riga and right of the riverDaugava.
Several of the small boiler houses - and also the larger district heating plants Imanta andZasulauks - are located quite close to the city centre, on the west side of the Daugava.Most of these small plants are however fired with gas, which means that not many vehicleshave to pass through the central areas in order to provide the plants with fuel.
December 21., 1998 - FVB - g.id&973601drqfi-I -p-1 rg dod

Riga District Heating Rehabilitation Project 3Final Report, Section 6Environmental Impact Review
In general the location of the heating plants is good from transportation point of view.
6.2.2 Fuels
The two mostly used fuels are natural gas (6800 Tcal in 1997) and heavy fuel oil (900Tcal in 1997). In TEC 1, 470 Tcal of peat was combusted in 1997. Only small amounts ofwood and coal are used in the system.
Table 6.2.2.1 Fuel analysis o heav fuel oilwater (wt %) 3,00sulfuir (wt %) |2,10SNet heat value of combustion (kJ/kg) |39000Source: Ainars Ozols, Riga Siltums
Table 6.2.2.2 Fuel analysis of natural gas
CH4 (vol %) 97,70
C2 H6 (vol %) 0,80
N 0 0,90
Net heat value of combustion (kJ/Nm3 ) 33500Source: Ainars Ozols, Riga Siltums
The heavy fuel oil is transported by train. Upon arrival the mazut is heated by steam andpoured into a receiving reservoir. During this process HC is emitted to the air. Theestimated amount of emitted hydrocarbon is presented in the table below. The storage ofmazut in oil containers also causes emissions of HC. This too is presented in the tablebelow.
Table 6.2.2.3 Emissions from storing and unloading heavy fuel oil 1997..Actual emissions Actual emissions HC emission limitfrom storing in from unloading values (ton)containers (ton) mazut (ton)
TEC-1 1,7*) 1,7TEC-2 4,0 *) 4,0Andrejsala 5,4 *) 5,4
Imanta 3,0 0,6 4,2Zasulauks 1,0 0,2 3,4Daugavgriva 0,06 0,01 0,088Ziepniekkalns 0 0 2,078**)Vecmilgravis 0 0 0Small boilers 0,07 0,01 0,137Total 15,23 0,82 21Source: Andris Boze, facsimile dated Feb 2, 1998*) Total emissions**) The norm was given in 1997 10 09. Since that time mazut was not burnt.
The system for unloading and storing mazut is sometimes (like in Daugavgriva) in a badcondition, which creates undesirable working conditions. Therefore, an investigationshould be undertaken to see if it is possible from an economnical point of view to carry outthe unloading of mazut in a more environmentally friendly way.
December 21., 1998 - FVB - g:LWidai97360/dnflflmreponiigo.-6.doc

Riga District Heating Rehabilitation Project 4Final Report, Section 6Environmental Impact Review
6.2.3 Emissions
Emnissions to air
In 1997 the average emissions from the different district heating plants were as follows:
Table 6.2.3.1 Emissions in mg/MJproduced ener from the district h ating systemHeating plant dust S02 NOx V205 CO HC C02 *)
(mglMJ) (mg/MJ) (mg/MJ) (mgfMJ) (mg/MJ) (mg/MJ) (g/MJ)
TEC-1 99 414 181 0,23 0 0,64 37TEC-2 3,0 182 238 1,3 0 0,43 64Andrejsala 0,38 14 55 0,19 0 2,6 64Imanta . 7,8 687 39 2,7 0 2,0 73Zasulauks 4,0 313 17 1,4 0 I, I 72Daugavgriva 11,5 562 75 2,2 823 0,3 93**)Ziepniekkalns 3,2 337 103 1,4 91 0 69Vecrnilgravis 0 0 24 0 0 0 70Small boilers 203 211 83 0,7 159 0,08 74These data are calculatedfrom the values of production (given in table 6.2.1.1) and the values ofemissions in ton/year (given in table 6.2.3.2).*) The emissions of C02 are calculatedfrom:Oil: 80 weight% C content, LHV (lower net heat of combustion)= 39 MJ/kgGas: 75 weight% C content, LHV =33,5 MJ/Nm3
Peat: regarded as a biofuel with no net emissions of CO2**) These emissions should be somewhat lower, because the production with wood is notincluded
The emissions, reported from Rigas Siltums plants (Andrejsala, Imanta and Zasulauks),especially those of Nox, are remarkably low - the same level or lower than NOx emissionsfrom modem plants.
During 1997 the plants emitted the following amount of pollutants, given in tons.
Table 6.2.3.2 Emissions in tons from the district heating system (power production isnot included)Heating plant dust S02 NOx V205 CO HC" C02**)
(ton) (ton) (ton) (ton) (ton) (ton) (ton)TEC-1 263 1100 480 0,6 1,7 97000TEC-2 28 1711 2228 12,3 4,0 600000Andrejsala 0,78 29 113 0,4 5,4 133000Imanta 14 1220 70 4,8 3,6 130000Zasulauks 4,8 377 21 1,7 1 ,3 86000Daugavgriva 2,6 127 17 0,5 186 0,07 21000""Ziepniekkalns 2,5 264 81 1,1 71 0 54000Vecmilgravis 0 0 16 0 0 0 46000Small boiler houses 195 203 80 0,7 152 0,08 71000Total 510,68 5031 3106 22,1 409 16,15 1240000*) Emissions from storing mazut in containers.Source: A. Boze, Riga Siltums, facsimile dated 1998 02 02**) The emissions of C02 are calculatedfrom table 6.2.3.1.***) These emissions should be somewhat lower, because the production with wood is notincluded
December 21.. 1998 - FVB - g. sid.19736O1d,oftfi.delponligo6.d

Riga District Heating Rehabilitation Project 5Final Report, Section 6Environmental Impact Review
Emissions to water
The drainage water from the oil storage tanks goes to a water settling reservoir. The oil ontop of the reservoir is separated from the water. The water in the reservoir is discharged tothe municipal waste water network. The table below shows the average content of oilproducts in the water that is discharged from the plant to the waste water network.
Table 6.2.3.3 Average values of oil products in drainage water 1997Actual average value of oil Norms for oil productsproducts in drainage water content in drainage water(mg/I) (mg/I)
TEC-1 TEC-2Andrejsala 0,84 4Imanta 0,6 4Zasulauks 0,3 4Daugavgriva 0,3 4Ziepniekkalns 0,4 0,5Vecmilgravis 1,8 4Small boilers __L
Source: A. Boze, Riga Siltums, facsimile dated 1998 02 02
Waste, ash and asbestos
The boilers are swept with steam soot blowers. The small amounts of ash from the oilburning plants are transported to the Getlini-2 landfill. The waste, - except for usedfluorescent lamps, generated at Rigas Siltums- is also transported to the Getlini landfill.The used fluorescent lamps are taken care of by a recirculation company situated in
Liepaja. In 1996 a total of 9 1O m3 waste from Riga Siltums was transported to Getlini-2.
When reconstruction takes place, it is sometimes necessary to remove asbestos from theplants or distribution system. The contractor (who is in charge of the reconstruction) isthen also responsible for the correct treatment of the asbestos.
According to EC standards, countries that are members of the EC are obliged to prevent or(if not possible) reduce emergence of asbestos waste and emissions of asbestos to air andwater.
When plants or buildings that contain asbestos are torn down or if materials that containasbestos are being transported, this shall be done without causing any significant pollutionof the environment. Therefore, a working plan for the activities should be established.
The member countries are obliged to take the necessary actions to prevent asbestos fibersand asbestos dust from being released to the air.
Waste that contains asbestos must be deposited at an approved landfill.
December 21, 1998 - FVB - g. Lid.976da)ifi aleponlrigrti6rdo

Riga District Heating Rehabilitation Project 6Final Report, Section 6Environmental Impact Review
Noise, dust and odor
The operation of the district heating plants does not cause any significant odor or dustproblems, since natural gas or heavy fuel oil is used as fuel. The information that has cometo hand does not indicate any occurrence of noise disturbances.
6.2.4 Air quality in the city
The emissions from the district heating plants contribute to the concentration of harmfulsubstances in the air. But there are also other sources. The traffic is by far the largestsource of nitrogen oxides.
Table 6.2.4.1 Estimated emissions of various substances in Riga (1991)Dust CO S02 N02 HCton/year ton/year ton/year ton/year ton/year
Industries ( 1991 ) 9300 6700 6700 2250Traffic (1991) 65000 4800 10500District heating plants (1991) 1200 6700 15700 5700District heating plants (1996) *) 30 1 10 2400 140 6Source: "Evaluation of air pollution control and air probation program for Riga"; 1993 09 03;Stockholm Energi AB, Teknik och Miljo*) May -December 1996. Not including TEC I and TEC 2.
The emissions from various sources in the city (and also to a certain extent outside thecity) cause the following concentrations in the city air:
Table 6.2.4.2 Actual concentration and limit values of SO2 and NO 2 in Stockholm andRtiga_ _ _ _ _ _ _ _ _ _ _ _ _ _ _ _ _ _ _ _ _ _ _
i___________ _ 0 |Sulfur dioxide Nitrogen dioxideaverage conc. max. conc. average conc. max. conc.ug/m 3 ug/m 3 Ug/M3 Ug/m3
Riga (actual level) 9,9 177 42,7 162,5Riga (permissible 50 l 500 2) 40 " 85 2)
level) _ _ _ _ _ _ _ _ _ _ _ _ _ _ _ _ _ _ _ _ _ _
Stockholm (actual 5 3) 35 4) 47 3) 110 4)
level)__ _ _ _ _ _ _ _ _ _ _ _ _ _ _ _ _ _ _ _ _ _
Stockholm 50 3) 200 5) 50 3) 110 5(permissible level)EC-standard 40-60 6) 350 5) 50 7 200 8)
Sources: A) Facsimile from "Riga domes vides aiszardzibas parvaldes gaisa monitoringa nodala"dated 1997 11 04; B) "MilUo 2000"- environmental program for the city of Stockholm,Miljoforvaltningen; C) European Community law 380L0779/S dated 1980 08 30 and389L0427/S dated 1989 07 14.I) Daily permissible max. concentration.2) Single permissible max. concentrationThe data from Riga are based on measurements performed 1997 01 15-1997 11 04.3) Average value (permissible and actual) for half a year (winter).4) 98-percentile of 24-hour values measured throughout the latest years (-1995)5) 24-hour limit value (98-percentile)6) Guiding level for yearly average value7) Guiding level of 50-percentile of hourly average values measured throughout a year8) Limit level for 98-percentile of hourly average value
December 21,. 1998 - FVB - g:isida9736O/dafiflIeponri/gaec6.doc

Riga District Heating Rehabilitation Project 7Final Report, Section 6Environmental Impact Review
6.2.5 European standards regarding air emissionsIn table 6.2.5.1 below the EC-standards for S02- and N02-emissions from new plants arepresented.
Table 6.2.5.1 EC-standards for S02 and NO2 emissions
Sulfur dioxide Nitrogen dioxide DustPlant size EC Plant size EC Plant size EC standard
MWI, standard MWh, standard MW mg/Nm3
mg/Nm' mg/Nm3
Liquid fuel 50-300 1700 all 450 all 50300-500 400-1700 ___
500- 400 _Gas fuel all 35,00 all 350 all 5Source: Directive of the EC board 388L0609/S 1988 12 07 and 394L066/S 1994 12 24
Below, these standards are compared with the actual emissions from the plants in Riga.
Table 6.2. 5.2 A poiaeemissions ponthe district heatin , lants in Ri Heating plant Fuel at present Capacity SO2 NO2 Dust
(MW) (mg/Nm3) (mgfNm') (mg/Nm3)TEC-1 gas/heavy fuel oil/peat 1290 -3500" 300-500 35-100hTEC-2 gas/heavy fuel oil 1280 -3500') 300-500 35,00Andrejsala gas/heavy fuel oil 470,00 -3500) 5103),345 ) - 0-3Imanta gas/heavy fuel oil 390,00 -3500') 3104) -
Zasulauks gas/heavy fuel oil 260,00 -3500') 3403)
Daugavgriva heavy fuel oil/wood 56,00 -3500") 3104 )
Ziepniekkalns gas/heavy fuel oil 160,00 -3500") 4514 )-
Vecmilgravis gas 160,00 -3500" ' 1803)1
Source: A inars Ozols and Egon Friss, Riga Siltums1) When heavy fuel oil (2 % S) is burnt. When burning gas the SO2-emissions are negligible.2) One of the boilers in TEC I is sometimes fired with peat, hence the higher dust values. TheEC standards for dust emissions from solid fuel from new plants are however 50 mg/m3.3) Gas was used as fuel when the measurement was carriedout.4) Heavy fuel oil was used as fuel when the measurement was carriedout.
The tables above indicate that the emission of sulfur is higher than the EC standards whenheavy fuel oil is burnt. Though the standards are only valid for newly built plants, they canbe interesting for comparison. The emissions of nitrogen oxides are in general at about thesame level as the standards or lower. Note that the EC standards are monthly averagevalues, whereas the NO2 values in the table below are instantaneous values, that are very
dependent on the load and on the value of excess oxygen for instance. The monthly averagevalues can be both higher and lower than the values given in the table above. Very fewmeasurements regarding dust emissions are carried out and therefore it is difficult to drawany conclusions regarding the dust emissions.
December 21,. 1998 - FVB - g. idai973601drs,fifl r - pon rigwsec6 drc

Riga District Heating Rehabilitation Project 8Final Report, Section 6Environmental Impact Review
6.2.6 Environment and Economy
Latvian Environmental taxes
According to Latvian laws, all plants have to apply for permission to operate from theregional environmental protection committee. Each plant gets individual conditions foroperation including limit values for emissions such as dust, CO, SO2 , NO2 , V2 0 5 and
hydrocarbons. All plants also have to pay tax for these emissions (generally about 10Ls/ton of emission). If the limit value is exceeded, the owner of the plant has to pay fourtimes more for each ton above the limit value.
Table 6.2.6.1 Taxfor various kinds of emissions (Ls/ton)
IType of emission Idust IV205 1S02 INOx ICO ICHX |Ls per ton of emission 3 10 10 10 4,5 10
Source: Law on natural resources tax
The plant Imanta exceeded the limit values of NOx emissions last year, because highamounts of mazut were burnt at the beginning of the year. The limit value was 59,7 tonand the actual value was 69,7 ton.
Table 6.2.6.2 Tax paid for the different plants in 1997Heating plant dust SO2 NOx V2 05 CO HC total
(Ls) (Ls) (Ls) (Ls) (Ls) (Ls) (Ls)
TEC-1 789 11000 4800 6 0 17 17000TEC-2 84 17000 22000 120 0 40 40000Andrejsala 2 290 1100 4 0 54 1500Imanta 42 12200 1000 48 0 36 13000Zasulauks 14,4 3770 210 17 0 13 4000Daugavgriva 7,8 1270 170 5 837 0,7 2300Ziepniekkalns 7,5 2640 810 11 319,5 0 3800Vecmilgravis 0 0 160 0 0 0 160Small boilers 585 2030 800 7 684 0,8 4100Total 1500 50000 31000 220 1800 160 85000Source: Table 6.2.3.2 and table 6.2.6.1
In 1997 Riga Siltums paid slightly more than 28 000 Ls in total in environmental taxes.(Also included are the tax for usage of ground water and the tax for emissions in water.)The tax paid by Latvenergo is also included in the table.
Swedish environmental taxes
It is difficult to evaluate how much the emissions "really" cost the environment. One wayis to compare with Swedish environmental taxes. The thought behind these taxes is to makeflue gas cleaning profitable. For instance, the charge for nitrogen oxide emissions is sohigh that in many cases it makes the installation of SNCR (Selective Non CatalyticReduction) or SCR (Selective Catalytic Reduction) profitable. The payment for NOxemissions is not a tax in general terms. It is a charge that all plant owners have to pay tothe environmental administration, but if your plant emits less than the national averagevalue of NOx emissions, then you receive more money from the administration than youoriginally paid. On the other hand, if your plant emits more than the average value, youreceive less than you paid originally.
December 21,. 1998 - FVB- g: -id 1 973601d-offi al .pm W9-6.d-

Riga District Heating Rehabilitation Project 9Final Report, Section 6Environmental Impact Review
The tax of carbon dioxide is set to a level, which makes combustion of biofuels moreprofitable than combustion of fossil fuels. The carbon dioxide taxes also correspond to thecosts of reducing the CO2 ernissions in the flue gases, for instance through a special kind offilter (report UY 97:150 from Vattenfall Utveckling).
Table 6.2.6.3 Swedish environmental taxes
Type of emission IC02 SNOxLs per ton of emission l 28 1150 3080Source: Swedish Environmental Protection Agency
If Swedish environmental taxes were applied to the emissions that are generated in thedistrict heating system in Riga, the "cost" would be 50 MLs.
Table 6. 2.6. Costs if Swedish taxes were applied in Latvia
Heating plant C02 NO. S02 Total(MLs) (MLs) (MLs) (MLs)
TEC-1 2,7 1,5 1,3 5,5TEC-2 16,8 6,9 1,9 25,6Andrejsala 3,7 0,3 0,03 4,1Imanta 3,6 0,2 1,4 5,3Zasulauks 2,4 0,06 0,4 2,9Daugavgriva 0,6 0,05 0,1 0,8Ziepniekkalns 1,5 0,2 0,3 2,1Vecmilgravis 1,3 0,05 0 1,3Small boilers 2,0 0,25 0,23 2,5Total 34,7 9,6 5,8 50
With higher taxes it is of course easier to make such investments, as flue gascleaning equipment, profitable. Selective non catalytic reduction of NOx in TEC2would, for instance, have a payback time of less than a year. But even withSwedish taxes it wouldn't be profitable to invest in sulfur dioxide cleaningequipment in any of the plants except for Imanta.
This chapter is by no means an attempt to show the necessity of Swedish taxes, they aremerely shown for comparison, because it is difficult to find other methods of comparison.
Assi2ned values for emissions
A third way to estimate the "costs" of environmental impacts is to assign a value (in thiscase in US Dollars per ton) for each emission. In the report "Klaipeda GeothermalDemonstration Project" dated April II, 1996, the World Bank estimated an economicalvalue for each emission.
December 21,, 1998 - FVB - 5:sddoA97360Odrafifinareponl.rigas.t6 doe
Riga District Heating Rehabilitation Project 10Final Report, Section 6Environmental Impact Review
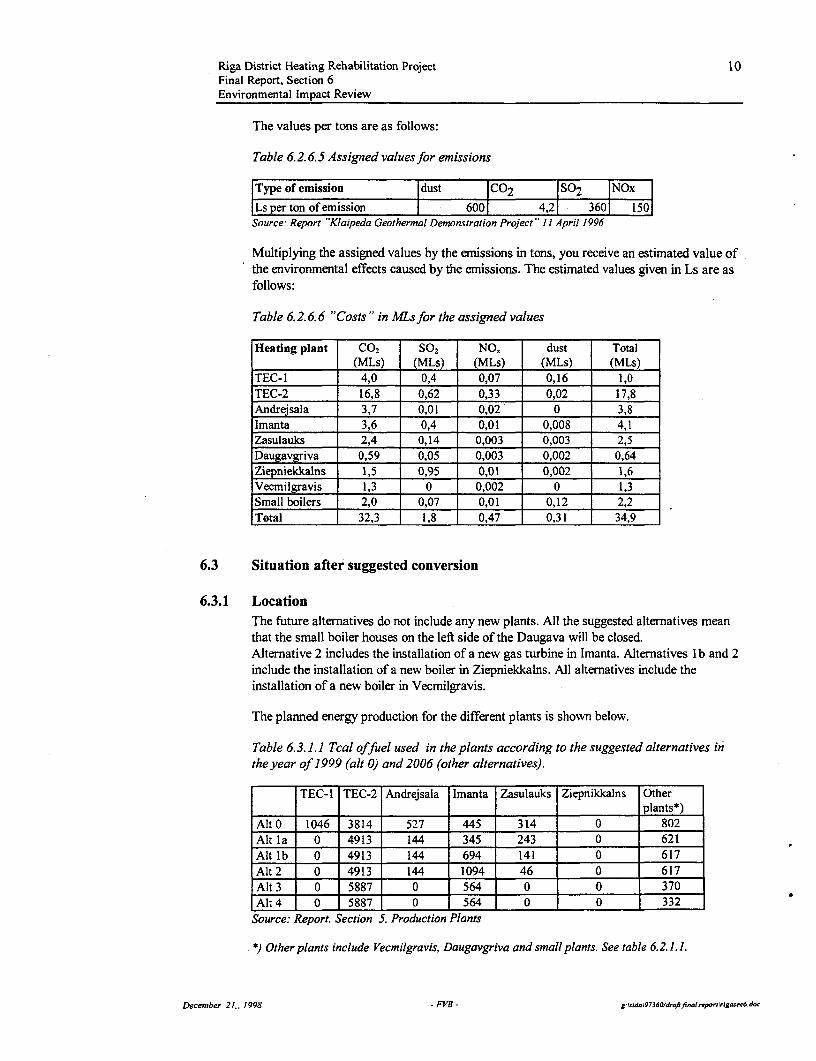
The values per tons are as follows:
Table 6.2.6.5 Assigned values for emissions
|Type of emission Idust lC02 I S02 INOx |Ls per ton of emission | 6001 4,21 3601 150ISource: Report "Klaipeda Geothermal Demonstration Project" II April 1996
Multiplying the assigned values by the emissions in tons, you receive an estimated value ofthe environmental effects caused by the emissions. The estimated values given in Ls are asfollows:
Table 6.2.6.6 "Costs" in MLs for the assigned values
Heating plant CO2 SO2 NO, dust Total(MLs) (MLs) (MLs) (MLs) (MLs)
TEC-1 4,0 0,4 0,07 0,16 1,0TEC-2 16,8 0,62 0,33 0,02 17,8Andrejsala 3,7 0,01 0,02 0 3,8Imanta 3,6 0,4 0,01 0,008 4,1Zasulauks 2,4 0,14 0,003 0,003 2,5Daugavgriva 0,59 0,05 0,003 0,002 0,64Ziepniekkalns 1,5 0,95 0,01 0,002 1,6Vecmilgravis 1,3 0 0,002 0 1,3Small boilers 2,0 0,07 0,01 0,12 2,2Total 32,3 1,8 0,47 0,31 34,9
6.3 Situation after suggested conversion
6.3.1 LocationThe future alternatives do not include any new plants. All the suggested altematives meanthat the small boiler houses on the left side of the Daugava will be closed.Alternative 2 includes the installation of a new gas turbine in Imanta. Alternatives lb and 2include the installation of a new boiler in Ziepniekkalns. All alternatives include theinstallation of a new boiler in Vecmilgravis.
The planned energy production for the different plants is shown below.
Table 6.3.1. 1 Tcal offuel used in the plants according to the suggested alternatives inthe year of 1999 (alt 0) and 2006 (other alternatives).
TEC-1 TEC-2 Andrejsala Imanta Zasulauks Ziepnikkalns Other_______ ___________ ______________ ~~plants*)
Alt O 1046 3814 527 445 314 0 802Alt Ia 0 4913 144 345 243 0 621Alt lb 0 4913 144 694 141 0 617Alt 2 0 4913 144 1094 46 0 617Alt 3 0 5887 0 564 0 0 370Alt 4 0 5887 0 564 0 0 332
Source: Report. Section 5. Production Plants
.*) Other plants include Vecmilgravis, Daugavgriva and small plants. See table 6.2.1.1.
December 21,. t998 - FVB - g:Wdu973601d,.fifna1reponig--6-d-
Riga District Heating Rehabilitation Project 11Final Report, Section 6Environmental Impact Review
6.3.2 FuelsThe mix of fuels used in the future will probably be about the same that is used today.
6.3.3 EmissionsEmissions to air
In the diagrams below the estimated emissions of CO2, SO2 and NOx for the differentfuture alternatives are shown.
Alternative 2 involves the installation of a power producing turbine in Imanta with anelectricity production of 295 GWh (in the year of 2006). Alternatives 3 and 4 include ahigher electricity production in the Latvenergo owned plant TEC 2 (298 GWh in the year2006). Since - in all these cases -heat and electricity are producedsimultaneously, this isbeneficial for the environment. Even though the emissions in the city of Riga will beslightly higher, it will mean lower emissions totally, since otherwise the electricity has to beproduced somewhere else. In the diagrams below this amount of electricity is included aslight blue columns. These columns are calculated as if the electricity (in alternatives 0, 1 aand I b) is produced in coal- fired power plants (with no simultaneous production of heat).Of course, this might not always be the case. However, coal- fired power plants are oftenused as an example of power production technique used on the margin. The blue columnsin the diagrams below show the estimated emissions of such production. It is important tostress that these figures are only estimated values. Naturally, emissions from coal fuelledpower plants vary from plant to plant.
The suggested measures to reduce heat losses in substations and network and to increasethe boiler efficiency of the plants (alternatives I - 4) will also have a positive impact on theenvironment.
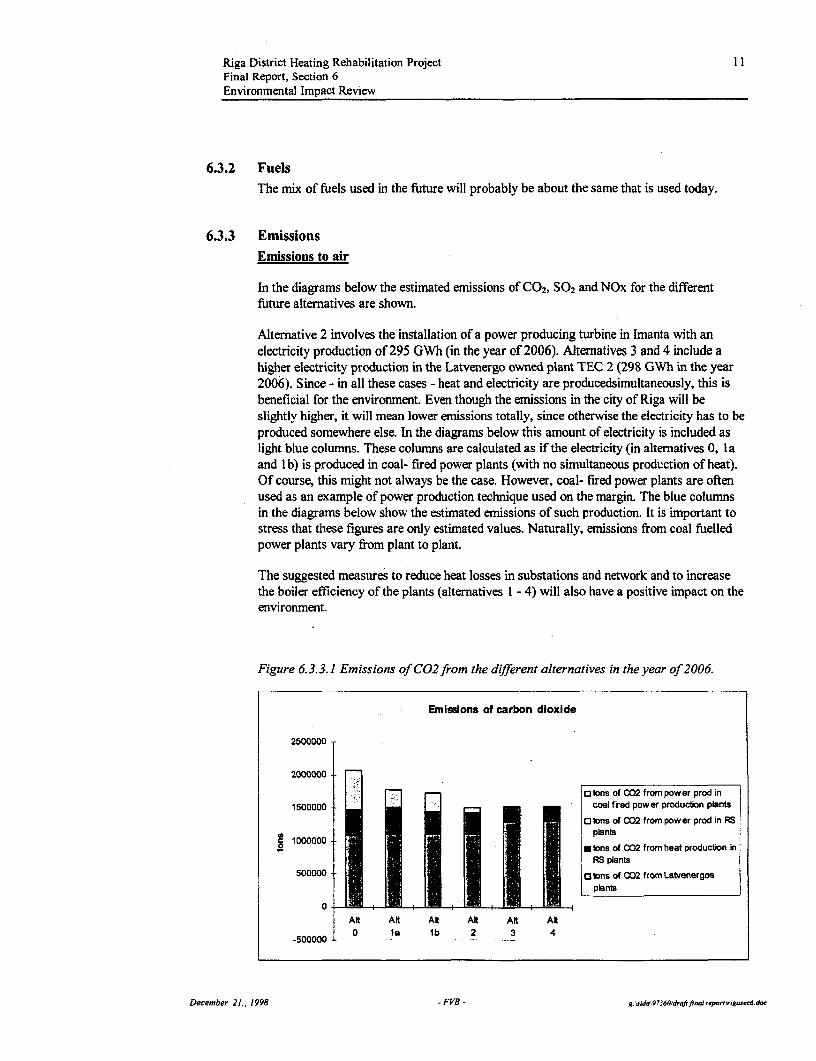
Figure 6.3.3.1 Emissions of C02 from the different alternatives in the year of2006.
Emissions of carbon dioxide
2500000
2000000
: otons of C02 f rom pow er prod in1500000 coal fired power production plants
D tons of 002 frompower prod in RS
g 1000000- plants* tons of 002 from heat production in
RS planta500000 -- g3 tons of C02 from Latvenergos
plants
ARt Aft At Aft Alt Ak500000 0 1. lb 2 3 4
December 21., 1998 -FVB - g. Ijdak973601doratfia1,epor0 gw6-do

Riga District Heating Rehabilitation Project 12Final Report, Section 6Environmental Impact Review
Regarding the emissions of carbon dioxide, alternatives 2, 3 and 4 are the most beneficial.With the same procedure of estimation, the current carbon dioxide ernissions amounts to2,66 million tons per year. Hence, alternative 3 with emissions of 1,52 million tons peryear implies a possible armual reduction of 1,14 million tons of carbon dioxide for therehabilitation project.
Figure 6. 3.3.2 Emissions of S02 for the different alternatives in the year 2006
mnissions of sulfur dioxide
12000 -
10000
6000 ; o a ton f SOx from power prod icoaJ fired power production plants
6000 - .3 torns of SOx from pow er prod in RSplixts
8 _ 4W0** c - - | | tons of SOx from heat production inFS plants
2000 13 l l l l 3tons of SOx from Latvenergos
0AnfO Al la Atl1b Ant2 Al3 Al4
-200
The emissions of sulfur dioxide are the lowest in alternative 2. This is due to the fact thatthe electricity producing unit in Imanta (suggested only in alternative 2) is fuelled by gas,which generates insignificant emissions of sulfur dioxide.
Figure 6.3.3.3
Emnissons of nitrogen oxides
7000
6000
5000 - O3 tons of N'x from power prod incoal fired power producton plants
4000 - C] tons of NOx from power prod in RS
3000 -plat0 *tons of NOx from heat production in
2000 RS plantsK Ktons of NOx from Latvenergos
1000 plants
0Al 0 Alt a AN lb AR 2 AR 3 AR4
-1000 -
Judging from the emissions of Nox, alternative 2 is the most beneficial. The higher nitrogenoxide emissions in alternative 3 and alternative 4 might be explained by the fact that theNOx emissions reported from the plants owned by Rigas Siltums are surprisingly low -even lower than the estimated NOx emissions from the brand new gas turbine in Imanta. Inthe latter alternatives, Latvenergo plant TEC 2 (with reported NOx values that areconsiderably higher than in Rigas Siltums plants) is used to a higher extent and therefore
December 21) 1998 - FVB - g:idk973601dr,, fi..) eponrrigw-6 dd

Riga District Heating Rehabilitation Project 13Final Report, Section 6Environmental Impact Review
the nitrogen oxide emissions are slightly higher in these alternatives.
Table 6.3.3.1 Emissions of dust, hydrocarbons, carbon monoxide and vanadiumpentoxide in the year of 2006 for the different future alternatives.
Alt_ Alt Ia Alt lb Alt2 Alt3 Alt4
dust 767 282 256 95 109 112HC 17 13 14 11 13 13V205 27 31 31 28 33 33CO 671 671 373 373 316 344
The emissions of dust, HC, CO and V205 will be reduced in the future alternatives due tothe simultaneous production of heat and electricity as well as due to the suggestedmeasures to reduce heat losses in substations and network.
Emissions to water
The suggested measures will not considerably impact on the emissions to water.
Waste, ash and asbestos
No change of the waste handling is suggested in any of the alternatives.
Regarding ash, there will be no significant change from the current situation.
All future alternatives include modification of the distribution network and the central andindividual supply points. This process will include removal of asbestos from old insulationmaterials in pipes and boilers.
According to EC standards countries that are members of the EC are obliged to takenecessary actions to prevent asbestos fibers and asbestos dust from being released to theair.
When plants or buildings that contain asbestos are torn down or if material that containsasbestos is being transported, this shall be done without causing any significant pollutionof the environment. Therefore, a working plan for the activities should be established.
Waste that contains asbestos must be deposited at an approved landfill.
Regarding the handling of asbestos we suggest the following:
D the parties involved should - if required by the Latvian legislation - apply forpermission from responsible authority
> a working plan should be established, which should contain description of workingmethod
> handling and safety instructions should be worked out and be easily accessible at theworking site
> all the workers involved should get proper training which should include informationabout the characteristics of asbestos, information about the necessary safety measures,information on demolition techniques and practical exercises.
December 21., 1998 - FVB - g.isida197360ld,.Jffiraierporigraec6.do

Riga District Heating Rehabilitation Project 14Final Report, Section 6Environmental Impact Review
>) it is important that the training is adapted to the actual working conditions
D the demolition should be done in a way so that asbestos fibers and dust are preventedfrom being released to the air; if necessary the packing which prevents asbestos dustfrom being released must be used
D asbestos waste and packing, which contains asbestos, should immediately be takencare of and be stored in a closed container until it is deposited at an approved landfill
> the working site should be shielded and the pressure should be below that of theatmosphere so that the spreading of dust is prevented
> smoking should be avoided during the work
> all the workers should have tight fitting protection clothes with headgear and breathingmasks
> the protections clothes should be made out of a dust repellent material and be withoutpockets
> the protection clothes and breathing masks should be cleaned after each working period
> before the breathing mask is taken off, the protection clothes should be vacuumcleaned in a special room
shower and washbasin should be easily accessible during the work
after the demolition is finished the working site should be cleaned; dust should bevacuum cleaned or washed away, compressed air blowing or dry sweeping should beprevented
transportation of asbestos material should be done in a way so that no dust or fibersare released to the atmosphere
As substitute material for asbestos we recommend the following:
Boilers
The boilers should be made airtight with refractory and covered with mineral wool, whichshould be covered by steel jackets.
Pipes
For underground pipes we recommend insulation of mineral cotton/glass fiber wool withthe protection by galvanized steel plates or tar paper. For pipes above ground,polyurethane is the best -known substitute material. For more information see chapter 4.3.
Noise, dust and odor
During the implementation of the suggestedimprovements, there will probably be somenoise on the working sites and in the neighborhood due to heavy vehicles and excavators.
December 21.. 1998 - FVB - g:Asidal9736o0daftfincoI,ponrigac5ecA6do

Riga District Heating Rehabilitation Project 15Final Report, Section 6Environmental Impact Review
6.3.4 Air quality in RigaIt is difficult to say anything about how the suggested measures will influence the airquality in the city. Probably, the reduction of emissions from the district heating plants willbe counteracted by increased emissions from the traffic and maybe also from the industry.
A likely scenario is that the content of SO, in the air will be lower in the future - due tolower emission from heating plants and industries - and that the content of NOx will behigher - due to the increasing traffic.
6.3.5 Environment and economyThe economical evaluations below are attempts to compare the "cost" of each alternativefor the environment. In the calculations below the ernissions from the heat and electricityproduction in Rigas Silturns and Latvenergo plants are included. Alternatives 0, 1 a and lbinclude lower electricity production than the other alternatives. In these cases the sameamount of electricity has to be produced somewhere else (outside the city of Riga). In thecalculations the emissions from the above- mentioned electricity (the excess electricityproduced in altematives 2,3 and 4) is also included. The calculations are based on theassumption that this electricity is produced in coal fuelled power production plant with nosimultaneous production of heat. (See chapter 6.3.3.)
Latvian environmental taxes
The Latvian enviromnental taxes are one way to estimate the environmental cost for thedifferent altematives:
Table 6.3.5.1 Latvian taxesfor various kinds of emissions (Ls/ton)
|Ty`pe of emission |dust I V I S2 NOx CO CHx Ls pertonofemission 1 31 10| 10| 10| 4,51 10|Source: Law on natural resource tax
When these values are multiplied by the emissions generated in each alternative, thefollowing "costs" are achieved:Table 6.3.5.2 Estimated environmental costs (Ls) in the year of 2006, based on Latviantaxes.
so2 NOx dust HC V2O5 CO TotalAlt 0 116000 61000 2300 200 300 3000 182000Alt la 79000 53000 900 100 300 3000 136000Alt lb 80000 52000 800 100 300 1700 135000Alt 2 45000 44000 300 100 300 1700 91000Alt3 54000 50000 300 100 300 1400 110000Alt 4 54000 50000 300 100 300 1500 110000
Using the Latvian taxes as a normn, alternative 2 is the most beneficial for the environment.This is due to the favorable environmental data of the new gas turbine in Imanta, suggestedin this altemative. However, alternative 3 and altemative 4 cause only slightly higheremissions.
December 21,, 1998 - FVB - g ,id.19736O/dr.ofit d"por.Irigo.e6doc

Riga District Heating Rehabilitation Project 16Final Report, Section 6Environmental Impact Review
Swedish environmental taxes
Another way to estimate the environmental costs is to use Swedish taxes:
Table 6.3.5.3 Swedish environmental taxes|Type of emission I C02I SO2l NOx|
|Lspertonofemission | 281 1150I 30801Source: Swedish Environmental Protection Agency
When these values are multiplied by the emissions generated in each alternative, thefollowing "costs" are achieved:
Table 6. 3.5.4 Estimated environmental costs (MLs) in the year of 2006, based onSwedish taxes.
C0 2 So2 NOx TotalAlt 0 58 13 19 90Altla 50 9 16 75Alt lb 48 9 16 74Alt 2 42 5 13 61Alt 3 43 6 15 64Alt 4 43 6 15 64
Using the Swedish taxes as a norm, alternative 2 is the most beneficial for the environment.This is due to the favorable environmental data of the new gas turbine in Imanta, suggestedin this alternative. However, alternative 3 and alternative 4 cause only slightly higherermissions.
Assigned values for emissions
A third way to evaluate the alternatives is to assign a value (in this case in US Dollars perton) for each emission. In the report "Klaipeda Geothermal Dernonstration Project" datedApril I 1, 1996, the World Bank estimated an economical value for each emission:
Table 6.3.5.5 Assigned values for emissions
Type of emission Idust IC02 IS02 INOX ILs per ton of emission 6001 4,21 3601 150Source: Report "Klaipeda Geothermal Demonstration Project" 11 April 1996
If these values were applied, each alternative would have the following environmental"cost" (in the reference year of 2006):
Table 6.3.5.6 Environmental "costs "for the different alternatives( in the year of 2006)if the assigned values are used. (ALs).
_CO 2 SO2 NOx dust TotalAltO0 9 4 1 0 14Alt Ia 7 3 1 0 11Alt lb 7 3 1 0 1 1Alt2 6 2 1 0 9Alt3 6 2 1 0 9Alt4 6 2 1 0 9
December 21,, 1998 -FVB - g.WridW97360/drajtfiAM1IW,or:n'9=6.doc

Riga District Heating Rehabilitation Project 1 7Final Report, Section 6Environmental Impact Review
When evaluating the alternatives using these assigned values, alternatives 2, 3 and 4 arethe most beneficial for the environment, due to the cogeneration of heat and electricity.
6.4 Summary
The suggested future alternatives will generate the following amounts of emissions:
Table 6.4.1 Estimated emissions (tons) for future alternatives
Alt 0 Alt la Alt lb Alt 2 Alt 3 Alt 4CO2 2070000 1780000 1730000 1510000 1520000 1530000so2 11600 7920 7970 4460 5370 5390NOx 6050 5250 5210 4380 4960 4970
dust 767 282 256 95 109 112HC 17 13 14 11 13 13V 205 27 31 31 28 33 33CO 671 671 373 373 316 344
All the suggested future alternatives (alternatives 1-4) are beneficial from an environmentalpoint of view compared to the situation without a project (alternative 0). Alternative 2generates the least emissions (slightly less than alternative 3 and alternative 4). If theemissions are related to the utilities (amounts of energy) produced, the following result isachieved:
Table 6. 4.2 Estimated emissions in g/Gcal produced energyfor future alternativesAlt 0 Alt la Alt lb Alt 2 Alt 3 Alt 4
CO2 330000 311000 311000 272000 272000 273000SO2 1860 1380 1440 803 961 964NOx 968 915 937 787 888 889dust 123 49 46 17 19 20HC 3 2 3 2 2 2V205 4 5 6 5 6 6CO 107 117 67 67 57 62
Judging from the tables above, the diagrams in chapter 6.3.3 and the tables in chapter6.3.5, alternative 2 is the most beneficial from environmental point of view. This is due tothe favorable environmental data of the new gas turbine in Imanta, suggested in thisalternative. However, alternatives 3 and 4 cause only slightly higher emissions.In alternatives 2, 3 and 4 electricity is produced simultaneously with heat. This isbeneficial for the environment since this amount of electricity would otherwise have to beproduced somewhere else, most likely with a higher environmental impact.
The suggested measures to reduce heat losses in substations and network and to increasethe boiler efficiency of the plants will also have a positive impact on the environment.
The suggested measures (altematives 2-4) will lead to a reduction of the CO2 emissions in2006 by almost 15 %, the NOx emissions by slightly more than 15 % and the S02
emissions by more than 50 %. compared to no rehabilitation project.
Compared to the current situation, carbon dioxide emissions will be reduced by 43 % or1,1 million tons per year.
December 21., 1998 FVB - g:Lido973601da/ifireponlolgosc6doc
Related Documents