FINAL REPORT Review of Ambient Groundwater Quality Monitoring Networks in the Okanagan Kootenay Region Submitted to: Prepared by: BC Ministry of Forests, Lands and Natural Resource Operations Western Water Associates Ltd. 109 Industrial Place Unit 32 - 10051 Highway 97 Penticton, British Columbia Lake Country, British Columbia V2A 7C8 V4V 1P6 March 31, 2011

Welcome message from author
This document is posted to help you gain knowledge. Please leave a comment to let me know what you think about it! Share it to your friends and learn new things together.
Transcript
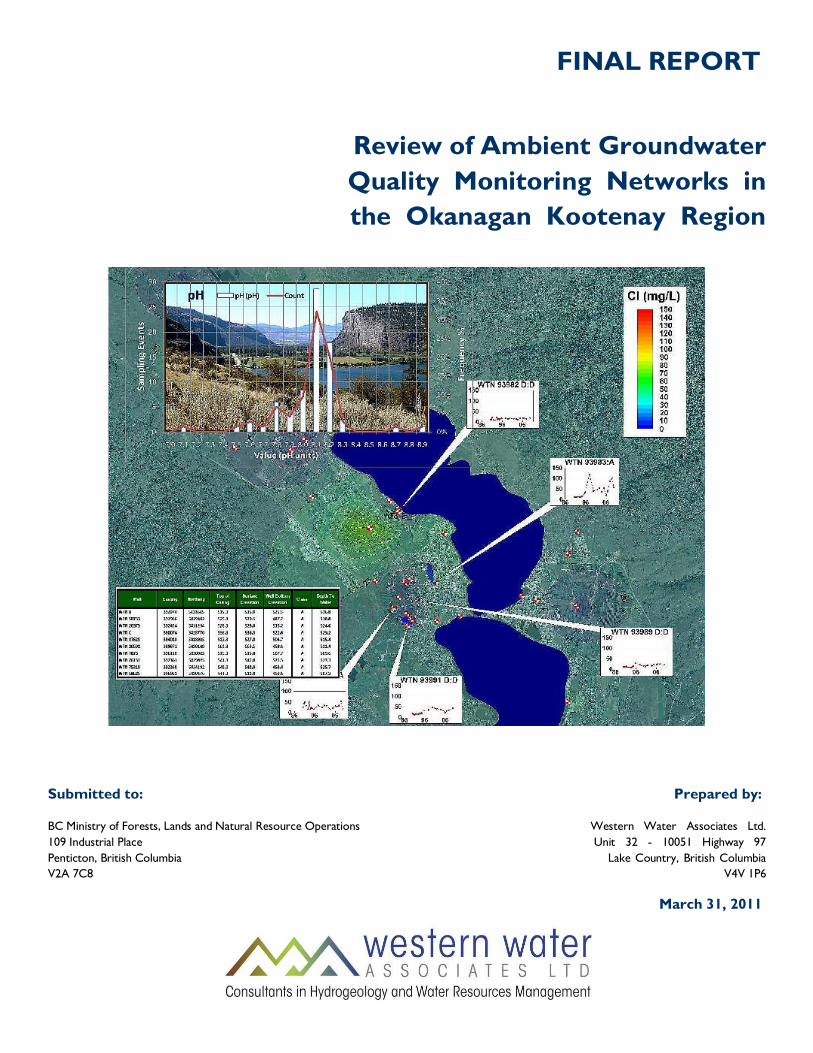
FINAL REPORT
Review of Ambient Groundwater
Quality Monitoring Networks in
the Okanagan Kootenay Region
Submitted to: Prepared by:
BC Ministry of Forests, Lands and Natural Resource Operations Western Water Associates Ltd.
109 Industrial Place Unit 32 - 10051 Highway 97
Penticton, British Columbia Lake Country, British Columbia
V2A 7C8 V4V 1P6
March 31, 2011

| Unit 32 – 10051 Highway 97, Lake Country, BC, V4V1P6 | 1.250.766.1030 | www.westernwater.ca |
EXECUTIVE SUMMARY
Western Water Associates Ltd. is pleased to present this report which summarizes the results of a
technical review of ambient groundwater quality monitoring networks maintained by the BC Ministry of
Forests, Lands and Natural Resource Operations [MNRO] in the Okanagan/Kootenay Region. This
work was completed under Contract CPNEN11021, which was issued by the Penticton Regional Office
of MNRO.
Objectives of this Assignment
The primary objective of this assignment included the analysis of groundwater chemistry data for
ambient networks located in Grand Forks, Osoyoos, Oliver and Eagle Rock, with a view to providing
recommendations for any modification to the networks, if deemed necessary. The secondary objective
of this assignment was to enhance the ability of MNRO staff to interpret data and to have the capability
to present findings to colleagues as well as the general public. The software and training delivered as
part of this assignment represent a tool not only for the assessment of historical data for each network,
but can also be used to continually update and analyze information at each site, plus analyze data from
other sites.
The Ambient Water Quality Monitoring [AWQM] networks in the Interior of British Columbia were
established in the mid-1980s in several important aquifers including Grand Forks [MNRO Aquifer 158],
Osoyoos [MNRO Aquifer 193/194], Oliver [MNRO Aquifer 254/255] and Eagle Rock [MNRO Aquifer
353]. The objectives of these ambient networks are to characterize water chemistry of the aquifer,
identify any parameter that exceeds health standards, or is trending in a direction that would impact
human or ecosystem health, and help raise awareness about the linkage between adverse land-use
practices and water quality. The AWQM networks utilize public and/or private water wells in a given
aquifer. The private wells are usually active water supply wells, whereas some of the monitoring
networks have dedicated Provincially-owned monitoring wells.
Scope of Work Summary
To accomplish the main objectives, the scope of work for this project was briefly, as follows:
Review and summarize water quality and geological information relevant to each aquifer that
hosts one of the monitoring well networks
Establish a database of water quality and lithology information for each aquifer and monitoring
well network in an excel spreadsheet format that was usable by a software package that was

| Unit 32 – 10051 Highway 97, Lake Country, BC, V4V1P6 | 1.250.766.1030 | www.westernwater.ca |
selected specifically for the analysis of the data. Three working copies of the software and
training on use of the software was included in the scope of work.
Generate location maps, cross-sections and contour maps of geology, water levels and
chemistry for each of the aquifers, specifically in the areas where the ambient networks are
focused
Analyze chemistry data for each of the ambient networks through the use of maps and plots
showing visual identification of spatial trends and anomalies for each of the key chemical
parameters included in the water quality data provided by MNRO.
Compare water quality data against the Guidelines for Canadian Drinking Water Quality
[GCDWQ] as well as to background [ambient] conditions for each aquifer. It was also necessary
to analyze the water quality data using statistical methods to identify outliers [anomalous data].
Prepare a report summarizing the methodology utilized and findings of the analysis, along with
recommendations on how each network could possibly be improved.
Summary of Study Results
The methodology utilized for this assignment, which combines statistical analysis with the plotting of
data in a spatial and temporal format, is very effective in identifying outliers, data gaps and trends in
water quality data.
The degree of effort required to translate tables from the current spreadsheets used by MNRO into
spreadsheets that are efficient for identification of statistical values and comparison against GCDWQ is
considerable. Although this work was completed with macros, it is not a user-friendly process. The
QA/QC process is also very detailed and not easily followed.
A comparison between the effectiveness of statistical methods for data validation and QA/QC, as
opposed to visual methods utilizing the EnviroInsite© software, suggests the software is capable of
identifying outliers as effectively as the statistical methods. The EnviroInsite© software represents a
significant step-forward for MNRO staff, which enables the continual updating of any water quality
database which is stored in MS Excel or MS Access and the ability to complete regular analysis of both
spatial and temporal trends.
In conclusion, we believe that the EnviroInsite© software is capable of visually identifying outliers and
therefore, more rigorous QA/QC of data is not warranted. However, should such additional QA/QC
be required, it is recommended that commercial software for statistical analysis of water quality data be

| Unit 32 – 10051 Highway 97, Lake Country, BC, V4V1P6 | 1.250.766.1030 | www.westernwater.ca |
utilized. The EnviroInsite© software has been designed to work with a statistical package called EQUIS©,
but there are other software packages available that will do the statistical analysis appropriately.
More specific conclusions and recommendations are provided in bullet form as follows:
C1 With the exception of Eagle Rock, all of the AWQM networks have been relatively successful in
documenting baseline water quality conditions and identifying trends in parameters of interest
related to the land use and aquifer setting.
C2 There are an insufficient number of sampling events and sampling locations available for the Eagle
Rock AWQM Network to allow for appropriate spatial and temporal analysis.
C3 All AWQM networks have issues relating to consistency of parameters included for testing, with
the frequency and regularity of sampling and with the application of consistent field methods for
the collection of samples.
C4 Eagle Rock does not have appropriate up-gradient [background] sampling locations, or
appropriate spatial coverage to the north, east and south of existing network footprint area.
C5 Grand Forks has at least two modes for background concentrations for many parameters; the
source water from the Grandby River Watershed influencing background concentrations in the
north of the aquifer and the source water from the Kettle River Watershed influencing
concentrations at the southwest corner of the aquifer.
C6 The majority of sampling completed to date has been for total metals analysis, for comparison
against acceptable concentrations and aesthetic objectives outlined in the GCDWQ. Sample
results indicate a significant number of outliers for total metal concentrations for, among others,
arsenic [As], iron [Fe], manganese [Mn] and uranium [U]. Total metals analysis for metals such as
these can be significantly influenced by field sampling methods which do not remove turbidity.
C7 Within the Eagle Rock AWQM Network, WTN 38720 [Larkin Well #4] has significantly different
chemistry than the other wells monitored in the network. In consideration of the up-gradient
position of this well in comparison to the others, the chemistry infers the water quality in this
area of the aquifer has been impacted.
C8 Within the Oliver AWQM Network, WTN 82376 has significantly higher NO3 levels than other
wells in the area. There is a localized source of nitrogen in this area that influences NO3, NO2
and NH4 levels. This is likely related to agricultural activity in the area. In general NO3 levels are

| Unit 32 – 10051 Highway 97, Lake Country, BC, V4V1P6 | 1.250.766.1030 | www.westernwater.ca |
decreasing in the area, possibly due to more awareness of sustainable application of fertilizers.
SO4 levels are also decreasing. There is also an upward trend in potassium [K], which could also
be related to NPK (Nitrate, Phosphate, Potassium) type fertilizers.
C9 Elevated Uranium [U] also exists in the Oliver Network in wells to the southeast of Tugulnuit
Lake. The variability in results suggests these levels could be associated with higher turbidity,
which needs to be confirmed.
C10 Within the Osoyoos AWQM Network, there are elevated NO3 levels to the north of the Town
and along the highway, specifically in the immediate area of WTN 14402. There are also isolated
areas where chloride [Cl] is elevated above background levels but still significantly lower than
GCDWQ. These areas are believed to be where on-site sewage disposal is utilized.
C11 Within the Grand Forks AWQM Network, there are at least 2 areas where NO3 [nitrate] levels
are elevated. These include the north end of the aquifer in the area of WTN 35526 and in the
south east in the area of WTN 59171, WTN 37623, WTN 7990 and WTN 7873. These same
areas also have elevated potassium [K]. Elevated levels of both NO3 and K could be related to
fertilizer application. Nitrate levels are however are gradually decreasing in the aquifer.
C12 Point source contamination is suggested in the area of Boundary Hospital, due to elevated levels
for Cl, NO3, SO4 and specific conductance.
C13 Point source contamination is also suggested in the area of the large industrial complex in the area
of 2nd Street and 65th Avenue. There are trends in the nearby monitoring well, WTN 59167, of
decreasing pH and increasing iron [Fe] and sodium [Na].
Based on the above conclusions, the following recommendations are provided:
R1 All AWQM networks should be more regularly sampled and the suite of parameters included
should continue to include total metals for comparison against historical results and GCDWQ.
However, the suite of parameters should be expanded to include major cations/anions, such that a
charge balance check can be completed. Turbidity should also be included to identify where total
metals results are potentially impacted by sediment in samples. Consideration should also be given
to testing for dissolved metals, not as a replacement for total metals, but to compliment the total
metals results and identify where the results for total metals analysis may be mis-leading.
R2 Standard protocols for field sampling and data validation should be implemented for the
preservation of data quality. This includes more prescriptive sampling methods and QA/QC
checking of data immediately after entering results in the EMS database, such that issues can be
identified and the samples re-tested in the lab before disposal.
| Unit 32 – 10051 Highway 97, Lake Country, BC, V4V1P6 | 1.250.766.1030 | www.westernwater.ca |
R3 At least 2 of the 4 closely clustered wells in the Eagle Rock AWQM Network could be removed
from the monitoring schedule in lieu of the establishment of two additional monitoring locations
to the north in the same aquifer.
R4 There are available wells at the south end of the Eagle Rock Aquifer that could be used for
monitoring.
R5 The Oliver AWQM Network is functioning appropriately. If anything, more regular monitoring is
prudent in WTN 53199, which is within the source area of recharge from the Park Rill
Watershed. The Park Rill Watershed has considerable agricultural activity.
R6 Additional, more frequent and comprehensive monitoring is warranted in the Oliver Area within
WTN 21867 to identify the source of nitrate in this area.
R7 For the Osoyoos AWQM Network, consideration should be given to removing some of the
nested monitoring well locations from the monitoring schedule. There does not appear to be
significant differences in chemistry results between the aquifer depths sampled. In lieu of the
second sampling depth at each nested monitoring well, there could be additional wells sampled on
the east side of the lake and on the west side to the north.
R8 Additional, more frequent and comprehensive monitoring is warranted in the Osoyoos Area
within WTN 14402 and in nearby wells to identify the source of nitrate in this area.
R9 For the Grand Forks AWQM Network, consideration should be given to removing some of the
nested monitoring well locations from the monitoring schedule. There does not appear to be
significant differences in chemistry results between the aquifer depths sampled. In lieu of the
second sampling depth at each nested monitoring well, there could be additional wells sampled at
the extreme north end of the aquifer to better document the water quality coming from the
north, or at the east end of the aquifer to have better spatial coverage down-gradient of the
industrial and agricultural activities in this area.
R10 In Grand Forks, the type and fate of the waste stream at Boundary Hospital needs to be verified
and, if it is determined that part of the waste stream is disposed of to ground, this activity should
be stopped.
R11 The identification of spatial and temporal trends at these AWQM network sites in relation to land
use as well as an understanding of the hydrogeology in the area, requires a knowledgeable
hydrogeologist in the role as the final QA/QC step. This will greatly assist in the identification of
field or laboratory errors that may have otherwise gone unnoticed, and will provide for the best
chance to understand the meaning of the reported results.

31 March 2011 i
MNRO Ambient Network Review 11-004
| Unit 32 – 10051 Highway 97, Lake Country, BC, V4V1P6 | 1.250.766.1030 | www.westernwater.ca |
TABLE OF CONTENTS
OBJECTIVES OF THIS ASSIGNMENT............................................................................................................................................I
SCOPE OF WORK SUMMARY .....................................................................................................................................................I
SUMMARY OF STUDY RESULTS .................................................................................................................................................II
1. INTRODUCTION .................................................................................................................................................. 1
2. BACKGROUND...................................................................................................................................................... 2
3. SCOPE OF WORK................................................................................................................................................. 6
4. REVIEW OF NETWORK AREAS AND AQUIFERS............................................................................. 8
4.1 EAGLE ROCK ......................................................................................................................................................... 8
4.2 OLIVER ................................................................................................................................................................... 9
4.3 OSOYOOS ...........................................................................................................................................................11
4.4 GRAND FORKS ...................................................................................................................................................13
5. METHODOLOGY................................................................................................................................................16
6. REVIEW OF DATA INPUT REQUIREMENTS FOR ENVIROINSITE© .........................................18
7. WATER QUALITY DATA ASSESSMENT..............................................................................................20
7.1 DATA INPUT VALIDATION ................................................................................................................................20
7.2 STATISTICAL ANALYSIS AND IDENTIFICATION OF OUTLIERS .......................................................................21
7.3 COMPARISON AGAINST GCDWQ.................................................................................................................24
7.4 TRIAL SPATIAL PLOTS FOR IDENTIFICATION OF TEMPORAL OUTLIERS.......................................................25
7.5 DATA TRANSFORMATION.................................................................................................................................26
7.6 QUALITY ASSURANCE / QUALITY CONTROL [QA/QC].............................................................................26
8. SOFTWARE TRAINING ..................................................................................................................................28
9. AMBIENT NETWORK ANALYSIS.............................................................................................................29
9.1 EAGLE ROCK .......................................................................................................................................................30
9.2 OLIVER .................................................................................................................................................................32
9.3 OSOYOOS ...........................................................................................................................................................34
9.4 GRAND FORKS ...................................................................................................................................................35
10. CONCLUSIONS AND RECOMMENDATIONS .............................................................................38
11. LIMITATIONS AND USE OF THIS REPORT ..................................................................................42
12. CLOSURE............................................................................................................................................................43
31 March 2011 ii
MNRO Ambient Network Review 11-004
| Unit 32 – 10051 Highway 97, Lake Country, BC, V4V1P6 | 1.250.766.1030 | www.westernwater.ca |
List of Figures
Figure 1 Location of AWQM Networks Addressed in this Study
Figure 2 Map of the Eagle Rock Aquifer
Figure 3 Land Use in the Area of Eagle Rock Aquifer
Figure 4 Geological X-Section Through the Eagle Rock Aquifer
Figure 5 Piper Plot of Chemistry in the Eagle Rock Aquifer
Figure 6 Map of the Oliver Aquifer
Figure 7 Land Use in the Area the Oliver Aquifer
Figure 8 Geological X-Section Through the Oliver Aquifer
Figure 9 Piper Plot of Chemistry in the Oliver Aquifer
Figure 10 Map of the Osoyoos Aquifer
Figure 11 Land Use in the Area of the Osoyoos Aquifer
Figure 12 Geological X-Section Through the Osoyoos Aquifer
Figure 13 Piper Plot of Chemistry in the Osoyoos Aquifer
Figure 14 Map of the Grand Forks Aquifer
Figure 15 Land Use in the Area of the Grand Forks Aquifer
Figure 16 Geological X-Section Through the Grand Forks Aquifer
Figure 17 Piper Plot of Chemistry in the Grand Forks Aquifer
Figure 18 Process Flow Diagram
Figure 19 EnviroInsite Database Schema
Figure 20 Example Plot of Visual Outlier in Eagle Rock
Figure 21 Example Plot of Visual Outlier in Oliver
Figure 22 Example Plot of Visual Outlier in Osoyoos
Figure 23 Example Plot of Visual Outlier in Grand Forks

31 March 2011 iii
MNRO Ambient Network Review 11-004
| Unit 32 – 10051 Highway 97, Lake Country, BC, V4V1P6 | 1.250.766.1030 | www.westernwater.ca |
List of Tables
Table 1 Summary of Statistics for All Sites [uncensored]
Table 2 Water Quality Statistics Summary for Eagle Rock [uncensored]
Table 3 Water Quality Statistics Summary for Oliver [uncensored]
Table 4 Water Quality Statistics Summary for Osoyoos [uncensored]
Table 5 Water Quality Statistics Summary for Grand Forks [uncensored]
Table 6 Summary Exceedences with GCDWQ [uncensored]
Table 7 Summary of Transformed Data
Table 8 Template Network Evaluation Table
Table 9 Summary of Trends in Water Quality in Networks
Table 10 Network Evaluation Table Eagle Rock
Table 11 Network Evaluation Table Oliver
Table 12 Network Evaluation Table Osoyoos
Table 13 Network Evaluation Table Grand Forks
List of Appendices
Appendix A Summary of wells used in this study
Appendix B Meta data plus QA/QC notes, etc
Appendix C Final EI input files [limited part of observation file]
Appendix D Printouts of spatial/temporal for Eagle Rock
Appendix E Printouts of spatial/temporal for Oliver
Appendix F Printouts of spatial/temporal for Osoyoos
Appendix G Printouts of spatial/temporal for Grand Forks
Appendix H Disk sleeve and disk contents summary

31 March 2011 1
MNRO Ambient Network Review 11-004
| Unit 32 – 10051 Highway 97, Lake Country, BC, V4V1P6 | 1.250.766.1030 | www.westernwater.ca |
1. INTRODUCTION
This report presents the results of a technical review of ambient groundwater quality monitoring
networks maintained by the BC Ministry of Forests, Lands and Natural Resource Operations [MNRO]
in the Okanagan/Kootenay Region. This work was completed under Contract CPNEN11021, which was
issued by the Penticton Regional Office. A contract for the work was executed between Sustainable
Subsurface Solutions and MNRO on 11 January 2011. Sustainable Subsurface Solutions was merged with
Western Water Associates Ltd in April 2011.
The primary objective of this assignment included the analysis of groundwater chemistry data for 6
ambient networks located in Grand Forks, Osoyoos [2], Oliver [2] and Eagle Rock, with a view to
providing recommendations for any modification to the networks, if deemed necessary. The locations of
the ambient networks reviewed in this assignment are shown in Figure 1.
The secondary objective of this assignment was to enhance the ability of MNRO Staff to interpret data
and to have the capability to present findings to colleagues as well as the general public. The software
and training delivered as part of this assignment not represent a tool not only for the assessment of
historical data for each network, but also to continually update information at each site and to look at
the site from different perspectives [cross-sections]. The software can also be used to develop
databases for other sites.

31 March 2011 2
MNRO Ambient Network Review 11-004
| Unit 32 – 10051 Highway 97, Lake Country, BC, V4V1P6 | 1.250.766.1030 | www.westernwater.ca |
2. BACKGROUND
Substantial costs are incurred to obtain and analyze samples. The costs for drilling, monitoring well
installation and sampling of monitoring wells and the laboratory costs for analyzing samples are not
trivial. The utility of such expenditures can be jeopardized by the manner in which reported results are
interpreted as well as by problems in how samples were taken and analyzed. Considerable attention has
been given to standardizing procedures for sampling and analyzing groundwater. Although following
such standard procedures is important and provides a necessary foundation for understanding results, it
neither guarantees that reported results will be representative nor necessarily have any real relationship
to actual site conditions. In summary, comprehensive data analysis and evaluation by a knowledgeable
professional should be the final quality assurance step, it may indeed help to find errors in field or
laboratory work that went otherwise unnoticed, and provides the best chance for real understanding of
the meaning of reported results.
In British Columbia ambient groundwater water quality monitoring networks AWQM networks utilize
public and/or private water wells in a given aquifer which are sampled for a period of time to assess the
groundwater quality in the aquifer. The private wells are usually active water supply wells [a pump
permanently installed in the well], whereas some of the monitoring networks have dedicated
provincially-owned monitoring wells. These data from these wells are used to analyze spatial and
temporal variation of groundwater quality for a given aquifer. In the interior of British Columbia
AWQM networks were established in several important aquifers including Grand Forks [MNRO Aquifer
158], Osoyoos [MNRO Aquifer 193/194], Oliver [MNRO Aquifer 254/255] and Armstrong/Eagle Rock
[MNRO Aquifer 353]. The objectives of these ambient networks are to characterize the water
chemistry of the aquifer, identify any parameter that exceeds health standards, or is trending in a
direction that would impact human or ecosystem health, and help raise awareness about the linkage
between adverse land-use practices and water quality.
The primary objective of this project is to analyze the groundwater quality data collected for these
networks, report of the results of the analysis and make any recommendations such as continuation
discontinuation, or modification of each network that would help the MNRO to better manage these
networks.
Further to the report by Wei & Cui [MNRO, 2004] any enhancements of ambient water quality
monitoring [AWQM] networks need to be carried out without great demands on finite government
resources. It was also pointed out that the general public has an increased expectation for the right to
know the nature of water quality in aquifers with BC. The high number of communities in BC that are
reliant on groundwater as a drinking supply are also important considerations in designing and
maintaining a provincial water quality monitoring network. Monitoring wells in these networks are to
be sampled on a regular basis with consistent sampling procedures, lab analysis, QA/QC, data analysis
and archiving. Groundwater conditions and trends should be reported regularly and consistently. A
range of potential enhancement options was presented in the report as follows:
31 March 2011 3
MNRO Ambient Network Review 11-004
| Unit 32 – 10051 Highway 97, Lake Country, BC, V4V1P6 | 1.250.766.1030 | www.westernwater.ca |
1. Develop a program that allows for various intensities of monitoring [priority and phased
approaches];
2. Integrate the various groundwater quality monitoring programs to maximize available resources;
3. Integrate water quality monitoring with well or aquifer protection planning;
4. Standardize sampling protocols and analytical, plus Quality Assurance/Quality Control (QA/QC)
protocols to ensure consistent and comparable water quality data;
5. Develop groundwater quality indicators with consideration of major groundwater quality
concerns for specific areas; and,
6. Compile, link and integrate water quality data from different sources.
Other guiding principles of monitoring presented in the report included the targeting of community
aquifers, monitoring jointly with other government agencies and or private organizations, the selection
of appropriate parameters for testing, QA/QC measures applied to sampling and testing, and several
aspects relating to data analysis including database design, validation of input data and documentation
[metadata] analysis. A significant recommendation was the need to develop a GIS platform to analyze
spatial and temporal data variation or trends of ambient groundwater quality and to assess how
groundwater quality is affected by hydrology, geology, topography, climate, land use, and land cover.
The final recommendation in the report was for regular progress and technical reports, as well as the
ability to provide quick summaries and participate in the exchange of information, if requested. The
content and format of the report recommended was as follows:
1. Objectives of the monitoring program;
2. Geographic characteristics of monitoring area;
3. Hydrogeology and characteristics of aquifer;
4. Surficial geology, aquifer polygon and classification, depth or thickness, confined or unconfined,
groundwater direction, flow rate, etc;
5. Land use characteristics;
6. Total records and wells selected for monitoring;

31 March 2011 4
MNRO Ambient Network Review 11-004
| Unit 32 – 10051 Highway 97, Lake Country, BC, V4V1P6 | 1.250.766.1030 | www.westernwater.ca |
7. Mapping which shows sampling locations and a description of each well and surrounding
environment [lithology, well construction, geographic, land use, etc.];
8. Methodologies of sample collection, lab analysis, and QA/QC [if standardized procedures, make
references to those procedures, or include it in an appendix];
9. Number of samples collected, starting and ending dates of sampling;
10. Tabulate small data set or tabulate summary only and include detailed data on a disc; and,
11. Conclusions and recommendations.
Subsequent to Wei & Cui [2004] a review of the Provincial Observation Well Network was completed
by Kohut [2009]. The purpose of the assignment was to develop a method or strategy to recommend
where observation wells needed to be located in the Province to help protect, manage and sustain the
grounder resources of British Columbia. Several conclusions presented in this report the primary focus
was on the expansion of the network to a relatively small number of key areas in each ministry reaching
where it was anticipated that observation well data would be needed to support local water services
planning and water management decision meeting. One of the secondary conclusions was that the
quality, continuity and available of water level and water quality information from the observation well
network could be enhanced with water quality sampling protocols, timely interpretation of data and
technological improvements such as telemetry stations and more reliable instrument patients such as
pressure transducers. It was also identified the number of the monitoring wells in the current networks,
due to their proximity to pumping wells, and the weapons just aquifers were not entirely suitable to
monitor the effects of climate change water level changes etc.
The Kohut Report also provided a brief review of groundwater quality monitoring conducted within the
current networks in the province. It was noted that sampling frequency for observation wells during the
2002 two 2008. Sampling of individual wells ranged greatly from a low of once in seven years to a high
of twice yearly for six consecutive years was also noted that sampling frequency ranges widely among
the regions and there is no standard schedule in place for covering all regions. More samples are
analyzed for major physical and inorganic parameters following a standard suite of parameters that has
not been adopted for all regions. Variations in sampling frequency and parameters tested for
observation wells is buried among the reasons that appear to depend on several factors such as, number
of existing observation wells, available resources for monitoring, site remoteness and accessibility, and
objectives for sampling, protocols followed in regional priorities.
Of particular relevance to the current assignment are some observations provided in the report, which
are paraphrased from another report which examined historical water chemistry data from observation
wells in aquifers within the Province. The major conclusion was that sampling frequency needed to be
31 March 2011 5
MNRO Ambient Network Review 11-004
| Unit 32 – 10051 Highway 97, Lake Country, BC, V4V1P6 | 1.250.766.1030 | www.westernwater.ca |
increased to quarterly for new observation wells and in 1A aquifer observation wells with little or no
monitoring history.
With regards to analytical parameters, some key issues identified in the report are as follows:
1. Analysis of dissolved metals in every sample. Gaps in data from sporadic sampling schedules
impact trend analysis. When standard parameters are occasionally omitted from the analytical
suite, this compounds the difficulties of data interpretation;
2. Discontinuing analysis of total metals;
3. Continued local or regional studies for appropriate non-standard analytes;
4. The need for a thorough review of the potential for contamination by organic contaminants,
specifically regular analyses performed for organics such as BTEX, PAHs and pesticides;
5. The need for review of analytical results within seven days of being entered into the EMS
database to provide opportunities for re-analysis of the submitted sample, if necessary;
6. Conducting a critical assessment of the measured parameters are regularly to ensure that they
are and will continue to be appropriate for meaningful evaluation of the site; and,
7. Having a standard suite of parameters for testing at all networks.
In summary, there is considerable literature to support the completion of the work outlined in this
assignment. The analysis completed in this report of each of the AWQM networks basically follows the
prescribed methodology. Furthermore, the software used for spatial and temporal analysis has
significant utility in completing the required tasks and for MNRO staff to present data effectively to
colleagues and the general public.

31 March 2011 6
MNRO Ambient Network Review 11-004
| Unit 32 – 10051 Highway 97, Lake Country, BC, V4V1P6 | 1.250.766.1030 | www.westernwater.ca |
3. SCOPE OF WORK
The overall objective of this assignment is to analyze water quality data and available hydrogeologic
information each of the AWQM networks. The deliverable is a report on the statistical, spatial and
temporal analysis of the data. Furthermore, based on an understanding of the purpose for each of the
networks and the potential risks, provide specific recommendations for continuing, modifying of well
locations, enhancing or changing the suite of monitored parameters [analytes], increased or decreased
sampling frequency, etc, or discontinuing the networks. For each aquifer that hosts a network, provide
concluding remarks and any recommendations.
The scope of work for this assignment is outlined in the Contract CPNEN11021, specifically as follows:
Review and summarize existing water well, water quality and geological information relevant to
each aquifer that hosts one of the monitoring well networks;
Establish a database of water quality and lithology information for selected wells in each aquifer
in a excel spreadsheet format, suitable for use with EnviroInsite© , a software package specifically
designed for the presentation of spatial and temporal hydrogeological data;
Generate location maps, cross-sections and contour maps of geology, water levels and
chemistry for each of the “aquifers”, specifically in the areas where the ambient networks are
focused;
Analyze chemistry data for each of the ambient networks through the use of maps and plots
showing visual identification of spatial trends and anomalies for each of the key chemical
parameters included in the data provided by MNRO including: Alkalinity, Ammonia, Calcium,
Chloride, Fluoride, Hardness, Iron, Magnesium, Nitrate, Nitrite, pH, Specific Conductance,
Sulphate, Total Dissolved Solids and Uranium [plus any other parameters that pose a human
health risk];
Compare water quality data against the Guidelines for Canadian Drinking Water Quality
[GCDWQ] as well as to background ambient conditions for each aquifer. Also analyze the data
using statistical methods to identify statistical outliers. Outliers identified in the analysis to be
further investigated with respect to potential causes. Water chemistry results that exceed
GCDWQ guidelines and/or background ambient groundwater conditions will be further
depicted on spatial and temporal maps. Aquifer characterization of each network is to include
Stiff/Piper and Time History Plots;
Prepare and submit a pdf copy of a Draft Report;
31 March 2011 7
MNRO Ambient Network Review 11-004
| Unit 32 – 10051 Highway 97, Lake Country, BC, V4V1P6 | 1.250.766.1030 | www.westernwater.ca |
Provide a final report that addresses comments provided by MNRO staff;
Provide MNRO with all working and electronic files associated with the analysis of this project
on a CD accompanying the final report; And,
Provide 3 working & paid licenses of the ENVIROINSITE© Software [Version 7] and provide
MNRO staff with training on the use of the software, specifically on inputting, modifying,
contouring and plotting of data.
31 March 2011 8
MNRO Ambient Network Review 11-004
| Unit 32 – 10051 Highway 97, Lake Country, BC, V4V1P6 | 1.250.766.1030 | www.westernwater.ca |
4. REVIEW OF NETWORK AREAS AND AQUIFERS
The purpose of this assignment is not to provide a detailed description of the hydrogeology of each
AWQM network site, but to present an understanding of each site in sufficient detail to support the
analysis of the water quality data. A considerable volume of effort has been undertaken by others to
investigate and document the hydrogeological setting and physical characteristics of the aquifers that
host each network, including assessment of the mechanisms and locations of recharge, hydraulic
characteristics and water balance calculations.
The descriptions of the aquifers in the following sub-sections are therefore based predominantly on
information provided by others. The scope of this assignment did not include any field work to verify
well locations, water levels and land use.
4.1 Eagle Rock
This network is hosted in MNRO Aquifer 353, which is located in the North Okanagan, to the south of
Armstrong and in the immediate area of the Spallumcheen Industrial Park, which is along the eastern
flank of the Valley. The aquifer is hosted in a fan deposit and is unconfined along the edge of the Valley
and confined towards the centre of the Valley by lacustrine sediments. There is substantial agricultural
activity in the area where the aquifer transitions from unconfined to confined in nature. The majority of
the unconfined portion of the aquifer is within the industrial park and large gravel extraction operations
on the east side of Highway 97. In addition to on-site sewage disposal systems in this area, other
potential sources of contaminants to this aquifer include industry [sawmill and fiberglass construction
plants], commercial activities, hydrocarbon storage tanks and pipelines, plus a livestock market. The
unconfined portion of the aquifer is locally recharged by precipitation and runoff from the highlands to
the west. Flow in the confined portion of the aquifer is derived from adjacent valley-bottom aquifers
that flow from north to south.
The aquifer covers a footprint area of roughly 7.8 km2 and hosts approximately 120 water wells with an
average values of 47.2 m [155 ft] for depth, 12.8 m [42 ft] for static water level [SWL] and 2.5 L/s [39.5
USgpm] for yield. Wells in the eastern portion of the aquifer trend to shallower, higher yielding and
more vulnerable, whereas wells located to the west are deeper and less vulnerable. Some wells at the
western portion of the aquifer, where the transition occurs from unconfined to confined in nature, are
flowing artesian at rates exceeding 22 L/s [50 USgpm]. There are several large yielding agricultural and
public water supply wells that utilize this aquifer. Eagle Rock Improvement District [ERID] and Larkin
Improvement District [LID] are the two most prominent water utilities. Data provided by LID and
ERID indicate that the total quantity pumped using water district wells in the area is in the range of 1.3 x
108 to 1.5 x 10⁸ Igal/yr, or 600,000 to 700,000 m3/yr. Tolko Industries apparently have 6 monitoring
wells and two extraction wells on their site, which covers a large portion of the very south end of the
aquifer. Only anecdotal information exists regarding the location of these wells and water quality

31 March 2011 9
MNRO Ambient Network Review 11-004
| Unit 32 – 10051 Highway 97, Lake Country, BC, V4V1P6 | 1.250.766.1030 | www.westernwater.ca |
derived from the aquifer in this area. Agricultural users are generally located to the north and west
portions of the aquifer. There also exists some higher density residential development to the north.
The aquifer has been classified as a 1A aquifer by MNRO, with a ranking of 14. The “1” designation
denotes a combination of relatively high degree of development as compared to productivity of the
aquifer, along with high demand and potentially high yields being available. The “A” designation denotes
a relatively high vulnerability to contamination, especially in the eastern portion of the aquifer, which is
unconfined.
The AWQM network at Eagle Rock was established in 2003 and includes 6 wells at 6 sites, all of which
are completed in MNRO Aquifer 353. However, water quality in this aquifer has been monitored since
July 1987. The objective of this monitoring network is to characterize the ambient groundwater quality
and to monitor for nitrates [NO3-N], in response to agricultural activity and sewage disposal to ground
within the Industrial Park.
MNRO Observation Well 180 is located in the aquifer. This well is WTN 32340, which is also a water
quality monitoring location included in the AWQN for Eagle Rock.
A plan view of the area showing the footprint area of the aquifer in the area of the AWQM network,
the wells currently monitored for water quality and contours of reported static water levels [inferred
direction of flow], is presented in Figure 2. The land use in the area, along with water wells and
direction of flow are shown in Figure 3. A geological cross-section through the aquifer showing water
levels and hydrogeological units is presented in Figure 4.
Based on major anion/cation concentrations derived from the EMS data, a Piper Plot of the water quality
in the aquifer is presented in Figure 5. The groundwater in this aquifer is characterized as Ca-HCO3
dominant.
The description of this aquifer and AWQM network are derived mainly from Ping et al (2007), Kohut
(1979) and Monahan (2006). A summary of the well records utilized in the assessment of this area is
included in Appendix A.
4.2 Oliver
The two networks in Oliver are hosted in MNRO Aquifer 254 and 255, which are situated within the
base of the Okanagan Valley. Aquifer 254 is bounded to the north by Tugulnuit Lake and the south by
Osoyoos Lake. The aquifer is approximately 15 km in length from north to south and covers a footprint
area of roughly 19.2 km2. Aquifer 255, also referred to as the Oliver North Aquifer, extends from
Tugulnuit Lake to Vaseux Lake. This aquifer is approximately 8.5 km in length and covers a footprint
area of 10.7 km2. Apart from areas where recharge impacts localized flow gradients along the edges of
the Valley [Vaseux Creek, Park Rill, etc], flow in both aquifers is from north to south.

31 March 2011 10
MNRO Ambient Network Review 11-004
| Unit 32 – 10051 Highway 97, Lake Country, BC, V4V1P6 | 1.250.766.1030 | www.westernwater.ca |
Both aquifers are hosted in fluvial and glacio-fluvial floodplain deposits, which are generally hydraulically
connected to flow in the Okanagan Channel. In some areas the aquifer is “locally” confined, where
shallow finer grained silts effectively cap the aquifer, or where the depth to water becomes excessive
along the edge of the valley in recharge areas. Aquifer 254 is generally unconfined in nature, shallow in
depth and thickness and hydraulically connected to the Okanagan Channel. The area that recharges the
aquifer is relatively small as compared to other valley-bottom aquifers in the Okanagan Valley. The
upland recharge area to the west is minor and recharge from the east of the Valley is predominantly
directed to the south end of the aquifer, directly into Osoyoos Lake. Some recharge from the east does
occur along Wolfcub Creek, which ultimately reports to Tugulnuit Lake. Therefore, the majority of
recharge in this aquifer is derived via lateral flow contribution from Aquifer 254m, which is immediately
north. Lesser amounts of recharge are derived from losses along the Okanagan Channel, from irrigation
return flow and from direct precipitation. Aquifer 255 receives substantial recharge from Vaseux Creek
and Vaseux Lake, as well as via lateral flow from aquifers in the base of the Valley to the north of Vaseux
Lake. Additional recharge is also contributed from the west via Park Rill Creek.
There is substantial agricultural activity all through the base of the Valley in the south Okanagan,
including orchards and an increasing number of vineyards and vegetable plots. There is some industrial
activity in the area, but not of particular significance. In addition to potential agricultural impacts on
groundwater, on-site sewage disposal systems [either domestic or commercial] and fertilizer application
on golf courses in the area, combine for a significant concern regarding nitrate loading in the aquifers.
The two aquifers cover a footprint area of roughly 29.9 km2 and host in the neighborhood of 700 water
wells, with average values of 18.9 m [62 ft] for depth, 7.3 m [24 ft] for static water level [SWL] and 2.5
L/s [39.5 USgpm] for yield. Wells in the northern part of Aquifer 255, immediately south of where
Vaseux Creek enters the Valley are the both the deepest and have the greatest depth to SWL. Well
adjacent to the Okanagan Channel and Tugulnuit Lake have the most shallow SWL and very likely
source a substantial amount of their yield from these surface water bodies.
There are several large yielding public water supply wells operated by the Town of Oliver, 2 of which
are located immediately south of Tugulnuit Lake, 5 located within 50 m of the Okanagan Channel [at
various locations within and to the north and south of the Town], and one [Rockcliffe well] located 1.5
km to the west of the Channel at the intersection of 344th Avenue and 342nd avenue. There are also
some high yielding irrigation wells in Aquifer 255 where the aquifer is recharged by Park Rill Creek. The
Jackson Triggs Winery has a couple of higher yielding wells and the Osoyoos Indian Band recently
completed two high capacity wells for their proposed Senkulmen Industrial Park, immediately south of
the Jackson Triggs Winery.
Both Aquifer 254 and 255 have been classified as 1A aquifers by MNRO, with rankings of 16 and 15
respectively. The “1” designation denotes a combination of relatively high degree of development as
compared to productivity of the aquifer, along with high demand and potentially high yields being
available. The “A” designation denotes a relatively high vulnerability to contamination, especially in the
lowest elevation portions of these aquifers next to the Okanagan Channel. Given the increased depth

31 March 2011 11
MNRO Ambient Network Review 11-004
| Unit 32 – 10051 Highway 97, Lake Country, BC, V4V1P6 | 1.250.766.1030 | www.westernwater.ca |
to SWL and evidence of some finer-grained and localized confining materials above the highest yielding
portion of Aquifer 255, there is ongoing discussion regarding the down-grading of the vulnerability in
this aquifer to “B”. This infers the aquifer is moderately vulnerable, as opposed to highly vulnerable.
The AWQM networks at Oliver were established in 2003 and include 12 water supply wells and one
MNRO Observation Well. The objective of this monitoring network is to characterize the ambient
groundwater quality and to monitor for nitrates [NO3-N], in response to agricultural activity and
sewage disposal to ground via domestic and commercial applications. MNRO Observation Well 322 is
located in Aquifer 254. This well is WTN 62966, which is also a water quality monitoring location
included in the AWQN for Oliver.
A plan view of the area showing the footprint area of the aquifers in the area of the AWQM network
for Oliver, the wells currently monitored for water quality and contours of reported static water levels
[inferred direction of flow], is presented in Figure 6. The land use in the area, along with water wells
and direction of flow are shown in Figure 7. A geological cross-section through the aquifer showing
water levels and hydrogeological units is presented in Figure 8.
Based on major anion/cation concentrations derived from the EMS data, a Piper Plot of the water quality
in the aquifer is presented in Figure 9. The groundwater in this aquifer is characterized as Ca-HCO3
dominant.
The description of this aquifer and AWQM network are derived mainly from Toews (2007), Golder et
al (2009) and MNRO Aquifer classification worksheets. A summary of the well records utilized in the
assessment of this area is included in Appendix A.
4.3 Osoyoos
The two networks in Osoyoos are hosted in MNRO Aquifer 193 and 194, which are situated within
the base of the Okanagan Valley. Aquifer 193 is on the west side of Osoyoos Lake and is bounded to
the west by bedrock highlands, the south by the USA border and the north where Osoyoos Lake
terminates. The aquifer is approximately 9.5 km in length from north to south long by 1.8 km in width
at the widest point. The aquifer covers a footprint area of roughly 13.4 km2. Aquifer 194 is on the east
side of the Lake, extending from the USA border to the northeast limits of the Town of Osoyoos. The
aquifer is 4.1 km in length and at the maximum is 1.2 km wide. For this study we have also included
MNRO Aquifer 195 with Aquifer 193, for a combined footprint area of 3.95 km2. Neither of these
aquifers receives significant recharge for the adjoining uplands, as these areas are relatively small. The
upland catchment area to the west of Osoyoos is very limited in extent and does not achieve sufficient
elevation to accumulate significant snowpack to drive recharge. The uplands to the east of Osoyoos are
higher in elevation and more extensive in area, but runoff and recharge from these areas is primarily
directed south to the USA portion of Osoyoos Lake. Recharge to Aquifer 193 and 194 is primarily via

31 March 2011 12
MNRO Ambient Network Review 11-004
| Unit 32 – 10051 Highway 97, Lake Country, BC, V4V1P6 | 1.250.766.1030 | www.westernwater.ca |
direct precipitation and irrigation return flow. All of the larger yielding wells in the Osoyoos Area are
close to the lake and derive groundwater that is induced flow from the base of the lake bottom
sediments. The level in the Lake and static water levels in many wells on both sides of the lake infer that
the gradient is very flat. There are some shallow wells that are completed above the elevation of the
lake that derive water from locally perched aquifers.
Both aquifers can be described in more detail as outwash terraces consisting of stratified drift ranging in
texture from fine sand to coarse gravel deposited by meltwater streams fed by melting following
glaciation. There are no obvious confining layers above these aquifers. Observation wells established in
1969 and piezometers in 1989 have generally shown rapid response to precipitation and irrigation
water.
Approximately 450 water wells, with average values of 16.1 m [53 ft] for depth, 5.7 m [18.7 ft] for static
water level [SWL] and 2.76 L/s [43.8 USgpm] for yield. Wells located towards the edges of the valley,
where the thickness of aquifer sediments are greatest, are generally the deepest. The shallowest wells
are generally in close proximity to the Lake. Approximately 90 percent of the wells are older dug wells
and 90 percent of yields have not been reported. Many of the older dug wells were completed with a
backhoe by the owner and unscreened. The calculated median well yield is therefore misleading.
There are several large yielding public water supply wells operated by the Town of Osoyoos, all of
which are within located within 200 m of the Lake. Three of these wells are located in Aquifer 194 on
the east side of the Lake, between Cottonwood Drive and Maple Drive. There are other wells on the
south west side of the Lake along Kingfisher Drive and 2-3 more wells to the north in the old public
works yard at the confluence of Spartan Drive and 92 Avenue.
Both Aquifer 193 and 194 have been classified as IIA aquifers by MNRO, with rankings of 16 and 14
respectively. The “1I” designation denotes a combination of relatively moderate degree of development
as compared to productivity of the aquifer, along with high demand and potentially high yields being
available. The “A” designation denotes a relatively high vulnerability to contamination.
The AWQM networks at Oliver were established in 2003 and include a total of 27 sampling sites,
including 9 domestic wells, 7 nested piezometers, and 2 MNRO Observation wells. The wells are
sampled annually. The Observation wells include Obs Well 101 [WTN 22731] and Obs well 96 [WTN
22769]. The objective of this monitoring network is to characterize the ambient groundwater quality
and to monitor for nitrates [NO3-N], in response to agricultural activity and sewage disposal to ground
via domestic and commercial applications.
A plan view of the area showing the footprint area of the aquifers in the area of the AWQM network
for Osoyoos, the wells currently monitored for water quality and contours of reported static water
levels [inferred direction of flow], is presented in Figure 10. The land use in the area, along with
water wells and direction of flow are shown in Figure 11. A geological cross-section through the
aquifer showing water levels and hydrogeological units is presented in Figure 12.
31 March 2011 13
MNRO Ambient Network Review 11-004
| Unit 32 – 10051 Highway 97, Lake Country, BC, V4V1P6 | 1.250.766.1030 | www.westernwater.ca |
Based on major anion/cation concentrations derived from the EMS data, a Piper Plot of the water quality
in the aquifer is presented in Figure 13. The groundwater in this aquifer is characterized as Ca-HCO3
dominant.
The description of this aquifer and AWQM network are derived mainly from Athanasopoulos (2009),
Nasmith (1962) and MNRO aquifer classification sheets. A summary of the well records utilized in the
assessment of this area is included in Appendix A.
4.4 Grand Forks
This network is hosted in MNRO Aquifer 158, which is located in Grand Forks, at the confluence of the
Kettle and Grandby rivers. The aquifer is irregular in shape as it follows the base of the valleys along the
two rivers, which are limited in extent by the surrounding bedrock hills. The entire aquifer is a
floodplain which is underlain by alluvial and glacial drift units, consisting predominantly of sand, gravel, silt
and clay (Wei et al., 1994). Recharge to the aquifer is derived from lateral flow contributions from the
Grandby Valley [from the north] and more predominantly from the Kettle Valley [from the west].
Additional recharge is provided via the hydraulic connection between the aquifer and the rivers, as well
as via infiltration of precipitation and irrigation return flow. Groundwater flow from the north and west
converges in the central part of the Valley and the combined flow continues to the east.
The international border runs across the southern portions of the aquifer, subdividing it into ~95% area
on the Canadian side, and the remainder on the US side; approximately 30% of the valley watershed lies
south of the border.
According to Allen et al (2004), the stratigraphic sequences in Grand Forks valley are poorly
understood. In other valleys in southern British Columbia, the basal units are commonly silt, clay and
gravel, overlain by thick glaciolacustrine silts, capped by sand and gravel outwash and floodplain deposits.
A working hydrostratigraphic model was proposed and subsequently used to investigate the impacts of
climate change on groundwater for the aquifer using a groundwater model. The 6 hydrostratigraphic
units are included in the following list.
1. Gravel [with or without sand]
2. Sand
3. Silt
4. Clay
5. Sandy and gravel
6. Bedrock
Allen [2000] further states that the hydraulic connection of the Kettle and Granby rivers to the shallow
aquifer appears to be efficient as there does not appear to be any till or low permeability silt material
overlying the highly permeable sand and gravel in the river beds. The upper stratigraphic unit of the

31 March 2011 14
MNRO Ambient Network Review 11-004
| Unit 32 – 10051 Highway 97, Lake Country, BC, V4V1P6 | 1.250.766.1030 | www.westernwater.ca |
aquifer consists of gravel, which appears to be closely linked with the Granby and Kettle Rivers as
evidenced by the corresponding rising and falling of water levels in shallow wells situated close to the
rivers. All wells completed in this shallow layer exhibit a static level approximately at river elevation,
indicating that the groundwater regime is likely strongly linked to the surface water regime.
There is substantial agricultural activity in the area.
The aquifer covers a footprint area of roughly 39 km2 and hosts approximately 500 water wells with
average values of 17.1 m [56 ft] for depth, 11.6 m [38 ft] for static water level [SWL] and 1.8 L/s [28.5
USgpm] for yield.
There are several large yielding public water supply and irrigation wells operated by the City of Grand
Forks and various irrigation/improvement districts [ID] such as Sion ID, Grand Forks ID, Covert ID and
Big Y ID. The City of Grand Forks wells are clustered in 2 locales north of the Kettle River and
Highway 3. Sion ID operates wells near the junction of Highway 3 and Highway 47. They also have a
well in operation along NorthFork Road. They constructed a new well on Community Centre Road in
2006. Covert ID operates 3 wells along Highway 947 near the USA border. Grand Forks, Almond
Garden ID and Big Y ID operate wells to the south of the Kettle River, generally along or close to
Gilpen Road. There is a large capacity well where the Grandby River enters the Study Area from the
north [Copper Ridge]. There are also large capacity wells used for a tree nursery located along Nursery
Road, to the east of the City and adjacent to the River.
Aquifer 158 has been classified as IA by MNRO, with a ranking of 17. The “1” designation denotes a
combination of relatively high degree of development as compared to productivity of the aquifer, along
with high demand and potentially high yields being available. The “A” designation denotes a relatively
high vulnerability to contamination, especially in the eastern portion of the aquifer, which is unconfined.
The AWQM network at Grand Forks was established in 1985 and includes a total of 28 sampling sites,
including several of the irrigation and municipal water supply well and MNRO Observation Well 217
[WTN 14947]. There are also several locations where nested sampling piezometers have been
established. The wells are sampled annually. The objective of this monitoring network is to
characterize the ambient groundwater quality and to monitor for nitrates [NO3-N], in response to
agricultural activity and sewage disposal to ground via domestic and commercial applications.
A plan view of the area showing the footprint area of Aquifer 158 and the locations of wells monitored
as part of the network, along with contours of reported static water levels [inferred direction of flow],
is presented in Figure 14. The land use in the area, along with water wells and direction of flow are
shown in Figure 15. A geological cross-section through the aquifer showing water levels and
hydrogeological units is presented in Figure 16.
Based on major anion/cation concentrations derived from the EMS data, a Piper Plot of the water quality
in the aquifer is presented in Figure 17. The groundwater in this aquifer is characterized as Ca-HCO3
dominant.
31 March 2011 15
MNRO Ambient Network Review 11-004
| Unit 32 – 10051 Highway 97, Lake Country, BC, V4V1P6 | 1.250.766.1030 | www.westernwater.ca |
The description of this aquifer and AWQM network are derived mainly from Wei et al (1994), Allen &
Wei (2010), Allen 2004) and Allen (2001). A summary of the well records utilized in the assessment of
this area is included in Appendix A.
31 March 2011 16
MNRO Ambient Network Review 11-004
| Unit 32 – 10051 Highway 97, Lake Country, BC, V4V1P6 | 1.250.766.1030 | www.westernwater.ca |
5. METHODOLOGY
In addition to the water quality and borehole data provided by MNRO for each of the network sites, it
was necessary to compile digital imagery, land use maps and digital elevation model [DEM] data for input
into spreadsheets compatible with EnviroInsite© [V.7], a commercially available software package that is
ideally suited for the analysis and presentation of hydrogeological data. The software combines easy to
use input files [MS Excel, MS Access, text or ascii] which generate a spatial and temporal [time history]
database for a given site [in this case each ambient network site]. The software combines powerful
spatial graphics [geo-referencing], as well as a full suite of hydrogeologist’s tools including the ability to
do geo-statistical and geo-chemical analysis, contouring and prepare geological cross-sections.
The methodology utilized to complete this assignment is graphically summarized in the flow diagram
presented in Figure 18. A description of each of the work tasks is as follows:
Review information and prepare x, y, x data files in MS Excel 2007 format, of geological
information including UTM coordinates, surface elevation, depths and thickness of
hydrostratigraphic units encountered, static water level, depth of screened intake. Additional
wells were included in the database for each network, where information regarding stratigraphy
and static water level, added spatial value, specifically with the interpretation of the continuity of
hydrostratigraphic units and contouring of water levels. These spreadsheets were used directly
by the EnviroInsite© software;
Transfer data from the MNRO water quality spreadsheets [data from the EMS database] into a
MS Excel spreadsheets that are readable as a database of spatial and temporal observations by
the EnviroInsite© software. The specific parameters included Alkalinity, Ammonia, Arsenic,
Bicarbonate, Calcium, Chloride, Iron, Fluoride, Hardness, Iron, Magnesium, Manganese,
Potassium, Nitrate, Nitrite, pH, Sodium, Specific Conductance, Sulphate, Total Dissolved Solids
and Uranium;
For each ambient network site, utilize the EnviroInsite© software to prepare trial spatial and
temporal plots to allow for the visual identification of trends and outliers, as well as background
concentrations for each of the chemical parameters. Background concentrations were generally
lowest level, method detection limit, or at up gradient end of system;
Transfer data from the MNRO water quality spreadsheets into task specific spreadsheets for
comparison against the Guidelines for Canadian Drinking Water Quality [GCDWQ, 2010], as
well as statistical analysis for the specified chemical parameters. Statistical analysis included the
identification of max, min and average values [arithmetic mean], standard deviation and the ratio
of max to background value [established in previous task] for each parameter. The Range of
31 March 2011 17
MNRO Ambient Network Review 11-004
| Unit 32 – 10051 Highway 97, Lake Country, BC, V4V1P6 | 1.250.766.1030 | www.westernwater.ca |
values determined appropriate interval and a combination chart was prepared for two data
series; 1) the number of events per interval and, 2) percentage of frequency for each interval,
Subsequently using a pivot table, the number of sample events were determined, In the end
identified statistical outliers;
Transformed [removed outliers] of data and then did final plots;
Identify trends, exceedences spatial and temporal plots, data gaps;
Summarize data for each site, data worth; and,
Complete an evaluation of each monitoring network in comparison to the original objectives of
that network.

31 March 2011 18
MNRO Ambient Network Review 11-004
| Unit 32 – 10051 Highway 97, Lake Country, BC, V4V1P6 | 1.250.766.1030 | www.westernwater.ca |
6. REVIEW OF DATA INPUT REQUIREMENTS FOR EnviroInsite©
The EnviroInsite© [V.7] can handle virtually any database format. For small sites, it is most convenient to
store the data in a spreadsheet such as Microsoft Excel. The data is read as a relational database, so it’s
important that the well, screen and constituent names are consistent in the different parts of the
database file. For example each Well in the Screens worksheet must have at least one identical
counterpart in the Wells worksheet. Likewise, each Well – Screen pair in the Observation table must
have their counterpart in the Screens table. It is also important that the spreadsheet contain the same
tab names and heading labels as in the spreadsheet template [site1.xls] that is provided with the
software. The easiest way to start a new spreadsheet data file is to use the template site1.xls.
There are six tabs [separate tables] in the spreadsheet. The documentation that comes with the
software includes a detailed explanation of the fields that must be filled in for each table. A complete
database schema for the software is provided in Figure 19. A summary of the individual tables and
fields within each table is as follows:
Table Fields
Wells Name, location, surface/bottom elevations, class
Screens Well/screen name and bounding elevation interval
ObservationsWell/screen name, measured value, date, constituent, data
flag and media
Constituents analyte, units, media, standard
BoringsWell name, soil or boring log description, top/bottom
elevation or depth
Stratigraphy Well name, strata, top/bottom elevation or depth
Point Values, Fill,Geophysics
Well name, parameter, elevation, value
Any other spatial information such as digital elevation files [DEM], bedrock contour files, feature class
[shape] files etc, can be imported directly. Images, such as old air photos, a print screen capture, or
Google Earth/Maps, can be easily imported and geo-referenced within the software.
For this assignment, the digital imagery and DEM data were derived from 1:20,000 NTS Map sheets
available on-line from GEOBC. Information on the location of observation wells in each ambient
network was provided by MNRO. It was necessary to analyze each well log to determine the elevation
31 March 2011 19
MNRO Ambient Network Review 11-004
| Unit 32 – 10051 Highway 97, Lake Country, BC, V4V1P6 | 1.250.766.1030 | www.westernwater.ca |
of each stratigraphic unit and the depth of screen interval. The observations table within the input file is
intended to contain data on the hydrogeologist’s interpretation of stratigraphic units. When constructing
the stratigraphy table unit intervals must lie in the same order from top to bottom in every well. When
a particular unit is missing at a well location, the software will interpret that the unit has zero thickness
at that location. Missing intervals below a given borehole location are also interpreted to have zero
thickness. The geologist’s interpretation of the expected elevation interval of missing units should be
entered in order to prevent the interpretation of stratigraphy as extending only to the bottom of the
borehole.
Input files can be MS Access [*.accdb] or MS Excel [*.xlxs]. Output files from EI have the extension *.
Xml.
It is possible to add wells and graphics but not observations while working in the software with a data
set open. It is also possible to directly browse the data set while running the software.
The largest data workbook is the observations tab, which utilizes a single row of data for each
observation. For example, each of the 20 parameters for a single sample event requires a dedicated line
in the table. In addition to water quality data, water levels for each well were added as observations.
Although, not completed as part of this assignment, it will be possible to enter water level data from
MNRO Observation Wells in each AWQM network and plot long term water level fluctuations.
31 March 2011 20
MNRO Ambient Network Review 11-004
| Unit 32 – 10051 Highway 97, Lake Country, BC, V4V1P6 | 1.250.766.1030 | www.westernwater.ca |
7. WATER QUALITY DATA ASSESSMENT
In reality, the assessment, or validation of the data is merely a process of checking for transcription and
conversion errors, with the ultimate intention being to summarize the data and conveying the essential
information contained in the data to the end user. The analysis completed on the EMS data provided by
MNRO was completed using MS Access and MS Excel to copy data to task-specific spreadsheets.
Subsequent analysis was completed using Excel to identify max, min, mean, mode, skewness, kurtosis,
standard deviation and normality. Most of the data exhibited a central tendency, but was not normally
distributed and therefore it was not possible to use statistical methods to identify extreme outliers. The
premise for the statistical analysis completed on the data is the 2006 USEPA document EPA QA/G-9S,
entitled “Data Quality Assessment: Statistical Methods for Practitioners”.
The main purpose of water quality data assessment was to; 1) look for sample results that exceed
selected parameters in the Guidelines for Canadian Drinking Water Quality [GCDWQ], and 2) identify
and remove visual outliers using the EnviroInsite Software. Once these outliers were identified, the data
was transformed by removing [censoring] the outliers.
7.1 Data Input Validation
EMS data were initially provided by MNRO is an Excel spreadsheet with unique columns of data for each
AWQM Network site for EMS ID, Sample Date, Type of Sample, and columns for water quality test
results for various parameters that were measured over various time periods.
Preliminary validation of the data was completed by reviewing the data for consistency between each
AWQM site data, specifically by examining the list of parameters, the ordering within the file and the
format of the data [consistent dates, parameter naming convention, values, measurement unit, type of
samples, etc]. Each data set was found to have blank values.
The EMS data sets contained water quality test results for 101 parameters, most of which were not
specified in the scope of work for analysis. The number of parameters tested for at each AWQM
network site varied significantly. For this study, only 20 parameters were selected for analysis. The data
set is unique in that the detection limit for the laboratory testing method varies considerably between
parameters and in some cases changes over time for the same parameter. The number of sampling
events also varied considerably between certain parameters and sampling locations. Four stand-alone
spreadsheets, one for each site, were prepared.
For the EnviroInsite Software, which was used for visual identification of trends and outliers, the data
was copied from the original EMS data sets into Access and then, using queries for each of the 20
parameters of interest via a macro, a table was created containing the lab result, well location and date
of sampling. The new table in Access was subsequently exported to an Excel table which was in a

31 March 2011 21
MNRO Ambient Network Review 11-004
| Unit 32 – 10051 Highway 97, Lake Country, BC, V4V1P6 | 1.250.766.1030 | www.westernwater.ca |
format acceptable by the EnviroInsite Software. For each parameter, values were sorted in increasing
numerical order, which positioned blanks at the bottom of list.
7.2 Statistical Analysis and Identification of Outliers
For this assignment, the statistical analysis of the data called for the copying of the original EMS data
tables to new MS Excel spreadsheets and subsequent modification to remove all data not related to the
20 parameters of interest. A column for Well Tag Numbers [WTN] was added to associate each
sampling location with a corresponding EMS number. Threshold criteria from the Guidelines for
Canadian Drinking Water Quality [GCDWQ] were then added for each of the parameters, including
Maximum Acceptable Criteria [MACs] and Aesthetic Objectives [AOs].
As water quality data sets are exceedingly fraught with errors due to sampling, handling [custody and
holding time], as well as laboratory error, it is critical to evaluate the reliability, or quality of the data,
using some level of statistical analysis and to identify as well as remove outliers that may strongly
influence the dataset. Given a major deliverable for this assignment is contoured plots of spatial data
based on average values for each well location, bad data can significantly influence these plots and the
analysis plus recommendations generated.
A normal distribution is one of the most common probability distributions used in the analysis of
environmental data. However, it is common for aqueous chemistry data to exhibit frequency distributions
that are non-negative and skewed with heavy or long right-tails. There are many statistical methods and
complex software programs that are available for the analysis of aqueous chemistry data, however most
of these assume that the data is normally distributed, or that the data is log-normally distributed and can
be transformed. Such tests for distribution include the Shapiro Wilk W Test, Filliben`s statistic, the
Studentized Range Test, Geary`s Test, the Chi-Square Test and the Lilliefors Kolmogorov-Smirnoff Test
(USEPA, 2006).
Therefore, prior to attempting statistical methods to identify outliers, it was necessary to first
characterize the data set and determine if the data was normally distributed. Basic statistical analyses
were completed such as ordering [difference based on current value minus previous value], min, max,
central tendency [mean, mode, geomean], verification of normal distribution, outliers and trends
between neighboring values. Also included in this stage of data analysis were comparisons against
GCDWQ and identification of possible background concentrations for each parameter of interest at
each AWQM network site.
It was determined in almost all cases that the data was not normally distributed and therefore it was
deemed inappropriate to identify statistical outliers using statistical outlier methods. It was therefore
necessary to utilize a more visual outlier identification method, specifically the histogram. Histograms
provide a visual method of identifying the underlying distribution of the data and often can reveal
detailed information about data sets that may not be apparent from a statistic method - for example
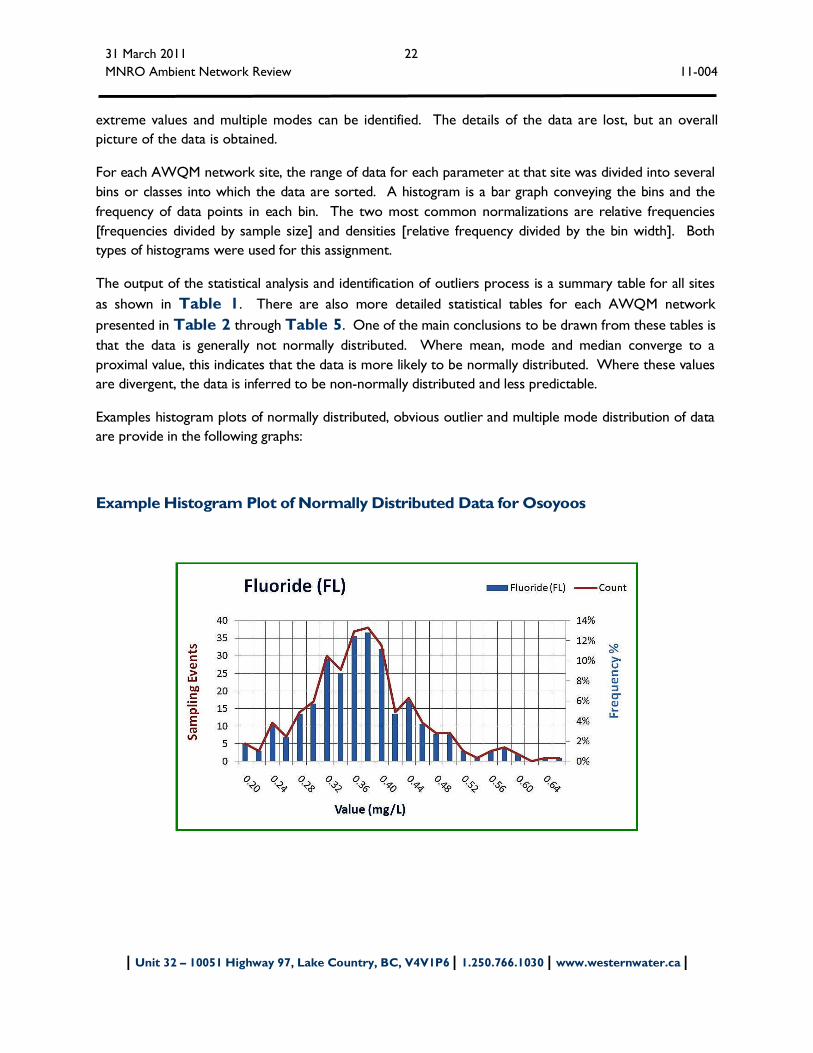
31 March 2011 22
MNRO Ambient Network Review 11-004
| Unit 32 – 10051 Highway 97, Lake Country, BC, V4V1P6 | 1.250.766.1030 | www.westernwater.ca |
extreme values and multiple modes can be identified. The details of the data are lost, but an overall
picture of the data is obtained.
For each AWQM network site, the range of data for each parameter at that site was divided into several
bins or classes into which the data are sorted. A histogram is a bar graph conveying the bins and the
frequency of data points in each bin. The two most common normalizations are relative frequencies
[frequencies divided by sample size] and densities [relative frequency divided by the bin width]. Both
types of histograms were used for this assignment.
The output of the statistical analysis and identification of outliers process is a summary table for all sites
as shown in Table 1. There are also more detailed statistical tables for each AWQM network
presented in Table 2 through Table 5. One of the main conclusions to be drawn from these tables is
that the data is generally not normally distributed. Where mean, mode and median converge to a
proximal value, this indicates that the data is more likely to be normally distributed. Where these values
are divergent, the data is inferred to be non-normally distributed and less predictable.
Examples histogram plots of normally distributed, obvious outlier and multiple mode distribution of data
are provide in the following graphs:
Example Histogram Plot of Normally Distributed Data for Osoyoos

31 March 2011 23
MNRO Ambient Network Review 11-004
| Unit 32 – 10051 Highway 97, Lake Country, BC, V4V1P6 | 1.250.766.1030 | www.westernwater.ca |
Example Histogram Plot of Statistical Outlier for Iron at Eagle Rock
Example histogram plot of multiple modes for Bicarbonate in Oliver

31 March 2011 24
MNRO Ambient Network Review 11-004
| Unit 32 – 10051 Highway 97, Lake Country, BC, V4V1P6 | 1.250.766.1030 | www.westernwater.ca |
7.3 Comparison Against GCDWQ
Water chemistry data provided by MNRO for all sampling locations in each of the AWQM networks
were compared against the current guidelines for drinking water quality, specifically the Guidelines for
Canadian Drinking Water Quality (2010). The suite of parameters included in the comparison included
the following:
Alkalinity [total]
Ammonia [dissolved] - NH4
Bicarbonate - HCO3
Calcium [total] - Ca
Chloride [dissolved] - Cl
Fluoride [dissolved] - Fl
Hardness [total]
Iron [total] - Fe
Magnesium [total] - Mg
Manganese [total] - Mn
Nitrate [nitrogen total] – NO3
Nitrite [dissolved] - NO2
pH
Specific conductance
Sulfate [dissolved] - SO4
Total dissolved solids - TDS
Uranium [total] - U
Data for other water quality parameters in the raw data set from MNRO were not included in the
comparison against water quality standards. The results of this analysis are presented in Table 6.
Some parameters do not have maximum acceptable concentration [MAC], Interim MAC, or Aesthetic
Objective [AO] thresholds in the GCDWQ. The background concentrations for each of the required
parameters are also included in this table.
At first glance, the table infers there are many exceedences at all AWQM network sites for iron [total],
arsenic [total] and manganese [total]. It is postulated that these results are artificially elevated due to
turbid field samples, however turbidity is not a parameters that has been monitored. Similar water
quality studies in BC have identified turbidity-driven “spikes” for total metals [Dessouki, 2009].
However, in this study, other total metals such as uranium and potassium do not show the same
variability and hence potential co-variability with turbidity. Correlation plots of Total Dissolved Solids
[TDS] versus iron, manganese and arsenic suggest that there is poor correlation between these
parameters. Therefore, TDS is not a good surrogate for turbidity.

31 March 2011 25
MNRO Ambient Network Review 11-004
| Unit 32 – 10051 Highway 97, Lake Country, BC, V4V1P6 | 1.250.766.1030 | www.westernwater.ca |
There was insufficient data for cation/anion charge balance calculations, specifically very infrequent
results for bicarbonate, which is a major anion.
There are relatively few parameters that exceed the GCDWQ standards. Nitrate is consistently above
acceptable limits in one well in Oliver [WTN 21867], and in a few wells in Grand Forks. There are also
single sample event exceedences for nitrate in Grand Forks [n=9] and Osoyoos [n=15]. Manganese and
iron are elevated in Eagle Rock.
Those parameters in the data set not considered include: silver (total/dissolved), aluminum
(total/dissolved), boron (total/dissolved), barium (total/dissolved), beryllium (total/dissolved),
bismuth(total/dissolved), bromide (dissolved), cadmium (total/dissolved), cobalt (total/dissolved)
chromium (total/dissolved), copper (total/dissolved), fluoride (total), lithium (total), molybdenum
(total/dissolved), Kjeldhal Nitrogen (total/dissolved), nickel (total/dissolved), ortho-phosphate
(dissolved), phosphporous (total/dissolved), lead (total/dissolved), sulphur (total/dissolved), niobium
(total/dissolved), selenium (total/dissolved), silica (dissolved), tin (total/dissolved), strontium
(total/dissolved), tellurium (total/dissolved), titanium (total/dissolved), thallium (total/dissolved),
vanadium (total/dissolved), zinc (total/dissolved) and zirconium (total/dissolved).
7.4 Trial Spatial Plots for Identification of Temporal Outliers
EnviroInsite was used to generate trial spatial plots using uncensored data to identify background water
quality, as well as spatial and temporal trends, plus visual clustering and visible outliers. To accomplish
this, plots of contoured average values for each parameter of interest were generated which also
included smaller temporal plots for the same parameter adjacent to each well. The trial plots were then
reviewed to visually identify outliers based on the following:
Average value for a specific well location was biased by an outlier or based on a limited numberof sampling events
Average value and temporal values were not consistent with nearest neighbor value or withspatial and temporal trend
Consistent lower limits representative of a laboratory non-detect. Consistent lower bound toplotted results was interpreted as detection limit and not a background concentration for theparameter of interest
Multiple modes of water quality based on heterogeneity or direction of flow in aquifer. Typically first and last data points were not removed due to the potential for the data being part
of a trend prior to sampling at the location in question, or the beginning of a yet un-identifiedtrend
Contouring was done using the default interpretation routine used by EnviroInsite, which is the inverse
distance method. Contour intervals were typically chosen by dividing the difference between the

31 March 2011 26
MNRO Ambient Network Review 11-004
| Unit 32 – 10051 Highway 97, Lake Country, BC, V4V1P6 | 1.250.766.1030 | www.westernwater.ca |
maximum and minimum level, by a number between 5 and10. This reduced the number of colors [and
gradational differences between them] used in plotting, which enhanced the visual interpretation.
Examples of visual outliers are presented in Figure 20 through Figure 23.
7.5 Data Transformation
Based on the combined results of the statistical data analysis and the visual identification of temporal
trends using EnviroInsite, erroneous readings or “outliers” were removed [censored]. A summary of
the candidate outliers and transformation completed on each data set in provided in Table 7.
The original data sets used for the trial plots have been copied to the disk accompanying this report. It
may be that further, more complex, multi-parameter correlation assessment may determine that the
outliers are valid data points, presumably related to un-documented events, or as a result of factors that
have not been considered.
In addition to the suspected relationship between turbidity and total metals results, it is apparent that
some of the outliers are very likely related to mislabeling of samples. An obvious example of this occurs
in Grand Forks between WTN 7962 and WTN A, where the results for all parameters for a sampling
event on 18 September 2007 are inter-changed and appear in temporal plots as a high outlier in one well
and a low outlier in the other. There are also suspected transcription errors, where outliers are an
order of magnitude variant, inferring a wrong decimal point during entering of data.
The outputs of this work are the data input files for the EnviroInsite Software. The input files are small
in size, with the exception of the observation workbook [tab], which ranged from 288 lines [for 5 wells]
to 4474 lines for Grand Forks [43 wells]. Printouts are provided in Appendix C for EnviroInsite input
files for each site including workbooks [tabs] for wells, screens, constituents, stratigraphy, and the first
page only of observations. Copies of the un-censored data files [input and output] for each AWQM
network site are included, along with the final input and output files, on the disk which accompanies this
report.
7.6 Quality Assurance / Quality Control [QA/QC]
The following tools were incorporated to aid in Quality Assurance & Quality Control [QA/QC] of
data:
Automation of data assembly where possible, using MS Access and macros;

31 March 2011 27
MNRO Ambient Network Review 11-004
| Unit 32 – 10051 Highway 97, Lake Country, BC, V4V1P6 | 1.250.766.1030 | www.westernwater.ca |
Adjusting data sources to be comparable with each other [such that ordering of columns &
parameter listings were consistent]. Blank columns were added in to some spreadsheets to
ensure consistent column position for each parameter;
Adding header numbers to columns to facilitate consistent referencing;
Assigning labels to the parameters to facilitate/simplify referencing;
Maintaining consistency using a building block process by developing a template for one
parameter at one site, duplicating it for the remaining parameters at that same site, then using
the same complete file format/structure at other network sites;
Cross-checking, using macros and linked spreadsheets to compare data values between new
data files and original source data files; and,
Updates/Changes, as required, were applied to all files simultaneously to maintain consistency.
Copies of all source data files, MS Excel spreadsheets and MS Access databases used for data
conversion, analysis and QA/QC are provided on the disk that accompanies this report. A listing of the
files and brief metadata are provided in Appendix B.

31 March 2011 28
MNRO Ambient Network Review 11-004
| Unit 32 – 10051 Highway 97, Lake Country, BC, V4V1P6 | 1.250.766.1030 | www.westernwater.ca |
8. SOFTWARE TRAINING
Three licenses for EnviroInsite© [V.7] were provided to MNRO staff in Penticton and training on how
to use the software was provided. The purpose of the training was to allow MNRO staff to use the
software to communicate the findings of this study to colleagues and the general public. The training
was also geared towards development of a tool that could be used for analysis of other hydrogeological
data for other sites that presumably could be collected by MNRO independently of the AWQM
Networks.
The training included the following:
how to prepare input files in MS Excel;
how to import and geo-reference images;
how to produce spatial contour and temporal plots for chemistry;
how to use plan view for generation of cross-sections ;
how to prepare input files for cross-sections and interpret hydrostratigraphic units using geo-
statistical analysis; and,
how to prepare piper plots, stiff diagrams, scatter plots and time history charts.

31 March 2011 29
MNRO Ambient Network Review 11-004
| Unit 32 – 10051 Highway 97, Lake Country, BC, V4V1P6 | 1.250.766.1030 | www.westernwater.ca |
9. AMBIENT NETWORK ANALYSIS
Based on the site-specific objectives for the 6 networks and the guiding principles of monitoring outlined
by Wei & Cui [2004], a qualitative evaluation matrix was developed to assist with the analysis of each
network. The matrix is a spreadsheet divided into 5 fundamental network objectives including:
1. Spatial and depth coverage;
2. Suite of analytes and lab methods;
3. Sampling frequency;
4. Field methods and validation of data; and,
5. Analysis and reporting.
The matrix is based on standard performance evaluation principles, which include the selection of
measurement criteria and subsequent use of these criteria to determine the current performance or
operational status of what is being evaluated [in this case an AWQM network]. The remainder of the
process includes identification of changes that have occurred, followed by an assessment of what
options, if any, are appropriate in response to the changes noted.
For this assignment, the measurement criteria selected included the following:
a. Number, location of background water quality wells sufficient;
b. Coverage in areas of suspected impacts appropriate;
c. Spatial modes exist in aquifer chemistry;
d. Appropriate coverage in all formations, either hydraulically isolated ,or not;
e. Indicator parameters capable of identifying existing or potential water quality issues;
f. Continuity in parameters tested and the lab detection limits;
g. Possible to do a cation/anion charge balance on the resultant chemistry;
h. Opportunity to use surrogate monitoring methods/parameters;
i. Appropriate frequency for primary and secondary well locations and analytes;

31 March 2011 30
MNRO Ambient Network Review 11-004
| Unit 32 – 10051 Highway 97, Lake Country, BC, V4V1P6 | 1.250.766.1030 | www.westernwater.ca |
j. Make sense to sample for seasonal variability;
k. Lab results subjected to immediate QA/QC analysis, such that re-testing is possible of samples
that still reside at the laboratory; and,
l. Data regularly analyzed for gaps, trends, etc and is the information used appropriately to
communicate with government agencies, water users and the general public
A template of the evaluation matrix, including more specific details regarding each criteria, is presented
in Table 8.
A summary of the water quality trends for the 20 parameters for all networks included in this
assessment is presented in Table 9.
9.1 Eagle Rock
The AWQM network at Eagle Rock has 6 wells that are clustered in the Industrial Park Area at the
south end of the aquifer within the portion that is unconfined. The majority of these wells [4] are
located within a small green area measuring 100 m by 100m that is bounded by Spallumcheen Way,
Crosier Rd and Pleasant Valley Road. We refer to this area as Monitoring Well Area 1 [MWA1].
Three of the 4 wells in MWA1 are public water supply wells operated by Eagle Rock [ERID] and Larkin
Improvement District [LID] and the 4th is MNRO Observation Well 180. Two more wells operated by
LID are used as monitoring wells: one located 350 m to the west of MWA1, along Crozier Road.
Another is located 1.2 km southeast of MWA1, along Highway 97, within the log storage yard of the
Tolko Mill. There are no nested wells [multiple level at a single location] in this network. The density
of monitoring wells is 1.3 wells/km2 and only approximately 33 percent of this aquifer is monitored, the
majority of monitoring locations being to the south and mid-gradient with regards to the direction of
flow through the aquifer.
A total of 6 sampling events have been completed in this network since July 1997. A total of 35 samples,
corresponding to approximately 5.8 samples per monitoring well have been collected. This is a
relatively sparse data set in terms of number of wells and number of sampling events, upon which to
complete a spatial and temporal assessment. The frequency of sampling has varied from yearly to every
5 years. The suite of parameters tested for during each sampling event has varied from a minimum of 8
parameters to a maximum of 19 for each sampling event. Of the 20 parameters of interest in this study,
all have been regularly included in the sampling events, except HCO3 [bicarbonate].
Spatial analysis of average values for each parameter infers that there are no spatial trends that are
consistent with aquifer boundaries, recharge areas and direction of flow. WTN 38720 [LID Well 4]¸
31 March 2011 31
MNRO Ambient Network Review 11-004
| Unit 32 – 10051 Highway 97, Lake Country, BC, V4V1P6 | 1.250.766.1030 | www.westernwater.ca |
consistently shows higher concentrations for all parameters except NO3. Initially, this well showed
higher values for NH4, but these have declined.
Temporal analysis infers that NH4 and pH are trending downwards and Ca, Cl, Fe, Mn, NO3 and specific
conductance are trending upwards. The current values for Fe are above GCDWQ standards in WTN
38720 [LID Well #4] and WTN 32340 [Obs Well 180]. Mn is also elevated above GCDWQ in well
[LID Well #4]. The data set for HCO3 is insufficient in size to allow for temporal analysis.
The original objective of the monitoring network in this area was to monitor NO3 and characterize
ambient water quality. The available information infers that the network has appropriately documented
NO3 levels in the immediate area of MWA1. However, there is insufficient spatial coverage in this
aquifer to establish background water quality and to determine if other areas of the aquifer have also
been impacted by NO3, specifically those areas to the north where agricultural land use is equally
dominant and the aquifer is unconfined.
The most up-gradient well in the existing network is WTN 38720 and this well shows elevated
concentrations for most of the parameters of interest relative to the other wells in the network. It is
apparent that this well has been impacted by industrial activities. There are also indicators of impact at
WTN 28325 and WTN 56810 [NO3 elevated or increasing]
Based on the network evaluation matrix as a guideline, consideration should be given to modifying the
network as follows:
1. The proximity of the 4 wells clustering in MWA1 infers that there is redundancy in sample
results. At least 2 of the 4 wells in this area could be eliminated;
2. Based on spatial and temporal trends for various parameters in WTN 38270, the frequency
and suite of analytes for analysis at this well should be increased to the maximum allowable
[yearly and all 20 analytes];
3. All wells should be sampled for all of the 20 parameters of interest during each sampling
event;
4. Turbidity and the corresponding dissolved fraction for each parameter of interest should
also be included;
5. Anecdotal information suggests that Tolko has several wells at their mill site that are
dedicated to an annual sampling program that is tied to the renewal of operational permits
with MNRO. Data from these wells exists back to the mid 1990s. Consideration of
historical data from these wells and incorporation of some of these wells into the AWQM
network will enhance the coverage of the south end of the aquifer and assist with the
analysis of issues related to WTN 38270; and,

31 March 2011 32
MNRO Ambient Network Review 11-004
| Unit 32 – 10051 Highway 97, Lake Country, BC, V4V1P6 | 1.250.766.1030 | www.westernwater.ca |
6. Additional monitoring wells should be established at the north end of the aquifer in the area
of Pleasant Valley Cross Road, between Pleasant Valley Road and Highway 97. Several
domestic wells already exist in this area.
The Network Evaluation Matrix for Eagle Rock is presented in Table 10 and spatial as well as temporal
plots for the various parameters are presented in Appendix D.
9.2 Oliver
The 2 AWQM networks at Oliver have 13 wells combined, most of which are located within close
proximity to the Okanagan Channel, or Tugulnuit Lake. The exception to this are WTN 21867, WTN
82376 [Town of Oliver Rockcliffe Well] and WTN 53199, which is a well at Sportsman’s Corner that
was constructed and tested by MNRO in 1980 that is no longer monitored. The density of monitoring
well coverage in this network is 2.1 wells/km2, is average as compared to the density of monitoring in
other AWQM networks. The spatial coverage in this network is very good in the north and central
portions of the aquifer as there are monitoring wells available at the 2 dominant recharge areas to the
aquifer well [Park Rill and Vaseux Creeks] and the placement of wells covers flow through the aquifer
along the majority of the flow path. The lower 25 percent of this aquifer, between the Town of Oliver
and Osoyoos Lake, has no monitoring well coverage. The majority of the monitoring wells in this
network are municipal water supply wells operated by the Town of Oliver. There are no nested
[multiple level at a single location] wells in this network.
A total of 10 sampling events have been completed in this network since 1985, with 2 events only prior
to 2003 and sampling completed annually every year since then. A total of 63 samples, corresponding to
approximately 4.8 samples per monitoring well have been collected. This is a relatively sparse data set
in terms of number of wells and number of sampling events. While the spatial coverage and number of
water quality results are adequate for a spatial analysis, the data set has limited utility for a temporal
assessment. The suite of parameters tested for during each sampling event has varied from a minimum
of 1 parameter [pH] to a maximum of 20 for each sampling event. Of the 20 parameters of interest in
this study, all have been regularly included in the sampling events, except HCO3. At least one well,
WTN 53199 [Sportsman’s Corner] has data for only one sampling event, when it was constructed and
tested in 1980.
Spatial analysis of average values for each parameter infer several natural chemistry trends in the two
aquifers [MNRO 254 + 255], generally following the direction of flow in the aquifer from north to south.
Due to the contouring method employed by the EnviroInsite software and the low mineralization in
WTN 49935 at the north end [recharge] versus the elevated mineralization in WTN 21867 at the south
end, the visual trend could be misleading. There is no visual trend for As. There are also elevated
values for Fl, Mn, Na and SO4 at WTN 53199, suggesting that the ambient water quality from up-

31 March 2011 33
MNRO Ambient Network Review 11-004
| Unit 32 – 10051 Highway 97, Lake Country, BC, V4V1P6 | 1.250.766.1030 | www.westernwater.ca |
gradient of Sportman’s Corner within the Park Rill catchment is influenced by land use activity in that
area, prior to entering the area covered by the network. There are also higher levels of U at WTN
83011/83010, to the southwest of Tugulnuit Lake, which are above GCDWQ. WTN 21867 [Oliver
Rockcliffe Well] consistently shows higher concentrations for all parameters, with NO3 values exceeding
GCDWQ on some occasions.
Temporal analysis infers that NH4 and K are trending upwards. The data set for HCO3 is insufficient in
size to allow for temporal analysis.
The original objective of the monitoring network in this area was to monitor NO3 and characterize
ambient water quality. The available information infers that the network has appropriately documented
NO3 levels, both spatially and temporally.
Based on the network evaluation matrix as a guideline, consideration should be given to modifying the
network as follows:
1. Based on spatial and temporal trends for various parameters in WTN 62966, the frequency
and suite of analytes for analysis at this well should be increased to the maximum allowable
[yearly and all 20 analytes];
2. The Sportsman’s Corner Well [WTN 53199] should be included in the monitoring network;
3. All wells should be sampled for all of the 20 parameters of interest during each sampling
event;
4. Turbidity and the corresponding dissolved fraction for each parameter of interest should
also be included;
5. Anecdotal information suggests that The Town of Oliver has several additional wells
available for monitoring including, for example, CPR, Lions and Miller Road wells.
Consideration of historical data from these wells and incorporation of some of these wells
into the AWQM network will enhance the spatial coverage in this aquifer; and,
6. Additional monitoring wells should be established at the south end of the network area,
between Oliver and Osoyoos Lake to verify that NO3 impacts at the south end of the
existing coverage do not extend further down-gradient. There are several candidate wells
located in this area, but the unconfined aquifer becomes relatively thin in this part of the
Valley and many of the existing wells penetrate confined aquifers in this area. It may be
necessary to construct dedicated multi-level [nested] observation points in this area.
31 March 2011 34
MNRO Ambient Network Review 11-004
| Unit 32 – 10051 Highway 97, Lake Country, BC, V4V1P6 | 1.250.766.1030 | www.westernwater.ca |
The Network Evaluation Matrix for Oliver is presented in Table 11 and spatial as well as temporal
plots for the various parameters are presented in Appendix E.
9.3 Osoyoos
The 2 AWQM networks at Osoyoos have 27 wells combined, including 9 domestic water wells, 7
nested piezometer sites constructed by MNRO in 1989 and 4 monitoring wells that are also used for
water supply. The density of monitoring well coverage in this network is 0.7 wells/km2, which is below
average as compared to other AWQM networks. However, the spatial coverage in this network is
relatively very good. The majority of the monitoring wells in this network are in close proximity to
either Osoyoos Lake or other smaller surface water bodies such as Peanut Lake and Elks Hall Lake.
A total of 24 sampling events have been completed in this network since 1985, with sampling completed
annually, except for 2010. A total of 433 samples, corresponding to approximately 18 samples per
monitoring well have been collected. The data set for these AWQM networks is significantly populated
and there is sufficient data for spatial and temporal analysis. The suite of parameters tested for during
each sampling event has varied from a minimum of 1 parameter [pH] to a maximum of 20 for each
sampling event. Of the 20 parameters of interest in this study, all have been regularly included in the
sampling events, except HCO3.
Spatial analysis of average values for each parameter of interest do not infer any trends across each
aquifer that would be related to groundwater flow direction, specifically chemistry differences that could
be differentiated between areas of recharge and discharge. There are no identifiable trends or elevated
point values for Alkalinity, As, NH4, Ca, Fl, hardness, Mg, Na, NO2, SO4 and pH.
There are several indications of impacts in the aquifer as noted by clustering of elevated values for
certain parameters in relation to suspected up-gradient contaminant sources. The most relevant of
these is extensive elevated NO3 levels along Highway 97 to the north of the Town of Osoyoos, with the
highest values being centered in proximity to WTN 14402. Lower NO3 levels, but still high and of
concern with regards to drinking water quality, also exist in the areas along Osoyoos Lake [WTN
93982, WTN B, WTN 82537] and to the west of Peanut Lake in WTN 93990, 93989D and WTN
93987, plus in the area of Elks Hall Lake in WTN 93991.
Elevated K is noted in WTN 14402 on the west side of the lake and in WTN 14406 on the east side.
Both of these areas are within or down-gradient of agricultural areas. The possible source of elevated K
could be NPK type fertilizers used for agriculture. There are also elevated levels of Cl, in WTN 19166
and WTN C. These are interpreted as being due to on-site [domestic] sewage disposal systems in these
areas. Further investigation is necessary to verify if this is the case. Contouring suggests that HCO3 is
elevated in the area of WTN 93982 S/D, WTN B and WTN 23677. The interpretation of HCO3 is

31 March 2011 35
MNRO Ambient Network Review 11-004
| Unit 32 – 10051 Highway 97, Lake Country, BC, V4V1P6 | 1.250.766.1030 | www.westernwater.ca |
based on a very limited data set; however the possible reasons for the higher levels in these areas
should be investigated.
Also of potentially significant importance is the elevated Fe levels in many wells located in close
proximity to surface water [Lake Osoyoos, Peanut Lake and Elks Hall Lake]. It is possible that the
elevated values seen at these location is due to turbidity in collected samples, with the exception of
consistent high levels in WTN 93984 S. This needs to be further investigated.
The original objective of the monitoring networks in this area was to monitor NO3 and characterize
ambient water quality. The available information infers that the network has appropriately documented
NO3 levels, both spatially and temporally.
Based on the network evaluation matrix as a guideline, consideration should be given to modifying the
network as follows:
1. Based on spatial and temporal trends for various parameters in WTN 14402, the frequency
and suite of analytes for analysis at this well should be increased to the maximum allowable
[yearly and all 20 analytes];
2. All wells should be sampled for all of the 20 parameters of interest during each sampling
event; and,
3. Turbidity and the corresponding dissolved fraction for each parameter of interest should
also be included.
The Network Evaluation Matrix for Osoyoos is presented in Table 12 and spatial as well as temporal
plots for the various parameters are presented in Appendix F.
9.4 Grand Forks
The AWQM network at Grand Forks includes 21 sample points at 28 sites that provide appropriate
spatial coverage of the 2 dominant recharge areas [from north and southwest], the dominant agricultural
areas [south, west and northwest] and the down-gradient portions of the aquifer to the east. Assuming
one sample location at each nested monitoring site, the density of monitoring well coverage in this
network is 1.8 wells/km2, which is average. Approximately half of the monitoring wells in this network
are dedicated monitoring wells constructed by MNRO in 1989. Many of these locations are nested
wells and are located to the south of the Kettle River along Carson Road. Several monitoring wells are
also municipal or irrigation wells operated by the City of Grand Forks and the various water utilities in

31 March 2011 36
MNRO Ambient Network Review 11-004
| Unit 32 – 10051 Highway 97, Lake Country, BC, V4V1P6 | 1.250.766.1030 | www.westernwater.ca |
the area [Sion, Covert and Almond Gardens IDs]. There are also some domestic wells in strategic
locations that are used as monitoring wells.
A total of 21 sampling events have been completed in this network since 1985, with 2 events only prior
to 1998 and sampling completed annually every year since then. A total of 443 samples, corresponding
to approximately 18.5 samples per monitoring well have been collected. The data set for the AWQM
network is the most populated of all of the networks addressed and there is sufficient data for spatial
and temporal analysis. The suite of parameters tested for during each sampling event has varied from a
minimum of one parameter [pH] to a maximum of 20 for each sampling event. Of the 20 parameters of
interest in this study, all have been regularly included in the sampling events, except HCO3.
Spatial analysis of average values for each parameter infers only a limited number of trends which are
attributable to natural flow in the aquifer. Such trends include higher TDS, hardness and specific
conductance levels in the north, presumably indicative of higher mineralized groundwater from the
Grandby Valley entering the area from the north. There are no identifiable trends or elevated point
values for As, HCO3, Fl, Mg and NO2.
There are several indications of impacts in the aquifer as noted by clustering of elevated values for
certain parameters in relation to suspected up-gradient contaminant sources. The most relevant of
these is extensive elevated NO3 levels in the southeast corner of the network area, centered around
WTN 59170, WTN 59171, WTN 37623 to the south of the airport and WTN 7990 and WTN 7873 to
the east of the airport. These areas are within intensive agriculture areas, or immediately down-gradient
with respect to the direction of groundwater flow. There are also elevated values for K and U in these
areas. The possible source of elevated K could be NPK type fertilizers used for agriculture.
A second area of suspected impacts is to the immediate east and south of the large industrial complex
along 2nd St and 65th Avenue. There are elevated values for Na and Fe, as well as lower values for pH in
this area.
A third area of suspected impacts is at Boundary Hospital. There are indications of elevated Cl, SO4,
specific conductance, and NO3. There is also elevated alkalinity in a wider area in the north that
includes the Hospital and WTN 7962.
Temporal analysis infers that NO3 levels are declining in most areas and Cl increasing in many others.
The data set for HCO3 is insufficient in size to allow for temporal analysis.
The original objective of the monitoring network in this area was to monitor NO3 and characterize
ambient water quality. The available information infers that the network has appropriately documented
NO3 levels, both spatially and temporally.
Based on the network evaluation matrix as a guideline, consideration should be given to modifying the
network as follows:

31 March 2011 37
MNRO Ambient Network Review 11-004
| Unit 32 – 10051 Highway 97, Lake Country, BC, V4V1P6 | 1.250.766.1030 | www.westernwater.ca |
1. Based on spatial and temporal trends for various parameters in WTN 35526, WTN 14947,
WTN 58625, WTN 7873, WTN 59170/59171 and WTN 37623, the frequency and suite of
analytes for analysis at these wells should be increased to the maximum allowable [yearly
and all 20 analytes];
2. All wells should be sampled for all of the 20 parameters of interest during each sampling
event;
3. Turbidity and the corresponding dissolved metal fraction for each parameter of interest
should also be included; and,
4. Sion ID Well #4 should be included as a permanent monitoring well in the network.
The Network Evaluation Matrix for Grand Forks is presented in Table 13 and spatial as well as
temporal plots for the various parameters are presented in Appendix G.

31 March 2011 38
MNRO Ambient Network Review 11-004
| Unit 32 – 10051 Highway 97, Lake Country, BC, V4V1P6 | 1.250.766.1030 | www.westernwater.ca |
10. CONCLUSIONS AND RECOMMENDATIONS
In conclusion, the methodology utilized for this assignment, which combines statistical analysis with the
plotting of data in a spatial and temporal format, is very effective in identifying outliers, data gaps and
trends in water quality data.
The degree of effort required to translate tables from the current spreadsheets used by MNRO into
spreadsheets that are efficient for identification of statistical values and comparison against GCDWQ, is
considerable. Although this work was completed with macros, it is not a user-friendly process. The
QA/QC process is also very detailed and not easily followed.
A comparison between the effectiveness of statistical methods for data validation and QA/QC, as
opposed to visual methods utilizing the EnviroInsite© software, suggests the software is capable of
identifying outliers as effectively as the statistical methods. The EnviroInsite© software represents a
significant step-forward for MNRO staff, which enables the continual updating of any water quality
database which is stored in MS Excel or MS Access and the ability to complete regular analysis of both
spatial and temporal trends.
In conclusion, we believe that the EnviroInsite© software is capable of visually identifying outliers and
therefore, more rigorous QA/QC of data is not warranted. However, should such additional QA/QC
be required, it is recommended that commercial software for statistical analysis of water quality data be
utilized. The EnviroInsite© software has been designed to work with a statistical package called
EQUIS©, but there are other software packages available that will do the statistical analysis appropriately.
More specific conclusions and recommendations are provided in bullet form as follows:
C1 With the exception of the Eagle Rock, all of the AWQM networks have been relatively successful
in documenting baseline water quality conditions and identifying trends in parameters of interest
related to the land use and aquifer setting;
C2 There are an insufficient number of sampling events and sampling locations available for the Eagle
Rock AWQM Network to allow for appropriate spatial and temporal analysis;
C3 All AWQM networks have issues relating to consistency of parameters included for testing, with
the frequency and regularity of sampling and with the application of consistent field methods for
the collection of samples;

31 March 2011 39
MNRO Ambient Network Review 11-004
| Unit 32 – 10051 Highway 97, Lake Country, BC, V4V1P6 | 1.250.766.1030 | www.westernwater.ca |
C4 Eagle Rock does not have appropriate up-gradient [background] sampling locations, or
appropriate spatial coverage to the north, east and south of existing network footprint area;
C5 Grand Forks has at least two modes for background concentrations for many parameters; the
source water from the Grandby River Watershed influencing background concentrations in the
north of the aquifer and the source water from the Kettle River Watershed influencing
concentrations at the southwest corner of the aquifer;
C6 The majority of sampling completed to date has been for total metals analysis, for comparison
against acceptable concentrations and aesthetic objectives outlined GCDWQ. Sample results
indicate a significant number of outliers for total metal concentrations for, among others, arsenic
[As], iron [Fe], manganese [Mn] and uranium [U]. Total metals analysis for metals such as these
can be significantly influenced by field sampling methods which do not remove turbidity;
C7 Within the Eagle Rock AWQM Network, WTN 38720 [Larkin Well #4] has significantly different
chemistry than the other wells monitored in the network. In consideration of the up-gradient
position of this well in comparison to the others, the chemistry infers the water quality in this
area of the aquifer has been impacted;
C8 Within the Oliver AWQM Network, WTN 82376 has significantly higher NO3 levels than other
wells in the area. There is a localized source of nitrogen in this area that influences NO3, NO2
and NH4 levels. This is likely related to agricultural activity in the area. In general NO3 levels are
decreasing in the area, possibly due to more awareness of sustainable application of fertilizers.
SO4 levels are also decreasing. There is also an upward trend in potassium [K], which could also
be related to NPK type fertilizers;
C9 Elevated Uranium [U] also exists in wells to the southeast of Tugulnuit Lake in the Oliver AWQM
Network. The variability in results suggests these levels could be associated with higher turbidity,
which needs to be confirmed;
C10 Within the Osoyoos AWQM Network, there are elevated NO3 levels to the north of the Town
and along the highway, specifically in the immediate area of WTN 14402. There are also isolated
areas where chloride [Cl] is elevated above background levels but still significantly lower than
GCDWQ. These areas are believed to be where on-site sewage disposal is utilized;
C11 Within the Grand Forks AWQM Network, there are at least 2 areas where NO3 levels are
elevated. These include the north end of the aquifer in the area of WTN 35526 and in the south
east in the area of WTN 59171, WTN 37623, WTN 7990 and WTN 7873. These same areas

31 March 2011 40
MNRO Ambient Network Review 11-004
| Unit 32 – 10051 Highway 97, Lake Country, BC, V4V1P6 | 1.250.766.1030 | www.westernwater.ca |
also have elevated potassium [K]. Elevated levels of both NO3 and K could be related to fertilizer
application. However, nitrate levels are gradually decreasing in the aquifer;
C12 Point source contamination is suggested in the area of Boundary Hospital, due to elevated levels
for Cl, NO3, SO4 and specific conductance; and,
C13 Point source contamination is also suggested in the area of the large industrial complex in the area
of 2nd Street and 65th Avenue. There are trends in the nearby monitoring well, WTN 59167, of
decreasing pH and increasing iron [Fe] and sodium [Na].
Based on the above conclusions, the following recommendations are provided:
R1 All AWQM networks should be more regularly sampled and the suite of parameters included
should continue to include total metals for comparison against historical results and GCDWQ.
However, the suite of parameters should be expanded to include major cations/anions such that a
charge balance check can be completed. Turbidity should also be included to identify where total
metals results are potentially impacted by sediment in samples. Consideration should also be given
to testing for dissolved metals, not as a replacement for total metals, but to compliment the total
metals results and identify where the results for total metals analysis may be misleading;
R2 Standard protocols for field sampling and data validation should be implemented for the
preservation of data quality. This includes more prescriptive sampling methods and QA/QC
checking of data immediately after entering results in the EMS database, such that issues can be
identified and the samples re-tested in the lab before disposal;
R3 At least 2 of the 4 closely clustered wells in the Eagle Rock AWQM Network could be removed
from the monitoring schedule. In lieu of these wells, establish two additional monitoring locations
to the north in the same aquifer;
R4 There are available wells at the south end of the Eagle Rock Aquifer that could be used for
monitoring;
R5 The Oliver AWQM Network is functioning appropriately. If anything, more regular monitoring is
prudent in WTN 53199, which is within the source area of recharge from the Park Rill
Watershed. The Park Rill Watershed has considerable agricultural activity;
R6 Additional, more frequent and comprehensive monitoring is warranted in the Oliver Area within
WTN 21867 and nearby wells, to identify the source of nitrate in this area;
31 March 2011 41
MNRO Ambient Network Review 11-004
| Unit 32 – 10051 Highway 97, Lake Country, BC, V4V1P6 | 1.250.766.1030 | www.westernwater.ca |
R7 For the Osoyoos AWQM Network, consideration should be given to removing some of the
nested monitoring well locations from the monitoring schedule. There does not appear to be
significant differences in chemistry results between the aquifer depths sampled. In lieu of the
second sampling depth at each nested monitoring well, there could be additional wells sampled on
the east side of the lake and on the west side to the north;
R8 Additional, more frequent and comprehensive monitoring is warranted in the Osoyoos Area
within WTN 14402 to identify the source of nitrate in this area;
R9 For the Grand Forks AWQM Network, consideration should be given to removing some of the
nested monitoring well locations from the monitoring schedule. There does not appear to be
significant differences in chemistry results between the aquifer depths sampled. In lieu of the
second sampling depth at each nested monitoring well, there could be additional wells sampled at
the extreme north end of the aquifer to better document the water quality coming from the
north, or at the east end of the aquifer to have better spatial coverage down-gradient of the
industrial and agricultural activities in this area;
R10 In Grand Forks, the type and fate of the waste stream at Boundary Hospital needs to be verified
and, if it is determined that part of the waste stream is disposed of to ground, this activity should
be stopped; and,
R11 The identification of spatial and temporal trends at these AWQM network sites in relation to land
use as well as an understanding of the hydrogeology in the area, requires a knowledgeable
hydrogeologist in the role as the final QA/QC step. This will greatly assist in the identification of
field or laboratory errors that may have otherwise gone unnoticed, and will provide for the best
chance to understand the meaning of the reported results.
31 March 2011 42
MNRO Ambient Network Review 11-004
| Unit 32 – 10051 Highway 97, Lake Country, BC, V4V1P6 | 1.250.766.1030 | www.westernwater.ca |
11. LIMITATIONS AND USE OF THIS REPORT
This report has been provided by Western Water Associates Ltd. for the particular purpose outlined in
the work scope presented in the preamble of this document. Any use which a third party makes of this
report, or any reliance on or decisions to be made based on it, are the responsibility of such third
parties. Western Water Associates Ltd. accepts no responsibility for damages, if any, suffered by any
third party as a result of decisions made or actions based on this report. Additional restrictions and
limitations that apply to this assignment are outlined in the attached Report Limitations.

31 March 2011 43
MNRO Ambient Network Review 11-004
| Unit 32 – 10051 Highway 97, Lake Country, BC, V4V1P6 | 1.250.766.1030 | www.westernwater.ca |
12. CLOSURE
We trust that the professional opinions and advice presented in this document are sufficient for your
current requirements. Please note that there are restrictions and limitations that apply to the scope of
our services, as outlined in the attached page of Report Limitations. Should you have any questions, or
if we can be of further assistance in this matter, please contact the undersigned.
WESTERN WATER ASSOCIATES LTD.
Remi Allard, M. Eng., P. Eng.
Senior Hydrogeologist, Groundwater Engineer
Bryer Manwell, M.Sc., P. Eng.
Hydrogeologist
Attachments
RA/ra/pa
C:\Users\Pina2\Desktop\3SL Co\2011\Projects 11\11-002 MoE Ambient Networks\Reporting\final report (draft sent to oleg 10 June).docx

31 March 2011 44
MNRO Ambient Network Review 11-004
| Unit 32 – 10051 Highway 97, Lake Country, BC, V4V1P6 | 1.250.766.1030 | www.westernwater.ca |
REFERENCES
1. Allen (2001) Groundwater and Climate Change: A Case Study Sensitivity Analysis for the Grand
Forks aquifer, Southern British Columbia, prepared for the BC the Groundwater Section, BC
Ministry of Environment, Lands and Parks
2. Allen et al (2004) Climate Change and Groundwater: A Modeling Approach for Identifying Impacts
and Resource Sustainability in the Central Interior of British Columbia, prepared for Climate Change
Action Fund, Natural Resources Canada
3. Allen, Wei et al (2010) State of Understanding of the Grand Forks Aquifer, SFU and BC Ministry of
Environment
4. Alley et al. (1999) Sustainability of Ground-Water Resources, United States Geological Survey (USGS)
Circular 1186. http://pubs.usgs.gov/circ/circ1186/5. Ballek (2008) Audit of Observation Well Water Quality. A Review of Water Chemistry Data from British
Columbia Observation Wells in Class 1A Aquifers, BC Ministry of Environment, Water and Air Monitoring
and reporting Section
6. Badry, A. (1974) Construction and Testing of New Well for Eagle Rock Waterworks District., E. Livingston
7. Dessouki (2009) Canada-British Columbia Water Quality Monitoring Agreement, Water Quality Assessment
of the Moyie River at Kings Gate (1997 – 2007), report prepared by BC Ministry of Environment for BC
Ministry of Environment and Environment Canada
8. Fulton, R. J. (1975) Quaternary Geology and Geomorphology, Nicola-Vernon Area, British Columbia.
Geological Survey Memoir 380, Energy, Mines and Resources Canada.
9. Golder Associates Ltd (2003) Phase I Aquifer Protection Planning , Eagle Rock Aquifer , Spallumcheen BC,
report for District of Spallumcheen
10. Golder et al (2009) Groundwater Objectives 2 and 3, Okanagan Water Supply and Demand Project, report
prepared for the Okanagan Basin Water Board
11. Hodge, W.S. (1992) Water Quality (Nitrate) Reconnaissance Study. Oliver, B.C. Groundwater Section, Water
Management Division.
12. Hodge, W.S. (1985) Groundwater Quality Monitoring and Assessment Program. Assessment of Water Quality
and Identification of Water Quality concerns and Problem Areas - Osoyoos. Water Management Branch,
Ministry of Environment, Victoria, British Columbia.
13. Hodge, W.S. (1989) Assessment of Water Quality and Identification of Water Quality concerns and Problem
Areas - Osoyoos 1989. Water Management Branch, Ministry of Environment, Victoria, British Columbia.
14. Jones, G.A. (1959) Geological Survey of Canada. Memoir 296. Vernon Map-Area, B.C. Map 1059A,
Department of Mines and Technical Surveys, Canada.
15. Kelly, C.C. and R.H. Spilsbury (1949) Soil Survey of the Okanagan and Similkameen Valleys, British Columbia.
Report No. 3, Dominion Department of Agriculture. Map Sheet No. 3.
16. Kohut (2007) Observation Well Network Review Okanagan region , Prepared for BC Ministry of
Environment, Water Stewardship Division
17. Kohut,.A.P. (1979) Municipality of Spallumcheen, Larkin-EagleRock Area-Groundwater Investigation,
Memorandum Report, Groundwater Section, NTS File 82L/6 #34.
18. Kohut et al (2009) Provincial Observation Well Network Review British Columbia, report prepared for
Water Stewardship Division, BC Ministry of Environment

31 March 2011 45
MNRO Ambient Network Review 11-004
| Unit 32 – 10051 Highway 97, Lake Country, BC, V4V1P6 | 1.250.766.1030 | www.westernwater.ca |
19. Kreye et al (1998) An Aquifer Classification System for Groundwater Management in British Columbia, BC
Ministry of Environment, Water Management Division, Victoria
20. Le Breton, E. G. (1972) A Hydrogeological Study of the Okanagan River Basin. Canada-British Columbia
Okanagan Basin Agreement Technical Supplement II Final Report. Water Resources Service, Department of
Lands, Forests, and Water Resources, British Columbia.
21. Livingston, Ed. (1983) Test Drilling and Construction and Testing of 200 mm Diameter Production Well For
Osoyoos Indian Band. Prepared for David Nairne and Associates Ltd. by Pacific Hydrology Consultants Ltd.
22. Nasmith, H. (1962) Late Glacial History and Surficial Deposits of the Okanagan Valley, British Columbia.
Bulletin No. 46, Department of Mines and Petroleum Resources, British Columbia.
23. Nielsen-Welch & Allen (2007) Groundwater and Hydrogeological Conditions in the Okanagan Basin, British
Columbia, A State-of-the Basin Report, prepared for the Okanagan Basin Water Board.
24. Monahan (2006) North Okanagan Mapping Project, report for the Groundwater Assessment of the Okanagan
Basin Project,
25. Ping, J., Nichol, C., Wei, A. (2010) Numerical Groundwater Modeling in the Deep Creek Watershed, Final
report on North Okanagan Groundwater Characterization and Assessment project. Submitted to B.C.
Ministry of Environment (Ministry of Natural Resources Operations). 208 pages
26. Province of British Columbia Ministry of Environment - Water Resources Atlas and WELLS Database,
web-hosted informational database with graphical interface. Accessed 15 March 2009 at http://
srmapps.gov.bc.ca/apps/wrbc/
27. Toews, M. (2007) Modeling Climate Change Impacts on Groundwater Recharge in a Semi-Arid region,
Southern Okanagan, British Columbia, M.Sc. Thesis, Simon Fraser University
28. Wei et al (2004) Hydrogeologic Mapping and Characterization of the Aquifer at Grand Forks, Southern
British Columbia to Support Local Planning and Protection
29. Wei & Cui (2000) Ambient Groundwater Quality Monitoring and Assessment in BC: Current Status and
Future Directions, report by BC Water Management Branch

31 March 2011 46
MNRO Ambient Network Review 11-004
| Unit 32 – 10051 Highway 97, Lake Country, BC, V4V1P6 | 1.250.766.1030 | www.westernwater.ca |
Western Water Associates Ltd.Standard Report Limitations
1. This Document has been prepared for the particular purpose outlined in the work scope thathas been mutually agreed to with the Client.
2. The scope and the period of service provided by Western Water Associates Ltd are subject torestrictions and limitations outlined in subsequent numbered limitations.
3. A complete assessment of all possible conditions or circumstances that may exist at the Site orwithin the Study Area referenced, has not been undertaken. Therefore, if a service is notexpressly indicated, it has not been provided and if a matter is not addressed, no determinationhas been made by Western Water Associates Ltd. in regards to it.
4. Conditions may exist which were undetectable given the limited nature of the enquiry thatWestern Water Associates Ltd. was retained to undertake with respect to the assignment.Variations in conditions may occur between investigatory locations, and there may be specialconditions pertaining to the Site, or Study Area, which have not been revealed by theinvestigation and which have not therefore been taken into account in the Document.Accordingly, additional studies and actions may be required.
5. In addition, it is recognised that the passage of time affects the information and assessmentprovided in this Document. Western Water Associates Ltd’s opinions are based uponinformation that existed at the time of the production of the Document. It is understood thatthe Services provided allowed Western Water Associates Ltd to form no more than an opinionof the actual conditions of the Site, or Study Area, at the time the site was visited and cannot beused to assess the effect of any subsequent changes in the quality of the Site, or Study Area, northe surroundings, or any laws or regulations.
6. Any assessments made in this Document are based on the conditions indicated from publishedsources and the investigation described. No warranty is included, either expressed or implied,that the actual conditions will conform exactly to the assessments contained in this Document.
7. Where data supplied by the Client or other external sources, including previous siteinvestigation data, have been used, it has been assumed that the information is correct unlessotherwise stated.
8. No responsibility is accepted by Western Water Associates Ltd for incomplete or inaccuratedata supplied by others.
9. The Client acknowledges that Western Water Associates Ltd may have retained sub-consultants affiliated to provide Services. Western Water Associates Ltd will be fullyresponsible to the Client for the Services and work done by all of its sub-consultants andsubcontractors. The Client agrees that it will only assert claims against and seek to recoverlosses, damages or other liabilities from Western Water Associates Ltd.
10. This Document is provided for sole use by the Client and is confidential to it and its professionaladvisers. No responsibility whatsoever for the contents of this Document will be accepted toany person other than the Client. Any use which a third party makes of this Document, or anyreliance on or decisions to be made based on it, is the responsibility of such third parties.Western Water Associates Ltd. accepts no responsibility for damages, if any, suffered by anythird party as a result of decisions made or actions based on this Document.
Related Documents


