August, 2005 Final Report Prepared for: Aqua Survey, Inc. 469 Point Breeze Road Flemington, NJ 08822 Contract Number TD060905 Prepared by: Germano & Associates, Inc. 12100 SE 46th Place Bellevue, WA 98006 G&A Project No. DS-ASI-01 Lower Passaic River Restoration Project Sediment Profile Imaging Survey Of Sediment And Benthic Habitat Characteristics Of The Lower Passaic River

Welcome message from author
This document is posted to help you gain knowledge. Please leave a comment to let me know what you think about it! Share it to your friends and learn new things together.
Transcript

August, 2005
Final Report
Prepared for:Aqua Survey, Inc.
469 Point Breeze Road
Flemington, NJ 08822
Contract Number
TD060905
Prepared by:Germano & Associates, Inc.12100 SE 46th PlaceBellevue, WA 98006
G&A Project No.
DS-ASI-01
Lower Passaic RiverRestoration Project
Sediment Profile Imaging
Survey Of Sediment And
Benthic Habitat Characteristics
Of The Lower Passaic River
Final Report
LOWER PASSAIC RIVER RESTORATION PROJECT
SEDIMENT PROFILE IMAGING SURVEY OF SEDIMENT AND BENTHIC HABITAT CHARACTERISTICS OF THE
LOWER PASSAIC RIVER, JUNE 2005
Prepared for
Aqua Survey, Inc.
469 Point Breeze Road Flemington, NJ 08822
Contract Number
TD060905
Prepared by
Germano & Associates, Inc. 12100 SE 46th Place
Bellevue, WA 98006
G&A Project No.
DS-ASI-01
August, 2005
ii
TABLE OF CONTENTS
LIST OF FIGURES..................................................................................................................................... iii
1.0 INTRODUCTION .................................................................................................................................. 1
2.0 MATERIALS AND METHODS........................................................................................................... 2 2.1 MEASURING, INTERPRETING, AND MAPPING SPI PARAMETERS ................................................... 4
2.1.1 Sediment Type......................................................................................................................... 4 2.1.2 Prism Penetration Depth ........................................................................................................ 5 2.1.3 Small-Scale Surface Boundary Roughness ............................................................................. 5 2.1.4 Thickness of Depositional Layers ........................................................................................... 6 2.1.5 Mud Clasts.............................................................................................................................. 6 2.1.6 Apparent Redox Potential Discontinuity Depth...................................................................... 7 2.1.7 Sedimentary Methane ............................................................................................................. 9 2.1.8 Infaunal Successional Stage ................................................................................................... 9 2.1.9 Organism-Sediment Index .................................................................................................... 11
2.2 USING SPI DATA TO ASSESS BENTHIC QUALITY & HABITAT CONDITIONS................................ 13 3.0 RESULTS.............................................................................................................................................. 16
3.1 GRAIN SIZE ................................................................................................................................ 16 3.2 DEPOSITIONAL LAYERS .............................................................................................................. 19 3.3 SURFACE BOUNDARY ROUGHNESS ............................................................................................ 19 3.4 PRISM PENETRATION DEPTH ...................................................................................................... 20 3.5 SEDIMENTARY METHANE........................................................................................................... 20 3.6 BENTHIC HABITAT CLASSIFICATIONS ........................................................................................ 21 3.7 APPARENT REDOX POTENTIAL DISCONTINUITY DEPTH ............................................................. 22 3.8 INFAUNAL SUCCESSIONAL STAGE.............................................................................................. 23 3.9 ORGANISM-SEDIMENT INDEX .................................................................................................... 24
4.0 DISCUSSION........................................................................................................................................ 25
5.0 REFERENCES CITED........................................................................................................................ 27 FIGURES APPENDIX A: SEDIMENT PROFILE IMAGE ANALYSIS RESULTS APPENDIX B: COORDINATES OF SAMPLING STATIONS
iii
LIST OF FIGURES Figure 1 SPI Benthic Camera Sampling Locations Figure 2 Operation of the sediment-profile camera during deployment Figure 3 Soft-bottom benthic community response to disturbance or organic
enrichment. Figure 4 Soft-bottom benthic community response to disturbance in freshwater
environments (from Soster and McCall 1990). Figure 5 Grain Size Major Mode (phi) Figure 6 Reddish silt-clay at Station 104 in Newark Bay near the mouth of the
Passaic River. Figure 7 Three representative profile images showing distinct layering of sand over
silt. From left to right: Station 123, Station 143 and Station 138. Figure 8 Three representative profile images showing layering of silt over sand.
From left to right: Station 53, Station 74 and Station 155. Figure 9 Representative profile images that each show multiple sedimentary layers.
Clockwise from top left: alternating layers of silt at Station 140, alternating layers of silt and sand at Stations 138 and 7, and alternating layers of silt and organic detritus (decayed leaf litter) at Station 145.
Figure 10 Photograph taken immediately following the intense rainfall event of June
22 showing an exposed mudbank with fresh erosional channels. Figure 11 Profile image from Station 101 showing a post-storm depositional layer
measuring 4.5 cm in thickness. Figure 12 Depositional layer thickness Figure 13 Prism penetration depths Figure 14 Examples of methane bubbles within layered silts.
iv
Figure 15 Methane bubbles within uniformly light-colored, silty sediment at Station 16. Surface depositional layer of sandy, light-colored sediment containing methane overlying black, highly anoxic silt-clay at depth at Station 52.
Figure 16 The image at left from Station 124 shows an ebullition track filled with
black sediment that has been brought up to the sediment surface by the action of rising methane bubbles. The image at right from Station 147 shows a small plume of sediment associated with an escaping methane bubble rising into the water column a few centimeters above the sediment-water interface
Figure 17 Average percentage of the imaged sediment area occupied by methane
bubbles at each station. Figure 18 Benthic habitat types observed at the SPI stations Figure 19 Examples of coarser sediment types found in the tidal freshwater section
of the river. Figure 20 Average apparent RPD depths at the Passaic River SPI stations. Figure 21 Infaunal successional stages at the Passaic River SPI stations. Figure 22 Examples of various successional stages at brackish water stations,
moving upriver from south to north. Figure 23 Examples of Stage III at tidal freshwater stations, moving upriver from
south to north. Figure 24 Median OSI values at the Passaic River SPI stations.
August, 2005 1
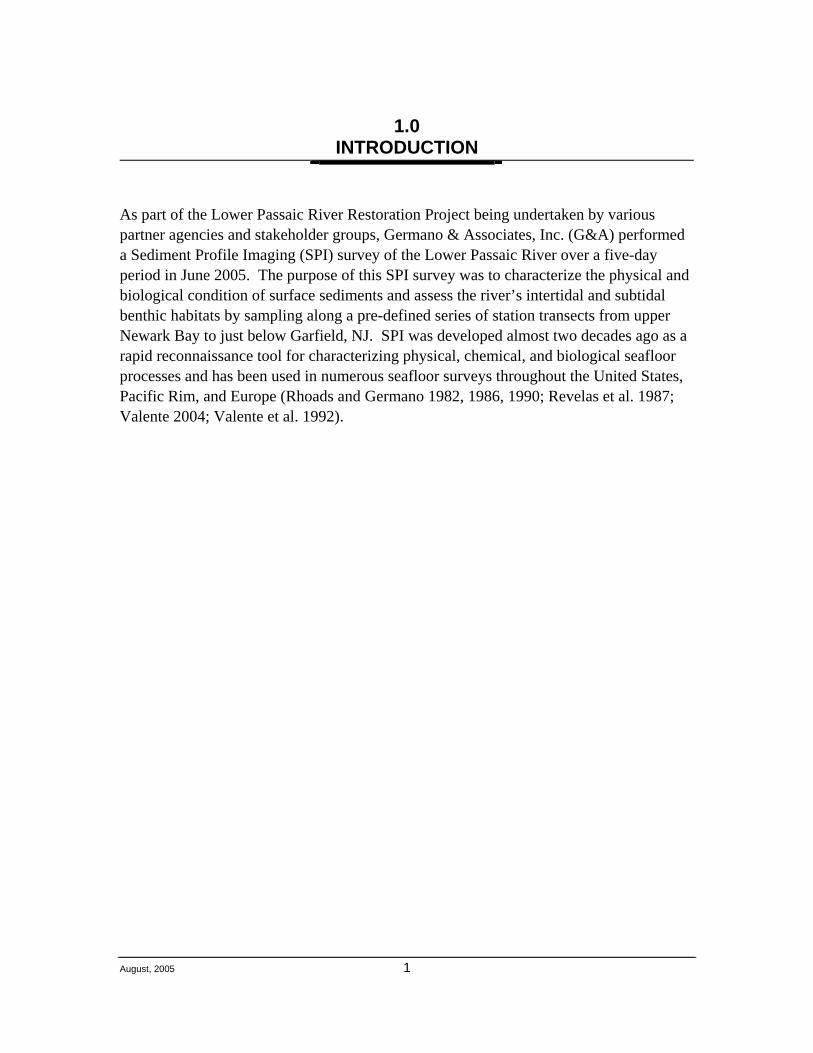
1.0 INTRODUCTION
As part of the Lower Passaic River Restoration Project being undertaken by various partner agencies and stakeholder groups, Germano & Associates, Inc. (G&A) performed a Sediment Profile Imaging (SPI) survey of the Lower Passaic River over a five-day period in June 2005. The purpose of this SPI survey was to characterize the physical and biological condition of surface sediments and assess the river’s intertidal and subtidal benthic habitats by sampling along a pre-defined series of station transects from upper Newark Bay to just below Garfield, NJ. SPI was developed almost two decades ago as a rapid reconnaissance tool for characterizing physical, chemical, and biological seafloor processes and has been used in numerous seafloor surveys throughout the United States, Pacific Rim, and Europe (Rhoads and Germano 1982, 1986, 1990; Revelas et al. 1987; Valente 2004; Valente et al. 1992).

August, 2005 2
2.0 MATERIALS AND METHODS
From June 20 through 24, 2005, scientists from G&A (responsible for SPI operation), Aqua Survey, Inc. (responsible for navigation/vessel support), and Earth Tech (project oversight) worked aboard Aqua Survey’s shallow-draft pontoon boat R/V Navesink to perform the SPI survey of the lower Passaic River. The field team collected two replicate sediment profile images at each of 134 stations (268 images total) using an Ocean Imaging Systems Model 3731D sediment profile camera. The stations were arranged in a series of 27 cross-river transects (T1 through T27) to allow characterization of both shallow, nearshore, intertidal areas and deeper subtidal areas within the main central channel of the river (Figure 1a-h). Five stations were sampled along each transect, with the exception of the northern-most transect T27 (4 stations). The Aqua Survey team operated the navigation system to ensure accurate positioning of the survey vessel at each sampling station. The coordinates for each sampling location were logged in the field and subsequently provided to G&A in tabular format by Aqua Survey on July 13, 2005. Navigation for the sampling effort was accomplished using a Differential Global Positioning System (DGPS) system capable of receiving the U.S. Coast Guard (USCG) beacon corrections. The system is capable of sub-meter (i.e., less than one-meter) horizontal position accuracy. The DGPS system was interfaced to a laptop computer running HYPACK® hydrographic survey software. HYPACK® provided the vessel captain with distance and direction to each sample station. The Ocean Imaging Systems Model 3731 sediment profile camera works like an inverted periscope. A Nikon D100 6-megapixel SLR camera with a 1-gigabyte compact flash card is mounted horizontally inside a watertight housing on top of a wedge-shaped prism. The prism has a Plexiglas® faceplate at the front with a mirror placed at a 45° angle at the back. The camera lens looks down at the mirror, which is reflecting the image from the faceplate. The prism has an internal strobe mounted inside at the back of the wedge to provide illumination for the image; this chamber is filled with distilled water, so the camera always has an optically clear path. This wedge assembly is mounted on a moveable carriage within a stainless steel frame. The frame is lowered to the seafloor on a winch wire, and the tension on the wire keeps the prism in its “up” position. When the frame comes to rest on the seafloor, the winch wire goes slack (see Figure 2) and the camera prism descends into the sediment at a slow, controlled rate by the dampening action of a hydraulic piston so as not to disturb the sediment-water interface. On the way down, it trips a trigger that activates a time-delay circuit of variable length (operator-selected) to allow the camera to penetrate the seafloor before any image is taken (a 15-second delay was used for this survey). The knife-sharp edge of the prism transects the
August, 2005 3
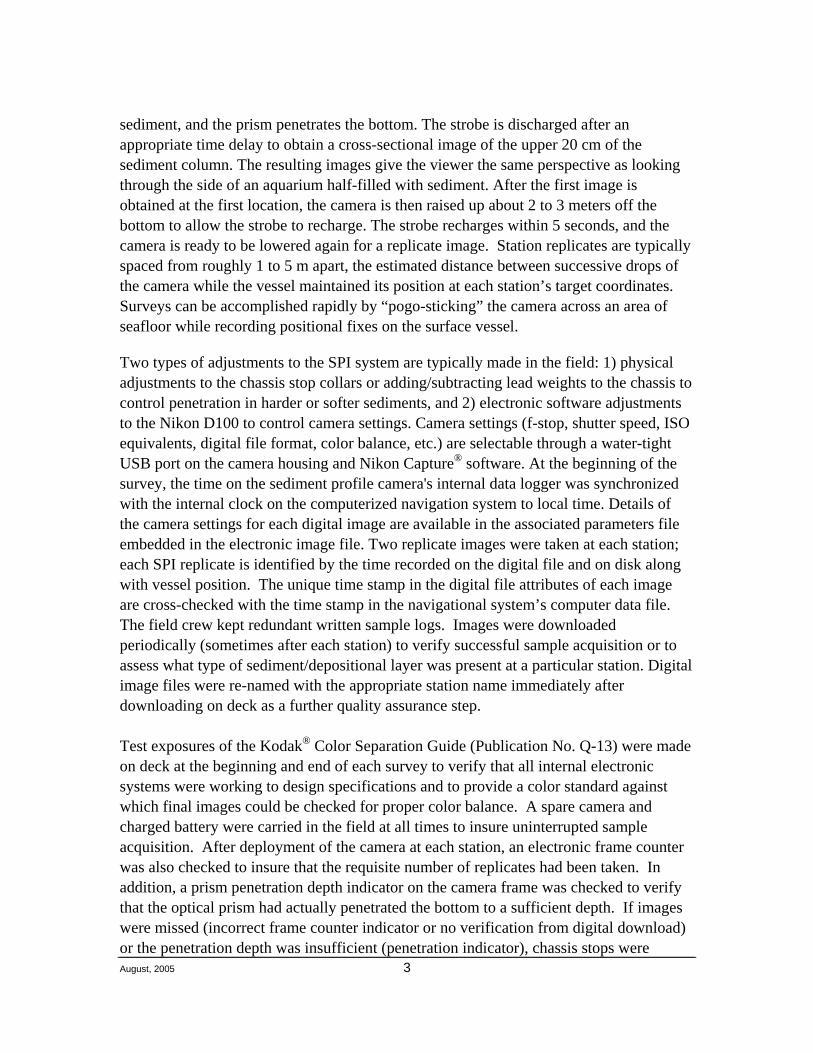
sediment, and the prism penetrates the bottom. The strobe is discharged after an appropriate time delay to obtain a cross-sectional image of the upper 20 cm of the sediment column. The resulting images give the viewer the same perspective as looking through the side of an aquarium half-filled with sediment. After the first image is obtained at the first location, the camera is then raised up about 2 to 3 meters off the bottom to allow the strobe to recharge. The strobe recharges within 5 seconds, and the camera is ready to be lowered again for a replicate image. Station replicates are typically spaced from roughly 1 to 5 m apart, the estimated distance between successive drops of the camera while the vessel maintained its position at each station’s target coordinates. Surveys can be accomplished rapidly by “pogo-sticking” the camera across an area of seafloor while recording positional fixes on the surface vessel.
Two types of adjustments to the SPI system are typically made in the field: 1) physical adjustments to the chassis stop collars or adding/subtracting lead weights to the chassis to control penetration in harder or softer sediments, and 2) electronic software adjustments to the Nikon D100 to control camera settings. Camera settings (f-stop, shutter speed, ISO equivalents, digital file format, color balance, etc.) are selectable through a water-tight USB port on the camera housing and Nikon Capture® software. At the beginning of the survey, the time on the sediment profile camera's internal data logger was synchronized with the internal clock on the computerized navigation system to local time. Details of the camera settings for each digital image are available in the associated parameters file embedded in the electronic image file. Two replicate images were taken at each station; each SPI replicate is identified by the time recorded on the digital file and on disk along with vessel position. The unique time stamp in the digital file attributes of each image are cross-checked with the time stamp in the navigational system’s computer data file. The field crew kept redundant written sample logs. Images were downloaded periodically (sometimes after each station) to verify successful sample acquisition or to assess what type of sediment/depositional layer was present at a particular station. Digital image files were re-named with the appropriate station name immediately after downloading on deck as a further quality assurance step. Test exposures of the Kodak® Color Separation Guide (Publication No. Q-13) were made on deck at the beginning and end of each survey to verify that all internal electronic systems were working to design specifications and to provide a color standard against which final images could be checked for proper color balance. A spare camera and charged battery were carried in the field at all times to insure uninterrupted sample acquisition. After deployment of the camera at each station, an electronic frame counter was also checked to insure that the requisite number of replicates had been taken. In addition, a prism penetration depth indicator on the camera frame was checked to verify that the optical prism had actually penetrated the bottom to a sufficient depth. If images were missed (incorrect frame counter indicator or no verification from digital download) or the penetration depth was insufficient (penetration indicator), chassis stops were

August, 2005 4
adjusted and/or weights were added or removed, and additional replicate images were taken. Changes in prism weight amounts, the presence or absence of mud doors, and chassis stop positions were recorded for each replicate image. Images were inspected at high magnification by the chief scientist on board to determine whether any stations needed re-sampling with different stop collar or weight settings. Following the completion of field operations, a G&A scientist utilized Bersoft Image Measurement© software version 3.06 (Bersoft, Inc.) to analyze each digital image for a standard suite of parameters (described below). Calibration information was determined by measuring the imaged scale on the Kodak® Color Separation Guide. This calibration information was applied to all SPI images analyzed. Linear and area measurements were recorded as number of pixels and converted to scientific units using the calibration information. Measured parameters were recorded on a Microsoft Excel© spreadsheet. G&A’s senior scientist (Dr. J. Germano) subsequently checked all these data as an independent quality assurance/quality control review of the original analyst’s measurements before final interpretation was performed. 2.1 MEASURING, INTERPRETING, AND MAPPING SPI PARAMETERS 2.1.1 Sediment Type The sediment grain-size major mode and range were visually estimated from the color images by overlaying a grain-size comparator that was at the same scale. This comparator was prepared by photographing a series of Udden-Wentworth size classes (equal to or less than coarse silt up to granule and larger sizes) with the SPI camera. Seven grain-size classes were on this comparator: >4 φ (silt-clay), 4-3 φ (very fine sand), 3-2 φ (fine sand), 2-1 φ (medium sand), 1-0 φ (coarse sand), 0 - (-)1 φ (very coarse sand), < -1 φ (granule and larger). The lower limit of optical resolution of the photographic system was about 62 microns, allowing recognition of grain sizes equal to or greater than coarse silt (> 4 φ). The accuracy of this method has been documented by comparing SPI estimates with grain-size statistics determined from laboratory sieve analyses. The comparison of the SPI images with Udden-Wentworth sediment standards photographed through the SPI optical system also was used to map near-surface stratigraphy such as sand-over-mud and mud-over-sand. When mapped on a local scale, this stratigraphy can provide information on relative sediment transport magnitude and frequency.
August, 2005 5
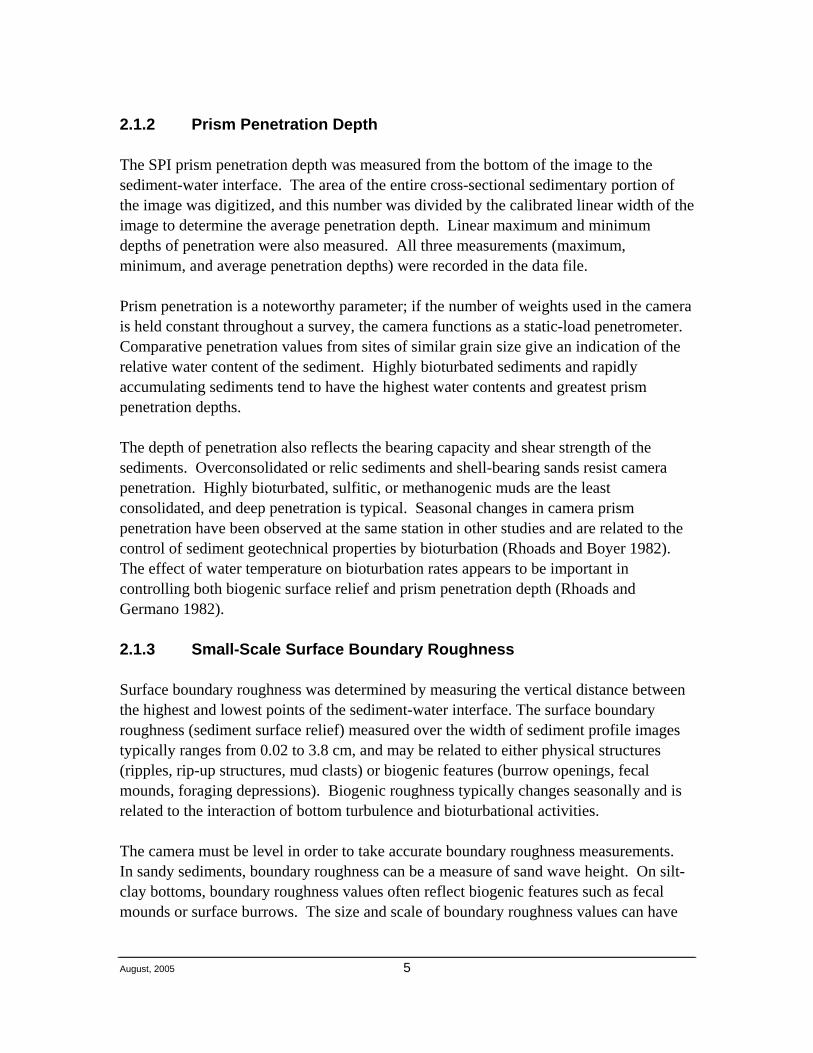
2.1.2 Prism Penetration Depth The SPI prism penetration depth was measured from the bottom of the image to the sediment-water interface. The area of the entire cross-sectional sedimentary portion of the image was digitized, and this number was divided by the calibrated linear width of the image to determine the average penetration depth. Linear maximum and minimum depths of penetration were also measured. All three measurements (maximum, minimum, and average penetration depths) were recorded in the data file. Prism penetration is a noteworthy parameter; if the number of weights used in the camera is held constant throughout a survey, the camera functions as a static-load penetrometer. Comparative penetration values from sites of similar grain size give an indication of the relative water content of the sediment. Highly bioturbated sediments and rapidly accumulating sediments tend to have the highest water contents and greatest prism penetration depths. The depth of penetration also reflects the bearing capacity and shear strength of the sediments. Overconsolidated or relic sediments and shell-bearing sands resist camera penetration. Highly bioturbated, sulfitic, or methanogenic muds are the least consolidated, and deep penetration is typical. Seasonal changes in camera prism penetration have been observed at the same station in other studies and are related to the control of sediment geotechnical properties by bioturbation (Rhoads and Boyer 1982). The effect of water temperature on bioturbation rates appears to be important in controlling both biogenic surface relief and prism penetration depth (Rhoads and Germano 1982). 2.1.3 Small-Scale Surface Boundary Roughness Surface boundary roughness was determined by measuring the vertical distance between the highest and lowest points of the sediment-water interface. The surface boundary roughness (sediment surface relief) measured over the width of sediment profile images typically ranges from 0.02 to 3.8 cm, and may be related to either physical structures (ripples, rip-up structures, mud clasts) or biogenic features (burrow openings, fecal mounds, foraging depressions). Biogenic roughness typically changes seasonally and is related to the interaction of bottom turbulence and bioturbational activities. The camera must be level in order to take accurate boundary roughness measurements. In sandy sediments, boundary roughness can be a measure of sand wave height. On silt-clay bottoms, boundary roughness values often reflect biogenic features such as fecal mounds or surface burrows. The size and scale of boundary roughness values can have

August, 2005 6
dramatic effects on both sediment erodibility and localized oxygen penetration into the bottom (Huettel et al. 1996). 2.1.4 Thickness of Depositional Layers Because of the camera's unique design, SPI can be used to detect the thickness of depositional and dredged material layers. SPI is effective in measuring layers ranging in thickness from 1 mm to 20 cm (the height of the SPI optical window). During image analysis, the thickness of the newly deposited sedimentary layers can be determined by measuring the distance between the pre- and post-disposal sediment-water interface. Recently deposited material is usually evident because of its unique optical reflectance and/or color relative to the underlying material representing the pre-disposal surface. Also, in most cases, the point of contact between the two layers is clearly visible as a textural change in sediment composition, facilitating measurement of the thickness of the newly deposited layer. 2.1.5 Mud Clasts When fine-grained, cohesive sediments are disturbed, either by physical bottom scour or faunal activity (e.g., decapod foraging), intact clumps of sediment are often scattered about the seafloor. These mud clasts can be seen at the sediment-water interface in SPI images. During analysis, the number of clasts was counted, the diameter of a typical clast was measured, and their oxidation state was assessed. The abundance, distribution, oxidation state, and angularity of mud clasts can be used to make inferences about the recent pattern of seafloor disturbance in an area. Depending on their place of origin and the depth of disturbance of the sediment column, mud clasts can be reduced or oxidized. In SPI images, the oxidation state is apparent from the reflectance (see Section 2.1.6). Also, once at the sediment-water interface, these mud clasts are exposed to bottom-water oxygen concentrations and currents. Evidence from laboratory microcosm observations of reduced sediments placed within an aerobic environment indicates that oxidation of reduced surface layers by diffusion alone is quite rapid, occurring within 6 to 12 hours (Germano 1983). Consequently, the detection of reduced mud clasts in an obviously aerobic setting suggests a recent origin. The size and shape of the mud clasts are also revealing; some clasts seen in the profile images are artifacts caused by the camera deployment (mud clots falling off the back of the prism or the wiper blade). Naturally-occurring mud clasts may be moved and broken by bottom currents and animals (macro- or meiofauna; Germano 1983). Over time, these naturally-occurring, large angular clasts become small and rounded.
August, 2005 7
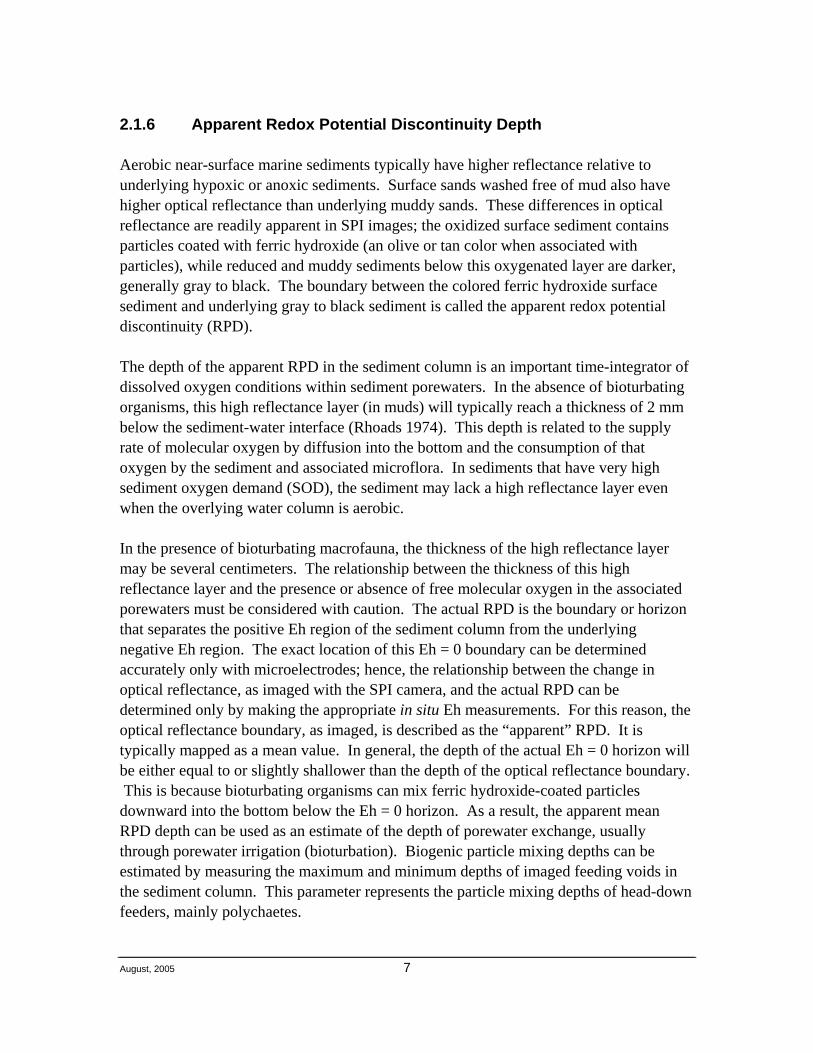
2.1.6 Apparent Redox Potential Discontinuity Depth Aerobic near-surface marine sediments typically have higher reflectance relative to underlying hypoxic or anoxic sediments. Surface sands washed free of mud also have higher optical reflectance than underlying muddy sands. These differences in optical reflectance are readily apparent in SPI images; the oxidized surface sediment contains particles coated with ferric hydroxide (an olive or tan color when associated with particles), while reduced and muddy sediments below this oxygenated layer are darker, generally gray to black. The boundary between the colored ferric hydroxide surface sediment and underlying gray to black sediment is called the apparent redox potential discontinuity (RPD). The depth of the apparent RPD in the sediment column is an important time-integrator of dissolved oxygen conditions within sediment porewaters. In the absence of bioturbating organisms, this high reflectance layer (in muds) will typically reach a thickness of 2 mm below the sediment-water interface (Rhoads 1974). This depth is related to the supply rate of molecular oxygen by diffusion into the bottom and the consumption of that oxygen by the sediment and associated microflora. In sediments that have very high sediment oxygen demand (SOD), the sediment may lack a high reflectance layer even when the overlying water column is aerobic. In the presence of bioturbating macrofauna, the thickness of the high reflectance layer may be several centimeters. The relationship between the thickness of this high reflectance layer and the presence or absence of free molecular oxygen in the associated porewaters must be considered with caution. The actual RPD is the boundary or horizon that separates the positive Eh region of the sediment column from the underlying negative Eh region. The exact location of this Eh = 0 boundary can be determined accurately only with microelectrodes; hence, the relationship between the change in optical reflectance, as imaged with the SPI camera, and the actual RPD can be determined only by making the appropriate in situ Eh measurements. For this reason, the optical reflectance boundary, as imaged, is described as the “apparent” RPD. It is typically mapped as a mean value. In general, the depth of the actual Eh = 0 horizon will be either equal to or slightly shallower than the depth of the optical reflectance boundary. This is because bioturbating organisms can mix ferric hydroxide-coated particles downward into the bottom below the Eh = 0 horizon. As a result, the apparent mean RPD depth can be used as an estimate of the depth of porewater exchange, usually through porewater irrigation (bioturbation). Biogenic particle mixing depths can be estimated by measuring the maximum and minimum depths of imaged feeding voids in the sediment column. This parameter represents the particle mixing depths of head-down feeders, mainly polychaetes.

August, 2005 8
The rate of depression of the apparent RPD within the sediment is relatively slow in organic-rich muds, on the order of 200 to 300 micrometers per day; therefore this parameter has a long time constant (Germano and Rhoads 1984). The rebound in the apparent RPD is also slow (Germano 1983). Measurable changes in the apparent RPD depth using the SPI optical technique can be detected over periods of 1 or 2 months. This parameter is used effectively to document changes (or gradients) that develop over a seasonal or yearly cycle related to water temperature effects on bioturbation rates, seasonal hypoxia, SOD, and infaunal recruitment. Time-series RPD measurements following a disturbance can be a critical diagnostic element in monitoring the degree of recolonization in an area by the ambient benthos (Rhoads and Germano 1986). The apparent mean RPD depth also can be affected by local erosion. The peaks of dredged material disposal mounds commonly are scoured by divergent flow over the mound. This scouring can wash away fines and shell or gravel lag deposits, and can result in very thin surface oxidized layer. During storm periods, erosion may completely remove any evidence of the apparent RPD (Fredette et al. 1988). Another important characteristic of the apparent RPD is the contrast in reflectance at this boundary. This contrast is related to the interactions among the degree of organic loading, the bioturbation activity in the sediment, and the concentrations of bottom-water dissolved oxygen in an area. High inputs of labile organic material increase SOD and, subsequently, sulfate reduction rates and the associated abundance of sulfide end products. This results in more highly reduced, lower-reflectance sediments at depth and higher RPD contrasts. In a region of generally low RPD contrasts, images with high RPD contrasts indicate localized sites of relatively large inputs of organic-rich material such as phytoplankton, other naturally-occurring organic detritus, dredged material, or sewage sludge. Because the determination of the apparent RPD requires discrimination of optical contrast between oxidized and reduced particles, it is difficult, if not impossible, to determine the depth of the apparent RPD in well-sorted sands of any size that have little to no silt or organic matter in them. When using SPI technology on sand bottoms, little information other than grain-size, prism penetration depth, and boundary roughness values can be measured. While oxygen has no doubt penetrated the sand beneath the sediment-water interface due to physical forcing factors acting on surface roughness elements (Ziebis et al. 1996; Huettel et al. 1998), estimates of the mean apparent RPD depths in these types of sediments are indeterminate with conventional white light photography.

August, 2005 9
2.1.7 Sedimentary Methane If organic loading is extremely high, porewater sulfate is depleted and methanogenesis occurs. The process of methanogenesis is indicated by the appearance of methane bubbles in the sediment column, and the number and total area covered by all methane pockets is measured. These gas-filled voids are readily discernable in SPI images because of their irregular, generally circular aspect and glassy texture (due to the reflection of the strobe off the gas bubble). 2.1.8 Infaunal Successional Stage The mapping of infaunal successional stages in soft-bottom environments is readily accomplished with SPI technology. In marine and brackish estuarine waters, these stages are recognized in SPI images by the presence of dense assemblages of near-surface polychaetes and/or the presence of subsurface feeding voids; both may be present in the same image. Mapping of successional stages is based on the theory that organism-sediment interactions in fine-grained sediments follow a predictable sequence after a major seafloor perturbation. This theory states that primary succession results in “the predictable appearance of macrobenthic invertebrates belonging to specific functional types following a benthic disturbance. These invertebrates interact with sediment in specific ways. Because functional types are the biological units of interest..., our definition does not demand a sequential appearance of particular invertebrate species or genera” (Rhoads and Boyer 1982). This theory is presented in Pearson and Rosenberg (1978) and further developed in Rhoads and Germano (1982) and Rhoads and Boyer (1982). However, this particular successional model could not be applied uniformly to all the stations sampled in this survey. Generally, the salinity of near-bottom waters in tidal rivers like the Passaic can vary considerably in space and time due to several factors, including tidal cycles, bottom topography, and the magnitude of river discharge stemming from surface water runoff. There is a general lack of comprehensive salinity information for the Passaic, but in a recent monitoring study, Chant et al. (2005) observed salinities ranging from 10 - 20 psu (i.e., mesohaline conditions) at the mouth of the river where it meets Newark Bay (Transects T1 – T3) to 0 - 10 psu (i.e., oligohaline conditions) around transect T15. Based on these results, the segment of the river between SPI transects T1 and T15 is best characterized as “brackish”, with salinities approaching 0 with distance from the river’s mouth. In the absence of any background data, we assumed that between transects T16 and T27 the river is predominantly limnetic or “tidal freshwater” (salinities less than 0.5 psu), with possible infrequent periods of salt intrusion creating oligohaline conditions. As described

August, 2005 10
in the following paragraphs, our classification of the SPI stations as either “brackish” or “tidal freshwater” has important implications for the determination of infaunal successional stages. The continuum of change in the soft-bottom communities of estuarine and marine environments immediately following a disturbance (primary succession) has been divided subjectively into three stages: Stage I is the initial community of tiny, densely populated polychaete assemblages; Stage II is the start of the transition to head-down deposit feeders; and Stage III is the mature, equilibrium community of deep-dwelling, head-down deposit feeders (Figure 3). After an area of bottom is disturbed by natural or anthropogenic events, the first invertebrate assemblage (Stage I) appears within days after the disturbance. Stage I consists of assemblages of tiny tube-dwelling marine polychaetes that reach population densities of 104 to 106 individuals per m². These animals feed at or near the sediment-water interface and physically stabilize or bind the sediment surface by producing a mucous “glue” that they use to build their tubes. Sometimes deposited dredged material layers contain Stage I tubes still attached to mud clasts from their location of origin; these transported individuals are considered as part of the in situ fauna in our assignment of successional stages. If there are no repeated disturbances to the newly colonized area, then these initial tube-dwelling suspension or surface-deposit feeding taxa are followed by burrowing, head-down deposit-feeders that rework the sediment deeper and deeper over time and mix oxygen from the overlying water into the sediment. The animals in these later-appearing communities (Stage II or III) are larger, have lower overall population densities (10 to 100 individuals per m²), and can rework the sediments to depths of 3 to 20 cm or more. These animals “loosen” the sedimentary fabric, increase the water content in the sediment, thereby lowering the sediment shear strength, and actively recycle nutrients because of the high exchange rate with the overlying waters resulting from their burrowing and feeding activities. While the successional dynamics of invertebrate communities in fine-grained estuarine and marine sediments have been well-documented, the successional dynamics of invertebrate communities in sand and coarser sediments are not well-known. Subsequently, the insights grained from sediment profile imaging technology regarding biological community structure and dynamics in sandy and coarse-grained bottoms are fairly limited. There is a similar scarcity of studies on benthic successional dynamics in freshwater systems. In recognition of this, Soster and McCall (1990) developed a generalized

August, 2005 11
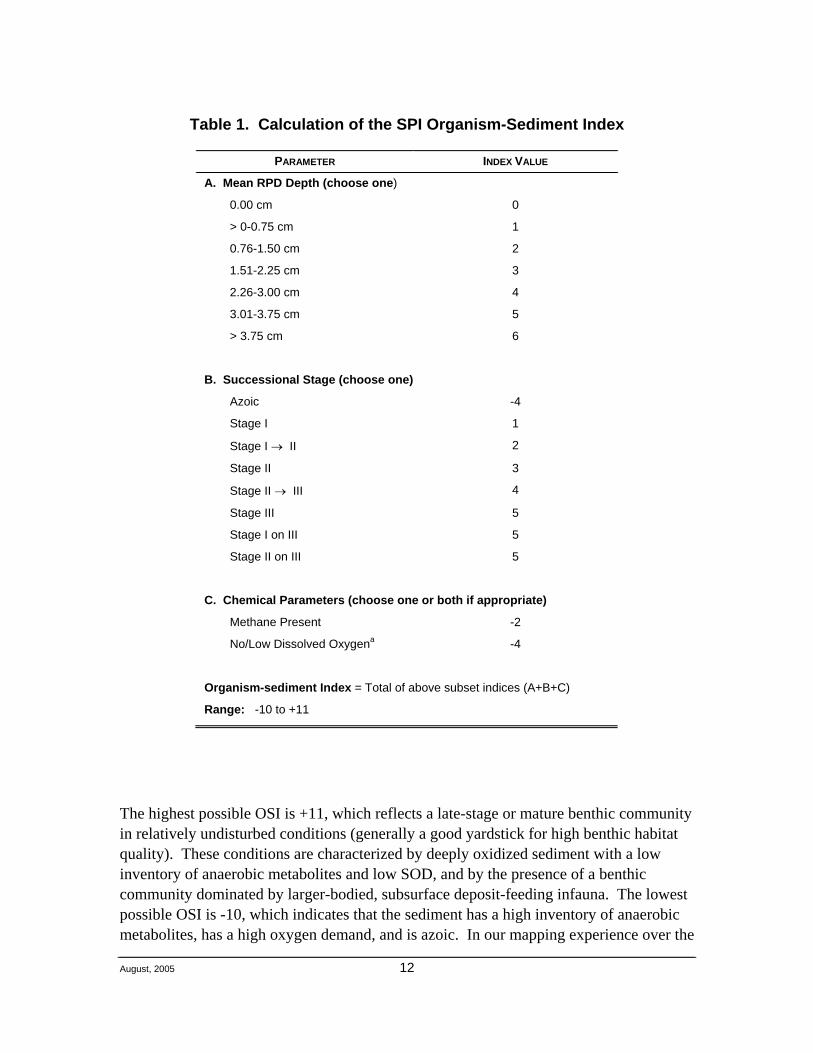
successional model based on their observations of the benthic community that developed over time in trays of defaunated sediment placed on the bottom in western Lake Erie (Figure 4). They observed a consistent pattern in the community development of organisms representing specific functional/adaptive types, comparable to the marine/estuarine model. Early colonizers were small and mobile organisms that live and feed close to the sediment-water and reproduce often. Representative taxa included the ostracod Physocypria globula, naidid oligochaetes and the chironomid Chironomus plumosus. For consistency with the estuarine/marine model, visible evidence of these types of pioneering “opportunists” in the Passaic River SPI images resulted in a “Stage I” successional designation. Late colonizers in the Soster and McCall study were larger-bodied, deep infaunal dwellers that grow slowly and reproduce late in life, including pisidiid bivalves and the tubificid oligochaetes Ilyodrilus templetoni and Limnodrilus sp. High apparent numbers of these organisms visible in the Passaic River SPI images resulted in a “Stage III” successional designation, while low numbers of these organisms were considered representative of “Stage II”, representing a transition between the Stage I and Stage III end-members. In a related study, McCall and Soster (1990) found that their successional model adequately reflected the response of benthic communities to gradients in bottom disturbance in western Lake Erie, particularly disturbance associated with high-energy wind events that resulted in redistribution of bottom sediments in shallow areas. Such sediment redistribution is the same type of physical disturbance that occurs regularly in dynamic river systems like the Passaic. While there are relatively few studies examining the applicability of Soster and McCall’s freshwater successional model to environments other than lakes, we found that this model adequately reflects the successional dynamics observed in the fine-grained sediments from the tidal freshwater segment surveyed in the Passaic River during this study. 2.1.9 Organism-Sediment Index The Organism-Sediment Index (OSI) is a summary mapping statistic that is calculated on the basis of four independently measured SPI parameters: apparent mean RPD depth, presence of methane gas, low/no dissolved oxygen at the sediment-water interface, and infaunal successional stage. Table 1 shows how these parameters are summed to derive the OSI.
August, 2005 12
Table 1. Calculation of the SPI Organism-Sediment Index
PARAMETER
INDEX VALUE A. Mean RPD Depth (choose one)
0.00 cm
0
> 0-0.75 cm
1
0.76-1.50 cm
2
1.51-2.25 cm
3
2.26-3.00 cm
4
3.01-3.75 cm
5
> 3.75 cm
6
B. Successional Stage (choose one)
Azoic
-4
Stage I
1
Stage I → II
2
Stage II
3
Stage II → III
4
Stage III
5
Stage I on III
5
Stage II on III
5
C. Chemical Parameters (choose one or both if appropriate)
Methane Present
-2
No/Low Dissolved Oxygena
-4
Organism-sediment Index = Total of above subset indices (A+B+C) Range: -10 to +11
The highest possible OSI is +11, which reflects a late-stage or mature benthic community in relatively undisturbed conditions (generally a good yardstick for high benthic habitat quality). These conditions are characterized by deeply oxidized sediment with a low inventory of anaerobic metabolites and low SOD, and by the presence of a benthic community dominated by larger-bodied, subsurface deposit-feeding infauna. The lowest possible OSI is -10, which indicates that the sediment has a high inventory of anaerobic metabolites, has a high oxygen demand, and is azoic. In our mapping experience over the

August, 2005 13
past 15 years, we have found that OSI values of +6 or less indicate that the benthic habitat has experienced physical disturbance, organic enrichment, or excessive bioavailable contamination in the recent past. 2.2 USING SPI DATA TO ASSESS BENTHIC QUALITY & HABITAT
CONDITIONS While various measurements of water quality such as dissolved oxygen, contaminants, or nutrients are often used to assess regional ecological quality or “health”, interpretation is difficult because of the transient nature of water-column phenomena. Measurement of a particular value of any water-column variable represents an instantaneous “snapshot” that can change within minutes after the measurement is taken. By the time an adverse signal in the water column such as a low dissolved oxygen concentration is persistent, the system may have degraded to the point where resource managers can do little but map the spatial extent of the phenomenon while gaining a minimal understanding of factors contributing to the overall degradation. Surface sediments (upper 10 to 20 cm), on the other hand, have many biological and geochemical features that can persist over much longer time scales. Sea- and river-beds thereby provide an integrated record of long-term environmental conditions in overlying waters. Values for many measured sediment variables are the result of physical, chemical, and biological interactions on time scales much longer than those present in a rapidly moving fluid. The seafloor is thus an excellent indicator of environmental health, both in terms of historical impacts and of future trends for any particular variable. Physical measurements made with the SPI system from profile images provide background information about gradients in physical disturbance (caused by dredging, disposal, oil platform cuttings and drilling muds discharge, trawling, or storm resuspension and transport) in the form of maps of sediment grain size, boundary roughness, sediment textural fabrics, and structures. The concentration of organic matter and the SOD can be inferred from the optical reflectance of the sediment column and the apparent RPD depth. Organic matter is an important indicator of the relative value of the sediment as a carbon source for both bacteria and infaunal deposit feeders. SOD is an important measure of ecological health; oxygen can be depleted quickly in sediment by the accumulation of organic matter and by bacterial respiration, both of which place an oxygen demand on the porewater and compete with animals for a potentially limited oxygen resource (Kennish 1986; Hyland et al. 2005). The apparent RPD depth is useful in assessing the quality of a habitat for epifauna and infauna from both physical and biological points of view. The apparent RPD depth in profile images has been shown to be directly correlated to the quality of the benthic

August, 2005 14
habitat in polyhaline and mesohaline estuarine zones (Rhoads and Germano 1986; Revelas et al. 1987; Valente et al. 1992). Controlling for differences in sediment type and physical disturbance factors, apparent RPD depths < 1 cm can indicate chronic benthic environmental stress or recent catastrophic disturbance. The distribution of successional stages in the context of the mapped disturbance gradients is one of the most sensitive indicators of the ecological health of the seafloor (Rhoads and Germano 1986). The presence of Stage III equilibrium taxa (mapped from subsurface feeding voids observed in profile images from estuarine/marine environments and abundant subsurface tubificid oligochaetes observed in profile images from freshwater environments) can be a good indication of high benthic habitat stability and relative “health.” A Stage III assemblage indicates that the sediment surrounding these organisms has not been disturbed severely in the recent past and that the inventory of bioavailable contaminants is relatively small. These inferences are based on past work, primarily in temperate latitudes, showing that Stage III species are relatively intolerant to sediment disturbance, organic enrichment, and sediment contamination. Stage III species expend metabolic energy on sediment bioturbation (both particle advection and porewater irrigation) to control sediment properties, including porewater profiles of sulfate, nitrate, and RPD depth in the sedimentary matrix near their burrows or tubes (Aller and Stupakoff 1996; Rice and Rhoads 1989). This bioturbation results in an enhanced rate of decomposition of polymerized organic matter by stimulating microbial decomposition (“microbial gardening”). Stage III benthic assemblages are very stable and are also called climax or equilibrium seres. The metabolic energy expended in bioturbation is rewarded by creating a sedimentary environment where refractory organic matter is converted to usable food. Stage III bioturbation has been likened to processes such as stirring and aeration used in tertiary sewage treatment plants to accelerate organic decomposition (these processes can be interpreted as a form of human bioturbation). Physical disturbance, contaminant loading, and/or over-enrichment result in habitat destruction and in local extinction of the climax seres. Loss of Stage III species results in the loss of sediment stirring and aeration and may be followed by a buildup of organic matter (sediment eutrophication). Because Stage III species in marine environments tend to have relatively conservative rates of recruitment, intrinsic population increase, and ontogenetic growth, they may not reappear for several years once they are excluded from an area. The presence of Stage I seres (in the absence of Stage III seres) in a marine environment can indicate that the bottom is an advanced state of organic enrichment, has received high contaminant loading, or experienced a substantial physical disturbance. Unlike Stage III communities, Stage I seres have a relatively high tolerance for organic enrichment and contaminants (Stage III organisms in freshwater systems can tolerate higher organic
August, 2005 15
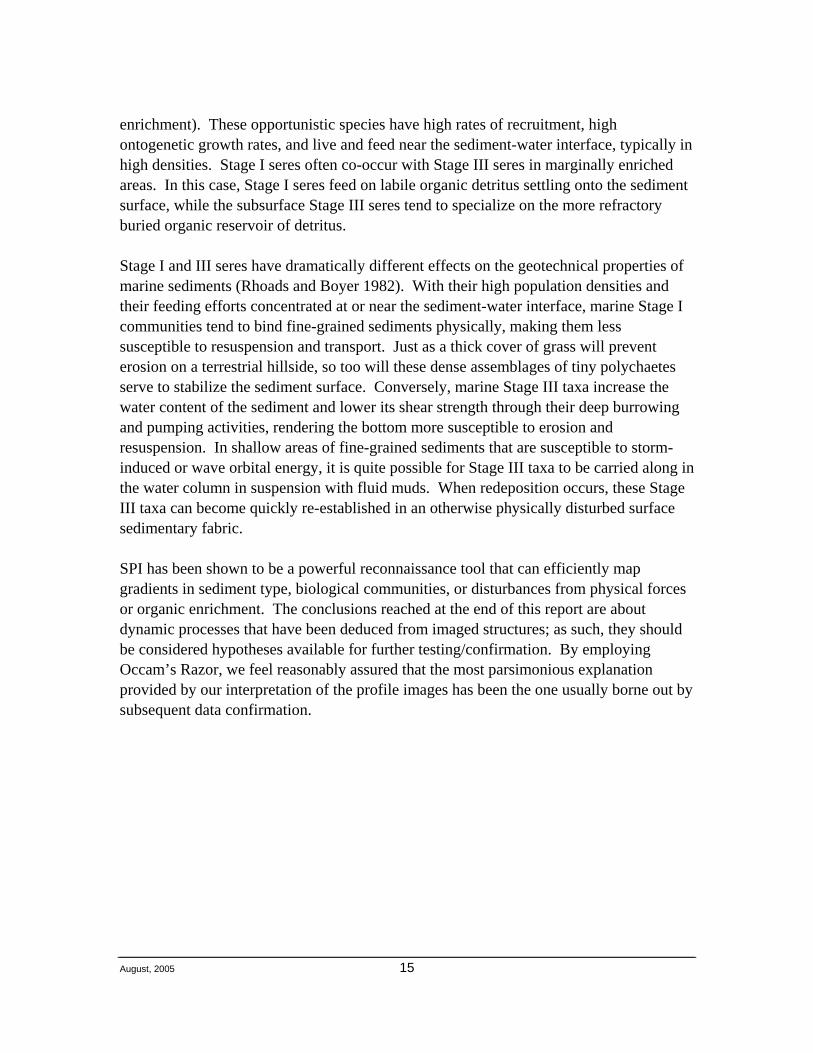
enrichment). These opportunistic species have high rates of recruitment, high ontogenetic growth rates, and live and feed near the sediment-water interface, typically in high densities. Stage I seres often co-occur with Stage III seres in marginally enriched areas. In this case, Stage I seres feed on labile organic detritus settling onto the sediment surface, while the subsurface Stage III seres tend to specialize on the more refractory buried organic reservoir of detritus. Stage I and III seres have dramatically different effects on the geotechnical properties of marine sediments (Rhoads and Boyer 1982). With their high population densities and their feeding efforts concentrated at or near the sediment-water interface, marine Stage I communities tend to bind fine-grained sediments physically, making them less susceptible to resuspension and transport. Just as a thick cover of grass will prevent erosion on a terrestrial hillside, so too will these dense assemblages of tiny polychaetes serve to stabilize the sediment surface. Conversely, marine Stage III taxa increase the water content of the sediment and lower its shear strength through their deep burrowing and pumping activities, rendering the bottom more susceptible to erosion and resuspension. In shallow areas of fine-grained sediments that are susceptible to storm-induced or wave orbital energy, it is quite possible for Stage III taxa to be carried along in the water column in suspension with fluid muds. When redeposition occurs, these Stage III taxa can become quickly re-established in an otherwise physically disturbed surface sedimentary fabric. SPI has been shown to be a powerful reconnaissance tool that can efficiently map gradients in sediment type, biological communities, or disturbances from physical forces or organic enrichment. The conclusions reached at the end of this report are about dynamic processes that have been deduced from imaged structures; as such, they should be considered hypotheses available for further testing/confirmation. By employing Occam’s Razor, we feel reasonably assured that the most parsimonious explanation provided by our interpretation of the profile images has been the one usually borne out by subsequent data confirmation.
August, 2005 16
3.0 RESULTS
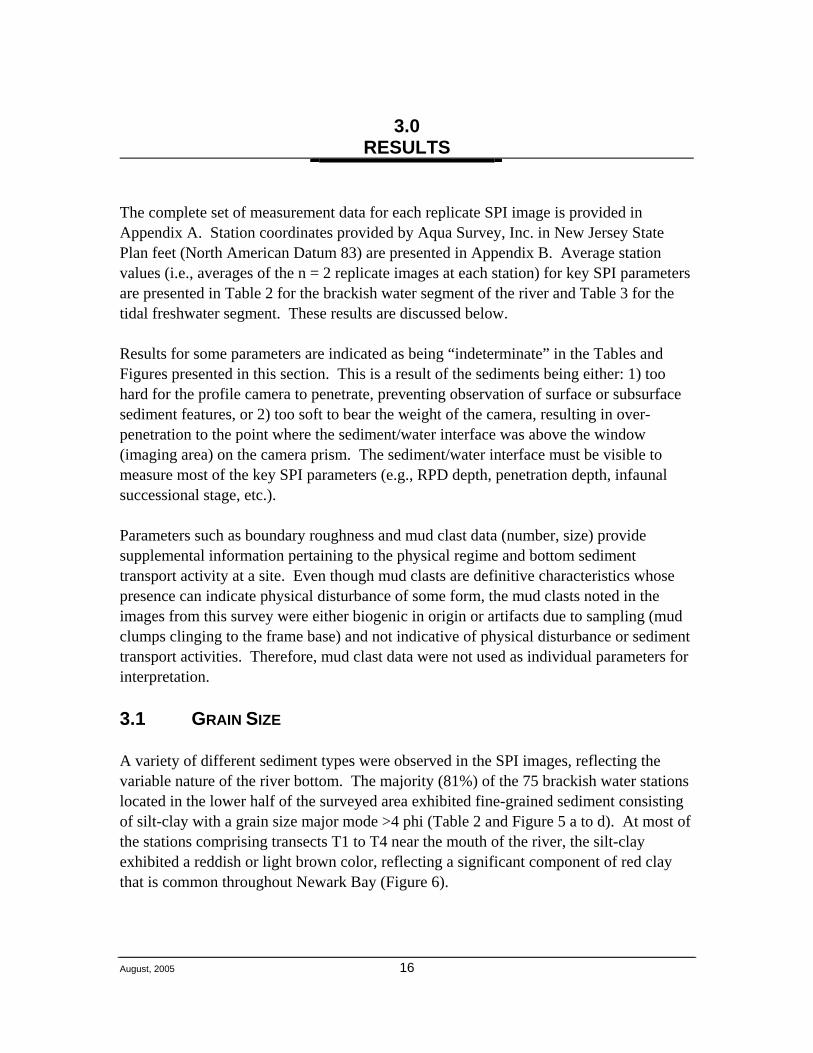
The complete set of measurement data for each replicate SPI image is provided in Appendix A. Station coordinates provided by Aqua Survey, Inc. in New Jersey State Plan feet (North American Datum 83) are presented in Appendix B. Average station values (i.e., averages of the n = 2 replicate images at each station) for key SPI parameters are presented in Table 2 for the brackish water segment of the river and Table 3 for the tidal freshwater segment. These results are discussed below. Results for some parameters are indicated as being “indeterminate” in the Tables and Figures presented in this section. This is a result of the sediments being either: 1) too hard for the profile camera to penetrate, preventing observation of surface or subsurface sediment features, or 2) too soft to bear the weight of the camera, resulting in over-penetration to the point where the sediment/water interface was above the window (imaging area) on the camera prism. The sediment/water interface must be visible to measure most of the key SPI parameters (e.g., RPD depth, penetration depth, infaunal successional stage, etc.). Parameters such as boundary roughness and mud clast data (number, size) provide supplemental information pertaining to the physical regime and bottom sediment transport activity at a site. Even though mud clasts are definitive characteristics whose presence can indicate physical disturbance of some form, the mud clasts noted in the images from this survey were either biogenic in origin or artifacts due to sampling (mud clumps clinging to the frame base) and not indicative of physical disturbance or sediment transport activities. Therefore, mud clast data were not used as individual parameters for interpretation. 3.1 GRAIN SIZE A variety of different sediment types were observed in the SPI images, reflecting the variable nature of the river bottom. The majority (81%) of the 75 brackish water stations located in the lower half of the surveyed area exhibited fine-grained sediment consisting of silt-clay with a grain size major mode >4 phi (Table 2 and Figure 5 a to d). At most of the stations comprising transects T1 to T4 near the mouth of the river, the silt-clay exhibited a reddish or light brown color, reflecting a significant component of red clay that is common throughout Newark Bay (Figure 6).
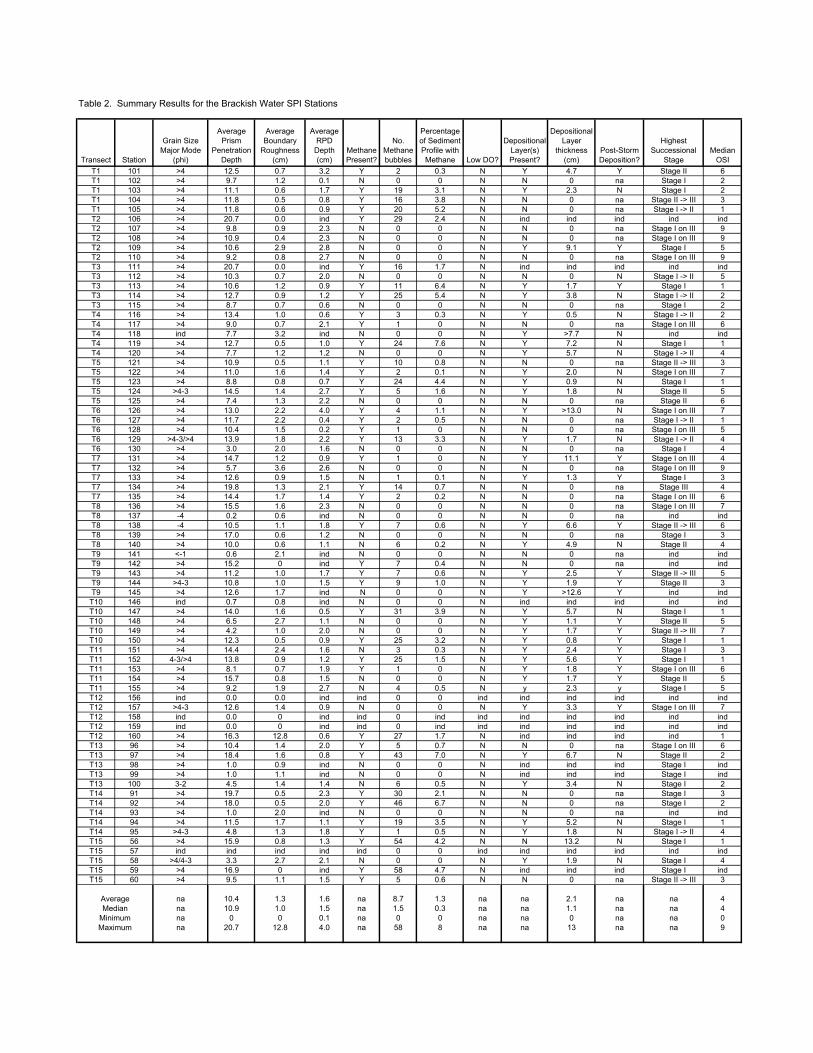
Table 2. Summary Results for the Brackish Water SPI Stations
Transect Station
Grain Size Major Mode
(phi)
Average Prism
Penetration Depth
Average Boundary
Roughness (cm)
Average RPD
Depth (cm)
Methane Present?
No. Methane bubbles
Percentage of Sediment Profile with Methane Low DO?
Depositional Layer(s) Present?
Depositional Layer
thickness (cm)
Post-Storm Deposition?
Highest Successional
StageMedian
OSIT1 101 >4 12.5 0.7 3.2 Y 2 0.3 N Y 4.7 Y Stage II 6T1 102 >4 9.7 1.2 0.1 N 0 0 N N 0 na Stage I 2T1 103 >4 11.1 0.6 1.7 Y 19 3.1 N Y 2.3 N Stage I 2T1 104 >4 11.8 0.5 0.8 Y 16 3.8 N N 0 na Stage II -> III 3T1 105 >4 11.8 0.6 0.9 Y 20 5.2 N N 0 na Stage I -> II 1T2 106 >4 20.7 0.0 ind Y 29 2.4 N ind ind ind ind indT2 107 >4 9.8 0.9 2.3 N 0 0 N N 0 na Stage I on III 9T2 108 >4 10.9 0.4 2.3 N 0 0 N N 0 na Stage I on III 9T2 109 >4 10.6 2.9 2.8 N 0 0 N Y 9.1 Y Stage I 5T2 110 >4 9.2 0.8 2.7 N 0 0 N N 0 na Stage I on III 9T3 111 >4 20.7 0.0 ind Y 16 1.7 N ind ind ind ind indT3 112 >4 10.3 0.7 2.0 N 0 0 N N 0 N Stage I -> II 5T3 113 >4 10.6 1.2 0.9 Y 11 6.4 N Y 1.7 Y Stage I 1T3 114 >4 12.7 0.9 1.2 Y 25 5.4 N Y 3.8 N Stage I -> II 2T3 115 >4 8.7 0.7 0.6 N 0 0 N N 0 na Stage I 2T4 116 >4 13.4 1.0 0.6 Y 3 0.3 N Y 0.5 N Stage I -> II 2T4 117 >4 9.0 0.7 2.1 Y 1 0 N N 0 na Stage I on III 6T4 118 ind 7.7 3.2 ind N 0 0 N Y >7.7 N ind indT4 119 >4 12.7 0.5 1.0 Y 24 7.6 N Y 7.2 N Stage I 1T4 120 >4 7.7 1.2 1.2 N 0 0 N Y 5.7 N Stage I -> II 4T5 121 >4 10.9 0.5 1.1 Y 10 0.8 N N 0 na Stage II -> III 3T5 122 >4 11.0 1.6 1.4 Y 2 0.1 N Y 2.0 N Stage I on III 7T5 123 >4 8.8 0.8 0.7 Y 24 4.4 N Y 0.9 N Stage I 1T5 124 >4-3 14.5 1.4 2.7 Y 5 1.6 N Y 1.8 N Stage II 5T5 125 >4 7.4 1.3 2.2 N 0 0 N N 0 na Stage II 6T6 126 >4 13.0 2.2 4.0 Y 4 1.1 N Y >13.0 N Stage I on III 7T6 127 >4 11.7 2.2 0.4 Y 2 0.5 N N 0 na Stage I -> II 1T6 128 >4 10.4 1.5 0.2 Y 1 0 N N 0 na Stage I on III 5T6 129 >4-3/>4 13.9 1.8 2.2 Y 13 3.3 N Y 1.7 N Stage I -> II 4T6 130 >4 3.0 2.0 1.6 N 0 0 N N 0 na Stage I 4T7 131 >4 14.7 1.2 0.9 Y 1 0 N Y 11.1 Y Stage I on III 4T7 132 >4 5.7 3.6 2.6 N 0 0 N N 0 na Stage I on III 9T7 133 >4 12.6 0.9 1.5 N 1 0.1 N Y 1.3 Y Stage I 3T7 134 >4 19.8 1.3 2.1 Y 14 0.7 N N 0 na Stage III 4T7 135 >4 14.4 1.7 1.4 Y 2 0.2 N N 0 na Stage I on III 6T8 136 >4 15.5 1.6 2.3 N 0 0 N N 0 na Stage I on III 7T8 137 -4 0.2 0.6 ind N 0 0 N N 0 na ind indT8 138 -4 10.5 1.1 1.8 Y 7 0.6 N Y 6.6 Y Stage II -> III 6T8 139 >4 17.0 0.6 1.2 N 0 0 N N 0 na Stage I 3T8 140 >4 10.0 0.6 1.1 N 6 0.2 N Y 4.9 N Stage II 4T9 141 <-1 0.6 2.1 ind N 0 0 N N 0 na ind indT9 142 >4 15.2 0 ind Y 7 0.4 N N 0 na ind indT9 143 >4 11.2 1.0 1.7 Y 7 0.6 N Y 2.5 Y Stage II -> III 5T9 144 >4-3 10.8 1.0 1.5 Y 9 1.0 N Y 1.9 Y Stage II 3T9 145 >4 12.6 1.7 ind N 0 0 N Y >12.6 Y ind ind
T10 146 ind 0.7 0.8 ind N 0 0 N ind ind ind ind indT10 147 >4 14.0 1.6 0.5 Y 31 3.9 N Y 5.7 N Stage I 1T10 148 >4 6.5 2.7 1.1 N 0 0 N Y 1.1 Y Stage II 5T10 149 >4 4.2 1.0 2.0 N 0 0 N Y 1.7 Y Stage II -> III 7T10 150 >4 12.3 0.5 0.9 Y 25 3.2 N Y 0.8 Y Stage I 1T11 151 >4 14.4 2.4 1.6 N 3 0.3 N Y 2.4 Y Stage I 3T11 152 4-3/>4 13.8 0.9 1.2 Y 25 1.5 N Y 5.6 Y Stage I 1T11 153 >4 8.1 0.7 1.9 Y 1 0 N Y 1.8 Y Stage I on III 6T11 154 >4 15.7 0.8 1.5 N 0 0 N Y 1.7 Y Stage II 5T11 155 >4 9.2 1.9 2.7 N 4 0.5 N y 2.3 y Stage I 5T12 156 ind 0.0 0.0 ind ind 0 0 ind ind ind ind ind indT12 157 >4-3 12.6 1.4 0.9 N 0 0 N Y 3.3 Y Stage I on III 7T12 158 ind 0.0 0 ind ind 0 ind ind ind ind ind ind indT12 159 ind 0.0 0 ind ind 0 ind ind ind ind ind ind indT12 160 >4 16.3 12.8 0.6 Y 27 1.7 N ind ind ind ind 1T13 96 >4 10.4 1.4 2.0 Y 5 0.7 N N 0 na Stage I on III 6T13 97 >4 18.4 1.6 0.8 Y 43 7.0 N Y 6.7 N Stage II 2T13 98 >4 1.0 0.9 ind N 0 0 N ind ind ind Stage I indT13 99 >4 1.0 1.1 ind N 0 0 N ind ind ind Stage I indT13 100 3-2 4.5 1.4 1.4 N 6 0.5 N Y 3.4 N Stage I 2T14 91 >4 19.7 0.5 2.3 Y 30 2.1 N N 0 na Stage I 3T14 92 >4 18.0 0.5 2.0 Y 46 6.7 N N 0 na Stage I 2T14 93 >4 1.0 2.0 ind N 0 0 N N 0 na ind indT14 94 >4 11.5 1.7 1.1 Y 19 3.5 N Y 5.2 N Stage I 1T14 95 >4-3 4.8 1.3 1.8 Y 1 0.5 N Y 1.8 N Stage I -> II 4T15 56 >4 15.9 0.8 1.3 Y 54 4.2 N N 13.2 N Stage I 1T15 57 ind ind ind ind ind 0 0 ind ind ind ind ind indT15 58 >4/4-3 3.3 2.7 2.1 N 0 0 N Y 1.9 N Stage I 4T15 59 >4 16.9 0 ind Y 58 4.7 N ind ind ind Stage I indT15 60 >4 9.5 1.1 1.5 Y 5 0.6 N N 0 na Stage II -> III 3
Average na 10.4 1.3 1.6 na 8.7 1.3 na na 2.1 na na 4Median na 10.9 1.0 1.5 na 1.5 0.3 na na 1.1 na na 4
Minimum na 0 0 0.1 na 0 0 na na 0 na na 0Maximum na 20.7 12.8 4.0 na 58 8 na na 13 na na 9
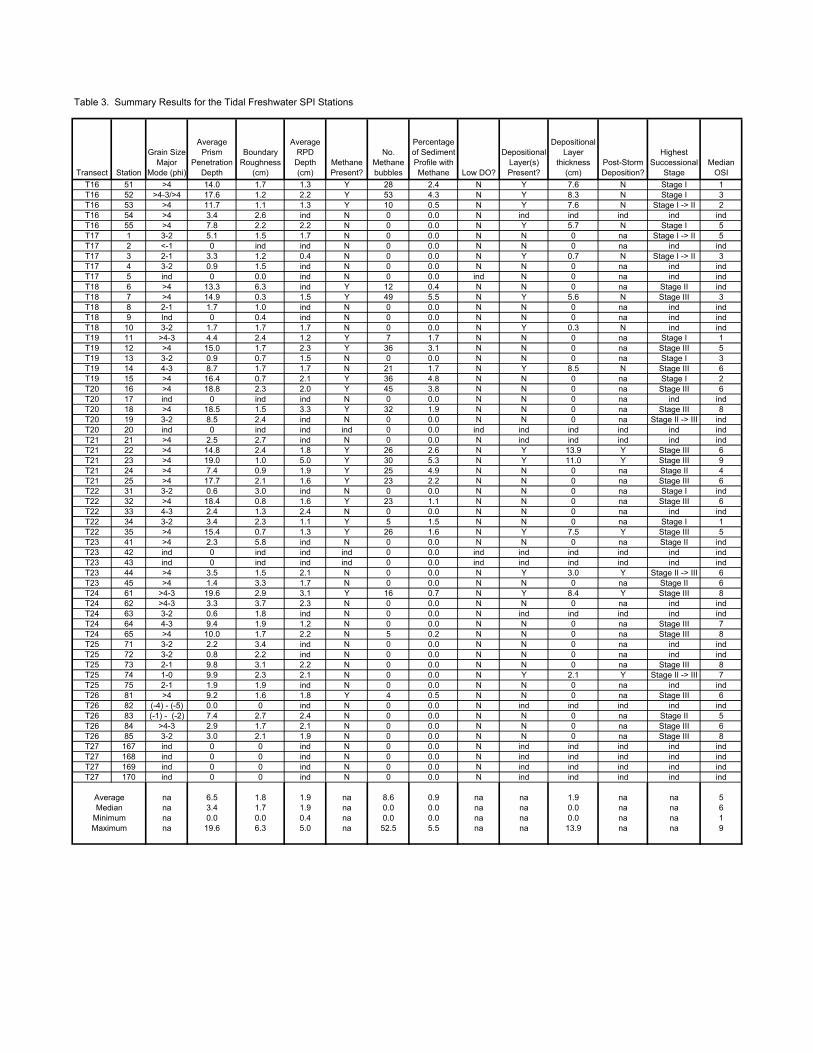
Table 3. Summary Results for the Tidal Freshwater SPI Stations
Transect Station
Grain Size Major
Mode (phi)
Average Prism
Penetration Depth
Boundary Roughness
(cm)
Average RPD
Depth (cm)
Methane Present?
No. Methane bubbles
Percentage of Sediment Profile with Methane Low DO?
Depositional Layer(s) Present?
Depositional Layer
thickness (cm)
Post-Storm Deposition?
Highest Successional
StageMedian
OSIT16 51 >4 14.0 1.7 1.3 Y 28 2.4 N Y 7.6 N Stage I 1T16 52 >4-3/>4 17.6 1.2 2.2 Y 53 4.3 N Y 8.3 N Stage I 3T16 53 >4 11.7 1.1 1.3 Y 10 0.5 N Y 7.6 N Stage I -> II 2T16 54 >4 3.4 2.6 ind N 0 0.0 N ind ind ind ind indT16 55 >4 7.8 2.2 2.2 N 0 0.0 N Y 5.7 N Stage I 5T17 1 3-2 5.1 1.5 1.7 N 0 0.0 N N 0 na Stage I -> II 5T17 2 <-1 0 ind ind N 0 0.0 N N 0 na ind indT17 3 2-1 3.3 1.2 0.4 N 0 0.0 N Y 0.7 N Stage I -> II 3T17 4 3-2 0.9 1.5 ind N 0 0.0 N N 0 na ind indT17 5 ind 0 0.0 ind N 0 0.0 ind N 0 na ind indT18 6 >4 13.3 6.3 ind Y 12 0.4 N N 0 na Stage II indT18 7 >4 14.9 0.3 1.5 Y 49 5.5 N Y 5.6 N Stage III 3T18 8 2-1 1.7 1.0 ind N 0 0.0 N N 0 na ind indT18 9 Ind 0 0.4 ind N 0 0.0 N N 0 na ind indT18 10 3-2 1.7 1.7 1.7 N 0 0.0 N Y 0.3 N ind indT19 11 >4-3 4.4 2.4 1.2 Y 7 1.7 N N 0 na Stage I 1T19 12 >4 15.0 1.7 2.3 Y 36 3.1 N N 0 na Stage III 5T19 13 3-2 0.9 0.7 1.5 N 0 0.0 N N 0 na Stage I 3T19 14 4-3 8.7 1.7 1.7 N 21 1.7 N Y 8.5 N Stage III 6T19 15 >4 16.4 0.7 2.1 Y 36 4.8 N N 0 na Stage I 2T20 16 >4 18.8 2.3 2.0 Y 45 3.8 N N 0 na Stage III 6T20 17 ind 0 ind ind N 0 0.0 N N 0 na ind indT20 18 >4 18.5 1.5 3.3 Y 32 1.9 N N 0 na Stage III 8T20 19 3-2 8.5 2.4 ind N 0 0.0 N N 0 na Stage II -> III indT20 20 ind 0 ind ind ind 0 0.0 ind ind ind ind ind indT21 21 >4 2.5 2.7 ind N 0 0.0 N ind ind ind ind indT21 22 >4 14.8 2.4 1.8 Y 26 2.6 N Y 13.9 Y Stage III 6T21 23 >4 19.0 1.0 5.0 Y 30 5.3 N Y 11.0 Y Stage III 9T21 24 >4 7.4 0.9 1.9 Y 25 4.9 N N 0 na Stage II 4T21 25 >4 17.7 2.1 1.6 Y 23 2.2 N N 0 na Stage III 6T22 31 3-2 0.6 3.0 ind N 0 0.0 N N 0 na Stage I indT22 32 >4 18.4 0.8 1.6 Y 23 1.1 N N 0 na Stage III 6T22 33 4-3 2.4 1.3 2.4 N 0 0.0 N N 0 na ind indT22 34 3-2 3.4 2.3 1.1 Y 5 1.5 N N 0 na Stage I 1T22 35 >4 15.4 0.7 1.3 Y 26 1.6 N Y 7.5 Y Stage III 5T23 41 >4 2.3 5.8 ind N 0 0.0 N N 0 na Stage II indT23 42 ind 0 ind ind ind 0 0.0 ind ind ind ind ind indT23 43 ind 0 ind ind ind 0 0.0 ind ind ind ind ind indT23 44 >4 3.5 1.5 2.1 N 0 0.0 N Y 3.0 Y Stage II -> III 6T23 45 >4 1.4 3.3 1.7 N 0 0.0 N N 0 na Stage II 6T24 61 >4-3 19.6 2.9 3.1 Y 16 0.7 N Y 8.4 Y Stage III 8T24 62 >4-3 3.3 3.7 2.3 N 0 0.0 N N 0 na ind indT24 63 3-2 0.6 1.8 ind N 0 0.0 N ind ind ind ind indT24 64 4-3 9.4 1.9 1.2 N 0 0.0 N N 0 na Stage III 7T24 65 >4 10.0 1.7 2.2 N 5 0.2 N N 0 na Stage III 8T25 71 3-2 2.2 3.4 ind N 0 0.0 N N 0 na ind indT25 72 3-2 0.8 2.2 ind N 0 0.0 N N 0 na ind indT25 73 2-1 9.8 3.1 2.2 N 0 0.0 N N 0 na Stage III 8T25 74 1-0 9.9 2.3 2.1 N 0 0.0 N Y 2.1 Y Stage II -> III 7T25 75 2-1 1.9 1.9 ind N 0 0.0 N N 0 na ind indT26 81 >4 9.2 1.6 1.8 Y 4 0.5 N N 0 na Stage III 6T26 82 (-4) - (-5) 0.0 0 ind N 0 0.0 N ind ind ind ind indT26 83 (-1) - (-2) 7.4 2.7 2.4 N 0 0.0 N N 0 na Stage II 5T26 84 >4-3 2.9 1.7 2.1 N 0 0.0 N N 0 na Stage III 6T26 85 3-2 3.0 2.1 1.9 N 0 0.0 N N 0 na Stage III 8T27 167 ind 0 0 ind N 0 0.0 N ind ind ind ind indT27 168 ind 0 0 ind N 0 0.0 N ind ind ind ind indT27 169 ind 0 0 ind N 0 0.0 N ind ind ind ind indT27 170 ind 0 0 ind N 0 0.0 N ind ind ind ind ind
Average na 6.5 1.8 1.9 na 8.6 0.9 na na 1.9 na na 5Median na 3.4 1.7 1.9 na 0.0 0.0 na na 0.0 na na 6
Minimum na 0.0 0.0 0.4 na 0.0 0.0 na na 0.0 na na 1Maximum na 19.6 6.3 5.0 na 52.5 5.5 na na 13.9 na na 9

August, 2005 19
There was considerably more variability in grain size among the 59 stations located in the tidal freshwater segment, where sediments included silt-clay (major mode of >4 phi), very fine to coarse sand (4 to 0 phi), and boulder-sized gravel having a major mode of <-8 phi (Table 3 and Figure 5 d to g). 3.2 DEPOSITIONAL LAYERS Distinct layering of sediment was observed at many stations across the entire surveyed area. Depositional layer presence/absence and thickness are indicated in Tables 2 and 3. At some stations, the surface depositional layer had a grain size major mode different from that of the underlying sediments (i.e., distinct sand-over-silt or silt-over-sand stratigraphy). These stations are indicated as a separate category in the grain size maps (Figure 5 a through g). Profile images illustrating the sand-over-silt and silt-over-sand stratigraphy are provided in Figures 7 and 8. At a number of stations, there were multiple sedimentary horizons or intervals comprising the imaged profile (Figure 9). This type of layering is due to repetitive cycles of erosion and deposition occurring at many of the sampled locations throughout the Passaic River. We were able to witness the effects of one such cycle, when a strong cold front accompanied by a 20-30 minute period of heavy rain passed over the Newark/Passaic area on Day 3 of our survey (June 22). This intense rainfall event occurred during low tide, when intertidal mudflats along the riverbank were fully exposed and thus highly susceptible to erosion by the ensuing runoff (Figure 10). At a number of stations sampled over the following 2 days, the recently-deposited surface depositional layers were visible (Figure 11). These layers most likely resulted from settling of the suspended sediment that had been washed into the river during the rain event. Tables 2 and 3 indicate the stations where such post-storm depositional layers were observed. The measured thickness of all observed depositional layers, including both the recent post-storm layers and layers that had been created by some physical disturbance at some undefined point in the past, is mapped by station in Figure 12 (a through g). 3.3 SURFACE BOUNDARY ROUGHNESS Small-scale surface boundary roughness ranged from 0.4 to 12.8 cm at the brackish water stations and from 0.3 to 6.3 cm at the tidal freshwater stations (Tables 2 and 3). The relatively high value of 12.8 cm at Station 160 is considered a sampling artifact due to disturbance of the sediment surface by the base frame of the sediment profile camera. With this outlier removed, boundary roughness values at the brackish water stations ranged from 0.4 cm to 3.6 cm, with an overall mean of 1.3 cm. This is comparable to the
August, 2005 20
range and overall mean of 2.0 cm at the tidal freshwater stations. In general, such values indicate a low to moderate amount of small scale relief at the sediment surface that was due primarily to physical factors (e.g., rippling of sand by bottom currents, uneven settling of depositional layers, disturbance of the sediment surface by escaping bubbles of methane). 3.4 PRISM PENETRATION DEPTH If the physical configuration of the sediment-profile camera is held constant during a survey (i.e., in terms of the number of removable weights, addition or removal of mud doors, and height of the adjustable stop collars), then the prism penetration depth provides an accurate measure of any differences that may exist among stations in sediment compactness/bearing strength. During the June 2005 survey of the Passaic River, adjustments were made frequently to the camera in an attempt to optimize penetration across the highly variable bottom conditions encountered. Nevertheless, the penetration depth measurements allow a qualitative assessment of spatial patterns in the degree of sediment compactness in the surveyed area. Average prism penetration depths at the brackish water stations ranged from 0 cm (no penetration on hard bottom) to 20.7 cm (over-penetration in very soft silt) (Table 2 and Figure 13 a through d). The overall average penetration of 10.4 cm (Table 2) indicates that the silt-clay sediments which predominated at the brackish water stations were moderately compact. Relatively deep penetration depths of greater than 16 cm reflect the presence of highly unconsolidated (i.e., loose) silt with abundant methane bubbles and high apparent water content at the following stations: 106, 111, 134, 160, 97, 91, 92, 59, 12, 15, 16, 18, 23, 32 and 61 (Table 2 and Figure 13 a through d). Average penetration depths at the tidal freshwater stations ranged from 0 to 19.6 cm, with an overall average of 6.5 cm that was considerably lower than the average of 10.4 cm at the brackish water stations (Table 3). Compared to the brackish water stations, a higher proportion of the tidal freshwater stations had penetration depth values less than 10 cm. This reflects the coarser sediments, including fine to coarse sand and various sizes of gravel, that were encountered more frequently at the tidal freshwater stations. 3.5 SEDIMENTARY METHANE Methane gas bubbles were observed within the sediment column at 40 of the 75 (53%) brackish water stations and at 19 of the 59 (32%) tidal freshwater stations (Tables 2 and 3). Methane was typically associated with fine-grained sediments, principally the unconsolidated, layered silts that occurred most frequently at the brackish water stations
August, 2005 21
(Figure 14). In some images, the methane bubbles occurred within a surface layer of sediment that was uniformly light-colored all the way from the sediment-water interface to the maximum depth of penetration (Figure 15, left image). It is hypothesized that the methane in such instances was being generated within subsurface layers of organic-rich, highly anoxic black sediment buried deeper within the sediment column (i.e., below the penetration or imaging depth of the profile camera). In the right image of Figure 15, for example, the surface layer of uniformly light-colored sediment is not as thick as in the left image, allowing the black, highly anoxic, underlying sediment to be seen. The occurrence of so many small methane bubbles within the upper 20 cm of the sediment column was to varying degrees an artifact of the SPI sampling. Specifically, vibrations caused by contact of the camera frame with the bottom, as well as the pressure exerted by penetration of the prism into the sediment, would act both to dislodge pockets of methane embedded within deeper, underlying layers and accelerate the upward movement of bubbles. While sampling, field personnel frequently observed methane bubbles rising to the water’s surface following bottom contact and penetration of the profile camera. Upward movement (ebullition) of bubbles resulted in the creation of small tunnels or tracks within the sediment column; these ebullition tracks often were clearly visible in the profile images (Figures 6 and 16). Although the number and size of visible methane bubbles were random and artifacts to varying degrees, the total area occupied by these bubbles (in cm2) was measured and expressed as a percentage of the total area occupied by sediment in each image (Tables 2 and 3). This provides a rough qualitative measure of the amount of methane present and is useful for comparing among stations on a relative basis and detecting spatial patterns (Figure 17). At the brackish water stations, values ranged from 0% (no visible methane bubbles) to 8%, with an overall mean of 1.3%, compared to a range of 0% to 5.5% and an overall mean of 0.9% at the tidal freshwater stations. The highest percentages of methane were most frequently observed in the soft layered silts at the brackish water stations, reflecting enhanced deposition of fines and resultant high rates of organic loading/elevated sediment oxygen demand (SOD) in the highly developed lower segments of the Passaic River in the vicinity of Newark (Figure 17). 3.6 BENTHIC HABITAT CLASSIFICATIONS A simple habitat classification scheme was developed to integrate several of the key physical parameters discussed above. The mapped distribution of these different habitat types is shown in Figure 18 (a through g). Organically enriched, fine-grained sediments with one or more depositional layers and high apparent SOD (as evidenced by the presence of methane) were classified as “layered silts with methane”. Examples of this habitat type are shown in Figures 14 and 15. A second category called “layered silts”

August, 2005 22
typically had black or dark sediments indicative of high rates of organic loading but these sediments lacked any visible methane (Figure 9). Layered silts, with or without methane, were common throughout the brackish lower half of the surveyed area in the vicinity of the city of Newark (Figure 18 a through g). A number of stations in this area, particularly at the mouth of the river, exhibited fine-grained sediments without any layering or methane (shown as “silt-clay” stations in Figure 18 a). Figure 18 also shows several important secondary habitat characteristics at each station, such as the presence of extremely soft (i.e, high water content) sediments, organic detritus (typically decayed leaf litter) occurring by itself or mixed with silty or sandy sediments, and sediment layering. In the upper, tidal freshwater half of the surveyed area, sediment texture grew increasingly coarser moving northward, and there was greater variability in habitat conditions. Very soft, layered silts with methane continued to be present along some transects, particularly at stations located on intertidal and shallow subtidal mudflats along the riverbanks (e.g., transects T16 and T18 to T22). The benthic habitat at other stations in this area, particularly those in the deeper midsection of the river, consisted of firm sand that was either well-sorted or mixed/layered with various amounts of silt-clay (Figure 19). Hard bottom consisting of gravel (pebbles or cobbles) also was observed at some of the stations in this area (Figures 18 and 19). Large cobbles and/or boulders were found at all of the stations comprising the northern-most transect, T27 (Figure 18). 3.7 APPARENT REDOX POTENTIAL DISCONTINUITY DEPTH The distribution of mean apparent RPD depths at the SPI stations in the Passaic River is shown in Figure 20. Average values at the brackish water stations ranged from 0.1 to 4.0 cm, with an overall mean of 1.6 cm. These were quite comparable to the range (0.4 to 5.0 cm) and overall average of 1.9 cm at the tidal freshwater stations (Tables 2 and 3). In general, apparent RPD depths of between 1 and 2 cm are considered indicative of a moderate degree of aeration or predominantly oxidizing conditions in soft-bottom habitats. At many of the Passaic River stations, there was a very strong color contrast between the light-colored, oxidized surface sediments and underlying black, anoxic sediments that are presumed to be the main source of any methane observed in the sediment column. The images presented in Figures 7 (center image), 8 (right image), 9 (upper left image) and 15 (right image) provide good examples of strong redox color contrasts. At a number of stations, all or most of the upper sediment column was uniformly light-colored to depths greater than 10 cm (e.g., Figure 15, both images). This is much deeper than the typical apparent RPD depths of 1 to 4 cm that characterize most estuarine and marine environments. It is considered a strong possibility that at such stations, all or most of the light-colored sediment represents a depositional layer of fairly recent origin (i.e.,
August, 2005 23
deposited several weeks to several months prior to the survey). In this case, the sediment has not had sufficient time for a “normal” geochemical profile to development. In the absence of any further disturbance (erosion or additional deposition), such normal profiles would be expected to develop at time scales of months to years. However, the presence of such thick, recent layers of light-colored sediment reflects the dynamic depositional/erosional sedimentary environment that characterizes much of the surveyed area in the Passaic River. 3.8 INFAUNAL SUCCESSIONAL STAGE Figure 21 (a through g) provides a series of maps showing the most-advanced or “highest” infaunal successional stage observed in the two replicate images at each station. Profile images illustrating these stages are shown in Figures 22 (brackish stations) and 23 (tidal freshwater stations). At many stations with hard or firm sediments, the successional stage could not be determined (indeterminate) due to no or insufficient penetration of the camera prism. A wide variety of different successional stages were found among both the brackish and freshwater stations (Figure 21). As indicated, the multiple sedimentary layers present at many locations throughout the river are the result of continuous cycles of erosion and deposition. The patchy mosaic of different successional stages reflects this history of periodic physical disturbance. In the brackish river segment, evidence of Stage III was observed at only 21 (28%) of the 75 stations (Table 2). Where present, the densities of typical Stage III taxa (i.e., larger-bodied, head-down deposit feeders) appeared to be quite low, as evidenced by the limited number of feeding voids (one or two at most) that were observed (e.g., Figure 22, left image). Small, opportunistic, Stage I polychaetes were much more ubiquitous among the brackish river stations, occurring either alone or in combination with Stages II or III at 46 (61%) of the 75 stations (Table 2). Stage I typically includes members of the polychaete families Spionidae and Capitellidae (e.g., Streblospio benedictii, Capitella sp., Heteromastus filiformis) known to be tolerant of low concentrations of dissolved oxygen and high levels of reduced sediment end-products (e.g., sulfide, ammonia and methane) associated with decomposition of organic carbon under anaerobic conditions. Given the obvious elevated levels of organic enrichment and high resultant SOD at many of the brackish water stations, it is considered likely that these taxa are among the long-term numerical dominants in this part of the river. Compared to the brackish water stations, Stage III was found at a slightly higher proportion of the tidal freshwater stations (20 of 59, or 34%) (Table 3). Tubificid oligochaetes appeared to be the numerical dominants at these stations, with Stage I

August, 2005 24
indicating low to moderate numbers of small/immature individuals and Stage III indicating relatively high numbers of larger individuals (see Figure 23), consistent with the freshwater model shown in Figure 4. Tubificid oligochaetes are also known to be relatively tolerant to elevated levels of organic loading and associated high SOD. 3.9 ORGANISM-SEDIMENT INDEX The spatial distribution of median OSI values throughout the study area can be seen in Figure 24. An OSI value of +6 or less typically indicates that a benthic habitat has experienced physical disturbances, eutrophication, or excessive bioavailable contamination in the recent past. The majority of the brackish water stations (50 of 79, or 63%) had median OSI values between +1 and +6 (Table 2), reflecting the disturbance associated with periodic sediment erosion/deposition, high organic loading rates and elevated SOD. The median OSI values of >+6 at three of the five stations comprising transect T2 at the mouth of the river in upper Newark Bay are a notable exception. These values are indicative of relatively undisturbed or non-degraded benthic habitat conditions in this location. Due to firm/hard bottom conditions, median OSI values could not be calculated at almost half (27 of 59, or 46%) of the tidal freshwater stations (Table 3). Stations comprising transects T16 – T18 in the lower part of the tidal freshwater segment had predominantly low median OSI values (range of +1 to +5), reflecting high organic loading/SOD conditions (Figure 24). Median OSI values >+6 were observed with greater consistency at the stations comprising transect 20 and above. This is a less developed stretch of the river that presumably is subject to somewhat lower rates of organic loading and is supportive of more abundant populations of tubificid oligochaetes (i.e., Stage III).
August, 2005 25
4.0 DISCUSSION
The results of our SPI technology survey of the lower Passaic River revealed a highly dynamic sedimentary environment characterized by cycles of erosion and deposition as well as significant variability in sediment types, particularly in the tidal freshwater reaches of the river that were sampled. As in most river systems in temperate latitudes, these erosion and deposition cycles likely operate at a variety of both temporal and spatial scales. For the river as a whole, net erosion and downriver transport of suspended sediments are likely greatest during high discharge conditions associated with the spring freshet, while net deposition would be expected under low flow conditions during periods or seasons when precipitation in the surrounding watershed in minimal. Upriver bedload transport and deposition of sediment also is possible in the lower reaches of the river during flood tides. In addition to these overarching seasonal factors, the degree of erosion or deposition at any given location can be influenced strongly by depth, bottom topography, local runoff patterns (both natural and anthropogenic), and short-term weather conditions (such as the rainfall event in the middle of our survey that resulted in fresh depositional layers of sediment at a significant number of stations). Many of the riverbank areas sampled in our survey consisted of intertidal or shallow-subtidal mudflats that are the result of net deposition of silts, clays and organic detritus over varying periods of time. The length of time that these large scale morphological features are able to persist, particularly during periods of high river flow and attendant erosion, is unknown. At a number of our station transects, the typical pattern was that one or both of the shallow riverbanks had soft, organically enriched silt (frequently with methane and organic detritus), while firmer, coarser sediments were observed in the deeper mid-section of the river. At such transects, higher current velocities in the middle of the river presumably have resulted in greater winnowing of fines and long-term persistence of the observed coarser sediment fractions. Along the shallower riverbanks, on the other hand, there appears to have been a net accumulation of fine-grained sediment over time. The profile images revealed the ubiquitous presence of subsurface layers of black, anoxic sediment having high apparent oxygen demand, as well as methane gas being produced at depth. These features were most common in the lower, brackish segment of the river, in association with heavy development/industrialization along the shoreline and in the surrounding watershed. In addition to high levels of chemical contaminants at some locations, it is possible to conclude that this part of the river experiences excessive organic loading that have resulted in disturbed or degraded benthic habitat conditions. Given the high apparent oxygen demand of the sediments and overlying waters, it is also possible that periodic episodes of near-bottom hypoxia or anoxia occur in this area.

August, 2005 26
Given the disturbed habitat conditions, it is not surprising that the benthic communities in the brackish river segment appeared to be dominated by lower-order, opportunistic Stage I taxa. At the limited number of stations having evidence of a more well-developed, Stage III community, only small numbers of Stage III organisms appeared to be present (i.e., only one or two feeding voids and very few larger-bodied individuals visible at depth). As a whole, the tidal freshwater stations had both greater habitat diversity and conditions suitable for supporting moderate to high numbers of tubificid oligochaetes, considered to be representative of an advanced successional status (Stage III) in freshwater systems. It is hypothesized that the somewhat better habitat conditions within the tidal freshwater segment of the river are due to lower organic loading rates, as a result of less industrialization and lower-density development in the surrounding watershed. The main conclusions that can be drawn from summarizing all the data are the following:
1. The lower Passaic River represents a dynamic sedimentary environment characterized by regular cycles of sediment erosion and deposition. The existence of such cycles is readily inferred from the multiple distinct sedimentary horizons that occur within the upper 20 cm of the sediment column throughout the lower river, as revealed through sediment-profile imaging. These cycles also are reflected in a wide variety of existing sediment types and benthic habitat conditions.
2. Methane gas bubbles and black anoxic sediments indicate excessive organic enrichment of the bottom, particularly in the highly developed and densely populated brackish segment of the river in the vicinity of the city of Newark.
3. In the brackish segment of the river, degraded habitat conditions have resulted in benthic communities dominated by small, opportunistic and/or pollution-tolerant taxa (successional Stage I).
4. In the tidal freshwater segment of the river that was surveyed, habitat conditions were found to be more varied and capable of supporting a more advanced benthic community (Stage III).
August, 2005 27
5.0 REFERENCES CITED
Aller, J.Y. and I. Stupakoff. 1996. The distribution and seasonal characteristics of
benthic communities on the Amazon shelf as indicators of physical processes. Cont. Shelf Res. 16: 717-751.
Boudreau, B.P. 1986. Mathematics of tracer mixing in sediment. I-Spatially-dependent,
diffusive mixing. II: Non-local mixing and biological conveyor-belt phenomena. Am. Jour. Sci. 286: 161-238.
Boudreau, B.P. 1994. Is burial velocity a master parameter for bioturbation? Geochimica
et Cosmochemica Acta 58: 1243-1249. Boudreau, B. P. 1998. Mean mixed depth of sediments: The wherefore and the why.
Limnol. Oceanogr. 43: 524-526. Ekman, J.E., Nowell, A.R.M., and P.A. Jumars. 1981. Sediment destabilization by animal
tubes. J. Mar. Res. 39: 361-374. François, F., Gerino, M., Stora, G., Durbec, J.P., and J.C. Poggiale. 2002. Functional
approach to sediment reworking by gallery-forming macrobenthic organisms: modeling and application with the polychaete Nereis diversicolor. Marine Ecology Progress Series 229: 127–136.
Fredette, T.J., W.F. Bohlen, D.C. Rhoads, and R.W. Morton. 1988. Erosion and
resuspension effects of Hurricane Gloria at Long Island Sound dredged material disposal sites. In: Proceedings of the Water Quality ‘88 seminar, February Meeting, Charleston, South Carolina. U.S. Army Corps of Engineers, Hydraulic Engineering Center, Davis, CA.
Germano, J.D. 1983. Infaunal succession in Long Island Sound: Animal-sediment
interactions and the effects of predation. Ph.D. dissertation. Yale University, New Haven, CT. 206 pp.
Germano, J.D. and D.C. Rhoads. 1984. REMOTS sediment profiling at the Field
Verification Program (FVP) Disposal Site. In: Dredging '84 Proceedings, ASCE, Nov. 14-16, Clearwater, FL. pp. 536-544.
August, 2005 28
Gilbert, F. S. Hulth, N. Strömberg, K. Ringdahl, and J.-C. Poggiale. 2003. 2-D optical quantification of particle reworking activities in marine surface sediments. Jour. Exp. Mar. Biol. Ecol. 285-286: 251-264.
Grant, W.D., Jr., Boyer, L.F., and Sanford, L.P. 1982. The effects of bioturbation on the initiation of motion of intertidal sands: Jour. Mar. Res., Vol. 40, pp. 659-677.
Huettel, M., W. Ziebis, and S. Forster. 1996. Flow-induced uptake of particulate matter in
permeable sediments. Limnol. Oceanogr. 41: 309-322. Huettel, M., Ziebis, W., Forster., S., and G.W. Luther III. 1998. Advective transport
affecting metal and nutrient distributions and interfacial fluxes in permeable sediments. Geochimica et Cosmochemica Acta 62: 613-631.
Hyland, J., L. Balthis, I. Karakassis, P. Magni, A. Petrov, J. Shine, O. Vestergaard and R.
Warwick. 2005. Organic carbon content of sediments as an indicator of stress in the marine benthos. Mar. Ecol. Prog. Ser. 295:91-103.
Kennish, M.J. 1986. Ecology of estuaries. Vol. I: Physical and chemical aspects.
CRC Press, Boca Raton, FL. McCall, P. L. and F. M. Soster. 1990. Benthos response to disturbance in western Lake
Erie: regional faunal surveys. Can. J. Fish. Aquat. Sci. 47:1996-2009. Nowell, A.R.M., P.A. Jumars, and J.E. Ekman. 1981. Effects of biological activity on the
entrainment of marine sediments. Mar. Geol. 42: 133-153.
Pearson, T.H. and R. Rosenberg. 1978. Macrobenthic succession in relation to organic
enrichment and pollution of the marine environment. Oceanogr. Mar. Biol. Ann. Rev. 16:229-311.
Reible, D and Thibodeaux, L. 1999. Using Natural Processes to Define Exposure
From Sediments., in Sediment Management Work Group; Contaminated Sediment Management Technical Papers, Sediment Management Work Group, http://www.smwg.org/index.htm.
Revelas, E.C., J.D. Germano, and D.C. Rhoads. 1987. REMOTS reconnaissance of
benthic environments. pp. 2069-2083. In: Coastal Zone ‘87 Proceedings, ASCE, WW Division, May 26-29, Seattle, WA.
Rhoads, D.C. 1974. Organism-sediment relations on the muddy seafloor. Oceanogr.
Mar. Biol. Ann. Rev. 12: 263-300.

August, 2005 29
Rhoads, D.C. and L.F. Boyer. 1982. The effects of marine benthos on physical properties of sediments. pp. 3-52. In: Animal-Sediment Relations. McCall, P.L. and M.J.S. Tevesz (eds). Plenum Press, New York, NY.
Rhoads, D.C. and J.D. Germano. 1982. Characterization of benthic processes using
sediment profile imaging: An efficient method of remote ecological monitoring of the seafloor (REMOTS™ System). Mar. Ecol. Prog. Ser. 8:115-128.
Rhoads, D.C. and J.D. Germano. 1986. Interpreting long-term changes in benthic
community structure: A new protocol. Hydrobiologia. 142:291-308. Rhoads, D.C. and J.D. Germano. 1990. The use of REMOTS® imaging technology for
disposal site selection and monitoring. pp. 50-64. In: Geotechnical Engineering of Ocean Waste Disposal, K. Demars and R. Chaney (eds). ASTM Symposium Volume, January, 1989. Orlando, FL.
Rice, D.L. and D.C. Rhoads. 1989. Early diagenesis of organic matter and the
nutritional value of sediment. pp. 59-97. In: Ecology of Marine Deposit Feeders, Vol. 31, Lecture notes on coastal and estuarine deposit feeders. Lopez, G., G. Tagon, and J. Levinton, (eds.). Springer-Verlag, New York, NY.
Soster, F. M. and P. L. McCall. 1990a. Benthos response to disturbance in western Lake
Erie: field experiments. Can. J. Fish. Aquat. Sci. 47:1970-1985. Valente, R. M. 2004. The role of seafloor characterization and benthic habitat mapping
in dredged material management: a review. Journal of Marine Environmental Engineering 7(3):185-215.
Valente, R.M., D.C. Rhoads, J.D. Germano, and V.J. Cabelli. 1992. Mapping of benthic
enrichment patterns in Narragansett Bay, RI. Estuaries 15:1-17. Ziebis, W., Huettel, M., and S. Forster. 1996. Impact of biogenic sediment topography on
oxygen fluxes in permeable seabeds. Mar. Ecol. Prog. Ser. 1409: 227-237.

FIGURES
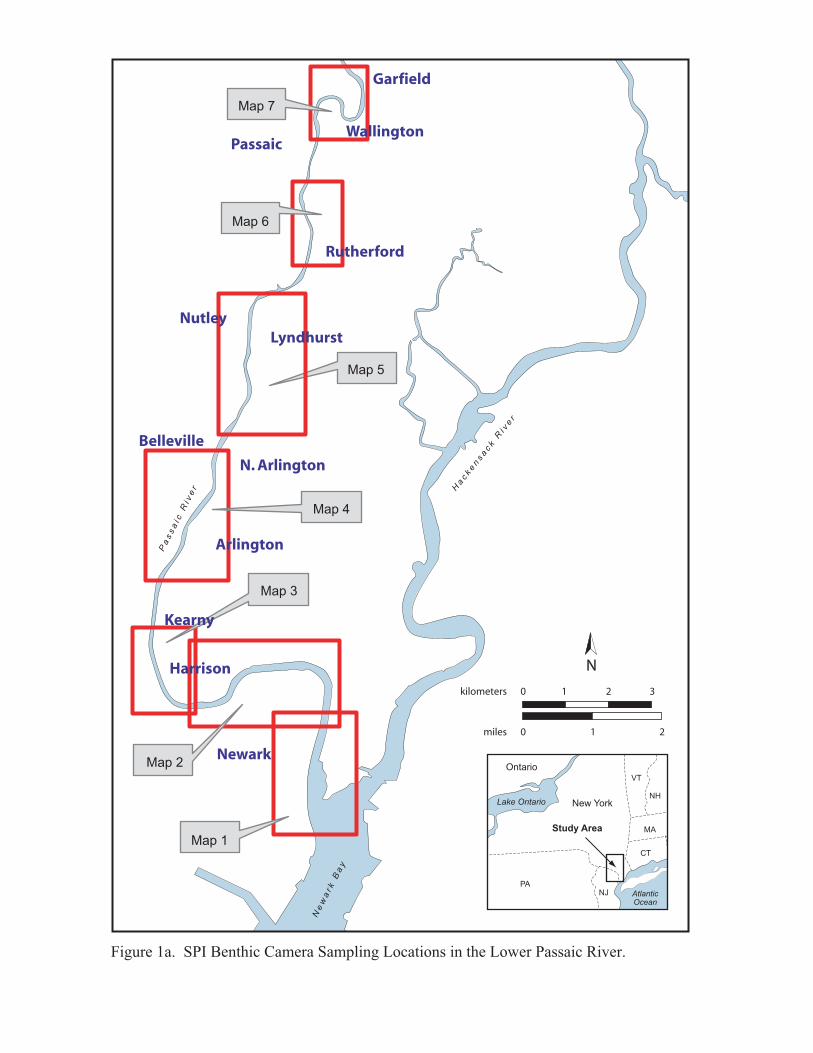
Map 6
Map 1
Map 2
Map 7
N
kilometers
miles
0 2 3
0
1
1 2
Map 5
Map 4
Map 3
Figure 1a. SPI Benthic Camera Sampling Locations in the Lower Passaic River.
PANJ
CT
MA
New York
Ontario
NH
VT
Lake Ontario
AtlanticOcean
Study Area
Ne
wa
rk
Ba
y
Pa
ss
ai c
Ri v
er H
acke
nsa
ck R
i ve
r
Newark
Harrison
Kearny
Arlington
Belleville
N. Arlington
Nutley
Rutherford
PassaicWallington
Garfield
Lyndhurst
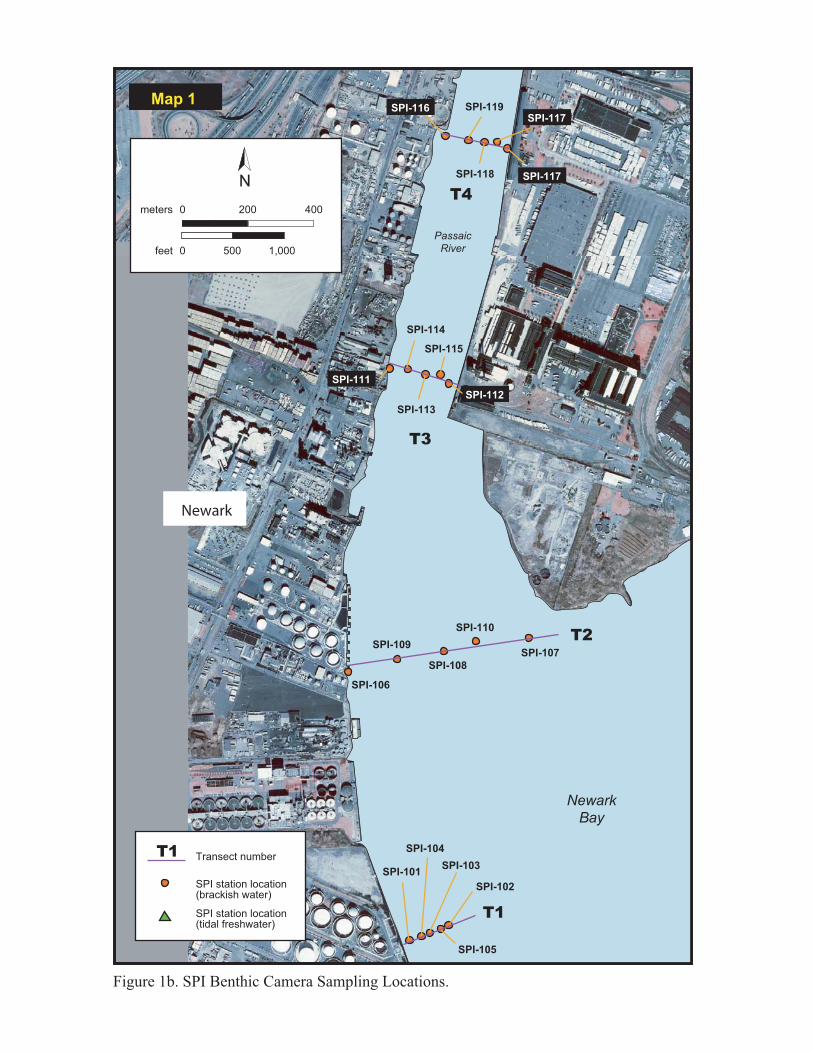
Figure 1b. SPI Benthic Camera Sampling Locations.
SPI-119
SPI-118
SPI-120
SPI-117
SPI-112
SPI-115
SPI-113
SPI-114
SPI-111
SPI-106
SPI-109
SPI-108
SPI-110
SPI-107
SPI-105
SPI-102
SPI-103
SPI-104
SPI-101
Newark
Bay
Passaic
River
Map 1
N
0 200 400
0 500 1,000
meters
feet
SPI-116
SPI-111
SPI-112
SPI-117
SPI-117
SPI station location(brackish water)
Transect number
SPI station location(tidal freshwater)
T1
T1
T2
T3
T4
Newark
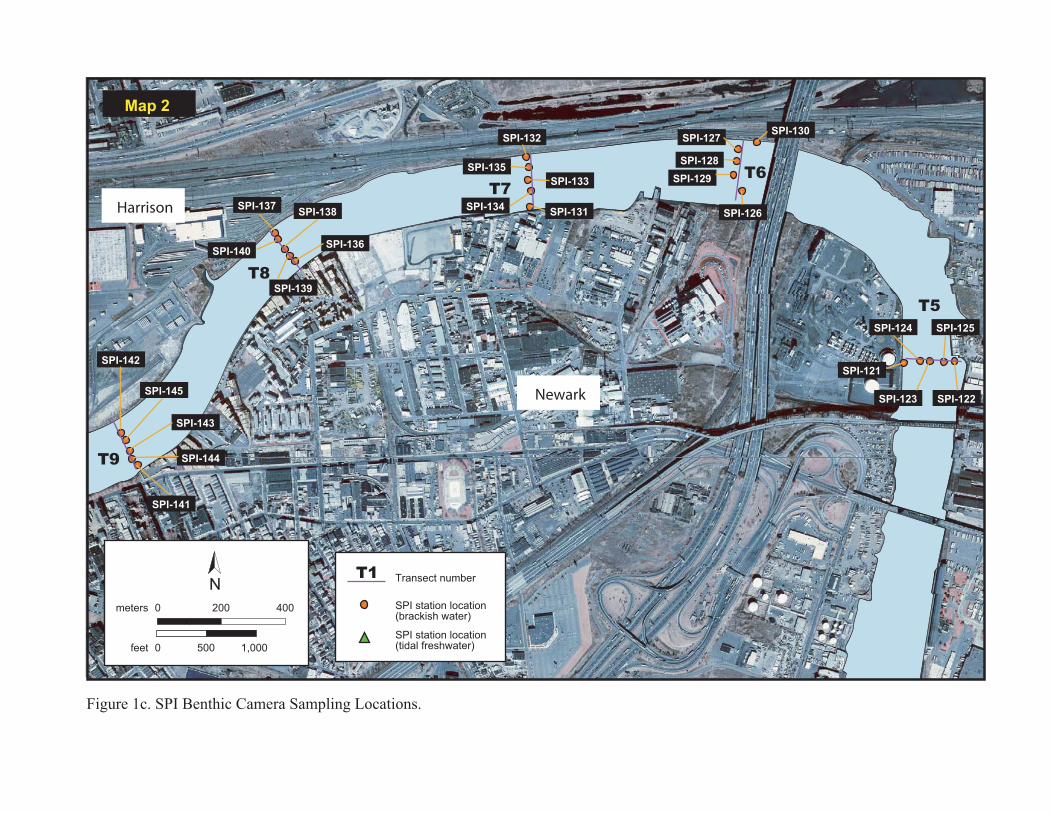
Figure 1c. SPI Benthic Camera Sampling Locations.
. ... .
.
.
.
.
.
.
.
..
.
.
.
. .
.
.
.
..
.
SPI-
SPI-127
SPI-121
SPI-126
SPI-129
SPI-128
SPI-127
SPI-135
SPI-131SPI-134SPI-137
SPI-138
SPI-136
SPI-139
SPI-141
SPI-143
SPI-145
SPI-142
SPI-144
SPI-140
SPI-132
SPI-133
SPI-130
SPI-123 SPI-122
SPI-124 SPI-125
N
0 200 400
0 500 1,000
meters
feet
Map 2
SPI station location(brackish water)
Transect number
SPI station location(tidal freshwater)
T1
T9
T8
T7
T6
T5
Newark
Harrison
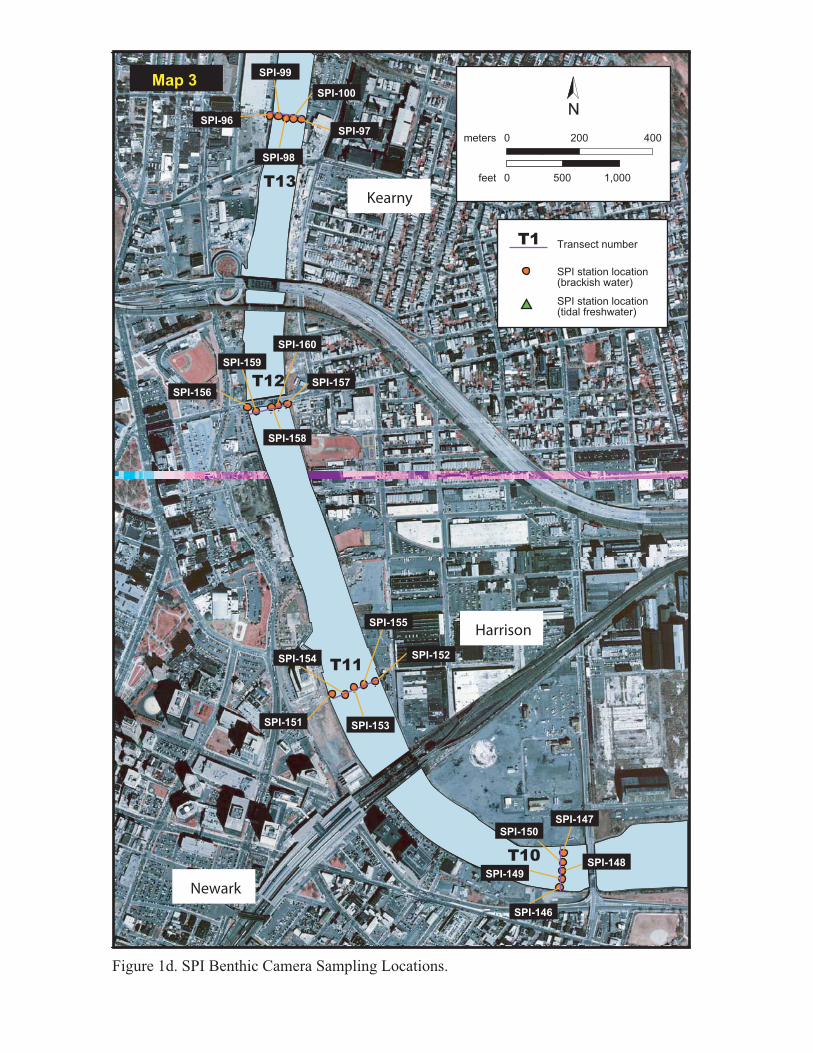
Figure 1d. SPI Benthic Camera Sampling Locations.
. ... .
.
.
..
.
..
...
. ... .
N
0 200 400
0 500 1,000
meters
feet
SPI-96
SPI-98
SPI-97
SPI-100
SPI-160
SPI-158
SPI-157
SPI-159
SPI-156
SPI-151
SPI-154
SPI-150SPI-147
SPI-148SPI-149
SPI-146
SPI-155
SPI-152
SPI-153
SPI-99Map 3
SPI station location(brackish water)
Transect number
SPI station location(tidal freshwater)
T1
T13
T12
T11
T10
Newark
Harrison
Kearny
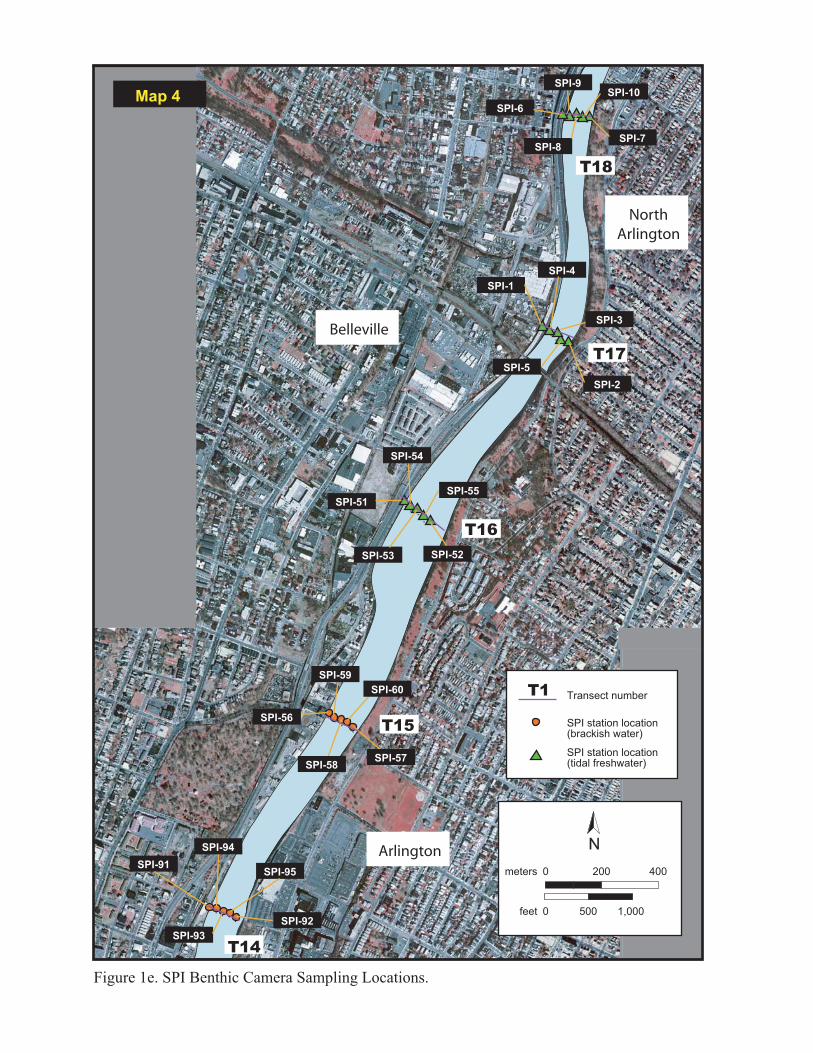
Figure 1e. SPI Benthic Camera Sampling Locations.
..
...
. ... .
.
...
.
..
...
.... .
SPI-9
SPI-6
SPI-8SPI-7
SPI-5
SPI-2
SPI-3
SPI-1
SPI-4
SPI-54
SPI-55SPI-51
SPI-53 SPI-52
SPI-94
SPI-91SPI-95
SPI-92
SPI-93
SPI-10Map 4
N
0 200 400
0 500 1,000
meters
feet
SPI-57
SPI-60
SPI-58
SPI-59
SPI-56SPI station location(brackish water)
Transect number
SPI station location(tidal freshwater)
T1
T18
T17
T16
T15
T14
Belleville
Arlington
NorthArlington
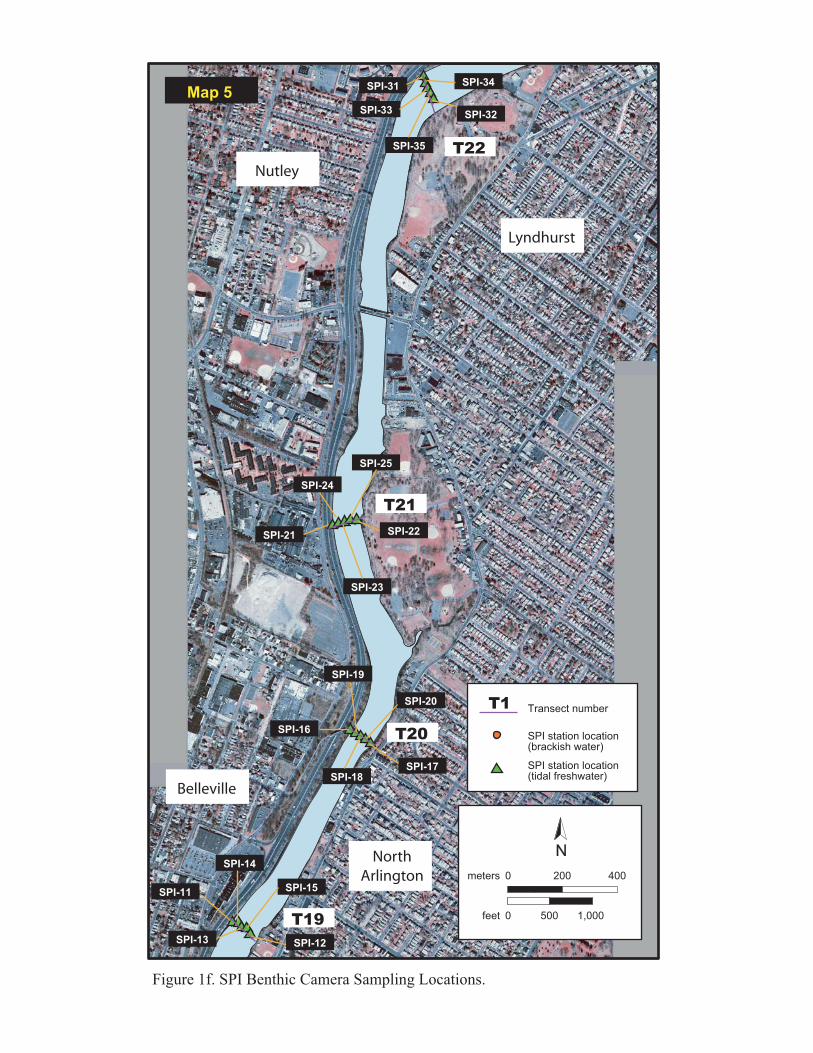
Figure 1f. SPI Benthic Camera Sampling Locations.
..
.. .
..... .
. ... .
.
... .
4
N
0 200 400
0 500 1,000
meters
feet
SPI-24
SPI-19
SPI-20
SPI-17SPI-18
SPI-14
SPI-15
SPI-12
SPI-11
SPI-13
SPI-16
SPI-25
SPI-22
SPI-23
SPI-21
Map 5SPI-34
SPI-35
SPI-32SPI-33
SPI-31
SPI station location(brackish water)
Transect number
SPI station location(tidal freshwater)
T1
T19
T20
T21
T22
Lyndhurst
Nutley
Belleville
NorthArlington
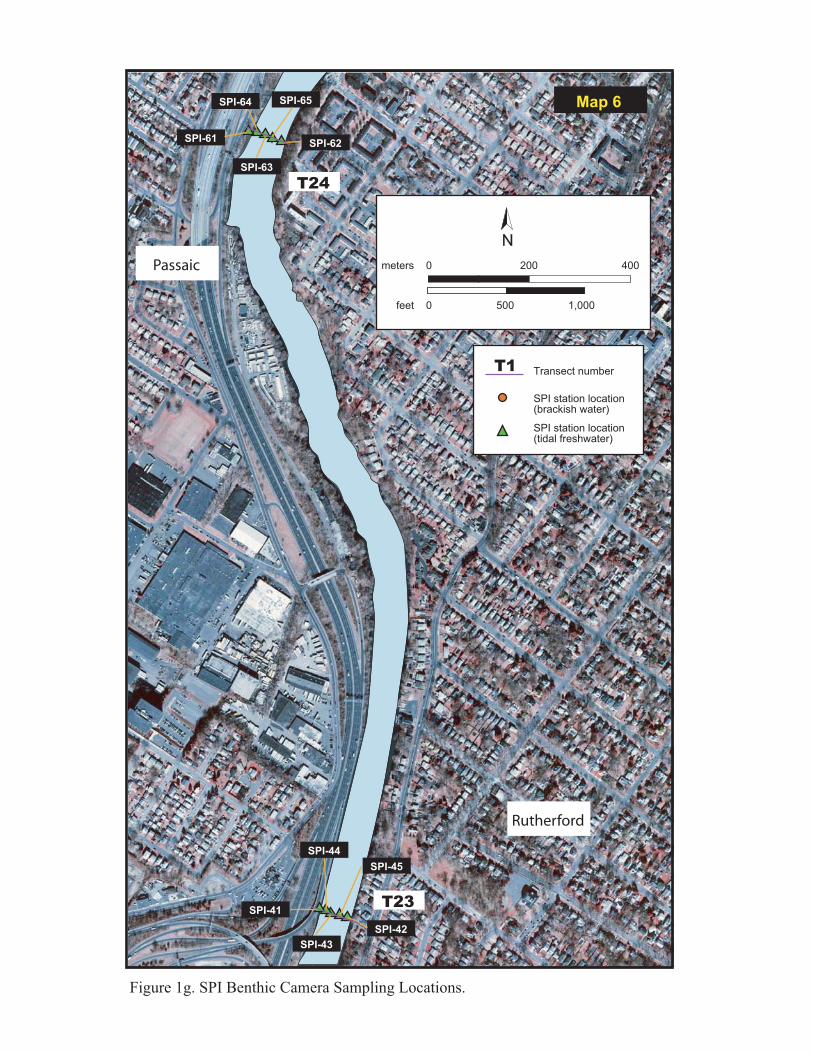
Figure 1g. SPI Benthic Camera Sampling Locations.
.... .
..
...-
N
0 200 400
0 500 1,000
meters
feet
SPI-44
SPI-45
SPI-42
SPI-43
SPI-41
Map 6SPI-65
SPI-62
SPI-63
SPI-64
SPI-61
SPI station location(brackish water)
Transect number
SPI station location(tidal freshwater)
T1
T24
T23
Rutherford
Passaic

Figure 1h. SPI Benthic Camera Sampling Locations.
..
.
.
....
N
0 200 400
0 500 1,000
meters
feet
Map 7 SPI-169
SPI-170SPI-168
SPI-167
SPI-81
SPI-84
SPI-85SPI-82
SPI-83
SPI-75
SPI-72
SPI-73
SPI-74
SPI-71
SPI station location(brackish water)
Transect number
SPI station location(tidal freshwater)
T1
T27
T26
T25Wallington
Passaic
Garfield

Figure 2. Operation of the sediment-profile camera during deployment. The central cradle of the camera is held in the “up” position by tension on the winch wire as it is being lowered to the seafloor (left); once the frame base hits the bottom (center), the prism is then free to penetrate the bottom (right) and take the photograph.

Stage 1 Stage 2 Stage 3
Dep
th (
cm
)D
ep
th (
cm
)
0
1
2
3
0
1
2
3
Stage 1 Stage 2 Stage 3Azoic
Figure 3. Soft-bottom benthic community response to disturbance (top panel) or organic enrichment (bottom panel). From
Rhoads and Germano, 1982.
Physical Disturbance Time Normal
Grossly PollutedDistance
Normal
A
B
Fiber Blanket
Anaerobic
Sediment
Anaerobic
Sediment
Oxidized
Sediment
Oxidized
Sediment
Water
Water
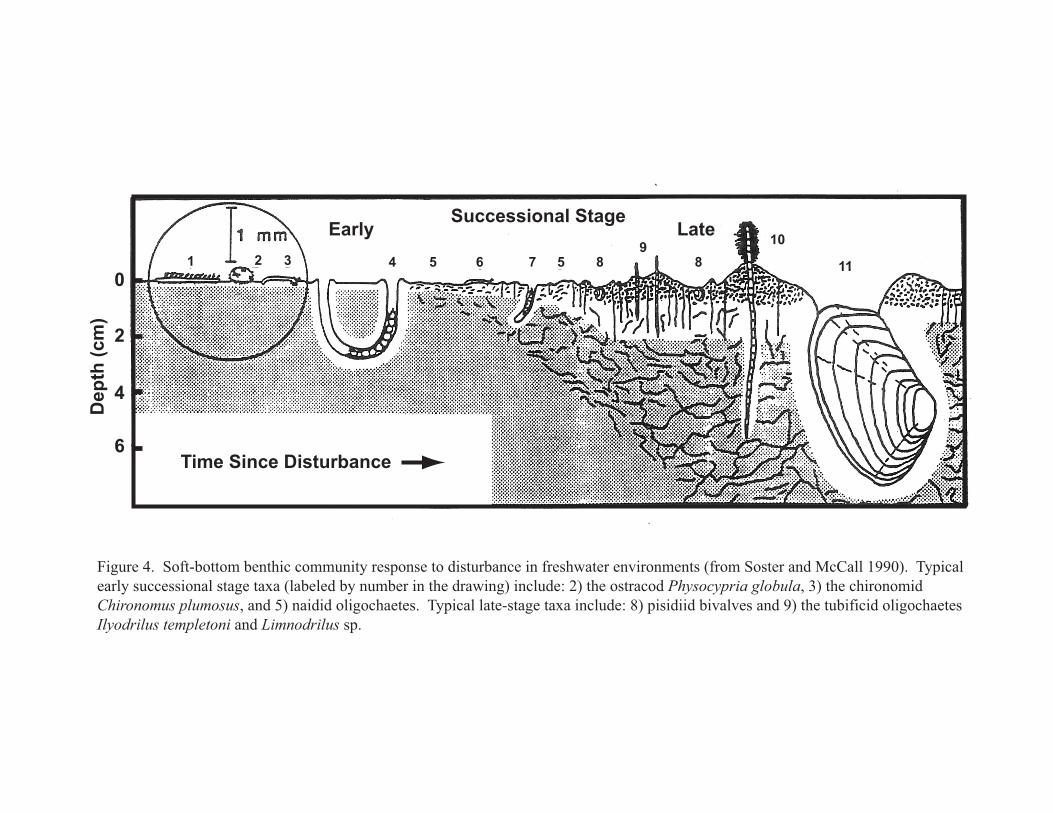
Dep
th (
cm
)
0
2
4
6
Successional StageEarly Late
Time Since Disturbance
Figure 4. Soft-bottom benthic community response to disturbance in freshwater environments (from Soster and McCall 1990). Typical
early successional stage taxa (labeled by number in the drawing) include: 2) the ostracod Physocypria globula, 3) the chironomid
Chironomus plumosus, and 5) naidid oligochaetes. Typical late-stage taxa include: 8) pisidiid bivalves and 9) the tubificid oligochaetes
Ilyodrilus templetoni and Limnodrilus sp.
1 2 3 4 5 5 8 8
10
11
96 7
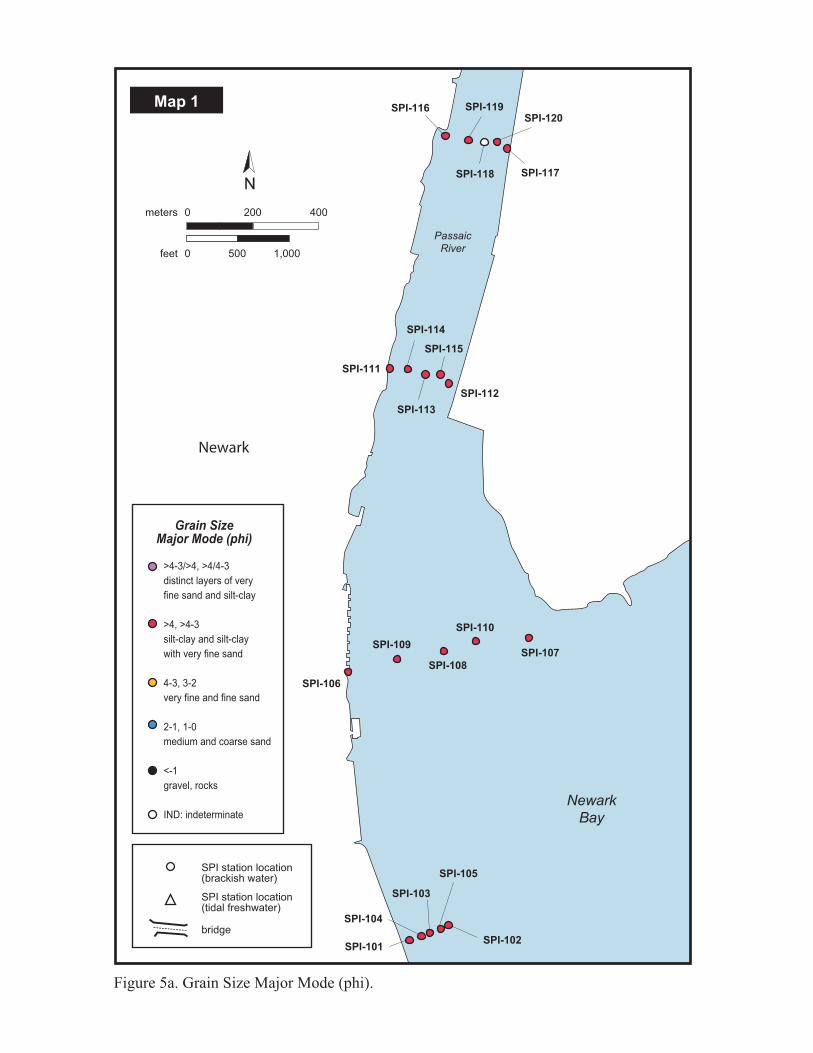
SPI-116 SPI-119
SPI-118
SPI-120
SPI-117
SPI-112
SPI-115
SPI-113
SPI-114
SPI-111
SPI-106
SPI-109
SPI-108
SPI-110
SPI-107
SPI-105
SPI-102
SPI-103
SPI-104
SPI-101
N
0 200 400
0 500 1,000
meters
feet
Newark
Bay
Passaic
River
Map 1
bridge
SPI station location(brackish water)
SPI station location(tidal freshwater)
Grain SizeMajor Mode (phi)
>4-3/>4, >4/4-3
distinct layers of very
fine sand and silt-clay
>4, >4-3
silt-clay and silt-clay
with very fine sand
4-3, 3-2
very fine and fine sand
2-1, 1-0
medium and coarse sand
<-1
gravel, rocks
IND: indeterminate
Newark
Figure 5a. Grain Size Major Mode (phi).

. ... .
.
.
.
.
.
..
.
.
.
. .
.
.
.
..
.
I-
Map 2
N
0 200 400
0 500 1,000
meters
feet
SPI-121
SPI-129
SPI-128
SPI-127
SPI-135
SPI-131
SPI-134SPI-137SPI-138
SPI-136
SPI-139
SPI-141
SPI-143
SPI-145
SPI-142
SPI-144
SPI-140
SPI-132
SPI-133
SPI-123 SPI-122
SPI-124 SPI-125
SPI-126
SPI-130
bridge
SPI station location(brackish water)
SPI station location(tidal freshwater)
Newark
Harrison
Figure 5b. Grain Size Major Mode (phi).
Grain SizeMajor Mode (phi)
>4-3/>4, >4/4-3
distinct layers of very
fine sand and silt-clay
>4, >4-3
silt-clay and silt-clay
with very fine sand
4-3, 3-2
very fine and fine sand
2-1, 1-0
medium and coarse sand
<-1
gravel, rocks
IND: indeterminate
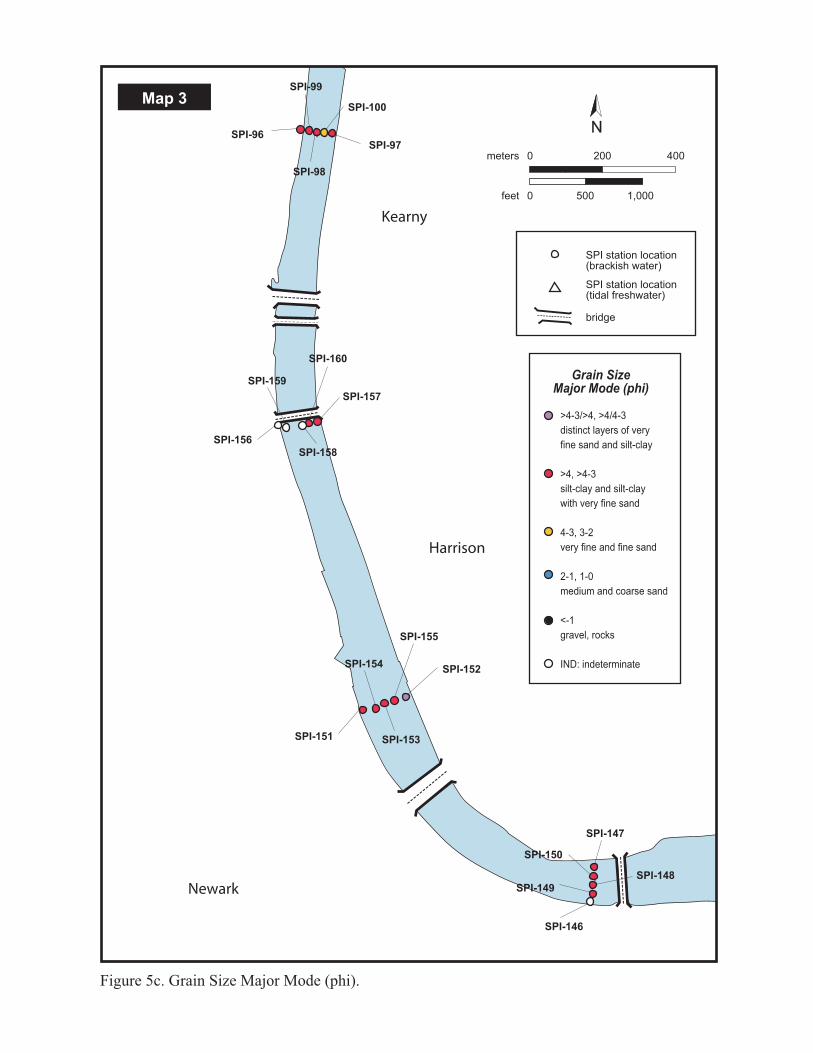
. ... .
.
..
..
...
... .
N
0 200 400
0 500 1,000
meters
feet
Map 3
SPI-96
SPI-98
SPI-97
SPI-100
SPI-160
SPI-158
SPI-157
SPI-159
SPI-156
SPI-151
SPI-154
SPI-150
SPI-147
SPI-149
SPI-146
SPI-155
SPI-152
SPI-153
SPI-99
SPI-148
bridge
SPI station location(brackish water)
SPI station location(tidal freshwater)
Newark
Harrison
Kearny
Figure 5c. Grain Size Major Mode (phi).
Grain SizeMajor Mode (phi)
>4-3/>4, >4/4-3
distinct layers of very
fine sand and silt-clay
>4, >4-3
silt-clay and silt-clay
with very fine sand
4-3, 3-2
very fine and fine sand
2-1, 1-0
medium and coarse sand
<-1
gravel, rocks
IND: indeterminate
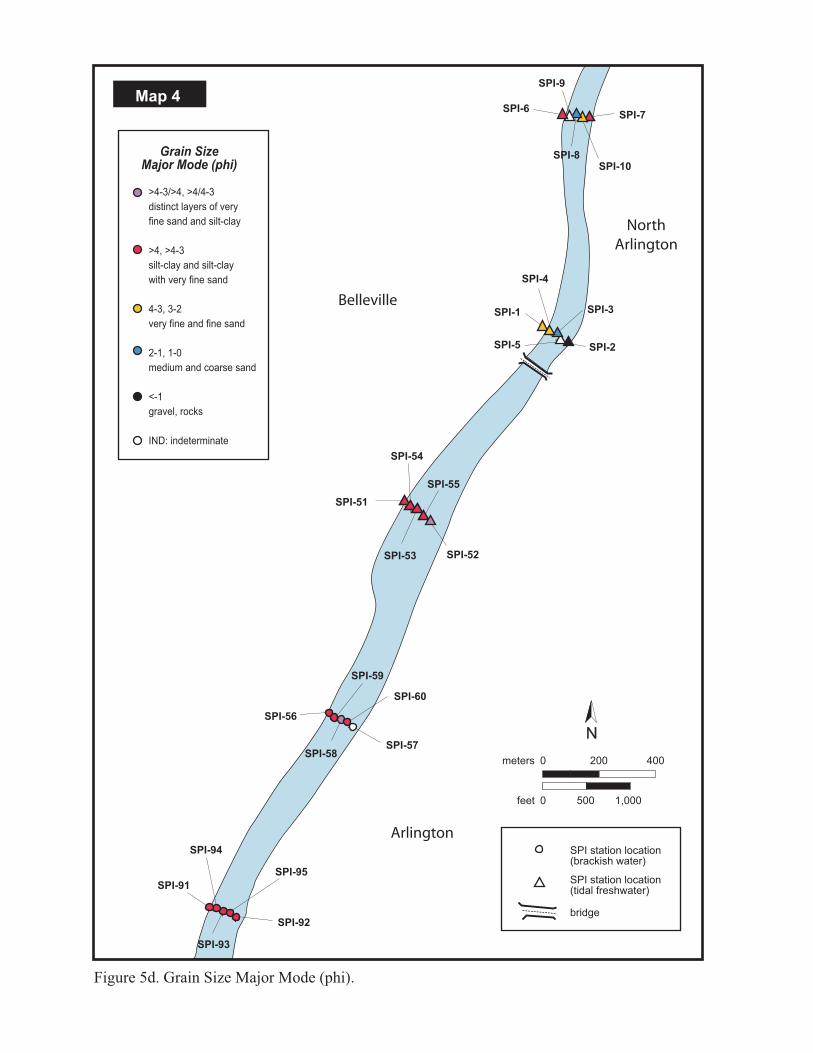
bridge
SPI station location(brackish water)
SPI station location(tidal freshwater)
..
...
. ... .
.
..
..
...
Map 4
N
0 200 400
0 500 1,000
meters
feet
SPI-9
SPI-6
SPI-8
SPI-7
SPI-5 SPI-2
SPI-3SPI-1
SPI-4
SPI-54
SPI-55
SPI-51
SPI-53 SPI-52
SPI-94
SPI-91
SPI-95
SPI-92
SPI-93
SPI-10
SPI-57
SPI-60
SPI-58
SPI-59
SPI-56
Belleville
Arlington
NorthArlington
Figure 5d. Grain Size Major Mode (phi).
Grain SizeMajor Mode (phi)
>4-3/>4, >4/4-3
distinct layers of very
fine sand and silt-clay
>4, >4-3
silt-clay and silt-clay
with very fine sand
4-3, 3-2
very fine and fine sand
2-1, 1-0
medium and coarse sand
<-1
gravel, rocks
IND: indeterminate
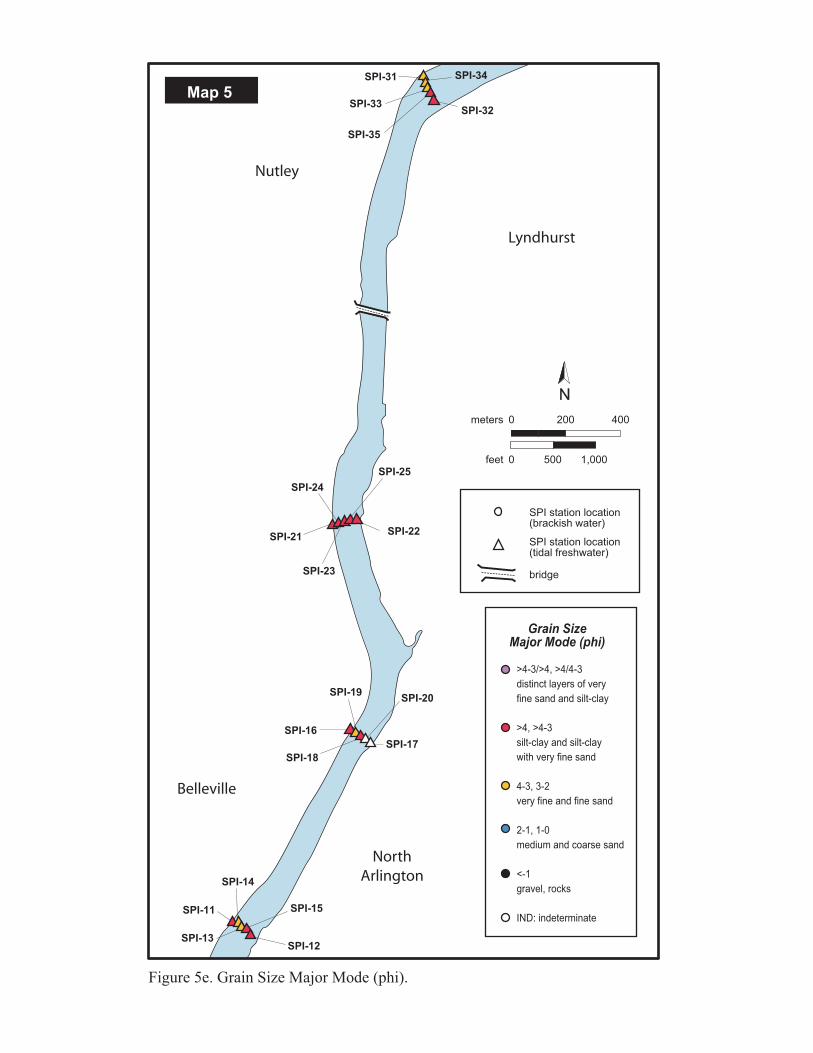
..
.....
. . .
...
N
0 200 400
0 500 1,000
meters
feet
Map 5
bridge
SPI station location(brackish water)
SPI station location(tidal freshwater)
SPI-24
SPI-19SPI-20
SPI-17
SPI-18
SPI-14
SPI-15
SPI-12
SPI-11
SPI-13
SPI-16
SPI-25
SPI-22
SPI-23
SPI-21
SPI-34
SPI-35
SPI-32SPI-33
SPI-31
Lyndhurst
Nutley
Belleville
NorthArlington
Figure 5e. Grain Size Major Mode (phi).
Grain SizeMajor Mode (phi)
>4-3/>4, >4/4-3
distinct layers of very
fine sand and silt-clay
>4, >4-3
silt-clay and silt-clay
with very fine sand
4-3, 3-2
very fine and fine sand
2-1, 1-0
medium and coarse sand
<-1
gravel, rocks
IND: indeterminate

.... .
..
..
N
0 200 400
0 500 1,000
meters
feet
Map 6
SPI station location(brackish water)
SPI station location(tidal freshwater)
SPI-44
SPI-45
SPI-42SPI-43
SPI-41
SPI-65
SPI-62
SPI-63
SPI-64
SPI-61
Rutherford
Passaic
Figure 5f. Grain Size Major Mode (phi).
Grain SizeMajor Mode (phi)
>4-3/>4, >4/4-3
distinct layers of very
fine sand and silt-clay
>4, >4-3
silt-clay and silt-clay
with very fine sand
4-3, 3-2
very fine and fine sand
2-1, 1-0
medium and coarse sand
<-1
gravel, rocks
IND: indeterminate

.
....
N
0 200 400
0 500 1,000
meters
feet
Map 7
bridge
SPI station location(brackish water)
SPI station location(tidal freshwater)
SPI-169
SPI-170
SPI-168
SPI-167
SPI-81
SPI-84
SPI-85SPI-82
SPI-83
SPI-75
SPI-72
SPI-73
SPI-74
SPI-71Wallington
Passaic
Garfield
Figure 5g. Grain Size Major Mode (phi).
Grain SizeMajor Mode (phi)
>4-3/>4, >4/4-3
distinct layers of very
fine sand and silt-clay
>4, >4-3
silt-clay and silt-clay
with very fine sand
4-3, 3-2
very fine and fine sand
2-1, 1-0
medium and coarse sand
<-1
gravel, rocks
IND: indeterminate
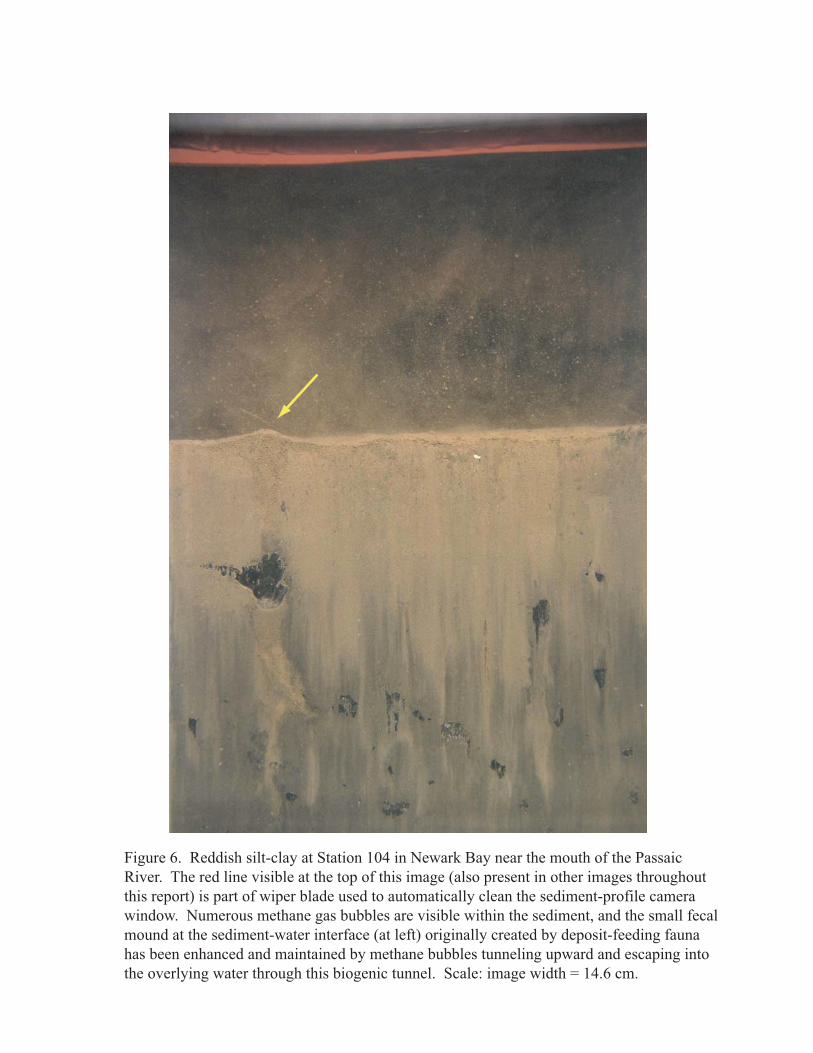
Figure 6. Reddish silt-clay at Station 104 in Newark Bay near the mouth of the Passaic
River. The red line visible at the top of this image (also present in other images throughout
this report) is part of wiper blade used to automatically clean the sediment-profile camera
window. Numerous methane gas bubbles are visible within the sediment, and the small fecal
mound at the sediment-water interface (at left) originally created by deposit-feeding fauna
has been enhanced and maintained by methane bubbles tunneling upward and escaping into
the overlying water through this biogenic tunnel. Scale: image width = 14.6 cm.
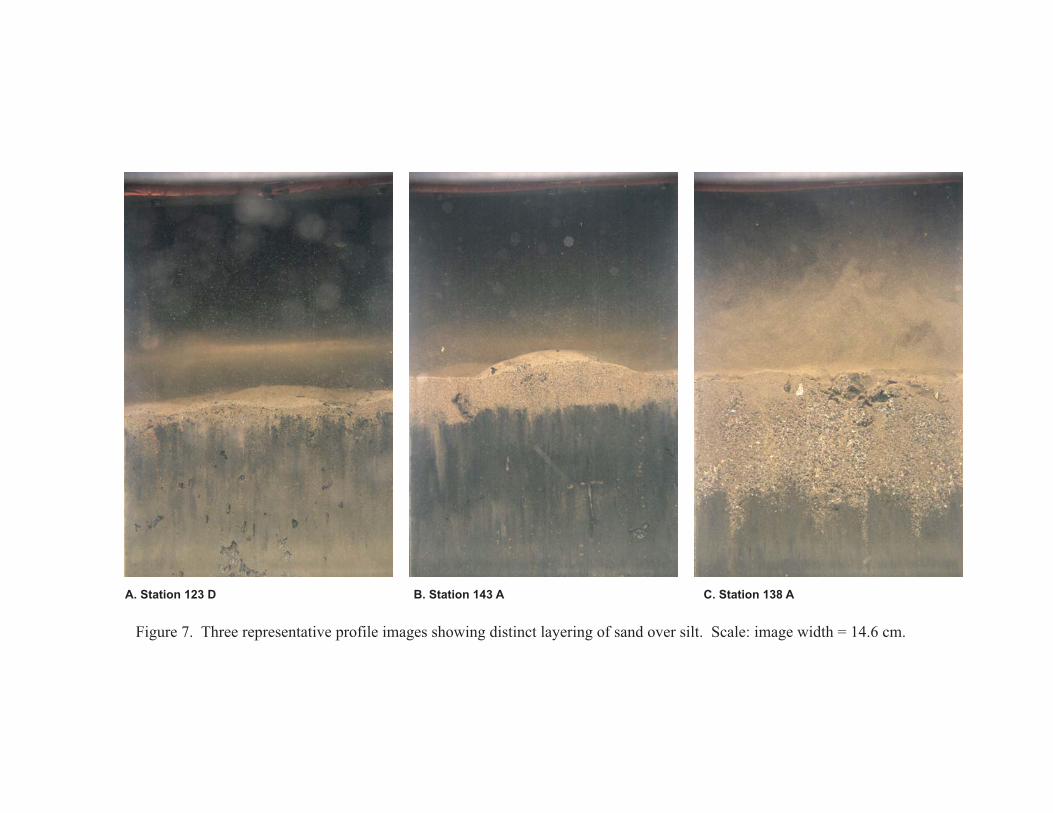
Figure 7. Three representative profile images showing distinct layering of sand over silt. Scale: image width = 14.6 cm.
A. Station 123 D B. Station 143 A C. Station 138 A

Figure 8. Three representative profile images showing layering of silt over sand. Scale: image width = 14.6 cm.
A. Station 53 A B. Station 74 B C. Station 155 A

Figure 9. Four representative profile images showing multiple sedimentary layers.
Clockwise from top left: alternating layers of silt at Station 140, alternating layers of silt
and sand at Stations 138 and 7, and alternating layers of silt and organic detritus (decayed
leaf litter) at Station 145. Scale: image width = 14.6 cm.
A. Station 140 A B. Station 138 B
D. Station 145 C C. Station 7 C
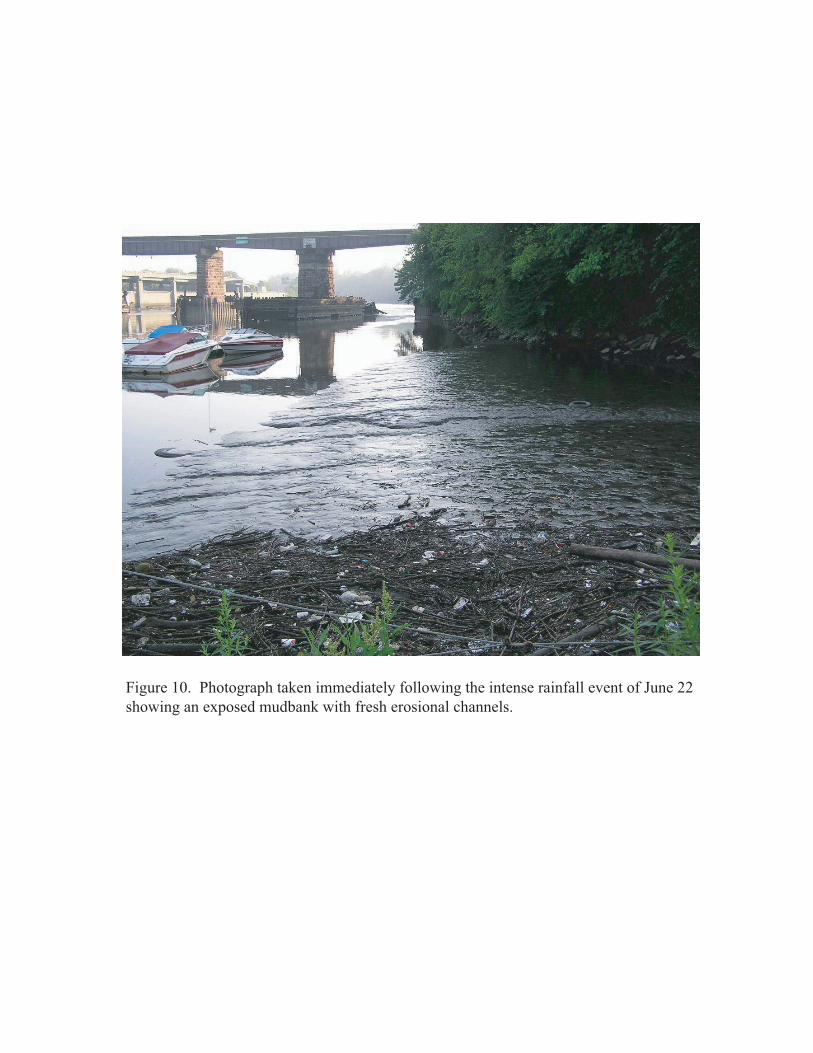
Figure 10. Photograph taken immediately following the intense rainfall event of June 22
showing an exposed mudbank with fresh erosional channels.
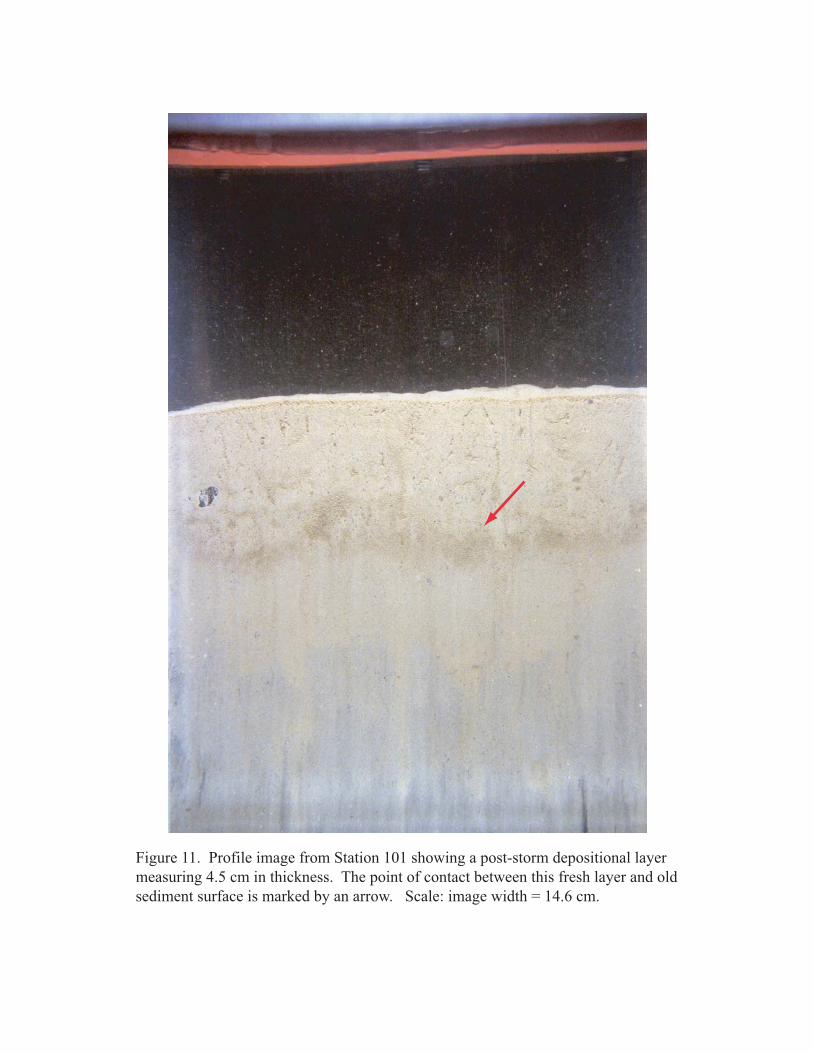
Figure 11. Profile image from Station 101 showing a post-storm depositional layer
measuring 4.5 cm in thickness. The point of contact between this fresh layer and old
sediment surface is marked by an arrow. Scale: image width = 14.6 cm.

Figure 12a. Depositional Layer Thickness (cm).
SPI-116 SPI-119
SPI-118
SPI-120
SPI-117
SPI-112
SPI-115
SPI-113
SPI-114
SPI-111
SPI-106
SPI-109
SPI-108
SPI-110
SPI-107
SPI-105
SPI-102
SPI-103
SPI-104
SPI-101
N
0 200 400
0 500 1,000
meters
feet
Newark
Bay
Passaic
River
Map 1
bridge
SPI station location(brackish water)
SPI station location(tidal freshwater)
Depositional Layer Thickness (cm)
No depositional layer present
0.1 - 3 cm
3.1 - 7.0 cm
> 7.0 cm
Indeterminate
Newark
Post-storm deposition?
Y
IND
Yes
Indeterminate
Y
Y
Y
IND
IND
no extra symbol for No
4.7
0.0
2.3
0.0
0.0
IND
0.0
IND
0.0
0.0
0.5
0.0
7.25.7
>7.7
1.7
3.8
0.00.0
9.1

. ... .
.
.
.
.
.
..
.
.
.
. .
.
.
.
..
.
I-
Map 2
N
0 200 400
0 500 1,000
meters
feet
SPI-121
SPI-129
SPI-128
SPI-127
SPI-135
SPI-131
SPI-134SPI-137SPI-138
SPI-136
SPI-139
SPI-141
SPI-143
SPI-145
SPI-142
SPI-144
SPI-140
SPI-132
SPI-133
SPI-123 SPI-122
SPI-124SPI-125
SPI-126
SPI-130
bridge
SPI station location(brackish water)
SPI station location(tidal freshwater)
Newark
Harrison
Figure 12b. Depositional Layer Thickness (cm).
Y
Y
Y
Y
Y
Y
0.0
2.00.9
1.80.0
>13.0
1.7
0.0
0.0 0.0
0.0
0.0
0.0
0.0
0.0
0.0
4.9
6.6
0.0
0.0
1.92.5
>12.6
11.1
1.3
Depositional Layer Thickness (cm)
No depositional layer present
0.1 - 3 cm
3.1 - 7.0 cm
> 7.0 cm
Indeterminate
Post-storm deposition?
Y
IND
Yes
Indeterminate
no extra symbol for No

. .. .
.
..
..
..
... .
N
0 200 400
0 500 1,000
meters
feet
Map 3
SPI-96
SPI-98
SPI-97
SPI-100
SPI-160
SPI-158
SPI-157
SPI-159
SPI-156
SPI-151
SPI-154
SPI-150
SPI-147
SPI-149
SPI-146
SPI-155
SPI-152
SPI-153
SPI-99
SPI-148
bridge
SPI station location(brackish water)
SPI station location(tidal freshwater)
Newark
Harrison
Kearny
Figure 12c. Depositional Layer Thickness (cm).
Y
Y
Y
Y Y
Y
Y
Y
Y
IND
INDIND
IND
IND
IND
IND
IND
5.7
1.1
1.7
0.8
2.4
5.6
1.8
1.7 2.3
IND
IND
0.0
IND
IND
6.7
3.4
IND
3.3
IND Depositional Layer Thickness (cm)
No depositional layer present
0.1 - 3 cm
3.1 - 7.0 cm
> 7.0 cm
Indeterminate
Post-storm deposition?
Y
IND
Yes
Indeterminate
no extra symbol for No
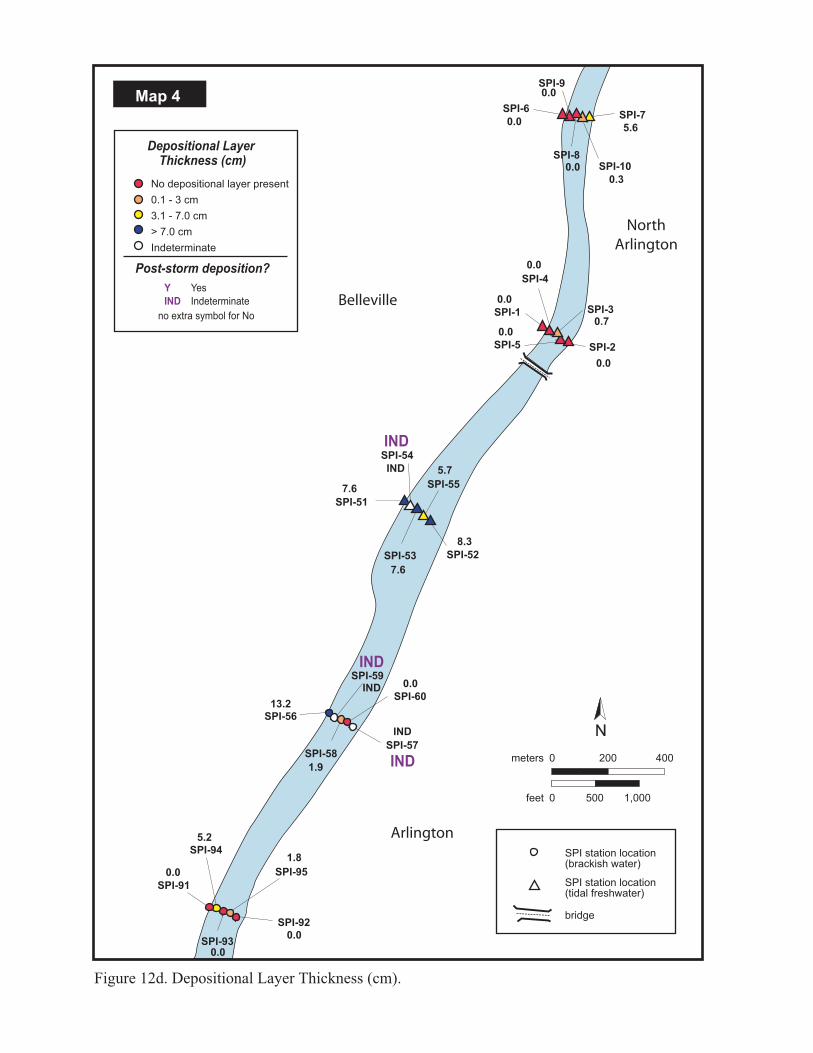
..
...
. ... .
.
..
...
Map 4
N
0 200 400
0 500 1,000
meters
feet
SPI-9
SPI-6
SPI-8
SPI-7
SPI-5 SPI-2
SPI-3SPI-1
SPI-4
SPI-54
SPI-55
SPI-51
SPI-53 SPI-52
SPI-94
0.0
0.0
0.0
13.2
1.9
IND 0.0
7.6
IND 5.7
8.3
7.6
0.0
0.0
0.0
0.0
0.0
0.0
0.0
0.3
5.6
0.7
IND
5.2
1.8
SPI-91
SPI-95
SPI-92
SPI-93
SPI-10
SPI-57
SPI-60
SPI-58
SPI-59
SPI-56
Belleville
Arlington
NorthArlington
bridge
SPI station location(brackish water)
SPI station location(tidal freshwater)
Figure 12d. Depositional Layer Thickness (cm).
IND
IND
IND
Depositional Layer Thickness (cm)
No depositional layer present
0.1 - 3 cm
3.1 - 7.0 cm
> 7.0 cm
Indeterminate
Post-storm deposition?
Y
IND
Yes
Indeterminate
no extra symbol for No

..
.....
. . .
...
N
0 200 400
0 500 1,000
meters
feet
Map 5
bridge
SPI station location(brackish water)
SPI station location(tidal freshwater)
SPI-24
SPI-19SPI-20
SPI-17
SPI-18
SPI-14
SPI-15
SPI-12
SPI-11
SPI-13
SPI-16
SPI-25
SPI-22
SPI-23
SPI-21
SPI-34
SPI-35
SPI-32SPI-33
SPI-31
Lyndhurst
Nutley
Belleville
Figure 12e. Depositional Layer Thickness (cm).
Y
Y
Y
IND
IND
0.0 0.0
0.0
0.0
0.0
0.0
0.0
0.0
13.9
7.5
0.00.0 0.0
0.0
11.0
0.0
IND
IND
0.0
8.5North
Arlington
Depositional Layer Thickness (cm)
No depositional layer present
0.1 - 3 cm
3.1 - 7.0 cm
> 7.0 cm
Indeterminate
Post-storm deposition?
Y
IND
Yes
Indeterminate
no extra symbol for No
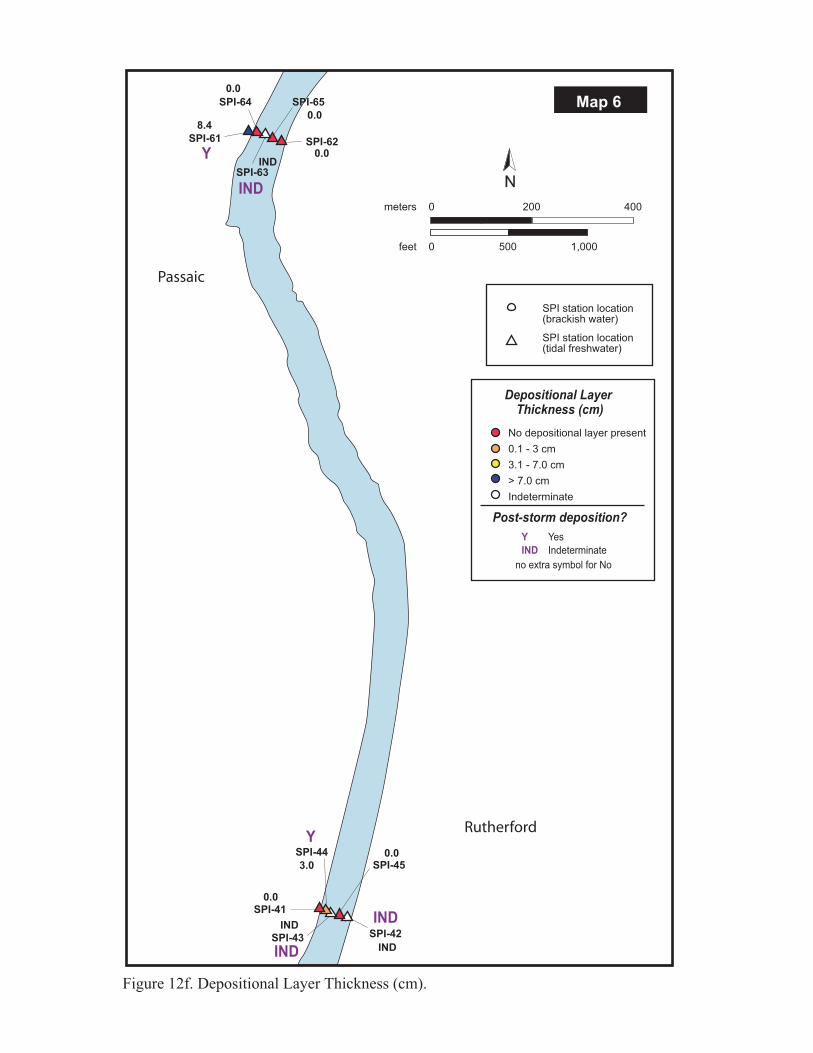
.... .
..
..
N
0 200 400
0 500 1,000
meters
feet
Map 6
SPI station location(brackish water)
SPI station location(tidal freshwater)
SPI-44
SPI-45
SPI-42SPI-43
SPI-41
SPI-65
SPI-62
SPI-63
SPI-64
SPI-61
Rutherford
Passaic
Figure 12f. Depositional Layer Thickness (cm).
Y
Y
IND
IND
IND
0.0
0.0
0.0
0.0
0.0
8.4
IND
3.0
IND
IND
Depositional Layer Thickness (cm)
No depositional layer present
0.1 - 3 cm
3.1 - 7.0 cm
> 7.0 cm
Indeterminate
Post-storm deposition?
Y
IND
Yes
Indeterminate
no extra symbol for No

.
....
N
0 200 400
0 500 1,000
meters
feet
Map 7
bridge
SPI station location(brackish water)
SPI station location(tidal freshwater)
SPI-169
SPI-170
SPI-168
SPI-167
SPI-81
SPI-84
SPI-85SPI-82
SPI-83
SPI-75
SPI-72
SPI-73
SPI-74
SPI-71 Wallington
Passaic
Garfield
Figure 12g. Depositional Layer Thickness (cm).
Y
IND
IND
IND
IND
IND
0.0
0.0
0.0
0.0
0.0
0.0
0.0
IND
IND
IND
IND
IND
0.0
2.1
Depositional Layer Thickness (cm)
No depositional layer present
0.1 - 3 cm
3.1 - 7.0 cm
> 7.0 cm
Indeterminate
Post-storm deposition?
Y
IND
Yes
Indeterminate
no extra symbol for No

Figure 13a. Prism Penetration Depths (cm).
SPI-116 SPI-119
SPI-118
SPI-120
SPI-117
SPI-112
SPI-115
SPI-113
SPI-114
SPI-111
SPI-106
SPI-109
SPI-108
SPI-110
SPI-107
SPI-105
SPI-102
SPI-103
SPI-104
SPI-101
N
0 200 400
0 500 1,000
meters
feet
Newark
Bay
Passaic
River
Map 1
bridge
SPI station location(brackish water)
SPI station location(tidal freshwater)
Prism penetrationdepth (cm)
0 - 7 cm
7 - 14 cm
14 - 21 cm
low
moderate
high
Newark
12.59.7
11.1
11.8
11.8
20.7 9.810.9
10.6
9.2
20.7
10.3
8.7
9.0
7.7
13.4 12.77.7
10.6
12.7

Figure 13b. Prism Penetration Depths (cm).
. ... .
.
.
.
.
.
.
..
.
.
.
. .
.
.
.
..
.
I-
Map 2
N
0 200 400
0 500 1,000
meters
feet
SPI-121
SPI-129
SPI-128
SPI-127
SPI-135
SPI-131
SPI-134SPI-137SPI-138
SPI-136
SPI-139
SPI-141
SPI-143
SPI-145
SPI-142
SPI-144
SPI-140
SPI-132
SPI-133
SPI-123SPI-122
SPI-124SPI-125
SPI-126
SPI-130
bridge
SPI station location(brackish water)
SPI station location(tidal freshwater)
Prism penetrationdepth (cm)
0 - 7 cm
7 - 14 cm
14 - 21 cm
low
moderate
high
Newark
Harrison
10.9
11.08.8
14.57.4
13.0
13.9
10.4
11.7 3.0
5.7
14.4
12.6
19.8
14.7
15.5
15.2
12.6
11.2
10.8
0.6
17.0
10.0
0.2
10.5

Figure 13c. Prism Penetration Depths (cm).
. ... .
.
..
..
...
... .
N
0 200 400
0 500 1,000
meters
feet
Map 3
SPI-96
SPI-98
SPI-97
SPI-100
SPI-160
SPI-158
SPI-157
SPI-159
SPI-156
SPI-151
SPI-154
SPI-150
SPI-147
SPI-149
SPI-146
SPI-155
SPI-152
SPI-153
SPI-99
SPI-148
bridge
SPI station location(brackish water)
SPI station location(tidal freshwater)
Prism penetrationdepth (cm)
0 - 7 cm
7 - 14 cm
14 - 21 cm
low
moderate
high
Newark
Harrison
Kearny
0.7
6.5
14.0
4.2
12.3
14.4
15.7
9.2
8.1
13.8
0.00.0
0.0
16.3
12.6
10.4
1.0
1.0
4.5
18.4
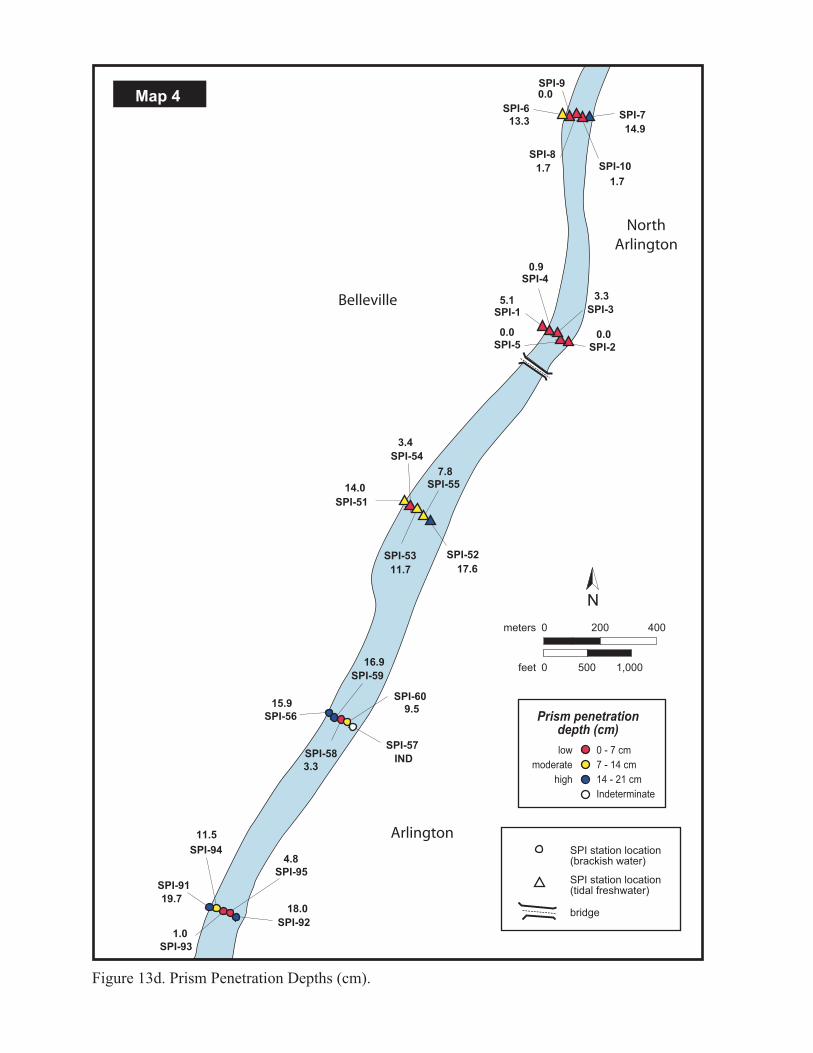
bridge
SPI station location(brackish water)
SPI station location(tidal freshwater)
..
...
. ... .
.
..
..
..
Map 4
N
0 200 400
0 500 1,000
meters
feet
SPI-9
SPI-6
SPI-8
SPI-7
SPI-5 SPI-2
SPI-3SPI-1
SPI-4
SPI-54
SPI-55
SPI-51
SPI-53 SPI-52
SPI-94
SPI-91
SPI-95
SPI-92
SPI-93
SPI-10
SPI-57
SPI-60
SPI-58
SPI-59
SPI-56
Figure 13d. Prism Penetration Depths (cm).
Prism penetrationdepth (cm)
0 - 7 cm
7 - 14 cm
14 - 21 cm
Indeterminate
low
moderate
high
Belleville
Arlington
NorthArlington
19.7
11.5
15.9
16.9
3.3
9.5
17.611.7
7.8
14.0
3.4
0.0
5.1
0.9
13.3
0.0
1.7
1.7
14.9
3.3
0.0
IND
4.8
18.0
1.0

Figure 13e. Prism Penetration Depths (cm).
..
.....
. . .
...
N
0 200 400
0 500 1,000
meters
feet
Map 5
bridge
SPI station location(brackish water)
SPI station location(tidal freshwater)
SPI-24
SPI-19SPI-20
SPI-17
SPI-18
SPI-14
SPI-15
SPI-12
SPI-11
SPI-13
SPI-16
SPI-25
SPI-22
SPI-23
SPI-21
SPI-34
SPI-35
SPI-32SPI-33
SPI-31
Prism penetrationdepth (cm)
0 - 7 cm
7 - 14 cm
14 - 21 cm
low
moderate
high
Lyndhurst
Nutley
Belleville
NorthArlington
4.4
0.9
8.7
16.4
15.0
18.5
18.8
8.50.0
0.0
19.0
14.8
17.77.4
2.5
15.4
2.4
0.6 3.4
18.4

.... .
..
..
N
0 200 400
0 500 1,000
meters
feet
Map 6
SPI station location(brackish water)
SPI station location(tidal freshwater)
SPI-44
SPI-45
SPI-42SPI-43
SPI-41
SPI-65
SPI-62
SPI-63
SPI-64
SPI-61
Figure 13f. Prism Penetration Depths (cm).
Prism penetrationdepth (cm)
0 - 7 cm
7 - 14 cm
14 - 21 cm
low
moderate
high
Rutherford
Passaic
2.3
0.0
3.5
3.3
10.0
0.6
19.6
9.4
1.4
0.0

.
.
.
....
N
0 200 400
0 500 1,000
meters
feet
Map 7
bridge
SPI station location(brackish water)
SPI station location(tidal freshwater)
SPI-169
SPI-170
SPI-168
SPI-167
SPI-81
SPI-84
SPI-85SPI-82
SPI-83
SPI-75
SPI-72
SPI-73
SPI-74
SPI-71
Figure 13g. Prism Penetration Depths (cm).
Prism penetrationdepth (cm)
0 - 7 cm
7 - 14 cm
14 - 21 cm
low
moderate
high
Wallington
Passaic
Garfield
2.2
9.9
1.9
0.8
9.8
2.9
9.2
0.0
0.0
0.0
0.0
3.0
7.4
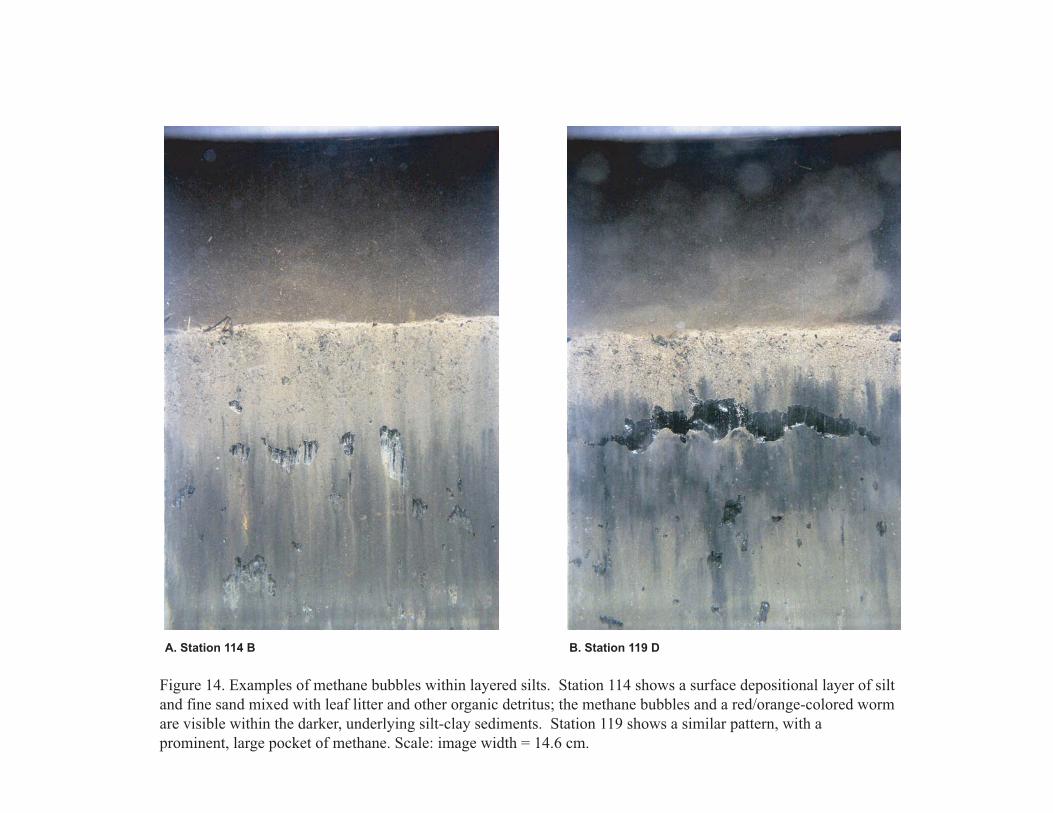
Figure 14. Examples of methane bubbles within layered silts. Station 114 shows a surface depositional layer of silt
and fine sand mixed with leaf litter and other organic detritus; the methane bubbles and a red/orange-colored worm
are visible within the darker, underlying silt-clay sediments. Station 119 shows a similar pattern, with a
prominent, large pocket of methane. Scale: image width = 14.6 cm.
A. Station 114 B B. Station 119 D
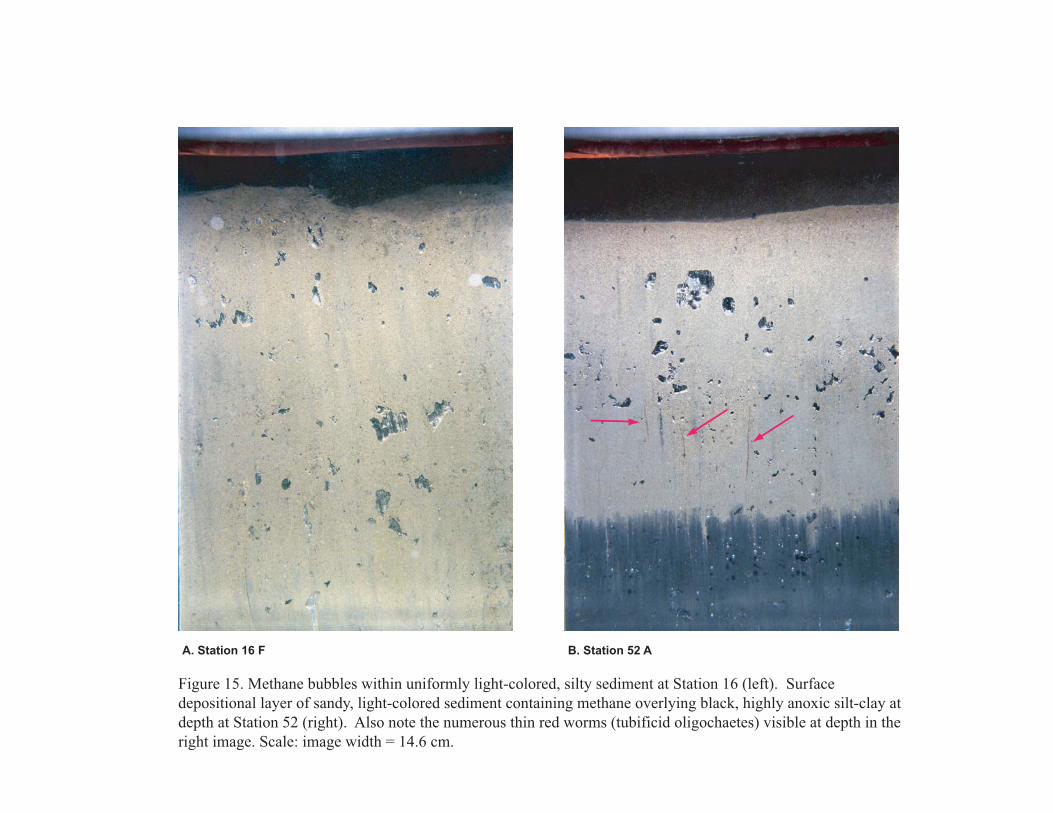
Figure 15. Methane bubbles within uniformly light-colored, silty sediment at Station 16 (left). Surface
depositional layer of sandy, light-colored sediment containing methane overlying black, highly anoxic silt-clay at
depth at Station 52 (right). Also note the numerous thin red worms (tubificid oligochaetes) visible at depth in the
right image. Scale: image width = 14.6 cm.
A. Station 16 F B. Station 52 A
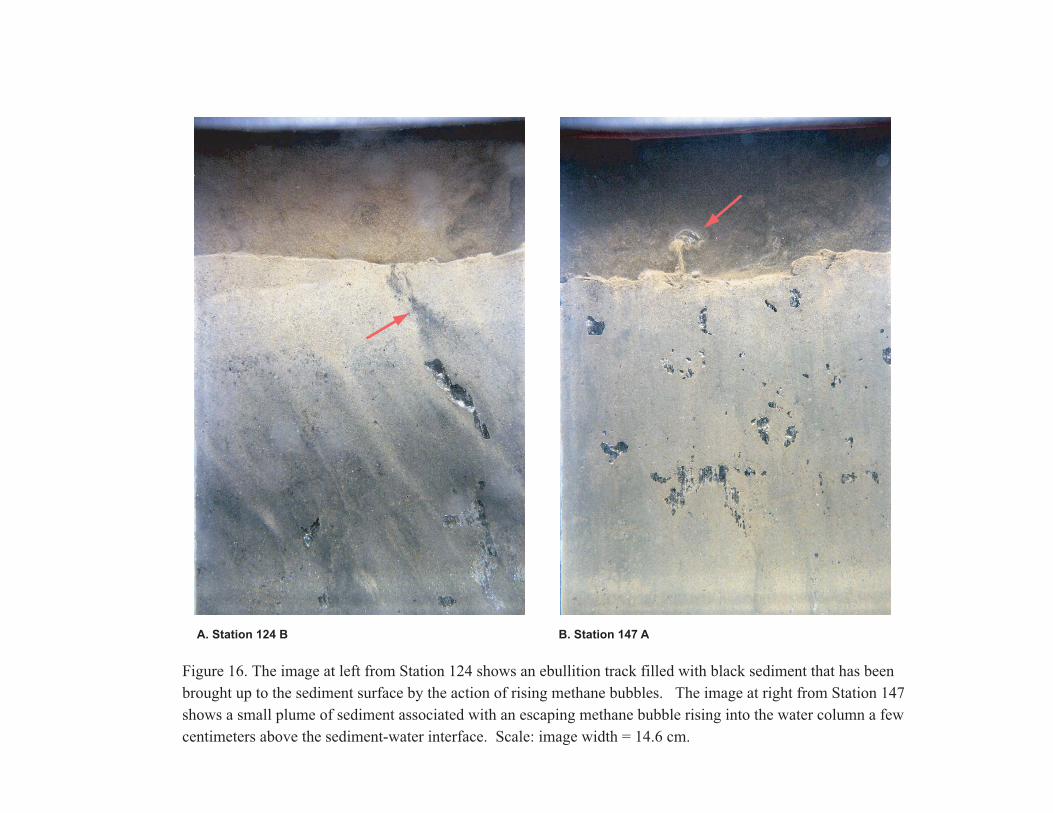
Figure 16. The image at left from Station 124 shows an ebullition track filled with black sediment that has been
brought up to the sediment surface by the action of rising methane bubbles. The image at right from Station 147
shows a small plume of sediment associated with an escaping methane bubble rising into the water column a few
centimeters above the sediment-water interface. Scale: image width = 14.6 cm.
A. Station 124 B B. Station 147 A
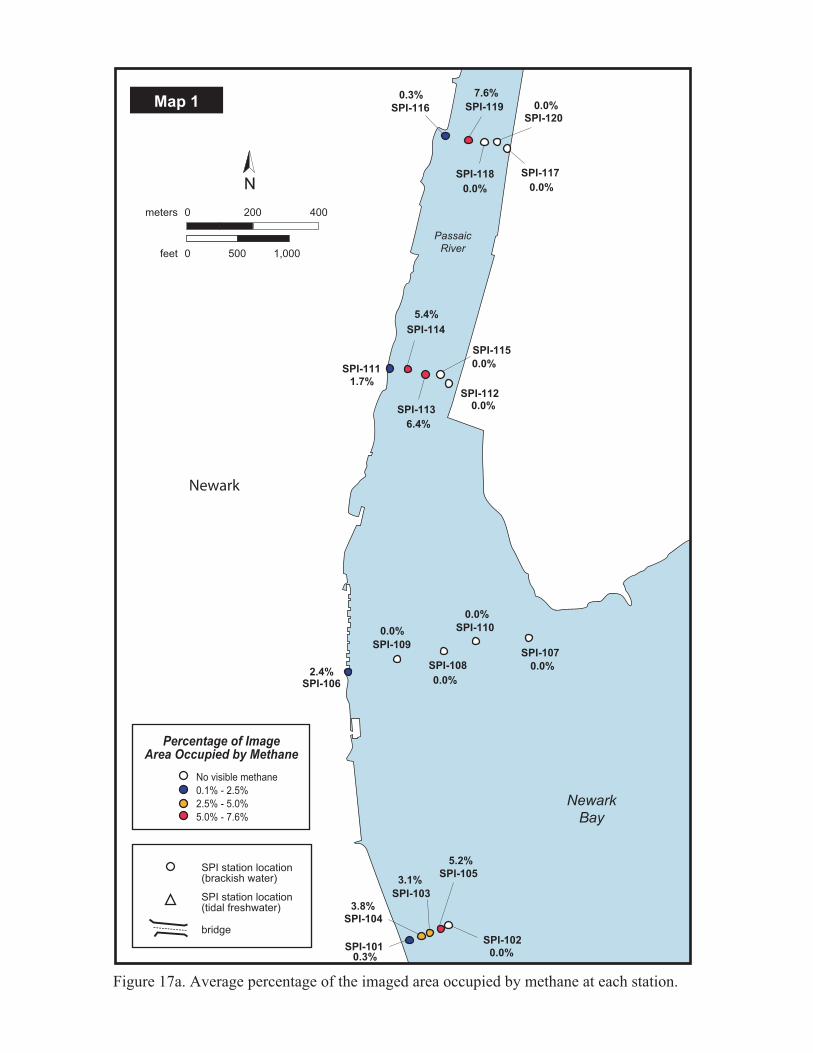
Figure 17a. Average percentage of the imaged area occupied by methane at each station.
SPI-116 SPI-119
SPI-118
SPI-120
SPI-117
SPI-112
SPI-115
SPI-113
SPI-114
SPI-111
SPI-106
SPI-109
SPI-108
SPI-110
SPI-107
SPI-105
SPI-102
SPI-103
SPI-104
SPI-101
N
0 200 400
0 500 1,000
meters
feet
Newark
Bay
Passaic
River
Map 1
bridge
SPI station location(brackish water)
SPI station location(tidal freshwater)
Percentage of ImageArea Occupied by Methane
No visible methane
0.1% - 2.5%
2.5% - 5.0%
5.0% - 7.6%
Newark
0.3% 0.0%
3.8%
3.1%
5.2%
2.4%
1.7%
5.4%
6.4%
0.0%0.0%
0.0%
7.6%0.3%
0.0%
0.0%
0.0%
0.0%
0.0%
0.0%
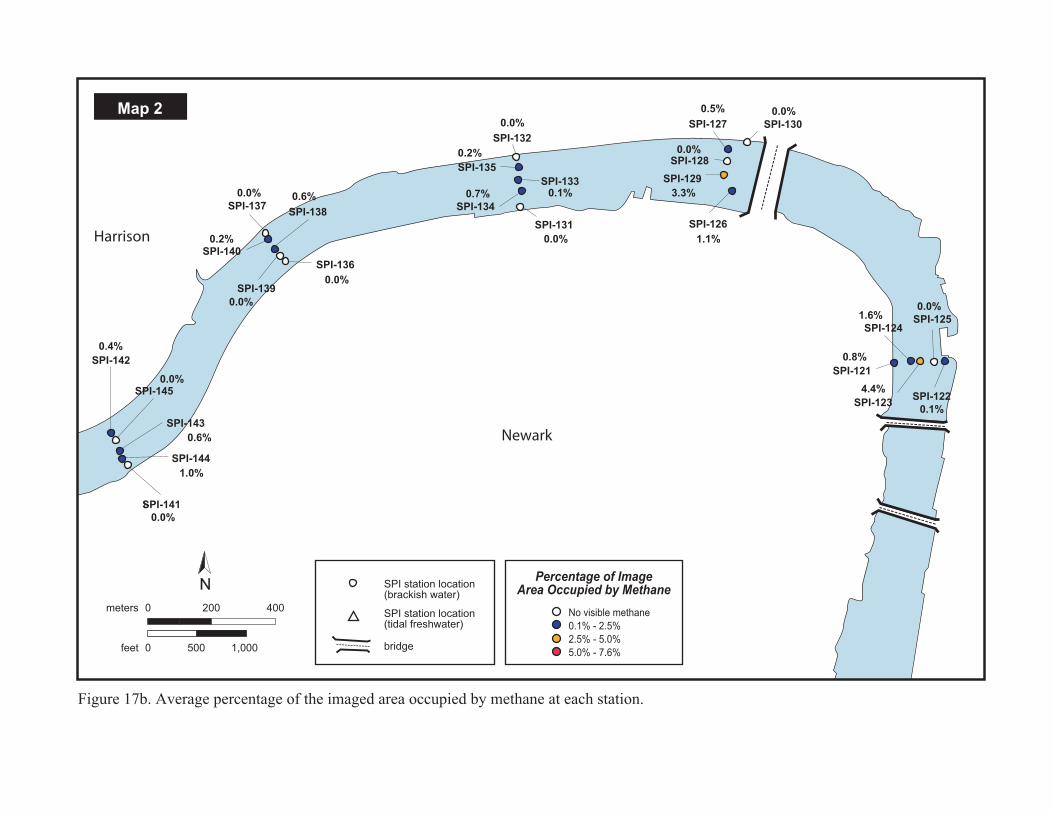
. ... .
.
.
.
.
.
.
..
.
.
.
. .
.
.
.
..
.
I-
Map 2
N
0 200 400
0 500 1,000
meters
feet
SPI-121
SPI-129
SPI-128
SPI-127
SPI-135
SPI-131
SPI-134SPI-137SPI-138
SPI-136
SPI-139
SPI-141
SPI-143
SPI-145
SPI-142
SPI-144
SPI-140
SPI-132
SPI-133
SPI-123SPI-122
SPI-124SPI-125
SPI-126
SPI-130
bridge
SPI station location(brackish water)
SPI station location(tidal freshwater)
Newark
Harrison
Figure 17b. Average percentage of the imaged area occupied by methane at each station.
Percentage of ImageArea Occupied by Methane
No visible methane
0.1% - 2.5%
2.5% - 5.0%
5.0% - 7.6%
0.4%
0.0%
0.0%
0.0%
0.0%
0.0%
0.0%
0.0% 1.1%
3.3%
0.0%
0.0%
0.0%1.6%
0.8%
4.4%
0.1%
0.5%
0.1%0.7%
0.2%
0.2%
1.0%
0.6%
0.6%

. ... .
.
..
..
...
..
N
0 200 400
0 500 1,000
meters
feet
Map 3
SPI-96
SPI-98
SPI-97
SPI-100
SPI-160
SPI-158
SPI-157
SPI-159
SPI-156
SPI-151
SPI-154
SPI-150
SPI-147
SPI-149
SPI-146
SPI-155
SPI-152
SPI-153
SPI-99
SPI-148
bridge
SPI station location(brackish water)
SPI station location(tidal freshwater)
Newark
Harrison
Kearny
Figure 17c. Average percentage of the imaged area occupied by methane at each station.
Percentage of ImageArea Occupied by Methane
No visible methane
0.1% - 2.5%
2.5% - 5.0%
5.0% - 7.6%
Indeterminate
0.0%
0.0%
0.0%
0.7%
0.5%
7.0%
0.0%
0.0%
1.7%
IND
IND
0.3%
0.5%
1.5%
0.0%
0.0%
0.0%
0.0%
3.9%
3.2%

..
...
. ... .
.
..
..
...
Map 4
N
0 200 400
0 500 1,000
meters
feet
SPI-9
SPI-6
SPI-8
SPI-7
SPI-5 SPI-2
SPI-3SPI-1
SPI-4
SPI-54
SPI-55
SPI-51
SPI-53 SPI-52
SPI-94
SPI-91
SPI-95
SPI-92SPI-93
SPI-10
SPI-57
SPI-60
SPI-58
SPI-59
SPI-56
Belleville
Arlington
NorthArlington
bridge
SPI station location(brackish water)
SPI station location(tidal freshwater)
Figure 17d. Average percentage of the imaged area occupied by methane at each station.
Percentage of ImageArea Occupied by Methane
No visible methane
0.1% - 2.5%
2.5% - 5.0%
5.0% - 7.6%
2.1%
6.7%0.0%
3.5%
0.5%
0.0%0.0%
0.0%
0.0%
0.0%
0.0%
0.0%0.0%
0.0%
0.4% 5.5%
0.0%
0.0%
0.0%
2.4%
0.5%
4.2%
4.7%
0.6%
4.3%

..
.....
. . .
...
N
0 200 400
0 500 1,000
meters
feet
Map 5
bridge
SPI station location(brackish water)
SPI station location(tidal freshwater)
SPI-24
SPI-19SPI-20
SPI-17
SPI-18
SPI-14
SPI-15
SPI-12
SPI-11
SPI-13
SPI-16
SPI-25
SPI-22
SPI-23
SPI-21
SPI-34
SPI-35
SPI-32SPI-33
SPI-31
Lyndhurst
Nutley
Belleville
NorthArlington
Figure 17e. Average percentage of the imaged area occupied by methane at each station.
Percentage of ImageArea Occupied by Methane
No visible methane
0.1% - 2.5%
2.5% - 5.0%
5.0% - 7.6%1.7%
1.7%
0.0%
0.0%0.0%
0.0%
0.0%
0.0%
0.0%
1.6%
1.5%
1.1%
2.6%
5.3%
4.9%2.2%
3.8%
4.8%
3.1%
1.9%
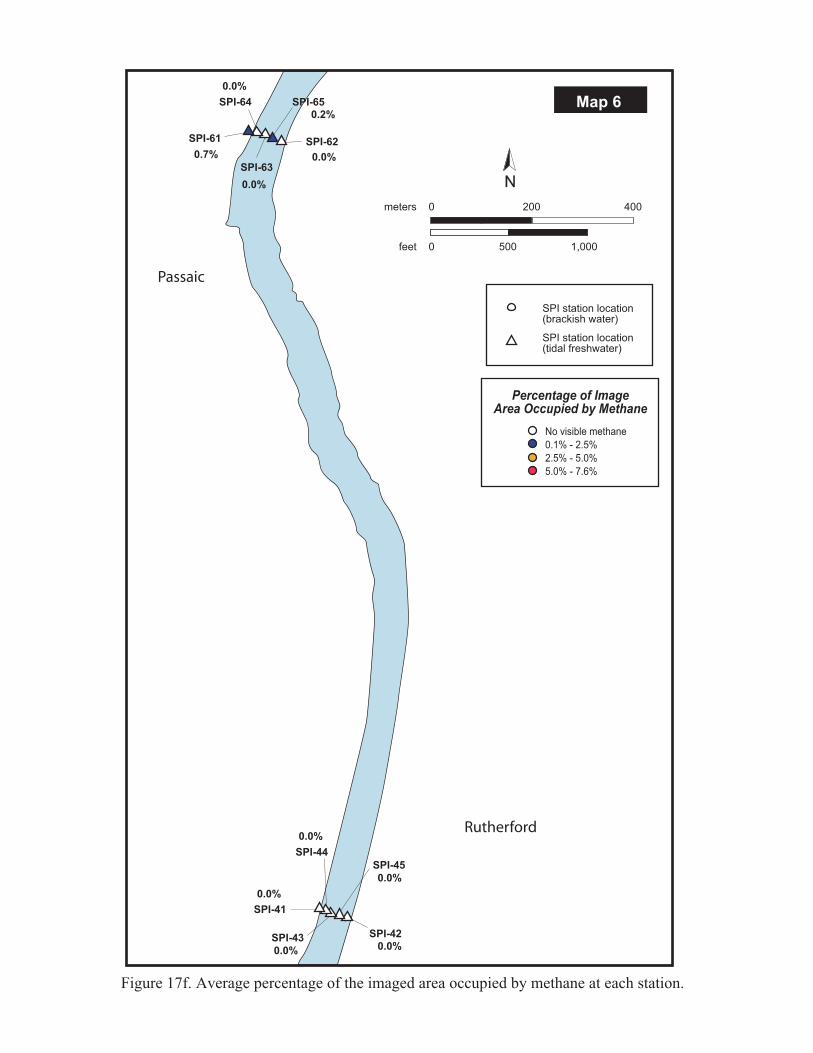
.... .
..
..
N
0 200 400
0 500 1,000
meters
feet
Map 6
SPI station location(brackish water)
SPI station location(tidal freshwater)
SPI-44
SPI-45
SPI-42SPI-43
SPI-41
SPI-65
SPI-62
SPI-63
SPI-64
SPI-61
Rutherford
Passaic
Figure 17f. Average percentage of the imaged area occupied by methane at each station.
Percentage of ImageArea Occupied by Methane
No visible methane
0.1% - 2.5%
2.5% - 5.0%
5.0% - 7.6%
0.0%
0.0%
0.0%
0.0%0.0%
0.0%
0.0%
0.0%
0.7%
0.2%
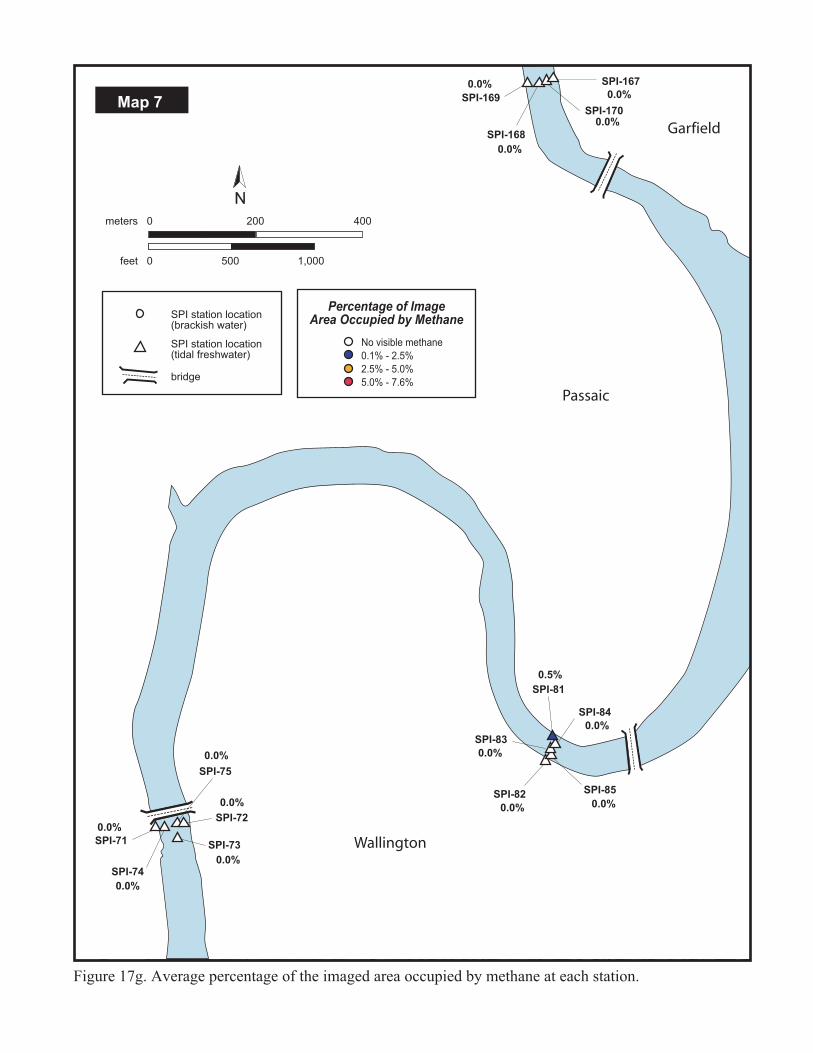
.
....
N
0 200 400
0 500 1,000
meters
feet
Map 7
bridge
SPI station location(brackish water)
SPI station location(tidal freshwater)
SPI-169
SPI-170
SPI-168
SPI-167
SPI-81
SPI-84
SPI-85SPI-82
SPI-83
SPI-75
SPI-72
SPI-73
SPI-74
SPI-71 Wallington
Passaic
Garfield
Figure 17g. Average percentage of the imaged area occupied by methane at each station.
Percentage of ImageArea Occupied by Methane
No visible methane
0.1% - 2.5%
2.5% - 5.0%
5.0% - 7.6%
0.5%
0.0%
0.0%
0.0%
0.0%
0.0%
0.0%
0.0%
0.0%
0.0%
0.0%
0.0%
0.0%
0.0%
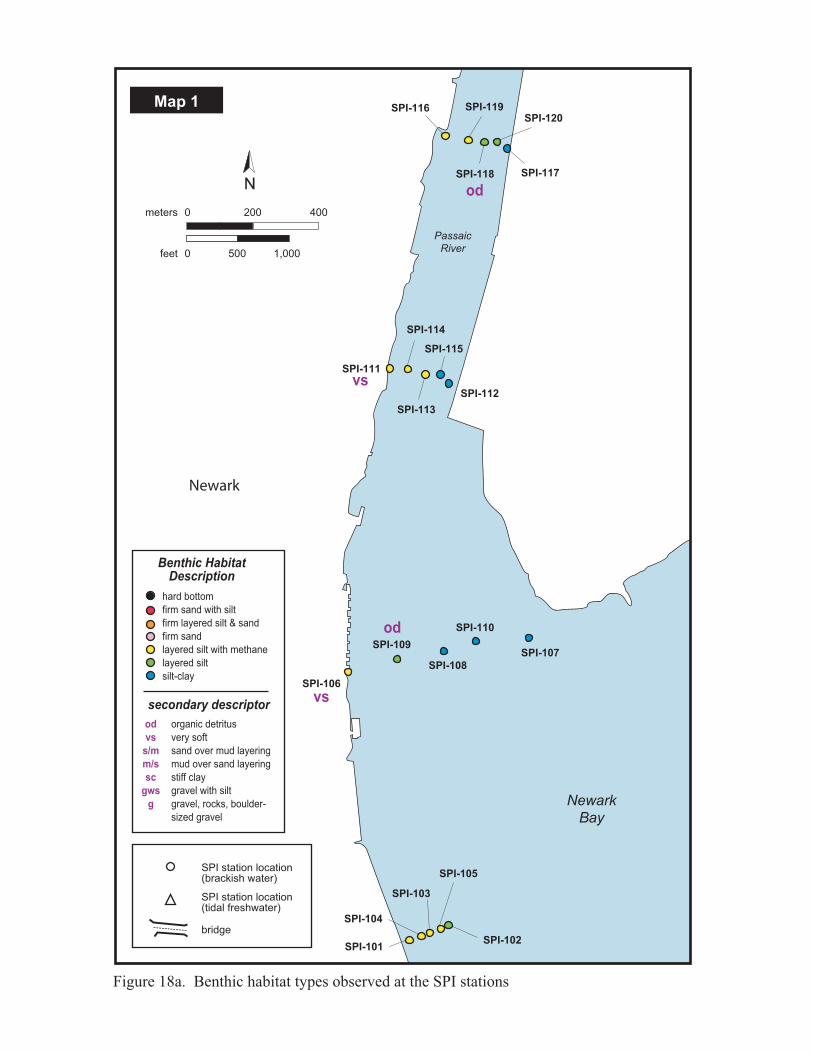
Figure 18a. Benthic habitat types observed at the SPI stations
SPI-116 SPI-119
SPI-118
SPI-120
SPI-117
SPI-112
SPI-115
SPI-113
SPI-114
SPI-111
SPI-106
SPI-109
SPI-108
SPI-110
SPI-107
SPI-105
SPI-102
SPI-103
SPI-104
SPI-101
N
0 200 400
0 500 1,000
meters
feet
Newark
Bay
Passaic
River
Map 1
bridge
SPI station location(brackish water)
SPI station location(tidal freshwater)
Newark
vs
vs
od
od
Benthic HabitatDescription
secondary descriptor
hard bottom
firm sand with silt
firm layered silt & sand
firm sand
layered silt with methane
layered silt
silt-clay
organic detritus
very soft
sand over mud layering
mud over sand layering
stiff clay
gravel with silt
gravel, rocks, boulder-
sized gravel
od
vs
s/m
m/s
sc
gws
g

. ... .
.
.
.
.
.
.
..
.
.
.
. .
.
.
.
..
.
I-
Map 2
N
0 200 400
0 500 1,000
meters
feet
SPI-121
SPI-129
SPI-128
SPI-127
SPI-135
SPI-131
SPI-134SPI-137
SPI-138
SPI-136
SPI-139
SPI-141
SPI-143
SPI-145
SPI-142
SPI-144
SPI-140
SPI-132
SPI-133
SPI-123 SPI-122
SPI-124SPI-125
SPI-126
SPI-130
bridge
SPI station location(brackish water)
SPI station location(tidal freshwater)
Newark
Harrison
Figure 18b. Benthic habitat types observed at the SPI stations.
s/m
s/m
s/m
s/m
s/m
g
od
od
od
od
vs
vs + od
od
g + sc
Benthic HabitatDescription
secondary descriptor
hard bottom
firm sand with silt
firm layered silt & sand
firm sand
layered silt with methane
layered silt
silt-clay
organic detritus
very soft
sand over mud layering
mud over sand layering
stiff clay
gravel with silt
gravel, rocks, boulder-
sized gravel
od
vs
s/m
m/s
sc
gws
g
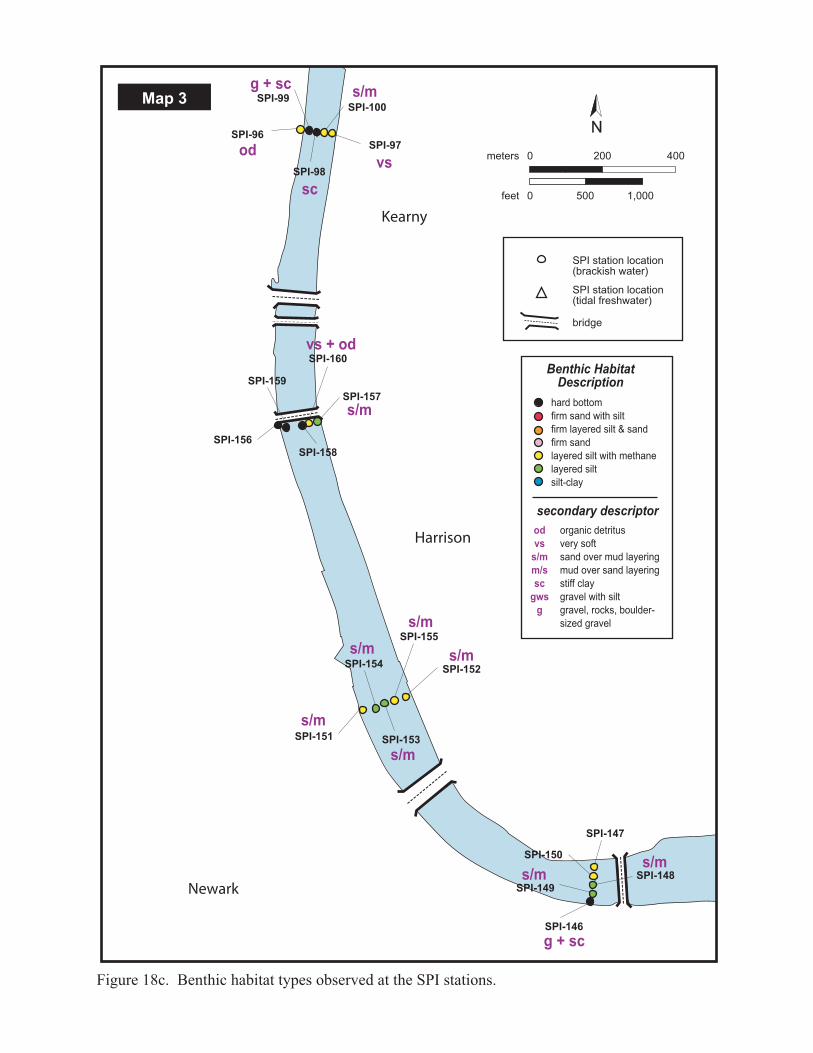
. ... .
.
..
..
...
... .
N
0 200 400
0 500 1,000
meters
feet
Map 3
SPI-96
SPI-98
SPI-97
SPI-100
SPI-160
SPI-158
SPI-157
SPI-159
SPI-156
SPI-151
SPI-154
SPI-150
SPI-147
SPI-149
SPI-146
SPI-155
SPI-152
SPI-153
SPI-99
SPI-148
bridge
SPI station location(brackish water)
SPI station location(tidal freshwater)
Newark
Harrison
Kearny
Figure 18c. Benthic habitat types observed at the SPI stations.
s/m
s/ms/m
s/m
s/m
s/m
s/m
s/m
s/m
vs + od
odvs
sc
g + sc
g + sc
Benthic HabitatDescription
secondary descriptor
hard bottom
firm sand with silt
firm layered silt & sand
firm sand
layered silt with methane
layered silt
silt-clay
organic detritus
very soft
sand over mud layering
mud over sand layering
stiff clay
gravel with silt
gravel, rocks, boulder-
sized gravel
od
vs
s/m
m/s
sc
gws
g

..
...
. ... .
.
..
..
...
Map 4
N
0 200 400
0 500 1,000
meters
feet
SPI-9
SPI-6
SPI-8
SPI-7
SPI-5 SPI-2
SPI-3SPI-1
SPI-4
SPI-54
SPI-55
SPI-51
SPI-53 SPI-52
SPI-94
SPI-91 SPI-95
SPI-92
SPI-93
SPI-10
SPI-57
SPI-60
SPI-58
SPI-59
SPI-56
Belleville
Arlington
NorthArlington
bridge
SPI station location(brackish water)
SPI station location(tidal freshwater)
Figure 18d. Benthic habitat types observed at the SPI stations.
Benthic HabitatDescription
secondary descriptor
hard bottom
firm sand with silt
firm layered silt & sand
firm sand
layered silt with methane
layered silt
silt-clay
organic detritus
very soft
sand over mud layering
mud over sand layering
stiff clay
gravel with silt
gravel, rocks, boulder-
sized gravel
od
vs
s/m
m/s
sc
gws
g
vs
vs
vs
m/s
s/m
s/m
m/s
m/s
m/s
m/s
m/s
m/s
vs vs
m/s
g
g
g + sc

..
.....
. . .
...
N
0 200 400
0 500 1,000
meters
feet
Map 5
bridge
SPI station location(brackish water)
SPI station location(tidal freshwater)
SPI-24
SPI-19SPI-20
SPI-17
SPI-18
SPI-14
SPI-15
SPI-12
SPI-11
SPI-13
SPI-16
SPI-25
SPI-22
SPI-23
SPI-21
SPI-34
SPI-35
SPI-32SPI-33
SPI-31
Lyndhurst
Nutley
Belleville
NorthArlington
Figure 18e. Benthic habitat types observed at the SPI stations.
Benthic HabitatDescription
secondary descriptor
hard bottom
firm sand with silt
firm layered silt & sand
firm sand
layered silt with methane
layered silt
silt-clay
organic detritus
very soft
sand over mud layering
mud over sand layering
stiff clay
gravel with silt
gravel, rocks, boulder-
sized gravel
od
vs
s/m
m/s
sc
gws
g
vs
vs
vs
g
vs + od
vs + od
vs
vs
m/s
m/s
m/s
s/m

.... .
..
..
N
0 200 400
0 500 1,000
meters
feet
Map 6
SPI station location(brackish water)
SPI station location(tidal freshwater)
SPI-44
SPI-45
SPI-42SPI-43
SPI-41
SPI-65
SPI-62
SPI-63
SPI-64
SPI-61
Rutherford
Passaic
Figure 18f. Benthic habitat types observed at the SPI stations.
Benthic HabitatDescription
secondary descriptor
hard bottom
firm sand with silt
firm layered silt & sand
firm sand
layered silt with methane
layered silt
silt-clay
organic detritus
very soft
sand over mud layering
mud over sand layering
stiff clay
gravel with silt
gravel, rocks, boulder-
sized gravel
od
vs
s/m
m/s
sc
gws
g
m/s
m/s
m/s
s/m
m/sod
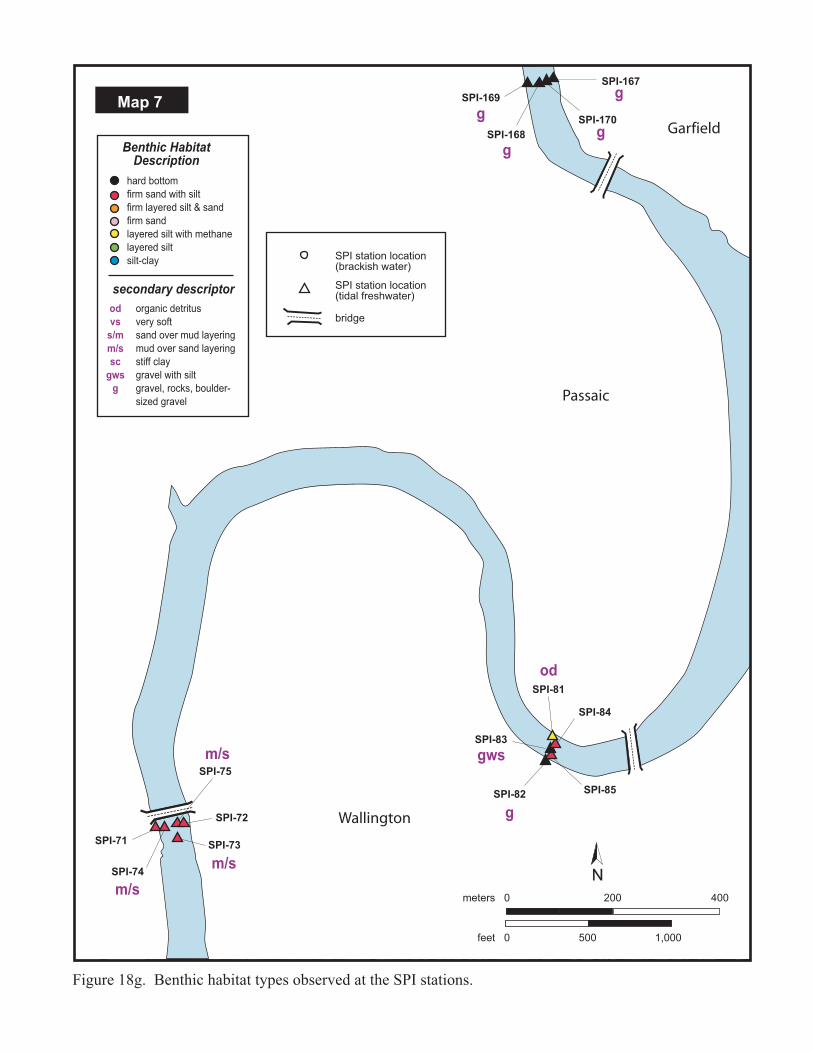
.
....
N
0 200 400
0 500 1,000
meters
feet
Map 7
bridge
SPI station location(brackish water)
SPI station location(tidal freshwater)
SPI-169
SPI-170
SPI-168
SPI-167
SPI-81
SPI-84
SPI-85SPI-82
SPI-83
SPI-75
SPI-72
SPI-73
SPI-74
SPI-71
Wallington
Passaic
Garfield
Figure 18g. Benthic habitat types observed at the SPI stations.
Benthic HabitatDescription
secondary descriptor
hard bottom
firm sand with silt
firm layered silt & sand
firm sand
layered silt with methane
layered silt
silt-clay
organic detritus
very soft
sand over mud layering
mud over sand layering
stiff clay
gravel with silt
gravel, rocks, boulder-
sized gravel
od
vs
s/m
m/s
sc
gws
g
g
gg
gws
g
od
m/s
m/s
m/s
g

Figure 19. Examples of coarser sediment types found in the tidal freshwater section of the
river. Clockwise from upper left: rippled fine sand with small amounts of silt at station 1,
medium to coarse sand with a thin surface veneer of brown silt and small oligochaete tubes
at Station 73, gravel with organic detritus at Station 82, a cobble-sized rock encrusted with
barnacles at Station 2. Scale: image width = 14.6 cm.
A. Station 1 C B. Station 73 C
D. Station 2 B C. Station 82 C

Figure 20a. Average apparent RPD depths at the Passaic River SPI stations.
SPI-116 SPI-119
SPI-118
SPI-120
SPI-117
SPI-112
SPI-115
SPI-113
SPI-114
SPI-111
SPI-106
SPI-109
SPI-108
SPI-110
SPI-107
SPI-105
SPI-102
SPI-103
SPI-104
SPI-101
N
0 200 400
0 500 1,000
meters
feet
Newark
Bay
Passaic
River
Map 1
bridge
SPI station location(brackish water)
SPI station location(tidal freshwater)
Mean apparentRPD depth (cm)
0-1.0 cm
1.1-2.0 cm
2.1-3.0 cm
3.1-4.0 cm
4.1-5.0 cm
Indeterminate
Newark
3.20.1
1.7
0.8
IND
2.8
2.3
2.7
2.3
0.9
IND
1.2
0.6 1.0
IND
1.2
2.1
0.6
2.0
0.9
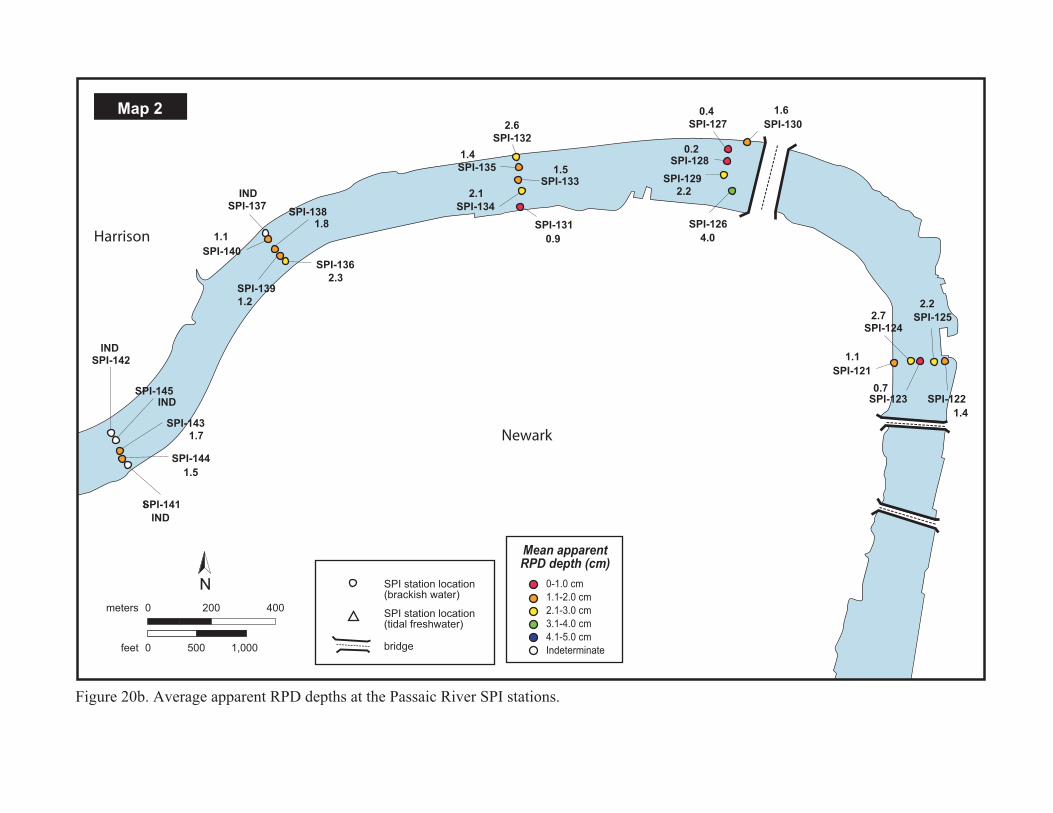
. ... .
.
.
.
.
.
.
..
.
.
.
. .
.
.
.
..
.
I-
Map 2
N
0 200 400
0 500 1,000
meters
feet
SPI-121
SPI-129
SPI-128
SPI-127
SPI-135
SPI-131
SPI-134SPI-137SPI-138
SPI-136
SPI-139
SPI-141
SPI-143
SPI-145
SPI-142
SPI-144
SPI-140
SPI-132
SPI-133
SPI-123 SPI-122
SPI-124SPI-125
SPI-126
SPI-130
bridge
SPI station location(brackish water)
SPI station location(tidal freshwater)
Newark
Harrison
Figure 20b. Average apparent RPD depths at the Passaic River SPI stations.
Mean apparentRPD depth (cm)
0-1.0 cm
1.1-2.0 cm
2.1-3.0 cm
3.1-4.0 cm
4.1-5.0 cm
Indeterminate
1.1
2.7
0.7
2.2
1.4
4.0
2.2
0.2
0.4 1.6
0.9
2.1
1.5
1.4
2.6
IND
1.1
1.8
2.3
1.2
1.7
1.5
IND
IND
IND

. .. .
.
..
..
...
... .
N
0 200 400
0 500 1,000
meters
feet
Map 3
SPI-96
SPI-98
SPI-97
SPI-100
SPI-160
SPI-158
SPI-157
SPI-159
SPI-156
SPI-151
SPI-154
SPI-150
SPI-147
SPI-149
SPI-146
SPI-155
SPI-152
SPI-153
SPI-99
SPI-148
bridge
SPI station location(brackish water)
SPI station location(tidal freshwater)
Newark
Harrison
Kearny
Figure 20c. Average apparent RPD depths at the Passaic River SPI stations.
Mean apparentRPD depth (cm)
0-1.0 cm
1.1-2.0 cm
2.1-3.0 cm
3.1-4.0 cm
4.1-5.0 cm
Indeterminate
IND
2.0
0.9
0.5
1.1
1.2
2.7
1.9
1.5
1.6
IND
IND
0.8
1.4
2.0
IND
IND
IND
0.9
0.6

..
...
. ... .
.
..
..
...
Map 4
N
0 200 400
0 500 1,000
meters
feet
SPI-9
SPI-6
SPI-8
SPI-7
SPI-5 SPI-2
SPI-3SPI-1
SPI-4
SPI-54
SPI-55
SPI-51
SPI-53 SPI-52
SPI-94
SPI-91
SPI-95
SPI-92
SPI-93
SPI-10
SPI-57
SPI-60
SPI-58
SPI-59
SPI-56
Belleville
Arlington
NorthArlington
bridge
SPI station location(brackish water)
SPI station location(tidal freshwater)
Figure 20d. Average apparent RPD depths at the Passaic River SPI stations.
Mean apparentRPD depth (cm)
0-1.0 cm
1.1-2.0 cm
2.1-3.0 cm
3.1-4.0 cm
4.1-5.0 cm
Indeterminate
2.0
1.8
1.1
2.3
1.3
2.1IND
1.5
IND
IND
1.3
1.3
2.2
2.2
IND
IND
IND
1.7 0.4
1.7IND
1.5
IND
IND
IND

..
.....
. . .
...
N
0 200 400
0 500 1,000
meters
feet
Map 5
bridge
SPI station location(brackish water)
SPI station location(tidal freshwater)
SPI-24
SPI-19SPI-20
SPI-17
SPI-18
SPI-14
SPI-15
SPI-12
SPI-11
SPI-13
SPI-16
SPI-25
SPI-22
SPI-23
SPI-21
SPI-34
SPI-35
SPI-32SPI-33
SPI-31
Lyndhurst
Nutley
Belleville
NorthArlington
Figure 20e. Average apparent RPD depths at the Passaic River SPI stations.
Mean apparentRPD depth (cm)
0-1.0 cm
1.1-2.0 cm
2.1-3.0 cm
3.1-4.0 cm
4.1-5.0 cm
Indeterminate
1.2
2.3
2.1
1.7
1.5
3.3
2.0
IND
IND
IND
IND 1.8
1.6
5.0
1.9
1.3
2.4
1.1
1.6
IND

.... .
..
..
N
0 200 400
0 500 1,000
meters
feet
Map 6
SPI station location(brackish water)
SPI station location(tidal freshwater)
SPI-44
SPI-45
SPI-42SPI-43
SPI-41
SPI-65
SPI-62
SPI-63
SPI-64
SPI-61
Rutherford
Passaic
Figure 20f. Average apparent RPD depths at the Passaic River SPI stations.
Mean apparentRPD depth (cm)
0-1.0 cm
1.1-2.0 cm
2.1-3.0 cm
3.1-4.0 cm
4.1-5.0 cm
Indeterminate
IND
IND
IND
2.1
1.7
2.33.1
1.2
2.2
IND
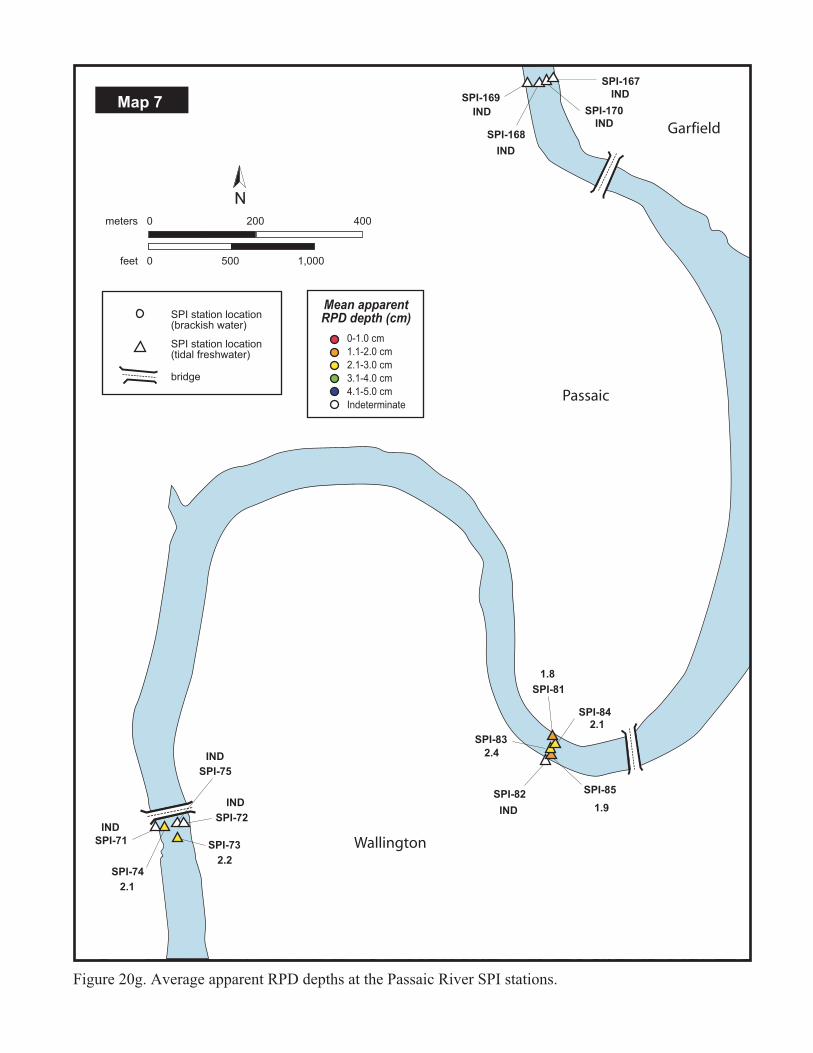
.
....
N
0 200 400
0 500 1,000
meters
feet
Map 7
bridge
SPI station location(brackish water)
SPI station location(tidal freshwater)
SPI-169
SPI-170
SPI-168
SPI-167
SPI-81
SPI-84
SPI-85SPI-82
SPI-83
SPI-75
SPI-72
SPI-73
SPI-74
SPI-71 Wallington
Passaic
Garfield
Figure 20g. Average apparent RPD depths at the Passaic River SPI stations.
Mean apparentRPD depth (cm)
0-1.0 cm
1.1-2.0 cm
2.1-3.0 cm
3.1-4.0 cm
4.1-5.0 cm
Indeterminate
2.1
IND
IND
IND
2.2
2.4
1.8
2.1
1.9IND
IND
INDIND
IND
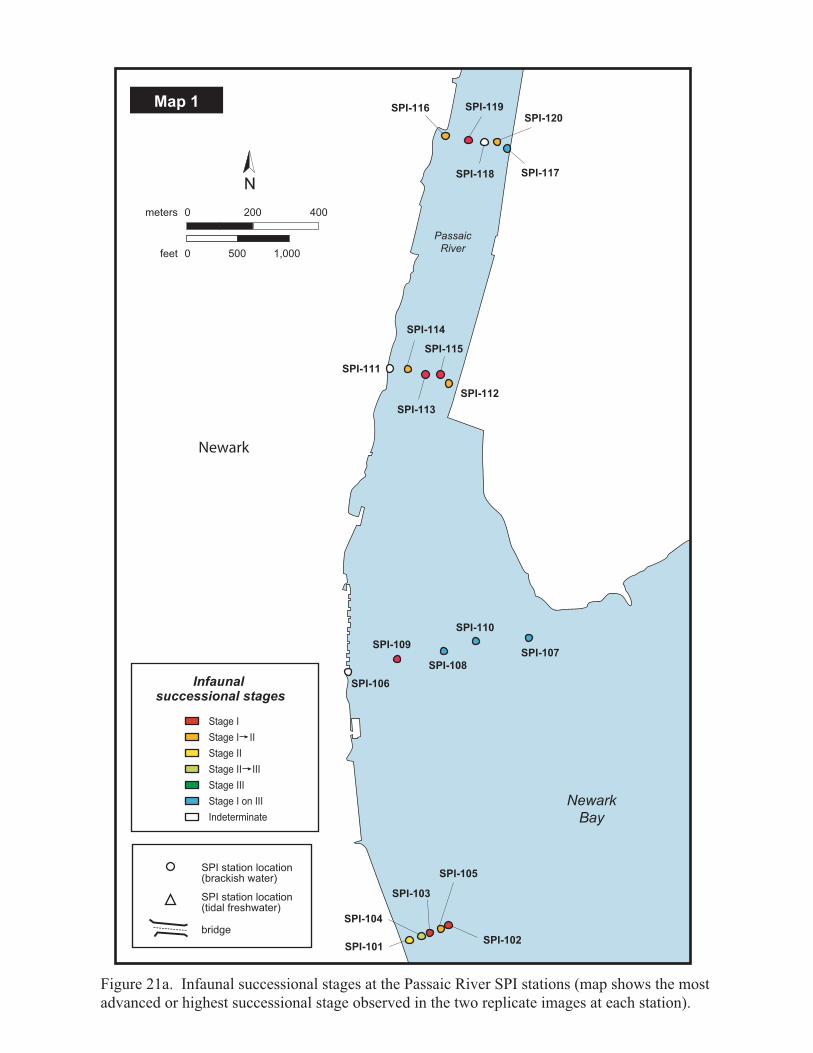
Figure 21a. Infaunal successional stages at the Passaic River SPI stations (map shows the most
advanced or highest successional stage observed in the two replicate images at each station).
SPI-116 SPI-119
SPI-118
SPI-120
SPI-117
SPI-112
SPI-115
SPI-113
SPI-114
SPI-111
SPI-106
SPI-109
SPI-108
SPI-110
SPI-107
SPI-105
SPI-102
SPI-103
SPI-104
SPI-101
N
0 200 400
0 500 1,000
meters
feet
Newark
Bay
Passaic
River
Map 1
bridge
SPI station location(brackish water)
SPI station location(tidal freshwater)
Newark
Infaunal successional stages
Stage I
Stage I II
Stage II
Stage II III
Stage III
Stage I on III
Indeterminate
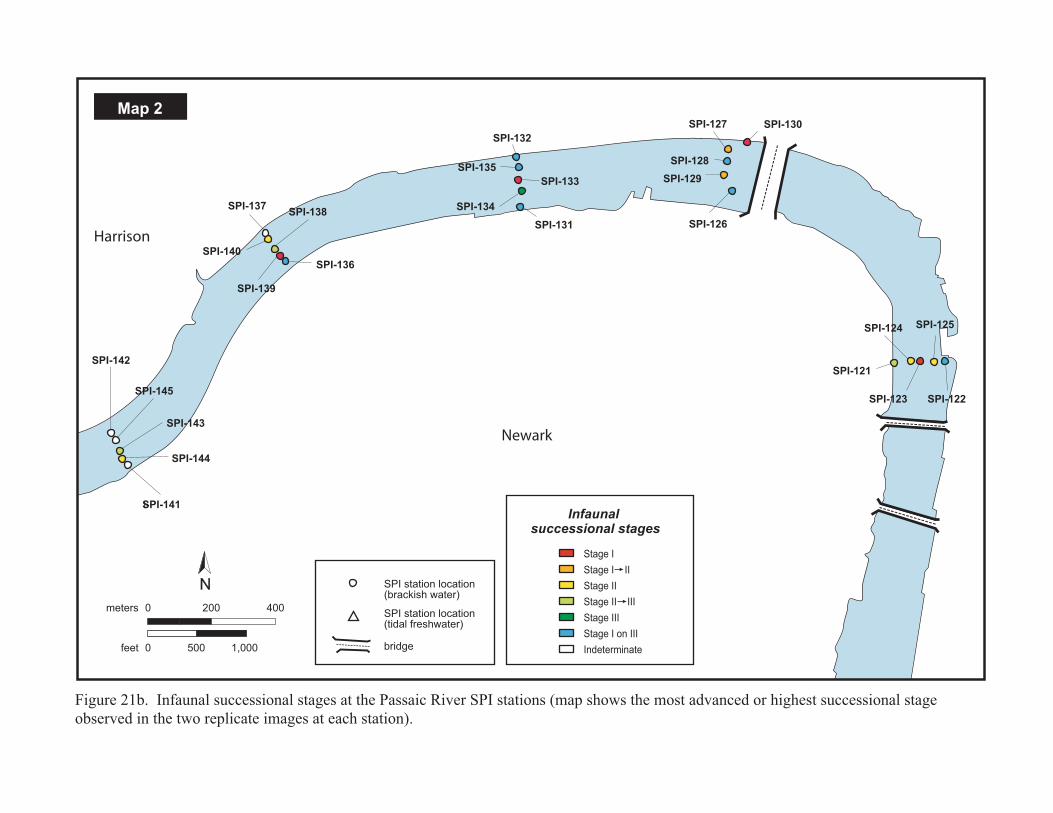
. ... .
.
.
.
.
.
.
..
.
.
.
. .
.
.
.
..
.
I-
Map 2
N
0 200 400
0 500 1,000
meters
feet
SPI-121
SPI-129
SPI-128
SPI-127
SPI-135
SPI-131
SPI-134SPI-137SPI-138
SPI-136
SPI-139
SPI-141
SPI-143
SPI-145
SPI-142
SPI-144
SPI-140
SPI-132
SPI-133
SPI-123 SPI-122
SPI-124 SPI-125
SPI-126
SPI-130
bridge
SPI station location(brackish water)
SPI station location(tidal freshwater)
Newark
Harrison
Figure 21b. Infaunal successional stages at the Passaic River SPI stations (map shows the most advanced or highest successional stage
observed in the two replicate images at each station).
Infaunal successional stages
Stage I
Stage I II
Stage II
Stage II III
Stage III
Stage I on III
Indeterminate
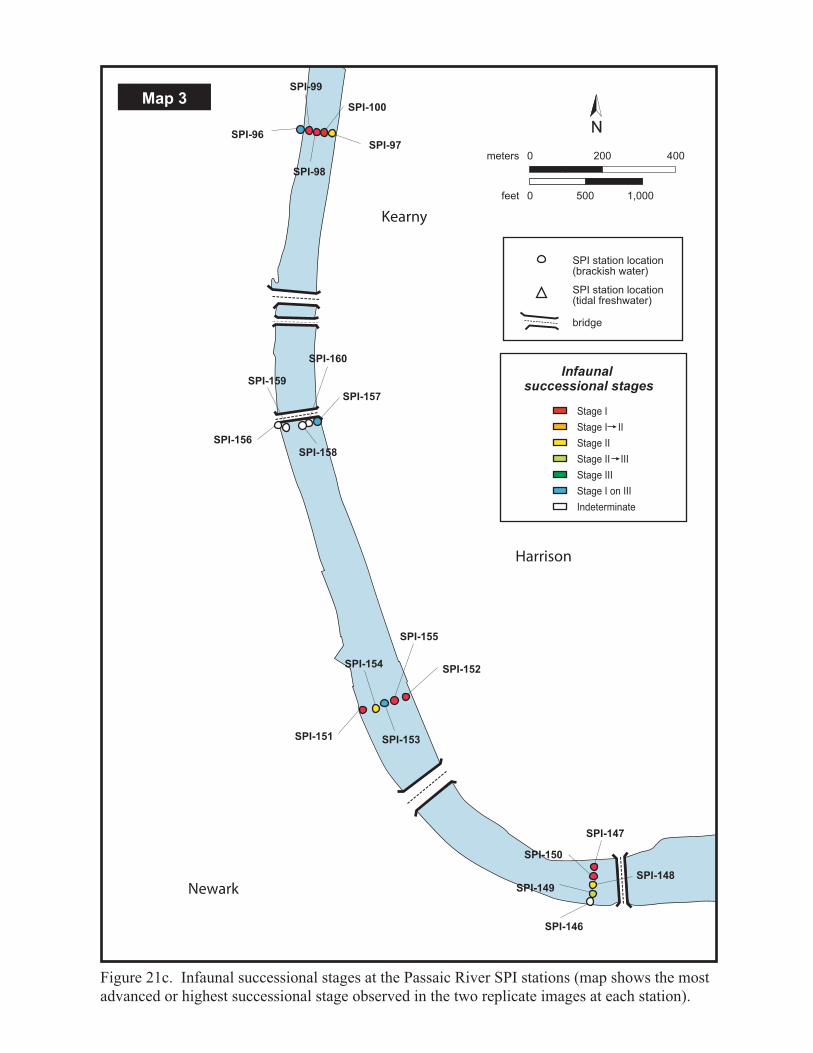
. ..
.
..
..
...
... .
N
0 200 400
0 500 1,000
meters
feet
Map 3
SPI-96
SPI-98
SPI-97
SPI-100
SPI-160
SPI-158
SPI-157
SPI-159
SPI-156
SPI-151
SPI-154
SPI-150
SPI-147
SPI-149
SPI-146
SPI-155
SPI-152
SPI-153
SPI-99
SPI-148
bridge
SPI station location(brackish water)
SPI station location(tidal freshwater)
Newark
Harrison
Kearny
Figure 21c. Infaunal successional stages at the Passaic River SPI stations (map shows the most
advanced or highest successional stage observed in the two replicate images at each station).
Infaunal successional stages
Stage I
Stage I II
Stage II
Stage II III
Stage III
Stage I on III
Indeterminate

bridge
SPI station location(brackish water)
SPI station location(tidal freshwater)
..
...
. ... .
.
..
..
...
Map 4
N
0 200 400
0 500 1,000
meters
feet
SPI-9
SPI-6
SPI-8
SPI-7
SPI-5 SPI-2
SPI-3SPI-1
SPI-4
SPI-54
SPI-55
SPI-51
SPI-53 SPI-52
SPI-94
SPI-91
SPI-95
SPI-92
SPI-93
SPI-10
SPI-57
SPI-60
SPI-58
SPI-59
SPI-56
Belleville
Arlington
NorthArlington
Figure 21d. Infaunal successional stages at the Passaic River SPI stations (map shows the most
advanced or highest successional stage observed in the two replicate images at each station).
Infaunal successional stages
Stage I
Stage I II
Stage II
Stage II III
Stage III
Stage I on III
Indeterminate

..
.....
. . .
...
N
0 200 400
0 500 1,000
meters
feet
Map 5
bridge
SPI station location(brackish water)
SPI station location(tidal freshwater)
SPI-24
SPI-19SPI-20
SPI-17
SPI-18
SPI-14
SPI-15
SPI-12
SPI-11
SPI-13
SPI-16
SPI-25
SPI-22
SPI-23
SPI-21
SPI-34
SPI-35
SPI-32SPI-33
SPI-31
Lyndhurst
Nutley
Belleville
NorthArlington
Figure 21e. Infaunal successional stages at the Passaic River SPI stations (map
shows the most advanced or highest successional stage observed in the two
replicate images at each station).
Infaunal successional stages
Stage I
Stage I II
Stage II
Stage II III
Stage III
Stage I on III
Indeterminate
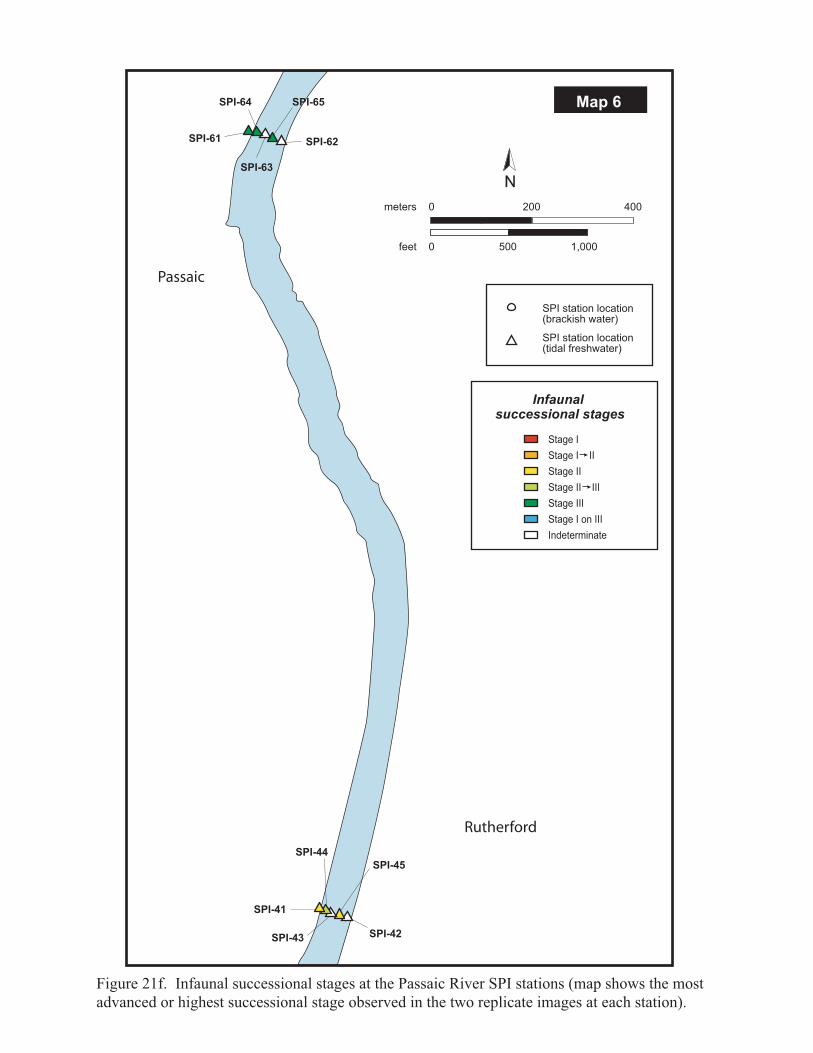
.... .
..
..
N
0 200 400
0 500 1,000
meters
feet
Map 6
SPI station location(brackish water)
SPI station location(tidal freshwater)
SPI-44
SPI-45
SPI-42SPI-43
SPI-41
SPI-65
SPI-62
SPI-63
SPI-64
SPI-61
Rutherford
Passaic
Figure 21f. Infaunal successional stages at the Passaic River SPI stations (map shows the most
advanced or highest successional stage observed in the two replicate images at each station).
Infaunal successional stages
Stage I
Stage I II
Stage II
Stage II III
Stage III
Stage I on III
Indeterminate
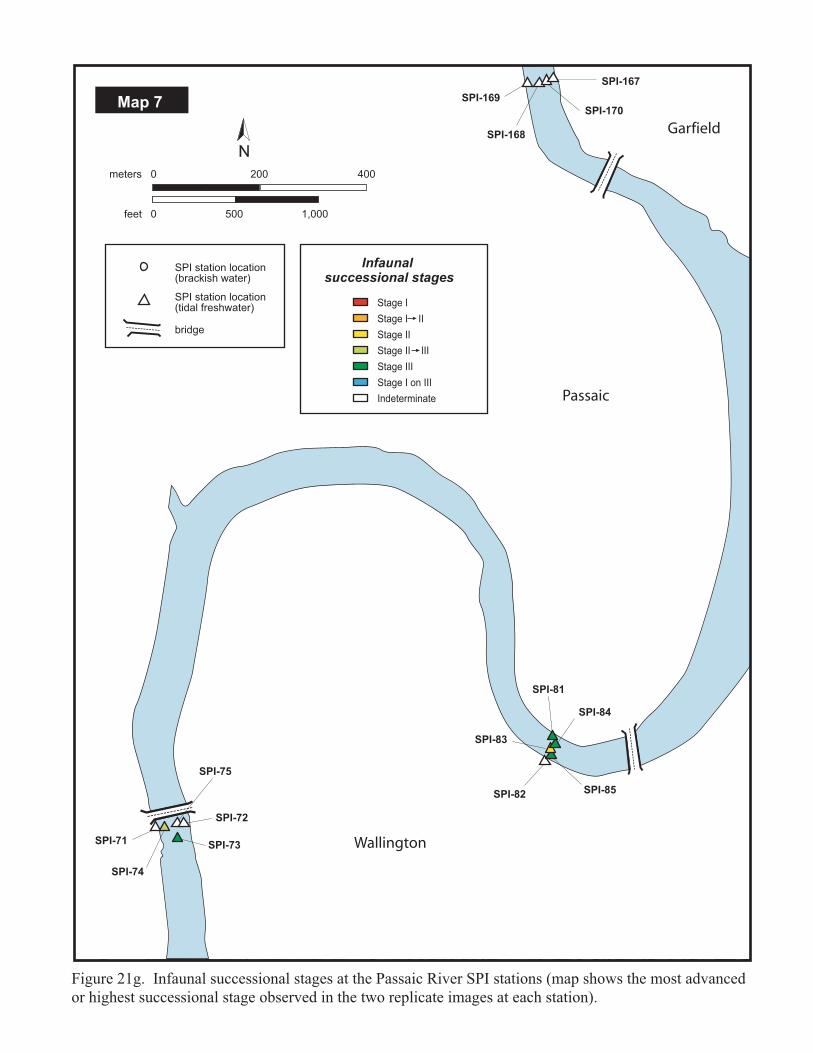
.
....
N
0 200 400
0 500 1,000
meters
feet
Map 7
bridge
SPI station location(brackish water)
SPI station location(tidal freshwater)
SPI-169
SPI-170
SPI-168
SPI-167
SPI-81
SPI-84
SPI-85SPI-82
SPI-83
SPI-75
SPI-72
SPI-73
SPI-74
SPI-71 Wallington
Passaic
Garfield
Figure 21g. Infaunal successional stages at the Passaic River SPI stations (map shows the most advanced
or highest successional stage observed in the two replicate images at each station).
Infaunal successional stages
Stage I
Stage I II
Stage II
Stage II III
Stage III
Stage I on III
Indeterminate
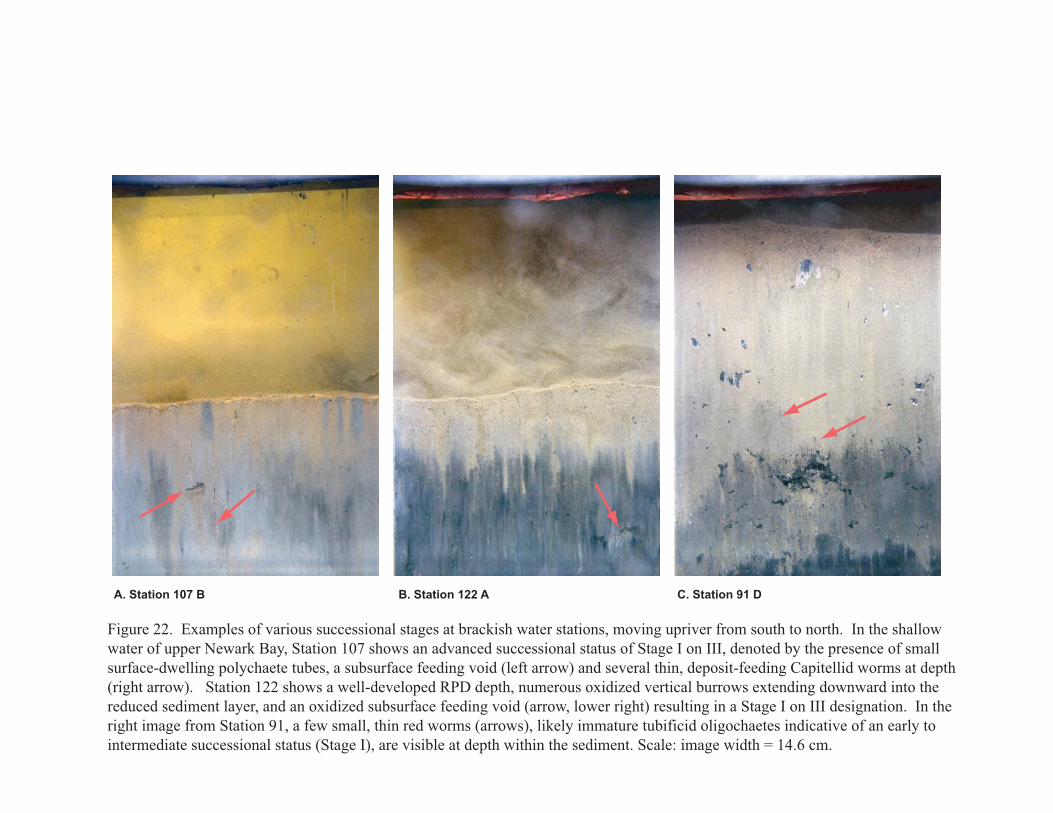
Figure 22. Examples of various successional stages at brackish water stations, moving upriver from south to north. In the shallow
water of upper Newark Bay, Station 107 shows an advanced successional status of Stage I on III, denoted by the presence of small
surface-dwelling polychaete tubes, a subsurface feeding void (left arrow) and several thin, deposit-feeding Capitellid worms at depth
(right arrow). Station 122 shows a well-developed RPD depth, numerous oxidized vertical burrows extending downward into the
reduced sediment layer, and an oxidized subsurface feeding void (arrow, lower right) resulting in a Stage I on III designation. In the
right image from Station 91, a few small, thin red worms (arrows), likely immature tubificid oligochaetes indicative of an early to
intermediate successional status (Stage I), are visible at depth within the sediment. Scale: image width = 14.6 cm.
A. Station 107 B B. Station 122 A C. Station 91 D

Figure 23. Examples of Stage III at tidal freshwater stations, moving upriver from south to north. Station 14 has alternating
layers of sand and silt, with numerous tubificid oligochaetes. Likewise, Station 61 has sand-over-silt layering and many
oligochaetes concentrated at the point of contact between the two layers. In the image on the far right, abundant oligochaete
tubes are visible as hair-like projections within a thin layer of silt at the sediment-water interface at Station 73 (Stage III).
Scale: image width = 14.6 cm.
A. Station 14 A B. Station 61 B C. Station 73 C
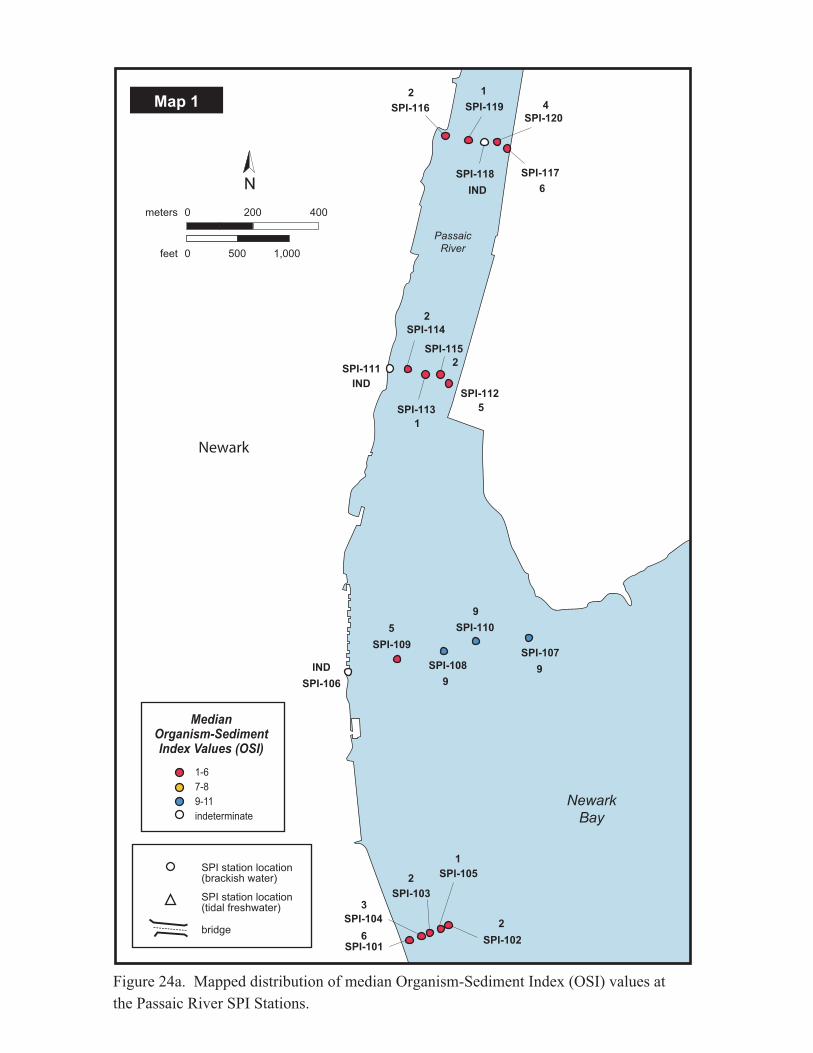
Figure 24a. Mapped distribution of median Organism-Sediment Index (OSI) values at
the Passaic River SPI Stations.
SPI-116 SPI-119
SPI-118
SPI-120
SPI-117
SPI-112
SPI-115
SPI-113
SPI-114
SPI-111
SPI-106
SPI-109
SPI-108
SPI-110
SPI-107
SPI-105
SPI-102
SPI-103
SPI-104
SPI-101
N
0 200 400
0 500 1,000
meters
feet
Newark
Bay
Passaic
River
Map 1
bridge
SPI station location(brackish water)
SPI station location(tidal freshwater)
MedianOrganism-SedimentIndex Values (OSI)
Newark
1-6
7-8
9-11
indeterminate
6
3
2
1
2
IND
5
9
9
9
1
5
2
6
4
12
IND
2
IND
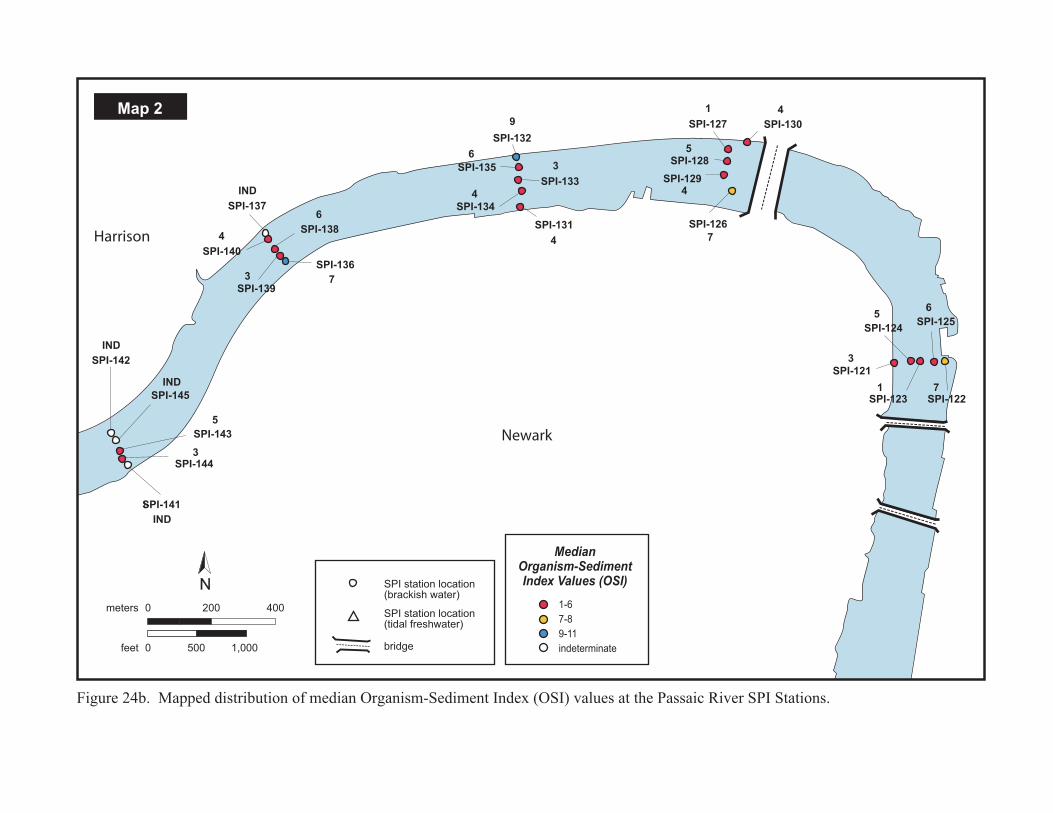
. ... .
.
.
.
.
.
.
..
.
.
.
. .
.
.
.
..
.
I-
Map 2
N
0 200 400
0 500 1,000
meters
feet
SPI-121
SPI-129
SPI-128
SPI-127
SPI-135
SPI-131
SPI-134SPI-137
SPI-138
SPI-136
SPI-139
SPI-141
SPI-143
SPI-145
SPI-142
SPI-144
SPI-140
SPI-132
SPI-133
SPI-123 SPI-122
SPI-124SPI-125
SPI-126
SPI-130
bridge
SPI station location(brackish water)
SPI station location(tidal freshwater)
Newark
Harrison
MedianOrganism-SedimentIndex Values (OSI)
1-6
7-8
9-11
indeterminate
Figure 24b. Mapped distribution of median Organism-Sediment Index (OSI) values at the Passaic River SPI Stations.
3
5
1
6
7
4
5
1 49
6
4
3
4
73
4
6
IND
5
3
IND
IND
IND
7
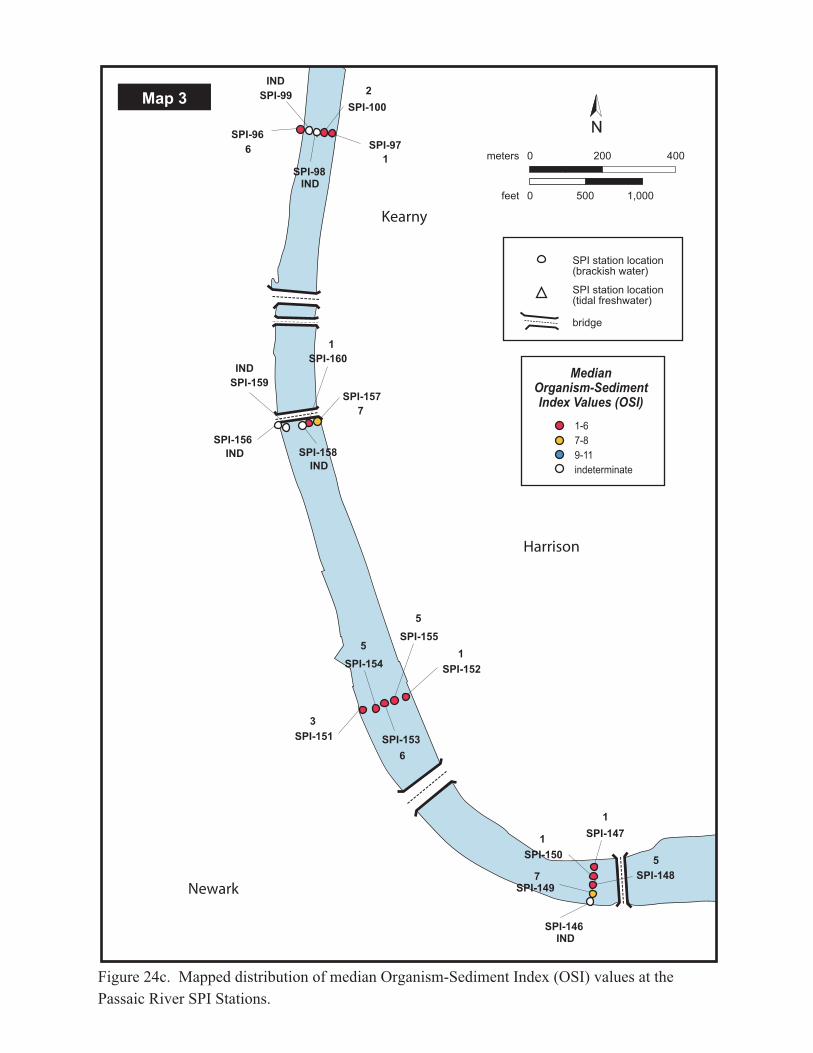
. ... .
.
..
..
...
... .
N
0 200 400
0 500 1,000
meters
feet
Map 3
SPI-96
SPI-98
SPI-97
SPI-100
SPI-160
SPI-158
SPI-157
SPI-159
SPI-156
SPI-151
SPI-154
SPI-150
SPI-147
SPI-149
SPI-146
SPI-155
SPI-152
SPI-153
SPI-99
SPI-148
bridge
SPI station location(brackish water)
SPI station location(tidal freshwater)
Newark
Harrison
Kearny
MedianOrganism-SedimentIndex Values (OSI)
1-6
7-8
9-11
indeterminate
Figure 24c. Mapped distribution of median Organism-Sediment Index (OSI) values at the
Passaic River SPI Stations.
IND
7
1
1
5
1
5
5
6
3
7
1
1
2
6
INDIND
IND
IND
IND

bridge
SPI station location(brackish water)
SPI station location(tidal freshwater)
..
. . .
.
.
..
Map 4
N
0 200 400
0 500 1,000
meters
feet
SPI-9
SPI-6
SPI-8
SPI-7
SPI-5 SPI-2
SPI-3SPI-1
SPI-4
SPI-54
SPI-55
SPI-51
SPI-53 SPI-52
SPI-94
SPI-91
SPI-95
SPI-92
SPI-93
SPI-10
SPI-57
SPI-60
SPI-58
SPI-59
SPI-56
MedianOrganism-SedimentIndex Values (OSI)
1-6
7-8
9-11
indeterminate
Belleville
NorthArlington
Arlington
Figure 24d. Mapped distribution of median Organism-Sediment Index (OSI) values at the
Passaic River SPI Stations.
IND
IND
IND
IND
IND
IND
IND
IND
IND
IND
IND
2
2
5
5
3
3
3
3
3
1
1
1
4
4
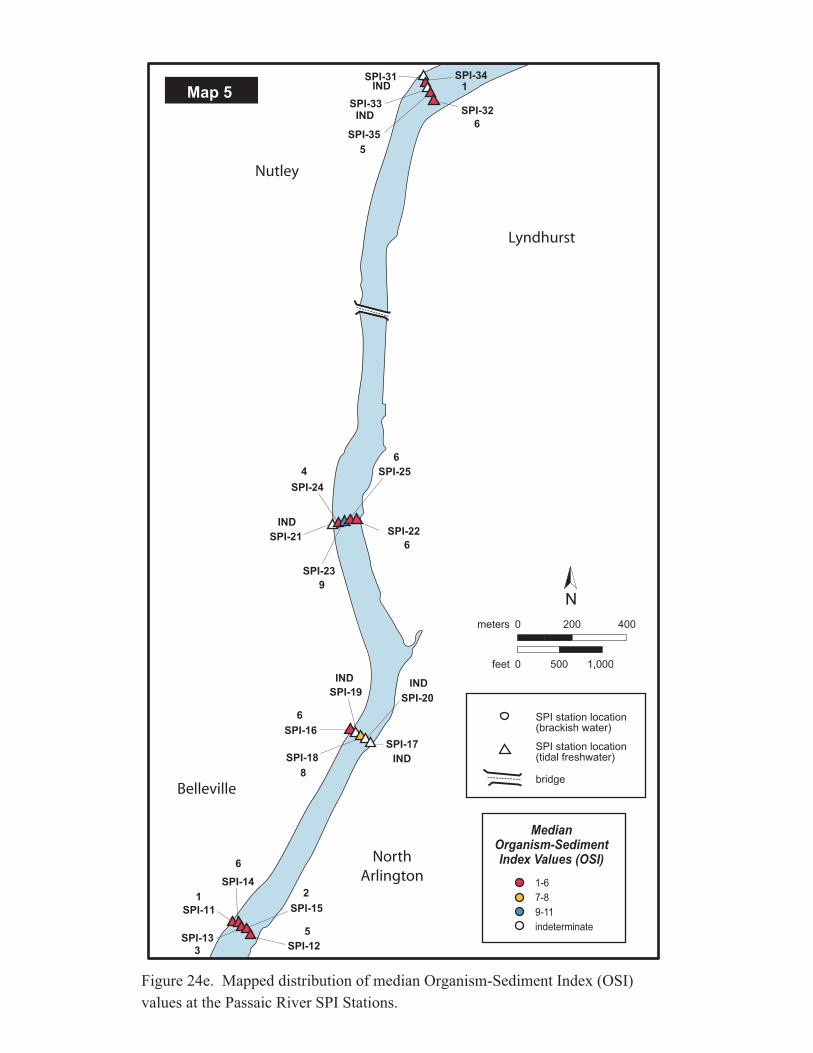
..
.....
. . .
...
N
0 200 400
0 500 1,000
meters
feet
Map 5
bridge
SPI station location(brackish water)
SPI station location(tidal freshwater)
SPI-24
SPI-19SPI-20
SPI-17
SPI-18
SPI-14
SPI-15
SPI-12
SPI-11
SPI-13
SPI-16
SPI-25
SPI-22
SPI-23
SPI-21
SPI-34
SPI-35
SPI-32SPI-33
SPI-31
Lyndhurst
Nutley
Belleville
NorthArlington
MedianOrganism-SedimentIndex Values (OSI)
1-6
7-8
9-11
indeterminate
Figure 24e. Mapped distribution of median Organism-Sediment Index (OSI)
values at the Passaic River SPI Stations.
IND
1
5
3
6
6
8
9
4
6
5
1
6
6
2
INDIND
IND
IND
IND
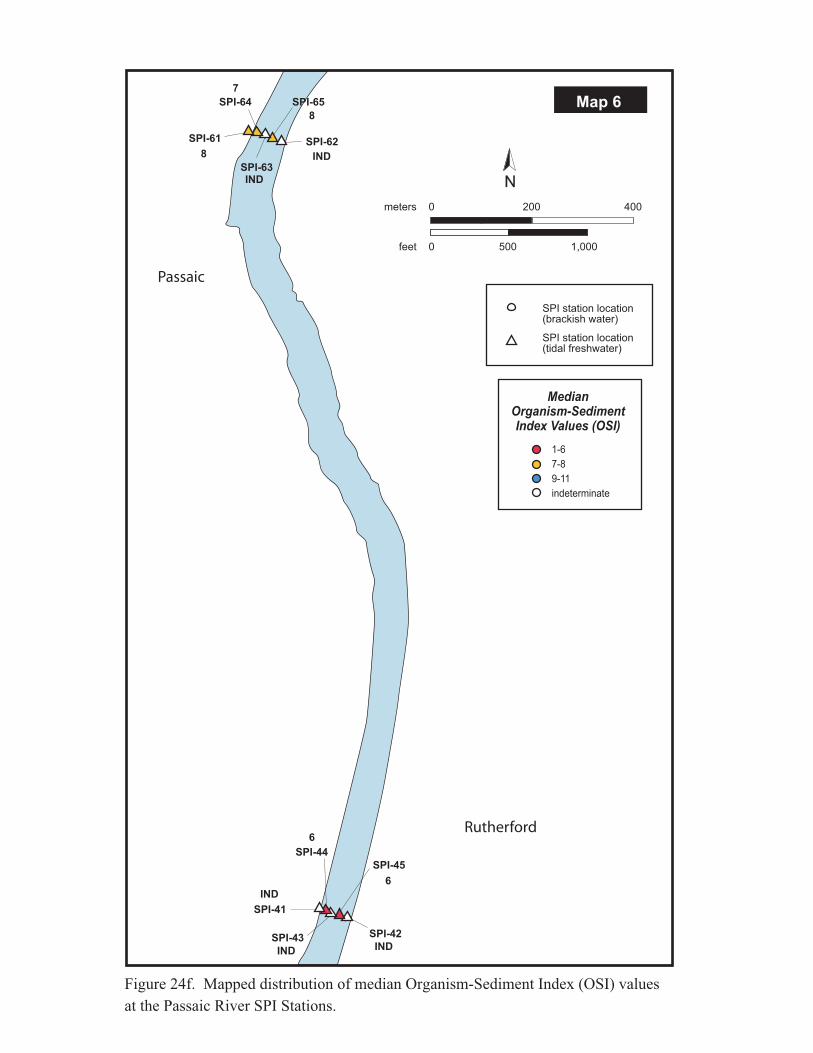
.... .
..
..
N
0 200 400
0 500 1,000
meters
feet
Map 6
SPI station location(brackish water)
SPI station location(tidal freshwater)
SPI-44
SPI-45
SPI-42SPI-43
SPI-41
SPI-65
SPI-62
SPI-63
SPI-64
SPI-61
Rutherford
Passaic
MedianOrganism-SedimentIndex Values (OSI)
1-6
7-8
9-11
indeterminate
Figure 24f. Mapped distribution of median Organism-Sediment Index (OSI) values
at the Passaic River SPI Stations.
IND
6
6
IND IND
IND
IND
8
7
8
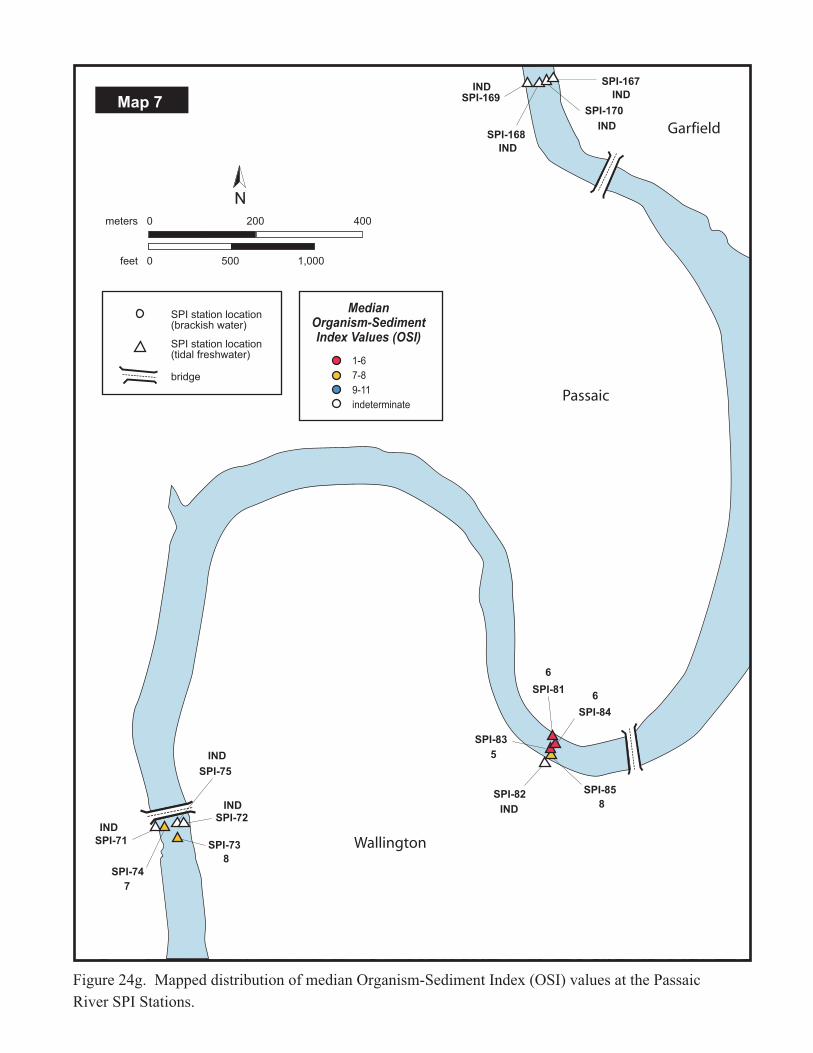
.
....
N
0 200 400
0 500 1,000
meters
feet
Map 7
bridge
SPI station location(brackish water)
SPI station location(tidal freshwater)
SPI-169
SPI-170
SPI-168
SPI-167
SPI-81
SPI-84
SPI-85SPI-82
SPI-83
SPI-75
SPI-72
SPI-73
SPI-74
SPI-71 Wallington
Passaic
Garfield
MedianOrganism-SedimentIndex Values (OSI)
1-6
7-8
9-11
indeterminate
Figure 24g. Mapped distribution of median Organism-Sediment Index (OSI) values at the Passaic
River SPI Stations.
IND
IND
IND
IND
IND
IND
IND
IND
7
8
5
8
6
6
APPENDIX A
Sediment Profile Image Analysis Results

Appendix A
SPI Image Analysis Results
Transect Station No. Rep. Date TimeCalibration Constant
Grain Size Major
Mode (phi)
Grain Size Max. (phi)
Grain Size Min.
(phi)
Grain Size
Range (phi)
Total Area of Imaged
Sediment (sq. cm)
Avg. Prism Penetration Depth (cm)
Min. Prism Pen.
Depth (cm)
Max. Prism Pen.
Depth (cm)
Boundary Roughness
(cm)
Origin of Boundary
Roughness (Physical or
Biogenic)RPD Area
(cm2)
Mean RPD (cm)
No. Mud Clasts
Mud Clasts Oxidized
Reduced or Both?
No. Feed-ing Voids
Feed- ing Void
Min. Depth (cm)
Feed- ing Void Max.
Depth (cm)
Feed- ing Void
Avg. Depth (cm)
Successional Stage
Organism-Sediment
Index (OSI)Methane Present?
Methane Min. Depth (cm)
Methane Max. Depth
(cm)
No. Methane Bubbles
Total area all bubbles
(cm2)T1 101 A 6/23/05 10:01 14.42 >4 2 >4 >4 - 2 181.1 12.6 12.5 13.2 0.64 B 47.61 3.30 0 0 0.00 Stage II 6 Y 2.52 2.52 1 0.3T1 101 C 6/23/05 10:02 14.43 >4 2 >4 >4 - 2 179.53 12.4 12.2 13.0 0.79 B 44.85 3.11 0 0 0.00 Stage I -> II 5 Y 6.37 11.05 2 0.7T1 102 A 6/23/05 11:19 14.46 >4 2 >4 >4 - 2 138.7 9.6 8.5 10.3 1.76 P 2.13 0.15 5 R 0 0.00 Stage I 2 N
T1 102 C 6/23/05 11:21 14.46 >4 2 >4 >4 - 2 140.7 9.7 10.3 10.8 0.54 B 1.01 0.07 8 B 0 0.00 Stage I 2 NT1 103 A 6/23/05 10:47 14.45 >4 2 >4 >4 - 2 158.17 10.9 10.7 11.2 0.47 B 21.25 1.47 0 B 0 0.00 Stage I 1 Y 3.96 10.8 18 4.4
T1 103 B 6/23/05 10:48 14.47 >4 2 >4 >4 - 2 162.94 11.3 11.0 11.8 0.79 P 26.49 1.83 0 0 0.00 Stage I 2 Y 2.37 11.31 19 5.4
T1 104 A 6/23/05 10:31 14.4 >4 2 >4 >4 - 2 168.32 11.7 9.7 10.3 0.63 P 5.51 0.38 2 B 0 0.00 Stage I -> II 1 Y 2.14 11.34 14 7.2
T1 104 D 6/23/05 10:35 14.46 >4 2 >4 >4 - 2 171.98 11.9 11.6 12.1 0.45 P 18.11 1.25 0 0 0.00 Stage II -> III 4 Y 3.67 11.86 18 5.8
T1 105 B 6/23/05 11:04 14.46 >4 2 >4 >4 - 2 171.98 11.9 11.6 12.1 0.55 P 14.96 1.03 0 0 0.00 Stage I 1 Y 3.09 10.95 23 12.3
T1 105 D 6/23/05 11:06 14.45 >4 2 >4 >4 - 2 169.69 11.7 11.3 12.0 0.69 B 9.65 0.67 4 B 0 0.00 Stage I -> II 1 Y 4.32 10.97 16 5.7T2 106 A 6/23/05 13:57 14.43 >4 3 >4 >4 - 3 298.38 20.7 20.7 20.7 0 ind ind ind NA 0 0.00 ind ind Y 4.84 20.51 34 11.0T2 106 B 6/23/05 13:58 14.41 >4 2 >4 >4 - 2 298.14 20.7 20.7 20.7 0 ind ind ind na 0 0.00 ind ind Y 8.66 18.25 24 3.2
T2 107 A 6/22/05 11:30 14.39 >4 2 >4 >4 - 2 143.22 10.0 9.4 10.7 1.23 B 33.49 2.33 6 B 2 3.4 6.0 4.71 Stage I on III 9 N
T2 107 B 6/22/05 11:31 14.44 >4 2 >4 >4 - 2 138.03 9.6 9.2 9.7 0.55 B 32.29 2.24 5 B 1 4.8 4.8 4.75 Stage I on III 8 NT2 108 A 6/22/05 11:51 14.44 >4 2 >4 >4 - 2 158.13 11.0 10.5 11.0 0.5 B 25.62 1.77 1 O 1 9.9 9.9 9.94 Stage I on III 8 N
T2 108 B 6/22/05 11:52 14.44 >4 2 >4 >4 - 2 156.35 10.8 10.7 10.9 0.28 B 40.61 2.81 7 O 2 6.5 10.4 8.45 Stage I on III 9 N
T2 109 B 6/23/05 14:06 14.43 >4 3 >4 >4 - 3 218.95 15.2 14.5 16.1 1.54 P ind ind 0 n 0.00 ind ind NT2 109 C 6/23/05 14:07 14.44 >4 0 >4 >4 - 0 87.04 6.0 3.5 7.7 4.23 P 40.12 2.78 0 0 0.00 Stage I 5 NT2 110 C 6/22/05 11:41 14.46 >4 2 >4 >4 - 2 126.06 8.7 8.3 9.6 1.29 P 42.38 2.93 0 2 5.2 6.0 5.60 Stage I on III 9 N
T2 110 D 6/22/05 11:42 14.48 >4 1 >4 >4 - 1 140.34 9.7 9.6 9.9 0.31 B 35.83 2.47 0 2 3.0 5.8 4.42 Stage I on III 9 NT3 111 B 6/23/05 14:17 14.46 >4 3 >4 >4 - 3 282.07 20.7 20.7 20.7 0 ind ind ind na 0 0.00 ind ind Y 4.07 12.06 13 5.8T3 111 C 6/23/05 14:17 14.41 >4 2 >4 >4 - 2 297.93 20.7 20.7 20.7 0 ind ind ind na 0 0.00 ind ind Y 5.47 16.89 18 3.9
T3 112 A 6/23/05 11:50 14.44 >4 2 >4 >4 - 2 149.85 10.4 10.0 10.6 0.63 B 25.91 1.79 0 0 0.00 Stage I -> II 5 NT3 112 C 6/23/05 11:51 14.4 >4 2 >4 >4 - 2 148.44 10.3 9.6 10.5 0.85 B 32.07 2.23 0 0 0.00 Stage I 4 NT3 113 A 6/23/05 12:16 14.46 >4 1 >4 >4 - 1 150.84 10.4 10.0 11.1 1.16 B 10.85 0.75 0 0 0.00 Stage I 0 Y 3.65 10.08 12 13.4T3 113 B 6/23/05 12:16 14.43 >4 1 >4 >4 - 1 155.41 10.8 10.0 11.3 1.24 P 13.76 0.95 0 0 0.00 Stage I 1 Y 2.59 10.27 10 6.0
T3 114 A 6/23/05 12:25 14.43 >4 2 >4 >4 - 2 179.37 12.4 12.1 13.0 0.9 B 20.5 1.42 4 R 0 0.00 Stage I -> II 2 Y 0.8 11.73 24 5.8
T3 114 B 6/23/05 12:26 14.44 >4 1 >4 >4 - 1 187.92 13.0 12.7 13.6 0.84 P 12.95 0.90 0 0 0.00 Stage I -> II 2 Y 3.23 13.38 25 14.4T3 115 A 6/23/05 12:02 14.46 >4 3 >4 >4 - 3 126.82 8.8 8.4 9.0 0.66 P 9.99 0.69 0 0 0.00 Stage I 2 NT3 115 B 6/23/05 12:03 14.43 >4 2 >4 >4 - 2 125.18 8.7 8.4 9.1 0.71 P 6.47 0.45 0 0 0.00 Stage I 2 N
T4 116 A 6/22/05 11:14 14.45 >4 2 >4 >4 - 2 201.55 13.9 13.6 14.7 1.08 P 9.7 0.67 6 R 0 0.00 Stage I -> II 3 NT4 116 C 6/22/05 11:16 14.44 >4 2 >4 >4 - 2 185.96 12.9 12.4 13.2 0.83 P 7.6 0.53 0 0 0.00 Stage I -> II 1 Y 3.25 5.69 3 0.9
T4 117 A 6/22/05 10:42 14.44 >4 1 >4 >4 - 1 131.59 9.1 8.8 9.4 0.55 P 28.55 1.98 0 0 0.00 Stage I 4 NT4 117 B 6/22/05 10:43 14.47 >4 1 >4 >4 - 1 128.71 8.9 8.6 9.4 0.81 P 33.16 2.29 10 R 2 7.0 8.5 7.73 Stage I on III 7 Y 6.08 6.1 1 0.1T4 118 A 6/22/05 10:59 14.42 ind ind ind ind 123.72 8.6 6.4 10.5 4.06 P ind ind 0 0 0.00 ind ind NT4 118 B 6/22/05 11:00 14.41 ind ind ind ind 99.07 6.9 7.0 9.4 2.42 P ind ind 0 0 0.00 ind ind N
T4 119 B 6/22/05 11:09 14.42 >4 0 >4 >4 - 0 182.01 12.6 12.3 12.9 0.6 P 14.64 1.02 10 R 0 0.00 Stage I 1 Y 1.52 12.75 25 8.5
T4 119 D 6/22/05 11:11 14.43 >4 0 >4 >4 - 0 184.14 12.8 12.4 12.8 0.44 P 15.2 1.05 2 R 0 0.00 Stage I 1 Y 1.75 12.8 23 19.5
T4 120 A 6/22/05 10:47 14.44 >4 2 >4 >4 - 2 91.52 6.3 5.6 7.3 1.69 P 26.27 1.82 2 R 0 0.00 Stage I -> II 5 N
T4 120 D 6/22/05 10:50 14.46 >4 2 >4 >4 - 2 130.23 9.0 8.6 9.3 0.65 P 7.71 0.53 2 B 0 0.00 Stage I 2 N
T5 121 A 6/22/05 13:09 14.45 >4 2 >4 >4 - 2 158.34 11.0 10.6 11.1 0.48 B 16.55 1.15 0 2 1.0 3.3 2.11 Stage I -> II 2 Y 1.72 10.92 8 1.2
T5 121 B 6/22/05 13:10 14.44 >4 2 >4 >4 - 2 155.4 10.8 10.5 11.1 0.58 P 13.88 0.96 7 B 0 0.00 Stage II -> III 4 Y 4.72 10.63 12 1.5
T5 122 A 6/22/05 13:48 14.46 >4 2 >4 >4 - 2 143.33 9.9 9.5 10.5 0.93 P 34.78 2.41 0 1 7.9 7.9 7.85 Stage I on III 9 N
T5 122 F 6/22/05 14:06 14.46 >4 1 >4 >4 - 1 173.66 12.0 11.4 13.7 2.3 P 7.11 0.49 0 1 6.9 6.9 6.91 Stage I on III 4 Y 7.09 8.16 2 0.5
T5 123 C 6/22/05 13:33 14.44 >4 1 >4 >4 - 1 123.18 8.5 8.1 9.1 1.01 P 11.33 0.78 6 B 0 0.00 Stage I 1 Y 1.6 9.02 19 6.0
1

Appendix A
SPI Image Analysis Results
Transect Station No. Rep.T1 101 AT1 101 CT1 102 A
T1 102 CT1 103 A
T1 103 B
T1 104 A
T1 104 D
T1 105 B
T1 105 DT2 106 AT2 106 B
T2 107 A
T2 107 BT2 108 A
T2 108 B
T2 109 BT2 109 CT2 110 C
T2 110 DT3 111 BT3 111 C
T3 112 AT3 112 CT3 113 AT3 113 B
T3 114 A
T3 114 BT3 115 AT3 115 B
T4 116 AT4 116 C
T4 117 AT4 117 BT4 118 AT4 118 B
T4 119 B
T4 119 D
T4 120 A
T4 120 D
T5 121 A
T5 121 B
T5 122 A
T5 122 F
T5 123 C
Percent Imaged Area Occupied by
MethaneLow DO?
Deposi-tional Layer
Present?
Deposi- tional Layer Thick-
ness (cm)
Post-Storm
Deposi-tion? COMMENT
0.1 No Y 4.5 Y reddish silt>pen; recent surface depositional layer with extensive meiofaunal tunneling; extensive biogenic mounding on surface, quick re-establishment after storm0.4 No Y 5.0 Y reddish silt>pen; recent surface depositional layer with extensive meiofaunal tunnelling; arthropod (shrimp?) at SWI in center mid-farfield0.0 No N N silt-clay>pen; black reduced sed close to SWI; sulfidic banding@depth; reduced mud clasts; numerous Stg 1 tubes
0.0 No N Nreddish-black silt-clay>pen; reduced sed at SWI; v. thin veneer of light-colored sed @ SWI; sulfidic banding @ depth; numerous Stg 1 tubes, this rep & last look like possible erosional effects from storm
2.8 No N N reddish silt-clay>pen; homogenous texture; sulfidic@depth; methane bubbles+ebbulition tracks; moderate Stg 1 tubes; highly invaginated RPD; a few smaller worms@depth
3.3 No Y 2.3 Yreddish silt-clay>pen; homogenous texture; dark but not black@depth; numerous methane bubbles+ebbulation tracks; few small thin worms@depth;faint horizon 2 cm down=older depositional layer? Shrimp at SWI
4.3 No N Nreddish silt-clay>pen; homogenous texture; dark but not black@depth; fainly reduced sed close to SWI; dense upright and recumbent Stg 1 tubes; numerous methane bubbles+ebbulation tracks; a few small worms@depth
3.4 No N Nreddish silt-clay>pen; homogenous texture; dark but not black@depth; fainly reduced sed close to SWI; Stg 1 tubes; numerous methane bubbles -- diagnostic photo showing methane filling "path of least resistance", i.e., occupying biogenic burrow; oxy sed@depth due to ebullation, a few reddish threadlike worms@depth=Capitellids?
7.1 No N N reddish silt-clay>pen; homogenous texture; dark but not black@depth; fainly reduced sed close to SWI; dense Stg 1 tubes; numerous methane bubbles+ebbulation tracks; ebullition mounds@SWI
3.3 No N Nreddish silt-clay>pen; homogenous texture; dark but not black@depth; fainly reduced sed at SWI; dense Stg 1 tubes; numerous methane bubbles; small cluster larger Stg 1 tubes, shallow burrowing bivalve
3.7 No ind N overpen; soft reddish silt-clay>pen; dark but not black@depth; probably Stg 1; a few very small worms@depth; numerous large and small methane bubbles1.1 No ind N overpen; soft reddish silt-clay>pen; dark but not black@depth; probably Stg 1; a few very small worms@depth; numerous large and small methane bubbles
0.0 No N N reddish muddy-silt w/ some fine sand>pen; shallow water=sun-illuminated water column+Ulva; active voids, vertical tube halos+larger-bodied worm@depth; some phaoepigment staining@SWI (?)
0.0 No N Nreddish muddy-silt w/ some fine sand>pen; wiper clast artifacts@SWI; shallow water=sun-illuminated water column+Ulva; active void, vertical tube halos+several red thread-like worms@depth; some phaoepigment staining@SWI (?)
0.0 No N N reddish muddy-silt w/minor fine sand>pen; a few small thin worms@depth; partial void lwr right; phaeopigments+organic matter mixed in upper 0.5 cm
0.0 No N Nreddish muddy-silt w/minor fine sand>pen; thin+one larger green worms@depth; voids indistinc but assumed active; phaeopigments+organic matter mixed in upper 0.5 cm; small red clay patches@depth
0.0 No Y 15.2 Yreddish silt-clay with abundant decayed leaf litter + other organicdetritus; flocculant SWI indistinct; sed appears very non-compacted from SWI to max pen depth; appears to be all recent deposition from storm
0.0 No Y 3.0 Y reddish sandy silt-clay; surface depositional lyr (?) of decayed leaf litter; flocculant leaf litter layer over more compact [email protected] No N N reddish silt-clay w/ significant fine sand>pen; shallow water=Ulva; indistinct small feeding voids; several thread-like worms@depth; indistinct RPD contrast
0.0 No N N brown silt-clay w/ significant fine sand>pen; shallow water=Ulva; evidence of burrows & subsurface re-working; patches of fine sand mixed with clay layers@depth; threadworms; indistinct RPD
2.1 No ind ind very soft silt-clay>pen; overpen; black sulfidic layering@depth; probably Stg 1 or azoic1.3 No ind ind very soft silt-clay>pen; overpen; black sulfidic layering@depth; probably Stg 1 or azoic
0.0 No N N reddish silt-clay>pen; very fine sand fraction in upper 5 cm; Stg 1 tubes in farfield; small pieces organic detritus in upper 3-4 cm; indistinct rpd contrast; transected burrow at depth
0.0 No N N reddish silt-clay>pen; very fine sand fraction in upper 3-4 cm; Stg 1 tubes in farfield; small pieces organic detritus in upper 3-4 cm; indistinct rpd contrast8.9 No N N reddish silt-clay>pen; fine sand fraction throughout; organic detritus+leaf litter mixed w/ sed; sulfidic [email protected] No Y 1.7 Y reddish silt-clay>pen; fine sand fraction throughout; organic detritus+leaf litter mixed w/ sed; large decayed leaves@surf
3.2 No N Nreddish silt-clay>pen; fine sand fraction throughout; some minor small organic detritus+leaf litter mixed w/ sed;bubble ebullition tracks; Stg 1 tubes;segment of larger-bodied orange-red worm at 3.5 cm depth
7.6 No Y 3.8 Yreddish silt-clay>pen; fine sand fraction in upper 3-4 cm;; organic detritus+leaf litter+twigs mixed w/ sed in surface dep layer from some time ago (?);bubble ebullition tracks; Stg 1 tubes;segment of larger-bodied orange-red worm at 7.5 cm depth, even with methane -- doesn't prevent errantia
0.0 No N reddish silt-clay>pen; homogenous texture; dragdown of decayed leaf=not measured for rpd; moderately reduced/sulfidic at depth; shallow and highly invaginated rpd0.0 No N brown silt-clay>pen; homogenous texture; minor smearing artifacts; moderately reduced/sulfidic sed@depth; shallow rpd and subtle redox contrast; reduced sed near SWI
0.0 No Y 0.4 N brown silt-clay>pen w/ fine sand in upper 5-7 cm; meiofaunal tunnelling/reworking in upper 1 cm=leaf debris lyr=recent deposition? one threadworm prominent@depth; moderately sulfidic@depth
0.5 No Y 0.6 N brown silt-clay>pen w/some fine sand; sulfidic patches@depth, moderately reduced sed at/near SWI=thin rpd; voids@depth; leaf litter@surf; worms at depth
0.0 No N brown silt-clay>pen w/some fine sand; moderately sulfidic@depth, very small indistinct voids@depth= potential feeding voids. Biogenic tunnelling near SWI; leaf litter@surface
0.1 No N reddish brown silt-clay w/ some fine sand>pen; moderately reduced@depth; meiofaunal tunnelling near SWI; thin surface dep lyr of leaf litter and detritus0.0 No Y >8.6 N decayed leaves, stems, twigs, wood chips and miscellaneous plant debris >pen. Appears very loose and mixed with small amount of silt-clay; result of recent deposition??0.0 No Y >6.9 N decayed leaves, stems, twigs, wood chips and miscellaneous plant debris >pen. Appears very loose and mixed with small amount of silt-clay; result of recent deposition??
4.7 No Y 7.22-3 cm surface layer of muddy fine sand over moderately reduced silt-clay; 5-6 cm thick sulfidic horizon below surface sandy lyr (historic depositional interval); organic detritus@surf; a few very thin worms@depth
10.6 No Y 7.2 N2-3 cm surface layer of muddy fine sand over moderately reduced silt-clay; 4-5 cm thick sulfidic horizon below surface sandy lyr; bottom of sulfidic horizon is bottom of old depositonal layer; some organic detritus@surf; black particles in upper 2-3 cm=coal/pyrogenic?
0.0 No N firmer reddish silt-clay with fine sand>pen; moderately reduced@depth; mound-like structure farfield=ebullition mound? a few threadlike worms@depth; one piece leaf debris
0.0 No Y 5.7 Nfirmer reddish silt-clay with minor fine sand fraction in upper 1-2 cm>pen; moderately reduced sed@SWI=very thin rpd; 2 cm thick sulfidic horizon@depth=bottom of older depositional layer ; sandier particles near sed surface=some winnowing?; a few black decayed leaf particles@surf; few visible organisms
0.8 No Nhomogenous silt-clay>pen; moderately reduced@depth; clear rpd contrast; two active feeding voids; biogenic reworking@sed surface; upright and recumbent Stg 1 tubes; a few small short worms@depth
0.9 No Nbrown silt-clay w/ sand in top 2 cm>pen; moderately reduced@depth; thin rpd=redsed near SWI; black particles near surf=pyrogenic?; edge of feeding void transected; several v. long threadworms@depth
0.0 No Y 2.0 Nbrown homogenous silt-clay>pen; moderately reduced@depth; feeding void evident; several long threadworms@depth; nearsurface meiofaunal tunnelling extensive; reworked layer=recent deposition?? boundary rough=fecal mounds; several deep oxidized vertical tubes/burrows
0.3 No Nbrown homogenous silt-clay>pen; moderately to strongly reduced@dept; reduced fecal pellet mound@swi; some artifacts due to camera+bubble ebullition; several threadworms@depth; sulfidic sed near surf
4.9 No Y 0.8 N 0.5 to 1 cm thin surface layer of light colored fine to medium sand over moderately reduced-sulfidic silt-clay; sand=recent dep layer; sulfidic horizon@depth; a few small reddish-purple worms@depth
2
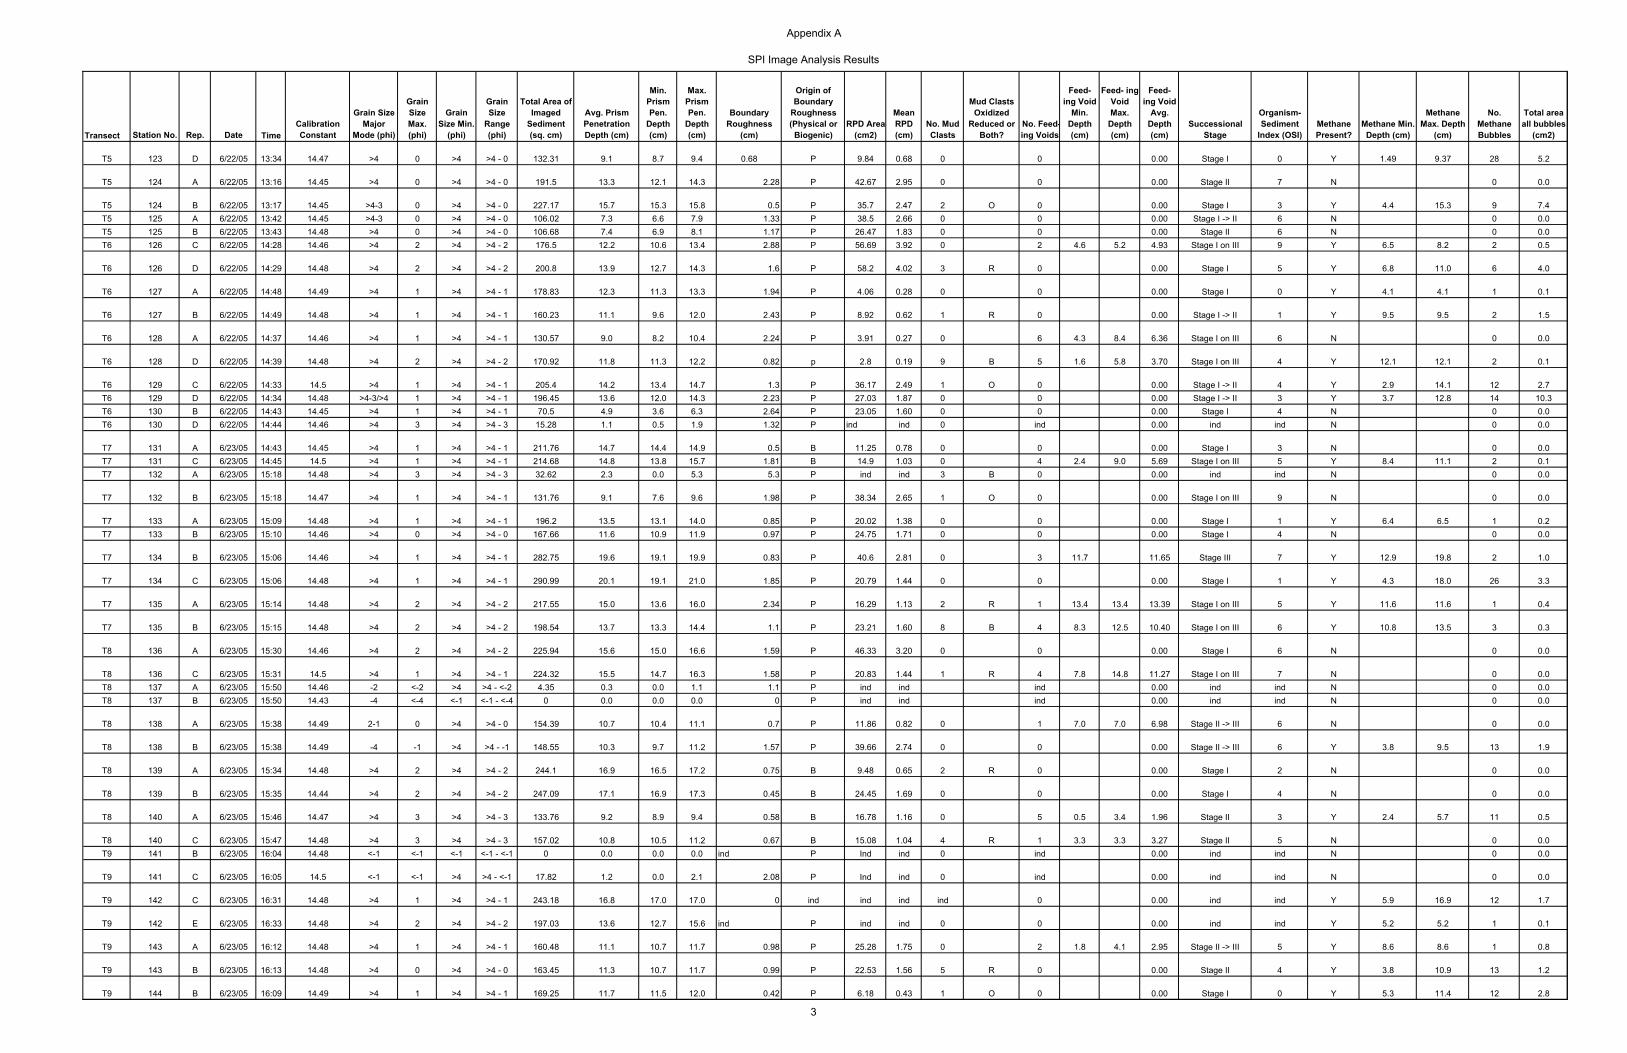
Appendix A
SPI Image Analysis Results
Transect Station No. Rep. Date TimeCalibration Constant
Grain Size Major
Mode (phi)
Grain Size Max. (phi)
Grain Size Min.
(phi)
Grain Size
Range (phi)
Total Area of Imaged
Sediment (sq. cm)
Avg. Prism Penetration Depth (cm)
Min. Prism Pen.
Depth (cm)
Max. Prism Pen.
Depth (cm)
Boundary Roughness
(cm)
Origin of Boundary
Roughness (Physical or
Biogenic)RPD Area
(cm2)
Mean RPD (cm)
No. Mud Clasts
Mud Clasts Oxidized
Reduced or Both?
No. Feed-ing Voids
Feed- ing Void
Min. Depth (cm)
Feed- ing Void Max.
Depth (cm)
Feed- ing Void
Avg. Depth (cm)
Successional Stage
Organism-Sediment
Index (OSI)Methane Present?
Methane Min. Depth (cm)
Methane Max. Depth
(cm)
No. Methane Bubbles
Total area all bubbles
(cm2)
T5 123 D 6/22/05 13:34 14.47 >4 0 >4 >4 - 0 132.31 9.1 8.7 9.4 0.68 P 9.84 0.68 0 0 0.00 Stage I 0 Y 1.49 9.37 28 5.2
T5 124 A 6/22/05 13:16 14.45 >4 0 >4 >4 - 0 191.5 13.3 12.1 14.3 2.28 P 42.67 2.95 0 0 0.00 Stage II 7 N 0 0.0
T5 124 B 6/22/05 13:17 14.45 >4-3 0 >4 >4 - 0 227.17 15.7 15.3 15.8 0.5 P 35.7 2.47 2 O 0 0.00 Stage I 3 Y 4.4 15.3 9 7.4T5 125 A 6/22/05 13:42 14.45 >4-3 0 >4 >4 - 0 106.02 7.3 6.6 7.9 1.33 P 38.5 2.66 0 0 0.00 Stage I -> II 6 N 0 0.0T5 125 B 6/22/05 13:43 14.48 >4 0 >4 >4 - 0 106.68 7.4 6.9 8.1 1.17 P 26.47 1.83 0 0 0.00 Stage II 6 N 0 0.0T6 126 C 6/22/05 14:28 14.46 >4 2 >4 >4 - 2 176.5 12.2 10.6 13.4 2.88 P 56.69 3.92 0 2 4.6 5.2 4.93 Stage I on III 9 Y 6.5 8.2 2 0.5
T6 126 D 6/22/05 14:29 14.48 >4 2 >4 >4 - 2 200.8 13.9 12.7 14.3 1.6 P 58.2 4.02 3 R 0 0.00 Stage I 5 Y 6.8 11.0 6 4.0
T6 127 A 6/22/05 14:48 14.49 >4 1 >4 >4 - 1 178.83 12.3 11.3 13.3 1.94 P 4.06 0.28 0 0 0.00 Stage I 0 Y 4.1 4.1 1 0.1
T6 127 B 6/22/05 14:49 14.48 >4 1 >4 >4 - 1 160.23 11.1 9.6 12.0 2.43 P 8.92 0.62 1 R 0 0.00 Stage I -> II 1 Y 9.5 9.5 2 1.5
T6 128 A 6/22/05 14:37 14.46 >4 1 >4 >4 - 1 130.57 9.0 8.2 10.4 2.24 P 3.91 0.27 0 6 4.3 8.4 6.36 Stage I on III 6 N 0 0.0
T6 128 D 6/22/05 14:39 14.48 >4 2 >4 >4 - 2 170.92 11.8 11.3 12.2 0.82 p 2.8 0.19 9 B 5 1.6 5.8 3.70 Stage I on III 4 Y 12.1 12.1 2 0.1
T6 129 C 6/22/05 14:33 14.5 >4 1 >4 >4 - 1 205.4 14.2 13.4 14.7 1.3 P 36.17 2.49 1 O 0 0.00 Stage I -> II 4 Y 2.9 14.1 12 2.7T6 129 D 6/22/05 14:34 14.48 >4-3/>4 1 >4 >4 - 1 196.45 13.6 12.0 14.3 2.23 P 27.03 1.87 0 0 0.00 Stage I -> II 3 Y 3.7 12.8 14 10.3T6 130 B 6/22/05 14:43 14.45 >4 1 >4 >4 - 1 70.5 4.9 3.6 6.3 2.64 P 23.05 1.60 0 0 0.00 Stage I 4 N 0 0.0T6 130 D 6/22/05 14:44 14.46 >4 3 >4 >4 - 3 15.28 1.1 0.5 1.9 1.32 P ind ind 0 ind 0.00 ind ind N 0 0.0
T7 131 A 6/23/05 14:43 14.45 >4 1 >4 >4 - 1 211.76 14.7 14.4 14.9 0.5 B 11.25 0.78 0 0 0.00 Stage I 3 N 0 0.0T7 131 C 6/23/05 14:45 14.5 >4 1 >4 >4 - 1 214.68 14.8 13.8 15.7 1.81 B 14.9 1.03 0 4 2.4 9.0 5.69 Stage I on III 5 Y 8.4 11.1 2 0.1T7 132 A 6/23/05 15:18 14.48 >4 3 >4 >4 - 3 32.62 2.3 0.0 5.3 5.3 P ind ind 3 B 0 0.00 ind ind N 0 0.0
T7 132 B 6/23/05 15:18 14.47 >4 1 >4 >4 - 1 131.76 9.1 7.6 9.6 1.98 P 38.34 2.65 1 O 0 0.00 Stage I on III 9 N 0 0.0
T7 133 A 6/23/05 15:09 14.48 >4 1 >4 >4 - 1 196.2 13.5 13.1 14.0 0.85 P 20.02 1.38 0 0 0.00 Stage I 1 Y 6.4 6.5 1 0.2T7 133 B 6/23/05 15:10 14.46 >4 0 >4 >4 - 0 167.66 11.6 10.9 11.9 0.97 P 24.75 1.71 0 0 0.00 Stage I 4 N 0 0.0
T7 134 B 6/23/05 15:06 14.46 >4 1 >4 >4 - 1 282.75 19.6 19.1 19.9 0.83 P 40.6 2.81 0 3 11.7 11.65 Stage III 7 Y 12.9 19.8 2 1.0
T7 134 C 6/23/05 15:06 14.48 >4 1 >4 >4 - 1 290.99 20.1 19.1 21.0 1.85 P 20.79 1.44 0 0 0.00 Stage I 1 Y 4.3 18.0 26 3.3
T7 135 A 6/23/05 15:14 14.48 >4 2 >4 >4 - 2 217.55 15.0 13.6 16.0 2.34 P 16.29 1.13 2 R 1 13.4 13.4 13.39 Stage I on III 5 Y 11.6 11.6 1 0.4
T7 135 B 6/23/05 15:15 14.48 >4 2 >4 >4 - 2 198.54 13.7 13.3 14.4 1.1 P 23.21 1.60 8 B 4 8.3 12.5 10.40 Stage I on III 6 Y 10.8 13.5 3 0.3
T8 136 A 6/23/05 15:30 14.46 >4 2 >4 >4 - 2 225.94 15.6 15.0 16.6 1.59 P 46.33 3.20 0 0 0.00 Stage I 6 N 0 0.0
T8 136 C 6/23/05 15:31 14.5 >4 1 >4 >4 - 1 224.32 15.5 14.7 16.3 1.58 P 20.83 1.44 1 R 4 7.8 14.8 11.27 Stage I on III 7 N 0 0.0T8 137 A 6/23/05 15:50 14.46 -2 <-2 >4 >4 - <-2 4.35 0.3 0.0 1.1 1.1 P ind ind ind 0.00 ind ind N 0 0.0T8 137 B 6/23/05 15:50 14.43 -4 <-4 <-1 <-1 - <-4 0 0.0 0.0 0.0 0 P ind ind ind 0.00 ind ind N 0 0.0
T8 138 A 6/23/05 15:38 14.49 2-1 0 >4 >4 - 0 154.39 10.7 10.4 11.1 0.7 P 11.86 0.82 0 1 7.0 7.0 6.98 Stage II -> III 6 N 0 0.0
T8 138 B 6/23/05 15:38 14.49 -4 -1 >4 >4 - -1 148.55 10.3 9.7 11.2 1.57 P 39.66 2.74 0 0 0.00 Stage II -> III 6 Y 3.8 9.5 13 1.9
T8 139 A 6/23/05 15:34 14.48 >4 2 >4 >4 - 2 244.1 16.9 16.5 17.2 0.75 B 9.48 0.65 2 R 0 0.00 Stage I 2 N 0 0.0
T8 139 B 6/23/05 15:35 14.44 >4 2 >4 >4 - 2 247.09 17.1 16.9 17.3 0.45 B 24.45 1.69 0 0 0.00 Stage I 4 N 0 0.0
T8 140 A 6/23/05 15:46 14.47 >4 3 >4 >4 - 3 133.76 9.2 8.9 9.4 0.58 B 16.78 1.16 0 5 0.5 3.4 1.96 Stage II 3 Y 2.4 5.7 11 0.5
T8 140 C 6/23/05 15:47 14.48 >4 3 >4 >4 - 3 157.02 10.8 10.5 11.2 0.67 B 15.08 1.04 4 R 1 3.3 3.3 3.27 Stage II 5 N 0 0.0T9 141 B 6/23/05 16:04 14.48 <-1 <-1 <-1 <-1 - <-1 0 0.0 0.0 0.0 ind P Ind ind 0 ind 0.00 ind ind N 0 0.0
T9 141 C 6/23/05 16:05 14.5 <-1 <-1 >4 >4 - <-1 17.82 1.2 0.0 2.1 2.08 P Ind ind 0 ind 0.00 ind ind N 0 0.0
T9 142 C 6/23/05 16:31 14.48 >4 1 >4 >4 - 1 243.18 16.8 17.0 17.0 0 ind ind ind ind 0 0.00 ind ind Y 5.9 16.9 12 1.7
T9 142 E 6/23/05 16:33 14.48 >4 2 >4 >4 - 2 197.03 13.6 12.7 15.6 ind P ind ind 0 0 0.00 ind ind Y 5.2 5.2 1 0.1
T9 143 A 6/23/05 16:12 14.48 >4 1 >4 >4 - 1 160.48 11.1 10.7 11.7 0.98 P 25.28 1.75 0 2 1.8 4.1 2.95 Stage II -> III 5 Y 8.6 8.6 1 0.8
T9 143 B 6/23/05 16:13 14.48 >4 0 >4 >4 - 0 163.45 11.3 10.7 11.7 0.99 P 22.53 1.56 5 R 0 0.00 Stage II 4 Y 3.8 10.9 13 1.2
T9 144 B 6/23/05 16:09 14.49 >4 1 >4 >4 - 1 169.25 11.7 11.5 12.0 0.42 P 6.18 0.43 1 O 0 0.00 Stage I 0 Y 5.3 11.4 12 2.8
3
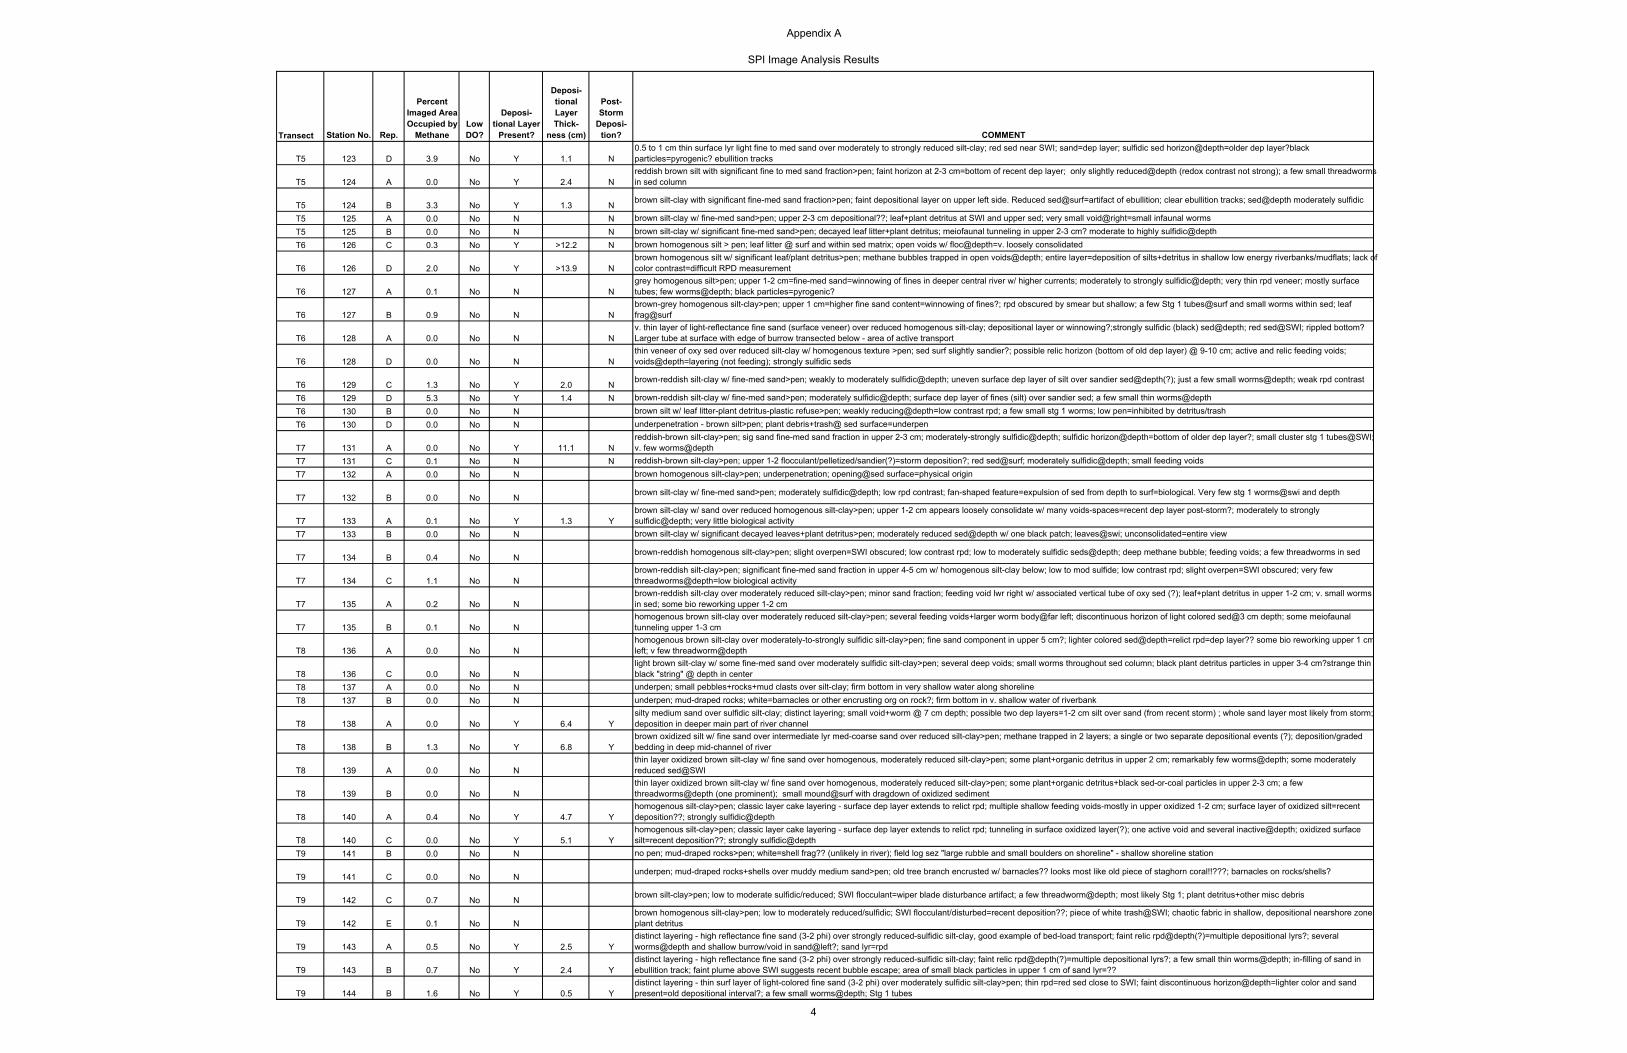
Appendix A
SPI Image Analysis Results
Transect Station No. Rep.
T5 123 D
T5 124 A
T5 124 BT5 125 AT5 125 BT6 126 C
T6 126 D
T6 127 A
T6 127 B
T6 128 A
T6 128 D
T6 129 CT6 129 DT6 130 BT6 130 D
T7 131 AT7 131 CT7 132 A
T7 132 B
T7 133 AT7 133 B
T7 134 B
T7 134 C
T7 135 A
T7 135 B
T8 136 A
T8 136 CT8 137 AT8 137 B
T8 138 A
T8 138 B
T8 139 A
T8 139 B
T8 140 A
T8 140 CT9 141 B
T9 141 C
T9 142 C
T9 142 E
T9 143 A
T9 143 B
T9 144 B
Percent Imaged Area Occupied by
MethaneLow DO?
Deposi-tional Layer
Present?
Deposi- tional Layer Thick-
ness (cm)
Post-Storm
Deposi-tion? COMMENT
3.9 No Y 1.1 N0.5 to 1 cm thin surface lyr light fine to med sand over moderately to strongly reduced silt-clay; red sed near SWI; sand=dep layer; sulfidic sed horizon@depth=older dep layer?black particles=pyrogenic? ebullition tracks
0.0 No Y 2.4 Nreddish brown silt with significant fine to med sand fraction>pen; faint horizon at 2-3 cm=bottom of recent dep layer; only slightly reduced@depth (redox contrast not strong); a few small threadworms in sed column
3.3 No Y 1.3 N brown silt-clay with significant fine-med sand fraction>pen; faint depositional layer on upper left side. Reduced sed@surf=artifact of ebullition; clear ebullition tracks; sed@depth moderately sulfidic
0.0 No N N brown silt-clay w/ fine-med sand>pen; upper 2-3 cm depositional??; leaf+plant detritus at SWI and upper sed; very small void@right=small infaunal worms0.0 No N N brown silt-clay w/ significant fine-med sand>pen; decayed leaf litter+plant detritus; meiofaunal tunneling in upper 2-3 cm? moderate to highly [email protected] No Y >12.2 N brown homogenous silt > pen; leaf litter @ surf and within sed matrix; open voids w/ floc@depth=v. loosely consolidated
2.0 No Y >13.9 Nbrown homogenous silt w/ significant leaf/plant detritus>pen; methane bubbles trapped in open voids@depth; entire layer=deposition of silts+detritus in shallow low energy riverbanks/mudflats; lack of color contrast=difficult RPD measurement
0.1 No N Ngrey homogenous silt>pen; upper 1-2 cm=fine-med sand=winnowing of fines in deeper central river w/ higher currents; moderately to strongly sulfidic@depth; very thin rpd veneer; mostly surface tubes; few worms@depth; black particles=pyrogenic?
0.9 No N Nbrown-grey homogenous silt-clay>pen; upper 1 cm=higher fine sand content=winnowing of fines?; rpd obscured by smear but shallow; a few Stg 1 tubes@surf and small worms within sed; leaf frag@surf
0.0 No N Nv. thin layer of light-reflectance fine sand (surface veneer) over reduced homogenous silt-clay; depositional layer or winnowing?;strongly sulfidic (black) sed@depth; red sed@SWI; rippled bottom? Larger tube at surface with edge of burrow transected below - area of active transport
0.0 No N Nthin veneer of oxy sed over reduced silt-clay w/ homogenous texture >pen; sed surf slightly sandier?; possible relic horizon (bottom of old dep layer) @ 9-10 cm; active and relic feeding voids; voids@depth=layering (not feeding); strongly sulfidic seds
1.3 No Y 2.0 N brown-reddish silt-clay w/ fine-med sand>pen; weakly to moderately sulfidic@depth; uneven surface dep layer of silt over sandier sed@depth(?); just a few small worms@depth; weak rpd contrast
5.3 No Y 1.4 N brown-reddish silt-clay w/ fine-med sand>pen; moderately sulfidic@depth; surface dep layer of fines (silt) over sandier sed; a few small thin [email protected] No N brown silt w/ leaf litter-plant detritus-plastic refuse>pen; weakly reducing@depth=low contrast rpd; a few small stg 1 worms; low pen=inhibited by detritus/trash0.0 No N underpenetration - brown silt>pen; plant debris+trash@ sed surface=underpen
0.0 No Y 11.1 Nreddish-brown silt-clay>pen; sig sand fine-med sand fraction in upper 2-3 cm; moderately-strongly sulfidic@depth; sulfidic horizon@depth=bottom of older dep layer?; small cluster stg 1 tubes@SWI; v. few worms@depth
0.1 No N N reddish-brown silt-clay>pen; upper 1-2 flocculant/pelletized/sandier(?)=storm deposition?; red sed@surf; moderately sulfidic@depth; small feeding voids0.0 No N brown homogenous silt-clay>pen; underpenetration; opening@sed surface=physical origin
0.0 No N brown silt-clay w/ fine-med sand>pen; moderately sulfidic@depth; low rpd contrast; fan-shaped feature=expulsion of sed from depth to surf=biological. Very few stg 1 worms@swi and depth
0.1 No Y 1.3 Ybrown silt-clay w/ sand over reduced homogenous silt-clay>pen; upper 1-2 cm appears loosely consolidate w/ many voids-spaces=recent dep layer post-storm?; moderately to strongly sulfidic@depth; very little biological activity
0.0 No N brown silt-clay w/ significant decayed leaves+plant detritus>pen; moderately reduced sed@depth w/ one black patch; leaves@swi; unconsolidated=entire view
0.4 No N brown-reddish homogenous silt-clay>pen; slight overpen=SWI obscured; low contrast rpd; low to moderately sulfidic seds@depth; deep methane bubble; feeding voids; a few threadworms in sed
1.1 No Nbrown-reddish silt-clay>pen; significant fine-med sand fraction in upper 4-5 cm w/ homogenous silt-clay below; low to mod sulfide; low contrast rpd; slight overpen=SWI obscured; very few threadworms@depth=low biological activity
0.2 No Nbrown-reddish silt-clay over moderately reduced silt-clay>pen; minor sand fraction; feeding void lwr right w/ associated vertical tube of oxy sed (?); leaf+plant detritus in upper 1-2 cm; v. small worms in sed; some bio reworking upper 1-2 cm
0.1 No Nhomogenous brown silt-clay over moderately reduced silt-clay>pen; several feeding voids+larger worm body@far left; discontinuous horizon of light colored sed@3 cm depth; some meiofaunal tunneling upper 1-3 cm
0.0 No Nhomogenous brown silt-clay over moderately-to-strongly sulfidic silt-clay>pen; fine sand component in upper 5 cm?; lighter colored sed@depth=relict rpd=dep layer?? some bio reworking upper 1 cm left; v few threadworm@depth
0.0 No Nlight brown silt-clay w/ some fine-med sand over moderately sulfidic silt-clay>pen; several deep voids; small worms throughout sed column; black plant detritus particles in upper 3-4 cm?strange thin black "string" @ depth in center
0.0 No N underpen; small pebbles+rocks+mud clasts over silt-clay; firm bottom in very shallow water along shoreline 0.0 No N underpen; mud-draped rocks; white=barnacles or other encrusting org on rock?; firm bottom in v. shallow water of riverbank
0.0 No Y 6.4 Ysilty medium sand over sulfidic silt-clay; distinct layering; small void+worm @ 7 cm depth; possible two dep layers=1-2 cm silt over sand (from recent storm) ; whole sand layer most likely from storm; deposition in deeper main part of river channel
1.3 No Y 6.8 Ybrown oxidized silt w/ fine sand over intermediate lyr med-coarse sand over reduced silt-clay>pen; methane trapped in 2 layers; a single or two separate depositional events (?); deposition/graded bedding in deep mid-channel of river
0.0 No Nthin layer oxidized brown silt-clay w/ fine sand over homogenous, moderately reduced silt-clay>pen; some plant+organic detritus in upper 2 cm; remarkably few worms@depth; some moderately reduced sed@SWI
0.0 No Nthin layer oxidized brown silt-clay w/ fine sand over homogenous, moderately reduced silt-clay>pen; some plant+organic detritus+black sed-or-coal particles in upper 2-3 cm; a few threadworms@depth (one prominent); small mound@surf with dragdown of oxidized sediment
0.4 No Y 4.7 Yhomogenous silt-clay>pen; classic layer cake layering - surface dep layer extends to relict rpd; multiple shallow feeding voids-mostly in upper oxidized 1-2 cm; surface layer of oxidized silt=recent deposition??; strongly sulfidic@depth
0.0 No Y 5.1 Yhomogenous silt-clay>pen; classic layer cake layering - surface dep layer extends to relict rpd; tunneling in surface oxidized layer(?); one active void and several inactive@depth; oxidized surface silt=recent deposition??; strongly sulfidic@depth
0.0 No N no pen; mud-draped rocks>pen; white=shell frag?? (unlikely in river); field log sez "large rubble and small boulders on shoreline" - shallow shoreline station
0.0 No N underpen; mud-draped rocks+shells over muddy medium sand>pen; old tree branch encrusted w/ barnacles?? looks most like old piece of staghorn coral!!???; barnacles on rocks/shells?
0.7 No N brown silt-clay>pen; low to moderate sulfidic/reduced; SWI flocculant=wiper blade disturbance artifact; a few threadworm@depth; most likely Stg 1; plant detritus+other misc debris
0.1 No Nbrown homogenous silt-clay>pen; low to moderately reduced/sulfidic; SWI flocculant/disturbed=recent deposition??; piece of white trash@SWI; chaotic fabric in shallow, depositional nearshore zone; plant detritus
0.5 No Y 2.5 Ydistinct layering - high reflectance fine sand (3-2 phi) over strongly reduced-sulfidic silt-clay, good example of bed-load transport; faint relic rpd@depth(?)=multiple depositional lyrs?; several worms@depth and shallow burrow/void in sand@left?; sand lyr=rpd
0.7 No Y 2.4 Ydistinct layering - high reflectance fine sand (3-2 phi) over strongly reduced-sulfidic silt-clay; faint relic rpd@depth(?)=multiple depositional lyrs?; a few small thin worms@depth; in-filling of sand in ebullition track; faint plume above SWI suggests recent bubble escape; area of small black particles in upper 1 cm of sand lyr=??
1.6 No Y 0.5 Ydistinct layering - thin surf layer of light-colored fine sand (3-2 phi) over moderately sulfidic silt-clay>pen; thin rpd=red sed close to SWI; faint discontinuous horizon@depth=lighter color and sand present=old depositional interval?; a few small worms@depth; Stg 1 tubes
4

Appendix A
SPI Image Analysis Results
Transect Station No. Rep. Date TimeCalibration Constant
Grain Size Major
Mode (phi)
Grain Size Max. (phi)
Grain Size Min.
(phi)
Grain Size
Range (phi)
Total Area of Imaged
Sediment (sq. cm)
Avg. Prism Penetration Depth (cm)
Min. Prism Pen.
Depth (cm)
Max. Prism Pen.
Depth (cm)
Boundary Roughness
(cm)
Origin of Boundary
Roughness (Physical or
Biogenic)RPD Area
(cm2)
Mean RPD (cm)
No. Mud Clasts
Mud Clasts Oxidized
Reduced or Both?
No. Feed-ing Voids
Feed- ing Void
Min. Depth (cm)
Feed- ing Void Max.
Depth (cm)
Feed- ing Void
Avg. Depth (cm)
Successional Stage
Organism-Sediment
Index (OSI)Methane Present?
Methane Min. Depth (cm)
Methane Max. Depth
(cm)
No. Methane Bubbles
Total area all bubbles
(cm2)
T9 144 C 6/23/05 16:10 14.48 >4-3 0 >4 >4 - 0 144.39 10.0 9.6 11.2 1.65 P 36.43 2.52 15 R 2 3.5 5.5 4.49 Stage II 5 Y 3.4 9.3 5 0.6
T9 145 B 6/23/05 16:19 14.49 >4 2 >4 >4 - 2 140.12 9.7 12.7 13.2 0.56 P ind ind 0 0 0.00 ind ind N 0.0 0.0
T9 145 C 6/23/05 16:22 14.49 >4 2 >4 >4 - 2 225.79 15.6 14.0 16.9 2.92 P ind ind 0 0 0.00 ind ind N 0.0 0.0T10 146 A 6/23/05 17:06 14.48 ind ind ind ind ind ind 0.0 0.0 0 ind ind ind ind na 0.00 ind ind N 0.0 0.0T10 146 B 6/23/05 17:07 14.45 ind ind >4 ind 9.59 0.7 0.0 1.6 1.63 P ind ind 0 na 0.00 ind ind N 0.0 0.0
T10 147 A 6/23/05 16:43 14.48 >4 2 >4 >4 - 2 216.37 14.9 14.5 16.0 1.53 P 2.64 0.18 2 R 0 0.00 Stage I 0 Y 0.7 15.1 36.0 10.0
T10 147 B 6/23/05 16:44 14.48 >4 3 >4 >4 - 3 189.41 13.1 12.3 14.0 1.69 P 13.09 0.90 2 O 0 0.00 Stage I 1 Y 1.3 13.6 26.0 5.8
T10 148 B 6/23/05 16:55 14.48 >4 0 >4 >4 - 0 126.1 8.7 6.4 10.1 3.61 P 12.95 0.89 0 1 3.2 3.2 3.18 Stage II 5 N 0.0 0.0
T10 148 D 6/23/05 16:57 14.5 >4 2 >4 >4 - 2 61.6 4.2 3.7 5.4 1.71 P 20.17 1.39 0 1 0.8 0.8 0.83 Stage II 5 N 0.0 0.0
T10 149 B 6/23/05 17:02 14.5 >4 3 >4 >4 - 3 29.99 2.1 1.5 2.6 1.18 P 29.99 2.07 1 R 0 0.00 Stage II -> III 7 N 0.0 0.0T10 149 C 6/23/05 17:03 14.47 >4 0 >4 >4 - 0 90.38 6.2 5.9 6.6 0.73 B 28.55 1.97 0 0 0.00 Stage II -> III 7 N 0.0 0.0
T10 150 A 6/23/05 16:49 14.48 >4 3 >4 >4 - 3 179.44 12.4 12.1 12.7 0.62 B 14.82 1.02 0 0 0.00 Stage I 1 Y 2.6 11.4 21.0 5.6
T10 150 C 6/23/05 16:50 14.5 >4 2 >4 >4 - 2 175.72 12.1 12.1 12.5 0.43 P 11.48 0.79 0 0 0.00 Stage I 1 Y 2.1 11.8 28.0 5.8
T11 151 A 6/23/05 17:19 14.48 >4 2 >4 >4 - 2 205.07 14.2 13.2 15.14 1.94 P 15.5 1.07 0 0 0.00 Stage I 1 Y 12.92 13.16 5 1.14
T11 151 B 6/23/05 17:20 14.48 >4 2 >4 >4 - 2 211.06 14.6 12.89 15.67 2.78 P 29.53 2.04 0 0 0.00 Stage I 4 N 0 0
T11 152 A 6/23/05 17:38 14.49 4-3 2 >4 >4 - 2 189.22 13.1 12.59 13.62 1.03 P 10.7 0.74 0 0 0.00 Stage I 0 Y 1.38 13.27 35 4.62
T11 152 B 6/23/05 17:38 14.48 4-3/>4 1 >4 >4 - 1 211.11 14.6 14.19 15.04 0.85 P 24.82 1.71 2 B 0 0.00 Stage I 2 Y 6.98 14.78 15 1.24
T11 153 B 6/23/05 17:30 14.48 >4 0 >4 >4 - 0 99.86 6.9 6.64 7.36 0.72 P 25.53 1.76 0 2 2.69 5.5 4.10 Stage I on III 8 N 0 0
T11 153 C 6/23/05 17:30 14.46 >4 0 >4 >4 - 0 135.59 9.4 9.04 9.71 0.67 P 28.71 1.99 0 0 0.00 Stage I -> II 3 Y 1.83 3.42 2 0.12
T11 154 A 6/23/05 17:24 14.45 >4 1 >4 >4 - 1 236.48 16.4 15.86 16.55 0.69 P 23.34 1.62 0 0 0.00 Stage II 6 N 0 0
T11 154 C 6/23/05 17:25 14.48 >4 1 >4 >4 - 1 217.33 15.0 14.53 15.4 0.87 P 21.02 1.45 0 0 0.00 Stage I 3 N 0 0
T11 155 A 6/23/05 17:34 14.5 >4 0 >4 >4 - 0 162.81 11.2 10.88 11.45 0.57 P 23.04 1.59 0 0 0.00 Stage I 2 Y 4.9 >11.07 8 1.67
T11 155 C 6/23/05 17:35 14.5 >4 3 >4 >4 - 3 105.25 7.3 5.66 8.84 3.18 p 54.93 3.79 0 0 0.00 Stage I 7 N 0 0T12 156 A 6/23/05 17:47 14.47 ind ind ind ind - ind 0 0.0 0 0 0 ind ind ind ind 0.00 ind ind ind 0 0T12 156 B 6/23/05 17:48 14.47 ind ind ind ind - ind 0 0.0 0 0 0 ind ind ind ind 0.00 ind ind ind 0 0
T12 157 A 6/23/05 18:10 14.47 >4 2 >4 >4 - 2 144.97 10.0 9.77 10.33 0.56 B 12.48 0.86 0 1 3.62 3.62 3.62 Stage I on III 7 N 0 0
T12 157 C 6/23/05 18:12 14.49 >4-3 1 >4 >4 - 1 220.48 15.2 13.82 16.11 2.29 P 13.28 0.92 ind 2 12.8 13.2 13.00 Stage I on III 7 N 0 0T12 158 A 6/23/05 18:00 14.47 ind ind ind ind 0 0.0 0 0 0 ind ind ind ind 0.00 ind ind ind 0 0T12 158 B 6/23/05 18:01 14.47 ind ind ind ind 0 0.0 0 0 0 ind ind ind ind 0.00 ind ind ind 0 0T12 159 A 6/23/05 17:52 14.47 ind ind ind ind 0 0.0 0 0 0 ind ind ind ind 0.00 ind ind ind 0 0T12 159 B 6/23/05 17:53 14.47 ind ind ind ind 0 0.0 0 0 0 ind ind ind ind 0.00 ind ind ind 0 0
T12 160 A 6/23/05 18:05 14.48 >4 2 >4 >4 - 2 171.8 11.9 2.74 15.52 12.78 p 8.56 0.59 0 0 0.00 Stage I -> II 1 Y 0.84 15 20 2.68T12 160 C 6/23/05 18:07 14.48 >4 2 >4 >4 - 2 299.46 20.7 20.61 20.83 ind ind ind ind ind 0 0.00 ind ind Y 1.08 17.47 34 5.78
T13 96 B 6/21/05 16:03 14.48 >4 -2 >4 >4 - -2 101.39 7.0 6.08 7.99 1.91 ind ind ind ind 0 0.00 ind ind Y 3.97 6.6 6 1.36
T13 96 C 6/21/05 16:04 14.48 >4 0 >4 >4 - 0 199.63 13.8 13.28 14.11 0.83 B 29.64 2.05 1 R 2 8.1 10.42 9.26 Stage I on III 6 Y 10.22 13.61 4 0.25
T13 97 B 6/21/05 15:33 14.45 >4 2 >4 >4 - 2 270.91 18.7 17.78 18.74 0.96 P 11.65 0.81 0 0 0.00 Stage I 1 Y 3.01 18.47 48 27.3
T13 97 C 6/21/05 15:34 14.48 >4 2 >4 >4 - 2 260.1 18.0 16.73 18.96 2.23 P 10.17 0.70 0 0 0.00 Stage II 2 Y 5.99 18.77 37 10.17T13 98 B 6/21/05 15:46 14.47 >4 3 >4 >4 - 3 17.82 1.2 0.83 1.46 0.63 P ind ind 0 0 0.00 Stage I ind N 0 0T13 98 C 6/21/05 15:51 14.5 >4 3 >4 >4 - 3 12.36 0.9 0.4 1.47 1.07 P ind ind 0 0 0.00 Stage I ind N 0 0T13 99 B 6/21/05 15:56 14.47 >4 -3 >4 >4 - -3 5.86 0.4 0 1.02 1.02 P ind ind 0 0 0.00 ind ind N 0 0T13 99 C 6/21/05 15:57 14.5 >4 3 >4 >4 - 3 22.37 1.5 1.01 2.26 1.25 B ind ind 1 R 0 0.00 Stage I ind N 0 0T13 100 A 6/21/05 15:38 14.47 4-3 0 >4 >4 - 0 68.41 4.7 3.94 5.55 1.61 P 10.35 0.72 0 0 0.00 Stage I 0 Y 1.34 4.07 12 0.65
T13 100 B 6/21/05 15:39 14.47 3-2 0 >4 >4 - 0 61.36 4.2 3.59 4.69 1.1 P 29.99 2.07 2 R 0 0.00 Stage I 4 N 0 0
5
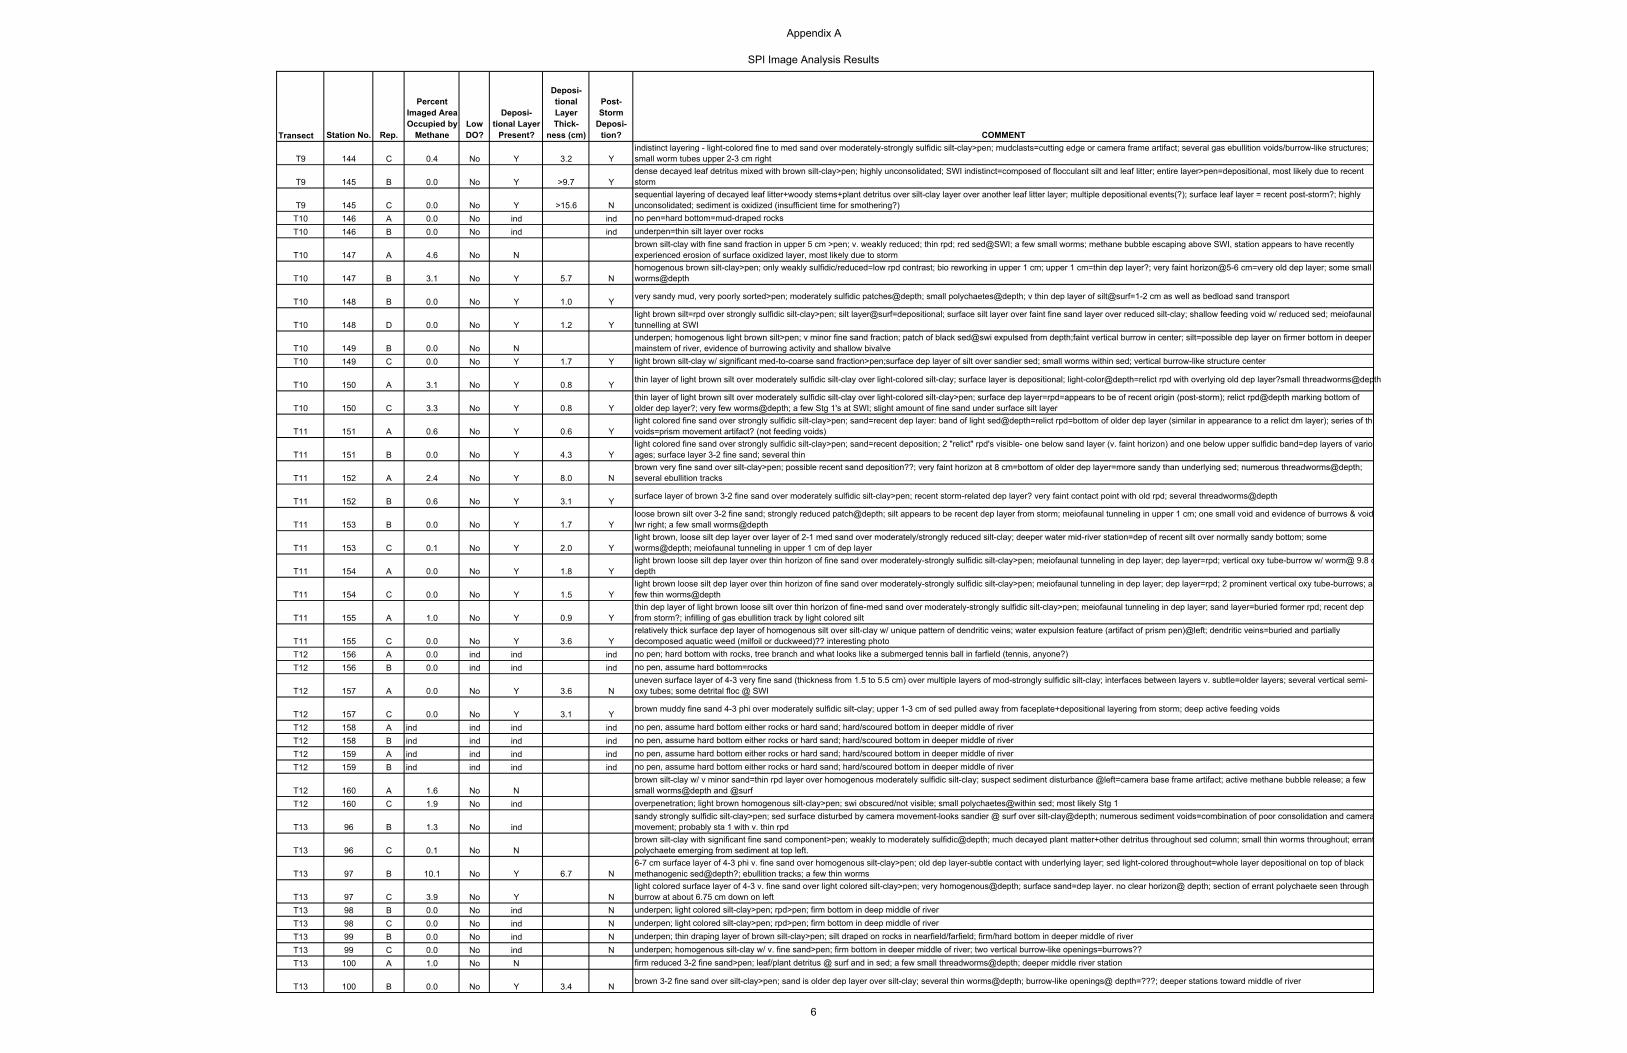
Appendix A
SPI Image Analysis Results
Transect Station No. Rep.
T9 144 C
T9 145 B
T9 145 CT10 146 AT10 146 B
T10 147 A
T10 147 B
T10 148 B
T10 148 D
T10 149 BT10 149 C
T10 150 A
T10 150 C
T11 151 A
T11 151 B
T11 152 A
T11 152 B
T11 153 B
T11 153 C
T11 154 A
T11 154 C
T11 155 A
T11 155 CT12 156 AT12 156 B
T12 157 A
T12 157 CT12 158 AT12 158 BT12 159 AT12 159 B
T12 160 AT12 160 C
T13 96 B
T13 96 C
T13 97 B
T13 97 CT13 98 BT13 98 CT13 99 BT13 99 CT13 100 A
T13 100 B
Percent Imaged Area Occupied by
MethaneLow DO?
Deposi-tional Layer
Present?
Deposi- tional Layer Thick-
ness (cm)
Post-Storm
Deposi-tion? COMMENT
0.4 No Y 3.2 Yindistinct layering - light-colored fine to med sand over moderately-strongly sulfidic silt-clay>pen; mudclasts=cutting edge or camera frame artifact; several gas ebullition voids/burrow-like structures; small worm tubes upper 2-3 cm right
0.0 No Y >9.7 Ydense decayed leaf detritus mixed with brown silt-clay>pen; highly unconsolidated; SWI indistinct=composed of flocculant silt and leaf litter; entire layer>pen=depositional, most likely due to recent storm
0.0 No Y >15.6 Nsequential layering of decayed leaf litter+woody stems+plant detritus over silt-clay layer over another leaf litter layer; multiple depositional events(?); surface leaf layer = recent post-storm?; highly unconsolidated; sediment is oxidized (insufficient time for smothering?)
0.0 No ind ind no pen=hard bottom=mud-draped rocks0.0 No ind ind underpen=thin silt layer over rocks
4.6 No Nbrown silt-clay with fine sand fraction in upper 5 cm >pen; v. weakly reduced; thin rpd; red sed@SWI; a few small worms; methane bubble escaping above SWI, station appears to have recently experienced erosion of surface oxidized layer, most likely due to storm
3.1 No Y 5.7 Nhomogenous brown silt-clay>pen; only weakly sulfidic/reduced=low rpd contrast; bio reworking in upper 1 cm; upper 1 cm=thin dep layer?; very faint horizon@5-6 cm=very old dep layer; some small worms@depth
0.0 No Y 1.0 Y very sandy mud, very poorly sorted>pen; moderately sulfidic patches@depth; small polychaetes@depth; v thin dep layer of silt@surf=1-2 cm as well as bedload sand transport
0.0 No Y 1.2 Ylight brown silt=rpd over strongly sulfidic silt-clay>pen; silt layer@surf=depositional; surface silt layer over faint fine sand layer over reduced silt-clay; shallow feeding void w/ reduced sed; meiofaunal tunnelling at SWI
0.0 No Nunderpen; homogenous light brown silt>pen; v minor fine sand fraction; patch of black sed@swi expulsed from depth;faint vertical burrow in center; silt=possible dep layer on firmer bottom in deeper mainstem of river, evidence of burrowing activity and shallow bivalve
0.0 No Y 1.7 Y light brown silt-clay w/ significant med-to-coarse sand fraction>pen;surface dep layer of silt over sandier sed; small worms within sed; vertical burrow-like structure center
3.1 No Y 0.8 Y thin layer of light brown silt over moderately sulfidic silt-clay over light-colored silt-clay; surface layer is depositional; light-color@depth=relict rpd with overlying old dep layer?small threadworms@depth
3.3 No Y 0.8 Ythin layer of light brown silt over moderately sulfidic silt-clay over light-colored silt-clay>pen; surface dep layer=rpd=appears to be of recent origin (post-storm); relict rpd@depth marking bottom of older dep layer?; very few worms@depth; a few Stg 1's at SWI; slight amount of fine sand under surface silt layer
0.6 No Y 0.6 Ylight colored fine sand over strongly sulfidic silt-clay>pen; sand=recent dep layer: band of light sed@depth=relict rpd=bottom of older dep layer (similar in appearance to a relict dm layer); series of thivoids=prism movement artifact? (not feeding voids)
0.0 No Y 4.3 Ylight colored fine sand over strongly sulfidic silt-clay>pen; sand=recent deposition; 2 "relict" rpd's visible- one below sand layer (v. faint horizon) and one below upper sulfidic band=dep layers of varioages; surface layer 3-2 fine sand; several thin
2.4 No Y 8.0 Nbrown very fine sand over silt-clay>pen; possible recent sand deposition??; very faint horizon at 8 cm=bottom of older dep layer=more sandy than underlying sed; numerous threadworms@depth; several ebullition tracks
0.6 No Y 3.1 Y surface layer of brown 3-2 fine sand over moderately sulfidic silt-clay>pen; recent storm-related dep layer? very faint contact point with old rpd; several threadworms@depth
0.0 No Y 1.7 Yloose brown silt over 3-2 fine sand; strongly reduced patch@depth; silt appears to be recent dep layer from storm; meiofaunal tunneling in upper 1 cm; one small void and evidence of burrows & void lwr right; a few small worms@depth
0.1 No Y 2.0 Ylight brown, loose silt dep layer over layer of 2-1 med sand over moderately/strongly reduced silt-clay; deeper water mid-river station=dep of recent silt over normally sandy bottom; some worms@depth; meiofaunal tunneling in upper 1 cm of dep layer
0.0 No Y 1.8 Ylight brown loose silt dep layer over thin horizon of fine sand over moderately-strongly sulfidic silt-clay>pen; meiofaunal tunneling in dep layer; dep layer=rpd; vertical oxy tube-burrow w/ worm@ 9.8 cdepth
0.0 No Y 1.5 Ylight brown loose silt dep layer over thin horizon of fine sand over moderately-strongly sulfidic silt-clay>pen; meiofaunal tunneling in dep layer; dep layer=rpd; 2 prominent vertical oxy tube-burrows; a few thin worms@depth
1.0 No Y 0.9 Ythin dep layer of light brown loose silt over thin horizon of fine-med sand over moderately-strongly sulfidic silt-clay>pen; meiofaunal tunneling in dep layer; sand layer=buried former rpd; recent dep from storm?; infilling of gas ebullition track by light colored silt
0.0 No Y 3.6 Yrelatively thick surface dep layer of homogenous silt over silt-clay w/ unique pattern of dendritic veins; water expulsion feature (artifact of prism pen)@left; dendritic veins=buried and partially decomposed aquatic weed (milfoil or duckweed)?? interesting photo
0.0 ind ind ind no pen; hard bottom with rocks, tree branch and what looks like a submerged tennis ball in farfield (tennis, anyone?)0.0 ind ind ind no pen, assume hard bottom=rocks
0.0 No Y 3.6 Nuneven surface layer of 4-3 very fine sand (thickness from 1.5 to 5.5 cm) over multiple layers of mod-strongly sulfidic silt-clay; interfaces between layers v. subtle=older layers; several vertical semi-oxy tubes; some detrital floc @ SWI
0.0 No Y 3.1 Y brown muddy fine sand 4-3 phi over moderately sulfidic silt-clay; upper 1-3 cm of sed pulled away from faceplate+depositional layering from storm; deep active feeding voids
ind ind ind ind no pen, assume hard bottom either rocks or hard sand; hard/scoured bottom in deeper middle of riverind ind ind ind no pen, assume hard bottom either rocks or hard sand; hard/scoured bottom in deeper middle of riverind ind ind ind no pen, assume hard bottom either rocks or hard sand; hard/scoured bottom in deeper middle of riverind ind ind ind no pen, assume hard bottom either rocks or hard sand; hard/scoured bottom in deeper middle of river
1.6 No Nbrown silt-clay w/ v minor sand=thin rpd layer over homogenous moderately sulfidic silt-clay; suspect sediment disturbance @left=camera base frame artifact; active methane bubble release; a few small worms@depth and @surf
1.9 No ind overpenetration; light brown homogenous silt-clay>pen; swi obscured/not visible; small polychaetes@within sed; most likely Stg 1
1.3 No indsandy strongly sulfidic silt-clay>pen; sed surface disturbed by camera movement-looks sandier @ surf over silt-clay@depth; numerous sediment voids=combination of poor consolidation and camera movement; probably sta 1 with v. thin rpd
0.1 No Nbrown silt-clay with significant fine sand component>pen; weakly to moderately sulfidic@depth; much decayed plant matter+other detritus throughout sed column; small thin worms throughout; errant polychaete emerging from sediment at top left.
10.1 No Y 6.7 N6-7 cm surface layer of 4-3 phi v. fine sand over homogenous silt-clay>pen; old dep layer-subtle contact with underlying layer; sed light-colored throughout=whole layer depositional on top of black methanogenic sed@depth?; ebullition tracks; a few thin worms
3.9 No Y Nlight colored surface layer of 4-3 v. fine sand over light colored silt-clay>pen; very homogenous@depth; surface sand=dep layer. no clear horizon@ depth; section of errant polychaete seen through burrow at about 6.75 cm down on left
0.0 No ind N underpen; light colored silt-clay>pen; rpd>pen; firm bottom in deep middle of river0.0 No ind N underpen; light colored silt-clay>pen; rpd>pen; firm bottom in deep middle of river0.0 No ind N underpen; thin draping layer of brown silt-clay>pen; silt draped on rocks in nearfield/farfield; firm/hard bottom in deeper middle of river0.0 No ind N underpen; homogenous silt-clay w/ v. fine sand>pen; firm bottom in deeper middle of river; two vertical burrow-like openings=burrows??1.0 No N firm reduced 3-2 fine sand>pen; leaf/plant detritus @ surf and in sed; a few small threadworms@depth; deeper middle river station
0.0 No Y 3.4 N brown 3-2 fine sand over silt-clay>pen; sand is older dep layer over silt-clay; several thin worms@depth; burrow-like openings@ depth=???; deeper stations toward middle of river
6

Appendix A
SPI Image Analysis Results
Transect Station No. Rep. Date TimeCalibration Constant
Grain Size Major
Mode (phi)
Grain Size Max. (phi)
Grain Size Min.
(phi)
Grain Size
Range (phi)
Total Area of Imaged
Sediment (sq. cm)
Avg. Prism Penetration Depth (cm)
Min. Prism Pen.
Depth (cm)
Max. Prism Pen.
Depth (cm)
Boundary Roughness
(cm)
Origin of Boundary
Roughness (Physical or
Biogenic)RPD Area
(cm2)
Mean RPD (cm)
No. Mud Clasts
Mud Clasts Oxidized
Reduced or Both?
No. Feed-ing Voids
Feed- ing Void
Min. Depth (cm)
Feed- ing Void Max.
Depth (cm)
Feed- ing Void
Avg. Depth (cm)
Successional Stage
Organism-Sediment
Index (OSI)Methane Present?
Methane Min. Depth (cm)
Methane Max. Depth
(cm)
No. Methane Bubbles
Total area all bubbles
(cm2)
T14 91 B 6/21/05 16:39 14.48 >4 3 >4 >4 - 3 297.57 20.6 20.78 20.78 0 ind ind ind 0 0 0.00 ind ind Y 0.56 20.35 23 2.25
T14 91 D 6/21/05 16:50 14.48 >4 2 >4 >4 - 2 272.68 18.8 18.45 19.35 0.9 P 33.38 2.31 0 0 0.00 Stage I 3 Y 1.29 17.99 36 9.24
T14 92 A 6/21/05 16:15 14.45 >4 1 >4 >4 - 1 256.31 17.7 17.43 17.92 0.49 P 31.5 2.18 0 0 0.00 Stage I 2 Y 3.4 17.86 48 17.36
T14 92 D 6/21/05 16:18 14.48 >4 1 >4 >4 - 1 263.79 18.2 18.11 18.6 0.49 B 27.8 1.92 0 0 0.00 Stage I 2 Y 5.21 18.2 43 17.48T14 93 A 6/21/05 16:26 14.46 Ind -5 >4 >4 - -5 5.89 0.4 0 1.08 1.08 P ind ind 0 0 0.00 ind ind N 0 0T14 93 B 6/21/05 16:27 14.45 >4 -2 >4 >4 - -2 23.92 1.7 0 2.98 2.98 P ind ind 0 0 0.00 ind ind N 0 0
T14 94 A 6/21/05 16:31 14.47 >4 2 >4 >4 - 2 182.25 12.6 11.86 13.63 1.77 P 9.62 0.66 0 0 0.00 Stage I 0 Y 1.12 11.56 25 7.46
T14 94 B 6/21/05 16:32 14.48 >4 2 >4 >4 - 2 150.23 10.4 9.47 11.07 1.6 P 23.33 1.61 0 0 0.00 Stage I 2 Y 1.65 6.24 12 4.35
T14 95 A 6/21/05 16:22 14.48 >4/4-3 0 >4 >4 - 0 72.33 5.0 4.51 6.06 1.55 P 29.13 2.01 0 0 0.00 Stage I -> II 5 N 0 0
T14 95 B 6/21/05 16:23 14.44 >4-3 1 >4 >4 - 1 65.49 4.5 4.23 5.24 1.01 P 22.27 1.54 0 0 0.00 Stage I -> II 3 Y 4.55 4.55 2 0.68
T15 56 B 6/21/05 16:51 14.47 >4 2 >4 >4 - 2 238.08 16.5 16.31 16.73 0.42 P 16.62 1.15 0 0 0.00 Stage I 1 Y 1.08 16.44 50 7.75
T15 56 C 6/21/05 16:53 14.45 >4 2 >4 >4 - 2 222.89 15.4 14.82 16 1.18 P 20.57 1.42 0 0 0.00 Stage I 1 Y 1.79 15.62 57 11.67T15 57 A 6/21/05 17:16 14.48 ind ind ind ind - ind ind ind ind ind ind ind ind ind ind ind ind ind ind ind ind ind ind ind 0 0T15 57 F 6/21/05 17:22 14.48 ind ind ind ind - ind ind ind ind ind ind ind ind ind ind ind ind ind ind ind ind ind ind ind 0 0T15 58 A 6/21/05 17:05 14.45 >4/4-3 0 >4 >4 - 0 47.89 3.3 1.48 4.58 3.1 P 30.28 2.10 3 O 0 0.00 Stage I 4 N 0 0T15 58 C 6/21/05 17:06 14.43 >4/4-3 0 >4 >4 - 0 46.19 3.2 1.68 3.96 2.28 P 30.3 2.10 8 O 0.00 Stage I 4 N 0 0
T15 59 A 6/21/05 17:01 14.49 >4 2 >4 >4 - 2 249.57 17.2 17.26 17.26 0 ind ind ind ind 0 0.00 Stage I ind Y 1.88 17.26 68 15.09
T15 59 B 6/21/05 17:01 14.49 >4 2 >4 >4 - 2 240.33 16.6 16.55 16.55 0 ind ind ind ind 0 0.00 Stage I ind Y 1.32 16.5 47 7.86
T15 60 A 6/21/05 17:10 14.48 >4 1 >4 >4 - 1 156.49 10.8 10.46 11.21 0.75 P 17.18 1.19 0 0 0.00 Stage I 1 Y 3.53 10.4 8 1.73
T15 60 B 6/21/05 17:11 14.46 >4 1 >4 >4 - 1 118.09 8.2 7.4 8.89 1.49 P 25.35 1.75 3 B 0 0.00 Stage II -> III 5 Y 1.15 3.17 2 0.04
T16 51 A 6/20/05 11:38 14.5 >4 2 >4 >4 - 2 165.91 11.4 10.95 11.96 1.01 P 19.17 1.32 4 O 0 0.00 Stage I 1 Y 0.47 11.54 15 1.42
T16 51 B 6/20/05 11:39 14.49 >4 1 >4 >4 - 1 239.82 16.6 14.9 17.36 2.46 P 17.2 1.19 0 0 0.00 Stage I 1 Y 0.1 17.02 41 9.5
T16 52 A 6/20/05 11:11 14.45 >4-3/>4 1 >4 >4 - 1 257.34 17.8 17.49 18.4 0.91 P 41.84 2.90 0 0 0.00 Stage I 3 Y 1.97 17.54 56 10.44
T16 52 C 6/20/05 11:13 14.49 >4-3/>4 1 >4 >4 - 1 253.09 17.5 16.89 18.36 1.47 P 22.52 1.55 0 0 0.00 Stage I 2 Y 0.54 16.78 49 11.32
T16 53 A 6/20/05 11:26 14.48 >4 1 >4 >4 - 1 183.24 12.7 12.63 12.86 0.23 P 19.37 1.34 0 0 0.00 Stage I -> II 2 Y 8.76 12.34 7 1.08
T16 53 B 6/20/05 11:27 14.48 >4 1 >4 >4 - 1 156.71 10.8 10 11.92 1.92 P 19.28 1.33 1 O 0 0.00 Stage I -> II 2 Y 1.68 11.88 13 0.68
T16 54 A 6/20/05 11:33 14.49 >4 1 >4 >4 - 1 75.03 5.2 3.62 6.13 2.51 P ind ind 0 ind 0.00 ind ind N 0 0T16 54 C 6/20/05 11:34 14.49 >4 0 >4 >4 - 0 23.79 1.6 0.69 3.44 2.75 P ind ind 0 ind 0.00 ind ind N 0 0
T16 55 A 6/20/05 11:20 14.46 >4 1 >4 >4 - 1 140.54 9.7 8.46 10.79 2.33 P 31.4 2.17 3 O 0 0.00 Stage I 4 N 0 0
T16 55 B 6/20/05 11:21 14.46 >4 3 >4 >4 - 3 84.47 5.8 4.94 6.99 2.05 P 33.5 2.32 0 0 0.00 Stage I 5 N 0 0T17 1 B 6/21/05 15:00 14.48 3-2 0 >4 >4 - 0 42.51 2.9 1.73 3.71 1.98 P 16.4 1.13 0 0 Stage I 3 N 0 0T17 1 C 6/21/05 15:01 14.45 3-2 0 >4 >4 - 0 104.38 7.2 6.6 7.63 1.03 P 32.93 2.28 0 0 Stage I -> II 6 N 0 0T17 2 B 6/21/05 14:40 14.48 -7 -7 >4 >4 - -7 0 0.0 0 0 NA P ind ind 0 0 ind ind N 0 0T17 2 C 6/21/05 14:41 14.46 <-1 <-1 <-1 <-1 - <-1 0 0.0 0 0 NA P ind ind 0 0 ind ind N 0 0
T17 3 A 6/21/05 14:50 14.49 2-1 -1 >4 >4 - -1 47.5 3.3 2.56 4.1 1.54 P 5.42 0.37 0 0 Stage I 2 N 0 0
T17 3 B 6/21/05 14:51 14.45 2-1 -1 >4 >4 - -1 49.17 3.4 2.88 3.79 0.91 P 4.95 0.34 0 0 Stage I -> II 3 N 0 0T17 4 B 6/21/05 14:55 14.49 3-2 0 >4 >4 - 0 9.09 0.6 0 1.02 1.02 p ind ind 0 0 ind ind N 0 0
T17 4 C 6/21/05 14:56 14.49 3-2 1 >4 >4 - 1 18.18 1.3 0.72 2.74 2.02 p ind ind 0 0 ind ind N 0 0T17 5 A 6/21/05 14:44 14.43 ind ind ind ind - ind 0 0.0 0 0 0 ind ind ind 0 0 ind ind N 0 0T17 5 B 6/21/05 14:45 14.45 ind ind ind ind - ind 0 0.0 0 0 0 ind ind ind 0 0 ind ind N 0 0
T18 6 A 6/21/05 14:27 14.48 >4 3 >4 >4 - 3 224.92 15.5 ind ind ind ind ind ind 0 0 Stage I ind Y 0.49 15.39 22 1.55
T18 6 C 6/21/05 14:29 14.48 >4 3 >4 >4 - 3 161.03 11.1 7.86 14.15 6.29 P ind ind 0 1 2.62 2.66 2.64 Stage II ind Y 4.3 4.32 1 0.02
7

Appendix A
SPI Image Analysis Results
Transect Station No. Rep.
T14 91 B
T14 91 D
T14 92 A
T14 92 DT14 93 AT14 93 B
T14 94 A
T14 94 B
T14 95 A
T14 95 B
T15 56 B
T15 56 CT15 57 AT15 57 FT15 58 AT15 58 C
T15 59 A
T15 59 B
T15 60 A
T15 60 B
T16 51 A
T16 51 B
T16 52 A
T16 52 C
T16 53 A
T16 53 B
T16 54 AT16 54 C
T16 55 A
T16 55 BT17 1 BT17 1 CT17 2 BT17 2 C
T17 3 A
T17 3 BT17 4 B
T17 4 CT17 5 AT17 5 B
T18 6 A
T18 6 C
Percent Imaged Area Occupied by
MethaneLow DO?
Deposi-tional Layer
Present?
Deposi- tional Layer Thick-
ness (cm)
Post-Storm
Deposi-tion? COMMENT
0.8 No N overpen; very soft, homogenous light brown silt-clay>pen; weakly sulfidic@ depth; probably Stage 1; deepwater station near bulkhead=depositional=dep layer>pen?; a few threadworms in sed
3.4 No Nvery soft, mostly homogenous light brown silt-clay>pen; light color fairly deep over moderately red sed over strongly sulfidic sed@depth; indistinct rpd contrast; numerous threadworms=capitellids or oligochaetes(?); deeper-station near bulkhead=entire lay
6.8 No Nsoft mostly homogenous light brown silt-clay>pen; significant component v. fine sand in upper 5-10 cm; light color>pen=very subtle rpd contrast; shallow riverbank mudflat station=dep lyr>pen w/ reduced sed@depth generating methane?; several reddish threadlike worms (oligochaetes) at depth
6.6 No N
soft mostly homogenous light brown silt-clay>pen; significant v.fine sand component in upper 10 cm; stage 1 tubes@swi and numerous capitellids or oligos@depth; entire layer light colored=difficult rpd measurement=dep lyr>pen overlying strongly reduced sed that's been buried; void@depth@center is not gas-filled(possible relic structure following gas escape?) Shallow mudflat station (strongly depositional)
0.0 No N underpen; scoured firm/hard bottom in deeper mid-channel of river; organic detritus and rocks over sandy silt; bubbles under wiper=air or methane(??)0.0 No N underpen; possible thin dep lyr of brown silt over sand; firm bottom=pebbles/rocks; rock in nearfield; hard bottom in deeper middle of river=scouring
4.1 No Y 4.1 N homogenous light-brown silt-clay over strongly sulfidic silt-clay>pen; possible older dep layer=4 cm thick=first faint sulfidic horizon; weakly sulfidic sed@surf; a few small worms
2.9 No Y 6.4 Nlight brown silt-clay w/ some sand+organic detritus over weakly sulfidic horizon over relict rpd over strongly sulfidic silt-clay>pen; weak sulfidic horizon=bottom of older dep layer? relic rpd; bubble mound@SWI
0.0 No Y 2.3 Nsurface dep layer of homogenous brown silt-clay over brown fine to med sand>pen; sed accumulation around bottom of large stick=boundary roughness; bottom of surface dep layer indisticnt=some smearing artifacts; firmer sandy bottom near middle of river; errant worm at depth on right
1.0 No Y 1.3 N indistinct surface dep layer of homogenous brown silt over fine to med brown sand>pen; indistinct methane bubble lower left; firmer silt-covered sand bottom in deeper middle of river
3.3 No Y 13.2 Nlight brown silt-clay over horizon of weakly sulfidic silt-clay>pen; some v. fine sand in upper 5 to 10 cm; meiofaunal tunneling in upper 1-2 cm; bubble escape mound@SWI; subtle sulfidic horizon@depth=old dep layer??; deposition of silt at shallow riverbank/mudflat station
5.2 No Nlight brown silt-clay over weakly sulfidic silt-clay>pen; some v. fine sand in upper 10 cm; depositional area - sandier silt over reduced silt-clay ….very indistinct contacts between layers; indistinct rpd; bubble escape mounds+ebullition tracks
0 ind ind ind ind no pen; hard bottom=rocks (field log says "near boulder shore")=rocky river bank0 ind ind ind ind no pen; hard bottom=rocks (field log says "near boulder shore")=rocky river bank
0.0 No Y ind min pen; brown silt with fine-med sand>pen; firm/hard bottom deep middle of river0.0 No Y 1.9 n min pen; thin layer of light brown silt over fine-to-med sand>pen; decayed leaves+plant detritus@SWI; firm sandy bottom in deep middle of river
6.0 No indoverpen=swi obscured; homogenous soft silt-clay with some v. fine sand>pen; light-colored throughout; just slightly darker@bottom=entire layer=dep silt along western bank of river?; small threadworms=caps and oligos
3.3 No indoverpen=swi obscured; homogenous soft silt-clay with some v. fine sand>pen; light-colored throughout; entire layer=dep silt along shallowere western bank of river?; numerous small threadworms=caps and oligos
1.1 No N homogenous brown-grey silt-clay>pen; weakly sulfidic@depth; ebullition mound@SWI; discontinuous 1.3 cm layer of flocculant sed+plant detritus@swi in right of image; moderately deep/depositional
0.0 No Nbrown silt-clay with some very fine sand>pen; plant detritus/leaf matter within sed; dark small thin worms; very small methane bubbles; moderately firm bottom between shore and central deep mainstem
0.9 No Y 9.2 Nbrown silt-clay w/ some v. fine sand over strongly sulfidic horizon over lighter colored sed@depth; bottom of sulfidic band=bottom of older dep layer; relic rpd@bottom of image(?); faint sand horizon above sulfidic band; multiple layers; ebullition tracks
4.0 No Y 6.0 Nsoft brown-dark grey silt-clay>pen; rpd smearing artifact; ebullition tracks+expulsion of red sed@surf due to ebullition; small bubbles in water above swi; prism bubbles=artifact; shallow station near bulkhead=high
4.1 No Y 9.2 Nsand over mud stratigraphy; light brown v. fine sand over grey silt-clay over strongly sulfidic/reduced silt-clay@depth; multiple Stg 1 tubes@swi and several long thin red worms@depth=capitellids or oligo's
4.5 No Y 7.4 Nsubtle sand over mud stratigraphy; v fine light brown sand over grey silt-clay over strongly sulfidic/black silt-clay@depth; dep layer=older-weathered; shallower near-shore station=depositional; faceplate bubbles artifact; wood+plant debris@swi; thin wor
0.6 No Y 7.3 Nsilt over sand stratigraphy; dep layer of light brown silt w/ some fine sand in upper 1-3 cm over light brown fine sand>pen; large patch of organic matter in sand@depth; sulfidic band=bottom of silt layer; meiofaunal tunneling upper 1 cm; thin red worms concentrated at sulfidic layer
0.4 No Y 8.0 Nmultiple layers; brown silt over silty fine sand>pen; 1-2 cm surface dep layer of light brown silt=rpd over grey silt over faint sulfidic band over relic rpd; bottom sulfidic band=bottom of older dep layer; sand horizon@depth (image bottom); multiple small thin worms in sed; meiofaunal tunneling @ SWI; decayed leaf at surface
0.0 No indunderpen+swi obscured/disturbed by resuspended sed+organic floc in water column=camera disturbance or lots of loose detritus+floc@swi in this location; patches of black/sulfidic sed@depth; probably Stg 1
0.0 No ind underpen+swi obscured by resuspended sed+organic detritus; firmer sandy bottom@this station??; definite surface floc+loose detrital layer; faceplate bubbles artifact
0.0 No Y 5.7 N brown sandy silt-clay>pen; uneven "stratigraphy"=laterally discontinuous dep layer of homogenous silt over silty fine sand; decayed leaves@swi+depth; white plastic trash @depth; chaotic fabric
0.0 No N homogenous brown silt-clay>pen; almost no rpd contrast; several small thin worms@depth+a few stg 1 tubes@swi; faceplate bubbles artifact; low pen=firmer bottom@this station??
0.0 No N brown fine 3-2 sand>pen; silt on surface and in upper 1-3 cm; ripple/bedform; firm sandy bottom=reduced pen0.0 No N brown fine-to-med sand>pen; silt drape on surf and smeared down 1-2 cm; sand moderately reduced/sulfidic@depth; a few thin stg 1 worms; bedload transport occurring0.0 No N no pen=barnacle encrusted rock>pen; rock diameter 12 to 15 cm; barnacles appear alive but retracted0.0 No N no pen-rock in farfield; possible barnacles or other encrusting organism on rock(??)
0.0 No Y 0.7 Nmedium 2-1 brownish sand w/ some coarse (1-0 phi) sand>pen; 0.5-1.0 cm discontinuous surface dep layer of silt; difficult rpd measurement-rpd=either silt layer or >pen???;minor bedform=sand ripple; decayed leaf stems+plant detritus
0.0 No Y 0.7 Nmedium 2-1 brownish sand w/ some coarse (1-0 phi) sand>pen; 0.5-1.0 cm discontinuous surface dep layer of silt; difficult rpd measurement-rpd=either silt layer or >pen???;minor bedform=sand ripple; minor plant detritus. Portion of burrow transected in lower right corner
0.0 No N brown fine to medium sand>pen; underpen; decayed leaves and plant detritus on surface; rpd>pen???; hard sandy bottom near western riverbank
0.0 No N brown fine to med sand>pen; underpen; silt+detritus deposited on sand and somewhat smeard downward; no rpd contrast-rpd>pen??decayed leaf; hard/firm bottom western side of river
0.0 ind N no pen; water shot; assume rocks/hard bottom on deeper eastern side of river0.0 ind N no pen; water shot; assume rocks/hard bottom on deeper eastern side of river
0.7 No Noverpen; v. homogenous soft brown silt or silt-clay>pen; v. faint horizon of old dep layer@5 cm(?); entire image>pen is depositional; a few thin small worms@depth; v. shallow sta. near concrete bulkhead on west side o' river
0.0 No Nv. homogenous brown silt>pen; br=bottom sloping from bulkhead down into deep mainsten; feeding void v. questionable; no rpd contrast=entire layer is unstable soft recent deposit (no time for rpd to develop); small worm@depth
8

Appendix A
SPI Image Analysis Results
Transect Station No. Rep. Date TimeCalibration Constant
Grain Size Major
Mode (phi)
Grain Size Max. (phi)
Grain Size Min.
(phi)
Grain Size
Range (phi)
Total Area of Imaged
Sediment (sq. cm)
Avg. Prism Penetration Depth (cm)
Min. Prism Pen.
Depth (cm)
Max. Prism Pen.
Depth (cm)
Boundary Roughness
(cm)
Origin of Boundary
Roughness (Physical or
Biogenic)RPD Area
(cm2)
Mean RPD (cm)
No. Mud Clasts
Mud Clasts Oxidized
Reduced or Both?
No. Feed-ing Voids
Feed- ing Void
Min. Depth (cm)
Feed- ing Void Max.
Depth (cm)
Feed- ing Void
Avg. Depth (cm)
Successional Stage
Organism-Sediment
Index (OSI)Methane Present?
Methane Min. Depth (cm)
Methane Max. Depth
(cm)
No. Methane Bubbles
Total area all bubbles
(cm2)
T18 7 A 6/21/05 13:45 14.43 >4 3 >4 >4 - 3 300.86 20.8 20.85 20.85 0 ind ind ind 0 0 Stage III ind Y 1.2 20.51 58 22.29
T18 7 C 6/21/05 13:50 14.47 >4 1 >4 >4 - 1 130.11 9.0 8.75 9.39 0.64 P 22.26 1.54 0 0 Stage I -> II 3 Y 2.46 8.84 40 4.63T18 8 A 6/21/05 14:22 14.47 2-1 -1 >4 >4 - -1 25.33 1.8 0.69 2.36 1.67 P ind ind 0 0 ind ind N 0 0T18 8 B 6/21/05 14:23 14.47 2-1 -2 >4 >4 - -2 23.91 1.7 1.37 1.69 0.32 P ind ind 0 0 ind ind N 0 0T18 9 A 6/21/05 14:17 14.47 Ind -3 >4 >4 - -3 ind 0.0 0 0.81 0.81 P ind ind 0 0 ind ind N 0 0T18 9 C 6/21/05 14:19 14.47 Ind -4 >4 >4 - -4 0 0.0 0 0 0 P ind ind 0 0 ind ind N 0 0
T18 10 A 6/21/05 14:01 14.45 3-2 -1 >4 >4 - -1 23.8 1.6 0.97 2.68 1.71 P ind ind 0 0 ind ind N 0 0T18 10 B 6/21/05 14:02 14.48 3-2 0 >4 >4 - 0 24.47 1.7 0.46 2.2 1.74 P 24.47 1.69 2 B 0 ind ind N 0 0T19 11 B 6/21/05 13:34 14.47 4-3 0 >4 >4 - 0 43.11 3.0 1.5 4.6 3.1 P 13.73 0.95 0 0 Stage I 1 Y 0.88 3.92 4 1.05
T19 11 C 6/21/05 13:35 14.45 >4-3 0 >4 >4 - 0 83.19 5.8 5.11 6.86 1.75 P 21.12 1.46 3 O 0 Stage I 1 Y 3.21 5.1 10 0.72
T19 12 A 6/21/05 13:11 14.47 >4 1 >4 >4 - 1 170.22 11.8 10.3 13.18 2.88 P 26.49 1.83 0 0 Stage I 2 Y 0.69 12.98 26 2.37T19 12 D 6/21/05 13:13 14.44 >4 2 >4 >4 - 2 264.09 18.3 18 18.59 0.59 B 41.43 2.87 1 O 0 Stage III 7 Y 2.96 17.87 46 12.59
T19 13 A 6/21/05 13:28 14.42 4-3 -1 >4 >4 - -1 21.06 1.5 1.15 1.75 0.6 P 21.06 1.46 0 0 Stage I 3 N 0 0.00T19 13 B 6/21/05 13:29 14.47 3-2 -1 >4 >4 - -1 5.62 0.4 0 0.76 0.76 P Ind ind 0 0 Stage I ind N 0 0.00
T19 14 A 6/21/05 13:23 14.46 4-3 1 >4 >4 - 1 185.7 12.8 12.3 13.41 1.11 B 25.42 1.76 0 0 Stage III 6 Y 1.97 13.3 42 6.15
T19 14 B 6/21/05 13:24 14.46 4-3 0 >4 >4 - 0 66.76 4.6 3.7 5.91 2.21 P 24.01 1.66 0 0 Stage II 6 N 0 0.00T19 15 A 6/21/05 13:18 14.42 >4 3 >4 >4 - 3 260.63 18.1 18.07 18.07 0 ind ind ind ind 0 Stage I ind Y 0 >17.89 47 15.45
T19 15 C 6/21/05 13:19 14.4 >4 2 >4 >4 - 2 212.93 14.8 14.11 15.56 1.45 P 30.26 2.10 0 0 Stage I 2 Y 2.72 14.93 25 7.82T20 16 F 6/24/05 8:04 14.47 >4 2 >4 >4 - 2 264.88 18.3 17.45 19.17 1.72 P 37.85 2.62 0 0 Stage III 7 Y 0.47 17.64 55 13.18
T20 16 G 6/24/05 8:05 14.45 >4 2 >4 >4 - 2 279.08 19.3 17.74 20.52 2.78 P 18.74 1.30 0 0 Stage III 5 Y 0.99 17.34 34 7.59T20 17 A 6/21/05 12:55 14.45 ind ind ind ind - ind 0 0.0 ind ind ind ind ind ind 0 ind ind ind N 0 0.00T20 17 B 6/21/05 12:56 14.45 ind ind ind ind - ind 0 0.0 ind ind ind ind ind ind 0 ind ind ind N 0 0.00
T20 18 E 6/21/05 12:34 14.42 >4 3 >4 >4 - 3 270.72 18.8 18.47 18.47 0 ind ind ind ind 1 12.92 12.92 12.92 Stage III ind Y 0 15.1 37 7.99T20 18 F 6/24/05 8:00 14.48 >4 3 >4 >4 - 3 265.02 18.3 16.41 19.46 3.05 P 47.74 3.30 0 0 Stage III 8 Y 1.23 15.49 27 2.22
T20 19 A 6/21/05 8:59 14.43 3-2 0 >4 >4 - 0 117.83 8.2 7.6 8.53 0.93 P ind ind 0 0 Stage II -> III ind N 0 0T20 19 B 6/21/05 9:00 14.49 3-2 0 >4 >4 - 0 128.93 8.9 6.77 10.73 3.96 p ind ind 0 0 Stage II -> III ind N 0 0T20 20 B 6/21/05 12:50 14.45 ind ind ind ind - ind 0 0.0 ind ind ind ind ind ind ind ind ind ind ind 0 0T20 20 C 6/21/05 12:50 14.45 ind ind ind ind - ind 0 0.0 ind ind ind ind ind ind ind ind ind ind ind 0 0T21 21 A 6/24/05 8:37 14.45 ind ind ind ind - ind 0 0.0 ind ind ind ind ind ind ind ind ind ind Y ind ind 0 0T21 21 B 6/24/05 8:40 14.45 >4 2 >4 >4 - 2 72.39 5.0 3.45 6.19 2.74 P ind ind ind ind ind ind N 0 0
T21 22 B 6/24/05 8:18 14.45 >4 2 >4 >4 - 2 187.79 13.0 12.23 14.5 2.27 P 19.86 1.37 0 0 Stage III 5 Y 0.3 8.39 14 1.39T21 22 C 6/24/05 8:19 14.49 >4 0 >4 >4 - 0 241.02 16.6 15.41 17.91 2.5 P 31.11 2.15 0 0 Stage III 6 Y 1.5 17.82 37 10.90T21 23 A 6/24/05 8:27 14.47 >4 0 >4 >4 - 0 261.74 18.1 17.41 18.33 0.92 P 72.75 5.03 0 0 Stage III 9 Y 5.99 14.51 20 6.54
T21 23 B 6/24/05 8:28 14.48 >4 0 >4 >4 - 0 289.09 20.0 19.46 20.63 1.17 P 72.64 5.02 0 0 Stage II -> III 8 Y 3.42 19.44 39 23.35
T21 24 A 6/24/05 8:32 14.48 >4 -1 >4 >4 - -1 107.54 7.4 6.62 7.43 0.81 P 25.13 1.74 4 R 0 Stage II 4 Y 0.85 7.51 33 7.53T21 24 B 6/24/05 8:33 14.45 >4 <-1 >4 >4 - <-1 105.8 7.3 6.7 7.67 0.97 P 30.91 2.14 0 0 Stage I -> II 3 Y 2.41 7.56 16 2.91
T21 25 A 6/24/05 8:23 14.48 >4 1 >4 >4 - 1 270.28 18.7 18.18 19.2 1.02 P 23.36 1.61 0 0 Stage III 6 Y 1.34 17.35 35 9.34
T21 25 B 6/24/05 8:24 14.47 >4 1 >4 >4 - 1 241.51 16.7 15.14 18.41 3.27 B 24.23 1.67 0 0 Stage III 6 Y 2.22 15.9 10 2.46T22 31 B 6/24/05 9:14 14.47 ind ind ind ind - ind 0 0.0 ind ind ind ind ind ind ind 0 ind ind N 0 0T22 31 C 6/24/05 9:15 14.4 3-2 -4 >4 >4 - -4 16.85 1.2 0 2.99 2.99 P ind ind 0 0 Stage I ind N 0 0
T22 32 A 6/24/05 8:54 14.42 >4 2 >4 >4 - 2 262.29 18.2 17.59 18.45 0.86 B 22.76 1.58 0 0 Stage III 6 Y 1.23 18.03 20 2.18T22 32 C 6/24/05 8:56 14.44 >4 1 >4 >4 - 1 269.29 18.6 18.34 19.11 0.77 B 22.1 1.53 0 0 Stage III 6 Y 2.31 11.1 26 3.77T22 33 A 6/24/05 9:04 14.42 3-2 -1 >4 >4 - -1 32.57 2.3 1.34 2.85 1.51 P 32.57 2.26 0 0 ind ind N 0 0T22 33 C 6/24/05 9:05 14.47 4-3 -1 >4 >4 - -1 36.43 2.5 2.14 3.16 1.02 P 36.43 2.52 0 0 ind ind N 0 0T22 34 A 6/24/05 9:08 14.4 3-2 0 >4 >4 - 0 50.34 3.5 2.06 5.23 3.17 P 17.7 1.23 0 0 ind ind N 0 0T22 34 C 6/24/05 9:10 14.47 3-2 1 >4 >4 - 1 47.55 3.3 2.52 3.85 1.33 P 13.69 0.95 0 0 Stage I 1 Y 1.21 3.26 9 1.46
T22 35 B 6/24/05 9:00 14.45 >4 2 >4 >4 - 2 211.2 14.6 14.11 14.73 0.62 P 19.3 1.34 3 O 0 Stage III 5 Y 0.69 14.28 27 2.68
T22 35 D 6/24/05 9:01 14.48 >4 1 >4 >4 - 1 235.02 16.2 15.64 16.45 0.81 P 18.23 1.26 0 0 Stage III 5 Y 1.5 16.2 24 4.46T23 41 B 6/24/05 9:53 14.43 >4 2 >4 >4 - 2 42.74 3.0 0 7.08 7.08 P ind ind 0 0 Stage II ind N 0 0
9

Appendix A
SPI Image Analysis Results
Transect Station No. Rep.
T18 7 A
T18 7 CT18 8 AT18 8 BT18 9 AT18 9 C
T18 10 AT18 10 BT19 11 B
T19 11 C
T19 12 AT19 12 D
T19 13 AT19 13 B
T19 14 A
T19 14 BT19 15 A
T19 15 CT20 16 F
T20 16 GT20 17 AT20 17 B
T20 18 ET20 18 F
T20 19 AT20 19 BT20 20 BT20 20 CT21 21 AT21 21 B
T21 22 BT21 22 CT21 23 A
T21 23 B
T21 24 AT21 24 B
T21 25 A
T21 25 BT22 31 BT22 31 C
T22 32 AT22 32 CT22 33 AT22 33 CT22 34 AT22 34 C
T22 35 B
T22 35 DT23 41 B
Percent Imaged Area Occupied by
MethaneLow DO?
Deposi-tional Layer
Present?
Deposi- tional Layer Thick-
ness (cm)
Post-Storm
Deposi-tion? COMMENT
7.4 No Noverpen; v. homogenous light brown silt>pen; only slightly reduced@depth=no rpd contrast; very soft mud on shallow eastern bank of river; entire image=transient dep layer over methanogenic sed@depth(?); numerous red threadworms@depth
3.6 No Y 5.6 Nmultiple layers=brown silt-clay=rpd over grey weakly sulfidic silt-clay over horizon of fine sand over silt-clay>pen; soft mud station in very shallow water on eastern bank of river; thin small worms@depth
0.0 No N underpen; med to coarse sand>pen; station located near deeper middle of river=current scouring of fines; black particles=coal or pyrogenic(?); v. little to no detritus0.0 No N underpen; med to coarse sand>pen; scouring in deeper middle of river; many black particles on sediment surface=black sand grains or weathered coal?; piece of stick0.0 No N underpen; very coarse sand to pebbles>pen; little to no surface detritus or fine-grained sed; scoured hard pebble bottom in deeper middle of river0.0 No N no pen; pebbles/very coarse sand>pen; little surface detritus=scoured hard pebble bottom in middle of river; stick-like structure in farfield
0.0 No Y 0.3 Nmin pen; fine to medium brown sand>pen; accumulation of brown silt+large black particles in sand ripple trough; black particles=coal, decayed wood or other pyrogenic source?; hard bottom in deeper, eastern side of river
0.0 No N min pen; rpd>pen?; brown fine to medium sand>pen; assymetrical ripples; small patch of silt covering sand on left; hard sand bottom2.4 No N min pen; dark brown fine sand>pen; thin surface dep layer (drape) of silt+detritus; a few thin worms @ depth; firm sandy bottom near shallow western bank of river
0.9 No N dark brown very fine to fine sand>pen; uniform color=almost no rpd contrast; somewhat firm, muddy fine sand w/ decayed leaf+plant detritus on shallow western riverbank; ebullition track/mound
1.4 No N brown homogenous silt>pen; silt accumulation on shallow mudflat eastern riverbank; entire lyr is depositional with methanogenic sed@depth. Meiofaunal tunneling upper 1-2 cm
4.8 No N v. homogenous light brown silt over moderately-strongly sulfidic silt>pen; buried black decayed leaf; stg 1 surf tubes+thin worms@depth; meiofaunal tunneling upper 1 cm
0.0 No N firm brown fine to med silty sand>pen; sed surface draped with thin film of silt; larger black particles=coal frags or small black pebbles?? rpd>pen; firm/hard bottom in deep middle of river
0.0 No N firm brown fine to med silty sand>pen; some silt@surface; firm/hard scoured sand bottom in deep middle of river
3.3 No Y 8.5 N brown silt with indistinct horizons of fine sand>pen; multiple depositional horizons=silt over sand over silt over sand; ebullition mound+tracks: western side of river; multiple thin red worms@depth
0.0 No N brown fine sand>pen; significant amounts of brown silt; indistinct rpd contrast=difficult rpd measurement; thin worms in sand; surface floc or detritus layer or camera artifact?
5.9 No N homogenous v. soft silt-clay>pen; homogenous color=no rpd contrast; overpen=swi obscured by wiper blade; a few thin worms@depth; entire image>pen is depositional??
3.7 No N homogenous light brown silt-clay w/ minor v. fine sand>pen; subtle horizon @ depth=bottom of old dep layer??; very indistinct redox contrast; entire image=dep layer on deeper eastern side of river?
5.0 No N homogenous light brown silt-clay>pen; homogenous color=weak rpd contrast; entire layer=depositional?; shallow station on western riverbank; thin red worms@depth.
2.7 No N homogenous light brown silt-clay>pen; homogenous color=weak rpd contrast; entire layer=depositional?; shallow station on western riverbank; thin red worms@depth; ebullition tracks+mounds
0.0 No N water shot=no pen; assume rocks/hard bottom0.0 No N water shot=no pen; assume rocks/hard bottom
3.0 No Nvery soft homogenous silt-clay>pen; weakly sulfidic@depth; homogenous color=rpd??; overpen=swi disturbed by wiper; distinct feeding void; thin worms@depth=capitellids; entire image=dep layer?; bubbles trapped under wiper
0.8 No N very soft homogenous silt-clay>pen; weakly sulfidic@depth; thin worms@depth; depositional area; soft sed in deeper middle of river!
0.0 No N fairly clean, homogenous light brown/tan fine sand>pen; minor amount (patch) of silt near swi (=dragdown)+@ depth; assymetrical rippled surface. Insufficient fines to measure aRPD; worms at depth.
0.0 No N light brown/tan fine sand>pen; some dragdown of silt in upper 3-4 cm; small sed deposit@swi=wiper artifact; assymetrical ripple0.0 ind ind water shot=no pen; assume rocks/hard bottom0.0 ind ind water shot=no pen; assume rocks/hard bottomind ind ind pull-out=water shot; very black and presumable cohesive silt-clay on faceplate; methane bubble in water column0.0 No ind dark brown silt-clay>pen; significant smearing of black sed from previous replicate=profile obscured; limited pen=firm/cohesive clay
0.7 No Y 12.2 Ylight brown silt-clay with minor fraction of very fine sand over base layer of fine sand; methane bubbles@depth and in water column; decayed leaf@depth; many small worms in sed; difficult rpd measurement.
4.5 No Y 15.7 Y light brown silt-clay with some v. fine sand overlyin fine-medium sand basement; many worms @ depth.2.5 No Y 8.5 Y dep layer of light brown homogenous silt (8-9 cm) over very silty fine to med sand; dep lyr from recent storm(?) or older; decayed leaves+many thin red worms@depth
8.1 No Y 13.4 Y dep lyr of light brown soft homogenous silt (13-14 cm) over fine sand horizon over silt-clay>pen; methane bubbles trapped in sand layer; white plastic(?); a few small worms@depth
7.0 No N thin surface veneer of fine-med sand over homgenous brown silt-clay>pen; s/m stratigraphy; sand is lag deposit (winnowing of fines) or post-storm dep layer?? a few small thin worms@depth
2.8 No N 1-3 cm surface layer of fine-med sand over homogenous brown silt-clay>pen; sand=lag deposit or dep layer? larger pebble-size particles; very few small worms
3.5 No N very subtle/gradual change in texture from silty very fine sand down to 8-10 cm to silt-clay below; decayed plant matter@depth on left; multiple dep layers?; thin worms@depth
1.0 No Nsomewhat chaotic fabric; dark brown organic floc over patchy discontinuous fine sand over silt-clay>pen; buried decayed leaves@depth indicates entire layer recent dep; burrow -like opening; small thin worm@depth
0.0 No N water shot=no pen; hard bottom=pebbles and small rocks on top of silty sand (based on second replicate image)0.0 No underpen; hard bottom=small rocks and pebbles over silty fine sand; rpd>pen; black decayed twigs+plant detritus
0.8 No N homogenous light brown silt-clay>pen; appears to contain small organic fibers=leaf+plant material?; tubelike structures@swi(but getting into oligohaline region); no clear rpd contrast
1.4 No N light brown soft silt-clay with some fine sand+plant matter>pen; many small thin worms in sed=tubificids; entire layer=depositional?0.0 No N underpen=firm bottom=brown med sand>pen; small patch of silt@depth; rpd>pen?? 0.0 No N underpen=firm bottom=silty brown fine to med sand>pen; rpd>pen0.0 No Y underpen=firm bottom=fine to med brown sand>pen; low rpd contrast=difficult measurement; active bedload transport with transgressive layer in left half of image3.1 No N underpen=firm bottom=silty fine to med sand>pen; low rpd contrast; methane in sand=sand overlying reduced sed@depth; stg 1 tubes at SWI
1.3 No Y 7.4 Ymultiple horizons=surface fine sand 1-2 cm over brown silt-clay over buried decayed leaves over light brown silt-clay>pen; buried leaves=bottom of surface dep layer (7-8 cm); wiper clasts=artifact; small thin worms@depth
1.9 No Y 7.6 Ysandy silt in upper 1-3 cm over silt-clay over uneven horizon of buried decayed leaves+plant matter over silt-clay>pen; appears to be recent deposition of upper layer; decayed leaves@surf; many small thin worms@depth
0.0 No N steeply sloping bottom=minimal pen; brown silt>pen; small worms in sed
10
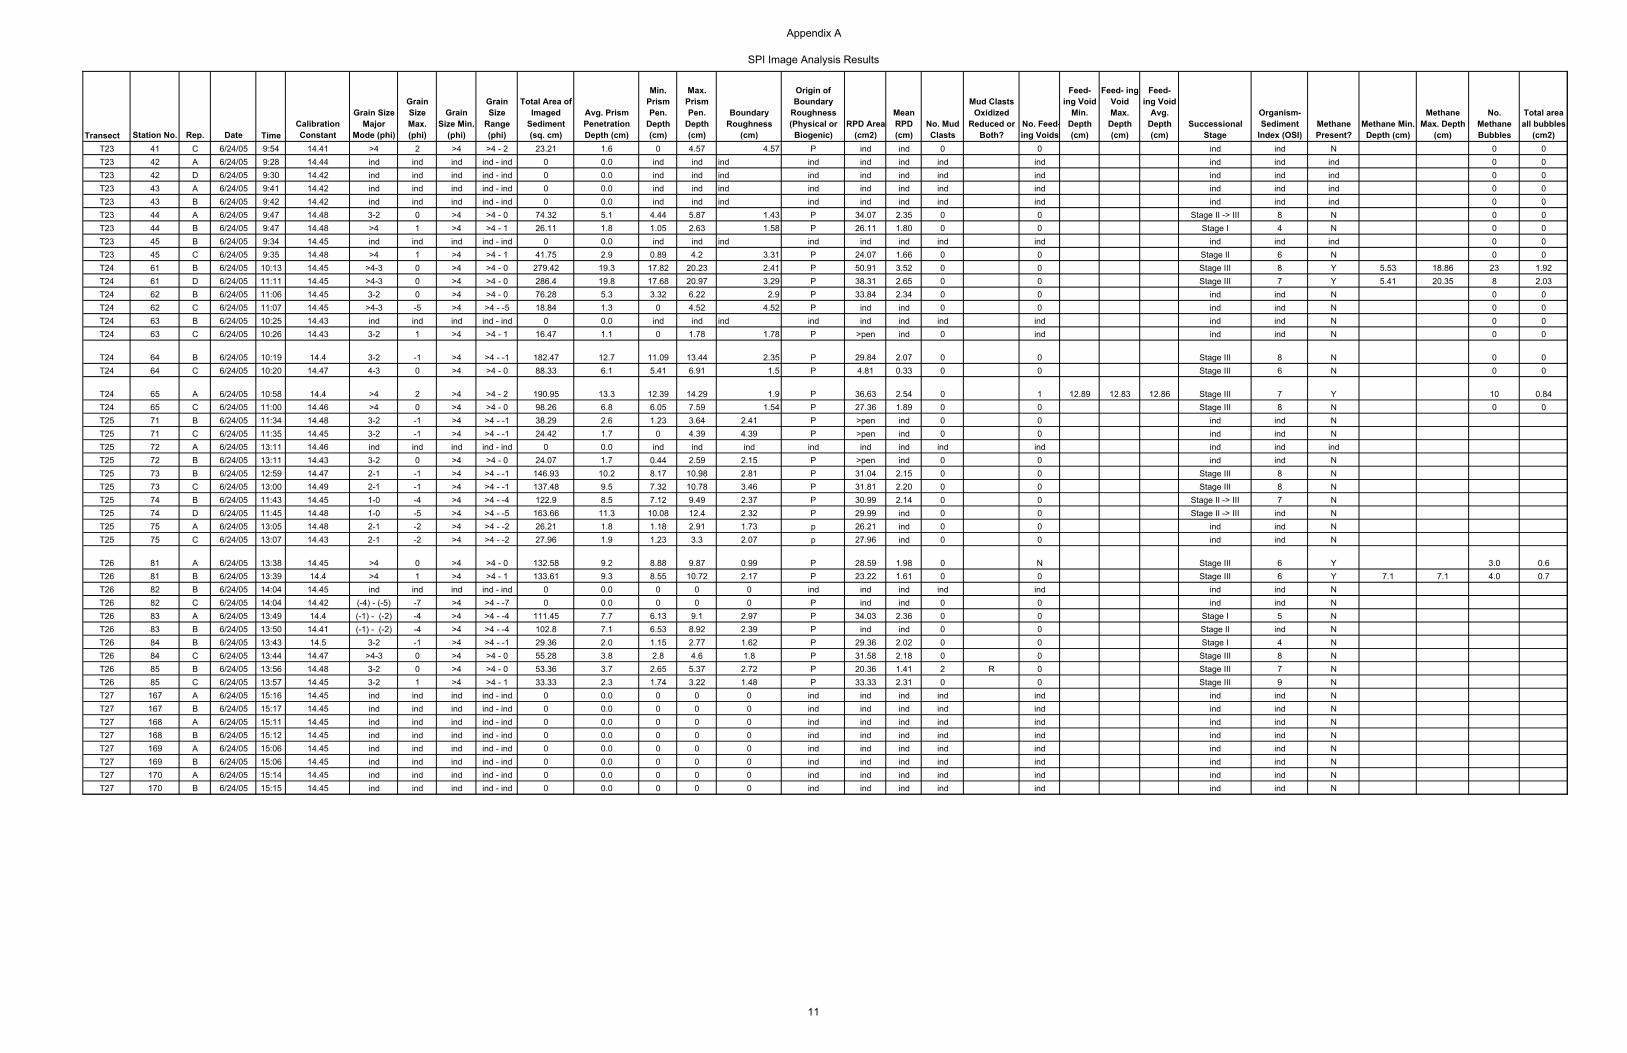
Appendix A
SPI Image Analysis Results
Transect Station No. Rep. Date TimeCalibration Constant
Grain Size Major
Mode (phi)
Grain Size Max. (phi)
Grain Size Min.
(phi)
Grain Size
Range (phi)
Total Area of Imaged
Sediment (sq. cm)
Avg. Prism Penetration Depth (cm)
Min. Prism Pen.
Depth (cm)
Max. Prism Pen.
Depth (cm)
Boundary Roughness
(cm)
Origin of Boundary
Roughness (Physical or
Biogenic)RPD Area
(cm2)
Mean RPD (cm)
No. Mud Clasts
Mud Clasts Oxidized
Reduced or Both?
No. Feed-ing Voids
Feed- ing Void
Min. Depth (cm)
Feed- ing Void Max.
Depth (cm)
Feed- ing Void
Avg. Depth (cm)
Successional Stage
Organism-Sediment
Index (OSI)Methane Present?
Methane Min. Depth (cm)
Methane Max. Depth
(cm)
No. Methane Bubbles
Total area all bubbles
(cm2)T23 41 C 6/24/05 9:54 14.41 >4 2 >4 >4 - 2 23.21 1.6 0 4.57 4.57 P ind ind 0 0 ind ind N 0 0T23 42 A 6/24/05 9:28 14.44 ind ind ind ind - ind 0 0.0 ind ind ind ind ind ind ind ind ind ind ind 0 0T23 42 D 6/24/05 9:30 14.42 ind ind ind ind - ind 0 0.0 ind ind ind ind ind ind ind ind ind ind ind 0 0T23 43 A 6/24/05 9:41 14.42 ind ind ind ind - ind 0 0.0 ind ind ind ind ind ind ind ind ind ind ind 0 0T23 43 B 6/24/05 9:42 14.42 ind ind ind ind - ind 0 0.0 ind ind ind ind ind ind ind ind ind ind ind 0 0T23 44 A 6/24/05 9:47 14.48 3-2 0 >4 >4 - 0 74.32 5.1 4.44 5.87 1.43 P 34.07 2.35 0 0 Stage II -> III 8 N 0 0T23 44 B 6/24/05 9:47 14.48 >4 1 >4 >4 - 1 26.11 1.8 1.05 2.63 1.58 P 26.11 1.80 0 0 Stage I 4 N 0 0T23 45 B 6/24/05 9:34 14.45 ind ind ind ind - ind 0 0.0 ind ind ind ind ind ind ind ind ind ind ind 0 0T23 45 C 6/24/05 9:35 14.48 >4 1 >4 >4 - 1 41.75 2.9 0.89 4.2 3.31 P 24.07 1.66 0 0 Stage II 6 N 0 0T24 61 B 6/24/05 10:13 14.45 >4-3 0 >4 >4 - 0 279.42 19.3 17.82 20.23 2.41 P 50.91 3.52 0 0 Stage III 8 Y 5.53 18.86 23 1.92T24 61 D 6/24/05 11:11 14.45 >4-3 0 >4 >4 - 0 286.4 19.8 17.68 20.97 3.29 P 38.31 2.65 0 0 Stage III 7 Y 5.41 20.35 8 2.03T24 62 B 6/24/05 11:06 14.45 3-2 0 >4 >4 - 0 76.28 5.3 3.32 6.22 2.9 P 33.84 2.34 0 0 ind ind N 0 0T24 62 C 6/24/05 11:07 14.45 >4-3 -5 >4 >4 - -5 18.84 1.3 0 4.52 4.52 P ind ind 0 0 ind ind N 0 0T24 63 B 6/24/05 10:25 14.43 ind ind ind ind - ind 0 0.0 ind ind ind ind ind ind ind ind ind ind N 0 0T24 63 C 6/24/05 10:26 14.43 3-2 1 >4 >4 - 1 16.47 1.1 0 1.78 1.78 P >pen ind 0 ind ind ind N 0 0
T24 64 B 6/24/05 10:19 14.4 3-2 -1 >4 >4 - -1 182.47 12.7 11.09 13.44 2.35 P 29.84 2.07 0 0 Stage III 8 N 0 0T24 64 C 6/24/05 10:20 14.47 4-3 0 >4 >4 - 0 88.33 6.1 5.41 6.91 1.5 P 4.81 0.33 0 0 Stage III 6 N 0 0
T24 65 A 6/24/05 10:58 14.4 >4 2 >4 >4 - 2 190.95 13.3 12.39 14.29 1.9 P 36.63 2.54 0 1 12.89 12.83 12.86 Stage III 7 Y 10 0.84T24 65 C 6/24/05 11:00 14.46 >4 0 >4 >4 - 0 98.26 6.8 6.05 7.59 1.54 P 27.36 1.89 0 0 Stage III 8 N 0 0T25 71 B 6/24/05 11:34 14.48 3-2 -1 >4 >4 - -1 38.29 2.6 1.23 3.64 2.41 P >pen ind 0 0 ind ind NT25 71 C 6/24/05 11:35 14.45 3-2 -1 >4 >4 - -1 24.42 1.7 0 4.39 4.39 P >pen ind 0 0 ind ind NT25 72 A 6/24/05 13:11 14.46 ind ind ind ind - ind 0 0.0 ind ind ind ind ind ind ind ind ind ind indT25 72 B 6/24/05 13:11 14.43 3-2 0 >4 >4 - 0 24.07 1.7 0.44 2.59 2.15 P >pen ind 0 0 ind ind NT25 73 B 6/24/05 12:59 14.47 2-1 -1 >4 >4 - -1 146.93 10.2 8.17 10.98 2.81 P 31.04 2.15 0 0 Stage III 8 NT25 73 C 6/24/05 13:00 14.49 2-1 -1 >4 >4 - -1 137.48 9.5 7.32 10.78 3.46 P 31.81 2.20 0 0 Stage III 8 NT25 74 B 6/24/05 11:43 14.45 1-0 -4 >4 >4 - -4 122.9 8.5 7.12 9.49 2.37 P 30.99 2.14 0 0 Stage II -> III 7 NT25 74 D 6/24/05 11:45 14.48 1-0 -5 >4 >4 - -5 163.66 11.3 10.08 12.4 2.32 P 29.99 ind 0 0 Stage II -> III ind NT25 75 A 6/24/05 13:05 14.48 2-1 -2 >4 >4 - -2 26.21 1.8 1.18 2.91 1.73 p 26.21 ind 0 0 ind ind NT25 75 C 6/24/05 13:07 14.43 2-1 -2 >4 >4 - -2 27.96 1.9 1.23 3.3 2.07 p 27.96 ind 0 0 ind ind N
T26 81 A 6/24/05 13:38 14.45 >4 0 >4 >4 - 0 132.58 9.2 8.88 9.87 0.99 P 28.59 1.98 0 N Stage III 6 Y 3.0 0.6T26 81 B 6/24/05 13:39 14.4 >4 1 >4 >4 - 1 133.61 9.3 8.55 10.72 2.17 P 23.22 1.61 0 0 Stage III 6 Y 7.1 7.1 4.0 0.7T26 82 B 6/24/05 14:04 14.45 ind ind ind ind - ind 0 0.0 0 0 0 ind ind ind ind ind ind ind NT26 82 C 6/24/05 14:04 14.42 (-4) - (-5) -7 >4 >4 - -7 0 0.0 0 0 0 P ind ind 0 0 ind ind NT26 83 A 6/24/05 13:49 14.4 (-1) - (-2) -4 >4 >4 - -4 111.45 7.7 6.13 9.1 2.97 P 34.03 2.36 0 0 Stage I 5 NT26 83 B 6/24/05 13:50 14.41 (-1) - (-2) -4 >4 >4 - -4 102.8 7.1 6.53 8.92 2.39 P ind ind 0 0 Stage II ind NT26 84 B 6/24/05 13:43 14.5 3-2 -1 >4 >4 - -1 29.36 2.0 1.15 2.77 1.62 P 29.36 2.02 0 0 Stage I 4 NT26 84 C 6/24/05 13:44 14.47 >4-3 0 >4 >4 - 0 55.28 3.8 2.8 4.6 1.8 P 31.58 2.18 0 0 Stage III 8 NT26 85 B 6/24/05 13:56 14.48 3-2 0 >4 >4 - 0 53.36 3.7 2.65 5.37 2.72 P 20.36 1.41 2 R 0 Stage III 7 NT26 85 C 6/24/05 13:57 14.45 3-2 1 >4 >4 - 1 33.33 2.3 1.74 3.22 1.48 P 33.33 2.31 0 0 Stage III 9 NT27 167 A 6/24/05 15:16 14.45 ind ind ind ind - ind 0 0.0 0 0 0 ind ind ind ind ind ind ind NT27 167 B 6/24/05 15:17 14.45 ind ind ind ind - ind 0 0.0 0 0 0 ind ind ind ind ind ind ind NT27 168 A 6/24/05 15:11 14.45 ind ind ind ind - ind 0 0.0 0 0 0 ind ind ind ind ind ind ind NT27 168 B 6/24/05 15:12 14.45 ind ind ind ind - ind 0 0.0 0 0 0 ind ind ind ind ind ind ind NT27 169 A 6/24/05 15:06 14.45 ind ind ind ind - ind 0 0.0 0 0 0 ind ind ind ind ind ind ind NT27 169 B 6/24/05 15:06 14.45 ind ind ind ind - ind 0 0.0 0 0 0 ind ind ind ind ind ind ind NT27 170 A 6/24/05 15:14 14.45 ind ind ind ind - ind 0 0.0 0 0 0 ind ind ind ind ind ind ind NT27 170 B 6/24/05 15:15 14.45 ind ind ind ind - ind 0 0.0 0 0 0 ind ind ind ind ind ind ind N
11

Appendix A
SPI Image Analysis Results
Transect Station No. Rep.T23 41 CT23 42 AT23 42 DT23 43 AT23 43 BT23 44 AT23 44 BT23 45 BT23 45 CT24 61 BT24 61 DT24 62 BT24 62 CT24 63 BT24 63 C
T24 64 BT24 64 C
T24 65 AT24 65 CT25 71 BT25 71 CT25 72 AT25 72 BT25 73 BT25 73 CT25 74 BT25 74 DT25 75 AT25 75 C
T26 81 AT26 81 BT26 82 BT26 82 CT26 83 AT26 83 BT26 84 BT26 84 CT26 85 BT26 85 CT27 167 AT27 167 BT27 168 AT27 168 BT27 169 AT27 169 BT27 170 AT27 170 B
Percent Imaged Area Occupied by
MethaneLow DO?
Deposi-tional Layer
Present?
Deposi- tional Layer Thick-
ness (cm)
Post-Storm
Deposi-tion? COMMENT
0.0 No N steeply sloping bottom-minimal pen; brown silt>pen0.0 ind ind water shot=no pen; assume hard bottom=pebbles and/or rocks 0.0 ind ind water shot=no pen; assume hard bottom=pebbles and/or rocks 0.0 ind ind water shot=no pen; assume hard bottom=pebbles and/or rocks 0.0 ind ind water shot=no pen; assume hard bottom=pebbles and/or rocks 0.0 No Y 3.0 Y brown silty fine to med sand>pen; surface dep lyr of silt with some smearing of silt on sand, but see other rep; firm sandy bottom with silt; a few small worms@depth 0.0 No Y >avg pen Y brown silt>pen; hint of fine sand near bottom of image=silt is recent dep over lyr of fine sand; RPD > pen; low penetration suggest compact sand underlying silt 0.0 No ind water shot=no pen; decayed leaves+plant matter visible; assume hard bottom=lots of sticks/twigs/plant debris and/or pebbles/rocks0.0 No N min pen; brown silty fine sand>pen; sticks+twigs+plant detritus on surface; firm bottom0.7 No Y 7.0 Y s/m; brown silty fine sand w/ plant detritus over light brown silt-clay>pen; concentration of tubificids@contact between layers=recent deposition0.7 No Y 9.8 Y s/m; brown silty fine sand w/plant detritus over light brown silt-clay>pen; leaf stem/twigs@swi; appears to be recent deposition0.0 No N brown fine to med sand>pen; some silt patches@depth; sticks/plant debris+rock@surf; firm bottom0.0 No brown silty fine/med sand>pen; underpen w/ sloping bottom; pebbles/rocks in farfield; firm/hard bottom0.0 No ind water shot=no pen; assume hard bottom=looks like sand w/ pebbles and/or rocks 0.0 No ind min pen; light colored fine sand over brown silt-clay; pebbles/rocks in farfield; rpd>pen, rippled bottom
0.0 No Nlight brown fine sand>pen; brown silt in upper 8 cm=artifact of smearing from wiper blade (similar to image from Station 21-B)dep layer over clean fine sand? faint band or horizon of silt@depth; tubelike structures@swi
0.0 No N silty brown fine sand>pen; sand ripple on surface, sig. silt in upper 3-4 cm; small worms@depth; tubelike structure on sed surf
0.4 No N homogenous brown silt-clay over mod-strongly sulfidic silt-clay>pen; partial view of feeding void@depth?; numerous oligochaetes +burrow structures@top of sulfidic layer@depth
0.0 No N brown silt>pen; patches and/or horizon of fine-med sand between 1 and 5 cm depth; sed loose@swi=biogenic reworking; burrow on rightNo N light brown, muddy fine to med sand>pen; compact sand=firm bottom=min pen; a few small wormsNo N light brown, muddy fine to med sand>pen; a few pebbles; roughness=sloped bottom; firm bottom=compact sand=min pen; rpd>penNo ind water shot=no pen; assume hard bottom=most likely sand with pebbles and/or rocks (based on other replicate) No N clean homogenous high reflectance fine sand>pen; minor amount of silt; bedform?; rpd>penNo N brown fine to medium silty sand>pen; thin veneer of silt-clay@sed surface+patches of silt@depth; many tubes@swiNo N brown fine to medium silty sand>pen; thin veneer silt-clay@surface+patches@depth; many larger tubes@surf; a few worms@depth; sloping bottom; rock in far field@rightNo Y 2.1 Y 1-3 cm surface dep layer of brown silt over med-coarse sand; some black decayed leaf frags in silt; silt is possible post-storm dep?; biogenic reworking@swiNo Y Y thin veneer of deposited silt over med-coarse sand>pen; several larger pebbles@surface; dragdown of siltNo N thin veneer brown silt over med to coarse sand>pen; some leaf+plant debris on sed surf; a few tubes; assymetrical rippleSNo N thin patchy veneer of brown silt over med to coarse sand>pen; underpen=firm bottom; twig@sed surface; rpd>pen?; dragdown/smearing of silt
0.5 No Nvery loosely consolidated brown silt with abundant decayed leaves+plant matter+green leaf(or algae); entire image=recent dep?; large voids@depth=physical origin; gas ebullition tracks/voids: void w/ worm; dense thin worms in sed; no rpd contrast
0.6 No N very loosely consolidated brown silt with significant fine sand; many decayed leaf frags+ebullition tracks; abundant thin small wormsNo ind water shot=no pen; assume hard bottom=pebbles-rocks (other rep) No ind silt-draped pebbles+rocks>pen; some twigs+plant matter among rocksNo N poorly sorted, variable mixture of pebbles, sand and silt>pen; a few decayed leaves; rpd=indistinct; shellsNo N poorly sorted, variable mixture of pebbles, sand and silt>pen; a few decayed leaves; rpd=indistinct; a few small worms in siltNo N med-coarse sand with significant silt>pen; firm/hard bottom=min pen; a few tubificids; rock in farfield?No N silt with significant amount of fine-med sand; decayed leaves; numerous tubificids @depth; indistinct rpd contrast No N fine to med brown sand with sig. silt>pen; decayed leaves@surf; tubificids@depth; indistinct rpd; floc/detritus in water column above swi No N fine to med brown sand with sig. silt>pen; pebbles+rocks in farfield covered in dense tubesNo ind water shot=no pen=rocks; shallow water station with rocks visible from boat No ind water shot=no pen=rocks; shallow water station with rocks visible from boat No ind no pen; rocks visible; rocks covered with silt+algae; shallow water station with rocks visible from boat No ind no pen; rock visible in farfield; shallow water station with rocks visible from boat No ind water shot=no pen=rocks; shallow water station with rocks visible from boat No ind water shot=no pen=rocks; shallow water station with rocks visible from boat No ind no pen; rocks visible in farfield; rocks covered with silt+algae; shallow water station with rocks visible from boat No ind water shot=no pen=rocks; shallow water station with rocks visible from boat
12
APPENDIX B
Recorded Navigation Fixes For All SPI Sampling Events

Appendix B
Station X-Y Coordinates in NJ State Plane Feet (NAD 83)
Transect Station Easting Northing Transect Station Easting Northing Transect Station Easting NorthingT1 101 597177.76 683166.27 T10 146 587375.12 692193.06 T19 11 590544.97 713402.99T1 102 597553.04 683324.36 T10 147 587404.57 692483.64 T19 12 590777.11 713255.52T1 103 597375.34 683249.07 T10 148 587381.1 692339.7 T19 13 590672.23 713351.31T1 104 597291.2 683210.8 T10 149 587397.2 692267.49 T19 14 590633.27 713387.44T1 105 597493.81 683286.21 T10 150 587405.8 692416.61 T19 15 590732.86 713315.68T2 106 596570.42 685794.95 T11 151 585339 693913.2 T20 16 591948.37 715646.8T2 107 598345.92 686114.25 T11 152 585717.35 694021.68 T20 17 592162.09 715517.57T2 108 597511.7 685981.1 T11 153 585528.85 693969.39 T20 18 592065.11 715579.55T2 109 597066 685909.3 T11 154 585446.7 693920.69 T20 19 592018.68 715614.67T2 110 597822.22 686081.17 T11 155 585616.24 693999.84 T20 20 592113.32 715553.2T3 111 596976.63 688751.16 T12 156 584575.02 696458.08 T21 21 591731.55 718074.7T3 112 597568.42 688580.53 T12 157 584918.71 696499.13 T21 22 591997.85 718114.16T3 113 597334.38 688667.87 T12 158 584784.58 696458.17 T21 23 591878.2 718094.89T3 114 597166.64 688734.31 T12 159 584651.16 696438.09 T21 24 591804.3 718080.87T3 115 597481.99 688664.03 T12 160 584853.66 696479.05 T21 25 591942.44 718104.53T4 116 597533.46 691001.72 T13 96 584778.46 699079.41 T22 31 592788.53 723328.43T4 117 598133.73 690867.57 T13 97 585055.27 699044.14 T22 32 592913.99 723052.12T4 118 597914.87 690915.37 T13 98 584921.94 699049.76 T22 33 592853.76 723183.61T4 119 597756.83 690947.15 T13 99 584851.71 699076.84 T22 34 592831.69 723243.11T4 120 598034.35 690929.74 T13 100 584982.98 699056.99 T22 35 592886.89 723124.39T5 121 597995.88 693539.4 T14 91 585194.13 701739.09 T23 41 596581.82 726212.83T5 122 598505.91 693534.8 T14 92 585488.35 701595.22 T23 42 596746.92 726154.37T5 123 598250.33 693536.02 T14 93 585333.91 701660.87 T23 43 596656.98 726182.64T5 124 598149 693546.78 T14 94 585261.66 701695.21 T23 44 596624.22 726201.27T5 125 598395.95 693540.82 T14 95 585416.24 701647.84 T23 45 596713.51 726176.85T6 126 596317.58 695294.46 T15 56 586607.58 703965.01 T24 61 596119.6 731239.56T6 127 596278.53 695722.7 T15 57 586871.36 703816.55 T24 62 596332.17 731169.36T6 128 596275.45 695600.57 T15 58 586739.19 703891.37 T24 63 596228.81 731211.29T6 129 596233.03 695453.98 T15 59 586663.19 703938.34 T24 64 596180.83 731230.79T6 130 596469.24 695798.98 T15 60 586820.77 703871.21 T24 65 596273.81 731180.95T7 131 594132.83 695160.8 T16 51 587485.6 706462.47 T25 71 597273.65 736231.51T7 132 594089.62 695668.79 T16 52 587796.91 706256.81 T25 72 597442.32 736283.16T7 133 594118.35 695434.15 T16 53 587635.93 706366.2 T25 73 597405.12 736188.63T7 134 594141.48 695328.13 T16 54 587549.97 706409.41 T25 74 597320 736242.5T7 135 594112.11 695565.99 T16 55 587706.19 706282.09 T25 75 597410.81 736268.82T8 136 591704.02 694591.37 T17 1 589166.02 708503.66 T26 81 599666.76 736785.07T8 137 591505.78 694858.94 T17 2 589383.53 708342.28 T26 82 599644.7 736659T8 138 591601.47 694717.8 T17 3 589258.72 708415.46 T26 83 599660.66 736713T8 139 591651.22 694663.2 T17 4 589199.44 708472.31 T26 84 599659.46 736751.1T8 140 591533.8 694808.35 T17 5 589308.03 708386.46 T26 85 599647.96 736689.3T9 141 590078.76 692467.03 T18 6 589361.43 711009.79 T27 167 599662.03 740735.82T9 142 589925.85 692814.6 T18 7 589621.62 710974.81 T27 168 599584.46 740712.24T9 143 590006.77 692631.15 T18 8 589505.34 710993.27 T27 169 599516.15 740705.05T9 144 590022.21 692534.49 T18 9 589433.05 710998.89 T27 170 599625.53 740725.86T9 145 589971.38 692735.44 T18 10 589566.32 710982.34
Related Documents