United States Environmental Protection Agency Office of Research and Development Washington, DC 20460 EPA/540/R-11/002 October 2011 Final Report on the Performance of the Eichrom Technologies Procept ® Rapid Dioxin Assay for Soil and Sediment Samples

Welcome message from author
This document is posted to help you gain knowledge. Please leave a comment to let me know what you think about it! Share it to your friends and learn new things together.
Transcript
United States Environmental ProtectionAgency
Office of Research and Development Washington, DC 20460
EPA/540/R-11/002 October 2011
Final Report on the Performance of the Eichrom Technologies Procept® Rapid Dioxin Assay for Soil and Sediment Samples

EPA/540/R-11/002 October 2011
www.epa.com
Final Report on the Performance of the Eichrom
Technologies Procept® Rapid Dioxin Assay for
Soil and Sediment Samples
Stephen Billets U.S. Environmental Protection Agency National Exposure Research Laboratory
Environmental Sciences Division Characterization and Monitoring Branch
Las Vegas, NV 89119
Although this work was reviewed by EPA and approved for publication, it may not necessarily reflect official Agency policy. Mention of trade names and commercial products does not constitute endorsement or recommendation for use.
U.S. Environmental Protection Agency Office of Research and Development
Washington, DC 20460

ii
Notice
This document was prepared for the U.S. Environmental Protection Agency (EPA) Superfund Innovative Technology Evaluation Program under Contract No. EP-C-05-057 to Battelle Columbus. The document has met the EPA’s requirements for peer and administrative review and has been approved for publication. Mention of corporation names, trade names, or commercial products does not constitute endorsement or recommendation for use.
iii
Abstract
A demonstration of screening technologies for determining the presence of dioxin and dioxin-like compounds in soil and sediment was conducted under the U.S. Environmental Protection Agency’s (EPA’s) Superfund Innovative Technology Evaluation Program in Saginaw, Michigan in 2004. The objectives of the demonstration included evaluating each participating technology’s accuracy, precision, sensitivity, sample throughput, tendency for matrix effects, and cost. The test also included an assessment of how well the technology’s results compared to those generated by established laboratory methods using high-resolution mass spectrometry (HRMS). The demonstration objectives were accomplished by evaluating the results generated by each technology from 209 soil, sediment, and extract samples. The test samples included performance evaluation (PE) samples (i.e., contaminant concentrations were certified or the samples were spiked with known contaminants) and environmental samples collected from 10 different sampling locations. The PE and environmental samples were distributed to the technology developers in blind, random order. One of the participants in the original SITE demonstration was Hybrizyme Corporation, which demonstrated the use of the AhRC PCR™ Kit. The AhRC PCR™ Kit was a technology that reported the concentration of aryl hydrocarbon receptor (AhR) binding compounds in a sample, with units reported as Aryl hydrocarbon receptor Binding Units (AhRBU). At the time of the original demonstration, this particular technology was intended for use as a screening tool to rank samples from those inducing the greatest AhR activity to those inducing the least AhR activity rather than to provide highly quantitative dioxin concentration in units of toxic equivalents (TEQ). After the SITE Dioxin demonstration, this technology was exclusively licensed to Eichrom Technologies. Eichrom focused its efforts on developing optimal sample preparation procedures for the assay and reporting bioanalytical equivalent (BEQ) values instead of AhRBU. BEQ takes into account the response factors for dioxin-like compounds and involves site-specific calibration, whereas AhRBU units represent the analytical output uncorrected for site-specific factors. The technology is now marketed under the trade name Procept® Rapid Dioxin Assay.
Based on the results of the 2004 demonstration, there was significant interest in evaluating the performance of dioxin immunoassays and AhR based-assays on a site-specific basis. Consequently, a second test was conducted in 2006 in which the developers were given a total of 112 samples that were segregated by site of origin. In contrast to the original demonstration, in which all sample information was unknown, environmental information for each site was provided to the developers to more closely represent the background information that would be available to contractors supporting a site-specific application. Each batch included some samples previously analyzed as part of the 2004 study, unique samples in archive that were not used as part of the 2004 study, replicates, and quality control (QC) samples. The developers were given the HRMS data from the 2004 study so that they would have the opportunity to utilize a site-specific calibration and knowledge regarding typical congener patterns at a particular site. Data analysis focused on analytical performance on a site-specific basis, and included an evaluation of comparability to the HRMS total dioxin/furan toxic equivalents (TEQD/F) results, precision on replicate analyses, and QC sample results. The “Interim Report” was published in January 2007, with the expectation that a follow-on study of the performance of the Eichrom Procept® Rapid Dioxin Assay would be conducted as a final evaluation of the optimized technology.
This report describes the experimental design of the follow-on site-specific study that was performed similarly to the second study in that samples were grouped and analyzed on a site-specific basis. However, samples from additional sites were included in the study, and Eichrom utilized an optimized method for its Procept® Rapid Dioxin Assay analyses.
iv
Contents
Page Chapter 1: Introduction ................................................................................................................................ 1
1.1 Background ............................................................................................................................ 1 1.1.1 EPA Superfund Innovative Technology Evaluation (SITE) Monitoring and
Measurement Technology (MMT) Program-Phase 1 ............................................... 1 1.1.2 Site-Specific Study-Phase 2 ...................................................................................... 2 1.1.3 Extended Site-Specific Study with Eichrom-Phase 3 ............................................... 3
1.2 Overview of the Report .......................................................................................................... 3 Chapter 2: Analytical Methods .................................................................................................................... 4
2.1 Eichrom Technologies Procept® Rapid Dioxin Assay .......................................................... 4 2.1.1 Sample Preparation ................................................................................................... 7
2.1.1.1 Reagents ..................................................................................................... 7 2.1.1.2 Sample Pretreatment ................................................................................... 7 2.1.1.3 Extraction ................................................................................................... 7 2.1.1.4 Evaporation and Solvent Exchange ............................................................ 8 2.1.1.5 Column Purification ................................................................................... 8
2.1.2 Sample Analysis ........................................................................................................ 9 2.1.2.1 Preparation of Capture Strips ..................................................................... 9 2.1.2.2 Reaction of Samples and Standards with Ah-Receptor (performed
while capture strips are on the plate shaker) .............................................. 9 2.1.2.3 Addition of Reaction Mixture to Capture Strips ...................................... 10 2.1.2.4 Polymerase Chain Reaction (PCR) .......................................................... 10
2.1.3 Quality Control ....................................................................................................... 11 2.1.4 Data Presentation and Results ................................................................................. 11
2.2 GC-MS Methods .................................................................................................................. 12 2.2.1 Sample Extraction .................................................................................................. 14 2.2.2 Sample Cleanup ...................................................................................................... 14 2.2.3 Sample Analysis ...................................................................................................... 14 2.2.4 Quality Control ....................................................................................................... 15 2.2.5 Data Presentation and Results ................................................................................. 15
2.3 Comparison of Procept® and GC-MS Methods .................................................................. 15 Chapter 3: Experimental Design ................................................................................................................ 18
3.1 Overview of Sampling Sites ................................................................................................. 18 3.2 Site Descriptions .................................................................................................................. 19
3.2.1 Midland Soil ............................................................................................................ 19 3.2.2 Newark Bay Sediment ............................................................................................ 19 3.2.3 Solutia Soil .............................................................................................................. 19 3.2.4 American Creosote Works (ACW), Residential and Wood Treatment Soil ........... 20 3.2.5 Budd Inlet Sediment ................................................................................................ 20 3.2.6 Cap Sante Boat Haven Harbor Sediment ................................................................ 20
3.3 Data Analysis ....................................................................................................................... 20 3.3.1 Comparability .......................................................................................................... 21 3.3.2 Precision .................................................................................................................. 21 3.3.3 False Positives/Negatives ........................................................................................ 21
Chapter 4: Results and Discussion ............................................................................................................. 22
4.1 Comparability and Precision ................................................................................................ 22
v
4.1.1 Midland Soil ............................................................................................................ 23 4.1.2 Newark Bay Sediment ............................................................................................ 24 4.1.3 Solutia Soil .............................................................................................................. 24 4.1.4 ACW Wood Treatment Soil .................................................................................... 25 4.1.5 ACW Residential Samples ...................................................................................... 25 4.1.6 Budd Inlet Sediment ................................................................................................ 26 4.1.7 Cap Sante Boat Haven Harbor Sediment ................................................................ 27 4.1.8 Summary of Results ................................................................................................ 27
4.2 False Positive/Negative Evaluation ...................................................................................... 28 4.3 Operational Factors .............................................................................................................. 28
4.3.1 Cost of Procept® Rapid Dioxin Assay ................................................................... 28 4.3.2 Cost Comparison to HRMS Methods ..................................................................... 30 4.3.3 Availability of Technology ..................................................................................... 30 4.3.4 Turnaround .............................................................................................................. 31 4.3.5 Training/Ease of Use for Procept® Assay ............................................................... 32
Chapter 5: Conclusions .............................................................................................................................. 33 Chapter 6: References ................................................................................................................................ 34

vi
List of Tables
Page
Table 2-1. Comparison of Procept® Response Factors to WHO Toxic Equivalency Factors (TEF) ...... 13 Table 2-2. Summary of HRMS Method Modifications Relative to Traditional EPA Method 1613B .... 14 Table 2-3. Comparison between Procept® and GC-MS Methods ........................................................... 16 Table 3-1. Summary of Dioxin-Contaminated Study Samples ............................................................... 18 Table 4-1. Results for Midland Samples ................................................................................................. 23 Table 4-2. Results for Newark Bay Samples .......................................................................................... 24 Table 4-3. Results for Solutia Samples ................................................................................................... 25 Table 4-4. Results for ACW Wood Treatment Samples ......................................................................... 25 Table 4-5. Results for ACW Residential Samples .................................................................................. 26 Table 4-6. Results for Budd Inlet Samples ............................................................................................. 26 Table 4-7. Results for Cap Sante Boat Haven (Harbor) Samples ........................................................... 27 Table 4-8. Summary of Results ............................................................................................................... 27 Table 4-9. False Positive (FP)/False Negative (FN) Evaluation Relative to Draft Interim Remediation
Goal of 72 pg/g TEQ ............................................................................................................. 29 Table 4-10. Capital Equipment Costs for the Procept® Assay .................................................................. 30 Table 4-11. Chemicals and Supplies Cost for Procept® Assay ................................................................. 31 Table 4-12. Estimation of Sample Turnaround Time Using Procept® Assay ........................................... 32
List of Figures Page
Figure 2-1. Procept® Sample Preparation and Cleanup .............................................................................. 5 Figure 2-2. Procept® Assay Procedure ........................................................................................................ 6 Figure 2-3. Procept® Dioxin Assay Kit ....................................................................................................... 7 Figure 4-1. BEQ vs TEQ with Site-Specific Correction ............................................................................ 22 Figure 4-2. BEQ vs TEQ without Site-Specific Correction ....................................................................... 23

vii
Abbreviations, Acronyms, and Symbols
AhR aryl hydrocarbon receptor
AhRBU aryl hydrocarbon receptor binding units
ASE accelerated solvent extraction
ATSDR Centers for Disease Control’s Agency for Toxic Substances and Disease Registry
BEQ bioanalytical equivalent (Procept® reporting units) D/F dioxin/furan
D/QAPP demonstration and quality assurance project plan
DQO data quality objective
EPA Environmental Protection Agency
ERA Environmental Resource Associates
g gram
GC gas chromatography
GC-MS gas chromatography-mass spectrometry
HRMS high-resolution mass spectrometry
ITVR innovative technology verification report
LRMS low resolution mass spectrometry
MDEQ Michigan Department of Environmental Quality
MMT Monitoring and Measurement Technology
MS mass spectrometry
NERL National Exposure Research Laboratory
NIST National Institute for Standards and Technology
ORD Office of Research and Development
PAH polycyclic aromatic hydrocarbon
PCB polychlorinated biphenyl

viii
PCDD/F polychlorinated dibenzo-p-dioxin/dibenzofuran
PE performance evaluation
pg pictogram
PCR polymerase chain reaction
ppt parts per trillion; picogram/g; pg/g
QA/QC quality assurance/quality control
RPD relative percent difference
RSD relative standard deviation
SITE Superfund Innovative Technology Evaluation
TAT turnaround time
TCDD tetrachlorodibenzo-p-dioxin
TCDF tetrachlorodibenzofuran
TEF toxic equivalency factor
TEQ toxic equivalent
TEQD/F total toxic equivalents of dioxins/furans
WHO World Health Organization

ix
Acknowledgements This report was prepared by Battelle Columbus Laboratories under the technical direction and administration of Amy Dindal. The authors of this report wish to thank the technology developer, Eichrom Technologies, in particular Dan McAlister, Larry Jassin, and Mike Fern, for their participation in this study and for their review of this report. The EPA NERL also thanks the following peer reviewers for their comments on this report: John Zimmerman, U.S. EPA and Ronan Cariou, ONIRIS Laberca France.
1
Chapter 1 Introduction
1.1 Background
Conventional analytical methods for determining concentrations of dioxin and dioxin-like compounds are time-consuming and costly. For example, U.S. Environmental Protection Agency (EPA) standard methods require solvent extraction of the sample, processing the extract through multiple cleanup columns, and analyzing the cleaned fraction by gas chromatography (GC)/high-resolution mass spectrometry (HRMS). Turnaround times for HRMS results are typically three weeks. Use of these traditional methods for high volume sampling or screening a contaminated site often is limited by budgetary constraints. The cost of these analyses can range from $800 to $1,200 per sample, depending on the method selected, the level of quality assurance/quality control incorporated into the analyses, and reporting requirements. The use of a simple, rapid (i.e., real-time or near real-time), cost-effective analytical method would allow field personnel to quickly assess the extent of contamination at a site and could be used to direct or monitor remediation or risk assessment activities. This data could be used to provide immediate feedback on potential health risks associated with the site and permit the development of a more focused and cost-effective sampling strategy.
The EPA Office of Research and Development (ORD), National Exposure Research Laboratory (NERL) contracted with Battelle (Columbus, OH) to conduct a demonstration of monitoring and measurement technologies for dioxin and dioxin-like compounds in soil and sediment. This performance study was conducted in three phases.
1.1.1 EPA Superfund Innovative Technology Evaluation (SITE) Monitoring and Measurement Technology (MMT) Program- Phase 1
In the first phase, five technology developers participated in demonstration under the EPA Superfund Innovative Technology Evaluation (SITE) Monitoring and Measurement Technology (MMT) Program (referred to as the “original demonstration” throughout this report). The participating technologies included immunoassay test kits and aryl hydrocarbon receptor (AhR)-based assays. A field demonstration of the technologies was conducted in Saginaw, MI in April 2004. A test suite of 209 soil, sediment, and extract samples with a variety of distinguishing characteristics, such as high levels of polychlorinated biphenyls (PCBs) and polycyclic aromatic hydrocarbons (PAHs), was analyzed by each developer as described in the project’s demonstration plan (U.S. EPA, 2004). Samples were collected from 10 different sites around the country with a known variety of dioxin-contaminated soil and sediment. Samples were identified and supplied through EPA Regions 2, 3, 4, 5, and 7 and the Michigan Department of Environmental Quality (MDEQ). In addition to providing environmental samples, MDEQ also facilitated access to the field demonstration site and provided on-site technical and logistical support. The samples were homogenized and characterized by HRMS prior to use in the original SITE demonstration to ensure a variety of homogeneous, environmentally derived samples with concentrations over a large dynamic range (< 50 to > 10,000 picogram/gram [pg/g]) were included. The environmental samples comprised 61% of the test samples (128 of the 209 samples) included in the original SITE demonstration. Performance evaluation (PE) samples were obtained from five commercial sources. PE samples consisted of known quantities of dioxin and dioxin-like compounds. Fifty-eight of the 209 demonstration samples (28%) were PE samples. Soil or sediment samples were extracted with toluene using Dean Stark Soxhlet extraction, and aliquots were provided to each of the five study participants to avoid possible variation due to sample heterogeneity. A total of 23 extracts (11% of the total number of samples) was included in the original SITE demonstration. For the 209 samples, sample type and sampling site were unknown to the developer during the analysis in order to challenge the technologies with a variety of matrices and potential interferences in an unbiased way. During planning, the Demonstration Panel (which included all
2
of the developers and approximately 20 EPA Regional experts) discussed providing identifying information the environmental site associated with each sample prior to submission for analysis, but concluded that all samples should be analyzed in a blind fashion. Also, all developers refused additional sample information when it was offered to them prior to the demonstration. An EPA innovative technology verification report (ITVR) was published for each technology (U.S. EPA, 2005a, b, c, d, e). Each report is posted on an EPA Web Site (http://www.epa.gov/nrmrl/lrpcd/site/pubsMMP.html).
The results of the original demonstration suggested that all of the technologies could be used in some capacity to screen for sample concentrations above and below threshold values (e.g., less than or greater than 1,000 pg toxic equivalents (TEQ)/g). However, none of the tested technologies demonstrated a significantly high correlation with the HRMS data. After publication of the SITE reports and dissemination of the information through seminars and conference presentations, subsequent feedback from the developers and from potential users of the technologies indicated significant interest in evaluating the performance of these technologies on a site-specific basis. The consensus was that, if the technology developers had more information about the sample identities (for example, sample site) and had access to historical analytical information, the results from the screening technologies would be more highly correlated to the HRMS results. Since this type of information (sample location and dioxin congeners) would typically be made available during a site characterization, this approach was adopted and a second study was launched.
1.1.2 Site-Specific Study- Phase 2
Phase 2 of the performance study (referred to as the “site-specific study”) was conducted in May 2006. All past participants in the original SITE demonstration were invited to participate in the site-specific study, and three developers did so. The study was conducted in each of the developer’s laboratories, rather than a central demonstration site, since the experiences of the original SITE demonstration suggested that these were primarily laboratory-based technologies that could be mobilized in a field environment. The developers were given a total of 112 samples that were segregated by site and asked to report sample concentration in terms of total TEQD/F. (Only dioxin and furan concentrations were evaluated due to the limited range of PCB concentrations in the samples that were available for this study). In contrast to the original SITE demonstration in which all sample information was unknown, environmental information for each site was provided to the developers. Samples were obtained from archived samples from the original SITE demonstration. Each batch included some samples previously analyzed as part of the original SITE demonstration and additional samples in archive along with replicates and one quality control (QC) sample per site batch. The developers were provided with the HRMS TEQD/F concentration and dioxin congener data for the QC sample only. This provided the developers with an opportunity to calibrate their results on a site-specific basis using the HRMS data from the QC sample for each site. Data analysis focused on analytical performance on a site-specific basis, and included an evaluation of comparability to the HRMS total dioxin/furan toxic equivalents (TEQD/F) results, precision on replicate analyses, and QC sample results. One of the participants in the site-specific study was the Procept® Rapid Dioxin Assay by Eichrom Technologies (referred to as Procept® throughout the report). Eichrom analyzed the 112 samples for this study and reported results within one month. After reviewing the initial results, Eichrom determined that an additional purification step would improve the accuracy and precision of the results. Eichrom did not re-extract all 112 samples, but rather took the existing extracts through the additional purification step and re-assayed the samples by PCR.
The results from the second study were reported in an EPA report (U.S. EPA, 2007a). The report was titled the “Interim Report” since Eichrom Technologies intended to continue optimizing their analytical approach and then participate in another EPA performance study. The results described in the Interim Report indicated that there was no overall significant pattern of positive or negative bias relative to the HRMS method results. The relative recovery values were both above and below 100%, but three of the
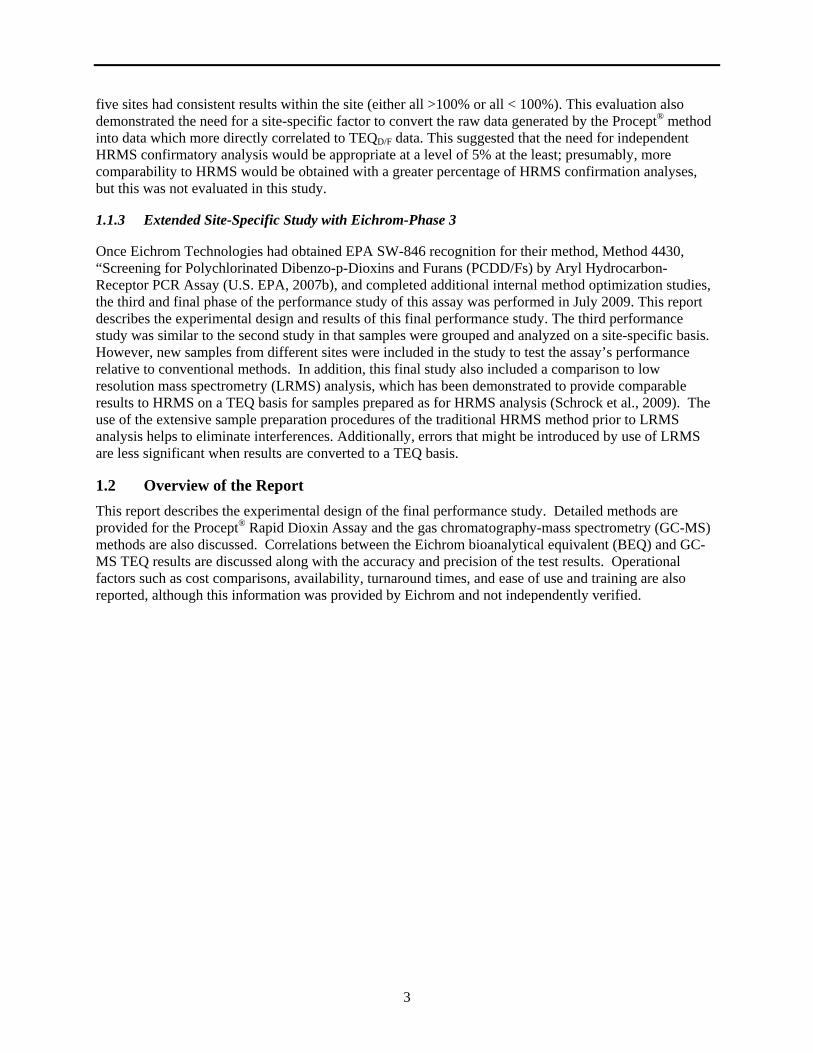
3
five sites had consistent results within the site (either all >100% or all < 100%). This evaluation also demonstrated the need for a site-specific factor to convert the raw data generated by the Procept® method into data which more directly correlated to TEQD/F data. This suggested that the need for independent HRMS confirmatory analysis would be appropriate at a level of 5% at the least; presumably, more comparability to HRMS would be obtained with a greater percentage of HRMS confirmation analyses, but this was not evaluated in this study.
1.1.3 Extended Site-Specific Study with Eichrom-Phase 3
Once Eichrom Technologies had obtained EPA SW-846 recognition for their method, Method 4430, “Screening for Polychlorinated Dibenzo-p-Dioxins and Furans (PCDD/Fs) by Aryl Hydrocarbon-Receptor PCR Assay (U.S. EPA, 2007b), and completed additional internal method optimization studies, the third and final phase of the performance study of this assay was performed in July 2009. This report describes the experimental design and results of this final performance study. The third performance study was similar to the second study in that samples were grouped and analyzed on a site-specific basis. However, new samples from different sites were included in the study to test the assay’s performance relative to conventional methods. In addition, this final study also included a comparison to low resolution mass spectrometry (LRMS) analysis, which has been demonstrated to provide comparable results to HRMS on a TEQ basis for samples prepared as for HRMS analysis (Schrock et al., 2009). The use of the extensive sample preparation procedures of the traditional HRMS method prior to LRMS analysis helps to eliminate interferences. Additionally, errors that might be introduced by use of LRMS are less significant when results are converted to a TEQ basis.
1.2 Overview of the Report
This report describes the experimental design of the final performance study. Detailed methods are provided for the Procept® Rapid Dioxin Assay and the gas chromatography-mass spectrometry (GC-MS) methods are also discussed. Correlations between the Eichrom bioanalytical equivalent (BEQ) and GC-MS TEQ results are discussed along with the accuracy and precision of the test results. Operational factors such as cost comparisons, availability, turnaround times, and ease of use and training are also reported, although this information was provided by Eichrom and not independently verified.
4
Chapter 2 Analytical Methods
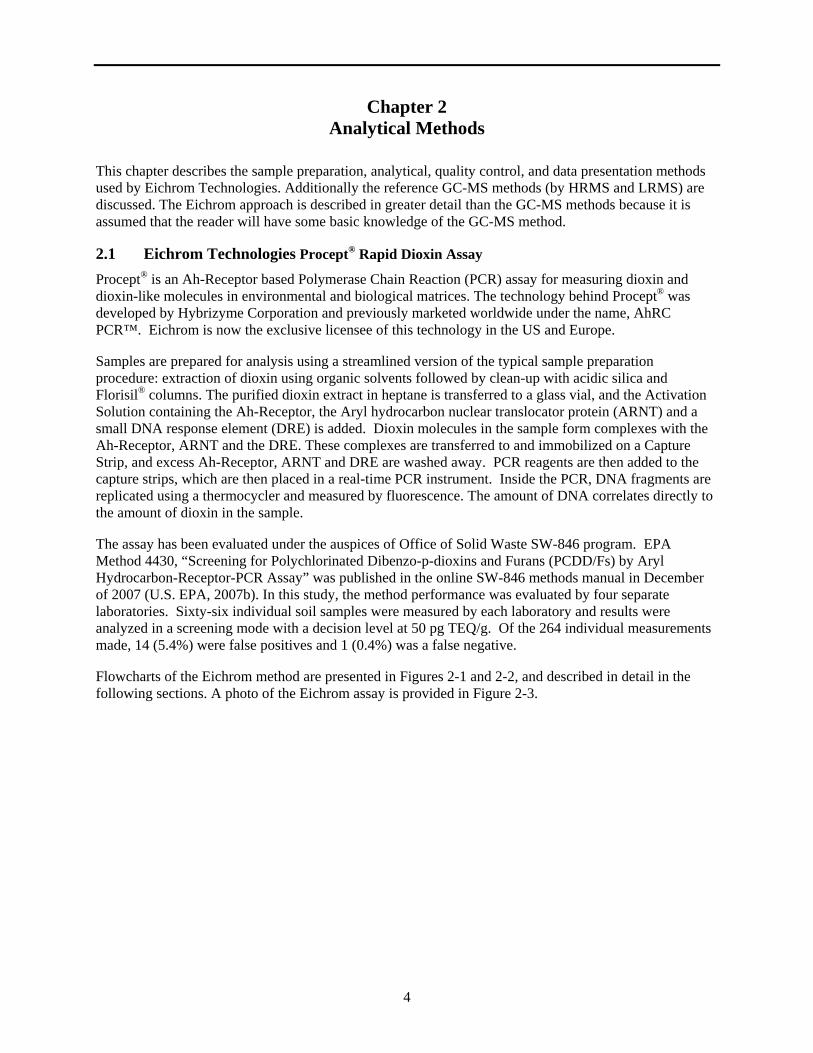
This chapter describes the sample preparation, analytical, quality control, and data presentation methods used by Eichrom Technologies. Additionally the reference GC-MS methods (by HRMS and LRMS) are discussed. The Eichrom approach is described in greater detail than the GC-MS methods because it is assumed that the reader will have some basic knowledge of the GC-MS method.
2.1 Eichrom Technologies Procept® Rapid Dioxin Assay
Procept® is an Ah-Receptor based Polymerase Chain Reaction (PCR) assay for measuring dioxin and dioxin-like molecules in environmental and biological matrices. The technology behind Procept® was developed by Hybrizyme Corporation and previously marketed worldwide under the name, AhRC PCR™. Eichrom is now the exclusive licensee of this technology in the US and Europe.
Samples are prepared for analysis using a streamlined version of the typical sample preparation procedure: extraction of dioxin using organic solvents followed by clean-up with acidic silica and Florisil® columns. The purified dioxin extract in heptane is transferred to a glass vial, and the Activation Solution containing the Ah-Receptor, the Aryl hydrocarbon nuclear translocator protein (ARNT) and a small DNA response element (DRE) is added. Dioxin molecules in the sample form complexes with the Ah-Receptor, ARNT and the DRE. These complexes are transferred to and immobilized on a Capture Strip, and excess Ah-Receptor, ARNT and DRE are washed away. PCR reagents are then added to the capture strips, which are then placed in a real-time PCR instrument. Inside the PCR, DNA fragments are replicated using a thermocycler and measured by fluorescence. The amount of DNA correlates directly to the amount of dioxin in the sample.
The assay has been evaluated under the auspices of Office of Solid Waste SW-846 program. EPA Method 4430, “Screening for Polychlorinated Dibenzo-p-dioxins and Furans (PCDD/Fs) by Aryl Hydrocarbon-Receptor-PCR Assay” was published in the online SW-846 methods manual in December of 2007 (U.S. EPA, 2007b). In this study, the method performance was evaluated by four separate laboratories. Sixty-six individual soil samples were measured by each laboratory and results were analyzed in a screening mode with a decision level at 50 pg TEQ/g. Of the 264 individual measurements made, 14 (5.4%) were false positives and 1 (0.4%) was a false negative.
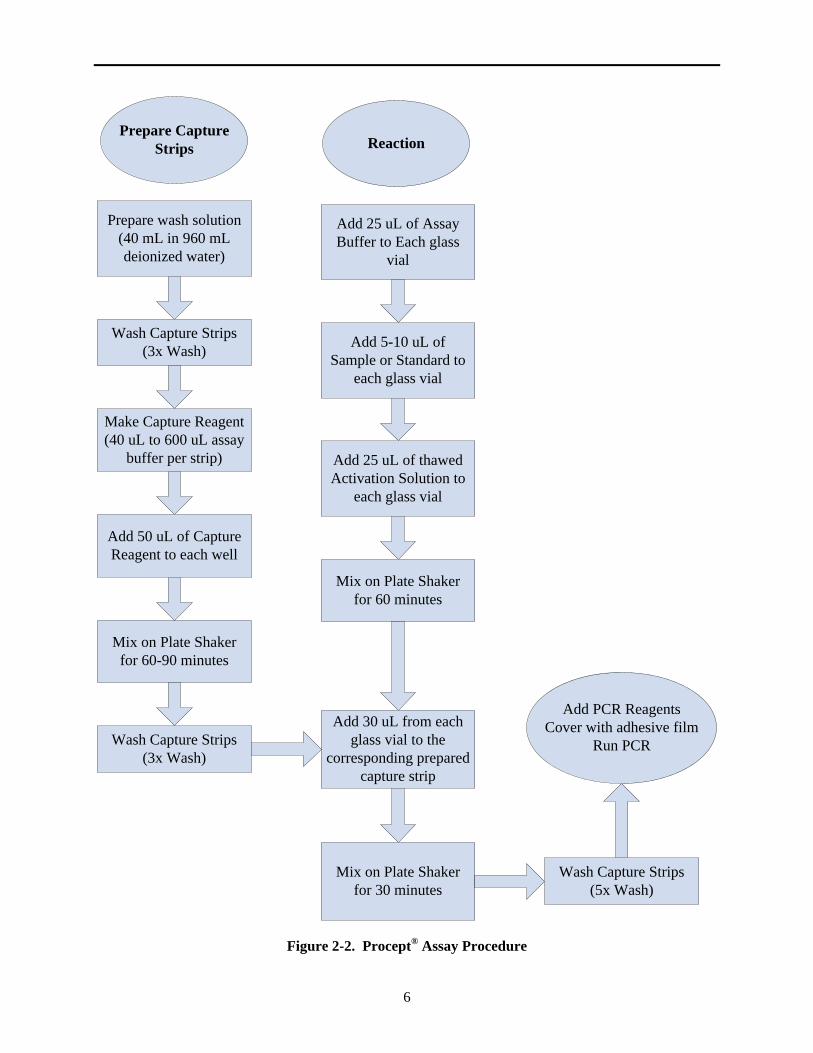
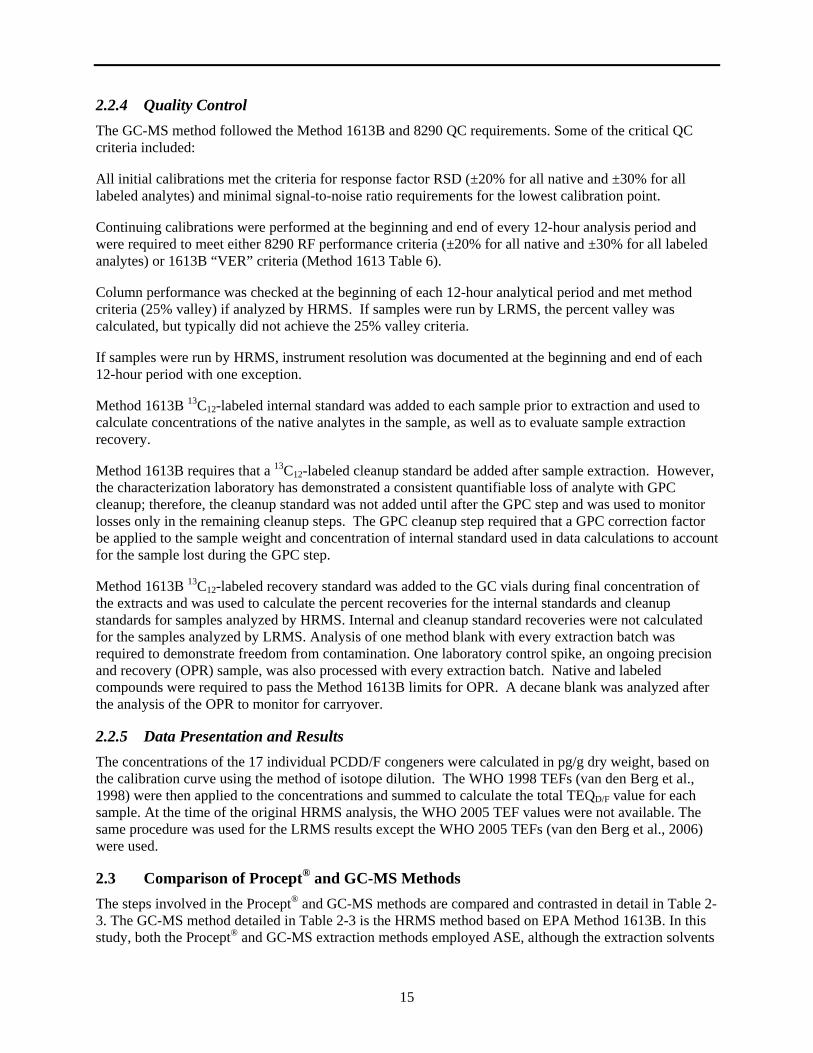
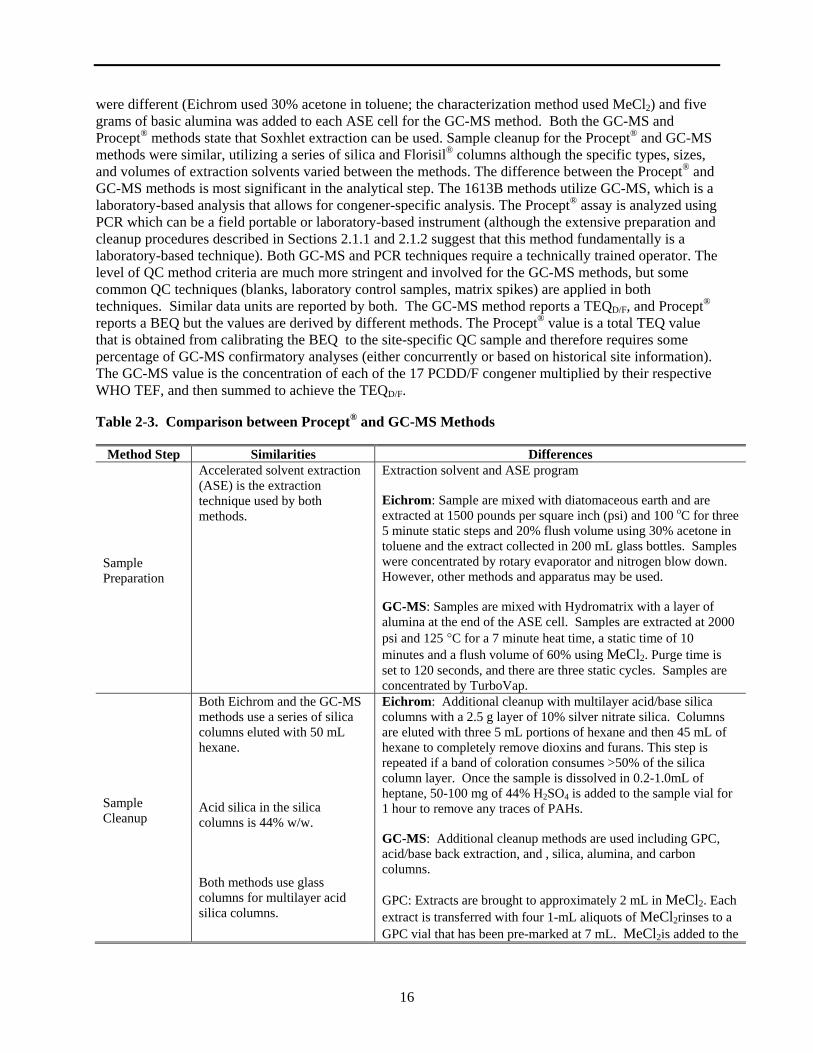
Flowcharts of the Eichrom method are presented in Figures 2-1 and 2-2, and described in detail in the following sections. A photo of the Eichrom assay is provided in Figure 2-3.

5
Figure 2-1. Procept® Sample Preparation and Cleanup
2) Sample + 5 g 44% H 2 SO4 Silica3) Rinse vial3x 5 mL hexane 4) Rinse column 45 mL hexane
(2) (3) (4)
7) 10 mL 2% MeCl2 in hexane 8) 10 mL 5% MeCl2 in hexane 9) 15 mL 50% MeCl2 in hexane
(9) Collect in tube or beaker
Redissolve in 0 .2 - 1 mL of
heptane
Evaporate and add 50-
100 mg 44% H2 SO 4 Silica
2.5g 10%
AgNO3
Silica
1g Silica1 g
2% KOHSilica
**Optional PCB Separation**
Collect in tube orbeaker
Redissolve in 0 . 2-1 mL of
heptane
Evaporate and add 25 - 50 mg 44%
H 2 SO4 Silica
Dry Soil Sample at 110 ⁰ C for a minimum of 12
hours
Homogenize sample and weigh 15-30 gAliquot for extraction
Extract sample using validatedmethod, such as ASE , 30%
acetone in toluene
, 150 ⁰C, 1500
psi , 2 - 3
five min static steps , 60% flush volume
Solvent Exchange to 10- 20 mL of hexane
Transfer to 40 mL vial, with 5 mL of
MeCl2 , add 5 g of 22% H 2 SO4 Silica
Mix 1 - 2 Hours
Pretreatment / Extraction
1 ) 25 mL hexane
ColumnPurification
Na2SO4
8 g 44%H2 SO4
Silica
Glass Wool
1g SilicaGlass Wool
Na2SO
4
Glass Wool
2.5 g Florisil
Glass Wool
1 ) Waste
1 ) 10 mL hexane
( 1 ) (2 ) (3 ) ( 4) (5) (6) (7 ) (8 ) Waste
6
Prepare Capture Strips
Prepare wash solution(40 mL in 960 mL deionized water)
Wash Capture Strips(3x Wash)
Make Capture Reagent(40 uL to 600 uL assay
buffer per strip)
Add 50 uL of Capture Reagent to each well
Mix on Plate Shaker for 60-90 minutes
Wash Capture Strips(3x Wash)
Reaction
Add 25 uL of Assay Buffer to Each glass
vial
Add 5-10 uL of Sample or Standard to
each glass vial
Add 25 uL of thawed Activation Solution to
each glass vial
Mix on Plate Shaker for 60 minutes
Add 30 uL from each glass vial to the
corresponding prepared capture strip
Mix on Plate Shaker for 30 minutes
Wash Capture Strips(5x Wash)
Add PCR ReagentsCover with adhesive film
Run PCR
Figure 2-2. Procept® Assay Procedure

7
2.1.1 Sample Preparation
This section includes the sample extraction and cleanup methods employed.
2.1.1.1 Reagents
Hexane: ENVISOLV, >95% (Sigma no. 34412)
Heptane: CHROMASOLV, >99% (Sigma no. 34873)
Methylene chloride: CHROMASOLV, 99.8% (Sigma no. 34411)
Toluene: ENVISOLV, 99.7% (Sigma no. 34413)
Acetone: ENVISOLV, 99.8% (Sigma no. 34410)
Silica: For Column Chromatography 60 (Fluka no. 60741)
Florisil®: 100-200 mesh (Sigma no. 20281)
Sulfuric acid: Reagent Grade, ACS (Acros no. AC42452)
Diatomaceous earth: Sample Dispersant (Dionex no. 062819)
DNase-free water: (Acros no. AC32739)
De-ionized water: Milli-Q2 System (or equivalent)
Potassium Hydroxide: Certified ACS Grade (Fisher no. P250-1)
Sodium sulfate: Reagent Grade, ACS, anhydrous (Sigma no. 239313)
PCR Master Mix: Taqman Universal PCR Mastermix (Applied Biosystems no. 431857)
Procept® Rapid Dioxin Assay: Eichrom Technologies, Inc.
2.1.1.2 Sample Pretreatment
(Note: This sample preparation step would be necessary for actual samples but was not used in this study since the samples were dried/homogenized prior to analysis.)
Determination of percent solids: Dry a glass vial at 110 oC for 12 hours; cool in a dessicator for each sample to be analyzed. Weigh 15-30 grams (g) of soil into the dried vial. Dry for a minimum of 12 hours at 110 oC and cool in a dessicator. Calculate percent solids as follows:
% solids = (weight of sample after drying)/(weight of sample before drying) x 100% (eq. 2-1)
2.1.1.3 Extraction
Any approved method for the extraction of PCDD/F from soil can be used, including Soxhlet and pressurized fluid extraction. The conditions for pressurized fluid extraction with a Dionex ASE100 used to generate the data in this report are given below.
Place a glass fiber filter into a 34 mL stainless steel extraction cell and add 3-5 g of diatomaceous earth sample dispersant.
Figure 2-3. Procept® Dioxin Assay Kit

8
Add the sample to the extraction cell and fill the remaining volume with diatomaceous earth sample dispersant. Seal the cell by hand tightening the top and bottom caps.
Three static cycles of five minutes and flush with 20% of the cell volume with 3:7 acetone:toluene. Flush for 60 seconds with nitrogen (no solvent). Collect in 200 mL glass bottle.
2.1.1.4 Evaporation and Solvent Exchange
Use a validated method for solvent exchange from acetone:toluene to hexane and concentration to 20 mL. Listed below is an example method, using a rotary evaporator. However, other methods and equipment may also be used.
Rinse all glassware, including disposable vials and test tubes, with methylene chloride (MeCl2). Evaporate the acetone/toluene to approximately 5 mL at 35 oC using rotary evaporator and transfer to 40 mL glass vials with three 5 mL portions of MeCl2.
Complete the solvent evaporation using a gentle stream of air while heating at 35 oC (sand bath) and add 20 mL of hexane.
2.1.1.5 Column Purification
Add 5 g of 22% H2SO4 silica to extracts and mix by shaking. Allow the extract/22% H2SO4 silica mixture to sit for 1-2 hours before column purification.
Pack and precondition a multilayer silica column and a Florisil® column (if PCB separation is required), immediately prior to use. Note that the Florisil® column was not utilized for this study.
- Silica column (50 mL glass serological pipette, bottom to top): glass wool plug, 1 g washed silica, 2.5 g 10% AgNO3 silica, 1 g 2% KOH silica, 1 g washed silica, 8 g 44% H2SO4 silica, 2.5 g dry Na2SO4, glass wool plug. The most up to date recommended column compositions and elution parameters can be found on the Eichrom web site (www.eichrom.com)
- Silica columns were prewashed with 25 mL of hexane. - Florisil® column (25 mL glass serological pipette, bottom to top): glass wool plug, 2.5 g Florisil®
(washed by ASE, 50% MeCl2 in hexane, dried 24 hours at 140 oC, cooled and stored in a dessicator), 1.5 g dry Na2SO4, glass wool plug.
- Florisil® column prewashed with 10 mL of hexane
Set up silica columns in a fume hood. Place a clean labeled 150 mL glass beaker under each silica column.
Slurry the extract/H2SO4 silica mixture and add it to the top of the silica column.
Use three portions of 5 mL hexane to complete the transfer of the extract to the silica column. Collect in a 150 mL glass beaker.
When the solvent level reaches the top of the silica column bed, add 45 mL of hexane to the silica column to complete the dioxin/furan elution. When the solvent level reaches the top of the silica column bed, note the coloration of the 44% H2SO4 silica and 10% AgNO3 silica layers. If a dark band of coloration consumes >50% of the layer, concentrate the collected extract to ~20 mL and repeat with another silica column. If PCB separation is required, continue with a Florisil® column. If no PCB separation is required,
9
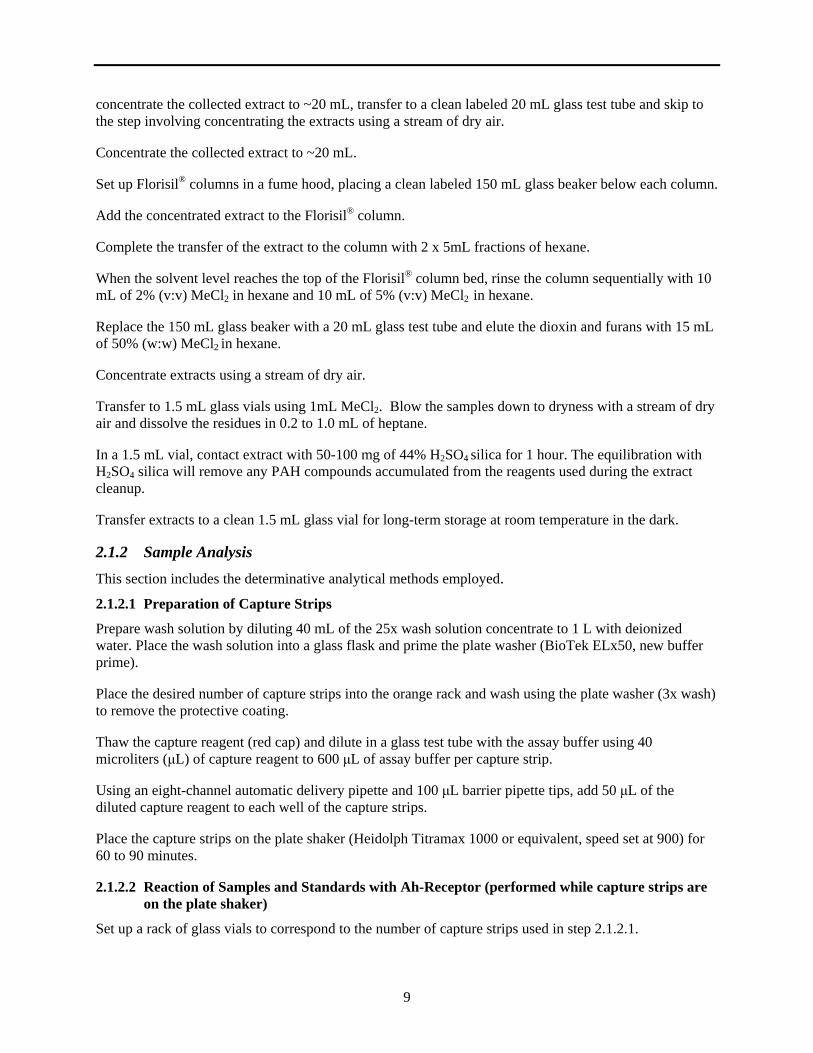
concentrate the collected extract to ~20 mL, transfer to a clean labeled 20 mL glass test tube and skip to the step involving concentrating the extracts using a stream of dry air.
Concentrate the collected extract to ~20 mL.
Set up Florisil® columns in a fume hood, placing a clean labeled 150 mL glass beaker below each column.
Add the concentrated extract to the Florisil® column.
Complete the transfer of the extract to the column with 2 x 5mL fractions of hexane.
When the solvent level reaches the top of the Florisil® column bed, rinse the column sequentially with 10 mL of 2% (v:v) MeCl2 in hexane and 10 mL of 5% (v:v) MeCl2 in hexane.
Replace the 150 mL glass beaker with a 20 mL glass test tube and elute the dioxin and furans with 15 mL of 50% (w:w) MeCl2 in hexane.
Concentrate extracts using a stream of dry air.
Transfer to 1.5 mL glass vials using 1mL MeCl2. Blow the samples down to dryness with a stream of dry air and dissolve the residues in 0.2 to 1.0 mL of heptane.
In a 1.5 mL vial, contact extract with 50-100 mg of 44% H2SO4 silica for 1 hour. The equilibration with H2SO4 silica will remove any PAH compounds accumulated from the reagents used during the extract cleanup.
Transfer extracts to a clean 1.5 mL glass vial for long-term storage at room temperature in the dark.
2.1.2 Sample Analysis
This section includes the determinative analytical methods employed.
2.1.2.1 Preparation of Capture Strips
Prepare wash solution by diluting 40 mL of the 25x wash solution concentrate to 1 L with deionized water. Place the wash solution into a glass flask and prime the plate washer (BioTek ELx50, new buffer prime).
Place the desired number of capture strips into the orange rack and wash using the plate washer (3x wash) to remove the protective coating.
Thaw the capture reagent (red cap) and dilute in a glass test tube with the assay buffer using 40 microliters (μL) of capture reagent to 600 μL of assay buffer per capture strip.
Using an eight-channel automatic delivery pipette and 100 μL barrier pipette tips, add 50 μL of the diluted capture reagent to each well of the capture strips.
Place the capture strips on the plate shaker (Heidolph Titramax 1000 or equivalent, speed set at 900) for 60 to 90 minutes.
2.1.2.2 Reaction of Samples and Standards with Ah-Receptor (performed while capture strips are on the plate shaker)
Set up a rack of glass vials to correspond to the number of capture strips used in step 2.1.2.1.
10
Add 25 μL of assay buffer to each glass vial (8-channel automatic delivery pipette and 100 μL barrier pipette tips).
Add 5-10 μL of the purified sample extract or standard to each glass vial (0.1 to 20 μL automatic delivery pipette and barrier pipette tips).
Thaw one vial of the activation solution (stored at -80 oC or in a liquid nitrogen Dewar) for each 2 strips used in step 2.1.2.1.
Mix multiple vials of activation solution together and transfer to a plastic multi-channel pipetting boat.
Add 25 μL of activation solution to each glass reaction vial (8-channel automatic delivery pipette and 100 μL barrier pipette tips).
Place the rack of glass reaction vials on the plate shaker for 60 minutes.
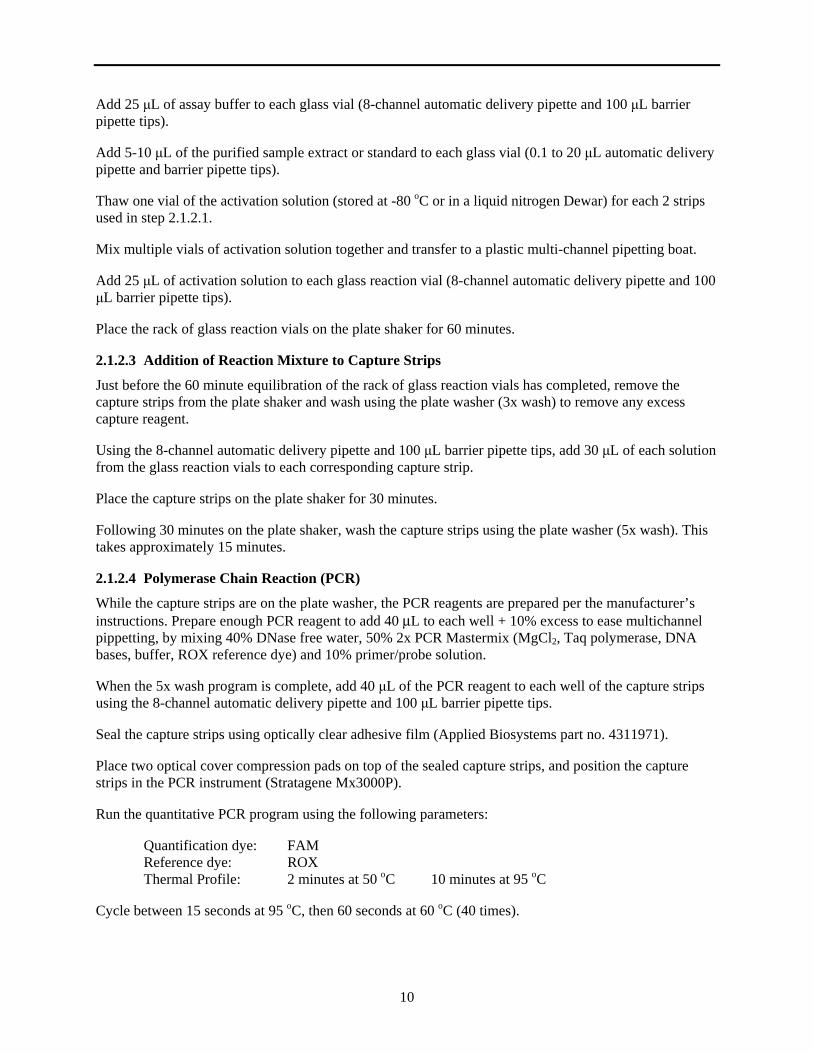
2.1.2.3 Addition of Reaction Mixture to Capture Strips
Just before the 60 minute equilibration of the rack of glass reaction vials has completed, remove the capture strips from the plate shaker and wash using the plate washer (3x wash) to remove any excess capture reagent.
Using the 8-channel automatic delivery pipette and 100 μL barrier pipette tips, add 30 μL of each solution from the glass reaction vials to each corresponding capture strip.
Place the capture strips on the plate shaker for 30 minutes.
Following 30 minutes on the plate shaker, wash the capture strips using the plate washer (5x wash). This takes approximately 15 minutes.
2.1.2.4 Polymerase Chain Reaction (PCR)
While the capture strips are on the plate washer, the PCR reagents are prepared per the manufacturer’s instructions. Prepare enough PCR reagent to add 40 μL to each well + 10% excess to ease multichannel pippetting, by mixing 40% DNase free water, 50% 2x PCR Mastermix (MgCl2, Taq polymerase, DNA bases, buffer, ROX reference dye) and 10% primer/probe solution.
When the 5x wash program is complete, add 40 μL of the PCR reagent to each well of the capture strips using the 8-channel automatic delivery pipette and 100 μL barrier pipette tips.
Seal the capture strips using optically clear adhesive film (Applied Biosystems part no. 4311971).
Place two optical cover compression pads on top of the sealed capture strips, and position the capture strips in the PCR instrument (Stratagene Mx3000P).
Run the quantitative PCR program using the following parameters:
Quantification dye: FAM Reference dye: ROX Thermal Profile: 2 minutes at 50 oC 10 minutes at 95 oC
Cycle between 15 seconds at 95 oC, then 60 seconds at 60 oC (40 times).
11
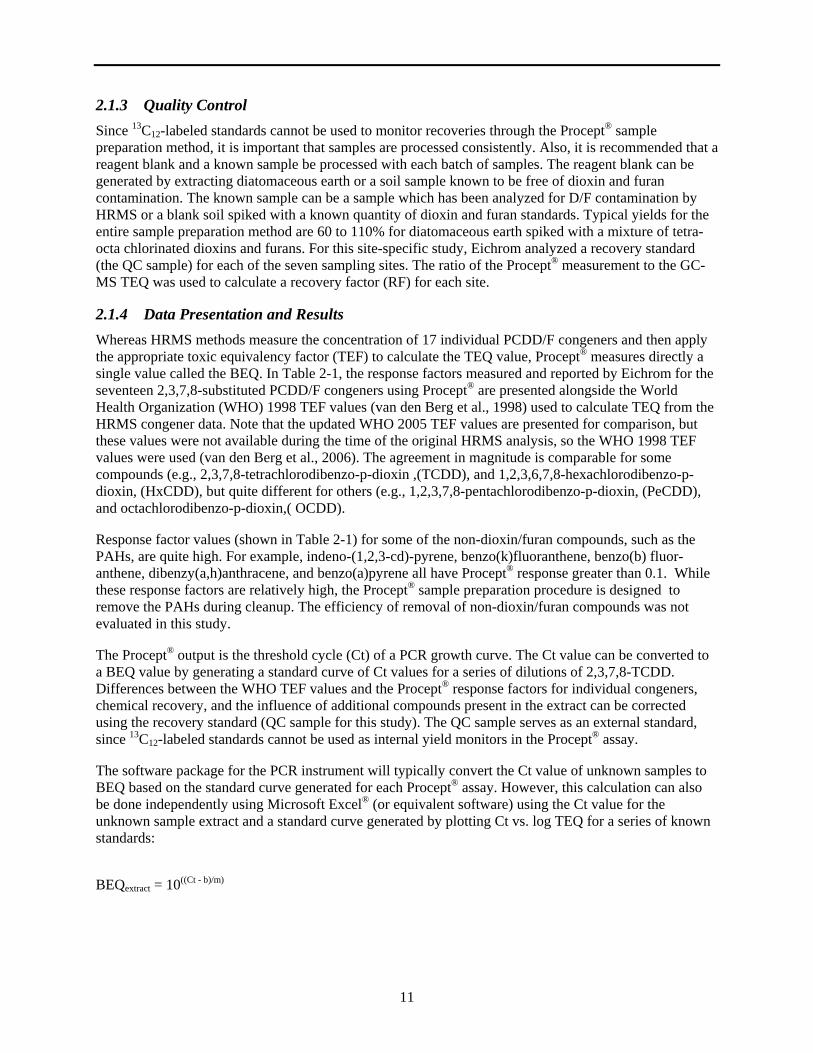
2.1.3 Quality Control
Since 13C12-labeled standards cannot be used to monitor recoveries through the Procept® sample preparation method, it is important that samples are processed consistently. Also, it is recommended that a reagent blank and a known sample be processed with each batch of samples. The reagent blank can be generated by extracting diatomaceous earth or a soil sample known to be free of dioxin and furan contamination. The known sample can be a sample which has been analyzed for D/F contamination by HRMS or a blank soil spiked with a known quantity of dioxin and furan standards. Typical yields for the entire sample preparation method are 60 to 110% for diatomaceous earth spiked with a mixture of tetra-octa chlorinated dioxins and furans. For this site-specific study, Eichrom analyzed a recovery standard (the QC sample) for each of the seven sampling sites. The ratio of the Procept® measurement to the GC-MS TEQ was used to calculate a recovery factor (RF) for each site.
2.1.4 Data Presentation and Results
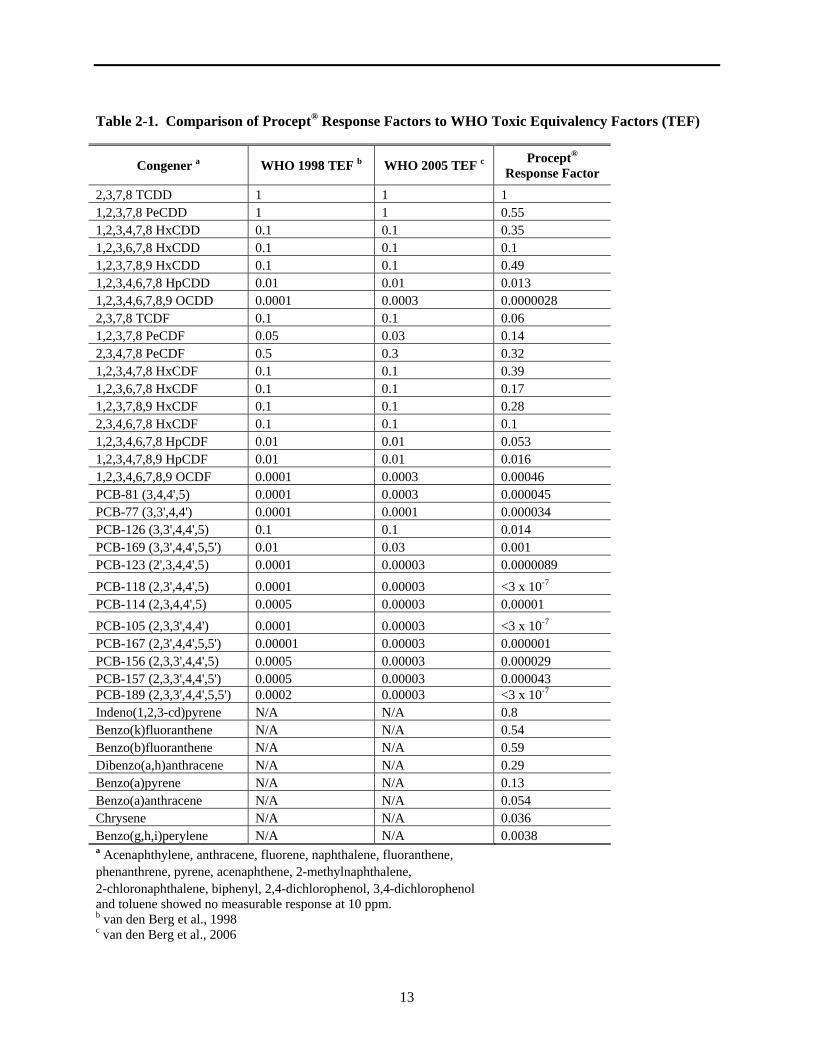
Whereas HRMS methods measure the concentration of 17 individual PCDD/F congeners and then apply the appropriate toxic equivalency factor (TEF) to calculate the TEQ value, Procept® measures directly a single value called the BEQ. In Table 2-1, the response factors measured and reported by Eichrom for the seventeen 2,3,7,8-substituted PCDD/F congeners using Procept® are presented alongside the World Health Organization (WHO) 1998 TEF values (van den Berg et al., 1998) used to calculate TEQ from the HRMS congener data. Note that the updated WHO 2005 TEF values are presented for comparison, but these values were not available during the time of the original HRMS analysis, so the WHO 1998 TEF values were used (van den Berg et al., 2006). The agreement in magnitude is comparable for some compounds (e.g., 2,3,7,8-tetrachlorodibenzo-p-dioxin ,(TCDD), and 1,2,3,6,7,8-hexachlorodibenzo-p-dioxin, (HxCDD), but quite different for others (e.g., 1,2,3,7,8-pentachlorodibenzo-p-dioxin, (PeCDD), and octachlorodibenzo-p-dioxin,( OCDD).
Response factor values (shown in Table 2-1) for some of the non-dioxin/furan compounds, such as the PAHs, are quite high. For example, indeno-(1,2,3-cd)-pyrene, benzo(k)fluoranthene, benzo(b) fluor-anthene, dibenzy(a,h)anthracene, and benzo(a)pyrene all have Procept® response greater than 0.1. While these response factors are relatively high, the Procept® sample preparation procedure is designed to remove the PAHs during cleanup. The efficiency of removal of non-dioxin/furan compounds was not evaluated in this study.
The Procept® output is the threshold cycle (Ct) of a PCR growth curve. The Ct value can be converted to a BEQ value by generating a standard curve of Ct values for a series of dilutions of 2,3,7,8-TCDD. Differences between the WHO TEF values and the Procept® response factors for individual congeners, chemical recovery, and the influence of additional compounds present in the extract can be corrected using the recovery standard (QC sample for this study). The QC sample serves as an external standard, since 13C12-labeled standards cannot be used as internal yield monitors in the Procept® assay.
The software package for the PCR instrument will typically convert the Ct value of unknown samples to BEQ based on the standard curve generated for each Procept® assay. However, this calculation can also be done independently using Microsoft Excel® (or equivalent software) using the Ct value for the unknown sample extract and a standard curve generated by plotting Ct vs. log TEQ for a series of known standards:
BEQextract = 10((Ct - b)/m) (eq 2-2)
12
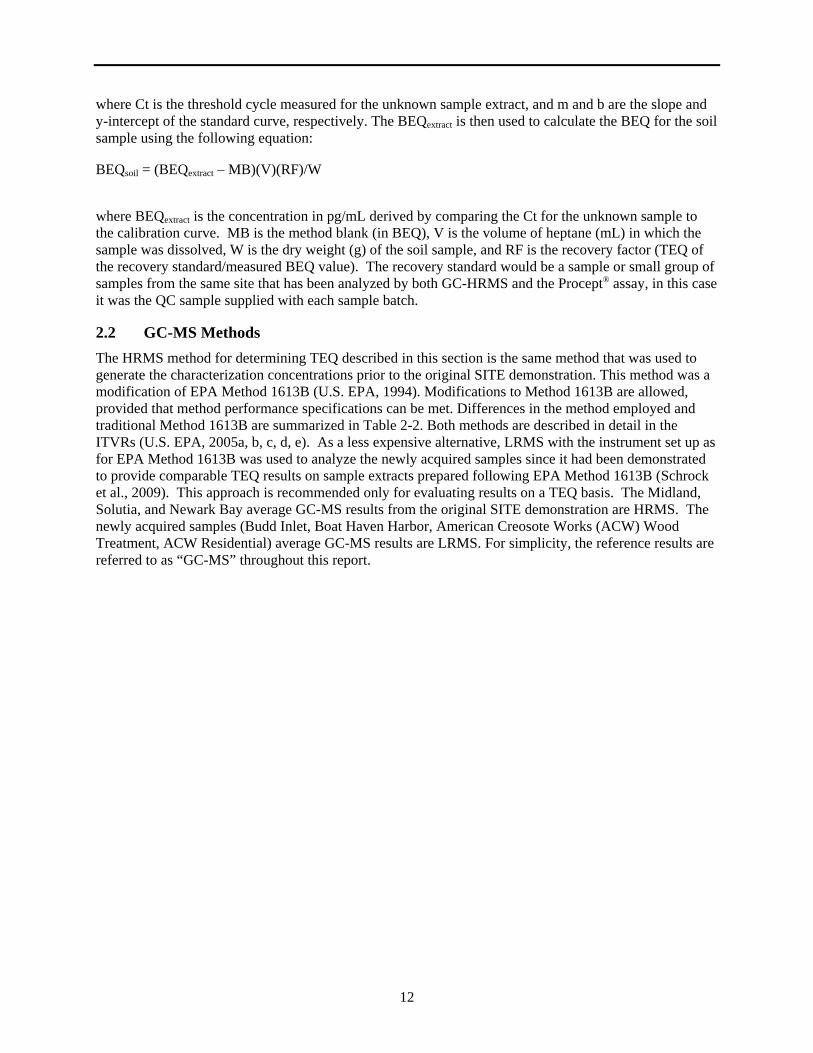
where Ct is the threshold cycle measured for the unknown sample extract, and m and b are the slope and y-intercept of the standard curve, respectively. The BEQextract is then used to calculate the BEQ for the soil sample using the following equation:
(eq 2-3) BEQsoil = (BEQextract – MB)(V)(RF)/W
where BEQextract is the concentration in pg/mL derived by comparing the Ct for the unknown sample to the calibration curve. MB is the method blank (in BEQ), V is the volume of heptane (mL) in which the sample was dissolved, W is the dry weight (g) of the soil sample, and RF is the recovery factor (TEQ of the recovery standard/measured BEQ value). The recovery standard would be a sample or small group of samples from the same site that has been analyzed by both GC-HRMS and the Procept® assay, in this case it was the QC sample supplied with each sample batch.
2.2 GC-MS Methods
The HRMS method for determining TEQ described in this section is the same method that was used to generate the characterization concentrations prior to the original SITE demonstration. This method was a modification of EPA Method 1613B (U.S. EPA, 1994). Modifications to Method 1613B are allowed, provided that method performance specifications can be met. Differences in the method employed and traditional Method 1613B are summarized in Table 2-2. Both methods are described in detail in the ITVRs (U.S. EPA, 2005a, b, c, d, e). As a less expensive alternative, LRMS with the instrument set up as for EPA Method 1613B was used to analyze the newly acquired samples since it had been demonstrated to provide comparable TEQ results on sample extracts prepared following EPA Method 1613B (Schrock et al., 2009). This approach is recommended only for evaluating results on a TEQ basis. The Midland, Solutia, and Newark Bay average GC-MS results from the original SITE demonstration are HRMS. The newly acquired samples (Budd Inlet, Boat Haven Harbor, American Creosote Works (ACW) Wood Treatment, ACW Residential) average GC-MS results are LRMS. For simplicity, the reference results are referred to as “GC-MS” throughout this report.
13
Table 2-1. Comparison of Procept® Response Factors to WHO Toxic Equivalency Factors (TEF)
Congener a WHO 1998 TEF b WHO 2005 TEF c Procept®
Response Factor
2,3,7,8 TCDD 1 1 1 1,2,3,7,8 PeCDD 1 1 0.55 1,2,3,4,7,8 HxCDD 0.1 0.1 0.35 1,2,3,6,7,8 HxCDD 0.1 0.1 0.1 1,2,3,7,8,9 HxCDD 0.1 0.1 0.49 1,2,3,4,6,7,8 HpCDD 0.01 0.01 0.013 1,2,3,4,6,7,8,9 OCDD 0.0001 0.0003 0.0000028 2,3,7,8 TCDF 0.1 0.1 0.06 1,2,3,7,8 PeCDF 0.05 0.03 0.14 2,3,4,7,8 PeCDF 0.5 0.3 0.32 1,2,3,4,7,8 HxCDF 0.1 0.1 0.39 1,2,3,6,7,8 HxCDF 0.1 0.1 0.17 1,2,3,7,8,9 HxCDF 0.1 0.1 0.28 2,3,4,6,7,8 HxCDF 0.1 0.1 0.1 1,2,3,4,6,7,8 HpCDF 0.01 0.01 0.053 1,2,3,4,7,8,9 HpCDF 0.01 0.01 0.016 1,2,3,4,6,7,8,9 OCDF 0.0001 0.0003 0.00046 PCB-81 (3,4,4',5) 0.0001 0.0003 0.000045 PCB-77 (3,3',4,4') 0.0001 0.0001 0.000034 PCB-126 (3,3',4,4',5) 0.1 0.1 0.014 PCB-169 (3,3',4,4',5,5') 0.01 0.03 0.001 PCB-123 (2',3,4,4',5) 0.0001 0.00003 0.0000089
PCB-118 (2,3',4,4',5) 0.0001 0.00003 <3 x 10⁻⁷ PCB-114 (2,3,4,4',5) 0.0005 0.00003 0.00001
PCB-105 (2,3,3',4,4') 0.0001 0.00003 <3 x 10⁻⁷ PCB-167 (2,3',4,4',5,5') 0.00001 0.00003 0.000001 PCB-156 (2,3,3',4,4',5) 0.0005 0.00003 0.000029 PCB-157 (2,3,3',4,4',5') 0.0005 0.00003 0.000043 PCB-189 (2,3,3',4,4',5,5') 0.0002 0.00003 <3 x 10⁻⁷ Indeno(1,2,3-cd)pyrene N/A N/A 0.8 Benzo(k)fluoranthene N/A N/A 0.54 Benzo(b)fluoranthene N/A N/A 0.59 Dibenzo(a,h)anthracene N/A N/A 0.29 Benzo(a)pyrene N/A N/A 0.13 Benzo(a)anthracene N/A N/A 0.054 Chrysene N/A N/A 0.036 Benzo(g,h,i)perylene N/A N/A 0.0038 a Acenaphthylene, anthracene, fluorene, naphthalene, fluoranthene, phenanthrene, pyrene, acenaphthene, 2-methylnaphthalene, 2-chloronaphthalene, biphenyl, 2,4-dichlorophenol, 3,4-dichlorophenol and toluene showed no measurable response at 10 ppm. b van den Berg et al., 1998 c van den Berg et al., 2006
14
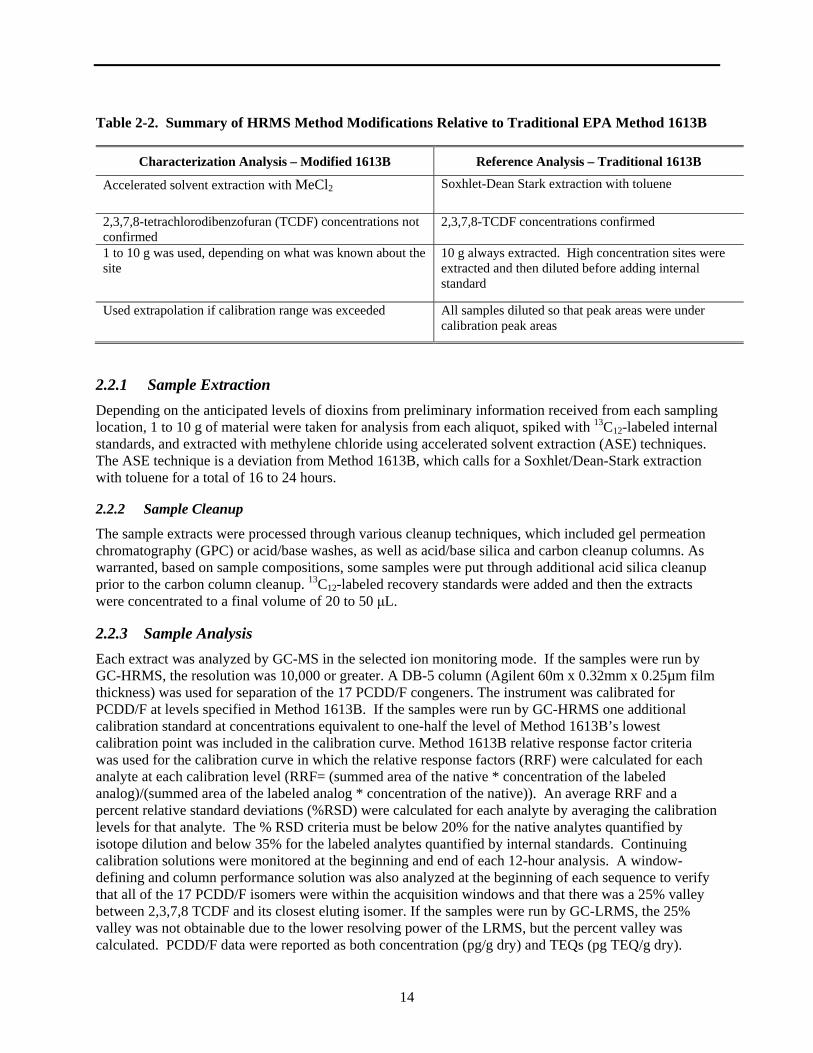
Table 2-2. Summary of HRMS Method Modifications Relative to Traditional EPA Method 1613B
Characterization Analysis – Modified 1613B Reference Analysis – Traditional 1613B
Accelerated solvent extraction with MeCl2 Soxhlet-Dean Stark extraction with toluene
2,3,7,8-tetrachlorodibenzofuran (TCDF) concentrations not 2,3,7,8-TCDF concentrations confirmed confirmed 1 to 10 g was used, depending on what was known about the 10 g always extracted. High concentration sites were site extracted and then diluted before adding internal
standard
Used extrapolation if calibration range was exceeded All samples diluted so that peak areas were under calibration peak areas
2.2.1 Sample Extraction
Depending on the anticipated levels of dioxins from preliminary information received from each sampling location, 1 to 10 g of material were taken for analysis from each aliquot, spiked with 13C12-labeled internal standards, and extracted with methylene chloride using accelerated solvent extraction (ASE) techniques. The ASE technique is a deviation from Method 1613B, which calls for a Soxhlet/Dean-Stark extraction with toluene for a total of 16 to 24 hours.
2.2.2 Sample Cleanup
The sample extracts were processed through various cleanup techniques, which included gel permeation chromatography (GPC) or acid/base washes, as well as acid/base silica and carbon cleanup columns. As warranted, based on sample compositions, some samples were put through additional acid silica cleanup prior to the carbon column cleanup. 13C12-labeled recovery standards were added and then the extracts were concentrated to a final volume of 20 to 50 μL.
2.2.3 Sample Analysis
Each extract was analyzed by GC-MS in the selected ion monitoring mode. If the samples were run by GC-HRMS, the resolution was 10,000 or greater. A DB-5 column (Agilent 60m x 0.32mm x 0.25µm film thickness) was used for separation of the 17 PCDD/F congeners. The instrument was calibrated for PCDD/F at levels specified in Method 1613B. If the samples were run by GC-HRMS one additional calibration standard at concentrations equivalent to one-half the level of Method 1613B’s lowest calibration point was included in the calibration curve. Method 1613B relative response factor criteria was used for the calibration curve in which the relative response factors (RRF) were calculated for each analyte at each calibration level (RRF= (summed area of the native * concentration of the labeled analog)/(summed area of the labeled analog * concentration of the native)). An average RRF and a percent relative standard deviations (%RSD) were calculated for each analyte by averaging the calibration levels for that analyte. The % RSD criteria must be below 20% for the native analytes quantified by isotope dilution and below 35% for the labeled analytes quantified by internal standards. Continuing calibration solutions were monitored at the beginning and end of each 12-hour analysis. A window-defining and column performance solution was also analyzed at the beginning of each sequence to verify that all of the 17 PCDD/F isomers were within the acquisition windows and that there was a 25% valley between 2,3,7,8 TCDF and its closest eluting isomer. If the samples were run by GC-LRMS, the 25% valley was not obtainable due to the lower resolving power of the LRMS, but the percent valley was calculated. PCDD/F data were reported as both concentration (pg/g dry) and TEQs (pg TEQ/g dry).
15
2.2.4 Quality Control
The GC-MS method followed the Method 1613B and 8290 QC requirements. Some of the critical QC criteria included:
All initial calibrations met the criteria for response factor RSD (±20% for all native and ±30% for all labeled analytes) and minimal signal-to-noise ratio requirements for the lowest calibration point.
Continuing calibrations were performed at the beginning and end of every 12-hour analysis period and were required to meet either 8290 RF performance criteria (±20% for all native and ±30% for all labeled analytes) or 1613B “VER” criteria (Method 1613 Table 6).
Column performance was checked at the beginning of each 12-hour analytical period and met method criteria (25% valley) if analyzed by HRMS. If samples were run by LRMS, the percent valley was calculated, but typically did not achieve the 25% valley criteria.
If samples were run by HRMS, instrument resolution was documented at the beginning and end of each 12-hour period with one exception.
Method 1613B 13C12-labeled internal standard was added to each sample prior to extraction and used to calculate concentrations of the native analytes in the sample, as well as to evaluate sample extraction recovery.
Method 1613B requires that a 13C12-labeled cleanup standard be added after sample extraction. However, the characterization laboratory has demonstrated a consistent quantifiable loss of analyte with GPC cleanup; therefore, the cleanup standard was not added until after the GPC step and was used to monitor losses only in the remaining cleanup steps. The GPC cleanup step required that a GPC correction factor be applied to the sample weight and concentration of internal standard used in data calculations to account for the sample lost during the GPC step.
Method 1613B 13C12-labeled recovery standard was added to the GC vials during final concentration of the extracts and was used to calculate the percent recoveries for the internal standards and cleanup standards for samples analyzed by HRMS. Internal and cleanup standard recoveries were not calculated for the samples analyzed by LRMS. Analysis of one method blank with every extraction batch was required to demonstrate freedom from contamination. One laboratory control spike, an ongoing precision and recovery (OPR) sample, was also processed with every extraction batch. Native and labeled compounds were required to pass the Method 1613B limits for OPR. A decane blank was analyzed after the analysis of the OPR to monitor for carryover.
2.2.5 Data Presentation and Results
The concentrations of the 17 individual PCDD/F congeners were calculated in pg/g dry weight, based on the calibration curve using the method of isotope dilution. The WHO 1998 TEFs (van den Berg et al., 1998) were then applied to the concentrations and summed to calculate the total TEQD/F value for each sample. At the time of the original HRMS analysis, the WHO 2005 TEF values were not available. The same procedure was used for the LRMS results except the WHO 2005 TEFs (van den Berg et al., 2006) were used.
2.3 Comparison of Procept® and GC-MS Methods
The steps involved in the Procept® and GC-MS methods are compared and contrasted in detail in Table 2-3. The GC-MS method detailed in Table 2-3 is the HRMS method based on EPA Method 1613B. In this study, both the Procept® and GC-MS extraction methods employed ASE, although the extraction solvents
16
were different (Eichrom used 30% acetone in toluene; the characterization method used MeCl2) and five grams of basic alumina was added to each ASE cell for the GC-MS method. Both the GC-MS and Procept® methods state that Soxhlet extraction can be used. Sample cleanup for the Procept® and GC-MS methods were similar, utilizing a series of silica and Florisil® columns although the specific types, sizes, and volumes of extraction solvents varied between the methods. The difference between the Procept® and GC-MS methods is most significant in the analytical step. The 1613B methods utilize GC-MS, which is a laboratory-based analysis that allows for congener-specific analysis. The Procept® assay is analyzed using PCR which can be a field portable or laboratory-based instrument (although the extensive preparation and cleanup procedures described in Sections 2.1.1 and 2.1.2 suggest that this method fundamentally is a laboratory-based technique). Both GC-MS and PCR techniques require a technically trained operator. The level of QC method criteria are much more stringent and involved for the GC-MS methods, but some common QC techniques (blanks, laboratory control samples, matrix spikes) are applied in both techniques. Similar data units are reported by both. The GC-MS method reports a TEQD/F, and Procept® reports a BEQ but the values are derived by different methods. The Procept® value is a total TEQ value that is obtained from calibrating the BEQ to the site-specific QC sample and therefore requires some percentage of GC-MS confirmatory analyses (either concurrently or based on historical site information). The GC-MS value is the concentration of each of the 17 PCDD/F congener multiplied by their respective WHO TEF, and then summed to achieve the TEQD/F.
Table 2-3. Comparison between Procept® and GC-MS Methods
Method Step Similarities Differences
Sample Preparation
Accelerated solvent extraction (ASE) is the extraction technique used by both methods.
Extraction solvent and ASE program
Eichrom: Sample are mixed with diatomaceous earth and are extracted at 1500 pounds per square inch (psi) and 100 oC for three 5 minute static steps and 20% flush volume using 30% acetone in toluene and the extract collected in 200 mL glass bottles. Samples were concentrated by rotary evaporator and nitrogen blow down. However, other methods and apparatus may be used.
GC-MS: Samples are mixed with Hydromatrix with a layer of alumina at the end of the ASE cell. Samples are extracted at 2000 psi and 125 °C for a 7 minute heat time, a static time of 10 minutes and a flush volume of 60% using MeCl2. Purge time is set to 120 seconds, and there are three static cycles. Samples are concentrated by TurboVap.
Sample Cleanup
Both Eichrom and the GC-MS methods use a series of silica columns eluted with 50 mL hexane.
Acid silica in the silica columns is 44% w/w.
Both methods use glass columns for multilayer acid silica columns.
Eichrom: Additional cleanup with multilayer acid/base silica columns with a 2.5 g layer of 10% silver nitrate silica. Columns are eluted with three 5 mL portions of hexane and then 45 mL of hexane to completely remove dioxins and furans. This step is repeated if a band of coloration consumes >50% of the silica column layer. Once the sample is dissolved in 0.2-1.0mL of heptane, 50-100 mg of 44% H2SO4 is added to the sample vial for 1 hour to remove any traces of PAHs.
GC-MS: Additional cleanup methods are used including GPC, acid/base back extraction, and , silica, alumina, and carbon columns.
GPC: Extracts are brought to approximately 2 mL in MeCl2. Each extract is transferred with four 1-mL aliquots of MeCl2rinses to a GPC vial that has been pre-marked at 7 mL. MeCl2is added to the
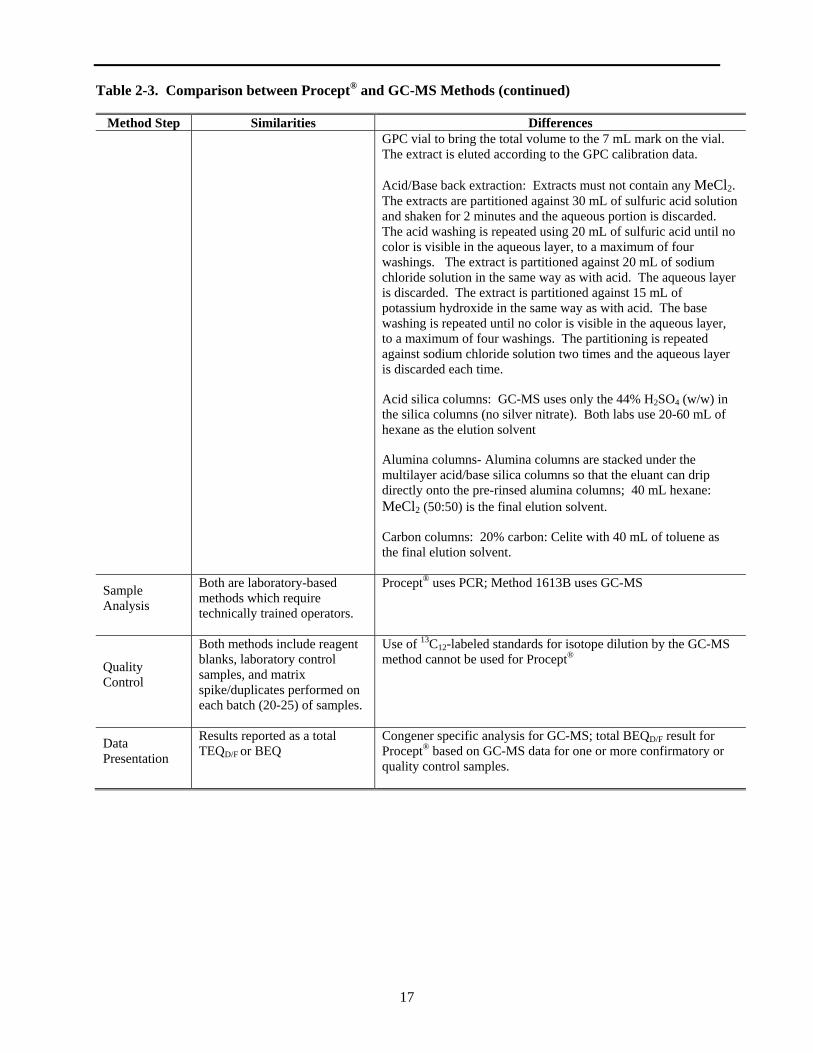
Table 2-3. Comparison between Procept® and GC-MS Methods (continued)
17
Method Step Similarities Differences GPC vial to bring the total volume to the 7 mL mark on the vial. The extract is eluted according to the GPC calibration data.
Acid/Base back extraction: Extracts must not contain any MeCl2. The extracts are partitioned against 30 mL of sulfuric acid solution and shaken for 2 minutes and the aqueous portion is discarded. The acid washing is repeated using 20 mL of sulfuric acid until no color is visible in the aqueous layer, to a maximum of four washings. The extract is partitioned against 20 mL of sodium chloride solution in the same way as with acid. The aqueous layer is discarded. The extract is partitioned against 15 mL of potassium hydroxide in the same way as with acid. The base washing is repeated until no color is visible in the aqueous layer, to a maximum of four washings. The partitioning is repeated against sodium chloride solution two times and the aqueous layer is discarded each time.
Acid silica columns: GC-MS uses only the 44% H2SO4 (w/w) in the silica columns (no silver nitrate). Both labs use 20-60 mL of hexane as the elution solvent
Alumina columns- Alumina columns are stacked under the multilayer acid/base silica columns so that the eluant can drip directly onto the pre-rinsed alumina columns; 40 mL hexane: MeCl2 (50:50) is the final elution solvent.
Carbon columns: 20% carbon: Celite with 40 mL of toluene as the final elution solvent.
Sample Analysis
Both are laboratory-based methods which require technically trained operators.
Procept® uses PCR; Method 1613B uses GC-MS
Quality Control
Both methods include reagent blanks, laboratory control samples, and matrix spike/duplicates performed on each batch (20-25) of samples.
Use of 13C12-labeled standards for isotope dilution by method cannot be used for Procept®
the GC-MS
Data Presentation
Results reported as a total TEQD/F or BEQ
Congener specific analysis for GC-MS; total BEQD/F result for Procept® based on GC-MS data for one or more confirmatory or quality control samples.
18
Chapter 3 Experimental Design
3.1 Overview of Sampling Sites
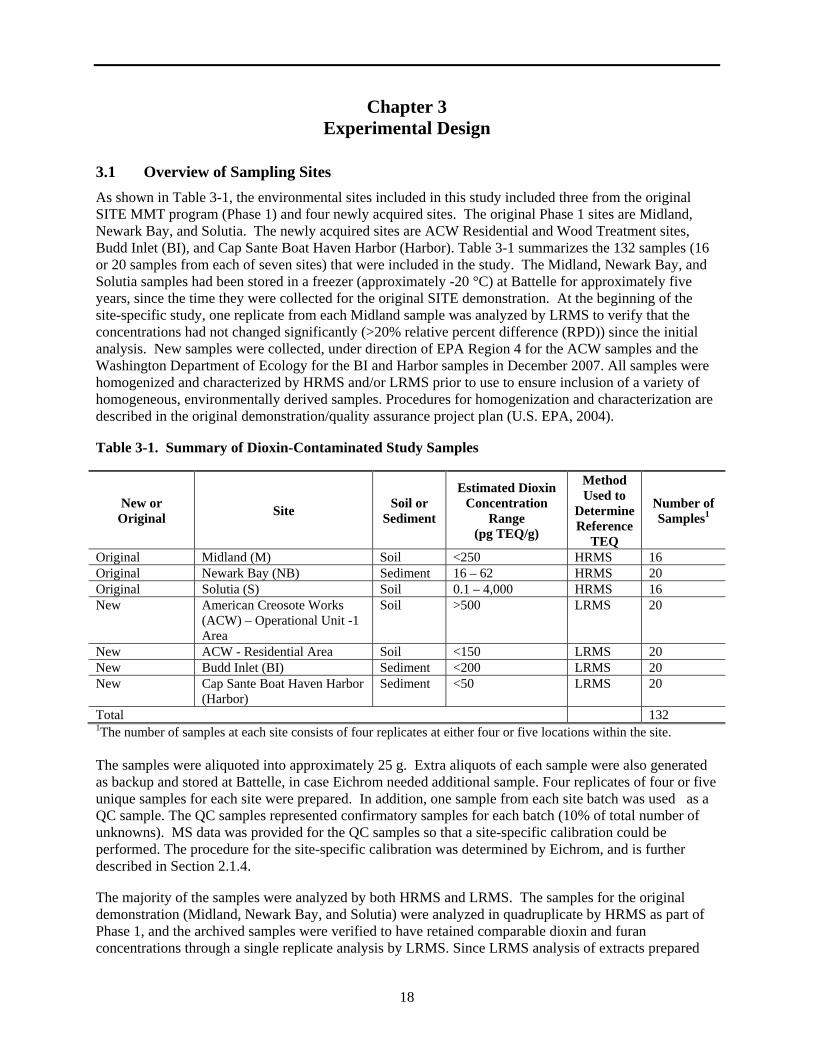
As shown in Table 3-1, the environmental sites included in this study included three from the original SITE MMT program (Phase 1) and four newly acquired sites. The original Phase 1 sites are Midland, Newark Bay, and Solutia. The newly acquired sites are ACW Residential and Wood Treatment sites, Budd Inlet (BI), and Cap Sante Boat Haven Harbor (Harbor). Table 3-1 summarizes the 132 samples (16 or 20 samples from each of seven sites) that were included in the study. The Midland, Newark Bay, and Solutia samples had been stored in a freezer (approximately -20 °C) at Battelle for approximately five years, since the time they were collected for the original SITE demonstration. At the beginning of the site-specific study, one replicate from each Midland sample was analyzed by LRMS to verify that the concentrations had not changed significantly (>20% relative percent difference (RPD)) since the initial analysis. New samples were collected, under direction of EPA Region 4 for the ACW samples and the Washington Department of Ecology for the BI and Harbor samples in December 2007. All samples were homogenized and characterized by HRMS and/or LRMS prior to use to ensure inclusion of a variety of homogeneous, environmentally derived samples. Procedures for homogenization and characterization are described in the original demonstration/quality assurance project plan (U.S. EPA, 2004).
Table 3-1. Summary of Dioxin-Contaminated Study Samples
New or Original
Site Soil or
Sediment
Estimated Dioxin Concentration
Range (pg TEQ/g)
Method Used to
Determine Reference
TEQ
Number of Samples1
Original Midland (M) Soil <250 HRMS 16 Original Newark Bay (NB) Sediment 16 – 62 HRMS 20 Original Solutia (S) Soil 0.1 – 4,000 HRMS 16 New American Creosote Works
(ACW) – Operational Unit -1 Area
Soil >500 LRMS 20
New ACW - Residential Area Soil <150 LRMS 20 New Budd Inlet (BI) Sediment <200 LRMS 20 New Cap Sante Boat Haven Harbor
(Harbor) Sediment <50 LRMS 20
Total 132 1The number of samples at each site consists of four replicates at either four or five locations within the site.
The samples were aliquoted into approximately 25 g. Extra aliquots of each sample were also generated as backup and stored at Battelle, in case Eichrom needed additional sample. Four replicates of four or five unique samples for each site were prepared. In addition, one sample from each site batch was used as a QC sample. The QC samples represented confirmatory samples for each batch (10% of total number of unknowns). MS data was provided for the QC samples so that a site-specific calibration could be performed. The procedure for the site-specific calibration was determined by Eichrom, and is further described in Section 2.1.4.
The majority of the samples were analyzed by both HRMS and LRMS. The samples for the original demonstration (Midland, Newark Bay, and Solutia) were analyzed in quadruplicate by HRMS as part of Phase 1, and the archived samples were verified to have retained comparable dioxin and furan concentrations through a single replicate analysis by LRMS. Since LRMS analysis of extracts prepared
19
for HRMS had proven to produce comparable TEQ results to HRMS analysis, LRMS was used to generate the quadruplicate reference method results for the new samples (ACW, BI, and Harbor). A single replicate for each site was confirmed by HRMS. The reference data that was generated in quadruplicate was used for comparison to the Eichrom results. Since both HRMS and LRMS were generated, the reference data is referred to as “GC-MS” data generally throughout the report.
Eichrom’s results were compared to the GC-MS reference values. Eichrom’s results from the replicate samples were averaged and the RSD were calculated. RSD values below 25% indicate good precision. Eichrom’s RSD values for each sample site were compared to the GC-MS RSD values (which were all < 25%). Eichrom’s average results were compared to the GC-MS value by calculating the recovery of the Eichrom BEQ against the GC-MS generated TEQ in terms of percent (see equation 3-1). Percent recovery values between 70 and 130% indicate good agreement with the GC-MS values. Eichrom’s results were also evaluated on a decision-making basis, with false positive and false negatives assessed based on EPA’s interim remediation goal for dioxin-contaminated soil (U.S. EPA, 2009).
3.2 Site Descriptions
This section provides descriptions of each of the soil and sediment sites, including how the sites became contaminated and approximate dioxin concentrations, as well as the type and concentrations of other major constituents (such as PCBs, pentachlorophenol (PCP), and PAHs), where known. This information was provided by the site owners/sample providers (e.g., the EPA, the EPA contractors, Washington Department of Ecology, etc.). Samples from the Midland, Newark Bay, and Solutia sites were in archive at Battelle since the original SITE demonstration in 2004. The samples were stored as homogenized bulk material, so no further processing (i.e., homogenization) was required prior to analysis. Samples from ACW, Budd Inlet, and Harbor sites were newly acquired prior to the Phase 2 study.
3.2.1 Midland Soil
Soil samples were collected by the Michigan Department of Environmental Quality from various locations in Midland, MI. The source of the contamination is speculated to be attributed to legacy contamination from chemical manufacturing. Samples were collected in various locations around Midland. Estimated TEQ concentrations ranged from 10 to 1,000 pg/g.
3.2.2 Newark Bay Sediment
Surrounded by manufacturing industries, Newark Bay is a highly contaminated area with numerous sources (sewage treatment plants, National Pollutant Discharge Elimination System discharges, and nonpoint sources). This bay is downstream from a dioxin Superfund site that contains some of the highest dioxin concentrations in the United States and also is downstream from a mercury Superfund site. The dioxin concentration in the area sampled for this demonstration was approximately 450 pg/g. Average PCB concentrations ranged from 300 to 740 ppb. Fine-grained sediments make up 50 to 90% of the dredged material. Average total organic carbon was about 4%.
3.2.3 Solutia Soil
The chemical production facility at the Solutia site in Nitro, WV, is located along the eastern bank of the Kanawha River, in Putnam County. The site has been used for chemical production since the early 1910s. The initial production facility was developed by the U.S. government for the production of military munitions during the World War I era between 1918 and 1921. The facility was then purchased by a small private chemical company, which began manufacturing chloride, phosphate, and phenol compounds at the site. A major chemical manufacturer purchased the facility in 1929 from Rubber Services Company. The company continued to expand operations and accelerated its growth in the 1940s. A variety of raw materials has been used at the facility over the years, including inorganic compounds, organic solvents, and other organic compounds, including Agent Orange. Agent Orange is a mixture of chemicals
20
containing equal amounts of two herbicides: 2,4-D (2,4-dichlorophenoxyacetic acid) and 2,4,5-T (2,4,5- trichlorophenoxyacetic acid). Manufacture of this chemical herbicide began at the site in 1948 and ceased in 1969. Dioxin contamination in the site soils was associated with the manufacture of 2,4,5-T, where dioxins are an unintentional by-product. The site has a dioxin profile from the parts per trillion (ppt) to low parts per billion (ppb) range. No PCBs or PAHs were identified in the soil.
3.2.4 American Creosote Works (ACW), Residential and Wood Treatment Soil
The ACW Superfund Site is located in Pensacola, FL. The site is a former wood treating plant. Wood-preserving operations were carried out at the ACW Pensacola site from 1902 until 1981. Prior to 1950, creosote was used exclusively to treat poles. Use of pentachlorophenol (PCP) started in 1950 and increased in the later years of the ACW operations. Dioxins at the site resulted from the use of PCP as a wood treating chemical, since dioxins are a common impurity in commercial grade PCP. Under the direction of EPA Region 4, samples were collected in December 2007 from two areas at the ACW Superfund site. 1) Samples were collected from within the Operational Unit-1 (OU-1 Area) and are expected to have higher concentrations of dioxin (> 500 pg TEQ/g). These are referred to as the “ACW-Wood Treatment” samples. 2) The second set was collected from residential areas around the OU-1 site and are expected to have lower concentrations of dioxin (< 150 pg TEQ/g). These are referred to as the “ACW-Residential” samples.
3.2.5 Budd Inlet Sediment
The Washington State Department of Ecology (Ecology) began investigations to determine the extent and possible sources of dioxin contamination of sediments in the Budd Inlet near Olympia, WA. Ecology initiated this investigation after elevated levels of dioxins were discovered by the Port of Olympia in an area scheduled for routine maintenance dredging. Although dioxins were found in areas throughout the inlet, the highest levels of dioxins were found in sediments near stormwater discharge pipes and the Port’s shipping berths. The specific source of dioxins in Budd Inlet is unknown. Most likely, dioxin contamination resulted from stormwater runoff or historical industrial use of shore areas. Samples provided for the study were sediments that were previously sampled, analyzed, and archived.
3.2.6 Cap Sante Boat Haven Harbor Sediment
The Dredged Material Management Program (DMMP) performed characterization of 40,900 cubic yards of sediment to restore navigational access within berthing areas at the Cap Sante Boat Haven which is located in Anacortes, WA. The DMMP consists of the principal agencies having jurisdiction for dredge/disposal projects in Washington State (i.e., the Corps of Engineers, Ecology, Department of Natural Resources, and EPA). Dioxin analyses were pursued in this area due to proximity to a historical paper/pulp mill. Samples provided for the study were sediments that were previously sampled, analyzed, and archived. Samples were received homogenized, but were also taken through the homogenization procedure used for all of the samples in this project.
3.3 Data Analysis
Like the original SITE MMT and follow-on site-specific demonstrations, this study compared Eichrom’s data to reference data generated by GC-MS analysis. GC-MS data was provided for representative samples from each site so that the Eichrom assay could be calibrated on a site-specific basis. Relative recovery of Eichrom results compared to GC-MS results, precision of replicate analyses, and false positive/negative results were evaluated. Qualitative parameters such as ease of use, cost, and sample throughput were not assessed during this study, but information was provided by the developer for inclusion in the report.
21
3.3.1 Comparability
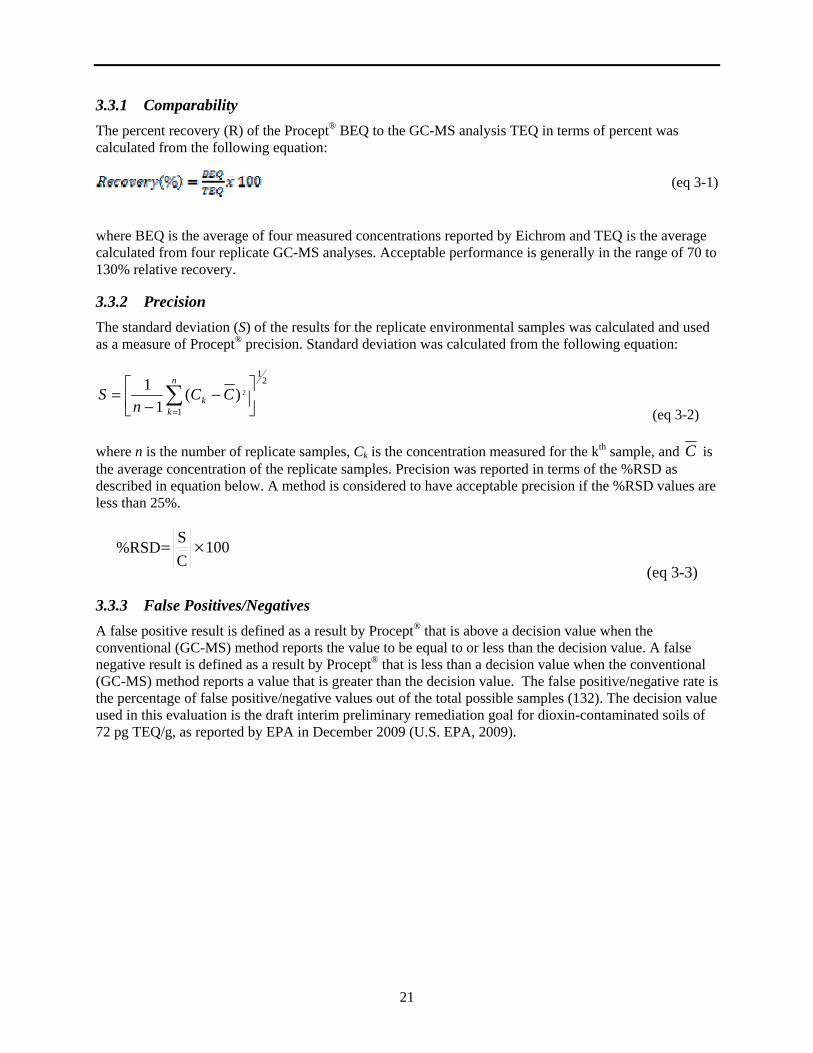
The percent recovery (R) of the Procept® BEQ to the GC-MS analysis TEQ in terms of percent was calculated from the following equation:
(eq 3-1)
where BEQ is the average of four measured concentrations reported by Eichrom and TEQ is the average calculated from four replicate GC-MS analyses. Acceptable performance is generally in the range of 70 to 130% relative recovery.
3.3.2 Precision
The standard deviation (S) of the results for the replicate environmental samples was calculated and used as a measure of Procept® precision. Standard deviation was calculated from the following equation:
1
1 n 2
S = (C ) 2
− 1 k − Cn k =1 (eq 3-2)
where n is the number of replicate samples, Ck is the concentration measured for the kth sample, and C is the average concentration of the replicate samples. Precision was reported in terms of the %RSD as described in equation below. A method is considered to have acceptable precision if the %RSD values are less than 25%.
S %RSD = × 100
C (eq 3-3)
3.3.3 False Positives/Negatives
A false positive result is defined as a result by Procept® that is above a decision value when the conventional (GC-MS) method reports the value to be equal to or less than the decision value. A false negative result is defined as a result by Procept® that is less than a decision value when the conventional (GC-MS) method reports a value that is greater than the decision value. The false positive/negative rate is the percentage of false positive/negative values out of the total possible samples (132). The decision value used in this evaluation is the draft interim preliminary remediation goal for dioxin-contaminated soils of 72 pg TEQ/g, as reported by EPA in December 2009 (U.S. EPA, 2009).
22
Chapter 4 Results and Discussion
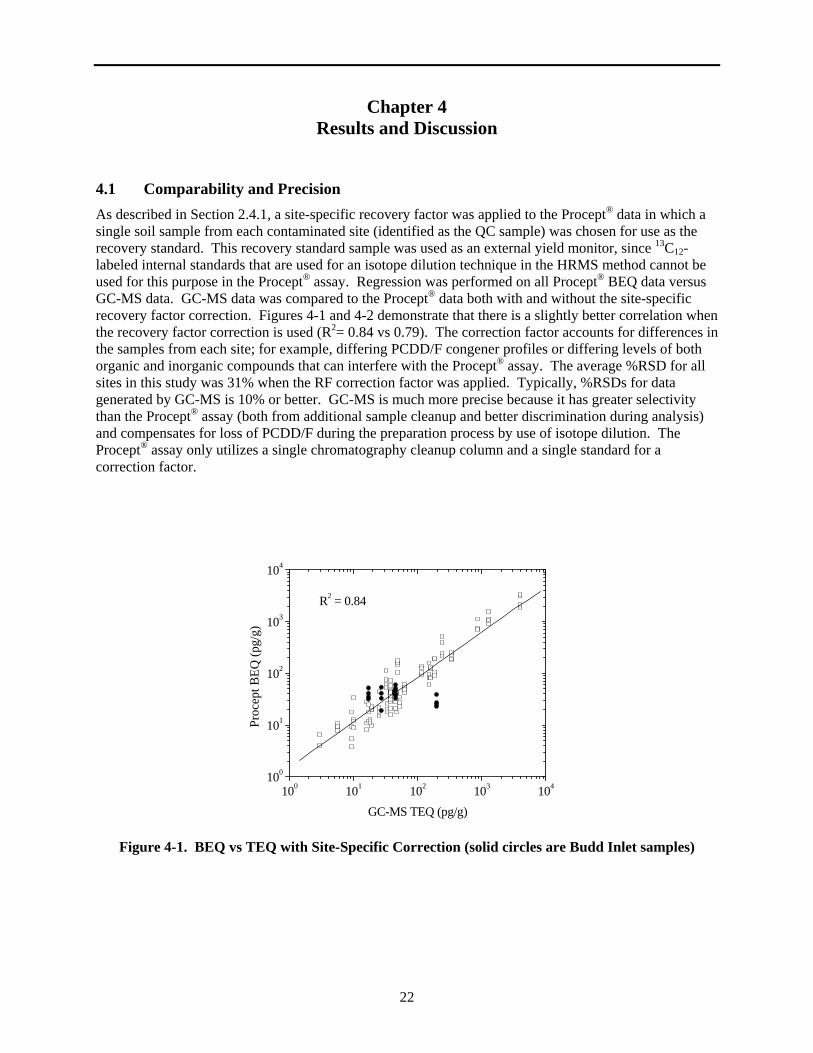
4.1 Comparability and Precision
As described in Section 2.4.1, a site-specific recovery factor was applied to the Procept® data in which a single soil sample from each contaminated site (identified as the QC sample) was chosen for use as the recovery standard. This recovery standard sample was used as an external yield monitor, since 13C12- labeled internal standards that are used for an isotope dilution technique in the HRMS method cannot be used for this purpose in the Procept® assay. Regression was performed on all Procept® BEQ data versus GC-MS data. GC-MS data was compared to the Procept® data both with and without the site-specific recovery factor correction. Figures 4-1 and 4-2 demonstrate that there is a slightly better correlation when the recovery factor correction is used (R2= 0.84 vs 0.79). The correction factor accounts for differences in the samples from each site; for example, differing PCDD/F congener profiles or differing levels of both organic and inorganic compounds that can interfere with the Procept® assay. The average %RSD for all sites in this study was 31% when the RF correction factor was applied. Typically, %RSDs for data generated by GC-MS is 10% or better. GC-MS is much more precise because it has greater selectivity than the Procept® assay (both from additional sample cleanup and better discrimination during analysis) and compensates for loss of PCDD/F during the preparation process by use of isotope dilution. The Procept® assay only utilizes a single chromatography cleanup column and a single standard for a correction factor.
Figure 4-1. BEQ vs TEQ with Site-Specific Correction (solid circles are Budd Inlet samples)
100 101 102 103 104100
101
102
103
104
Pro
cept
BE
Q (
pg/g
)
GC-MS TEQ (pg/g)
R2 = 0.84
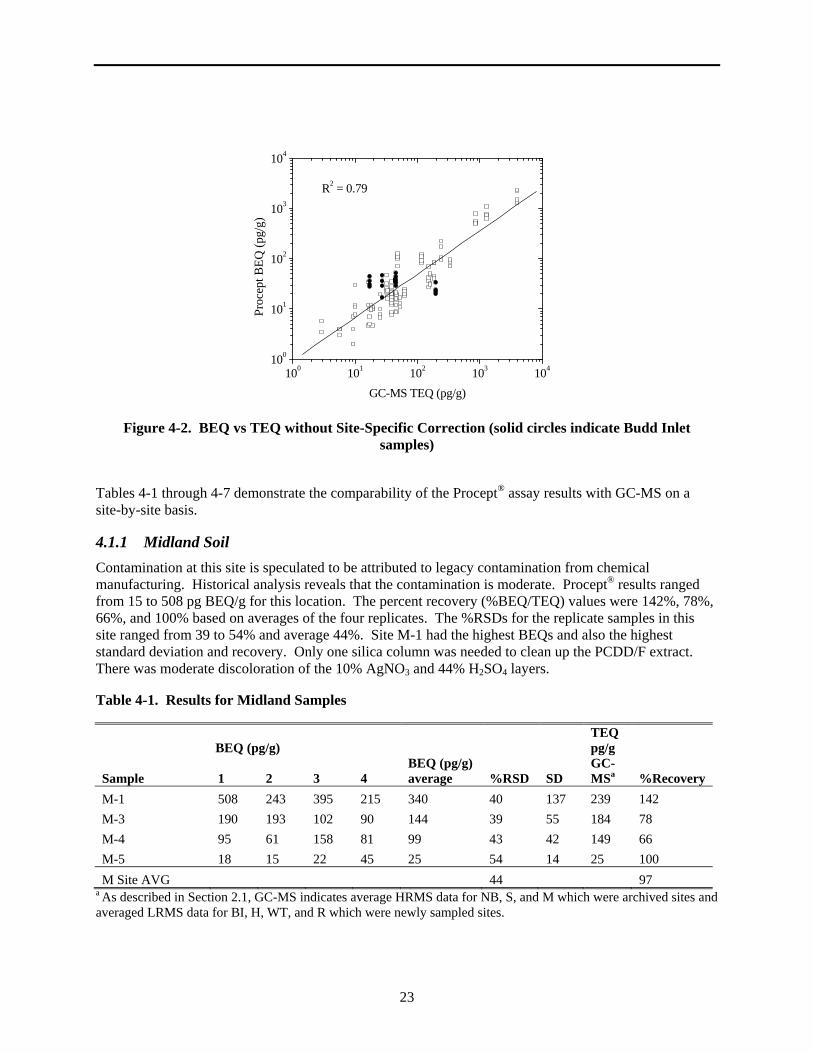
23
100 101 102 103 104100
101
102
103
104
Pro
cept
BE
Q (
pg/g
)
GC-MS TEQ (pg/g)
R2 = 0.79
Figure 4-2. BEQ vs TEQ without Site-Specific Correction (solid circles indicate Budd Inlet samples)
Tables 4-1 through 4-7 demonstrate the comparability of the Procept® assay results with GC-MS on a site-by-site basis.
4.1.1 Midland Soil
Contamination at this site is speculated to be attributed to legacy contamination from chemical manufacturing. Historical analysis reveals that the contamination is moderate. Procept® results ranged from 15 to 508 pg BEQ/g for this location. The percent recovery (%BEQ/TEQ) values were 142%, 78%, 66%, and 100% based on averages of the four replicates. The %RSDs for the replicate samples in this site ranged from 39 to 54% and average 44%. Site M-1 had the highest BEQs and also the highest standard deviation and recovery. Only one silica column was needed to clean up the PCDD/F extract. There was moderate discoloration of the 10% AgNO3 and 44% H2SO4 layers.
Table 4-1. Results for Midland Samples
TEQ BEQ (pg/g) pg/g
BEQ (pg/g) GC-Sample
M-1
1
508
2
243
3
395
4
215
average
340
%RSD
40
SD
137
MSa
239
%Recovery
142
M-3 190 193 102 90 144 39 55 184 78
M-4 95 61 158 81 99 43 42 149 66
M-5 18 15 22 45 25 54 14
M Site AVG 44 a As described in Section 2.1, GC-MS indicates average HRMS data for NB, S, and M wh
25 100
97 ich were archived sites and
averaged LRMS data for BI, H, WT, and R which were newly sampled sites.
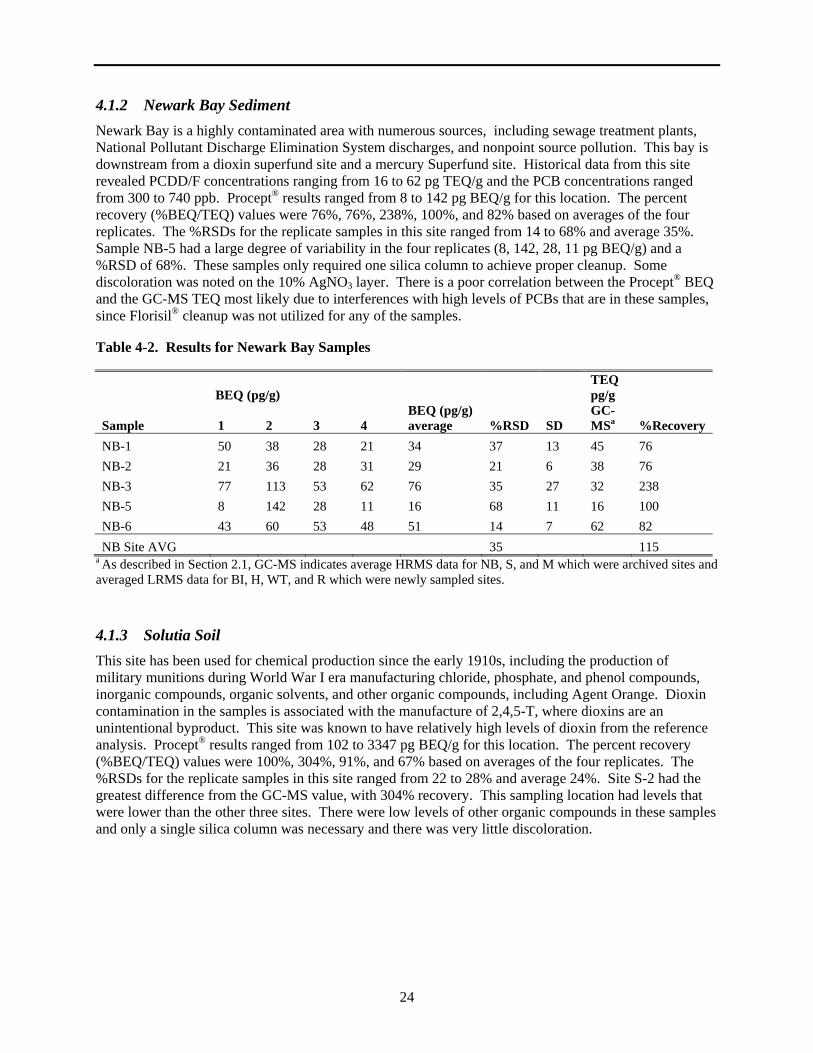
24
4.1.2 Newark Bay Sediment
Newark Bay is a highly contaminated area with numerous sources, including sewage treatment plants, National Pollutant Discharge Elimination System discharges, and nonpoint source pollution. This bay is downstream from a dioxin superfund site and a mercury Superfund site. Historical data from this site revealed PCDD/F concentrations ranging from 16 to 62 pg TEQ/g and the PCB concentrations ranged from 300 to 740 ppb. Procept® results ranged from 8 to 142 pg BEQ/g for this location. The percent recovery (%BEQ/TEQ) values were 76%, 76%, 238%, 100%, and 82% based on averages of the four replicates. The %RSDs for the replicate samples in this site ranged from 14 to 68% and average 35%. Sample NB-5 had a large degree of variability in the four replicates (8, 142, 28, 11 pg BEQ/g) and a %RSD of 68%. These samples only required one silica column to achieve proper cleanup. Some discoloration was noted on the 10% AgNO ®
3 layer. There is a poor correlation between the Procept BEQ and the GC-MS TEQ most likely due to interferences with high levels of PCBs that are in these samples, since Florisil® cleanup was not utilized for any of the samples.
Table 4-2. Results for Newark Bay Samples
TEQ BEQ (pg/g) pg/g
BEQ (pg/g) GC-Sample 1 2 3 4 average %RSD SD MSa %Recovery
NB-1 50 38 28 21 34 37 13 45 76
NB-2 21 36 28 31 29 21 6 38 76
NB-3 77 113 53 62 76 35 27 32 238
NB-5 8 142 28 11 16 68 11 16 100
NB-6 43 60 53 48 51 14 7 62 82
NB Site AVG 35 115 a As described in Section 2.1, GC-MS indicates average HRMS data for NB, S, and M which were archived sites and averaged LRMS data for BI, H, WT, and R which were newly sampled sites.
4.1.3 Solutia Soil
This site has been used for chemical production since the early 1910s, including the production of military munitions during World War I era manufacturing chloride, phosphate, and phenol compounds, inorganic compounds, organic solvents, and other organic compounds, including Agent Orange. Dioxin contamination in the samples is associated with the manufacture of 2,4,5-T, where dioxins are an unintentional byproduct. This site was known to have relatively high levels of dioxin from the reference analysis. Procept® results ranged from 102 to 3347 pg BEQ/g for this location. The percent recovery (%BEQ/TEQ) values were 100%, 304%, 91%, and 67% based on averages of the four replicates. The %RSDs for the replicate samples in this site ranged from 22 to 28% and average 24%. Site S-2 had the greatest difference from the GC-MS value, with 304% recovery. This sampling location had levels that were lower than the other three sites. There were low levels of other organic compounds in these samples and only a single silica column was necessary and there was very little discoloration.
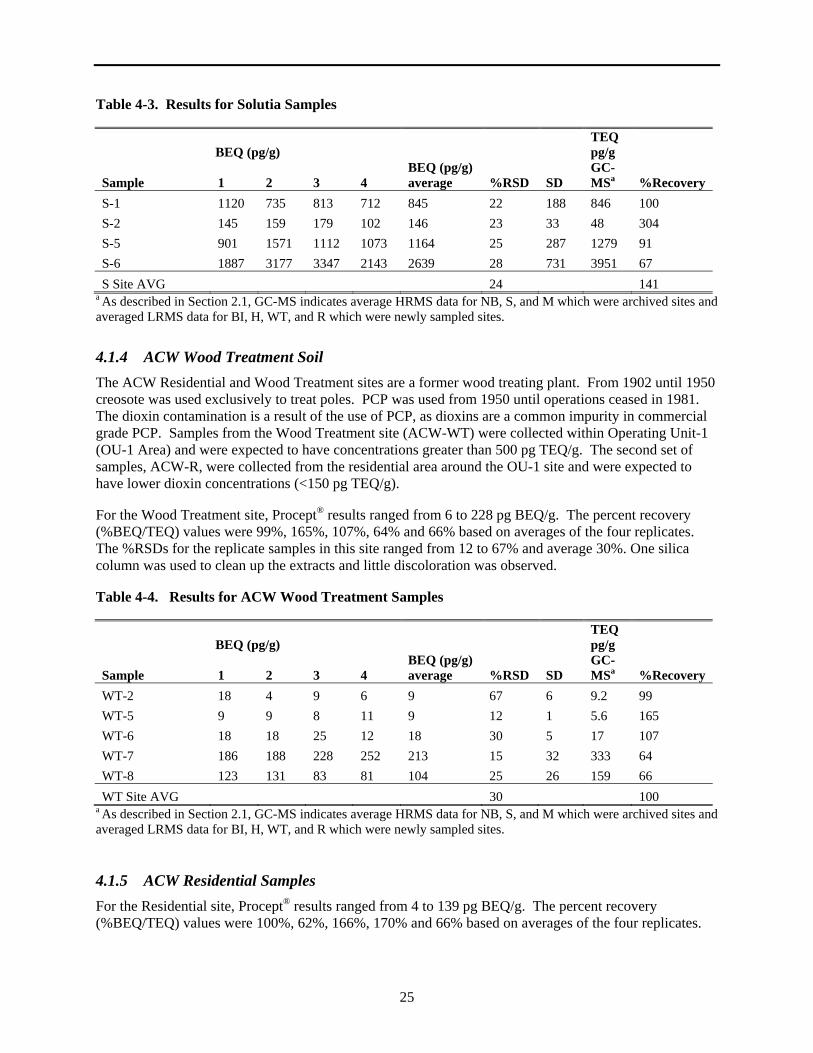
25
Table 4-3. Results for Solutia Samples
TEQ BEQ (pg/g) pg/g
BEQ (pg/g) GC-Sample
S-1
1
1120
2
735
3
813
4
712
average
845
%RSD
22
SD
188
MSa
846
%Recovery
100
S-2 145 159 179 102 146 23 33 48 304
S-5 901 1571 1112 1073 1164 25 287 1279 91
S-6 1887 3177 3347
S Site AVG a As described in Section 2.1, GC-MS indicate
2143
s average
2639 28 731
24 HRMS data for NB, S, and M wh
3951 67
141 ich were archived sites and
averaged LRMS data for BI, H, WT, and R which were newly sampled sites.
4.1.4 ACW Wood Treatment Soil
The ACW Residential and Wood Treatment sites are a former wood treating plant. From 1902 until 1950 creosote was used exclusively to treat poles. PCP was used from 1950 until operations ceased in 1981. The dioxin contamination is a result of the use of PCP, as dioxins are a common impurity in commercial grade PCP. Samples from the Wood Treatment site (ACW-WT) were collected within Operating Unit-1 (OU-1 Area) and were expected to have concentrations greater than 500 pg TEQ/g. The second set of samples, ACW-R, were collected from the residential area around the OU-1 site and were expected to have lower dioxin concentrations (<150 pg TEQ/g).
For the Wood Treatment site, Procept® results ranged from 6 to 228 pg BEQ/g. The percent recovery (%BEQ/TEQ) values were 99%, 165%, 107%, 64% and 66% based on averages of the four replicates. The %RSDs for the replicate samples in this site ranged from 12 to 67% and average 30%. One silica column was used to clean up the extracts and little discoloration was observed.
Table 4-4. Results for ACW Wood Treatment Samples
TEQ BEQ (pg/g) pg/g
BEQ (pg/g) GC-Sample 1 2 3 4 average %RSD SD MSa %Recovery
WT-2 18 4 9 6 9 67 6 9.2 99
WT-5 9 9 8 11 9 12 1 5.6 165
WT-6 18 18 25 12 18 30 5 17 107
WT-7 186 188 228 252 213 15 32 333 64
WT-8 123 131 83 81 104 25 26 159 66
WT Site AVG 30 100 a As described in Section 2.1, GC-MS indicates average HRMS data for NB, S, and M which were archived sites and averaged LRMS data for BI, H, WT, and R which were newly sampled sites.
4.1.5 ACW Residential Samples
For the Residential site, Procept® results ranged from 4 to 139 pg BEQ/g. The percent recovery (%BEQ/TEQ) values were 100%, 62%, 166%, 170% and 66% based on averages of the four replicates.
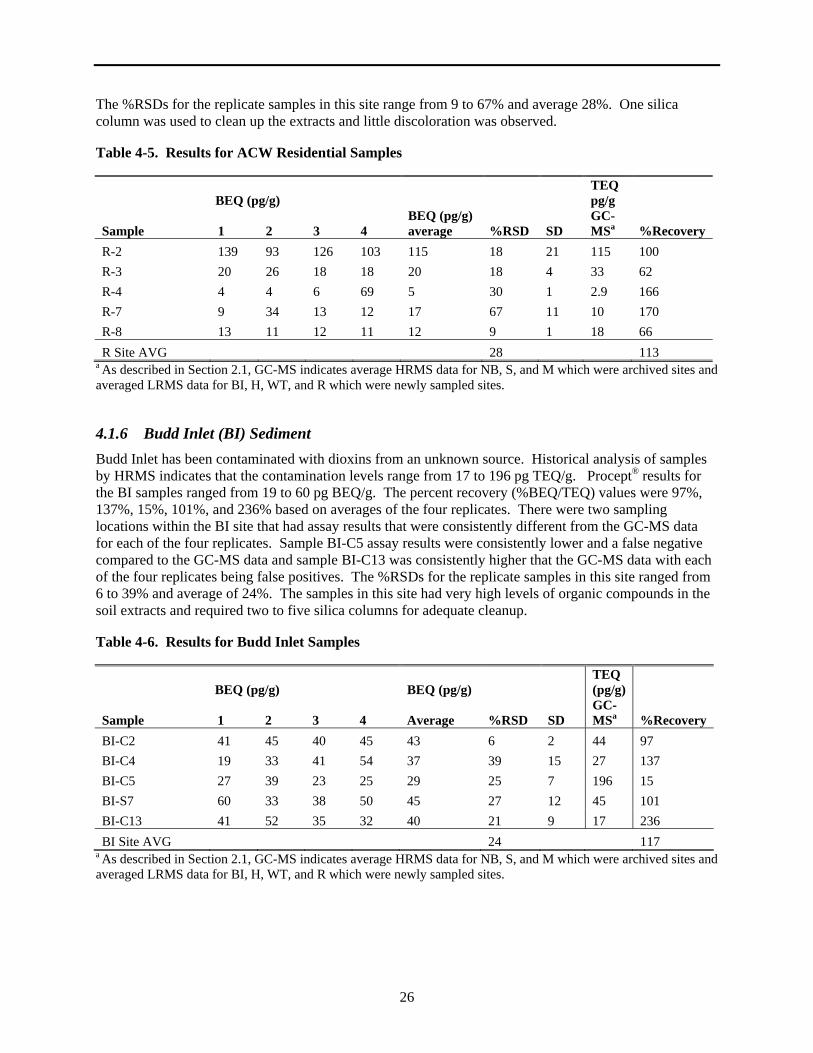
26
The %RSDs for the replicate samples in this site range from 9 to 67% and average 28%. One silica column was used to clean up the extracts and little discoloration was observed.
Table 4-5. Results for ACW Residential Samples
TEQ BEQ (pg/g) pg/g
BEQ (pg/g) GC-Sample 1 2 3 4 average %RSD SD MSa %Recovery
R-2 139 93 126 103 115 18 21 115 100
R-3 20 26 18 18 20 18 4 33 62
R-4 4 4 6 69 5 30 1 2.9 166
R-7 9 34 13 12 17 67 11 10 170
R-8 13 11 12 11 12 9 1 18 66
R Site AVG 28 113 a As described in Section 2.1, GC-MS indicates average HRMS data for NB, S, and M which were archived sites and averaged LRMS data for BI, H, WT, and R which were newly sampled sites.
4.1.6 Budd Inlet (BI) Sediment
Budd Inlet has been contaminated with dioxins from an unknown source. Historical analysis of samples by HRMS indicates that the contamination levels range from 17 to 196 pg TEQ/g. Procept® results for the BI samples ranged from 19 to 60 pg BEQ/g. The percent recovery (%BEQ/TEQ) values were 97%, 137%, 15%, 101%, and 236% based on averages of the four replicates. There were two sampling locations within the BI site that had assay results that were consistently different from the GC-MS data for each of the four replicates. Sample BI-C5 assay results were consistently lower and a false negative compared to the GC-MS data and sample BI-C13 was consistently higher that the GC-MS data with each of the four replicates being false positives. The %RSDs for the replicate samples in this site ranged from 6 to 39% and average of 24%. The samples in this site had very high levels of organic compounds in the soil extracts and required two to five silica columns for adequate cleanup.
Table 4-6. Results for Budd Inlet Samples
TEQ BEQ (pg/g) BEQ (pg/g) (pg/g)
GC-Sample 1 2 3 4 Average %RSD SD MSa %Recovery
BI-C2 41 45 40 45 43 6 2 44 97
BI-C4 19 33 41 54 37 39 15 27 137
BI-C5 27 39 23 25 29 25 7 196 15
BI-S7 60 33 38 50 45 27 12 45 101
BI-C13 41 52 35 32 40 21 9 17 236
BI Site AVG 24 117 a As described in Section 2.1, GC-MS indicates average HRMS data for NB, S, and M which were archived sites and averaged LRMS data for BI, H, WT, and R which were newly sampled sites.

27
4.1.7 Cap Sante Boat Haven Harbor Sediment
This site is in close proximity to a historical paper/pulp mill. Samples provided for this study had previously been sampled, analyzed, and the remaining sediment was in archive. The HRMS concentration range from previous analyses indicated 19 to 52 pg TEQ/g. Procept® results ranged from 16 to 73 pg BEQ/g for this location. The percent recovery (%BEQ/TEQ) values were 71%, 97%, 97%, 54%, and 137% based on averages of the four replicates. The %RSDs for the replicate samples in this site ranged from 19%-38% and average 31%. Sample HS-2 had one replicate that was dramatically lower (16 pg BEQ/g) than the other three (42, 46, 44 pg BEQ/g) that were close to the value of the GC-MS data. These samples also had high levels of other organic contaminants, those that are absorbed by the 10% AgNO3 silica layer. All four replicates required three to four silica columns for proper cleanup.
Table 4-7. Results for Cap Sante Boat Haven (Harbor) Samples
TEQ BEQ (pg/g) pg/g
BEQ (pg/g) GC-Sample 1 2 3 4 average %RSD SD MSa %Recovery
H-1 42 39 31 18 33 32 11 46 71
H-2 20 10 20 23 18 31 6 19 97
HS-2 16 42 46 44 37 38 14 38 97
H-8 27 27 35 23 28 19 5 52 54
H-9 42 58 73 35 52 33 17 38 137
H Site AVG 31 91 a As described in Section 2.1, GC-MS indicates average HRMS data for NB, S, and M which were archived sites and averaged LRMS data for BI, H, WT, and R which were newly sampled sites.
4.1.8 Summary of Results
Table 4-8 presents a summary of the recovery and precision results. The overall average recovery was 110% and the median recovery was 97%. The range of recovery values was 15 to 304%. There was no significant pattern of positive or negative bias relative to the GC-MS method results, since the percent recovery values were both above and below 100%. The average RSD value was 31% and the median RSD value was 28%. The range of RSD values was 6% to 68%.
Table 4-8. Summary of Results
Metric RSD (%) Recovery (%) Average 31 110 Range 6-68 15-304 Median 28 97
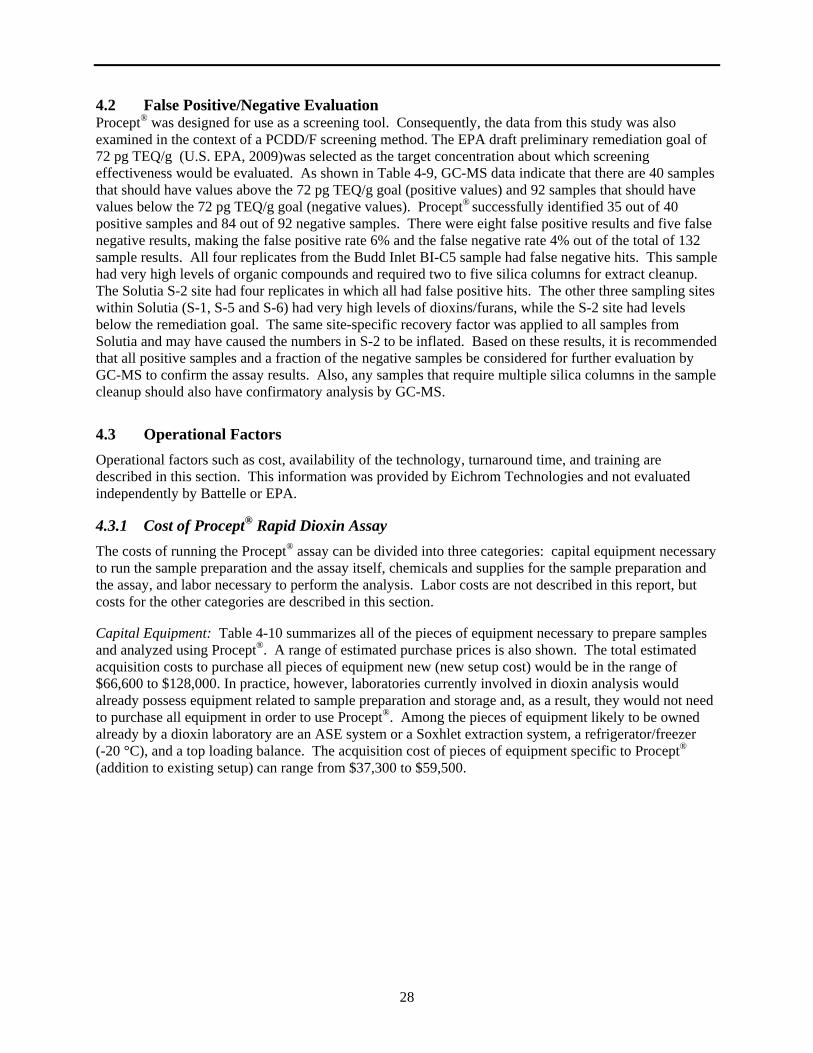
28
4.2 False Positive/Negative Evaluation Procept® was designed for use as a screening tool. Consequently, the data from this study was also examined in the context of a PCDD/F screening method. The EPA draft preliminary remediation goal of 72 pg TEQ/g (U.S. EPA, 2009)was selected as the target concentration about which screening effectiveness would be evaluated. As shown in Table 4-9, GC-MS data indicate that there are 40 samples that should have values above the 72 pg TEQ/g goal (positive values) and 92 samples that should have values below the 72 pg TEQ/g goal (negative values). Procept® successfully identified 35 out of 40 positive samples and 84 out of 92 negative samples. There were eight false positive results and five false negative results, making the false positive rate 6% and the false negative rate 4% out of the total of 132 sample results. All four replicates from the Budd Inlet BI-C5 sample had false negative hits. This sample had very high levels of organic compounds and required two to five silica columns for extract cleanup. The Solutia S-2 site had four replicates in which all had false positive hits. The other three sampling sites within Solutia (S-1, S-5 and S-6) had very high levels of dioxins/furans, while the S-2 site had levels below the remediation goal. The same site-specific recovery factor was applied to all samples from Solutia and may have caused the numbers in S-2 to be inflated. Based on these results, it is recommended that all positive samples and a fraction of the negative samples be considered for further evaluation by GC-MS to confirm the assay results. Also, any samples that require multiple silica columns in the sample cleanup should also have confirmatory analysis by GC-MS.
4.3 Operational Factors
Operational factors such as cost, availability of the technology, turnaround time, and training are described in this section. This information was provided by Eichrom Technologies and not evaluated independently by Battelle or EPA.
4.3.1 Cost of Procept® Rapid Dioxin Assay
The costs of running the Procept® assay can be divided into three categories: capital equipment necessary to run the sample preparation and the assay itself, chemicals and supplies for the sample preparation and the assay, and labor necessary to perform the analysis. Labor costs are not described in this report, but costs for the other categories are described in this section.
Capital Equipment: Table 4-10 summarizes all of the pieces of equipment necessary to prepare samples and analyzed using Procept®. A range of estimated purchase prices is also shown. The total estimated acquisition costs to purchase all pieces of equipment new (new setup cost) would be in the range of $66,600 to $128,000. In practice, however, laboratories currently involved in dioxin analysis would already possess equipment related to sample preparation and storage and, as a result, they would not need to purchase all equipment in order to use Procept®. Among the pieces of equipment likely to be owned already by a dioxin laboratory are an ASE system or a Soxhlet extraction system, a refrigerator/freezer (-20 °C), and a top loading balance. The acquisition cost of pieces of equipment specific to Procept® (addition to existing setup) can range from $37,300 to $59,500.
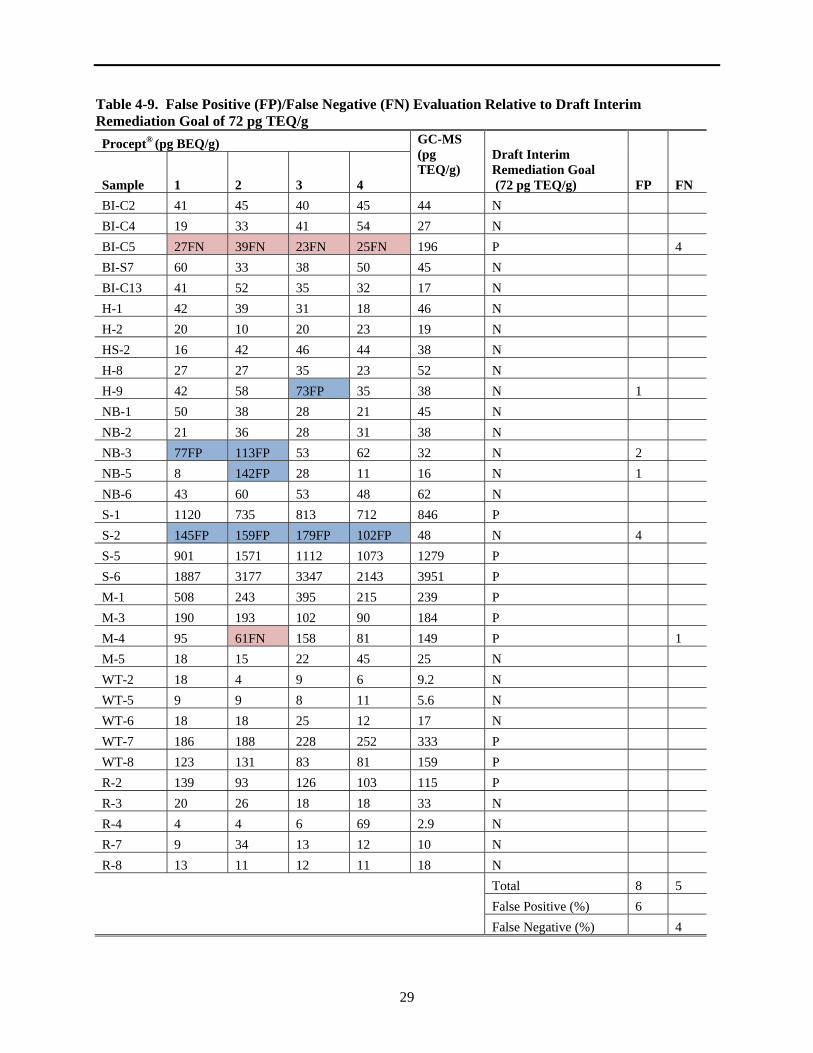
29
Table 4-9. False Positive (FP)/False Negative (FN) Evaluation Relative to Draft Interim Remediation Goal of 72 pg TEQ/g
Procept® (pg BEQ/g) GC-MS (pg TEQ/g)
Draft Interim Remediation Goal (72 pg TEQ/g) FP FN Sample 1 2 3 4
BI-C2 41 45 40 45 44 N
BI-C4 19 33 41 54 27 N
BI-C5 27FN 39FN 23FN 25FN 196 P 4
BI-S7 60 33 38 50 45 N
BI-C13 41 52 35 32 17 N
H-1 42 39 31 18 46 N
H-2 20 10 20 23 19 N
HS-2 16 42 46 44 38 N
H-8 27 27 35 23 52 N
H-9 42 58 73FP 35 38 N 1
NB-1 50 38 28 21 45 N
NB-2 21 36 28 31 38 N
NB-3 77FP 113FP 53 62 32 N 2
NB-5 8 142FP 28 11 16 N 1
NB-6 43 60 53 48 62 N
S-1 1120 735 813 712 846 P
S-2 145FP 159FP 179FP 102FP 48 N 4
S-5 901 1571 1112 1073 1279 P
S-6 1887 3177 3347 2143 3951 P
M-1 508 243 395 215 239 P
M-3 190 193 102 90 184 P
M-4 95 61FN 158 81 149 P 1
M-5 18 15 22 45 25 N
WT-2 18 4 9 6 9.2 N
WT-5 9 9 8 11 5.6 N
WT-6 18 18 25 12 17 N
WT-7 186 188 228 252 333 P
WT-8 123 131 83 81 159 P
R-2 139 93 126 103 115 P
R-3 20 26 18 18 33 N
R-4 4 4 6 69 2.9 N
R-7 9 34 13 12 10 N
R-8 13 11 12 11 18 N
Total 8 5
False Positive (%) 6
False Negative (%) 4
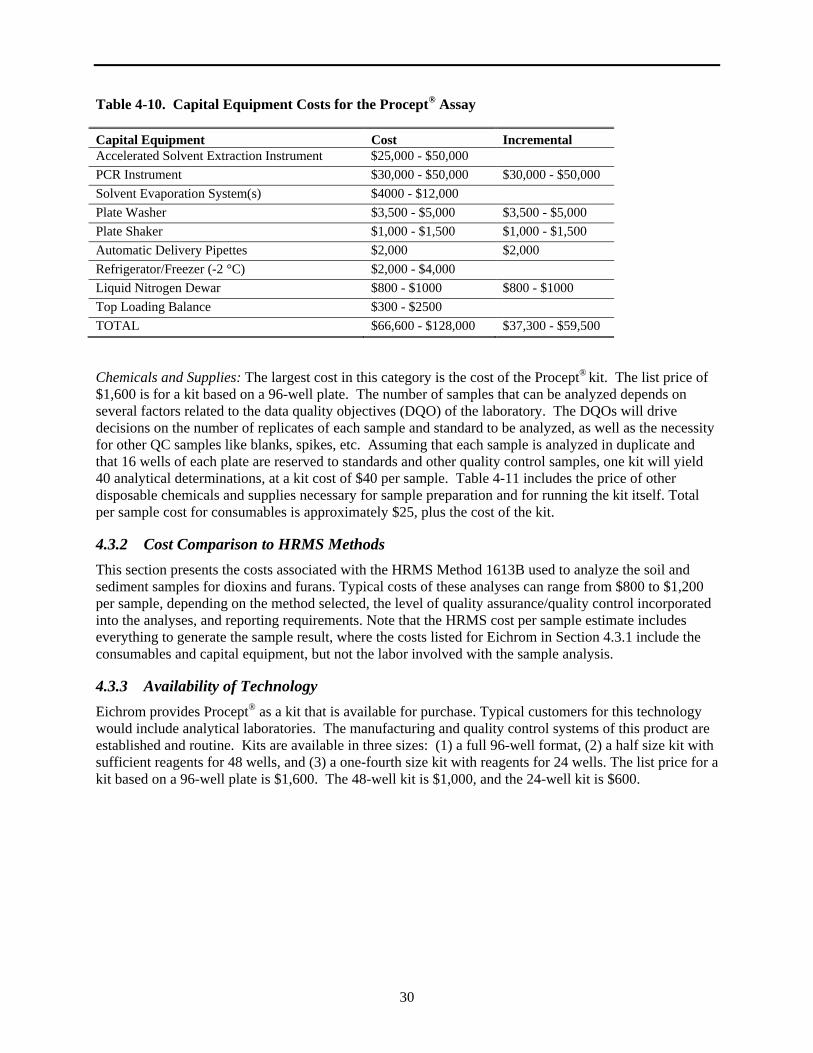
30
Table 4-10. Capital Equipment Costs for the Procept® Assay
Capital Equipment Cost Incremental Accelerated Solvent Extraction Instrument $25,000 - $50,000
PCR Instrument $30,000 - $50,000 $30,000 - $50,000
Solvent Evaporation System(s) $4000 - $12,000
Plate Washer $3,500 - $5,000 $3,500 - $5,000
Plate Shaker $1,000 - $1,500 $1,000 - $1,500
Automatic Delivery Pipettes $2,000 $2,000
Refrigerator/Freezer (-2 °C) $2,000 - $4,000
Liquid Nitrogen Dewar $800 - $1000 $800 - $1000
Top Loading Balance $300 - $2500
TOTAL $66,600 - $128,000 $37,300 - $59,500
Chemicals and Supplies: The largest cost in this category is the cost of the Procept® kit. The list price of $1,600 is for a kit based on a 96-well plate. The number of samples that can be analyzed depends on several factors related to the data quality objectives (DQO) of the laboratory. The DQOs will drive decisions on the number of replicates of each sample and standard to be analyzed, as well as the necessity for other QC samples like blanks, spikes, etc. Assuming that each sample is analyzed in duplicate and that 16 wells of each plate are reserved to standards and other quality control samples, one kit will yield 40 analytical determinations, at a kit cost of $40 per sample. Table 4-11 includes the price of other disposable chemicals and supplies necessary for sample preparation and for running the kit itself. Total per sample cost for consumables is approximately $25, plus the cost of the kit.
4.3.2 Cost Comparison to HRMS Methods
This section presents the costs associated with the HRMS Method 1613B used to analyze the soil and sediment samples for dioxins and furans. Typical costs of these analyses can range from $800 to $1,200 per sample, depending on the method selected, the level of quality assurance/quality control incorporated into the analyses, and reporting requirements. Note that the HRMS cost per sample estimate includes everything to generate the sample result, where the costs listed for Eichrom in Section 4.3.1 include the consumables and capital equipment, but not the labor involved with the sample analysis.
4.3.3 Availability of Technology
Eichrom provides Procept® as a kit that is available for purchase. Typical customers for this technology would include analytical laboratories. The manufacturing and quality control systems of this product are established and routine. Kits are available in three sizes: (1) a full 96-well format, (2) a half size kit with sufficient reagents for 48 wells, and (3) a one-fourth size kit with reagents for 24 wells. The list price for a kit based on a 96-well plate is $1,600. The 48-well kit is $1,000, and the 24-well kit is $600.
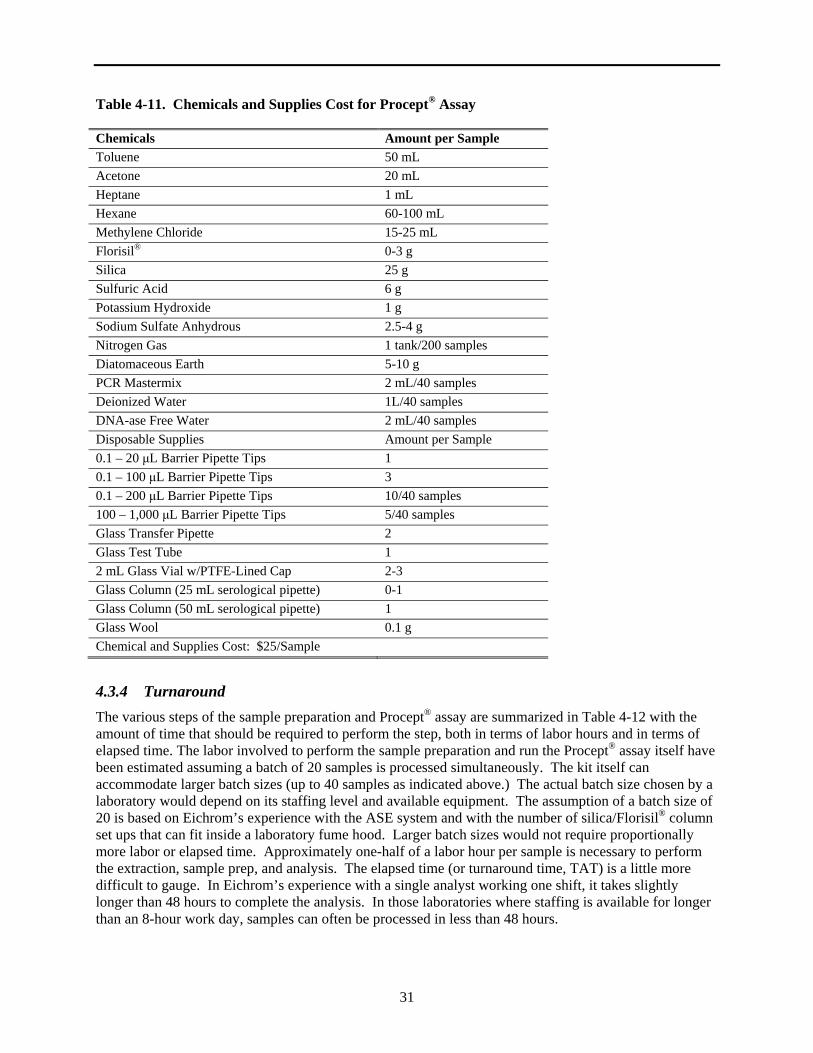
31
Table 4-11. Chemicals and Supplies Cost for Procept® Assay
Chemicals Amount per Sample
Toluene 50 mL
Acetone 20 mL
Heptane 1 mL
Hexane 60-100 mL
Methylene Chloride 15-25 mL
Florisil® 0-3 g
Silica 25 g
Sulfuric Acid 6 g
Potassium Hydroxide 1 g
Sodium Sulfate Anhydrous 2.5-4 g
Nitrogen Gas 1 tank/200 samples
Diatomaceous Earth 5-10 g
PCR Mastermix 2 mL/40 samples
Deionized Water 1L/40 samples
DNA-ase Free Water 2 mL/40 samples
Disposable Supplies Amount per Sample
0.1 – 20 μL Barrier Pipette Tips 1
0.1 – 100 μL Barrier Pipette Tips 3
0.1 – 200 μL Barrier Pipette Tips 10/40 samples
100 – 1,000 μL Barrier Pipette Tips 5/40 samples
Glass Transfer Pipette 2
Glass Test Tube 1
2 mL Glass Vial w/PTFE-Lined Cap 2-3
Glass Column (25 mL serological pipette) 0-1
Glass Column (50 mL serological pipette) 1
Glass Wool 0.1 g
Chemical and Supplies Cost: $25/Sample
4.3.4 Turnaround
The various steps of the sample preparation and Procept® assay are summarized in Table 4-12 with the amount of time that should be required to perform the step, both in terms of labor hours and in terms of elapsed time. The labor involved to perform the sample preparation and run the Procept® assay itself have been estimated assuming a batch of 20 samples is processed simultaneously. The kit itself can accommodate larger batch sizes (up to 40 samples as indicated above.) The actual batch size chosen by a laboratory would depend on its staffing level and available equipment. The assumption of a batch size of 20 is based on Eichrom’s experience with the ASE system and with the number of silica/Florisil® column set ups that can fit inside a laboratory fume hood. Larger batch sizes would not require proportionally more labor or elapsed time. Approximately one-half of a labor hour per sample is necessary to perform the extraction, sample prep, and analysis. The elapsed time (or turnaround time, TAT) is a little more difficult to gauge. In Eichrom’s experience with a single analyst working one shift, it takes slightly longer than 48 hours to complete the analysis. In those laboratories where staffing is available for longer than an 8-hour work day, samples can often be processed in less than 48 hours.
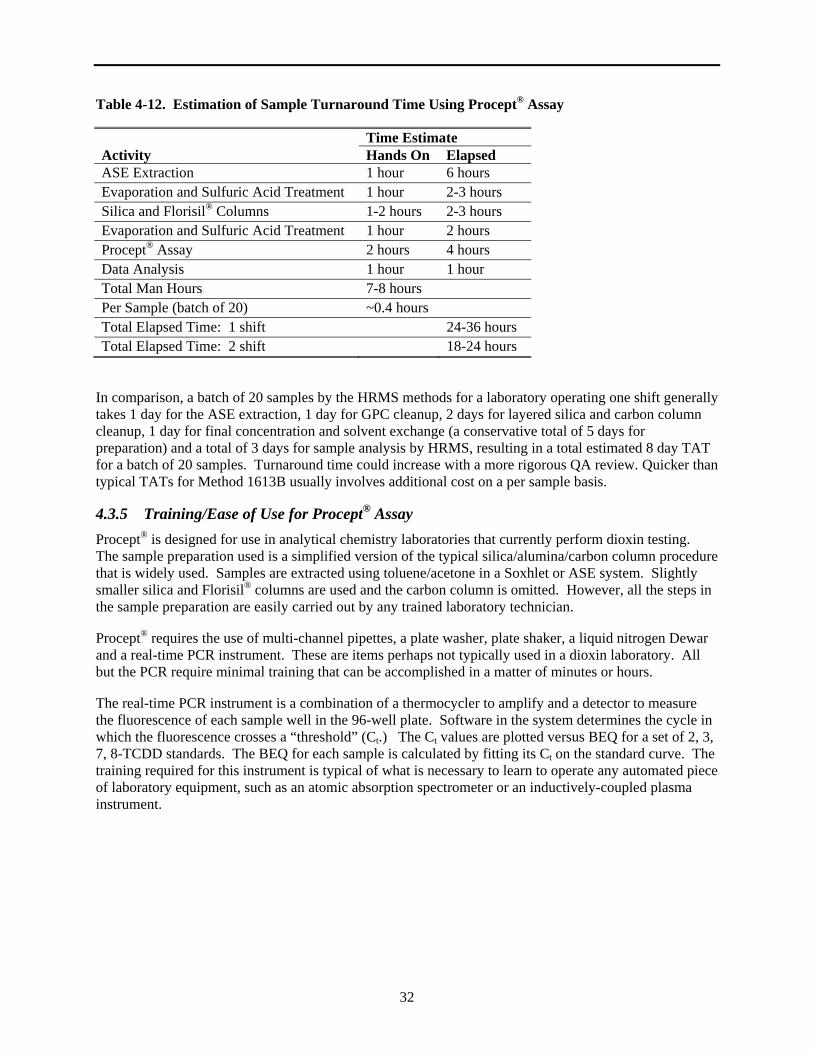
32
Table 4-12. Estimation of Sample Turnaround Time Using Procept® Assay
Activity ASE Extraction Evaporation and Sulfuric Acid Treatment
Time Estimate Hands On Elapsed 1 hour 6 hours 1 hour 2-3 hours
Silica and Florisil® Columns Evaporation and Sulfuric Acid Treatment
1-2 hours 1 hour
2-3 hours 2 hours
Procept® Assay Data Analysis Total Man Hours Per Sample (batch of 20) Total Elapsed Time: 1 shift Total Elapsed Time: 2 shift
2 hours 4 hours 1 hour 1 hour 7-8 hours ~0.4 hours 24-36 hours 18-24 hours
In comparison, a batch of 20 samples by the HRMS methods for a laboratory operating one shift generally takes 1 day for the ASE extraction, 1 day for GPC cleanup, 2 days for layered silica and carbon column cleanup, 1 day for final concentration and solvent exchange (a conservative total of 5 days for preparation) and a total of 3 days for sample analysis by HRMS, resulting in a total estimated 8 day TAT for a batch of 20 samples. Turnaround time could increase with a more rigorous QA review. Quicker than typical TATs for Method 1613B usually involves additional cost on a per sample basis.
4.3.5 Training/Ease of Use for Procept® Assay
Procept® is designed for use in analytical chemistry laboratories that currently perform dioxin testing. The sample preparation used is a simplified version of the typical silica/alumina/carbon column procedure that is widely used. Samples are extracted using toluene/acetone in a Soxhlet or ASE system. Slightly smaller silica and Florisil® columns are used and the carbon column is omitted. However, all the steps in the sample preparation are easily carried out by any trained laboratory technician.
Procept® requires the use of multi-channel pipettes, a plate washer, plate shaker, a liquid nitrogen Dewar and a real-time PCR instrument. These are items perhaps not typically used in a dioxin laboratory. All but the PCR require minimal training that can be accomplished in a matter of minutes or hours.
The real-time PCR instrument is a combination of a thermocycler to amplify and a detector to measure the fluorescence of each sample well in the 96-well plate. Software in the system determines the cycle in which the fluorescence crosses a “threshold” (Ct.) The Ct values are plotted versus BEQ for a set of 2, 3, 7, 8-TCDD standards. The BEQ for each sample is calculated by fitting its Ct on the standard curve. The training required for this instrument is typical of what is necessary to learn to operate any automated piece of laboratory equipment, such as an atomic absorption spectrometer or an inductively-coupled plasma instrument.
33
Chapter 5 Conclusions
Eichrom anticipates that this technology will mostly be used by analytical laboratories prior to the more expensive HRMS analysis, given its lower cost and quicker analysis time. Prior to GC-MS analyses, Procept® may be useful as a screening technique to provide estimates of the TEQ present at a site, such as a method of monitoring the effectiveness of remedial actions. With site-specific calibration of the Procept® results using a one-point (e.g., QC sample) GC-MS result, it is a potential tool for providing an estimate of TEQ concentrations, although some level of false positives and negatives between 5 and 10% could be expected, based on the observations during this study.
Although considerable progress has been made, additional studies to address questions about the technology to achieve a better understanding on its performance should be undertaken. Additional research to gain a better understanding of factors that are potentially contributing to the differences between the Procept® BEQ and GC-MS TEQ results should be conducted.
34
Chapter 6 References
Schrock, M.; Dindal, A.; and Billets, S. “Evaluation of Alternative Approaches for Screening Contaminated Sediments and Soils for PCDD/PCDF.” Journal of Environmental Management 90 (2009) 1289–1295.
U.S. EPA, 1994. EPA Method 1613B. Dioxins, Tetra- thru Octa-(CDDs) and Furans (CDFs), EPA/821/B-94-005, 40 Code of Federal Regulations Part 136, Appendix A, October 1994.
U.S. EPA, 2004. Demonstration and Quality Assurance Project Plan, EPA/600/R-04/036, April.
U.S. EPA, 2005a. Innovative Technology Verification Report, Xenobiotic Detection Systems, CALUX® by XDS. EPA/540/R-05/001, July.
U.S. EPA, 2005b. Innovative Technology Verification Report, Wako Pure Chemical Industries, Dioxin ELISA Kit. EPA/540/R-05/002, March.
U.S. EPA, 2005c. Innovative Technology Verification Report, Abraxis, Coplanar PCB ELISA Kit. EPA/540/R-05/003, March.
U.S. EPA, 2005d. Innovative Technology Verification Report, CAPE Technologies, DF1 Dioxin/Furan Immunoassay Kit and PCB TEQ Immunoassay Kit. EPA/540/R-05/004, March.
U.S. EPA, 2005e. Innovative Technology Verification Report, Hybrizyme Corporation, AhRC PCR™ Kit. EPA/540/R-05/005, March.
U. S. EPA, 2007a. Interim Report on the Evolution and Performance of the Eichrom Technologies Procept® Rapid Dioxin Assay for Soil and Sediment Samples. EPA/540/R-07/001, January.
U. S. EPA, 2007b, SW-846 Method 4430, “Screening for Polychlorinated Dibenzo-p-Dioxins and Furans (PCDD/Fs) By Aryl Hydrocarbon-Receptor PCR Assay, Revision 0, December. http://www.epa.gov/osw/hazard/testmethods/sw846/index.htm
U.S. EPA, 2009. http://epa.gov/superfund/policy/remedy/sfremedy/remedies/dioxinsoil.html.
van den Berg, M., Birnbaum, L., Bosveld, A. T. C., Brunström, B., Cook, P., Feeley, M., Giesy, J. P., Hanberg, A., Hasagawa, R., Kennedy, S. W., Kubiak, T., Larsen, J. C., van Leeuwen, F. X. R., Liem, A. K. D., Nolt, C., Peterson, R. E., Poellinger, L., Safe, S., Schrenk, D., Tillitt, D., Tysklind, M., Younes, M., Waern, F., and Zacharewski, T. 1998. Toxic equivalency factors (TEFs) for PCBs, PCDDs, PCDFs for humans and wildlife. Environmental Health Perspectives 106: 775–792.
van den Berg, M., Birnbaum, L., Denison, M., De Vito, M., Farland, W., Feeley, M., Fiedler, H., Hakansson, H., Hanberg, A., Haws, L., Rose, M., Safe, S., Schrenk, D., Tohyama, C., Tritscher, A., Tuomisto, J., Tysklind, M., Walker, N., and Peterson, R. 2006. The 2005 Word Health Organization Reevaluation of Human and Mammalian Toxic Equivalency Factors for Dioxins and Dioxin-Like Compounds. Toxicological Sciences 93(2): 223-241.

Please make all necessary changes on the below label, detachor copy and return to the address in the upper left hand corner.
If you do not wish to receive these reports CHECK HERE ; detach, or copy this cover, and return to the address in the upper left hand corner.
Office of Research and Development (8101R) Washington, DC 20460
Official Business Penalty for Private Use $300 EPA/540/R-11/002 October 2011 www.epa.gov
vRecycled/Recyclable
Printed with vegetable-based ink on paper that contains a minimum of 50% post-consumer fiber content processed chlorine free
Related Documents