C:\DOCUMENTS AND SETTINGS\BXS\LOCAL SETTINGS\TEMP\FINAL REPORT - 20 JUNE 05_1.DOC Measuring the tax compliance costs of small and medium-sized businesses – a benchmark survey Final Report Colmar Brunton undertakes all research projects to the highest possible standards, and in accord with the principles detailed in the MRSNZ Code of Practice which is based on the ESOMAR Code of Conduct for Market Research. All methodologies and techniques outlined in this report are provided solely for use by the client. Copyright is reserved by Colmar Brunton. Attention: Stuart Turner and Prue Oxley Contact: Jocelyn Rout (09) 919 9212 Issue Date: 20 June 2005 Prepared for: Inland Revenue

Welcome message from author
This document is posted to help you gain knowledge. Please leave a comment to let me know what you think about it! Share it to your friends and learn new things together.
Transcript

C:\DOCUMENTS AND SETTINGS\BXS\LOCAL SETTINGS\TEMP\FINAL REPORT - 20 JUNE 05_1.DOC
Measuring the tax compliance costs of small and medium-sized businesses – a benchmark survey
Final Report
Colmar Brunton undertakes all research projects to the highest possible standards, and in accord with the principles detailed in the MRSNZ Code of Practice which is based on the ESOMAR Code of Conduct for Market Research.
All methodologies and techniques outlined in this report are provided solely for use by the client. Copyright is reserved by Colmar Brunton.
Attention: Stuart Turner and Prue Oxley
Contact: Jocelyn Rout (09) 919 9212
Issue Date: 20 June 2005
Prepared for: Inland Revenue

FINAL REPORT PAGE 1
colmar brunton
Table of Contents
List of tables.................................................................................................................................3
1. Executive summary .............................................................................................................................. 7 Research purpose .........................................................................................................................7 Research methodology ..................................................................................................................7 Key findings .................................................................................................................................7
Definitions ................................................................................................................................7 Internal compliance costs...........................................................................................................8 External tax advisor costs ..........................................................................................................9 Payroll services .......................................................................................................................10 Combined costs.......................................................................................................................10 Reported stress levels..............................................................................................................12
2. Background and objectives ................................................................................................................ 13 Background................................................................................................................................13
Policy purposes .......................................................................................................................13 Alignment with other Inland Revenue priorities ..........................................................................13
Research objectives ....................................................................................................................13 Defining compliance costs............................................................................................................14
3. Research methodology....................................................................................................................... 16 Overview ...................................................................................................................................16 Scoping and design.....................................................................................................................17
Acknowledgements .................................................................................................................17 Sample design ........................................................................................................................17 Questionnaire development......................................................................................................18
Main fieldwork – business survey .................................................................................................19 Business survey ......................................................................................................................19 Tax advisor sub-survey – response rate ....................................................................................21
Data integrity and data processing ...............................................................................................21 Database construction.................................................................................................................21
Weighting...............................................................................................................................21 Data imputation ......................................................................................................................21 Calculation of means ...............................................................................................................21 Calculation of medians.............................................................................................................21 Treatment of missing information .............................................................................................21 Presentation of results .............................................................................................................21 Significance testing .................................................................................................................21
4. Sample profile .................................................................................................................................... 21 Sample profile by business size ....................................................................................................21
5. Internal time and costs ...................................................................................................................... 21 Internal time ..............................................................................................................................21
Internal time spent on specific tax activities...............................................................................21

FINAL REPORT PAGE 2
colmar brunton
Internal time spent on tax activities by specific types of personnel...............................................21 Internal time spent dealing with child support and student loans.................................................21 Internal time spent on particular income tax-related activities .....................................................21 Internal time spent on tax-related activities required for entertainment expenses .........................21
Value of time analysis .................................................................................................................21 Income tax.................................................................................................................................21
Stress associated with provisional tax compliance ......................................................................21 GST...........................................................................................................................................21
Accounting system used for GST ..............................................................................................21 Basis on which GST is accounted for and GST filing frequency.....................................................21 Whether business would still use computerised accounting software if New Zealand was tax-free ..21 Stress associated with GST compliance .....................................................................................21
PAYE .........................................................................................................................................21 Method used to process staff wages .........................................................................................21 Filing method..........................................................................................................................21 Stress associated with PAYE compliance....................................................................................21
FBT ...........................................................................................................................................21 Stress associated with FBT compliance......................................................................................21
6. External tax advisor costs ................................................................................................................... 21 Use of, and payment for, external tax advisor services – business survey data .............................21 Tax advisor sub-survey results .................................................................................................21 External compliance costs by tax type .......................................................................................21 Whether a business would still pay their external accountant to do their annual accounts if New Zealand was tax-free ...............................................................................................................21
7. Payroll services................................................................................................................................... 21
8. Audit ................................................................................................................................................... 21
9. Combined costs .................................................................................................................................. 21 Summary of internal time ............................................................................................................21 Summary of compliance costs ......................................................................................................21
10. Psychological compliance costs........................................................................................................ 21
Appendices .............................................................................................................................................. 21 A. Response rate over time.........................................................................................................21 B. Sample profile – unweighted data ...........................................................................................21 C. Internal time – excludes those who spent zero hours ................................................................21 D. External costs based on businesses who use an advisor ............................................................21 E. Payment for external tax services – comparison of tax advisor and business survey data .............21 F. Analysis by sector ..................................................................................................................21 G. Analysis by age of business ....................................................................................................21
Questionnaire .......................................................................................................................................... 21

FINAL REPORT PAGE 3
colmar brunton
List of tables Table 3.1: Response rate analysis ................................................................................................................... 20
Table 3.2: Comparison of respondents and non-respondents............................................................................ 21
Table 3.3: Internal time spent on all tax activities (annual hours) by tax type and date of questionnaire return – means.................................................................................................................... 22
Table 3.4: Response rate analysis – tax advisor sub-survey.............................................................................. 22
Table 4.1: Sample profile by business size (number of employees) ................................................................... 30
Table 4.2: Sample profile by tax type.............................................................................................................. 34
Table 4.3: Tax type by business size .............................................................................................................. 37
Table 5.1: Internal time spent on tax activities (annual hours) by tax type – means ......................................... 39
Table 5.2: Internal time spent on tax activities (annual hours) by tax type – medians ........................................ 40
Table 5.3: Internal time spent on tax activities (annual hours) by business size – means ................................... 41
Table 5.4: Internal time spent on tax activities (annual hours) by business size – medians................................. 41
Table 5.5: Time spent on all tax activities for each tax type by business size ..................................................... 42
Table 5.6: Internal time spent by personnel on all tax activities (annual hours) by tax type – means .................. 44
Table 5.7: Internal time spent by personnel on all tax activities (annual hours) by tax type – medians................ 45
Table 5.8: Internal time spent by all personnel on all tax activities (annual hours) by business size (number of employees) – means ............................................................................................................... 46
Table 5.9: Internal time spent by all personnel on all tax activities (annual hours) by business size (number of employees) – medians............................................................................................................. 46
Table 5.10: Internal time spent (annual hours) dealing with child support and student loans by business size (number of employees)......................................................................................................... 48
Table 5.11: Internal time spent (annual hours) dealing with child support and student loans by filing method..... 49
Table 5.12: Internal time spent (annual hours) on particular income tax-related activities by business size (number of employees) – means .......................................................................................... 50
Table 5.13: Internal time spent (annual hours) on particular income tax-related activities by business size (number of employees) – medians ....................................................................................... 50
Table 5.14: Internal time spent (annual hours) on particular income tax-related activities by age of business...... 51
Table 5.15: Internal time spent (annual hours) on particular income tax-related activities by provisional tax options .............................................................................................................................. 51
Table 5.16: Internal time spent (annual hours) on tax-related activities required for entertainment expenses...... 52
Table 5.17: Value of time data relating to owners ............................................................................................ 54
Table 5.18: Value of time data relating to paid employees................................................................................ 54
Table 5.19: Value of time data relating to unpaid friends or relatives ................................................................ 55
Table 5.20: Summary of internal income tax compliance costs.......................................................................... 56
Table 5.21: Internal time spent (annual hours) by personnel on income tax by business size (number of employees)............................................................................................................................. 57
Table 5.22: Mean internal compliance costs of income tax by business size (number of employees) ................... 57
Table 5.23: Mean internal compliance costs of income tax by use of a tax advisor for income tax....................... 58
Table 5.24: Mean internal compliance costs of income tax by business size (number of employees) and whether business uses tax advisor for income tax ................................................................................ 58
Table 5.25: Mean internal compliance costs of income tax as a percent of turnover ........................................... 59
Table 5.26: Stress associated with provisional tax compliance .......................................................................... 60
Table 5.27: Stress associated with provisional tax compliance – mean scores by business size (number of employees) and age of business .............................................................................................. 60

FINAL REPORT PAGE 4
colmar brunton
Table 5.28: Stress associated with provisional tax compliance – mean scores by business size (number of employees) and accounting system.......................................................................................... 61
Table 5.29: Stress associated with provisional tax compliance – analysed by who answered the question ........... 62
Table 5.30: Summary of internal GST compliance costs.................................................................................... 63
Table 5.31: Internal time spent (annual hours) by personnel on GST analysed by business size (number of employees)............................................................................................................................. 63
Table 5.32: Mean internal compliance costs of GST by business size ................................................................. 64
Table 5.33: Mean internal compliance costs of GST as a proportion of turnover................................................. 64
Table 5.34: Internal time spent (annual hours) on GST by age of business and business size (turnover) ............. 65
Table 5.35: Accounting system used for GST by business size (number of employees)....................................... 65
Table 5.36: Accounting system used for GST by age of business ...................................................................... 66
Table 5.37: Mean internal compliance costs of GST by accounting system and business size (turnover) .............. 66
Table 5.38: Mean internal compliance costs of GST by GST basis and business size (turnover) ........................... 67
Table 5.39: Mean internal compliance costs of GST by GST filing frequency and business size (turnover)............ 67
Table 5.40: Whether business would still use computerised accounting software if New Zealand was tax-free............................................................................................................................................. 68
Table 5.41: Stress associated with GST compliance.......................................................................................... 69
Table 5.42: Stress associated with GST compliance – mean scores by business size (number of employees) by age of business.................................................................................................................................... 69
Table 5.43: Stress associated with GST compliance – mean scores by business size (number of employees) by accounting system ............................................................................................................................... 70
Table 5.44: Stress associated with GST compliance – mean scores by business size (number of employees) by accounting system ............................................................................................................................... 70
Table 5.45: Stress associated with GST tax compliance ................................................................................... 71
Table 5.46: Summary of internal PAYE compliance costs .................................................................................. 72
Table 5.47: Internal time spent by personnel on PAYE (annual hours) by business size (number of employees) .. 73
Table 5.48: Mean internal compliance costs of PAYE by business size (number of employees) ............................ 73
Table 5.49: Mean internal compliance costs of PAYE per employee ................................................................... 74
Table 5.50: Mean internal compliance costs of PAYE as a percent of turnover ................................................... 74
Table 5.51: Method used in processing staff wages by business size (number of employees) ............................. 75
Table 5.52: Mean internal compliance costs of PAYE analysed by method used to process staff wages and business size (number of employees) .................................................................................................. 75
Table 5.53: Mean internal compliance costs of PAYE analysed by business size (number of employees) and filing method ..................................................................................................................................... 76
Table 5.54: Stress associated with PAYE compliance ........................................................................................ 77
Table 5.55: Stress associated with PAYE compliance – mean scores by business size (number of employees) and age of business.................................................................................................................................. 78
Table 5.56: Stress associated with PAYE compliance – mean scores by business size (number of employees) by accounting system ............................................................................................................................... 78
Table 5.57: Stress associated with PAYE compliance – mean scores by business size (number of employees) by filing method ....................................................................................................................................... 79
Table 5.58: Stress associated with PAYE compliance ....................................................................................... 79
Table 5.59: Summary of internal FBT compliance costs .................................................................................... 80
Table 5.60: Mean internal compliance costs of FBT by business size (number of employees) .............................. 80
Table 5.61: Mean internal compliance costs of FBT as a percent of turnover ..................................................... 81
Table 5.62: Stress associated with FBT compliance .......................................................................................... 82

FINAL REPORT PAGE 5
colmar brunton
Table 5.63: Stress associated with FBT compliance ......................................................................................... 83
Table 6.1: Use of, and payment for, external tax advisor services (business survey data)................................... 84
Table 6.2: Profile of tax advisor sub-survey sample.......................................................................................... 85
Table 6.3: Payment made for external tax services – results from Advisor sub-survey........................................ 86
Table 6.4: External mean compliance costs by tax type and business size (number of employees)...................... 87
Table 6.5: External mean compliance costs by tax type and business size (turnover) ......................................... 87
Table 6.6: Mean external compliance costs tax as a percent of turnover............................................................ 88
Table 6.7: Payment made for external advice on choice between provisional tax options ................................... 88
Table 6.8: Whether a business would still pay their external accountant to do their annual accounts if New Zealand was tax-free – analysed by business size (number of employees) ........................... 89
Table 6.9: Whether a business would still pay their external accountant to do their annual accounts if New Zealand was tax-free – analysed by entity type.................................................................. 89
Table 6.10: Tax advisors’ views on whether a business would still pay their external accountant to do their annual accounts if New Zealand was tax-free – analysed by business size (number of employees).... 90
Table 6.11: Tax advisors’ views on whether business would still pay their external accountant to do their annual accounts if New Zealand was tax-free – analysed by entity type........................................... 90
Table 6.12: Comparison of tax advisors’ and businesses’ views on whether business would still pay their external accountant to do their annual accounts if New Zealand was tax-free ................................ 91
Table 7.1: Use of, and payment for, external payroll services ........................................................................... 92
Table 7.2: Whether business would still pay for external payroll services if New Zealand became tax-free........... 93
Table 8.1: Incidence of IRD audit and related time and cost incurred by the business........................................ 94
Table 9.1: Summary of internal time spent on all tax activities by tax type and business size (number of employees)............................................................................................................................. 95
Table 9.2: Summary of internal time spent on all tax activities by tax type and business size (turnover) ............. 96
Table 9.3: Internal time spent (mean annual hours) on all tax activities by age of business and business size (number of employees) .................................................................................................. 96
Table 9.4: Summary of mean annual compliance costs by business size (number of employees) ........................ 97
Table 9.5: Summary of mean annual compliance costs by business size (turnover)............................................ 98
Table 9.6: Summary of mean annual compliance costs by entity type ............................................................... 99
Table 10.1: Overall psychological compliance costs and reported stress levels by tax type.................................. 100
Table 10.2: Overall psychological compliance costs by business size (number of employees).............................. 101
Table 10.3: Psychological costs associated with overall tax requirements (ignoring finding the money) ............... 102
Table 11.1: Sample profile by business size – unweighted data ........................................................................ 104
Table 11.2: Sample profile by tax type – unweighted data................................................................................ 108
Table 11.3: Tax type by business size – unweighted data................................................................................. 111
Table 11.4: Internal time spent on tax activities (annual hours) by tax type – means ........................................ 112
Table 11.5: Internal time spent by personnel on all tax activities (annual hours) by tax type – means ................ 113
Table 11.6: External mean compliance costs by tax type and business size (number of employees) .................... 113
Table 11.7: Internal time spent on tax activities (annual hours) by sector ......................................................... 118
Table 11.8: Internal time spent by all personnel on all tax activities (annual hours) by sector............................. 119
Table 11.9: Internal time spent on all tax activities for each tax type (annual hours) by sector ........................... 119
Table 11.10: Stress associated with provisional tax compliance – mean scores by business size (number of employees) and sector ............................................................................................................ 120
Table 11.11: Mean internal compliance costs of GST by business size (turnover) and sector............................... 120
Table 11.12: Accounting system used for GST by sector................................................................................... 121

FINAL REPORT PAGE 6
colmar brunton
Table 11.13: Stress associated with GST compliance – mean scores by business size (number of employees) by sector.................................................................................................................................................. 121
Table 11.14: Stress associated with PAYE compliance – mean scores by business size (number of employees) and sector................................................................................................................................................ 122

FINAL REPORT PAGE 7
colmar brunton
1. Executive summary
Research purpose Inland Revenue has commissioned research to measure the tax compliance costs of small and medium sized businesses (SMEs) so that independent and evidence-based information can be used in developing and evaluating tax policy proposals. The research has been set up so that it can respond to policy proposals as they arise over the next 5-10 years. The starting point is a major benchmark survey quantifying relevant tax compliance costs for small and medium businesses.
Research methodology A mail-out survey of small and medium businesses was conducted between October and December of 2004. A total of 1907 completed questionnaires were used in the analysis linked to key IRD extracted data. The response rates to the survey were 44% and 45% (for two questionnaire versions1). Extensive qualitative pre-testing and piloting of the questionnaire was undertaken, as well as pilot data verification interviews, to develop and refine the questionnaires as well as to provide reassurance of the validity of the final dataset. A tax advisor sub-survey was conducted in December 2004 to gather information in order to apportion external tax advisor compliance costs to different tax types (this was especially important for businesses paying for external advice on multiple tax types).
Key findings
Definitions The measure of compliance costs used in this survey includes internal time and external advisor costs. Data is also collected on psychological costs although this is not converted into dollars. Cash flow, tax deductibility and managerial benefits and government cash grants are not included. The population of interest is New Zealand’s small and medium businesses (based on number of employees and annual turnover) and self-employed individuals with substantial income from ‘businesses activities’ (SMEs).
1 Two versions of the questionnaire were designed; a ‘long’ version of the questionnaire which was relevant to multiple tax type
businesses, and a ‘short’ version of the questionnaire which was relevant to those paying income tax only. The questions in this short questionnaire were essentially a subset of the long (main) questionnaire.

FINAL REPORT PAGE 8
colmar brunton
Internal compliance costs Averages for internal compliance costs were calculated using a trimmed mean (i.e. with a few unusually high values removed before averaging) rather than the usual mean (which averages all values). Internal time spent on all tax activities The average SME spends 76.7 hours on tax compliance in a year. A breakdown of this amount by personnel type is as follows:
• owners/partners/directors/trustees (56.3 hours)
• paid employees (18.4 hours)
• unpaid friends or relatives (3.4 hours). The amount of time spent on tax activities is strongly related to business size (from 51.3 hours for businesses without employees up to 204.5 hours for businesses with at least 20 employees). GST requires the greatest time commitment (44.2 hours for GST-registered businesses), followed by income tax (29.2 hours for those who pay income tax), PAYE (27.5 hours for employers), and FBT (12.8 hours for FBT payers). Internal time spent dealing with child support and student loans 11% of employers employ staff paying child support. On average, these employers spend 0.5 hours per year dealing with PAYE issues related to child support. This equates to 1.3% of the time they spend on PAYE in total. 20% of employers employ staff making student loan payments. On average, these employers spend 0.5 hours per year dealing with PAYE issues related to student loans. This equates to 1.3% of the time they spend on PAYE in total. Internal time spent on particular income tax-related activities On average, businesses spent around two hours in the last 12 months on each of the following activities:
• Calculating provisional tax and deciding which provisional tax option to choose
• Tax activities for depreciation and adjustments for fixed assets, valuing stock
• Other end-of-year adjustments. The median values associated with these activities are zero indicating that most businesses have not spent any time on these activities in the last 12 months. Medium sized SMEs spend on average 12 hours per year on tax activities for depreciation and adjustments for fixed assets and valuing stock. Internal time spent on tax-related activities required for entertainment expenses Seventeen percent of businesses have dealt with the 50% deductibility and GST adjustment required for some entertainment expenses in the last 12 months. Businesses that make these type of adjustments spend around two hours per year on them. Value of time analysis The following dollar amounts were used to convert time into compliance costs:
• $43.99 (owners/partners/directors/trustees)
• $20.31 (paid employees)

FINAL REPORT PAGE 9
colmar brunton
• $25.70 (unpaid friends or relatives). Income tax The mean annual internal compliance cost for income tax is $1224. Income tax compliance costs rise with business size from $1146 for businesses with no employees to $1896 for businesses with 20+ employees. Income tax compliance costs are the same between those that use a tax advisor and those that do not ($1202 respectively). GST The mean annual internal compliance cost for GST is $1852 (based on those who file/pay GST). GST compliance costs increase with business size (from $1496 for businesses with no employees to $2369 for businesses with 20+ employees). A similar pattern is evident with regard to turnover. However, other analysis also shows that GST compliance costs as a proportion of turnover diminish sharply with size. Forty percent of GST-registrants use manual accounting systems for GST, 38% use computerised accounting software (in-house), 15% use ‘other’ computing systems (in-house) and 14% use external support. Those who pay for an external firm to handle aspects of their GST obligations experience the lowest internal GST tax compliance costs ($1399). Eighty four percent of those who use computerised accounting software say they would ‘definitely’ or ‘probably’ still do so if New Zealand were tax-free, highlighting the importance of this type of software as a management information tool rather than a tax compliance cost. More frequent filers of GST experience higher internal GST compliance costs (annual mean compliance costs of $1993 for 2-monthly filers compared to $1449 for 6-monthly filers). PAYE The mean annual internal compliance cost for PAYE is $937 (based on employers). PAYE compliance costs rise with employer size from $959 for micro businesses (1-5 employees) to $1404 for medium-sized employers (20+ employees). However, smaller employers experience a markedly higher compliance cost on a per employee basis - $520 for micro employers (1-5 employees), $166 for small employers (6-19 employees) and $43 for medium employers (20+ employees). Sixty percent of employers use a manual system for processing staff wages, 26% use a computerised payroll system, and 10% use ‘other’ computing system (in-house). FBT The mean annual compliance cost for FBT is $416 (based on those who make FBT payments). Apart from SMEs with nil employees, FBT compliance costs do not rise with business size.
External tax advisor costs Eighty percent of businesses pay for external tax advisor services. Among those who pay for these services, the mean annual payment is $1465. The mean annual payment made for external tax advisor services for each tax type is as follows:
• $480 for services relating to GST (among all GST-registered businesses who pay for external services related to GST)

FINAL REPORT PAGE 10
colmar brunton
• $1,202 for services relating to income tax (among all those who pay for external services related to income tax)
• $141 for services relating to PAYE (among all employers who pay for external services related to PAYE)
• $149 for services relating to FBT (among all those who make FBT payments to IRD and who pay for external services related to FBT).
Tax advisors indicate that the average payment made for external advice on the choice between provisional tax options is $159 (although this differs markedly according to business size). Opinion, among businesses, on whether they would retain the services of an external tax accountant if New Zealand were tax-free is divided: 44% say that they ‘definitely’ or ‘probably’ would, 45% say they ‘definitely’ or ‘probably’ wouldn’t, and 9% are unsure. Tax advisors are similarly divided on this issue.
Payroll services Seven percent of employers use external payroll services. On average, these businesses spend $1550 on payroll services annually. And, a small majority (56%) of these businesses indicate that they would ‘definitely’ or ‘probably’ still use external payroll services if New Zealand was tax-free.
Combined costs The combined compliance costs given in this report are the sum of internal compliance costs and external compliance costs. They do not include costs associated with audits or payroll services nor do they incorporate any estimates of cash flow benefits or benefits of tax deductibility. Psychological costs have been collected but are not valued in dollar terms. The mean combined compliance costs for businesses are summarised in the first chart below. The average business faces a combined annual tax compliance cost of $4024. GST-related costs and income-tax related costs are by far the largest contributors to this. Again, the familiar pattern of increasing costs with business size is evident – from $2932 for businesses with no employees to $7649 for businesses with 20 or more employees. However, as illustrated in the subsequent chart, compliance costs clearly diminish as a percentage of turnover.

FINAL REPORT PAGE 11
colmar brunton
Figure 1: Combined mean compliance costs (internal plus external)
$0
$1,000
$2,000
$3,000
$4,000
$5,000
$6,000
$7,000
$8,000
$9,000
$10,000
Nil employees Micro Small Medium All SMEs
Business size (number of employees)
GST PAYE FBT Income tax
Combined Mean compliance cost ($)
$2,932
$5,694
$6,827
$7,649
$4,024
Figure 2: Combined mean compliance costs as % of turnover
21.0%
0.2%
7.5%
4.7%
0.9%
2.6%1.6%
0%
5%
10%
15%
20%
25%
500to
1.3m
1.3m+Business size ($ turnover)
Costs as % of
turnover
AB C F GED
A Up to $19,999B $20,000 to $39,999C $40,000 to $99,999D $100,000 to $249,999E $250,000 to $499,999F $500,000 to $1,299,999G $1.3 million +

FINAL REPORT PAGE 12
colmar brunton
Reported stress levels Respondents were asked to indicate how stressful they found meeting IRD requirements overall (ignoring finding the money) and for each tax type separately (including finding the money). Around half (51%) find meeting IRD requirements overall less than moderately stressful (rating of 1 to 3), one quarter (24%) find them moderately stressful, and just under a quarter (23%) find them more than moderately stressful (rating of 5 to 7). Reported levels of stress in dealing with GST and provisional tax are higher than those relating to PAYE and FBT. However, additional analysis detailed in the body of the report shows that employers tend to report higher stress levels than those without employees in regard to their overall tax requirements, provisional tax and GST.

FINAL REPORT PAGE 13
colmar brunton
2. Background and objectives
Background
Policy purposes The small and medium-sized business (SME) sector in New Zealand is important, as most New Zealand businesses are small. More than 95 percent employ fewer than 20 people while 86 percent employ fewer than five. Small businesses also form a more significant part of the economy in New Zealand than they do in other OECD countries. New Zealand averages around six employees per firm, whereas most other OECD countries average from ten to twenty employees. The Government’s tax simplification programme recognises that many small businesses struggle to comply with the increasingly complex set of tax laws to which they are subject. Key concerns for small businesses are the costs of compliance and the risks associated with non-compliance. The focus of the simplification programme is on reducing the stress, uncertainty and risks that these concerns place on small business. A number of discussion documents outlining initiatives to reduce tax compliance costs for small businesses have been released, including the Simplifying Taxpayer Requirements (1997) discussion document and, more recently, the Less Taxing Tax (1999), More Time For Business (2001) and Making Tax Easier for Small Businesses (2003) discussion documents. A number of the initiatives have been implemented.
Research is required to assist in monitoring the impact of past and present legislative and administrative initiatives on reducing business tax compliance costs and also to allow for better consideration of the impact of proposed changes on tax compliance costs at each stage of the tax policy development process. This should also facilitate better compliance with Business Compliance Costs Statement (BCCS) requirements for policy proposals. Alignment with other Inland Revenue priorities A priority for Inland Revenue is to tailor interventions to make it easier for small businesses to meet their tax obligations and to increase their confidence in the tax administration. Simplification of tax administration interventions is a key focus of the Department’s strategy and the Government is implementing or considering a number of specific proposals.2
Research objectives The overriding purpose of the research is to provide independent and evidence-based information on the tax compliance costs of small and medium-sized business for the purposes of developing and evaluating tax policy proposals. The research is to be set up so that it can respond to policy proposals as they arise over the next 5-10 years. The starting point is a major benchmark survey quantifying compliance costs in hours and dollar terms for small and medium businesses.
2 Inland Revenue, ‘Our Statement of Intent’, 2004-2005, p23

FINAL REPORT PAGE 14
colmar brunton
The overall research objectives, which the benchmark survey contributes to, are as follows:
• To estimate the tax compliance costs of small and medium business.
• To provide measures of the impact of actual changes to the tax system on tax compliance costs faced by businesses. In particular:
- By how much and in what direction do compliance costs change? - Which elements of compliance costs change? - Which groups of taxpayers are affected? - To what extent can the changes be attributed to the specific intervention?
• Similarly, for proposed tax initiatives, forecast the expected impact on compliance costs.
• To pre-test the impact of proposed initiatives in a prospective or experimental way.
• To develop and implement a framework for monitoring, over time, the tax compliance costs incurred at various stages of the life (and tax) cycle of a business.
• To provide information for better compliance with BCCS reporting requirements, particularly, in relation to quantitative assessments of compliance costs.
This report presents the results of this benchmark study.
Defining compliance costs The Government’s objective is to make tax easier for small businesses, and this calls for a broad understanding of tax burdens and costs. For example, some of the proposed initiatives aim to reduce the burden through easing cash flow or budgeting problems and these may potentially involve more time spent on tax than previously. This and the fact that this benchmark survey has an applied policy purpose have a number of implications for the definition and measurement of ‘compliance costs’ adopted by Inland Revenue, a definition which differs from the more conventional ‘total compliance costs’ used in other surveys. First, reducing cash flow management problems is an integral element of some of the proposed initiatives. Therefore it is important to include a measure of cash flow benefit in the equation, both in terms of dollars saved or foregone as well the less quantifiable benefits of ease of mind. Second, some of the less frequent compliance costs that may generate unusually high costs (eg associated with being audited) and those where the tax component is not easily isolated (eg paying a payroll agency) have been acknowledged and quantified to varying degrees but not included in the main calculations. Furthermore, this project does not aim to estimate nationwide business compliance costs in total. First, this research has not surveyed all businesses, e.g. large businesses are excluded. Second, calculated compliance costs are based on trimmed means which exclude the extreme values at the upper end, thus providing a more robust basis for comparing compliance costs over time, in the future.

FINAL REPORT PAGE 15
colmar brunton
ATAX’s3 definition of ‘total compliance costs’ is:
(Direct monetary outgoings incurred by taxpayers + Imputed costs of time and resources spent by taxpayers) − (Managerial benefits to taxpayers+ Cash flow benefits to taxpayers + Tax deductibility benefits to taxpayers + Cash grants from the government)
This is the foundation of the definition adopted by Inland Revenue, with the restrictions noted above. The definition for this benchmark quantifying exercise is:
benchmark compliance costs = internal time + external advisor costs – (cash flow benefits + tax deductibility) + psychological costs [excluding audit costs, computing and other internal non-labour costs, external payroll provider costs]
where: internal time = imputed costs of time spent by owners, staff,
family and friends external advisor costs = direct monetary outgoings to tax advisers
(regular & occasional) cash flow benefits = financial benefits arising from the mismatch in
timing between when taxes are collected and when they are remitted to the tax authority
tax deductibility = for example, costs associated with using a tax advisor
psychological costs = the level of stress associated with tax activities including finding the money; measures are not converted to dollars
This survey contributes the data for the core compliance costs, ie internal time and external tax advisor costs. Data on psychological costs has also been collected (though not converted into dollars). Cash flow, tax deductibility and managerial benefits and government cash grants are not included.
3 The tax compliance costs of small and medium-sized business, C Evans and B Tran-Nam, ATAX, University of New South Wales, January 2004, page 12.

FINAL REPORT PAGE 16
colmar brunton
3. Research methodology
This section outlines the research methodology used in conducting this benchmark research.
Overview The diagram below summarises the approach. A more detailed explanation follows. Figure 3: Overview of methodology
Initial scoping and design-scoping report
-questionnaire design- small scale testing of questionnaire
- sampling design
Cognitive interviews to pre-test draft questionnaire
Pilot questionnaire
Pilot data verification interviews
Short questionnaire (income tax only)
Long questionnaire(multiple tax types)
Agent sub-survey
Data integrity and data processing- editing checks
- call backs to check inconsistencies in data- data verification interviews to investigate
potential problems
Database construction - data checked for inconsistencies
- data imputation- data weighted to population characteristics
- trimming of means-data conversions (eg. converting monthly into
annual figures)
Scop
ing
and
desi
gnM
ain
fee
dbac
kD
ata
inte
grit
y, p
roce
ssin
g an
d co
nst
ruct
ion
To maximise response rate:
- postcard reminders- reminder letters with replacement questionnaires- phone reminders- Incentive

FINAL REPORT PAGE 17
colmar brunton
Scoping and design
Acknowledgements The design of this survey has benefited from the collaborative advice of experts in tax compliance costs, in survey research and in business. Inland Revenue appreciates and acknowledges the assistance from Dr Chris Evans and Dr Binh Tran-Nam from Atax, University of New South Wales; Katherine Ritchie, Senior Lecturer in Taxation at Manukau Institute of Technology; Charles Sullivan of Capital Research; Business New Zealand; the Institute of Chartered Accountants of New Zealand; and Colmar Brunton. The conceptual framework and options provided by Atax are in their report to Inland Revenue, The tax compliance costs of small and medium-sized businesses, by C Evans and B Tran-Nam, January 2004.
Sample design Inland Revenue selected a sample of businesses for focus in this research. The population of interest is small and medium businesses in New Zealand, and self-employed individuals with substantial income from such businesses (whose income tax returns are potentially affected by proposed changes to provisional tax). To define this for the purposes of a quantitative survey we used the following dimensions:
1. Business ‘Nature’, indicated by i. legal, or business Structure (IRD’s entity type) ii. types of tax paid
2. Business Size, indicated by i. number of employees ii. annual turnover
The survey population is 485,317 SMEs. In practice, the small and medium business population was defined into two sub-populations:
1. multiple tax type businesses, that is paying GST and/or employing staff (in addition to being subject to income tax) (N = 376,929)
2. those paying income tax only (individuals with business income, sole traders too small to pay GST or employ staff, a few business entities not liable for other taxes)4 – around one quarter of the sample was allocated to this group. (N =108,388)
A disproportionate stratified random sample, totalling 4,848 SMEs, was drawn reflecting different levels of turnover, employee numbers, tax type and whether FBT is paid. Data were weighted so that the results can be used to generalise to the entire population of interest (weighting is discussed later in this chapter).
4 Note, individual self-employed entities were limited to those receiving income from business activity which was judged distinct
from rental, investment or overseas income.

FINAL REPORT PAGE 18
colmar brunton
In general terms, SMEs were included if:
• they were registered for either GST or PAYE (as at 30 June 2004) as Companies, Partnerships, Trusts, Maori Authorities or Individual – Self Employed or Employing taxpaying entities, or
• earned sufficient ‘business income’ and were ‘income tax only’ (IR3, IR4, IR6 & IR7 tax return filers). And excluded if:
• on grounds of size, they employ 50+ staff AND have an annual turnover $10+ million
• were not active i.e. not trading
• were very small or relatively inactive businesses.
An in-depth description and discussion of the sampling design used for this study is given in a document prepared by Inland Revenue:‘Measuring the Compliance Costs of Small and Medium Businesses: Design Summary: Version 2.; 9a. Strata Population Sizes [New Version: including appropriate non-valid addresses].’ Before being given the contact lists of businesses, Inland Revenue sent all the selected businesses a letter introducing the purpose of the forthcoming research and giving businesses an opportunity to withdraw their names from the lists before they were passed onto Colmar Brunton. Following the provision of contact lists of businesses from Inland Revenue, Colmar Brunton removed businesses that had participated in survey research over recent months.
Questionnaire development Initial scoping work and questionnaire development was undertaken by Charles Sullivan and Katherine Ritchie (including testing questionnaire versions with several businesses). Colmar Brunton undertook further work on questionnaire design. Two versions of the questionnaire were designed; a ‘long’ version of the questionnaire which was relevant to multiple tax type businesses, and a ‘short’ version of the questionnaire which was relevant to those paying income tax only. The questions in this short questionnaire were essentially a subset of the long (main) questionnaire. Cognitive interviewing Colmar Brunton conducted 16 cognitive face-to-face interviews in Auckland, Wellington and Christchurch to qualitatively pre-test both versions of the survey questionnaire. Eleven of the interviews involved testing the ‘long’ questionnaire version and five involved testing the simpler, shortened version of the questionnaire. Pilot The questionnaires were then further revised and piloted. The pilot consisted of mailing out 239 questionnaires in total (188 long questionnaires and 51 short questionnaires). Seventy one questionnaires were completed and returned to Colmar Brunton (58 long and 13 short). Pilot data verification interviews Following the pilot, 16 data verification interviews were conducted to provide reassurance regarding the validity of key questions. The key issues addressed were:
• Whether respondents regarded the cost of an external tax advisor preparing annual accounts as a tax compliance cost. The data verification interviews indicated that this varied. Inland Revenue

FINAL REPORT PAGE 19
colmar brunton
subsequently decided that this was a reasonable outcome – it should be left to the respondent to decide whether these costs are tax compliance costs. Following the pilot, ‘check’ questions to ensure the amounts paid to external tax advisors were purely tax-related were revised and emphasised.
• How respondents allocated time in Q13a/13b of the long questionnaire and Q6a/6c of the short questionnaire, and in particular whether double counting occurred. Key findings were:
- Rows were commonly left blank, but all respondents indicated that these blanks meant zero (ie no time was spent on the activity)5
- Most respondents claimed to have made an effort to avoid double counting although a few (four of the 16) indicated that there was a degree of overlap between ‘recording information needed for tax’ and ‘dealing with tax advisors’ as it was hard to separate these or break them down into very small time components (eg 5 minutes).
- There was a tendency for respondents to overstate their time in the first tax activity line in the question (i.e. recording information needed for tax, etc.) because they included activities we intended them to cover in the subsequent lines. On realising they had done this, these respondents tended to leave the subsequent lines blank (if they had included this time in the first line) and enter a total at the bottom. This finding suggests that the totals are more reliable than the individual tax activities.
• What respondents used as a basis for valuing the time spent on tax compliance activities (Q14 in the long questionnaire and Q7 in the short questionnaire). Respondents tended to use either a set charge-out rate or calculation based on salaries and wages. This finding was borne in mind in determining appropriate dollar values to use in calculating compliance costs (this is addressed in depth later in the report in the section entitled ‘Value of time analysis’).
The overall conclusion from the pilot data verification interviews was that overall the questionnaire facilitated the collection of data that can be regarded as having high validity, that is, it measures what was intended.
Main fieldwork – business survey
Business survey Self-completion questionnaires (the long and short versions) were sent to 4848 businesses on the 14th of October 2004. 3686 long questionnaires were dispatched and 1162 short questionnaires were dispatched. The following measures were undertaken to maximise the response rate:
• Highlighter pens with Post-it flags were sent with the initial questionnaires.
• Postcard reminders were sent to all businesses approximately one week after the initial dispatch.
• Reminder letters with replacement questionnaires were sent to all businesses that had not yet returned a questionnaire.
• 600 telephone reminder calls were made (450 to businesses that were sent the long questionnaire and 150 to businesses that were sent the short questionnaire).
See Appendix A for when the initiatives were employed.
5 A series of editing rules were developed, and applied, regarding the interpretation of ‘blank’ rows.

FINAL REPORT PAGE 20
colmar brunton
Response rate analysis In total, 4848 questionnaires were dispatched and 2353 completed questionnaires returned. Therefore, the response rate based on the number of questionnaires dispatched is 49%. However, this response rate does not take into account the number of businesses that declined to participate when they were sent the ‘consent’ letter (thus, these businesses were not included in the contact lists sent to Colmar Brunton). Therefore, based on all eligible SMEs initially selected for the study the overall response rate to the study is 44%6. Table 3.1: Response rate analysis Long
QuestionnaireShort
Questionnaire Overall
Number of ‘consent’ letters7 dispatched by Inland Revenue
4142 1478 5620
Less ineligible ‘businesses’: Withdrew – No longer in business
Less ineligible ‘businesses’: Returned – Address not known8 38 104
43
97
81
201 A Overall number of eligible businesses 4000 1338 5338 B Number of contacts provided by Inland Revenue 3721 1184 4905 C Questionnaires dispatched (number remaining after
Colmar Brunton’s ‘deduping’ process) 3686 1162 4848
D Completed questionnaires returned 1749 604 2353 E Questionnaires returned indicating we did not have
a current address 51 25 76
F Uncompleted questionnaires returned 56 95 95 ‘Questionnaire’ Response rate (D/C) 47% 52% 49% Overall Response rate (D/A) 44% 45% 44% Although 604 short questionnaires were returned, only 158 have been used in the analysis. The 446 respondents who have been excluded fall into three categories:
1. 381 respondents who ticked income tax and some other tax type in Q1, raising considerable concern about whether the results relating to the taxpayer’s time spent on tax compliance (Q6a) related solely to income tax9. This concern was supported by the results of ‘callbacks’ made to 20 of these respondents – the majority were involved in other taxable activities and were not able to or didn't separate the business/entity selected from other interests/subsidiaries mixing all other tax types into their responses to Q6a. Hence we cannot be confident that their recorded time relates to only income tax for one business.
2. 26 individuals who Inland Revenue identified as being part of a group that proved to be ineligible after the sample was drawn.
3. 39 respondents did not indicate that they filed/paid income tax at Q1.
6 This response rate is slightly underestimated because it does not exclude those businesses that were removed from the dispatch lists because of the ‘deduping’ process (that ensured businesses who had recently participated in a Colmar Brunton survey were not sent a questionnaire for this study). Further, some of the businesses that declined at the ‘consent’ letter stage may also have been removed at the ‘deduping’ stage had they reached this point. 7 IRD sent out letters to SMEs asking them to participate in a survey which measures their tax compliance costs. If they did not want to take part they had the opportunity of opting out. 8 ‘Businesses’ for which IRD does not hold current address information were excluded on the basis that they are no longer trading businesses and hence ineligible. 9 6 respondents had ticked both income tax and another tax type, but were included in the final sample for analysis because they had clearly separated out these additional tax types in their responses at Q6a (under the category ‘other’).

FINAL REPORT PAGE 21
colmar brunton
Item response In addition to the overall response rates reported above, the following analysis assesses the extent to which we have successfully collected the key data necessary to estimate compliance costs. This analysis takes into account the amount of missing information, responses where the business indicated that they ‘didn’t know’ the amount of time they spent on tax activities, as well as outliers that have been ‘trimmed’ from the mean calculations. Note, whilst Inland Revenue provided an indication of the tax types relevant to each respondent in the list used for mailing out the surveys, this information did not necessarily match the tax types respondents reported that they filed (at Q1 in the questionnaire). Thus, we are not able to estimate reliable item response rates based on all businesses that were sent a questionnaire and that file the particular tax type in question. Instead, we have looked at the extent to which respondents to the survey were able to answer Q13b. Question 13b has been used for the basis of this analysis as this question provides the key data for the calculation of internal compliance costs for each tax type. Tax type
GST Income tax PAYE FBT
A. The number of respondents of the survey that pay/file the particular tax type (according to their response at Q1)
1744 1854 1325 343
B. The number of respondents for whom we do not have useable data at Q14b due to missing information, ‘don’t knows’ or outliers.
125 275 128 32
C. The number of respondents whose responses were used in the calculation of internal compliance costs
1546 1521 1155 316
Proportion of respondents that provided useable data (C/A) at Q14b
89% 82% 87% 92%
Non-response bias – long questionnaire The following table analyses those who responded to the long business survey and those who did not by tax type. Tax type variables were included on the contact lists that Inland Revenue provided. The analysis suggests that there is little non-response bias in terms of tax type, that is, the likelihood of a business responding does not appear to be dependent on tax type. Table 3.2: Comparison of respondents and non-respondents
Questionnaires dispatched
Questionnaires returned Questionnaires not returned Tax type
Number % of questionnaires
dispatched
Number % of questionnaires
dispatched
Income tax 3686 1742 47.3 1944 52.7
GST 3486 1659 47.6 1827 52.4
PAYE 2316 1124 48.5 1192 51.5
FBT 638 305 47.8 333 52.2

FINAL REPORT PAGE 22
colmar brunton
Table 3.3 provides further analysis on the possible extent of non-response bias. Respondents have been separated into groups according to how quickly they responded to the survey. This type of analysis surmises that businesses that returned a questionnaire late in the fieldwork period are more likely to be similar in nature to non-responders than businesses that returned a questionnaire early in the fieldwork period. Responses to Question 13b have been used for the analysis as this question forms the basis for the calculations of internal tax compliance costs (presented later in the report). Weighted data has been used to isolate the nature of possible non-response bias from any bias that the weighting will correct for. A oneway ANOVA has been carried out to assess whether there are statistically significant differences by tax type. T-tests were then used to determine statistical differences:
• between early and mid responders, or
• between mid and late responders, or
• between early and late responders. There are significant differences (at the 95% confidence level) by tax type. Further, there are significant differences: 1. between early and mid responders in terms of the number of hours spent on tax activities overall (ie
70.1 hours compared to 83.2 hours) 2. between early and late responders in terms of the number of hours spent on tax activities overall (ie
70.1 hours compared to 89.1 hours). This analysis suggests there may be a small degree of non response bias in terms of the number of hours that businesses spend on tax activities. Table 3.3: Internal time spent on all tax activities (annual hours) by tax type and date of questionnaire return - means Date of questionnaire return GST Income tax
(including provisional
tax)
PAYE (including
child support, student
loans, ACC levy)
FBT All tax types
Mean (trimmed) annual number of hours
Early (21/10/04 to 3/11/04) 43.0 (869)
29.9 (880)
25.6 (630)
12.1 (175)
71.6 (985)
Mid (4/11/04 to 17/11/04) 46.3 (409)
27.4 (372)
27.9 (333)
13.9 (93)
94.6 (440)
Late (18/11/04 to 7/12/04) 45.8 (236)
33.8 (213)
53.8 (191)
13.7 (47)
96.6 (243)
All 44.2 (1521)
29.4 (1509)
27.5 (1157)
12.8 (316)
76.7 (1714)
Base: All respondents who according to Q1 filed the particular tax type (excluding missing information and outliers) Source: Long questionnaire Q13b; Short questionnaire Q6b, Q6c

FINAL REPORT PAGE 23
colmar brunton
Tax advisor sub-survey – response rate A tax advisor sub-survey was conducted to gather information in order to apportion external tax advisor compliance costs to different tax types. This information was collected from named tax advisors in respect to specific clients. A self-completion questionnaire was pre-tested with three tax advisors. Self-completion questionnaires were then sent to 554 tax advisors. Questionnaires were only sent to the tax advisors of businesses that participated in the business survey (long questionnaire) and who gave consent to their tax advisor being contacted for this purpose. Response data for the tax advisor sub-survey questionnaire is specified below. Table 3.4: Response rate analysis – tax advisor sub-survey Number of businesses in long questionnaires that use an external tax advisor
1488
Questionnaires dispatched (number of respondents who gave consent to their tax advisor being contacted within the survey period)
554
Completed questionnaires returned 275
Questionnaires returned indicating wrong address 10
Uncompleted questionnaires returned 1
Response rate A (% of tax advisors sent a questionnaire who returned a completed questionnaire)
50%
Response rate B (% of businesses in long questionnaire who use an external tax advisor and whose tax advisor returned a completed tax advisor questionnaire)
18%
As indicated in the above table, whilst a good response rate was achieved from tax advisors who were sent the tax advisor questionnaire, the low level of consent from businesses to send tax advisors a questionnaire results in a low overall response rate. However, the following information should also be considered in determining the extent to which results from the tax advisor sub-survey can be generalised. Early testing of the questionnaire indicated that businesses were able to reasonably easily report the total payment made to their tax advisor, but businesses were unsure how this amount was allocated by tax type. Hence, the tax advisor sub-survey is most important for businesses that use external tax advice for multiple tax types. This is because the business survey data can be reliably used for payments made for external advice when the business seeks this advice for one tax type only (as this simply involves using the total payment figure from the business survey). In total, we required information about 1616 respondents (both respondents to the long and short questionnaires) in terms of payments made for external tax advice. Of these 1616 respondents:
• data provided by tax advisors has been used for 275 respondents
• business survey data has been used for 566 because the business pays for advice on one tax type only (covers both long and short questionnaires).

FINAL REPORT PAGE 24
colmar brunton
Thus we have data for 841 out of 1616 respondents. This equates to 52%. Thus this is a reasonable basis on which to estimate external tax compliance costs for particular tax types. A detailed explanation of how external tax compliance costs have been calculated is given later in this chapter in the section entitled ‘Data imputation’.
Data integrity and data processing A number of steps were undertaken with respect to data integrity including the following:
• A series of comprehensive editing checks and database checks to test for the internal validity of the data. This included checking for the distinction between missing values and true 0’s.
• Telephoning respondents back to clarify/check their answers. Telephone calls were made for this purpose to 13% of businesses that completed a questionnaire. The most common reason for these telephone calls was that the respondent had failed to confirm whether the amount paid for external tax advice (at Q10a in the long questionnaire) related to tax requirements only.
• 100% double-entry of data. We consider the level of internal data validity to be very good. The size of any discrepancies discovered in the data is generally not regarded to be of significant concern. Of particular interest is the reasonably high degree of consistency between:
• responses made to Q13a in the long questionnaire (Q6a in the short questionnaire) which relate to time spent on tax activities by tax type, and
• responses to Q13b in the long questionnaire (Q6c in the short questionnaire) which relate to the amount of time spent by types of personnel for each tax type.
Of respondents who provided values at both Q13a in the long questionnaire (Q6a in the short questionnaire) and Q13b in the long questionnaire (Q6c in the short questionnaire), the total figures given in these two questions matched exactly for:
• 85% of respondents in relation to GST
• 88% of respondents in relation to income tax
• 89% of respondents in relation to PAYE
• 96% of respondents in relation to FBT.
Database construction
Weighting The data have been weighted so that the survey results can be used to generalise to the entire survey population. Unless otherwise stated, weighted data has been used. Weighting was conducted in two stages. First, a pre-weight was applied to correct for sample selection probabilities. The pre-weight was calculated as (N(i)/n(i))*(n/N)
Where: N(i) is the population of statrum i n(i) is the sample size of statrum i N is the total population size And n is the total sample size.

FINAL REPORT PAGE 25
colmar brunton
This was followed by weighting by strata to strata proportions (based on the figures provided in a document prepared by Inland Revenue:‘Measuring Compliance the Costs of Small and Medium Businesses: Design Summary: Version 2.; 9a. Strata Population Sizes [New Version: including appropriate non-valid addresses].’. It should be noted that since the only variable being weighted to was strata proportions, the pre-weight stage effectively produced weights to these proportions. The second stage of weighting to strata proportions, while unnecessary, was still performed. Strata e and i (micro businesses that pay FBT with nil turnover and turnover of less than $100,000 respectively), f and j (small businesses that pay FBT with nil turnover and turnover of less than $100,000 respectively), and t and x (small businesses that don’t pay FBT with nil turnover and turnover of less than $100,000 respectively) were combined to increase cell size. The weighting was calculated based on a target of 1928, being the total number of respondents before removing 21 due to missing database information making it impossible to assign them to a stratum. Businesses with 20+ employees and turnover of under $100,000 were excluded from the sampling frame and consequently were excluded from the population figures used to calculate weighting proportions. These businesses represent 0.03% of the total population of interest. While any effects from this would be minimal, it should be noted that the results of the survey do not represent these businesses.
Data imputation Turnover and sector Missing values for turnover and sector, in the business survey data have been imputed using information from Inland Revenue’s database for turnover and sector. External tax compliance costs The calculation of external compliance costs by tax type has been undertaken using both data from the tax advisor sub-survey and the business surveys, as well as data imputation. Relying solely on the tax advisor sub-survey data would have been problematic due to the relatively low response rate of that survey. To this end, external compliance costs have been calculated by using the following data:
• For respondents to the long business survey for whom we have data from their tax advisors, we have used the tax advisor-supplied data (regardless of whether it matched the total $ amount that the business gave and regardless of whether they use their tax advisor for one or more tax types).
• For respondents to the long business survey for whom we do not have data from their tax advisors, but who only ticked one tax type at Q10b, we have used the $ amount given at Q10a (if they confirmed at Q10a that the amount only included tax-related costs).
• For respondents to the short questionnaire we have used their response to Q4 (if they confirmed at Q4 that the amount only included tax-related costs) as reflective of the amount they paid for external tax services in relation to income tax.
We therefore had ‘missing information’ for respondents to the long questionnaire who use external tax advice for multiple tax types, but for whom we do not have data from their tax advisors. Imputed data (utilising results to Q10b as well as industry sector) has been used for these respondents.

FINAL REPORT PAGE 26
colmar brunton
As a check on the reliability of the above process, an assessment of the extent to which tax advisor reported data and business survey data matches (in terms of the total tax payment made for external advice) was undertaken. This analysis is appended to the report (see Appendix E) and shows a reasonably strong (positive) correlation between these two sets of data. To impute for long questionnaire respondents with multiple tax types, without tax advisor data, groups of respondents based on industry and the number of tax types they filed for were created. From the tax advisor data the proportion of the advisor costs that went to each tax type for each of the previously mentioned segments were found. This proportion was then applied to the total amount that the respondent claimed they paid to their tax advisor in Q10a if they had indicated in Q10aiii that the fees they paid only included tax fees. Long questionnaire respondents with multiple tax types, without tax advisor data who had not indicated in Q10aiii that the fees they paid only included tax fees did not have any external costs imputed for them.
Calculation of means Trimmed10 means have been used extensively in the analysis and reporting of the amount of time businesses spend on tax compliance and associated tax compliance costs. This involved excluding any values whose log falls outside of the Median(log10(x)) + 2.24 MAD(log10(x)) where MAD is the median absolute deviation normalized to approximate the standard deviation for normally distributed data. The constant 2.24 was selected so that only the most extreme values would be trimmed. Given the highly skewed nature of the results, no values were trimmed from the bottom end. Note that by taking logs, zero values are excluded from the trimming process, but the zeros are re-introduced for the mean and median calculations. The primary reasons for the decision to use trimmed means rather than conventional means were as follows:
• To avoid misleading descriptions of tax compliance costs – conventional means are prone to considerable influence with the presence of a small number of very high values.
• Trimmed means were regarded to be a better fit with policy objectives, that is policy initiatives will likely be aimed at reductions in compliance costs for a broad range of businesses rather than a few businesses with unusually high costs (eg due to audit).
• Trimmed means are more sensitive to detecting changes over time than conventional means. When data is affected by a few high values, conventional tests of differences between means can often fail to detect real change.
10 ‘Trimmed mean’ normally refers to a mean calculated after first removing a fixed percentage of values from the top and bottom of the distribution (eg a 5% trimmed mean is the average after 5% of the smallest values and 5% of the larges values have been removed). We used a more flexible trimming process in which the percentage of values trimmed varied depending on the extent to which a particular question elicited extreme values (outliers); only such outliers were removed before averaging.

FINAL REPORT PAGE 27
colmar brunton
The following graphs show the effect of the trimming process. The first is a histogram of the total annual hours spent on GST returns (Skewness 5.934924; Kurtosis 56.90451). Figure 4: Total annual hours spent on GST returns
2000150010005000
Total GST Hours (Annual)
500
400
300
200
100
0
Freq
uenc
y
Taking the log of this variable has two effects. It removes zero values and changes the distribution to a much more normal distribution (Skewness 0.070814; Kurtosis 0.378891). Figure 5: Log values of total annual hours spent on GST returns
3.002.001.000.00
Log10(Total GST Hours (Annual))
150
100
50
0
Freq
uenc
y

FINAL REPORT PAGE 28
colmar brunton
The final graph shows the trimmed variable (Skewness 2.199625; Kurtosis, 5.425463). Figure 6: Trimmed total annual hours spent on GST returns
4003002001000
Trimmed Total GST Hours (Annual)
500
400
300
200
100
0
Freq
uenc
y
Calculation of medians Outliers have not been removed in calculating medians. Unlike the mean calculations, inclusion of outliers in the median calculations had very little effect.
Treatment of missing information The following data has been excluded from the calculation of mean and median values:
• Missing information11
• Don’t knows Where the respondent did not complete Q13a or Q13b and they wrote on the questionnaire that their accountant dealt with the particular tax type, these have been treated as ‘zero’ responses and this included in the mean and median calculations. Missing information has been reported as a separate category for results that are presented as percentages. Thus, missing information has been included in the base in calculating these percentages.
11 The database contains both cases of ‘Value missing’ and ‘system missing value’. The former is what we have labelled as ‘missing information’ in this report. It refers to the situation when a respondent has not provided a response, but yet we would have expected them to have. Whereas a system missing value refers to the situation when a respondent has not provided a response and we did not require them to provide one (eg Questions pertaining to GST were not required to be answered by those who did not file/pay GST).

FINAL REPORT PAGE 29
colmar brunton
Presentation of results The survey results are largely presented in tables. The following explanations may assist the reader in interpreting the data:
• The numbers given in the brackets refer to the unweighted sample size.
• Where means have been trimmed, this is specified.
• Where percentages do not add to 100% this may be due to rounding or because more than one response category potentially applied to the respondent.
Analyses by industry sector are detailed in Appendix F as variations by sector appear to largely be a result of business size variations. Analysis by business size is presented extensively throughout the body of the report.
Significance testing Estimated sampling errors have been calculated for the results presented in the section entitled ‘Combined costs’. To account for the imputation and trimming process of the external costs, confidence intervals have been estimated through bootstrapping. This process involved drawing a random sample (with replacement). The resulting sample was reweighted, imputed and trimmed. The mean of the variable of interest was then stored. This was repeated 200 times. The stored mean values is an estimate of the sampling distribution for the variable of interest and therefore the standard deviation is an estimate of the standard error of the variable. This was then used to calculate the confidence interval for the variable. Confidence intervals for internal costs were simply calculated based on the standard error of the variable. In addition, some tests for the statistical significance of apparent differences in the survey results between questions and/or subgroups have been carried out. Unless otherwise specified, all tests have been carried out at the 95% confidence level. Use of the word ‘significant’ in the report refers to statistical significance (at the 95% confidence level). Two types of tests have been used:
• In comparing proportions between samples, a z-test has been used to determine statistical significance. The notation is: z=(p1-p2)/sqrt((p1*(1-p1)/n1)+(p2*(1-p2)/n2)) where n1/n2 are the sample sizes and p1/p2 are the proportions we are comparing. The resulting z-value is compared to the Normal (0,1) distribution.
• In comparing means, the two-tailed t-tests available in the statistical packages SPSS and Toolbox have been used. The sample sizes used in these tests exclude any outliers that were removed as part of the trimming process.

FINAL REPORT PAGE 30
colmar brunton
4. Sample profile
This chapter provides a profile of the sample. All percentages use weighted data. Similar tables have been constructed using unweighted data and are appended to the report.
Sample profile by business size Table 4.1: Sample profile by business size (number of employees)
Business size (number of employees) Nil
employees %
Micro (1-5)
%
Small (6-19)
%
Medium (20+)
%
All
%
Number of owners working in the business 0 1 2 3+ Don’t know Missing information
40 34 22 2 * 2
3 44 46 7 - *
4 34 49 13 - 1
16 20 38 26 - 1
27 36 31 5 * 2
Business size - Number of employees (full-time and part-time combined12) Nil Micro (1-5 employees) Small (6-19 employees) Medium (20+ employees) Missing information
100 - - - -
-
100 - - -
- -
100 - -
- - -
100 -
63 28 7 3 -
Business size - turnover Nothing $1 – $19,999 $20,000 – $39,999 $40,000 – $99,999 $100,000 – $249,999 $250,000 – $499,999 $500,000 – $1,299,999 $1.3 million – $4,999,999 $5 million – $9,999,999 $10 million – $49,999,999 $50 million – $99,999,999 $100 million or more Missing information Don’t know
1 12 21 30 23 8 2 1 - - - - 1 *
1 2 6 16 30 23 18 4 1 - - * - *
1 * 1 3 6 17 39 29 1 1 - - - -
1 - 1 - - 3 19 46 15 15 1 - - -
1 8 15 24 23 13 9 5 1 * * * 1 *
12 This refers to the total number of full-time employees plus the total number of part-time employees.

FINAL REPORT PAGE 31
colmar brunton
Table 4.1: Sample profile by business size (number of employees) (cont.) Length of time in business Less than 1 year 1 – 2 years 3 – 5 years 6 – 10 years > 10 years Missing information
3 12 18 17 49 1
3 11 20 18 46 2
4 9 17 19 50 2
4 8 13 17 57 1
3 11 18 17 48 1
Use of a tax advisor Use a tax advisor Don’t use a tax advisor Missing information
77 23 *
87 23 *
86 13 -
84 14 4
80 20 *
Main business activity Agriculture Mining Manufacturing Electricity Construction Wholesale Retail Accommodation Transport Communication Finance Property Education Health and community services Cultural and recreational services Personal & other services Other Missing information
18 - 3 1 10 2 6 2 2 3 5 27 4 6 1 10 * *
27 * 4 2 13 3 11 3 4 3 1 13 1 4 1 9 * 1
15 -
12 1 9 5 13 11 4 1 1 9 4 6 2 8 - -
9 -
15 1 12 4 9 15 4 - -
10 2 8 7 4 - -
21 * 4 1 11 3 8 3 3 2 4 21 3 5 2 9 * *
Industry sector groupings Primary produce Industrial Distribution Business and finance Service Missing information
18 14 10 32 25 *
28 19 18 14 21 1
15 21 22 9 33 -
9 27 17 10 37 -
21 16 13 25 25 *
Number of sites 1 2 3 4 Missing information
95 4 1 * -
93 7 * * *
89 9 2 - -
97 2 - 1 -
94 5 1 * *
Legal entity Company Individual Partnership Trust Missing information
22 49 21 8 -
46 23 28 3 *
73 12 12 3 -
73 5 10 12 -
34 38 22 6 *

FINAL REPORT PAGE 32
colmar brunton
Table 4.1: Sample profile by business size (number of employees) (cont.) Provisional tax option used 03/04 Missing information Unknown – non provisional taxpayer New business elects to make payment Safe Harbour Estimated
5 41 * 45 8
6 54 * 34 5
9 43 -
42 6
4 30 -
53 13
6 45 * 42 7
Number of respondents (unweighted) (724) (767) (290) (116) (1907) SME Population (calculated using weighted base sizes)
303,721 134,875 32,209 12,330 485,149
* = 0.0% < 0.5% Base: All respondents Source: Long questionnaire Q3, Q4, Q10a, Q20, Q21, Q22; Short questionnaire Q4, Q11, Q13, Q12; IRD database information used for Filing method for EMS, GST basis, Nature of GST registration, GST filing frequency.
Table 4.1: Sample profile by business size (number of employees) (cont.) Business size (number of employees)
Nil employees*
%
Micro (1-5)
%
Small (6-19)
%
Medium (20+)
%
All
%
Filing method for EMS Missing information/No filing option recorded Electronic Manual
61 2 37
12 5 83
13 17 70
32 47 21
25 9 66
Number of respondents (unweighted) (193) (718) (290) (116) (1324) SME Population (calculated using weighted base sizes)
50,075 117,261 32,209 12,330 212,882
Base: All respondents who pay/file PAYE (Q1); excludes all ‘not applicables’ in Filing method Source: Long questionnaire Q4; IRD database information used for Filing method for EMS *Respondents were asked how many employees they had at the end of ‘last month’13. Thus, respondents in the ‘nil employees’ category can be regarded as not currently employing staff, but having done so in the last 12 months (as they indicated at Question 1 that they had paid/filed PAYE in the last 12 months).
13 Due to some businesses experiencing marked variability in employee numbers over a year, respondents were asked to estimate the number of employees they had at a particular point in time.
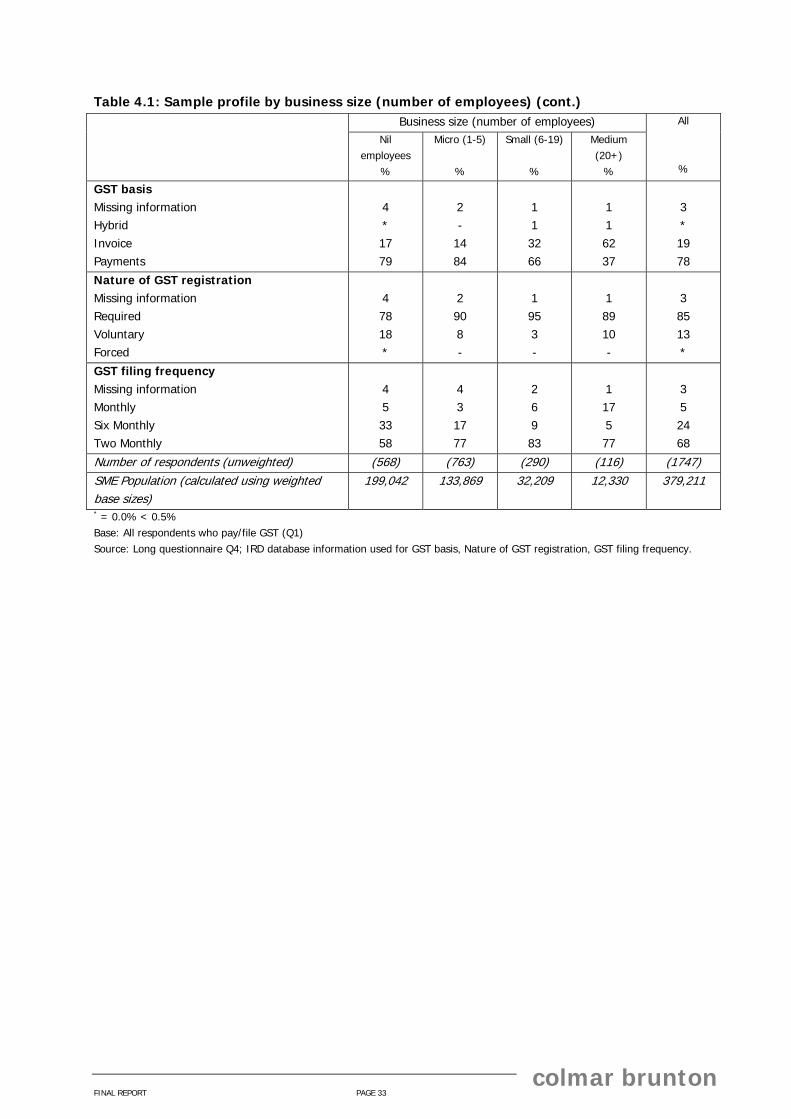
FINAL REPORT PAGE 33
colmar brunton
Table 4.1: Sample profile by business size (number of employees) (cont.) Business size (number of employees)
Nil employees
%
Micro (1-5)
%
Small (6-19)
%
Medium (20+)
%
All
%
GST basis Missing information Hybrid Invoice Payments
4 * 17 79
2 -
14 84
1 1 32 66
1 1 62 37
3 * 19 78
Nature of GST registration Missing information Required Voluntary Forced
4 78 18 *
2 90 8 -
1 95 3 -
1 89 10 -
3 85 13 *
GST filing frequency Missing information Monthly Six Monthly Two Monthly
4 5 33 58
4 3 17 77
2 6 9 83
1 17 5 77
3 5 24 68
Number of respondents (unweighted) (568) (763) (290) (116) (1747) SME Population (calculated using weighted base sizes)
199,042 133,869 32,209 12,330 379,211
* = 0.0% < 0.5% Base: All respondents who pay/file GST (Q1) Source: Long questionnaire Q4; IRD database information used for GST basis, Nature of GST registration, GST filing frequency.

FINAL REPORT PAGE 34
colmar brunton
Table 4.2: Sample profile by tax type Tax type
GST %
Income tax %
PAYE %
FBT^
%
All
%
Number of owners working in the business 0 1 2 3+ Don’t know Missing information
6 46 39 6 * 2
27 36 31 5 * 1
5 39 47 9 - 1
7 28 53 12 - 1
27 36 31 5 * 2
Business size - Number of employees (full-time and part-time combined) Nil Micro (1-5 employees) Small (6-19 employees) Medium (20+ employees) Missing information
52 35 8 3 *
63 28 7 3 *
23 55 15 6 *
24 35 24 17 -
63 28 7 3 *
Business size - turnover Nothing $1 – $19,999 $20,000 – $39,999 $40,000 – $99,999 $100,000 – $249,999 $250,000 – $499,999 $500,000 – $1,299,999 $1.3 million – $4,999,999 $5 million – $9,999,999 $10 million – $49,999,999 $50 million – $99,999,999 $100 million or more Don’t know Missing information
1 6 11 25 24 14 12 6 1 1 * * * 1
1 8 15 23 23 13 9 5 1 * * * * 1
1 3 6 16 25 19 18 10 1 1 * * * -
- 1 2 7 20 15 21 24 5 5 * - - -
1 8 15 24 23 13 9 5 1 * * * * 1
Length of time in business Less than 1 year 1 – 2 years 3 – 5 years 6 – 10 years > 10 years Missing information
4 12 21 17 45 1
3 11 19 17 49 1
3 11 21 17 46 1
2 9 18 18 52 1
3 11 18 17 48 1

FINAL REPORT PAGE 35
colmar brunton
Table 4.2: Sample profile by tax type (cont.) Main business activity Agriculture Mining Manufacturing Electricity Construction Wholesale Retail Accommodation Transport Communication Finance Property Education Health and community services Cultural and recreational services Personal & other services Other Missing information
23 * 5 1 12 3 9 3 3 2 2 20 1 5 2 9 * *
21 * 4 1 11 3 8 3 3 2 4 21 3 5 2 9 * *
25 * 7 1 12 3 11 5 4 2 1 13 1 5 2 9 * *
12 -
12 * 12 8 13 4 6 2 2 14 3 4 3 4 - -
21 * 4 1 11 3 8 3 3 2 4 21 3 5 2 9 * *
Industry sector groupings Primary produce Industrial Distribution Business and finance Service Missing information
23 18 15 22 22 *
21 16 13 25 25 *
25 20 18 14 23 *
12 25 28 16 20 *
21 16 13 25 25 *
Number of sites Missing information 1 2 3 4
93 6 1 *
94 5 1 *
93 6 1 *
91 8 1 1
94 5 1 *
Legal entity Missing information Company Individual Partnership Trust
* 43 27 25 6
* 33 38 22 6
* 50 21 25 3
-
82 4 8 5
* 34 38 22 6
Use of a tax advisor Use a tax advisor Don’t use a tax advisor Missing information
84 15 *
81 19 *
86 13 *
88 12 -
80 20 *
Provisional tax option used 03/04 Unknown – non provisional taxpayer New business elects to make payment Safe Harbour Estimated
7 51 36 6
5 44 43 7
7 52 35 6
5 43 41 10
6 45 42 7
Number of respondents (unweighted) (1747) (1854) (1326) (343) (1907) SME Population (calculated using weighted base sizes)
379,463 472,567 212,882 35,732 485,149
* = 0.0% < 0.5%
^= excludes those who filed FBT-nil returns only
Base: All respondents Source: Long questionnaire Q3, Q4, Q10a, Q20, Q21, Q22; Short questionnaire Q4, Q11, Q13, Q12; IRD database information used for Filing method for EMS, GST basis, Nature of GST registration, GST filing frequency.

FINAL REPORT PAGE 36
colmar brunton
Table 4.2: Sample profile by tax type (cont.) Tax type
GST %
Income tax %
PAYE %
FBT^
%
All
%
Filing method for EMS Missing information/No filing option recorded Electronic (E,F) Manual (H)
25 9 66
25 9 66
25 9 66
27 21 53
25 9 66
Number of respondents (unweighted) (1320) (1288) (1324) (325) (1324) SME Population (calculated using weighted base sizes)
211,875 206,591 212,882 31,203 212,882
^= excludes those who filed FBT-nil returns only
Base: All respondents who pay/file PAYE (Q1) Source: Long questionnaire Q1; IRD database information used for Filing method for EMS
Table 4.2: Sample profile by tax type (cont.) Tax Type
GST %
Income tax %
PAYE %
FBT^
%
All
%
GST basis Missing information Hybrid Invoice Payments
3 * 19 78
3 * 19 78
2 * 21 77
1 2 34 62
3 * 19 78
Nature of GST registration Missing information Required Voluntary Forced
3 85 13 *
3 84 13 *
2 90 8 -
1 93 6 -
3 85 13 *
GST filing frequency Missing information Monthly Six Month Two Monthly
3 5 24 68
3 5 24 68
3 5 16 76
3 6 11 79
3 5 24 68
Number of respondents (unweighted) (1747) (1697) (1322) (343) (1747) SME Population (calculated using weighted base sizes)
379,211 367,385 212,127 35,732 379,211
* = 0.0% < 0.5%
^= excludes those who filed FBT-nil returns only
Base: All respondents who pay/file GST (Q1) Source: Long questionnaire Q4; IRD database information used for GST basis, Nature of GST registration, GST filing frequency.

FINAL REPORT PAGE 37
colmar brunton
Table 4.3: Tax type by business size Business size (number of employees)
Nil employees Micro 1-5 Small 6-19 Medium 20+
All
Tax type14 % % % % % Income 97 98 96 100 97 GST 66 99 100 100 78 PAYE 16 87 100 100 44 FBT 3 9 27 49 7
Tax type combination Income only 34 * - - 22 Income, GST 40 11 - - 29 Income, GST, PAYE 11 55 49 28 26 Income, GST, PAYE, FBT 5 30 47 72 16 Income, PAYE - * - - * Income, PAYE, FBT - - - - - GST only 2 * - - 1 GST, PAYE * 2 4 - 1 GST, PAYE, FBT * * - - * PAYE only * * - - * PAYE, FBT * - - - * Income, GST, FBT 7 1 - - 5
Number of respondents (unweighted)
(724) (767) (290) (116) (1907)
SME Population (calculated using weighted base sizes)
303,721 134,875 32,209 12,330 485,149
* = 0.0% < 0.5% Base: All respondents Source: Long questionnaire Q1, Q4; Short questionnaire Q1
14 Odd figures here (16% of SMEs with nil employees paid PAYE) may be explained due to the questionnaire asking for information relating to a specific point in time e.g. number of employees at the end of last month, or respondent interpretation e.g. the income tax of Partnerships.

FINAL REPORT PAGE 38
colmar brunton
5. Internal time and costs
This chapter examines the internal time that businesses spend on tax compliance activities, followed by an analysis of the value of that time and estimates of internal tax compliance costs. The costs incurred by businesses through the purchase of external tax advice/services are covered in Chapter 6.
Internal time Internal time spent on specific tax activities Respondents were asked to estimate the average number of hours per month the business spent on tax activities during the last 12 months (See Figure 7). For each tax type, they were asked to record this information by tax activity. Although monthly data was collected, for analysis and reporting purposes, this data has been converted to annual figures. Figure 7: Question 13a in long questionnaire
In answering this question:13a
Recording information needed for tax (e.g. GST amounts, employeetax codes). To work this out, imagine New Zealand became tax-free. Consider what you would stop recording and write down how much time you would save.
Total hours per month (on average)
Other tax activities (please describe)
Learning about tax laws (new or existing) e.g. from newsletters, Tax Information Bulletin, the Internet
Dealing with tax advisors (including providing information to them)
Tax planning (e.g. for losses)
Dealing with IRD (e.g. letters, phone calls, visits, email)
Calculating tax, completing and filing returns, paying tax
Fringe Benefit TaxPAYE, including child support, student loans, ACC levy
Income Tax, including provisional tax
GST
hr min
hr min
hr min
hr min
hr min
hr min
hr min
hr minhr min
hr minhr min
hr minhr min
hr minhr min
hr minhr min
hr minhr min
hr minhr min
hr minhr min
hr minhr min
hr minhr min
hr minhr min
hr minhr min
hr minhr min
hr minhr min
hr minhr min
hr minhr min
hr minhr min
hr minhr min
hr minhr min
hr minhr min
hr minhr min
hr minhr min
hr minhr min
hr minhr min
hr minhr min
hr minhr min
hr minhr min
hr minhr min
Internal Time/Costs
hr min hr min hr min hr minhr minhr min hr minhr min hr minhr min hr minhr min
• Please estimate the average hours per month within this business spent on tax activities during the last 12 months. Some taxes are dealt with only once or twice a year; please include this time on a monthly basis (e.g. if you spent 12 hours on end-of-year income tax count this as 1 hour per month).
• Include time spent by owners/partners/directors/trustees, paid employees, and unpaid friends or relatives.• Only count hours once (e.g. if you count some hours beside the heading “Recording information needed for tax”, do not count the same hours beside “Calculating tax, completing tax forms, paying tax”).• If no time was spent on a particular activity, please write in ‘0’ or a dash (-). If the tax type does not apply to your business, you can cross out the column.
Tables 5.1 and 5.2 detail the amount of time spent on specific tax activities for each tax type. Table 5.1 uses mean values and Table 5.2 uses medians15. Sample sizes are shown in brackets.
15 The mean values are trimmed. The median values are not trimmed. See explanation on the trimming of means in the report chapter entitled ‘Research Methodology’ for more detail.

FINAL REPORT PAGE 39
colmar brunton
On average, businesses spend 75.6 hours per year on tax activities. GST accounts for a considerable portion of the time spent on tax activities with GST registrants spending on average 49.3 hours. Income tax and PAYE require similar amounts of time with 29.7 hours and 29.2 hours respectively spent on these tax types (among those who file these tax types). The medians given in Table 5.2 are notably lower than the means given in Table 5.1. This indicates that the distribution of businesses is skewed towards the bottom end (ie towards zero); a minority of businesses with higher hours is essentially ‘pulling’ the means upward. However, this situation is not as marked as it would have been had we not used ‘trimmed’ means. The bulk of the time spent on tax activities appears to be spent in recording information, calculating tax, completing and filing returns and paying tax. Recording information is clearly the dominant tax activity in relation to GST and Income tax. This is evident from the tables and is illustrated pictorially in Figure 8. In interpreting the data, the reader should note the following. As discussed earlier in this report under the chapter entitled ‘Research methodology’, the data verification interviews conducted following the pilot indicated that there was a tendency for some respondents to overstate their time in the first tax activity line in the question (i.e. recording information needed for tax, etc.) because they included activities we intended them to cover in the subsequent lines. On realising they had done this, these respondents tended to leave the subsequent lines blank (if they had included this time in the first line) and enter a total at the bottom. This finding suggests that the totals are more reliable than the individual tax activities. The data verification interviews also suggested there was a degree of overlap between ‘recording information needed for tax’ and ‘dealing with tax advisors’ as it was hard to separate these or break them down time into very small time components (eg 5 minutes). Table 5.1: Internal time spent on tax activities (annual hours) by tax type – means GST Income tax
(including provisional
tax)
PAYE (including child support, student loans,
ACC levy)
FBT All tax types
Mean (trimmed) annual number of hours
Recording information 24.2 (1592)
12.1 (1587)
11.6 (1202)
4.0 (313)
33.7 (1506)
Calculating tax, completing and filing returns, paying tax
11.6 (1653)
5.9 (1579)
8.4 (1203)
3.6 (316)
18.8 (1556
Dealing with IRD 2.4 (1650
1.7 (1607
1.9 (1211)
0.7 (319)
4.7 (1568)
Tax planning 1.4 (1664)
1.9 (1604)
0.7 (1228)
0.4 (318)
3.0 (1568)
Dealing with tax advisors (including providing information to them)
4.7 (1650)
6.0 (1593)
2.6 (1220)
2.2 (316)
10.3 (1557)
Learning about tax laws (new or existing)
2.9 (1645)
2.1 (1589)
2.7 (1220)
2.0 (316)
5.2 (1542)
Other 0.3 (1668)
0.1 (1601)
0.1 (1229)
0.0 (316)
0.4 (1565)
All activities 49.3 (1593)
29.7 (1542)
29.2 (1191)
14.1 (311)
75.6 (1479)
Base: All respondents who according to Q1 filed/paid the particular tax type (excluding missing information and outliers) Source: Long questionnaire Q13a; Short questionnaire Q6a Sample sizes are shown in brackets

FINAL REPORT PAGE 40
colmar brunton
Figure 8: Internal time spent on tax activities (annual hours) by tax type
0
20
40
60
80
100
GST Income tax PAYE FBT All tax types
Tax type
Recording information
Calculating tax, completing returns, paying tax
Other
Mean (trimmed) number of annual hours 49.3
29.7 29.2
14.1
75.6
Table 5.2: Internal time spent on tax activities (annual hours) by tax type – medians GST Income tax
(including provisional
tax)
PAYE (including child support, student loans,
ACC levy)
FBT All tax types
Median number of hours (annual)
Recording information 12.0 (1668)
6.0 (1609)
6.0 (1229)
2.0 (319)
13.0 (1907)
Calculating tax, completing and filing returns, paying tax
6.0 (1667)
2.0 (1609)
6.0 (1229)
2.0 (319)
6.0 (1907)
Dealing with IRD 0.0 (1666)
0.0 (1609)
0.0 (1228)
0.0 (319)
0.0 (1907)
Tax planning 0.0 (1667)
0.0 (1608)
0.0 (1229)
0.0 (319)
0.0 (1907)
Dealing with tax advisors (including providing information to them)
1.0 (1667)
3.0 (1612)
0.0 (1229)
0.0 (319)
3.0 (1907)
Learning about tax laws (new or existing)
1.0 (1667)
0.0 (1610)
0.6 (1229)
0.0 (319)
0.0 (1907)
Other 0.0 (1668)
0.0 (1601)
0.0 (1229)
0.0 (318)
0.0 (1907)
All activities 33.0 (1637)
18.0 (1578)
15.0 (1209)
8.1 (314)
35.0 (1907)
Base: All respondents who according to Q1 filed/paid the particular tax type (excluding missing information) Source: Long questionnaire Q13a; Short questionnaire Q6a
Tables 5.3 and 5.4 detail the amount of time spent on specific tax activities by size of business (defined in terms of number of employees).

FINAL REPORT PAGE 41
colmar brunton
There is a strong correlation between business size and the number of hours a business spends on tax activities per year. This pattern is also evident within each of the tax activities (with the exception of ‘other’ tax activities). Table 5.3: Internal time spent on tax activities (annual hours) by business size - means
Business size (number of employees) Tax activity
Nil employees
Micro (1-5) Small (6-19) Medium (20+)
All
Mean (trimmed) annual number of hours
Recording information 24.2 (716)
46.8 (738)
57.4 (265)
74.3 (102)
33.7 (1831)
Calculating tax, completing and filing returns, paying tax
12.7 (720)
25.9 (759)
36.1 (285)
48.1 (113)
18.8 (1887)
Dealing with IRD 2.8 (723)
6.3 (766)
9.0 (289)
22.1 (113)
4.7 (1901)
Tax planning 1.9 (721)
4.7 (766)
4.4 (289)
9.9 (116)
3.0 (1902)
Dealing with tax advisors (including providing information to them)
7.4 (721)
13.8 (768)
17.5 (289)
24.9 (113)
10.3 (1887)
Learning about tax laws (new or existing)
3.3 (719)
7.4 (755)
10.4 (281)
16.7 (109)
5.2 (1874)
Other 0.2 (724)
0.8 (767)
0.4 (290)
0.2 (116)
0.4 (1907)
All activities 51.9 (716)
105.7 (745)
144.3 (273)
181.9 (102)
75.6 (1846)
Base: All respondents excluding missing information and outliers Source: Long questionnaire Q13a, Q4; Short questionnaire Q6a
Table 5.4: Internal time spent on tax activities (annual hours) by business size - medians
Business size (number of employees) Tax activity
Nil employees
Micro (1-5) Small (6-19) Medium (20+)
All
Median number of hours (annual)
Recording information 12.0 (699)
28.0 (738)
40.4 (281)
72.0 (110)
16.0 (1836)
Calculating tax, completing and filing returns, paying tax
6.0 (698)
12.0 (738)
22.2 (281)
40.9 (110)
6.0 (1835)
Dealing with IRD 0.0 (698)
0.0 (738)
0.2 (281)
8.6 (110)
0.0 (1835)
Tax planning 0.0 (698)
0.0 (738)
0.0 (281)
0.0 (110)
0.0 (1835)
Dealing with tax advisors (including providing information to them)
2.0 (700)
6.0 (738)
10.0 (281)
23.5 (110)
3.1 (1837)
Learning about tax laws (new or existing)
0.0 (699)
2.0 (738)
6.0 (281)
12.0 (110)
0.0 (1835)
Other 0.0 (699)
0.0 (738)
0.0 (281)
0.0 (110)
0.0 (1836)
All activities 27.0 (702)
61.0 (738)
95.0 (281)
160.0 (110)
36.0 (1839)
Base: All respondents excluding missing information Source: Long questionnaire Q13a, Q4; Short questionnaire Q6a

FINAL REPORT PAGE 42
colmar brunton
Figure 9 details the mean amount of time spent on all tax activities by size of business (defined in terms of number of employees). Table 5.5 breaks this information down by tax type.
The time spent on tax activities associated with each of the specific tax types tends to increase as business size increases. However, the differences between some business size groupings are not significantly different. For example between those with no employees and micro-sized businesses in relation to income tax, and between small and medium-sized businesses in relation to FBT. Figure 9: Time spent on all tax activities for each tax type by business size
51.9
105.7
144.3
181.9
75.6
0
20
40
60
80
100
120
140
160
180
200
220
Nil employees Micro Small Medium All SMEs
Mean (trimmed) number of annual hours
Business size (number of employees)
Table 5.5: Time spent on all tax activities for each tax type by business size Business size (number of employees) Tax type
Nil employees
Micro (1-5) Small (6-19) Medium (20+)
All
Mean (trimmed) annual number of hours
GST 38.4 (531)
58.5 (688)
67.4 (263)
89.0 (103)
49.3 (1593)
Income tax (including provisional tax) 26.8 (602)
31.4 (598)
40.5 (234)
61.6 (101)
29.7 (1542)
PAYE (including child support, student loans, ACC levy)
13.1 (170)
26.7 (646)
49.5 (266)
65.9 (103)
29.2 (1191)
FBT 8.2 (40)
13.2 (97)
17.9 (107)
18.8 (67)
14.1 (311)
All tax types 51.9 (716)
105.7 (745)
144.3 (273)
181.9 (102)
75.6 (1846)
Base: All respondents who file the tax type indicated at Q1 excluding missing information and outliers Source: Long questionnaire Q1, Q4, Q13a; Short questionnaire Q6a *Respondents were asked how many employees they had at the end of ‘last month’. Thus, respondents in the ‘nil employees’ category can be regarded as not currently employing staff, but having done so in the last 12 months (as they indicated at Question 1 that they had paid/filed PAYE in the last 12 months).

FINAL REPORT PAGE 43
colmar brunton
Internal time spent on tax activities by specific types of personnel Similarly, for each tax type, respondents were asked to estimate how many hours per month different types of people (eg owners, paid employees, unpaid friends or relatives) spent on tax activities during the last 12 months. Again, this data has been converted into annual figures. Table 5.6, Figure 10, and Table 5.7 detail the amount of time that different types of personnel spend on tax activities in relation to each tax type. Table 5.6 and Figure 10 use mean values and Table 5.7 uses medians. Ideally the amount of time spent by all personnel (as specified in the following tables) should match the amount of time spent on all tax activities (as specified in the previous tables). Whilst these figures are very close, they do not match exactly because two different questions were used to produce these two sets of data. Check questions and telephone call backs were successfully employed to avoid any major discrepancy. Using the data from this question (Q13b), businesses spend an average of 76.7 hours per year on tax activities (across all personnel categories). This compares to 75.6 hours reported earlier in response to Q13a (which asked the respondent to record time by tax activity)16. Q13b has been used for the bulk of the analysis in this report – including the calculation of compliance costs – for two reasons. First, it enables us to place values on the time of different personnel categories (this is explained in detail in the section entitled ‘Value of Time’). And second, Q13b is possibly less prone to double-counting. The data in the tables below indicate that owners/partners/directors/trustees spend the most time on tax activities (on average 56.3 hours per year) ahead of paid employees (18.4 hours) and unpaid friends or relatives (3.4 hours). This pattern is evident across all tax types with the exception of FBT. (However, as shown in Tables 5.8 and 5.9, this pattern does not hold across all business size groupings.) Again, the median measures are notably lower than the means. The median measures for the time that paid employees, and unpaid friends or relatives, spend on tax activities is zero. This indicates that for the majority of businesses, no time is spent on tax activities by these types of personnel (either because these businesses do not have these types of personnel or if they do they do not spend time on tax activities).
16 Much larger discrepancies occurred between the similar questions in a major Australian survey. For example, median annual hours spent on all tax activities for ‘medium’ businesses (turnover between $100,000 and $10 million) was 132 hours, whereas when measured in response to list of different tax types median time was only 48 hours (Evans et al., 1996, pp.125, 129).

FINAL REPORT PAGE 44
colmar brunton
Table 5.6: Internal time spent by personnel on all tax activities (annual hours) by tax type - means Personnel GST Income tax
(including provisional
tax)
PAYE (including
child support, student
loans, ACC levy)
FBT All tax types
Mean (trimmed) annual number of hours
Owners/partners/directors/trustees 33.8 (1599)
23.1 (1564)
15.8 (1178)
6.8 (308)
56.3 (1494)
Paid employees 11.1 (1619)
3.6 (1566)
8.8 (1186)
6.4 (310)
18.4 (1518)
Unpaid friends or relatives 2.2 (1623)
1.0 (1572)
0.8 (1198)
0.0 (309)
3.4 (1517)
All personnel 44.2 (1521)
29.4 (1509)
27.5 (1157)
12.8 (316)
76.7 (1714)
Base: All respondents who according to Q1 filed the particular tax type (excluding missing information and outliers) Source: Long questionnaire Q13b; Short questionnaire Q6b, Q6c
Figure 10: Internal time spent on all tax activities (annual hours) by tax type - means
0
20
40
60
80
100
GST Income tax PAYE FBT All tax types
Tax type
Owners/partners/directors/trusteesPaid employeesUnpaid friends or relatives
Mean (trimmed) number of annual hours 44.2
29.4 27.5
12.8
76.7

FINAL REPORT PAGE 45
colmar brunton
Table 5.7: Internal time spent by personnel on all tax activities (annual hours) by tax type - medians Personnel GST Income tax
(including provisional
tax)
PAYE (including
child support, student
loans, ACC levy)
FBT All tax types
Median number of hours (annual)
Owners/partners/directors/trustees 24.0 (1627)
12.0 (1585)
8.0 (1201)
3.0 (311)
30.7 (1517)
Paid employees 0.0 (1623)
0.0 (1582)
0.0 (1198)
0.0 (311)
0.0 (1521)
Unpaid friends or relatives 0.0 (1626)
0.0 (1582)
0.0 (1199)
0.0 (311)
0.0 (1520)
All personnel 30.0 (1569)
18.0 (1536)
14.0 (1174)
8.0 (320)
45.0 (1755)
Base: All respondents who according to Q1 filed the particular tax type (excluding missing information) Source: Long questionnaire Q13b; Short questionnaire Q6b, Q6c
Figure 11, Table 5.8, and Table 5.9 detail the amount of time that different types of personnel spend on tax activities over all tax types by size of business (defined in terms of number of employees). Larger businesses are clearly more reliant on paid employees to undertake tax work with these personnel carrying out most of this type of work (88%) in medium-sized SMEs, compared to 42% of tax work carried out by paid employees in small SMEs, and 30% in Micro. Figure 11: Internal time spent by personnel by tax type - means
0
20
40
60
80
100
120
140
160
180
200
220
240
Nil employees Micro Small Medium All SMEs
Business size (number of employees)
Owners/partners/directors/trusteesPaid employeesUnpaid friends or relatives
Mean (trimmed) number of annual hours
51.3
108.0
156.7
204.5
76.7

FINAL REPORT PAGE 46
colmar brunton
Table 5.8: Internal time spent by all personnel on all tax activities (annual hours) by business size (number of employees) - means
Business size (number of employees) Personnel
Nil employees
Micro (1-5) Small (6-19) Medium (20+)
All
Mean (trimmed) annual number of hours
Owners/partners/directors/trustees 44.2 (591)
79.9 (568)
86.9 (235)
59.4 (98)
56.3 (1494)
Paid employees 2.2 (599)
32.9 (579)
65.0 (239)
166.7 (98)
18.4 (1518)
Unpaid friends or relatives 3.6 (595)
3.0 (578)
4.3 (241)
0.0 (100)
3.4 (1517)
All personnel 51.3 (674)
108.0 (688)
156.7 (251)
204.5 (94)
76.7 (1714)
Base: All respondents (excluding missing information and outliers) Source: Long questionnaire Q4, Q13b; Short questionnaire Q6b, Q6c
Table 5.9: Internal time spent by all personnel on all tax activities (annual hours) by business size (number of employees) - medians
Business size (number of employees) Personnel
Nil employees
Micro (1-5) Small (6-19) Medium (20+)
All
Median number of hours (annual)
Owners/partners/directors/trustees 26.0 (724)
50.0 (767)
41.1 (290)
24.0 (116)
32.0 (1907)
Paid employees 0.0 (724)
0.0 (767)
18.0 (290)
84.0 (116)
0.0 (1907)
Unpaid friends or relatives 0.0 (724)
0.0 (767)
0.0 (290)
0.0 (116)
0.0 (1907)
All personnel 30.0 (720)
67.4 (764)
109.1 (289)
174.4 (116)
42.0 (1898)
Base: All respondents (excluding missing information) Source: Long questionnaire Q4, Q13b; Short questionnaire Q6b, Q6c

FINAL REPORT PAGE 47
colmar brunton
Internal time spent dealing with child support and student loans Table 5.10 assesses the amount of time that employers in different business size groupings spend dealing with activities associated with child support payments and student loan payments. 11% of employers employ staff paying child support. On average, these employers spend 0.5 hours per year dealing with PAYE issues related to child support. This equates to 1.2% of the time they spend on PAYE in total. 20% of employers employ staff making student loan payments. On average, these employers spend 0.5 hours per year dealing with PAYE issues related to student loans. This equates to 1.3% of the time they spend on PAYE in total. Due to small sample sizes, care should be taken in interpreting the results by business size. However, the data shows that more larger businesses employ staff paying child support and student loans. Among businesses that employ these types of staff, the amount of time spent on child support and student loan issues does not appear to differ according to business size (defined in terms of the total number of employees a business has).

FINAL REPORT PAGE 48
colmar brunton
Table 5.10: Internal time spent (annual hours) dealing with child support and student loans by business size (number of employees)
Business size (number of employees)
Nil employees±
Micro (1-5) Small (6-19) Medium (20+)
All
PAYE Mean (trimmed) number of hours that those who employ staff paying child support spent on PAYE (including child support, student loans, ACC levy)**
0.0 (1)
44.6 (38)
53.9 (81)
48.5 (62)
49.5 (182)
Mean (trimmed) number of hours that those who employ staff paying student loans spent on PAYE (including child support, student loans, ACC levy)***
10.6 (9)
32.9 (101)
48.1 (118)
55.2 (86)
42.7 (315)
Child support % who employ staff paying child support*
1% (5 of 192)^
5% (43 of 720)^
29% (89 of 290)^
60% (73 of 115)^
11% (210 of 1325)^
Mean (trimmed) number of hours spent dealing with child support**
1.0 (4)
0.5 (37)
0.5 (73)
0.5 (57)
0.5 (171)
% of PAYE related time spent on child support**
- (-)
1.3% (33)
1.1% (64)
1.2% (48)
1.2% (145)
Student loans % who employ staff paying student loans*
3% (12 of 192)^
13% (114 of 720)^
46% (137 of 290)^
79% (97 of 116)^
20% (362 of 1325)^
Mean (trimmed) number of hours spent dealing with student loans***
0.2 (10)
0.4 (105)
0.4 (120)
0.5 (86)
0.5 (322)
% of PAYE related time spent on student loans***
2.6% (7)
1.7% (91)
0.9% (105)
1.1% (73)
1.3% (277)
Base: *All who indicated they file PAYE at Q1; **All those who indicated they employ staff paying child support at Q15; ***All those who indicated they employ staff paying student loans at Q16
Source: Long questionnaire Q4, Q13b, Q15 and Q16
^The numbers in brackets use unweighted data (ie the actual number of respondents) whereas the % is a weighted value.
±Note: Respondents were asked how many employees they had at the end of ‘last month’. Thus, respondents in the ‘nil
employees’ category can be regarded as not currently employing staff, but having done so in the last 12 months (as they indicated at Question 1 that they had paid/filed PAYE in the last 12 months).

FINAL REPORT PAGE 49
colmar brunton
A similar analysis to that presented in the previous table is shown below, but with an assessment made by PAYE filing method. The results suggest that those who file electronically are more likely to employ staff that pay child support and student loans. However, this is likely to be a function of business size (as supported by the sample profile tables earlier in the report). There is no significant difference in the amount of time spent on child support issues or student loan issues between those who file electronically and those who file manually. Table 5.11: Internal time spent (annual hours) dealing with child support and student loans by filing method Filing method
Electronic Manual
All
PAYE Mean (trimmed) number of hours that those who employ staff paying child support spent on PAYE (including child support, student loans, ACC levy)**
51.4 (75)
51.9 (97)
49.5 (182)
Mean (trimmed) number of hours that those who employ staff paying student loans spent on PAYE (including child support, student loans, ACC levy)***
47.0 (115)
40.6 (191)
42.7 (315)
Child support % who employ staff paying child support* 35%
(89 of 208)^
9% (108 of 990)^
11% (210 of 1325)^
Mean (trimmed) number of hours spent dealing with child support**
0.4 (70)
0.5 (92)
0.5 (171)
% of PAYE related time spent on child support** 1.1% (58)
1.3% (80)
1.2% (145)
Student loans % who employ staff paying student loans* 54%
(31 of 208)^ 19%
(219 of 990)^
20% (362 of 1325)^
Mean (trimmed) number of hours spent dealing with student loans***
0.4 (113)
0.4 (197)
0.5 (322)
% of PAYE related time spent on student loans*** 0.8% (97)
1.5% (171)
1.3% (277)
Base: *All who indicated they file PAYE at Q1; **All those who indicated they employ staff paying child support at Q15; ***All those who indicated they employ staff paying student loans at Q16
Source: Long questionnaire Q13b, Q15 and Q16; IRD database information used for filing method ^The numbers in brackets use unweighted data (ie the actual number of respondents) whereas the % is a weighted value.

FINAL REPORT PAGE 50
colmar brunton
Internal time spent on particular income tax-related activities Respondents were asked to indicate how many hours their business had spent (internally) on the three income tax-related activities listed in the following table. Tables 5.12 and 5.13 present this data by business size using means and medians respectively. On average, around two hours per year is spent on each of these activities. Time spent on tax activities for depreciation, and adjustments for fixed assets/valuing stock is higher among median SMEs (12.0 hours). Table 5.12: Internal time spent (annual hours) on particular income tax-related activities by business size (number of employees) – means Tax activity Business size (number of employees)
Nil employees
Micro (1-5) Small (6-19)
Medium (20+)
All
Mean (trimmed) annual number of hours
Calculating provisional tax and deciding which provisional tax option to choose
1.2 (538)
1.9 (721)
1.6 (272)
1.5 (113)
1.5 (1653)
Tax activities for depreciation and adjustments for fixed assets, valuing stock
1.2 (503)
1.9 (695)
3.7 (264)
12.0 (111)
2.1 (1582)
Other end-of-year adjustments 1.2 (493)
1.5 (679)
2.3 (261)
3.2 (109)
1.5 (1551)
Mean hours for income tax 26.3 (590)
31.9 (587)
39.3 (229)
57.2 (97)
29.4 (1509)
Base: All respondents (those who ticked ‘none’ have been included as zero) Source: Long questionnaire Q4 and Q17; Short questionnaire Q8
Table 5.13: Internal time spent (annual hours) on particular income tax-related activities by business size (number of employees) – medians Tax activity Business size (number of employees)
Nil employees
Micro (1-5) Small (6-19)
Medium (20+)
All
Median number of hours (annual)
Calculating provisional tax and deciding which provisional tax option to choose
0.0 (1207)
0.0 (536)
0.0 (128)
0.0 (49)
0.0 (1928)
Tax activities for depreciation and adjustments for fixed assets, valuing stock
0.0 (1207)
0.0 (536)
0.0 (128)
1.6 (49)
0.0 (1928)
Other end-of-year adjustments 0.0 (1207)
0.0 (536)
0.0 (128)
1.8 (49)
0.0 (1928)
Median hours for income tax 13 (699)
12 (749)
20.7 (282)
36.9 (115)
14 (1854)
Base: All respondents (those who ticked ‘none’ have been included as zero) Source: Long questionnaire Q4 and Q17; Short questionnaire Q8

FINAL REPORT PAGE 51
colmar brunton
Tables 5.14 and 5.15 present similar tables (using trimmed mean values) by age of business and provisional tax option. No marked differences are evident except for income tax. Table 5.14: Internal time spent (annual hours) on particular income tax-related activities by age of business Tax activity Age of business All
Less than 12 months
1-2 years
3-5 years
6-10 years
10 years +
Mean (trimmed) annual number of hours
Calculating provisional tax and deciding which provisional tax option to choose
0.5 (46)
0.5 (196)
0.4 (351)
0.4 (336)
0.3 (929)
0.4 (1890)
Tax activities for depreciation and adjustments for fixed assets, valuing stock
0.6 (46)
0.5 (199)
0.6 (350)
0.6 (335)
0.5 (912)
0.5 (1873)
Other end-of-year adjustments 0.5 (46)
0.6 (199)
0.7 (352)
0.7 (337)
0.5 (929)
0.6 (1895)
Mean hours for income tax 36.4 (30)
33.5 (152)
29.2 (286)
28.5 (273)
28.6 (748)
29.4 (1509)
Base: All respondents (those who ticked ‘none’ have been included as zero) Source: Long questionnaire Q17, Q22; Short questionnaire Q8, Q9, Q13
Table 5.15: Internal time spent (annual hours) on particular income tax-related activities by provisional tax options
Provisional tax options Tax activity
Estimated Safe harbour
All
Mean (trimmed) annual number of hours
Calculating provisional tax and deciding which provisional tax option to choose
0.5 (132)
0.3 (746)
0.4 (1888)
Tax activities for depreciation and adjustments for fixed assets, valuing stock
0.6 (126)
0.4 (744)
0.5 (1871)
Other end-of-year adjustments 0.7 (130)
0.4 (750)
0.6 (1893)
Mean hours for income tax 41.3 (117)
28.1 (596)
26.0 (1878)
Base: All respondents (those who ticked ‘none’ have been included as zero) Source: Long questionnaire Q17, Q13b; Short Q6b, Q8, Q9; IRD database information on provisional tax options.

FINAL REPORT PAGE 52
colmar brunton
Internal time spent on tax-related activities required for entertainment expenses Respondents were asked whether their business spent time during the last 12 months dealing with the 50% deductibility and GST adjustment required for some entertainment expenses and, if so, how much time was spent. Seventeen percent of all SMEs have dealt with these types of adjustments in the last 12 months. This figure rises markedly with business size with around half of medium-sized businesses having spent time on these types of adjustments. The mean number of hours spent per year on these adjustments is low across all business size groupings with businesses that make these types of adjustments spending around two hours per year.
Table 5.16: Internal time spent (annual hours) on tax-related activities required for entertainment expenses Business size (number of employees)
Nil employees
Micro (1-5) Small (6-19)
Medium (20+)
All
% who made these types of adjustments (based on all SMEs)
13% (93 of 724)*
21% (177 of 767)*
27% (89 of 290)*
53% (57 of 116)*
17% (418 of 1907)*
Mean (trimmed) annual number of hours
Mean number of hours spent per year on GST adjustments & 50% deductibility required for entertainment expenses (based on All SMEs)
0.2
(723)
0.5
(764)
0.6
(286)
1.3
(112)
0.3
(1895)
Mean number of hours spent per year on GST adjustments & 50% deductibility required for entertainment expenses (based on only those SMEs that made these type of adjustments)
1.9 (87)
2.2 (170)
2.4 (83)
2.8 (50)
2.1 (391)
Base: Varies - see explanation in table Source: Long questionnaire Q4, Q18; Short questionnaire Q9 *The numbers in brackets use unweighted data (ie the actual number of respondents) whereas the % is a weighted value.

FINAL REPORT PAGE 53
colmar brunton
Value of time analysis The task of converting time into a monetary value relies on the robust estimation of the value of time, that is, the time spent by:
• owners/partners/directors/trustees
• paid employees
• unpaid friends or relatives' time. A number of options were considered as follows:
• Basing the value of time on the survey responses, ie using ‘reported values’ (Question 7 in the ‘short’ questionnaire and Question 14 in the ‘long’ questionnaire).
• Using official statistics. - New Zealand’s Department of Statistics publishes quarterly average hourly rate figures from
the NZ Income Survey. It is possible to obtain these rates by both main job occupation or by business nature or sector.
- New Zealand’s Department of Statistics undertakes the Quarterly Employment Survey (QES) which is designed to measure quarterly estimates of change and levels of average hourly and weekly (pre-tax) earnings, average weekly paid hours, and the number of filled jobs.
- MED produce a table under ‘SMEs in New Zealand: Structure and Dynamics’ which allows a rough estimate (based on 1,920 hours worked per year – 48 weeks /yr , 40 hr /wk). Statistics in this section are drawn from the Annual Enterprise Survey conducted by Statistics New Zealand.
• Imputing a value. The wage rates for self-employed business taxpayers can be imputed either by: - asking business taxpayers the minimum wage that would induce them to supply an extra
hour of their labour time (the ‘reservation’ wage rate); or - the wage rates of people who have comparable human capital to those business taxpayers,
for example using external recruitment sources – Hayes Salary Survey 2004 (this is somewhat arbitrary but practical).
Following an in-depth investigation of each of these options, Inland Revenue made a number of recommendations. These recommendations, and the supporting evidence which led to these recommendations, are detailed in a paper prepared by Inland Revenue ‘Measuring the Compliance Costs of Small and Medium Businesses: Value of time – Estimating an appropriate value’. In summary, the recommendations are as follows. The recommendation was made that we can assume that there is no difference in time values between respondents of the ‘short’ income tax only questionnaire and those who completed the ‘long’ multiple tax type questionnaire – that they are ‘equivalent’ small and medium businesses. In drawing this assumption, we escape some of the problems encountered in previous research by not having to differentiate between individuals, sole traders and conventional business structures. We can focus on differences in business size and the role of the person whether it is as an owner/manager or paid employee or unpaid friend/relative. No real gains can be made by introducing the added complexity of value of time across sector type.

FINAL REPORT PAGE 54
colmar brunton
The ATAX scoping report supported the use of trimmed means for respondent data (which are on average 9% higher than the trimmed medians in our case) over medians. In comparing values we used the trimmed means. Owners/partners/directors/trustees For paid employees, hourly wage rates provide a convenient estimate of opportunity cost. With business owners/directors, selecting a value to apply is less objective and has more difficulties to valuing time spent on personal tax affairs (because owners may do the tax compliance work in what would otherwise be leisure time). Table 5.17: Value of time data relating to owners Hayes Personnel Services: Salary Survey 2004
Respondent
Data NZ Stats
(NZIS Jun 04) Finance Manager
Site Manager (Construction)
GM Sales & Marketing
Retail Centre Manager
Nil employees $45.09 -
Micro (1-5) $41.93 - $41.67
Small (6-19) $39.09 - $46.88
Medium (20+) $50.98 -
Total $43.99 $25.76^ $36.46 $93.75* $26.04 - $52.08
^Based on Main Job Occupations: (Note: reports only on incomes received from wage and salary jobs.)
• Legislators, Administrators & Managers
• Professionals *Based on larger, higher turnover enterprises than generally the target of this research. Again, given that the variation across business size is not too large, one figure has been used to value time for owners/partners/directors/trustees. A decision to use respondent data as the best estimate was made as it compares favourably with comparisons to data from the Hayes salary survey, and other research. The value of time figure for owners/partners/directors/trustees was $43.99. Paid employees In line with other research, a recommendation was made to value the time of paid employees based on external data. The close alignment between respondent data and Statistics New Zealand data supports this decision (see table below). Table 5.18: Value of time data relating to paid employees
Respondent Data
NZ Stats (QES Sep 04)
NZ Stats (NZIS Jun 04)
Nil employees $25.52 - -
Micro (1-5) $ 23.01 $20.37 -
Small (6-19) $21.87 $19.61 -
Medium (20+) $25.75 $20.35 -
Total $23.39 $20.31 * $18.25 ** *Average total hourly earnings (private sector) from Quarterly Employment Survey Sept 04’ ** Average hourly rate from the New Zealand Income Survey June 2004 quarter

FINAL REPORT PAGE 55
colmar brunton
Given the small variation across business size, the decision to use one figure for all business size groupings was made. The value of time figure used for paid employees was $20.31. Unpaid friends or relatives Most interesting, and probably hardest to estimate, is the value of unpaid friends or relatives. This is because they have no real market wage rate. Also, about one-third of survey respondents indicated that an approximate value for this time was $0. The difficulty with this is that it is not clear whether the helper’s time really has no value or the result of the respondent misunderstanding the point of the question. Table 5.19: Value of time data relating to unpaid friends or relatives
Hayes Personnel Services: Salary Survey 2004
Respondent Data* Payroll Clerk Teller General Accounts
Clerk
Nil employees $27.40
Micro (1-5) $21.70
Small (6-19) $19.50
Medium (20+) -
Total $25.70 $18.23 $17.18 $18.23 *Respondents reporting $0 were not included in the mean calculations.
Again, given the variation across business size is relatively small, the decision was made to use one figure to value time for unpaid friends or relatives. A decision was made to use respondent data as the best estimate. While slightly higher than comparisons to data from the Hayes salary survey and other research, IRD did not want to underestimate compliance costs. The value of time figure for unpaid friends or relatives is $25.70. Value of time analysis summary The following dollar amounts were used to convert time into compliance costs:
• $43.99 (owners/partners/directors/trustees)
• $20.31 (paid employees)
• $25.70 (unpaid friends or relatives).

FINAL REPORT PAGE 56
colmar brunton
Income tax This section reports on the internal tax compliance costs associated with income tax. Table 5.20 provides a summary of the internal compliance costs of income tax. The first column of figures summarises the internal time that various categories of personnel spent on income tax. The second column of figures gives the estimated compliance costs of income tax (time multiplied by $). And the last column expresses the compliance costs associated with a particular category of personnel as a percentage of the compliance cost associated with all personnel. On average, businesses spend 29.4 hours per year on tax activities associated with income tax. This equates to $1224. The vast majority of this cost is the result of time spent by owners/partners/directors /trustees. Table 5.20: Summary of internal income tax compliance costs Personnel Mean (trimmed)
time – an annual hours
Mean (trimmed) compliance cost –
annual $
Mean compliance cost expressed as
a % of mean compliance cost of
all personnel
Hours $ %*
Owners/partners/directors/trustees 23.1 (1564)
$1103 (1569)
90.1%
Paid employees 3.6 (1566)
$75 (1567)
6.1%
Unpaid friends or relatives 1.0 (1572)
$36 (1578)
2.9%
All personnel 29.4 (1509)
$1224 (1521)
100.0%
Base: All respondents who file/pay income tax (Q1 in long questionnaire) and all respondents of short questionnaire (excluding missing information and outliers)
Source: Long questionnaire Q13b, and Q14; Short questionnaire Q6a, Q6b, Q6c, Q7 *The percentages in this column do not add to 100% because the mean compliance costs each have slightly different bases due to the process of trimming outliers.
Tables 5.21 and 5.22 respectively show the internal time and costs spent on income tax analysed by business size (number of employees) and distinguishing the different categories of personnel.

FINAL REPORT PAGE 57
colmar brunton
Table 5.21: Internal time spent (annual hours) by personnel on income tax by business size (number of employees)
Business size (number of employees) Personnel
Nil employees Micro (1-5) Small (6-19) Medium (20+)
All
Mean (trimmed) annual number of hours
Owners/partners/directors/trustees 23.0 (604)
22.2 (608)
24.2 (642)
31.1 (104)
23.1 (1564)
Paid employees 0.8 (612)
5.8 (611)
12.0 (239)
28.3 (98)
3.6 (1566)
Unpaid friends or relatives 1.3 (606)
0.6 (611)
0.5 (245)
0.0 (104)
1.0 (1572)
All personnel 26.3 (590)
31.9 (587)
39.3 (229)
57.2 (97)
29.4 (1509)
Base: All respondents who file/pay income tax (Q1 in long questionnaire) and all respondents of short questionnaire (excluding missing information and outliers)
Source: Long questionnaire Q4 and Q13b; Short questionnaire Q6a, Q6b, and Q6c
Income tax compliance costs rise with business size. This is largely the result of the time spent on tax activities by paid employees. Note there is very little difference in the income tax related costs between SMEs employing nil employees and micro SMEs. Costs incurred by owners are reasonably constant across business size with the exception of medium SMEs. Table 5.22: Mean internal compliance costs of income tax by business size (number of employees)
Business size (number of employees) Personnel
Nil employees Micro (1-5) Small (6-19) Medium (20+)
All
Mean (trimmed) annual compliance costs
Owners/partners/directors/trustees $1,097 (606)
$1,087 (611)
$1,097 (242)
$1,409 (104)
$1,103 (1569)
Paid employees $17 (612)
$128 (612)
$248 (239)
$574 (98)
$75 (1567)
Unpaid friends or relatives $44 (609)
$22 (613)
$32 (246)
$0 (104)
$36 (1578)
All personnel $1,146 (591)
$1,298 (590)
$1,462 (234)
$1,896 (100)
$1,224 (1521)
Base: All respondents who file/pay income tax (Q1 in long questionnaire) and all respondents of short questionnaire (excluding missing information and outliers)
Source: Long questionnaire Q4, Q13b and Q14; Short questionnaire Q6a, Q6b, Q6c and Q7

FINAL REPORT PAGE 58
colmar brunton
Table 5.23 shows the internal compliance costs of income tax analysed by whether or not a business uses a tax advisor for income tax purposes. Table 5.24 provides a breakdown by business size. Compliance costs between those who do and do not use a tax advisor are the same overall. However, those who use a tax advisor appear more reliant on, and those who don’t use a tax advisor appear less reliant on, paid employees. In interpreting these results, the reader should bear in mind that those who do not use tax advisors are more likely to be smaller businesses; 80% of those who do not use a tax advisor for income tax have no employees compared to only 51% of those who use a tax advisor for income tax. Table 5.23: Mean internal compliance costs of income tax by use of a tax advisor for income tax
Whether business uses a tax advisor for income tax Personnel
Use tax advisor Do not use tax advisor
All
Mean compliance costs in dollars (annual)
Owners/partners/directors/trustees $1,054 (1141)
$1,063 (278)
$1,103 (1569)
Paid employees $107 (1135)
$49 (279)
$75 (1567)
Unpaid friends or relatives $32 (1146)
$37 (282)
$36 (1578)
All personnel $1,202 (1103)
$1,202 (272)
$1,224 (1521)
Base: All respondents who file/pay income tax (Q1 in long questionnaire) and all respondents of short questionnaire (excluding missing information and outliers)
Source: Long questionnaire Q10a, 10b (income tax), Q13b and Q14; Short questionnaire Q4, Q6a, Q6b, Q6c and Q7
Table 5.24 Mean internal compliance costs of income tax by business size (number of employees) and whether business uses tax advisor for income tax
Business size (number of employees) Use of tax advisor
Nil employees Micro (1-5) Small (6-19) Medium (20+)
All
Mean (trimmed) annual compliance costs
Use tax advisor for income tax $1,027 (349)
$1,297 (486)
$1,587 (185)
$1,827 (81)
$1,202 (1103)
Don’t use tax advisor for income tax
$1,163 (121)
$1,307 (87)
$1,088 (43)
$2,174 (19)
$1,202 (272)
All $1,146 (591)
$1,298 (590)
$1,462 (234)
$1,896 (100)
$1,224 (1521)
Base: All respondents who file/pay income tax (Q1 in long questionnaire) and all respondents of short questionnaire (excluding missing information and outliers)
Source: Long questionnaire Q4, Q13b and Q14; Short questionnaire Q6a, Q6b, Q6c and Q7
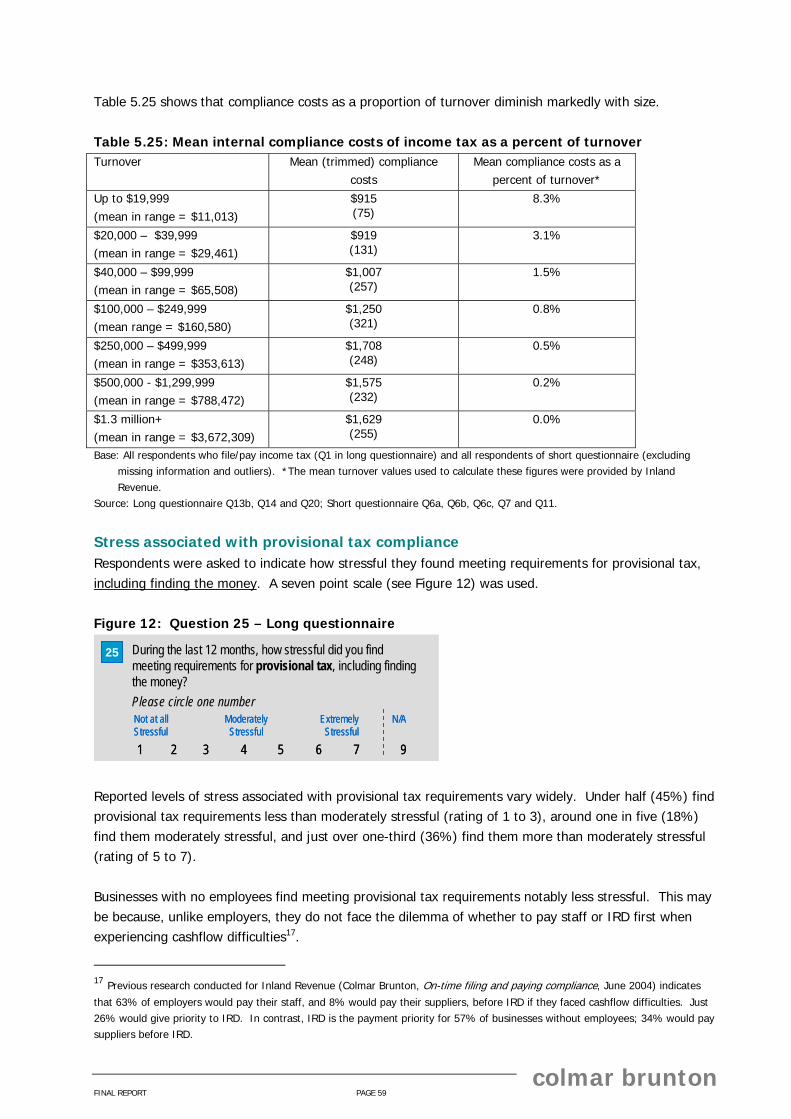
FINAL REPORT PAGE 59
colmar brunton
Table 5.25 shows that compliance costs as a proportion of turnover diminish markedly with size. Table 5.25: Mean internal compliance costs of income tax as a percent of turnover Turnover Mean (trimmed) compliance
costs Mean compliance costs as a
percent of turnover*
Up to $19,999 (mean in range = $11,013)
$915 (75)
8.3%
$20,000 – $39,999 (mean in range = $29,461)
$919 (131)
3.1%
$40,000 – $99,999 (mean in range = $65,508)
$1,007 (257)
1.5%
$100,000 – $249,999 (mean range = $160,580)
$1,250 (321)
0.8%
$250,000 – $499,999 (mean in range = $353,613)
$1,708 (248)
0.5%
$500,000 - $1,299,999 (mean in range = $788,472)
$1,575 (232)
0.2%
$1.3 million+ (mean in range = $3,672,309)
$1,629 (255)
0.0%
Base: All respondents who file/pay income tax (Q1 in long questionnaire) and all respondents of short questionnaire (excluding missing information and outliers). *The mean turnover values used to calculate these figures were provided by Inland Revenue.
Source: Long questionnaire Q13b, Q14 and Q20; Short questionnaire Q6a, Q6b, Q6c, Q7 and Q11.
Stress associated with provisional tax compliance Respondents were asked to indicate how stressful they found meeting requirements for provisional tax, including finding the money. A seven point scale (see Figure 12) was used. Figure 12: Question 25 – Long questionnaire
During the last 12 months, how stressful did you find meeting requirements for provisional tax, including finding the money?Please circle one number
25
1 2 3 4 5 6 7 9
Not at all Moderately Extremely N/AStressful Stressful Stressful
During the last 12 months, how stressful did you find meeting requirements for provisional tax, including finding the money?Please circle one number
25
1 2 3 4 5 6 7 9
Not at all Moderately Extremely N/AStressful Stressful Stressful
1 2 3 4 5 6 7 9
Not at all Moderately Extremely N/AStressful Stressful Stressful
Reported levels of stress associated with provisional tax requirements vary widely. Under half (45%) find provisional tax requirements less than moderately stressful (rating of 1 to 3), around one in five (18%) find them moderately stressful, and just over one-third (36%) find them more than moderately stressful (rating of 5 to 7). Businesses with no employees find meeting provisional tax requirements notably less stressful. This may be because, unlike employers, they do not face the dilemma of whether to pay staff or IRD first when experiencing cashflow difficulties17.
17 Previous research conducted for Inland Revenue (Colmar Brunton, On-time filing and paying compliance, June 2004) indicates
that 63% of employers would pay their staff, and 8% would pay their suppliers, before IRD if they faced cashflow difficulties. Just 26% would give priority to IRD. In contrast, IRD is the payment priority for 57% of businesses without employees; 34% would pay suppliers before IRD.
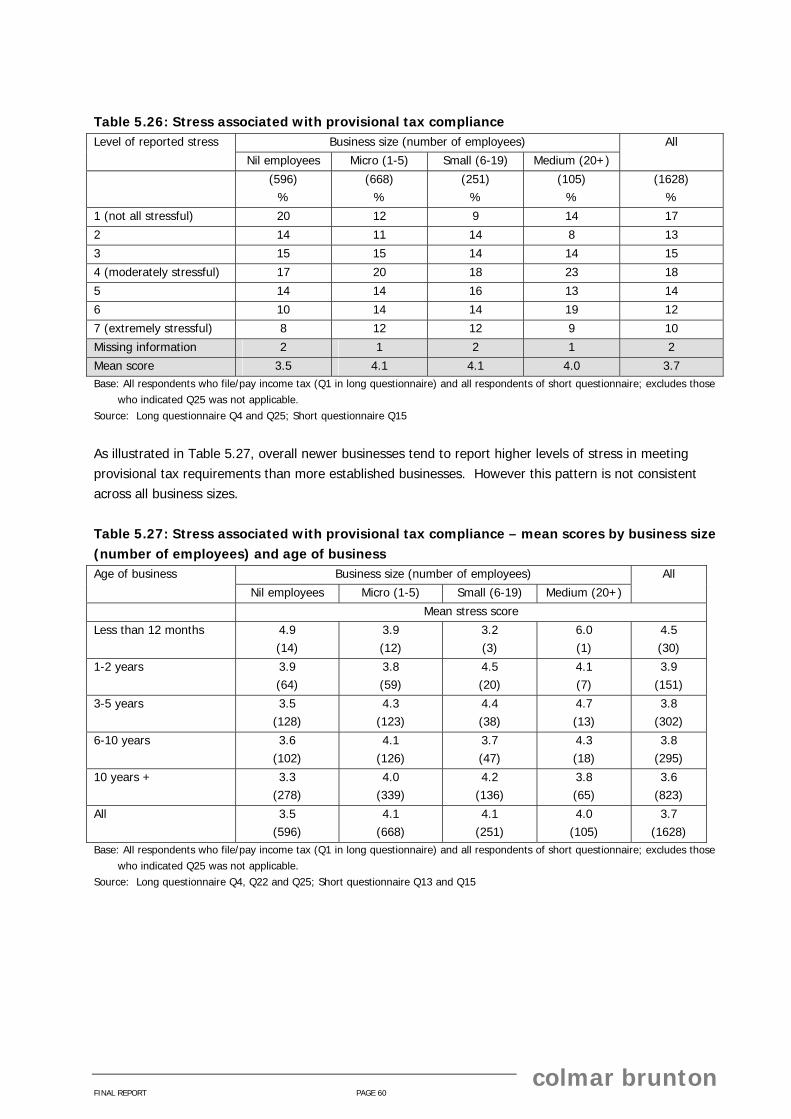
FINAL REPORT PAGE 60
colmar brunton
Table 5.26: Stress associated with provisional tax compliance Level of reported stress Business size (number of employees)
Nil employees Micro (1-5) Small (6-19) Medium (20+)
All
(596) %
(668) %
(251) %
(105) %
(1628) %
1 (not all stressful) 20 12 9 14 17
2 14 11 14 8 13
3 15 15 14 14 15
4 (moderately stressful) 17 20 18 23 18
5 14 14 16 13 14
6 10 14 14 19 12
7 (extremely stressful) 8 12 12 9 10
Missing information 2 1 2 1 2
Mean score 3.5 4.1 4.1 4.0 3.7 Base: All respondents who file/pay income tax (Q1 in long questionnaire) and all respondents of short questionnaire; excludes those
who indicated Q25 was not applicable. Source: Long questionnaire Q4 and Q25; Short questionnaire Q15
As illustrated in Table 5.27, overall newer businesses tend to report higher levels of stress in meeting provisional tax requirements than more established businesses. However this pattern is not consistent across all business sizes. Table 5.27: Stress associated with provisional tax compliance – mean scores by business size (number of employees) and age of business Age of business Business size (number of employees) All
Nil employees Micro (1-5) Small (6-19) Medium (20+)
Mean stress score
Less than 12 months 4.9 (14)
3.9 (12)
3.2 (3)
6.0 (1)
4.5 (30)
1-2 years 3.9 (64)
3.8 (59)
4.5 (20)
4.1 (7)
3.9 (151)
3-5 years 3.5 (128)
4.3 (123)
4.4 (38)
4.7 (13)
3.8 (302)
6-10 years 3.6 (102)
4.1 (126)
3.7 (47)
4.3 (18)
3.8 (295)
10 years + 3.3 (278)
4.0 (339)
4.2 (136)
3.8 (65)
3.6 (823)
All 3.5 (596)
4.1 (668)
4.1 (251)
4.0 (105)
3.7 (1628)
Base: All respondents who file/pay income tax (Q1 in long questionnaire) and all respondents of short questionnaire; excludes those who indicated Q25 was not applicable.
Source: Long questionnaire Q4, Q22 and Q25; Short questionnaire Q13 and Q15

FINAL REPORT PAGE 61
colmar brunton
Table 5.28 analyses the mean reported stress levels associated with provisional tax requirements by business size and GST accounting system. The latter was chosen as a variable worth investigating as it was felt to be potentially indicative of the degree to which a business is organised in collating information for tax purposes (including, eventually, income tax). Perhaps in contrast to initial expectations, the reported stress levels of those with manual systems are lower than those with computerised accounting software (see figures in last column). However, as the data in the table indicates, this pattern only holds for businesses with no employees. Further analysis of the database also shows that businesses with no employees and who use manual accounting systems have markedly lower levels of turnover than businesses with no employees and who use computerised systems. Thus, there is no conclusive evidence that the type of GST accounting system contributes to reported levels of stress associated with provisional tax requirements. Table 5.28: Stress associated with provisional tax compliance – mean scores by business size (number of employees) and accounting system
Business size (number of employees) All Accounting system used for GST Nil employees Micro (1-5) Small (6-19) Medium (20+)
Mean stress score
Manual/paper-based 3.6 (214)
4.2 (219)
4.1 (45)
5.3 (6)
3.8 (486)
Computerised accounting software (in-house)
4.0 (145)
4.1 (307)
4.1 (173)
4.0 (88)
4.0 (716)
Other computing used in-house
4.0 (78)
4.0 (87)
3.8 (13)
4.6 (8)
4.0 (189)
External 4.1 (63)
4.0 (105)
4.6 (39)
2.7 (9)
4.1 (217)
Base: All respondents who file/pay income tax (Q1 in long questionnaire) and all respondents of short questionnaire; excludes those who indicated Q25 was not applicable.
Source: Long questionnaire Q4, Q6 and Q25; Short questionnaire Q15
A question was included in the long questionnaire to ascertain who answered the questions about how stressful tax activities are. The results to this question have been used as an analysis variable in Table 5.29. In relation to multiple taxpaying businesses, owners/partners, managers, and clerks/IT staff report significantly higher levels of stress associated with meeting provisional tax requirements than internal accountants/lawyers or external tax advisors. Income tax only taxpayers (respondents of the short questionnaire) also report significantly lower levels of stress.

FINAL REPORT PAGE 62
colmar brunton
Table 5.29: Stress associated with provisional tax compliance – analysed by who answered the question
Base: All respondents who file/pay income tax (Q1 in long questionnaire) and all respondents of short questionnaire; excludes those who indicated Q25 was not applicable.
Source: Long questionnaire Q25 and Q28; Short questionnaire Q15
Person who answered question Level of reported stress Owner/
partner/ director/ trustee
Manager Internal accounta
nt or lawyer
External accountant or tax advisor
Clerk or IT staff
Unpaid friend or family
member
Other (long
questionnaire)
Respondent of short questionn
aire
All
(1196) %
(144) %
(78) %
(50) %
(106) %
(33) %
(3) %
(132) %
(1628) %
1 (not all stressful) 13 16 22 27 9 18 - 26 17
2 12 7 12 14 15 13 - 18 13
3 15 18 10 21 19 11 - 16 15
4 (moderately stressful)
19 18 30 19 14 26 25 16 18
5 16 11 5 9 14 7 - 13 14
6 15 21 16 1 12 13 38 4 12
7 (extremely stressful)
10 9 4 9 15 13 38 7 10
Missing information 1 - 1 - 3 - - * 2
Mean score 4.0 4.0 3.5 3.1 4.1 3.8 5.9 3.1 3.7

FINAL REPORT PAGE 63
colmar brunton
GST This section reports on the internal tax compliance costs associated with GST. GST-registrants spend on average 44.2 hours per year on tax activities associated with GST. The value of this time equates to $1,852. For all SMEs, most of this can be attributed to time spent by owners/partners/directors/trustees. However, a different pattern emerges for larger businesses (see Table 5.31), where paid employees provide increasing proportions of the labour as business size grows. Table 5.30: Summary of internal GST compliance costs Personnel Mean (trimmed)
time – annual hours
Mean (trimmed) compliance cost –
annual $
Mean compliance cost expressed as
a % of mean compliance cost of
all personnel
Hours $ %*
Owners/ partners /directors /trustees 33.8 (1599)
$1,634 (1608)
88.2%
Paid employees 11.1 (1619)
$229 (1580)
12.4%
Unpaid friends or relatives 2.2 (1623)
$61 (1583)
3.3%
All personnel 44.2 (1521)
$1,852 (1546)
100.0%
Base: All respondents who file GST (Q1) excluding missing information and outliers Source: Long questionnaire Q13b and Q14 *The percentages in this column do not add to 100% because the mean compliance costs each have slightly different bases due to the process of trimming outliers.
Tables 5.31 and 5.32 display the mean hours and compliance costs of GST associated with different categories of personnel and business size groupings. The proportion of time that paid employees spend on GST increases as business size increases, with paid employees accounting for the bulk of time spent on GST for medium-sized-businesses. Table 5.31: Internal time spent (annual hours) by personnel on GST analysed by business size (number of employees)
Business size (number of employees) Personnel
Nil employees Micro (1-5) Small (6-19) Medium (20+)
All
Mean (trimmed) annual number of hours
Owners/partners/directors/trustees 30.2 (528)
39.8 (692)
32.7 (263)
32.2 (108)
33.9 (1599)
Paid employees 1.9 (535)
15.4 (699)
28.8 (269)
71.1 (108)
11.1 (1619)
Unpaid friends or relatives 2.5 (534)
2.2 (702)
1.9 (270)
0.0 (109)
2.2 (1623)
All personnel 33.7 (509)
54.0 (655)
59.9 (251)
73.0 (98)
44.2 (1521)
Base: All respondents who file GST (Q1) excluding missing information and outliers Source: Long questionnaire Q4 and Q13b

FINAL REPORT PAGE 64
colmar brunton
Table 5.32: Mean internal compliance costs of GST by business size
Business size (number of employees) Personnel
Nil employees Micro (1-5) Small (6-19) Medium (20+)
All
Mean (trimmed) annual compliance costs
Owners/partners/directors/trustees $1,454 (530)
$1,909 (696)
$1,699 (266)
$1,418 (108)
$1,634 (1608)
Paid employees $40 (517)
$314 (686)
$588 (262)
$1,455 (107)
$229 (1580)
Unpaid friends or relatives $70 (516)
$56 (688)
$51 (263)
$0 (108)
$61 (1583)
All personnel $1,496 (510)
$2,244 (665)
$2,285 (257)
$2,369 (106)
$1,852 (1546)
Base: All respondents who file GST (Q1) excluding missing information and outliers Source: Long questionnaire Q4, Q13b and Q14
Table 5.33 shows that GST compliance costs as a proportion of turnover diminish markedly with business size (defined in terms of turnover). Table 5.33: Mean internal compliance costs of GST as a proportion of turnover Turnover Mean (trimmed) GST-
related compliance costs Mean compliance costs as a
percent of turnover*
Up to $19,999 (mean in range = $11,013)
$1,665 (60)
15.1%
$20,000 – $39,999 (mean in range = $29,461)
$1,447 (98)
4.9%
$40,000 – $99,999 (mean in range = $65,508)
$1,478 (247)
2.3%
$100,000 – $249,999 (mean range = $160,580)
$1,795 (359)
1.1%
$250,000 – $499,999 (mean in range = $353,613)
$2,238 (258)
0.6%
$500,000 - $1,299,999 (mean in range = $788,472)
$2,502 (252)
0.3%
$1.3 million+ (mean in range = $3,672,309)
$2,389 (270)
0.0%
Base: All respondents who file GST (Q1) excluding missing information and outliers. *The mean turnover values used to calculate these figures were provided by Inland Revenue and based on population characteristics.
Source: Long questionnaire Q13b, Q14 and Q21

FINAL REPORT PAGE 65
colmar brunton
Table 5.34 looks at the internal time spent on GST by turnover and age of business. With the exception of new businesses (ie those who have been in business for less than 12 months) which on average spend slightly more time than older businesses, time spent on GST does not vary much by age of business. Table 5.34: Internal time spent (annual hours) on GST by age of business and business size (turnover)
Age of business Turnover
Less than 12 months
1-2 years 3-5 years 6-10 years 10 years +
All
Mean (trimmed) annual number of hours
Up to $39,999 47.7 (12)
44.5 (23)
35.6 (49)
33.9 (25)
32.3 (46)
36.1 (158)
$40,000 to $99,999 58.4 (11)
44.0 (41)
38.6 (58)
31.0 (44)
24.6 (89)
33.4 (246)
$100,000 to $1,299,999 48.7 (14)
50.6 (88)
54.1 (149)
54.3 (151)
46.1 (445)
49.5 (858)
$1.3 million + 86.4 (2)
54.2 (14)
79.8 (31)
70.2 (48)
62.0 (159)
66.4 (257)
All 52.5 (39)
47.2 (167)
46.7 (287)
46.5 (268)
41.0 (740)
44.2 (1521)
Base: All respondents who file GST (Q1) excluding missing information and outliers Source: Long questionnaire Q13b, Q20 and Q22
Accounting system used for GST Respondents were asked what type of accounting system they use for GST. The results by business size are shown in Table 5.35. Forty percent of businesses use some type of manual system for their GST. This is markedly more common the smaller the business. A similar proportion (38%) uses computerised in-house accounting software. Likewise, the use of computerised accounting software increases as business size increases. A further 15% use some other type of computer system. And 14% rely on an external tax advisor for their GST. Table 5.35: Accounting system used for GST by business size (number of employees)
Business size (number of employees) Accounting system
Nil employees
Micro (1-5)
Small (6-19)
Medium (20+)
All
(568) %
(762) %
(290) %
(115) %
(1745) %
Manual - paper based 49 36 21 7 40
Computerised accounting software (in-house) 28 44 64 84 38
Other computing used in-house (e.g. spreadsheets) 17 14 8 10 15
External 12 16 19 13 14
Missing information 1 * 1 - 1 Base: All respondents who file GST (Q1); excludes those who indicated Q6 was not applicable. Source: Long questionnaire Q4 and Q6

FINAL REPORT PAGE 66
colmar brunton
Table 5.36 indicates that the type of accounting system used for GST does not vary markedly by age of business. Established businesses (10 years+) are significantly less likely to use ‘other computing systems’ than their younger counterparts. Table 5.36: Accounting system used for GST by age of business
Age of business Accounting system
Less than 12 months
1-2 years
3-5 years
6-10 years
10 years +
All
(46) %
(191) %
(325) %
(308) %
(846) %
(1745) %
Manual - paper based 32 37 36 43 43 40
Computerised accounting software (in-house) 42 42 42 39 36 38
Other computing used in-house (e.g. spreadsheets) 21 17 20 15 12 15
External 18 11 13 13 15 14
Missing information - 2 1 - 1 1 Base: All respondents who file GST (Q1); excludes those who indicated Q6 was not applicable. Source: Long questionnaire Q6 and Q22
Table 5.37 shows that businesses that use computerised accounting software (in-house) face the highest GST-related compliance costs. However, this pattern is not evident among those with up to $39,999 in turnover. Note these costs relate to hours spent on all GST, not just on the accounting system. Logically, those who pay for an external tax accountant to handle aspects of their GST obligations experience the lowest internal tax compliance costs.
Table 5.37: Mean internal compliance costs of GST by accounting system and business size (turnover) Business size Accounting system
(Turnover) Manual - paper based
Computerised accounting software
(in-house)
Other computing used in-house (e.g.
spreadsheets)
External
Mean (trimmed) annual compliance costs
Up to $39,999 $1,452 (81)
$1,662 (47)
$2,294 (29)
$1,292 (18)
$40,000 to $99,999 $1,440 (130)
$1,897 (62)
$1,491 (52)
$1,153 (27)
$100,000 to $1,299,999 $2,024 (284)
$2,425 (421)
$2,156 (107)
$1,423 (124)
$1.3 million + $2,182 (26)
$2,457 (211)
$2,273 (20)
$2,246 (25)
All $1,699 (521)
$2,264 (742)
$1,959 (208)
$1,399 (195)
Base: All respondents who file GST (Q1) excluding missing information and outliers Source: Long questionnaire Q6, Q13b, Q14 and Q20

FINAL REPORT PAGE 67
colmar brunton
Basis on which GST is accounted for and GST filing frequency There is little variation in mean internal compliance costs of GST between those that account for GST on an invoice basis and those that account for GST on a payments basis (see Table 5.38). Note, data for those that account for GST on a hybrid basis are not shown due to small sample sizes. Table 5.38: Mean internal compliance costs of GST by GST basis and business size (turnover)
GST basis
Invoice Payments
Business size (turnover)
Mean (trimmed) annual compliance costs
Up to $39,999 $1,730 (27)
$1,501 (128)
$40,000 to $99,999 $1,224 (31)
$1,498 (214)
$100,000 to $1,299,999 $1,885 (147)
$2,162 (703)
$1.3 million + $2,528 (191)
$2,182 (70)
All $1,912 (396)
$1,866 (1116)
Base: All respondents who file GST (Q1) excluding missing information and outliers Source: Long questionnaire Q13b, Q14 and Q20; IRD database information on GST basis
Table 5.39 shows that GST-registrants who file more frequently face significantly higher GST compliance costs. Table 5.39: Mean internal compliance costs of GST by GST filing frequency and business size (turnover)
GST filing frequency
Monthly 2-monthly 6-monthly
Business size (turnover)
Mean (trimmed) annual compliance costs
Up to $39,999 $1,147 (6)
$1,745 (101)
$1,173 (48)
$40,000 to $99,999 $1,100 (10)
$1,634 (159)
$1,185 (75)
$100,000 to $1,299,999 $2,788 (40)
$2,146 (685)
$1,824 (120)
$1.3 million + $2,768 (36)
$2,420 (228)
$1,083 (3)
All $2,253 (92)
$1,993 (1174)
$1,449 (246)
Base: All respondents who file GST (Q1) excluding missing information and outliers Source: Long questionnaire Q13b, Q14 and Q20; IRD database information on GST filing frequency ^ Businesses filing ‘6 monthly’ are required to have a turnover of less than $250k. Possible explanations as to why these 3 businesses with turnover in excess of $1.3 million have 6 monthly filing frequencies are:
• change in circumstance • questionnaire timing • respondent inaccuracies

FINAL REPORT PAGE 68
colmar brunton
Whether business would still use computerised accounting software if New Zealand was tax-free Respondents who use computerised accounting software (in-house) for GST were asked to imagine that New Zealand was tax-free, and if it were whether they would still use computerised accounting software. They were asked to assume that the costs of buying and updating the software remain as they are now. The distribution of response to this question is provided in Table 5.40. With the vast majority (84%) indicating that they would ‘definitely’ or ‘probably’ still use computerised accounting software if New Zealand was tax-free, the software appears to be an important management information tool for businesses and clearly serves purposes beyond those related to tax. This is particularly the case for larger businesses (small and medium-sized businesses). Table 5.40: Whether business would still use computerised accounting software if New Zealand was tax-free
Business size (number of employees)
Nil employees Micro (1-5) Small (6-19) Medium (20+)
All
(177) %
(350) %
(198) %
(98) %
(826) %
Definitely yes 54 53 72 76 58
Probably yes 24 32 18 13 26
Unsure 5 5 4 2 5
Probably not 10 7 3 5 7
Definitely not 5 2 3 4 4
Missing information
2 1 1 - 1
Total 100% 100% 100% 100% 100% Base: All respondents who use computerised accounting software (in-house) (at Q6) Source: Long questionnaire Q4 and Q7
Stress associated with GST compliance Respondents were asked to indicate how stressful they found meeting requirements for GST, including finding the money. A seven point scale was used (as described in Table 5.41). Reported levels of stress associated with GST are wide-ranging. Under half (41%) find GST requirements less than moderately stressful (rating of 1 to 3), around one in five (22%) find them moderately stressful, and just over one-third (35%) find them more than moderately stressful (rating of 5 to 7). The pattern by business size is not as clear as was apparent in regard to provisional tax. However, as the data in the table below shows, businesses with no employees report significantly lower levels of stress in meeting GST requirements than micro or small businesses.

FINAL REPORT PAGE 69
colmar brunton
Table 5.41: Stress associated with GST compliance Level of reported stress Business size (number of employees) All
Nil employees Micro (1-5) Small (6-19) Medium (20+)
(560) %
(759) %
(289) %
(116) %
(1734) %
1 (not all stressful) 12 8 10 9 11
2 13 13 13 18 13
3 18 18 13 16 17
4 (moderately stressful) 21 24 20 15 22
5 17 15 21 16 16
6 11 13 11 20 12
7 (extremely stressful) 5 8 10 6 7
Missing information 1 1 2 - 1
Mean score 3.7 4.0 4.0 3.9 3.8 Base: All respondents who file GST (Q1); excludes those who indicated Q24 was not applicable. Source: Long questionnaire Q4 and Q24
Table 5.42 illustrates that newer businesses (two years or less) report significantly higher levels of stress in dealing with GST than more established businesses (10 years and over). This pattern is not consistent within the business size groupings. Table 5.42: Stress associated with GST compliance – mean scores by business size (number of employees) by age of business
Business size (number of employees) Age of business
Nil employees Micro (1-5) Small (6-19) Medium (20+)
All
Mean stress score
Less than 12 months 3.6 (21)
4.5 (17)
4.1 (6)
6.0 (2)
4.0 (46)
1-2 years 4.3 (75)
3.6 (78)
4.6 (27)
4.4 (7)
4.1 (189)
3-5 years 3.6 (125)
4.2 (144)
4.6 (38)
4.5 (14)
3.9 (321)
6-10 years 3.9 (90)
3.9 (141)
3.7 (52)
4.8 (20)
3.9 (305)
10 years+ 3.5 (240)
4.0 (369)
3.9 (158)
3.4 (72)
3.7 (844)
All SMEs 3.7 (560)
4.0 (759)
4.0 (289)
3.9 (116)
3.8 (1734)
Base: All respondents who file GST (Q1); excludes those who indicated Q24 was not applicable. Source: Long questionnaire Q4, Q22 and Q24

FINAL REPORT PAGE 70
colmar brunton
Table 5.43 shows that the type of GST accounting system does not have a significant bearing on the reported level of stress in dealing with GST. Table 5.43: Stress associated with GST compliance – mean scores by business size (number of employees) by accounting system
Business size (number of employees) GST accounting system
Nil employees Micro (1-5) Small (6-19) Medium (20+)
All
Mean stress score
Manual/paper-based 3.8 (257)
4.0 (259)
3.9 (55)
5.0 (7)
3.8 (582)
Computerised accounting software (in-house)
3.8 (175)
3.9 (347)
4.0 (198)
4.0 (98)
3.9 (821)
Other computing used in-house
3.8 (95)
4.2 (99)
4.4 (17)
3.5 (9)
3.9 (223)
External 3.8 (71)
4.2 (114)
4.2 (45)
4.1 (11)
4.0 (242)
Base: All respondents who file GST (Q1); excludes those who indicated Q6 and/or Q24 were not applicable. Source: Long questionnaire Q4, Q6 and Q24
As shown in Table 5.44, there is no evidence that reported levels of stress in dealing with GST vary significantly according to the frequency of filing GST. Table 5.44: Stress associated with GST compliance – mean scores by business size (number of employees) by accounting system
Business size (number of employees) Filing frequency
Nil employees Micro (1-5) Small (6-19) Medium (20+)
All
Mean stress score
2-monthly
3.7 (346)
4.0 (612)
3.9 (254)
4.0 (89)
3.9 (1320)
6-monthly
3.7 (170)
4.1 (96)
5.2 (12)
4.3 (3)
3.9 (282)
Base: All respondents who file GST (Q1); excludes those who indicated Q6 and/or Q24 were not applicable. Source: Long questionnaire Q4 and Q24, IRD database information on filing frequency.

FINAL REPORT PAGE 71
colmar brunton
Table 5.45 assesses levels of reported stress with GST compliance in light of who answered the question. Owners/partners and managers along with clerks and unpaid friends or family members report significantly higher levels of stress associated with meeting GST requirements than internal accountants/lawyers. Table 5.45: Stress associated with GST tax compliance
Person who answered question Level of reported stress Owner/
partner/ director/ trustee
Manager Internal accounta
nt or lawyer
External accountant or tax advisor
Clerk or IT staff
Unpaid friend or family
member
Other
All
(1373) %
(164) %
(92) %
(56) %
(135) %
(43) %
(4) %
(1734) %
1 (not all stressful)
10 8 15 17 11 20 - 11
2 13 13 15 17 17 9 - 13
3 18 20 27 16 10 12 - 17
4 (moderately stressful)
22 21 17 21 25 15 27 22
5 17 14 10 15 19 18 - 16
6 12 15 5 9 10 15 45 12
7 (extremely stressful)
7 9 10 6 8 11 27 7
Missing information
* - - - 1 - - 1
Mean score 3.9 4.0 3.5 3.5 3.9 3.9 5.7 3.8 Base: All respondents who file GST (Q1); excludes those who indicated Q24 was not applicable. Source: Long questionnaire Q24 and Q28

FINAL REPORT PAGE 72
colmar brunton
PAYE This section reports on the internal tax compliance costs associated with PAYE. The following table summarises the PAYE compliance costs for all businesses. On average, businesses spend 27.5 hours per year on PAYE compliance. In dollar terms, this equates to $937. The majority of these costs are the result of time spent by owners/partners/directors/trustees. Table 5.46: Summary of internal PAYE compliance costs Personnel Mean (trimmed)
time – annual hours
Mean (trimmed) compliance cost –
annual $
Mean compliance cost expressed as
a % of mean compliance cost of
all personnel
Hours $ %* Owners/ partners /directors /trustees 15.8
(1178) $704
(1179) 75.1%
Paid employees 8.8 (1186)
$200 (1191)
21.3%
Unpaid friends or relatives 0.8 (1198)
$21 (1198)
2.2%
All personnel 27.5 (1157)
$937 (1155)
100%
Base: All respondents who file PAYE (Q1) excluding missing information and outliers Source: Long questionnaire Q13b and Q14 *The percentages in this column do not add to 100% because the mean compliance costs each have slightly different bases due to the process of trimming outliers.
In the remainder of this section on PAYE, a number of the tables present an analysis by business size (defined in terms of the number of employees). The reader will note that there is a category for those with ‘nil employees’. Respondents were asked how many employees they had at the end of ‘last month’18. Thus, respondents in the ‘nil employees’ category can be regarded as not currently employing staff, but having done so in the last 12 months (as they indicated at Question 1 that they had paid/filed PAYE in the last 12 months).
18 Due to some businesses experiencing marked variability in employee numbers over a year, respondents were asked to estimate the number of employees they had at a particular point in time.

FINAL REPORT PAGE 73
colmar brunton
The following two tables show that the time businesses spend on PAYE (and the corresponding tax compliance costs) increase as business size increases. Not unexpectedly, in larger businesses, proportionately more time is spent on PAYE compliance by paid employees than owners/partners, compared to smaller businesses, (67% for medium SMEs compared to 25% for Micro). Table 5.47: Internal time spent by personnel on PAYE (annual hours) by business size (number of employees)
Business size (number of employees) Personnel
Nil employees Micro (1-5) Small (6-19) Medium (20+)
All
Mean (trimmed) annual number of hours
Owners/partners/directors/trustees 8.8 (166)
17.7 (641)
20.1 (260)
14.3 (106)
15.8 (1179)
Paid employees 1.8 (168)
6.5 (644)
18.0 (270)
34.6 (106)
8.8 (1191)
Unpaid friends or relatives 0.8 (167)
0.7 (646)
1.3 (271)
0.4 (108)
0.8 (1198)
All personnel 13.2 (163)
26.1 (626)
45.2 (259)
51.9 (101)
27.5 (1155)
Base: All respondents who file PAYE (Q1) excluding missing information and outliers Source: Long questionnaire Q4 and Q13b
Table 5.48: Mean internal compliance costs of PAYE by business size (number of employees)
Business size (number of employees) Personnel
Nil employees Micro (1-5) Small (6-19) Medium (20+)
All
Mean (trimmed) annual compliance costs
Owners/partners/directors/trustees $338 (166)
$791 (641)
$906 (260)
$627 (106)
$704 (1179)
Paid employees $37 (168)
$138 (644)
$412 (270)
$855 (104)
$200 (1191)
Unpaid friends or relatives $20 (167)
$19 (646)
$34 (271)
$9 (108)
$21 (1198)
All personnel $436 (163)
$959 (626)
$1,442 (259)
$1,404 (101)
$937 (1155)
Base: All respondents who file PAYE (Q1) excluding missing information and outliers Source: Long questionnaire Q4, Q13b and Q14

FINAL REPORT PAGE 74
colmar brunton
Table 5.49 shows the mean compliance costs per employee. Larger employers enjoy markedly lower compliance costs per employee than smaller employers. Table 5.49: Mean internal compliance costs of PAYE per employee Business size (number of employees) Overall mean (trimmed)
compliance cost Mean compliance cost per employee*
Nil employees $436 (163)
N/A
Micro (1-5) $959 (626)
$520
Small (6-19) $1,442 (259)
$166
Medium (20+) $1,404 (101)
$43
Base: All respondents who file PAYE (Q1) excluding missing information and outliers Source: Long questionnaire Q4, Q13b and Q14 *These calculations have been conducted at an individual level, ie by using the respondent’s answer at Q4.
Likewise, as Table 5.50 illustrates, mean compliance costs as a proportion of turnover diminish as business size increases. Table 5.50: Mean internal compliance costs of PAYE as a percent of turnover Turnover Mean (trimmed) compliance
costs Mean compliance costs as a
percent of turnover*
Up to $19,999 (mean in range = $11,013)
$298 (18)
2.7%
$20,000 – $39,999 (mean in range = $29,461)
$472 (40)
1.6%
$40,000 – $99,999 (mean in range = $65,508)
$577 (119)
0.9%
$100,000 – $249,999 (mean in range = $160,580)
$810 (255)
0.5%
$250,000 – $499,999 (mean in range = $353,613)
$1,156 (222)
0.3%
$500,000 - $1,299,999 (mean in range = $788,472)
$1,226 (238)
0.2%
$1.3 million+ (mean in range = $3,672,309)
$1,221 (262)
0.0%
Base: All respondents who file PAYE (Q1) excluding missing information and outliers. *The mean turnover values used to calculate these figures were provided by Inland Revenue and based on population characteristics.
Source: Long questionnaire Q13b, Q14 and Q20
Method used to process staff wages Employers were asked how their business processes staff wages. The results are presented in Table 5.51. More than half (61%) use a manual system for processing staff wages. This is considerably more common among micro businesses (73%), less common among small businesses (36%) and virtually non existent among medium businesses (3%). In contrast, the larger the business, the greater the use of computerised payroll or accounting software (eg 88% of medium businesses). One quarter (27%) of all SMEs overall use computerised payroll or accounting software with a further 11% using some other

FINAL REPORT PAGE 75
colmar brunton
computing system to process staff wages. Overall, only 5% of SMEs employing staff use an external process for managing staff wages19. Table 5.51: Method used in processing staff wages by business size (number of employees) Business size (number of employees)
Nil employees Micro (1-5) Small (6-19) Medium (20+)
All
(27) %
(713) %
(290) %
(116) %
(1153) %
Manual/Paper - based 77 73 36 3 61
Computerised payroll or accounting software (in-house)
3 15 49 88 27
Other computing used in-house
19 11 9 7 11
External - 4 10 8 5
Not answered - 3 1 - 2 Base: All respondents who file PAYE (Q1); excluding those who indicated Q5 was not applicable. Source: Long questionnaire Q4 and Q5 Percentages do not add to 100% because respondents could select more than one category.
Table 5.52 shows that the mean compliance costs of businesses with computerised payroll systems tend to be higher than those with manual systems. However, this is clearly a function of the former having more employees than the latter. The differences between compliance costs of PAYE within business size groupings are not significantly different and generally follow the ‘larger the SME the larger the PAYE compliance cost’ pattern. Table 5.52: Mean internal compliance costs of PAYE analysed by method used to process staff wages and business size (number of employees)
Business size (number of employees) Accounting system
Nil employees Micro (1-5) Small (6-19) Medium (20+)
All
Mean (trimmed) annual compliance costs
Manual $619 (21)
$932 (450)
$1,511 (91)
$2,716 (4)
$994 (569)
Computerised payroll or accounting software (in-house)
$366 (1)
$901 (112)
$1,402 (142)
$1,431 (91)
$1,207 (349)
Other computing used in-house
$867 (4)
$1,223 (72)
$1,748 (29)
$948 (7)
$1,270 (105)
External $0 (0)
$1,438 (19)
$2,079 (17)
$1,245 (7)
$1,697 (43)
All SMEs $436 (163)
$959 (626)
$1142 (259)
$1404 (101)
$937 (1155)
Base: All respondents who file PAYE (Q1) excluding missing information and outliers Source: Long questionnaire Q4, Q13b, and Q14
19 Note this result is in relation to Q5. The figure is different to the results presented in Chapter 7 on Payroll Services which relate to Q12a.

FINAL REPORT PAGE 76
colmar brunton
Filing method Likewise, as Table 5.53 illustrates, whilst businesses that file PAYE electronically have higher mean compliance costs than those who file PAYE on a manual basis, this appears to be largely a function of the number of employees rather than filing method, ie electronic filers are more likely to have a greater number of employees20. Table 5.53: Mean internal compliance costs of PAYE analysed by business size (number of employees) and filing method
Business size (number of employees) Filing method
Nil employees Micro (1-5) Small (6-19) Medium (20+)
All
Mean (trimmed) annual compliance costs
Electronic $305
(9)
$1,209
(38)
$1,141
(65)
$1,436
(73)
$1,227
(181)
Manual $636
(114)
$919
(556)
$1,550
(187)
$1,772
(20)
$1,003
(867) Base: All respondents who file PAYE (Q1) excluding missing information and outliers Source: Long questionnaire Q4, Q13b, and Q14; IRD database information on filing method
20 33% of electronic filers are medium-sized SMEs (compared to 2% of manual filers), 30% are small (compared to 16% of manual filers), 33% are micro (compared to 69% of manual filers) and 5% currently have no employees (compared to 13% of manual filers).

FINAL REPORT PAGE 77
colmar brunton
Stress associated with PAYE compliance Respondents were asked to indicate how stressful they found meeting requirements for PAYE, including finding the money. The results are presented in Table 5.54. Lower levels of stress are reported in relation to PAYE than other tax types (with the exception of FBT). Over half (58%) find PAYE requirements less than moderately stressful (rating of 1 to 3), around one in five (19%) find them moderately stressful, and a similar proportion (21%) find them more than moderately stressful (rating of 5 to 7). Medium-sized businesses report slightly higher levels of stress in dealing with PAYE than micro-sized businesses. Table 5.54: Stress associated with PAYE compliance Level of reported stress
Business size (number of employees)
Nil employees Micro (1-5) Small (6-19) Medium (20+)
All
(143) %
(707) %
(288) %
(116) %
(1261) %
1 (not all stressful)
24 17 12 14 17
2 13 22 23 21 21
3 9 23 19 18 20
4 (moderately stressful)
23 18 20 16 19
5 8 7 12 8 8
6 7 7 9 21 8
7 (extremely stressful)
7 5 3 1 5
Missing information
4 1 2 - 1
Mean score 3.3 3.2 3.4 3.5 3.2 Base: All respondents who file PAYE (Q1); excludes those who indicated Q26 was not applicable. Source: Long questionnaire Q4 and Q26

FINAL REPORT PAGE 78
colmar brunton
The age of a business does not have a significant bearing on the reported level of stress in complying with PAYE (see Table 5.55), except that those operating less than 12 months may perhaps report more stress (note, however, that the sample size of this subgroup is very small). Table 5.55: Stress associated with PAYE compliance – mean scores by business size (number of employees) and age of business
Business size (number of employees)
Nil employees Micro (1-5) Small (6-19) Medium (20+)
All Age of business
Mean stress score
Less than 12 months 4.0 (1)
3.6 (16)
3.4 (6)
5.8 (2)
3.7 (25)
1-2 years 3.4 (19)
3.0 (71)
3.9 (27)
3.8 (7)
3.3 (126)
3-5 years 2.8 (33)
3.2 (134)
3.8 (39)
4.3 (14)
3.3 (220)
6-10 years 3.7 (19)
3.1 (130)
2.8 (51)
4.4 (20)
3.2 (221)
10 years + 3.4 (68)
3.2 (346)
3.4 (157)
2.9 (72)
3.2 (647)
All 3.3 (143)
3.2 (707)
3.4 (288)
3.5 (116)
3.2 (1261)
Base: All respondents who file PAYE (Q1); excludes those who indicated Q26 was not applicable. Source: Long questionnaire Q4, Q22 and Q26
As illustrated in Table 5.56, the accounting system that a business uses to process staff wages does not have a significant bearing on reported levels of stress in dealing with PAYE. Table 5.56: Stress associated with PAYE compliance – mean scores by business size (number of employees) by accounting system
Business size (number of employees)
Nil employees Micro (1-5) Small (6-19) Medium (20+)
All Accounting system
Mean stress score
Manual 3.4 (19)
3.2 (505)
3.2 (47)
2.7 (5)
3.2 (629)
Computerised payroll or accounting software (in-house)
5.0 (1)
3.0 (124)
3.4 (158)
3.5 (103)
3.3 (389)
Other computing used in-house
3.7 (5)
3.4 (76)
3.7 (25)
4.1 (7)
3.5 (114)
External - (-)
3.2 (30)
3.7 (21)
3.1 (10)
3.4 (61)
Base: All respondents who file PAYE (Q1); excludes those who indicated Q5 and/orQ26 were not applicable. Source: Long questionnaire Q4, Q5 and Q26

FINAL REPORT PAGE 79
colmar brunton
Table 5.57 illustrates that there are no significant differences in levels of stress associated with GST between those who file electronically and those who file manually. Table 5.57: Stress associated with PAYE compliance – mean scores by business size (number of employees) by filing method
Business size (number of employees)
Nil employees Micro (1-5) Small (6-19) Medium (20+)
All Filing method
Mean stress score
Electronic
6.4 (2)
3.2 (45)
3.2 (72)
3.6 (82)
3.4 (201)
Manual
3.2 (22)
3.1 (637)
3.5 (206)
4.1 (23)
3.2 (896)
Base: All respondents who file PAYE (Q1); excludes those who indicated Q5 and/orQ26 were not applicable. Source: Long questionnaire Q4 and Q26 and IRD database information on filing method
Table 5.58 assesses levels of reported stress with PAYE compliance in the context of who answered the question. There is little variation in reported levels of stress with PAYE compliance by who answered the question. Owners/partners and internal accountants/lawyers report significantly higher levels of stress associated with meeting PAYE requirements than clerks or IT staff. Table 5.58: Stress associated with PAYE compliance
Person who answered question Level of reported stress Owner/
partner/ director/ trustee
Manager Internal accounta
nt or lawyer
External accountant or tax advisor
Clerk or IT staff
Unpaid friend or family
member
Other
All
(954) %
(146) %
(85) %
(34) %
(129) %
(25) %
(4) %
(1261) %
1 (not all stressful)
17 17 16 15 19 34 - 17
2 20 24 23 18 26 26 - 21
3 20 16 9 25 26 3 27 20
4 (moderately stressful)
20 23 16 19 15 14 73 19
5 8 7 11 13 7 3 - 8
6 8 8 20 9 8 11 - 8
7 (extremely stressful)
6 6 4 2 1 9 - 5
Missing information
1 - - - 1 - - 1
Mean score 3.3 3.3 3.6 3.3 2.9 2.9 3.7 3.2 Base: All respondents who file PAYE (Q1); excludes those who indicated Q26 was not applicable. Source: Long questionnaire Q26 and Q28

FINAL REPORT PAGE 80
colmar brunton
FBT This section reports on the internal tax compliance costs associated with FBT. The respondents that are the subject of the analysis in this section indicated that they had filed at least one return requiring payment within the last 12 months. Respondents who had only filed nil returns have been excluded from the analysis. On average, employers who pay FBT spend 12.8 hours per year within the business on FBT compliance. This equates to $416 in dollar terms. Table 5.59: Summary of internal FBT compliance costs Personnel Mean (trimmed)
time – annual hours
Mean (trimmed) compliance cost –
annual $
Mean compliance cost expressed as
a % of mean compliance cost of
all personnel
Hours $ %* Owners/ partners /directors /trustees 6.8
(308) $299 (308)
71.9%
Paid employees 6.4 (310)
$133 (310)
32.0%
Unpaid friends or relatives 0.0 (309)
$0 (309)
0%
All personnel 12.8 (316)
$416 (316)
100%
Base: All respondents who have made an FBT payment in last 12 months (Q1) excluding missing information and outliers. Note, base does not include those who have made a nil return for FBT in the last 12 months unless they have also made an FBT payment.
Source: Long questionnaire Q13b and Q14 *The percentages in this column do not add to 100% because the mean compliance costs each have slightly different bases due to the process of trimming outliers.
Table 5.60 shows that there is very little difference in the mean compliance costs incurred by micro, small, and medium-sized businesses. However, business size plays a part in terms of who within the business spends time on FBT. Paid employees in larger SMEs spend proportionately more time on FBT than paid employees in smaller businesses. Note that unpaid friends or relatives do not feature in assisting in FBT compliance. Table 5.60: Mean internal compliance costs of FBT by business size (number of employees)
Business size (number of employees) Personnel
Nil employees Micro (1-5) Small (6-19) Medium (20+)
All
Mean (trimmed) annual compliance costs
Owners/partners/directors/trustees $279 (38)
$393 (94)
$280 (108)
$166 (68)
$299 (308)
Paid employees $7 (39)
$85 (94)
$203 (110)
$304 (67)
$133 (310)
Unpaid friends or relatives $0 (39)
$0 (93)
$0 (109)
$0 (68)
$0 (309)
All personnel $258 (41)
$467 (99)
$466 (111)
$483 (65)
$416 (316)
Base: All respondents who have made an FBT payment in last 12 months (Q1) excluding missing information and outliers. Source: Long questionnaire Q4, Q13b and Q14

FINAL REPORT PAGE 81
colmar brunton
Again, the familiar pattern of diminishing compliance costs as a percentage of turnover is evident in relation to FBT. Table 5.61: Mean internal compliance costs of FBT as a percent of turnover Turnover Mean (trimmed) compliance
costs Mean compliance costs as a
percent of turnover*
Up to $19,999 (mean in range = $11,013) $1.015 (1)
9.2%
$20,000 – $39,999 (mean in range = $29,461)
$181 (2)
0.6%
$40,000 – $99,999 (mean in range = $65,508) $272 (13)
0.4%
$100,000 – $249,999 (mean range = $160,580)
$407 (39)
0.3%
$250,000 – $499,999 (mean in range = $353,613)
$396 (36)
0.1%
$500,000 - $1,299,999 (mean in range = $788,472)
$437 (72)
0.0%
$1.3 million+ (mean in range = $3,672,309) $452 (153)
0.0%
Base: All respondents who have made an FBT payment in last 12 months (Q1) excluding missing information and outliers. *The mean turnover values used to calculate these figures were provided by Inland Revenue and based on population characteristics.
Source: Long questionnaire Q13b, Q14 and Q20

FINAL REPORT PAGE 82
colmar brunton
Stress associated with FBT compliance Respondents were asked to indicate how stressful they found meeting requirements for FBT, including finding the money. Lower levels of stress are reported in relation to FBT than GST or income tax. Over half (60%) find FBT requirements less than moderately stressful (rating of 1 to 3), less than one in five (17%) find them moderately stressful, and around one in five (21%) find them more than moderately stressful (rating of 5 to 7). There is no significant variation in stress levels by business size (in terms of number of employees). Table 5.62: Stress associated with FBT compliance
Business size (number of employees) Level of reported stress
Nil employees Micro (1-5) Small (6-19) Medium (20+)
All
(42) %
(107) %
(116) %
(69) %
(334) %
1 (not all stressful) 29 15 12 19 18
2 15 21 26 15 20
3 21 29 14 20 22
4 (moderately stressful) 17 15 23 16 17
5 12 11 13 17 12
6 - 4 7 5 4
7 (extremely stressful) 3 5 6 8 5
Missing information 3 1 1 - 1
Mean score 2.8 3.2 3.4 3.4 3.2 Base: All respondents who have made an FBT payment in last 12 months (Q1); excludes those who have made an FBT nil return
only and those who answered ‘not applicable’ at Q27 Source: Q4 and Q27

FINAL REPORT PAGE 83
colmar brunton
Likewise, who answered the question is not a determinant of reported levels of stress in dealing with FBT (see Table 5.63). Table 5.63: Stress associated with FBT compliance
Person who answered question Level of reported stress Owner/
partner/ director/ trustee
Manager Internal accountant or lawyer
External accountan
t or tax advisor
Clerk or IT staff
Unpaid friend or family
member
All
(219) %
(55) %
(44) %
(7) %
(44) %
(3) %
(334) %
1 (not all stressful) 19 15 7 13 17 31 18
2 18 31 25 42 20 69 20
3 25 16 21 6 8 - 22
4 (moderately stressful)
16 16 20 16 32 - 17
5 14 8 20 - 13 - 12
6 3 9 5 23 8 - 4
7 (extremely stressful)
6 1 1 - 3 - 5
Missing information * 4 - - - - 1
Mean score 3.2 3.0 3.4 3.2 3.4 1.7 3.2 Base: All respondents who have made an FBT payment in last 12 months (Q1); excludes those who have made an FBT nil return
only and those who answered ‘Not applicable’ at Q27 Source: Q27 and Q28

FINAL REPORT PAGE 84
colmar brunton
6. External tax advisor costs
This chapter reports on external tax compliance costs, ie payments made for tax services from advisors such as external tax accountants, tax advisors or lawyers.
Use of, and payment for, external tax advisor services – business survey data Table 6.1 gives the proportion of businesses that paid for any tax advisors in the last 12 months from an advisor outside the business with a breakdown of tax types to which the payments relate. The reader should note that the percentages are calculated using a base of SMEs that file the particular tax type in question. The table also gives the mean tax-related payments made for external tax advice. The information in this section is provided by SME respondents. Eighty percent of businesses pay for external tax services. Businesses with no employees are less likely to pay for external tax services relating to income tax and more likely for FBT. Medium GST-registered businesses are less likely to pay for external tax services regarding GST compared to other GST-registered businesses. Likewise, medium-sized-employers are less likely to pay for external services regarding PAYE than smaller employers. The mean annual tax related payment is $1465. This calculation (along with the other mean calculations in this table) is based only on businesses that pay for external tax services. Those who do not pay for these services have been excluded from the calculations. Mean payment increases with business size with the exception of medium-sized businesses. Table 6.1: Use of, and payment for, external tax advisor services (business survey data)
Business size (number of employees) Tax type
Nil employees %
Micro (1-5) %
Small (6-19) %
Medium (20+) %
All
%
GST* 44 (254 of 568)^
46 (354 of 763)^
49 (122 of 290)^
35 (42 of 116)^
45 (772 of 1747)^
Income tax* 50 (432 of 699)^
81 (620 of 749)^
76 (218 of 282)^
75 (93 of 115)^
61 (1367 of 1854)^
FBT* 63 (28 of 45)^
48 (35 of 109)^
49 (48 of 119)^
44 (26 of 70)^
51 (157 of 343)^
PAYE* 29 (58 of 193)^
30 (220 of 720)^
29 (69 of 290)^
15 (16 of 116)^
29 (364 of 1326) ^
Any tax related services** 77 (587 of 724)^
87 (671 of 767)^
86 (252 of 290)^
84 (100 of 116)^
80 (1616 of 1907)^
Mean (trimmed) tax related payment to external tax advisors***
$1150 (483)
$1835 (521)
$2499 (173)
$2424 (60)
$1465 (1241)
Bases: * Respondents who file the particular tax type (Q1); ** All respondents
*** Mean tax payment calculations only include businesses that confirmed at Q10a (long questionnaire) or Q4 (short questionnaire) that the dollar value they gave related only to tax-related activities. Of the 1611 respondents that gave a dollar value, 1288 indicated that the amount only covered tax-related activities. The amount of 1288 differs from the total sample size of 1241 in the above table because of the trimming process that removed outliers. Source: Long questionnaire Q10a and 10b; Short questionnaire Q4 ^The numbers in brackets use unweighted data (ie the actual number of respondents) whereas the % is a weighted value.

FINAL REPORT PAGE 85
colmar brunton
Tax advisor sub-survey results A tax advisor sub-survey was conducted to gather information in order to apportion external tax advisor compliance costs to different tax types. A profile of the tax advisor sub-sample survey is given below with a comparison from the business survey. The business survey data is only based on businesses that use external tax services. Table 6.2: Profile of tax advisor sub-survey sample Advisor sample* Business sample (long
questionnaire)**
Number % Number %
Entity type Company Individual Partnership Trust
148 46 66 15
54 17 24 5
548 301 332 77
44 24 26 6
Tax type GST Income tax PAYE FBT
275 269 206 55
100 98 75 20
1254 1231 721 125
100 98 57 10
Business size (number of employees) Nil employees Micro (1-5) Small (6-19) Medium (20+)
87 126 42 18
32 46 15 7
638 465 110 41
51 37 9 3
All 275 100 1544 100 Base: *All in Advisor sub-survey; **All SMEs in long questionnaire that pay for external tax services. Source: Long questionnaire Q1, Q4, IRD database information on entity type, + Advisor sub-survey Q5 The tax advisor sub-survey over represents companies, those who pay PAYE and micro SMEs, and under represents those with no employees.

FINAL REPORT PAGE 86
colmar brunton
Table 6.3 presents the results from the Advisor sub-survey. Note, more complete and reliable estimates of external compliance costs which incorporate business survey data follow shortly. As the SME size increases the proportion of non-tax related tax advisor fees increases. Table 6.3: Payment made for external tax services – results from Advisor sub-survey
Business size (employee numbers) Tax type
Nil employees Micro (1-5) Small (6-19) Medium (20+)
All
Mean (trimmed) payment to tax advisors (Q1)*
$1,363 (87)
$2,533 (126)
$4,510 (42)
$9,139 (18)
$2,362 (275)
Mean (trimmed) tax related payment to external tax advisors (Q4)*
$1,228 (87)
$1,829 (126)
$3,150 (42)
$5,393 (17)
$1,772 (274)
Mean (trimmed) tax related payment by tax type (Q5)** GST Income tax PAYE etc FBT Other
$460 (47)
$1,011 (84) $166 (7)
$138 (9)
$425 (2)
$677 (67)
$1,409 (125) $204 (27) $196 (16) $133 (12)
$889 (25)
$2,342 (41) $562 (13) $241 (14) $508 (10)
$2,376 (10)
$3,080 (18) $975 (2)
$1,311 (3)
$724 (3)
$679 (149)
$1,355 (270) $280 (42) $226 (51) $364 (27)
Base: *All in Advisor sub-survey; **All non-zero payments for the particular tax type Source: Advisor sub-survey Q1, Q4, and Q5. Business size has been sourced from the business questionnaire – Long questionnaire Q4.
External compliance costs by tax type Advisor responses tend to be somewhat higher than business survey results. One reason for discrepancies is the mismatch between tax advisor and business views over the extent to which work on annual accounts is tax related (see Table 6.12 later). Table 6.4 and Table 6.5 present external compliance costs by tax type and business size. Imputed data has been used to produce these results (see section on ‘Research Methodology’ for details of the data imputation process). The amounts under each tax type relate to the average payment made for external advice in regard to that tax type among businesses that file that tax type whether or not they pay for external advice . Note, those who do not pay for external tax services relating to that tax type have been allocated a zero value and included in the calculation. The final column is based on all businesses and gives the average payment made for tax services relating to any tax type according to business size. Again, businesses that do not pay for external tax services have been allocated a zero value in the calculation. On average, businesses pay $1022 for external tax services. The mean payment made for any external tax services increases with business size (see last column). This trend is the result of increasing payments for external services in relation to income tax and GST.

FINAL REPORT PAGE 87
colmar brunton
Table 6.4: External mean compliance costs by tax type and business size (number of employees)
Tax type* All^ Business size (number of employees) Mean (trimmed) external annual compliance costs
GST Income tax PAYE FBT
Nil employees $164 (536)
$714 (623)
$28 (185)
$67 (40)
$808
Micro (1-5) $211 (709)
$1,133 (635)
$30 (685)
$65 (103)
$1,350
Small (6-19) $275 (258)
$1,315 (213)
$40 (272)
$46 (105)
$1,590
Medium (20+) $214 (105)
$1,488 (82)
$28 (114)
$60 (64)
$1,751
All $190 (1618)
$879 (1561)
$31 (1263)
$61 (312)
$1,022
Base: *Utilises imputed data, business survey data and tax advisor data. Base is all businesses who file the particular tax type at Q1 Source: Long questionnaire Q4, Q10a, Q10b, Q10d; Short questionnaire Q4; Advisor sub-survey Q5. ^This figures in this column have been calculated by taking the sum of the external costs for each tax type that are shown in Table 9.4 (as the costs in Table 9.4 are based on all businesses).
Table 6.5: External mean compliance costs by tax type and business size (turnover)
Tax type* All^ Turnover
Mean (trimmed) external annual compliance costs
GST Income tax PAYE FBT
Up to $19,999 $164 (64)
$494 (80)
$21 (24)
$0 (1)
$550
$20,000 – $39,999 $102 (108)
$398 (138)
$18 (44)
$104 (4)
$452
$40,000 – $99,999 $145 (266)
$661 (278)
$25 (135)
$64 (14)
$764
$100,000 – $249,999 $200 (383)
$994 (361)
$26 (280)
$50 (39)
$1,161
$250,000 – $499,999 $235 (266)
$1,264 (257)
$32 (240)
$58 (39)
$1,464
$500,000 - $1,299,999 $285 (261)
$1,494 (225)
$33 (258)
$75 (69)
$1,788
$1.3 million+ $257 (266)
$1,618 (217)
$50 (280)
$56 (146)
$1,938
All SMEs $190 (1618)
$879 (1561)
$31 (1263)
$61 (312)
$1,022
Base: *Utilises imputed data, business survey data and tax advisor data. Base is all businesses who file the particular tax type at Q1 Source: Long questionnaire Q10a, Q10b, Q10d, Q20; Short questionnaire Q4; Advisor sub-survey Q5. ^This figures in this column have been calculated by taking the sum of the external costs for each tax type that are shown in Table 9.5 (as the costs in Table 9.5 are based on all businesses).

FINAL REPORT PAGE 88
colmar brunton
Table 6.6 illustrates that mean external compliance costs decrease as a proportion of turnover. Table 6.6: Mean external compliance costs tax as a percent of turnover Turnover Mean (trimmed) compliance
costs Mean external compliance
costs as a percent of turnover*
Up to $19,999 (mean in range = $11,013)
$550 5.0%
$20,000 – $39,999 (mean in range = $29,461)
$452 1.5%
$40,000 – $99,999 (mean in range = $65,508)
$764 1.2%
$100,000 – $249,999 (mean range = $160,580)
$1,161 0.7%
$250,000 – $499,999 (mean in range = $353,613)
$1,464 0.4%
$500,000 - $1,299,999 (mean in range = $788,472)
$1,788 0.2%
$1.3 million+ (mean in range = $3,672,309)
$1,938 0.1%
Base: All respondents who file/pay income tax (Q1 in long questionnaire) and all respondents of short questionnaire (excluding missing information and outliers). *The mean turnover values used to calculate these figures were provided by Inland Revenue.
Tax advisors were asked to specify how much their client paid for external advice on the choice between provisional tax options (ie the time the tax advisor spent on the preparation of information, discussions, and advice about this choice, plus time calculating provisional tax). Table 6.7 specifies the mean payments made for this across different business size groupings. The average payment overall is $159. Payment increases with business size. Table 6.7: Payment made for external advice on choice between provisional tax options Business size (number of employees)
Sample size Mean amount paid for external advice on choice between provisional tax options (ie the time the tax advisor spent on the preparation of information, discussions, and advice about this
choice, plus time calculating provisional tax)
Nil employees 86 $89
Micro (1-5) 124 $139
Small (6-19) 42 $498
Medium (20+) 18 $501
All SMEs 272 $159 Base: All respondents in long questionnaire for whom we have tax advisor responses Source: Tax advisor questionnaire Q6; long questionnaire Q4

FINAL REPORT PAGE 89
colmar brunton
Whether a business would still pay their external accountant to do their annual accounts if New Zealand was tax-free Businesses that used an external accountant were asked to imagine that New Zealand was tax-free and if it was whether they would still pay their external accountant to do their annual accounts. Results are presented in Table 6.8. Reaction to this proposition is evenly divided: 44% indicate that they would ‘definitely’ or ‘probably’ still pay their accountant to do their annual accounts if New Zealand was tax-free and 45% indicate that they ‘definitely’ or ‘probably’ not do so. Nine percent are unsure. Opinion varies by size of business. Larger businesses (small and medium) appear more definite that they would still use an external accountant. Businesses without any employees are least likely to feel certain that they would still use an external accountant. Table 6.8: Whether a business would still pay their external accountant to do their annual accounts if New Zealand was tax-free – analysed by business size (number of employees) Business size (number of employees)
Nil employees Micro (1-5) Small (6-19) Medium (20+)
All
(566) %
(657) %
(244) %
(95) %
(1568) %
Definitely yes 17 22 34 30 20
Probably yes 23 25 27 25 24
Unsure 9 10 5 8 9
Probably not 24 26 25 19 24
Definitely not 25 15 10 17 21
Missing information 1 1 - 1 1 Base: All respondents who file/pay income tax (Q1 in long questionnaire) and all respondents of short questionnaire; excludes those
who indicated Q11 was not applicable. Source: Long questionnaire Q11; Short questionnaire Q5
Table 6.9 shows that companies and trusts are the more definite about wanting to retain the services of an external accountant to prepare their annual accounts. Conversely, individuals are the most definite about not wanting to retain these services. Table 6.9: Whether a business would still pay their external accountant to do their annual accounts if New Zealand was tax-free – analysed by entity type
Entity type
Company Individual Partnership Trust
All
(844) %
(280) %
(355) %
(87) %
(1568) %
Definitely yes 27 15 18 21 20
Probably yes 24 22 27 33 24
Unsure 8 10 8 10 9
Probably not 26 22 26 23 24
Definitely not 14 30 21 12 21
Missing information 1 2 - - 1 Base: All respondents who file/pay income tax (Q1 in long questionnaire) and all respondents of short questionnaire; excludes those
who indicated Q11 was not applicable. Source: Long questionnaire Q11; Short questionnaire Q5; IRD database information on entity type

FINAL REPORT PAGE 90
colmar brunton
Tax advisors were also asked for their views on whether their client would still pay them to do the business’s annual accounts if New Zealand was tax-free. Their views are presented in Table 6.10. Again consistent with the views of businesses, but more exaggerated, tax advisors believe their larger clients would retain their services and that their smaller clients – especially those with no employees – would not require their services. Table 6.10: Tax advisors’ views on whether a business would still pay their external accountant to do their annual accounts if New Zealand was tax-free – analysed by business size (number of employees) Business size (number of employees)
Nil employees Micro (1-5) Small (6-19) Medium (20+)
All
(85) %
(124) %
(42) %
(18) %
(271) %
Definitely yes 7 14 24 56 16
Probably yes 25 29 48 22 31
Unsure 9 11 5 6 9
Probably not 42 36 19 17 34
Definitely not 16 9 5 - 10
Missing information - 1 - - * Base: All respondents in long questionnaire for whom we have tax advisor responses Source: Tax advisor questionnaire Q2; Long questionnaire Q4
Likewise, tax advisors believe that companies would be most likely to retain their services and that individuals and partnerships would be least likely to retain their services (refer to Table 6.11). Table 6.11: Tax advisors’ views on whether business would still pay their external accountant to do their annual accounts if New Zealand was tax-free – analysed by entity type Entity type
Company Individual Partnership Trust
All
(148) %
(44) %
(64) %
(15) %
(271) %
Definitely yes 24 7 5 13 16
Probably yes 35 20 25 40 31
Unsure 11 9 8 - 9
Probably not 21 52 50 40 34
Definitely not 9 11 12 7 10
Missing information 1 - - - * Base: All respondents in long questionnaire for whom we have tax advisor responses Source: Tax advisor questionnaire Q2; IRD database information on entity type
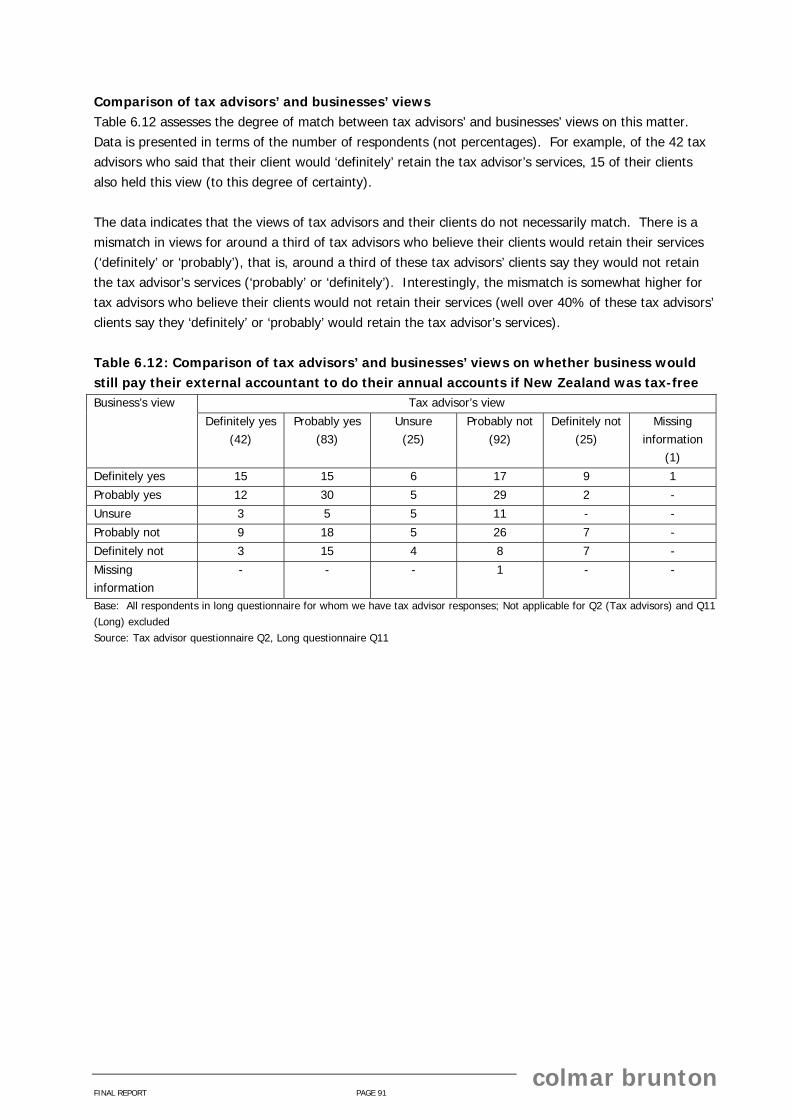
FINAL REPORT PAGE 91
colmar brunton
Comparison of tax advisors’ and businesses’ views Table 6.12 assesses the degree of match between tax advisors’ and businesses’ views on this matter. Data is presented in terms of the number of respondents (not percentages). For example, of the 42 tax advisors who said that their client would ‘definitely’ retain the tax advisor’s services, 15 of their clients also held this view (to this degree of certainty). The data indicates that the views of tax advisors and their clients do not necessarily match. There is a mismatch in views for around a third of tax advisors who believe their clients would retain their services (‘definitely’ or ‘probably’), that is, around a third of these tax advisors’ clients say they would not retain the tax advisor’s services (‘probably’ or ‘definitely’). Interestingly, the mismatch is somewhat higher for tax advisors who believe their clients would not retain their services (well over 40% of these tax advisors’ clients say they ‘definitely’ or ‘probably’ would retain the tax advisor’s services). Table 6.12: Comparison of tax advisors’ and businesses’ views on whether business would still pay their external accountant to do their annual accounts if New Zealand was tax-free
Tax advisor’s view Business’s view
Definitely yes (42)
Probably yes (83)
Unsure (25)
Probably not (92)
Definitely not (25)
Missing information
(1)
Definitely yes 15 15 6 17 9 1
Probably yes 12 30 5 29 2 -
Unsure 3 5 5 11 - -
Probably not 9 18 5 26 7 -
Definitely not 3 15 4 8 7 -
Missing information
- - - 1 - -
Base: All respondents in long questionnaire for whom we have tax advisor responses; Not applicable for Q2 (Tax advisors) and Q11 (Long) excluded Source: Tax advisor questionnaire Q2, Long questionnaire Q11

FINAL REPORT PAGE 92
colmar brunton
7. Payroll services
This chapter examines payroll services. Table 7.1 shows the proportion of businesses that use external payroll services and the mean payment made for these services. Seven percent of all businesses that file PAYE have used external payroll services in the last 12 months. Usage is markedly higher among small businesses and to a lesser extent medium-sized businesses compared to micro-sized businesses. On average, businesses spend $1550 on payroll services annually. No clear pattern by business size is evident due to small sample sizes. Table 7.1: Use of, and payment for, external payroll services
Business size (number of employees)
Nil employees*
Micro (1-5) Small (6-19) Medium (20+)
All
% use external payroll services in last 12 months
1% (6 of 192)^
6% (45 of 720)^
20% (49 of 290)^
13% (19 of 116)^
7% (119 of 1325)^
Mean amount paid for external payroll services
$1,313 (5)
$645 (33)
$2,284 (41)
$2,041 (17)
$1,550 (96)
Base: All SMEs that file/pay PAYE (Q1) Source: Long questionnaire Q12a
* Respondents were asked how many employees they had at the end of ‘last month’21. Thus, respondents in the ‘nil employees’
category can be regarded as not currently employing staff, but having done so in the last 12 months (as they indicated at Question 1 that they had paid/filed PAYE in the last 12 months).
^The numbers in brackets use unweighted data (ie the actual number of respondents) whereas the % is a weighted value.
21 Due to some businesses experiencing marked variability in employee numbers over a year, respondents were asked to estimate the number of employees they had at a particular point in time.

FINAL REPORT PAGE 93
colmar brunton
Respondents who use external payroll services were asked to imagine that if New Zealand was tax-free whether they would still use these services. They were asked to assume that the costs would remain the same. Just over half (56%) indicate that they would ‘definitely’ or ‘probably’ still use external payroll services if New Zealand was tax-free. Analysis by business size is limited due to small sample sizes. Table 7.2: Whether business would still pay for external payroll services if New Zealand became tax-free Business size (number of employees) All
Nil employees (6) %
Micro (1-5) (45) %
Small (6-19) (49) %
Medium (20+) (19) %
(119) %
Definitely yes 8 19 28 33 24
Probably yes 18 31 33 32 32
Unsure - 5 7 32 8
Probably not 45 24 21 3 21
Definitely not 28 19 11 - 14
Missing information - 2 1 - 1 Base: All respondents who file PAYE (Q1) Source: Long questionnaire Q4, Q12b

FINAL REPORT PAGE 94
colmar brunton
8. Audit
This chapter examines SMEs’ experience of tax audits carried out by Inland Revenue in the last 12 months. Costs associated with being audited are reported separately and are not included in the combined compliance cost calculation. There was a concern that a few very large audit-related costs would create extreme values for particular groups of businesses or business types. Also it is not possible to split audit compliance costs across tax types. Inland Revenue administers a risk-based audit programme whereas the results of this survey relate to a random sample. The audit programme is comprised of different types of audit, ranging from single revenue ones to multi-revenue audits, from checks to in-depth investigations. This, plus such factors as the circumstances of the business being audited, determines the time and cost involved in being audited. Information reported in Table 8.1 is the businesses’ self reported estimates of the time and external costs involved in their audits. 3% of the sampled SMEs reported being audited by Inland Revenue in the last 12 months. The incidence of being audited is higher the larger the business (up to 14% for medium-sized businesses). On average, a SME which is audited spends 38.8 hours within the business as a result of the audit. Additionally, a SME who is audited incurs on average $1801 in external costs (for example fees to an external accountant, but excluding any change in tax liability or penalties). Analysis of this data by business size is limited due to small sample sizes. However, there does appear to be a positive correlation between size of business and costs incurred as a result of the audit (both in terms of the number of hours a business spends on audit activities and external costs). However, there is no evidence of any significant variation in costs between small and medium businesses. Table 8.1: Incidence of IRD audit and related time and cost incurred by the business
Business size (number of employees)
Nil employees Micro (1-5) Small (6-19) Medium (20+)
All
% had audit in last 12 months 2% (18 of 724)^
3% (17 of 767)^
8% (21 of 290)^
14% (15 of 116)^
3% (71 of 1907)^
Trimmed mean number of hours within business
12.5 (17)
18.2 (13)
68.5 (18)
77.5 (14)
33.8 (62)
External costs associated with audit (excluding any change in tax liability or penalties)
$947 (17)
$1,969 (12)
$2,853 (17)
$3,130 (11)
$1,801 (57)
Base: All SMEs Source: Long questionnaire Q8; Short questionnaire Q2
^The numbers in brackets use unweighted data (ie the actual number of respondents) whereas the % is a weighted value.

FINAL REPORT PAGE 95
colmar brunton
9. Combined costs This chapter presents a summary of the internal time spent on tax compliance as well as combined compliance costs, that is, costs that combine both internal and external costs.
Summary of internal time Tables 9.1 and 9.2 summarise the internal time spent on tax activities on an annual basis (using mean values). Note, in order to calculate the figures in the last column of these tables – the mean amount of time spent by a business (covering all tax types) – the calculations of hours relating to each individual tax type have used a base of all SMEs rather than those that pay/file a particular tax type. In practice, this means that those who do not file/pay a particular tax type have been allocated a value of zero for that tax type. This is a different approach to that used in the chapter on ‘internal time and costs’. The calculations in that chapter used a base of businesses that pay/file a particular tax type. The average business spends 76.7 hours per year on tax activities. Business size is a clear determinant of time spent on tax activities with the average number of hours being as low as 51.3 hours for businesses without employees and as high as 204.5 hours for SMEs with at least 20 employees. A similar pattern is evident in relation to turnover. In terms of particular tax types, the average SME spends 28.5 hours on income tax, 33.4 hours on GST, 11.1 hours on PAYE, and 1 hour on FBT. For SMEs with no employees, income tax takes as much time as GST. Table 9.1: Summary of internal time spent on all tax activities by tax type and business size (number of employees) Business size (number of employees)
Mean (trimmed) annual number of hours All
GST Income tax PAYE FBT
Nil employees 21.2 (665)
25.6 (605)
1.9 (695)
0.2 (696)
51.3 (678)
Micro (1-5) 53.4 (661)
31.3 (593)
22.3 (673)
1.2 (677)
108.0 (688)
Small (6-19) 59.8 (252)
36.6 (233)
45.1 (261)
4.1 (265)
156.7 (251)
Medium (20+) 72.7 (99)
57.4 (95)
51.9 (101)
9.5 (106)
204.5 (94)
All SMEs 33.4 (1685)
28.5 (1533)
11.1 (1739)
0.9 (1753)
76.7 (1714)
Base: All respondents (excluding missing values and outliers ) Source: Long questionnaire Q1, Q4, Q13b; Short questionnaire Q6a, Q6b, Q6c

FINAL REPORT PAGE 96
colmar brunton
Table 9.2: Summary of internal time spent on all tax activities by tax type and business size (turnover) Business size (turnover) Mean (trimmed) annual number of hours All
GST Income tax PAYE FBT
Up to $19,999 19.5 (89)
19.9 (83)
0.9 (92)
0.1 (93)
43.5 (92)
$20,000 – $39,999 18.9 (141)
21.7 (134)
2.4 (148)
0.0 (148)
47.4 (144)
$40,000 – $99,999 26.4 (294)
22.5 (263)
3.8 (307)
0.2 (308)
56.6 (294)
$100,000 – $249,999 33.7 (378)
28.2 (326)
10.3 (387)
0.7 (388)
74.8 (378)
$250,000 – $499,999 42.9 (274)
41.8 (246)
19.1 (277)
0.9 (277)
95.9 (274)
$500,000 - $1,299,999 59.6 (246)
37.2 (230)
30.1 (260)
2.2 (262)
137.9 (246)
$1.3 million+ 66.1 (259)
44.7 (247)
39.6 (263)
6.9 (272)
167.7 (259)
All SMEs 33.4 (1685)
28.5 (1533)
11.1 (1739)
0.9 (1753)
76.7 (1714)
Base: All respondents Source: Long questionnaire Q1, Q13b, Q20; Short questionnaire Q6b, Q11
Table 9.3 presents the mean number of hours spent on tax activities analysed by business size and age of business. Age of business does not have a marked effect on time spent on tax activities with the possible exception of new businesses (those who have been in business less than 12 months). By the time a SME has been operating for 6 or more years, time on tax appears to settle to be slightly less than the early years of a SME. Table 9.3: Internal time spent (mean annual hours) on all tax activities by age of business and business size (number of employees)
Age of business Business size (number of employees) Less than 12
months 1-2 years 3-5 years 6-10 years 10 years +
All
Nil employees 82.6 (22)
64.4 (77)
53.3 (149)
47.2 (114)
46.7 (305)
51.3 (674)
Micro (1-5) 116.6 (15)
101.4 (70)
114.1 (126)
115.0 (132)
105.3 (336)
108.0 (688)
Small (6-19) 196.8 (5)
125.4 (25)
193.9 (33)
160.2 (44)
144.4 (138)
156.7 (251)
Medium (20+) 252.7 (2)
201.0 (6)
243.3 (12)
168.3 (16)
204.1 (57)
204.5 (94)
All SMEs 105.8 (44)
79.6 (180)
80.8 (320)
76.7 (307)
72.6 (840)
76.7 (1714)
Base: All respondents Source: Long questionnaire Q4, Q13b, Q14 and Q22; Short questionnaire Q6b, Q6c and Q13

FINAL REPORT PAGE 97
colmar brunton
Summary of compliance costs The next two graphs and three tables summarise mean compliance costs. Note, in order to calculate a combined mean compliance cost for all businesses, the compliance costs relating to each individual tax type have been calculated using a base of all businesses rather than those that pay/file a particular tax type. In practice, this means that those who do not file/pay a particular tax type have been allocated a value of zero. Likewise, the external compliance cost figures are based on all businesses rather than just those who pay for external advice/services. This means that those who do not use an external tax advisor have been allocated a value of zero. This is a different approach to that used in the sections relating to each tax type in the chapter on internal and external compliance costs. Those compliance costs have been calculated using a base of businesses that pay/file a particular tax type. As with the previous tables in this report, the base size is shown in the brackets in the tables. Estimated sampling errors are shown below the base sizes. The average business faces a combined tax compliance cost (incorporating both internal and external costs22) of $4,024. GST-related costs and Income-tax related costs are by far the largest contributors to this. Again, the familiar pattern of increasing costs with business size is evident – from $2,932 for businesses with no employees to $7,649 for businesses with 20 or more employees. A similar pattern is evident in relation to turnover. However, as illustrated in Figure 14, combined compliance costs clearly diminish as a percentage of turnover. Figure 13: Combined mean compliance costs (internal plus external)
$0
$1,000
$2,000
$3,000
$4,000
$5,000
$6,000
$7,000
$8,000
$9,000
$10,000
Nil employees Micro Small Medium All SMEs
Business size (number of employees)
GST PAYE FBT Income tax
Combined Mean compliance cost ($)
$2,932
$5,694
$6,827
$7,649
$4,024
22 Excluding payroll and audit costs

FINAL REPORT PAGE 98
colmar brunton
Table 9.4: Summary of mean annual compliance costs by business size (number of employees)
Business size (number of employees) GST Income tax PAYE FBT
Combined costs (internal and external)
Internal External Internal External Internal External Internal External
Nil employees $942 (666)
+/-$84
$105 (692)
+/-$21
$1,112 (616)
+/-$88
$695 (648)
+/-$59
$63 (694)
+/-$17
$5 (716) +/-$1
$7 (696) +/-$4
$3 (718) +/-$1
$2,932
Micro (1-5) $2,221 (669)
+/-$211
$209 (713)
+/-$36
$1,259 (608)
+/-$162
$1,107 (653)
+/-$88
$820 (673)
+/-$92
$26 (732) +/-$5
$44 (677)
+/-$19
$8 (761) +/-$3
$5,694
Small (6-19) $2,285 (257)
+/-$489
$275 (258)
+/-$90
$1,387 (242)
+/-$358
$1,257 (221)
+/-$167
$1,442 (259)
+/-$300
$40 (272)
+/-$12
$123 (265)
+/-$62
$18 (276) +/-$6
$6,827
Medium (20+) $2,369 (106)
+/-$686
$214 (105)
+/-$106
$1,888 (101)
+/-$614
$1,481 (83)
+/-$337
$1,404 (101)
+/-$419
$28 (114)
+/-$26
$237 (106)
+/-$119
$28 (110) +/-$9
$7,649
All SMEs $1,407 (1706) +/-$90
$146 (1778) +/-$20
$1,187 (1574) +/-$76
$856 (1614) +/-$45
$378 (1736) +/-$40
$14 (1844) +/-$2
$30 (1753) +/-$8
$6 (1875) +/-$1
$4,024
Base: All respondents Source: Long questionnaire Q4, Q10a, Q13b and Q14; Short questionnaire Q4, Q6b, Q6c and Q7
Figure 14: Combined mean compliance costs as % of turnover
21.0%
0.2%
7.5%
4.7%
0.9%
2.6%1.6%
0%
5%
10%
15%
20%
25%
500to
1.3m
1.3m+Business size ($ turnover)
Costs as % of
turnover
AB C F GED
A Up to $19,999B $20,000 to $39,999C $40,000 to $99,999D $100,000 to $249,999E $250,000 to $499,999F $500,000 to $1,299,999G $1.3 million +

FINAL REPORT PAGE 99
colmar brunton
Table 9.5: Summary of mean annual compliance costs by business size (turnover)
Business size (turnover) GST Income tax PAYE FBT
Combined costs
(internal and
external)
Combined mean
compliance costs as %
of turnover*
Internal External Internal External Internal External Internal External Up to $19,999 (mean in range = $11,013)
$877 (89)
+/-$229
$90 (93)
+/-$42
$847 (83)
+/-$164
$455 (88)
+/-$112
$33 (92)
+/-$19
$3 (98)
+/-$2
$4 (93)
+/-$9
$2 (98)
+/-$1
$2,311 21.0%
$20,000 – $39,999 (mean in range = $29,461)
$769 (141)
+/-$155
$56 (151)
+/-$20
$895 (136)
+/-$126
$391 (143)
+/-$63
$78 (148)
+/-$34
$3 (152) +/-$2
$1 (148) +/-$2
$2 (154) +/-$1
$2,195 7.5%
$40,000 – $99,999 (mean in range = $65,508)
$1,169 (295)
+/-$139
$116 (314)
+/-$35
$962 (271)
+/-$140
$638 (293)
+/-$75
$147 (307)
+/-$46
$8 (323) +/-$3
$6 (308) +/-$5
$2 (329) +/-$1
$3,048 4.7%
$100,000 – $249,999 (mean range = $160,580)
$1,440 (379)
+/-$183
$162 (403)
+/-$33
$1,228 (332)
+/-$159
$981 (372)
+/-$112
$351 (385)
+/-$73
$12 (410) +/-$3
$27 (308)
+/-$17
$6 (424) +/-$1
$4,207 2.6%
$250,000 – $499,999 (mean in range = $353,613)
$1,781 (276)
+/-$294
$188 (284)
+/-$48
$1,689 (252)
+/-$291
$1,249 (261)
+/-$174
$688 (275)
+/-$145
$19 (293) +/-$5
$33 (277)
+/-$25
$8 (304) +/-$3
$5,655 1.6%
$500,000 - $1,299,999 (mean in range = $788,472)
$2,502 (252)
+/-$387
$285 (261)
+/-$57
$1,529 (238)
+/-$284
$1,458 (231)
+/-$168
$1,041 (258)
+/-$205
$31 (278) +/-$9
$76 (262)
+/-$35
$14 (281) +/-$5
$6,936 0.9%
$1.3 million+ (mean in range = $3,672,309)
$2,389 (270)
+/-$526
$257 (266)
+/-$72
$1,617 (258)
+/-$375
$1,604 (220)
+/-$241
$1,167 (266)
+/-$258
$48 (284)
+/-$19
$185 (272)
+/-$70
$29 (279) +/-$9
$7,296 0.2%
All SMEs $1,407 (1706) +/-$90
$146 (1778) +/-$20
$1,187 (1574) +/-$76
$856 (1614) +/-$45
$378 (1736) +/-$40
$14 (1844) +/-$2
$30 (1753) +/-$8
$6 (1875) +/-$1
$4,024
Base: All respondents Source: Long questionnaire Q10a, Q13b, Q14 and Q20; Short questionnaire Q4, Q6b, Q6c, Q7 and Q11 *The mean turnover values used to calculate these figures were provided by Inland Revenue and based on population
characteristics.

FINAL REPORT PAGE 100
colmar brunton
Table 9.6 details tax compliance costs by entity type. Companies and to a lesser extent Partnerships experience higher combined compliance costs than Trust and Individuals. Table 9.6: Summary of mean annual compliance costs by entity type
Entity type GST Income tax PAYE FBT
Combined costs (internal and
external) Internal External Internal External Internal External Internal External $
Company $2,065 (909)
+/$-175
$231 (926)
+/-$39
$1,409 (850)
+/-$162
$1,182 (818)
+/-$87
$677 (916)
+/-$90
$19 (973) +/-$4
$77 (924)
+/-$21
$17 (979) +/-$3
$5,677
Individual $754 (328)
+/-$108
$64 (363)
+/-$19
$1,072 (298)
+/-$100
$507 (337)
+/-$78
$115 (341)
+/-$27
$6 (367) +/-$2
$3 (347) +/-$4
$0 (376) +/-$0
$2,521
Partnership $1,707 (366)
+/-$206
$166 (382)
+/-$29
$1,105 (331)
+/-$157
$970 (362)
+/-$88
$440 (370)
+/-$93
$19 (394) +/-$4
$7 (373) +/-$9
$2 (411) +/-$1
$4,416
Trust $866 (102)
+/-$264
$161 (105)
+/-$61
$993 (93)
+/-$210
$961 (95)
+/-$190
$191 (107)
+/-$94
$6 (108) +/-$5
$23 (107)
+/-$20
$1 (107) +/-$1
$3,202
All SMEs $1,407 (1706) +/-$90
$146 (1778) +/-$20
$1,187 (1574) +/-$76
$856 (1614) +/-$45
$378 (1736) +/-$40
$14 (1844) +/-$2
$30 (1753) +/-$8
$6 (1875) +/-$1
$4,024
Base: All respondents Source: Long questionnaire Q10a, Q13b, and Q14; Short questionnaire Q4, Q6b, Q6c, Q7 and entity type from IRD database
information.

FINAL REPORT PAGE 101
colmar brunton
10. Psychological compliance costs
This chapter examines the psychological compliance costs that businesses experience in meeting tax requirements overall. Specifically, they were asked to rate how stressful they found meeting IRD requirements overall during the last 12 months (ignoring finding the money). This chapter also draws together the reported stress levels associated with meeting requirements for each of the individual tax types (as reported in separate sections earlier in this report). Note, however, that the questions relating to individual tax type asked respondents to include any stress involved in finding the money. Therefore, the data pertaining to individual tax types are not purely psychological compliance costs. The psychological costs associated with meeting tax requirements overall (ignoring finding the money) vary widely. Around half (51%) find meeting IRD requirements overall less than moderately stressful (rating of 1 to 3), one quarter (24%) find them moderately stressful, and just under a quarter (23%) find them more than moderately stressful (rating of 5 to 7). Reported levels of stress in dealing with GST and provisional tax are significantly higher than those relating to PAYE and FBT. Table 10.1: Overall psychological compliance costs and reported stress levels by tax type Level of reported stress Overall tax
requirements (ignoring
finding the money)
GST Provisional tax PAYE FBT
(1877) %
(1734) %
(1628) %
(1261) %
(334) %
1 (not all stressful) 13 11 17 17 18
2 16 13 13 21 20
3 22 17 15 20 22
4 (moderately stressful) 24 22 18 19 17
5 14 16 14 8 12
6 6 12 12 8 4
7 (extremely stressful) 3 7 10 5 5
Missing information 1 1 2 1 1
Mean score 3.4 3.8 3.7 3.2 3.2 Base: All who pay/file the tax type in question (Q1); excludes those who indicated Q23 was not applicable. Source: Long questionnaire Q23-Q27; Short questionnaire Q14 and Q15

FINAL REPORT PAGE 102
colmar brunton
Table 10.2 shows that reported levels of stress with IRD requirements overall are significantly higher among employers (micro, small and medium businesses) than those with no employees. Table 10.2: Overall psychological compliance costs by business size (number of employees) Level of reported stress Business size (number of employees) All
Nil employees Micro (1-5) Small (6-19) Medium (20+)
(701) %
(762) %
(289) %
(115) %
(1877) %
1 (not all stressful) 16 10 10 10 13
2 17 14 17 16 16
3 22 22 18 21 22
4 (moderately stressful) 22 30 26 17 24
5 15 12 17 20 14
6 5 7 6 14 6
7 (extremely stressful) 2 4 3 4 3
Missing information 1 2 2 - 1
Mean score 3.3 3.6 3.5 3.8 3.4 Base: All respondents excluding those who indicated Q23 was not applicable. Source: Long questionnaire Q4 and Q23

FINAL REPORT PAGE 103
colmar brunton
A question was included in the long questionnaire to ascertain who answered the questions about the stress associated with meeting IRD requirements overall. The results to this question are in Table 10.3. Owners/partners and managers reported higher stress levels than external tax advisors or clerks/IT staff. Unpaid friends or family members also reported high levels of stress. However, because of the small sample size this is only significantly higher than clerks/IT staff. Table 10.3: Psychological costs associated with overall tax requirements (ignoring finding the money)
Person who answered question Level of reported stress Owner/
partner/ director/ trustee
Manager Internal accounta
nt or lawyer
External accountant or tax advisor
Clerk or IT staff
Unpaid friend or family
member
Other (long
questionnaire)
Respondent of short
questionnaire
All
(1372) %
(165) %
(92) %
(57) %
(133) %
(43) %
(4) %
(148) %
(1877) %
1 (not all stressful)
12 10 16 21 13 16 - 18 13
2 13 16 12 21 22 10 - 24 16
3 21 24 25 16 20 15 - 27 22
4 (moderately stressful)
28 19 29 24 32 26 82 15 24
5 15 11 8 12 9 12 - 16 14
6 8 8 10 5 2 5 18 1 6
7 (extremely stressful)
3 7 - 2 1 12 - * 3
Missing information
* 3 - - 1 4 - * 1
Mean score 3.6 3.6 3.3 3.1 3.1 3.7 4.4 2.9 3.4 Base: All respondents excluding those who indicated Q23 was not applicable. Source: Long questionnaire Q23 and Q28; Short questionnaire Q14

FINAL REPORT PAGE 104
colmar brunton
Appendices
A. Response rate over time Figure 15: Analysis of response rates over time
0
10
20
30
40
50
60
14th
Oct
20th
Oct
21st
Oct
22nd
Oct
26th
Oct
27th
Oct
28th
Oct
29th
Oct
1st N
ov
2nd
Nov
3rd
Nov
4th
Nov
5th
Nov
8th
Nov
9th
Nov
10th
Nov
11th
Nov
12th
Nov
15th
Nov
16th
Nov
17th
Nov
18th
Nov
19th
Nov
22nd
Nov
23rd
Nov
24th
Nov
25th
nov
26th
Nov
29th
Nov
30th
Nov
1st D
ec
2nd
Dec
3rd
Dec
6th
Dec
7th
Dec
8th
Dec
9th
Dec
10th
Dec
Date
Res
pons
e ra
te (%
)
ShortLong
Que
stio
nnai
res
disp
atch
edPo
stca
rd re
min
ders
Rep
lace
men
t qu
estio
nnai
res
Tele
phon
e re
min
ders

FINAL REPORT PAGE 105
colmar brunton
B. Sample profile – unweighted data Table 11.1: Sample profile by business size – unweighted data
Business size (number of employees) Nil
employees %
Micro (1-5)
%
Small (6-19)
%
Medium (20+)
%
All
%
Number of owners working in the business 0 1 2 3+ Don’t know Missing information
27 37 31 3 * 2
3 41 48 7 - *
5 33 49 13 - 1
22 23 35 16 - 3
13 37 41 7 * 2
Business size - Number of employees (full-time and part-time combined) Nil Micro (1-5 employees) Small (6-19 employees) Medium (20+ employees) Missing information
100 - - - -
-
100 - - -
- -
100 - -
- - -
100 -
38 40 15 6 1
Business size - turnover Nothing $1 – $19,999 $20,000 – $39,999 $40,000 – $99,999 $100,000 – $249,999 $250,000 – $499,999* $500,000 – $1,299,999 $1.3 million – $4,999,999 $5 million – $9,999,999 $10 million – $49,999,999 $50 million – $99,999,999 $100 million or more Missing information Don’t know
2 10 17 32 24 10 3 2 * * - - 1 -
1 1 4 11 31 25 20 7 1 * - * - *
* * * 2 4 14 36 39 3 1 - - - -
- - 1 - - 3 13 46 17 18 2 - - -
1 4 8 17 22 16 15 12 2 1 * * * *
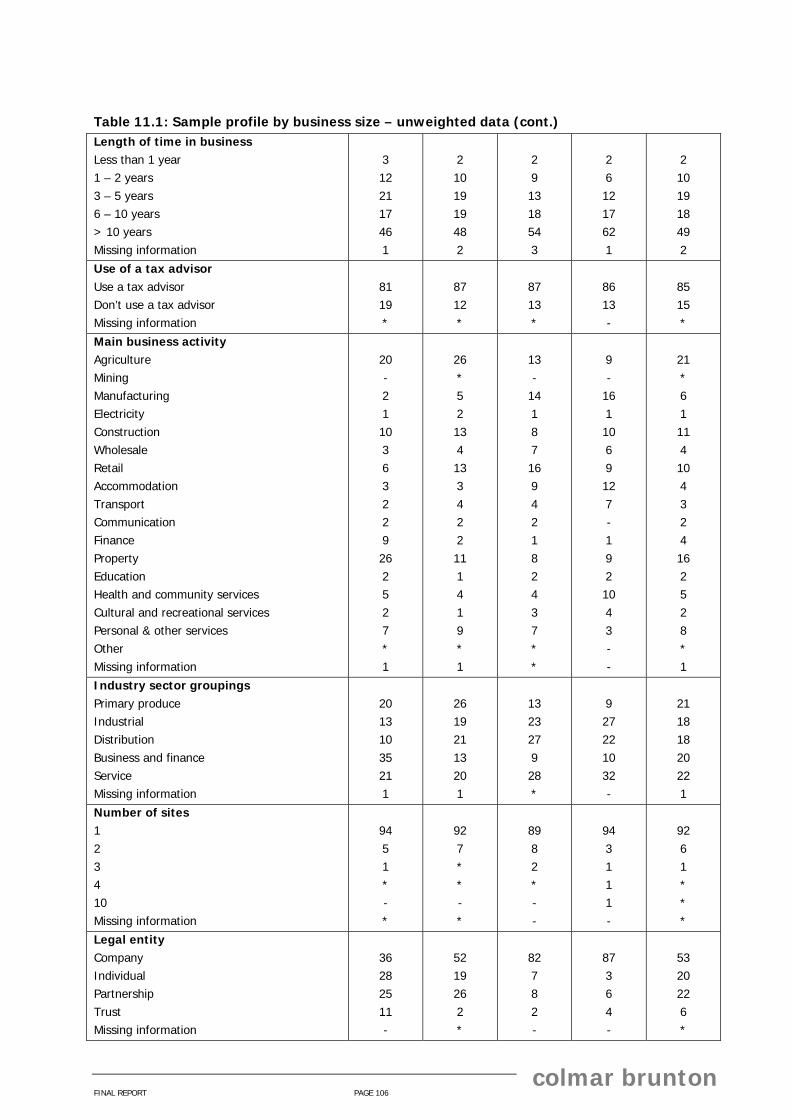
FINAL REPORT PAGE 106
colmar brunton
Table 11.1: Sample profile by business size – unweighted data (cont.) Length of time in business Less than 1 year 1 – 2 years 3 – 5 years 6 – 10 years > 10 years Missing information
3 12 21 17 46 1
2 10 19 19 48 2
2 9 13 18 54 3
2 6 12 17 62 1
2 10 19 18 49 2
Use of a tax advisor Use a tax advisor Don’t use a tax advisor Missing information
81 19 *
87 12 *
87 13 *
86 13 -
85 15 *
Main business activity Agriculture Mining Manufacturing Electricity Construction Wholesale Retail Accommodation Transport Communication Finance Property Education Health and community services Cultural and recreational services Personal & other services Other Missing information
20 - 2 1 10 3 6 3 2 2 9 26 2 5 2 7 * 1
26 * 5 2 13 4 13 3 4 2 2 11 1 4 1 9 * 1
13 -
14 1 8 7 16 9 4 2 1 8 2 4 3 7 * *
9 -
16 1 10 6 9 12 7 - 1 9 2 10 4 3 - -
21 * 6 1 11 4 10 4 3 2 4 16 2 5 2 8 * 1
Industry sector groupings Primary produce Industrial Distribution Business and finance Service Missing information
20 13 10 35 21 1
26 19 21 13 20 1
13 23 27 9 28 *
9 27 22 10 32 -
21 18 18 20 22 1
Number of sites 1 2 3 4 10 Missing information
94 5 1 * - *
92 7 * * - *
89 8 2 * - -
94 3 1 1 1 -
92 6 1 * * *
Legal entity Company Individual Partnership Trust Missing information
36 28 25 11 -
52 19 26 2 *
82 7 8 2 -
87 3 6 4 -
53 20 22 6 *

FINAL REPORT PAGE 107
colmar brunton
Table 11.1: Sample profile by business size – unweighted data (cont.) Provisional tax option used 03/04 Missing information Unknown – non provisional taxpayer Safe harbour option – new taxpayers New business elects to make payment Safe harbour Estimated
6 49 * -
38 6
5 53 * * 36 5
7 38 - -
47 9
4 23 1 -
55 16
6 47 * * 40 7
Number of respondents 724 767 290 116 1907 * = 0.0% < 0.5% Base: All respondents Source: Long questionnaire Q3, Q4, Q10a, Q20, Q21, Q22; Short questionnaire Q4, Q11, Q13, Q12; IRD database information used for Filing method for EMS, GST basis, Nature of GST registration, GST filing frequency.
Table 11.1: Sample profile by business size – unweighted data (cont.) Business size (number of employees)
Nil employees
%
Micro (1-5)
%
Small (6-19)
%
Medium (20+)
%
All
%
Filing method for EMS Missing information/No filing option recorded Electronic Manual
36 5 59
5 6 89
3 25 71
9 71 20
10 16 75
Number of respondents 193 718 290 116 1324 Base: All respondents who pay/file PAYE (Q1) Source: Long questionnaire Q4; IRD database information used for Filing method for EMS

FINAL REPORT PAGE 108
colmar brunton
Table 11.1: Sample profile by business size – unweighted data (cont.) Business size (number of employees)
Nil employees
%
Micro (1-5)
%
Small (6-19)
%
Medium (20+)
%
All
%
GST basis Missing information Hybrid Invoice Payments Both
2 * 18 79 -
1 * 17 81 *
1 2 43 54 *
1 1 72 26 -
1 1 25 73 *
Nature of GST registration Missing information Required Voluntary Required, Voluntary Forced
2 82 16 - *
1 92 7 * -
1 97 3 - -
1 95 4 - -
1 90 9 * *
GST filing frequency Missing information Monthly Six Monthly Two Monthly
2 6 30 62
3 4 13 81
1 7 4 88
1 19 3 78
2 6 16 76
Number of respondents 193 720 290 116 1326 * = 0.0% < 0.5% Base: All respondents who pay/file GST (Q1) Source: Long questionnaire Q4; IRD database information used for GST basis, Nature of GST registration, GST filing frequency.

FINAL REPORT PAGE 109
colmar brunton
Table 11.2: Sample profile by tax type – unweighted data Tax type
GST %
Income tax %
PAYE %
FBT^
%
All
%
Number of owners working in the business 0 1 2 3+ Don’t know Missing information
6 40 45 7 * 2
13 37 41 7 * 1
5 36 49 9 - 1
10 28 49 12 - 1
13 37 41 7 * 2
Business size - Number of employees (full-time and part-time combined) Nil Micro (1-5 employees) Small (6-19 employees) Medium (20+ employees) Missing information
33 44 17 7 1
38 40 15 6 *
15 54 22 9 1
13 32 35 20 -
38 40 15 6 1
Business size - turnover Nothing $1 – $19,999 $20,000 – $39,999 $40,000 – $99,999 $100,000 – $249,999 $250,000 – $499,999 $500,000 – $1,299,999 $1.3 million – $4,999,999 $5 million – $9,999,999 $10 million – $49,999,999 $50 million – $99,999,999 $100 million or more Don’t know Missing information
1 3 6 16 23 16 17 13 2 2 * * * *
1 4 8 17 22 16 15 12 2 1 * * * *
1 1 3 11 22 19 20 17 3 2 * * * -
- 1 1 4 12 12 22 33 8 7 1 - - -
1 4 8 17 22 16 15 12 2 2 * * * *
Length of time in business Less than 1 year 1 – 2 years 3 – 5 years 6 – 10 years > 10 years Missing information
3 11 19 18 49 2
2 10 19 18 49 2
2 10 18 18 50 2
1 7 13 17 60 1
2 10 19 18 49 2
Use of a tax advisor Use a tax advisor Don’t use a tax advisor Missing information
86 14 *
86 14 *
87 13 *
89 13 *
85 15 *

FINAL REPORT PAGE 110
colmar brunton
Table 11.2: Sample profile by tax type – unweighted data (cont.) Main business activity Agriculture Mining Manufacturing Electricity Construction Wholesale Retail Accommodation Transport Communication Finance Property Education Health and community services Cultural and recreational services Personal & other services Other Missing information
22 * 6 1 12 4 11 4 4 2 2 15 1 5 2 8 * *
21 * 6 1 11 4 11 4 3 2 4 16 2 5 2 8 * 1
22 * 8 1 11 5 13 5 4 2 2 11 1 5 2 8 * *
8 -
15 * 9 10 17 4 6 3 3 12 1 4 2 5 - *
21 * 6 1 11 4 10 4 3 2 4 16 2 5 2 8 * 1
Industry sector groupings Primary produce Industrial Distribution Business and finance Service Missing information
22 19 19 17 22 *
21 18 18 20 22 1
22 20 22 12 23 *
8 25 32 15 19 *
21 18 18 20 22 1
Number of sites Missing information 1 2 3 4 10
* 92 7 1 * *
* 92 7 1 * *
* 91 7 1 * *
* 90 7 1 1 *
* 92 6 1 * *
Legal entity Missing information Company Individual Partnership Trust
* 56 19 22 4
* 53 20 22 6
* 62 15 21 2
* 92 1 4 3
* 53 20 22 6
Provisional tax option used 03/04 Missing information Non-provisional taxpayer Safe harbour option - new taxpayers Safe harbour Estimated
6 48 * 38 7
5 47 * 40 7
6 48 * 39 7
3 36 * 48 12
6 47 * 40 7
Number of respondents 1747 1854 1326 343 1907 * = 0.0% < 0.5%
^= excludes those who filed FBT-nil returns only
Base: All respondents Source: Long questionnaire Q3, Q4, Q10a, Q20, Q21, Q22; Short questionnaire Q4, Q11, Q13, Q12; IRD database information used for Filing method for EMS, GST basis, Nature of GST registration, GST filing frequency.

FINAL REPORT PAGE 111
colmar brunton
Table 11.2: Sample profile by tax type – unweighted data (cont.) Tax type
GST %
Income tax %
PAYE %
FBT^
%
All
%
Filing method for EMS Missing information/No filing option recorded Electronic Manual
10 16 75
10 16 75
10 16 75
7 34 59
10 16 75
Number of respondents 1320 1288 1324 325 1324 Base: All respondents who pay/file PAYE (Q1) Source: Long questionnaire Q4; IRD database information used for Filing method for EMS
Table 11.2: Sample profile by tax type – unweighted data (cont.)
Tax type GST %
Income tax %
PAYE %
FBT^
%
All
%
GST basis Missing information Both Hybrid Invoice Payments
1 * 1 25 73
1 * 1 26 72
1 * 1 28 70
1 1 2 48 48
1 * 1 25 73
Nature of GST registration Missing information Required Voluntary Required, Voluntary Forced
1 90 9 * *
1 90 9 * *
1 93 6 * -
1 96 3 * -
1 90 9 * *
GST filing frequency Missing information Monthly Six Monthly Two Monthly
2 6 16 76
2 6 16 76
2 6 11 81
2 8 6 84
2 6 16 80
Number of respondents 1747 1697 1322 343 1747 * = 0.0% < 0.5%
^= excludes those who filed FBT-nil returns only
Base: All respondents who pay/file PAYE (Q1) Source: Long questionnaire Q4; IRD database information used for GST basis, Nature of GST registration, GST filing frequency.

FINAL REPORT PAGE 112
colmar brunton
Table 11.3: Tax type by business size – unweighted data
Business size (number of employees)
Nil employees Micro 1-5 Small 6-19 Medium 20+
All
Tax type % % % % % Income 97 98 97 99 97 GST 78 99 100 100 92 PAYE 27 94 100 100 70 FBT 6 14 41 60 18
Tax type combination Income only 21 * - - 8 Income, GST 41 5 - - 18 Income, GST, PAYE 16 57 39 27 37 Income, GST, PAYE, FBT 9 35 58 72 31 Income, PAYE - * - - * Income, PAYE, FBT - - - - - GST only 2 * - - 1 GST, PAYE 1 2 2 - 1 GST, PAYE, FBT 1 * * * * PAYE only * * - - * PAYE, FBT * - - - * Income, GST, FBT 9 * - - 4 * = 0.0% < 0.5% Base: All respondents Source: Long questionnaire Q1, Q4; Short questionnaire Q1

FINAL REPORT PAGE 113
colmar brunton
C. Internal time – excludes those who spent zero hours Table 11.4 gives the number of hours spent on specifics tax activities for each tax type. The number of hours in each cell has been calculated using a base that excludes respondents who indicated they spent zero hours (for that tax activity in relation to that tax type). Table 11.4: Internal time spent on tax activities (annual hours) by tax type – means GST Income tax
(including provisional
tax)
PAYE (including child support, student loans,
ACC levy)
FBT All tax types
Mean (trimmed) annual number of hours
Recording information 27.4
(1406)
17.5
(1068)
14.8
(995)
6.3
(210)
39.6
(1597)
Calculating tax, completing and filing returns, paying tax
14.8
(1348)
9.8
(928)
10.7
(985)
5.6
(228)
24.4
(1529)
Dealing with IRD 6.3
(649)
5.9
(461)
5.5
(455)
4.0
(58)
11.1
(887)
Tax planning 10.1
(235)
9.0
(379)
8.4
(105)
6.1
(21)
14.1
(465)
Dealing with tax advisors (including providing information to them)
9.4
(840)
9.3
(1087)
8.1
(386)
5.4
(122)
15.5
(1310)
Learning about tax laws (new or existing)
5.5
(940)
5.5
(685)
5.3
(670)
4.6
(155)
10.5
(1100)
Other 39.7
(12)
15.7
(14)
17.5
(5)
0.0
(-)
33.4
(25)
All activities 51.7
(15.34)
31.8
(1429)
31.3
(1134)
16.4
(277)
79.5
(1750) Base: All respondents who according to Q1 filed/paid the particular tax type (excluding missing information and outliers) and gave a response of more than zero hours on the particular task. Source: Long questionnaire Q13a; Short questionnaire Q6a Sample sizes are shown in brackets

FINAL REPORT PAGE 114
colmar brunton
Table 11.5 details the amount of time that different types of personnel spend on tax activities in relation to each tax type. The number of hours in each cell has been calculated using a base that excludes respondents who indicated they spent zero hours on that tax type. Table 11.5: Internal time spent by personnel on all tax activities (annual hours) by tax type - means Personnel GST Income tax
(including provisional
tax)
PAYE (including
child support, student
loans, ACC levy)
FBT All tax types
Mean (trimmed) annual number of hours
Owners/partners/directors/trustees 39.9 (1271)
26.9 (1263)
21.6 (801)
10.7 (170)
62.4 (1286)
Paid employees 58.3 (483)
28.0 (366)
29.8 (450)
18.2 (149)
106.9 (484)
Unpaid friends or relatives 32.5 (85)
13.4 (71)
21.0 (39)
0.0 (0)
38.4 (90)
All personnel 46.9 (1447)
31.4 (1388)
29.4 (1098)
15.5 (271)
78.6 (1670)
Base: All respondents who according to Q1 filed the particular tax type (excluding missing information and outliers) and gave a response of more than zero hours for that tax type. Source: Long questionnaire Q13b; Short questionnaire Q6b, Q6c

FINAL REPORT PAGE 115
colmar brunton
D. External costs based on businesses who use an advisor Table 11.6 presents external compliance costs by tax type and business size. The amounts under each tax type relate to the average payment made for external advice in regard to that tax type among businesses that file that tax type and who pay for external advice. Note, those who do not pay for external tax services relating to that tax type have been excluded from the bases for these calculations. The final column is based on all businesses and gives the average payment made for tax services relating to any tax type according to business size. Again, businesses that do not pay for external tax services have been excluded from the calculations. Table 11.6: External mean compliance costs by tax type and business size (number of employees)
Tax type* All Business size (number of employees) Mean (trimmed) external annual compliance costs
GST Income tax PAYE FBT
Nil employees $418 (212)
$998 (475)
$113 (46)
$115 (21)
$1,143 (488)
Micro (1-5) $519 (292)
$1,447 (510)
$134 (155)
$156 (46)
$1,720 (521)
Small (6-19) $631 (93)
$1,839 (152)
$178 (53)
$143 (31)
$2,183 (161)
Medium (20+) $708 (30)
$2,261 (60)
$324 (10)
$268 (15)
$2,495 (58)
All $480 (627)
$1,202 (1200)
$141 (266)
$149 (113)
$1,398 (1231)
Base: *Utilises imputed data, business survey data and tax advisor data. Base is all businesses who file the particular tax type at Q1 Source: Long questionnaire Q4, Q10a, Q10b, Q10d; Short questionnaire Q4; Advisor sub-survey Q5.

FINAL REPORT PAGE 116
colmar brunton
E. Payment for external tax services – comparison of tax advisor and business survey data Figure 16: All SMEs (n= 204, r=0.56)
Figure 17: SMEs with no employees (n=63, r=0.56)

FINAL REPORT PAGE 117
colmar brunton
Figure 18: Micro-sized businesses (n=98, r=0.64)
Figure 19: Small businesses (n=29, r=0.61)

FINAL REPORT PAGE 118
colmar brunton
Figure 20: Medium-sized businesses (n=13, r=0.19)

FINAL REPORT PAGE 119
colmar brunton
F. Analysis by sector This section provides analyses by sector. SMEs in the Distribution sector tend to spend the most time on tax activities with those in the Business and Finance sector spending the least time. However, this may well be a function of business size with those in the Distribution sector having more employees than those in the Business and Finance sector (see sample profile tables earlier in this report).
Table 11.7: Internal time spent on tax activities (annual hours) by sector
Sector Tax activity
Primary produce
Industrial Distribution Business & Finance
Service
All sectors
Mean number of hours (annual)
Recording information 36.0 (382)
37.7 (324)
38.6 (321)
24.5 (384)
36.0 (408)
33.7 (1831)
Calculating tax, completing and filing returns, paying tax
16.8 (387)
22.5 (336)
25.6 (339)
14.0 (388)
19.4 (425)
18.8 (1887)
Dealing with IRD 4.7 (392)
5.0 (341)
6.5 (340)
3.5 (390)
4.6 (426)
4.7 (1901)
Tax planning 3.4 (392)
2.3 (341)
4.7 (340)
2.1 (390)
3.4 (427)
3.0 (1902)
Dealing with tax advisors (including providing information to them)
11.6 (389)
10.3 (340)
11.9 (335)
6.8 (389)
12.0 (422)
10.3 (1887)
Learning about tax laws (new or existing)
5.1 (386)
5.7 (334)
6.3 (336)
4.5 (386)
5.1 (420)
5.2 (1874)
Other 0.5 (394)
0.0 (342)
0.3 (341)
0.2 (390)
0.4 (428)
0.4 (1907)
All activities 79.5 (383)
81.8 (325)
92.8 (328)
56.5 (385)
79.2 (413)
75.6 (1846)
Base: All respondents excluding missing information and outliers Source: Long questionnaire Q13a, Q21; Short questionnaire Q6a, Q12
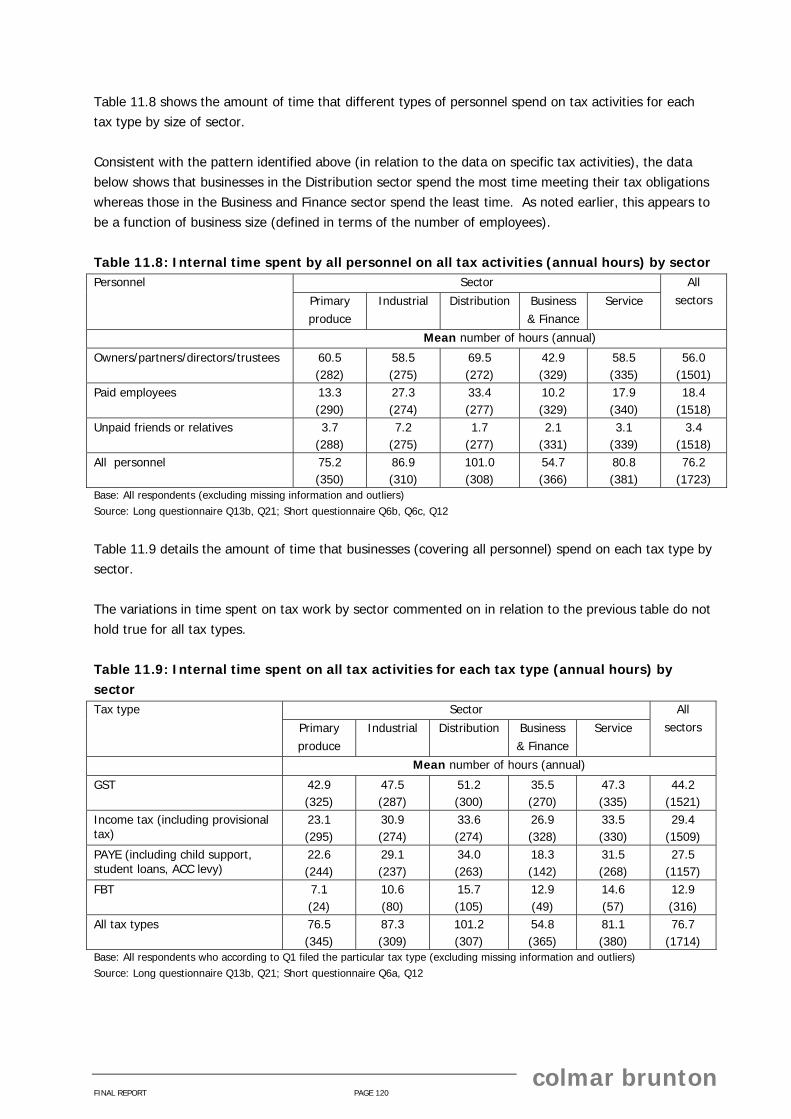
FINAL REPORT PAGE 120
colmar brunton
Table 11.8 shows the amount of time that different types of personnel spend on tax activities for each tax type by size of sector. Consistent with the pattern identified above (in relation to the data on specific tax activities), the data below shows that businesses in the Distribution sector spend the most time meeting their tax obligations whereas those in the Business and Finance sector spend the least time. As noted earlier, this appears to be a function of business size (defined in terms of the number of employees). Table 11.8: Internal time spent by all personnel on all tax activities (annual hours) by sector
Sector Personnel
Primary produce
Industrial Distribution Business & Finance
Service
All sectors
Mean number of hours (annual)
Owners/partners/directors/trustees 60.5 (282)
58.5 (275)
69.5 (272)
42.9 (329)
58.5 (335)
56.0 (1501)
Paid employees 13.3 (290)
27.3 (274)
33.4 (277)
10.2 (329)
17.9 (340)
18.4 (1518)
Unpaid friends or relatives 3.7 (288)
7.2 (275)
1.7 (277)
2.1 (331)
3.1 (339)
3.4 (1518)
All personnel 75.2 (350)
86.9 (310)
101.0 (308)
54.7 (366)
80.8 (381)
76.2 (1723)
Base: All respondents (excluding missing information and outliers) Source: Long questionnaire Q13b, Q21; Short questionnaire Q6b, Q6c, Q12
Table 11.9 details the amount of time that businesses (covering all personnel) spend on each tax type by sector. The variations in time spent on tax work by sector commented on in relation to the previous table do not hold true for all tax types. Table 11.9: Internal time spent on all tax activities for each tax type (annual hours) by sector
Sector Tax type
Primary produce
Industrial Distribution Business & Finance
Service
All sectors
Mean number of hours (annual)
GST 42.9 (325)
47.5 (287)
51.2 (300)
35.5 (270)
47.3 (335)
44.2 (1521)
Income tax (including provisional tax)
23.1 (295)
30.9 (274)
33.6 (274)
26.9 (328)
33.5 (330)
29.4 (1509)
PAYE (including child support, student loans, ACC levy)
22.6 (244)
29.1 (237)
34.0 (263)
18.3 (142)
31.5 (268)
27.5 (1157)
FBT 7.1 (24)
10.6 (80)
15.7 (105)
12.9 (49)
14.6 (57)
12.9 (316)
All tax types 76.5 (345)
87.3 (309)
101.2 (307)
54.8 (365)
81.1 (380)
76.7 (1714)
Base: All respondents who according to Q1 filed the particular tax type (excluding missing information and outliers) Source: Long questionnaire Q13b, Q21; Short questionnaire Q6a, Q12

FINAL REPORT PAGE 121
colmar brunton
Table 11.10 shows that businesses in the Industrial, Distribution and Service sector groupings tend to report the highest levels of stress associated with provisional tax requirements. SMEs in the Primary produce and Business & Finance sector groupings report the lowest levels of stress. Table 11.10: Stress associated with provisional tax compliance – mean scores by business size (number of employees) and sector Sector Business size (number of employees) All
Nil employees Micro (1-5) Small (6-19) Medium (20+)
Mean stress score
Primary produce 3.3 (113)
3.7 (180)
4.3 (32)
2.8 (9)
3.5 (337)
Industrial 4.1 (87)
4.3 (132)
4.5 (63)
3.8 (31)
4.2 (313)
Distribution 4.2 (63)
4.2 (138)
4.1 (70)
3.5 (23)
4.1 (296)
Business & Finance 3.0 (206)
3.7 (84)
3.4 (22)
4.6 (11)
3.2 (323)
Service 3.7 (122)
4.4 (130)
4.0 (63)
4.8 (31)
3.9 (349)
All sectors 3.5 (596)
4.1 (668)
4.1 (251)
4.0 (105)
3.7 (1628)
Base: All respondents who file/pay income tax (Q1 in long questionnaire) and all respondents of short questionnaire; excludes those who indicated Q25 was not applicable.
Source: Long questionnaire Q21 and Q25; Short questionnaire Q12 and Q15
Table 11.11 looks at mean internal compliance costs of GST by turnover and sector. Compliance costs of GST increase as turnover increases. Compliance costs of GST vary by industry sector with businesses in the Distribution sector experiencing the highest costs. However, this pattern does not always hold within business size groupings – the higher costs of the Distribution sector is largely due to those Distribution businesses with between $100,000 and $1,299,999 Table 11.11: Mean internal compliance costs of GST by business size (turnover) and sector
Primary produce
Industrial Distribution Business & Finance
Service All Business size (turnover)
Mean (trimmed) annual compliance costs
Up to $39,999 $1,734 (38)
$1,909 (21)
$1,475 (18)
$1,152 (39)
$1,544 (42)
$1,528 (158)
$40,000 to $99,999 $1,339 (47)
$1,430 (47)
$1,544 (25)
$1,472 (65)
$1,632 (62)
$1,478 (247)
$100,000 to $1,299,999 $2,003 (218)
$2,001 (142)
$2,753 (172)
$1,573 (144)
$2,145 (190)
$2,083 (869)
$1.3 million + $2,853 (25)
$2,056 (82)
$2,351 (92)
$1,955 (23)
$2,246 (48)
$2,389 (270)
All $1,850 (328)
$1,922 (292)
$2,288 (308)
$1,467 (272)
$1,897 (342)
$1,852 (1546)
Base: All respondents who file GST (Q1) excluding missing information and outliers Source: Long questionnaire Q13b, Q14, Q20 and Q21

FINAL REPORT PAGE 122
colmar brunton
There are a few variations in the accounting system used for GST by sector (see Table 11.12). SMEs in the Distribution sector are more likely than average to use computerised accounting software. SMEs in Primary produce are more likely than other businesses to rely on an external accountant for GST. And those in the Business & Finance sector are more likely than average to use ‘other computing systems’. Table 11.12: Accounting system used for GST by sector
Sector Accounting system
Primary produce
Industrial
Distribution
Business & Finance
Service
All sectors
(383) %
(334) %
(338) %
(291) %
(392) %
(1745) %
Manual - paper based 42 44 36 40 38 40 Computerised accounting software (in-house) 36 37 45 39 37 38 Other computing used in-house (e.g. spreadsheets) 9 15 12 20 19 15 External 20 12 9 11 16 14 Missing information 1 * 1 * 1 1 Base: All respondents who file GST (Q1); excludes those who indicated Q6 was not applicable. Source: Long questionnaire Q6 and Q21
SMEs in the Services, Industrial, and Distribution sectors report higher levels of stress in dealing with GST than businesses in the Primary produce and Business & Finance sectors (see Table 11.13). This pattern also tends to be evident within the business size groupings – however, due to some small sample sizes, these are not necessarily statistically significant. Table 11.13: Stress associated with GST compliance – mean scores by business size (number of employees) by sector
Business size (number of employees) Sector
Nil employees Micro (1-5) Small (6-19) Medium (20+)
All
Mean stress score
Primary produce 3.6 (130)
3.9 (198)
4.0 (39)
3.2 (10)
3.7 (380)
Industrial 4.2 (88)
3.9 (147)
4.2 (67)
3.6 (31)
4.1 (334)
Distribution 4.1 (70)
4.0 (159)
4.2 (77)
3.6 (26)
4.0 (334)
Business & Finance 3.2 (153)
3.4 (98)
2.8 (26)
3.5 (12)
3.2 (290)
Services 4.1 (117)
4.5 (153)
4.2 (79)
4.7 (37)
4.3 (389)
All sectors 3.7 (560)
4.0 (759)
4.0 (289)
3.9 (116)
3.8 (1734)
Base: All respondents who file GST (Q1); excludes those who indicated Q24 was not applicable. Source: Long questionnaire Q4, Q21 and Q24

FINAL REPORT PAGE 123
colmar brunton
Table 11.14 shows that businesses in the Services sector report higher levels of stress in dealing with PAYE compliance than businesses in the Industrial, Distribution and Business & Finance sectors. SMEs in the Primary produce sector also report higher levels of stress than businesses in the Business & Finance sector. This pattern is not as clear-cut within the business size groupings – this analysis is hampered by small sample sizes in some cases. Table 11.14: Stress associated with PAYE compliance – mean scores by business size (number of employees) and sector
Business size (number of employees)
Nil employees Micro (1-5) Small (6-19) Medium (20+)
All Sector
Mean stress score
Primary produce 3.3 (43)
3.3 (182)
3.8 (38)
2.9 (10)
3.3 (275)
Industrial 3.4 (26)
3.0 (135)
3.6 (67)
3.0 (31)
3.1 (260)
Distribution 3.0 (19)
2.9 (156)
3.3 (77)
4.0 (26)
3.1 (279)
Business & Finance 3.2 (24)
3.0 (84)
2.2 (26)
3.1 (12)
3.0 (146)
Services 3.4 (31)
3.5 (146)
3.5 (79)
4.0 (37)
3.5 (296)
All sectors 3.3 (143)
3.2 (707)
3.4 (288)
3.5 (116)
3.2 (1261)
Base: All respondents who file PAYE (Q1); excludes those who indicated Q26 was not applicable. Source: Long questionnaire Q21 and Q26
Table 11.5 summarises the combined annual compliance costs by sector.
Table 11.15: Summary of mean annual compliance costs by business size (number of employees)
Business size (number of employees) GST Income tax PAYE FBT
Combined costs (internal and external)
Internal External Internal External Internal External Internal External
Primary produce
$1588 (339)
$208 (355)
$1050 (304)
$1074 (329)
$426 (346)
$26 (374)
$11 (351)
$2 (389)
$4385
Industrial $1593 (300)
$133 (321)
$1235 (282)
$940 (284)
$484 (312)
$20 (332)
$33 (314)
$8 (334)
$4446
Distribution $2074 (311)
$173 (325)
$1306 (286)
$1038 (287)
$602 (314)
$13 (332)
$74 (316)
$17 (334)
$5297
Business & Finance
$974 (370)
$118 (375)
$1062 (342)
$645 (342)
$134 (368)
$6 (384)
$22 (376)
$5 (389)
$2966
Services $1257 (377)
$123 (390)
$1328 (350)
$749 (360)
$405 (386)
$7 (410)
$27 (392)
$5 (417)
$3901
All SMEs $1,407 (1706)
$146 (1778)
$1,187 (1574)
$856 (1614)
$378 (1736)
$14 (1844)
$30 (1753)
$6 (1875)
$4,024
Base: All respondents Source: Long questionnaire Q10a, Q13b, Q14 and Q21; Short questionnaire Q6b, Q6c, Q7 and Q12.

FINAL REPORT PAGE 124
colmar brunton
G. Analysis by age of business The next four tables show the internal time spent on tax compliance for each of the tax types with an analysis by age of business and turnover. Newer businesses, and larger businesses (in terms of turnover), tend to spend more time on tax compliance. Table 11.16: Internal time spent (annual hours) on Income tax by age of business and business size (turnover)
Age of business Turnover
Less than 12 months
1-2 years 3-5 years 6-10 years 10 years +
All
Mean (trimmed) annual number of hours
Up to $39,999 43.0 (10)
30.2 (27)
21.4 (59)
17.6 (36)
19.1 (69)
22.0 (205)
$40,000 to $99,999 24.8 (8)
20.7 (31)
19.6 (56)
17.0 (44)
27.7 (111)
23.5 (254)
$100,000 to $1,299,999 27.3 (11)
44.7 (82)
38.0 (142)
37.3 (143)
30.5 (411)
34.3 (798)
$1.3 million + 84.0 (1)
31.1 (11)
53.3 (28)
40.0 (50)
45.6 (156)
45.5 (249)
All 36.4 (30)
33.5 (152)
29.2 (286)
28.5 (273)
28.6 (748)
29.4 (1509)
Base: All respondents who file Income tax (Q1) excluding missing information and outliers Source: Long questionnaire Q13b, Q20 and Q22; short questionnaire Q6b, Q11 and Q13.
Table 11.17: Internal time spent (annual hours) on GST by age of business and business size (turnover)
Age of business Turnover
Less than 12 months
1-2 years 3-5 years 6-10 years 10 years +
All
Mean (trimmed) annual number of hours
Up to $39,999 47.7 (12)
44.5 (23)
35.6 (49)
33.9 (25)
32.3 (46)
36.1 (158)
$40,000 to $99,999 58.4 (11)
44.0 (41)
38.6 (58)
31.0 (44)
24.6 (89)
33.4 (246)
$100,000 to $1,299,999 48.7 (14)
50.6 (88)
54.1 (149)
54.3 (151)
46.1 (445)
49.5 (858)
$1.3 million + 86.4 (2)
54.2 (14)
79.8 (31)
70.2 (48)
62.0 (159)
66.4 (257)
All 52.5 (39)
47.2 (167)
46.7 (287)
46.5 (268)
41.0 (740)
44.2 (1521)
Base: All respondents who file GST (Q1) excluding missing information and outliers Source: Long questionnaire Q13b, Q20 and Q22

FINAL REPORT PAGE 125
colmar brunton
Table 11.18: Internal time spent (annual hours) on PAYE by age of business and business size (turnover)
Age of business Turnover
Less than 12 months
1-2 years 3-5 years 6-10 years 10 years +
All
Mean (trimmed) annual number of hours
Up to $39,999 6.5 (4)
6.9 (4)
13.6 (28)
8.7 (6)
17.0 (15)
12.8 (58)
$40,000 to $99,999 56.2 (5)
16.2 (24)
10.1 (25)
16.8 (23)
11.0 (40)
14.9 (119)
$100,000 to $1,299,999 28.5 (11)
25.7 (73)
38.0 (124)
27.2 (129)
28.7 (372)
29.7 (720)
$1.3 million + 84.1 (2)
19.0 (14)
47.3 (28)
40.0 (49)
41.3 (164)
41.4 (259)
All 35.0 (22)
21.1 (116)
29.2 (205)
26.8 (207)
28.3 (591)
27.5 (1157)
Base: All respondents who file PAYE (Q1) excluding missing information and outliers Source: Long questionnaire Q13b, Q20 and Q22
Table 11.19: Internal time spent (annual hours) on FBT by age of business and business size (turnover)
Age of business Turnover
Less than 12 months
1-2 years 3-5 years 6-10 years 10 years +
All
Mean (trimmed) annual number of hours
Up to $39,999 0.0 (0)
0.0 (0)
0.0 (1)
0.0 (0)
12.7 (2)
11.0 (3)
$40,000 to $99,999 0.0 (0)
14.8 (3)
11.7 (3)
5.7 (5)
2.4 (2)
7.5 (13)
$100,000 to $1,299,999 14.7 (3)
18.4 (14)
9.0 (24)
13.0 (25)
10.1 (78)
11.3 (147)
$1.3 million + 0.0 (0)
13.4 (4)
23.6 (13)
14.7 (26)
16.1 (109)
16.8 (153)
All 14.7 (3)
17.6 (21)
12.6 (41)
12.3 (56)
12.5 (191)
12.9 (316)
Base: All respondents who file FBT (Q1) excluding missing information and outliers Source: Long questionnaire Q13b, Q20 and Q22

FINAL REPORT PAGE 126
colmar brunton
Table 11.20 shows the combined annual compliance costs by age of business. New businesses (less than 12 months) experience the highest combined annual compliance costs. Table 11.20: Summary of mean annual compliance costs by age of business
Business size (number of employees) GST Income tax PAYE FBT
Combined costs (internal and external)
Internal External Internal External Internal External Internal External
Less than 12 months
$1782 (40)
$247 (44)
$1333 (38)
$631 (42)
$465 (42)
$13 (47)
$14 (43)
$2 (46)
$4487
1-2 years $1566 (177)
$156 (182)
$1295 (164)
$670 (166)
$311 (181)
$10 (191)
$33 (183)
$8 (198)
$4049
3-5 years $1651 (318)
$155 (336)
$1129 (292)
$843 (313)
$465 (320)
$15 (341)
$33 (323)
$3 (350)
$4294
6-10 years $1491 (305)
$138 (315)
$1205 (283)
$764 (289)
$374 (309)
$14 (328)
$34 (311)
$7 (333)
$4027
10 years + $1232 (843)
$137 (871)
$1179 (774)
$950 (775)
$360 (858)
$14 (1906)
$27 (866)
$7 (917)
$3906
All SMEs $1,407 (1706)
$146 (1778)
$1,187 (1574)
$856 (1614)
$378 (1736)
$14 (1844)
$30 (1753)
$6 (1875)
$4,024
Base: All respondents Source: Long questionnaire Q10a, Q13b, Q14 and Q22; Short questionnaire Q4, Q6b, Q6c, Q7 and Q13.

FINAL REPORT PAGE 127
colmar brunton
Questionnaire
FINAL REPORT PAGE 128
colmar brunton
Dear Sir/Madam,
This survey will help reduce business tax compliance costsThe Inland Revenue Department (IRD) is committed to reducing your tax compliance costs. By tax compliance costs, we mean the time, money and effort your business spends in meeting IRD’s tax requirements. To help IRD reduce these costs, Colmar Brunton has been asked to conduct this very important survey.
This will help IRD report to Government on the impact that future initiatives and law changes have on compliance costs. The research will help IRD to do the right things to reduce compliance costs for businesses.
Who should complete the survey?The questionnaire should be completed on behalf of the business (or person with business income) to which the envelope is addressed. If the envelope is not addressed to a named person, the person within your business who mostly deals with tax matters should complete the survey.
Please ignore all related business entities, such as subsidiaries or holding companies.
If your business has more than one site, please ensure your answers include estimates for all sites (in total – you don’t need to provide separate estimates per site).
You can answer all the questions without needing to consult tax advisors outside the business.
As a small token of appreciation for your help with the survey, we enclose a highlighter pen with Post-it flags. This may also be useful to mark questions if a second person is needed to answer a few of them.
Your input is confidentialIRD will not know who responded to the survey and only anonymous information will be passed back to IRD. Colmar Brunton is an independent research organisation.
We will give you the resultsWe will send you a summary of the research results on completion of the project.
Any questions?If you do have any questions about this survey, you can either call Colmar Brunton on freephone 0508 265 627 (and ask to speak to someone on the tax research team), or IRD on 0800 833 445 (this is a special line set up to answer questions about this survey).
What to do when you’re finishedThere is a reply paid envelope enclosed with this questionnaire. Once you have completed your questionnaire, please put it in the envelope and post it back to Colmar Brunton by Friday, 19 November 2004.
Thank you very much in anticipation of your input.
Yours faithfully
The tax research teamColmar Brunton
Business Tax Compliance Costs Survey

FINAL REPORT PAGE 129
colmar brunton
• Many questions ask you to provide information about “the last 12 months”. If you cannot easily estimate this, please use the most recent 12 month period possible (e.g. perhaps your last tax year).
• You can answer all the questions without needing to consult tax advisors outside the business.• This form should be completed on behalf of the business (or person with business income) to which it is addressed.
Please ignore all related business entities, such as subsidiaries or holding companies.• If your business has more than one site, please ensure your answers include estimates for all sites (in total – you don’t
need to provide separate estimates per site).• IRD will not know who responded to the survey and only anonymous responses will be passed back to IRD.
How many owners who work in this business at the end of last month were:
3
Full time – usually working 30 hours or more per week
Part time – usually working less than 30 hours a week
How many owners who work in this business at the end of last month were:
3
Full time – usually working 30 hours or more per week
Part time – usually working less than 30 hours a week
Business Compliance Costs
SSCWT (Specified Superannuation Contribution Withholding Tax): If you are one of the few businesses to pay SSCWT, please ignore it throughout this questionnaire.
Which of the following taxes did this business/organisation pay or complete a return for during the last 12 months? Include taxes where your accountant/tax advisor completed the return for you
1
1 GST (tick only if you are GST-registered)2 Income tax (including provisional tax)3 PAYE4 Fringe Benefit Tax (nil return only)5 Fringe Benefit Tax (including some payment)
What type of accounting system does this business use for GST?Tick as many as apply
6
1 Not applicable – not GST-registered2 Paper-based/manual (used in-house)3 Computerised accounting software (used in-house)
such as MYOB, NZA Gold4 Other computing used in-house (e.g. spreadsheet)5 External
What type of accounting system does this business use for GST?Tick as many as apply
6
1 Not applicable – not GST-registered2 Paper-based/manual (used in-house)3 Computerised accounting software (used in-house)
such as MYOB, NZA Gold4 Other computing used in-house (e.g. spreadsheet)5 External
Imagine for a moment that New Zealand was tax-free: do you think that you would still use computerised accounting software? Assume that the costs of buying and updating the software remain as they are now.Tick one only
7
1 Definitely yes2 Probably yes3 Unsure4 Probably not5 Definitely not6 Not applicable
Only answer the question below if you use computerised accounting software (in-house) such as MYOB, otherwise go to Q8.
START HERE
Is this organisation a charity or not-for-profit organisation?21 No2 Yes, and we are exempt income tax3 Yes, but we are not exempt income tax4 Other (please describe)
Is this organisation a charity or not-for-profit organisation?21 No2 Yes, and we are exempt income tax3 Yes, but we are not exempt income tax4 Other (please describe)
1 No2 Yes, and we are exempt income tax3 Yes, but we are not exempt income tax4 Other (please describe)
1 No Go to 9Have you had an IRD tax audit during the last 12 months?8
If YES: Please estimate the time and costs as a result of the tax audit
Hours within the business
2 Yes
External costs (e.g. fees to accountant outside the business), but excluding any change in tax liability or penalties
$
Please exclude the time and cost associated with IRD tax audits throughout the rest of this questionnaire.
How does the business process staff wages? This question is not about PAYE.Tick as many as apply
5
1 Not applicable – no staff2 Paper-based/manual (used in-house)3 Computerised payroll or accounting software (used in-
house)4 Other computing used in-house (e.g. spreadsheet)5 External (e.g. bureau/Internet payroll service)
How many employees in this business at the end of last month were (excluding owners):
4
Full time – usually working 30 hours or more per week
Part time – usually working less than 30 hours a week
• Casual• Temporarily absent from work (e.g. sick, on leave/or strike
or temporary layoffs etc)• Working for commission, unless registered for GST• Managerial staff (excluding working proprietors)
Include any:
How many employees in this business at the end of last month were (excluding owners):
4
Full time – usually working 30 hours or more per week
Part time – usually working less than 30 hours a week
How many employees in this business at the end of last month were (excluding owners):
4
Full time – usually working 30 hours or more per week
Part time – usually working less than 30 hours a week
• Casual• Temporarily absent from work (e.g. sick, on leave/or strike
or temporary layoffs etc)• Working for commission, unless registered for GST• Managerial staff (excluding working proprietors)
Include any:

FINAL REPORT PAGE 130
colmar brunton
External Costs
Imagine for a moment that New Zealand was tax-free: would you still pay your external accountant/advisor to do your annual accounts?
Tick one only
11
1 Not applicable (e.g. don’t pay them to do annual accounts now)
2 Definitely yes3 Probably yes4 Unsure5 Probably not6 Definitely not
Imagine for a moment that New Zealand was tax-free: would you still pay your external accountant/advisor to do your annual accounts?
Tick one only
11
1 Not applicable (e.g. don’t pay them to do annual accounts now)
2 Definitely yes3 Probably yes4 Unsure5 Probably not6 Definitely not
Did the business pay for tax services in the last 12 months from an advisor(s) other than your main tax advisor?
10d
1 No Go to 112 Yes
If YES: Roughly, how much of this cost for tax advisor(s) other than your main tax advisor resulted from each tax?
1 2 GST
1 2 Income tax (including provisional tax)
1 2 Fringe Benefit Tax
1 2 PAYE (incl. Child support, Student loans, ACC earner levy)
Any Cost?Yes No
$
$
$
$
Which taxes did the amount paid to tax advisors concern?10b
1 2 GST1 2 Income tax (including provisional tax)1 2 Fringe Benefit Tax1 2 PAYE (including child support, student loans, ACC
earner levy)
Yes NoWhich taxes did the amount paid to tax advisors concern?10b
1 2 GST1 2 Income tax (including provisional tax)1 2 Fringe Benefit Tax1 2 PAYE (including child support, student loans, ACC
earner levy)
Yes No
Imagine for a moment that New Zealand became tax-free: would you still pay for these external payroll services? Assume the cost remains the same.
Tick one only
12b
1 Definitely yes2 Probably yes3 Unsure4 Probably not5 Definitely not6 Not applicable
Imagine for a moment that New Zealand became tax-free: would you still pay for these external payroll services? Assume the cost remains the same.
Tick one only
12b
1 Definitely yes2 Probably yes3 Unsure4 Probably not5 Definitely not6 Not applicable
Did the business pay for any external payroll services in the last 12 months?
12a
1 No Go to 13a2 Yes
If YES, about how much did you pay in total?
$
Did the business pay for any external payroll services in the last 12 months?
12a
1 No Go to 13a2 Yes
If YES, about how much did you pay in total?
$
Approx. fee(if possible)
PLEASE READ: Tax compliance costs are the time, money and effort your business spends in meeting IRD tax requirements. Many activities occur because you are in business, but are not tax compliance costs. The following are not tax compliance costs, nor is paying for advice about them:• Processing customer invoices/cash received• Following up debtors• Banking• Paying bills and wages• Checking bank statements against cash records• Stock control• Investment planning unrelated to taxPlease consider only the extra work necessary to meet the requirements of IRD in answering the rest of the questionnaire.
9 PLEASE READ: Tax compliance costs are the time, money and effort your business spends in meeting IRD tax requirements. Many activities occur because you are in business, but are not tax compliance costs. The following are not tax compliance costs, nor is paying for advice about them:• Processing customer invoices/cash received• Following up debtors• Banking• Paying bills and wages• Checking bank statements against cash records• Stock control• Investment planning unrelated to taxPlease consider only the extra work necessary to meet the requirements of IRD in answering the rest of the questionnaire.
9
Tax advisors outside the business will often know more accurately than their clients how much of their fee was tax-related and how much of their fee related to GST versus PAYE etc. We would therefore like consent from your business for Colmar Brunton to ask your tax advisor how much each tax cost you. Is this okay? We will tell the tax advisor to answer questions only if they are happy to do so without charging you.
10c
1 YES, OK for Colmar Brunton to ask our tax advisor about this
2 NO, please don’t contact our tax advisor Go to 10d
If YES: please write the contact details for your main tax advisor below:
Name:
Postal address:
Name:
Postal address:
Did the business pay for any tax services in the last 12 months from an advisor outside the business (e.g. an accountant, tax agent or lawyer)?
10a
1 No Go to 12a2 YesIf YES, how much did you pay these advisors because of tax? $
PLEASE CHECK: The amount may or may not be your total bill. Does this amount only cover what you paid because of tax requirements?1 Yes
2 No Please change your answer so it includes only tax costs

C:\DOCUMENTS AND SETTINGS\BXS\LOCAL SETTINGS\TEMP\FINAL REPORT - 20 JUNE 05_1.DOC
In answering this question:13a
Recording information needed for tax (e.g. GST amounts, employeetax codes). To work this out, imagine New Zealand became tax-free. Consider what you would stop recording and write down how much time you would save.
Total hours per month (on average)
Other tax activities (please describe)
Learning about tax laws (new or existing) e.g. from newsletters, Tax Information Bulletin, the Internet
Dealing with tax advisors (including providing information to them)
Tax planning (e.g. for losses)
Dealing with IRD (e.g. letters, phone calls, visits, email)
Calculating tax, completing and filing returns, paying tax
Fringe Benefit TaxPAYE, including child support, student loans, ACC levy
Income Tax, including provisional tax
GST
Recording information needed for tax (e.g. GST amounts, employeetax codes). To work this out, imagine New Zealand became tax-free. Consider what you would stop recording and write down how much time you would save.
Total hours per month (on average)
Other tax activities (please describe)
Learning about tax laws (new or existing) e.g. from newsletters, Tax Information Bulletin, the Internet
Dealing with tax advisors (including providing information to them)
Tax planning (e.g. for losses)
Dealing with IRD (e.g. letters, phone calls, visits, email)
Calculating tax, completing and filing returns, paying tax
Fringe Benefit TaxPAYE, including child support, student loans, ACC levy
Income Tax, including provisional tax
GST
hr min
hr min
hr min
hr min
hr min
hr min
hr min
hr minhr min
hr minhr min
hr minhr min
hr minhr min
hr minhr min
hr minhr min
hr minhr min
hr minhr min
hr minhr min
hr minhr min
hr minhr min
hr minhr min
hr minhr min
hr minhr min
hr minhr min
hr minhr min
hr minhr min
hr minhr min
hr minhr min
hr minhr min
hr minhr min
hr minhr min
hr minhr min
hr minhr min
hr minhr min
hr minhr min
hr minhr min
hr minhr min
Internal Time/Costs
hr min hr min hr min hr minhr minhr min hr minhr min hr minhr min hr minhr min
• Please estimate the average hours per month within this business spent on tax activities during the last 12 months. Some taxes are dealt with only once or twice a year; please include this time on a monthly basis (e.g. if you spent 12 hours on end-of-year income tax count this as 1 hour per month).
• Include time spent by owners/partners/directors/trustees, paid employees, and unpaid friends or relatives.• Only count hours once (e.g. if you count some hours beside the heading “Recording information needed for tax”, do not count the same hours beside “Calculating tax, completing tax forms, paying tax”).• If no time was spent on a particular activity, please write in ‘0’ or a dash (-). If the tax type does not apply to your business, you can cross out the column.

FINAL REPORT PAGE 1
colmar brunton
13b
Please Check: Are the totals immediately above similar to the totals for question 13a?
Total hours per month (on average)
Unpaid friends or relatives
Paid employees (e.g. clerks, managers, internal accountants, IT staff)
Owners/Partners/Directors/Trustees
Fringe Benefit TaxPAYE, including child support, student loans, ACC levy
Income Tax, including provisional tax
GST
hr min
hr min
hr min
hr min
hr min
hr min
hr min
hr min
hr min
hr min
hr min
hr min
hr minhr min
hr minhr min
hr minhr min
hr minhr min
hr minhr min
hr minhr min
hr minhr min
hr minhr min
hr minhr min
hr minhr min
hr minhr min
hr minhr min
Internal Time/Costs
Time spent on the above activities is valuable. What was the approximate value of this time for each group of people?14
per hourOwners/partners/directors/trustees $ per hourOwners/partners/directors/trustees $
per hourUnpaid friends or relatives $ per hourUnpaid friends or relatives $
per hourPaid employees $ per hourPaid employees $
hr min hr min hr min hr minhr minhr min hr minhr min hr minhr min hr minhr min
1 Yes2 No If not, please check and adjust
Now, please tell us how the time you recorded in Q13a was divided across different people. In answering this question:• Please estimate how many hours per month the following people within this business spent on the taxes below during the last 12 months. The total for each tax should be about the
same as for question 13a.• For taxes which are dealt with only once or twice a year; please include this time on a monthly basis (e.g. if you spend 12 hours on end-of-year income tax count this as 1 hour per month).• If there is more than one person in a category, provide the total number of hours for all the people in that category.• If no time was spent on a particular activity, please write in ‘0’ or a dash (-). If the tax type does not apply to your business, you can cross out the column.

C:\DOCUMENTS AND SETTINGS\BXS\LOCAL SETTINGS\TEMP\FINAL REPORT - 20 JUNE 05_1.DOC
During the last 12 months, did your business employ staff repaying student loans?
16
If YES: In Question 13 you estimated the hours per month spent on PAYE. On average, about how many of those hours were spent dealing with Student loans?
hrs mins per month
During the last 12 months, did your business employ staff repaying student loans?
16
If YES: In Question 13 you estimated the hours per month spent on PAYE. On average, about how many of those hours were spent dealing with Student loans?
hrs mins per month
If YES: In Question 13 you estimated the hours per month spent on PAYE. On average, about how many of those hours were spent dealing with Student loans?
hrs mins per month
1 No Go to 172 Yes
Internal Time/Costs/Background
During the last 12 months, did your business employ staff paying child support?
15
1 No Go to 162 Yes1 No Go to 162 YesIf YES: In Question 13 you estimated the hours per month spent on PAYE. On average, about how many of those hours were spent dealing with child support?
hrs mins per month
If YES: In Question 13 you estimated the hours per month spent on PAYE. On average, about how many of those hours were spent dealing with child support?
hrs mins per month
Some entertainment expenses are only 50% deductible and also require a related GST adjustment. Did this business spend time during the last 12 months dealing with the 50% deductibility and GST adjustment required for such entertainment expenses?
18
hrs mins per year
IF YES: roughly how much time?
1 No2 Yes
Some entertainment expenses are only 50% deductible and also require a related GST adjustment. Did this business spend time during the last 12 months dealing with the 50% deductibility and GST adjustment required for such entertainment expenses?
18
hrs mins per yearhrs mins per year
IF YES: roughly how much time?
1 No2 Yes1 No2 Yes
During the last year, how many hours within the business were spent on…
17
a. Calculating provisional tax and deciding which provisional tax option to choose (i.e. standard option [+5%] versus estimation/estimating income)
hrs mins per year
None
b. Tax activities for depreciation and adjustments for fixed assets, valuing stock
hrs mins per year
None
c. Other end-of-year tax adjustments (e.g. amounts owed to you/by you)
hrs mins per year
None
During the last year, how many hours within the business were spent on…During the last year, how many hours within the business were spent on…
17
a. Calculating provisional tax and deciding which provisional tax option to choose (i.e. standard option [+5%] versus estimation/estimating income)
hrs mins per yearhrs mins per year
None
b. Tax activities for depreciation and adjustments for fixed assets, valuing stock
hrs mins per year
None
b. Tax activities for depreciation and adjustments for fixed assets, valuing stock
hrs mins per yearhrs mins per year
None
c. Other end-of-year tax adjustments (e.g. amounts owed to you/by you)
hrs mins per year
None
c. Other end-of-year tax adjustments (e.g. amounts owed to you/by you)
hrs mins per yearhrs mins per year
None
During the last year, how many hours within the business were spent on…
Were there any other unusual things during the last 12 months that resulted in your tax compliance costs being unusually high or unusually low (for a business of your size)?
19
If YES: please describe briefly:
1 No2 Yes
Were there any other unusual things during the last 12 months that resulted in your tax compliance costs being unusually high or unusually low (for a business of your size)?
19
If YES: please describe briefly:
1 No2 Yes1 No2 Yes
Please estimate the turnover of the business for your last tax year (excluding GST).
Tick one only
20
1 $02 $1 - $19,9993 $20,000 - $39,9994 $40,000 - $99,9995 $100,000 - $249,9996 $250,000 - $499,9997 $500,000 - $1,299,998 $1.3 million - $4,999,9999 $5 million - $9,999,999
10 $10 million - $49,999,99911 $50 million - $99,999,99912 $100 million or more

FINAL REPORT PAGE 1
colmar brunton
Background Questions
About how long has this business/organisation been trading?
Tick one only22
1 Less than 6 months
3 1 – 2 years4 3 – 5 years5 6 – 10 years6 More than 10 years
2 6 months but less than 1 year
About how long has this business/organisation been trading?
Tick one only22
1 Less than 6 months
3 1 – 2 years4 3 – 5 years5 6 – 10 years6 More than 10 years
2 6 months but less than 1 year
What is the main activity of the business?
Tick one only21
1 Agriculture, forestry and fishing2 Mining
4 Electricity, gas and water supply5 Construction (incl. landscaping and all activities
involving construction) and repair of buildings6 Wholesale trade7 Retail trade8 Accommodation, cafes and restaurants9 Transport and storage
10 Communication services11 Finance and insurance12 Property and business services (“business services”
incl. lawyers, accountants, architects, engineers, etc.)
17 Other (please describe)
3 Manufacturing
14 Health and community services15 Cultural and recreational services16 Personal and other services (“personal services” incl.
photographers, hairdressers, laundries, gardeners, lawn mowing)
13 Education
Overall during the last 12 months, how stressful did you find meeting IRD requirements (ignoring finding the money)?Please circle one number
23
1 2 3 4 5 6 7 9
Not at all Moderately Extremely N/AStressful Stressful Stressful
Overall during the last 12 months, how stressful did you find meeting IRD requirements (ignoring finding the money)?Please circle one number
23
1 2 3 4 5 6 7 9
Not at all Moderately Extremely N/AStressful Stressful Stressful
1 2 3 4 5 6 7 9
Not at all Moderately Extremely N/AStressful Stressful Stressful
During the last 12 months, how stressful did you find meeting requirements for provisional tax, including finding the money?Please circle one number
25
1 2 3 4 5 6 7 9
Not at all Moderately Extremely N/AStressful Stressful Stressful
During the last 12 months, how stressful did you find meeting requirements for provisional tax, including finding the money?Please circle one number
25
1 2 3 4 5 6 7 9
Not at all Moderately Extremely N/AStressful Stressful Stressful
1 2 3 4 5 6 7 9
Not at all Moderately Extremely N/AStressful Stressful Stressful
During the last 12 months, how stressful did you find meeting requirements for GST, including finding the money?Please circle one number
24
1 2 3 4 5 6 7 9
Not at all Moderately Extremely N/AStressful Stressful Stressful
During the last 12 months, how stressful did you find meeting requirements for GST, including finding the money?Please circle one number
24
1 2 3 4 5 6 7 9
Not at all Moderately Extremely N/AStressful Stressful Stressful
1 2 3 4 5 6 7 9
Not at all Moderately Extremely N/AStressful Stressful Stressful
During the last 12 months, how stressful did you find meeting requirements for PAYE, including finding the money?Please circle one number
26
1 2 3 4 5 6 7 9
Not at all Moderately Extremely N/AStressful Stressful Stressful
During the last 12 months, how stressful did you find meeting requirements for PAYE, including finding the money?Please circle one number
26
1 2 3 4 5 6 7 9
Not at all Moderately Extremely N/AStressful Stressful Stressful1 2 3 4 5 6 7 9
Not at all Moderately Extremely N/AStressful Stressful Stressful
During the last 12 months, how stressful did you find meeting requirements for Fringe Benefit Tax, including finding the money?Please circle one number
27
1 2 3 4 5 6 7 9
Not at all Moderately Extremely N/AStressful Stressful Stressful
During the last 12 months, how stressful did you find meeting requirements for Fringe Benefit Tax, including finding the money?Please circle one number
27
1 2 3 4 5 6 7 9
Not at all Moderately Extremely N/AStressful Stressful Stressful1 2 3 4 5 6 7 9
Not at all Moderately Extremely N/AStressful Stressful Stressful
Who answered the last five questions about how stressful tax activities are?
Tick as many as apply
28
1 Owner/partner/director/trustee2 Manager3 Internal accountant or lawyer4 External accountant or tax advisor5 Clerk or IT staff6 Unpaid friend or family member7 Other (please specify)
Who answered the last five questions about how stressful tax activities are?
Tick as many as apply
28
1 Owner/partner/director/trustee2 Manager3 Internal accountant or lawyer4 External accountant or tax advisor5 Clerk or IT staff6 Unpaid friend or family member7 Other (please specify)

FINAL REPORT PAGE 2
colmar brunton
Background Questions
In a few cases, it may be important for us to briefly check on key answers to this questionnaire. We would appreciate your first name and telephone number to help with this. (This information will remain confidential to the Colmar Brunton research team and will not be given to IRD).
30
First name:
Telephone number:
( 0 )
Would you like a summary of the results of this survey?29
1 Yes2 No Go to 30
If YES, to help us get this summary to you next year, please provide us your name, and any corrections needed to the mailing address we used. (This information will remain confidential to the Colmar Brunton research team, and will not be given to IRD).
Name:
Email address, or corrections to mailing address:
Thank you
Please use this space to make any comments that you feel would be helpful to understand your answers.
31 Please use this space to make any comments that you feel would be helpful to understand your answers.
31
Related Documents


