FINAL REPORT JONES RIVER ESTUARY AND KINGSTON BAY STORMWATER ASSESSMENT PROJECT MASSACHUSETTS BAYS PROGRAM RESEARCH & PLANNING GRANTS TOWN OF KINGSTON DECEMBER 28, 2011 ATP ENVIRONMENTAL MELROSE, MA

Welcome message from author
This document is posted to help you gain knowledge. Please leave a comment to let me know what you think about it! Share it to your friends and learn new things together.
Transcript

FINAL REPORT
JONES RIVER ESTUARY AND KINGSTON BAYSTORMWATER ASSESSMENT PROJECT
MASSACHUSETTS BAYS PROGRAMRESEARCH & PLANNING GRANTS
TOWN OF KINGSTON
DECEMBER 28, 2011
ATP ENVIRONMENTALMELROSE, MA

EXECUTIVE SUMMARY
The Jones River Estuary and Kingston Bay Stormwater Assessment Project was been completed pursuant to a grant from the Massachusetts Bays Program. End-of-pipe sampling at outfalls and other stormwater runoff points was completed during the “first flush” of two separate storm events, one in September 2011 and one in October 2011. All sampling and analysis was completed pursuant to a Quality Assurance Project Plan (QAPP) approved at the outset by USEPA.
Beginning with 35 known stormwater discharge points, the Town identified nineteen locally controlled locations representing potential sources for stormwater contamination. The nineteen sites were mapped, along with two outfall sites controlled by Mass DOT on Route 3, and an analysis completed to determine which sites should be subject to further study. Fifteen of the sites were selected for water quality sampling during two storm events, and analyzed for bacterial contamination (fecal coliform and enterococci) and total suspended solids. The results of the two sampling rounds were tabulated and examined along with other parameters.
Based upon the results of the two sampling rounds, twelve sites were identified for an assessment of stormwater mitigation measures that might be considered for future implementation. Best Management Practices (BMPs), as defined in the Massachusetts Stormwater Handbook, were identified for each location. Conceptual designs were completed for ten sites while a more detailed preliminary engineering design was performed at two sites. The ten conceptual designs were presented on 100-scale drawings; the two sites subject to preliminary design were presented on drawings at twenty scale.
Based upon the conceptual and preliminary designs, an estimate was made of construction cost for implementation of BMPs. The construction costs were developed using material quantities generated from the BMP designs and applying unit prices recently observed for other nearby stormwater mitigation projects of similar scale. For the twelve sites it was estimated that final design, construction, and engineering inspection would cost $825,170. Of the total cost, $268,778 is estimated for the two sites subject to preliminary engineering while the balance ($556,392) is estimated for the ten sites subject to conceptual design.
Future actions are recommended in the Assessment Report. Principal among them is the identification of grant programs that can be sought for implementation (construction) funding of stormwater mitigation BMPs in the Commonwealth. The next best opportunity for Kingston will be in the Fall of 2012 when proposals will be sought by the Office of Coastal Zone Management under the Coastal Pollutant Remediation grant program. It is recommended the the Town make application when the opportunity presents itself. Also, the Town is currently investigating improvements to the Town Landing site. It is recommended that, should the Landing project proceed to final design, the stormwater BMPs prepared as part of this study be incorporated in the recommended site improvements and be included as part of a CPR application.
FINAL A T P ENVIRONMENTAL 1
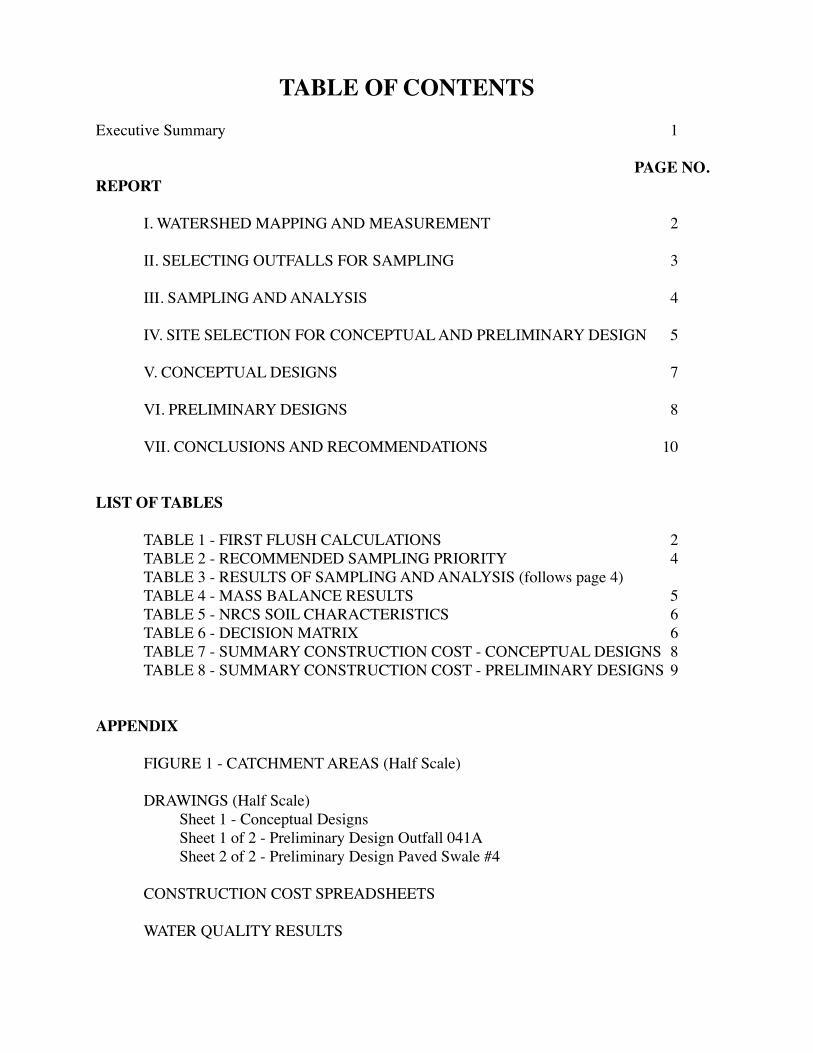
TABLE OF CONTENTSExecutive Summary! 1
! PAGE NO.REPORT!
I. WATERSHED MAPPING AND MEASUREMENT! 2
II. SELECTING OUTFALLS FOR SAMPLING! 3
III. SAMPLING AND ANALYSIS! 4
IV. SITE SELECTION FOR CONCEPTUAL AND PRELIMINARY DESIGN! 5
V. CONCEPTUAL DESIGNS! 7
VI. PRELIMINARY DESIGNS! 8
VII. CONCLUSIONS AND RECOMMENDATIONS! 10
LIST OF TABLES
TABLE 1 - FIRST FLUSH CALCULATIONS! 2TABLE 2 - RECOMMENDED SAMPLING PRIORITY! 4TABLE 3 - RESULTS OF SAMPLING AND ANALYSIS (follows page 4)TABLE 4 - MASS BALANCE RESULTS! 5TABLE 5 - NRCS SOIL CHARACTERISTICS! 6TABLE 6 - DECISION MATRIX! 6TABLE 7 - SUMMARY CONSTRUCTION COST - CONCEPTUAL DESIGNS! 8TABLE 8 - SUMMARY CONSTRUCTION COST - PRELIMINARY DESIGNS!9
APPENDIX
FIGURE 1 - CATCHMENT AREAS (Half Scale)
DRAWINGS (Half Scale)Sheet 1 - Conceptual DesignsSheet 1 of 2 - Preliminary Design Outfall 041ASheet 2 of 2 - Preliminary Design Paved Swale #4
CONSTRUCTION COST SPREADSHEETS
WATER QUALITY RESULTS
REPORT
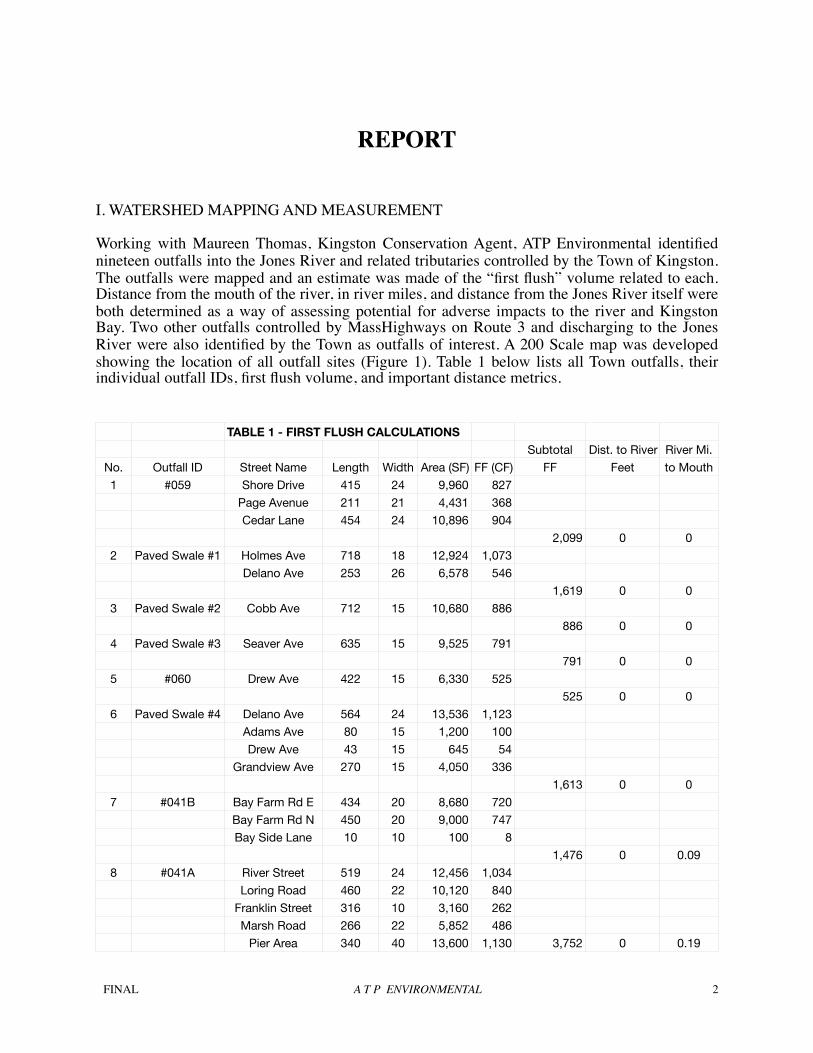
I. WATERSHED MAPPING AND MEASUREMENT
Working with Maureen Thomas, Kingston Conservation Agent, ATP Environmental identified nineteen outfalls into the Jones River and related tributaries controlled by the Town of Kingston. The outfalls were mapped and an estimate was made of the “first flush” volume related to each. Distance from the mouth of the river, in river miles, and distance from the Jones River itself were both determined as a way of assessing potential for adverse impacts to the river and Kingston Bay. Two other outfalls controlled by MassHighways on Route 3 and discharging to the Jones River were also identified by the Town as outfalls of interest. A 200 Scale map was developed showing the location of all outfall sites (Figure 1). Table 1 below lists all Town outfalls, their individual outfall IDs, first flush volume, and important distance metrics.
TABLE 1 - FIRST FLUSH CALCULATIONS TABLE 1 - FIRST FLUSH CALCULATIONS TABLE 1 - FIRST FLUSH CALCULATIONS TABLE 1 - FIRST FLUSH CALCULATIONS Subtotal Dist. to River River Mi.
No. Outfall ID Street Name Length Width Area (SF) FF (CF) FF Feet to Mouth
1 #059 Shore Drive 415 24 9,960 827
Page Avenue 211 21 4,431 368
Cedar Lane 454 24 10,896 904
2,099 0 0
2 Paved Swale #1 Holmes Ave 718 18 12,924 1,073
Delano Ave 253 26 6,578 546
1,619 0 0
3 Paved Swale #2 Cobb Ave 712 15 10,680 886
886 0 0
4 Paved Swale #3 Seaver Ave 635 15 9,525 791
791 0 0
5 #060 Drew Ave 422 15 6,330 525
525 0 0
6 Paved Swale #4 Delano Ave 564 24 13,536 1,123
Adams Ave 80 15 1,200 100
Drew Ave 43 15 645 54
Grandview Ave 270 15 4,050 336
1,613 0 0
7 #041B Bay Farm Rd E 434 20 8,680 720
Bay Farm Rd N 450 20 9,000 747
Bay Side Lane 10 10 100 8
1,476 0 0.09
8 #041A River Street 519 24 12,456 1,034
Loring Road 460 22 10,120 840
Franklin Street 316 10 3,160 262
Marsh Road 266 22 5,852 486
Pier Area 340 40 13,600 1,130 3,752 0 0.19
FINAL A T P ENVIRONMENTAL 2

Subtotal Dist. to River River Mi.
Outfall ID Street Name Length Width Area (SF) FF (CF) FF Feet to Mouth
9 #041 Loring Road 276 22 6,072 504
Marsh Road 445 22 9,790 813
Arrow Street 436 22 9,592 796
Jones River Dr 238 22 5,236 435
2,547 0 0.32
10 #043 Maple Street 760 30 22,800 1,892
Wright Court 0 25 0 0
Dwy 236 20 4,720 392
2,284 500 1.86
11 #051A Riverside Drive 1495 30 44,850 3,723
Pearl Street 331 26 8,606 714
4,437 200 2.08
12 #195 Maple Street 444 30 13,320 1,106
Landing Road 667 37 24,679 2,048
Dwy 300 10 3,000 249
3,403 0 1.63
13 #196 Electric SubstationElectric Substation 0 0
0 0 1.70
14 #197 Landing Road 802 24 19,248 1,598
Field Access RoadField Access Road 406 24 9,744 809
2,406 0 1.70
15 #198 Upland? 0 0
0 0 1.75
16 #047B Jones River Dr 730 22 16,060 1,333
River Street 620 24 14,880 1,235
2,568 400 1.34
17 #047 Jones River Dr 638 22 14,036 1,165
1,165 100 0.91
18 #057A Jones River Dr 393 22 8,646 718
718 100 0.42
19 #193 Park Street 912 21 19,152 1,590
1,590 1000 1.78
II. SELECTING OUTFALLS FOR SAMPLING
Using the above data, ATP recommended that 10 outfalls be sampled based upon the “first flush” volume generated from one inch of runoff and the proximity of the discharge to Kingston Bay. One inch of runoff was used because shellfish areas in Kingston Bay represent the natural resource of concern. Outfalls with elevated first flush volumes discharging at or near the mouth of the River, or that were high in volume within 2 miles from the mouth of the River, were selected to be sampled under two storm events. The Town added three other local outfalls based upon their observations in the past, and two outfalls managed by Mass DOT. Table 2 below lists all fifteen outfalls ultimately selected for sampling during two rain events.
FINAL A T P ENVIRONMENTAL 3

Table 2 - Recommended Sampling PriorityTable 2 - Recommended Sampling PriorityTable 2 - Recommended Sampling PriorityTable 2 - Recommended Sampling Priority
No. Outfall ID First Flush Dist. to River River MileCF Feet to Mouth
1 #059 2099 0 0.002 #041A 3752 0 0.193 #041B 1476 0 0.094 #041 2547 0 0.325 #047 1162 100 0.916 #047B 2568 400 1.347 #051A 4437 200 2.088 #195 3403 0 1.639 #197 2406 0 1.7010 #043 2284 500 1.8611 #198 Unknown 0 1.7512 #193 1590 1000 1.7813 PS#4 1613 0 014 MDOT 1 Unknown 0 1.1415 MDOT 2 Unknown 0 1.56
III. SAMPLING and ANALYSIS
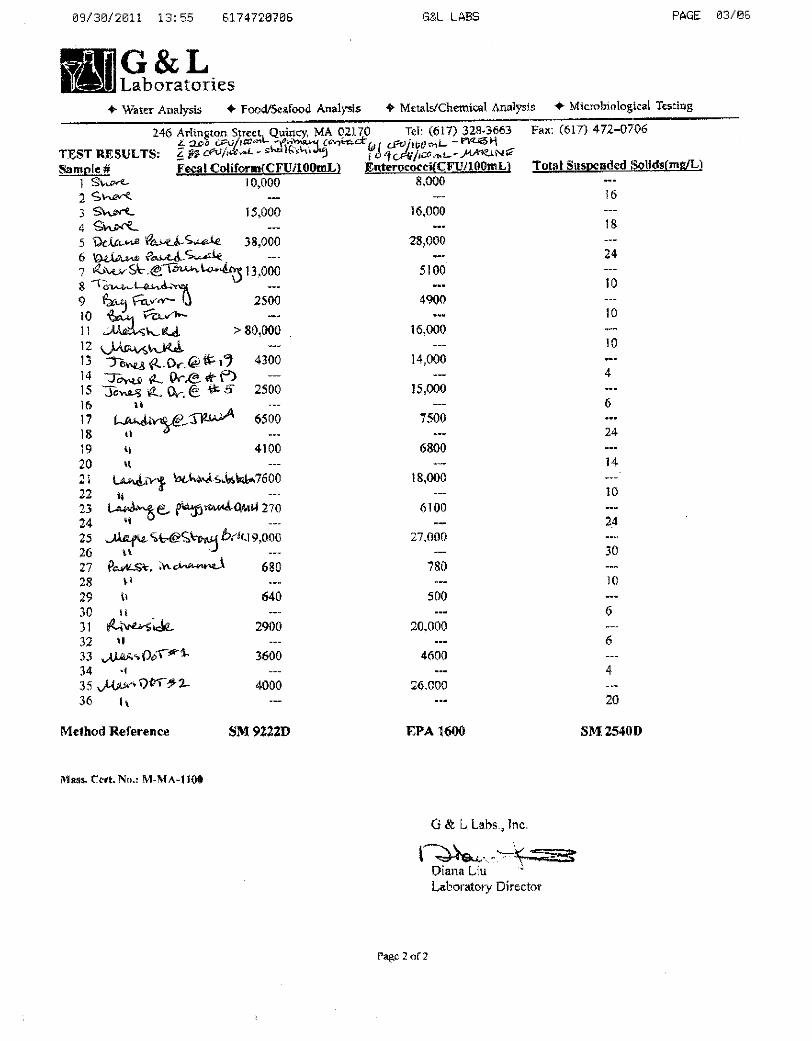
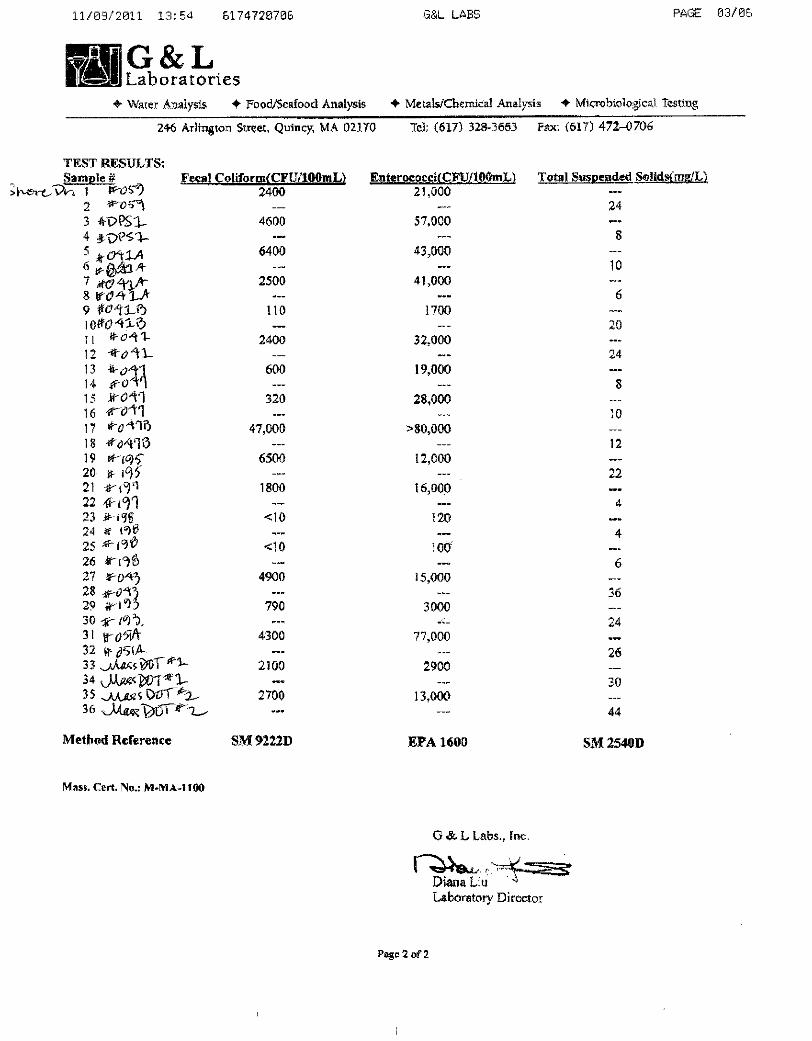
Two rounds of wet weather sampling were undertaken by the Town of Kingston lead by Maureen Thomas. The first sampling round was conducted on September 22, 2011 followed by a second sampling round October 27, 2011. Sampling protocols were followed as prescribed in the Sampling and Analysis QAPP prepared by the Town and approved by USEPA. Outfalls were sampled where accessible; immediate upstream catchbasins were sampled when necessary. Samples in both rounds were analyzed for bacteria (fecal coliform and enterococci), and total suspended solids. Duplicates were taken at three outfalls during both sampling events.
The results of the two sampling rounds were plotted and analyzed by ATP Environmental. Because of the wide disparity of bacteria values between events at some locations, it was decided to calculate the geometric mean of values, rather than a simple average, to assess the level of contamination. As can be seen on Table 3, the geometric mean for fecal coliform counts ranged from 52 cfu/100 ml at the playground DMH (Outfall #198) to 13,856 cfu/100 ml at the Marsh Road outfall (#041) with an average of 5,417 cfu/100 ml for all fifteen sample sites. The geometric mean for enterococci ranged from 856 cfu/100 ml (again, #198) to 39,950 at the Delano Ave. paved swale (PS#4) with an average of 16,962 cfu/100 ml for all fifteen sample sites. Total suspended solids values ranged from 6 mg/l at Jones River Road #5 (Outfall #047B) to 33 mg/l at the Maple Street outfall (#043) with an average value of 17 mg/l across all fifteen sites. (Note: TSS values represent arithmetic average values, not geometric mean values, because TSS values between sample rounds did not vary significantly).
FINAL A T P ENVIRONMENTAL 4

SAMPLE ID
#59#59
Paved Swale #4#041A#041A#041B#041#047#047
#047B#195
#197#198#198#043#193
#051AMass DOT 1Mass DOT 2
TABLE 3 - RESULTS OF SAMPLING AND ANALYSISTABLE 3 - RESULTS OF SAMPLING AND ANALYSISTABLE 3 - RESULTS OF SAMPLING AND ANALYSISTABLE 3 - RESULTS OF SAMPLING AND ANALYSISTABLE 3 - RESULTS OF SAMPLING AND ANALYSIS
Jones River Estuary and Kingston BayJones River Estuary and Kingston BayJones River Estuary and Kingston BayJones River Estuary and Kingston BayJones River Estuary and Kingston Bay Stormwater Assessment Project Stormwater Assessment Project Stormwater Assessment Project
MBP GRANT: ENV 11 CZM 02MBP GRANT: ENV 11 CZM 02MBP GRANT: ENV 11 CZM 02
SAMPLING DATE 09/22/2011 SAMPLING DATE 10/27/2011WEATHER Light Rain, 63 degrees, calm, 30.16 SLight Rain, 63 degrees, calm, 30.16 SLight Rain, 63 degrees, calm, 30.16 S WEATHER Light Rain, 47 degrees, calm, 29.71 SLight Rain, 47 degrees, calm, 29.71 SLight Rain, 47 degrees, calm, 29.71 S
TIDE 2 Hrs either side of HT2 Hrs either side of HT TIDE 2 to 4 hours into Flood2 to 4 hours into FloodPRECEDING CONDITIONS No Rain Documented in Previous 72 hoursNo Rain Documented in Previous 72 hoursNo Rain Documented in Previous 72 hours PRECEEDING CONDITIONSPRECEEDING CONDITIONS dry 72 Hrs prior except: 0.01” 44hrs prior; 0.02” 20hrs prior dry 72 Hrs prior except: 0.01” 44hrs prior; 0.02” 20hrs prior dry 72 Hrs prior except: 0.01” 44hrs prior; 0.02” 20hrs prior dry 72 Hrs prior except: 0.01” 44hrs prior; 0.02” 20hrs prior
RAINFALL EVENT 0.5 in. between 0100 and 09000.5 in. between 0100 and 0900 RAINFALL EVENT 0.25 in. between 0630 and 10300.25 in. between 0630 and 10300.25 in. between 0630 and 1030SAMPLING PERIOD 0515 TO 0920 SAMPLING PERIODSAMPLING PERIOD 0719 to 1020
MASS BALANCEMASS BALANCEMASS BALANCESAMPLE LOCATION RANK SAMPLE POINT SAMPLE TIME SAMPLE TIME RESULTS GEOMETRIC MEAN GEOMETRIC MEAN FIRST FLUSH x10^6 x10^6 x10^3 SAMPLE ID SAMPLE LOCATION
Fecal Coliform: CFU/100mlFecal Coliform: CFU/100ml Enterococci: CFU/100mlEnterococci: CFU/100ml TSS: mg/l FECAL ENTEROCOCCI TSS CF Fecal Units Entero. Units TSS: mgSEPT. OCT. SEPT. OCT. SEPT. OCT. SEPT. OCT.
Shore Drive Outfall 515 728 10000 2400 8000 21000 16 24 4,899 12,961 20 2099 2,912 7,705 11,889 #59 Shore DriveShore Drive Dup. 515 15000 16000 18 #59 Shore Drive Dup.Delano Ave 2 Surface 505 719 38000 4600 28000 57000 24 8 13,221 39,950 16 1613 6,039 18,249 7,309 Paved Swale #4 Delano AveTown Ld’g-River Street 4 CB upstream 534 741 13000 6400 5100 43000 10 10 9,121 14,809 10 3752 9,692 15,735 10,626 #041A Town Ld’g-River StreetTown Ld’g-River Street Dup 742 2500 41000 6 #041A Town Ld’g-River Street DupBay Farm Road Outfall 544 752 2500 110 4900 1700 10 20 524 2,886 15 1476 219 1,206 6,270 #041B Bay Farm RoadMarsh Road 2 CB upstream 642 800 80000 2400 16000 32000 10 24 13,856 22,627 17 2547 9,995 16,321 12,262 #041 Marsh RoadJones River Dr #19 CB upstream 623 809 4300 600 14000 19000 4 8 1,606 16,310 6 1165 530 5,381 1,980 #047 Jones River Dr #19Jones River Dr #19 Dup 809 320 28000 10 #047 Jones River Dr #19 DupJones River Dr #5 1 CB upstream 635 819 2500 47000 15000 80000 6 12 10,840 34,641 9 2568 7,883 25,193 6,545 #047B Jones River Dr #5Landing @JRWA CB upstream 605 830 6500 6500 7500 12000 24 22 6,500 9,487 23 3403 6,264 9,143 22,166 #195 Landing @JRWALanding @JRWA Dup. 605 4100 6800 14 Landing @JRWA Dup.Landiing behind Substation CB upstream 705 841 7600 1800 18000 16000 10 4 3,699 16,971 7 2406 2,520 11,563 4,770 #197 Landiing behind SubstationLanding @Play. DMH in DMH 827 853 270 10 6100 120 24 4 52 856 14 0 #198 Landing @Play. DMHLanding @Play. DMH Dup 854 10 100 6 #198 Landing @Play. DMH DupMaple St @ Stony Brook Outfall 756 909 9000 4900 27000 15000 30 36 6,641 20,125 33 2284 4,295 13,017 21,345 #043 Maple St @ Stony BrookPark St. in Channel in Stream 736 919 680 790 780 3000 10 24 733 1,530 17 1590 330 689 7,655 #193 Park St. in ChannelPark St. in Channel Dup. 736 640 500 6 Park St. in Channel Dup.Riverside Drive CB upstream 808 930 2900 4300 20000 77000 6 26 3,531 39,243 16 4437 4,437 49,311 20,105 #051A Riverside DriveEast of Rte. 3 Bridge Outfall 905 1020 3600 2100 4600 2900 4 30 2,750 3,652 16 Mass DOT 1 East of Rte. 3 BridgeL. Knife Outfall Outfall 920 1012 4000 2700 26000 13000 20 44 3,286 18,385 32 Mass DOT 2 L. Knife Outfall
AVERAGE 12,323 5,774 13,399 26,181 14 20 5,417 16,962 17 3,675 11,568 8,861 AVERAGEPOLLUTANT LEVELPOLLUTANT LEVEL BAY PROXIMITYBAY PROXIMITYBAY PROXIMITY
Sept/Oct Sept/Oct Sept/Oct Fecal Units Entero. Units CONSTRUCT.CONSTRUCT.CONSTRUCT. RANK#59 Shore Drive 4.2 0.4 0.7 3 3 5 3 14 #59 Shore Drive
2 Paved Swale #4 Delano Ave 8.3 0.5 3.0 4 5 5 3 17 2 Paved Swale #4 Delano Ave4 #041A Town Ld’g-River StreetTown Ld’g-River Street 2.0 0.1 1.0 4 3 5 4 16 4 #041A Town Ld’g-River Street
#041B Bay Farm RoadBay Farm Road 22.7 2.9 0.5 1 1 5 4 11 #041B Bay Farm Road2 #041 Marsh Road 33.3 0.5 0.4 5 4 4 4 17 2 #041 Marsh Road
#047 Jones River Dr #19Jones River Dr #19 7.2 0.7 0.5 1 2 3 5 11 #047 Jones River Dr #191 #047B Jones Rive Dr #5Jones Rive Dr #5 0.1 0.2 0.5 5 5 3 5 18 1 #047B Jones Rive Dr #5
#195 Landing @JRWALanding @JRWA 1.0 0.6 1.1 5 3 2 3 13 #195 Landing @JRWA#197 Landiing behind SubstationLandiing behind Substation 4.2 1.1 2.5 2 4 2 2 10 #197 Landiing behind Substation#198 Landing @Play. DMHLanding @Play. DMH 27.0 50.8 6.0 1* 1* #198 Landing @Play. DMH#043 Maple St @ Stony BrookMaple St @ Stony Brook 1.8 1.8 0.8 3 3 2 3 11 #043 Maple St @ Stony Brook#193 Park St. in ChannelPark St. in Channel 0.9 0.3 0.4 1 1 2 4 8 #193 Park St. in Channel
#051A Riverside Drive 0.7 0.3 0.2 3 5 1 5 14 #051A Riverside DriveMass DOT 1 East of Rte. 3 BridgeEast of Rte. 3 Bridge 1.7 1.6 0.1 * = absence of ff values moot* = absence of ff values moot* = absence of ff values moot Mass DOT 1 East of Rte. 3 BridgeMass DOT 2 L. Knife Outfall 1.5 2.0 0.5 1-5 with 5 being worst1-5 with 5 being worst1-5 with 5 being worst Mass DOT 2 L. Knife Outfall
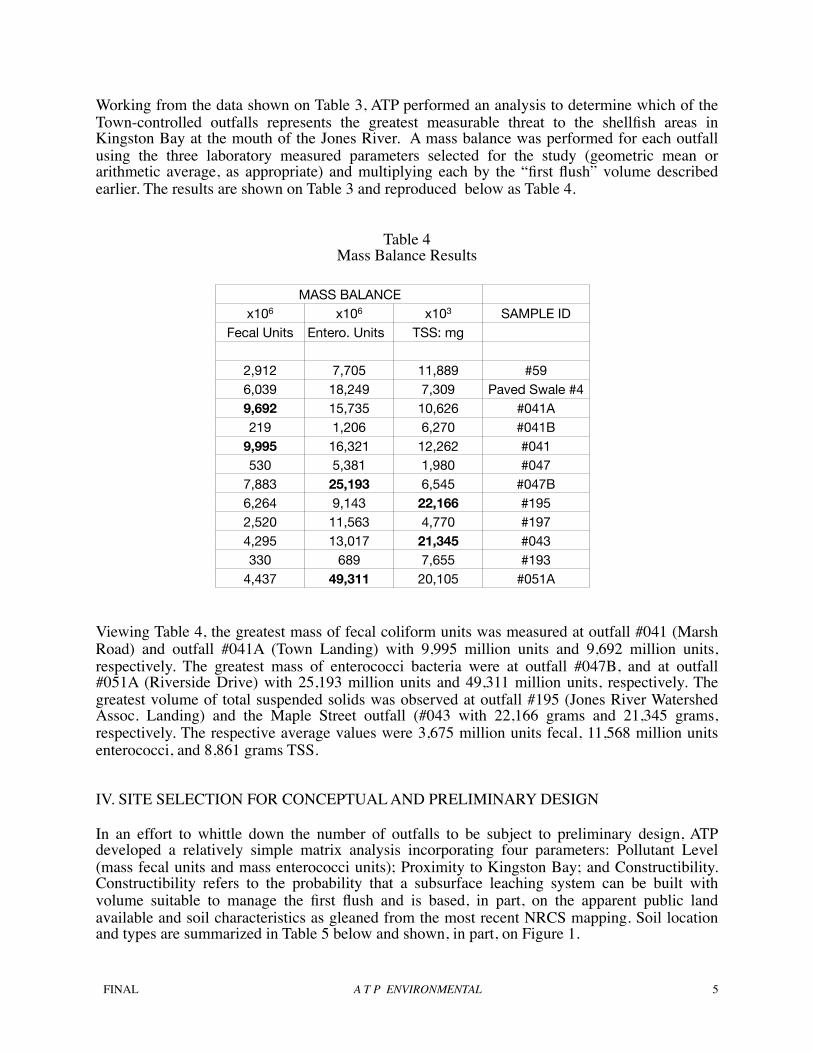
Working from the data shown on Table 3, ATP performed an analysis to determine which of the Town-controlled outfalls represents the greatest measurable threat to the shellfish areas in Kingston Bay at the mouth of the Jones River. A mass balance was performed for each outfall using the three laboratory measured parameters selected for the study (geometric mean or arithmetic average, as appropriate) and multiplying each by the “first flush” volume described earlier. The results are shown on Table 3 and reproduced below as Table 4.
Table 4Mass Balance Results
MASS BALANCEMASS BALANCEMASS BALANCEx106 x106 x103 SAMPLE ID
Fecal Units Entero. Units TSS: mg
2,912 7,705 11,889 #596,039 18,249 7,309 Paved Swale #49,692 15,735 10,626 #041A219 1,206 6,270 #041B
9,995 16,321 12,262 #041530 5,381 1,980 #047
7,883 25,193 6,545 #047B6,264 9,143 22,166 #1952,520 11,563 4,770 #1974,295 13,017 21,345 #043330 689 7,655 #193
4,437 49,311 20,105 #051A
Viewing Table 4, the greatest mass of fecal coliform units was measured at outfall #041 (Marsh Road) and outfall #041A (Town Landing) with 9,995 million units and 9,692 million units, respectively. The greatest mass of enterococci bacteria were at outfall #047B, and at outfall #051A (Riverside Drive) with 25,193 million units and 49,311 million units, respectively. The greatest volume of total suspended solids was observed at outfall #195 (Jones River Watershed Assoc. Landing) and the Maple Street outfall (#043 with 22,166 grams and 21,345 grams, respectively. The respective average values were 3,675 million units fecal, 11,568 million units enterococci, and 8,861 grams TSS.
IV. SITE SELECTION FOR CONCEPTUAL AND PRELIMINARY DESIGN
In an effort to whittle down the number of outfalls to be subject to preliminary design, ATP developed a relatively simple matrix analysis incorporating four parameters: Pollutant Level (mass fecal units and mass enterococci units); Proximity to Kingston Bay; and Constructibility. Constructibility refers to the probability that a subsurface leaching system can be built with volume suitable to manage the first flush and is based, in part, on the apparent public land available and soil characteristics as gleaned from the most recent NRCS mapping. Soil location and types are summarized in Table 5 below and shown, in part, on Figure 1.
FINAL A T P ENVIRONMENTAL 5

Table 5 - NRCS Soil Characteristics
OutfallOutfall First Distance River Depth to
No. ID Flush to River Mile Predominant Hydrologic/Drainage Char. Water Table
CF Feet to Mouth Soil River
1 #059 2099 0 0.00 635C, Canton, urban land, rock outcrop B/ >200
309B, Moshup loam, v. stony C/Moderately well drained 61 (2 ft)
2 #041A 2622 0 0.19 602B, Urban land >200
341B, Broadbrook, vf sandy loam C/Well drained 61 (2 ft)
420C, Canton, vf sandy loam B/Well drained >200
3 #041B 1476 0 0.09 341B, Broadbrook, vf sandy loam C/Well drained 61 (2 ft)
4 #041 2547 0 0.32 341B, Broadbrook, vf sandy loam C/Well drained 61 (2 ft)
5 #047 1162 100 0.91 420C, Canton, vf sandy loam B/Well drained >200
6 #047B 2568 400 1.34 256A, Deerfield, fine sand B/Moderately well drained 69 (2'-3")
316B, Scituate, gv,sdy loam C/Moderately well drained 38 (15”)
7 #051A 4437 200 2.08 254B, Merrimac sandy loam A/Somewhat excessively drained >200
8 #195 3403 0 1.63 602B, Urban land >200
252B, Carver coarse sand A/excessively drained >200
9 #197 2406 0 1.70 254B, Merrimac sandy loam A/Somewhat excessively drained >200
10 #043 2284 500 1.86 602B, Urban land >200
37A, Massosoit, Mashpee complex D/Poorly drained 0
11 PS #4 1613 0 0.19 635C, Canton, urban land, rock outcrop B/ >200
12 #198 0 1.74 254B, Merrimac sandy loam A/Somewhat excessively drained >200
13 #193 1590 1150 1.59 276A,223A Ninigret fs loam;Scio vfs loam B/Moderately well drained 56
Within the matrix, each outfall was assigned a value from one to five for each of the four parameters with 1 being not significant and 5 being significant. For constructibility, a value of 1 was given to sites deemed to pose significant construction hurdles while 5 was given to sites that appeared to be buildable with few complications (eg, absent tight soils or high groundwater). The individual scores were then added up with the highest value representing outfalls that should move forward to preliminary design. Table 6 below presents the scoring matrix, total value, and subsequent rank for the top four outfalls.
Table 6Decision Matrix
POLLUTANT LEVEL POLLUTANT LEVEL
Fecal Units Entero. Units BAY PROXIMITY CONSTRUCT. TOTAL RANK OUTFALL #
3 3 5 3 14 #59
4 5 5 3 17 2 P. Swale #4
4 3 5 4 16 4 #041A
1 1 5 4 11 #041B
5 4 4 4 17 2 #041
1 2 3 5 11 #047
5 5 3 5 18 1 #047B
5 3 2 3 13 #195
2 4 2 2 10 #197
1* 1* 2 3 7* #198
3 3 2 3 11 #043
1 1 2 4 8 #193
3 5 1 5 14 #051A
* = mass balance values not calculated* = mass balance values not calculated* = mass balance values not calculated
FINAL A T P ENVIRONMENTAL 6

As shown above in Table 6, outfall #047B (Jones River Dr. #5) is the highest ranking site. Outfall #041 (Marsh Road) and Paved Swale #4 (Delano Ave.) tied for second; while Outfall #041A (Town Landing at River Road) represents the fourth highest rank site. These four sites were subsequently subject to topographic survey and two selected by the Town for preliminary design; Paved Swale #4 on Delano Avenue and Outfall #041A at the Town Landing on River Road. The remaining sites (10) were subject to conceptual design.
V. CONCEPTUAL DESIGNS
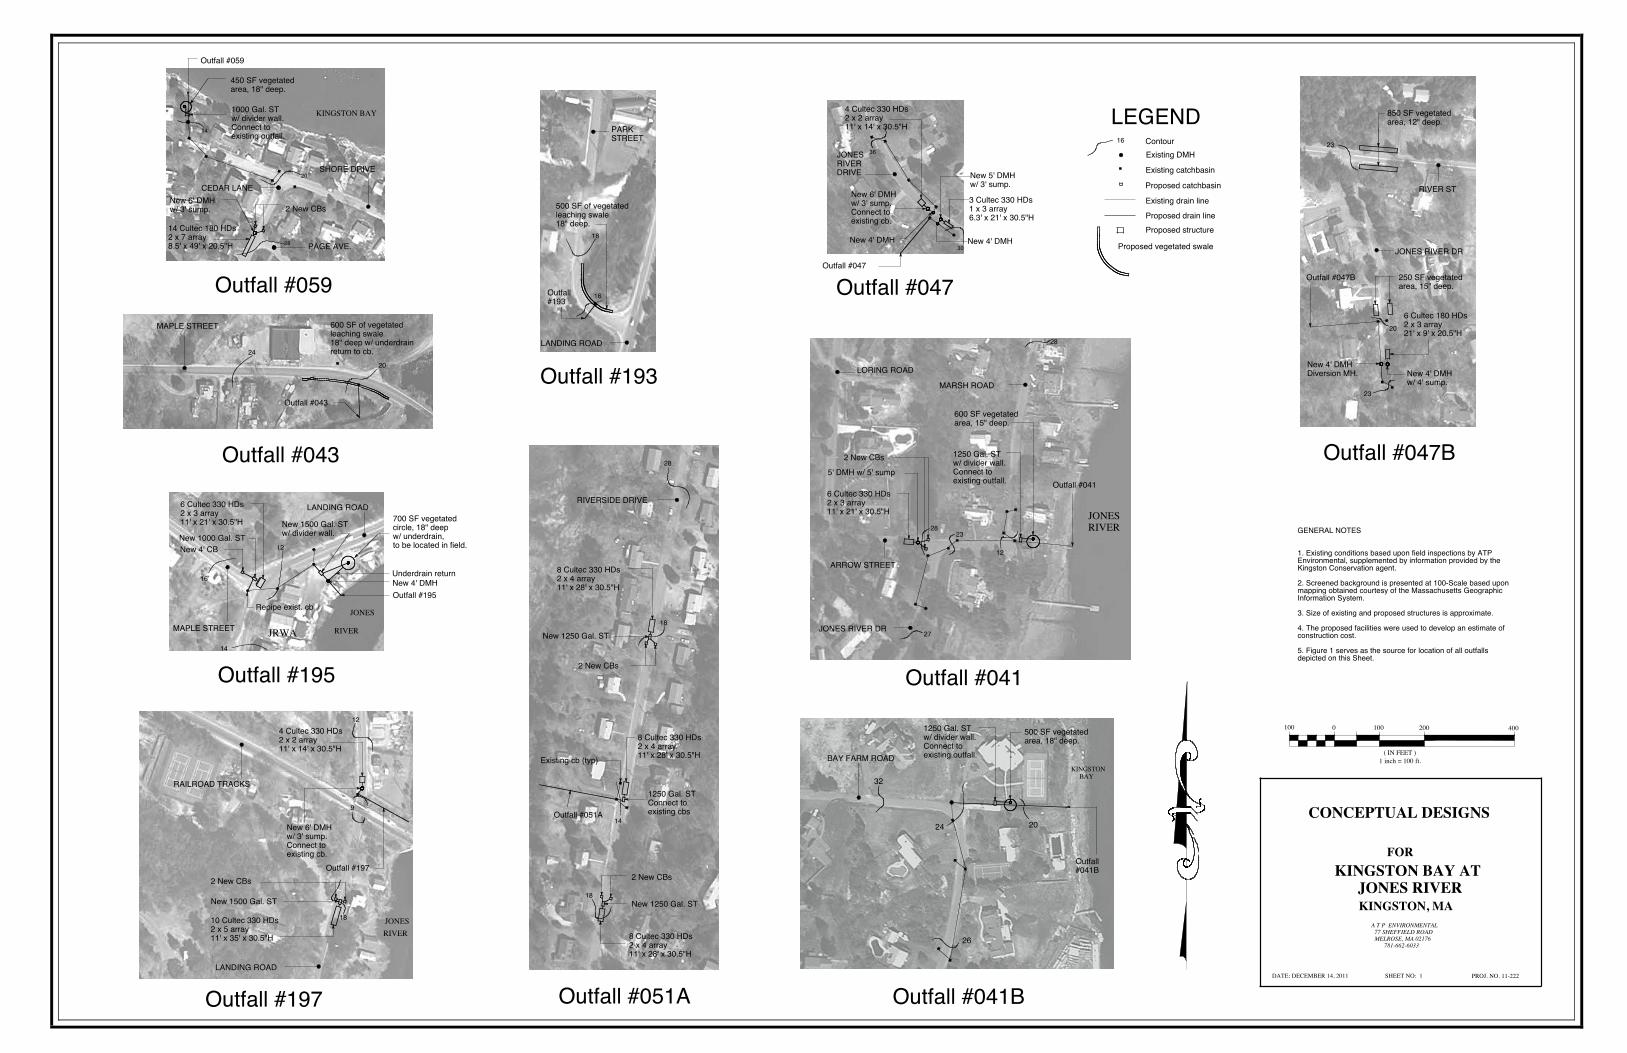
In an effort to begin the process of mitigating stormwater impacts, conceptual designs were developed for ten catchment areas. Using first flush volumes calculated and presented above, a site specific BMP system that would remove suspended solids and fecal coliform using infiltration systems, both surface and subsurface, was developed. System headworks were sized to hold 10% of the first flush volume for settling purposes. Consistent with the Massachusetts Stormwater Handbook, infiltration systems were sized using TR-55 analyses based upon the first flush (1” of runoff) which serves as the Required Water Quality Volume. The “Dynamic Field” method was used to determine system size based upon an estimate of permeability from the soils data gathered from NRCS sources. Technically, the “Simple Dynamic” system should be used absent field measured soils data, but it is anticipated that all sites will be subject to field investigation as the program goes forward where the “Dynamic Field” method will ultimately be used for final design.
Depending upon soil types and estimated depth to water table, surface and subsurface infiltration systems were analyzed. In shallow-to-groundwater areas, such as near to outfalls, vegetated swales, surface filtration systems, and rain gardens were proposed (Outfall #043, 193, 047B and 41B). Where first flush volumes were large, upgradient subsurface systems were selected for conceptual design to capture flow and minimize the footprint of surface systems (Outfalls 195, 041, 059). Subsurface systems were selected in locations where soils were permeable, groundwater was deemed to be at depth, and/or where space was tight (Outfall 047, 051A, 197. In some locations a network of existing catchbasins and drain manholes were worked into the conceptual design. (eg, Outfall 041) while elsewhere, no system existed apart from a simple catchbasin/outfall complex (eg, Outfall 043). Typical sedimentation units were comprised of drain manholes with 4’ sumps and septic tanks ranging in size from 1000 gallons to 1500 gallons. Conceptual infiltration systems were predicated upon units manufactured by Cultec with varying heights and sizes. Surface filtration systems sometimes were proposed to be constructed using imported sand with underdrainage where soils were deemed not sufficiently permeable (eg, Outfall 043 and 195).
A single plan sheet was developed to illustrate the conceptual designs prepared. Sheet 1 depicts systems that serve all ten outfalls selected for future work. Based upon these conceptual designs, a materials quantity takeoff was performed and a construction cost estimate developed for each location. Construction costs were increased by 15% to cover contingencies and 25% to cover the cost of services for final design and construction inspection. Table 7 below presents a summary of the total construction costs based upon the ten Conceptual Designs. As shown, the total construction cost estimate for all systems on Sheet 1 is $556, 392.
FINAL A T P ENVIRONMENTAL 7
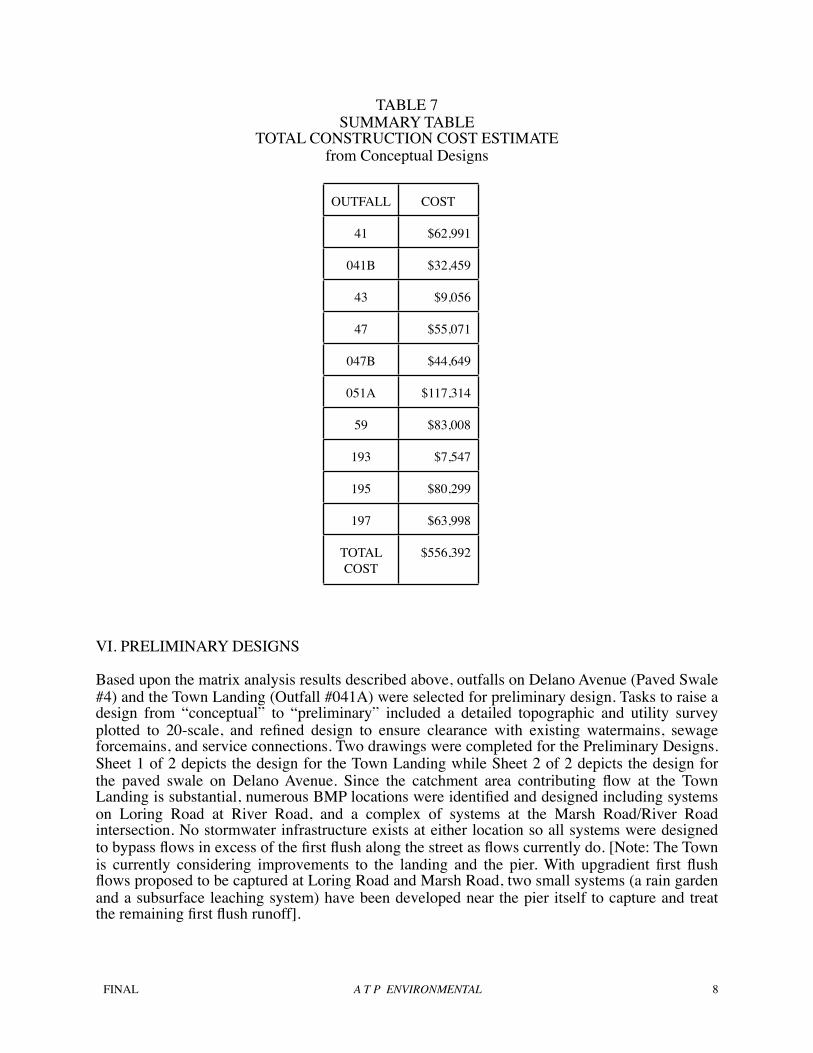
TABLE 7SUMMARY TABLE
TOTAL CONSTRUCTION COST ESTIMATEfrom Conceptual Designs
OUTFALL COST
41 $62,991
041B $32,459
43 $9,056
47 $55,071
047B $44,649
051A $117,314
59 $83,008
193 $7,547
195 $80,299
197 $63,998
TOTAL COST
$556,392
VI. PRELIMINARY DESIGNS
Based upon the matrix analysis results described above, outfalls on Delano Avenue (Paved Swale #4) and the Town Landing (Outfall #041A) were selected for preliminary design. Tasks to raise a design from “conceptual” to “preliminary” included a detailed topographic and utility survey plotted to 20-scale, and refined design to ensure clearance with existing watermains, sewage forcemains, and service connections. Two drawings were completed for the Preliminary Designs. Sheet 1 of 2 depicts the design for the Town Landing while Sheet 2 of 2 depicts the design for the paved swale on Delano Avenue. Since the catchment area contributing flow at the Town Landing is substantial, numerous BMP locations were identified and designed including systems on Loring Road at River Road, and a complex of systems at the Marsh Road/River Road intersection. No stormwater infrastructure exists at either location so all systems were designed to bypass flows in excess of the first flush along the street as flows currently do. [Note: The Town is currently considering improvements to the landing and the pier. With upgradient first flush flows proposed to be captured at Loring Road and Marsh Road, two small systems (a rain garden and a subsurface leaching system) have been developed near the pier itself to capture and treat the remaining first flush runoff].
FINAL A T P ENVIRONMENTAL 8

Preliminary design at the paved swale on Delano Avenue is proposed to be comprised of a trench drain at the toe of the road, two 5’ drain manholes with 4’ sumps, and two 18’ diameter rain gardens. The site is fairly tight with poor soils and narrow public land but it appears, based upon current understanding of property lines, that a rain garden of some configuration is possible on both sides of the proposed trench drain. Final design will ensure that, once the rain gardens are full, flows in excess of the first flush will pass over the trench drain and enter the Jones River as they currently do. The final design will also seek to manage any scour that might occur from the new system by specifying some combination of riprap and hardy vegetation down gradient.
Based on the preliminary designs shown on the two design sheets, a total construction cost estimate of $268,778 has been calculated for outfall 041A and paved swale #4. The total construction cost includes 10% for construction contingencies and 25% for services related to design and construction inspection. Table 8 below presents the total construction cost for outfalls already subject to Preliminary Design.
TABLE 8SUMMARY TABLE
CONSTRUCTION COST ESTIMATEfrom Preliminary Designs
OUTFALL COST
PS #4 $50,442
#041A $218,336
TOTAL COST
$268,778
Adding the results presented in Table 7 ad Table 8, the total construction cost estimate to mitigate all twelve outfalls is $825,170
FINAL A T P ENVIRONMENTAL 9
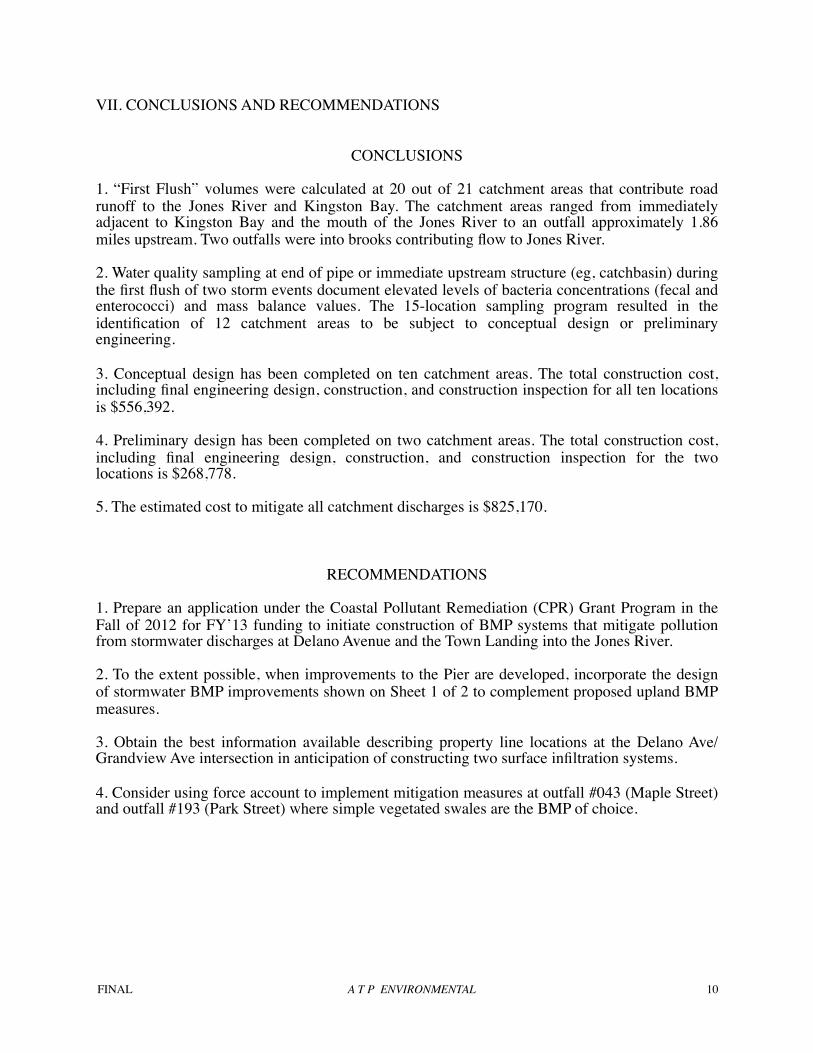
VII. CONCLUSIONS AND RECOMMENDATIONS
CONCLUSIONS
1. “First Flush” volumes were calculated at 20 out of 21 catchment areas that contribute road runoff to the Jones River and Kingston Bay. The catchment areas ranged from immediately adjacent to Kingston Bay and the mouth of the Jones River to an outfall approximately 1.86 miles upstream. Two outfalls were into brooks contributing flow to Jones River.
2. Water quality sampling at end of pipe or immediate upstream structure (eg, catchbasin) during the first flush of two storm events document elevated levels of bacteria concentrations (fecal and enterococci) and mass balance values. The 15-location sampling program resulted in the identification of 12 catchment areas to be subject to conceptual design or preliminary engineering.
3. Conceptual design has been completed on ten catchment areas. The total construction cost, including final engineering design, construction, and construction inspection for all ten locations is $556,392.
4. Preliminary design has been completed on two catchment areas. The total construction cost, including final engineering design, construction, and construction inspection for the two locations is $268,778.
5. The estimated cost to mitigate all catchment discharges is $825,170.
RECOMMENDATIONS
1. Prepare an application under the Coastal Pollutant Remediation (CPR) Grant Program in the Fall of 2012 for FY’13 funding to initiate construction of BMP systems that mitigate pollution from stormwater discharges at Delano Avenue and the Town Landing into the Jones River.
2. To the extent possible, when improvements to the Pier are developed, incorporate the design of stormwater BMP improvements shown on Sheet 1 of 2 to complement proposed upland BMP measures.
3. Obtain the best information available describing property line locations at the Delano Ave/Grandview Ave intersection in anticipation of constructing two surface infiltration systems.
4. Consider using force account to implement mitigation measures at outfall #043 (Maple Street) and outfall #193 (Park Street) where simple vegetated swales are the BMP of choice.
FINAL A T P ENVIRONMENTAL 10

A P P E N D I X

#059#060 Paved Swale #1
Paved Swale #2Paved Swale #3Paved Swale #4
#041B
#041A
#041
#195
#196 - Substation
#197 - Road
#198Upland
#051A
#043
KINGSTON BAY / JONES RIVERFOR
KINGSTON, MA
A T P ENVIRONMENTAL 77 SHEFFIELD ROAD MELROSE, MA 02176 781-662-6033
DATE: DECEMBER 21, 2011 PROJ. NO. 11-222
1 inch = ft.
GRAPHIC SCALE200
2000200 100400 600
CATCHMENT AREAS
#047B
#047#057A
#193
River Street
Maple Street
#198SamplingDMH
MDOT#1
MDOT#2
TownLanding
KINGSTON BAY
635C
635C
341B
341B
602B
51A
256A
420C
420C
254C
254B
253E
254B
602B
602B
37A
256B37A256B
~
602B
320A
~
223A
276A
Paved Swale Not Sampled
Outfall Not Sampled
Paved Swale Sampled
Outfall Sampled
#041B Outfall ID No.
LEGEND
Catchment Limit
420C Soil Type
Geometric Mean:Fecal = 4,899Entero = 12,961
Geometric Mean:Fecal = 13,221Entero = 39,850
Geometric Mean:Fecal = 524Entero = 2,886
Geometric Mean:Fecal = 9,121Entero = 14,809
Geometric Mean:Fecal = 13,856Entero = 22,627
Geometric Mean:Fecal = 1,606Entero = 16,310
Geometric Mean:Fecal = 3,531Entero = 39,243
Geometric Mean:Fecal = 2,750Entero = 3,652
Geometric Mean:Fecal = 3,286Entero = 18,385
Geometric Mean:Fecal = 3,531Entero = 39,243
Geometric Mean:Fecal = 52Entero = 856
Geometric Mean:Fecal = 6,641Entero = 20,125
Geometric Mean:Fecal = 6,500Entero = 9,487
Geometric Mean:Fecal = 3,699Entero = 16,971
Geometric Mean:Fecal = 733Entero = 1,530
Fecal and entero valuesexpressed as cfu/100ml
FIGURE 1
309B
453B252B
Soil Limit
316B
NOTE: Base Plan developed fromStorm Drain Mapping, 2008,by Environmental Partners, Quincy, MA
Outfall #043
Outfall #195
Outfall #197 Outfall #051A
Outfall #193
Outfall #047
Outfall #041B
Outfall #059
CONCEPTUAL DESIGNS
KINGSTON BAY AT JONES RIVER
FOR
KINGSTON, MAA T P ENVIRONMENTAL 77 SHEFFIELD ROAD MELROSE, MA 02176 781-662-6033
DATE: DECEMBER 14, 2011 SHEET NO: 1 PROJ. NO. 11-222
100 400
( IN FEET )1 inch = 100 ft.
GENERAL NOTES
1. Existing conditions based upon field inspections by ATP Environmental, supplemented by information provided by the Kingston Conservation agent.
2. Screened background is presented at 100-Scale based upon mapping obtained courtesy of the Massachusetts Geographic Information System.
3. Size of existing and proposed structures is approximate.
4. The proposed facilities were used to develop an estimate of construction cost.
5. Figure 1 serves as the source for location of all outfalls depicted on this Sheet.
1000 200
Stony Brook
LANDING ROAD
MAPLE STREET JRWA
RIVERSIDE DRIVE
LANDING ROAD
PARKSTREET
JONESRIVERDRIVE
BAY FARM ROAD
SHORE DRIVE
CEDAR LANE
JONES
RIVER
LANDING ROAD
RAILROAD TRACKS
JONESRIVER
KINGSTON BAY
KINGSTON BAY
MAPLE STREET
New 1250 Gal. ST
1250 Gal. STConnect toexisting cbs
8 Cultec 330 HDs2 x 4 array11' x 28' x 30.5"H
2 New CBs
New 1250 Gal. ST
8 Cultec 330 HDs2 x 4 array11' x 28' x 30.5"H
2 New CBs
8 Cultec 330 HDs2 x 4 array11' x 28' x 30.5"HExisting cb (typ)
Outfall #051A
4 Cultec 330 HDs2 x 2 array11' x 14' x 30.5"H
New 6' DMHw/ 3' sump.Connect toexisting cb.
Outfall #197
10 Cultec 330 HDs2 x 5 array11' x 35' x 30.5"H
New 1500 Gal. ST
2 New CBs
700 SF vegetatedcircle, 18" deepw/ underdrain,to be located in field.
New 1500 Gal. STw/ divider wall.
Underdrain returnNew 4' DMH
New 1000 Gal. ST
6 Cultec 330 HDs2 x 3 array11' x 21' x 30.5"H
New 4' CB
Repipe exist. cbOutfall #195
500 SF of vegetatedleaching swale18" deep.
Outfall#193
4 Cultec 330 HDs2 x 2 array11' x 14' x 30.5"H
New 6' DMHw/ 3' sump.Connect toexisting cb.
3 Cultec 330 HDs1 x 3 array6.3' x 21' x 30.5"H
New 5' DMHw/ 3' sump.
New 4' DMHNew 4' DMH
Outfall #047
600 SF of vegetatedleaching swale18" deep w/ underdrainreturn to cb.
Outfall #043
LEGEND
Existing catchbasin
Existing drain line
Proposed catchbasin
Proposed drain lineProposed structure
Proposed vegetated swale
Existing DMH
Outfall#041B
500 SF vegetatedarea, 18" deep.
1250 Gal. STw/ divider wall.Connect toexisting outfall.
2 New CBsNew 6' DMHw/ 3' sump.
14 Cultec 180 HDs2 x 7 array8.5' x 49' x 20.5"H PAGE AVE.
450 SF vegetatedarea, 18" deep.
1000 Gal. STw/ divider wall.Connect toexisting outfall.
32
26
24 20
16
18
16 Contour
14
18
18
30
36
Outfall #059
28
14
20
28
20
24
12
16
14
12
9
18
Outfall #041
Outfall #047B
MARSH ROAD
JONES RIVER DR
ARROW STREET
LORING ROAD
6 Cultec 330 HDs2 x 3 array11' x 21' x 30.5"H
2 New CBs5' DMH w/ 5' sump
600 SF vegetatedarea, 15" deep.
1250 Gal. STw/ divider wall.Connect toexisting outfall. Outfall #041
JONESRIVER
JONES RIVER DR
250 SF vegetatedarea, 15" deep.
6 Cultec 180 HDs2 x 3 array21' x 9' x 20.5"H
New 4' DMHw/ 4' sump.
New 4' DMHDiversion MH.
RIVER ST
850 SF vegetatedarea, 12" deep.
23
20
23
28
12
2328
27
Outfall #047B

8
8
76
9
9
1011121314151617181920212223
24
PRELIMINARY DESIGN OUTFALL 041A
TOWN LANDINGFOR
KINGSTON, MAA T P ENVIRONMENTAL 77 SHEFFIELD ROAD MELROSE, MA 02176 781-662-6033
DATE: DECEMBER 27, 2011 SHEET NO: 1 of 2 PROJ. NO. 11-222
20 80
( IN FEET )1 inch = 20 ft.
200 40
25
40
45
49
48
47
46
44
43
42
41
39
38
3728 27 26
24
6"W
8"W
6"W
S
23
24
25
S
4' DMH w/4' sumpInv. in = 15.8Inv. out = 15.8
20
RIVER RD
RIVER RD4' CB w/4' sumpgrate elev. = 18.8Inv. = 15.8
4' DMH w/4' sumpInv. in = 18.6Inv. out = 18.6
4' CB w/4' sumpgrate elev. 21.6Inv. = 18.6
2 Rows of 6Cultec 330HDsInv. in = 15.7Bottom Elev. 14.3
APPROX. PROPERTY LINE
APPROX. PROPERTY LINE
TOWN LANDING
GENERAL NOTES
1. All vessels including, but not limited to catchbasins, drain manholes, leaching structures, septic tanks, sleeves, and vessel covers, shall be designed and built for H-20 loading. Unless otherwise indicated, vessels shall be set on a 6" thick layer of 3/4" minus crushed stone compacted to 95% (MDPW M2.01.4) overlying a firm, stable subbase.
2. Existing conditions and topography obtained per field survey performed November 21, 2011 by A T P ENVIRONMENTAL.
3. Topographic survey completed based on USGS 1929 datum from magnetic nail set in River Street Pier by Grady Consulting, Inc., Kingston, MA, 2002: Elev. 7.76
4. All new pipe is to be HDPE unless otherwise shown. Pipe shall be set atop bed 12" deep (min) comprised of 1" (max) stone backfilled to spring line. Maximum trench width shall not exceed five (5) feet.
5. An appropriately sized oil trap hood (Snout) shall be installed where noted on the plans.
6. All new drain manholes to be fitted with catchbasin grates a) Frame and grate to be Le Baron LA 248-2. b) Drain manhole hood to be BMP "Snout" or equivlent. c) Set frame in full bed of mortar. Bricks (3-5 courses) may be used for grade adjusments. d) Mortar all joints e) Provide "V" openings for pipes with 2" clearance outside op pipe. f) Provide min. of 0.12 sq. in. of steel per vertical foot and place per AASHTO M199. g) Construction material for structure to consist of concrete block set in mortar or precast concrete with a 28 day compressive strength of 4000 psi.
7. Contractor must notify "DIGSAFE" at 1-888-344-7233 at least 72 hours prior to construction.
8. All new drain manholes shall have risers with frame and grate to grade as shown on plans.
9. Contractor shall comply with all applicable Federal, State, and local trenching requirements.
10. All pavement to be sawcut; no jackhammer cutting.
PROJECT LOCUS1" = 2000'
LOCUS
TBM: ELEV. 7.76
OUTFALL #041A
Rain Garden20' x 12' by 15" deepBottom elev. 6.9Build with 3 rows of8" concrete block
Concrete block gutter inletInv. = 5.1
approx. limitof new workon pier
4' DMH w/grate elev. 7.7Inv. = 4.4
Concrete block gutter inletInv. = 5.1
4' CB w/4' sumpInv. = 6.9
4' CB w/4' sumpInv. = 7.3
5' Dia. Special DMHWith divider wall elev. 8.2Inv. in (nw) = 6.9Inv. in (sw) = 6.9Inv. out (s) = 6.9Inv. out (se) = 5.9
5' Dia. Special DMHWith divider wall elev. 6.0Inv. in (n) = 5.0Inv. in (e) = 5.0Inv. out (w) = 5.0Inv. out (s) = 5.0
4 rows of 3 Cultec 125 HD18" tallBottom elev. = 4.5
2 Rows of 6Cultec 330HDsInv. in = 18.5Bottom Elev. 17.0
4' DMH w/4' sumpInv. in = 15.8Inv. out = 15.8
2 Rows of 6Cultec 330HDsInv. in = 15.7Bottom Elev. 14.3
4' CB w/4' sumpgrate elev. 37.5Inv. = 34.5
5' DMH w/4' sumpInv. in = 34.5Inv. out = 34.5
2 Rows of 3Cultec 330HDsInv. in = 34.4Bottom Elev. 33.0
Shallow Cape Cod Berm

9
1314
15 1617
18
19
20 21
22 23
24
25
26
27
28
2930
31 3233
34
3536
3738
39
40
4142
43
44
20 20 40
20
8010
PRELIMINARY DESIGN PAVED SWALE #4
DELANO STREETFOR
KINGSTON, MAA T P ENVIRONMENTAL 77 SHEFFIELD ROAD MELROSE, MA 02176 781-662-6033
DATE: DECEMBER 27, 2011 SHEET NO: 2 of 2 PROJ. NO. 11-222
20 80
( IN FEET )1 inch = 20 ft.
200 40
18' Dia. Rain GardenBottom elev. = 14.7
4' Dia.DMH w/grate elev. = 15.3
4' Dia.DMH w/grate elev. = 15.3
5' Dia.DMH w/4' sumpInv. in = 12.8Inv. out = 12.8
12" Trench Draingrate elev. 15.8
APPROX. PROPERTY LINE
18' Dia. Rain GardenBottom elev. = 14.7
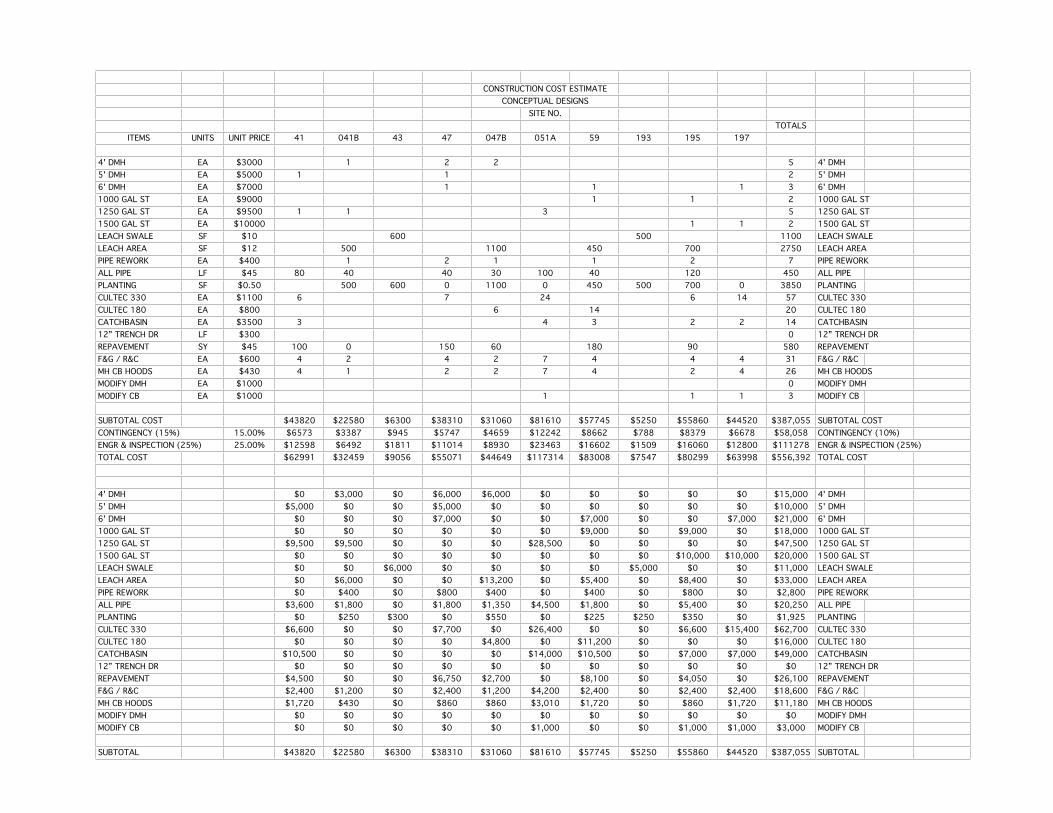
CONSTRUCTION COST ESTIMATECONSTRUCTION COST ESTIMATECONSTRUCTION COST ESTIMATECONCEPTUAL DESIGNSCONCEPTUAL DESIGNSCONCEPTUAL DESIGNS
SITE NO.TOTALS
ITEMS UNITS UNIT PRICE 41 041B 43 47 047B 051A 59 193 195 197
4' DMH EA $3000 1 2 2 5 4' DMH5' DMH EA $5000 1 1 2 5' DMH6' DMH EA $7000 1 1 1 3 6' DMH1000 GAL ST EA $9000 1 1 2 1000 GAL ST1000 GAL ST1250 GAL ST EA $9500 1 1 3 5 1250 GAL ST1250 GAL ST1500 GAL ST EA $10000 1 1 2 1500 GAL ST1500 GAL STLEACH SWALE SF $10 600 500 1100 LEACH SWALELEACH SWALELEACH AREA SF $12 500 1100 450 700 2750 LEACH AREALEACH AREAPIPE REWORK EA $400 1 2 1 1 2 7 PIPE REWORKPIPE REWORKALL PIPE LF $45 80 40 40 30 100 40 120 450 ALL PIPEPLANTING SF $0.50 500 600 0 1100 0 450 500 700 0 3850 PLANTINGCULTEC 330 EA $1100 6 7 24 6 14 57 CULTEC 330CULTEC 330CULTEC 180 EA $800 6 14 20 CULTEC 180CULTEC 180CATCHBASIN EA $3500 3 4 3 2 2 14 CATCHBASINCATCHBASIN12” TRENCH DR LF $300 0 12” TRENCH DR12” TRENCH DRREPAVEMENT SY $45 100 0 150 60 180 90 580 REPAVEMENTREPAVEMENTF&G / R&C EA $600 4 2 4 2 7 4 4 4 31 F&G / R&CMH CB HOODS EA $430 4 1 2 2 7 4 2 4 26 MH CB HOODSMH CB HOODSMODIFY DMH EA $1000 0 MODIFY DMHMODIFY DMHMODIFY CB EA $1000 1 1 1 3 MODIFY CB
SUBTOTAL COST $43820 $22580 $6300 $38310 $31060 $81610 $57745 $5250 $55860 $44520 $387,055 SUBTOTAL COSTSUBTOTAL COSTCONTINGENCY (15%)CONTINGENCY (15%) 15.00% $6573 $3387 $945 $5747 $4659 $12242 $8662 $788 $8379 $6678 $58,058 CONTINGENCY (10%)CONTINGENCY (10%)ENGR & INSPECTION (25%)ENGR & INSPECTION (25%) 25.00% $12598 $6492 $1811 $11014 $8930 $23463 $16602 $1509 $16060 $12800 $111278 ENGR & INSPECTION (25%)ENGR & INSPECTION (25%)ENGR & INSPECTION (25%)TOTAL COST $62991 $32459 $9056 $55071 $44649 $117314 $83008 $7547 $80299 $63998 $556,392 TOTAL COSTTOTAL COST
4' DMH $0 $3,000 $0 $6,000 $6,000 $0 $0 $0 $0 $0 $15,000 4' DMH5' DMH $5,000 $0 $0 $5,000 $0 $0 $0 $0 $0 $0 $10,000 5' DMH6' DMH $0 $0 $0 $7,000 $0 $0 $7,000 $0 $0 $7,000 $21,000 6' DMH1000 GAL ST $0 $0 $0 $0 $0 $0 $9,000 $0 $9,000 $0 $18,000 1000 GAL ST1000 GAL ST1250 GAL ST $9,500 $9,500 $0 $0 $0 $28,500 $0 $0 $0 $0 $47,500 1250 GAL ST1250 GAL ST1500 GAL ST $0 $0 $0 $0 $0 $0 $0 $0 $10,000 $10,000 $20,000 1500 GAL ST1500 GAL STLEACH SWALE $0 $0 $6,000 $0 $0 $0 $0 $5,000 $0 $0 $11,000 LEACH SWALELEACH SWALELEACH AREA $0 $6,000 $0 $0 $13,200 $0 $5,400 $0 $8,400 $0 $33,000 LEACH AREALEACH AREAPIPE REWORK $0 $400 $0 $800 $400 $0 $400 $0 $800 $0 $2,800 PIPE REWORKPIPE REWORKALL PIPE $3,600 $1,800 $0 $1,800 $1,350 $4,500 $1,800 $0 $5,400 $0 $20,250 ALL PIPEPLANTING $0 $250 $300 $0 $550 $0 $225 $250 $350 $0 $1,925 PLANTINGCULTEC 330 $6,600 $0 $0 $7,700 $0 $26,400 $0 $0 $6,600 $15,400 $62,700 CULTEC 330CULTEC 330CULTEC 180 $0 $0 $0 $0 $4,800 $0 $11,200 $0 $0 $0 $16,000 CULTEC 180CULTEC 180CATCHBASIN $10,500 $0 $0 $0 $0 $14,000 $10,500 $0 $7,000 $7,000 $49,000 CATCHBASINCATCHBASIN12” TRENCH DR $0 $0 $0 $0 $0 $0 $0 $0 $0 $0 $0 12” TRENCH DR12” TRENCH DRREPAVEMENT $4,500 $0 $0 $6,750 $2,700 $0 $8,100 $0 $4,050 $0 $26,100 REPAVEMENTREPAVEMENTF&G / R&C $2,400 $1,200 $0 $2,400 $1,200 $4,200 $2,400 $0 $2,400 $2,400 $18,600 F&G / R&CMH CB HOODS $1,720 $430 $0 $860 $860 $3,010 $1,720 $0 $860 $1,720 $11,180 MH CB HOODSMH CB HOODSMODIFY DMH $0 $0 $0 $0 $0 $0 $0 $0 $0 $0 $0 MODIFY DMHMODIFY DMHMODIFY CB $0 $0 $0 $0 $0 $1,000 $0 $0 $1,000 $1,000 $3,000 MODIFY CB
SUBTOTAL $43820 $22580 $6300 $38310 $31060 $81610 $57745 $5250 $55860 $44520 $387,055 SUBTOTAL

CONSTRUCTION COST ESTIMATECONSTRUCTION COST ESTIMATECONSTRUCTION COST ESTIMATEPRELIMINARY DESIGNSPRELIMINARY DESIGNSPRELIMINARY DESIGNS
Public Town TOTALSITEMS UNITS UNIT PRICE Swale #4 Landing
4' DMH EA $3000 4 45' DMH EA $5000 2 2 46' DMH EA $7000 01000 GAL ST EA $9000 01250 GAL ST EA $9500 01500 GAL ST EA $10000 0LEACH SWALE SF $10 0LEACH AREA SF $12 510 510PIPE REWORK EA $400 0ALL PIPE LF $45 60 470 530PLANTING SF $0.50 510 100 610CULTEC 330 EA $1100 22 22CULTEC 180 EA $800 12 12CATCHBASIN EA $3500 2 9 1112” TRENCH DR LF $300 20 20REPAVEMENT SY $45 30 700 730F&G / R&C EA $600 4 16 20MH CB HOODS EA $430 2 13 15MODIFY DMH EA $1000 0MODIFY CB EA $1000 1 1CAPE COD BERM LF $20 130 130
SUBTOTAL COST $36685 $158790 $195,475CONTINGENCY (10%)CONTINGENCY (10%) 10.00% $3669 $15879 $19,548ENGR & INSPECTION (25%)ENGR & INSPECTION (25%) 25.00% $10088 $43667 $53,756TOTAL COST $50442 $218336 $268,778
4' DMH $0 $12,000 $12,0005' DMH $10,000 $10,000 $20,0006' DMH $0 $0 $01000 GAL ST $0 $0 $01250 GAL ST $0 $0 $01500 GAL ST $0 $0 $0LEACH SWALE $0 $0 $0LEACH AREA $6,120 $0 $6,120PIPE REWORK $0 $0 $0ALL PIPE $2,700 $21,150 $23,850PLANTING $255 $50 $305CULTEC 330 $0 $24,200 $24,200CULTEC 180 $0 $9,600 $9,600CATCHBASIN $7,000 $31,500 $38,50012” TRENCH DR $6,000 $0 $6,000REPAVEMENT $1,350 $31,500 $32,850F&G / R&C $2,400 $9,600 $12,000MH CB HOODS $860 $5,590 $6,450MODIFY DMH $0 $0 $0MODIFY CB $0 $1,000 $1,000CAPE COD BERM $0 $2,600 $2,600SUBTOTAL $36685 $158790 $195,475


Related Documents