Page 1 of 427 The Second Study of Infectious Intestinal Disease in the Community (IID2 Study) Project Number: B18021 Funder: UK Food Standards Agency Final Report Report Authors Clarence Tam, Laura Viviani, Bob Adak, Eric Bolton, Julie Dodds, John Cowden, Meirion Evans, Jim Gray, Paul Hunter, Kathryn Jackson, Louise Letley, Keith Neal, Greta Rait, Gillian Smith, Brian Smyth, David Tompkins, Mike van der Es, Laura Rodrigues and Sarah O‟Brien on behalf of the IID2 Study Executive Committee Project Lead Contractor Sarah J O‟Brien University of Manchester www.gutfeelings.org.uk UK Data Archive Study Number 7820 - Second Study of Infectious Intestinal Disease in the United Kingdom, 2008-2009

Welcome message from author
This document is posted to help you gain knowledge. Please leave a comment to let me know what you think about it! Share it to your friends and learn new things together.
Transcript
Page 1 of 427
The Second Study of Infectious Intestinal Disease in the Community
(IID2 Study)
Project Number: B18021
Funder: UK Food Standards Agency
Final Report
Report Authors
Clarence Tam, Laura Viviani, Bob Adak, Eric Bolton, Julie Dodds, John Cowden,
Meirion Evans, Jim Gray, Paul Hunter, Kathryn Jackson, Louise Letley, Keith Neal,
Greta Rait, Gillian Smith, Brian Smyth, David Tompkins, Mike van der Es,
Laura Rodrigues and Sarah O‟Brien
on behalf of the IID2 Study Executive Committee
Project Lead Contractor
Sarah J O‟Brien
University of Manchester
www.gutfeelings.org.uk
UK Data Archive Study Number 7820 - Second Study of Infectious Intestinal Disease in the United Kingdom, 2008-2009
Page 2 of 427
TABLE OF CONTENTS
Chapter Title Page
Acknowledgements 12
List of Abbreviations 14
List of Figures 16
List of Tables 20
1 EXECUTIVE SUMMARY 23
1.1 Introduction 23
1.2 Objectives 23
1.3 Methods 24
1.3.1 Study 1: National Telephone Survey 24
1.3.2 Study 2: Prospective Population-Based Cohort
Study
24
1.3.3 Study 3: General Practice (GP) Presentation Study 25
1.3.4 Study 4: General Practice (GP) Validation Study 25
1.3.5 Study 5: General Practice (GP) Enumeration Study 25
1.3.6 Study 6: Microbiology Study 25
1.3.7 Study 7: National Reporting Study 26
1.4 Results and Interpretation 26
1.5 Conclusion 29
2 BACKGROUND AND OBJECTIVES 30
2.1 Infectious Intestinal Disease 30
2.1.1 What is IID? 30
2.1.2 Pathogens that commonly cause IID 32
2.2 National Surveillance for IID 32
2.2.1 Statutory notification 33
2.2.2 Voluntary reports from diagnostic laboratories 34
2.2.3 Surveillance scheme for general outbreaks of IID 35
2.2.4 Primary care and community surveillance 36
2.2.4.1 RCGP Weekly Returns Service (WRS) 36
2.2.4.2 HPA/Q Surveillance National Surveillance Scheme 36
Page 3 of 427
Chapter Title Page
2.2.4.3 NHS Direct/HPA Syndromic Surveillance Scheme 37
2.3 The Surveillance Pyramid 37
2.4 The Epidemiology of IID 39
2.5 Rationale for the Current Study 42
2.5.1 The Food Standards Agency‟s foodborne illness
reduction target
42
2.5.2 The First Study of Infectious Intestinal Disease (IID1) 43
2.5.3 Changes to Surveillance Systems since IID1 43
2.5.4 Changes to diagnostic microbiology since IID1 44
2.5.5 Methods for Estimating the Population Burden of IID 44
2.6 The Second Study of Infectious Intestinal
Disease (IID2)
47
2.6.1 Design innovations 47
2.6.2 Changes to microbiological methods 48
2.6.3 Objectives 50
3 METHODS 51
3.1 Overview of Study Design 51
3.1.1 Study 1: National Telephone Survey 51
3.1.2 Study 2: Prospective Population-Based Cohort
Study
52
3.1.3 Study 3: General Practice (GP) Presentation Study 52
3.1.4 Study 4: General Practice (GP) Validation Study 52
3.1.5 Study 5: General Practice (GP) Enumeration Study 52
3.1.6 Study 6: Microbiology Study 53
3.1.7 Study 7: National Reporting Study 53
3.2 Setting 53
3.3 Case Definitions and Exclusion Criteria 53
3.4 Ethics Committee Favourable Opinion and
Consent
54
3.5 Pilot Studies 55
Page 4 of 427
Chapter Title Page
3.5.1 Objectives 55
3.5.1.1 National Telephone Survey 55
3.5.1.2 Prospective Population-Based Cohort Study 55
3.5.1.3 GP Presentation Study 55
3.5.1.4 GP Validation Study 55
3.5.1.5 GP Enumeration Study 55
3.5.1.6 Microbiology Studies 55
3.5.2 Methods 56
3.5.2.1 National Telephone Survey 56
3.5.2.2 Prospective Population-Based Cohort Study 56
3.5.2.3 GP Presentation Study 57
3.5.2.4 GP Validation Study 57
3.5.2.5 GP Enumeration Study 57
3.5.2.6 Microbiology Studies 57
3.5.3 Results and Discussion 58
3.5.3.1 Telephone Survey 58
3.5.3.2 Prospective Population-Based Cohort Study 58
3.5.3.3 GP Presentation Study 58
3.5.3.4 GP Validation Study 58
3.5.3.5 GP Enumeration Study 59
3.5.3.6 Microbiology Studies 59
3.5.4 Implications for the Main Studies 59
3.5.5 Changes to the Study Protocol and Study Material
as a Result of the Pilot Studies
60
3.5.5.1 Dropping the Third Telephone Call 60
3.5.5.2 Replacing the Next Birthday Method of Random
Sampling within Households
60
3.5.5.3 Improving Participation in the Prospective
Population-Based Cohort Study
60
3.5.5.4 Improving Invitations to the GP Presentation Study 60
Page 5 of 427
Chapter Title Page
3.5.5.5 Streamlining questions on occupation 61
3.6 Main Studies 62
3.6.1 National Telephone Survey of Self-Reported Illness 62
3.6.2 Prospective Population-Based Cohort Study 64
3.6.2.1 Training 64
3.6.2.2 Participant recruitment 65
3.6.2.3 E-mail follow-up 66
3.6.2.4 Postcard follow-up 67
3.6.2.5 Second phase of recruitment 67
3.6.3 General Practice (GP) Presentation Study 67
3.6.4 General Practice (GP) Validation Study 68
3.6.5 General Practice (GP) Enumeration Study 69
3.6.6 NHS Direct/NHS24 70
3.6.7 National Surveillance Study 70
3.6.8 Sample Size Calculations 71
3.6.8.1 Telephone Survey 71
3.6.8.2 Prospective Population-Based Cohort Study 72
3.6.8.3 GP Presentation Study 72
3.6.9 Microbiology Studies 73
3.6.9.1 Stool Sample Collection 73
3.6.9.2 Processing of Samples at HPA Regional Laboratory
in Manchester
74
3.6.9.3 Molecular Methods used at HPA Centre for
Infections
80
3.6.9.4 Definition of positive quantitative PCR results based
on molecular methods used at the CfI
83
3.7 External Sources of Data used in Analysis 84
3.7.1 Census and area-level data 84
3.7.2 International Passenger Survey 85
Page 6 of 427
Chapter Title Page
3.7.3 Royal College of General Practitioners Weekly
Returns Service
85
3.8 Data Management and Quality Control 86
3.8.1 Data management 86
3.8.2 Questionnaires and Forms/Study Registers 86
3.8.2.1 Questionnaires 86
3.8.2.2 Study Registers 87
3.8.2.3 Study Newsletters 87
3.8.3 Web-Based Data System for Prospective Studies 87
3.8.3.1 Reports 88
3.8.3.2 Weekly Monitoring meetings 88
3.8.3.3 Data flow 89
3.8.3.4 Data security 91
3.8.4 Telephone Survey Database 91
3.8.4.1 Data security 91
3.8.5 Quality Control 92
3.8.5.1 Data Collection by Study Nurses 92
3.8.5.2 Web-Based Data System 92
3.8.5.3 Study Registers 93
3.8.5.4 Quality control at the HPA Manchester Laboratory 93
3.8.5.5 Quality control at CfI 94
3.8.5.6 Quality control in the Telephone Survey 94
3.8.6 Audit Programme 94
3.8.6.1 Internal Audit Programme 94
3.8.6.2 External Audit 95
3.9 Statistical Methods 95
3.9.1 Methods for participation, representativeness and
compliance in the Telephone Survey, Prospective
Cohort Study and GP Presentation Study
95
3.9.1.1 Participation 95
Page 7 of 427
Chapter Title Page
3.9.1.2 Representativeness 96
3.9.1.3 Compliance 96
3.9.1.4 Completeness of follow-up 97
3.9.2 Incidence of IID in the community 97
3.9.2.1 Definition of cases 97
3.9.2.2 Incidence calculations 97
3.9.3 Incidence of IID in the Telephone Survey 99
3.9.4 Comparing incidence rates in the Prospective Cohort
Study and Telephone Survey
100
3.9.5 Incidence of consultations to NHS Direct/NHS24 for
diarrhoea and vomiting
101
3.9.6 Incidence of IID presenting to General Practice 102
3.9.7 Triangulation of incidence rates presenting to
primary care
103
3.9.8 Organism-specific incidence of IID 104
3.9.8.1 Microbiological Findings in Cases 104
3.9.8.2 Imputation of missing data on microbiological testing 104
3.9.9 Reporting patterns of IID 105
3.9.9.1 Incidence of IID reported to National Surveillance 105
3.9.9.2 Incidence of IID in the community, presenting to
general practice, and reported to national
surveillance
106
3.9.10 Comparing aetiology and incidence of IID in the IID1
and IID2 studies
106
4 PARTICIPATION, REPRESENTATIVENESS AND
COMPLIANCE
109
4.1 Practice Characteristics 109
4.2 Prospective Population-Based Cohort Study 112
4.2.1 Recruitment and representativeness 112
4.2.2 Follow-up 119
4.2.3 Compliance 121
Page 8 of 427
Chapter Title Page
4.3 Telephone Survey 122
4.3.1 Recruitment and representativeness 122
4.4 GP Presentation Study 130
4.4.1 Recruitment 130
4.4.2 Under-ascertainment 132
4.5 GP Enumeration Study 136
4.6 Specimen Collection 136
5 INCIDENCE RATES 139
5.1 Incidence Rates in the Prospective Population-
Based Cohort Study
139
5.2 Incidence Rates in the Telephone Survey 141
5.3 Comparing the Incidence Rates of Overall IID in
the Prospective Population-Based Cohort Study
and Telephone Survey
144
5.4 Incidence Rates in NHS Direct 146
5.5 Incidence Rates in the GP Presentation Study 148
5.6 Triangulation of Incidence Rates 149
5.6.1 Comparing estimates of incidence of IID presenting
to general practice and consulting NHS Direct from
different studies
149
5.6.2 Reporting pattern for overall IID in the UK 153
5.6.3 Travel-related IID 154
6 ORGANISM-SPECIFIC INCIDENCE RATES OF IID 155
6.1 Microbiological Findings in the Prospective
Population-Based Cohort and GP Presentation
Cases
155
6.1.1 Prospective Population-Based Cohort Study 155
6.1.2 GP Presentation Study 157
6.1.3 Factors associated with negative specimens 159
6.1.4 Mixed infections 160
6.2 Organism-Specific Incidence Rates of IID in the 160
Page 9 of 427
Chapter Title Page
Community and Presenting to General Practice
6.3 Reporting Patterns of IID by Organism and
Reporting Ellipses
163
7 COMPARING AETIOLOGY AND INCIDENCE
RATES OF IID IN ENGLAND IN THE IID1 AND IID2
STUDIES
167
7.1 Incidence Rates of Overall IID in IID1 and IID2
Studies
167
7.2 Aetiology of IID in IID1 and IID2 Studies 172
7.3 Reporting Patterns by Organism in the IID1 and
IID2 Studies
174
8 DISCUSSION, CONCLUSIONS AND
RECOMMENDATIONS
179
8.1 Summary of Main Findings 179
8.2 Strengths and Limitations of the Study 180
8.2.1 Prospective Cohort Study 180
8.2.1.1 Person-Years of Follow-Up and Study Power 180
8.2.1.2 Participation and Cohort Population 181
8.2.1.3 Weekly Follow-Up and Reporting Fatigue 182
8.2.1.4 Questionnaire and stool sample submission from
participants reporting symptoms
182
8.2.2 GP Presentation and Validation Studies 183
8.2.2.1 Practice Population Characteristics 183
8.2.2.2 Participation and Compliance 183
8.2.2.3 Under-ascertainment 184
8.2.3 Advantages and Disadvantages of the Prospective
Cohort Study and the GP Presentation Study
185
8.2.4 GP Enumeration Study 185
8.2.4.1 Read code searches 185
8.2.5 Microbiology Studies 186
8.2.5.1 Diagnostic Methods 186
Page 10 of 427
Chapter Title Page
8.2.5.2 Lack of controls and implications for defining positive
results
187
8.2.5.3 Missing specimens 188
8.2.5.4 Mixed infections 189
8.2.6 National Surveillance Study 189
8.2.6.1 Inability to perform data linkage 189
8.2.6.2 Inclusion in national surveillance data of organisms
of doubtful pathogenicity
190
8.2.6.3 Recording dates 190
8.2.7 Telephone Survey 190
8.2.7.1 Participation 190
8.2.7.2 Sampling within households 191
8.2.7.3 Case definition of IID 192
8.2.7.4 Inaccurate recall and digit preference 192
8.2.7.5 Advantages and Disadvantages of the Telephone
Survey
192
8.2.8 NHS Direct/NHS24 193
8.2.8.1 Population covered 193
8.2.8.2 Algorithms 193
8.2.8.3 Data availability 193
8.2.9 Simulation Methods 193
8.3 Interpretation 194
8.3.1 Estimated rates of IID in the community in the UK 194
8.3.2 Estimated rates of IID presenting to primary care in
the UK
196
8.3.3 Aetiology of IID in the UK 197
8.3.4 Comparing IID1 with IID2 in England 199
8.3.4.1 IID rates in the community 199
8.3.4.2 IID rates presenting to primary care 199
8.3.4.3 Re-calibrating national surveillance – reporting 200
Page 11 of 427
Chapter Title Page
patterns
8.3.4.4 IID acquired outside the UK 201
8.4 Conclusions 201
8.5 Recommendations 203
8.5.1 Recommendations for laboratory diagnostics 203
8.5.2 Recommendations for estimating illness burden and
trends
203
8.5.3 Recommendations for Policy 205
REFERENCES 206
ANNEX: SUPPLEMENTARY RESULTS 215
Chapter 4 Annex 217
Chapter 5 Annex 230
Chapter 6 Annex 237
APPENDICES 251
Table of Contents 251
Last Page 427

Page 12 of 427
ACKNOWLEDGEMENTS
First and foremost, the IID2 study Executive Committee* wishes to thank all the
participants, study nurses, general practitioners, practice staff, telephonists,
laboratory, research and administrative staff who took part in the IID2 Study. We are
grateful to the Medical Research Council General Practice Research Framework, the
Primary Care Research Networks in England and Northern Ireland and the Scottish
Primary Care Research Network for assistance with the recruitment of General
Practices.
We thank the UK Food Standards Agency and the Department of Health for
funding the research component of the IID2 Study (Project B18021). We thank the
Department of Health, the Scottish Primary Care Research Network, NHS Greater
Glasgow and Clyde, NHS Grampian, NHS Tayside, the Welsh Assembly
Government (Wales Office of Research and Development) and, in Northern Ireland,
the Health and Social Care Public Health Agency (HSC Research and Development)
for providing service support costs.
At the Food Standards Agency we are also very grateful to Paul Cook for
chairing the IID2 Study Executive Committee, Josh Atkinson, Clifford Gay, Louise
Knowles and Gael O‟Neill. At the Department of Health we should like to thank Brian
Duerden and Sally Wellsteed.
We wish to thank the following colleagues for their invaluable contributions to
the smooth running of the study:- Ruth Bastick, Valerie Brueton, Tamsin D‟Estrube,
Jane Elwood, Kay Foulger, Sue Fox, Vania Gay, Anne Hall, Lesley Hand, Fiona
Leslie, Hansa Shah and Anna Williams at the MRC General Practice Research
Framework; Anthony Dyer and Lisa Irvine at the University of East Anglia; Emma
Dixon and Mike Pigram at the University of Manchester; Katherine Mather, Alan
Ridge and Bernard Wood at the Health Protection Agency Regional Laboratory in
Manchester; Corine Amar, Lisa Berry, Dalia Choudhury, Fenella Halstead, John
Harris, Miren Iturriza-Gomara, Ben Lopman, Jim McLauchlin and John Wain at the
HPA Centre for Infections; Julian Gardiner, Barbara Stacey and Susanne St Rose at
the London School of Hygiene and Tropical Medicine; Trish Buckley, Tina Hayes and
Shirley Large at NHS Direct; Alex Elliott and Paul Loveridge at Health Protection
Agency West Midlands; Susan Brownlie and Mary Locking at Health Protection

Page 13 of 427
Scotland; Ruth Campbell and Jim Crawford at the Public Health Agency of Northern
Ireland.
We are very grateful to Carl Barnett, David McGavin and Samuel Venables
from Egton Software Services for developing the web-based data system and for
ongoing technical support; Dyfrig Parri at Languages for Business Ltd for Welsh
translations; Geoff Warburton at Q-Ten for the IID2 Study logo; Darren Coffey,
Amelia Hibbs, Graeme Johnson and Steve Rowe at Osmosis Brand
Communications for marketing advice and re-designing study materials.
Last, but not least, we thank Michael O‟Brien for proof-reading this document.
* Members are:- Bob Adak, Eric Bolton, Paul Cook, John Cowden, Meirion Evans, Jim Gray, Paul
Hunter, Louise Letley, Jim McLauchlin, Keith Neal, Sarah O'Brien, Greta Rait, Laura Rodrigues,
Gillian Smith, Brian Smyth, Clarence Tam and David Tompkins.
Page 14 of 427
LIST OF ABBREVIATIONS
ACMSF Advisory Committee on the Microbiological Safety of Food
BMS Biomedical Scientist
CDSC NI Communicable Disease Surveillance Centre, Northern Ireland
(Northern Ireland Public Health Agency from October 2009)
CfI Centre for Infections
CI Confidence Intervals
CT value Cycle threshold value
CV Coefficient of variation
EIA Enzyme Immunoassay
EMIS Egton Medical Information Systems
FSA Food Standards Agency
GCP Good Clinical Practice in Research
GP General Practice
HPA Health Protection Agency
HPS Health Protection Scotland
IID Infectious Intestinal Disease
IID1 The First Study of Infectious Intestinal Disease in the Community
IID2 The Second Study of Infectious Intestinal Disease in the
Community (this study)
IMD Index of Multiple Deprivation
IQA Internal Quality Assurance
IQC Internal Quality Control
LGP Laboratory of Gastrointestinal Pathogens
LSHTM London School of Hygiene and Tropical Medicine
MLA Medical Laboratory Assistant
MRC GPRF Medical Research Council General Practice Research Framework
NS-SEC National Statistics Socioeconomic Classification
ONS Office of National Statistics
PCR Polymerase chain reaction
Page 15 of 427
RCGP WRS Royal College of General Practitioners‟ Weekly Returns Service
RR Rate Ratio
RTN Regional Training Nurse
RT PCR Reverse Transcription Polymerase Chain Reaction
SOP Standard operating procedure
SSL Secure Socket Layer
UEA University of East Anglia
UoM University of Manchester
VTEC Vero cytotoxin-producing E. coli
WHO World Health Organisation
Page 16 of 427
LIST OF FIGURES
Title Page
Figure 2.1 The inter-relationships between terms used to describe
gastrointestinal and foodborne disease
31
Figure 2.2 The surveillance pyramid: laboratory reports represent only a
fraction of the true prevalence of IID
38
Figure 2.3 The surveillance ellipse: the relationship between IID in the
community, presenting to general practice, and reported to
national surveillance
39
Figure 2.4 Laboratory reports of Campylobacter in the UK, 1993-2008 40
Figure 2.5 Laboratory reports of Salmonella by serotype in the UK,
1983-2008
41
Figure 2.6 Laboratory reports of VTEC O157 in the UK, 1988-2008 41
Figure 2.7 Trends in human listeriosis showing an increase in
bacteraemia in people over 60 years of age, England and
Wales 1990-2007
42
Figure 3.1 IID2 Study Planned Design 51
Figure 3.2 Sample Collection Kit 74
Figure 3.3 Sample Container Packaging 74
Figure 3.4 Flow Diagram illustrating the Microbiological Examination of
Specimens at Manchester
76
Figure 3.5 Reporting Algorithm for Microbiological Diagnostic Results 79
Figure 3.6 Flow diagram describing sample processing at CfI 81
Figure 3.7 Web-based Data flow 90
Figure 4.1 Recruitment and allocation of GP practices into the IID2
study
110
Figure 4.2 Age and sex profile of practice populations among practices
in the Enumeration and GP Presentation studies compared
with the UK census population
111
Figure 4.3 Recruitment of participants into the Cohort Study 113
Page 17 of 427
Title Page
Figure 4.4 Age and sex structure of Cohort Study participants compared
with the UK census population
115
Figure 4.5 Distribution of ethnic group among cohort participants
relative to the UK census population
116
Figure 4.6 Distribution of National Statistics – Socioeconomic
Classification among cohort participants aged 16-74 years
compared with the UK population
117
Figure 4.7 Distribution of area-level deprivation among cohort
participants compared with the UK population
118
Figure 4.8 Distribution of urban-rural classification among cohort
participants compared with the UK population
119
Figure 4.9 Distribution of follow-up time in the Cohort Study by month 120
Figure 4.10 Cohort Study case definitions and exclusions 121
Figure 4.11 Eligibility of calls made in the Telephone Survey, UK 123
Figure 4.12 Number of completed interviews by month 124
Figure 4.13 Age and sex structure of Telephone Survey participants
compared with the UK population
125
Figure 4.14 Distribution of ethnic group among Telephone Survey
participants relative to the UK population
126
Figure 4.15 Distribution of household size among Telephone Survey
participants compared with the UK population
127
Figure 4.16 Distribution of area-level deprivation among Telephone
Survey participants compared with the UK population
128
Figure 4.17 Distribution of urban-rural classification among Telephone
Survey participants compared with the UK population
129
Figure 4.18 Recruitment of participants into the GP Presentation Study 130
Figure 4.19 Case definition and exclusions among GP Presentation
Study participants
132
Figure 4.20 Case definition and exclusions among the Validation Study
records
133
Page 18 of 427
Title Page
Figure 4.21 Under-ascertainment in the GP Presentation Study by sex,
age group and Read code category
135
Figure 4.22 Case definition and exclusions among GP Enumeration
Study records
136
Figure 5.1 Incidence rates of overall IID by age group in the Cohort
Study and Telephone Survey
145
Figure 5.2 Incidence rates of overall IID in the Telephone Survey, by
recall period, and in the Cohort Study
146
Figure 5.3 Incidence rate of overall IID presenting to general practice –
Estimates from different studies
150
Figure 5.4 Incidence of IID in the community and presenting to general
practice – Estimates from the Telephone Survey and Cohort
Study
151
Figure 5.5 Incidence of IID presenting to general practice by age group
– Estimates from the Cohort and GP Presentation studies
152
Figure 5.6 Reporting pattern for overall IID, UK 153
Figure 6.1 Microbiological findings in Cohort and GP Presentation
cases
159
Figure 6.2 Reporting ellipse for IID due to Campylobacter 165
Figure 6.3 Reporting ellipse for IID due to Salmonella 165
Figure 6.4 Reporting pattern of IID due to norovirus 166
Figure 6.5 Reporting pattern of IID due to rotavirus 166
Figure 7.1 Incidence rates of overall IID in the community by age group,
IID1 and IID2 studies
167
Figure 7.2 Incidence rates of overall IID presenting to general practice
by age group, IID1 and IID2 studies
168
Figure 7.3 Reporting patterns for overall IID in England, IID1 and IID2
studies
169
Figure 7.4 Incidence rates of IID presenting to general practice –
Estimates from RCGP Weekly Returns Service, IID1 and
IID2
170
Page 19 of 427
Title Page
Figure 7.5 Proportion of IID cases reporting absence from work or
school and consulting their GP, IID1 and IID2 studies
171
Figure 7.6 Microbiological findings among community cases of IID in
IID1 and IID2 studies
172
Figure 7.7 Microbiological findings among IID cases presenting to
general practice in IID1 and IID2 studies
173
Figure 7.8 Percentage of specimens from IID cases in the community
and presenting to general practice with one or more
pathogens identified in IID1 and IID2 studies
174
Figure 7.9 Reporting pattern of IID due to Campylobacter in England,
IID1 and IID2 studies
175
Figure 7.10 Reporting pattern of IID due to Salmonella in England, IID1
and IID2 studies
176
Figure 7.11 Reporting pattern of IID due to norovirus in England, IID1
and IID2 studies
177
Figure 7.12 Reporting pattern of IID due to rotavirus in England, IID1 and
IID2 studies
178
Page 20 of 427
LIST OF TABLES
Title Page
Table 2.1 Estimated costs attributable to foodborne illness (England
and Wales)
30
Table 2.2 Conditions causing food poisoning, gastroenteritis or
gastrointestinal infection but not IID
32
Table 2.3 Notifiable IID and Food Poisoning in the United Kingdom 33
Table 2.4 Number of laboratory reports of selected gastro-intestinal
pathogens in the United Kingdom, 2000-2008
40
Table 2.5 Advantages and disadvantages of prospective and
retrospective study methods for estimating the population
burden of IID
45
Table 2.6 Changes in microbiological methods between IID1 and
IID2
49
Table 3.1 Sample size calculations for estimating the overall
frequency of IID via self-report - Telephone Survey
71
Table 3.2 Sample size required for Prospective Cohort Study in order
to estimate a single UK-wide surveillance pyramid
72
Table 3.3 Sample size required for the GP Presentation Study in
order to estimate a single UK-wide surveillance pyramid
73
Table 3.4 Target Organisms: Primary Diagnostic Methods 75
Table 3.5 IID2 priority list for testing insufficient specimens 78
Table 3.6 Table showing genomic targets for the detection of a range
of bacterial, viral and parasitic pathogens by molecular
methods
82
Table 3.7 Summary of definitions for positive results for each
pathogen investigated at CfI, based on quantitative PCR
84
Table 3.8 IID2 Study Questionnaires 87
Table 4.1 Distribution of IID2 study practices by area-level
deprivation and urban-rural classification, compared with
all UK practices
112
Page 21 of 427
Title Page
Table 4.2 Recruitment of participants into the Cohort Study by age
group and sex
114
Table 4.3 Percentage of eligible calls resulting in completed
interviews by country
124
Table 4.4 Recruitment of participants into the GP Presentation Study
by age group and sex
131
Table 4.5 Number and percentage of specimens submitted among
definite cases in the Cohort Study by age group and sex
137
Table 4.6 Number and percentage of specimens submitted among
cases in the GP Presentation Study by age group and sex
138
Table 5.1 Incidence rate of overall IID in the Cohort Study 139
Table 5.2 Incidence rate of overall IID in the Cohort Study by age
group and sex (definite cases only)
140
Table 5.3 Incidence rate of overall IID in the Telephone Survey by
recall period
142
Table 5.4 Incidence rate of overall IID in the Telephone Survey by
recall period, age group and sex
143
Table 5.5 Incidence rate of overall IID in the Telephone Survey by
recall period and country
143
Table 5.6 Incidence of consultations to NHS Direct/NHS24 by age
group in England, Wales and Scotland (rate per 1,000
person-years)
147
Table 5.7 Incidence of consultations to NHS Direct by age group and
sex in England and Wales
147
Table 5.8 Percentage of calls to NHS Direct by outcome of call,
England and Wales
148
Table 5.9 Incidence rate of overall IID presenting to general practice 148
Table 5.10 Incidence rates of overall IID presenting to general practice
by age group and sex (definite cases only)
149
Page 22 of 427
Title Page
Table 6.1 Microbiological findings in stool samples submitted by
Cohort cases
156
Table 6.2 Microbiological findings in stool samples submitted by GP
Presentation cases
158
Table 6.3 Incidence rates of IID in the community and presenting to
general practice by organism
162
Table 6.4 Incidence rates of IID in the community, presenting to
general practice, and reported to national surveillance, by
organism
164

Page 23 of 427
CHAPTER 1
EXECUTIVE SUMMARY
1.1 INTRODUCTION
This report describes the Second Study of Infectious Intestinal Disease in the
community (IID2 study). The main aim of the IID2 study was to determine if the
incidence of infectious intestinal disease (IID) had changed since the mid-1990s. A
secondary aim was to re-calibrate national surveillance data. It comprised seven
separate but linked studies:- a retrospective Telephone Survey of self-reported
illness, a Prospective, Population-Based Cohort Study, a General Practice (GP)
Presentation Study, a GP Validation Study, a GP Enumeration Study, a Microbiology
Study and a National Reporting Study. All elements except the National Reporting
Study were piloted between 3rd September 2007 and 1st December 2007. The main
studies took place between 28th April 2008 and 31st August 2009 (except the
Telephone Survey which ran from 1st February 2008 to 31st August 2009).
1.2 OBJECTIVES
The objectives of the IID2 study were to:-
1. Estimate prospectively the number and aetiology of cases of IID in the
population, contacting NHS Direct (and the equivalent NHS24 in Scotland),
presenting to General Practitioners and having stool specimens sent routinely
for laboratory examination in the UK.
2. Compare these numbers and the aetiologies with those captured by the UK
laboratory reporting surveillance systems and with calls to NHS Direct in
England and Wales and NHS24 in Scotland.
3. Determine the proportion of cases of IID likely to have been acquired abroad.
4. Compare the surveillance patterns from the first and second studies of
infectious intestinal disease for England using reporting ellipses.
5. Compare the aetiology of IID in the first and second IID studies for England.
Page 24 of 427
6. Estimate the number of cases of IID in the population of each UK nation,
based on recall, via a national Telephone Survey of self-reported diarrhoea,
conducted over two time periods: a week, and a month.
7. Compare the burden of self-reported illness through the national Telephone
Survey with the burden of self-reported illness captured through NHS Direct in
England and NHS24 in Scotland.
8. Compare the prospective and self-reporting methods for estimating IID
incidence in the UK, over two time periods: a week and a month.
Additional objectives were to:-
9. Compare molecular methods with traditional microbiological techniques for IID
diagnosis.
10. Determine the contribution of Clostridium difficile to the aetiology of infectious
intestinal disease in the community.
11. Assess retrospective and prospective methods for determining IID burden.
1.3 METHODS
The IID2 study was composed of seven separate, but related, studies.
1.3.1 Study 1: National Telephone Survey
In Study 1, we asked a sample of people (n=14,726), via a Telephone Survey, if they
had recently experienced symptoms of diarrhoea or vomiting. We asked one group
(n=12,381) about symptoms during the previous seven days and another group
(n=2,345) about symptoms during the previous 28 days to compare estimates of
community incidence of IID obtained using the two different time periods. We
compared this with the incidence estimate from Study 2 (Prospective Population-
Based Cohort Study). We also compared incidence rates in the four UK countries.
1.3.2 Study 2: Prospective Population-Based Cohort Study
In Study 2, we recruited 7,033 people at random from 88 General Practices across
the UK and followed them up at weekly intervals for up to one year to find out how
many developed new symptoms of IID. People who developed IID completed a
symptom questionnaire about their illness and their contact with health services, e.g.
Page 25 of 427
NHS Direct/NHS24, and provided a stool sample. We compared the community
incidence of IID with corresponding estimates from the Telephone Survey. We also
compared the incidence of IID in England in 2008-9 with the incidence in 1993-6, at
the time of IID1. We randomly assigned the practices in Study 2 into two groups –
those taking part in Studies 3 and 4, or those taking part in Study 5.
1.3.3 Study 3: General Practice (GP) Presentation Study
In Study 3 (37 practices completed) Study Nurses invited everyone who consulted
their GP for a new episode of IID to complete a symptom questionnaire and provide
a stool sample. We used this information to estimate the incidence and aetiology of
IID in people presenting to primary care.
1.3.4 Study 4: General Practice (GP) Validation Study
In Study 4 we audited recruitment to the GP Presentation Study (Study 3). Study
Nurses searched practice records for anyone presenting with a new episode of IID to
the practices taking part in Study 3 during the study period. They generated a list of
all the patients that should have been included in Study 3 using Read diagnostic
codes and compared this with the actual recruitment list. We used this information
to determine under-ascertainment in Study 3.
1.3.5 Study 5: General Practice (GP) Enumeration Study
In Study 5 (40 practices completed) Study Nurses searched practice records for
anyone presenting with a new episode of IID. They recorded the patient‟s age, sex,
postcode, place of consultation, admission to hospital and whether or not a stool
sample was requested. If a sample was requested they recorded the result. We
then compared proportion of cases of IID in the GP Presentation Study (Study 3)
with the incidence of laboratory-confirmed infection documented in the GP
Enumeration Study (Study 5).
1.3.6 Study 6: Microbiology Study
In Study 6, all stool samples from Studies 2 and 3 were examined first at the HPA
Manchester Laboratory using conventional microbiological techniques and then at
the HPA CfI at Colindale using molecular methods.

Page 26 of 427
1.3.7 Study 7: National Reporting Study
In Study 7, we used the results from studies 1 to 6 to estimate under-ascertainment
of community IID in national surveillance data by comparing the incidence estimates
from Studies 1 to 6 with those generated from national surveillance data.
1.4 RESULTS AND INTERPRETATION
We estimated that around 25% of people in the United Kingdom suffer from an
episode of IID in a year. We estimated that for every case of IID in the UK
reported to national surveillance systems there were 147 in the community.
The most commonly identified pathogens were, in order of frequency,
norovirus, sapovirus, Campylobacter spp. and rotavirus.
There were 1,201 definite cases of IID and a total of 4,658 person-years of
follow-up (86% of the maximum achievable follow-up time) in the community cohort
(N = 6,836; participation rate ≈ 9%). The age-sex standardised rate of IID in the
community in the UK was 274 per 1,000 person-years (around 1 in 4 members of the
population). We estimated that for every case of IID in the UK reported to national
surveillance systems there were 147 in the community.
Sixty-five percent of the 1,201 definite cases of IID in the cohort submitted a
stool sample for laboratory examination so we used multiple imputation methods to
account for missing data. Using the full panel of tests, 40% of samples tested
contained one or more pathogens, the most commonly identified being norovirus
(16.5% of samples), sapovirus (9.2%), Campylobacter spp. (4.6%) and rotavirus
(4.1%). The IID2 Study coincided with the introduction of a new genotype of
sapovirus into the UK population.
Clostridium perfringens, Salmonella spp., and Escherichia coli O157 were
each found in less than 1% of samples and Listeria monocytogenes was not found at
all.
We estimated that less than 2% of people in the UK consulted their GP for an
episode of IID and that for every case of IID reported to national surveillance
there were 10 presenting to General Practice in the UK. The most commonly
Page 27 of 427
identified pathogens were, in order of frequency, Campylobacter spp.,
norovirus, sapovirus and rotavirus.
In total 1,254 people with IID were recruited into the GP Presentation Study.
Following adjustment for under-ascertainment and practice list inflation there were
an estimated 5,546 definite cases of IID presenting to General Practice and 312,232
person-years of follow-up. Thus, the estimated incidence of IID presenting to
General Practice was 18 cases per 1,000 person-years. We estimated that for every
case of IID in the UK reported to national surveillance systems there were 10 that
presented to General Practice.
Eighty-eight percent of cases in the GP Presentation Study submitted a stool
sample and 51% were positive for one or more pathogens. Using the full panel of
tests, the most frequently identified pathogens in samples from cases of IID
presenting to general practice in the UK were Campylobacter spp. (13% of samples),
norovirus (12.4%) sapovirus (8.8%) and rotavirus (7.3%). Salmonella spp. were
detected in only 0.8% of cases. This was less than cases with C. perfringens
(2.2%), Enteroaggregative E. coli (1.4%), Cryptosporidium (1.4%) or Giardia (1.0%).
Two or more pathogens were found in stool samples from 4.6% of cases in the GP
Presentation Study.
We found only one case of C. difficile-associated diarrhoea in the Prospective
Cohort Study and 10 cases in the GP Presentation Study.
This suggests that in unselected community samples, i.e. samples from people who
have not necessarily had recent or frequent contact with health or social care, the
incidence of C. difficile-associated diarrhoea is very low.
We found that around 8% of people in the Prospective Cohort Study and 12%
of people in the GP Presentation Study reported having travelled outside the
UK in the 10 days prior to illness onset.
There were differences in the rate of IID estimated from the Prospective Cohort
Study and the Telephone Survey.
From the Telephone Survey we estimated that the rate of IID in the
community in the UK was 1,530 cases per 1,000 person-years (i.e. five times higher
than the rate in the Prospective Cohort Study) using 7-day recall and 533 cases per
1,000 person-years using 28-day recall i.e. twice as high as in the Prospective
Page 28 of 427
Cohort Study). To attempt to understand this variation in community rates in the two
types of study we triangulated rates around presentation to General Practice. The
rates from the Prospective, Population-Based Cohort Study, the GP Presentation
Study, the GP Enumeration Study and an external data source (the Royal College of
General Practitioners‟ Weekly Returns Service) were all of a similar order of
magnitude and substantially less than in the Telephone Survey. These findings
suggest that the cohort approach might provide more reliable estimates, at least for
episodes of IID that involve health care contact.
There was variation in the IID rate estimates by country in the Telephone
Survey but the confidence intervals were wide and all overlapped so that there
was insufficient evidence to indicate that differences between countries were
important.
The estimated rate of IID in the community in England was 43% higher in 2008-
9 (IID2) than in 1993-6 (IID1) whilst the estimated rate of IID presenting to
General Practice in England in IID2 was 50% lower than in IID1. Approximately
50% of people with an episode of IID in both studies reported absence from
work or school because of their symptoms.
The burden of IID in the community that is hidden from national surveillance
systems was greater in IID2 than in IID1. The main reason for this hidden burden
was the smaller proportion of cases presenting to general practice.
In England, the ratio between cases reported to national surveillance and
those occurring in the community had changed.
Using molecular methods in the IID2 Study meant that we could test low
volume samples for the complete range of pathogens. Taking into account the
changes in target organisms and diagnostics (and re-calculating ratios from IID1
where necessary) we found that the ratio of cases reported to national surveillance in
England to cases in the community had changed from ≈ 1:85 in IID1 to ≈ 1:150 in
IID2. For norovirus the changes was from ≈ 1:1,000 in IID1 to ≈ 1:300 in IID2. The
ratios for Campylobacter spp., Salmonella spp. and rotavirus were similar in both
studies.
Although the hidden burden of IID had increased between the two study
periods the ratio of cases reported to national surveillance to cases presenting to
Page 29 of 427
general practice had improved for all IID and for all the pathogens that we
considered i.e. national surveillance data capture had improved between IID1 and
IID2 for cases who presented to General Practice.
A small proportion of people with IID (<2%) contacted NHS Direct or NHS24.
Decreases in GP presentation were unlikely to be explained by the
introduction of these telephone information and advice services.
1.5 CONCLUSION
The burden of IID in the United Kingdom is substantial. In England the estimated
incidence of IID in the community increased by 43% between 1993-6 and 2008-9
and cases presenting to general practice decreased by around 50% so that the
hidden burden of IID is greater now than it was 12 years ago. Approximately 50% of
people with IID reported absence from work or school because of their symptoms.
The pathogens most frequently associated with IID in the community and presenting
to primary care were norovirus, sapovirus, rotavirus and Campylobacter spp..
Clostridium difficile-associated diarrhoea was rare.
Page 30 of 427
CHAPTER 2
BACKGROUND AND OBJECTIVES
2.1 INFECTIOUS INTESTINAL DISEASE
Infectious intestinal disease (IID) is an important public health problem worldwide. In
developed countries IID-related mortality is low but morbidity remains high. In the
mid-1990s it was estimated that around 1 in 5 people in England suffered from IID
each year and the annual cost to the nation was around £750 million (Food
Standards Agency (FSA, 2000; Wheeler et al., 1999; Roberts et al., 2003). Recent
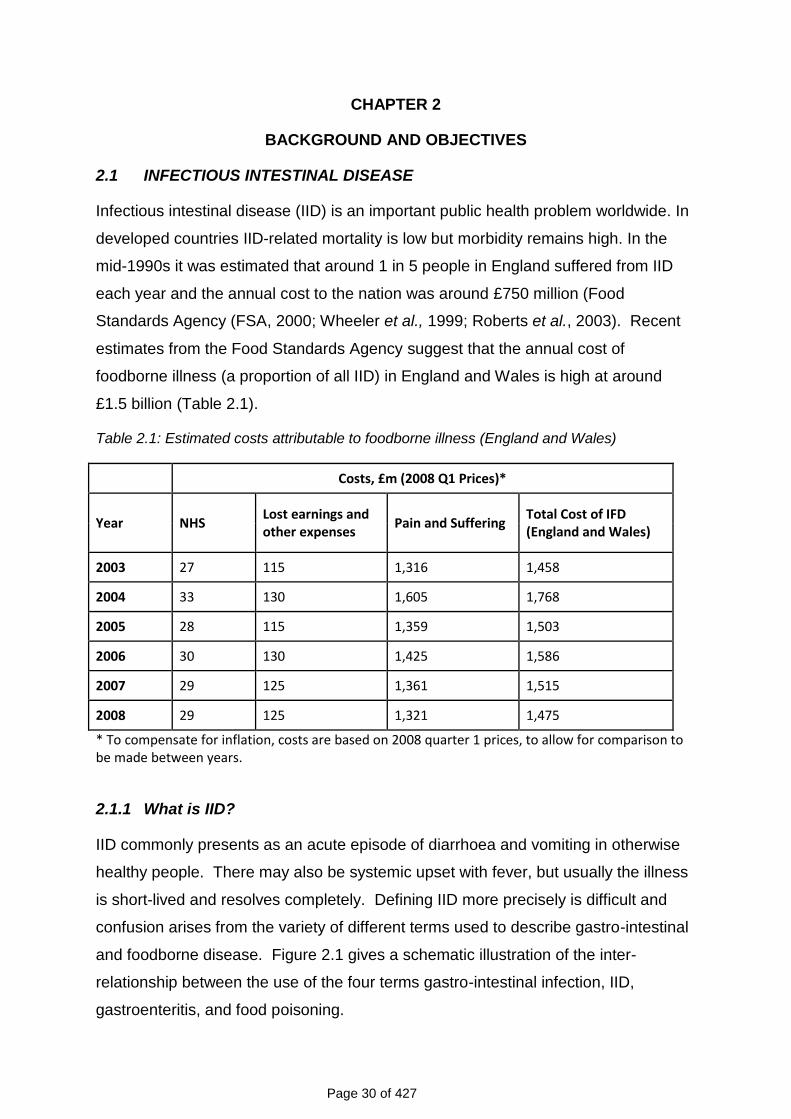
estimates from the Food Standards Agency suggest that the annual cost of
foodborne illness (a proportion of all IID) in England and Wales is high at around
£1.5 billion (Table 2.1).
Table 2.1: Estimated costs attributable to foodborne illness (England and Wales)
Costs, £m (2008 Q1 Prices)*
Year NHS Lost earnings and other expenses
Pain and Suffering Total Cost of IFD (England and Wales)
2003 27 115 1,316 1,458
2004 33 130 1,605 1,768
2005 28 115 1,359 1,503
2006 30 130 1,425 1,586
2007 29 125 1,361 1,515
2008 29 125 1,321 1,475
* To compensate for inflation, costs are based on 2008 quarter 1 prices, to allow for comparison to be made between years.
2.1.1 What is IID?
IID commonly presents as an acute episode of diarrhoea and vomiting in otherwise
healthy people. There may also be systemic upset with fever, but usually the illness
is short-lived and resolves completely. Defining IID more precisely is difficult and
confusion arises from the variety of different terms used to describe gastro-intestinal
and foodborne disease. Figure 2.1 gives a schematic illustration of the inter-
relationship between the use of the four terms gastro-intestinal infection, IID,
gastroenteritis, and food poisoning.
Page 31 of 427
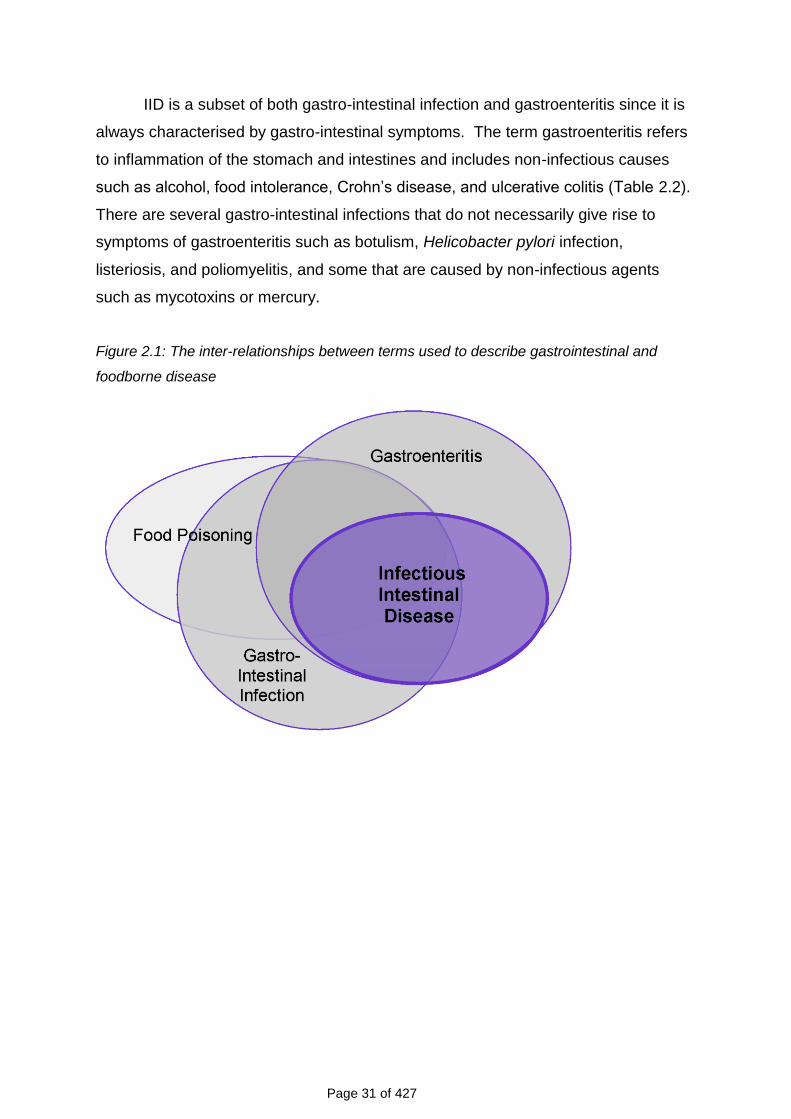
IID is a subset of both gastro-intestinal infection and gastroenteritis since it is
always characterised by gastro-intestinal symptoms. The term gastroenteritis refers
to inflammation of the stomach and intestines and includes non-infectious causes
such as alcohol, food intolerance, Crohn‟s disease, and ulcerative colitis (Table 2.2).
There are several gastro-intestinal infections that do not necessarily give rise to
symptoms of gastroenteritis such as botulism, Helicobacter pylori infection,
listeriosis, and poliomyelitis, and some that are caused by non-infectious agents
such as mycotoxins or mercury.
Figure 2.1: The inter-relationships between terms used to describe gastrointestinal and
foodborne disease

Page 32 of 427
Table 2.2: Conditions causing food poisoning, gastroenteritis or gastrointestinal infection but
not IID
Food poisoning but not IID
Chemicals e.g. histamine, dioxin Heavy metals e.g. mercury Mycotoxins Botulism
Gastroenteritis but not IID
Irritable bowel syndrome Inflammatory bowel disease e.g. Crohn’s disease Food intolerance Alcohol
Gastrointestinal infection but not IID
Helicobacter pylori Botulism
2.1.2 Pathogens that commonly cause IID
IID is caused by a range of bacteria, viruses, and protozoa (Adak et al., 2002;
Musher, 2004) (see Appendix 1). The disease may be spread from person to
person, arise from a common food or environmental source, or result from exposure
to animals. Food and water can be primary sources or become contaminated from
an infected person or animal. Pathogens that can be food- or water-borne include
Salmonella, campylobacters, norovirus, and Cryptosporidium, whereas others such
as Shigella sonnei and rotavirus are usually spread from person to person.
Conversely, several important food- or water-borne pathogens such as Listeria
monocytogenes, Salmonella Typhi and S. Paratyphi, Clostridium botulinum, and
hepatitis A and E cause systemic infection but little intestinal disease.
2.2 NATIONAL SURVEILLANCE SYSTEMS FOR IID
There are three main sources of routinely collected data on IID in the UK (Wall et al.,
1996):
Statutory notifications from clinicians of cases of food poisoning.
Voluntary reports from diagnostic laboratories of laboratory confirmed
infections.
Page 33 of 427
Standard report forms submitted by health protection units on general
outbreaks of IID.
In addition, there are several voluntary, primary care and community surveillance
schemes that provide information on consultation rates for IID.
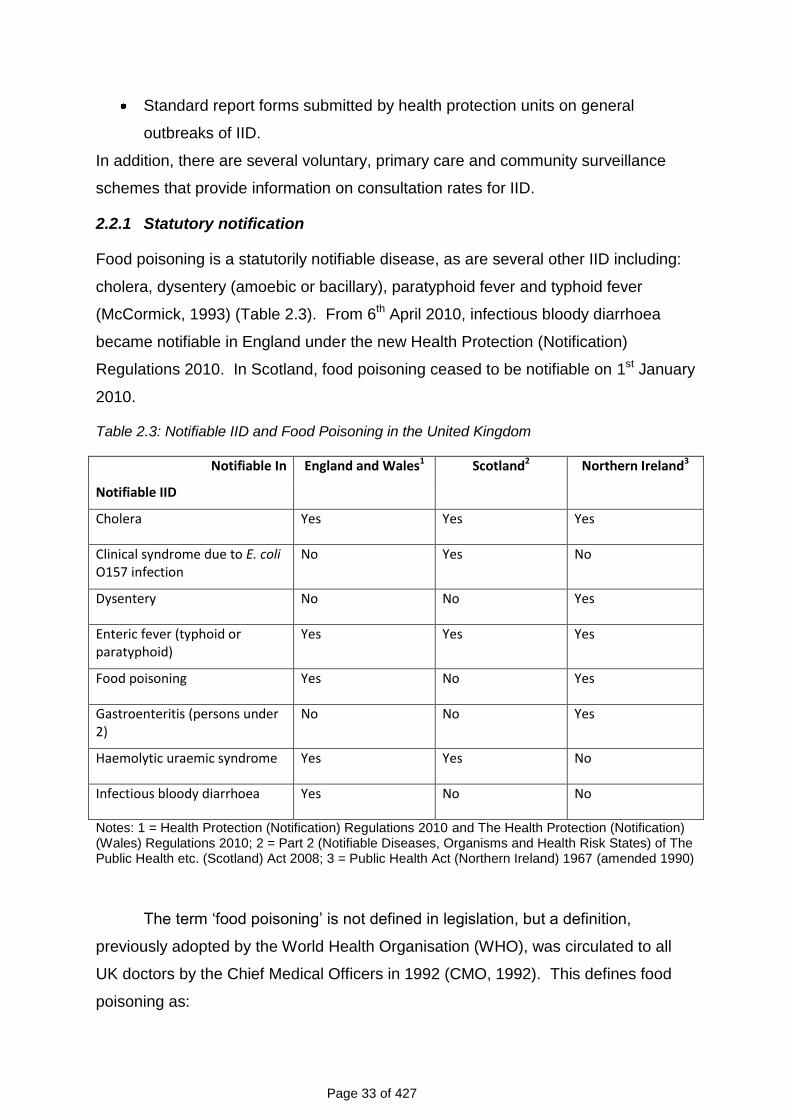
2.2.1 Statutory notification
Food poisoning is a statutorily notifiable disease, as are several other IID including:
cholera, dysentery (amoebic or bacillary), paratyphoid fever and typhoid fever
(McCormick, 1993) (Table 2.3). From 6th April 2010, infectious bloody diarrhoea
became notifiable in England under the new Health Protection (Notification)
Regulations 2010. In Scotland, food poisoning ceased to be notifiable on 1st January
2010.
Table 2.3: Notifiable IID and Food Poisoning in the United Kingdom
Notifiable In England and Wales1 Scotland2 Northern Ireland3
Notifiable IID
Cholera Yes Yes Yes
Clinical syndrome due to E. coli O157 infection
No Yes No
Dysentery No No Yes
Enteric fever (typhoid or paratyphoid)
Yes Yes Yes
Food poisoning Yes No Yes
Gastroenteritis (persons under 2)
No No Yes
Haemolytic uraemic syndrome Yes Yes No
Infectious bloody diarrhoea Yes No No
Notes: 1 = Health Protection (Notification) Regulations 2010 and The Health Protection (Notification) (Wales) Regulations 2010; 2 = Part 2 (Notifiable Diseases, Organisms and Health Risk States) of The Public Health etc. (Scotland) Act 2008; 3 = Public Health Act (Northern Ireland) 1967 (amended 1990)
The term „food poisoning‟ is not defined in legislation, but a definition,
previously adopted by the World Health Organisation (WHO), was circulated to all
UK doctors by the Chief Medical Officers in 1992 (CMO, 1992). This defines food
poisoning as:

Page 34 of 427
„any disease of an infectious or toxic nature caused by or thought to be caused by
the consumption of food or water‟.
In addition to formal notification, local authorities also record cases
ascertained by other means. These are mostly cases identified during the course of
routine follow-up of sporadic cases or during outbreak investigations, with a small
number arising from complaints made by members of the public.
2.2.2 Voluntary reports from diagnostic laboratories
Laboratory reporting underpins the national surveillance system for IID. All Health
Protection Agency (HPA) regional laboratories and reference laboratories, most NHS
laboratories, and a small number of private laboratories throughout England and
Wales report weekly via electronic links to the HPA Centre for Infections (CfI),
although some NHS laboratories still report on paper. Similar schemes exist in
Scotland and Northern Ireland.
The National Standard Method for investigation of stool samples for bacterial
pathogens briefly outlines the bacteria responsible for enteric infection and the
methods used for their isolation (Health Protection Agency, 2008). It is
recommended that primary laboratories routinely screen faeces for Campylobacter,
Salmonella, Shigella and Escherichia coli O157 on all diarrhoeal (semi-formed or
liquid) faeces. The investigation of faeces for Clostridium perfringens is normally
only performed in food poisoning incidents. Laboratory confirmation requires either
isolation of the same serotype from the faeces of affected individuals and from food,
or detection of the enterotoxin in the faeces of affected individuals, or faecal spore
counts of >105 organisms per gram. Faeces may also be screened for other bacteria
as indicated by clinical details, for example in patients with prolonged diarrhoea or
dysenteric syndromes for whom no cause can be found, or in association with
outbreaks.
Stool samples are also tested for intestinal parasitic infections and routine
diagnosis still depends mainly on examination of stool samples by microscopy for the
identification of helminth eggs and protozoan trophozoites and cysts.
Stool samples are not routinely tested for viruses except in children less than
5 years of age, adults over 60 years, food-handlers and immunocompromised
patients. Most laboratories test for norovirus and rotavirus all year round, but in a
Page 35 of 427
minority testing may be restricted to the winter gastroenteritis season (Atchison et
al., 2009). Samples from outbreaks of gastroenteritis in semi-closed communities
such as hospitals and nursing homes are tested for norovirus. Samples are tested
for adenovirus, norovirus, and rotavirus by enzyme immuno-assay (EIA), polymerase
chain reaction (PCR), or reverse transcription (RT)-PCR, although practice varies
widely.
Most human isolates of Salmonella from England and Wales are forwarded
for confirmation and further identification to the national Salmonella Reference Unit
at the HPA Laboratory of Gastrointestinal Pathogens (LGP). Salmonella spp. and E.
coli O157 from Northern Ireland are also routinely sent to LGP. Laboratories are
also encouraged to send isolates of E. coli O157 to the Gastrointestinal Infections
Reference Unit at LGP for further identification and definitive typing. Similar
arrangements exist in Scotland which has its own Salmonella and Vero cytotoxin-
producing E. coli reference laboratories. In England and Wales, isolates of Bacillus
cereus, C. perfringens, and Staphylococcus aureus are submitted to the Foodborne
Pathogens Reference Unit at LGP for typing and/or toxin testing. There is
considerable overlap between notified cases of food poisoning and laboratory
reports of IID. However, there is no linkage between the two systems at national
level so it is not possible to eliminate duplication or to combine the datasets.
2.2.3 Surveillance scheme for general outbreaks of IID
This is a voluntary scheme run by CfI that collects data on general outbreaks of IID
in England and Wales. Similar arrangements exist in Scotland and Northern Ireland.
A general outbreak is defined as „an outbreak affecting members of more than one
private residence or residents of an institution‟. The definition excludes outbreaks
that are confined to a single household, e.g. a family outbreak, but includes
geographically widespread outbreaks linked by organism, serotype or phage type.
When CfI becomes aware of a possible general outbreak, usually through the
laboratory reporting scheme, a structured questionnaire is sent to the consultant in
communicable disease control based in the appropriate local health protection unit
for completion when the outbreak investigation is finished. There are several
potential reporting biases which might affect the completeness or representativeness
of the data collected (O‟Brien et al., 2002). For example, outbreaks at social
Page 36 of 427
functions affecting a defined cohort of people are more likely to be identified and
investigated than those where cases are widely dispersed in the community. Bias
can also be introduced by the person completing the form who is responsible for
indicating the probable mode of transmission and the factors likely to have
contributed to the outbreak.
2.2.4 Primary care and community surveillance
There are several primary care surveillance schemes in operation that collect
information on consultations and episodes of illness diagnosed in General Practice,
including IID. The longest established scheme is the Royal College of General
Practitioners (RCGP) Weekly Returns Service, and the largest is the HPA/Q
Surveillance National Surveillance Scheme. In 2000, the NHS Direct/HPA Syndromic
Surveillance scheme was established based on calls to the information and advice
service, NHS Direct. There is also a range of similar schemes operating in Scotland
and Wales. However, no syndromic surveillance scheme for IID exists in Northern
Ireland.
2.2.4.1 RCGP Weekly Returns Service (WRS)
The WRS is a network of about 100 General Practices located mainly in England
(Fleming et al., 2002). The total population covered by the WRS averages
approximately 900,000. Consultations for IID are determined according to Read
diagnostic codes assigned by the practitioner (Chisholm, 1990). Read codes are the
recommended national standard coding system in General Practice. However, a
variety of different codes may be used for IID and there is no validation of diagnosis.
Consultation rates for IID recorded by the WRS have fallen dramatically over the last
10 years. The mean weekly incidence of IID episodes was 17 per 100,000 in 2008
compared with 38 per 100,000 in 1999.
2.2.4.2 HPA/Q Surveillance National Surveillance Scheme
The HPA/Q Surveillance scheme is a collaborative project between the HPA and the
University of Nottingham that monitors a variety of conditions that might indicate
infectious diseases (Smith et al., 2007). It comprises a sample of around 4,000
General Practices from across the UK that use Egton Medical Information Systems
(EMIS) clinical software. Although EMIS is the leading primary care information
technology provider in the UK, only a minority of practices in Scotland and Northern
Page 37 of 427
Ireland use it. As in the WRS, consultations for IID are determined according to
Read diagnostic codes assigned by the practitioner but there is no validation of
diagnosis. Data are extracted electronically from a primary care-derived database
(Q Surveillance) that contains information on clinical consultations, prescriptions,
tests and results, and referrals for a population of approximately 20 million patients
currently registered. Relevant indicators for IID include vomiting, diarrhoea,
diarrhoea with hydration therapy, and gastroenteritis. Trend summaries for these
indicators are fed back to public health practitioners in a weekly bulletin.
2.2.4.3 NHS Direct/HPA Syndromic Surveillance Scheme
NHS Direct is a nurse-led health advice and information service, which covers the
whole of England and Wales. Algorithms are used to sort and categorise calls by a
variety of symptoms/syndromes. There is no formal diagnostic coding, but calls are
assessed for severity by nurse advisers to recommend priority for further care. Data
on several symptoms/syndromes are received electronically from across the country
and analysed by the HPA on a daily basis. The weekly NHS Direct/HPA Syndromic
Surveillance Bulletin includes reports of major rises in symptoms and regularly
updated national graphs showing age-group specific trends for individual
symptoms/syndromes including diarrhoea and vomiting (Cooper et al., 2003). There
is a similar scheme in Scotland based on the NHS24 telephone helpline, but there is
no NHS helpline in Northern Ireland.
2.3 THE SURVEILLANCE PYRAMID
Although IID is very common in the community not all cases present to the
healthcare system, and not all cases that present are reported to national
surveillance. For example, reports of laboratory confirmed IID pathogens represent
a fraction of the true incidence since many patients do not seek medical attention. A
sub-set of those that do will submit a stool sample for analysis. When a sample is
submitted, a pathogen is not always identified, but where the sample is positive this
result is not always reported to national surveillance.
Since reporting of IID to national surveillance depends on patients seeking
healthcare, laboratory reports are more likely to represent patients at the severe end
of the IID spectrum (Food Standards Agency, 2000). As a result, many IID cases
Page 38 of 427
are not captured in routine data sources, and surveillance data in the UK thus
underestimate the total IID burden. This pattern of under-ascertainment is
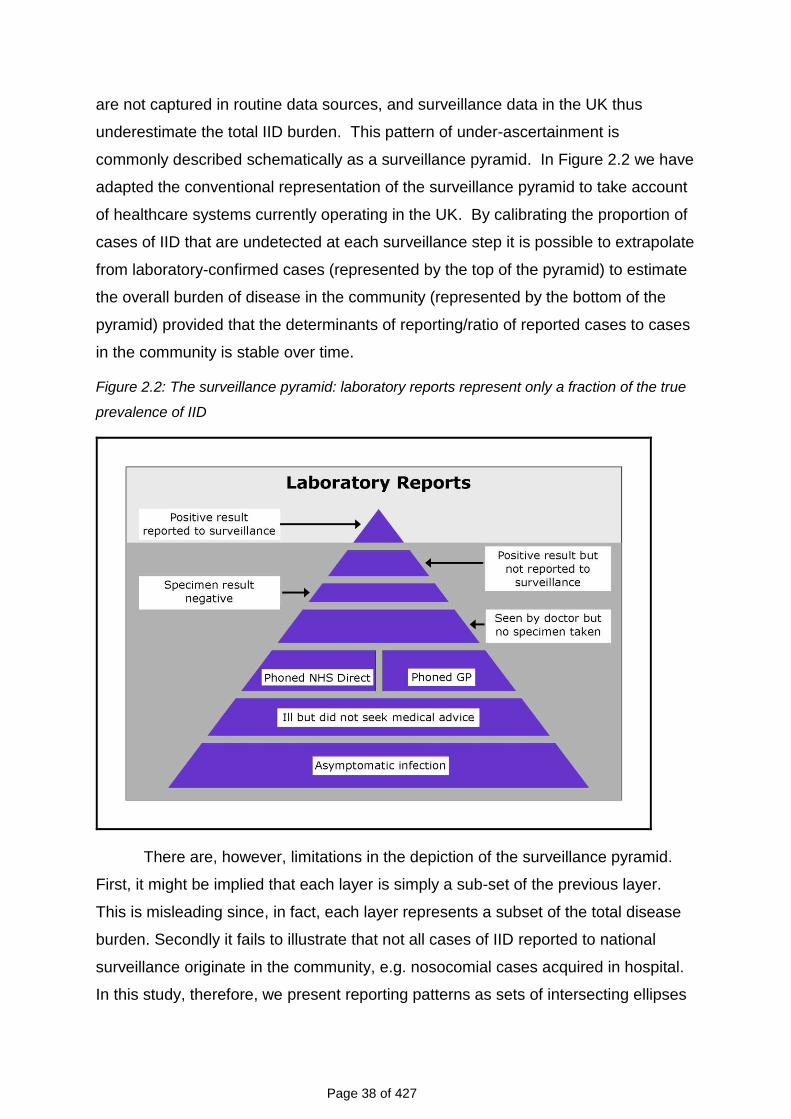
commonly described schematically as a surveillance pyramid. In Figure 2.2 we have
adapted the conventional representation of the surveillance pyramid to take account
of healthcare systems currently operating in the UK. By calibrating the proportion of
cases of IID that are undetected at each surveillance step it is possible to extrapolate
from laboratory-confirmed cases (represented by the top of the pyramid) to estimate
the overall burden of disease in the community (represented by the bottom of the
pyramid) provided that the determinants of reporting/ratio of reported cases to cases
in the community is stable over time.
Figure 2.2: The surveillance pyramid: laboratory reports represent only a fraction of the true
prevalence of IID
There are, however, limitations in the depiction of the surveillance pyramid.
First, it might be implied that each layer is simply a sub-set of the previous layer.
This is misleading since, in fact, each layer represents a subset of the total disease
burden. Secondly it fails to illustrate that not all cases of IID reported to national
surveillance originate in the community, e.g. nosocomial cases acquired in hospital.
In this study, therefore, we present reporting patterns as sets of intersecting ellipses
Page 39 of 427
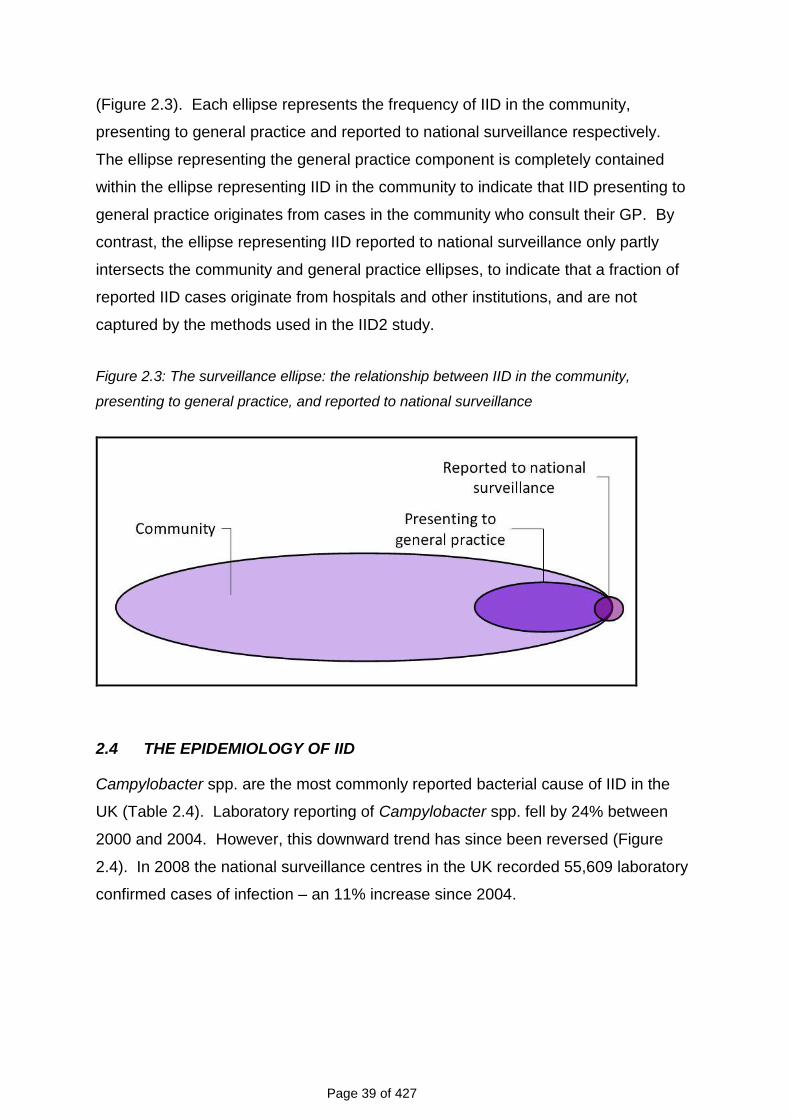
(Figure 2.3). Each ellipse represents the frequency of IID in the community,
presenting to general practice and reported to national surveillance respectively.
The ellipse representing the general practice component is completely contained
within the ellipse representing IID in the community to indicate that IID presenting to
general practice originates from cases in the community who consult their GP. By
contrast, the ellipse representing IID reported to national surveillance only partly
intersects the community and general practice ellipses, to indicate that a fraction of
reported IID cases originate from hospitals and other institutions, and are not
captured by the methods used in the IID2 study.
Figure 2.3: The surveillance ellipse: the relationship between IID in the community,
presenting to general practice, and reported to national surveillance
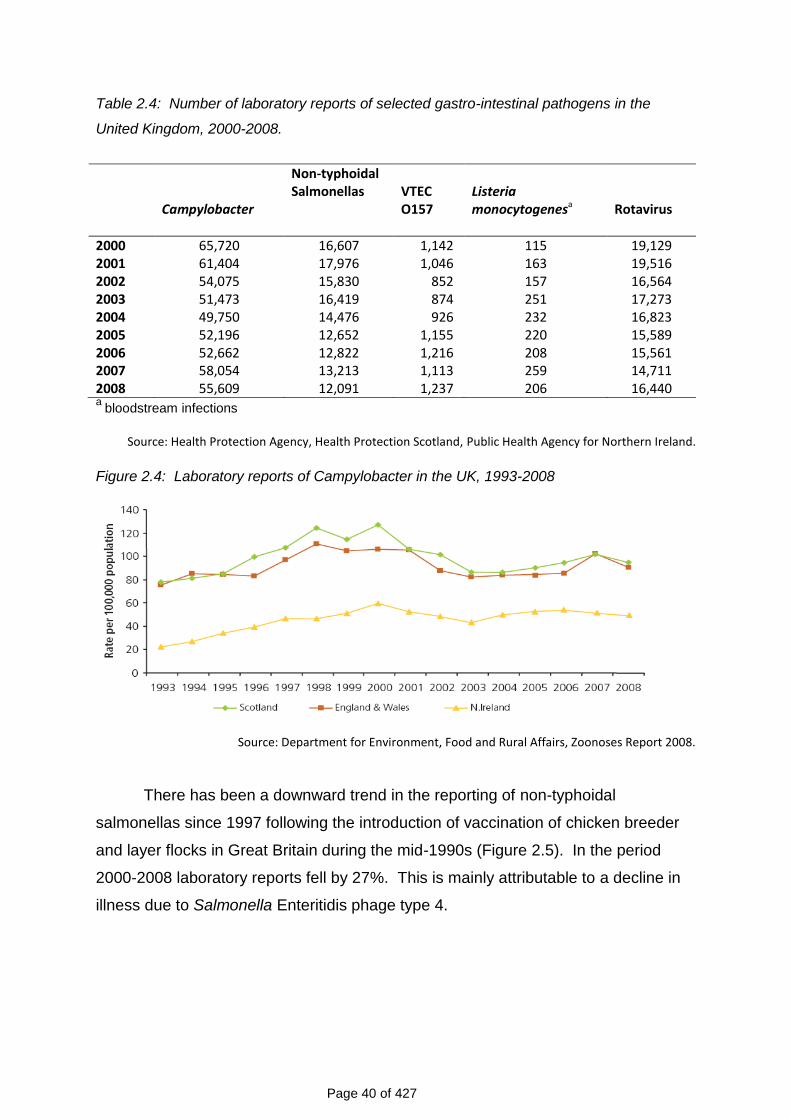
2.4 THE EPIDEMIOLOGY OF IID
Campylobacter spp. are the most commonly reported bacterial cause of IID in the
UK (Table 2.4). Laboratory reporting of Campylobacter spp. fell by 24% between
2000 and 2004. However, this downward trend has since been reversed (Figure
2.4). In 2008 the national surveillance centres in the UK recorded 55,609 laboratory
confirmed cases of infection – an 11% increase since 2004.
Page 40 of 427
Table 2.4: Number of laboratory reports of selected gastro-intestinal pathogens in the
United Kingdom, 2000-2008.
Campylobacter
Non-typhoidal Salmonellas
VTEC O157
Listeria monocytogenesa
Rotavirus
2000 65,720 16,607 1,142 115 19,129 2001 61,404 17,976 1,046 163 19,516 2002 54,075 15,830 852 157 16,564 2003 51,473 16,419 874 251 17,273 2004 49,750 14,476 926 232 16,823 2005 52,196 12,652 1,155 220 15,589 2006 52,662 12,822 1,216 208 15,561 2007 58,054 13,213 1,113 259 14,711 2008 55,609 12,091 1,237 206 16,440 a
bloodstream infections
Source: Health Protection Agency, Health Protection Scotland, Public Health Agency for Northern Ireland.
Figure 2.4: Laboratory reports of Campylobacter in the UK, 1993-2008
Source: Department for Environment, Food and Rural Affairs, Zoonoses Report 2008.
There has been a downward trend in the reporting of non-typhoidal
salmonellas since 1997 following the introduction of vaccination of chicken breeder
and layer flocks in Great Britain during the mid-1990s (Figure 2.5). In the period
2000-2008 laboratory reports fell by 27%. This is mainly attributable to a decline in
illness due to Salmonella Enteritidis phage type 4.
Page 41 of 427
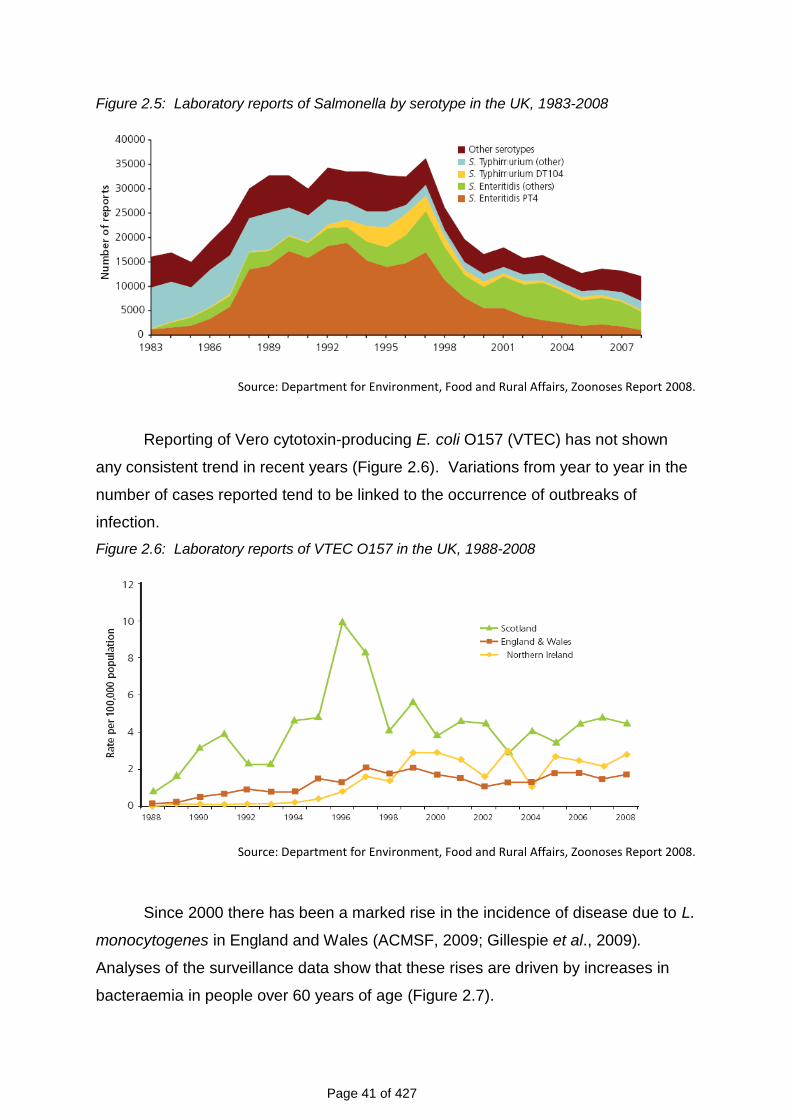
Figure 2.5: Laboratory reports of Salmonella by serotype in the UK, 1983-2008
Source: Department for Environment, Food and Rural Affairs, Zoonoses Report 2008.
Reporting of Vero cytotoxin-producing E. coli O157 (VTEC) has not shown
any consistent trend in recent years (Figure 2.6). Variations from year to year in the
number of cases reported tend to be linked to the occurrence of outbreaks of
infection.
Figure 2.6: Laboratory reports of VTEC O157 in the UK, 1988-2008
Source: Department for Environment, Food and Rural Affairs, Zoonoses Report 2008.
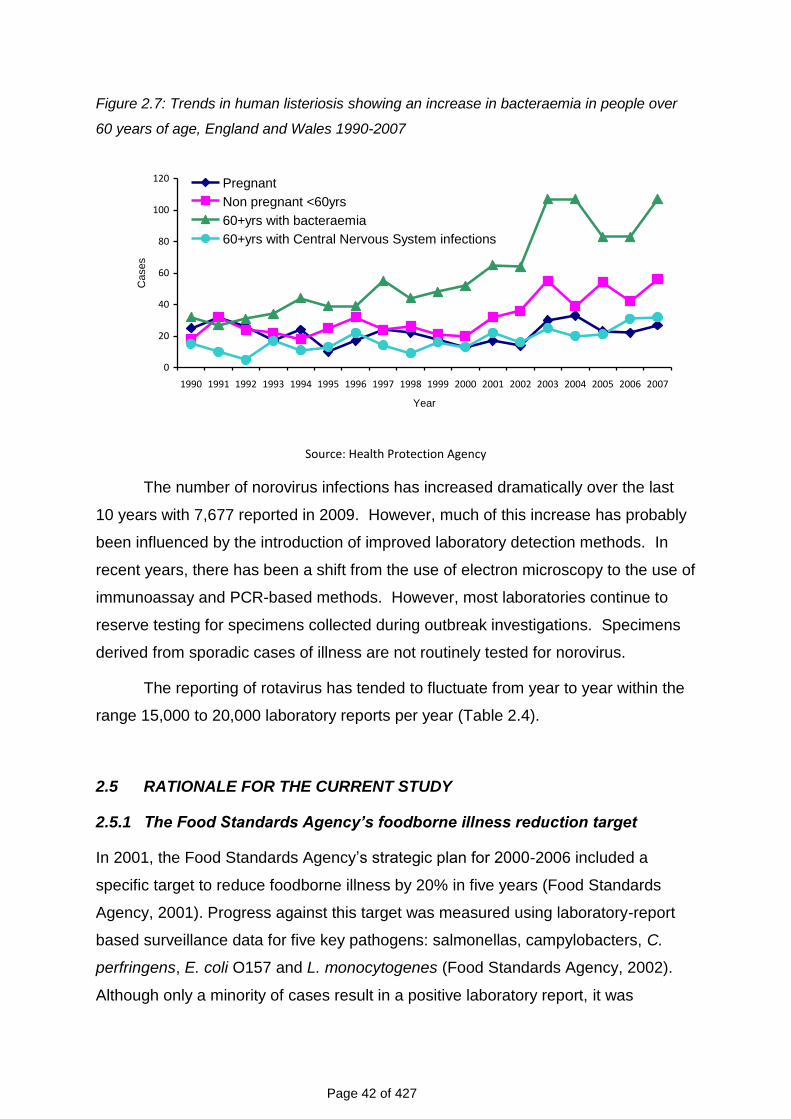
Since 2000 there has been a marked rise in the incidence of disease due to L.
monocytogenes in England and Wales (ACMSF, 2009; Gillespie et al., 2009).
Analyses of the surveillance data show that these rises are driven by increases in
bacteraemia in people over 60 years of age (Figure 2.7).
Page 42 of 427
Figure 2.7: Trends in human listeriosis showing an increase in bacteraemia in people over
60 years of age, England and Wales 1990-2007
0
20
40
60
80
100
120
1990 1991 1992 1993 1994 1995 1996 1997 1998 1999 2000 2001 2002 2003 2004 2005 2006 2007
Year
Cases
Pregnant
Non pregnant <60yrs
60+yrs with bacteraemia
60+yrs with Central Nervous System infections
Source: Health Protection Agency
The number of norovirus infections has increased dramatically over the last
10 years with 7,677 reported in 2009. However, much of this increase has probably
been influenced by the introduction of improved laboratory detection methods. In
recent years, there has been a shift from the use of electron microscopy to the use of
immunoassay and PCR-based methods. However, most laboratories continue to
reserve testing for specimens collected during outbreak investigations. Specimens
derived from sporadic cases of illness are not routinely tested for norovirus.
The reporting of rotavirus has tended to fluctuate from year to year within the
range 15,000 to 20,000 laboratory reports per year (Table 2.4).
2.5 RATIONALE FOR THE CURRENT STUDY
2.5.1 The Food Standards Agency’s foodborne illness reduction target
In 2001, the Food Standards Agency‟s strategic plan for 2000-2006 included a
specific target to reduce foodborne illness by 20% in five years (Food Standards
Agency, 2001). Progress against this target was measured using laboratory-report
based surveillance data for five key pathogens: salmonellas, campylobacters, C.
perfringens, E. coli O157 and L. monocytogenes (Food Standards Agency, 2002).
Although only a minority of cases result in a positive laboratory report, it was
Page 43 of 427
considered that laboratory data provide a reliable indication of trends in Salmonella,
Campylobacter, L. monocytogenes and E. coli O157. It was acknowledged,
however, that the system was probably less reliable at detecting C. perfringens,
except as an important cause of outbreaks.
To continue to monitor progress, there was a need to establish whether or not
the relationship between disease burden in the community and official statistics had
changed. In the last decade, several changes in the NHS and health protection
services, described below, might have altered that relationship to a greater or lesser
degree. It was important that the scientific community, the Food Standards Agency
and, ultimately, the public had confidence in the measurement of the foodborne
disease target. To achieve this, contemporary information on the relationships in the
surveillance pyramids was required.
2.5.2 The First Study of Infectious Intestinal Disease (IID1)
The public health impact of IID was underlined by the publication of The Study of IID
in England ((IID1) Food Standards Agency, 2000). The field work was undertaken
between August 1993 and January 1996. The incidence of community IID in that
study was estimated at 194 cases of IID per 1,000 person years, indicating that
approximately 20% of the population has an episode of IID each year (Wheeler et
al., 1999). As well as defining disease burden, a major component of IID1 was the
calibration of national surveillance systems, i.e. estimating the factor by which the
number of cases of IID due to specific pathogens reported to national surveillance
needed to be multiplied to estimate the actual number of infections in the community.
By comparing rates of IID reported to national surveillance to IID rates in the
community (the so-called indirect method of comparing rates), it was established that
for every case of IID reported to national surveillance 88 cases had occurred in the
community. For campylobacters the ratio of reports to national surveillance to
disease in the community was 1:10, and for salmonellas was approximately 1:4.
Accounting for improvements in diagnostics for viruses in the intervening years the
ratio for norovirus in IID1 was recalculated to be around 1:1000 (Phillips et al., 2010).
2.5.3 Changes to Surveillance Systems since IID1
During the intervening years, rates of laboratory-confirmed infections associated with
IID reported to UK national surveillance systems have fallen. However, this might
Page 44 of 427
not reflect a true decline in disease as there have been structural changes that could
have affected national surveillance over the same time period. In primary care,
people can now call NHS Direct (or NHS24) 24 hours a day to find out if they can
treat their symptoms at home or if it is necessary to visit a GP or other healthcare
provider. Clinical laboratories no longer report directly to the national centre in
England but via regional units. The creation of the Health Protection Agency in 2003
reduced the number of lead laboratories directly under the control of the public
health services from 48 to nine, with a possible reduction in the range of
microbiological tests applied to each sample. However, during this time there have
also been developments in electronic reporting of laboratory results to national
centres replacing the earlier manual systems thereby improving completeness and
timeliness of reporting.
2.5.4 Changes to diagnostic microbiology since IID1
There have been significant changes in microbiological methods used in diagnostic
laboratories in the UK over the past decade with a greater use of automation and the
introduction of molecular assays. However, these developments have mostly been
applied to specimens other than faeces. In most laboratories the methods used for
detection of enteric pathogens remain unchanged from the time of the IID1 study,
with a few exceptions (Pawlowski et al., 2009). Although PCR tests have been
described for all of the major enteric pathogens, and were used to improve the
detection rate in archived faeces specimens from the IID1 study (Amar et al., 2007),
the only commonly available diagnostic PCR tests are for enteric viruses, which are
used in a small number of specialist virology centres. Immunoassays were in routine
use in the 1990s for rotavirus and adenovirus and now many laboratories also use
immunoassays for C. difficile toxin and norovirus detection. Some laboratories have
replaced labour intensive microscopy for Giardia and Cryptosporidium with
immunoassays, but the culture methods used for the major bacterial pathogens
(Campylobacter, Salmonella, Shigella and E. coli O157) remain unchanged.1
2.5.5 Methods for Estimating the Population Burden of IID
Most studies for estimating community burden of IID in developed countries are
either prospective cohort studies or retrospective cross-sectional surveys. The
1 Available at http://www.hpa-standardmethods.org.uk/documents/bsop/pdf/bsop30.pdf - Date
accessed 19th June 2010.
Page 45 of 427
prospective cohort design consists of recruiting volunteers and asking them to record
relevant symptoms, over a defined time period, often in some form of diary. The
retrospective study involves contacting people, usually by telephone and asking
about symptoms in the recent past. A major advantage of population-based,
prospective cohort studies is the ability to request stool specimens from people who
report illness so that the range of gastrointestinal pathogens causing symptoms can
be determined. Retrospective studies do not provide information on the
microbiological causes of illness; however, they are much quicker and cheaper to
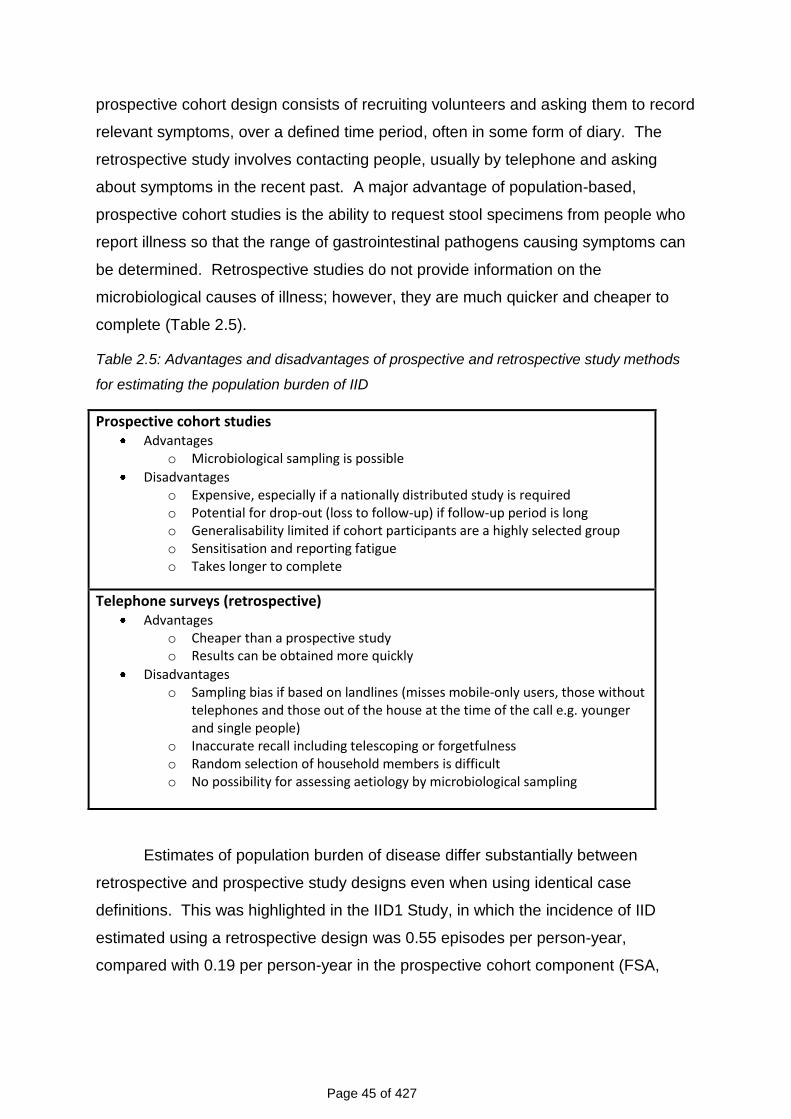
complete (Table 2.5).
Table 2.5: Advantages and disadvantages of prospective and retrospective study methods
for estimating the population burden of IID
Prospective cohort studies Advantages
o Microbiological sampling is possible
Disadvantages o Expensive, especially if a nationally distributed study is required o Potential for drop-out (loss to follow-up) if follow-up period is long o Generalisability limited if cohort participants are a highly selected group o Sensitisation and reporting fatigue o Takes longer to complete
Telephone surveys (retrospective) Advantages
o Cheaper than a prospective study o Results can be obtained more quickly
Disadvantages o Sampling bias if based on landlines (misses mobile-only users, those without
telephones and those out of the house at the time of the call e.g. younger and single people)
o Inaccurate recall including telescoping or forgetfulness o Random selection of household members is difficult o No possibility for assessing aetiology by microbiological sampling
Estimates of population burden of disease differ substantially between
retrospective and prospective study designs even when using identical case
definitions. This was highlighted in the IID1 Study, in which the incidence of IID
estimated using a retrospective design was 0.55 episodes per person-year,
compared with 0.19 per person-year in the prospective cohort component (FSA,
Page 46 of 427
2000). There are several possible explanations for this discrepancy which need to
be investigated more fully.
Prospective cohort studies are prone to several problems, including loss to
follow-up, sensitisation and reporting fatigue. In IID1, 39% of the original cohort of
9,296 persons was lost to follow-up over six months, which could have resulted in
inaccurate incidence estimates if those lost to follow-up had a very different risk of
IID compared with those who remained in the study. Sensitisation occurs when
respondents become more aware of issues related to their health because they are
participating in a health-related study (Strickland et al., 2006), and as a result
perceive more symptoms during early follow-up than before enrolment. For studies
with long periods of follow-up, or frequent follow-ups, participants can also become
fatigued with the follow-up process (Strickland et al., 2006). If participants tire of
completing a health diary, or returning data via postcard or e-mail, they might be less
likely to report symptoms over time (Strickland et al., 2006; Verbrugge, 1980). This
might be a particular problem in studies in which participants are required to submit a
stool specimen as some people might find this distasteful and be reluctant to do it.
This pattern of sensitisation-fatigue, where illness reporting is highest during the
early weeks of follow-up and subsequently decreases, is characteristic of much
longitudinal data (Strickland et al., 2006; Gill et al., 1997; Marcus, 1982) and was
seen in IID1 (Food Standards Agency, 2000).
Retrospective surveys are generally much cheaper than prospective cohort
studies, mainly because each participant is only contacted once. Information can be
collected in different ways, including face-to-face interviews, telephone interviews,
postal questionnaires, or through the internet. Common problems in such
retrospective surveys include sampling bias, response bias and poor recall.
Sampling bias can occur if the sampling frame used to identify participants excludes
certain sections of the population that might have a different risk of illness. For
example, telephone surveys based on calls to landlines will exclude households that
do not have fixed line telephones. This could result in bias if, for example, having a
landline is correlated with socioeconomic or other factors that are related to risk of
illness. Response bias occurs when those who choose to respond to a survey differ
in important ways from those who decline to take part. For example, in both
telephone and postal surveys, respondents are often more likely to be older people
Page 47 of 427
and women, and may have a different risk of illness compared with the general
population.
A major problem in retrospective studies is inaccurate recall. Surveys of IID
commonly ask respondents to recall symptoms occurring in the previous month.
Accurate reporting requires that respondents remember not only whether they
experienced relevant symptoms, but also that they recall the date of onset, the
duration, and the severity of symptoms. If respondents are less likely to remember
illness that occurred some time previously, disease incidence will be underestimated.
Conversely, respondents might recall illness episodes as having occurred more
recently than they actually did, thereby inflating disease incidence. This latter
phenomenon is known as “telescoping”.
Finally, another major challenge of IID studies is standardisation in order to
allow international comparisons of incidence rates. Case definitions used in different
studies vary greatly, regardless of the study design. The case definition can
influence the observed incidence of IID by as much as 1.5 to 2.1 times even within a
given country (Majowicz et al., 2008). To overcome this, a standard, symptom-
based definition has been developed that should allow international comparison in
future (Majowicz et al., 2008).
Several comprehensive reviews of studies have recently been published and
they cover estimated rates of gastrointestinal illness in developed countries (Roy et
al., 2006), and the estimated burden and cost of foodborne disease (Flint et al.,
2005; Buzby and Roberts, 2009).
2.6 THE SECOND STUDY OF INFECTIOUS INTESTINAL DISEASE (IID2)
2.6.1 Design innovations
IID1 was confined to England. However, the foodborne disease reduction target
relates to the whole of the UK. IID2 therefore described surveillance patterns for
England, and for the UK as a whole. The impact of the introduction of NHS
Direct/NHS24 on surveillance data was estimated.
IID2 included a comparison of prospective and retrospective methods for
estimating the community incidence and population burden of IID. In a Telephone
Page 48 of 427
Survey, the accuracy of effects of recall of self-reported IID was examined over two
different time periods. If the degree of under-reporting or telescoping can be
defined, and shown to be relatively stable, telephone surveys could provide a robust
and cost-effective method for making future estimates of population burden of IID.
2.6.2 Changes to microbiological methods
Following a review of IID1, and discussion with the Food Standards Agency,
samples were not examined for some micro-organisms that were considered of
doubtful pathogenicity despite the fact that those tests were carried out in IID1. This
meant re-calculating the proportion of positive samples overall and by pathogen in
IID1 so that comparisons with IID2 were valid.
In addition, molecular methods were employed for pathogen detection and
characterisation, alongside conventional methods (Amar et al., 2005; Amar et al.,
2007; Iturriza et al., 2009). This allowed comparisons with IID1 and will also allow
future comparisons since, in 10 years time, molecular methods are likely to be in
routine use. Re-analysis of archived stool samples from IID1 increased the
identification of an aetiological agent from 53% in cases using conventional methods
to 75% using PCR (Amar et al., 2007). This study should therefore provide the
bridge between data generated by “old” and “new” methods.
There were also some other changes to microbiological examination
procedures. For example, the in-house C. perfringens enterotoxin assay used by the
reference laboratory in the IID1 was no longer available and so isolates were
examined for enterotoxin using a commercial immunoassay.
A major change between IID1 and IID2 was the decision not to fund collection
of samples for pathogen detection from a control group. This meant restricting the
range of pathogens sought and had implications for defining positive samples using
molecular methods (see Section 8.2.5.2).
A summary and rationale for the changes to microbiological methods is
presented in Table 2.6.
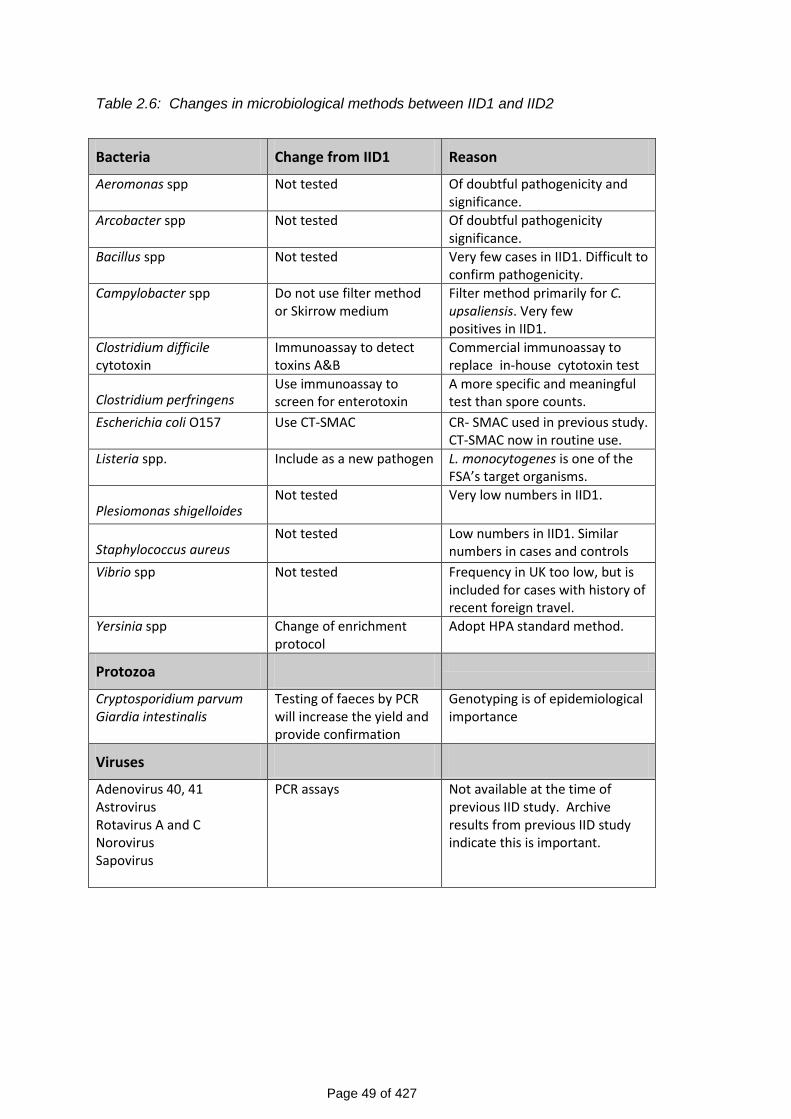
Page 49 of 427
Table 2.6: Changes in microbiological methods between IID1 and IID2
Bacteria Change from IID1 Reason
Aeromonas spp Not tested Of doubtful pathogenicity and significance.
Arcobacter spp Not tested Of doubtful pathogenicity significance.
Bacillus spp Not tested Very few cases in IID1. Difficult to confirm pathogenicity.
Campylobacter spp Do not use filter method or Skirrow medium
Filter method primarily for C. upsaliensis. Very few positives in IID1.
Clostridium difficile cytotoxin
Immunoassay to detect toxins A&B
Commercial immunoassay to replace in-house cytotoxin test
Clostridium perfringens Use immunoassay to screen for enterotoxin
A more specific and meaningful test than spore counts.
Escherichia coli O157 Use CT-SMAC CR- SMAC used in previous study. CT-SMAC now in routine use.
Listeria spp. Include as a new pathogen L. monocytogenes is one of the FSA’s target organisms.
Plesiomonas shigelloides Not tested Very low numbers in IID1.
Staphylococcus aureus Not tested Low numbers in IID1. Similar
numbers in cases and controls
Vibrio spp Not tested Frequency in UK too low, but is included for cases with history of recent foreign travel.
Yersinia spp Change of enrichment protocol
Adopt HPA standard method.
Protozoa
Cryptosporidium parvum Giardia intestinalis
Testing of faeces by PCR will increase the yield and provide confirmation
Genotyping is of epidemiological importance
Viruses
Adenovirus 40, 41 Astrovirus Rotavirus A and C Norovirus Sapovirus
PCR assays Not available at the time of previous IID study. Archive results from previous IID study indicate this is important.

Page 50 of 427
2.6.3 Objectives
The objectives of the IID2 study were to:-
1. Estimate prospectively the number and aetiology of cases of IID in the
population, contacting NHS Direct/NHS24, presenting to GPs and having
stool specimens sent routinely for laboratory examination in the UK.
2. Compare these numbers and the aetiologies with those captured by the UK
laboratory reporting surveillance systems and with calls to NHS Direct in
England and NHS24 in Scotland.
3. Determine the proportion of cases of IID likely to have been acquired abroad.
4. Compare the surveillance patterns from the first and second studies of
infectious intestinal disease for England using reporting ellipses.
5. Compare the aetiology of IID in the first and second IID studies for England.
6. Estimate the number of cases of IID in the population of each UK nation,
based on recall, via a national Telephone Survey of self-reported diarrhoea,
conducted over two time periods: a week, and a month.
7. Compare the burden of self-reported illness through the national Telephone
Survey with the burden of self-reported illness captured through NHS Direct in
England and NHS24 in Scotland.
8. Compare the prospective and self-reporting methods for estimating IID
incidence in the UK, over two time periods: a week and a month.
Additional objectives were to:-
9. Compare molecular methods with traditional microbiological techniques for IID
diagnosis.
10. Determine the contribution of Clostridium difficile to the aetiology of infectious
intestinal disease in the community.
11. Assess retrospective and prospective methods for determining IID burden.
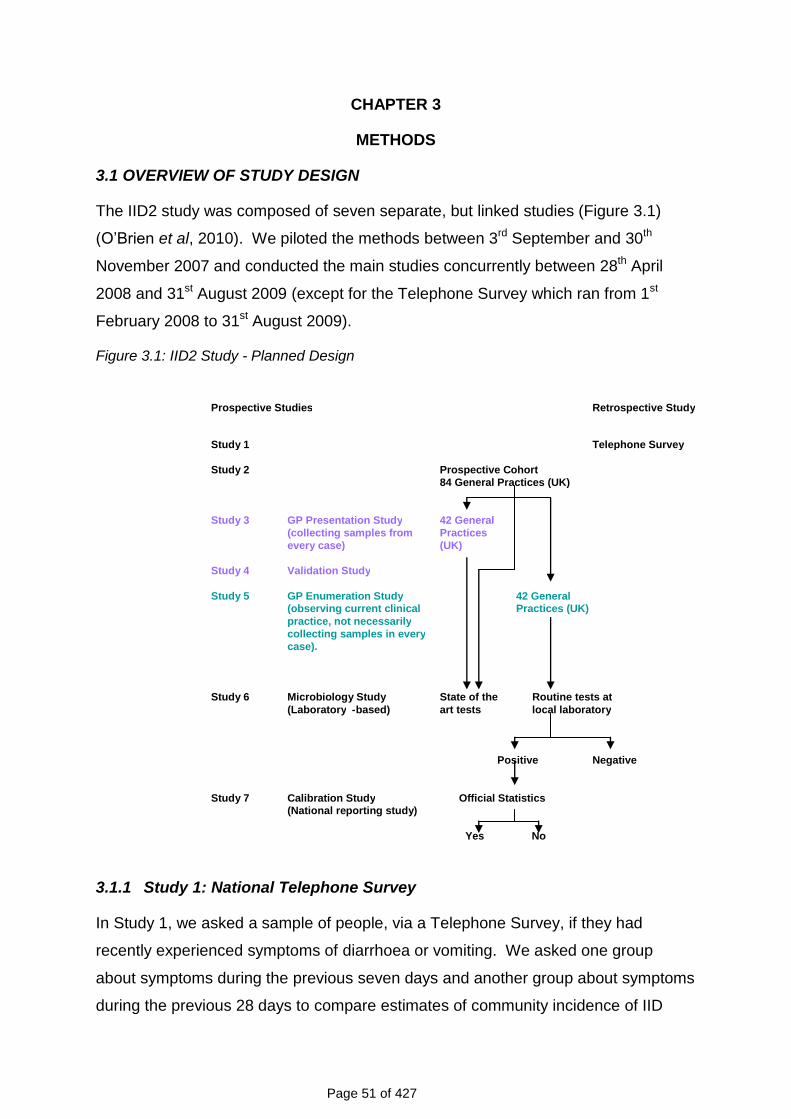
Page 51 of 427
CHAPTER 3
METHODS
3.1 OVERVIEW OF STUDY DESIGN
The IID2 study was composed of seven separate, but linked studies (Figure 3.1)
(O‟Brien et al, 2010). We piloted the methods between 3rd September and 30th
November 2007 and conducted the main studies concurrently between 28th April
2008 and 31st August 2009 (except for the Telephone Survey which ran from 1st
February 2008 to 31st August 2009).
Figure 3.1: IID2 Study - Planned Design
3.1.1 Study 1: National Telephone Survey
In Study 1, we asked a sample of people, via a Telephone Survey, if they had
recently experienced symptoms of diarrhoea or vomiting. We asked one group
about symptoms during the previous seven days and another group about symptoms
during the previous 28 days to compare estimates of community incidence of IID
Prospective Studies Retrospective Study
Study 1 Telephone Survey
Study 2 Prospective Cohort 84 General Practices (UK)
Study 3 GP Presentation Study 42 General (collecting samples from Practices every case) (UK)
Study 4 Validation Study
Study 5 GP Enumeration Study 42 General (observing current clinical Practices (UK) practice, not necessarily collecting samples in every case).
Study 6 Microbiology Study State of the Routine tests at (Laboratory - based) art tests local laboratory
Positive Negative
Study 7 Calibration Study Official Statistics (National reporting study)
Yes No
Page 52 of 427
obtained using the two different time periods. We compared this with the incidence
estimate from Study 2 (Prospective Population-Based Cohort Study). We also
compared incidence rates in the four UK countries.
3.1.2 Study 2: Prospective Population-Based Cohort Study
In Study 2, we aimed to recruit 8,400 people at random and follow them up for a
period of one year from 84 General Practices across the United Kingdom - the
sample size required to detect a 20% reduction in the incidence of IID presenting to
general practice since the mid-1990s. We followed up participants weekly for one
calendar year to find out how many developed new symptoms of IID. People who
developed IID completed a symptom questionnaire about their illness and their
contact with health services, e.g. NHS Direct/NHS24, and provided a stool sample.
We compared the community incidence of IID with corresponding estimates from the
Telephone Survey. We also compared the incidence of IID in England in 2008-9
with the incidence in 1993-6, at the time of IID1. We randomly assigned the
practices in Study 2 into two groups – those taking part in Studies 3 and 4, or those
taking part in Study 5 (see below).
3.1.3 Study 3: General Practice (GP) Presentation Study
In Study 3 (42 practices) Study Nurses invited everyone who consulted their GP for a
new episode of IID to complete a symptom questionnaire and provide a stool
sample. We used this information to estimate the incidence and aetiology of IID in
people presenting to primary care.
3.1.4 Study 4: General Practice (GP) Validation Study
In Study 4 we audited recruitment to the GP Presentation Study (Study 3). Study
Nurses searched practice records for anyone presenting with an episode of IID to the
practices taking part in Study 3 during the study period. They generated a list of all
the patients that should have been included in Study 3 using Read diagnostic codes
(Chisholm, 1990) and compared this with the actual recruitment list. We used this
information to adjust incidence estimates in Study 3 for under-ascertainment.
3.1.5 Study 5: General Practice (GP) Enumeration Study
In Study 5 we aimed to recruit the remaining 42 practices. Study Nurses searched
practice records for anyone presenting with an episode of IID. They recorded the
Page 53 of 427
patient‟s age, sex, postcode, place of consultation, admission to hospital and
whether or not a stool sample was requested. If a sample was requested they
recorded the result. We used this information to estimate the proportion of IID-
related consultations in routine practice that have laboratory-confirmed infection
documented in the medical records.
3.1.6 Study 6: Microbiology Study
In Study 6, all stool samples from Studies 2 and 3 were examined first at the HPA
Manchester Laboratory using conventional microbiological techniques and then at
the HPA CfI at Colindale using molecular methods.
3.1.7 Study 7: National Reporting Study
In Study 7, we used the results from studies 1 to 6 to estimate under-ascertainment
of community IID in national surveillance data by comparing the incidence estimates
from Studies 1 to 6 with those generated from national surveillance.
3.2 SETTING
The setting for the study was the population of the United Kingdom (UK). The
sampling frame for the prospective studies comprised the Medical Research Council
General Practice Research Framework (MRC GPRF) and Primary Care Research
Networks in England, Wales, Scotland and Northern Ireland. In the Telephone
Survey we created a database of landline telephone numbers by taking a random
selection of telephone numbers from GP surgeries across the UK and changing the
last three digits.
3.3 CASE DEFINITIONS AND EXCLUSION CRITERIA
Cases of IID were defined as people with loose stools or clinically significant
vomiting lasting less than two weeks, in the absence of a known non-infectious
cause, preceded by a symptom-free period of three weeks. Vomiting was
considered clinically significant if it occurred more than once in a 24-hour period and
if it incapacitated the case or was accompanied by other symptoms such as cramps
or fever.
Page 54 of 427
The exclusion criteria were:-
Patients with terminal illness.
Patients whose first language was not English and for whom a suitable
interpreter was not available.
Patients with severe mental incapacity.
Patients with non-infectious causes of diarrhoea or vomiting: Crohn‟s disease,
ulcerative colitis, cystic fibrosis, coeliac disease, surgical obstruction, excess
alcohol, morning sickness and, in infants, regurgitation.
These exclusions were employed because an infectious aetiology could not reliably
be determined, and because it would have been difficult to determine date of onset
for acute symptoms among patients with these conditions.
A case of Clostridium difficile-associated diarrhoea was defined as an
individual with symptoms of diarrhoea not attributable to another cause (i.e. in the
absence of other enteropathogens), occurring at the same time as a positive toxin
assay.
3.4 ETHICS COMMITTEE FAVOURABLE OPINION AND CONSENT
We received a favourable ethical opinion from the North West Research Ethics
Committee (07/MRE08/5) on 19th April 2007. In addition we sought NHS Research
Management and Governance approval for each of the study sites. This amounted
to 37 separate applications and approvals.
We obtained and recorded oral informed consent from participants in the
Telephone Survey using the CopyCall Telephone Recorder. We obtained written
informed consent from all adults in the prospective studies. We obtained written
informed assent from children and written informed consent from their parent or
guardian.
Page 55 of 427
3.5 PILOT STUDIES
We undertook the pilot studies between 3rd September 2007 and 1st December 2007
and submitted a full report to the Food Standards Agency in December 2007. We
have included an overview of the pilot studies to explain changes made to the
original protocol.
3.5.1 Objectives
The objectives of the pilot studies were:-
3.5.1.1 National Telephone Survey: To assess the recruitment process, participant
compliance and efficiency of data entry procedures.
3.5.1.2 Prospective Population-Based Cohort Study: To test the feasibility of the
recruitment process and the efficiency of participant follow-up, both overall and by
practice, and to assess the procedures for case ascertainment and the quality of
data entered into a web-based system.
3.5.1.3 GP Presentation Study: To assess the level of case referral by GPs, evaluate
procedures for work-up of IID cases and assess the quality of data entered into the
web-based system.
3.5.1.4 GP Validation Study: To evaluate the search strategy for identifying patients
with IID from practice records using Read codes in practices undertaking the GP
Presentation Study.
3.5.1.5 GP Enumeration Study: To evaluate the search strategy for identifying
patients with IID from practice records using Read codes in the remaining GP
practices, where clinical practice was simply observed.
3.5.1.6 Microbiology Studies: To determine the number of stool samples available in
sufficient quantity for testing, to obtain initial estimates of the frequency of organisms
identified by microbiological examination (including enrichment and PCR), and to
measure the time taken for data transfer between laboratories and GPs.
Page 56 of 427
3.5.2 Methods
3.5.2.1 National Telephone Survey
The pilot study took place between 18th October 2007 and 1st December 2007. First,
we generated a landline number bank by obtaining the full list of GP practices in
each UK country, randomly selecting 100 of these practices, and then replacing the
last three digits of the surgery telephone number with 150 randomly generated
numbers between 000 and 999. Telephonists selected numbers at random from the
number bank and dialled. For valid numbers they made up to four attempts to
contact the household on various days and at different times.
For valid telephone numbers, the telephonists asked the person who
answered the telephone if they wished to take part in the survey. If they agreed they
were then asked to choose the household member (present at the time of the call)
whose birthday occurred next. Telephonists sometimes interviewed respondents
aged ≥12 years directly, but they interviewed a parent or guardian about participants
aged <12 years. Telephonists obtained verbal informed consent from all participants
and parents of children aged <16 years. They recorded all calls using CopyCall
Telephone Recorder software. Telephonists asked respondents whether they had
experienced diarrhoea and/or vomiting and basic demographic characteristics. If
respondents reported diarrhoea and/or vomiting, telephonists asked more detailed
questions about symptoms and timing, use of healthcare service, diagnostic
methods, treatment practices and the effect of their illness on work and daily
activities.
3.5.2.2 Prospective Population-Based Cohort Study
The pilot studies in primary care began on 3rd September 2007. Six volunteer
general practices were recruited to take part in the pilot study – five from England
and one from Scotland. Study Nurses generated a random sample of people from
the practice age-sex register. They sent study information to eligible subjects with a
reply slip and stamped, addressed envelope. They followed up non-responders with
a second letter and then a telephone call. Study Nurses invited people who were
interested (up to a maximum of 30 participants) to attend a baseline recruitment
interview. If they agreed to participate the Study Nurses asked if they would prefer
to be followed-up via replying to a weekly automated e-mail or by returning weekly
Page 57 of 427
postcards. Study Nurses obtained written consent from all participants (assent from
children). They entered data onto a secure, bespoke web-based database. The
Study Nurses stopped recruiting when they reached their target of 30 people
enrolled.
3.5.2.3 GP Presentation Study
This took place between 17th September 2007 and 19th November 2007 in three
practices selected randomly from the six practices undertaking the Cohort Study.
People who fulfilled the case definition and consulted a GP or nurse in person or by
telephone, or were seen by out-of-hours providers (excluding NHS Direct/NHS24)
were invited to take part. If they were interested, the person conducting the
consultation gave them a study information sheet and a specimen pot and informed
them that the Study Nurse would contact them. The GP completed a referrals
notepad and sent the referral to the Study Nurse.
3.5.2.4 GP Validation Study
The three practices conducting the GP Presentation Study also undertook the GP
Validation Study during the same time period. The Study Nurses conducted a
search of the practice records using a list of IID-related Read codes (Appendix 2)
and produced a line list of all people who had presented to the practice with a new
episode of IID between 17th September 2007 and 19th November 2007. Having
collected the validation data the Study Nurses then checked the line list against the
list of people recruited into the GP Presentation Study.
3.5.2.5 GP Enumeration Study
The GP Enumeration Study covered the period between 17th September 2007 and
19th November 2007 and took place in the three practices not taking part in the GP
Presentation Study. Study Nurses conducted a search of the practice records using
a list of IID-related Read codes (Appendix 2) and produced a line list of all cases of
IID that had presented to the practice during the study period.
3.5.2.6 Microbiology Studies
Microbiological testing was performed at two sites. Diagnostic testing (traditional
microbiology) was performed at the HPA Regional Laboratory at Manchester and
molecular testing at CfI, Colindale, London.
Page 58 of 427
3.5.3 Results and Discussion
3.5.3.1 Telephone Survey
In the six-week pilot period, a total of 5,608 telephone numbers (including invalid
numbers, non-answered calls, ineligible numbers and refusals) was dialled. Of the
2,251 subjects with valid residential telephone numbers invited to take part in the
survey, 887 (39.5%) completed an interview. Issues identified in the pilot study
included the inefficiency of making three calls to valid numbers, difficulties with
implementing the next birthday method of sampling within households and problems
applying questions on socioeconomic classification.
3.5.3.2 Prospective Population-Based Cohort Study
In total, 2,213 eligible participants were invited of which 327 (14.8%) people
responded positively and 169 (51.9%) of these joined the cohort during the time
allotted for the pilot. Of those declining, 25% stated that they had insufficient time to
participate, 35% were not interested in taking part, 16% said that they were often
away and 24% gave other reasons. The most commonly cited “other reason” for not
taking part was not having (or never having) had diarrhoea and/or vomiting (34%).
We needed to amend the participant invitation letter and information sheets to clarify
the fact that participants need not have (or ever have had) diarrhoea or vomiting in
order to take part in the study.
Compliance with follow-up was good regardless of whether the participant
chose e-mails or postcards and the quality of data on the web-based database was
high.
The implication of the pilot study was that we needed to invite a larger number
of people to achieve the required sample size than we had anticipated initially.
3.5.3.3 GP Presentation Study
In total 23 patients presenting to their GP were invited to take part, 16 responded
positively (70%) and 13 (81%) were recruited. One patient had recovered before
their interview and two patients did not attend their appointment.
3.5.3.4 GP Validation Study
Sixty-five eligible IID-related consultations were identified corresponding to an
average of three consultations per practice per week. In total, 13 cases (20%) were
Page 59 of 427
recruited into the GP Presentation Study representing an average recruitment rate of
0.6 cases per week.
Anecdotal evidence from the Study Nurses suggested that General
Practitioners were just becoming accustomed to introducing the IID2 study to
symptomatic patients when the pilot study stopped.
3.5.3.5 GP Enumeration Study
One hundred and twenty-six consultations were identified in the three practices
taking part in this study corresponding to an average of 4.7 IID-related presentations
per practice per week.
Apparent discrepancies between the Validation and Enumeration Study
results related to practice size, age/sex distribution of patients registered with the
practices, the use of different GP clinical management software systems and
inconsistencies in Read coding between practices.
3.5.3.6 Microbiology Studies
Twenty seven stool samples were submitted to the HPA Manchester Laboratory
between 10th October 2007 and 30th November 2007. Three were insufficient for full
examination resulting in 24 specimens (89%) being examined and sent to the HPA
Centre for Infections for molecular testing. Of the 24 specimens examined in
Manchester, a pathogen was detected in four (16.6%). C. perfringens enterotoxin
was detected in three specimens (12.5%) and Giardia spp. in one specimen (4.2%).
Of the 24 samples received at CfI a pathogen was detected in 11 (45.8%) samples.
Norovirus was detected in seven (29.2%) samples and sapovirus, astrovirus and
Campylobacter jejuni in one (4.2%) sample each. A mixed infection with rotavirus
and Giardia spp. was detected in one (4.2%) sample.
3.5.4 Implications for the Main Studies
The major implications arising out of the pilot studies included:-
Inefficiency of three or more telephone call for unanswered calls in the
Telephone Survey.
Difficulty operating the next birthday method of sampling in the Telephone
Survey.
Page 60 of 427
Lower than anticipated participation in the Cohort Study.
Lower than anticipated invitations from GPs to patients to take part in the GP
Presentation Study.
Difficulty applying census questions on socio-economic classification in the
Telephone Survey and Cohort Study. This proved more of a problem in the
Telephone Survey where some individuals became very suspicious of
detailed questions about their occupation.
3.5.5 Changes to the Study Protocol and Study Material as a Result of the Pilot
Studies
3.5.5.1 Dropping the Third Telephone Call
The third telephone call was abandoned unless this was by prior arrangement with a
survey participant.
3.5.5.2 Replacing the Next Birthday Method of Random Sampling within Households
We replaced the next birthday method of random selection with a method that used
seniority within the household. Household size was used to generate a random
number reflecting age relative to other household members (i.e. 1st oldest, 2nd oldest
….nth oldest).
3.5.5.3 Improving Participation in the Prospective Population-Based Cohort Study
To improve Cohort Study participation we:-
Redrafted invitation letters and participant information sheets to make it clear
that participants did not need to have symptoms (or ever have had symptoms)
in order to take part in the study.
Doubled the size of the mail-shot to ensure that we achieved the required
sample size.
3.5.5.4 Improving Invitations to the GP Presentation Study
To improve invitations by GPs into the GP Presentation Study we:-
Used professionally designed posters to increase awareness of the study for
those people in the waiting room, so that patients could ask the receptionist

Page 61 of 427
for an information leaflet, make another appointment with the Study Nurse or
ask their GP about the study during the consultation.
E-mailed each practice their observed referral rates against the expected
referral rates and a short newsletter with anonymised charts comparing
practice performance.
Asked the Study Nurses to perform monthly validation searches with the top
five Read codes to track recruitment by practice and then to target practices
with lower invitation rates with site visits, or offers of extra support.
3.5.5.5 Streamlining questions on occupation
We included a question on job title in the Cohort Study and the Telephone Survey.
In the Cohort Study we continued to ask the full set of Census questions in order to
assign socioeconomic classification. In the Telephone Survey we planned to code
occupation using Computer Assisted Structured Coding Tool (CASCOT)
software2 to compare the Telephone Survey group with the Cohort Study group
based on job title.
A revised study protocol was submitted to, and approved by, the North West
Multi-Centre Research Ethics Committee on 6th March 2008. The changes could not
be implemented before NHS Research Management and Governance approval had
been granted by each of the 37 NHS R&D Organisations. Completing this process
took approximately four months.
2 http://www2.warwick.ac.uk/fac/soc/ier/publications/software/cascot/details/ - Date accessed 19th
July 2010
Page 62 of 427
3.6 MAIN STUDIES
The main studies took place from 28th April 2008 to 31st August 2009. The
exceptions were that the Telephone Survey continued from 1st February 2008 and
practices that took part in the pilot study carried on recruitment and weekly follow-up
of pilot participants. However, changes to the protocol were not implemented at
local level until Ethics and R&D approvals had been granted. This meant a
staggered start to recruitment in the main study. The study methods are described
in full below.
3.6.1 National Telephone Survey of Self-Reported Illness
We created an IID2 Study telephone numbers database by obtaining the full list of
GP practices in each UK country, randomly selecting 100 of these practices, taking
their contact number, and replacing the last three digits with 150 randomly generated
numbers between 000 and 999. To compensate for potential over-sampling in urban
areas, noted in the pilot study, we also included telephone number stems from
primary school listings (21,750 schools across the UK) and deleted any duplicate
numbers.
We selected households by random digit dialling of land lines from the IID2
Study telephone numbers database. We did not use mobile phone numbers. The
risk of introducing bias by not using mobile phone numbers was offset by a number
of considerations:-
The use of mobile phone numbers is not yet standard and reliable sampling
frames are not readily available.
Many mobile phone users are children and it would have been unethical to
contact them directly.
It is not easy to localise mobile phones to a geographical area.
In general terms, people without landlines tend to be younger and of lower socio-
economic status – groups who tend to respond poorly to surveys. It is, therefore,
unclear whether use of mobile phone numbers would help to mitigate selection bias.
However, to assess the potential for bias introduced by only using landlines, we
asked people recruited into the Prospective Population-Based Cohort Study about
Page 63 of 427
their main method of telephony. Approximately 95% reported primarily using a
landline.
A well-trained team of six to 10 part-time telephonists made calls between 5
pm and 9 pm on weekdays and between 10 am and 2 pm at weekends.
Telephonists did not know the name of the respondent, or the property they were
calling. As telephone number generation was completely random, the number
sometimes belonged to a commercial property or a fax machine or had not been
assigned. When this happened, or if a valid household refused to take part, the
telephonists did not call the number again. For valid numbers telephonists made no
more than three attempts to contact the household on different occasions, according
to an agreed algorithm (Appendix 3).
Telephonists randomly selected participants (present at the time of the call) in
households with more than one person by asking to speak to the “Nth” oldest person
in the household. “N” was a computer-generated random number based on the
number of people at home at the time of the call. All participants gave oral consent
to take part in the survey. If the person selected was a child under 12 years of age,
the telephonists interviewed the parent or guardian. For participants aged between
12 and 16 years old the interview was conducted either with the parent or guardian
or with the child, depending on parental preference.
The Telephone Survey incorporated questions on socio-demographic
characteristics, recent history of foreign travel, details of any clinical symptoms of IID
and healthcare seeking behaviour (if appropriate) (Appendix 4). To investigate
whether the accuracy of symptom reporting varied according to recall period, we
assigned participants randomly to questions about symptoms within the previous
seven days (80% of interviews) or 28 days (20% of interviews). Calls were recorded
using CopyCall Telephone Recorder or Retell 957 software. This call recording
software started recording automatically when the telephone call began, and stopped
and saved the call automatically when the call ended. All recordings were stored
centrally and time-date stamped so that specific files could be accessed easily.
Calls were recorded to allow double data entry for data validation, and to fulfil the
ethical requirement for documented informed consent. The telephonists entered
data directly onto a bespoke, secure, electronic database (Microsoft Access™)
during the course of the interview and data were stored off-site as a safety measure.

Page 64 of 427
3.6.2 Prospective Population-Based Cohort Study
We conducted the Prospective Population-Based Cohort Study in 88 practices.
Fifty-seven practices were from the MRC GPRF, 29 from the Primary Care Research
Network in England and two from the Scottish Primary Care Research Network.
3.6.2.1 Training
Staff at the MRC GPRF organised training for the Study Nurses taking part in
the study to ensure they understood the protocol. Most of the training sessions were
held in London and each lasted a day. The agenda covered the background, study
design and procedures, specimen collection, record searches and electronic data
capture (Appendix 5). We covered all relevant aspects of good clinical practice in
research (GCP), including how to obtain informed consent (or assent) and collect,
process and store data securely. The sessions were led by members of the IID2
study team including the Chief Investigator, Project Manager, Study Manager,
Microbiologist, Senior Research Nurse, Senior Nurse Manager and Senior Clinical
Scientist. We conducted 19 one-day training sessions in total and approximately 10-
20 nurses attended each time. We trained Study Nurses from a further eight
practices on site since they were unable to attend the training days in London.
We used standardised training materials to ensure consistency and trained
Study Nurses from practices taking part in the GP Presentation and Validation
Studies separately from those taking part in the Enumeration Study to avoid any
potential confusion.
We covered electronic data capture during the training days and showed the
Study Nurses how to use a bespoke, secure web-based data system developed by
Egton Software Services (see section 3.9) via a training website. We ensured that
they could log in to the training website after the training day to familiarise
themselves with the system before they recruited their first participants. They
received a comprehensive Study Nurse manual detailing all aspects of running the
study in the practice including the recruitment processes, exclusion criteria, case
definition and follow up procedures. To avoid any confusion, there were separate
manuals for those conducting the GP Presentation/Validation studies, and for those
conducting the Enumeration Study. There was also a training manual for the web-
based system, along with instructions on how to use the study registers, randomly
select patients from their practice list, perform a mail merge, and collect specimens.
Page 65 of 427
In addition, we gave Study Nurses the reporting algorithm from the laboratory,
detailing the reporting process from the laboratory to the practice.
3.6.2.2 Participant recruitment
The aim was to recruit 100 randomly selected participants of all ages in each
practice and to follow them up for a period of one calendar year from their
recruitment date. Study Nurses generated a randomised list of 800 individuals from
the practice age-sex register via practice software or by using Research
Randomizer3. They carried out a brief record search. The GPs in the practice
reviewed the lists prior to the invitations being sent to identify people who should not
be approached because they met the exclusion criteria or those who it would be
inappropriate to invite. Exclusions at this stage were logged on a study register.
Study Nurses posted study information (Appendix 6) to adults along with a
reply slip and pre-paid envelope. For children they sent invitation letters and study
information to the parent or guardian, along with a child information sheet (Appendix
6) and a pre-paid return envelope. Recipients indicated on the reply slip whether
they were interested in learning more about the study or not. If they were not
interested they were asked to state why. Non-responders received a second letter a
fortnight after the original invitation (Appendix 6).
Individuals who expressed interest in the study were invited to attend a
baseline recruitment interview. At this session the Study Nurse went through a
Microsoft PowerPoint™ presentation about the study (Appendix 7). People who
agreed to take part provided written, informed consent (Appendix 8), and baseline
demographic and socioeconomic information (Appendix 9). Children were invited to
the surgery with their parent or guardian. The child and parent or guardian was
taken through the consent procedure using child study material. If the child was
willing to participate, their parent or guardian provided consent. Baseline data were
recorded on the secure web-based system. Study Nurses gave the participants a
stool sample kit with written instructions on how to collect and send a stool sample to
the HPA Regional Laboratory in Manchester if they developed symptoms of IID
(Appendix 10). In addition participants received a short symptom questionnaire
(Appendix 9) to be completed and returned to the Study Nurse in a pre-paid
envelope if they experienced symptoms. The symptom questionnaire included
3 Available at www.randomizer.org - Date accessed 25
th June 2010
Page 66 of 427
questions on date of onset and duration of symptoms, symptom profile and severity,
contact with healthcare services as a result of the illness (including contact with NHS
Direct or NHS24, contact with or visits to a general practice clinic, walk-in centre or
accident and emergency department, and visits to hospital including any overnight
stays) and history of foreign travel in the 10 days before symptom onset (Appendix
9). Study Nurses provided replacement sample pots and questionnaires for
participants who developed symptoms, in case they experienced multiple episodes
during the study period. They sent out the replacement study materials three weeks
after the illness episode to ensure that any further samples were from a new episode
of illness. Participants received instructions for completing the weekly follow-ups,
and could elect to be followed-up either by e-mail or by postcard, as described in the
next two sections.
All the information on identification and recruitment of participants was
recorded on a study register (Appendix 11). This register was created in Microsoft
Excel™ format. Anonymised registers were transferred to the MRC GPRF
Coordinating Centre by e-mail on a weekly basis for inclusion in a central database.
3.6.2.3 E-mail follow-up
To be eligible for the e-mail group, participants needed to access their e-mail
account more than three times a week. They were asked to ensure that the e-mail
would not enter the “Spam” folder. They received an automated e-mail every
Monday and were asked to click on the appropriate hyperlink within the body of the
email to report whether or not they had experienced symptoms of diarrhoea and/or
vomiting during the previous 7 days (Appendix 12). Responses were recorded
automatically onto the web-based data system. A reminder e-mail was sent
automatically if the participant did not respond after three days. The Study Nurses
also ran a weekly report to identify non-responders, who were then contacted by
telephone and asked to respond to the e-mail. If participants persistently failed to
reply to their e-mails they were dropped from the study after four weeks of
consecutive non-response. We also stopped sending e-mails to participants who
chose to withdraw from the study.
Page 67 of 427
3.6.2.4 Postcard follow-up
Participants who chose to be followed up by postcard were given 52 pre-dated,
postage-paid postcards (Appendix 12). They were asked to return a postcard to the
Study Nurse each week indicating whether they had experienced symptoms of
diarrhoea and/or vomiting during the previous 7 days (as per e-mail follow-up).
Study Nurses entered information from postcards onto the web-based data system.
They ran weekly reports to identify missing postcards and telephoned non-
responders reminding them to mail their postcard. If a participant did not return
postcards on four consecutive weeks, they were dropped from the study.
3.6.2.5 Second phase of recruitment
During the first phase of recruitment to the Prospective Population-Based Cohort
Study, certain groups (16-24 year-old males and 25-34 year olds) were particularly
under-represented. These groups were targeted with revised study material aimed
specifically at these age groups during a second phase of recruitment (Appendix 6).
A random list of 250 individuals aged between 16 and 34 years was
generated from the patient register of each practice. Those who had been
approached previously in the first phase of recruitment were excluded, and the
remainder received a letter signed by their GP. This contained an invitation to take
part in the study, an information sheet that explained the study and what would be
involved if they agreed to participate, and a pre-paid envelope in which to return their
response. People who were interested in the study were recruited using the
procedures described above.
3.6.3 General Practice (GP) Presentation Study
General practices were assigned randomly to take part in the GP Presentation Study
(and Validation Study) or the GP Enumeration Study (see section 3.6.5). The aim
was to recruit all patients who fulfilled the case definition and consulted a healthcare
practitioner (e.g. General Pracitioner or practice nurse) in person or by telephone, or
were seen by an out-of-hours service provider. Telephone contact with NHS
Direct/NHS24 was not included. Anyone registered with the practice who consulted
their General Practitioner for an episode of IID was eligible unless they met the
exclusion criteria (see section 3.3).
Page 68 of 427
The Study Nurses introduced the GP Presentation Study to the General
Pracitioners at practice meetings and other informal meetings. They provided each
healthcare practitioner (normally the General Practitioner) with a laminated
information sheet that included the case definition and a referral pad to provide
minimal information for the Study Nurse (i.e. patient‟s name, date of birth and
telephone number).
During the consultation all patients who fulfilled the case definition should
have been invited to take part in the study. The healthcare practitioner gave them a
study information sheet and a specimen pot and informed them that the Study Nurse
would contact them. Children and their parent or guardian received a children‟s
information sheet (Appendix 6).
The Study Nurses invited interested patients to attend a baseline recruitment
interview. At this session the Study Nurse explained the study using a Microsoft
PowerPointTM presentation (Appendix 7). If the person agreed, they signed a
consent form (Appendix 8) and completed a questionnaire containing baseline
demographic and socioeconomic information, as well as clinical details regarding
their illness and contact with healthcare services (Appendix 9). Children were invited
to the surgery with their parent or guardian. The child and parent or guardian was
taken through the consent procedure using child study material. For children willing
to participate, their parent or guardian provided consent. If the participant brought a
stool sample this was sent immediately to the HPA Manchester Laboratory.
Otherwise the Study Nurse checked that the participant had a specimen pot and
went through the instructions for collecting a sample (Appendix 10). Anonymised
details of all patients referred to the Study Nurse were entered into an electronic
study register (Appendix 11). Each Study Nurse sent an updated secure version of
the study register to the MRC GPRF Coordinating Centre every week. This
information was updated weekly on a central database.
3.6.4 General Practice (GP) Validation Study
The aim of the GP Validation Study was to determine the degree of under-
ascertainment4 of recorded IID in the GP Presentation Study. All practices
participating in the GP Presentation Study took part in the Validation Study. Study
4 Under-ascertainment is used to assess the completeness of referral of eligible cases into the study.
Page 69 of 427
Nurses in each practice searched the practice database once a month, throughout
the duration of the GP Presentation Study, using a pre-determined set of Read
codes (Appendix 2) to identify all IID-related presentations occurring during the same
time period as the GP Presentation Study.
The Study Nurses recorded the following details, where available in the
medical records, on a standard form:- the case's age, sex, symptoms, date of onset
and information about the place of consultation, admission to hospital, recent travel
outside the UK, time off work/school and whether or not a stool specimen had been
requested (Appendix 9). If a stool sample was requested as part of the consultation
and the results were recorded in the medical records, the Study Nurse recorded the
result. Once the Study Nurses had completed this search, they checked to see if the
case had been recruited into the GP Presentation Study. If so, they recorded the
relevant GP Presentation Study number onto an electronic study register (Appendix
11), which contained anonymised data on all patients in the Validation Study
(including age, sex and study ID). Hard copies of all anonymised forms were
forwarded to the MRC GPRF for entry onto a dedicated Microsoft Access™
Validation database. The anonymised electronic study registers were also
forwarded to MRC GPRF Coordinating Centre on a monthly basis.
3.6.5 General Practice (GP) Enumeration Study
The GP Enumeration Study was a survey of routine clinical practice for the
management of IID cases and of IID organisms identified in routine laboratory
practice. The aim was to compare the results of the GP Presentation and
Enumeration Studies to determine the relationship between the total number of
people who consulted their GP with IID, and the number of people who consulted
with IID and had the cause of their infection laboratory confirmed in routine clinical
practice. Using the same pre-determined set of Read codes as that used in the
Validation Study (Appendix 2), the Study Nurses identified all patients from the
practice database for whom the consultation coding was compatible with IID. Where
available in the medical records, they recorded the following details directly on the
web-based data system:- the case's age, sex, symptoms, date of onset, place of
consultation, admission to hospital, recent travel outside the UK, time off work/school
and whether or not a stool sample was requested. If a stool sample was requested
Page 70 of 427
as part of the consultation, and a result was recorded in the medical records, the
Study Nurse recorded the result (Appendix 9).
3.6.6 NHS DIRECT/NHS24
The HPA Real-Time Syndromic Surveillance Team in Birmingham provided data on
calls to NHS Direct and NHS24 during the two-year period 1st July 2007 to 30th June
2009. We excluded data for the last two months of the IID2 Study (1st July 2009 to
31st August 2009) to avoid artefacts in call rates resulting from the H1N1 influenza
pandemic. The introduction of emergency telephone assessment tools for colds and
flu during this period led to a dramatic drop in the calls to these services that were
categorised as diarrhoea and vomiting.
For NHS Direct we obtained anonymised individual records on all calls for
which the main complaint was recorded as „Diarrhoea‟, „Vomiting‟ or „Food
poisoning‟. Information was available on each call regarding date of the call, the age
and sex of the patient, call type (based on the predominant complaint as assessed
by the triage nurse) and call outcome (based on what the caller was advised to do).
For NHS24, only aggregated data were available. We obtained the number of
calls received each day for which the main complaint was recorded as „Diarrhoea‟ or
„Vomiting‟, aggregated by age group. Information on sex and call outcome was not
available.
3.6.7 National Surveillance Study
Individual, anonymised records of positive identifications of IID-related pathogens
reported to each of the national surveillance systems between 1st April 2008 and 31st
August 2009 were downloaded from the respective databases. The laboratory
reports requested covered the range of pathogens sought in the IID2 Study. To
allow for reporting delays the data were extracted after 1st December 2009. The
data fields extracted were:-
Unique identifier.
Country.
Age in years.
Sex.
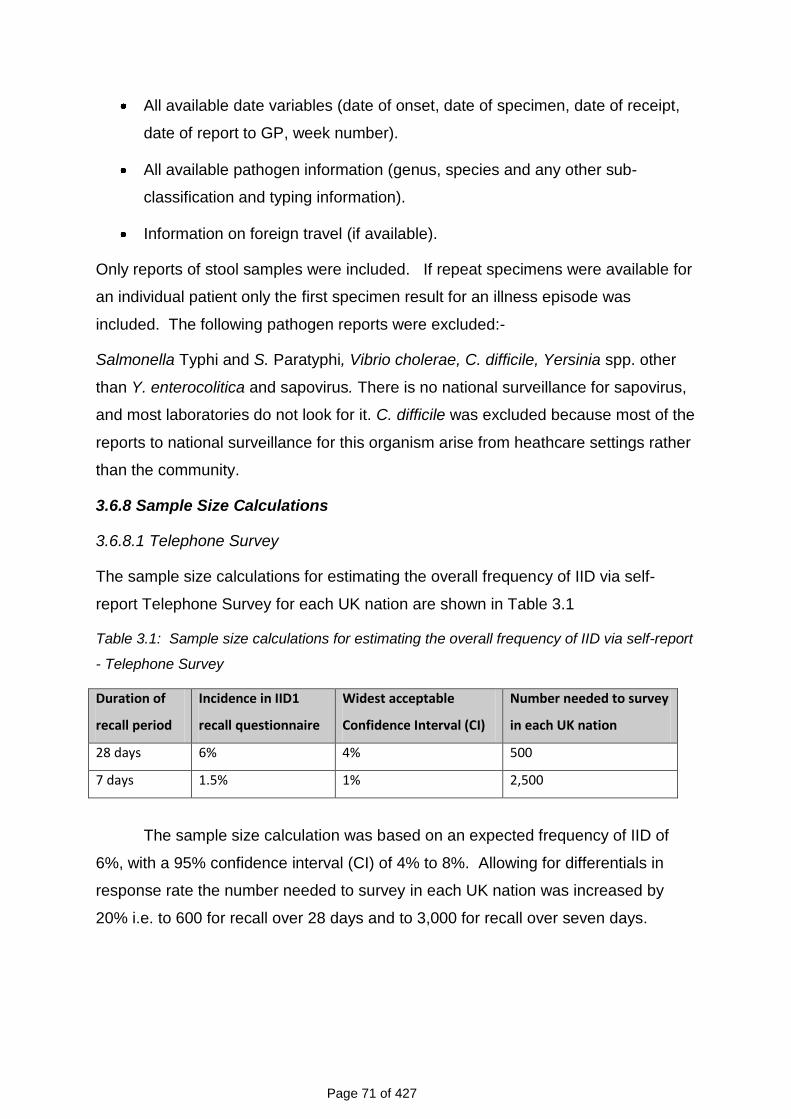
Page 71 of 427
All available date variables (date of onset, date of specimen, date of receipt,
date of report to GP, week number).
All available pathogen information (genus, species and any other sub-
classification and typing information).
Information on foreign travel (if available).
Only reports of stool samples were included. If repeat specimens were available for
an individual patient only the first specimen result for an illness episode was
included. The following pathogen reports were excluded:-
Salmonella Typhi and S. Paratyphi, Vibrio cholerae, C. difficile, Yersinia spp. other
than Y. enterocolitica and sapovirus. There is no national surveillance for sapovirus,
and most laboratories do not look for it. C. difficile was excluded because most of the
reports to national surveillance for this organism arise from heathcare settings rather
than the community.
3.6.8 Sample Size Calculations
3.6.8.1 Telephone Survey
The sample size calculations for estimating the overall frequency of IID via self-
report Telephone Survey for each UK nation are shown in Table 3.1
Table 3.1: Sample size calculations for estimating the overall frequency of IID via self-report
- Telephone Survey
Duration of
recall period
Incidence in IID1
recall questionnaire
Widest acceptable
Confidence Interval (CI)
Number needed to survey
in each UK nation
28 days 6% 4% 500
7 days 1.5% 1% 2,500
The sample size calculation was based on an expected frequency of IID of
6%, with a 95% confidence interval (CI) of 4% to 8%. Allowing for differentials in
response rate the number needed to survey in each UK nation was increased by
20% i.e. to 600 for recall over 28 days and to 3,000 for recall over seven days.
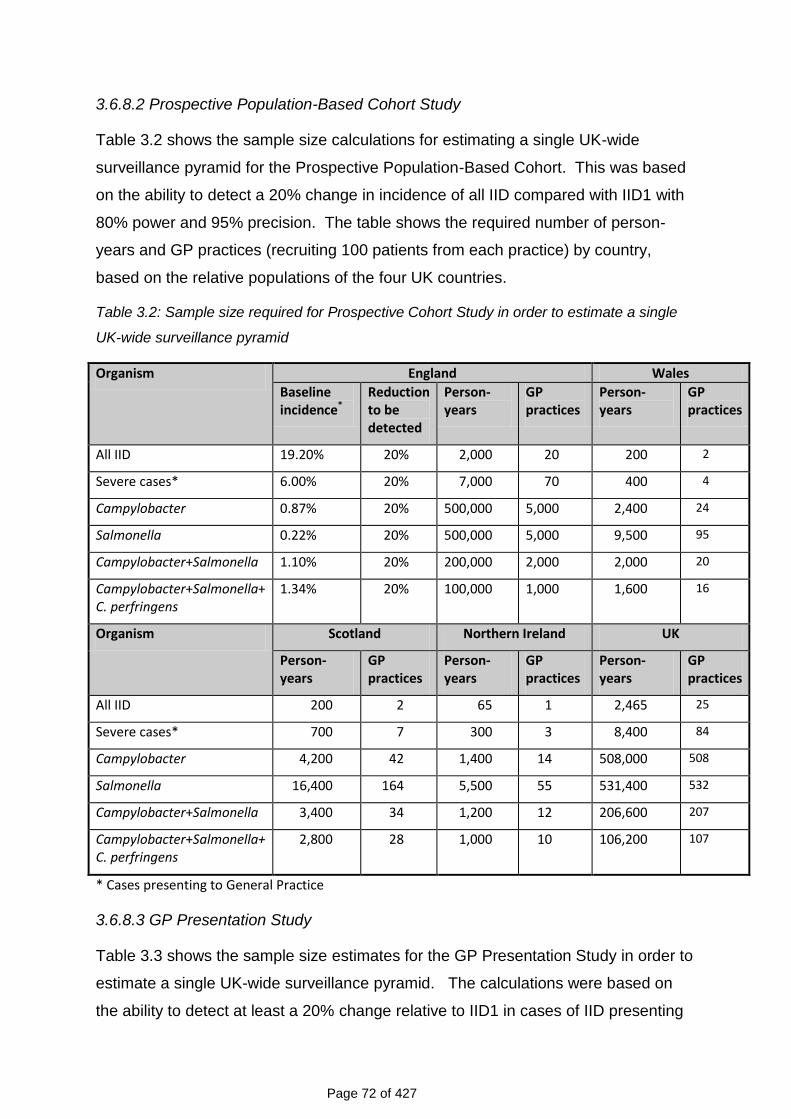
Page 72 of 427
3.6.8.2 Prospective Population-Based Cohort Study
Table 3.2 shows the sample size calculations for estimating a single UK-wide
surveillance pyramid for the Prospective Population-Based Cohort. This was based
on the ability to detect a 20% change in incidence of all IID compared with IID1 with
80% power and 95% precision. The table shows the required number of person-
years and GP practices (recruiting 100 patients from each practice) by country,
based on the relative populations of the four UK countries.
Table 3.2: Sample size required for Prospective Cohort Study in order to estimate a single
UK-wide surveillance pyramid
Organism England Wales
Baseline incidence*
Reduction to be detected
Person-years
GP practices
Person-years
GP practices
All IID 19.20% 20% 2,000 20 200 2
Severe cases* 6.00% 20% 7,000 70 400 4
Campylobacter 0.87% 20% 500,000 5,000 2,400 24
Salmonella 0.22% 20% 500,000 5,000 9,500 95
Campylobacter+Salmonella 1.10% 20% 200,000 2,000 2,000 20
Campylobacter+Salmonella+ C. perfringens
1.34% 20% 100,000 1,000 1,600 16
Organism Scotland Northern Ireland UK
Person-years
GP practices
Person-years
GP practices
Person-years
GP practices
All IID 200 2 65 1 2,465 25
Severe cases* 700 7 300 3 8,400 84
Campylobacter 4,200 42 1,400 14 508,000 508
Salmonella 16,400 164 5,500 55 531,400 532
Campylobacter+Salmonella 3,400 34 1,200 12 206,600 207
Campylobacter+Salmonella+ C. perfringens
2,800 28 1,000 10 106,200 107
* Cases presenting to General Practice
3.6.8.3 GP Presentation Study
Table 3.3 shows the sample size estimates for the GP Presentation Study in order to
estimate a single UK-wide surveillance pyramid. The calculations were based on
the ability to detect at least a 20% change relative to IID1 in cases of IID presenting
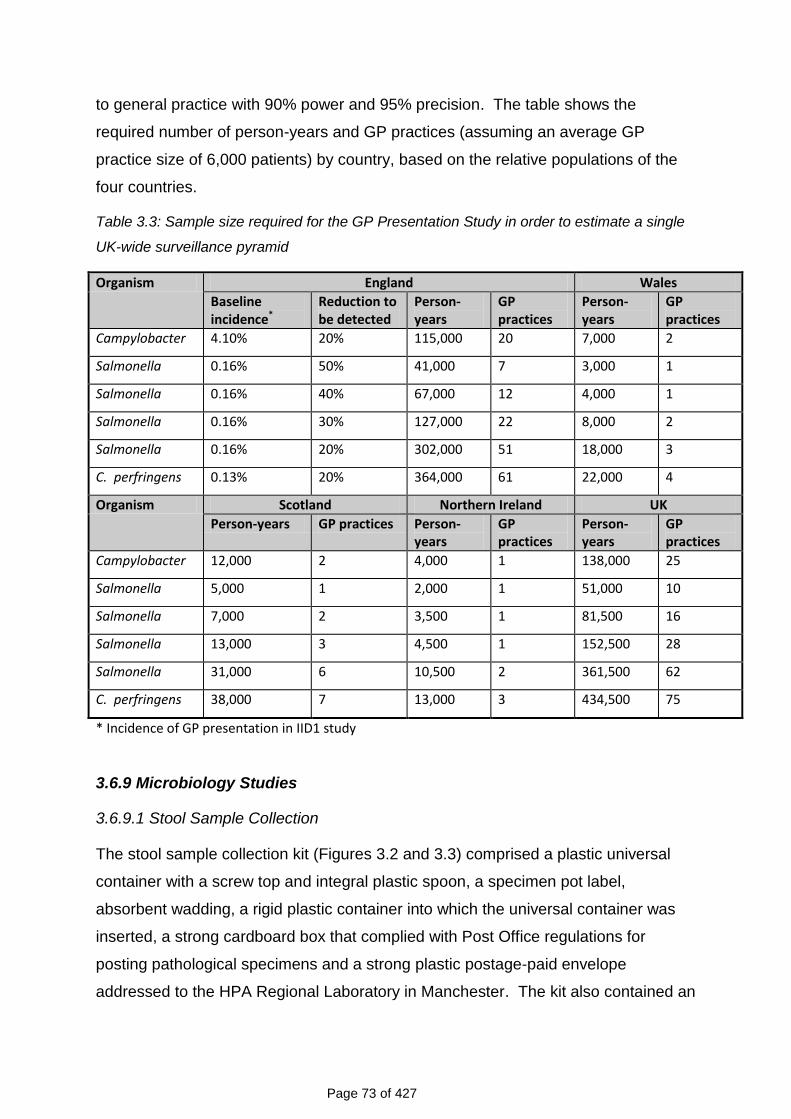
Page 73 of 427
to general practice with 90% power and 95% precision. The table shows the
required number of person-years and GP practices (assuming an average GP
practice size of 6,000 patients) by country, based on the relative populations of the
four countries.
Table 3.3: Sample size required for the GP Presentation Study in order to estimate a single
UK-wide surveillance pyramid
Organism England Wales
Baseline incidence*
Reduction to be detected
Person-years
GP practices
Person-years
GP practices
Campylobacter 4.10% 20% 115,000 20 7,000 2
Salmonella 0.16% 50% 41,000 7 3,000 1
Salmonella 0.16% 40% 67,000 12 4,000 1
Salmonella 0.16% 30% 127,000 22 8,000 2
Salmonella 0.16% 20% 302,000 51 18,000 3
C. perfringens 0.13% 20% 364,000 61 22,000 4
Organism Scotland Northern Ireland UK
Person-years GP practices Person-years
GP practices
Person-years
GP practices
Campylobacter 12,000 2 4,000 1 138,000 25
Salmonella 5,000 1 2,000 1 51,000 10
Salmonella 7,000 2 3,500 1 81,500 16
Salmonella 13,000 3 4,500 1 152,500 28
Salmonella 31,000 6 10,500 2 361,500 62
C. perfringens 38,000 7 13,000 3 434,500 75
* Incidence of GP presentation in IID1 study
3.6.9 Microbiology Studies
3.6.9.1 Stool Sample Collection
The stool sample collection kit (Figures 3.2 and 3.3) comprised a plastic universal
container with a screw top and integral plastic spoon, a specimen pot label,
absorbent wadding, a rigid plastic container into which the universal container was
inserted, a strong cardboard box that complied with Post Office regulations for
posting pathological specimens and a strong plastic postage-paid envelope
addressed to the HPA Regional Laboratory in Manchester. The kit also contained an
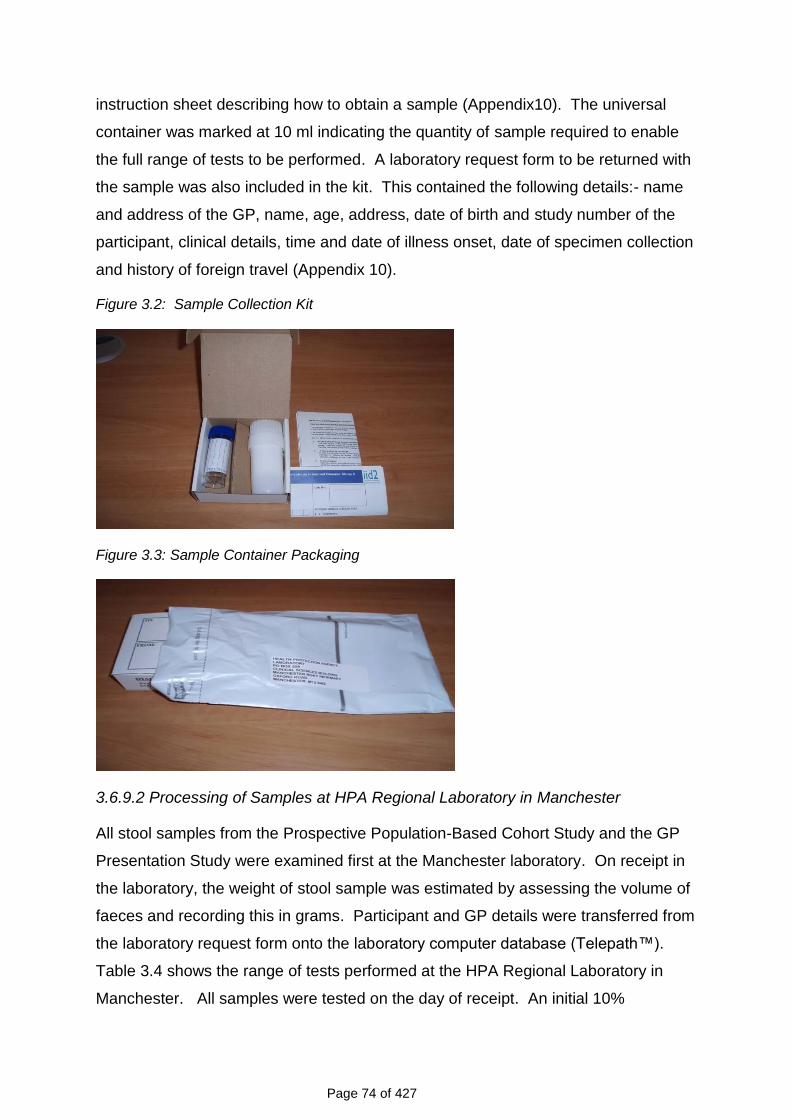
Page 74 of 427
instruction sheet describing how to obtain a sample (Appendix10). The universal
container was marked at 10 ml indicating the quantity of sample required to enable
the full range of tests to be performed. A laboratory request form to be returned with
the sample was also included in the kit. This contained the following details:- name
and address of the GP, name, age, address, date of birth and study number of the
participant, clinical details, time and date of illness onset, date of specimen collection
and history of foreign travel (Appendix 10).
Figure 3.2: Sample Collection Kit
Figure 3.3: Sample Container Packaging
3.6.9.2 Processing of Samples at HPA Regional Laboratory in Manchester
All stool samples from the Prospective Population-Based Cohort Study and the GP
Presentation Study were examined first at the Manchester laboratory. On receipt in
the laboratory, the weight of stool sample was estimated by assessing the volume of
faeces and recording this in grams. Participant and GP details were transferred from
the laboratory request form onto the laboratory computer database (Telepath™).
Table 3.4 shows the range of tests performed at the HPA Regional Laboratory in
Manchester. All samples were tested on the day of receipt. An initial 10%
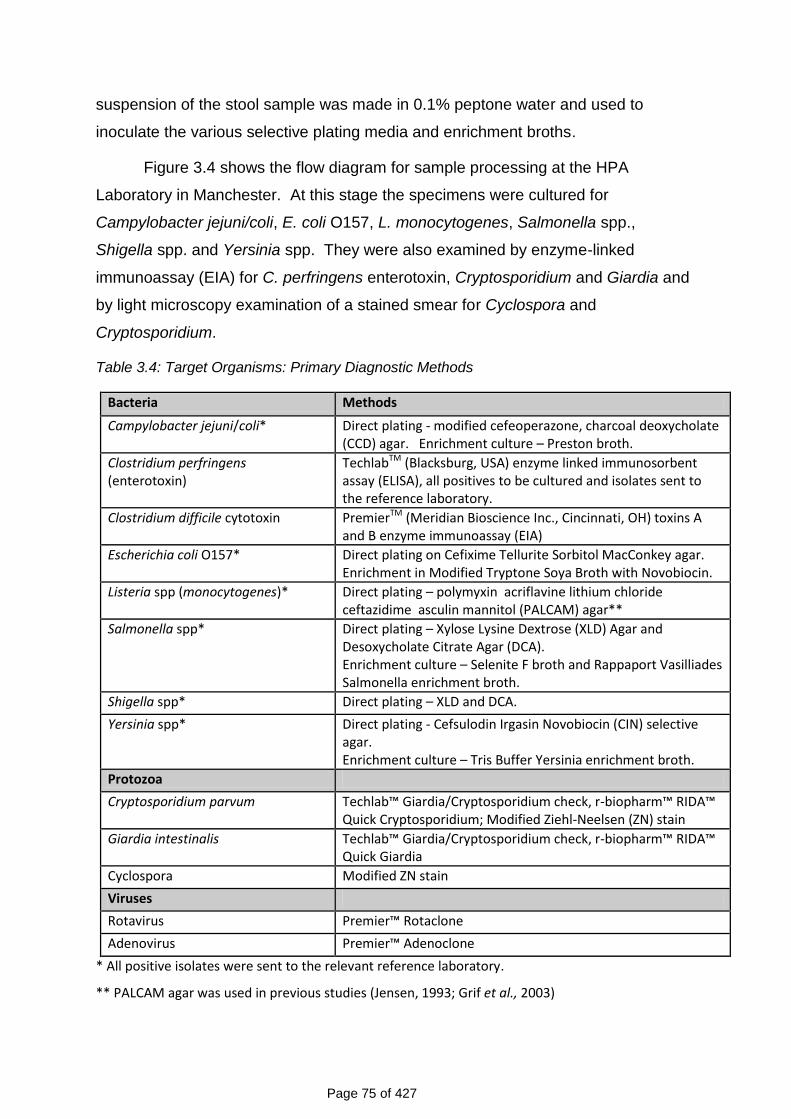
Page 75 of 427
suspension of the stool sample was made in 0.1% peptone water and used to
inoculate the various selective plating media and enrichment broths.
Figure 3.4 shows the flow diagram for sample processing at the HPA
Laboratory in Manchester. At this stage the specimens were cultured for
Campylobacter jejuni/coli, E. coli O157, L. monocytogenes, Salmonella spp.,
Shigella spp. and Yersinia spp. They were also examined by enzyme-linked
immunoassay (EIA) for C. perfringens enterotoxin, Cryptosporidium and Giardia and
by light microscopy examination of a stained smear for Cyclospora and
Cryptosporidium.
Table 3.4: Target Organisms: Primary Diagnostic Methods
Bacteria Methods
Campylobacter jejuni/coli* Direct plating - modified cefeoperazone, charcoal deoxycholate (CCD) agar. Enrichment culture – Preston broth.
Clostridium perfringens (enterotoxin)
TechlabTM (Blacksburg, USA) enzyme linked immunosorbent assay (ELISA), all positives to be cultured and isolates sent to the reference laboratory.
Clostridium difficile cytotoxin PremierTM (Meridian Bioscience Inc., Cincinnati, OH) toxins A and B enzyme immunoassay (EIA)
Escherichia coli O157* Direct plating on Cefixime Tellurite Sorbitol MacConkey agar. Enrichment in Modified Tryptone Soya Broth with Novobiocin.
Listeria spp (monocytogenes)* Direct plating – polymyxin acriflavine lithium chloride ceftazidime asculin mannitol (PALCAM) agar**
Salmonella spp* Direct plating – Xylose Lysine Dextrose (XLD) Agar and Desoxycholate Citrate Agar (DCA). Enrichment culture – Selenite F broth and Rappaport Vasilliades Salmonella enrichment broth.
Shigella spp* Direct plating – XLD and DCA.
Yersinia spp* Direct plating - Cefsulodin Irgasin Novobiocin (CIN) selective agar. Enrichment culture – Tris Buffer Yersinia enrichment broth.
Protozoa
Cryptosporidium parvum Techlab™ Giardia/Cryptosporidium check, r-biopharm™ RIDA™ Quick Cryptosporidium; Modified Ziehl-Neelsen (ZN) stain
Giardia intestinalis Techlab™ Giardia/Cryptosporidium check, r-biopharm™ RIDA™ Quick Giardia
Cyclospora Modified ZN stain
Viruses
Rotavirus Premier™ Rotaclone
Adenovirus Premier™ Adenoclone
* All positive isolates were sent to the relevant reference laboratory.
** PALCAM agar was used in previous studies (Jensen, 1993; Grif et al., 2003)
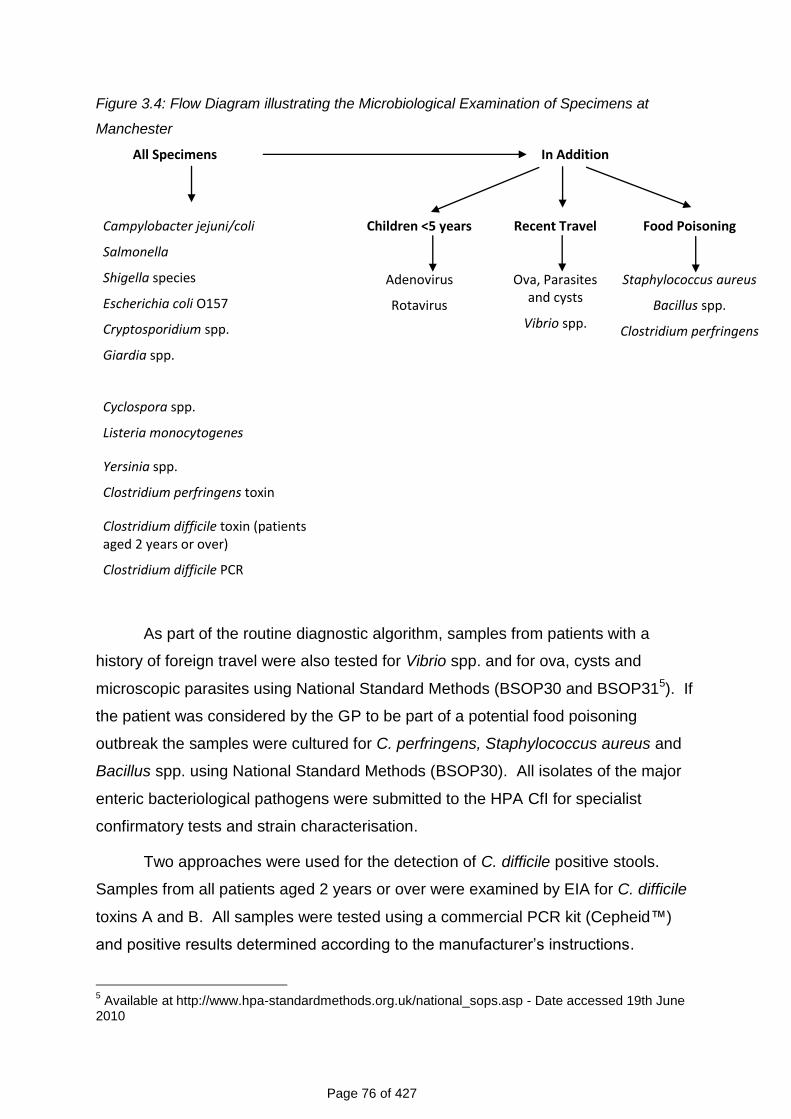
Page 76 of 427
Figure 3.4: Flow Diagram illustrating the Microbiological Examination of Specimens at
Manchester
All Specimens
In Addition
Campylobacter jejuni/coli
Salmonella
Shigella species
Escherichia coli O157
Cryptosporidium spp.
Giardia spp.
Cyclospora spp.
Listeria monocytogenes
Yersinia spp.
Clostridium perfringens toxin
Clostridium difficile toxin (patients aged 2 years or over)
Clostridium difficile PCR
Children <5 years
Adenovirus
Rotavirus
Recent Travel
Ova, Parasites and cysts
Vibrio spp.
Food Poisoning
Staphylococcus aureus
Bacillus spp.
Clostridium perfringens
As part of the routine diagnostic algorithm, samples from patients with a
history of foreign travel were also tested for Vibrio spp. and for ova, cysts and
microscopic parasites using National Standard Methods (BSOP30 and BSOP315). If
the patient was considered by the GP to be part of a potential food poisoning
outbreak the samples were cultured for C. perfringens, Staphylococcus aureus and
Bacillus spp. using National Standard Methods (BSOP30). All isolates of the major
enteric bacteriological pathogens were submitted to the HPA CfI for specialist
confirmatory tests and strain characterisation.
Two approaches were used for the detection of C. difficile positive stools.
Samples from all patients aged 2 years or over were examined by EIA for C. difficile
toxins A and B. All samples were tested using a commercial PCR kit (Cepheid™)
and positive results determined according to the manufacturer‟s instructions.
5 Available at http://www.hpa-standardmethods.org.uk/national_sops.asp - Date accessed 19th June
2010
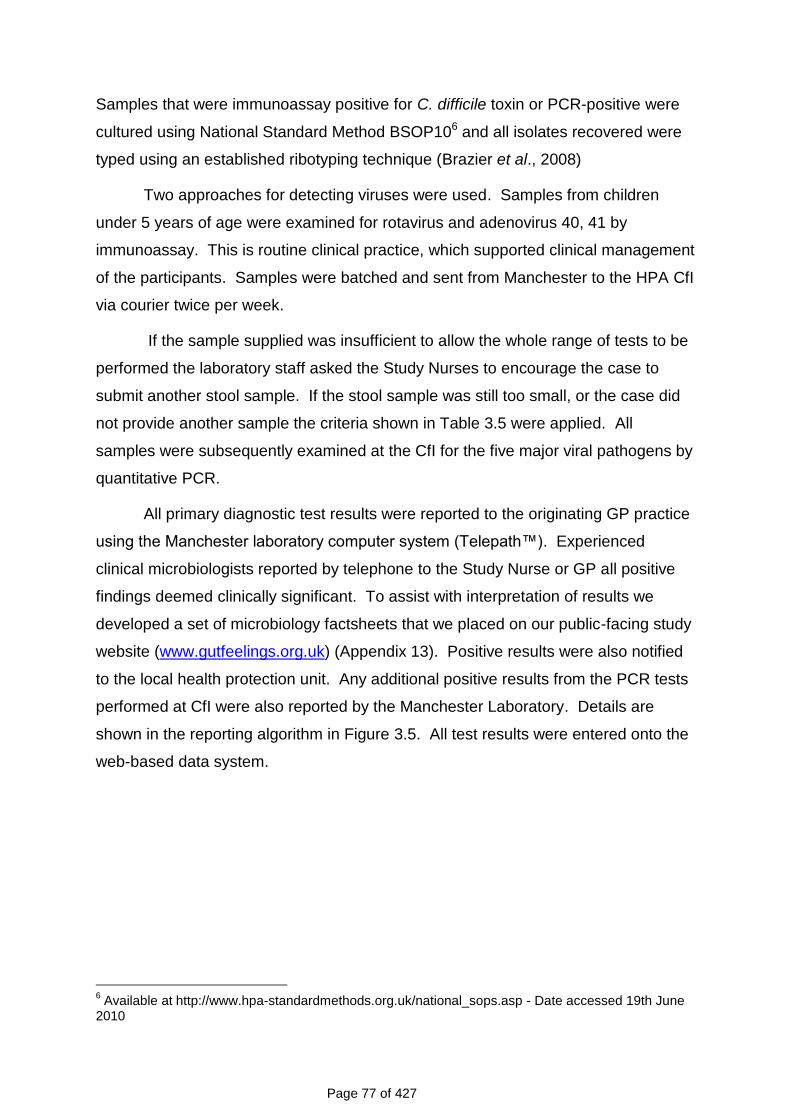
Page 77 of 427
Samples that were immunoassay positive for C. difficile toxin or PCR-positive were
cultured using National Standard Method BSOP106 and all isolates recovered were
typed using an established ribotyping technique (Brazier et al., 2008)
Two approaches for detecting viruses were used. Samples from children
under 5 years of age were examined for rotavirus and adenovirus 40, 41 by
immunoassay. This is routine clinical practice, which supported clinical management
of the participants. Samples were batched and sent from Manchester to the HPA CfI
via courier twice per week.
If the sample supplied was insufficient to allow the whole range of tests to be
performed the laboratory staff asked the Study Nurses to encourage the case to
submit another stool sample. If the stool sample was still too small, or the case did
not provide another sample the criteria shown in Table 3.5 were applied. All
samples were subsequently examined at the CfI for the five major viral pathogens by
quantitative PCR.
All primary diagnostic test results were reported to the originating GP practice
using the Manchester laboratory computer system (Telepath™). Experienced
clinical microbiologists reported by telephone to the Study Nurse or GP all positive
findings deemed clinically significant. To assist with interpretation of results we
developed a set of microbiology factsheets that we placed on our public-facing study
website (www.gutfeelings.org.uk) (Appendix 13). Positive results were also notified
to the local health protection unit. Any additional positive results from the PCR tests
performed at CfI were also reported by the Manchester Laboratory. Details are
shown in the reporting algorithm in Figure 3.5. All test results were entered onto the
web-based data system.
6 Available at http://www.hpa-standardmethods.org.uk/national_sops.asp - Date accessed 19th June
2010
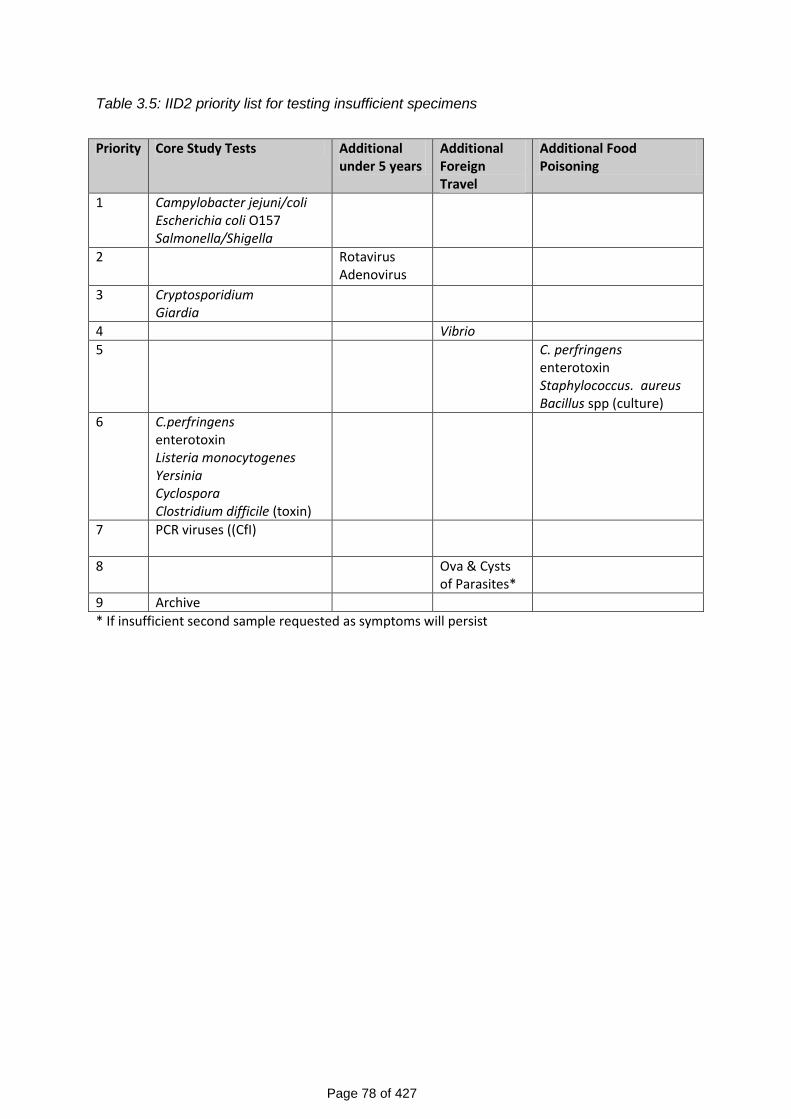
Page 78 of 427
Table 3.5: IID2 priority list for testing insufficient specimens
Priority Core Study Tests Additional
under 5 years Additional Foreign Travel
Additional Food Poisoning
1 Campylobacter jejuni/coli Escherichia coli O157 Salmonella/Shigella
2
Rotavirus Adenovirus
3
Cryptosporidium Giardia
4 Vibrio
5
C. perfringens enterotoxin Staphylococcus. aureus Bacillus spp (culture)
6
C.perfringens enterotoxin Listeria monocytogenes Yersinia Cyclospora Clostridium difficile (toxin)
7
PCR viruses ((CfI)
8 Ova & Cysts of Parasites*
9 Archive
* If insufficient second sample requested as symptoms will persist
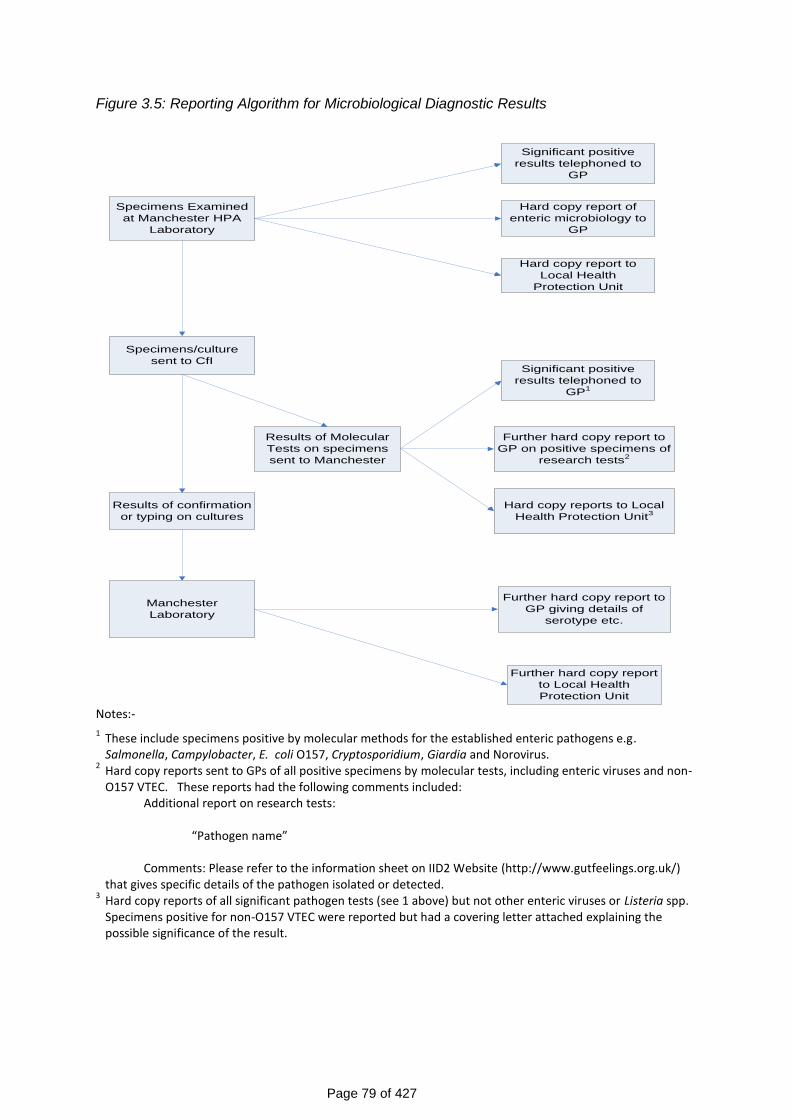
Page 79 of 427
Figure 3.5: Reporting Algorithm for Microbiological Diagnostic Results
Notes:-
1 These include specimens positive by molecular methods for the established enteric pathogens e.g. Salmonella, Campylobacter, E. coli O157, Cryptosporidium, Giardia and Norovirus.
2 Hard copy reports sent to GPs of all positive specimens by molecular tests, including enteric viruses and non-O157 VTEC. These reports had the following comments included:
Additional report on research tests: “Pathogen name” Comments: Please refer to the information sheet on IID2 Website (http://www.gutfeelings.org.uk/)
that gives specific details of the pathogen isolated or detected. 3 Hard copy reports of all significant pathogen tests (see 1 above) but not other enteric viruses or Listeria spp. Specimens positive for non-O157 VTEC were reported but had a covering letter attached explaining the possible significance of the result.
Specimens Examined
at Manchester HPA
Laboratory
Hard copy report of
enteric microbiology to
GP
Specimens/culture
sent to CfI
Results of Molecular
Tests on specimens
sent to Manchester
Results of confirmation
or typing on cultures
Manchester
Laboratory
Further hard copy report to
GP on positive specimens of
research tests2
Further hard copy report to
GP giving details of
serotype etc.
Hard copy report to
Local Health
Protection Unit
Further hard copy report
to Local Health
Protection Unit
Significant positive
results telephoned to
GP
Significant positive
results telephoned to
GP1
Hard copy reports to Local
Health Protection Unit3
Page 80 of 427
3.6.9.3 Molecular Methods used at HPA Centre for Infections
Figure 3.6 shows the flow diagram for sample processing at the CfI. Two nucleic
acid extracts were prepared from each stool sample by a modification of the method
of Boom and colleagues (1990). For one sample of DNA mechanical disruption
using zirconia beads was included (McLauchlin et al., 1999) and in the second
sample RNA was immediately converted to cDNA through random primed reverse
transcription (Green et al., 1993). The reverse transcriptase reactions using random
hexamer priming have been described elsewhere (Amar et al., 2003; Amar et al.,
2004; Amar et al., 2005). Each extract was examined by real-time PCR for a range
of potential pathogens (Table 3.6). These were C. jejuni, C. coli, C. difficile, L.
monocytogenes, Salmonella species, rotavirus, norovirus, sapovirus, adenovirus,
astrovirus, Cryptosporidium, Giardia and E. coli (Enteroaggregative and Vero
cytotoxin-producing (genes encoding VT1 and VT2)).
Nucleic acid extraction and reverse transcription were monitored through the
inclusion of DNA (fragment of Phocine herpes virus 1 gB gene) and RNA (fragment
of the mouse mengo virus genome) controls. Positive and negative microbe-specific
controls were included in each assay run in order to monitor the target-specific
reagents. Extraction controls were quantitative, allowing the use of Westgard rules
(Westgard et al., 1997)7 to determine whether the assays were within +3 standard
deviations (SD) of the expected value and to determine the co-efficient of variation
(CV). Suitable criteria for assigning positive results based on cycle threshold values
were determined for the viral pathogens (Phillips et al., 2009a; Phillips et al., 2009b).
Two samples of 1-2ml each of a 10% faecal suspension, the remaining faecal
material, 5x 10μl of a DNA extract and 5x 10μl of cDNA extract were archived for
future study. Participants in the study gave their explicit consent for this.
Positive laboratory findings were reported to HPA Regional Laboratory in
Manchester when detected and negative findings on completion of testing.
All results were entered onto the web-based data system. If necessary a
follow-up computer-generated clinical report containing the results of the molecular
(research) tests was issued by the HPA Regional Laboratory in Manchester and
posted to the General Practitioner.
7 Available at www.westgard.com – Date accessed 25
th June 2010
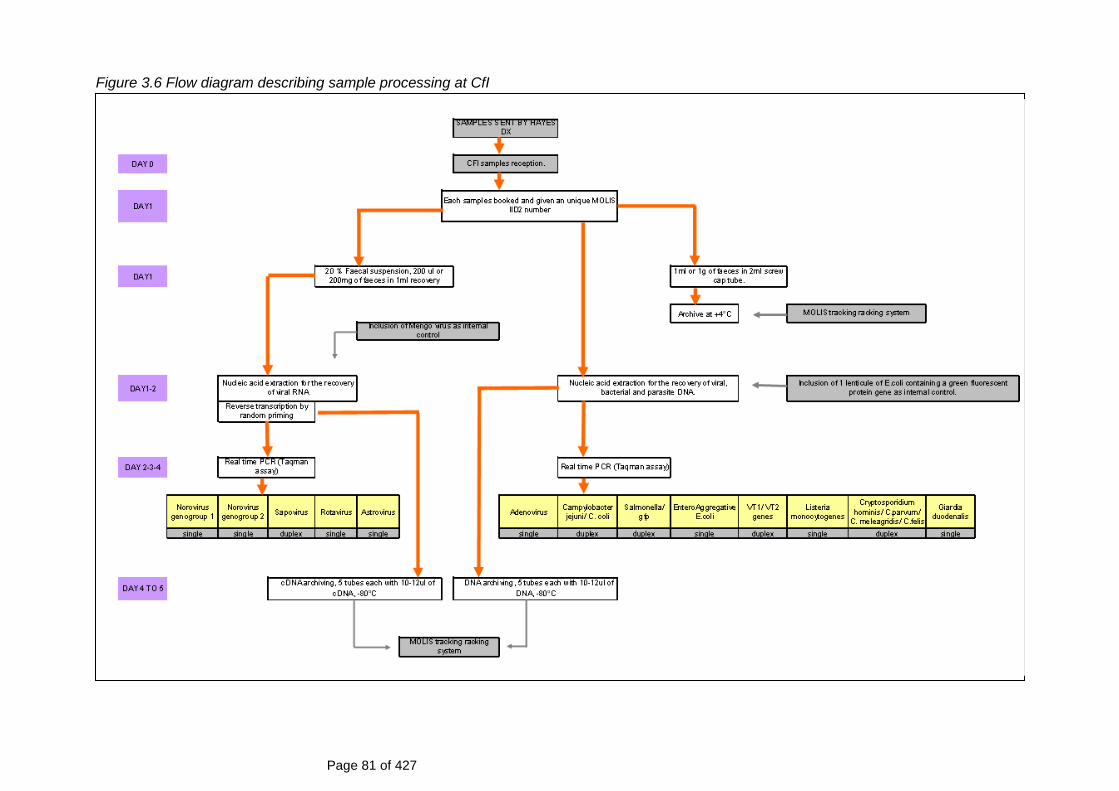
Page 81 of 427
Figure 3.6 Flow diagram describing sample processing at CfI
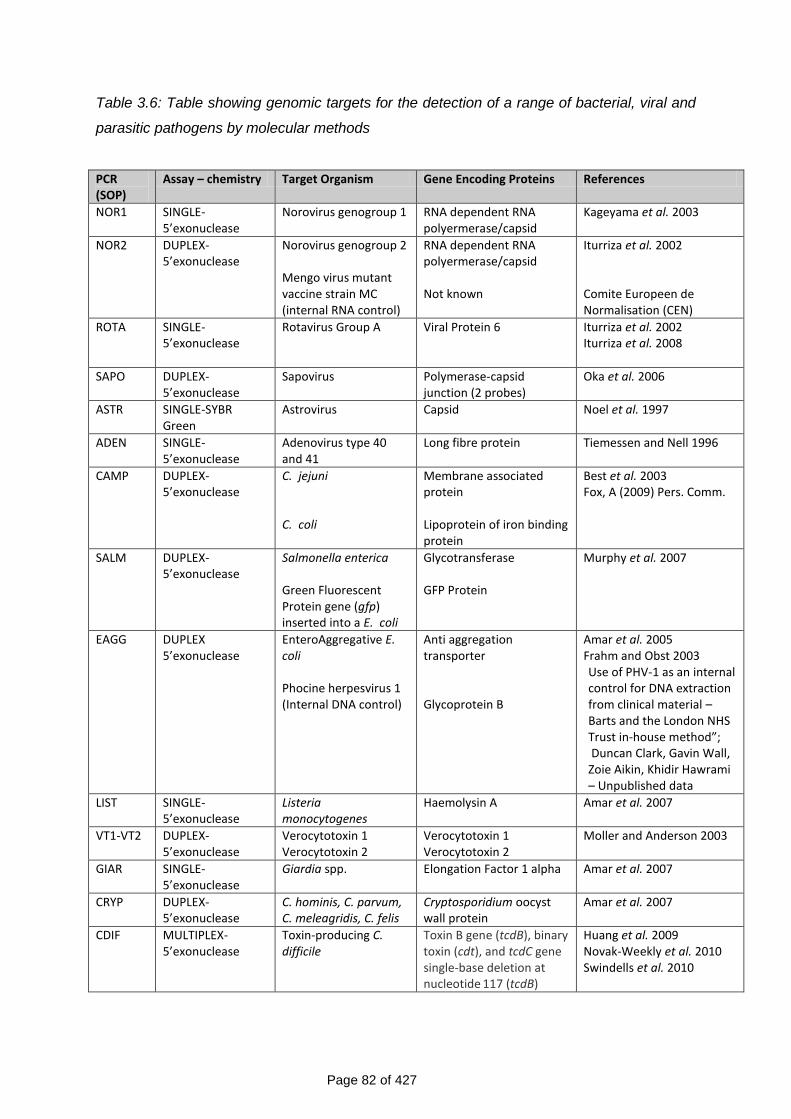
Page 82 of 427
Table 3.6: Table showing genomic targets for the detection of a range of bacterial, viral and
parasitic pathogens by molecular methods
PCR (SOP)
Assay – chemistry Target Organism Gene Encoding Proteins References
NOR1 SINGLE-5’exonuclease
Norovirus genogroup 1 RNA dependent RNA polyermerase/capsid
Kageyama et al. 2003
NOR2 DUPLEX-5’exonuclease
Norovirus genogroup 2 Mengo virus mutant vaccine strain MC (internal RNA control)
RNA dependent RNA polyermerase/capsid Not known
Iturriza et al. 2002 Comite Europeen de Normalisation (CEN)
ROTA SINGLE-5’exonuclease
Rotavirus Group A Viral Protein 6 Iturriza et al. 2002 Iturriza et al. 2008
SAPO DUPLEX-5’exonuclease
Sapovirus Polymerase-capsid junction (2 probes)
Oka et al. 2006
ASTR SINGLE-SYBR Green
Astrovirus Capsid Noel et al. 1997
ADEN SINGLE-5’exonuclease
Adenovirus type 40 and 41
Long fibre protein Tiemessen and Nell 1996
CAMP DUPLEX-5’exonuclease
C. jejuni C. coli
Membrane associated protein Lipoprotein of iron binding protein
Best et al. 2003 Fox, A (2009) Pers. Comm.
SALM DUPLEX-5’exonuclease
Salmonella enterica Green Fluorescent Protein gene (gfp) inserted into a E. coli
Glycotransferase GFP Protein
Murphy et al. 2007
EAGG DUPLEX 5’exonuclease
EnteroAggregative E. coli Phocine herpesvirus 1 (Internal DNA control)
Anti aggregation transporter Glycoprotein B
Amar et al. 2005 Frahm and Obst 2003 Use of PHV-1 as an internal control for DNA extraction from clinical material – Barts and the London NHS Trust in-house method”; Duncan Clark, Gavin Wall, Zoie Aikin, Khidir Hawrami – Unpublished data
LIST SINGLE-5’exonuclease
Listeria monocytogenes
Haemolysin A Amar et al. 2007
VT1-VT2 DUPLEX-5’exonuclease
Verocytotoxin 1 Verocytotoxin 2
Verocytotoxin 1 Verocytotoxin 2
Moller and Anderson 2003
GIAR SINGLE-5’exonuclease
Giardia spp. Elongation Factor 1 alpha Amar et al. 2007
CRYP DUPLEX-5’exonuclease
C. hominis, C. parvum, C. meleagridis, C. felis
Cryptosporidium oocyst wall protein
Amar et al. 2007
CDIF MULTIPLEX- 5’exonuclease
Toxin-producing C. difficile
Toxin B gene (tcdB), binary toxin (cdt), and tcdC gene single-base deletion at nucleotide
117 (tcdB)
Huang et al. 2009 Novak-Weekly et al. 2010 Swindells et al. 2010
Page 83 of 427
3.6.9.4 Definition of positive quantitative PCR results based on molecular methods
used at the CfI
Table 3.7 summarises the tests performed at the CfI. The cut-off points for positive
results, based on the cycle threshold (CT) values, are shown in the table.
For all organisms tested by quantitative PCR, a CT value <40 was considered
positive. For norovirus and rotavirus, however, Amar et al. (2007) demonstrated that
a considerable fraction of asymptomatic individuals test positive for these two
organisms, based on data on archived specimens from both IID cases and controls
in the first IID study that were re-tested using PCR. Moreover, Phillips et al. (Phillips
et al., 2009a; Phillips et al., 2009b) showed that a fraction of IID cases with evidence
of norovirus or rotavirus infection had CT values indicative of low viral loads
comparable with those seen in asymptomatically infected individuals. This suggests
that in a fraction of norovirus and rotavirus IID cases with low viral loads, disease is
unlikely to be caused by these organisms and infection is likely to be coincidental.
The analysis by Phillips et al. (Phillips et al., 2009a; Phillips et al., 2009b) indicated
that a CT value <30 for both viruses was suggestive of a clinically significant result,
that is, disease truly caused by these two organisms. For rotavirus, this cut-off point
coincided well with results from ELISA testing, suggesting that rotavirus
immunoassays are adequate for diagnosing disease due to rotavirus. In the IID2
study, we have therefore used a CT value <30 to define clinically significant infection
for both norovirus and rotavirus.
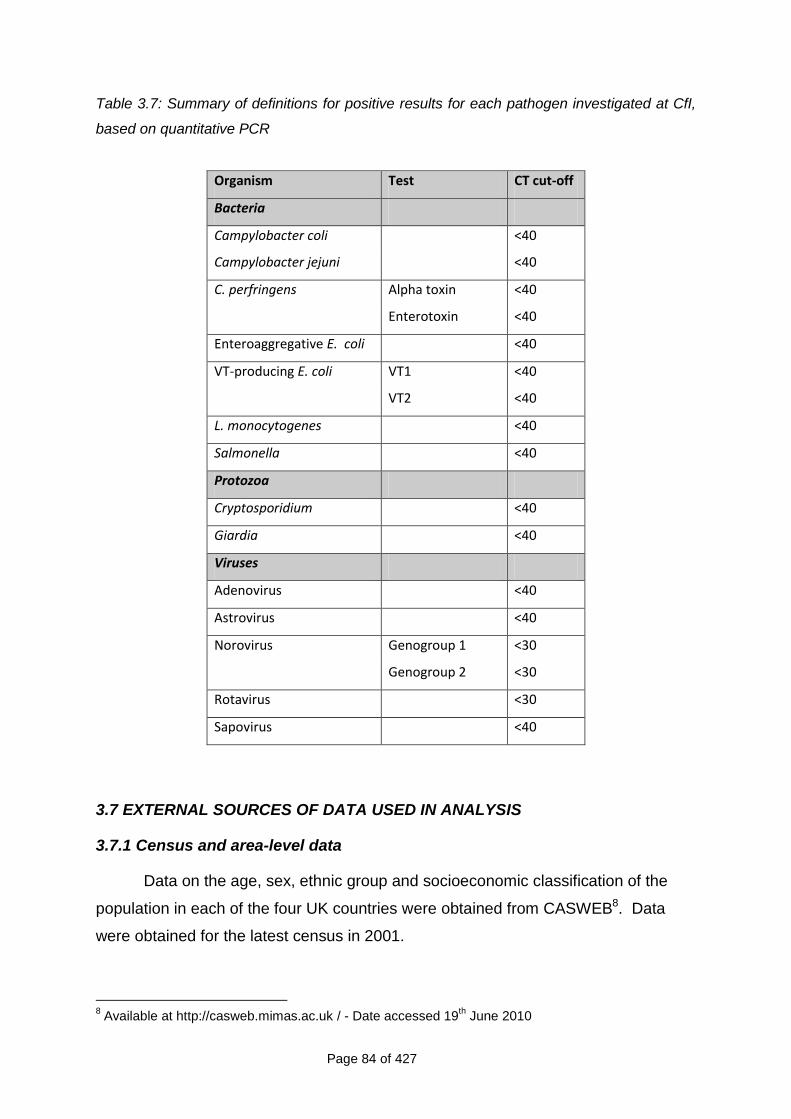
Page 84 of 427
Table 3.7: Summary of definitions for positive results for each pathogen investigated at CfI,
based on quantitative PCR
Organism Test CT cut-off
Bacteria
Campylobacter coli <40
Campylobacter jejuni <40
C. perfringens Alpha toxin <40
Enterotoxin <40
Enteroaggregative E. coli <40
VT-producing E. coli VT1 <40
VT2 <40
L. monocytogenes <40
Salmonella <40
Protozoa
Cryptosporidium <40
Giardia <40
Viruses
Adenovirus <40
Astrovirus <40
Norovirus Genogroup 1 <30
Genogroup 2 <30
Rotavirus <30
Sapovirus <40
3.7 EXTERNAL SOURCES OF DATA USED IN ANALYSIS
3.7.1 Census and area-level data
Data on the age, sex, ethnic group and socioeconomic classification of the
population in each of the four UK countries were obtained from CASWEB8. Data
were obtained for the latest census in 2001.
8 Available at http://casweb.mimas.ac.uk / - Date accessed 19
th June 2010
Page 85 of 427
Data on area-level deprivation were obtained from the Office for National
Statistics Postcode Directory9, which maps every UK postcode to a Super Output
Area (SOA). SOAs comprise approximately 1,000 residents within defined
geographic boundaries. They are ranked according to the Index of Multiple
Deprivation (IMD) (Jordan et al., 2004) with the lowest rank denoting SOAs with the
greatest level of deprivation, based on a composite score that uses information on
seven domains: Income, Employment, Health, Education, Housing and Services,
Crime, and Living Environment. Participants‟ postcodes were linked to their SOA of
residence to obtain information on the deprivation and urban-rural classification of
their area.
3.7.2 International Passenger Survey
The International Passenger Survey is a continuous survey of returning travellers
conducted at UK ports of entry10. The survey gathers information from UK residents
on the frequency, duration and purpose of visits to non-UK countries. We obtained
aggregated data on the number of nights spent abroad by UK residents in 2008, by
age and sex, from the Office for National Statistics. We used these data to estimate
the average number of nights spent outside the UK by age group and sex.
3.7.3 Royal College of General Practitioners Weekly Returns Service
The Royal College of General Practitioners (RCGP) Research and Surveillance
Centre collects information on all consultations from a network of 100 general
practices distributed throughout England and Wales. Statistics on the weekly
incidence of consultations, according to the 9th version of the International
Classification of Diseases code, are published annually. We obtained information on
the annual incidence of episodes of IID (ICD9 codes 001-009) presenting to network
practices for the years 1996 and 200811, when the first and second IID studies were
conducted, as an external comparison of rates of IID presenting to general practice.
9 Available at http://www.ons.gov.uk/about-statistics/geography/products/geog-products-
postcode/nspd/index.html - Date accessed 25th June 2010
10 Available at http://www.statistics.gov.uk/ssd/surveys/international_passenger_survey.asp - Date
accessed 25th June 2010 11
Available at: http://www.rcgp.org.uk/clinical_and_research/rsc/annual_reports.aspx - Date accessed 20
th July 2010

Page 86 of 427
3.8 DATA MANAGEMENT AND QUALITY CONTROL
3.8.1 Data management
Staff at each of the main study sites jointly co-ordinated data management. For the
prospective studies this was primarily by use of a bespoke web-based data collection
system.
The University of Manchester team (UoM) was responsible for developing the
web-based data system with input from the London School of Hygiene and Tropical
Medicine (LSHTM), MRC GPRF, HPA Manchester Laboratory and CfI. The
University of Manchester was also responsible for day-to-day liaison with the
development and hosting companies to ensure that any non-conforming issues or
problems were dealt with in a timely manner.
The MRC GPRF Coordinating Centre was primarily responsible for day-to-day
liaison with the Study Nurses in the study practices.
The HPA Manchester laboratory was responsible for day-to-day liaison with
the GP practices on any sample-related queries and provision of positive results of
microbiological testing.
The LSHTM and the MRC GPRF were responsible for the design of the study
registers and dedicated databases to hold participant recruitment information from
each practice. In addition, LSHTM was responsible for monitoring data quality and
completeness and evaluating the accuracy of data entry.
The team at the University of East Anglia (UEA) was responsible for the
design and development of the Telephone Survey database.
3.8.2 Questionnaires and Forms/Study Registers
3.8.2.1 Questionnaires
Several short questionnaires were used and have been summarised in Table 3.8.
Copies of the full questionnaires are located in Appendix 9.
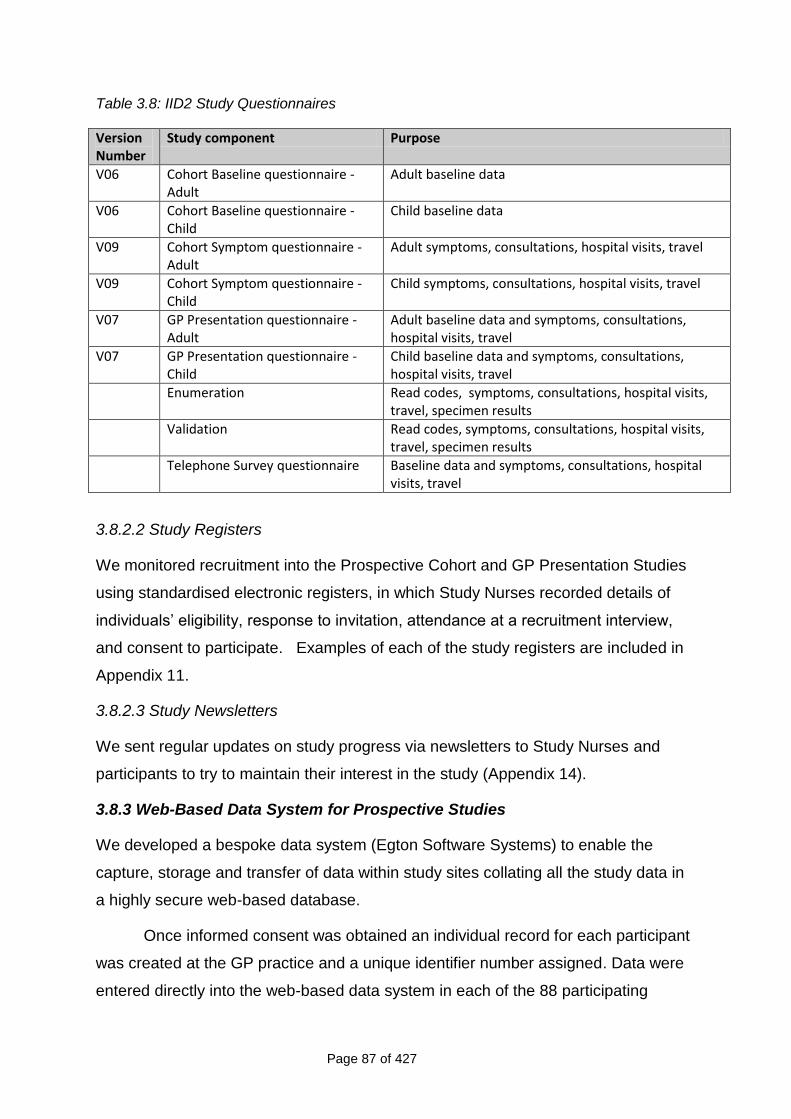
Page 87 of 427
Table 3.8: IID2 Study Questionnaires
Version Number
Study component Purpose
V06 Cohort Baseline questionnaire -Adult
Adult baseline data
V06 Cohort Baseline questionnaire -Child
Child baseline data
V09 Cohort Symptom questionnaire - Adult
Adult symptoms, consultations, hospital visits, travel
V09 Cohort Symptom questionnaire -Child
Child symptoms, consultations, hospital visits, travel
V07 GP Presentation questionnaire - Adult
Adult baseline data and symptoms, consultations, hospital visits, travel
V07 GP Presentation questionnaire - Child
Child baseline data and symptoms, consultations, hospital visits, travel
Enumeration Read codes, symptoms, consultations, hospital visits, travel, specimen results
Validation Read codes, symptoms, consultations, hospital visits, travel, specimen results
Telephone Survey questionnaire
Baseline data and symptoms, consultations, hospital visits, travel
3.8.2.2 Study Registers
We monitored recruitment into the Prospective Cohort and GP Presentation Studies
using standardised electronic registers, in which Study Nurses recorded details of
individuals‟ eligibility, response to invitation, attendance at a recruitment interview,
and consent to participate. Examples of each of the study registers are included in
Appendix 11.
3.8.2.3 Study Newsletters
We sent regular updates on study progress via newsletters to Study Nurses and
participants to try to maintain their interest in the study (Appendix 14).
3.8.3 Web-Based Data System for Prospective Studies
We developed a bespoke data system (Egton Software Systems) to enable the
capture, storage and transfer of data within study sites collating all the study data in
a highly secure web-based database.
Once informed consent was obtained an individual record for each participant
was created at the GP practice and a unique identifier number assigned. Data were
entered directly into the web-based data system in each of the 88 participating
Page 88 of 427
practices, at the MRC GPRF Coordinating Centre, and in the two microbiology
laboratories. Each user was assigned a level of access to the system appropriate to
their role in the study. This is described in detail in Appendix 15. In addition, for
those cohort participants who opted for email follow-up, an automated email was
sent each week and their response automatically logged in the system.
The system permitted real-time monitoring of Cohort and Presentation Study
participation and real-time tracking of specimens and results.
3.8.3.1 Reports
Users at each study site had access to a range of reports which could be run on
demand and were used throughout the study to monitor participation rates, follow-up,
episodes and specimens.
3.8.3.2 Weekly Monitoring meetings
The UoM team hosted weekly telephone conferences. Representatives from each of
the main study sites took part i.e. for the prospective studies the MRC GPRF,
Manchester HPA Laboratory, HPA CfI, LSHTM and for the retrospective Telephone
Survey from UEA.
Each of the main study sites provided detailed reports 24 hours prior to the
meeting. For monitoring purposes these included recruitment, follow-up and drop-out
figures for the previous week, as well as reporting of symptoms, submission of
questionnaires and specimens by study participants, and microbiological findings.
For the prospective studies all sites used the report functionalities within the
web-based system to generate reports. Additional reports on recruitment, follow-up
and compliance were generated at LSHTM from the web-based data system and at
MRC GPRF from the study registers that were compiled centrally into a Microsoft
Access™ logging database. Reports which were generated using Microsoft Excel™
were provided by UEA to monitor the Telephone Survey.
These meetings provided real-time monitoring of all aspects of the study and
enabled any inconsistencies or missing information to be identified and followed-up
in a timely manner.
Page 89 of 427
3.8.3.3 Data flow
For each participant who consented to take part in the Prospective Cohort or GP
Presentation studies, the Study Nurse generated a record on the web-based data
system, containing baseline demographic information and a unique identifier was
attached automatically by the system. Authorised users from different study sites
could upload additional information related to that record as necessary (Figure 3.7).
Participants could appear in both the Prospective Cohort Study and the GP
Presentation Study if they were a cohort member and they presented to the GP for
IID-related symptoms during the study period. In this case, a separate record
containing episode information relating to the GP presentation visit was created in
the GP Presentation Study data.
Prospective Cohort Study participants who reported symptoms of diarrhoea
and/or vomiting through the weekly follow-up system were asked to complete a
paper-based questionnaire and mail it to the Study Nurse, who entered the
information into the relevant record on the web-based data system.
GP Presentation Study participants completed a baseline and symptom
questionnaire in person with the Study Nurse upon enrolment. The Study Nurse
added the data directly to the relevant record on the web-based data system during
the interview.
Once data for a record were entered and saved on the web-based system,
Study Nurses could not amend the data for that record, but could request
amendments to be made. When logging into the system the MRC GPRF were able
to view any amendment requests and to update participant information as
appropriate.
The system provided real-time tracking of specimens and results.
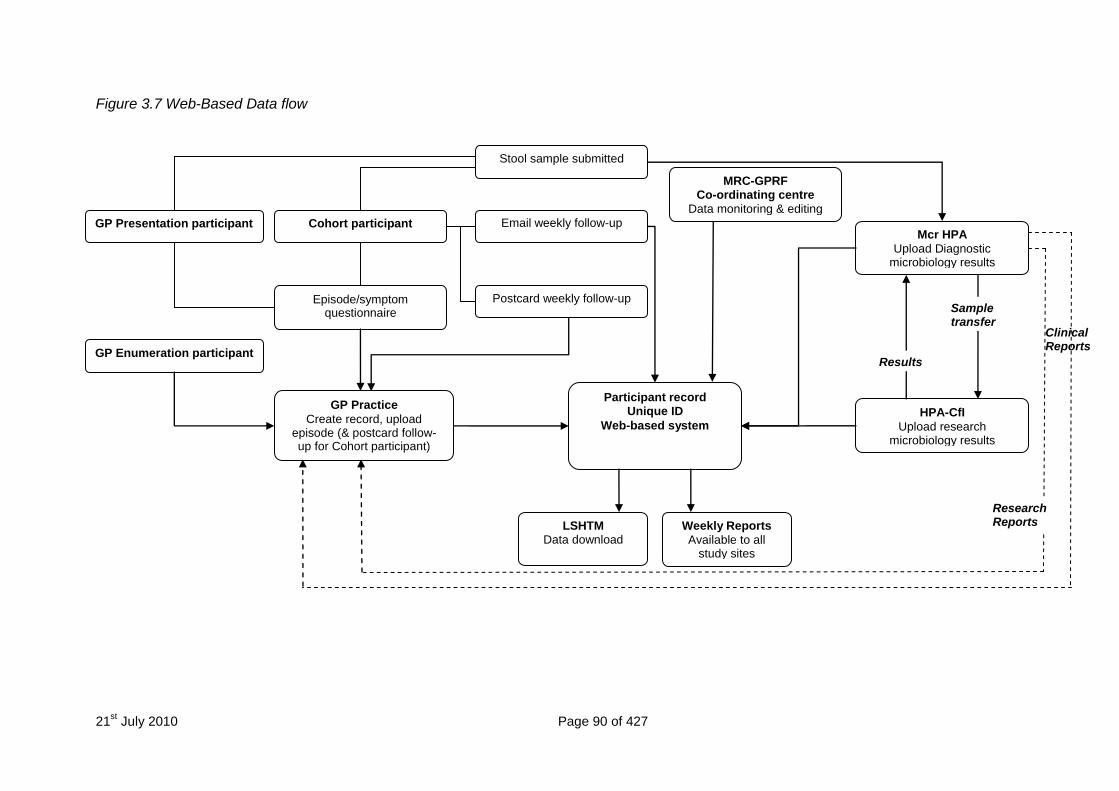
21st July 2010 Page 90 of 427
Figure 3.7 Web-Based Data flow
Research Reports
Clinical Reports
GP Presentation participant
GP Enumeration participant
Participant record Unique ID
Web-based system
Cohort participant Mcr HPA
Upload Diagnostic microbiology results
HPA-CfI
Upload research microbiology results
GP Practice
Create record, upload episode (& postcard follow-up for Cohort participant)
Email weekly follow-up
Postcard weekly follow-up Episode/symptom questionnaire
Stool sample submitted
Weekly Reports
Available to all study sites
LSHTM Data download
Results
Sample transfer
MRC-GPRF Co-ordinating centre
Data monitoring & editing
Research Reports
Page 91 of 427
3.8.3.4 Data security
The data were stored on a dedicated server housed behind a dedicated Cisco
(hardware) firewall. Access to the server was assigned through a secure shell (SSH)
via unique user names and passwords. All information was encrypted prior to
transfer using secure socket layer certificates (SSL‟s) providing 128 bit encryption.
The range of Internet Protocol (IP) addresses was restricted to national IP ranges. A
Redundant Array of Independent Disks (RAID 5 array) was employed for the server
to provide additional fault tolerance and hence data security. A detailed account of
the data security measures and back-up arrangements is presented in Appendix 15.
3.8.4 Telephone Survey Database
A bespoke, secure, Telephone Survey database was developed at UEA using
Microsoft Access™. Number banks were generated from random telephone
numbers by the Telephone Survey team. These numbers were uploaded to the
Telephone Survey database. Calls were made according to the telephone calling
algorithm (Appendix 3).
When telephonists opened the Access database and started a new call the
selection of telephone number and recall period (7 or 28 days) were random. All
calls were assigned a unique identifier and recorded using CopyCall Telephone
Recorder or Retell 957 software, which generated a digital sound recording (wav file)
of the call. In compliance with ethical requirements, only calls with an audible record
of consent in the digital audio file were included in the study. The call recording was
also used for quality control purposes and double data entry. Data were entered by
the telephonists directly onto the database during the course of the interview.
3.8.4.1 Data security
The Telephone Survey database was encrypted and stored on a secure server
centrally at the UEA. Whilst telephonists were able to access the Telephone Survey
programme, enabling them to enter survey data, they were unable to access the
database itself or to view or edit the data once it had been entered.
Access to the database itself was password protected and assigned to only
the system developer and the researcher at UEA. The database was backed up on
a daily basis at UEA. A full audit trail of all records on the database was available.
Page 92 of 427
Copies of the database, from which telephone numbers had been removed,
were transferred on a weekly basis to a secure server at LSHTM using a secure file
transfer protocol.
3.8.5 Quality Control
3.8.5.1 Data Collection by Study Nurses
The MRC GPRF regional training nurses (RTNs) provided ongoing support for the
Study Nurses whilst the field work was in progress. These nurses are experienced
in practice-based research and were specifically trained in the IID2 study protocols
and procedures. The RTNs contacted the Study Nurses at the practices at the
beginning of the study to ensure that they were confident in the study procedures.
Where there was a delay between nurse training and the start of fieldwork (e.g. due
to R&D approval), the RTNs offered to visit the nurses for „top up‟ training. They also
visited all the nurses to carry out quality control (QC) checks, ensuring that the
nurses were adhering to the protocol and collecting the data in a standardised way.
The RTNs completed a quality control form for each practice visit (Appendix 16).
They also discussed issues such as recruitment and RTNs liaised with the study
team to resolve any difficulties that were raised. RTNs made a minimum of two visits
to each practice during the recruitment period.
3.8.5.2 Web-Based Data System
Computerised and manual checks were implemented at every stage to ensure data
accuracy. Consistency checks were built into the web-based data collection fields,
which flagged any inconsistencies at the data entry stage, to provide increased data
integrity. A full audit trail of each record was available on the system.
An independent company (Abacus UK) double entered all Prospective Cohort
Study, Enumeration Study and Validation Study questionnaires.
Completeness of the datasets was monitored on regular basis. Each of the
main study sites (UoM, MRC GPRF, HPA Manchester, CfI, LSHTM and UEA)
provided weekly reports which were discussed during the weekly telephone
conferences. This enabled any inconsistencies or missing information to be
identified and followed-up in a timely manner.
Page 93 of 427
3.8.5.3 Study Registers
All study registers were locked to prevent formatting changes and data input masks
used to ensure invalid data were not entered. Study Nurses sent their study
registers electronically to the MRC GPRF Coordinating Centre on a weekly basis.
Registers were automatically imported to a dedicated Microsoft Access logging
database and the data updated weekly. Updates received by practices could be
viewed by a specific date, allowing the MRC GPRF team to identify any practices
that had not returned an updated study register. Queries were also setup to identify
any missing information in the study registers and to monitor recruitment. The
logging database was maintained by MRC GPRF and data were checked by the
MRC GPRF and LSHTM.
3.8.5.4 Quality control at the HPA Manchester Laboratory
The responsibility for the laboratory section‟s internal quality assurance (IQA)
remained with the individual heads of the section. The Quality Manager assisted in
the maintenance of dedicated computer databases and by administration of some of
the IQA schemes.
In each laboratory section designated staff produced reports on the results
obtained in any IQA. IQA reports were discussed at management and staff meetings
and copies were placed on notice boards and/or distributed via the Biomedical
Scientist (BMS) network.
The internal quality control (IQC) procedures in place verified the quality of the
agar media and broths that were used to isolate and identify the organisms in the
enteric laboratory. All reagents, stains and equipment were also regularly monitored
and recorded. IQC data were recorded on specific controlled documents that
included all relevant auditable information. Both Medical Laboratory Assistant (MLA)
and BMS staff were responsible for carrying out and documenting the IQC
procedures and these were supervised by senior BMS staff.
Internal Quality Assurance (IQA) was also carried out during the study from
receipt of sample to final results. IQA was performed weekly and involved both MLA
and BMS staff. Findings were recorded. In addition assay controls were included in
all immunoassays and acceptance limits, based on the analysis of IQA data and the

Page 94 of 427
acceptance criteria provided by the manufacturers of commercial assays, were used
for all results.
3.8.5.5 Quality control at CfI
IQC was performed with pathogen-specific controls and PCR inhibition
controls for RNA and DNA targets. IQC was monitored through the use of the
Westgard rules and assays with target-specific controls +3SD from the expected
value were repeated. Individual samples demonstrating inhibition in the RT-PCR or
PCR assays were repeated following manual extraction of the nucleic acid (Boom et
al., 1990).
Manchester HPA and CfI laboratories were accredited by Clinical Pathology
Accreditation (UK) throughout the study. The laboratory staff at both Manchester
HPA and at the CfI participated in audits and complied with local safety policies and
procedures. Their competencies in sample handling, assay performance and data
handling were measured after training, and monitored throughout the project. All
staff kept a detailed training record.
3.8.5.6 Quality control in the Telephone Survey
The Telephone Survey Co-ordinator monitored call quality on a continuous basis
recording a minimum of two formal IQC assessments (Appendix 16).
Data entry clerks re-entered data from the telephone interviews by listening to
the original digital recording. The LSHTM team then compared original and double-
entered data for discrepancies. The Telephone Survey Co-ordinator at UEA
resolved the discrepancies by referring to the original audio files where necessary.
3.8.6 Audit Programme
3.8.6.1 Internal Audit Programme
The Project Manager at Manchester developed and implemented an internal audit
programme to ensure adherence to all study protocols and procedures. Aspects of
the study were audited in turn once per quarter.
At each visit the Project Manager verified and recorded compliance against all
audit items using quality audit forms (Appendix 16) which were completed on the day
of the audit and included comments from the Project Manager and the researcher.

Page 95 of 427
The Project Manager summarised the audit findings in a separate document and
specified any improvement actions required. These included:
Any non conformities or deficiencies found.
Any recommendations and timescales for corrective action.
Responsibilities for corrective action.
Any recommendations for preventative action.
The Project Manager provided copies of the audit document and improvement
actions to the site researcher, the Food Standards Agency and members of the IID2
Study Executive Committee. The Project Manager retained the original documents.
The Project Manager ensured that any improvement actions were completed
within the agreed timescale. In the event that issues were not resolved within the
agreed timescale, the contingency was to report non compliance to the IID2 Study
Executive Committee at the next meeting or, if urgent, via correspondence. Internal
audit was a standing item on the agenda of the IID2 Study Executive Committee.
3.8.6.2 External Audit
The Project Management team at the University of Manchester was subject to two
external audits during the course of the study to ensure that all protocols and
procedures were followed. The reports of these external audits may be found in
Appendix 16.
3.9 STATISTICAL METHODS
3.9.1 Methods for participation, representativeness and compliance in the
Telephone Survey, Prospective Cohort Study and GP Presentation Study
3.9.1.1 Participation
We computed participation in the Telephone Survey, Prospective Cohort Study and
GP Presentation Study as the percentage of those invited who consented to take
part in the study. For the Telephone Survey, only overall participation by country
was calculated, as no additional information on non-participants was available. For
the Prospective Cohort and GP Presentation Studies, we calculated participation
separately by age group and sex.
Page 96 of 427
3.9.1.2 Representativeness
We assessed the representativeness of the study populations in each of the studies
by comparing the characteristics of each study population with those of the 2001
census population. We used the 2001 census because this was the last census for
which results were published. Age-sex structure estimates were available after 2001
(based on census projections) but data on population size by ethnic group,
household size, NS-SEC and area-level deprivation were not.
We compared the age and sex distribution of the population registered with
general practices participating in the GP Enumeration and GP Presentation Studies
with that of the UK census population. In addition, we compared the area-level
deprivation and urban-rural profiles of participating practices with those of all
practices in the UK.
For the Prospective Cohort Study, we assessed representativeness by
comparing the distribution of age group, sex, ethnic group, socioeconomic
classification, area-level deprivation and urban-rural distribution of cohort participants
with that of the UK census population. We used the National Statistics-
Socioeconomic Classification (NS-SEC) to assign participants aged 16 to 74 to one
of five socioeconomic groups based on the self-coded method12, which uses
information from five questions on employment type and status to classify working
individuals into five socioeconomic groups.
For the Telephone Survey we compared the age, sex, ethnic group,
household size, area-level deprivation and urban-rural characteristics of survey
participants with those of the census population, separately for each of the four UK
countries, and for the UK as a whole. To account for the differing populations in the
four UK countries, we weighted the sample to reflect the relative size of the
population in each country.
3.9.1.3 Compliance
For the Cohort and GP Presentation Studies, we computed compliance as the
percentage of IID cases who submitted a questionnaire following the onset of
symptoms. We estimated compliance separately by age group and sex. We
12
Available at: http://www.ons.gov.uk/about-statistics/classifications/current/ns-sec/index.html - Date accessed 21/06/2010
Page 97 of 427
investigated factors related to compliance using a logistic regression model,
comparing compliant and non-compliant individuals in terms of demographic
characteristics and type of follow-up (email or postcard).
3.9.1.4 Completeness of follow-up
We computed the median duration of follow-up among cohort participants. As
recruitment occurred throughout the duration of the study, we computed the total
follow-up time in the cohort as a percentage of the maximum achievable follow-up
time, based on the number of weeks individuals could remain in the study between
their start of follow-up and the end of the study on 31st August 2009. In addition, we
calculated the percentage of participants who dropped out or were lost to follow-up
during the course of the study, and investigated factors associated with not
completing the study using logistic regression.
3.9.2 Incidence of IID in the community
3.9.2.1 Definition of cases
For a fraction of participants reporting diarrhoea and/or vomiting through the weekly
follow-up system, information on symptom duration and foreign travel was not
available, either because of missing responses, or because no questionnaire was
submitted. We therefore defined cases as definite and possible cases. Definite
cases were individuals meeting the case definition as described in section 3.3.
Possible cases were defined as individuals who reported symptoms of diarrhoea
and/or vomiting through the weekly follow-up system, but who did not submit a
questionnaire or who submitted a questionnaire but could not be classified as
definite cases because of missing information on the presence and/or duration of
symptoms or recent foreign travel. We calculated incidence estimates using definite
cases only, and using definite and possible cases.
3.9.2.2 Incidence calculations
We computed the incidence of IID in the community, per 1000 person-years, as the
ratio of IID cases occurring in the cohort to the number of person-years at risk during
the period of follow-up. We censored periods of follow-up during which individuals
were not considered to be at risk according to the case definition. In particular,
among cases who reported travel outside the UK in the 10 days prior to illness onset,
we excluded from analysis the period between the date they left the UK until three
Page 98 of 427
weeks after their last reported symptomatic week, or three weeks after their return to
the UK, whichever was latest. Among individuals reporting symptoms not related to
travel, follow-up time was censored from the date of symptoms onset until three
weeks after their last reported symptomatic week, at which point they were
considered to be at risk again. If a person did not respond to follow-up for one or
more consecutive weeks, their follow-up time was considered censored from the first
week of non-response until three weeks after their last week of non-response.
Individuals did not count towards the numerator or the denominator in the incidence
calculations during censored periods. Participants who did not respond to follow-up
for four or more consecutive weeks were considered dropped out of the study.
We did not make any adjustments to the denominator to account for time
spent outside the UK during the follow-up period, as individuals in the cohort were
instructed not to respond to weekly follow-ups on weeks during which they were
outside the UK. Such weeks would, therefore, have automatically been excluded
from analysis. Cohort participants were, however, not asked to report the specific
weeks on which they were not in the UK.
We calculated incidence rates overall, by age group and sex, and by
pathogen. We assumed that pathogens were independent; so that if a sample was
positive for two pathogens, it contributed to the numerator in the incidence
calculations for both pathogens (except for C. difficile).
We calculated overall rates of IID, and rates of IID by pathogen for England
and for the UK. To account for differences in the age and sex structure of the IID2
cohort relative to the census population, we adjusted incidence estimates by means
of post-stratification weighting. For each stratum of age group and sex we computed
individuals‟ weights as the ratio of the size of the stratum in the census population to
that in the Prospective Cohort Study. We then normalised the weights to sum to
unity.
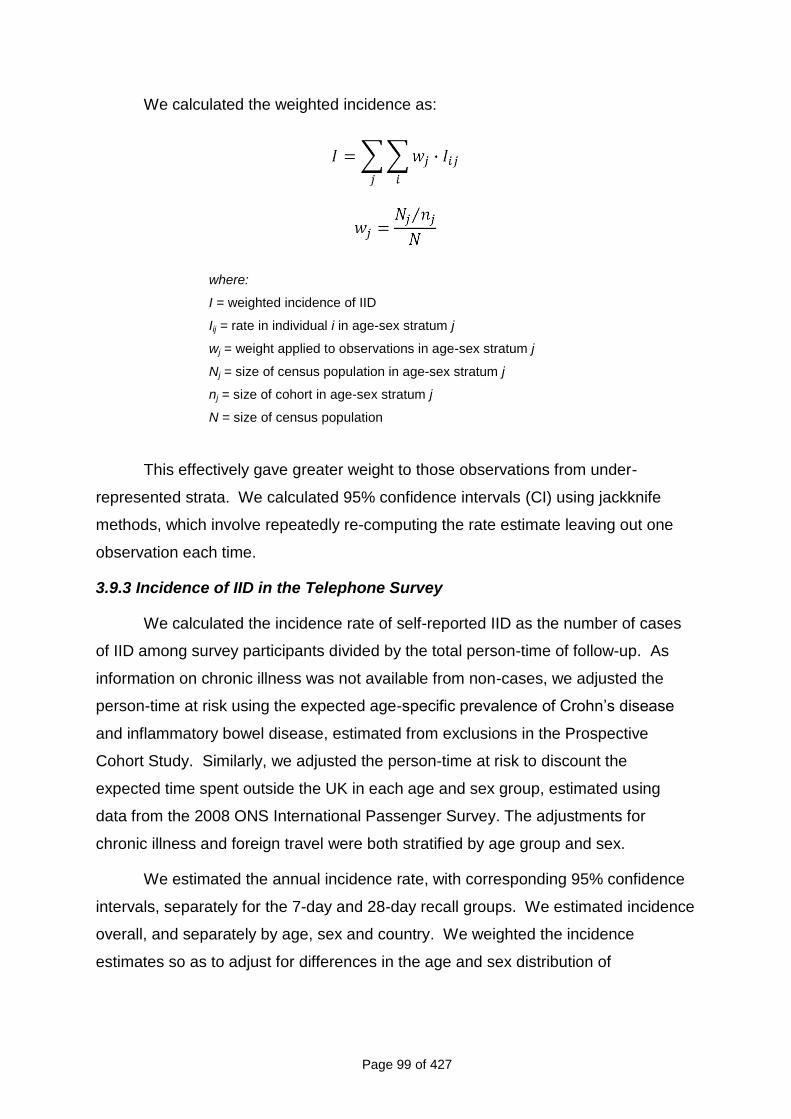
Page 99 of 427
We calculated the weighted incidence as:
where:
I = weighted incidence of IID
Iij = rate in individual i in age-sex stratum j
wj = weight applied to observations in age-sex stratum j
Nj = size of census population in age-sex stratum j
nj = size of cohort in age-sex stratum j
N = size of census population
This effectively gave greater weight to those observations from under-
represented strata. We calculated 95% confidence intervals (CI) using jackknife
methods, which involve repeatedly re-computing the rate estimate leaving out one
observation each time.
3.9.3 Incidence of IID in the Telephone Survey
We calculated the incidence rate of self-reported IID as the number of cases
of IID among survey participants divided by the total person-time of follow-up. As
information on chronic illness was not available from non-cases, we adjusted the
person-time at risk using the expected age-specific prevalence of Crohn‟s disease
and inflammatory bowel disease, estimated from exclusions in the Prospective
Cohort Study. Similarly, we adjusted the person-time at risk to discount the
expected time spent outside the UK in each age and sex group, estimated using
data from the 2008 ONS International Passenger Survey. The adjustments for
chronic illness and foreign travel were both stratified by age group and sex.
We estimated the annual incidence rate, with corresponding 95% confidence
intervals, separately for the 7-day and 28-day recall groups. We estimated incidence
overall, and separately by age, sex and country. We weighted the incidence
estimates so as to adjust for differences in the age and sex distribution of

Page 100 of 427
participants relative to the census population, as defined for the Cohort Study in
section 3.9.2.
When calculating incidence for the UK as a whole, estimates were further
adjusted to reflect the relative sizes of the populations in each UK country.
Estimates were weighted to account for the fact that England comprises 83.6% of
the UK population, Scotland 8.6%, Wales 4.9% and Northern Ireland 2.9%.
Finally, we adjusted for the number of interviews completed each month. This
was done in order to avoid bias due to seasonal effects, because the number of
interviews conducted varied by month, and there was some evidence that incidence
of self-reported IID varied between months. We used jackknife re-sampling methods
to calculate 95% confidence intervals.
To obtain estimates of differential recall between the 7-day and 28-day recall
groups we calculated the rate ratio (RR) comparing the incidence between the two
groups:
where:
RRj = rate ratio in age-sex stratum j
7d Ij = rate in age-sex stratum j of 7-day recall group
28d Ij = rate in age-sex stratum j of 28-day recall group
We estimated the rate ratio and 95% confidence interval comparing incidence
in the 7-day and 28-day recall groups overall, and for each age group and sex
category, using a Poisson regression model with the logarithm of the rate as the
outcome variable, and recall period as the dependent variable.
3.9.4 Comparing incidence rates in the Prospective Cohort Study and
Telephone Survey
To provide a visual comparison of the rates estimated in the Cohort Study and the
Telephone Survey, we plotted the age-specific rates of self-reported IID from the two
components with corresponding 95% confidence intervals. We did not conduct any
Page 101 of 427
formal statistical comparisons between the two studies, because of the low power to
estimate age-specific rates, particularly in the Telephone Survey.
To investigate further whether telescoping or differential recall took place in
the Telephone Survey, we plotted the incidence estimates from the Cohort Study,
and from the 7-day and 28-day recall groups of the Telephone Survey. We also
plotted incidence estimates in the 28-day recall group splitting the recall period into
two time bands: <2 weeks prior to the date of interview, and 2 to 4 weeks prior to the
date of interview. This enabled us to see whether differences in rate estimates were
related to the period over which participants were asked to recall symptoms.
3.9.5 Incidence of consultations to NHS Direct/NHS24 for diarrhoea and
vomiting
We computed the annual incidence rate of telephone consultations to NHS Direct as
the ratio of annual calls to the service (averaged over the two-year period 1st July
2007 to 30th June 2009) to the mid-year census population. We included calls from
the following complaints in the numerator:
1. Diarrhoea (including diarrhoea in infants and toddlers).
2. Vomiting (including vomiting in infants and toddlers).
3. Food poisoning.
Calls for which the main complaint was vomiting blood were excluded, as these are
unlikely to reflect IID.
We calculated rates of consultation to NHS Direct by age group and sex,
separately for England and Wales. In addition, we calculated rates according to the
following call outcomes, based on what the caller was advised to do:
1. Ambulance required as soon as possible (999);
2. Patient referred to Accident and Emergency (A&E);
3. Patient referred to GP surgery (GP);
4. Patient advised to be cared for at home (Home Care);
5. Any other call outcome (Other).
Page 102 of 427
For NHS24, we calculated rates of consultation over the same time period by age
group. We included calls in which the principal complaint was “Diarrhoea” or
“Vomiting” in the numerator. Information on the patients‟ sex, and the outcome of
the call, was not available.
3.9.6 Incidence of IID presenting to General Practice
We estimated the incidence of IID presenting to general practice from the GP
Presentation and Validation studies. We computed the incidence rate of IID as the
ratio of cases identified in the GP Presentation Study to the number of person-years
of observation, adjusted for under-ascertainment and practice list inflation.
We defined the under-ascertainment ratio as the ratio between the number of
cases identified in the Validation Study that were not recruited in the GP
Presentation Study and the number of cases identified in the Validation Study and
recruited in the GP Presentation Study. This ratio represents the expected number
of additional consultations that actually occurred during the observation period for
every case that was recruited into the GP Presentation Study.
We investigated factors related to under-ascertainment using a logistic
regression model in which ascertainment into the GP Presentation Study was used
as the outcome variable. We explored associations between ascertainment and age
group, sex, and a number of practice-level factors, including practice size, number of
GPs working in the practice, area-level deprivation based on the postcode of the
practice, and the urban-rural classification of the practice. In addition, we
investigated whether cases coded in the practice records under specific types of
Read code were more likely to be ascertained in the GP Presentation Study. We
grouped the Read codes assigned to each consultation in the Validation Study into
seven broad categories: diarrhoea (D), vomiting (V), diarrhoea and vomiting (DV),
gastroenteritis (G), codes denoting IID due to specific pathogens (P), codes
indicating that a stool sample was sent for analysis (O), and codes relating to
symptoms compatible with IID (S). In addition, we included in the logistic regression
model a random intercept for practice as a second level variable, to account for
additional variation between practices that was not accounted for by the above
factors.
Page 103 of 427
The analysis indicated that age group and Read code category were
important predictors of under-ascertainment. No practice-level factors were related
to under-ascertainment, although there was strong statistical evidence for variation
between practices that was not accounted for by these practice-level factors. The
final under-ascertainment model included age group, sex, Read code category and a
random intercept term for practice. From this model, we obtained under-
ascertainment probabilities for each case recruited in the GP Presentation Study.
We used the inverse of these probabilities as under-ascertainment weights, and
adjusted the numerator in each age-sex stratum by multiplying the number of cases
ascertained in the GP Presentation Study by the weight to obtain the expected
number of cases. We used two sets of weights in the incidence calculations, based
on separate under-ascertainment models for definite, and definite and probable
cases.
We did not take organism into account in the under-ascertainment model,
because information on causative pathogen in the GP Validation Study records was
not reliably recorded and not available for the majority of cases. Similarly, we did not
take into account the symptoms experienced by GP Validation Study cases in the
under-ascertainment model because they were not reliably recorded in the medical
records.
For each practice, we estimated the person-years as the size of the
population registered with the practice multiplied by the period of observation. The
denominator was further adjusted by a factor for list inflation, to discount individuals
registered with the practice but no longer living in the catchment area of the practice.
Practice-specific list inflation factors were estimated from the Prospective Cohort
Study, by determining the proportion of individuals randomly selected from the
practice list that had died or moved away. We estimated the logarithm of the
incidence rate of IID using a Poisson model, accounting for the dependence of
observations within practices in the calculation of 95% confidence intervals.
3.9.7 Triangulation of incidence rates presenting to primary care
As an external validation of incidence estimates obtained in the Cohort Study and
Telephone Survey, we estimated the incidence of IID presenting to general practice,
based on cases in these two studies who reported having consulted a GP for their
Page 104 of 427
illness. We compared these estimates with those obtained in the GP Presentation
Study, the GP Enumeration Study, and the RCGP Weekly Returns Service.
For the Cohort Study, we also estimated the incidence of IID for which cases
reported contacting NHS Direct. We compared this estimate with that obtained from
actual calls to NHS Direct.
3.9.8 Organism-specific incidence of IID
3.9.8.1 Microbiological Findings in Cases
For the Prospective Cohort and GP Presentation Studies, we computed, by study,
the percentage of specimens positive for each organism among IID cases for whom
a stool sample was available for analysis. We assumed that infection with one
organism was independent of infection with any other organism, i.e. if a sample was
positive for two organisms we counted it as positive in the calculations for both
organisms (except for C. difficile13). We computed the percentage of specimens
positive for each organism based on routine diagnostic methods, and on routine and
molecular diagnostic methods combined. In addition, we calculated the percentage
of specimens that were negative for all organisms tested.
3.9.8.2 Imputation of missing data on microbiological testing
For a proportion of participants in both the Prospective Cohort and GP Presentation
studies information on microbiological test results was missing. This was (a)
because the participant had not provided a stool specimen (b) because the
specimen provided was insufficient to test for some of the pathogens or (c) because
the specimen was not tested for one or more pathogens due to another reason.
Ignoring the missing data would result in an under-estimate of pathogen-specific
incidence. To account for the missing data, we used multiple imputations by chained
equations (Rubin, 2004). Using this method, we first defined an imputation model for
each microbiological test to predict the probability of positivity conditional on the
observed data. The model used as predictors five categories of age group (<1 year,
1-4 years, 5-24 years, 25-64 years and 65+ years), sex and the presence of five
symptoms likely to be related to pathogen, namely diarrhoea, vomiting, bloody
13
A case of Clostridium difficile-associated diarrhoea was defined as an individual with symptoms of diarrhoea not attributable to another cause (i.e. in the absence of other enteropathogens), occurring at the same time as a positive toxin assay.
Page 105 of 427
diarrhoea, abdominal pain and fever. For each test in turn, the missing values were
filled in using random draws from the parameter distribution defined by the
imputation model. The imputation proceeded iteratively, updating the imputed
variables each time, until the model converged and all missing values had been filled
in. To account for uncertainty in the imputation, 20 imputed datasets were
generated. For E. coli and Salmonella, for which the number of positives was very
low, the missing data were instead filled in by sampling with replacement from the
observed data within strata of age group and sex. Overall, 35% of records in the
Cohort Study and 11% of records in the GP Presentation Study had values imputed
for at least one variable.
We obtained incidence estimates for each pathogen by averaging the
incidence across all 20 imputation datasets, taking into account the within- and
between-imputation variances in the calculation of 95% confidence intervals.
Multiple imputation and analysis of imputed data were implemented in Stata 11.0
(Statacorp) using the ice and mi suites of commands (Carlin et al., 2003; Royston,
2005).
3.9.9 Reporting patterns of IID
3.9.9.1 Incidence of IID reported to National Surveillance
We obtained records of IID cases reported to national surveillance during the period
1st April 2008 to 31st August 2009 from the national databases at CfI, Health
Protection Scotland (HPS) and the Communicable Disease Surveillance Centre
Northern Ireland (CDSC NI). We calculated incidence rates of reported IID by
dividing the number of cases reported over a 12-month period by the mid-year
census population. To account for seasonal variations in incidence, smooth out
temporal fluctuations and delays in reporting, and because the study spanned more
than one year, we calculated the numerator as a moving average of the number of
reports over 22 consecutive 365-day periods between 1st April 2008 and 31st August
2009, with the 365-day window advancing by one week in each consecutive period.
We then took the mean of these 22 values as the numerator in the incidence
calculations.
We calculated the overall incidence rates and incidence by organism for
England and for the UK as a whole.
Page 106 of 427
3.9.9.2 Incidence of IID in the community, presenting to general practice, and
reported to national surveillance
To investigate the relationship between the incidence of IID in the community,
presenting to general practice, and reported to national surveillance, we calculated
rate ratios comparing the incidence in the different components, both for all IID and
for IID due to specific organisms.
For organism-specific IID, we calculated the ratio comparing the rate in the
community with that presenting to general practice using a simulation approach. We
assumed that the natural logarithm of the rates, estimated from the combined
analysis of 20 imputed datasets, had an approximately normal distribution with mean
equal to the logarithm of the observed rate, and standard deviation inferred from the
width of the 95% confidence intervals. We performed 100,000 random draws from
the distribution of each rate and calculated the difference between each pair of
sampled values. The median and central 95% of the resulting distribution was
obtained, and the exponential of these values used to estimate the rate ratio and
95% confidence bounds. Rate ratios comparing organism-specific incidence in the
community and presenting to general practice with that reported to national
surveillance were estimated in a similar way.
In estimating the incidence of all IID in the community, we used distribution-
free methods to calculate 95% confidence intervals. Accordingly, to estimate the
rate ratio comparing the rate of all IID in the community with that presenting to
general practice, we used distribution-free methods to account for variability in the
rate estimate. We simulated the distribution of the rate in the community by
performing 9,999 bootstrap replications. In each replication, we sampled with
replacement a cohort of size equal to the observed data and calculated the rate.
Similarly, the rate of all IID presenting to general practice was calculated from 9,999
bootstrap replications. The ratio of the rates was calculated for each pair of
bootstrap replicates, and the median and central 95% of the resulting distribution
obtained to provide estimates of the rate ratio and 95% confidence bounds.
3.9.10 Comparing aetiology and incidence of IID in the IID1 and IID2 studies
We compared the percentage of specimens positive for each organism, as well as
the percentage of specimens positive for at least one organism, in the IID1 and IID2
Page 107 of 427
studies. To account for differences in the organisms tested for in the two studies, we
used only the subset of organisms tested for in both studies. For organisms that
were additionally tested by PCR in the IID2 study, we compared the percentage
positivity using conventional methods in IID1 to that using both conventional and
PCR methods in IID2 to establish the added benefit of using molecular diagnostic
methods.
To investigate whether the relationship between disease in the community,
presenting to general practice and reported to national surveillance had changed in
the intervening period between the IID1 and IID2 studies, we compared the reporting
patterns for all IID, as well as for Campylobacter spp., Salmonella spp., norovirus
and rotavirus, between the two studies. It should be noted that in IID1 two separate
estimates of under-ascertainment by national surveillance were made. The first was
based on direct linkage of cases among community cohort participants, and cases
presenting to general practice, to cases reported to national surveillance. The
second, indirect method was based on the overall ratios of incidence in the
community and presenting to general practice to the incidence of reports to national
surveillance. The difference is important because, for some organisms, notably
norovirus, a large fraction of reports to national surveillance result from disease in
hospitals and other institutions not included in the community cohort. Accordingly, in
IID1 there was great divergence in the estimates for norovirus obtained by the two
methods. Because of confidentiality restrictions and changes in the amount of
personal identifiable information held on laboratory reports, direct linkage of cases
identified in the IID2 study with reports to national surveillance was not possible.
Reporting patterns presented in this report are, therefore, all based on the indirect
method.
For Campylobacter spp. and Salmonella spp. we present reporting patterns
for both studies based on diagnosis by culture, so as to enable direct comparison
between the two studies. For norovirus, Phillips et al. (2010) recently published a
modified reporting pattern based on PCR re-testing of archived specimens from the
first IID study, and we have used those estimates as a comparison. For rotavirus, the
original estimates in IID1 are based on diagnosis by ELISA. In IID2, ELISA testing
was performed only on specimens from individuals aged <5 years, while all
specimens were tested by PCR. Incidence estimates in IID2 are therefore based on

Page 108 of 427
cases with clinically significant rotavirus infection (CT value <30 by PCR) at all ages
and/or a positive ELISA test in individuals <5 years of age.
Page 109 of 427
CHAPTER 4
PARTICIPATION, REPRESENTATIVENESS AND COMPLIANCE14
4.1 PRACTICE CHARACTERISTICS
Figure 4.1 presents a summary of practices recruited into the IID2 study. A total of
126 initially agreed to take part in the study (Table A4.1). Seventeen practices
subsequently dropped out before being allocated to the GP Enumeration or GP
Presentation Study. The majority of these practices cited lack of nurse time or
resources as reasons for withdrawing from the study. Of the remaining 109
practices, 53 were randomly allocated to the GP Enumeration Study and 56 to the
GP Presentation/Validation Study. Six GP Enumeration Study and 15 GP
Presentation/Validation Study practices subsequently withdrew from the study, either
prior to training or in the early stages of the study. Among the remaining practices,
seven did not complete the GP Enumeration Study, three did not complete the GP
Presentation/Validation Study and one was excluded from analysis of the GP
Presentation/Validation Study because of low recruitment. Thus, after withdrawals
and exclusions, 40 practices completed both the Cohort and GP Enumeration
studies, and 37 practices completed both the Cohort and GP Presentation/Validation
studies. Eleven practices did not complete either the GP Enumeration or GP
Presentation Study, and contributed data only to the Cohort Study.
14
When reading this chapter please note that tables and figures pre-fixed “A” can be found in the annex to Chapter 4.
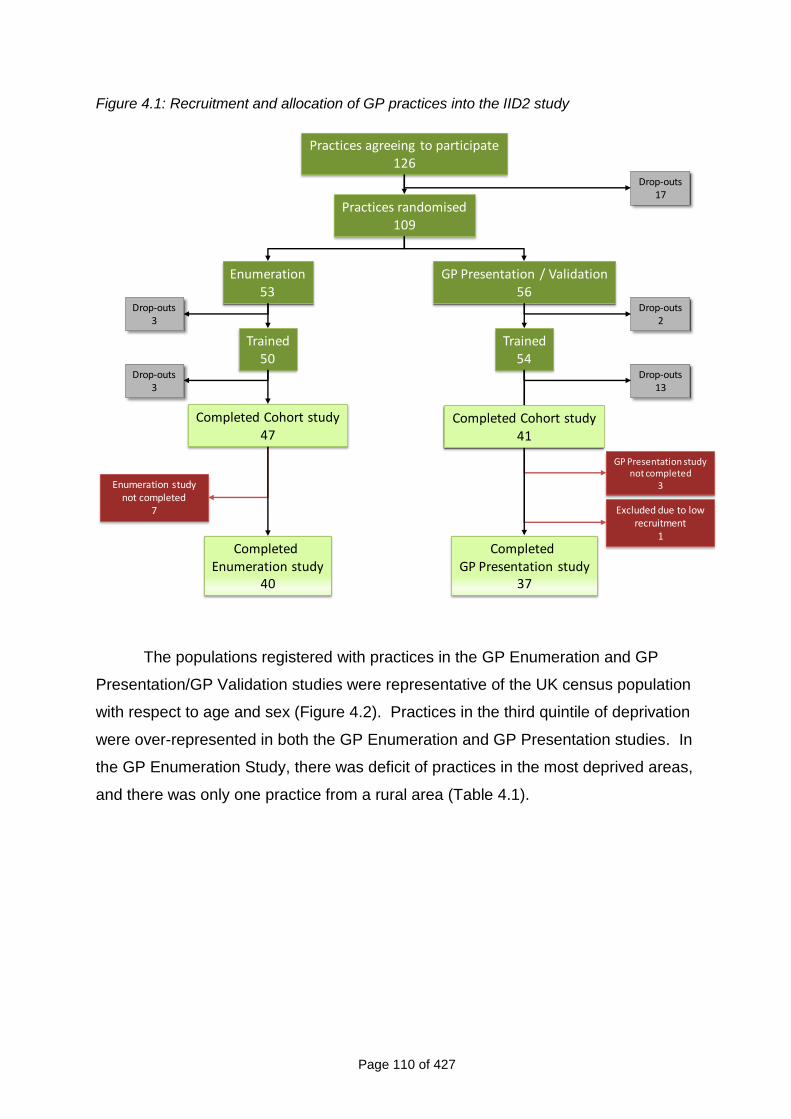
Page 110 of 427
Figure 4.1: Recruitment and allocation of GP practices into the IID2 study
Practices randomised109
Enumeration53
GP Presentation / Validation56
Completed Enumeration study
40
Drop-outs3
Drop-outs2
GP Presentation study not completed
3
Excluded due to low recruitment
1
Enumeration study not completed
7
Completed GP Presentation study
37
Practices agreeing to participate126
Drop-outs17
Trained50
Trained54
Drop-outs3
Drop-outs13
Completed Cohort study47
Completed Cohort study41
The populations registered with practices in the GP Enumeration and GP
Presentation/GP Validation studies were representative of the UK census population
with respect to age and sex (Figure 4.2). Practices in the third quintile of deprivation
were over-represented in both the GP Enumeration and GP Presentation studies. In
the GP Enumeration Study, there was deficit of practices in the most deprived areas,
and there was only one practice from a rural area (Table 4.1).
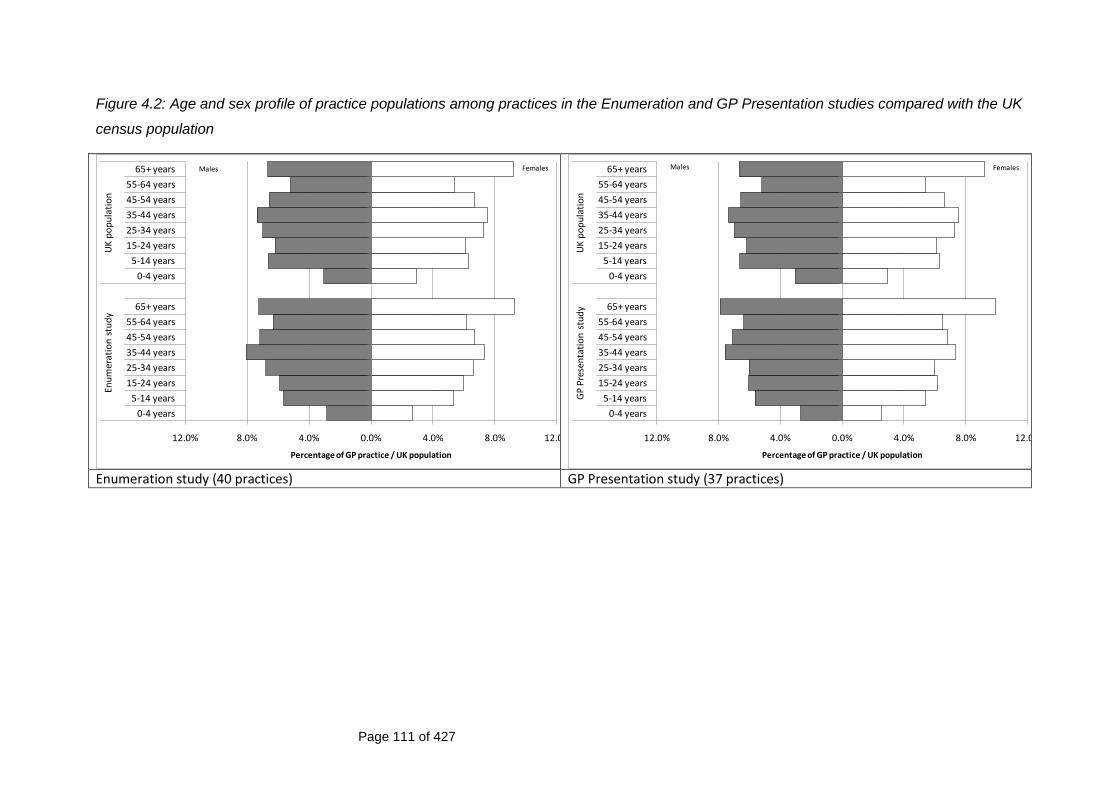
Page 111 of 427
Figure 4.2: Age and sex profile of practice populations among practices in the Enumeration and GP Presentation studies compared with the UK
census population
12.0% 8.0% 4.0% 0.0% 4.0% 8.0% 12.0%
0-4 years
5-14 years
15-24 years
25-34 years
35-44 years
45-54 years
55-64 years
65+ years
0-4 years
5-14 years
15-24 years
25-34 years
35-44 years
45-54 years
55-64 years
65+ years
Enu
mer
atio
n s
tud
yU
K p
op
ula
tio
n
Percentage of GP practice / UK population
Males Females
12.0% 8.0% 4.0% 0.0% 4.0% 8.0% 12.0%
0-4 years
5-14 years
15-24 years
25-34 years
35-44 years
45-54 years
55-64 years
65+ years
0-4 years
5-14 years
15-24 years
25-34 years
35-44 years
45-54 years
55-64 years
65+ years
GP
Pre
sen
tati
on
stu
dy
UK
po
pu
lati
on
Percentage of GP practice / UK population
Males Females
Enumeration study (40 practices) GP Presentation study (37 practices)
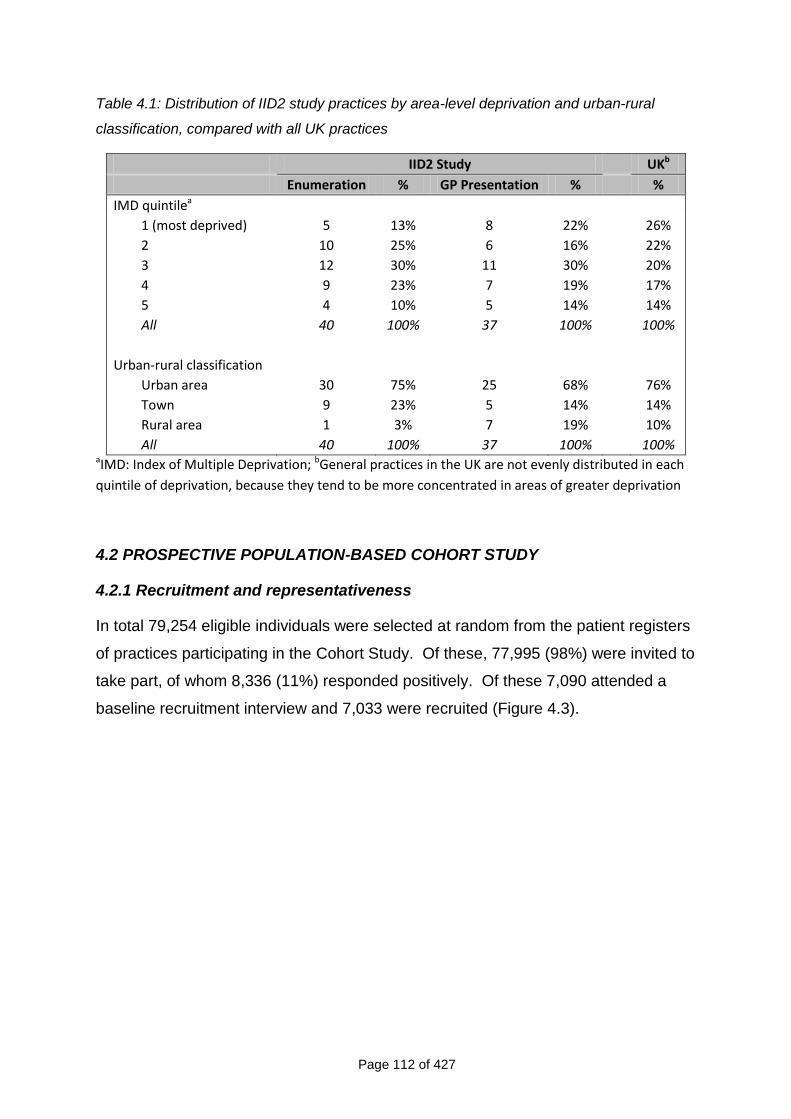
Page 112 of 427
Table 4.1: Distribution of IID2 study practices by area-level deprivation and urban-rural
classification, compared with all UK practices
IID2 Study UKb
Enumeration % GP Presentation % %
IMD quintilea
1 (most deprived) 5 13% 8 22% 26%
2 10 25% 6 16% 22%
3 12 30% 11 30% 20%
4 9 23% 7 19% 17%
5 4 10% 5 14% 14%
All 40 100% 37 100% 100%
Urban-rural classification
Urban area 30 75% 25 68% 76%
Town 9 23% 5 14% 14%
Rural area 1 3% 7 19% 10%
All 40 100% 37 100% 100% aIMD: Index of Multiple Deprivation; bGeneral practices in the UK are not evenly distributed in each
quintile of deprivation, because they tend to be more concentrated in areas of greater deprivation
4.2 PROSPECTIVE POPULATION-BASED COHORT STUDY
4.2.1 Recruitment and representativeness
In total 79,254 eligible individuals were selected at random from the patient registers
of practices participating in the Cohort Study. Of these, 77,995 (98%) were invited to
take part, of whom 8,336 (11%) responded positively. Of these 7,090 attended a
baseline recruitment interview and 7,033 were recruited (Figure 4.3).
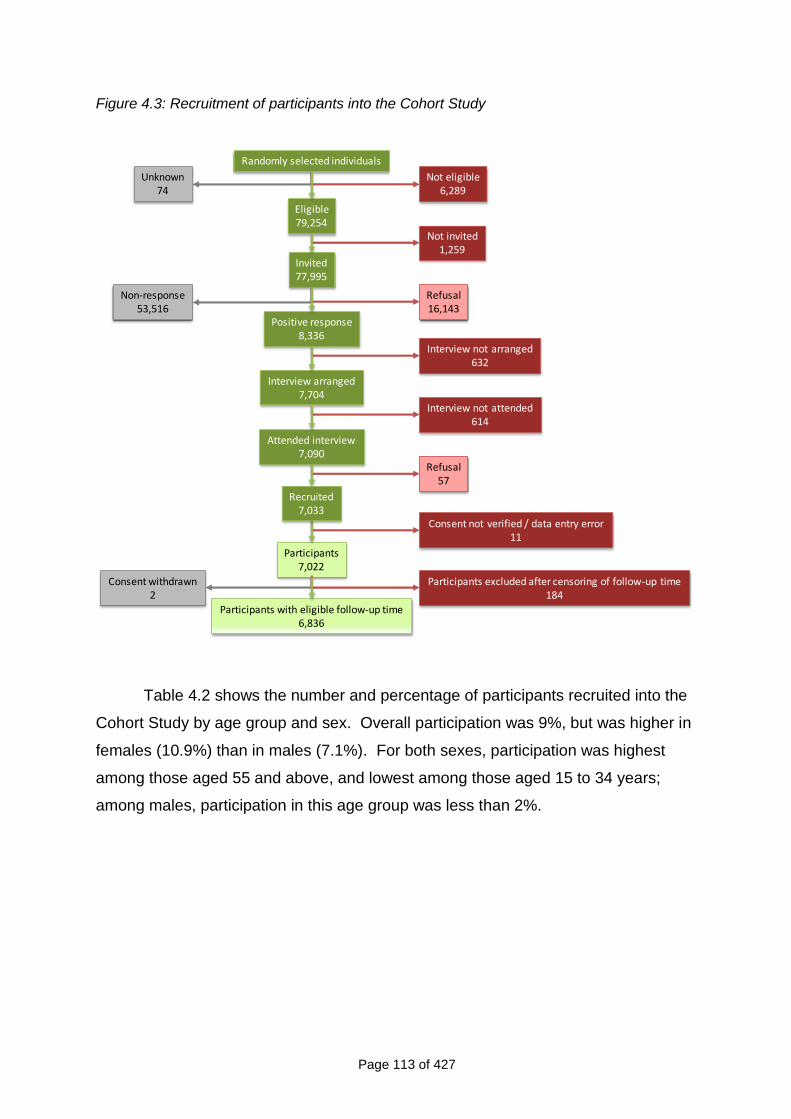
Page 113 of 427
Figure 4.3: Recruitment of participants into the Cohort Study
Not eligible6,289
Unknown74
Not invited1,259
Refusal16,143
Interview not arranged632
Interview not attended614
Refusal57
Randomly selected individuals
Eligible79,254
Invited77,995
Positive response8,336
Interview arranged7,704
Attended interview7,090
Non-response53,516
Participants7,022
Consent not verified / data entry error11
Recruited7,033
Participants with eligible follow-up time6,836
Participants excluded after censoring of follow-up time184
Consent withdrawn2
Table 4.2 shows the number and percentage of participants recruited into the
Cohort Study by age group and sex. Overall participation was 9%, but was higher in
females (10.9%) than in males (7.1%). For both sexes, participation was highest
among those aged 55 and above, and lowest among those aged 15 to 34 years;
among males, participation in this age group was less than 2%.
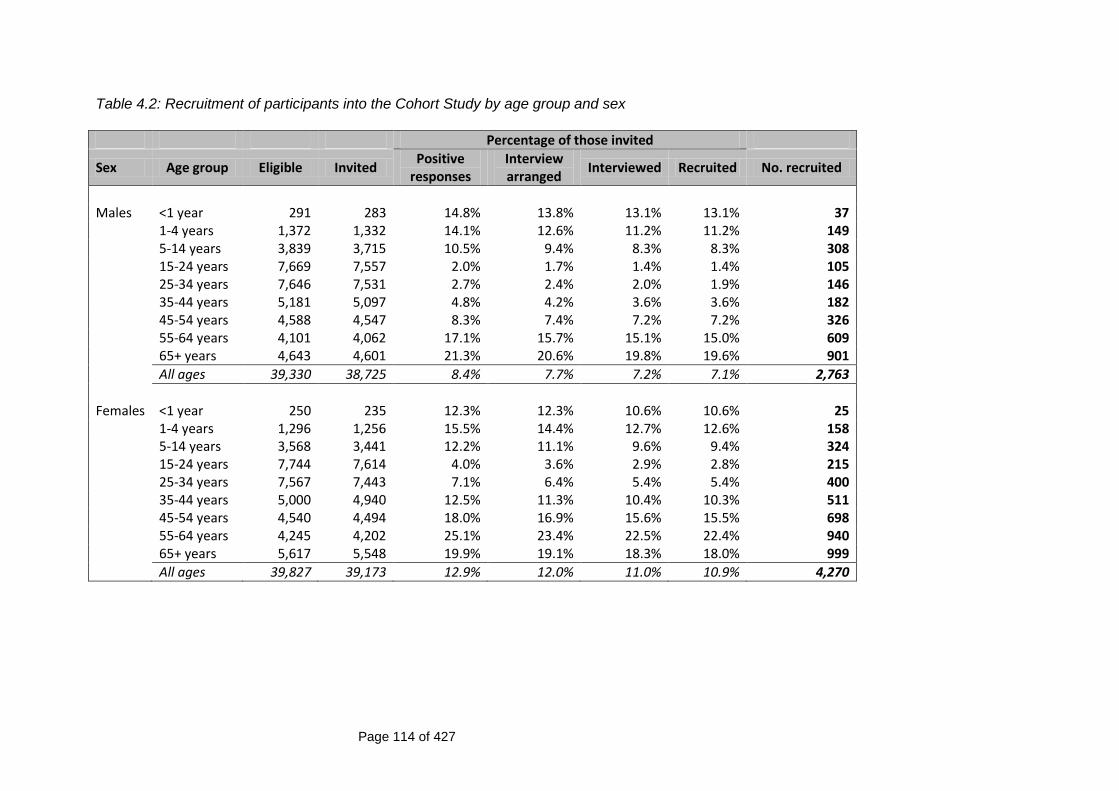
Page 114 of 427
Table 4.2: Recruitment of participants into the Cohort Study by age group and sex
Percentage of those invited
Sex Age group Eligible Invited Positive
responses Interview arranged
Interviewed Recruited No. recruited
Males <1 year 291 283 14.8% 13.8% 13.1% 13.1% 37 1-4 years 1,372 1,332 14.1% 12.6% 11.2% 11.2% 149 5-14 years 3,839 3,715 10.5% 9.4% 8.3% 8.3% 308 15-24 years 7,669 7,557 2.0% 1.7% 1.4% 1.4% 105 25-34 years 7,646 7,531 2.7% 2.4% 2.0% 1.9% 146 35-44 years 5,181 5,097 4.8% 4.2% 3.6% 3.6% 182 45-54 years 4,588 4,547 8.3% 7.4% 7.2% 7.2% 326 55-64 years 4,101 4,062 17.1% 15.7% 15.1% 15.0% 609 65+ years 4,643 4,601 21.3% 20.6% 19.8% 19.6% 901
All ages 39,330 38,725 8.4% 7.7% 7.2% 7.1% 2,763
Females <1 year 250 235 12.3% 12.3% 10.6% 10.6% 25 1-4 years 1,296 1,256 15.5% 14.4% 12.7% 12.6% 158 5-14 years 3,568 3,441 12.2% 11.1% 9.6% 9.4% 324 15-24 years 7,744 7,614 4.0% 3.6% 2.9% 2.8% 215 25-34 years 7,567 7,443 7.1% 6.4% 5.4% 5.4% 400 35-44 years 5,000 4,940 12.5% 11.3% 10.4% 10.3% 511 45-54 years 4,540 4,494 18.0% 16.9% 15.6% 15.5% 698 55-64 years 4,245 4,202 25.1% 23.4% 22.5% 22.4% 940 65+ years 5,617 5,548 19.9% 19.1% 18.3% 18.0% 999
All ages 39,827 39,173 12.9% 12.0% 11.0% 10.9% 4,270
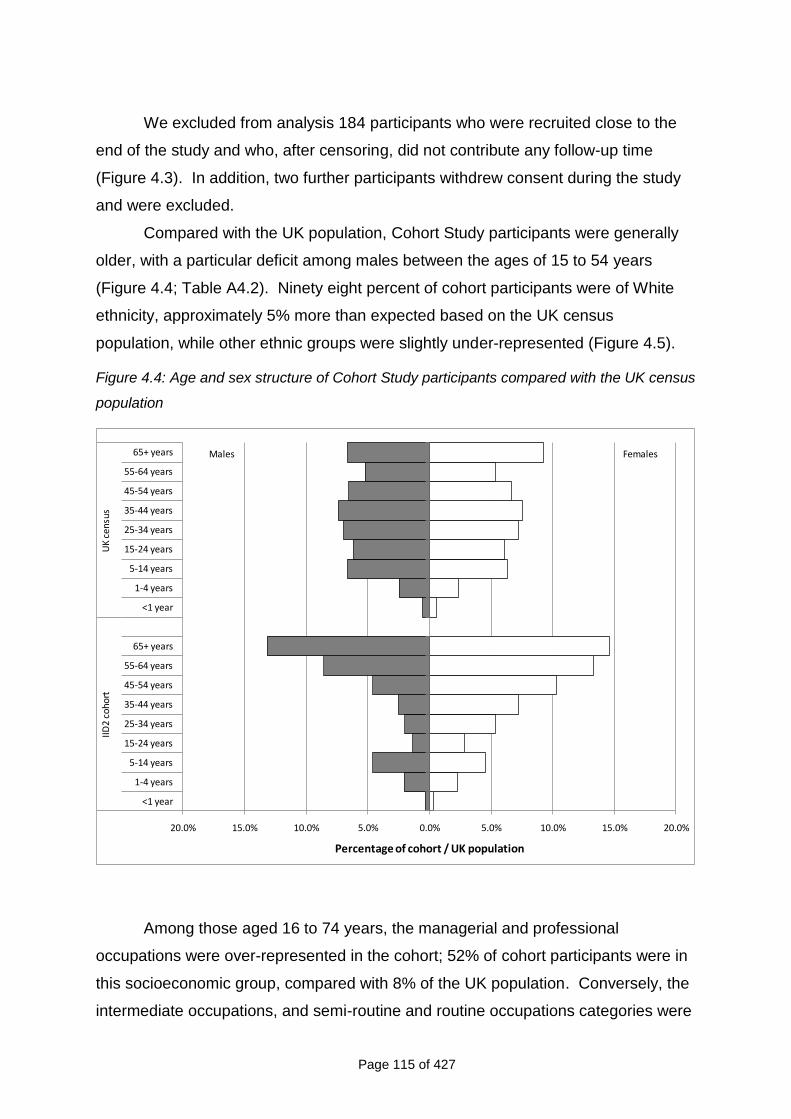
Page 115 of 427
We excluded from analysis 184 participants who were recruited close to the
end of the study and who, after censoring, did not contribute any follow-up time
(Figure 4.3). In addition, two further participants withdrew consent during the study
and were excluded.
Compared with the UK population, Cohort Study participants were generally
older, with a particular deficit among males between the ages of 15 to 54 years
(Figure 4.4; Table A4.2). Ninety eight percent of cohort participants were of White
ethnicity, approximately 5% more than expected based on the UK census
population, while other ethnic groups were slightly under-represented (Figure 4.5).
Figure 4.4: Age and sex structure of Cohort Study participants compared with the UK census
population
20.0% 15.0% 10.0% 5.0% 0.0% 5.0% 10.0% 15.0% 20.0%
<1 year
1-4 years
5-14 years
15-24 years
25-34 years
35-44 years
45-54 years
55-64 years
65+ years
<1 year
1-4 years
5-14 years
15-24 years
25-34 years
35-44 years
45-54 years
55-64 years
65+ years
IID2
coho
rtU
K ce
nsu
s
Percentage of cohort / UK population
Males Females
Among those aged 16 to 74 years, the managerial and professional
occupations were over-represented in the cohort; 52% of cohort participants were in
this socioeconomic group, compared with 8% of the UK population. Conversely, the
intermediate occupations, and semi-routine and routine occupations categories were
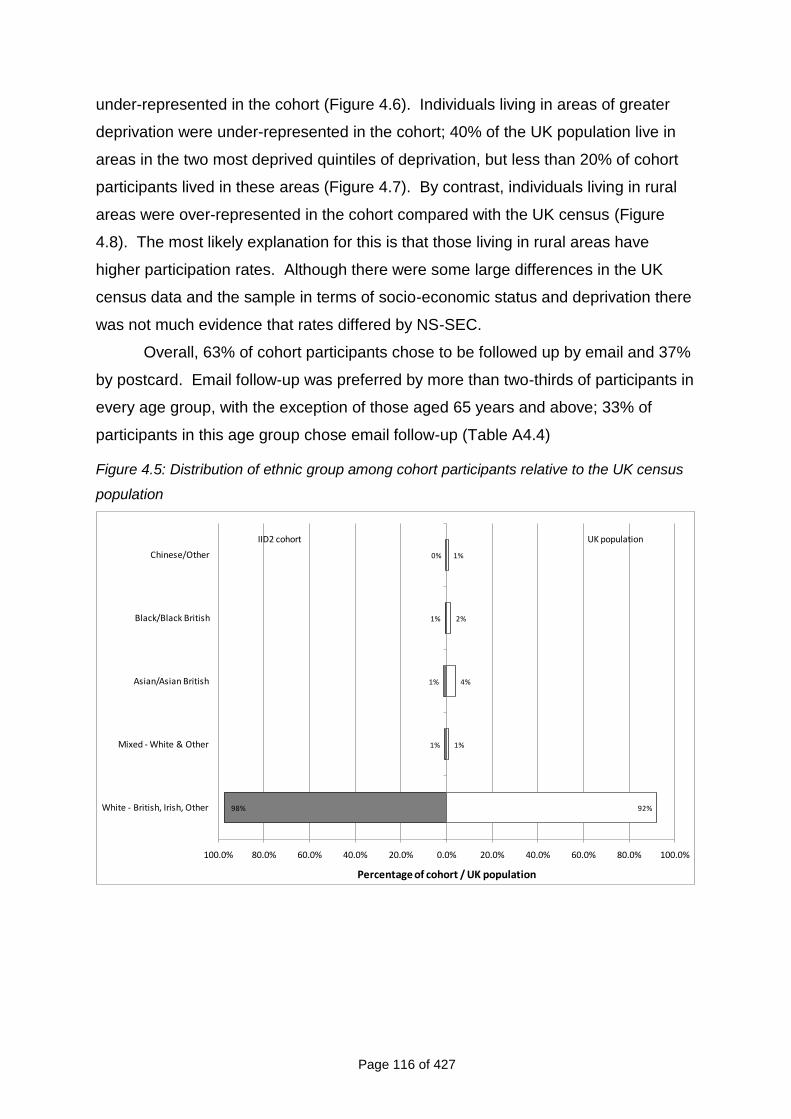
Page 116 of 427
under-represented in the cohort (Figure 4.6). Individuals living in areas of greater
deprivation were under-represented in the cohort; 40% of the UK population live in
areas in the two most deprived quintiles of deprivation, but less than 20% of cohort
participants lived in these areas (Figure 4.7). By contrast, individuals living in rural
areas were over-represented in the cohort compared with the UK census (Figure
4.8). The most likely explanation for this is that those living in rural areas have
higher participation rates. Although there were some large differences in the UK
census data and the sample in terms of socio-economic status and deprivation there
was not much evidence that rates differed by NS-SEC.
Overall, 63% of cohort participants chose to be followed up by email and 37%
by postcard. Email follow-up was preferred by more than two-thirds of participants in
every age group, with the exception of those aged 65 years and above; 33% of
participants in this age group chose email follow-up (Table A4.4)
Figure 4.5: Distribution of ethnic group among cohort participants relative to the UK census
population
98%
1%
1%
1%
0%
92%
1%
4%
2%
1%
100.0% 80.0% 60.0% 40.0% 20.0% 0.0% 20.0% 40.0% 60.0% 80.0% 100.0%
White - British, Irish, Other
Mixed - White & Other
Asian/Asian British
Black/Black British
Chinese/Other
Percentage of cohort / UK population
IID2 cohort UK population
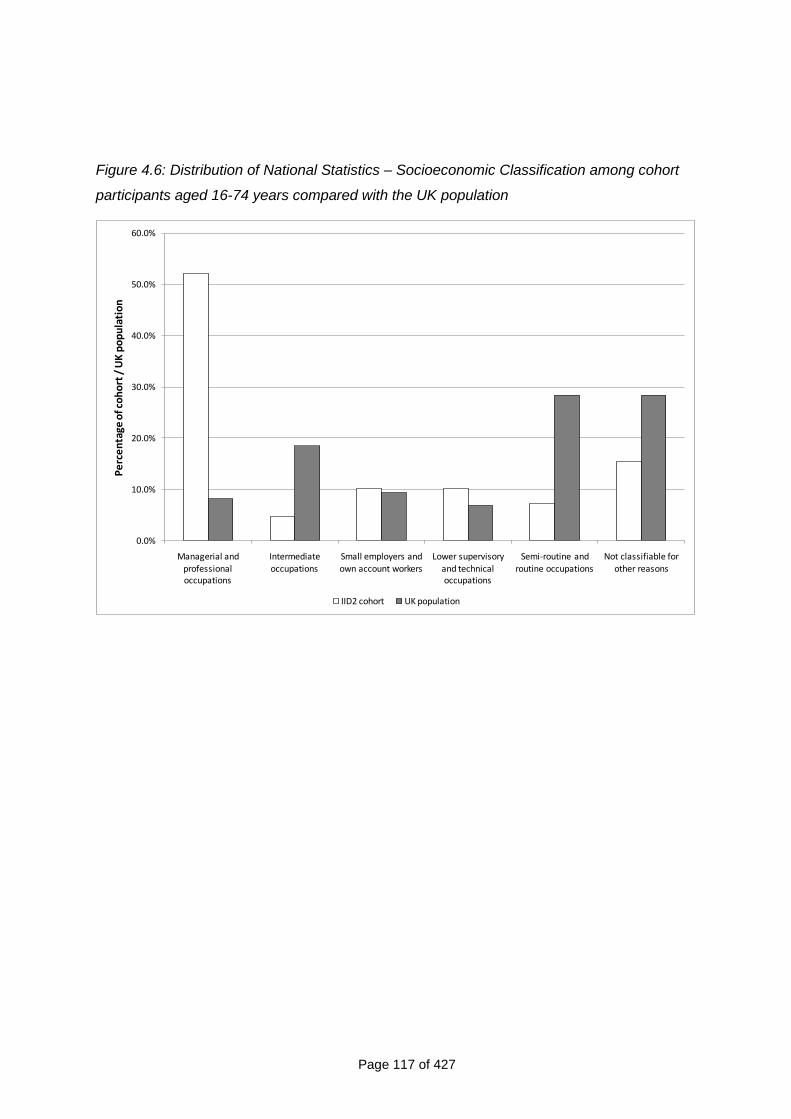
Page 117 of 427
Figure 4.6: Distribution of National Statistics – Socioeconomic Classification among cohort
participants aged 16-74 years compared with the UK population
0.0%
10.0%
20.0%
30.0%
40.0%
50.0%
60.0%
Managerial and professional occupations
Intermediate occupations
Small employers and own account workers
Lower supervisory and technical occupations
Semi-routine and routine occupations
Not classifiable for other reasons
Pe
rce
nta
ge o
f co
ho
rt /
UK
po
pu
lati
on
IID2 cohort UK population
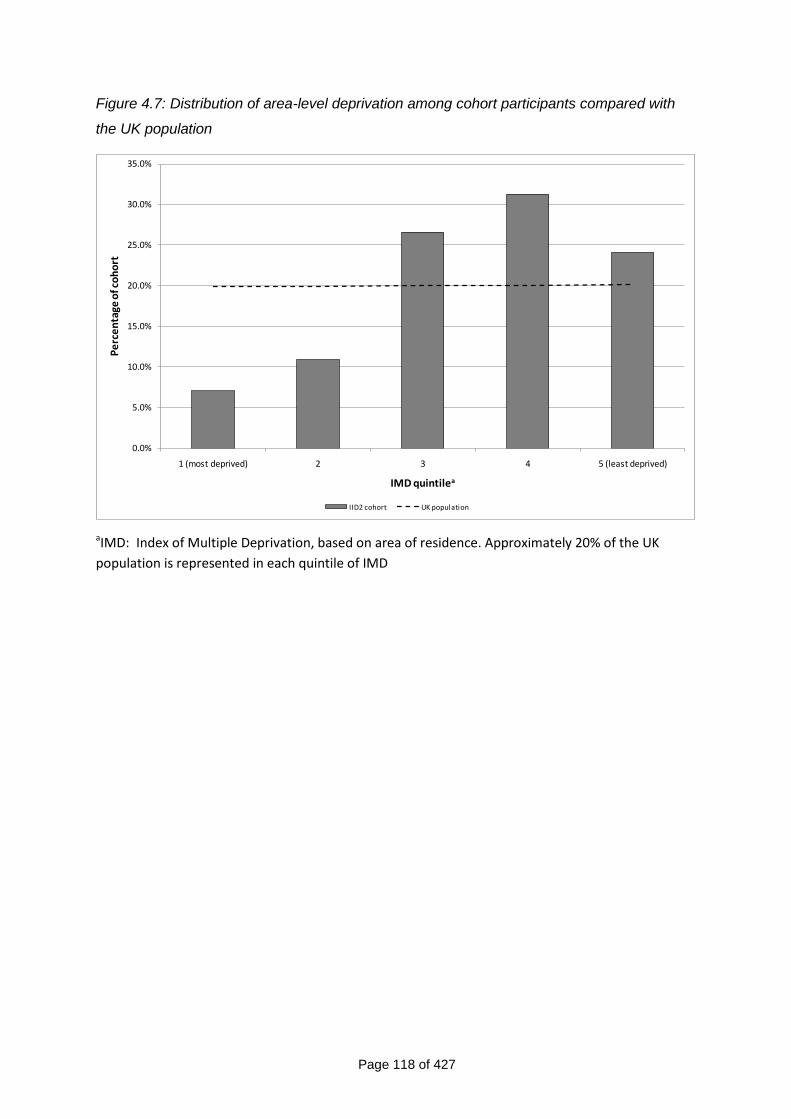
Page 118 of 427
Figure 4.7: Distribution of area-level deprivation among cohort participants compared with
the UK population
0.0%
5.0%
10.0%
15.0%
20.0%
25.0%
30.0%
35.0%
1 (most deprived) 2 3 4 5 (least deprived)
Pe
rce
nta
ge o
f co
ho
rt
IMD quintilea
IID2 cohort UK population
aIMD: Index of Multiple Deprivation, based on area of residence. Approximately 20% of the UK
population is represented in each quintile of IMD
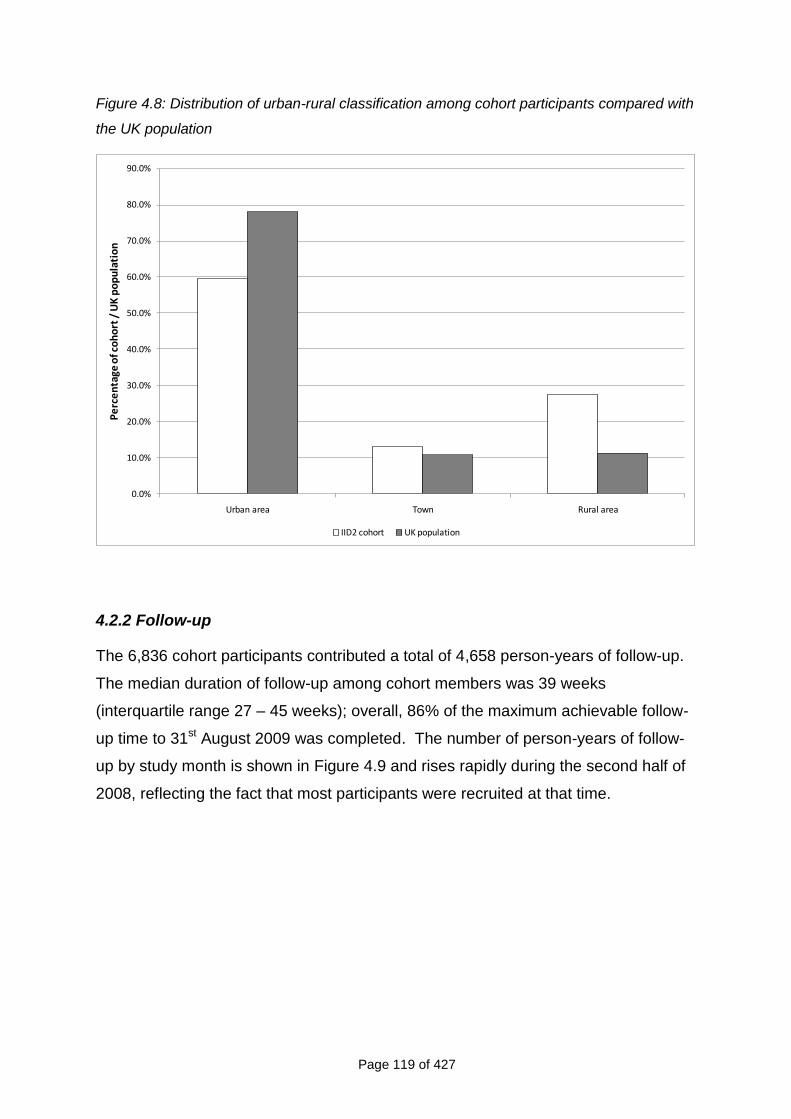
Page 119 of 427
Figure 4.8: Distribution of urban-rural classification among cohort participants compared with
the UK population
0.0%
10.0%
20.0%
30.0%
40.0%
50.0%
60.0%
70.0%
80.0%
90.0%
Urban area Town Rural area
Pe
rce
nta
ge o
f co
ho
rt /
UK
po
pu
lati
on
IID2 cohort UK population
4.2.2 Follow-up
The 6,836 cohort participants contributed a total of 4,658 person-years of follow-up.
The median duration of follow-up among cohort members was 39 weeks
(interquartile range 27 – 45 weeks); overall, 86% of the maximum achievable follow-
up time to 31st August 2009 was completed. The number of person-years of follow-
up by study month is shown in Figure 4.9 and rises rapidly during the second half of
2008, reflecting the fact that most participants were recruited at that time.
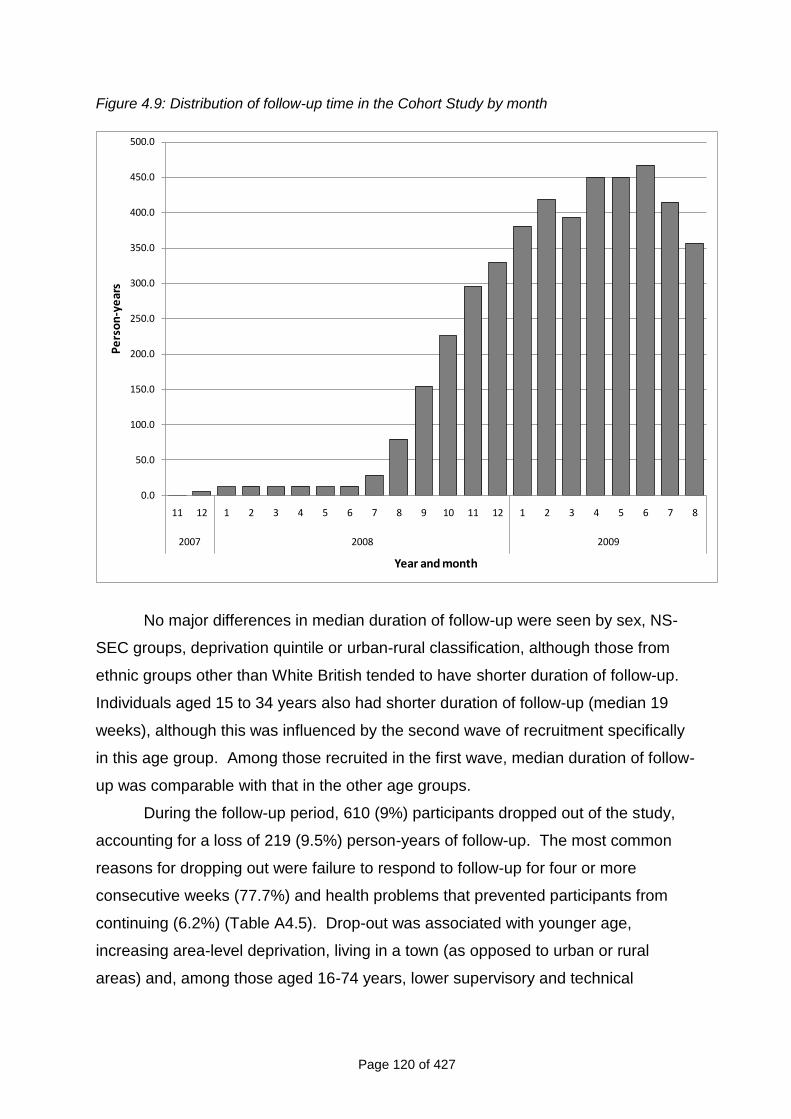
Page 120 of 427
Figure 4.9: Distribution of follow-up time in the Cohort Study by month
0.0
50.0
100.0
150.0
200.0
250.0
300.0
350.0
400.0
450.0
500.0
11 12 1 2 3 4 5 6 7 8 9 10 11 12 1 2 3 4 5 6 7 8
2007 2008 2009
Pe
rso
n-y
ear
s
Year and month
No major differences in median duration of follow-up were seen by sex, NS-
SEC groups, deprivation quintile or urban-rural classification, although those from
ethnic groups other than White British tended to have shorter duration of follow-up.
Individuals aged 15 to 34 years also had shorter duration of follow-up (median 19
weeks), although this was influenced by the second wave of recruitment specifically
in this age group. Among those recruited in the first wave, median duration of follow-
up was comparable with that in the other age groups.
During the follow-up period, 610 (9%) participants dropped out of the study,
accounting for a loss of 219 (9.5%) person-years of follow-up. The most common
reasons for dropping out were failure to respond to follow-up for four or more
consecutive weeks (77.7%) and health problems that prevented participants from
continuing (6.2%) (Table A4.5). Drop-out was associated with younger age,
increasing area-level deprivation, living in a town (as opposed to urban or rural
areas) and, among those aged 16-74 years, lower supervisory and technical
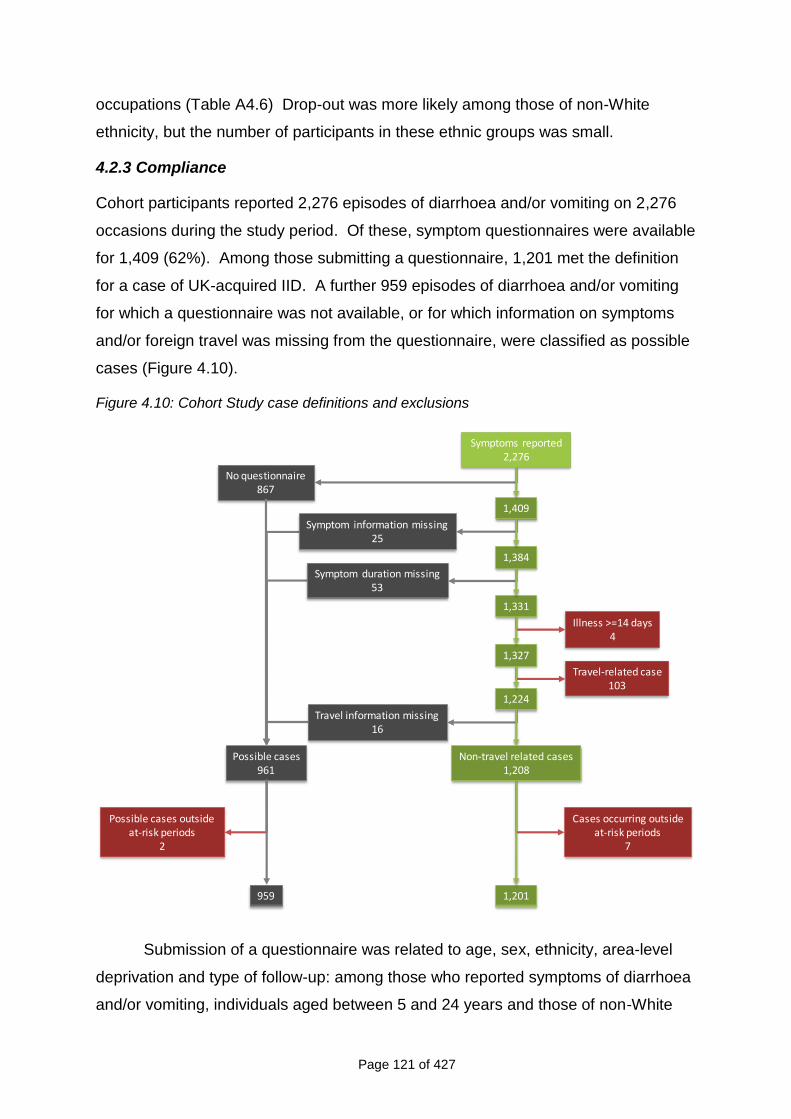
Page 121 of 427
occupations (Table A4.6) Drop-out was more likely among those of non-White
ethnicity, but the number of participants in these ethnic groups was small.
4.2.3 Compliance
Cohort participants reported 2,276 episodes of diarrhoea and/or vomiting on 2,276
occasions during the study period. Of these, symptom questionnaires were available
for 1,409 (62%). Among those submitting a questionnaire, 1,201 met the definition
for a case of UK-acquired IID. A further 959 episodes of diarrhoea and/or vomiting
for which a questionnaire was not available, or for which information on symptoms
and/or foreign travel was missing from the questionnaire, were classified as possible
cases (Figure 4.10).
Figure 4.10: Cohort Study case definitions and exclusions
No questionnaire867
Symptom information missing25
Illness >=14 days4
Travel-related case103
Symptoms reported2,276
1,409
1,384
1,331
1,327
1,224
Non-travel related cases1,208
Symptom duration missing53
Travel information missing16
Possible cases961
1,201959
Cases occurring outsideat-risk periods
7
Possible cases outsideat-risk periods
2
Submission of a questionnaire was related to age, sex, ethnicity, area-level
deprivation and type of follow-up: among those who reported symptoms of diarrhoea
and/or vomiting, individuals aged between 5 and 24 years and those of non-White
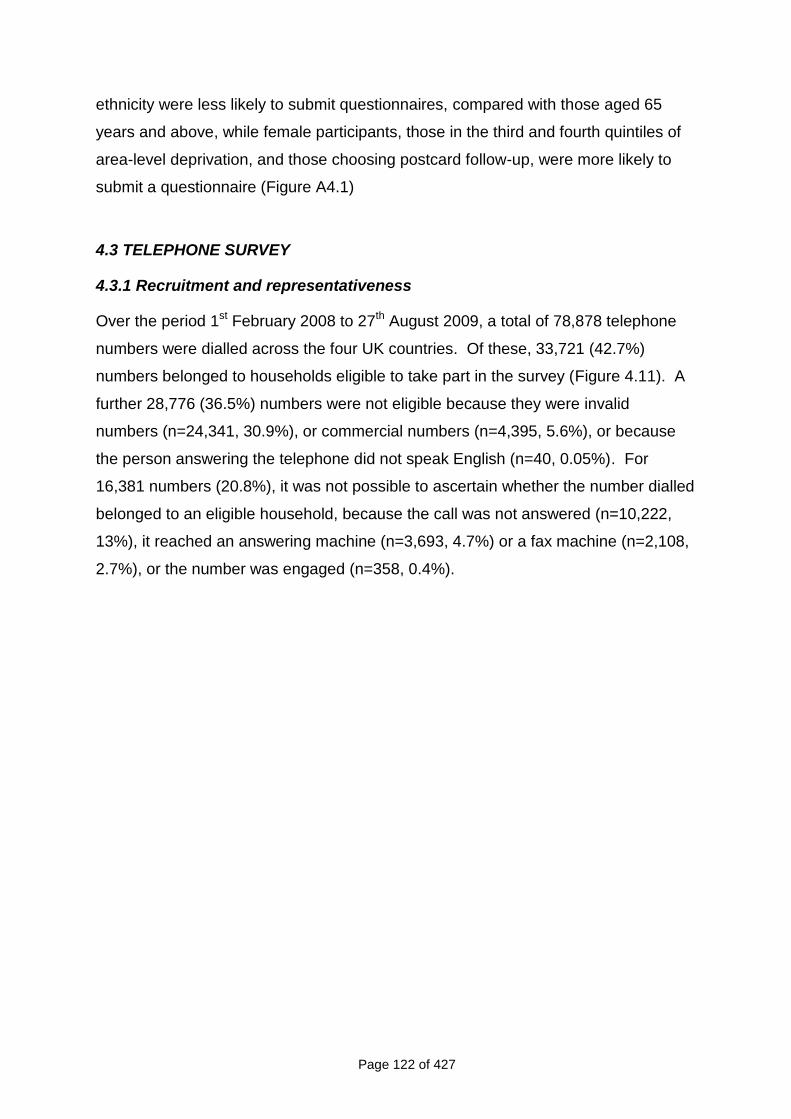
Page 122 of 427
ethnicity were less likely to submit questionnaires, compared with those aged 65
years and above, while female participants, those in the third and fourth quintiles of
area-level deprivation, and those choosing postcard follow-up, were more likely to
submit a questionnaire (Figure A4.1)
4.3 TELEPHONE SURVEY
4.3.1 Recruitment and representativeness
Over the period 1st February 2008 to 27th August 2009, a total of 78,878 telephone
numbers were dialled across the four UK countries. Of these, 33,721 (42.7%)
numbers belonged to households eligible to take part in the survey (Figure 4.11). A
further 28,776 (36.5%) numbers were not eligible because they were invalid
numbers (n=24,341, 30.9%), or commercial numbers (n=4,395, 5.6%), or because
the person answering the telephone did not speak English (n=40, 0.05%). For
16,381 numbers (20.8%), it was not possible to ascertain whether the number dialled
belonged to an eligible household, because the call was not answered (n=10,222,
13%), it reached an answering machine (n=3,693, 4.7%) or a fax machine (n=2,108,
2.7%), or the number was engaged (n=358, 0.4%).
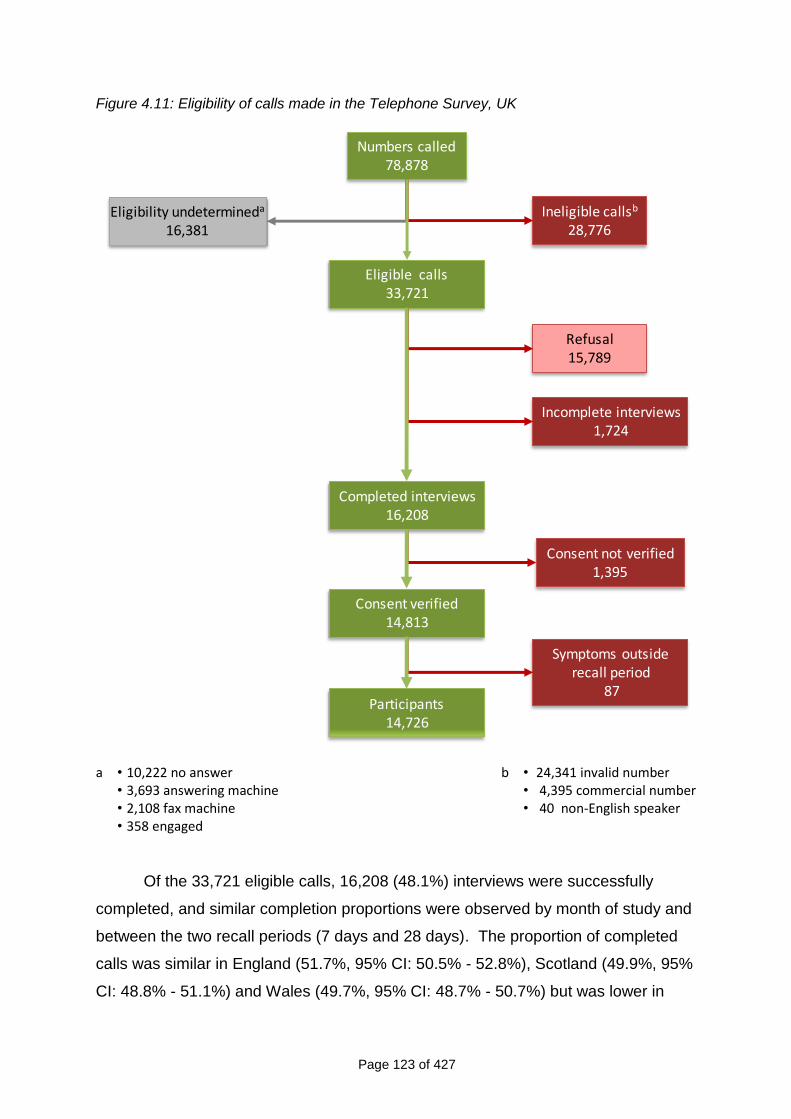
Page 123 of 427
Figure 4.11: Eligibility of calls made in the Telephone Survey, UK
Ineligible callsb
28,776
Refusal15,789
Incomplete interviews1,724
Symptoms outsiderecall period
87
Numbers called78,878
Eligible calls33,721
Consent verified14,813
Participants14,726
Completed interviews16,208
Consent not verified1,395
Eligibility undetermineda
16,381
a • 10,222 no answer • 3,693 answering machine • 2,108 fax machine • 358 engaged
b • 24,341 invalid number • 4,395 commercial number • 40 non-English speaker
Of the 33,721 eligible calls, 16,208 (48.1%) interviews were successfully
completed, and similar completion proportions were observed by month of study and
between the two recall periods (7 days and 28 days). The proportion of completed
calls was similar in England (51.7%, 95% CI: 50.5% - 52.8%), Scotland (49.9%, 95%
CI: 48.8% - 51.1%) and Wales (49.7%, 95% CI: 48.7% - 50.7%) but was lower in
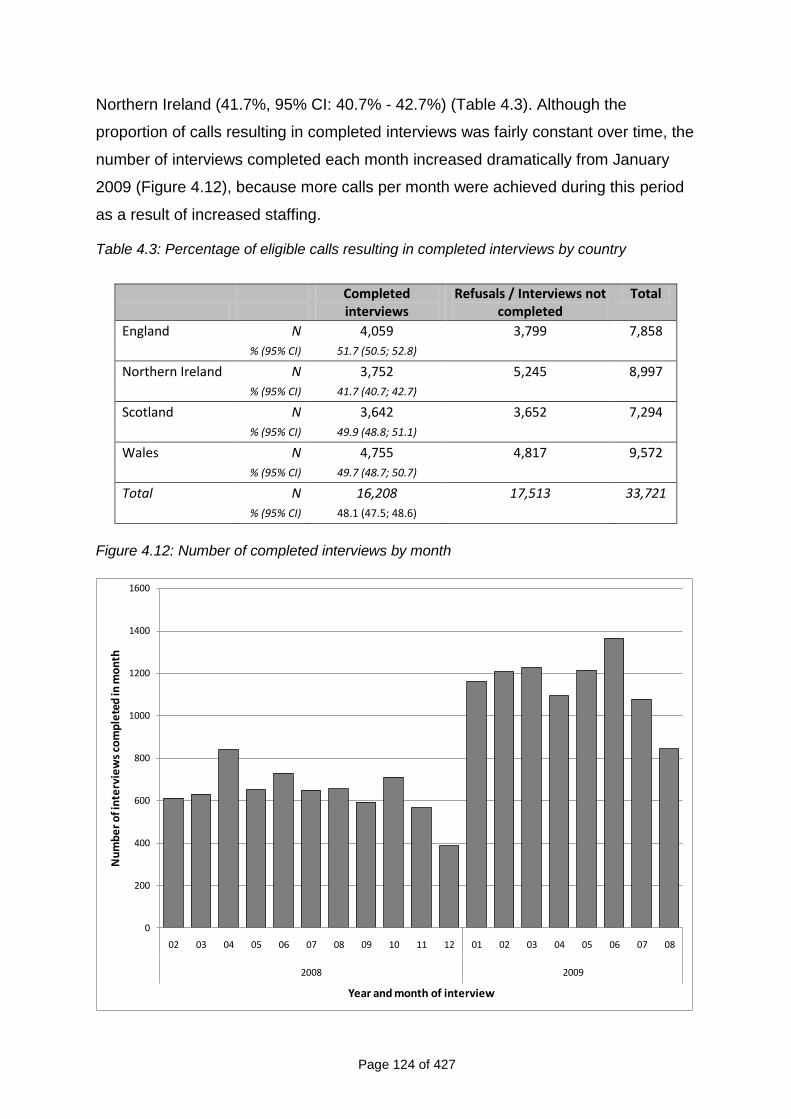
Page 124 of 427
Northern Ireland (41.7%, 95% CI: 40.7% - 42.7%) (Table 4.3). Although the
proportion of calls resulting in completed interviews was fairly constant over time, the
number of interviews completed each month increased dramatically from January
2009 (Figure 4.12), because more calls per month were achieved during this period
as a result of increased staffing.
Table 4.3: Percentage of eligible calls resulting in completed interviews by country
Completed
interviews Refusals / Interviews not
completed Total
England N 4,059 3,799 7,858
% (95% CI) 51.7 (50.5; 52.8)
Northern Ireland N 3,752 5,245 8,997
% (95% CI) 41.7 (40.7; 42.7)
Scotland N 3,642 3,652 7,294
% (95% CI) 49.9 (48.8; 51.1)
Wales N 4,755 4,817 9,572
% (95% CI) 49.7 (48.7; 50.7)
Total N 16,208 17,513 33,721
% (95% CI) 48.1 (47.5; 48.6)
Figure 4.12: Number of completed interviews by month
0
200
400
600
800
1000
1200
1400
1600
02 03 04 05 06 07 08 09 10 11 12 01 02 03 04 05 06 07 08
2008 2009
Nu
mb
er
of i
nte
rvie
ws
com
ple
ted
in m
on
th
Year and month of interview
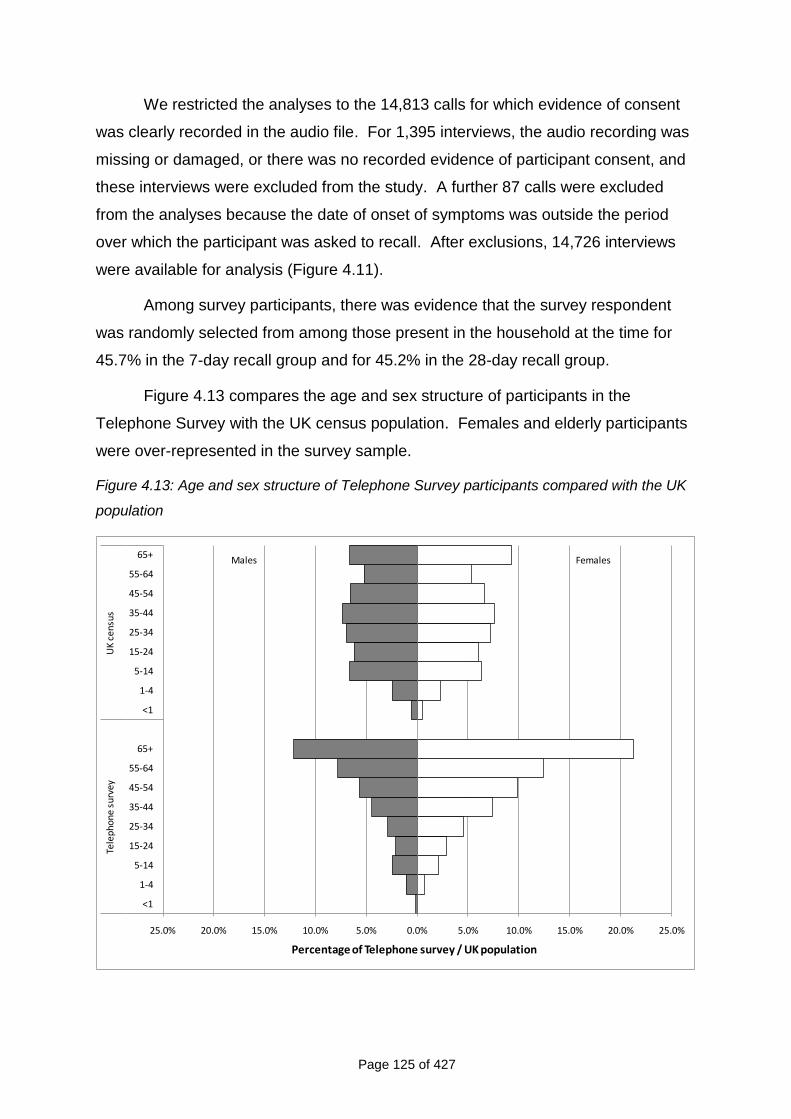
Page 125 of 427
We restricted the analyses to the 14,813 calls for which evidence of consent
was clearly recorded in the audio file. For 1,395 interviews, the audio recording was
missing or damaged, or there was no recorded evidence of participant consent, and
these interviews were excluded from the study. A further 87 calls were excluded
from the analyses because the date of onset of symptoms was outside the period
over which the participant was asked to recall. After exclusions, 14,726 interviews
were available for analysis (Figure 4.11).
Among survey participants, there was evidence that the survey respondent
was randomly selected from among those present in the household at the time for
45.7% in the 7-day recall group and for 45.2% in the 28-day recall group.
Figure 4.13 compares the age and sex structure of participants in the
Telephone Survey with the UK census population. Females and elderly participants
were over-represented in the survey sample.
Figure 4.13: Age and sex structure of Telephone Survey participants compared with the UK
population
25.0% 20.0% 15.0% 10.0% 5.0% 0.0% 5.0% 10.0% 15.0% 20.0% 25.0%
<1
1-4
5-14
15-24
25-34
35-44
45-54
55-64
65+
<1
1-4
5-14
15-24
25-34
35-44
45-54
55-64
65+
Tele
phon
e su
rvey
UK
cens
us
Percentage of Telephone survey / UK population
Males Females
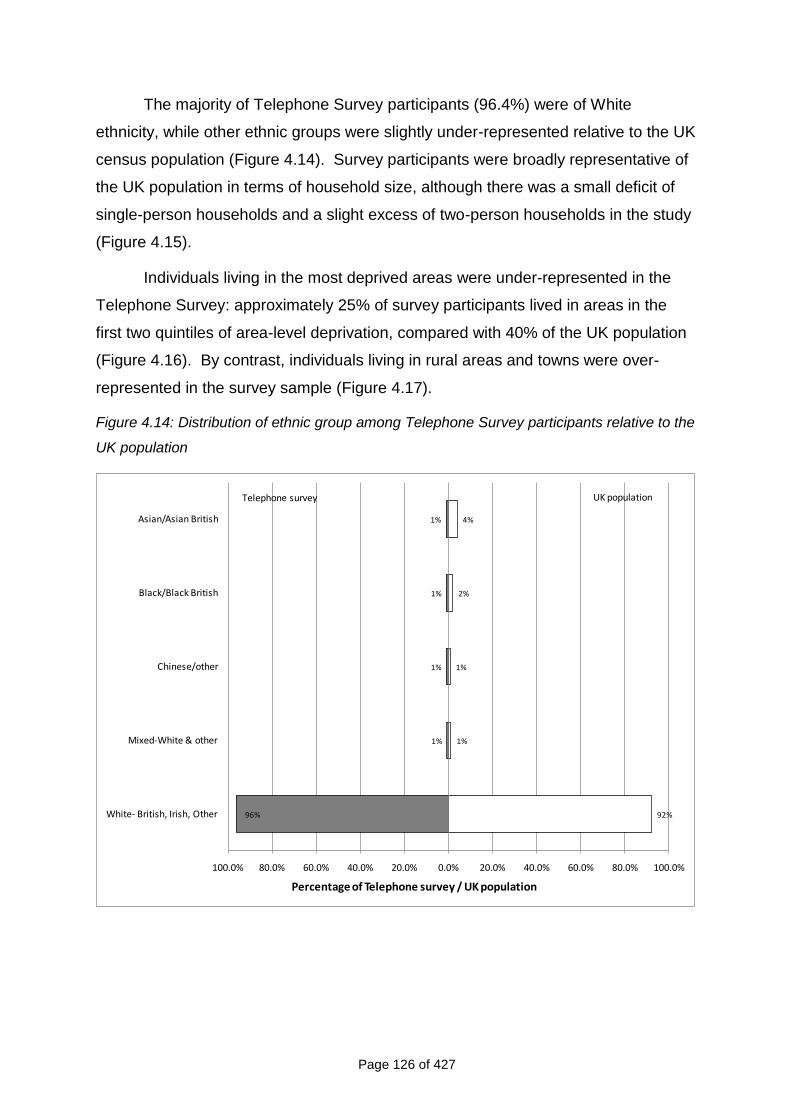
Page 126 of 427
The majority of Telephone Survey participants (96.4%) were of White
ethnicity, while other ethnic groups were slightly under-represented relative to the UK
census population (Figure 4.14). Survey participants were broadly representative of
the UK population in terms of household size, although there was a small deficit of
single-person households and a slight excess of two-person households in the study
(Figure 4.15).
Individuals living in the most deprived areas were under-represented in the
Telephone Survey: approximately 25% of survey participants lived in areas in the
first two quintiles of area-level deprivation, compared with 40% of the UK population
(Figure 4.16). By contrast, individuals living in rural areas and towns were over-
represented in the survey sample (Figure 4.17).
Figure 4.14: Distribution of ethnic group among Telephone Survey participants relative to the
UK population
1%
1%
1%
1%
96%
4%
2%
1%
1%
92%
100.0% 80.0% 60.0% 40.0% 20.0% 0.0% 20.0% 40.0% 60.0% 80.0% 100.0%
Asian/Asian British
Black/Black British
Chinese/other
Mixed-White & other
White- British, Irish, Other
Percentage of Telephone survey / UK population
Telephone survey UK population
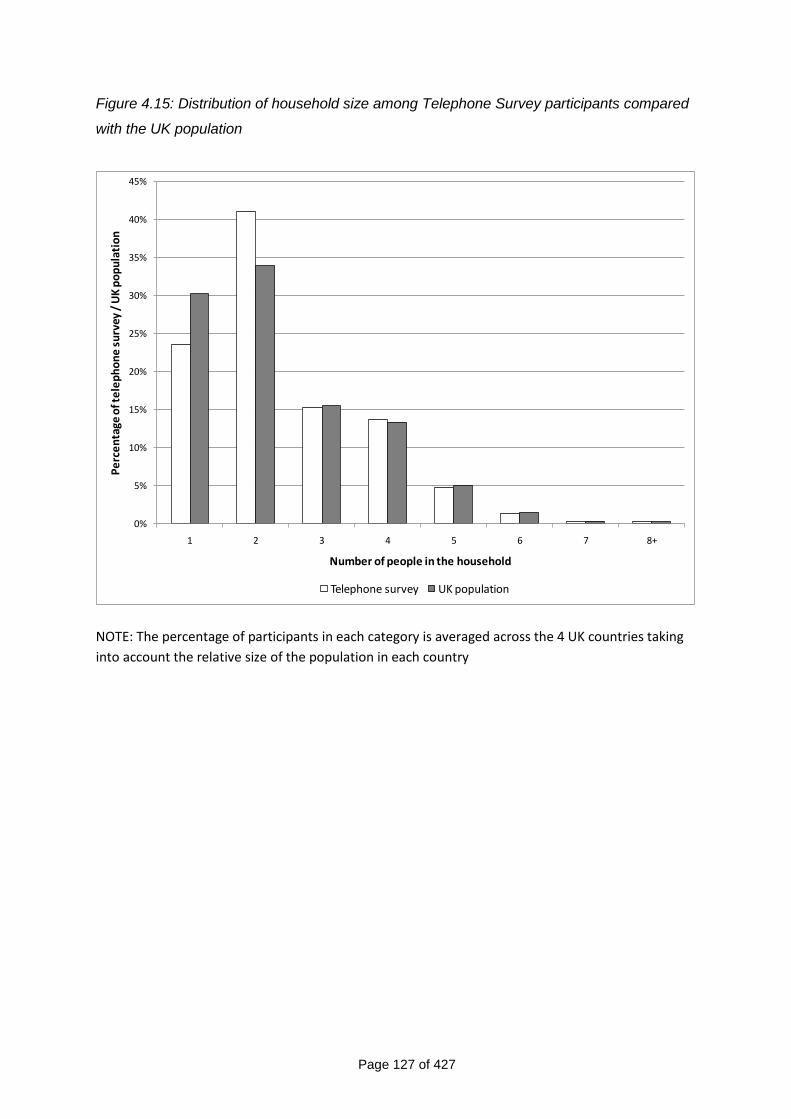
Page 127 of 427
Figure 4.15: Distribution of household size among Telephone Survey participants compared
with the UK population
0%
5%
10%
15%
20%
25%
30%
35%
40%
45%
1 2 3 4 5 6 7 8+
Pe
rce
nta
ge o
f te
lep
ho
ne
su
rvey
/ U
K p
op
ula
tio
n
Number of people in the household
Telephone survey UK population
NOTE: The percentage of participants in each category is averaged across the 4 UK countries taking
into account the relative size of the population in each country
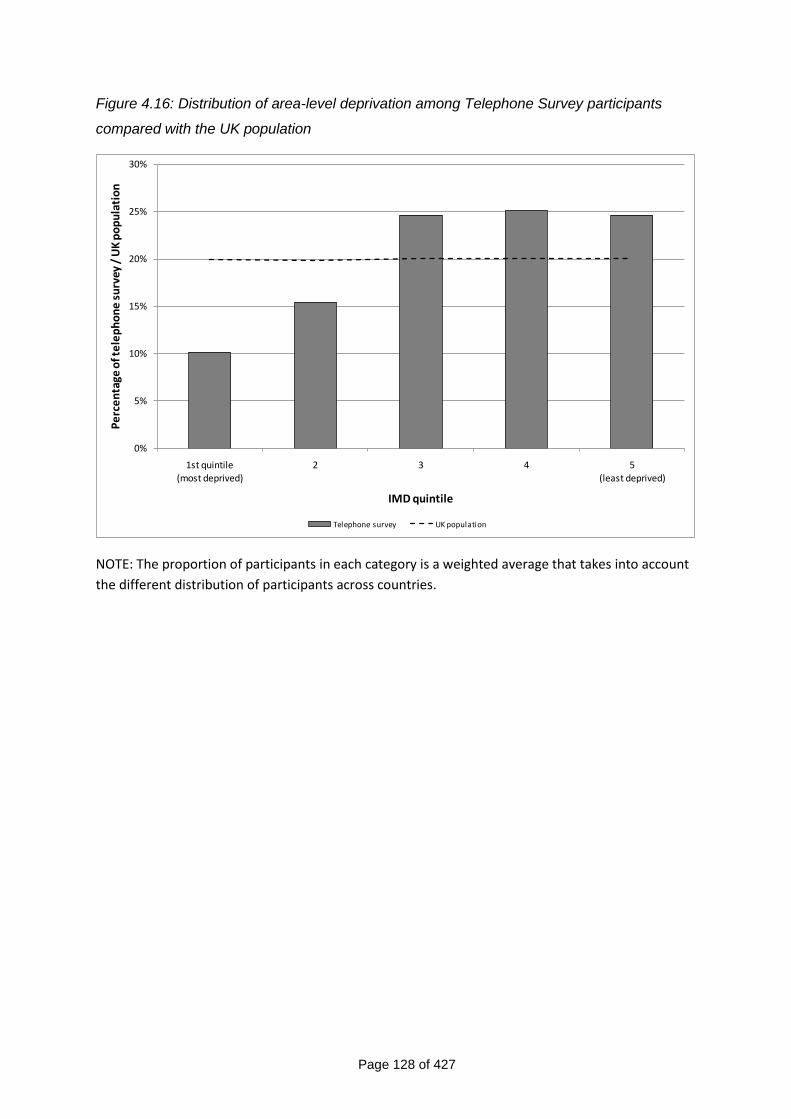
Page 128 of 427
Figure 4.16: Distribution of area-level deprivation among Telephone Survey participants
compared with the UK population
0%
5%
10%
15%
20%
25%
30%
1st quintile
(most deprived)
2 3 4 5
(least deprived)
Pe
rce
nta
ge o
f te
lep
ho
ne
su
rvey
/ U
K p
op
ula
tio
n
IMD quintile
Telephone survey UK population
NOTE: The proportion of participants in each category is a weighted average that takes into account
the different distribution of participants across countries.
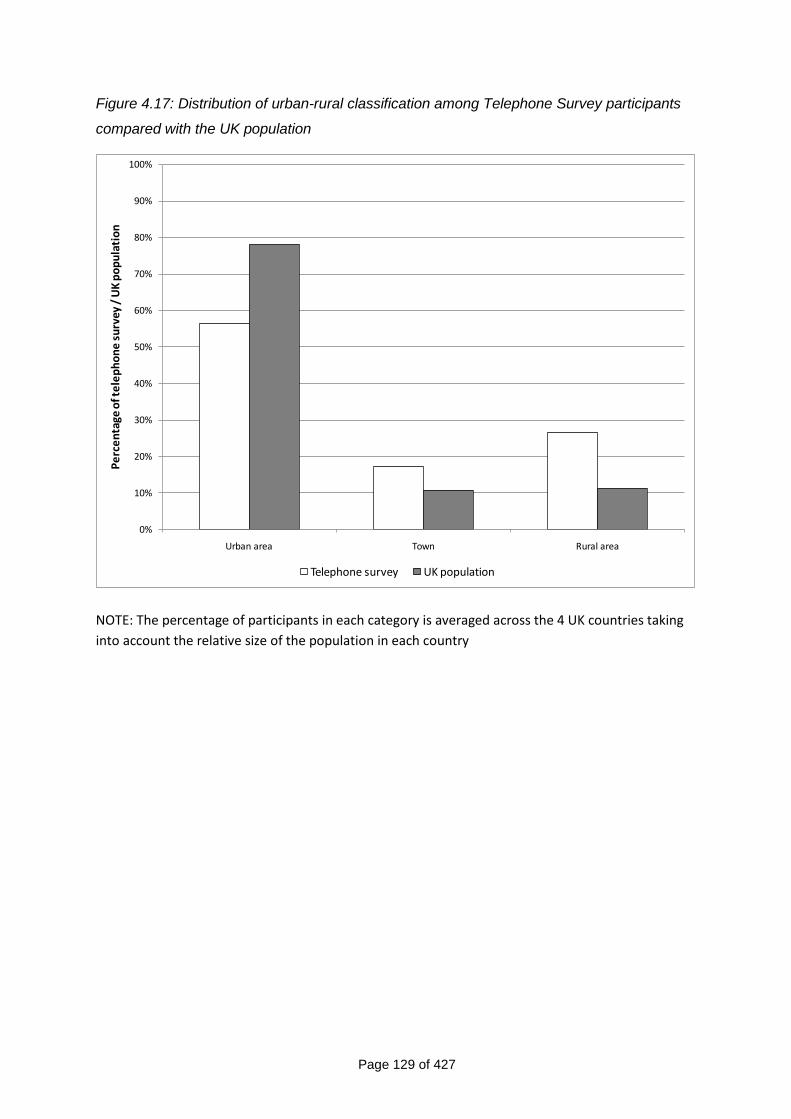
Page 129 of 427
Figure 4.17: Distribution of urban-rural classification among Telephone Survey participants
compared with the UK population
0%
10%
20%
30%
40%
50%
60%
70%
80%
90%
100%
Urban area Town Rural area
Pe
rce
nta
ge o
f te
lep
ho
ne
su
rvey
/ U
K p
op
ula
tio
n
Telephone survey UK population
NOTE: The percentage of participants in each category is averaged across the 4 UK countries taking
into account the relative size of the population in each country
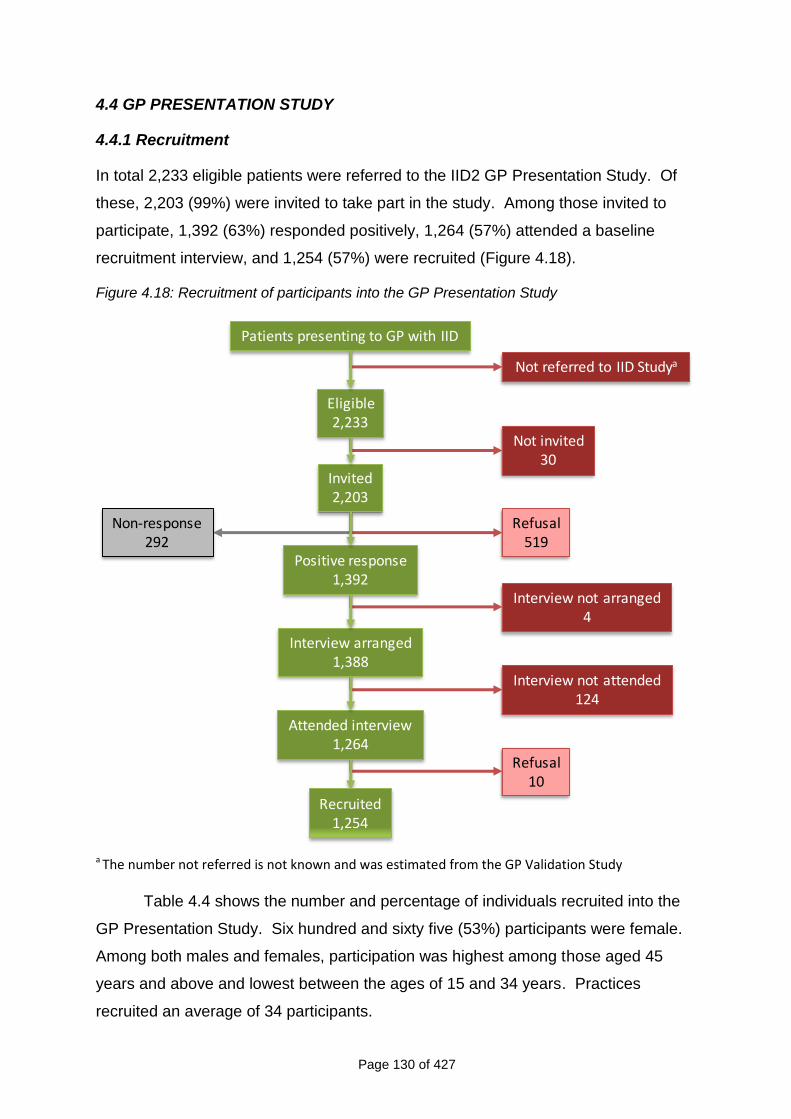
Page 130 of 427
4.4 GP PRESENTATION STUDY
4.4.1 Recruitment
In total 2,233 eligible patients were referred to the IID2 GP Presentation Study. Of
these, 2,203 (99%) were invited to take part in the study. Among those invited to
participate, 1,392 (63%) responded positively, 1,264 (57%) attended a baseline
recruitment interview, and 1,254 (57%) were recruited (Figure 4.18).
Figure 4.18: Recruitment of participants into the GP Presentation Study
Not referred to IID Studya
Not invited30
Refusal519
Interview not arranged4
Interview not attended124
Refusal10
Patients presenting to GP with IID
Eligible2,233
Invited2,203
Positive response1,392
Interview arranged1,388
Attended interview1,264
Non-response292
Recruited1,254
a The number not referred is not known and was estimated from the GP Validation Study
Table 4.4 shows the number and percentage of individuals recruited into the
GP Presentation Study. Six hundred and sixty five (53%) participants were female.
Among both males and females, participation was highest among those aged 45
years and above and lowest between the ages of 15 and 34 years. Practices
recruited an average of 34 participants.
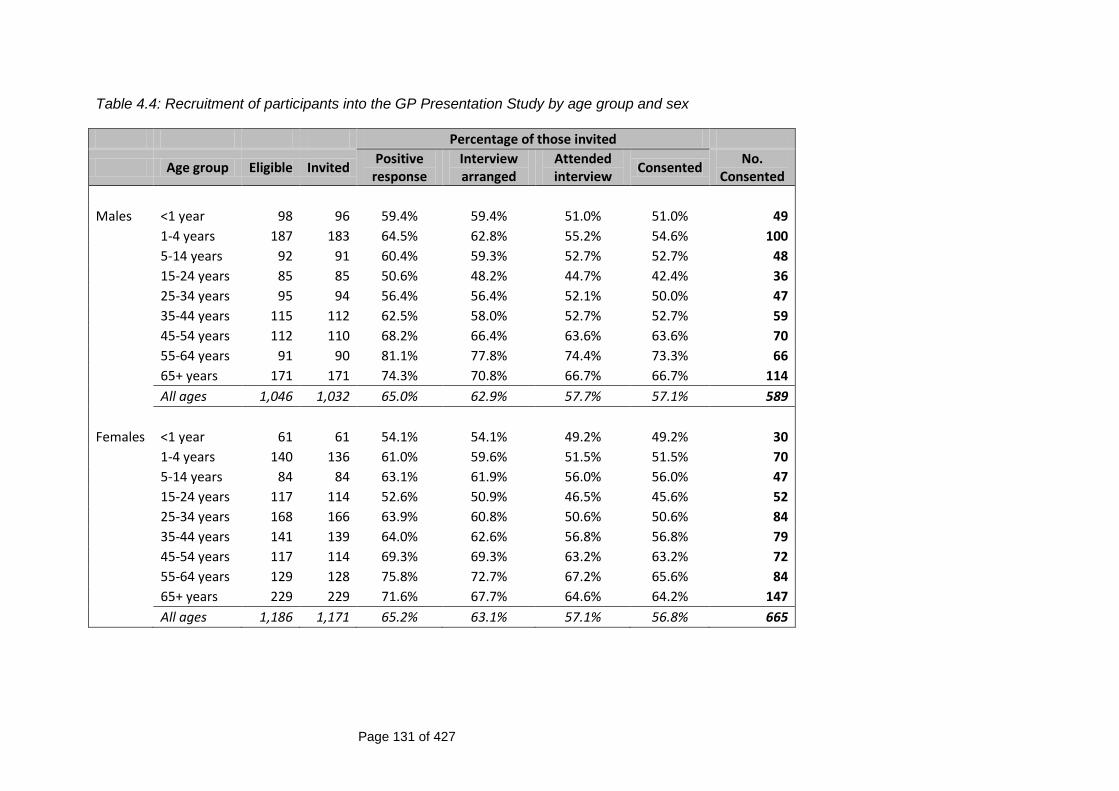
Page 131 of 427
Table 4.4: Recruitment of participants into the GP Presentation Study by age group and sex
Percentage of those invited
Age group Eligible Invited Positive
response Interview arranged
Attended interview
Consented No.
Consented
Males <1 year 98 96 59.4% 59.4% 51.0% 51.0% 49
1-4 years 187 183 64.5% 62.8% 55.2% 54.6% 100
5-14 years 92 91 60.4% 59.3% 52.7% 52.7% 48
15-24 years 85 85 50.6% 48.2% 44.7% 42.4% 36
25-34 years 95 94 56.4% 56.4% 52.1% 50.0% 47
35-44 years 115 112 62.5% 58.0% 52.7% 52.7% 59
45-54 years 112 110 68.2% 66.4% 63.6% 63.6% 70
55-64 years 91 90 81.1% 77.8% 74.4% 73.3% 66
65+ years 171 171 74.3% 70.8% 66.7% 66.7% 114
All ages 1,046 1,032 65.0% 62.9% 57.7% 57.1% 589
Females <1 year 61 61 54.1% 54.1% 49.2% 49.2% 30
1-4 years 140 136 61.0% 59.6% 51.5% 51.5% 70
5-14 years 84 84 63.1% 61.9% 56.0% 56.0% 47
15-24 years 117 114 52.6% 50.9% 46.5% 45.6% 52
25-34 years 168 166 63.9% 60.8% 50.6% 50.6% 84
35-44 years 141 139 64.0% 62.6% 56.8% 56.8% 79
45-54 years 117 114 69.3% 69.3% 63.2% 63.2% 72
55-64 years 129 128 75.8% 72.7% 67.2% 65.6% 84
65+ years 229 229 71.6% 67.7% 64.6% 64.2% 147
All ages 1,186 1,171 65.2% 63.1% 57.1% 56.8% 665
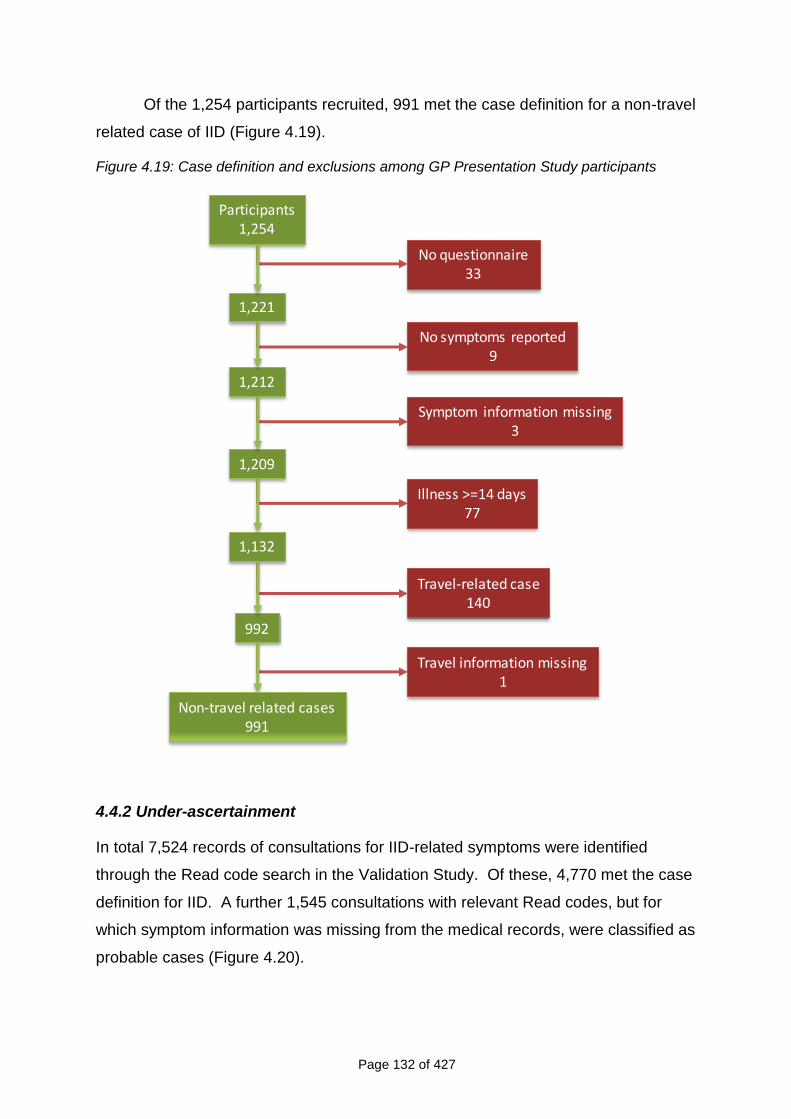
Page 132 of 427
Of the 1,254 participants recruited, 991 met the case definition for a non-travel
related case of IID (Figure 4.19).
Figure 4.19: Case definition and exclusions among GP Presentation Study participants
No questionnaire33
No symptoms reported9
Illness >=14 days77
Travel-related case140
Participants1,254
1,221
1,212
1,209
1,132
992
Non-travel related cases991
Symptom information missing3
Travel information missing1
4.4.2 Under-ascertainment
In total 7,524 records of consultations for IID-related symptoms were identified
through the Read code search in the Validation Study. Of these, 4,770 met the case
definition for IID. A further 1,545 consultations with relevant Read codes, but for
which symptom information was missing from the medical records, were classified as
probable cases (Figure 4.20).
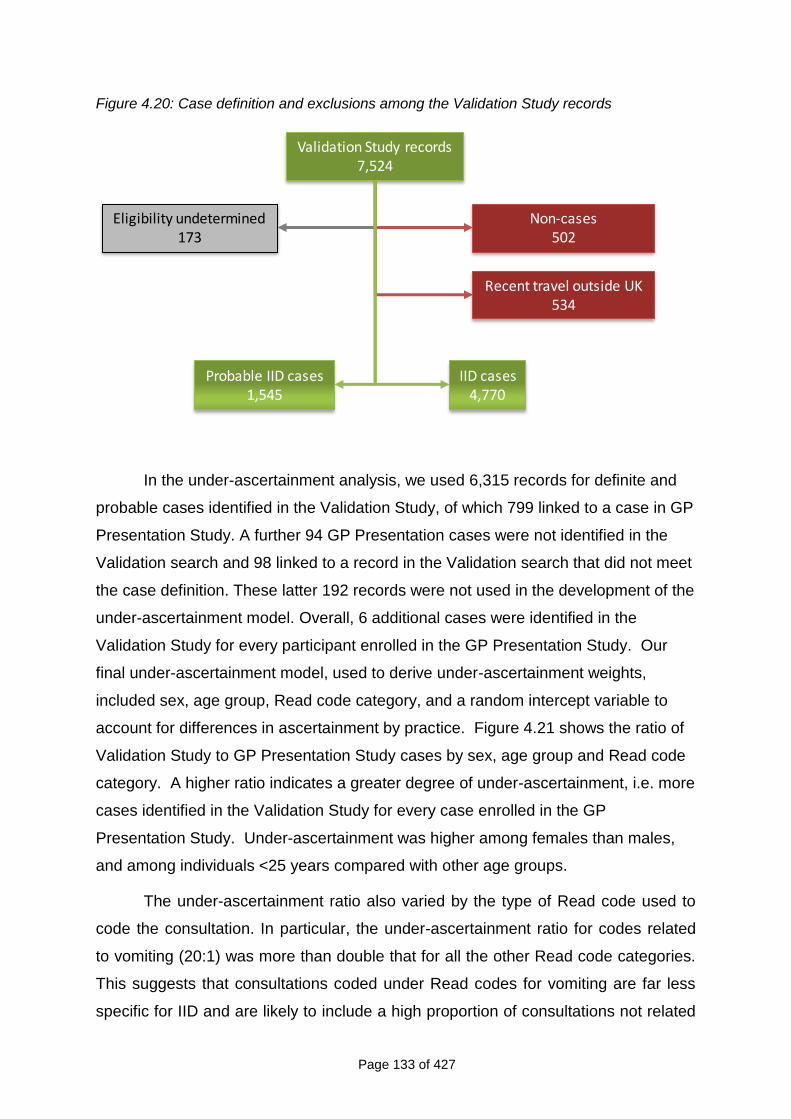
Page 133 of 427
Figure 4.20: Case definition and exclusions among the Validation Study records
Non-cases502
Validation Study records7,524
Eligibility undetermined173
IID cases4,770
Probable IID cases1,545
Recent travel outside UK534
In the under-ascertainment analysis, we used 6,315 records for definite and
probable cases identified in the Validation Study, of which 799 linked to a case in GP
Presentation Study. A further 94 GP Presentation cases were not identified in the
Validation search and 98 linked to a record in the Validation search that did not meet
the case definition. These latter 192 records were not used in the development of the
under-ascertainment model. Overall, 6 additional cases were identified in the
Validation Study for every participant enrolled in the GP Presentation Study. Our
final under-ascertainment model, used to derive under-ascertainment weights,
included sex, age group, Read code category, and a random intercept variable to
account for differences in ascertainment by practice. Figure 4.21 shows the ratio of
Validation Study to GP Presentation Study cases by sex, age group and Read code
category. A higher ratio indicates a greater degree of under-ascertainment, i.e. more
cases identified in the Validation Study for every case enrolled in the GP
Presentation Study. Under-ascertainment was higher among females than males,
and among individuals <25 years compared with other age groups.
The under-ascertainment ratio also varied by the type of Read code used to
code the consultation. In particular, the under-ascertainment ratio for codes related
to vomiting (20:1) was more than double that for all the other Read code categories.
This suggests that consultations coded under Read codes for vomiting are far less
specific for IID and are likely to include a high proportion of consultations not related
Page 134 of 427
to IID. For this reason, for records with a Read code of “Vomiting”, we used as the
weights the mean under-ascertainment ratio across all other Read code categories
instead. We thus made the assumption that for the fraction of consultations for
“Vomiting” that was truly related to IID, the under-ascertainment ratio was similar to
that for IID consultations coded under other categories of Read code (such as
“Diarrhoea and vomiting” or “Gastroenteritis”).
The under-ascertainment weights were applied to the 991 definite cases
identified in the GP Presentation Study to compute the incidence. For the 192 GP
Presentation records that were not used in developing the under-ascertainment
model, we used the model-estimated weights for records in the same practice and in
the corresponding stratum of age group, sex and Read code category. If no records
in the same stratum occurred in that practice, then the mean of the weights across
all other practices was applied.
It was not possible to assess misclassification amongst GP Presentation
cases. Where GP Presentation cases did not link to a validation record this was
often because the consultation had not been coded, or had been coded as
something else. However, all the GP Presentation cases used in the analysis met
the case definition.
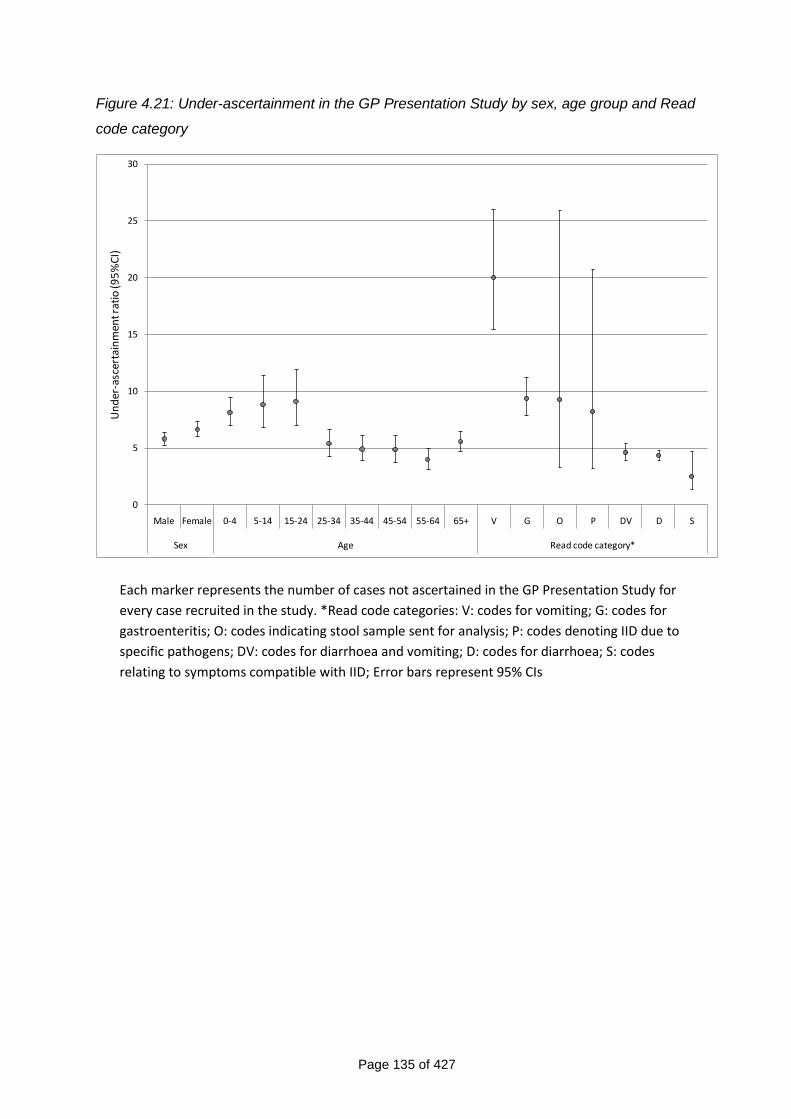
Page 135 of 427
Figure 4.21: Under-ascertainment in the GP Presentation Study by sex, age group and Read
code category
0
5
10
15
20
25
30
Male Female 0-4 5-14 15-24 25-34 35-44 45-54 55-64 65+ V G O P DV D S
Sex Age Read code category*
Un
der
-asc
erta
inm
ent r
atio
(95
%C
I)
Each marker represents the number of cases not ascertained in the GP Presentation Study for
every case recruited in the study. *Read code categories: V: codes for vomiting; G: codes for
gastroenteritis; O: codes indicating stool sample sent for analysis; P: codes denoting IID due to
specific pathogens; DV: codes for diarrhoea and vomiting; D: codes for diarrhoea; S: codes
relating to symptoms compatible with IID; Error bars represent 95% CIs
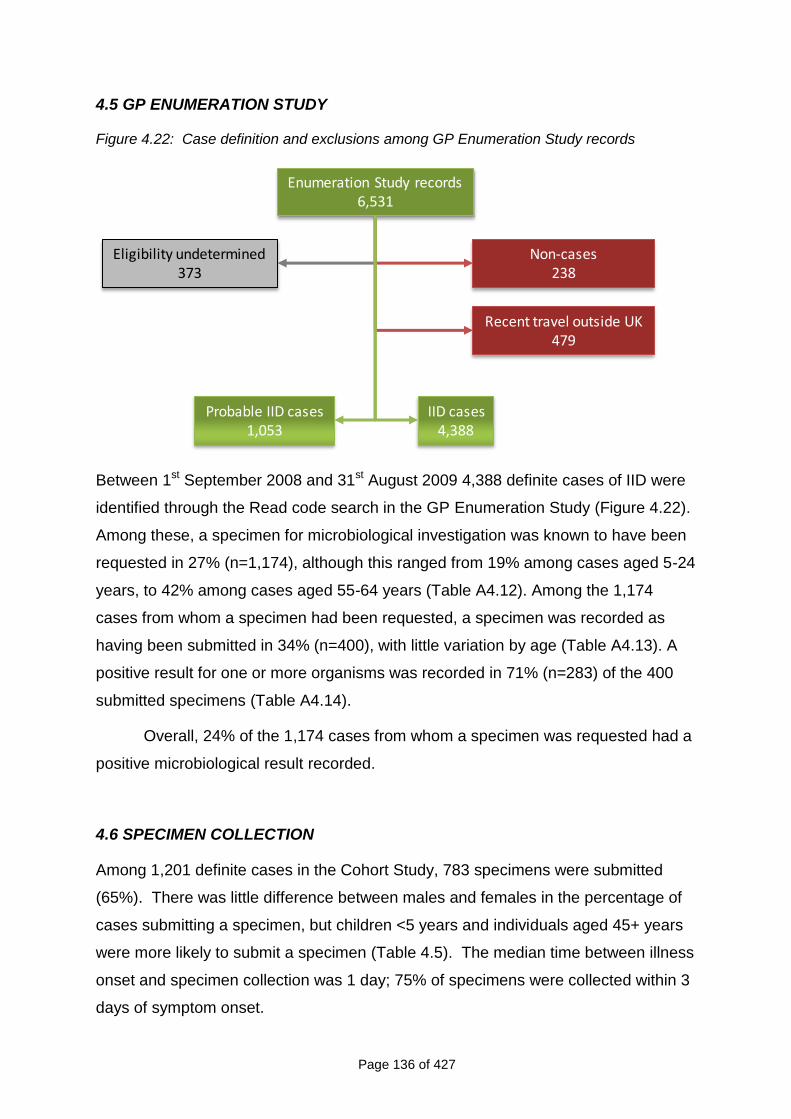
Page 136 of 427
4.5 GP ENUMERATION STUDY
Figure 4.22: Case definition and exclusions among GP Enumeration Study records
Non-cases238
Enumeration Study records6,531
Eligibility undetermined373
IID cases4,388
Probable IID cases1,053
Recent travel outside UK479
Between 1st September 2008 and 31st August 2009 4,388 definite cases of IID were
identified through the Read code search in the GP Enumeration Study (Figure 4.22).
Among these, a specimen for microbiological investigation was known to have been
requested in 27% (n=1,174), although this ranged from 19% among cases aged 5-24
years, to 42% among cases aged 55-64 years (Table A4.12). Among the 1,174
cases from whom a specimen had been requested, a specimen was recorded as
having been submitted in 34% (n=400), with little variation by age (Table A4.13). A
positive result for one or more organisms was recorded in 71% (n=283) of the 400
submitted specimens (Table A4.14).
Overall, 24% of the 1,174 cases from whom a specimen was requested had a
positive microbiological result recorded.
4.6 SPECIMEN COLLECTION
Among 1,201 definite cases in the Cohort Study, 783 specimens were submitted
(65%). There was little difference between males and females in the percentage of
cases submitting a specimen, but children <5 years and individuals aged 45+ years
were more likely to submit a specimen (Table 4.5). The median time between illness
onset and specimen collection was 1 day; 75% of specimens were collected within 3
days of symptom onset.
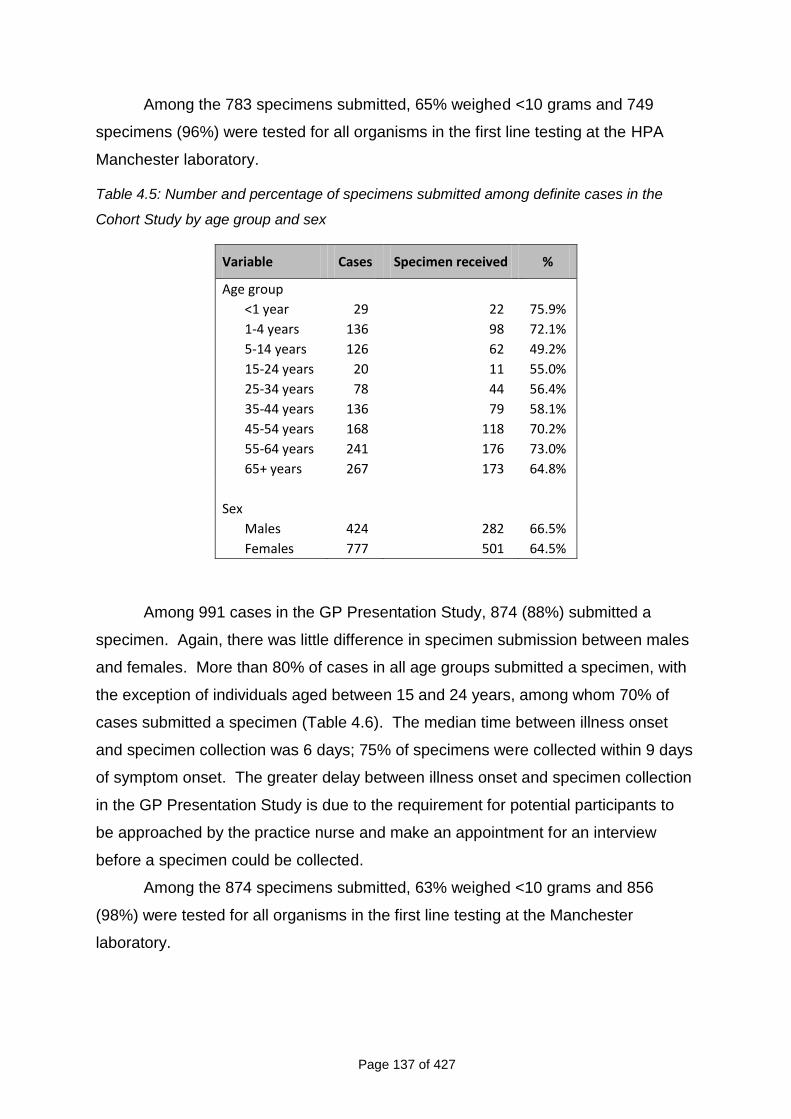
Page 137 of 427
Among the 783 specimens submitted, 65% weighed <10 grams and 749
specimens (96%) were tested for all organisms in the first line testing at the HPA
Manchester laboratory.
Table 4.5: Number and percentage of specimens submitted among definite cases in the
Cohort Study by age group and sex
Variable Cases Specimen received %
Age group
<1 year 29 22 75.9%
1-4 years 136 98 72.1%
5-14 years 126 62 49.2%
15-24 years 20 11 55.0%
25-34 years 78 44 56.4%
35-44 years 136 79 58.1%
45-54 years 168 118 70.2%
55-64 years 241 176 73.0%
65+ years 267 173 64.8%
Sex
Males 424 282 66.5%
Females 777 501 64.5%
Among 991 cases in the GP Presentation Study, 874 (88%) submitted a
specimen. Again, there was little difference in specimen submission between males
and females. More than 80% of cases in all age groups submitted a specimen, with
the exception of individuals aged between 15 and 24 years, among whom 70% of
cases submitted a specimen (Table 4.6). The median time between illness onset
and specimen collection was 6 days; 75% of specimens were collected within 9 days
of symptom onset. The greater delay between illness onset and specimen collection
in the GP Presentation Study is due to the requirement for potential participants to
be approached by the practice nurse and make an appointment for an interview
before a specimen could be collected.
Among the 874 specimens submitted, 63% weighed <10 grams and 856
(98%) were tested for all organisms in the first line testing at the Manchester
laboratory.
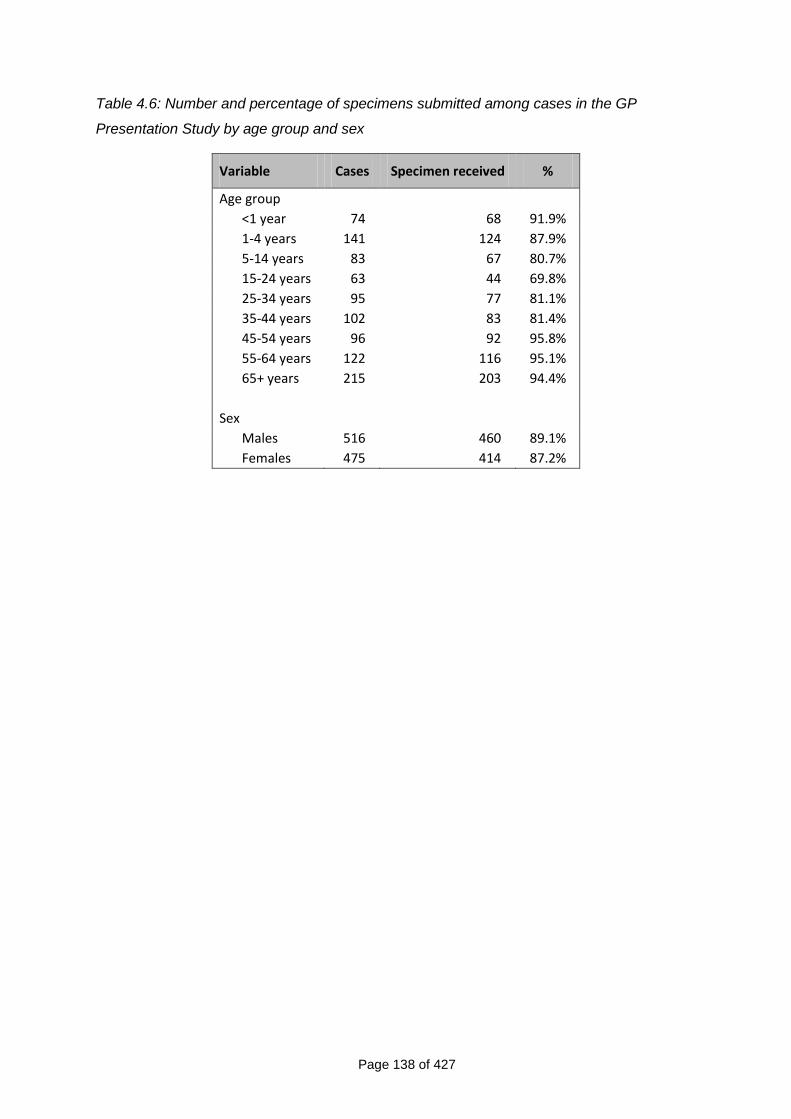
Page 138 of 427
Table 4.6: Number and percentage of specimens submitted among cases in the GP
Presentation Study by age group and sex
Variable Cases Specimen received %
Age group
<1 year 74 68 91.9%
1-4 years 141 124 87.9%
5-14 years 83 67 80.7%
15-24 years 63 44 69.8%
25-34 years 95 77 81.1%
35-44 years 102 83 81.4%
45-54 years 96 92 95.8%
55-64 years 122 116 95.1%
65+ years 215 203 94.4%
Sex
Males 516 460 89.1%
Females 475 414 87.2%
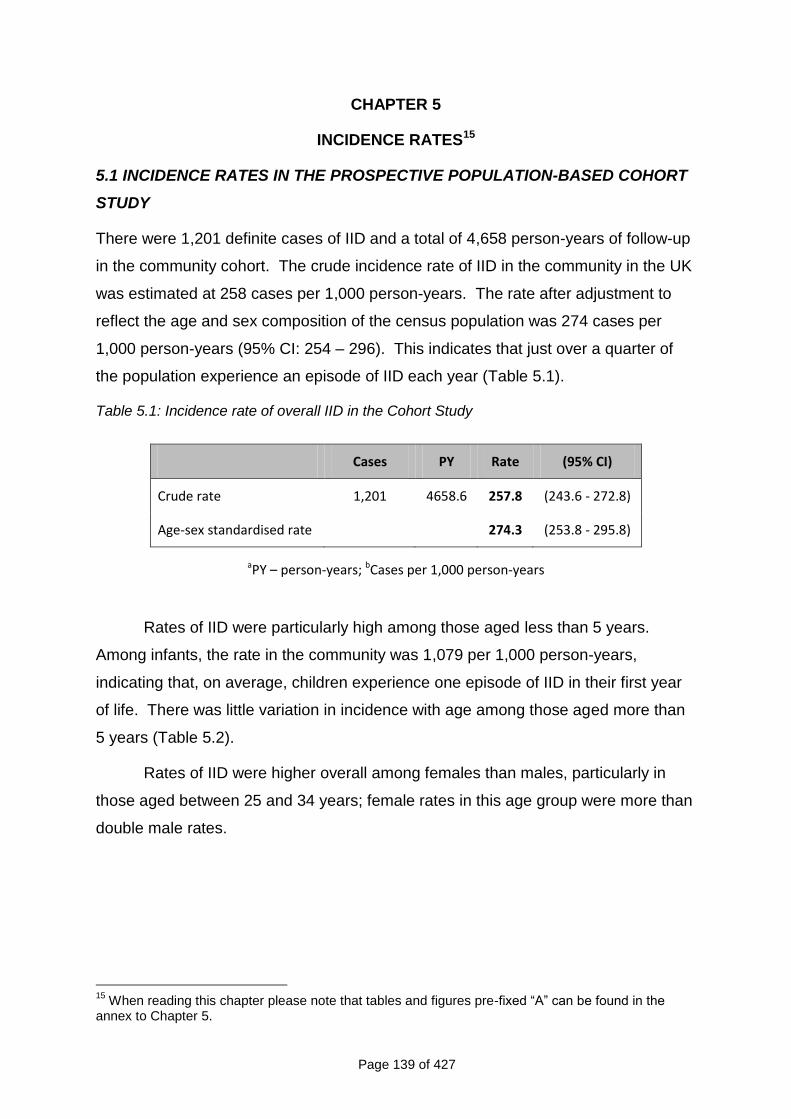
Page 139 of 427
CHAPTER 5
INCIDENCE RATES15
5.1 INCIDENCE RATES IN THE PROSPECTIVE POPULATION-BASED COHORT
STUDY
There were 1,201 definite cases of IID and a total of 4,658 person-years of follow-up
in the community cohort. The crude incidence rate of IID in the community in the UK
was estimated at 258 cases per 1,000 person-years. The rate after adjustment to
reflect the age and sex composition of the census population was 274 cases per
1,000 person-years (95% CI: 254 – 296). This indicates that just over a quarter of
the population experience an episode of IID each year (Table 5.1).
Table 5.1: Incidence rate of overall IID in the Cohort Study
Cases PY Rate (95% CI)
Crude rate 1,201 4658.6 257.8 (243.6 - 272.8)
Age-sex standardised rate 274.3 (253.8 - 295.8)
aPY – person-years; bCases per 1,000 person-years
Rates of IID were particularly high among those aged less than 5 years.
Among infants, the rate in the community was 1,079 per 1,000 person-years,
indicating that, on average, children experience one episode of IID in their first year
of life. There was little variation in incidence with age among those aged more than
5 years (Table 5.2).
Rates of IID were higher overall among females than males, particularly in
those aged between 25 and 34 years; female rates in this age group were more than
double male rates.
15
When reading this chapter please note that tables and figures pre-fixed “A” can be found in the annex to Chapter 5.
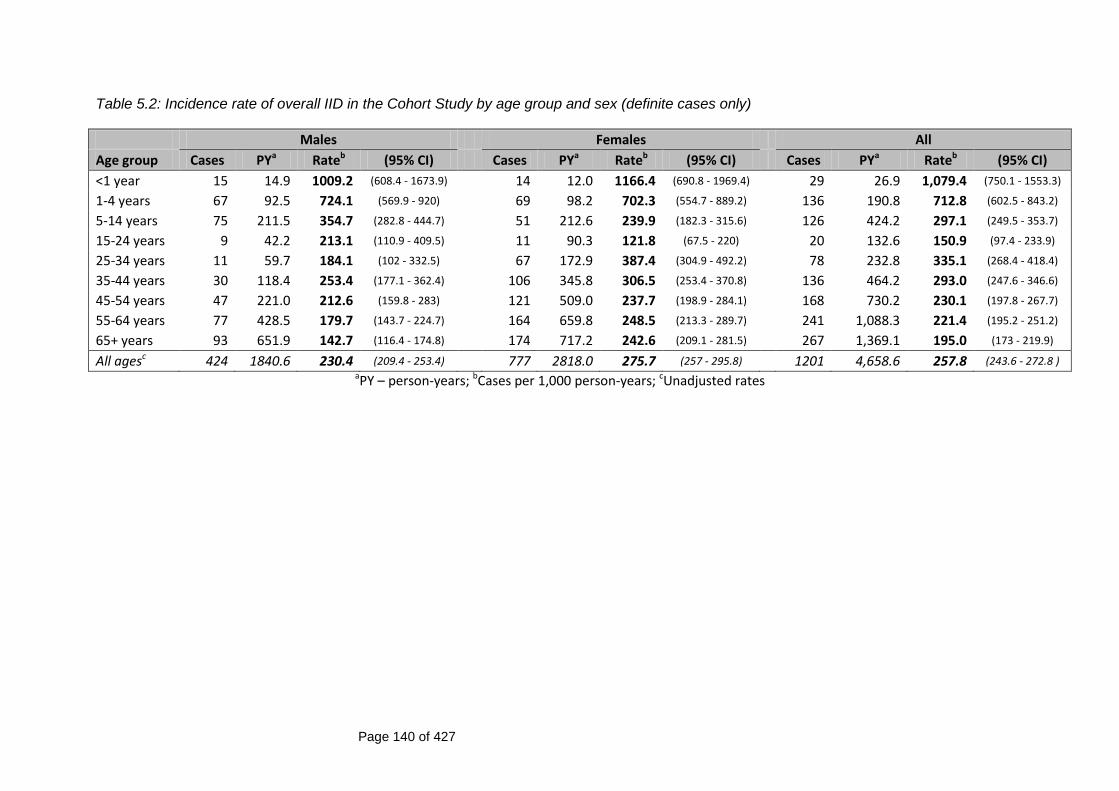
Page 140 of 427
Table 5.2: Incidence rate of overall IID in the Cohort Study by age group and sex (definite cases only)
Males Females All
Age group Cases PYa Rateb (95% CI) Cases PYa Rateb (95% CI) Cases PYa Rateb (95% CI)
<1 year 15 14.9 1009.2 (608.4 - 1673.9) 14 12.0 1166.4 (690.8 - 1969.4) 29 26.9 1,079.4 (750.1 - 1553.3)
1-4 years 67 92.5 724.1 (569.9 - 920) 69 98.2 702.3 (554.7 - 889.2) 136 190.8 712.8 (602.5 - 843.2)
5-14 years 75 211.5 354.7 (282.8 - 444.7) 51 212.6 239.9 (182.3 - 315.6) 126 424.2 297.1 (249.5 - 353.7)
15-24 years 9 42.2 213.1 (110.9 - 409.5) 11 90.3 121.8 (67.5 - 220) 20 132.6 150.9 (97.4 - 233.9)
25-34 years 11 59.7 184.1 (102 - 332.5) 67 172.9 387.4 (304.9 - 492.2) 78 232.8 335.1 (268.4 - 418.4)
35-44 years 30 118.4 253.4 (177.1 - 362.4) 106 345.8 306.5 (253.4 - 370.8) 136 464.2 293.0 (247.6 - 346.6)
45-54 years 47 221.0 212.6 (159.8 - 283) 121 509.0 237.7 (198.9 - 284.1) 168 730.2 230.1 (197.8 - 267.7)
55-64 years 77 428.5 179.7 (143.7 - 224.7) 164 659.8 248.5 (213.3 - 289.7) 241 1,088.3 221.4 (195.2 - 251.2)
65+ years 93 651.9 142.7 (116.4 - 174.8) 174 717.2 242.6 (209.1 - 281.5) 267 1,369.1 195.0 (173 - 219.9)
All agesc 424 1840.6 230.4 (209.4 - 253.4) 777 2818.0 275.7 (257 - 295.8) 1201 4,658.6 257.8 (243.6 - 272.8 ) aPY – person-years; bCases per 1,000 person-years; cUnadjusted rates
Page 141 of 427
After adjusting for age and sex, there was little evidence of variation in IID
rates by type of follow-up (email or postcard), area-level deprivation, urban-rural
classification or socioeconomic classification, although for the latter, there was some
evidence that the rate in the lower supervisory and technical occupations group was
lower when compared with the rate in the Managerial and professional occupations
group. Those belonging to non-White ethnic groups reported lower rates of IID,
although there were very few participants in these groups and the uncertainty in the
corresponding rate estimates was high (Figure A5.1).
The rate of IID decreased with time in study. Among participants who were in
the study for <26 weeks, the rate of IID was 442 cases per 1,000 person-years (95%
CI: 370 – 533). Among those who were in the study for 26 weeks or more, the rate
in the first 26 weeks was 282 cases per 1,000 person-years (95% CI: 257 – 311),
while the rate after 26 weeks was 198 cases per 1,000 person-years (95% CI: 74 –
227) (Figure A5.2). There was a gradual decrease in the rate by week of follow-up
(Figure A5.3)
When both definite and possible cases were considered, the crude rate
estimate was 464 cases per 1,000 person-years. After standardising for age and
sex, this estimate rose to 523 cases per 1,000 person-years. The difference
between crude and standardised rates arises because individuals in certain age
groups were more likely to be missing a questionnaire and hence be classified as
possible cases, despite reporting a higher frequency of episodes of diarrhoea and/or
vomiting.
5.2 INCIDENCE RATES IN THE TELEPHONE SURVEY
The estimates of IID incidence in the Telephone Survey for the 7-day and 28-day
recall groups are shown in Table 5.3 Among participants in the 7-day recall group,
there were a total of 300 cases and 212 person-years, resulting in a crude incidence
of IID of 1,414 cases per 1,000 person-years (95% CI: 1263 – 1583). Among the 28-
day recall group, 107 cases occurred in 158 person-years, giving a crude incidence
of IID of 676 cases per 1,000 person-years (95% CI: 559 – 817). After standardising
for age and sex, and adjusting for the number of interviews completed each month
and the relative size of each UK country, the estimated rate of IID in the 7-day recall
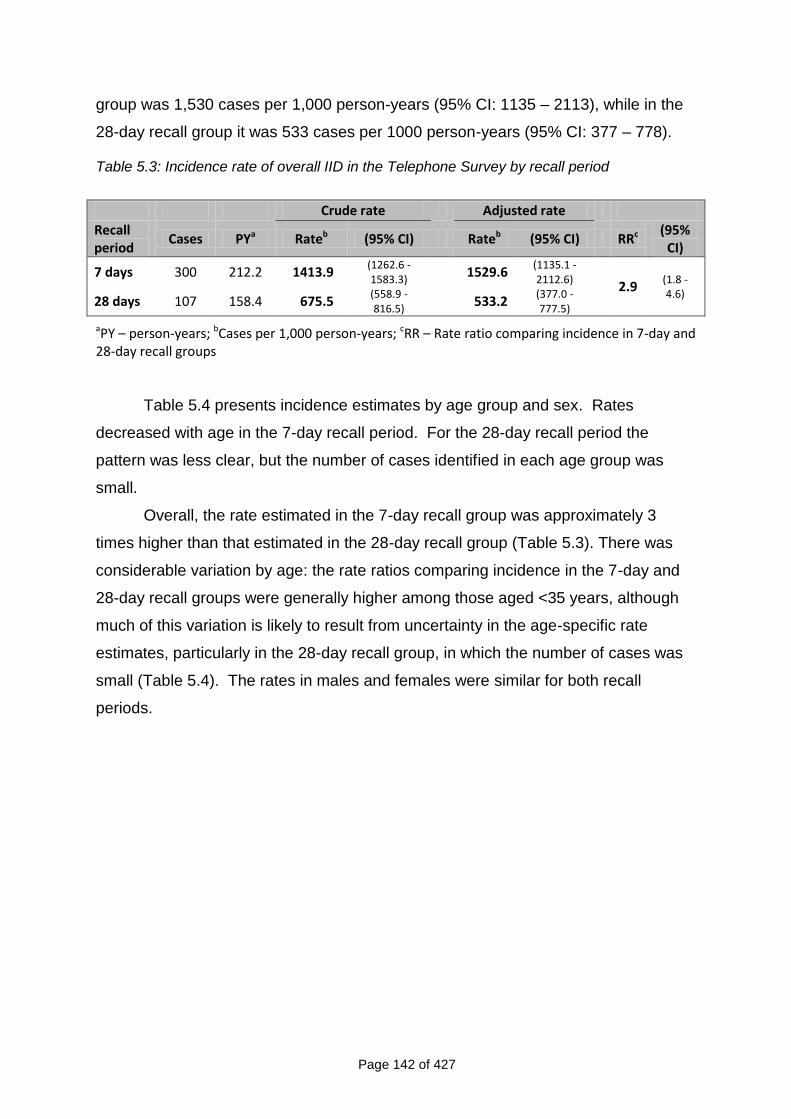
Page 142 of 427
group was 1,530 cases per 1,000 person-years (95% CI: 1135 – 2113), while in the
28-day recall group it was 533 cases per 1000 person-years (95% CI: 377 – 778).
Table 5.3: Incidence rate of overall IID in the Telephone Survey by recall period
Crude rate Adjusted rate
Recall period
Cases PYa Rateb (95% CI) Rateb (95% CI) RRc (95% CI)
7 days 300 212.2 1413.9 (1262.6 - 1583.3)
1529.6 (1135.1 - 2112.6)
2.9
(1.8 - 4.6)
28 days 107 158.4 675.5 (558.9 - 816.5)
533.2 (377.0 - 777.5)
aPY – person-years; bCases per 1,000 person-years; cRR – Rate ratio comparing incidence in 7-day and 28-day recall groups
Table 5.4 presents incidence estimates by age group and sex. Rates
decreased with age in the 7-day recall period. For the 28-day recall period the
pattern was less clear, but the number of cases identified in each age group was
small.
Overall, the rate estimated in the 7-day recall group was approximately 3
times higher than that estimated in the 28-day recall group (Table 5.3). There was
considerable variation by age: the rate ratios comparing incidence in the 7-day and
28-day recall groups were generally higher among those aged <35 years, although
much of this variation is likely to result from uncertainty in the age-specific rate
estimates, particularly in the 28-day recall group, in which the number of cases was
small (Table 5.4). The rates in males and females were similar for both recall
periods.
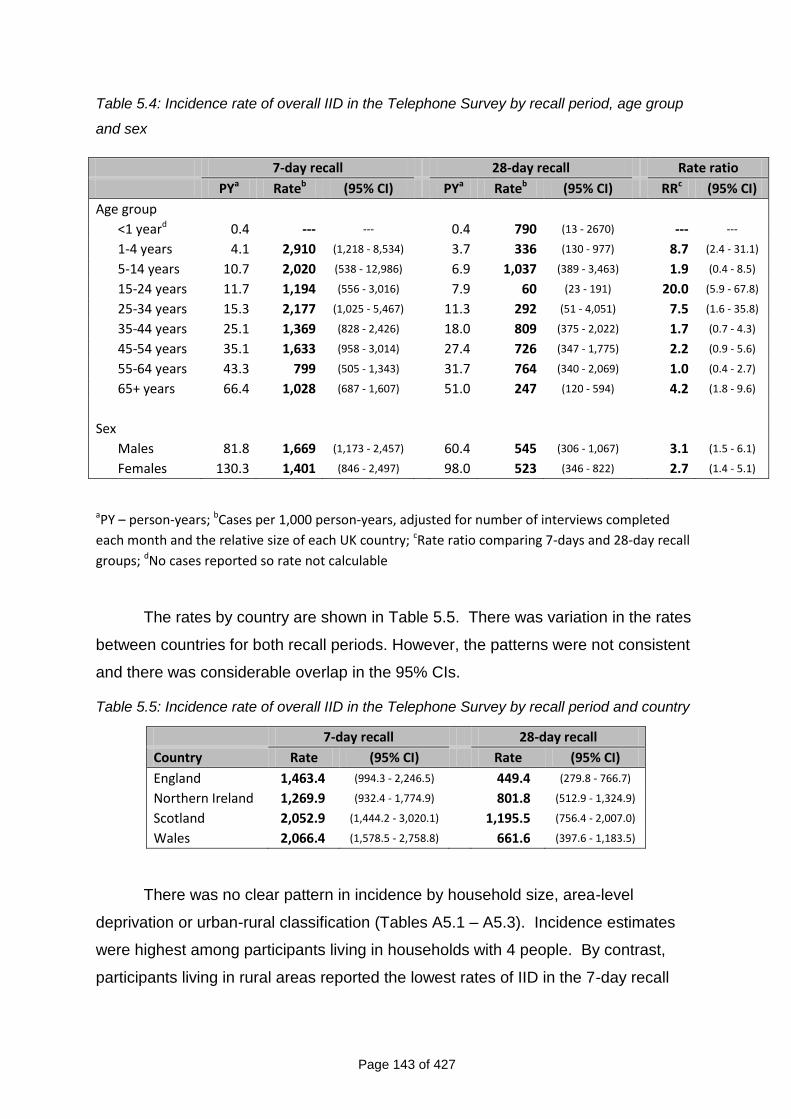
Page 143 of 427
Table 5.4: Incidence rate of overall IID in the Telephone Survey by recall period, age group
and sex
aPY – person-years; bCases per 1,000 person-years, adjusted for number of interviews completed
each month and the relative size of each UK country; cRate ratio comparing 7-days and 28-day recall
groups; dNo cases reported so rate not calculable
The rates by country are shown in Table 5.5. There was variation in the rates
between countries for both recall periods. However, the patterns were not consistent
and there was considerable overlap in the 95% CIs.
Table 5.5: Incidence rate of overall IID in the Telephone Survey by recall period and country
7-day recall 28-day recall
Country Rate (95% CI) Rate (95% CI)
England 1,463.4 (994.3 - 2,246.5) 449.4 (279.8 - 766.7)
Northern Ireland 1,269.9 (932.4 - 1,774.9) 801.8 (512.9 - 1,324.9)
Scotland 2,052.9 (1,444.2 - 3,020.1) 1,195.5 (756.4 - 2,007.0)
Wales 2,066.4 (1,578.5 - 2,758.8) 661.6 (397.6 - 1,183.5)
There was no clear pattern in incidence by household size, area-level
deprivation or urban-rural classification (Tables A5.1 – A5.3). Incidence estimates
were highest among participants living in households with 4 people. By contrast,
participants living in rural areas reported the lowest rates of IID in the 7-day recall
7-day recall 28-day recall Rate ratio
PYa Rateb (95% CI) PYa Rateb (95% CI) RRc (95% CI)
Age group
<1 yeard 0.4 --- --- 0.4 790 (13 - 2670) --- ---
1-4 years 4.1 2,910 (1,218 - 8,534) 3.7 336 (130 - 977) 8.7 (2.4 - 31.1)
5-14 years 10.7 2,020 (538 - 12,986) 6.9 1,037 (389 - 3,463) 1.9 (0.4 - 8.5)
15-24 years 11.7 1,194 (556 - 3,016) 7.9 60 (23 - 191) 20.0 (5.9 - 67.8)
25-34 years 15.3 2,177 (1,025 - 5,467) 11.3 292 (51 - 4,051) 7.5 (1.6 - 35.8)
35-44 years 25.1 1,369 (828 - 2,426) 18.0 809 (375 - 2,022) 1.7 (0.7 - 4.3)
45-54 years 35.1 1,633 (958 - 3,014) 27.4 726 (347 - 1,775) 2.2 (0.9 - 5.6)
55-64 years 43.3 799 (505 - 1,343) 31.7 764 (340 - 2,069) 1.0 (0.4 - 2.7)
65+ years 66.4 1,028 (687 - 1,607) 51.0 247 (120 - 594) 4.2 (1.8 - 9.6)
Sex
Males 81.8 1,669 (1,173 - 2,457) 60.4 545 (306 - 1,067) 3.1 (1.5 - 6.1)
Females 130.3 1,401 (846 - 2,497) 98.0 523 (346 - 822) 2.7 (1.4 - 5.1)
Page 144 of 427
group, but the highest rates in the 28-day recall group. It should be noted, however,
that there was considerable uncertainty around these rate estimates.
For both the 7-day and 28-day recall, there was evidence of variation in recall
of IID symptoms according to time since illness onset. Participants reported a higher
number of episodes with onset in the 3 days prior to interview, but there was a rapid
decline in the number of episodes reported with onset beyond this period (Figure
A5.4). For the 28-day recall group, there was also clear evidence of digit preference,
with a greater number of episodes reported with onset 7, 14 and 21 days prior to the
date of interview than on other days.
5.3 COMPARING INCIDENCE RATES OF OVERALL IID IN THE PROSPECTIVE
POPULATION-BASED COHORT STUDY AND TELEPHONE SURVEY
Figure 5.1 compares the age-specific estimates of IID incidence in the Cohort Study
and Telephone Survey. Incidence rates decreased with age until the ages of 15 to
24 years, with a subsequent secondary peak in adults between 25 and 44 years.
For all age groups, incidence estimates were higher in the 7-day recall
Telephone Survey component than in all the other components.
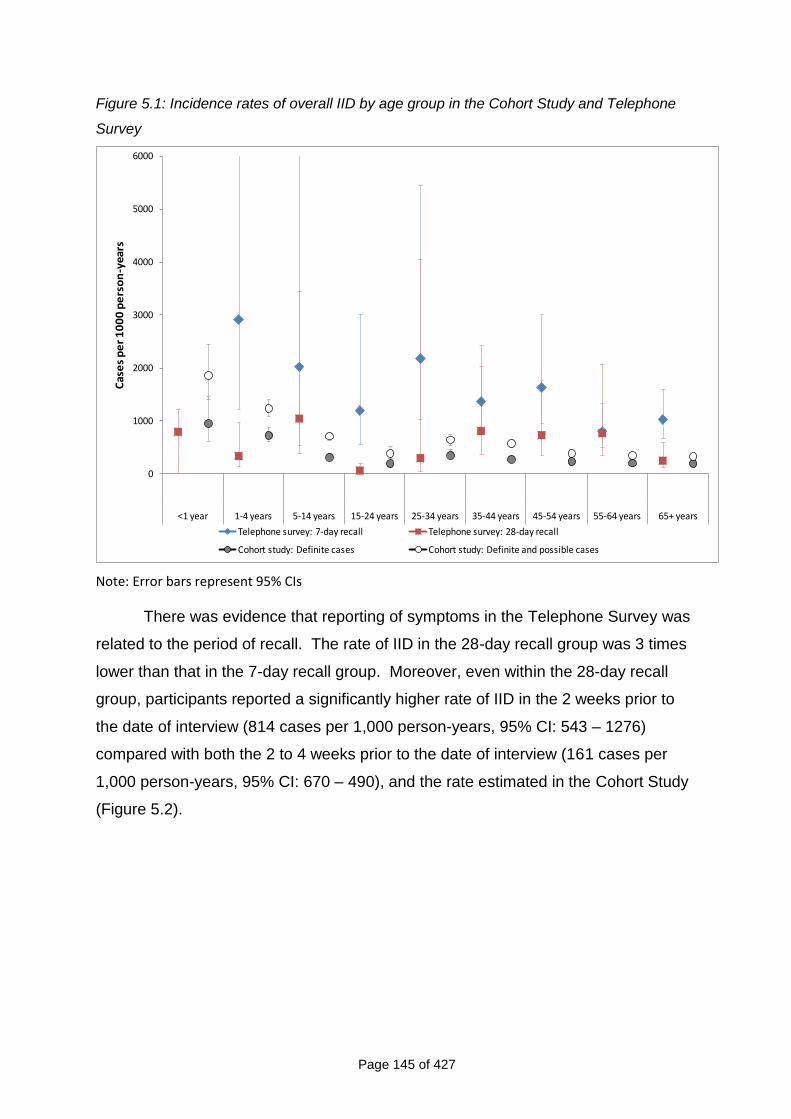
Page 145 of 427
Figure 5.1: Incidence rates of overall IID by age group in the Cohort Study and Telephone
Survey
0
1000
2000
3000
4000
5000
6000
<1 year 1-4 years 5-14 years 15-24 years 25-34 years 35-44 years 45-54 years 55-64 years 65+ years
Cas
es
pe
r 1
00
0 p
ers
on
-yea
rs
Telephone survey: 7-day recall Telephone survey: 28-day recall
Cohort study: Definite cases Cohort study: Definite and possible cases
Note: Error bars represent 95% CIs
There was evidence that reporting of symptoms in the Telephone Survey was
related to the period of recall. The rate of IID in the 28-day recall group was 3 times
lower than that in the 7-day recall group. Moreover, even within the 28-day recall
group, participants reported a significantly higher rate of IID in the 2 weeks prior to
the date of interview (814 cases per 1,000 person-years, 95% CI: 543 – 1276)
compared with both the 2 to 4 weeks prior to the date of interview (161 cases per
1,000 person-years, 95% CI: 670 – 490), and the rate estimated in the Cohort Study
(Figure 5.2).
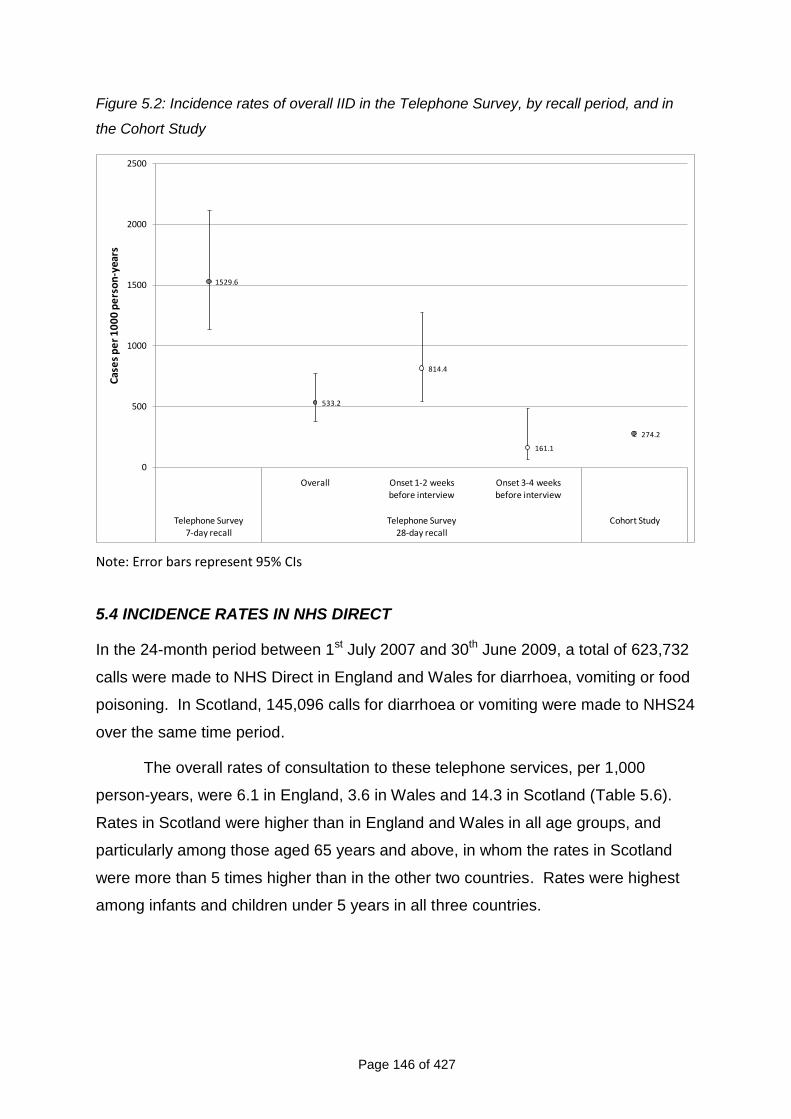
Page 146 of 427
Figure 5.2: Incidence rates of overall IID in the Telephone Survey, by recall period, and in
the Cohort Study
1529.6
533.2
814.4
161.1
274.2
0
500
1000
1500
2000
2500
Overall Onset 1-2 weeks before interview
Onset 3-4 weeks before interview
Telephone Survey 7-day recall
Telephone Survey 28-day recall
Cohort Study
Cas
es
pe
r 1
00
0 p
ers
on
-yea
rs
Note: Error bars represent 95% CIs
5.4 INCIDENCE RATES IN NHS DIRECT
In the 24-month period between 1st July 2007 and 30th June 2009, a total of 623,732
calls were made to NHS Direct in England and Wales for diarrhoea, vomiting or food
poisoning. In Scotland, 145,096 calls for diarrhoea or vomiting were made to NHS24
over the same time period.
The overall rates of consultation to these telephone services, per 1,000
person-years, were 6.1 in England, 3.6 in Wales and 14.3 in Scotland (Table 5.6).
Rates in Scotland were higher than in England and Wales in all age groups, and
particularly among those aged 65 years and above, in whom the rates in Scotland
were more than 5 times higher than in the other two countries. Rates were highest
among infants and children under 5 years in all three countries.
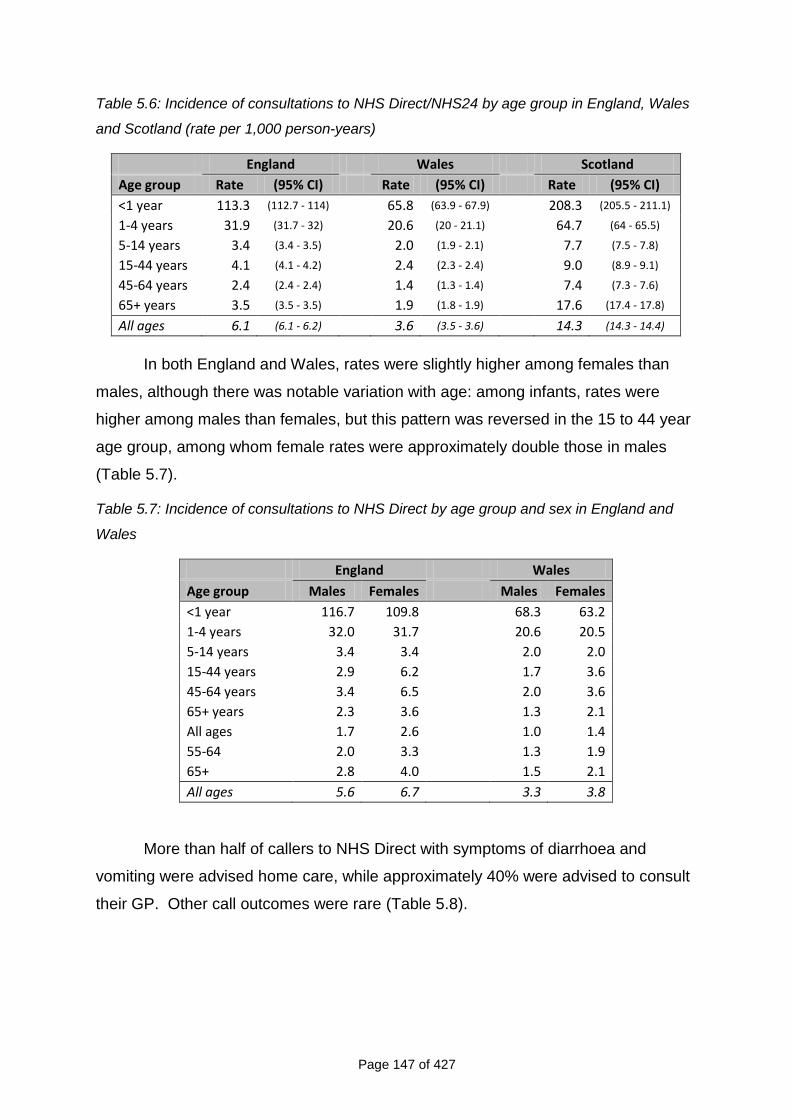
Page 147 of 427
Table 5.6: Incidence of consultations to NHS Direct/NHS24 by age group in England, Wales
and Scotland (rate per 1,000 person-years)
England Wales Scotland
Age group Rate (95% CI) Rate (95% CI) Rate (95% CI)
<1 year 113.3 (112.7 - 114) 65.8 (63.9 - 67.9) 208.3 (205.5 - 211.1)
1-4 years 31.9 (31.7 - 32) 20.6 (20 - 21.1) 64.7 (64 - 65.5)
5-14 years 3.4 (3.4 - 3.5) 2.0 (1.9 - 2.1) 7.7 (7.5 - 7.8)
15-44 years 4.1 (4.1 - 4.2) 2.4 (2.3 - 2.4) 9.0 (8.9 - 9.1)
45-64 years 2.4 (2.4 - 2.4) 1.4 (1.3 - 1.4) 7.4 (7.3 - 7.6)
65+ years 3.5 (3.5 - 3.5) 1.9 (1.8 - 1.9) 17.6 (17.4 - 17.8)
All ages 6.1 (6.1 - 6.2) 3.6 (3.5 - 3.6) 14.3 (14.3 - 14.4)
In both England and Wales, rates were slightly higher among females than
males, although there was notable variation with age: among infants, rates were
higher among males than females, but this pattern was reversed in the 15 to 44 year
age group, among whom female rates were approximately double those in males
(Table 5.7).
Table 5.7: Incidence of consultations to NHS Direct by age group and sex in England and
Wales
England Wales
Age group Males Females Males Females
<1 year 116.7 109.8 68.3 63.2
1-4 years 32.0 31.7 20.6 20.5
5-14 years 3.4 3.4 2.0 2.0
15-44 years 2.9 6.2 1.7 3.6
45-64 years 3.4 6.5 2.0 3.6
65+ years 2.3 3.6 1.3 2.1
All ages 1.7 2.6 1.0 1.4
55-64 2.0 3.3 1.3 1.9
65+ 2.8 4.0 1.5 2.1
All ages 5.6 6.7 3.3 3.8
More than half of callers to NHS Direct with symptoms of diarrhoea and
vomiting were advised home care, while approximately 40% were advised to consult
their GP. Other call outcomes were rare (Table 5.8).
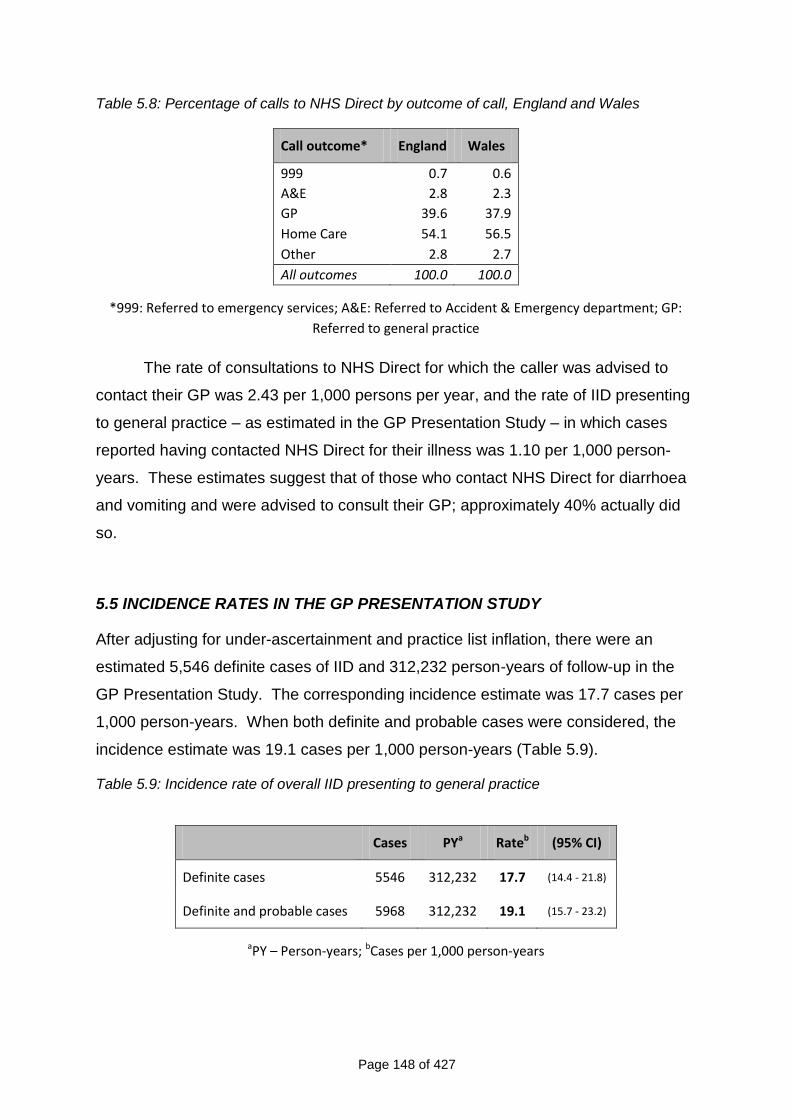
Page 148 of 427
Table 5.8: Percentage of calls to NHS Direct by outcome of call, England and Wales
Call outcome* England Wales
999 0.7 0.6
A&E 2.8 2.3
GP 39.6 37.9
Home Care 54.1 56.5
Other 2.8 2.7
All outcomes 100.0 100.0
*999: Referred to emergency services; A&E: Referred to Accident & Emergency department; GP:
Referred to general practice
The rate of consultations to NHS Direct for which the caller was advised to
contact their GP was 2.43 per 1,000 persons per year, and the rate of IID presenting
to general practice – as estimated in the GP Presentation Study – in which cases
reported having contacted NHS Direct for their illness was 1.10 per 1,000 person-
years. These estimates suggest that of those who contact NHS Direct for diarrhoea
and vomiting and were advised to consult their GP; approximately 40% actually did
so.
5.5 INCIDENCE RATES IN THE GP PRESENTATION STUDY
After adjusting for under-ascertainment and practice list inflation, there were an
estimated 5,546 definite cases of IID and 312,232 person-years of follow-up in the
GP Presentation Study. The corresponding incidence estimate was 17.7 cases per
1,000 person-years. When both definite and probable cases were considered, the
incidence estimate was 19.1 cases per 1,000 person-years (Table 5.9).
Table 5.9: Incidence rate of overall IID presenting to general practice
Cases PYa Rateb (95% CI)
Definite cases 5546 312,232 17.7 (14.4 - 21.8)
Definite and probable cases 5968 312,232 19.1 (15.7 - 23.2)
aPY – Person-years; bCases per 1,000 person-years
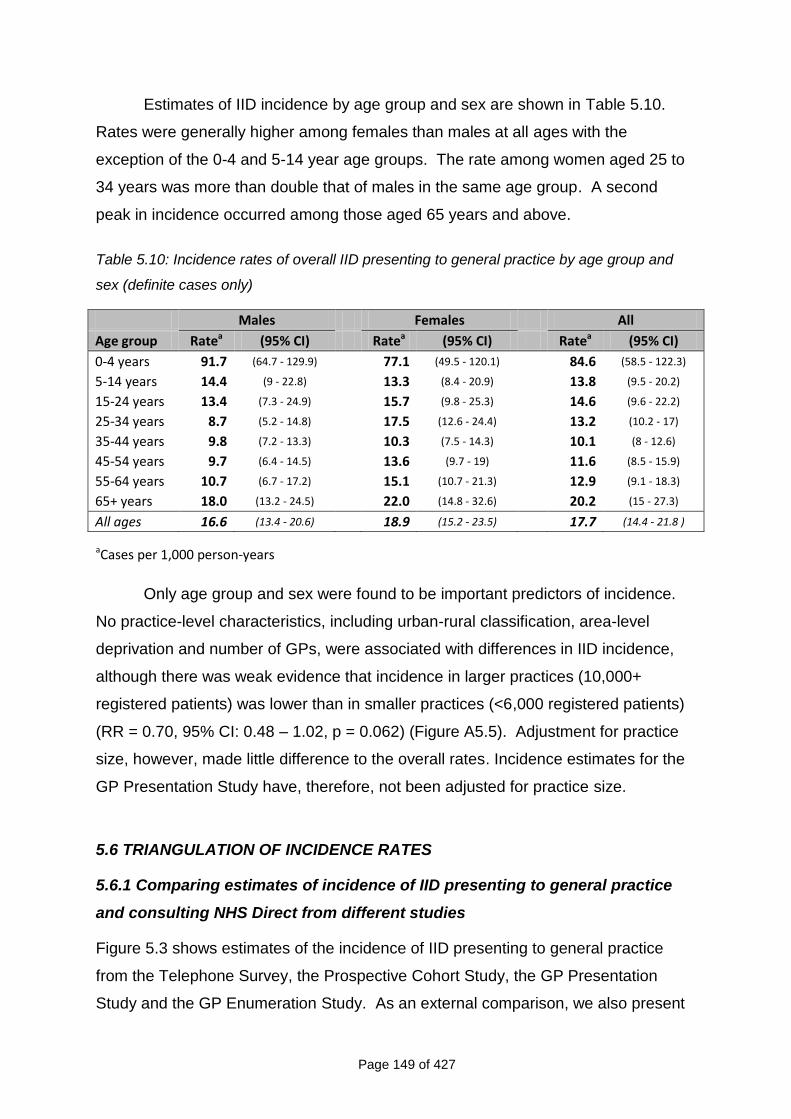
Page 149 of 427
Estimates of IID incidence by age group and sex are shown in Table 5.10.
Rates were generally higher among females than males at all ages with the
exception of the 0-4 and 5-14 year age groups. The rate among women aged 25 to
34 years was more than double that of males in the same age group. A second
peak in incidence occurred among those aged 65 years and above.
Table 5.10: Incidence rates of overall IID presenting to general practice by age group and
sex (definite cases only)
Males Females All
Age group Ratea (95% CI) Ratea (95% CI) Ratea (95% CI)
0-4 years 91.7 (64.7 - 129.9) 77.1 (49.5 - 120.1) 84.6 (58.5 - 122.3)
5-14 years 14.4 (9 - 22.8) 13.3 (8.4 - 20.9) 13.8 (9.5 - 20.2)
15-24 years 13.4 (7.3 - 24.9) 15.7 (9.8 - 25.3) 14.6 (9.6 - 22.2)
25-34 years 8.7 (5.2 - 14.8) 17.5 (12.6 - 24.4) 13.2 (10.2 - 17)
35-44 years 9.8 (7.2 - 13.3) 10.3 (7.5 - 14.3) 10.1 (8 - 12.6)
45-54 years 9.7 (6.4 - 14.5) 13.6 (9.7 - 19) 11.6 (8.5 - 15.9)
55-64 years 10.7 (6.7 - 17.2) 15.1 (10.7 - 21.3) 12.9 (9.1 - 18.3)
65+ years 18.0 (13.2 - 24.5) 22.0 (14.8 - 32.6) 20.2 (15 - 27.3)
All ages 16.6 (13.4 - 20.6) 18.9 (15.2 - 23.5) 17.7 (14.4 - 21.8 )
aCases per 1,000 person-years
Only age group and sex were found to be important predictors of incidence.
No practice-level characteristics, including urban-rural classification, area-level
deprivation and number of GPs, were associated with differences in IID incidence,
although there was weak evidence that incidence in larger practices (10,000+
registered patients) was lower than in smaller practices (<6,000 registered patients)
(RR = 0.70, 95% CI: 0.48 – 1.02, p = 0.062) (Figure A5.5). Adjustment for practice
size, however, made little difference to the overall rates. Incidence estimates for the
GP Presentation Study have, therefore, not been adjusted for practice size.
5.6 TRIANGULATION OF INCIDENCE RATES
5.6.1 Comparing estimates of incidence of IID presenting to general practice
and consulting NHS Direct from different studies
Figure 5.3 shows estimates of the incidence of IID presenting to general practice
from the Telephone Survey, the Prospective Cohort Study, the GP Presentation
Study and the GP Enumeration Study. As an external comparison, we also present
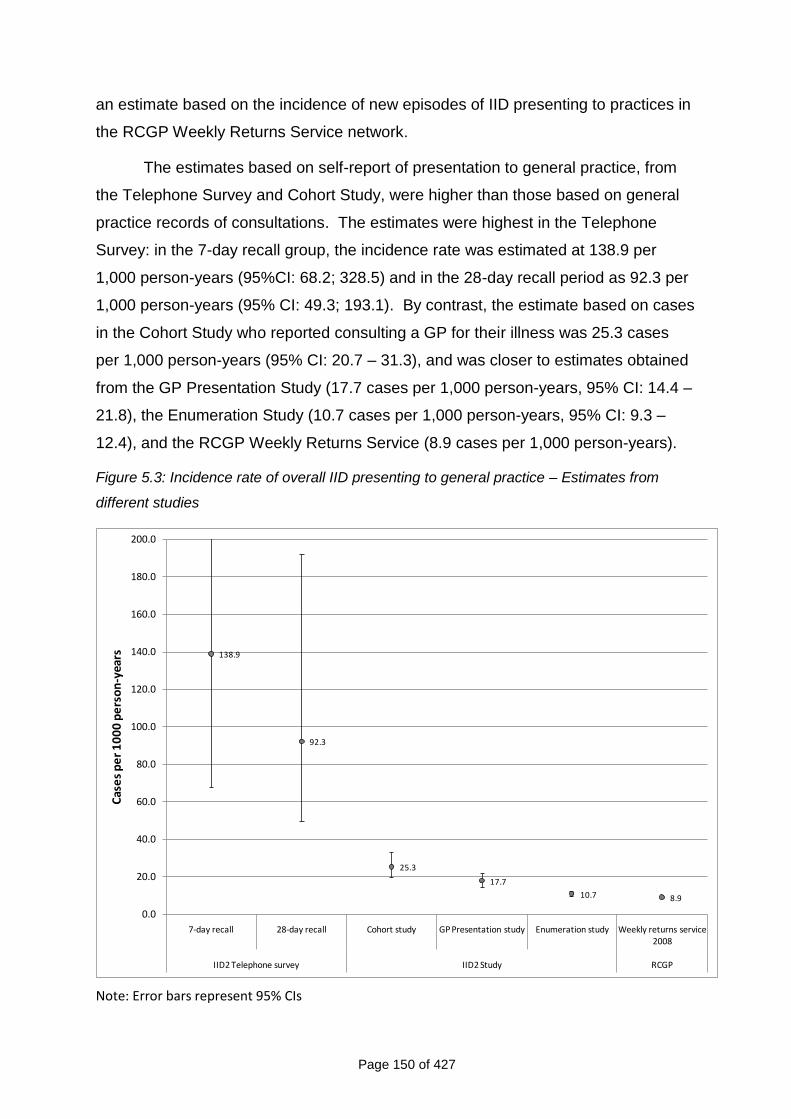
Page 150 of 427
an estimate based on the incidence of new episodes of IID presenting to practices in
the RCGP Weekly Returns Service network.
The estimates based on self-report of presentation to general practice, from
the Telephone Survey and Cohort Study, were higher than those based on general
practice records of consultations. The estimates were highest in the Telephone
Survey: in the 7-day recall group, the incidence rate was estimated at 138.9 per
1,000 person-years (95%CI: 68.2; 328.5) and in the 28-day recall period as 92.3 per
1,000 person-years (95% CI: 49.3; 193.1). By contrast, the estimate based on cases
in the Cohort Study who reported consulting a GP for their illness was 25.3 cases
per 1,000 person-years (95% CI: 20.7 – 31.3), and was closer to estimates obtained
from the GP Presentation Study (17.7 cases per 1,000 person-years, 95% CI: 14.4 –
21.8), the Enumeration Study (10.7 cases per 1,000 person-years, 95% CI: 9.3 –
12.4), and the RCGP Weekly Returns Service (8.9 cases per 1,000 person-years).
Figure 5.3: Incidence rate of overall IID presenting to general practice – Estimates from
different studies
138.9
92.3
25.3
17.7
10.7 8.9
0.0
20.0
40.0
60.0
80.0
100.0
120.0
140.0
160.0
180.0
200.0
7-day recall 28-day recall Cohort study GP Presentation study Enumeration study Weekly returns service 2008
IID2 Telephone survey IID2 Study RCGP
Cas
es
pe
r 1
00
0 p
ers
on
-yea
rs
Note: Error bars represent 95% CIs
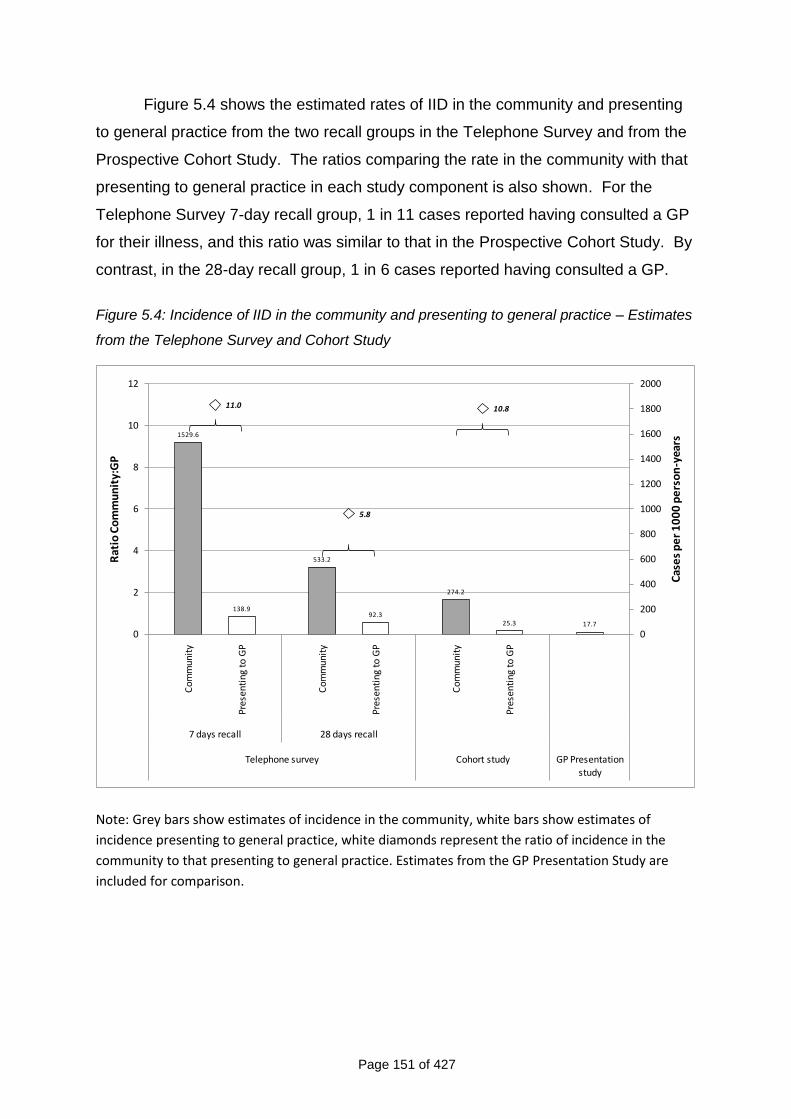
Page 151 of 427
Figure 5.4 shows the estimated rates of IID in the community and presenting
to general practice from the two recall groups in the Telephone Survey and from the
Prospective Cohort Study. The ratios comparing the rate in the community with that
presenting to general practice in each study component is also shown. For the
Telephone Survey 7-day recall group, 1 in 11 cases reported having consulted a GP
for their illness, and this ratio was similar to that in the Prospective Cohort Study. By
contrast, in the 28-day recall group, 1 in 6 cases reported having consulted a GP.
Figure 5.4: Incidence of IID in the community and presenting to general practice – Estimates
from the Telephone Survey and Cohort Study
1529.6
533.2
274.2
138.992.3
25.3 17.7
11.0
5.8
10.8
0
200
400
600
800
1000
1200
1400
1600
1800
2000
0
2
4
6
8
10
12
Com
mun
ity
Pres
enti
ng to
GP
Com
mun
ity
Pres
enti
ng to
GP
Com
mun
ity
Pres
enti
ng to
GP
7 days recall 28 days recall
Telephone survey Cohort study GP Presentation
study
Cas
es
pe
r 1
00
0 p
ers
on
-yea
rs
Rat
io C
om
mu
nit
y:G
P
Note: Grey bars show estimates of incidence in the community, white bars show estimates of
incidence presenting to general practice, white diamonds represent the ratio of incidence in the
community to that presenting to general practice. Estimates from the GP Presentation Study are
included for comparison.
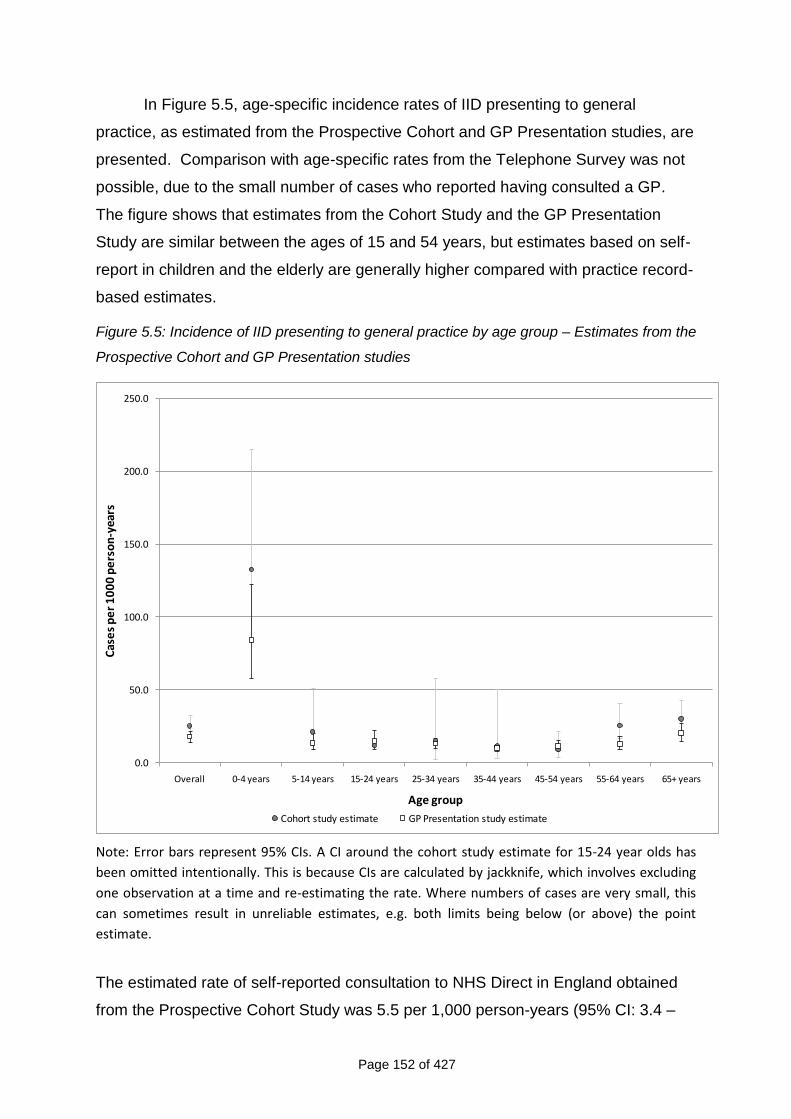
Page 152 of 427
In Figure 5.5, age-specific incidence rates of IID presenting to general
practice, as estimated from the Prospective Cohort and GP Presentation studies, are
presented. Comparison with age-specific rates from the Telephone Survey was not
possible, due to the small number of cases who reported having consulted a GP.
The figure shows that estimates from the Cohort Study and the GP Presentation
Study are similar between the ages of 15 and 54 years, but estimates based on self-
report in children and the elderly are generally higher compared with practice record-
based estimates.
Figure 5.5: Incidence of IID presenting to general practice by age group – Estimates from the
Prospective Cohort and GP Presentation studies
0.0
50.0
100.0
150.0
200.0
250.0
Overall 0-4 years 5-14 years 15-24 years 25-34 years 35-44 years 45-54 years 55-64 years 65+ years
Cas
es
pe
r 1
00
0 p
ers
on
-yea
rs
Age group
Cohort study estimate GP Presentation study estimate
Note: Error bars represent 95% CIs. A CI around the cohort study estimate for 15-24 year olds has
been omitted intentionally. This is because CIs are calculated by jackknife, which involves excluding
one observation at a time and re-estimating the rate. Where numbers of cases are very small, this
can sometimes result in unreliable estimates, e.g. both limits being below (or above) the point
estimate.
The estimated rate of self-reported consultation to NHS Direct in England obtained
from the Prospective Cohort Study was 5.5 per 1,000 person-years (95% CI: 3.4 –
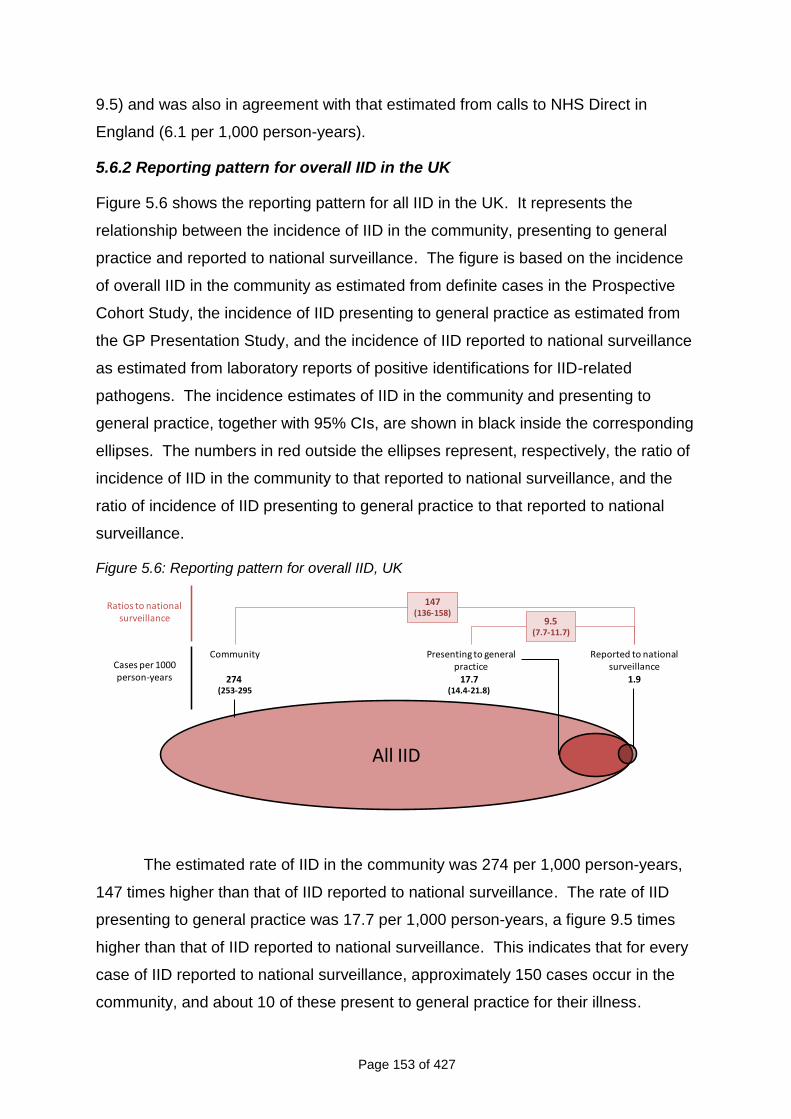
Page 153 of 427
9.5) and was also in agreement with that estimated from calls to NHS Direct in
England (6.1 per 1,000 person-years).
5.6.2 Reporting pattern for overall IID in the UK
Figure 5.6 shows the reporting pattern for all IID in the UK. It represents the
relationship between the incidence of IID in the community, presenting to general
practice and reported to national surveillance. The figure is based on the incidence
of overall IID in the community as estimated from definite cases in the Prospective
Cohort Study, the incidence of IID presenting to general practice as estimated from
the GP Presentation Study, and the incidence of IID reported to national surveillance
as estimated from laboratory reports of positive identifications for IID-related
pathogens. The incidence estimates of IID in the community and presenting to
general practice, together with 95% CIs, are shown in black inside the corresponding
ellipses. The numbers in red outside the ellipses represent, respectively, the ratio of
incidence of IID in the community to that reported to national surveillance, and the
ratio of incidence of IID presenting to general practice to that reported to national
surveillance.
Figure 5.6: Reporting pattern for overall IID, UK
All IID
Ratios to national surveillance
Presenting to general practice
17.7(14.4-21.8)
Reported to national surveillance
1.9
Community
274 (253-295
147(136-158)
9.5(7.7-11.7)
Cases per 1000 person-years
The estimated rate of IID in the community was 274 per 1,000 person-years,
147 times higher than that of IID reported to national surveillance. The rate of IID
presenting to general practice was 17.7 per 1,000 person-years, a figure 9.5 times
higher than that of IID reported to national surveillance. This indicates that for every
case of IID reported to national surveillance, approximately 150 cases occur in the
community, and about 10 of these present to general practice for their illness.
Page 154 of 427
The ratio comparing the incidence of IID in the community with that presenting
to general practice was 15.4 (95% CI: 12.4 – 19.3), indicating that approximately 1 in
every 15 cases of IID occurring in the community consults a GP for their illness.
5.6.3 Travel-related IID
In the Prospective Cohort Study, 8% of IID cases reported having travelled outside
the UK in the 10 days prior to illness onset. The proportion reporting recent foreign
travel was lower among children, and there was little variation among those aged 15
years and above. The corresponding figure among cases of IID presenting to
general practice was 12%, with a similar pattern by age (Tables A5.4 and A5.5).
In the Prospective Cohort Study, we estimated that the rate of IID for which
recent foreign travel is reported was 22 cases per 1,000 person-years (95% CI: 17.5
- 28.0) (Table A5.6), suggesting that approximately 2% of UK residents acquire IID
putatively related to recent foreign travel.
Page 155 of 427
CHAPTER 6
ORGANISM-SPECIFIC INCIDENCE RATES OF IID16
6.1 MICROBIOLOGICAL FINDINGS IN THE PROSPECTIVE POPULATION-
BASED COHORT AND GP PRESENTATION CASES
6.1.1 Prospective Population-Based Cohort Study
Microbiological findings among cases in the cohort are shown in Table 6.1. Viruses
were the most commonly identified pathogens: clinically significant norovirus and
rotavirus infection was identified in 16.5% and 4.1% of specimens respectively, while
evidence of sapovirus infection was found in 9.2% of specimens. Adenovirus and
astrovirus were identified in 3.6% and 1.8% of specimens respectively. Among
children aged <5 years, norovirus was identified in 20% of specimens, sapovirus in
18%, and rotavirus in 10% (Table A6.1). Campylobacter was the most commonly
identified bacterial agent among cohort cases, with 3.7% of specimens testing
positive for this pathogen by culture methods. Overall, 4.6% of specimens tested
positive for Campylobacter by either culture or PCR. Enteroaggregative E. coli was
found by PCR in 1.9% of specimens overall (Table 6.1) and in 5% of specimens
among those aged less than 5 years (Table A6.1). Other pathogens were identified
in less than 1% of specimens. For C. difficile, only one specimen tested positive by
PCR. No C. difficile positive specimens were identified using immunoassay methods.
Overall, 60.2% of samples from confirmed cases had no pathogen identified,
although this varied by age group; among those aged less than 5 years, 40% of
specimens had no pathogen identified (Table A6.1).
16
When reading this chapter please note that tables and figures pre-fixed “A” can be found in the annex to Chapter 6.
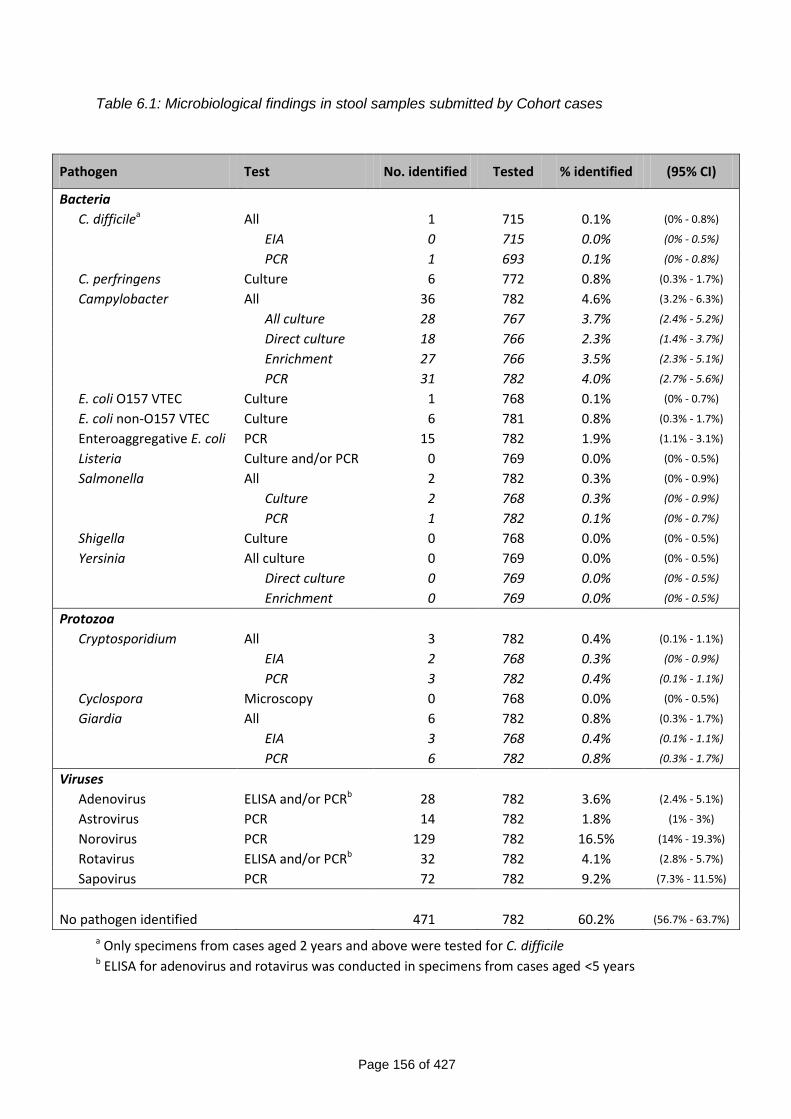
Page 156 of 427
Table 6.1: Microbiological findings in stool samples submitted by Cohort cases
Pathogen Test No. identified Tested % identified (95% CI)
Bacteria
C. difficilea All 1 715 0.1% (0% - 0.8%)
EIA 0 715 0.0% (0% - 0.5%)
PCR 1 693 0.1% (0% - 0.8%)
C. perfringens Culture 6 772 0.8% (0.3% - 1.7%)
Campylobacter All 36 782 4.6% (3.2% - 6.3%)
All culture 28 767 3.7% (2.4% - 5.2%)
Direct culture 18 766 2.3% (1.4% - 3.7%)
Enrichment 27 766 3.5% (2.3% - 5.1%)
PCR 31 782 4.0% (2.7% - 5.6%)
E. coli O157 VTEC Culture 1 768 0.1% (0% - 0.7%)
E. coli non-O157 VTEC Culture 6 781 0.8% (0.3% - 1.7%)
Enteroaggregative E. coli PCR 15 782 1.9% (1.1% - 3.1%)
Listeria Culture and/or PCR 0 769 0.0% (0% - 0.5%)
Salmonella All 2 782 0.3% (0% - 0.9%)
Culture 2 768 0.3% (0% - 0.9%)
PCR 1 782 0.1% (0% - 0.7%)
Shigella Culture 0 768 0.0% (0% - 0.5%)
Yersinia All culture 0 769 0.0% (0% - 0.5%)
Direct culture 0 769 0.0% (0% - 0.5%)
Enrichment 0 769 0.0% (0% - 0.5%)
Protozoa
Cryptosporidium All 3 782 0.4% (0.1% - 1.1%)
EIA 2 768 0.3% (0% - 0.9%)
PCR 3 782 0.4% (0.1% - 1.1%)
Cyclospora Microscopy 0 768 0.0% (0% - 0.5%)
Giardia All 6 782 0.8% (0.3% - 1.7%)
EIA 3 768 0.4% (0.1% - 1.1%)
PCR 6 782 0.8% (0.3% - 1.7%)
Viruses
Adenovirus ELISA and/or PCRb 28 782 3.6% (2.4% - 5.1%)
Astrovirus PCR 14 782 1.8% (1% - 3%)
Norovirus PCR 129 782 16.5% (14% - 19.3%)
Rotavirus ELISA and/or PCRb 32 782 4.1% (2.8% - 5.7%)
Sapovirus PCR 72 782 9.2% (7.3% - 11.5%)
No pathogen identified 471 782 60.2% (56.7% - 63.7%)
a Only specimens from cases aged 2 years and above were tested for C. difficile b ELISA for adenovirus and rotavirus was conducted in specimens from cases aged <5 years
Page 157 of 427
6.1.2 GP Presentation Study
Among cases in the GP Presentation Study, Campylobacter was the most commonly
identified agent, with 13% of specimens testing positive for this pathogen by either
culture or PCR (8% by culture alone) (Table 6.2). Among cases aged 5 years and
above, 15% of specimens were positive for Campylobacter by either culture or PCR,
compared with 5% among cases aged less than 5 years (Tables A6.3 and A6.4)
Viruses were also common among GP Presentation Study cases, with
evidence of clinically significant norovirus or rotavirus infection identified in 12.4%
and 7.3% of specimens respectively (Table 6.2). Nearly 20% of specimens in cases
aged less than 5 years had evidence of clinically significant norovirus infection, with
a similar figure for rotavirus (Table A6.3). Sapovirus infection was identified in 8.8%
of cases overall (Table 6.2), with similar prevalences in cases less than 5 years and
cases aged 5 years and above (Tables A6.3 and A6.4).
Salmonella were detected in only 0.8% of cases. This was less than cases
with C. difficile (1.4%), C. perfringens (2.2%), Enteroaggregative E. coli (1.4%),
Cryptosporidium (1.4%) or Giardia (1.0%).
No pathogen was identified in 48.6% of specimens (Table 6.2). Among cases
less than 5 years, 36% of specimens were negative for all pathogens tested,
compared with 52% among specimens from cases aged 5 years and above (Tables
A6.3 and A6.4).
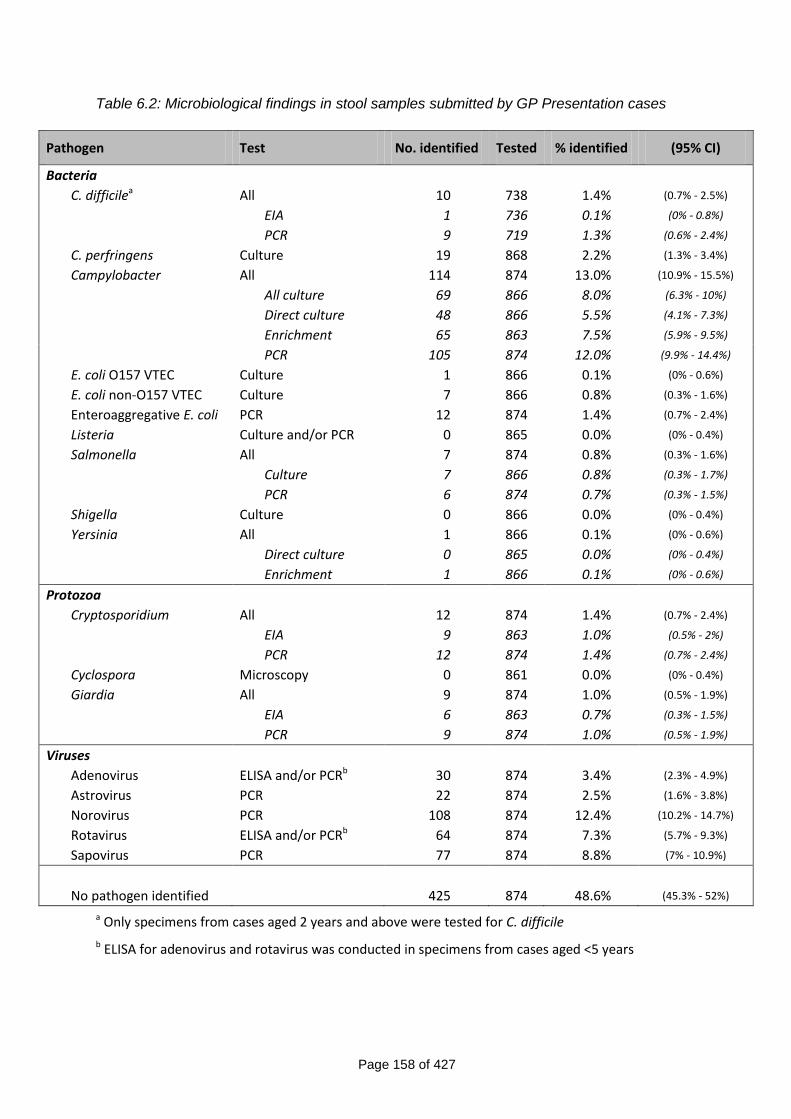
Page 158 of 427
Table 6.2: Microbiological findings in stool samples submitted by GP Presentation cases
Pathogen Test No. identified Tested % identified (95% CI)
Bacteria
C. difficilea All 10 738 1.4% (0.7% - 2.5%)
EIA 1 736 0.1% (0% - 0.8%)
PCR 9 719 1.3% (0.6% - 2.4%)
C. perfringens Culture 19 868 2.2% (1.3% - 3.4%)
Campylobacter All 114 874 13.0% (10.9% - 15.5%)
All culture 69 866 8.0% (6.3% - 10%)
Direct culture 48 866 5.5% (4.1% - 7.3%)
Enrichment 65 863 7.5% (5.9% - 9.5%)
PCR 105 874 12.0% (9.9% - 14.4%)
E. coli O157 VTEC Culture 1 866 0.1% (0% - 0.6%)
E. coli non-O157 VTEC Culture 7 866 0.8% (0.3% - 1.6%)
Enteroaggregative E. coli PCR 12 874 1.4% (0.7% - 2.4%)
Listeria Culture and/or PCR 0 865 0.0% (0% - 0.4%)
Salmonella All 7 874 0.8% (0.3% - 1.6%)
Culture 7 866 0.8% (0.3% - 1.7%)
PCR 6 874 0.7% (0.3% - 1.5%)
Shigella Culture 0 866 0.0% (0% - 0.4%)
Yersinia All 1 866 0.1% (0% - 0.6%)
Direct culture 0 865 0.0% (0% - 0.4%)
Enrichment 1 866 0.1% (0% - 0.6%)
Protozoa
Cryptosporidium All 12 874 1.4% (0.7% - 2.4%)
EIA 9 863 1.0% (0.5% - 2%)
PCR 12 874 1.4% (0.7% - 2.4%)
Cyclospora Microscopy 0 861 0.0% (0% - 0.4%)
Giardia All 9 874 1.0% (0.5% - 1.9%)
EIA 6 863 0.7% (0.3% - 1.5%)
PCR 9 874 1.0% (0.5% - 1.9%)
Viruses
Adenovirus ELISA and/or PCRb 30 874 3.4% (2.3% - 4.9%)
Astrovirus PCR 22 874 2.5% (1.6% - 3.8%)
Norovirus PCR 108 874 12.4% (10.2% - 14.7%)
Rotavirus ELISA and/or PCRb 64 874 7.3% (5.7% - 9.3%)
Sapovirus PCR 77 874 8.8% (7% - 10.9%)
No pathogen identified 425 874 48.6% (45.3% - 52%)
a Only specimens from cases aged 2 years and above were tested for C. difficile
b ELISA for adenovirus and rotavirus was conducted in specimens from cases aged <5 years
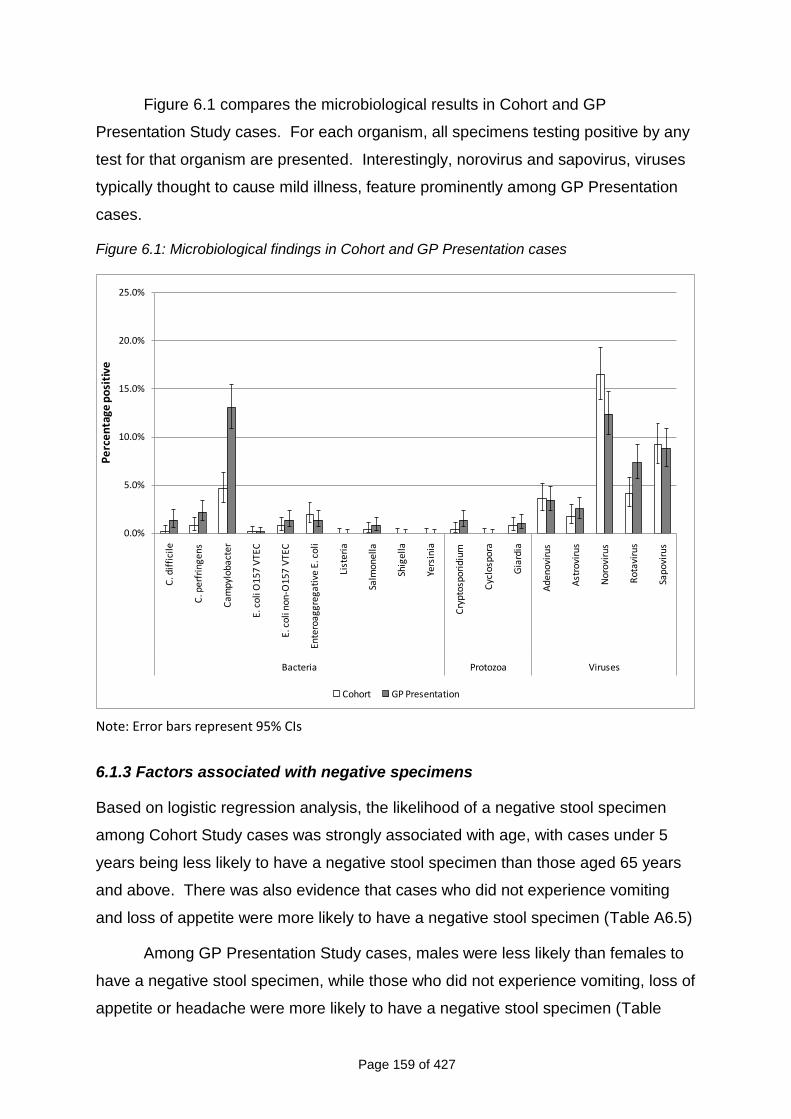
Page 159 of 427
Figure 6.1 compares the microbiological results in Cohort and GP
Presentation Study cases. For each organism, all specimens testing positive by any
test for that organism are presented. Interestingly, norovirus and sapovirus, viruses
typically thought to cause mild illness, feature prominently among GP Presentation
cases.
Figure 6.1: Microbiological findings in Cohort and GP Presentation cases
0.0%
5.0%
10.0%
15.0%
20.0%
25.0%
C. d
iffi
cile
C. p
erf
rin
ge
ns
Ca
mp
ylo
ba
cte
r
E. c
oli
O1
57
VTE
C
E. c
oli n
on-O
157
VTE
C
Ente
roag
greg
ativ
e E.
co
li
List
eria
Salm
onel
la
Shig
ella
Yers
inia
Cry
ptos
pori
dium
Cyc
losp
ora
Gia
rdia
Ade
nov
irus
Ast
rovi
rus
No
rovi
rus
Rot
avir
us
Sap
ovi
rus
Bacteria Protozoa Viruses
Pe
rce
nta
ge p
osi
tive
Cohort GP Presentation
Note: Error bars represent 95% CIs
6.1.3 Factors associated with negative specimens
Based on logistic regression analysis, the likelihood of a negative stool specimen
among Cohort Study cases was strongly associated with age, with cases under 5
years being less likely to have a negative stool specimen than those aged 65 years
and above. There was also evidence that cases who did not experience vomiting
and loss of appetite were more likely to have a negative stool specimen (Table A6.5)
Among GP Presentation Study cases, males were less likely than females to
have a negative stool specimen, while those who did not experience vomiting, loss of
appetite or headache were more likely to have a negative stool specimen (Table
Page 160 of 427
A6.6). In addition, cases who no longer had diarrhoea at the time of questionnaire
completion were more likely to have a negative stool specimen, as were those who
collected a stool specimen 10 or more days after onset of symptoms. Among those
aged 16 years and above, there was evidence that the likelihood of a negative stool
specimen was related to socioeconomic group, with those in non-managerial and
professional occupations being more likely to have a negative stool specimen (Table
A6.6).
6.1.4 Mixed infections
Among 782 specimens from Cohort Study cases, infections with two or more
organisms were identified in 37 (4.7%). The majority of these mixed infections
involved adenovirus, norovirus or sapovirus (Tables A6.7 and A6.8). Among 874
specimens from GP Presentation Study cases, 40 (4.6%) had evidence of infection
with two or more organisms. Mixed infections involving adenovirus, norovirus,
sapovirus or Campylobacter accounted for the majority of these (Tables A6.9 and
A6.10).
6.2 ORGANISM-SPECIFIC INCIDENCE RATES OF IID IN THE COMMUNITY AND
PRESENTING TO GENERAL PRACTICE
Table 6.3 shows UK incidence rates of IID in the community and presenting to
general practice by organism. For Campylobacter spp., Salmonella spp.,
Cryptosporidium spp., and Giardia spp., incidence rates are presented for
conventional diagnostic methods, and for conventional and PCR diagnostic methods
combined. For adenovirus and rotavirus, incidence rates are presented based on
ELISA and PCR diagnostic methods combined, although diagnosis by ELISA was
performed only in children under 5 years. The last three columns of the table show
the ratio of incidence rates in the community to rates of IID presenting to general
practice, with corresponding 95% CIs.
The most common organism causing IID in the community was norovirus, with
an incidence of 47 cases per 1,000 person-years. Approximately one case of
norovirus IID presented to general practice for every 23 cases occurring in the
community. Other viral agents, particularly sapovirus and rotavirus, were also
Page 161 of 427
common. One in nine cases of rotavirus IID in the community presented to general
practice.
Among the bacteria, Campylobacter had the highest incidence in the
community, at approximately 10 cases per 1,000 person-years. When considering
culture methods only, about one in seven community cases of Campylobacter IID
presented to general practice; when both culture and PCR methods were
considered, the corresponding ratio was one in five. The incidence of Salmonella IID
in the community was 0.6 cases per 1,000 person-years; approximately one in four
cases in the community presented to general practice. Enteroaggregative E. coli
was the second most common bacterial agent, with an incidence of 5.9 cases per
1,000 person-years.
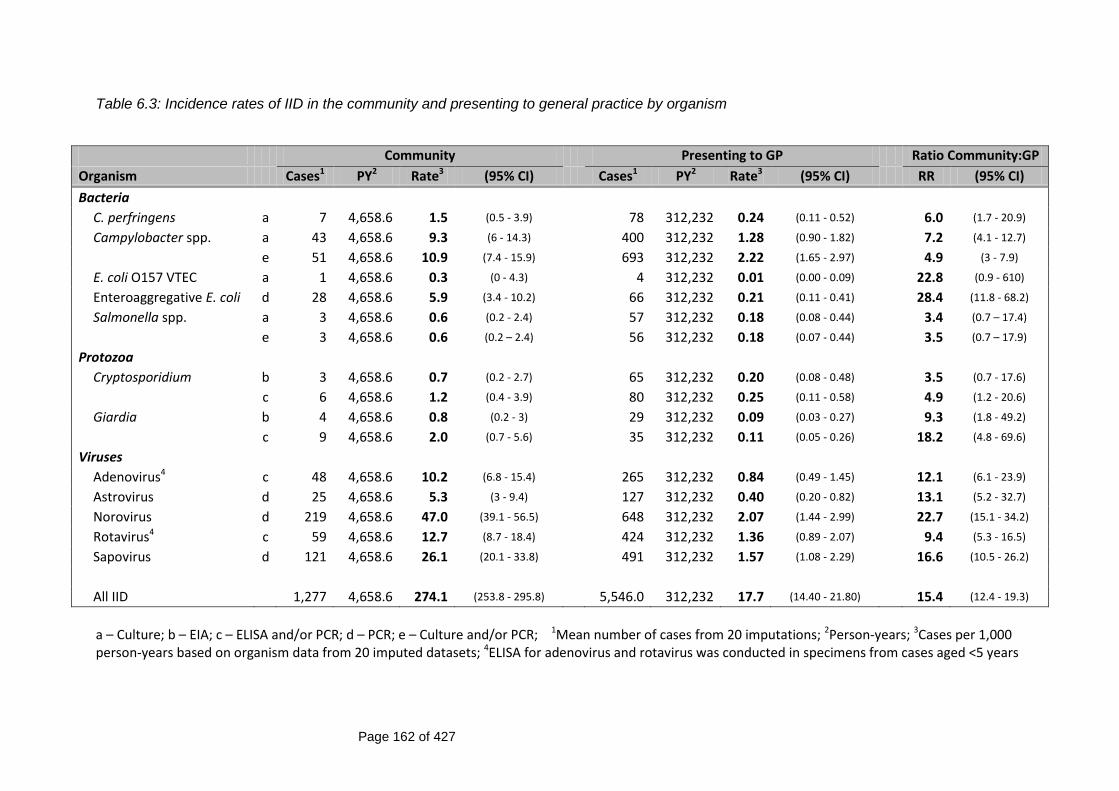
Page 162 of 427
Table 6.3: Incidence rates of IID in the community and presenting to general practice by organism
Community Presenting to GP Ratio Community:GP
Organism Cases1 PY2 Rate3 (95% CI) Cases1 PY2 Rate3 (95% CI) RR (95% CI)
Bacteria
C. perfringens a 7 4,658.6 1.5 (0.5 - 3.9) 78 312,232 0.24 (0.11 - 0.52) 6.0 (1.7 - 20.9)
Campylobacter spp. a 43 4,658.6 9.3 (6 - 14.3) 400 312,232 1.28 (0.90 - 1.82) 7.2 (4.1 - 12.7)
e 51 4,658.6 10.9 (7.4 - 15.9) 693 312,232 2.22 (1.65 - 2.97) 4.9 (3 - 7.9)
E. coli O157 VTEC a 1 4,658.6 0.3 (0 - 4.3) 4 312,232 0.01 (0.00 - 0.09) 22.8 (0.9 - 610)
Enteroaggregative E. coli d 28 4,658.6 5.9 (3.4 - 10.2) 66 312,232 0.21 (0.11 - 0.41) 28.4 (11.8 - 68.2)
Salmonella spp. a 3 4,658.6 0.6 (0.2 - 2.4) 57 312,232 0.18 (0.08 - 0.44) 3.4 (0.7 – 17.4)
e 3 4,658.6 0.6 (0.2 – 2.4) 56 312,232 0.18 (0.07 - 0.44) 3.5 (0.7 – 17.9)
Protozoa
Cryptosporidium b 3 4,658.6 0.7 (0.2 - 2.7) 65 312,232 0.20 (0.08 - 0.48) 3.5 (0.7 - 17.6)
c 6 4,658.6 1.2 (0.4 - 3.9) 80 312,232 0.25 (0.11 - 0.58) 4.9 (1.2 - 20.6)
Giardia b 4 4,658.6 0.8 (0.2 - 3) 29 312,232 0.09 (0.03 - 0.27) 9.3 (1.8 - 49.2)
c 9 4,658.6 2.0 (0.7 - 5.6) 35 312,232 0.11 (0.05 - 0.26) 18.2 (4.8 - 69.6)
Viruses
Adenovirus4 c 48 4,658.6 10.2 (6.8 - 15.4) 265 312,232 0.84 (0.49 - 1.45) 12.1 (6.1 - 23.9)
Astrovirus d 25 4,658.6 5.3 (3 - 9.4) 127 312,232 0.40 (0.20 - 0.82) 13.1 (5.2 - 32.7)
Norovirus d 219 4,658.6 47.0 (39.1 - 56.5) 648 312,232 2.07 (1.44 - 2.99) 22.7 (15.1 - 34.2)
Rotavirus4 c 59 4,658.6 12.7 (8.7 - 18.4) 424 312,232 1.36 (0.89 - 2.07) 9.4 (5.3 - 16.5)
Sapovirus d 121 4,658.6 26.1 (20.1 - 33.8) 491 312,232 1.57 (1.08 - 2.29) 16.6 (10.5 - 26.2)
All IID 1,277 4,658.6 274.1 (253.8 - 295.8) 5,546.0 312,232 17.7 (14.40 - 21.80) 15.4 (12.4 - 19.3)
a – Culture; b – EIA; c – ELISA and/or PCR; d – PCR; e – Culture and/or PCR; 1Mean number of cases from 20 imputations; 2Person-years; 3Cases per 1,000 person-years based on organism data from 20 imputed datasets; 4ELISA for adenovirus and rotavirus was conducted in specimens from cases aged <5 years
Page 163 of 427
6.3 REPORTING PATTERNS OF IID BY ORGANISM AND REPORTING
ELLIPSES
Table 6.4 shows the incidence rates of IID in the community, presenting to general
practice and reported to national surveillance, by organism. The rate ratios
comparing community and general practice incidences with incidence of IID reported
to national surveillance are also presented.
In general, viral agents had higher ratios of community to national surveillance
rates, reflecting the fact that these viruses, while occurring with high frequency in the
community, are less likely to be reported to national surveillance.
Figures 6.2 to 6.5 show the reporting patterns for Campylobacter, Salmonella,
norovirus and rotavirus. For each organism, the area of the community, general
practice and national surveillance ellipses are proportional to the incidence, so as to
enable visual comparison of the rates. The areas of the ellipses are, however, not
comparable between organisms, as each diagram is scaled differently.
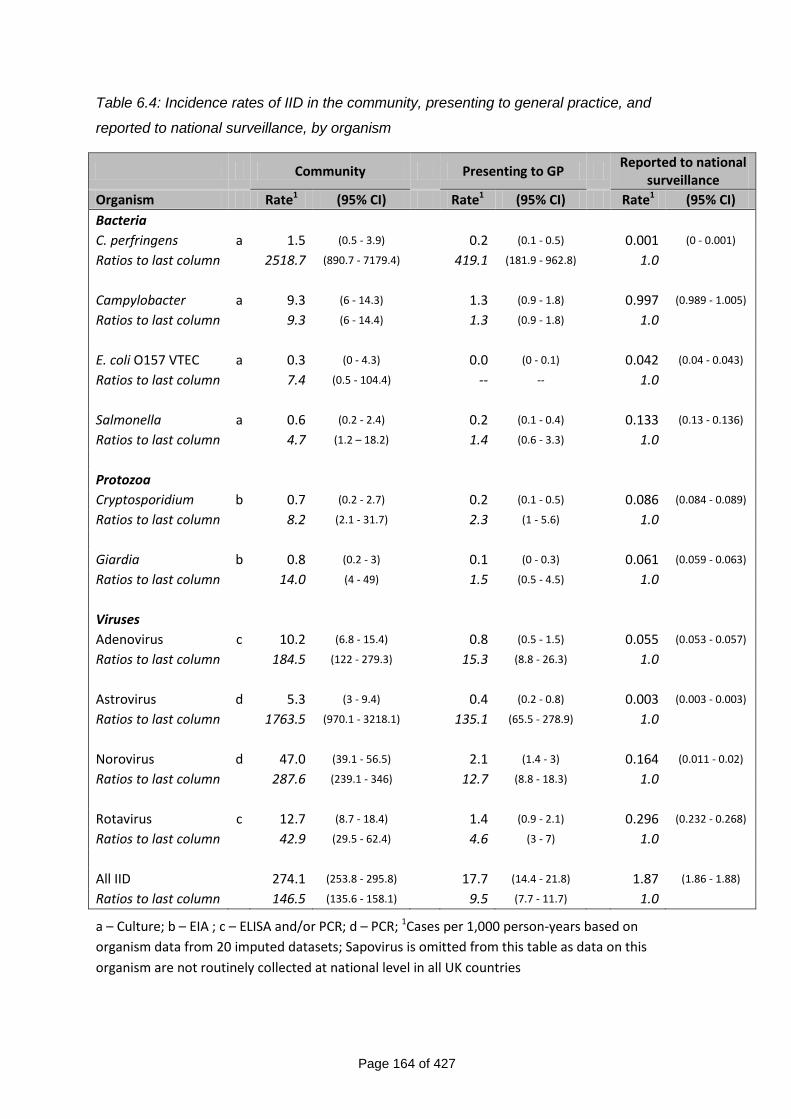
Page 164 of 427
Table 6.4: Incidence rates of IID in the community, presenting to general practice, and
reported to national surveillance, by organism
Community Presenting to GP Reported to national
surveillance
Organism Rate1 (95% CI) Rate1 (95% CI) Rate1 (95% CI)
Bacteria
C. perfringens a 1.5 (0.5 - 3.9) 0.2 (0.1 - 0.5) 0.001 (0 - 0.001)
Ratios to last column 2518.7 (890.7 - 7179.4) 419.1 (181.9 - 962.8) 1.0
Campylobacter a 9.3 (6 - 14.3) 1.3 (0.9 - 1.8) 0.997 (0.989 - 1.005)
Ratios to last column 9.3 (6 - 14.4) 1.3 (0.9 - 1.8) 1.0
E. coli O157 VTEC a 0.3 (0 - 4.3) 0.0 (0 - 0.1) 0.042 (0.04 - 0.043)
Ratios to last column 7.4 (0.5 - 104.4) -- -- 1.0
Salmonella a 0.6 (0.2 - 2.4) 0.2 (0.1 - 0.4) 0.133 (0.13 - 0.136)
Ratios to last column 4.7 (1.2 – 18.2) 1.4 (0.6 - 3.3) 1.0
Protozoa
Cryptosporidium b 0.7 (0.2 - 2.7) 0.2 (0.1 - 0.5) 0.086 (0.084 - 0.089)
Ratios to last column 8.2 (2.1 - 31.7) 2.3 (1 - 5.6) 1.0
Giardia b 0.8 (0.2 - 3) 0.1 (0 - 0.3) 0.061 (0.059 - 0.063)
Ratios to last column 14.0 (4 - 49) 1.5 (0.5 - 4.5) 1.0
Viruses
Adenovirus c 10.2 (6.8 - 15.4) 0.8 (0.5 - 1.5) 0.055 (0.053 - 0.057)
Ratios to last column 184.5 (122 - 279.3) 15.3 (8.8 - 26.3) 1.0
Astrovirus d 5.3 (3 - 9.4) 0.4 (0.2 - 0.8) 0.003 (0.003 - 0.003)
Ratios to last column 1763.5 (970.1 - 3218.1) 135.1 (65.5 - 278.9) 1.0
Norovirus d 47.0 (39.1 - 56.5) 2.1 (1.4 - 3) 0.164 (0.011 - 0.02)
Ratios to last column 287.6 (239.1 - 346) 12.7 (8.8 - 18.3) 1.0
Rotavirus c 12.7 (8.7 - 18.4) 1.4 (0.9 - 2.1) 0.296 (0.232 - 0.268)
Ratios to last column 42.9 (29.5 - 62.4) 4.6 (3 - 7) 1.0
All IID 274.1 (253.8 - 295.8) 17.7 (14.4 - 21.8) 1.87 (1.86 - 1.88)
Ratios to last column 146.5 (135.6 - 158.1) 9.5 (7.7 - 11.7) 1.0
a – Culture; b – EIA ; c – ELISA and/or PCR; d – PCR; 1Cases per 1,000 person-years based on
organism data from 20 imputed datasets; Sapovirus is omitted from this table as data on this
organism are not routinely collected at national level in all UK countries
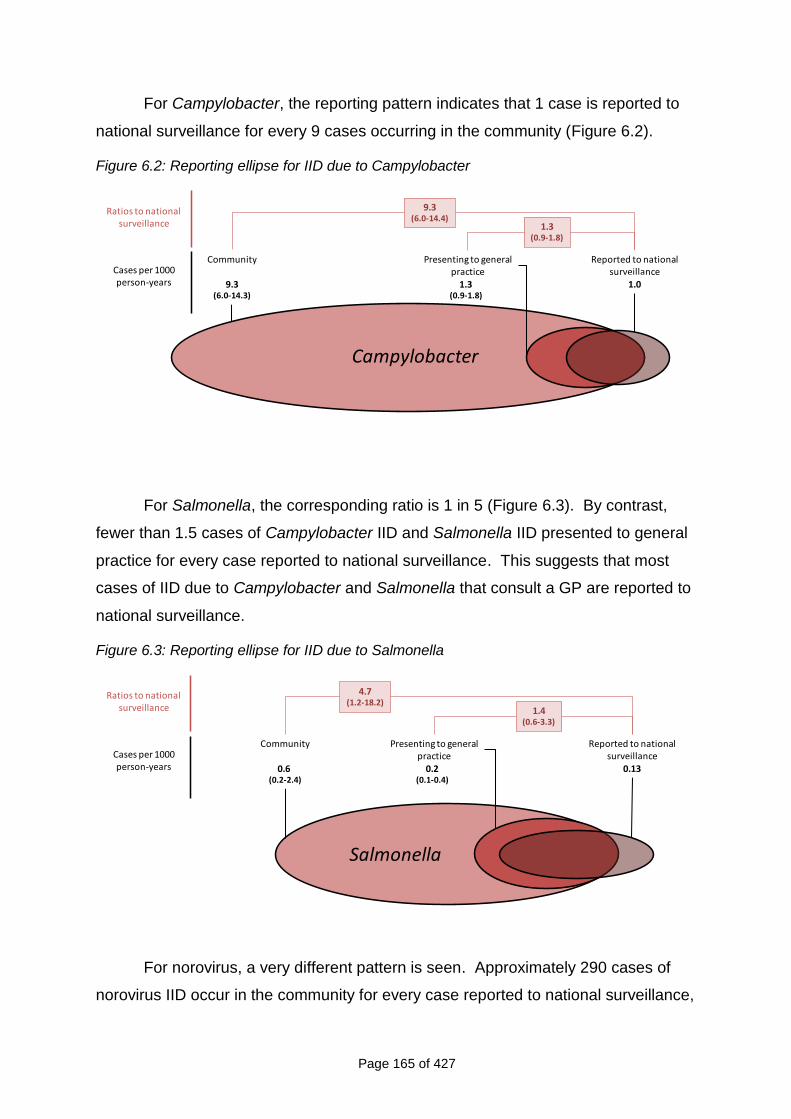
Page 165 of 427
For Campylobacter, the reporting pattern indicates that 1 case is reported to
national surveillance for every 9 cases occurring in the community (Figure 6.2).
Figure 6.2: Reporting ellipse for IID due to Campylobacter
Ratios to national surveillance
Presenting to general practice
1.3(0.9-1.8)
Reported to national surveillance
1.0
Community
9.3(6.0-14.3)
9.3(6.0-14.4)
1.3(0.9-1.8)
Cases per 1000 person-years
Campylobacter
For Salmonella, the corresponding ratio is 1 in 5 (Figure 6.3). By contrast,
fewer than 1.5 cases of Campylobacter IID and Salmonella IID presented to general
practice for every case reported to national surveillance. This suggests that most
cases of IID due to Campylobacter and Salmonella that consult a GP are reported to
national surveillance.
Figure 6.3: Reporting ellipse for IID due to Salmonella
Salmonella
Ratios to national surveillance
Presenting to general practice
0.2(0.1-0.4)
Reported to national surveillance
0.13
Community
0.6 (0.2-2.4)
4.7(1.2-18.2)
1.4(0.6-3.3)
Cases per 1000 person-years
For norovirus, a very different pattern is seen. Approximately 290 cases of
norovirus IID occur in the community for every case reported to national surveillance,
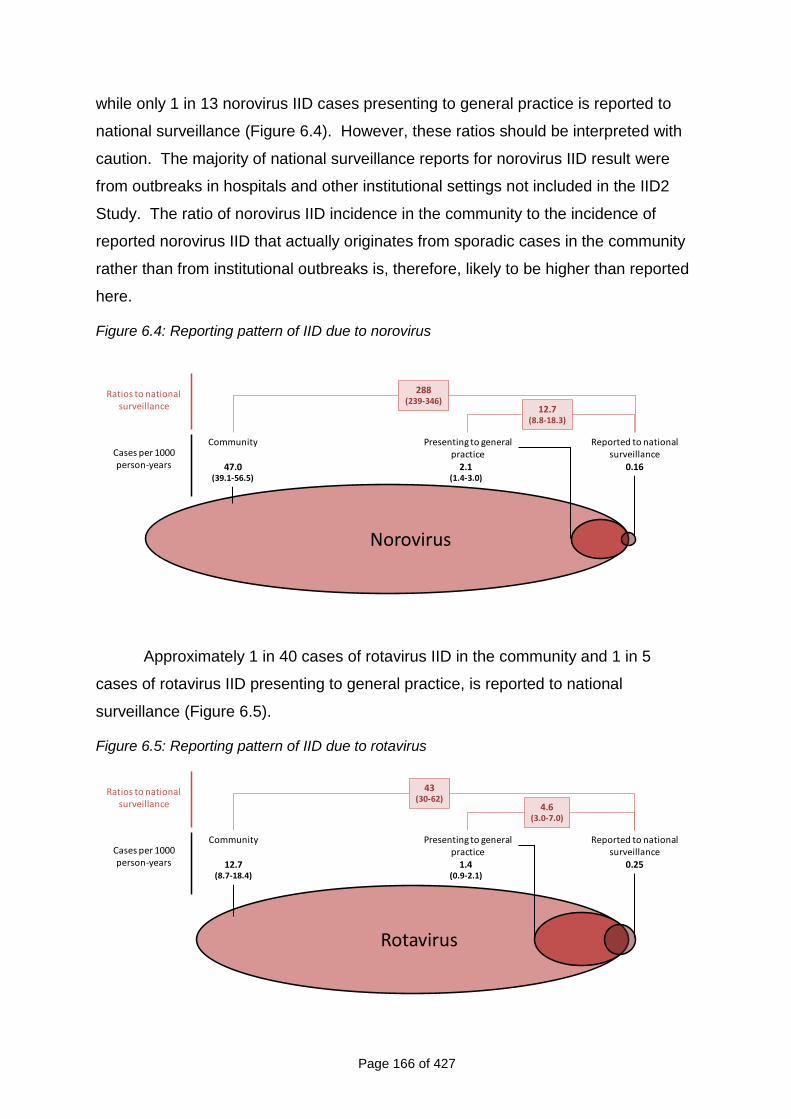
Page 166 of 427
while only 1 in 13 norovirus IID cases presenting to general practice is reported to
national surveillance (Figure 6.4). However, these ratios should be interpreted with
caution. The majority of national surveillance reports for norovirus IID result were
from outbreaks in hospitals and other institutional settings not included in the IID2
Study. The ratio of norovirus IID incidence in the community to the incidence of
reported norovirus IID that actually originates from sporadic cases in the community
rather than from institutional outbreaks is, therefore, likely to be higher than reported
here.
Figure 6.4: Reporting pattern of IID due to norovirus
Norovirus
Ratios to national surveillance
Presenting to general practice
2.1(1.4-3.0)
Reported to national surveillance
0.16
Community
47.0(39.1-56.5)
288(239-346)
12.7(8.8-18.3)
Cases per 1000 person-years
Approximately 1 in 40 cases of rotavirus IID in the community and 1 in 5
cases of rotavirus IID presenting to general practice, is reported to national
surveillance (Figure 6.5).
Figure 6.5: Reporting pattern of IID due to rotavirus
Rotavirus
Ratios to national surveillance
Presenting to general practice
1.4(0.9-2.1)
Reported to national surveillance
0.25
Community
12.7(8.7-18.4)
43(30-62)
4.6(3.0-7.0)
Cases per 1000 person-years
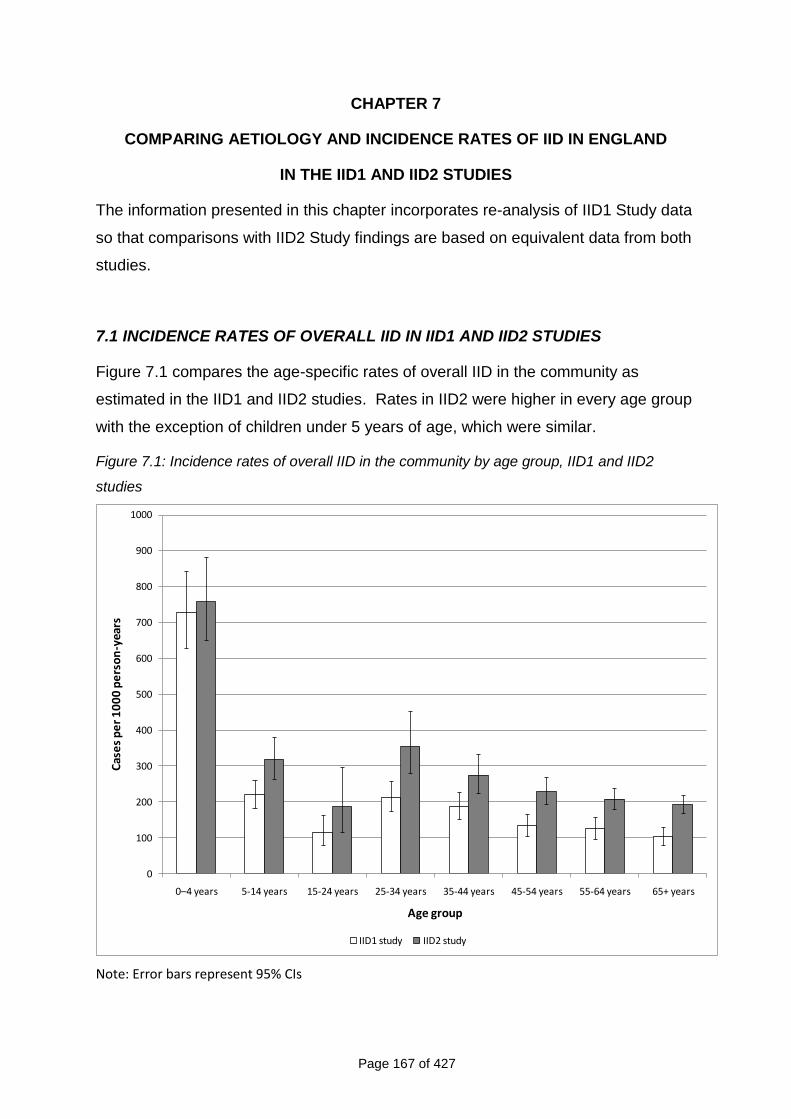
Page 167 of 427
CHAPTER 7
COMPARING AETIOLOGY AND INCIDENCE RATES OF IID IN ENGLAND
IN THE IID1 AND IID2 STUDIES
The information presented in this chapter incorporates re-analysis of IID1 Study data
so that comparisons with IID2 Study findings are based on equivalent data from both
studies.
7.1 INCIDENCE RATES OF OVERALL IID IN IID1 AND IID2 STUDIES
Figure 7.1 compares the age-specific rates of overall IID in the community as
estimated in the IID1 and IID2 studies. Rates in IID2 were higher in every age group
with the exception of children under 5 years of age, which were similar.
Figure 7.1: Incidence rates of overall IID in the community by age group, IID1 and IID2
studies
0
100
200
300
400
500
600
700
800
900
1000
0–4 years 5-14 years 15-24 years 25-34 years 35-44 years 45-54 years 55-64 years 65+ years
Cas
es
pe
r 1
00
0 p
ers
on
-yea
rs
Age group
IID1 study IID2 study
Note: Error bars represent 95% CIs
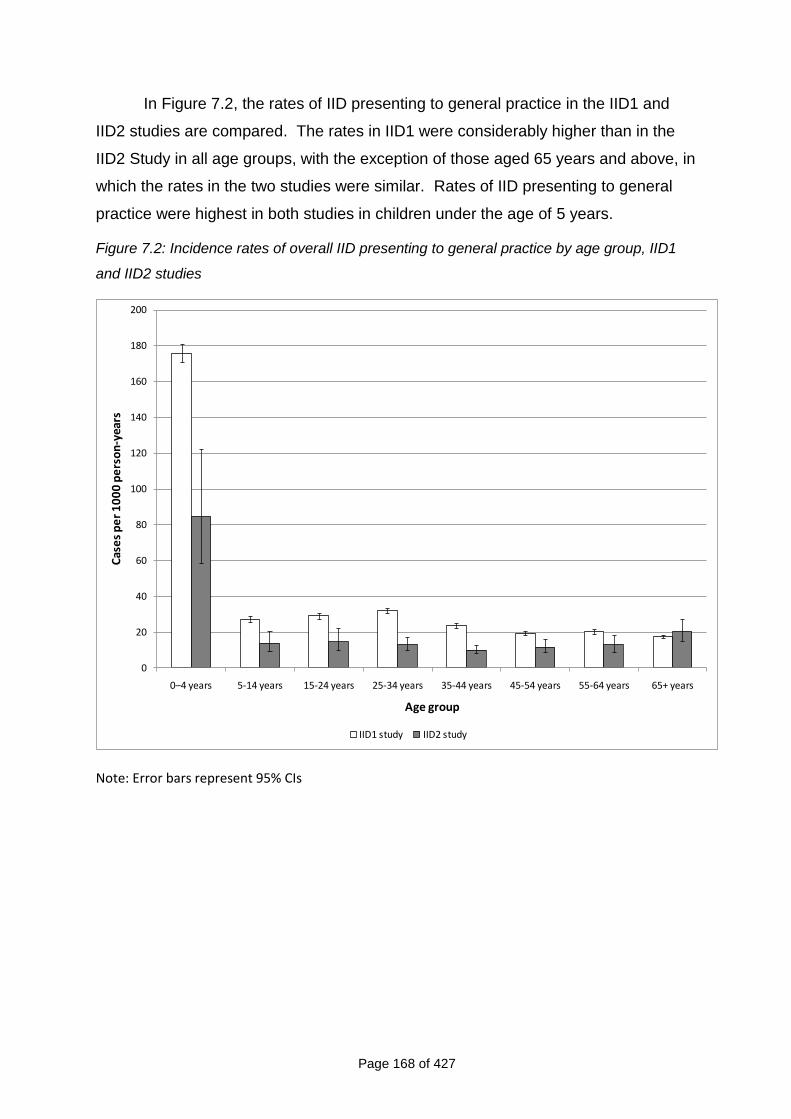
Page 168 of 427
In Figure 7.2, the rates of IID presenting to general practice in the IID1 and
IID2 studies are compared. The rates in IID1 were considerably higher than in the
IID2 Study in all age groups, with the exception of those aged 65 years and above, in
which the rates in the two studies were similar. Rates of IID presenting to general
practice were highest in both studies in children under the age of 5 years.
Figure 7.2: Incidence rates of overall IID presenting to general practice by age group, IID1
and IID2 studies
0
20
40
60
80
100
120
140
160
180
200
0–4 years 5-14 years 15-24 years 25-34 years 35-44 years 45-54 years 55-64 years 65+ years
Cas
es
pe
r 1
00
0 p
ers
on
-yea
rs
Age group
IID1 study IID2 study
Note: Error bars represent 95% CIs
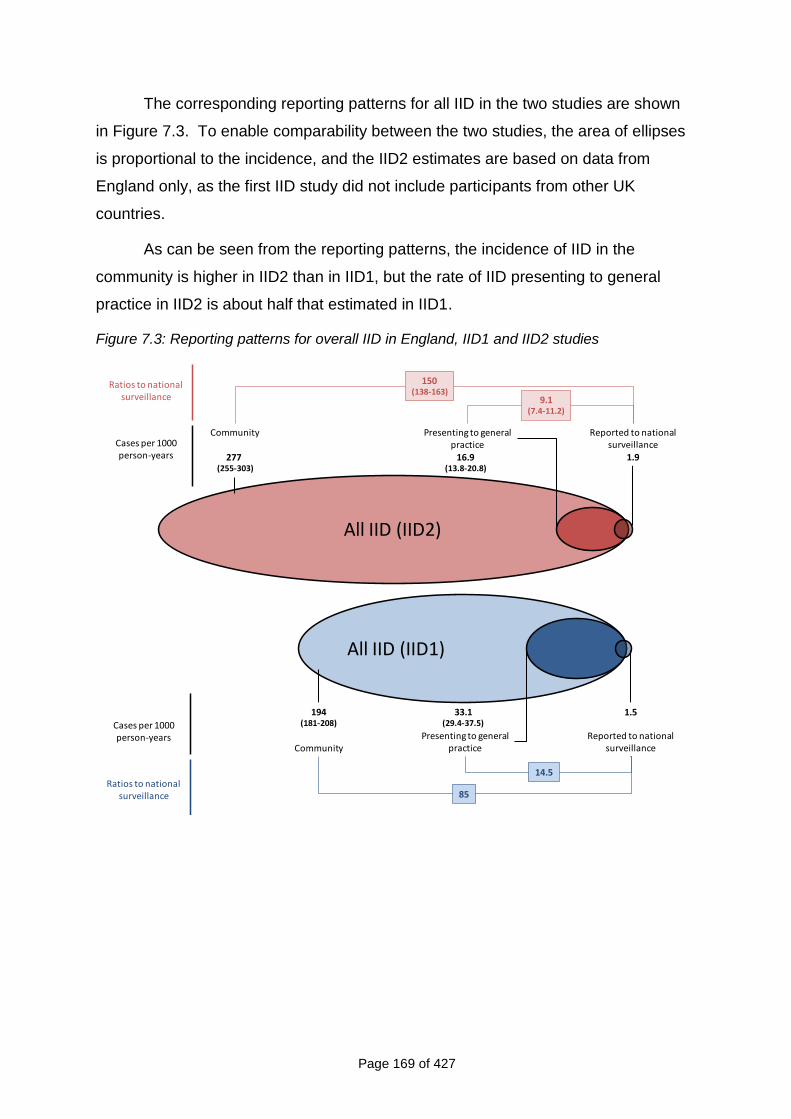
Page 169 of 427
The corresponding reporting patterns for all IID in the two studies are shown
in Figure 7.3. To enable comparability between the two studies, the area of ellipses
is proportional to the incidence, and the IID2 estimates are based on data from
England only, as the first IID study did not include participants from other UK
countries.
As can be seen from the reporting patterns, the incidence of IID in the
community is higher in IID2 than in IID1, but the rate of IID presenting to general
practice in IID2 is about half that estimated in IID1.
Figure 7.3: Reporting patterns for overall IID in England, IID1 and IID2 studies
All IID (IID1)
Ratios to national surveillance
Presenting to general practice
33.1(29.4-37.5)
Reported to national surveillance
1.5
Community
194(181-208)
85
14.5
Cases per 1000 person-years
All IID (IID2)
Ratios to national surveillance
Presenting to general practice
16.9(13.8-20.8)
Reported to national surveillance
1.9
Community
277 (255-303)
150(138-163)
9.1(7.4-11.2)
Cases per 1000 person-years
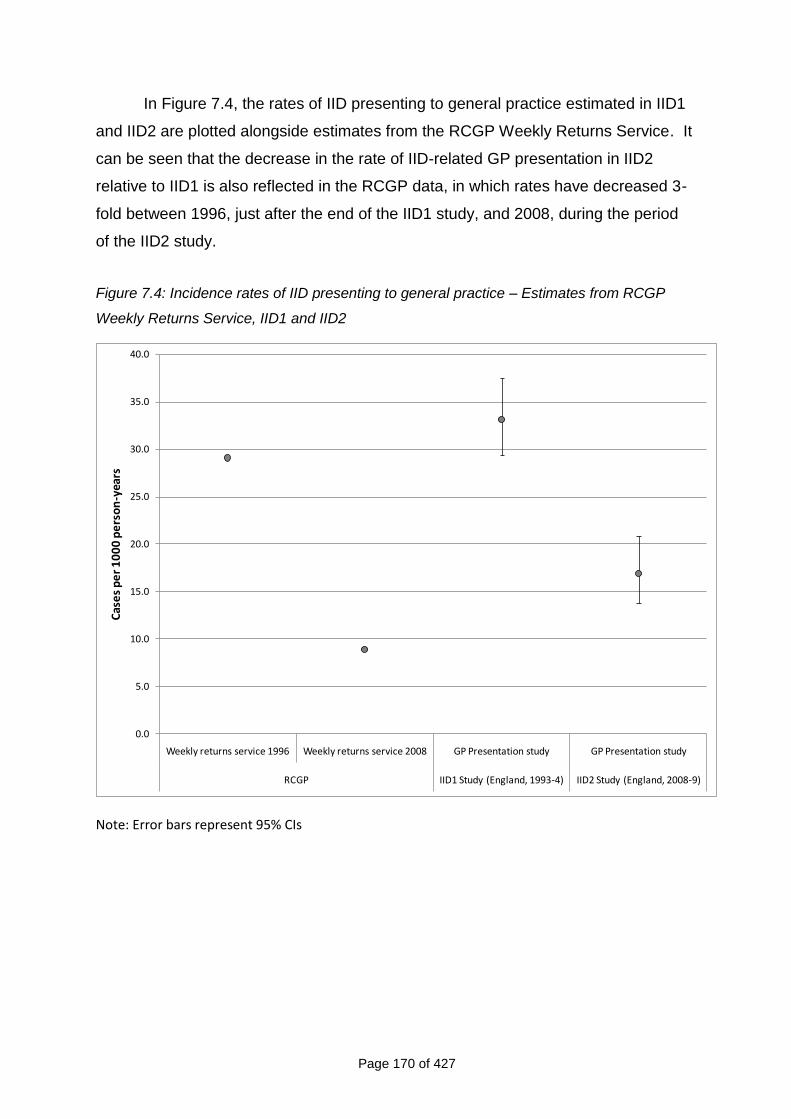
Page 170 of 427
In Figure 7.4, the rates of IID presenting to general practice estimated in IID1
and IID2 are plotted alongside estimates from the RCGP Weekly Returns Service. It
can be seen that the decrease in the rate of IID-related GP presentation in IID2
relative to IID1 is also reflected in the RCGP data, in which rates have decreased 3-
fold between 1996, just after the end of the IID1 study, and 2008, during the period
of the IID2 study.
Figure 7.4: Incidence rates of IID presenting to general practice – Estimates from RCGP
Weekly Returns Service, IID1 and IID2
0.0
5.0
10.0
15.0
20.0
25.0
30.0
35.0
40.0
Weekly returns service 1996 Weekly returns service 2008 GP Presentation study GP Presentation study
RCGP IID1 Study (England, 1993-4) IID2 Study (England, 2008-9)
Cas
es
pe
r 1
00
0 p
ers
on
-yea
rs
Note: Error bars represent 95% CIs
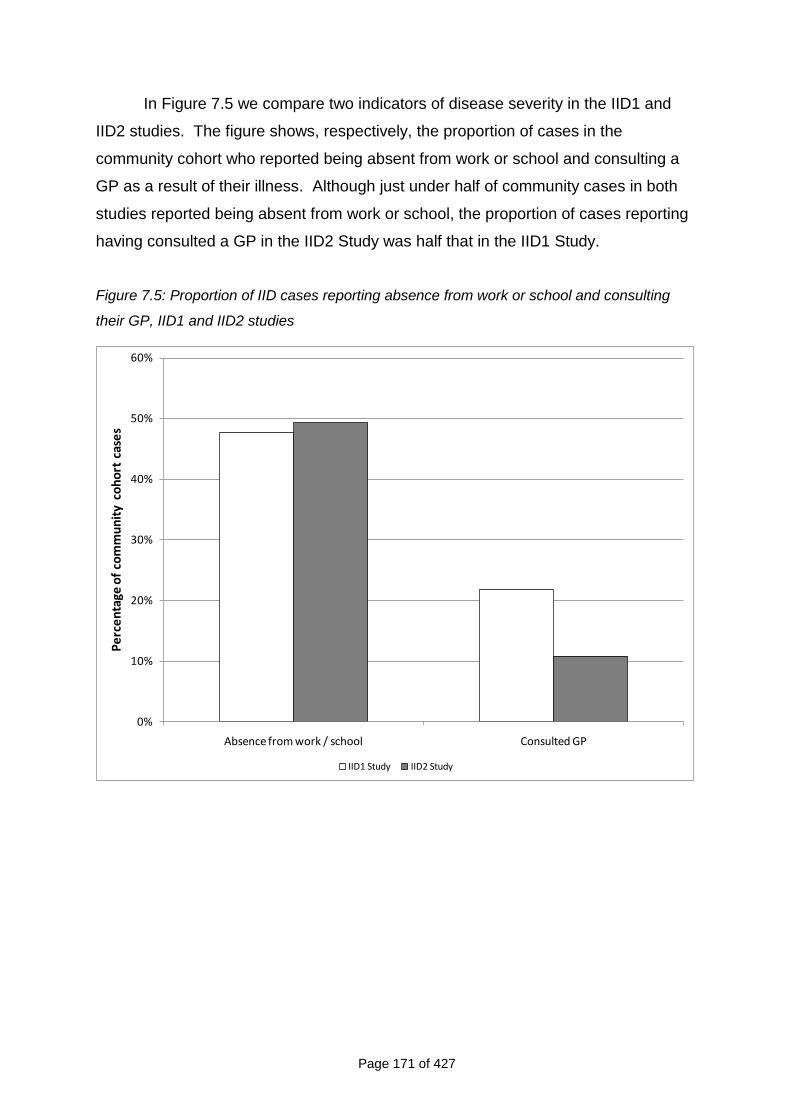
Page 171 of 427
In Figure 7.5 we compare two indicators of disease severity in the IID1 and
IID2 studies. The figure shows, respectively, the proportion of cases in the
community cohort who reported being absent from work or school and consulting a
GP as a result of their illness. Although just under half of community cases in both
studies reported being absent from work or school, the proportion of cases reporting
having consulted a GP in the IID2 Study was half that in the IID1 Study.
Figure 7.5: Proportion of IID cases reporting absence from work or school and consulting
their GP, IID1 and IID2 studies
0%
10%
20%
30%
40%
50%
60%
Absence from work / school Consulted GP
Pe
rce
nta
ge o
f co
mm
un
ity
coh
ort
cas
es
IID1 Study IID2 Study
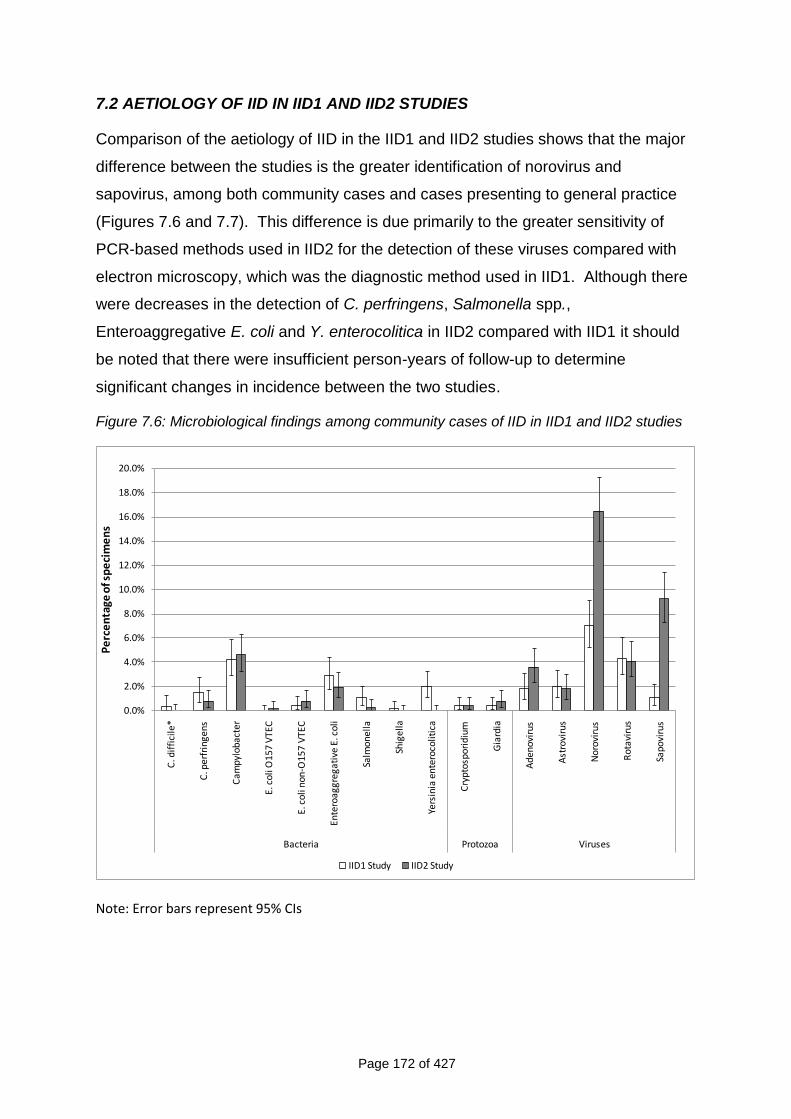
Page 172 of 427
7.2 AETIOLOGY OF IID IN IID1 AND IID2 STUDIES
Comparison of the aetiology of IID in the IID1 and IID2 studies shows that the major
difference between the studies is the greater identification of norovirus and
sapovirus, among both community cases and cases presenting to general practice
(Figures 7.6 and 7.7). This difference is due primarily to the greater sensitivity of
PCR-based methods used in IID2 for the detection of these viruses compared with
electron microscopy, which was the diagnostic method used in IID1. Although there
were decreases in the detection of C. perfringens, Salmonella spp.,
Enteroaggregative E. coli and Y. enterocolitica in IID2 compared with IID1 it should
be noted that there were insufficient person-years of follow-up to determine
significant changes in incidence between the two studies.
Figure 7.6: Microbiological findings among community cases of IID in IID1 and IID2 studies
0.0%
2.0%
4.0%
6.0%
8.0%
10.0%
12.0%
14.0%
16.0%
18.0%
20.0%
C. d
iffi
cile
*
C. p
erfr
inge
ns
Cam
pylo
bact
er
E. c
oli O
157
VTE
C
E. c
oli n
on-O
157
VTE
C
Ente
roag
greg
ativ
e E.
col
i
Salm
onel
la
Shig
ella
Yers
inia
en
tero
colit
ica
Cry
ptos
pori
dium
Gia
rdia
Ade
nov
irus
Ast
rovi
rus
Nor
ovir
us
Rot
avir
us
Sapo
viru
s
Bacteria Protozoa Viruses
Pe
rce
nta
ge o
f sp
eci
me
ns
IID1 Study IID2 Study
Note: Error bars represent 95% CIs
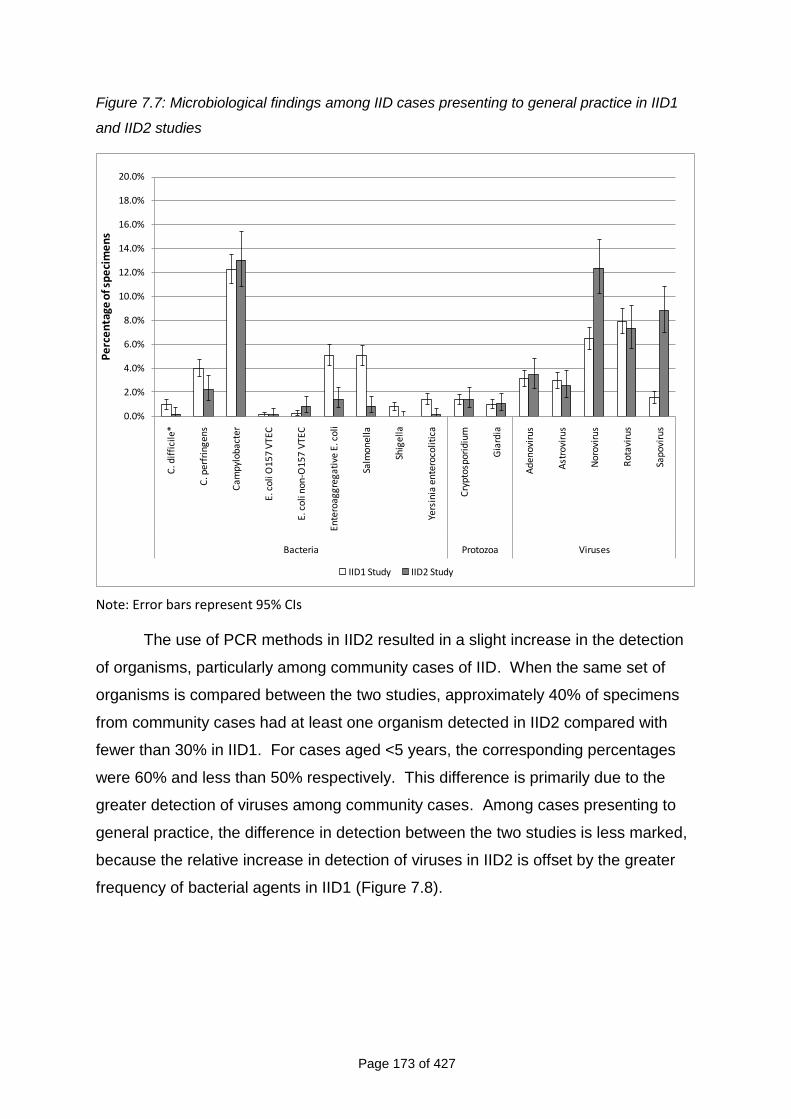
Page 173 of 427
Figure 7.7: Microbiological findings among IID cases presenting to general practice in IID1
and IID2 studies
0.0%
2.0%
4.0%
6.0%
8.0%
10.0%
12.0%
14.0%
16.0%
18.0%
20.0%C
. dif
fici
le*
C. p
erfr
inge
ns
Cam
pylo
bact
er
E. c
oli O
157
VTE
C
E. c
oli n
on-O
157
VTE
C
Ente
roag
greg
ativ
e E.
col
i
Salm
onel
la
Shig
ella
Yers
inia
en
tero
colit
ica
Cry
ptos
pori
dium
Gia
rdia
Ade
nov
irus
Ast
rovi
rus
Nor
ovir
us
Rot
avir
us
Sapo
viru
s
Bacteria Protozoa Viruses
Pe
rce
nta
ge o
f sp
eci
me
ns
IID1 Study IID2 Study
Note: Error bars represent 95% CIs
The use of PCR methods in IID2 resulted in a slight increase in the detection
of organisms, particularly among community cases of IID. When the same set of
organisms is compared between the two studies, approximately 40% of specimens
from community cases had at least one organism detected in IID2 compared with
fewer than 30% in IID1. For cases aged <5 years, the corresponding percentages
were 60% and less than 50% respectively. This difference is primarily due to the
greater detection of viruses among community cases. Among cases presenting to
general practice, the difference in detection between the two studies is less marked,
because the relative increase in detection of viruses in IID2 is offset by the greater
frequency of bacterial agents in IID1 (Figure 7.8).
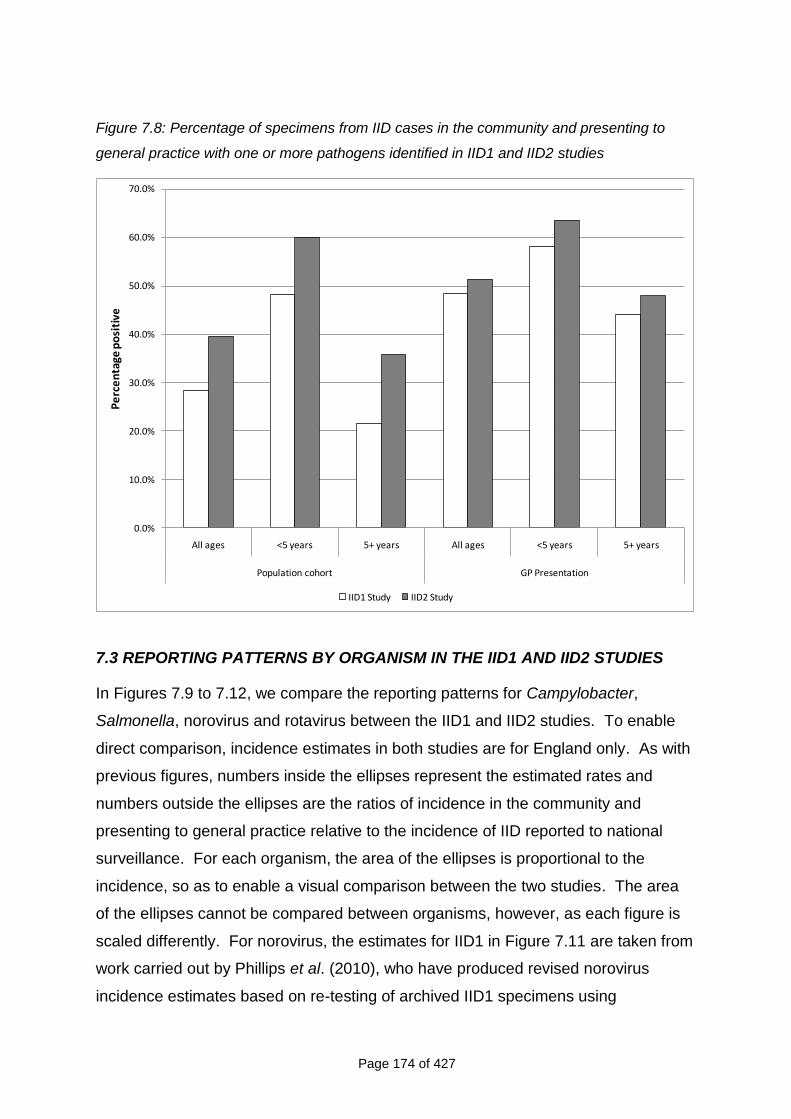
Page 174 of 427
Figure 7.8: Percentage of specimens from IID cases in the community and presenting to
general practice with one or more pathogens identified in IID1 and IID2 studies
0.0%
10.0%
20.0%
30.0%
40.0%
50.0%
60.0%
70.0%
All ages <5 years 5+ years All ages <5 years 5+ years
Population cohort GP Presentation
Pe
rce
nta
ge p
osi
tive
IID1 Study IID2 Study
7.3 REPORTING PATTERNS BY ORGANISM IN THE IID1 AND IID2 STUDIES
In Figures 7.9 to 7.12, we compare the reporting patterns for Campylobacter,
Salmonella, norovirus and rotavirus between the IID1 and IID2 studies. To enable
direct comparison, incidence estimates in both studies are for England only. As with
previous figures, numbers inside the ellipses represent the estimated rates and
numbers outside the ellipses are the ratios of incidence in the community and
presenting to general practice relative to the incidence of IID reported to national
surveillance. For each organism, the area of the ellipses is proportional to the
incidence, so as to enable a visual comparison between the two studies. The area
of the ellipses cannot be compared between organisms, however, as each figure is
scaled differently. For norovirus, the estimates for IID1 in Figure 7.11 are taken from
work carried out by Phillips et al. (2010), who have produced revised norovirus
incidence estimates based on re-testing of archived IID1 specimens using
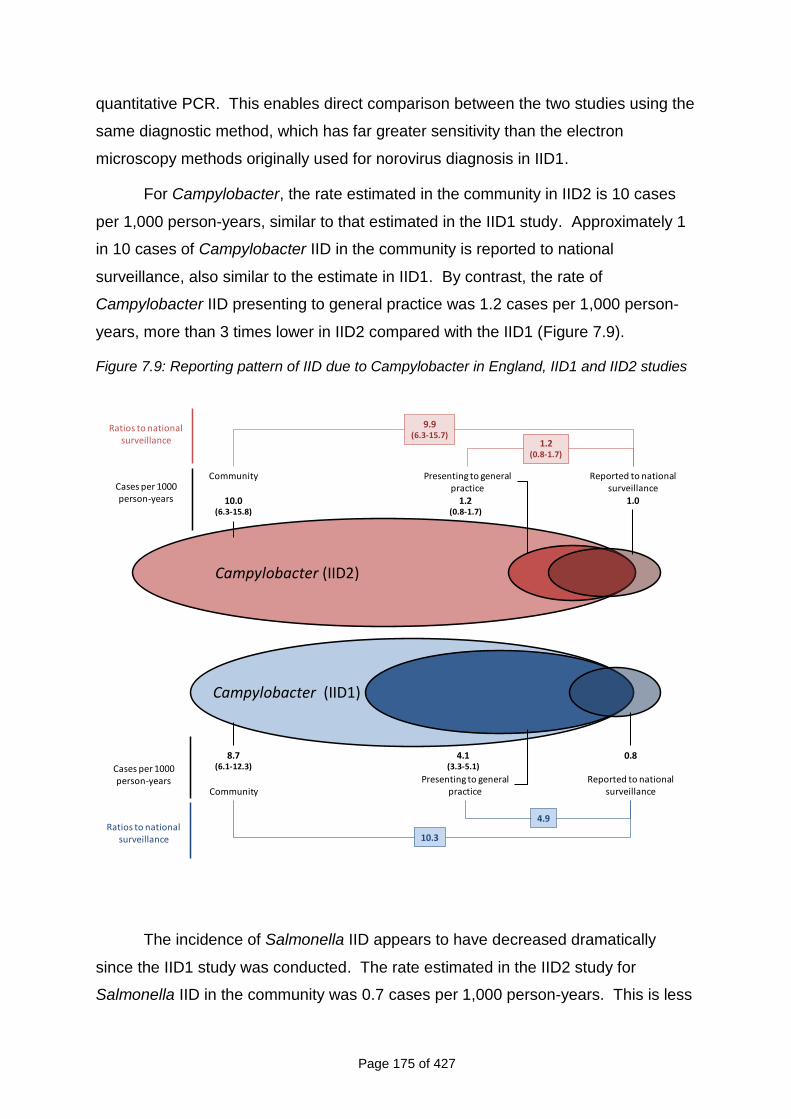
Page 175 of 427
quantitative PCR. This enables direct comparison between the two studies using the
same diagnostic method, which has far greater sensitivity than the electron
microscopy methods originally used for norovirus diagnosis in IID1.
For Campylobacter, the rate estimated in the community in IID2 is 10 cases
per 1,000 person-years, similar to that estimated in the IID1 study. Approximately 1
in 10 cases of Campylobacter IID in the community is reported to national
surveillance, also similar to the estimate in IID1. By contrast, the rate of
Campylobacter IID presenting to general practice was 1.2 cases per 1,000 person-
years, more than 3 times lower in IID2 compared with the IID1 (Figure 7.9).
Figure 7.9: Reporting pattern of IID due to Campylobacter in England, IID1 and IID2 studies
Campylobacter (IID1)
Ratios to national surveillance
Presenting to general practice
4.1(3.3-5.1)
Reported to national surveillance
0.8
Community
8.7(6.1-12.3)
10.3
4.9
Cases per 1000 person-years
Campylobacter (IID2)
Ratios to national surveillance
Presenting to general practice
1.2(0.8-1.7)
Reported to national surveillance
1.0
Community
10.0(6.3-15.8)
9.9(6.3-15.7)
1.2(0.8-1.7)
Cases per 1000 person-years
The incidence of Salmonella IID appears to have decreased dramatically
since the IID1 study was conducted. The rate estimated in the IID2 study for
Salmonella IID in the community was 0.7 cases per 1,000 person-years. This is less
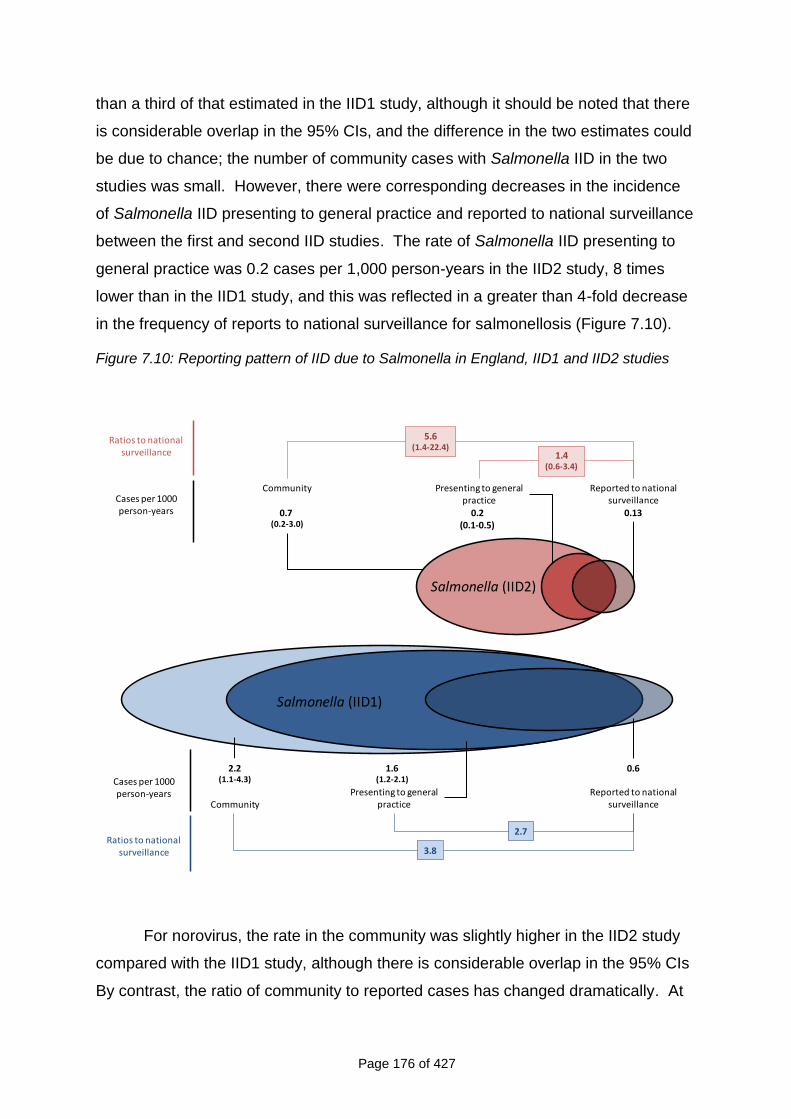
Page 176 of 427
than a third of that estimated in the IID1 study, although it should be noted that there
is considerable overlap in the 95% CIs, and the difference in the two estimates could
be due to chance; the number of community cases with Salmonella IID in the two
studies was small. However, there were corresponding decreases in the incidence
of Salmonella IID presenting to general practice and reported to national surveillance
between the first and second IID studies. The rate of Salmonella IID presenting to
general practice was 0.2 cases per 1,000 person-years in the IID2 study, 8 times
lower than in the IID1 study, and this was reflected in a greater than 4-fold decrease
in the frequency of reports to national surveillance for salmonellosis (Figure 7.10).
Figure 7.10: Reporting pattern of IID due to Salmonella in England, IID1 and IID2 studies
Salmonella (IID1)
Ratios to national surveillance
Presenting to general practice
1.6(1.2-2.1)
Reported to national surveillance
0.6
Community
2.2(1.1-4.3)
3.8
2.7
Cases per 1000 person-years
Salmonella (IID2)
Ratios to national surveillance
Presenting to general practice
0.2(0.1-0.5)
Reported to national surveillance
0.13
Community
0.7 (0.2-3.0)
5.6(1.4-22.4)
1.4(0.6-3.4)
Cases per 1000 person-years
For norovirus, the rate in the community was slightly higher in the IID2 study
compared with the IID1 study, although there is considerable overlap in the 95% CIs
By contrast, the ratio of community to reported cases has changed dramatically. At
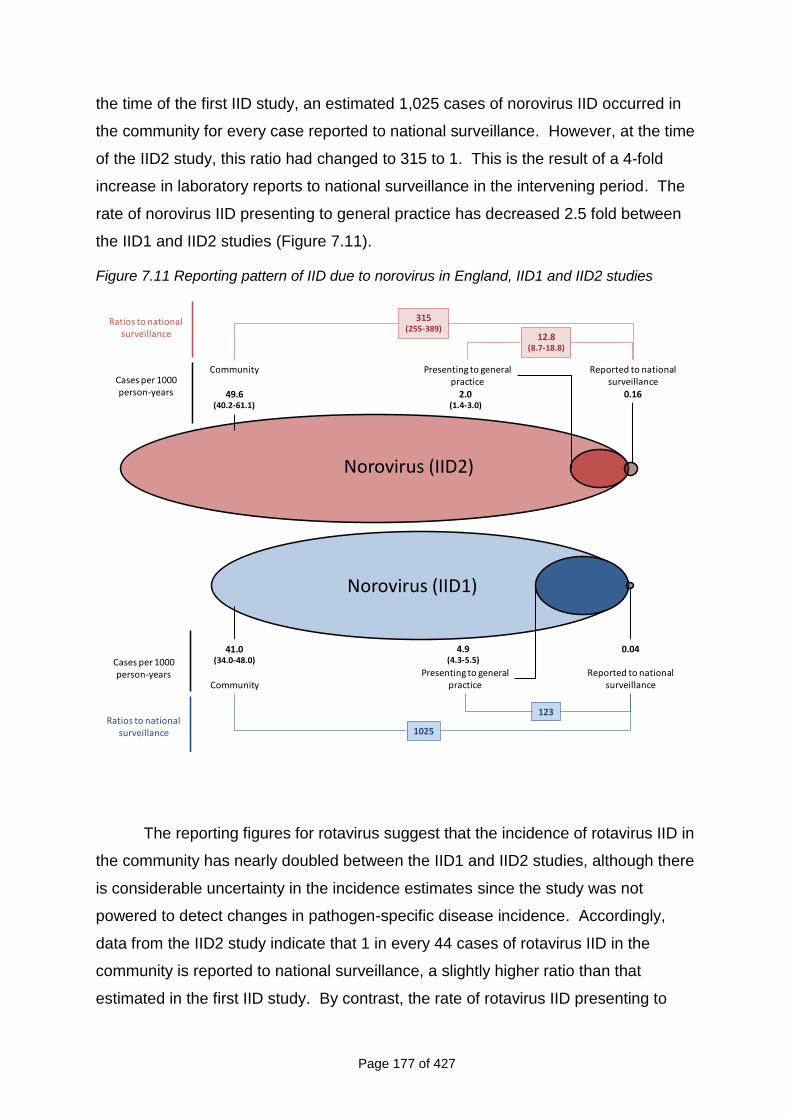
Page 177 of 427
the time of the first IID study, an estimated 1,025 cases of norovirus IID occurred in
the community for every case reported to national surveillance. However, at the time
of the IID2 study, this ratio had changed to 315 to 1. This is the result of a 4-fold
increase in laboratory reports to national surveillance in the intervening period. The
rate of norovirus IID presenting to general practice has decreased 2.5 fold between
the IID1 and IID2 studies (Figure 7.11).
Figure 7.11 Reporting pattern of IID due to norovirus in England, IID1 and IID2 studies
Norovirus (IID2)
Ratios to national surveillance
Presenting to general practice
2.0(1.4-3.0)
Reported to national surveillance
0.16
Community
49.6(40.2-61.1)
315(255-389)
12.8(8.7-18.8)
Cases per 1000 person-years
Norovirus (IID1)
Ratios to national surveillance
Presenting to general practice
4.9(4.3-5.5)
Reported to national surveillance
0.04
Community
41.0(34.0-48.0)
1025
123
Cases per 1000 person-years
The reporting figures for rotavirus suggest that the incidence of rotavirus IID in
the community has nearly doubled between the IID1 and IID2 studies, although there
is considerable uncertainty in the incidence estimates since the study was not
powered to detect changes in pathogen-specific disease incidence. Accordingly,
data from the IID2 study indicate that 1 in every 44 cases of rotavirus IID in the
community is reported to national surveillance, a slightly higher ratio than that
estimated in the first IID study. By contrast, the rate of rotavirus IID presenting to
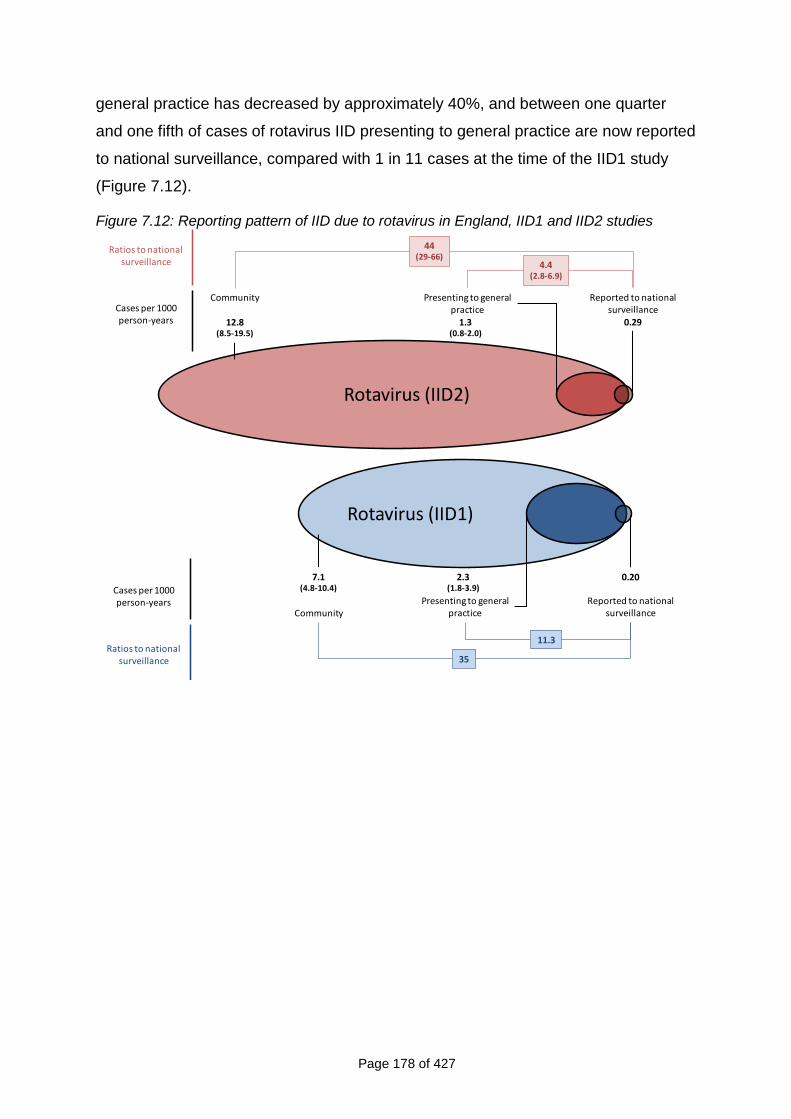
Page 178 of 427
general practice has decreased by approximately 40%, and between one quarter
and one fifth of cases of rotavirus IID presenting to general practice are now reported
to national surveillance, compared with 1 in 11 cases at the time of the IID1 study
(Figure 7.12).
Figure 7.12: Reporting pattern of IID due to rotavirus in England, IID1 and IID2 studies
Rotavirus (IID1)
Ratios to national surveillance
Presenting to general practice
2.3(1.8-3.9)
Reported to national surveillance
0.20
Community
7.1(4.8-10.4)
35
11.3
Cases per 1000 person-years
Rotavirus (IID2)
Ratios to national surveillance
Presenting to general practice
1.3(0.8-2.0)
Reported to national surveillance
0.29
Community
12.8(8.5-19.5)
44(29-66)
4.4(2.8-6.9)
Cases per 1000 person-years
Page 179 of 427
CHAPTER 8
DISCUSSION, CONCLUSION AND RECOMMENDATIONS
This chapter is arranged in five sections. In the first section we present a summary of
the main study findings. The second section describes the strengths and limitations
of the study. The third section contains our interpretation of the study results in the
context of the worldwide literature. We present our overall conclusions in the fourth
section and the final section contains the implications of the study and our
recommendations.
8.1 SUMMARY OF MAIN FINDINGS
In the Prospective Cohort Study the estimated rate of IID in the community in
the UK was 274 cases per 1,000 person-years, meaning that around a quarter
of the population suffer from IID in a year. The most commonly identified
pathogens were, in order of frequency, norovirus, sapovirus, Campylobacter
spp. and rotavirus.
In the Telephone Survey the estimated rate of IID in the community using 7-
day recall was 1,530 cases per 1000 person-years, which was five times
higher than the rate estimated in the Prospective Cohort Study. This would
correspond to the average person having IID between once and twice a year.
Using 28-day recall the estimated rate of IID in the community in the
Telephone Survey was 533 cases per 1000 person-years, which was twice as
high as the rate estimated in the Prospective Cohort Study and would mean
half the population suffering from IID in a year. There was variation in
estimated rates between countries. The rate of reported symptoms was
different in the two recall periods.
Around 8% of people in the Prospective Cohort Study IID and 12% of people
in the GP Presentation Study reported having travelled outside the UK in the
10 days prior to illness onset.
In the Prospective Cohort Study the estimated rate of overall IID in the
community in England was 43% higher in 2008-9 than in 1993-96 (estimated
in IID1).

Page 180 of 427
The estimated rate of IID presenting to general practice in England in 2008-9
was 50% lower than in 1993-6 (estimated in IID1). The most commonly
identified pathogens were, in order of frequency, Campylobacter spp.,
norovirus, sapovirus and rotavirus.
C. difficile–associated diarrhoea was uncommon.
Approximately 50% of people with an episode of IID in IID1 and IID2 reported
absence from work or school because of their symptoms.
In England, the ratio of cases reported to national surveillance to cases in the
community has changed from ≈1:85 in IID1 to ≈1:150 in IID2. For norovirus,
the change was from ≈1:1000 in IID1 to ≈1:300 in IID2. The ratios for
Campylobacter, Salmonella and rotavirus were similar in both studies.
In the IID2 Study, in which molecular methods were used, the diagnostic yield
was 10% higher than in IID1.
The ratio of cases reported to national surveillance to cases presenting to
primary care had improved for all IID and for all the pathogens that we
considered.
The rate of contact with NHS Direct/24 by people with IID was very low (<2%).
Less than half of IID cases contacting NHS Direct were advised to contact
their General Practitioner and approximately 40% of people receiving this
advice actually did so.
8.2 STRENGTHS AND LIMITATIONS OF THE STUDY
8.2.1 Prospective Cohort Study
8.2.1.1 Person-Years of Follow-Up and Study Power
We set out to include 8,400 person-years of follow-up based on the sample size
needed to detect a 20% change in IID incidence from a baseline incidence of 6%.
The follow-up time achieved in the Prospective Cohort Study was just under 5,000
person-years of follow-up. Research ethics and governance procedures (and in
particular the time taken by NHS R&D Offices to communicate decisions) meant a
much more staggered start to recruitment than we had anticipated. This meant that
we were recruiting to the Prospective Cohort Study during the entire study period.
Page 181 of 427
However, since the differences in rates observed in IID1 and IID2 were much higher
than anticipated (with the rate in the community being much higher, and the rate of
GP Presentation much lower), the study objectives were still met despite fewer
person-years of follow-up.
It should also be noted that the study was not powered to detect changes in
the incidence of specific organisms over time since, to have done this, we would
have needed a minimum of 106,000 person-years of follow-up in the Prospective
Cohort Study, which was considered unaffordable.
8.2.1.2 Participation and Cohort Population
The proportion of people who agreed to take part in the Prospective Cohort Study
was low (9%), and considerably lower than in IID1 in which around one third of
people approached (35%) agreed to participate (Food Standards Agency, 2000).
The most commonly cited reasons for not participating included lack of interest and
lack of time. It should be noted that Ethics Committee requirements in the UK do not
allow follow-up of non-responders since this is considered to be harassment. People
may refuse to take part in research without giving a reason. Even in studies where
incentives are used, participation rates are generally lower than they were 10 years
ago. The low participation in the IID2 Prospective Cohort Study is similar to those in
other large, population-based studies conducted in the UK at around the same time.
In “Flu Watch”, in which researchers recruited a healthy cohort of all ages and
collected swabs when individuals developed respiratory symptoms, the participation
rate was around 11% (Andrew Hayward – Personal Communication). Similarly in UK
Biobank, a multi-million pound prospective Cohort Study with the aim of improving
the prevention, diagnosis and treatment of a wide range of serious and life-
threatening illnesses, the overall attendance rate for an assessment visit during the
pilot was 8% (UK Biobank Co-ordinating Centre, 2006). Nevertheless, low
participation might limit the generalisability of the study findings if those who chose to
take part in the study had very different risks of IID compared with the general
population and this was not controlled for.
The characteristics of the cohort population differed from the UK population, in
particular by age and sex. As expected, teenagers and young adults (and especially
males) proved the most difficult groups to recruit so we approached a professional
Page 182 of 427
marketing company with a view to helping us to create study material more
appealing to them. Despite using the new material at re-recruitment the participation
amongst these groups remained low (data available but not shown). To compensate
for differences in the demographic profile of the cohort and the general population
we standardised rates according to the age and sex distribution of the 2001 census
population. We used data from the last census because they allow for comparison of
a number of other important variables, including socioeconomic classification, ethnic
composition and household size. Although changes in the population structure of the
UK might have occurred in the intervening period, such changes are likely to be
minor and should not invalidate our comparisons and adjustments.
8.2.1.3 Weekly Follow-Up and Reporting Fatigue
People who agreed to take part in the study complied well with follow-up as
witnessed by the high proportion of people who responded each week (whether
using the weekly automated e-mail or postcards). Drop-outs among participants
were even rarer than in IID1. Over the entire study period there was evidence of a
small decline in the reported incidence of symptoms consistent with reporting fatigue.
However, the rate of decline was small and even less marked than in IID1 (FSA,
2000). So, although participation in IID2 was lower than in IID1, the retention was
higher and participants were followed up for a longer time.
8.2.1.4 Questionnaire and stool sample submission from participants reporting
symptoms
More than half of the people reporting symptoms in the Prospective Cohort Study
completed a questionnaire but the proportion not returning a questionnaire was
higher in the e-mail follow-up group. This persisted despite follow up by the Study
Nurses to ensure that participants had reported symptoms correctly and not
inadvertently clicked on the wrong link in the automated e-mail. People who
reported symptoms but did not return questionnaire were defined as possible cases
since, without knowing details of their illness, we could not include them as definite
cases of IID according to our case definition. Rates were presented including and
excluding the possible cases.
Most of the people who did not return a questionnaire also failed to submit a
stool specimen (data available but not shown). They might have recovered before
Page 183 of 427
getting round to submitting either stool specimen or questionnaire. We might,
therefore, have underestimated the frequency of mild IID in the Prospective Cohort
Study. However, the good agreement between the Prospective Cohort Study and
other study components in the rates of IID that resulted in contact with a General
Practitioner or NHS Direct suggests that we captured adequately episodes of illness
that participants considered significant.
8.2.2 GP Presentation and Validation Studies
8.2.2.1 Practice Population Characteristics
The practice populations were representative of the UK in terms of age and sex.
Although we randomly allocated practices to the GP Enumeration and the GP
Presentation/Validation studies, a larger number of practices dropped out or failed to
complete the GP Presentation/Validation Study than the GP Enumeration Study.
The majority of practices that withdrew from the GP Presentation/Validation Study
did so after random allocation to the study and after their training session. The GP
Presentation/Validation Study involved considerably more work, which dissuaded
some practices from taking part. This could have introduced bias if the rate of
consultation for IID differed between participating and non-participating practices.
Practices completing the GP Enumeration Study tended to be larger than those
completing the GP Presentation Study. The estimated rate of IID presenting to
general practice was lower in the GP Enumeration Study than the GP Presentation
Study, although adjusting for practice size did not account for this difference. It is
also possible that the difference in the estimated rates occurred by chance, as the
number of practices in each study arm was relatively small.
8.2.2.2 Participation and Compliance
Amongst those invited to take part in the GP Presentation Study, just less than 60%
chose to participate, and commonly cited reasons for not taking part were lack of
interest or lack of time. The Ethics Committee required that we allowed symptomatic
people a 24-hour “cooling-off” period before enrolling them into the study. In
practice, however, this meant they had to make another appointment at the surgery if
they were interested in taking part in the study. Given that IID is an acute, generally
short-lived illness many patients who might have participated probably did not want
to return to the practice on another day, but we have no means of verifying this.
Page 184 of 427
People who enrolled in the GP Presentation Study complied well with the
study procedures and approximately 90% submitted a stool sample.
8.2.2.3 Under-ascertainment
Under-ascertainment is frequently encountered in epidemiological studies, disease
registers and surveillance and so results need to be adjusted to obtain accurate
estimates of incidence (Doll, 1991). In the Validation Study the Study Nurses
undertook a Read code search once a month in order to identify patients who should
have been referred into the study but were not. The purpose of this was to work out
the degree of under-ascertainment in the GP Presentation Study.
Read codes are a hierarchical coding system that is employed in primary
care to code consultations. They comprise a variety of signs and symptoms and
capture a clinician‟s interpretation of a patient‟s presenting complaint. The use of
these codes for IID in primary care is not standardised within or between practices.
The clinician may code the consultation using codes that may refer to symptoms,
diagnoses, investigations or treatment. Alternatively they might not code the
consultation at all. Since data on symptom duration, frequency or severity are not
collected in a standardised manner some Read codes in our search are likely to be
more sensitive and less specific than our epidemiological case definition. Thus some
Read codes, particularly those related to vomiting symptoms, were not sufficiently
specific and were likely to include consultations for conditions other than IID. We
accounted for this in our under-ascertainment analysis by assuming that the degree
of under-ascertainment for IID cases coded as vomiting should be similar to the
degree of under-ascertainment for cases coded under other IID-related codes.
Different clinical management software (or different versions of the same software)
may also affect how codes are used. We developed a Read code search using
EMIS software (LV 5.2) and this was adapted for use with different versions of EMIS
and for the various other electronic clinical management systems employed in
participating practices. Although we attempted to be as comprehensive as possible it
is possible that the translation into different versions was incomplete.
Overall, we estimated that about 1 in 6 people presenting to general practice
with IID were recruited into the GP Presentation Study. To account for this, we
adjusted for under-ascertainment in our analysis, taking into account variations in the
Page 185 of 427
degree of under-ascertainment by age, sex, study practice, and the type of condition
for which the patient presented. Including both definite and probable cases had little
impact on our incidence estimates (a difference of 1.4 cases per 1,000 person-years
compared with definite cases only). However, we were unable to account for other,
potentially relevant, determinants of under-ascertainment in our adjustments,
particularly causative organism and symptom severity, as the information available
on these in consultation records is limited. Our analysis indicated that there was
considerable variation in ascertainment between practices that was not accounted
for by practice size, number of GPs, or the area-level deprivation and urban-rural
profile of the practice. This suggests that under-ascertainment was largely related to
efficiency of referral and recruitment within practices. Methods used to correct for
under-ascertainment were sufficiently similar (albeit not identical), to those used in
IID1.
8.2.3 Advantages and Disadvantages of the Prospective Cohort Study and the
GP Presentation Study
A major strength of the two studies was garnering information on the aetiology of IID,
which is impossible in a Telephone Survey of self-reported illness. It would have
been impossible for us to re-calibrate national surveillance data by pathogen without
information on the aetiology of IID. However, weekly follow-up and obtaining and
testing stool samples are very costly procedures. We could not, therefore, produce
independent incidence rate estimates or reporting pyramids for each UK nation since
it would have been prohibitively expensive.
8.2.4 GP Enumeration Study
8.2.4.1 Read code searches
We encountered the same issues with Read code searches in the GP Enumeration
Study as we did in the GP Presentation Study (see Section 8.2.2.3). It is possible
that variations in coding of IID consultations and implementing Read code searches
between the two different groups of practices resulted in differences in the sensitivity
of Read code searches for capturing IID-related consultations. Given the
considerable difference in estimated rates, and the fact that practices were randomly
allocated to the two study arms, this is unlikely.
Page 186 of 427
We had originally intended to use GP Enumeration study data to link with
national surveillance data. However, during the course of the study the national
surveillance systems changed from capturing personally identifiable information to
electronic anonymised data so that record linkage was impossible. We attempted to
overcome this problem using probability linkage but, unfortunately, this did not work
(see Section 8.6.2.1).
8.2.5 Microbiology Studies
8.2.5.1 Diagnostic Methods
The time to submission of stool samples was generally short. In the Prospective
Cohort Study 75% of participants submitted stool samples within three days of illness
onset. In the GP Presentation Study 75% of people submitted stool samples within
nine days of illness onset. In a logistic regression analysis, only specimens
submitted 10 or more days after onset were more likely to test negative for all
pathogens tested, after adjusting for other factors.
The inclusion of molecular methods in IID2 increased the diagnostic yield by
around 10% overall compared with IID1. To undertake this comparison we re-
calculated the diagnostic yield in IID1 according to the pathogens sought in IID2. The
gain was most obvious for the enteric viruses. Using molecular methods also meant
that we could test low volume samples for the complete range of IID2 study tests.
The sample collection methods used (unrefrigerated, unpreserved samples
transported by mail) mimicked routine community specimen collection and
transportation. The lack of significant increases in detection of bacteria using PCR
suggests that organisms were viable where present.
During the course of the study we noticed that the Campylobacter PCR was
failing to detect the organism in stool samples that were positive on culture in the
HPA Manchester Laboratory. This is not necessarily surprising since there is high
variability in the Campylobacter genome (Parkhill et al., 2000) meaning that the
sensitivity of a PCR based on any one genome target might be sub-optimal. A
second PCR, specific for C. jejuni and containing alternative primers and probe,
specific for the mapA gene was developed in Manchester (Fox, A, 2009, Pers
comm.) and was used on all samples to optimise the detection of C. jejuni (Forward
primer, reverse primer and probe, 5‟- GTG GTT TTG AAG CAA AGA TTA AAG G3‟,
Page 187 of 427
5‟-GCG TTT ATT GGC ACA ACA TTG A-3‟, FAM5‟-ATA CAT TAG CGA TGT TGG
A-3‟MGB, respectively). Similarly, an alternatively labelled probe was included in the
C. coli-specific PCR (YY5‟-TTG GAC CTC AAT CTC GCT TTG GAA TCA TT-
3‟BHQ1). Therefore every sample was tested using two C. jejuni and C. coli PCR
assays. The Campylobacter results presented in this report are based on samples
positive by either PCR method.
The immunoassay test used for C. perfringens was different in IID2 compared
with IID1, so differences between the two sets of study findings should be interpreted
with caution.
8.2.5.2 Lack of controls and implications for defining positive results
A major difference in study design was the inclusion of controls in IID1 but not in
IID2. One of the consequences of this is that it hindered the identification of an
appropriate cut of value for the definition of a positive result when PCR-based
methods were used (since we did not have the distribution of CT values in controls).
This might have led to overestimations of incidence of IID by specific organisms.
Previous work on the analysis of archived specimens from IID1 by PCR has shown
that in those data, CT cut-off value of <30 is a good indicator of IID genuinely caused
by norovirus and rotavirus, and we used these published cut-off points to define
norovirus and rotavirus positive specimens in IID2 (Phillips et al., 2009; Phillips et al.,
2010). In the original work by Phillips et al., cut-off points were derived using only
cases with specimens collected within 3 days of symptom onset, to minimise the
possibility that low viral loads in cases were related to late specimen collection. In
our data, we found no differences in viral load between specimens collected within
and after 3 days of illness onset (data available but not shown), so we have made no
adjustments for timing of specimen collection. In the absence of similar data on CT
value cut-offs for other organisms, we used a more sensitive cut-off value of <40 for
other pathogens, which is standard practice in diagnostic laboratories. We found
good agreement between PCR and culture results for both Campylobacter and
Salmonella, but might have over-estimated incidence for other pathogens,
particularly some viruses, if disease in IID cases with high CT values (low pathogen
loads) was not actually due to infection with those organisms.
Page 188 of 427
The absence of controls also had implications for searching for a broader
range of pathogens. For example, in IID2 we did not look for other pathogenic E. coli
such as Diffusely Adherent E. coli, Enteropathogenic E. coli or Enteroinvasive E. coli.
In IID1 these organisms were almost as prevalent in controls as cases (Tompkins et
al., 1999) so that there was the potential to overestimate the prevalence of these
pathogens.
8.2.5.3 Missing specimens
A large proportion of IID cases in both the Prospective Cohort and GP Presentation
studies failed to supply a stool sample. We used multiple imputation methods to
account for missing data on specimen results. In the first IID study, the distribution
of pathogens for IID cases not providing a stool specimen was assumed to be the
same as that among cases with specimens available. The multiple imputation
method used in IID2 is an improvement on this, in that it enables additional
information to be used in determining the probability that a case with missing
specimen information is positive for a given organism. In particular, we included age
and symptoms experienced in our imputation model, which are likely to be related to
the infecting organism. In addition, by using data from 20 imputed datasets in our
analysis, we were able to account for uncertainty in the imputation process, to better
reflect the uncertainty introduced by the missing data in the estimation of organism-
specific incidence rates. Nevertheless, our analysis could still have resulted in
inaccurate estimates if important variables were omitted from the imputation model.
For example, cases with and without specimens might differ in ways, other than age
and symptoms, that are related to the risk of infection with specific organisms.
Another assumption of our imputation process is that infection with a given organism
is independent of infection with all other organisms, which might not be reasonable if,
for example, certain groups of organisms share common routes of infection. This
assumption was necessary because of the large number of organisms involved,
which would have made the imputation process unwieldy. Among cases with
specimens available, the proportion with mixed infections was low, so this is unlikely
to have had a marked difference to the results. The need for the independence
assumption, however, means that we could not reliably estimate the incidence of IID
in which no organism is identified.
Page 189 of 427
8.2.5.4 Mixed infections
Less than 5% of cases who provided a specimen had an infection with more than
one organism. In both studies, adenovirus, norovirus and sapovirus were the
organisms most commonly involved in mixed infections. This means that we might
have slightly overestimated the burden of disease cause by these viruses.
We did not consider it appropriate to exclude those cases with more than one
pathogen found because, if mixed infections are common, incidence is potentially
underestimated for many pathogens. In addition, for cases with mixed infections
there is currently no reliable way of determining which pathogen was responsible for
symptoms. For norovirus and rotavirus there is some evidence that in patients with
lower viral loads the infection is more likely to be coincidental than clinically relevant
but these data are not available for other pathogens. It might not be reasonable to
assume that the principle would also apply to bacterial and protozoal pathogens.
Furthermore, it is possible that mixed infections reflect common routes of infection.
For example, sewage contamination of food or water, with multiple pathogens likely
to be present, could lead to clinical disease from more than one organism
simultaneously. Given current scientific constraints, our approach represents the
most transparent way of presenting the data.
8.2.6 National Surveillance Study
8.2.6.1 Inability to perform data linkage
In the IID2 Study we were unable to link directly information from cases in the
Prospective Cohort and GP Presentation Studies to laboratory reports to the four
national surveillance centres to calibrate the national surveillance data, as was done
in IID1. All data held at the national surveillance centres are now anonymised so
that direct linkage was, in practice, impossible. To overcome this we used the
indirect method to compare estimated rates of IID in the IID1 and IID2 studies.
It should be noted that national surveillance data contain information about
outbreak cases of IID as well as sporadic cases although outbreak cases are not
necessarily flagged as such. This is particularly important for norovirus for which the
majority of reported cases are from outbreaks, most of which will be reported in
institutions like hospitals and nursing homes rather than in the community. National
surveillance data might also contain information from repeat samples, which we
Page 190 of 427
could not identify from anonymised data. Finally, we could not exclude travel-related
cases from our analysis, which might have inflated the numerator and denominator.
There are no UK surveillance data for Enteroaggregative E. coli or for non-
O157 VTEC (except in Scotland) and national surveillance data for C. perfringens is
confined to enterotoxin detection in cases of suspected food poisoning.
8.2.6.2 Inclusion in national surveillance data of organisms of doubtful pathogenicity
Inclusion of organisms of doubtful pathogenicity in national surveillance systems
might also inflate rates of sporadic, UK-acquired IID in those systems. This is
particularly the case for Yersinia spp. (only certain types are known to be
pathogenic) and adenovirus where the viruses of interest belong only to group F.
8.2.6.3 Recording dates
We found that the dates attached to stool samples were recorded in several different
ways in the various national surveillance systems – date of onset (often poorly
captured), specimen date, date received in the laboratory or date (week) uploaded
into the national surveillance system. However, since we were averaging rates over
more than a calendar year, and since we took account of reporting delays in
extracting the data, this is unlikely to have affected the rate estimates.
8.2.7 Telephone Survey
8.2.7.1 Participation
In the Telephone Survey nearly 50% of individuals invited to take part completed a
survey questionnaire. Participation was highest in England and lowest in Northern
Ireland. This is similar to recently published Telephone Surveys from British
Columbia (44%) (Thomas et al., 2006), Canada (34.7%) and the United States
(37.1%) but is lower than levels of participation achieved in Ireland (84.1%) and
Australia (68.2%) (Scallan et al., 2005). However, in a study by Boland and
colleagues (2006), examining three Telephone Surveys on the island of Ireland
conducted between 2000 and 2005, participation fell from 84.1% to 40.5% over this
time period.
Participation in the Telephone Survey was higher than in the Prospective
Cohort Study although the two study samples were very similar in terms of age
group, sex, ethnicity, area-level deprivation and urban-rural classification. In the
Page 191 of 427
Telephone Survey, however, we could not measure NS-SEC because of the
difficulty, identified in the pilot study, of implementing the full set of questions over
the phone.
Those least likely to participate were in the younger age groups, and
especially young males. This group is well known to be the hardest group to recruit
into research studies. Younger people are more likely to use mobile phones but,
mainly for ethical reasons, we were unable to make calls to mobile numbers. Among
participants in the Prospective Cohort Study 95% still used a landline as their main
method of making phone calls. This suggests that the potential for bias from
exclusion of mobile telephones was small, provided that the low participation in the
Cohort Study has not led to an overestimate of landline usage. To account for
under-representation among males and among certain age groups, we standardised
rates according to the age and sex distribution of the census population.
In this telephone survey we recorded calls electronically. We discovered
during double data entry (DDE) that a proportion of the calls could not be used
because the audio recording was missing or damaged or there was no evidence that
the participant had consented to proceed with the interview. This highlights the need
to monitor call recordings continuously, to commence DDE early in the study and to
test recording software rigorously during the pilot phase.
8.2.7.2 Sampling within households
Random sampling of people within the household proved very difficult to implement.
For both recall periods the proportion of survey participants selected at random was
less than 50%. A similar pattern was seen in a Telephone Survey in Northern
Ireland where the person who answered the call was most likely to complete the
survey, even in two people households when the likelihood of their completing the
call should have been 50% (Scallan et al., 2004). However, in our study, the rate
estimates among those sampled at random and those not sampled at random were
very similar (data not shown), which suggests that among those present in the
household at the time of the call, the decision about who responds to the survey is
not primarily influenced by whether participants recently had symptoms. However,
people at home at the time of the survey might be at home because they are
recovering from IID. One of the consequences of restricting sampling to people in
Page 192 of 427
the household at the time of the call, rather than calling back at another time once
the participant is identified, especially using a 7-day recall period, is that people who
recently have been unwell with IID might still be at home recovering from their
symptoms and are, therefore, available to answer the phone. The population
sampled might over-represent individuals who have generally worse health and,
perhaps, a higher risk of IID so that we might have overestimated the rate of IID
8.2.7.3 Case definition of IID
We matched the case definitions in the Telephone Survey and the Prospective
Cohort Study as closely as possible, because we aimed to compare the rate
estimates between the two study types. However, one of the implications of this was
that we did not define the term “diarrhoea” to participants. Most investigators who
use Telephone Surveys to estimate illness burden define diarrhoea as three or more
loose stools in a 24 hour period. Our case definition was probably more sensitive
than that used in other Telephone Surveys of self-reported illness. Since we did not
specifically provide a definition to our Telephone Survey participants they might have
interpreted the term diarrhoea differently from each other and from us. In addition
we were unable to exclude episodes occurring less than three weeks apart, among
cases in the Telephone Survey, and this could have inflated rate estimates,
especially in the 7-day recall group.
8.2.7.4 Inaccurate recall and digit preference
There was a decline in reporting of symptoms by number of days prior to the
interview and this occurred regardless of recall period. However, during the 28-day
recall period there was clear evidence of digit preference. Participants were much
more likely to report symptoms on days 7, 14 and 21 suggesting, perhaps, that
people remember events in blocks of a week. There was also evidence that reporting
of symptoms is related to the period of recall; in the 28-day recall group, participants
were more than four times more likely to report symptoms in the one to two weeks
preceding the interview than in the period three to four weeks prior to the interview.
8.2.7.5 Advantages and Disadvantages of the Telephone Survey
A major advantage of telephone surveys is the ability to study large sample sizes
relatively cheaply. This meant that we were able to calculate independent IID rate
estimates for each UK country in the Telephone Survey. The main disadvantages
Page 193 of 427
are lack of information on the aetiology of IID, which means that telephone surveys
cannot be used to calibrate national surveillance systems by pathogen, and the
potential for inaccurate recall leading to inaccurate rate estimates.
8.2.8. NHS Direct/NHS24
8.2.8.1 Population covered
The nurse-led telephone information and advice systems do not cover the entire UK
population. NHS Direct covers England and Wales whilst NHS24 covers Scotland.
There is no telephone service in Northern Ireland although the NHS Direct website is
available. However, we found that the proportion of the population in our studies that
had contacted NHS Direct/NHS24 was very small.
8.2.8.2 Algorithms
We captured IID presenting to NHS Direct/NHS24 using calls for three main
complaints – diarrhoea, vomiting and food poisoning. These were relatively crude
groupings and could have included non-IID related causes of diarrhoea and
vomiting. It seems that the food poisoning algorithm is rarely used by the nurses to
avoid attributing a particular cause to a constellation of symptoms.
8.2.8.3 Data availability
In Scotland NHS24 data only aggregated data were available to us and we had no
information on the sex of the caller or on call outcome. This limited our analysis of
those data, in particular with regard to the proportion of calls relating to diarrhoea
and vomiting in which the caller is advised to consult their GP.
8.2.9 Simulation Methods
We used simulation as a consistent framework for calculating uncertainty around
reporting ratios, both for overall IID and for organism-specific estimates. While less
intensive methods are available, we considered that simulation requires similar
assumptions to other methods, is equally valid and is more flexible, allowing data
from differents sources to be combined regardless of how the estimates in the
individual study components were derived.
Page 194 of 427
8.3 INTERPRETATION
8.3.1 Estimated rates of IID in the community in the UK
We used two methods to estimate rates of IID in the community – a Prospective
Cohort Study and a Telephone Survey of self-reported illness. The estimated rate of
IID in the community in the Prospective Cohort Study was within the range of
estimates from other prospective studies (Roy et al., 2006) and similar to the rates
obtained by de Wit et al. (2001) in the SENSOR study in the Netherlands (280 per
1,000 person-years) and Fox et al. (1972) in the United States (300 per 1,000
person-years). However, as with all international rate comparisons, case definitions,
recruitment, participation and follow-up in the various studies were different.
Similarly the estimated rates from the Telephone Survey (28-day recall) were within
the range reported in the international literature (Roy et al., 2006) but the same
caveats as those mentioned above apply. The rate estimates in the Telephone
Survey using a 28-day recall period were very close to the rates reported by Wheeler
et al. (1999) in the retrospective element of the IID1 Study (533 per 1,000 person-
years in IID2 versus 550 per 1,000 person-years in IID1). However, the Prospective
Cohort and Telephone Survey Studies in IID2 yielded very different results, which
might reflect differences in the methods of data collection in the two studies.
Although there was variation in the rate estimates by country in the Telephone
Survey the confidence intervals were wide so that there was little evidence that
differences between countries were important. We could find no external sources of
data that might have helped with further interpretation of these findings.
The annual rates from the Telephone Survey were between two and five
times higher than the rates from the Prospective Cohort Study, depending upon the
period of recall used. There are several possible explanations for the differences in
rates obtained.
First, sampling from people in the household at the time of the telephone call
might have meant that we selectively sampled people more likely to have had IID
(especially for 7-day recall) if they were at home recovering from their illness and
therefore available to answer the phone.
Secondly, the people who signed up to the Prospective Cohort Study were
given a detailed briefing about the study prior to giving consent to take part. It is
Page 195 of 427
possible, therefore, that they developed a better understanding of the definition of IID
and might have been more selective about what they reported than participants in
the Telephone Survey. Indeed there is some evidence that people in the Telephone
Survey might have reported milder illness – 31% reported two or less bouts of
diarrhoea on the worst day of their illness compared with 22% in the Prospective
Cohort Study. However, this difference was not enough to explain the discrepancy
in rates.
Thirdly, it is possible that the two study populations were different. The type
of person that agrees to comply with the procedures required to be a member of the
cohort is likely to be different from someone who is prepared to answer a short
duration, one-off telephone call.
Several factors indicate that rates from the Telephone Survey might
overestimate the incidence of IID. First, the estimated rates appear to be highly
sensitive to the period of recall used, suggesting that factors related to recall of
symptoms play an important role. Secondly, the rate of IID presenting to general
practice estimated from the Cohort Study was slightly higher than that estimated
from the GP Presentation Study, and both were within the same order of magnitude
as estimates from the GP Enumeration Study and an external estimate from the
RCGP Weekly Returns Service. Similarly, the rate of IID-related calls to NHS Direct
estimated in the Cohort is very close to that estimated from NHS Direct data. By
contrast, rates of IID presenting to general practice in the Telephone Survey were
considerably higher. Indeed, extrapolating the estimated rate based on 7-day results
in a projected eight million general practice consultations for IID in the UK, an
implausibly high figure. These findings suggest that the cohort approach provides
more reliable estimates, certainly for episodes of IID that involve health care contact.
Interestingly, 1 in 11 cases of IID reported having contacted their GP in both
the Cohort Study and the 7-day recall group of the Telephone Survey, while in the
28-day recall group the corresponding ratio was 1 in 6. This suggests that
Telephone Survey data results in consistently higher estimates of incidence and that
the phenomena of telescoping and selective recall appear to operate at different
timescales. Our findings indicate that IID is consistently reported with greater
frequency in the 7-day recall group relative to the Cohort Study, regardless of
whether contact with a GP is involved. This is consistent with findings reported by
Page 196 of 427
Cantwell et al. (2010). By contrast, a greater proportion of cases in the 28-day recall
group reported contacting their GP, suggesting that over this longer period of recall,
participants are more likely to recall illness that involved healthcare contact.
Consultation rates to NHS Direct in England and Wales and to NHS24
Scotland were a fraction of the incidence rates recorded in the telephone survey by
country. This probably reflects being prompted to recall illness in the telephone
survey, which the case might not have judged severe enough to contact healthcare
services.
It might be argued that we have chosen the most conservative rate estimate
as our study outcome. In our opinion, definite cases of IID provide the most relevant
measure of disease burden and are also most relevant for guiding policy. People in
the IID2 Study were asked to report symptoms that were presumed to be of
infectious origin, but neither the participants, nor we, can be certain that this was this
case in the absence of positive laboratory results. From a policy perspective, cases
that are laboratory negative are not particularly amenable to control measures. For
example, if a clinical definition of IID is very sensitive, incidence estimates will be
higher. However, if most cases are negative on laboratory testing how useful is that
clinical definition? It is noteworthy that the patterns and magnitude of incidence
estimates based on definite cases in IID2 showed good agreement with IID1 for all
organisms expect Salmonella, where a decline was expected (see Section 8.3.3).
8.3.2 Estimated rates of IID presenting to primary care in the UK
From the GP Presentation Study, we estimated the incidence of IID presenting to
general practice at 18 per 1,000 person-years. This equates to less than 2% of the
population consulting a GP for symptoms of IID every year, or about 1 million
consultations per year in the UK. Our estimate was about double that obtained from
the RCGP Weekly Returns Service, although it should be noted that these two sets
of data were collected using different methodologies. In particular, the diagnostic
codes used to capture IID are likely to be different. In addition, data from the RCGP
Weekly Returns Service can be used to exclude repeat consultations for the same
episode of illness, which was not possible in the IID2 GP Presentation Study. This
might have resulted in a slight overestimate of incidence.
Page 197 of 427
The incidence of IID case presenting to primary care in our study is around
twice as high as in a similar study in the Netherlands (8 per 1,000 person-years) (de
Wit et al., 2001a) but around half as much as that found in north-west Germany (40
per 1,000 person years) (Karsten et al., 2009). Differences in case definitions and
healthcare systems might explain at least part of the difference observed.
Less than half of the people who contacted NHS Direct and were advised to
contact their GP subsequently did so. However, callers with uncomplicated
diarrhoea and/or vomiting are advised to self-care with home treatment. Callers are
only advised to contact their primary care service if their symptoms are complex or
worsen. The short-lived nature of diarrhoea and vomiting is likely to mean that a
significant percentage of callers will have identified their symptoms as non-
worsening, been able to self-care to manage their symptoms, or recovered
sufficiently, so that contacting their GP becomes unnecessary. This is likely to
account for the relatively low percentage of people advised to contact their GP who
are estimated by the study to have actually done so.
8.3.3 Aetiology of IID in the UK
No pathogen was detected in a large percentage of stool samples submitted by
people who reported symptoms of IID. This was despite the fact that the majority of
people submitted their sample within 10 days of symptom onset. The case definition
in the IID2 Study was very sensitive but, in order to compare IID2 Study data with
IID1, we needed to use the same case definition. We did not define the term
“diarrhoea” to participants so it is possible that we detected transient changes in
bowel habit not caused by IID. Alternatively, we might have missed cases of IID due
to organisms that we did not include in our diagnostic algorithms.
Norovirus was the most common viral cause of IID in the community in the UK
and Campylobacter spp., one of the Food Standards Agency‟s target organisms,
was the most common bacterial cause. The high proportion of sapovirus
identifications is consistent with the fact that the IID2 Study data collection coincided
with the introduction of a completely new genotype into the population (Jim Gray,
Tom McDonnell - personal communication).
Norovirus, sapovirus and Campylobacter infection all featured prominently in
GP Presentation Study samples. As regards norovirus and sapovirus this probably
Page 198 of 427
reflects the fact that young children were more likely to be affected. Campylobacter
infection, on the other hand, might lead to more severe symptoms prompting the
case to present to their GP (Tam et al., 2003).
The prevalence of norovirus can fluctuate quite widely from year to year
(Siebenga et al., 2009) so it might be argued studying a one-year cohort would either
over- or under-estimate viral IID burden. We note that, compared with the revised
incidence estimates for IID1 (Phillips et al., 2010), the IID2 study incidence estimates
are quite similar. The proportion of samples positive for norovirus in cases
presenting to primary care in our study was similar to studies conducted in Germany
(Karsten et al., 2009), Switzerland (Fretz et al., 2005), Australia (Sinclair et al., 2005)
and the Netherlands in 1999 (de Wit et al., 2001a) but less that in an Austrian study
conducted in 2007 (Huhulescu et al., 2009). The incidence of norovirus IID
presenting to primary care in our study (210 cases per 100,000) was around a third
of that found in north-west Germany in 2004 (626 cases per 100,000) (Karsten et al.,
2009). As well as the emergence of new genotypes (Siebenga et al., 2009)
differences in study design, sample sizes and case definitions might also explain at
least some of the differences described here.
In relation to the findings on rotavirus it should be noted that routine
vaccination had not been implemented in the UK at the time of the IID2 Study.
These data will provide useful background information for assessing the
effectiveness of a vaccine if it is introduced into the UK schedule.
The proportion of samples positive for the Food Standards Agency‟s
remaining target organisms in the community was very low (C. perfringens,
Salmonella spp., Listeria monocytogenes, E. coli O157 (all <1% and Listeria
monocytogenes (0%)) and the findings were similar for cases presenting to general
practice (Salmonella spp. <1%, C. difficile 1.4%, C. perfringens 2.2% and Listeria
monocytogenes 0%).
There was only one case of C. difficile-associated diarrhoea in the
Prospective Cohort Study and 10 cases in the GP Presentation Study, which
suggests that in unselected community samples, i.e. from people who have not
necessarily had recent or frequent contact with health or social care, the incidence of
C. difficile-associated diarrhoea is very low. However, based on the study design and
Page 199 of 427
case definition, we could only detect the fraction of listeriosis and C. difficile infection
that was associated with diarrhoeal disease. We did not capture the systemic
complications associated with either infection so we have underestimated their
clinical impact. Similarly, we did not collect any risk factor data in the IID2 Study (e.g.
hospital stays or antibiotic usage) that might have been useful in interpreting the C.
difficile results.
8.3.4 Comparing IID1 with IID2 in England
8.3.4.1 IID rates in the community
A major consideration when assessing rates from the IID1 and IID2 studies relates to
the comparability of the two cohorts. Participation in IID1 was higher than in IID2 but
the reporting fatigue was also more marked. It is difficult to assess the impact these
differences in participation and follow-up, which might or might not influence the
validity of the comparisons between the two studies. Rates in both studies were
standardised to account for differences between the cohort populations and the UK
census populations at the time of each study. The UK age-sex structure had not
changed much between IID1 and IID2.
To the degree that comparing the two cohorts is valid, the estimated rate of
IID in the community in England was high (274 per 1,000 person-years) and over
40% higher than in IID1 (194 per 1,000 person-years).
8.3.4.2 IID rates presenting to primary care
The estimated rate of IID presenting to primary care was approximately half that in
IID1 for all IID and across all organisms that we looked for. This might reflect the
changes in healthcare usage that have taken place between the two study periods
since we observed similar reductions in consultation rates in the RCGP Weekly
Returns Service. We noted that although the consultation rates had, in general,
halved the consultation rates for people with Salmonella infection had reduced eight-
fold. There have been major changes in the epidemiology of salmonellosis in the
intervening years, mainly a large decline in S. Enteritidis Phage Type 4, and it is
possible that the illness is milder than it was, leading to fewer consultations. The fall
in GP Presentation rates that we observed is not attributable to NHS Direct/NHS24
since the proportion of people with IID in the community contacting those services
was very small (≈2%).
Page 200 of 427
8.3.4.3 Re-calibrating national surveillance – reporting patterns
Introducing molecular methods into the IID2 Study improved diagnostic yield by
approximately 10%. Given the improvements in detection methods that have taken
place between the IID1 and IID2 studies, especially for viruses, we used a revised
reporting pattern for norovirus, based on PCR-based testing of archived specimens
from IID1 (Phillips et al., 2010).
The ratio of IID cases in the community to those reported to national
surveillance has changed. In the IID1 Study the ratio was ≈1:85 compared with
≈1:150 in the IID2 Study. This means that, not only has the overall incidence of IID
increased, but the proportion that is hidden from national surveillance systems has
also increased. The reason that the hidden burden has increased appears to be
because fewer cases are presenting to, and are therefore visible to, health services.
It was notable that the ratio of cases reported to national surveillance to cases
presenting to primary care had improved for all IID and for all the pathogens that we
considered. It suggests that a greater proportion of cases presenting to the GP are
being reported and, presumably, also reflects better data capture from diagnostic
laboratories reporting to national surveillance systems.
For Salmonella the ratio of cases in the community to those reported to
national surveillance was similar (≈1:4 in IID1 to ≈1:5 in IID2). The reporting patterns
for rotavirus and Campylobacter were similar in the two studies but the ratio of
cases of norovirus reported to national surveillance to cases in the community had
changed from ≈1:1000 to ≈1:300. This might be due to improvements in diagnostic
methods used in routine practice. However, it needs to be interpreted cautiously
since norovirus cases reported to national surveillance tend to reflect outbreak cases
rather than sporadic cases.
We were unable to determine if changes in the community rates of particular
organisms were greater than could be explained by chance alone, because the IID2
study was not powered for these outcomes. Although not designed specifically to
measure changes in individual pathogens, particularly in the cohort, in the context of
other evidence (e.g. Gillespie et al., 2005; Matheson et al., 2010; Gormley et al.,
2011), the IID2 Study provides support for a decline in Salmonella incidence in
recent years. To have detected statistically significant changes in incidence for
Page 201 of 427
individual pathogens would have required several hundred thousand person-years of
follow-up, which was considered to be unaffordable.
8.3.4.4 IID acquired outside the UK
Around 8% of people in the Prospective Cohort Study and 12% of people in the GP
Presentation Study with IID reported having travelled outside the UK in the 10 days
prior to illness onset. It should be noted, however, that this study was not specifically
designed to estimate the incidence of travel-related IID. In particular, we did not
have an estimate for the frequency of recent foreign travel from a similar group of
individuals without IID for comparison, and our study might not have captured cases
that occurred outside the UK but had already resolved by the time individuals
returned to the UK. In addition, participants might not have reported symptoms while
they were abroad. It should be noted that we excluded travel-related cases from all
the incidence calculations.
8.4 CONCLUSIONS
We conclude that:-
Around 25% of people in the UK suffer from an episode of IID in a year.
Approximately 50% of people with IID reported absence from work or school
because of their symptoms. We estimated that for every case of IID in the UK
reported to national surveillance systems there were 147 in the community.
The most commonly identified pathogens were, in order of frequency,
norovirus, sapovirus, rotavirus and Campylobacter spp.. C. perfringens,
Salmonella spp. was found in <1% of samples from IID cases. L.
monocytogenes was not found.
Less than 2% of people in the UK consulted their General Practitioner for an
episode of IID and about 1 in 18 of these is reported to national surveillance in
the UK. The most commonly identified pathogens were Campylobacter spp.,
norovirus, sapovirus and rotavirus. Salmonella were detected in only 0.8% of
cases. This was less than cases of C. perfringens (2.2%), Enteroaggregative
E. coli (1.4%), Cryptosporidium (1.4%) or Giardia (1.0%).
Page 202 of 427
There was only one case of C. difficile-associated diarrhoea in the
Prospective Cohort Study and 10 cases in the GP Presentation Study.
Approximately 8% of community IID cases reported having travelled outside
the UK in the 10 days prior to illness onset. Among cases of IID presenting to
general practice, the corresponding figure was 12%.
There was variation in the IID rate estimates by country in the Telephone
Survey but the confidence intervals were wide and there was insufficient
evidence to determine if these differences were important.
The estimated rate of IID in England was 43% higher in 2008-9 (IID2) than in
1993-6 (IID1) whilst the estimated rate of IID presenting to General Practice in
England in IID2 was 50% lower than in IID1.
Approximately 50% of people with an episode of IID in IID1 and IID2 reported
absence from work or school because of their symptoms.
In England, the ratio between cases reported to national surveillance to those
occurring in the community had changed from ≈1:85 in IID1 to ≈1:150 in IID2.
For norovirus, the change was from ≈1:1000 in IID1 to ≈1:300 in IID2. The
ratios for Campylobacter, Salmonella and rotavirus were similar in both
studies.
Based on a re-analysis of IID1 Study data, using molecular methods in the
IID2 Study increased the diagnostic yield to 40% compared with IID1 (30%) in
the Prospective Cohort Study.
Although the hidden burden of IID had increased between the two study
periods, because fewer people with IID present to general practice, reporting
to national surveillance of cases presenting to general practice had improved
i.e. national surveillance data capture of cases presenting to healthcare had
improved between IID1 and IID2 for all the pathogens that we considered.
A very small proportion of people with IID (≈2%) contacted NHS Direct or
NHS24, and this was insufficient to account for the observed drop in rates of
consultation to general practice.
From the Telephone Survey we estimated that the rate of IID in the
community in the UK was 1,530 cases per 1,000 person-years using 7-day
Page 203 of 427
recall (i.e. five times higher than the rate in the Prospective Cohort Study) and
533 cases per 1,000 person-years using 28-day recall i.e. twice as high as in
the Prospective Cohort Study). We also found evidence that rates differ
according to the period of recall.
To attempt to understand the variation in community rates in the two types of
study we triangulated rates around presentation to General Practice. The
rates from the Prospective Cohort Study, the GP Presentation Study, the GP
Enumeration Study and an external data source (the RCGP Weekly Returns
Service) were all of a similar order of magnitude and substantially less than in
the Telephone Survey. We suggest, therefore, that the cohort approach might
provide more reliable estimates, at least for episodes of IID that involve
healthcare contact.
8.5 RECOMMENDATIONS
8.5.1 Recommendations for laboratory diagnostics
As diagnostic methods become more sensitive, there is a need to define
adequate cut-off points for the diagnosis of clinically significant positive results
based on real time PCR methods. Preliminary work on this has been
undertaken for norovirus and rotavirus and similar work, using samples from
appropriate controls, is necessary for other organisms.
If cut-off points of sufficient sensitivity and specificity are found, given the
improvement in diagnostic yield witnessed in this study, the cost-effectiveness
of introducing PCR-based methods in routine diagnostics needs to be
investigated.
8.5.2 Recommendations for estimating illness burden and trends
The appropriate methods to estimate illness burden and trends depend on the
question to be answered.
o Measuring disease incidence is difficult whichever method is chosen.
Both telephone surveys and cohort studies are subject to bias. An
alternative to measuring incidence would be to measure longitudinal
prevalence (Morris et al., 1996) i.e. the proportion of people with IID on
Page 204 of 427
the day of the survey, with no recall involved. In certain circumstances,
longitudinal prevalence can be a more useful measure of disease
burden, as it measures the proportion of time during which individuals
are ill. The advantages of this method are that it avoids difficulties in
defining incident (new) cases of illness, and can potentially eliminate
inaccurate recall if participants are asked about illness on the day of
contact. Although this requires larger studies, continuous syndromic
surveillance mechanisms can be set up to estimate longitudinal
prevalence of many conditions simultaneously, and the data analysed
cumulatively. It should be noted, however, that longitudinal prevalence
is influenced not just by risk of illness, but also by illness duration, and
so is not appropriate for studies in which the distinction between these
two features is important.
o Trend information on overall IID can be captured through telephone
surveys or cohort studies but telephone surveys are, of course,
considerably cheaper. The drawbacks of using telephone surveys,
however, are inaccuracy in burden estimation and lack of information
on the aetiology of IID, which is important for policy-making.
o In future, capturing information on the frequency of illness through
internet-based surveys using volunteers is likely to become more
commonplace.
Calibrating national surveillance data requires knowledge of the organisms
causing IID.
o An alternative to an IID3 Study would be to implement some form of
continuous sentinel surveillance including stool sample requests from
all cases, for example attached to the RCGP WRS. It is possible that
primary care electronic datasets might provide an alternative to GP
Presentation studies if data entry can be improved although stool
samples for laboratory examination are not always requested from (or
provided by) all IID cases.
o Interpreting positive laboratory results in the absence of a control group
is challenging. Cycle threshold cut-off values need to be validated in
Page 205 of 427
this context, taking into account variations in laboratory techniques and
sample populations. In future studies, and depending on available
funding, cohort members could be used as their own controls e.g.
obtaining samples at baseline or at other times during follow-up when
participants are not symptomatic.
o The increasing use of electronic methods, such as e-mail, for collecting
health information is accompanied by concerns that those taking part in
epidemiological studies are an increasingly selected subset of the
population. The gradual uptake of these electronic forms of
communication should, however, offset some of these concerns. In our
study, two-thirds of participants elected to be followed up weekly by e-
mail. Those choosing e-mail were generally younger, but weekly
response rates between the two groups were comparable. Our
experience suggests that offering participants a range of options for
collecting information can improve response rates by allowing them to
choose the most convenient form of communication, while substantially
reducing workload and providing more timely information.
8.5.3 Recommendations for Policy
Our findings suggest that:-
IID continues to represent a significant disease burden in the UK, so that
further efforts to control the pathogens causing IID are needed.
Campylobacter spp. remains an important public health problem so that the
Food Standards Agency continued focus on tackling foodborne
Campylobacter to reduce levels of IID is warranted.
From the point of view of the Food Standards Agency, further work is needed
to understand the burden of norovirus infection, in particular the proportion of
norovirus infection that might be food-related.
The increase in sapovirus due to the emergence of a new genotype highlights
the need for continual surveillance and horizon scanning to identify new and
emerging pathogens.
Page 206 of 427
REFERENCES
ACMSF, 2009. Ad Hoc Group on Vulnerable Groups: Report on the Increased
Incidence of Listeriosis in the UK. London: Food Standards Agency
(FSA/1439/0709).
Adak GK, Long SM, O'Brien SJ (2002). Trends in indigenous foodborne disease and
deaths, England and Wales: 1992 to 2000. Gut 51: 832-41.
Amar CFL, Dear PH, McLauchlin J (2003). Detection and genotyping by real-time
PCR/RFLP analyses of Giardia duodenalis from human faeces. J Med Microbiol
52:681-683.
Amar CFL, Dear PH, McLauchlin J (2004a). Detection and identification by real-time
PCR/RFLP analyses of Cryptosporidium species from human faeces. Lett Appl
Microbiol 38: 217-222.
Amar CFL, East CL, Grant KA, Gray J, Iturriza-Gomara M, Maclure EA, McLauchlin
J (2005). Detection of viral, bacterial and parasitological RNA or DNA of nine
intestinal pathogens in faecal samples archived as part of the English Infectious
Intestinal Disease Study: assessment of the stability of target nucleic acid. Diagn Mol
Pathol 14: 90-6.
Amar CF, East CL, Gray J, Iturriza-Gomara M, Maclure EA, McLauchlin J (2007).
Detection by PCR of eight groups of enteric pathogens in 4,627 faecal samples: re-
examination of the English case-control Infectious Intestinal Disease Study (1993-
1996). Eur J Clin Microbiol Infect Dis 26(5): 311-23.
Atchison CJ, Lopman BA, Harris CJ, Tam CC, Iturriza Gómara M, Gray JJ (2009).
Clinical laboratory practices for the detection of rotavirus in England and Wales: can
surveillance based on routine laboratory testing data be used to evaluate the impact
of vaccination. Euro Surveill 14: 1-6.
Best EL, Powell EJ, Swift C, Grant KA, Frost JA (2003) Applicability of a rapid duplex
real-time PCR assay for speciation of Campylobacter jejuni and Campylobacter coli
directly from culture plates. FEMS Microbiol Let. 229: 237-241.
Boland M, Sweeney MR, Scallan E, Harrington M, Staines A (2006). Emerging
advantages and drawbacks of telephone surveyingTelephone Surveying in public
health research in Ireland and the U.K. BMC Public Health 6: 208.
Page 207 of 427
Boom R, Sol CJ, Salimans MM, Jansen CL, Wertheim-van Dillen PM, van der
Noordaa J. (1990 )Rapid and simple method for purification of nucleic acids. J Clin
Microbiol 28(3): 495–503.
Brazier JS, Raybould R, Patel B, Duckworth G, Pearson A, Charlett A, Duerden BI
(2008). Distribution and antimicrobial susceptibility patterns of Clostridium difficile
PCR ribotypes in English hospitals, 2007-08. Euro Surveill 13: 41.
Buzby JC, Roberts T. (2009). The economics of enteric infections: human foodborne
disease costs. Gastroenterology 136: 1851-1862.
Cantwell LB, Henao OL, Hoekstra RM, Scallan E (2010 ). The effect of different
recall periods on estimates of acute gastroenteritis in the United States, FoodNet
Population Survey 2006-2007. Foodborne Pathog Dis. Jun 26 [E-pub ahead of print].
Carlin JB, Li N, Greenwood P, Coffey C. (2003). Tools for analyzing multiple imputed
datasets. Stata Journal; 3(3): 226-244.
Chief Medical Officer. (1992). Definition of food poisoning (PL/CMO(92)14).
Department of Health: London.
Chisholm J (1990). The Read clinical classification. BMJ 300(6732): 1092.
Cooper DL, Smith GE, O'Brien SJ, Hollyoak VA, Baker M (2003). What can analysis
of calls to NHS direct tell us about the epidemiology of gastrointestinal infections in
the community? J Infect 46: 101-5.
Doll R (1991). Progress against cancer. An epidemiological assessment. The 1991
John C Cassel Memorial Lecture. Am J Epidemiol 134: 675-88.
Fleming DM, Smith GE, Charlton JR, Charlton J, Nicoll A (2002). Impact of infections
on primary care – greater than expected. Commun Dis Public Health 5: 7-12.
Flint JA, Duynhoven YT, Angulo FJ, DeLong SM, Braun P, Kirk M, Scallan E,
Fitzgerald M, Adak GK, Sockett P, Ellis A, Hall G, Walke H, Braam P (2005).
Estimating the burden of acute gastroenteritis, foodborne disease, and pathogens
commonly transmitted by food: an international review. Clin Infect Dis 41: 693-704.
Frahm E, Obst U (2003). Application of the fluorogenic probe technique (TaqMan
PCR) to the detection of Enterococcus spp. and Escherichia coli in water samples. J
Microbiol Methods 52:123-131.
Page 208 of 427
Food Standards Agency (2000). A report of the study of infectious intestinal disease
in England. London: The Stationery Office.
Food Standards Agency (2001). Strategic Plan 2001-2006: Putting Consumers First.
Available at < http://www.food.gov.uk/multimedia/pdfs/stratplan.pdf> Accessed 21st
July 2010.
Food Standards Agency (2002). Measuring foodborne illness levels. Available at <
http://www.food.gov.uk/safereating/microbiology/58736> Accessed 21st July 2010.
Fox JP, Hall CE, Cooney MK, Luce RE, Kronmal RA (1972). The Seattle virus
watch. II. Objectives, study population and its observation, data processing and
summary of illnesses. Am J Epidemiol 96(4): 270-85.
Fretz R, Herrmann L, Christen A, Svoboda P, Dubuis O, Viollier EH, Tanner M,
Baumgartner A (2005). Frequency of Norovirus in stool samples from patients with
gastrointestinal symptoms in Switzerland. Eur J Clin Microbiol Infect Dis 24(3):214-6.
Gill LJ, Shand PAX, Fuggle P, Dugan B, Davies SC (1997). Pain assessment for
children with sickle cell disease: improved validity of diary keeping versus interview
ratings. Br J Health Psychol 2: 131–140.
Gillespie IA, O'Brien SJ, Adak GK, Ward LR, Smith HR (2005). Foodborne general
outbreaks of Salmonella Enteritidis phage type 4 infection, England and Wales,
1992-2002: where are the risks? Epidemiol Infect. 133(5):795-801.
Gillespie IA, McLauchlin J, Little CL, Penman C, Mook P, Grant K, O'Brien SJ
(2009). Disease presentation in relation to infection foci for non-pregnancy-
associated human listeriosis in England and Wales, 2001 to 2007. J Clin Microbiol
47(10): 3301-7.
Gormley FJ, Little CL, Rawal N, Gillespie IA, Lebaigue S, Adak GK (2011). A 17-year
review of foodborne outbreaks: describing the continuing decline in England and
Wales (1992-2008). Epidemiol Infect. 139(5):688-99.
Green J, Norcott JP, Lewis D, Arnold C, Brown DW (1993). Norwalk-like viruses:
demonstration of genomic diversity by polymerase chain reaction. J Clin Microbiol
31: 3007-3012.
Page 209 of 427
Grif K, Patscheider G, Dierich MP, Allerberger F (2003). Incidence of fecal carriage
of Listeria monocytogenes in three healthy volunteers: a one-year prospective stool
survey. Euro J Clin Microbiol Infect Dis. 22:16-20.
Huang H, Weintraub A, Fang H, Nord CE (2009). Comparison of a commercial
multiplex real-time PCR to the cell cytotoxicity neutralization assay for diagnosis of
Clostridium difficile infections. J Clin Microbiol 47(11): 3729-31.
Huhulescu S, Kiss R, Brettlecker M, Cerny RJ, Hess C, Wewalka G, Allerberger F
(2009) . Etiology of acute gastroenteritis in three sentinel general practices, Austria
2007. Infection 37(2):103-8.
Iturriza Gomara M, Wong C, Blome S, Desselberger U, Gray J (2002). Molecular
characterization of VP6 genes of human rotavirus isolates: correlation of genogroups
with subgroups and evidence of independent segregation. J Virol 76: 6596-6601.
Iturriza Gómara M, Simpson R, Perault AM, Redpath C, Lorgelly P, Joshi D, Mugford
M, Hughes CA, Dalrymple J, Desselberger U, Gray J (2008). Structured surveillance
of infantile gastroenteritis in East Anglia, UK: incidence of infection with common
viral gastroenteric pathogens. Epidemiol Infect 136(1): 23-33.
Iturriza-Gómara M, Elliot AJ, Dockery C, Fleming DM, Gray JJ (2009). Structured
surveillance of infectious intestinal disease in pre-school children in the community:
„The Nappy Study‟. Epidemiol Infect 137(7): 922-31.
Jensen A (1993). Listeria monocytogenes isolation from human faecal specimens:
experiments with the selective media, PALCAM and L-PALCAMY. Lett Appl
Microbiol 16(1): 32-5.
Jordan H, Roderick P, Martin D (2004). The Index of Multiple Deprivation 2000 and
accessibility effects on health. J Epidemiol Community Health 58(3): 250-7.
Kageyama T, Kojima S, Shinohara M, Uchida K, Fukushi S, Hoshino FB, Takeda N,
Katayama K (2003). Broadly reactive and highly sensitive assay for Norwalk-like
viruses based on real-time quantitative reverse transcription-PCR. J Clin Microbiol
41: 1548-1557.
Page 210 of 427
Karsten C, Baumgarte S, Friedrich AW, von Eiff C, Becker K, Wosniok W, Ammon A,
Bockemühl J, Karch H, Huppertz HI (2009). Incidence and risk factors for
community-acquired acute gastroenteritis in north-west Germany in 2004. Eur J Clin
Microbiol Infect Dis 28(8):935-43.
Marcus AC (1982). Memory aids in longitudinal health surveys: results from a field
experiment. American Journal of Public Health 72: 567–573.
Majowicz SE, Hall G, Scallan E, Adak GK, Gauci C, Jones TF, O'Brien S, Henao O,
Sockett PN (2008). A common, symptom-based case definition for gastroenteritis.
Epidemiol Infect 136: 886-894.
Matheson N, Kingsley RA, Sturgess K, Aliyu SH, Wain J, Dougan G, Cooke FJ
(2010). Ten years experience of Salmonella infections in Cambridge, UK. J Infect.
60(1):21-5.
McCormick A (1993). The notification of infectious diseases in England and Wales.
Communicable Disease Report CDR Review 2: R19-R25.
McLauchlin J, Pedraza-Díaz S, Amar-Hoetzeneder C, Nichols GL (1999). Genetic
characterization of Cryptosporidium strains from 218 patients with diarrhea
diagnosed as having sporadic cryptosporidiosis J Clin Microbiol 37: 3153-3158.
Murphy NM, McLauchlin J, Ohai C, Grant KA (2007). Construction and evaluation of
a microbiological positive process internal control for PCR-based examination of
food samples for Listeria monocytogenes and Salmonella enterica. Int J Food
Microbiol 120(1-2): 110-9.
Morris SS, Cousens SN, Kirkwood BR, Arthur P, Ross DA (1996). Is prevalence of
diarrhea a better predictor of subsequent mortality and weight gain than diarrhea
incidence? Am J Epidemiol 144(6): 582-8.
Møller Nielsen E and Thorup Andersen M (2003). Detection and Characterization of
Verocytotoxin-Producing Escherichia coli by Automated 5‟ Nuclease PCR assay. J
Clin Microbiol 41: 2884-2893.
Murphy NM, McLauchlin J, Ohai C, Grant KA (2007). Construction and evaluation of
a microbiological positive process internal control for PCR-based examination of
food samples for Listeria monocytogenes and Salmonella enterica. Int J Food
Microbiol. 120(1-2): 110-9.
Page 211 of 427
Musher DM (2004). Contagious acute gastrointestinal infections. N Engl J Med 351:
2417-2427.
Noel JS, Liu BL, Humphrey CD, Rodriguez EM, Lambden PR, Clarke IN, Dwyer DM,
Ando T, Glass RI, Monroe SS (1997). Parkville virus: a novel genetic variant of
human calicivirus in the Sapporo virus clade, associated with an outbreak of
gastroenteritis in adults. J Med Virol 52:173-178.
Novak-Weekley SM, Marlowe EM, Miller JM, Cumpio J, Nomura JH, Vance PH,
Weissfeld A (2010). Clostridium difficile testing in the clinical laboratory using
multiple testing algorithms. J Clin Microbiol 48(3): 889-893.
O‟Brien SJ, Elson R, Gillespie IA, Adak GK, Cowden JM (2002). Surveillance of
foodborne outbreaks of infectious intestinal disease in England and Wales 1992-
1999: contributing to evidence-based food policy? Public Health 116(2): 75-80.
O'Brien SJ, Rait G, Hunter PR, Gray JJ, Bolton FJ, Tompkins DS, McLauchlin J,
Letley LH, Adak GK, Cowden JM, Evans MR, Neal KR, Smith GE, Smyth B, Tam
CC, Rodrigues LC (2010). Methods for determining disease burden and calibrating
national surveillance data in the United Kingdom: the second study of infectious
intestinal disease in the community (IID2 study). BMC Med Res Methodol 10: 39.
Oka T, Katayama K, Hansman GS, Kageyama T, Ogawa S, Wu FT, White PA,
Takeda N. (2006). Detection of human sapovirus by real-time reverse transcription-
polymerase chain reaction. J Med Virol 78(10): 1347-53.
Parkhill J, Wren BW, Mungall K, Ketley JM, Churcher C, Basham D, Chillingworth
T, Davies RM, Feltwell T, Holroyd S, Jagels K, Karlyshev AV, Moule S, Pallen MJ,
Penn CW, Quail MA, Rajandream MA, Rutherford KM, van Vliet AH, Whitehead S,
Barrell BG (2000). The genome sequence of the food-borne pathogen
Campylobacter jejuni reveals hypervariable sequences. Nature 403(6770): 665-8.
Pawlowski SW, Warren CA, Guerrant R (2009). Diagnosis and treatment of acute or
persistent diarrhea. Gastroenterology 136: 1874-1886.
Phillips G, Lopman B, Tam CC, Iturriza-Gomara M, Brown D, Gray J (2009a).
Diagnosing norovirus-associated infectious intestinal disease using viral load. BMC
Infect Dis 9: 63.
Page 212 of 427
Phillips G, Lopman B, Tam CC, Iturriza-Gomara M, Brown D, Gray J (2009b).
Diagnosing rotavirus A associated IID: Using ELISA to identify a cut-off for real time
RT-PCR. J Clin Virol 44(3): 242-5.
Phillips G, Tam CC, Conti S, Rodrigues L C, Brown D, Iturriza-Gomara M, Gray J,
Lopman B (2010). Community Incidence of Norovirus-associated Infectious Intestinal
Disease in England: Improved Estimates Using Viral Load for Norovirus Diagnosis.
Am J Epidemiol 171(9): 1014-1022.
Roberts JA, Cumberland PA, Sockett P, Rodrigues LC, Wheeler JG, Sethi D,
Roderick PJ (2003). The study of infectious intestinal disease in England: socio-
economic impact. Epidemiol Infect 130 (3): 1-11.
Roy SL, Scallan E, Beach MJ (2006). The rate of acute gastrointestinal illness in
developed countries. J Water Health 4(Suppl. 2): 31-70.
Royston P (2005). Multiple imputation of missing values: update. Stata Journal 5(2):
1-14.
Rubin DB (2004). Multiple imputation for nonresponse in surveys (2nd Ed.). Wiley-
Blackwell.
Scallan E, Fitzgerald M, Collins C, Crowley D, Daly L, Devine M, Igoe D, Quigley T,
Robinson T, Smyth B (2004). Acute gastroenteritis in northern Ireland and the
Republic of Ireland: a telephone survey. Commun Dis Public Health 7(1): 61-7.
Scallan E, Majowicz SE, Hall G, Banerjee A, Bowman CL, Daly L, Jones T, Kirk MD,
Fitzgerald M, Angulo FJ (2005). Prevalence of diarrhoea in the community in
Australia, Canada, Ireland, and the United States. Int J Epidemiol 34: 454-60.
Siebenga JJ, Vennema H, Zheng DP, Vinjé J, Lee BE, Pang XL, Ho EC, Lim W,
Choudekar A, Broor S, Halperin T, Rasool NB, Hewitt J, Greening GE, Jin M, Duan
ZJ, Lucero Y, O'Ryan M, Hoehne M, Schreier E, Ratcliff RM, White PA, Iritani N,
Reuter G, Koopmans M (2009). Norovirus illness is a global problem: emergence
and spread of norovirus GII.4 variants, 2001-2007. J Infect Dis 200(5):802-12.
Simpson R, Aliyu S, Iturriza-Gómara M, Desselberger U, Gray J (2003). Infantile viral
gastroenteritis: on the way to closing the diagnostic gap. J Med Virol 70: 258-62.
Page 213 of 427
Sinclair MI, Hellard ME, Wolfe R, Mitakakis TZ, Leder K, Fairley CK (2005).
Pathogens causing community gastroenteritis in Australia. J Gastroenterol Hepatol.
20(11):1685-90.
Smith G, Hippisley-Cox J, Harcourt S, Heaps M, Painter M, Porter A, Pringle M
(2007). Developing a national primary care-based early warning system for health
protection – a surveillance tool for the future? J Public Health (Oxf) 29: 75-82.
Strickland MJ, Crawford JM, Shen L, Wilkins JR 3rd (2006). Time-dependent record
keeping fatigue among youth completing health diaries of unintentional injuries. J
Safety Res 37: 487-492.
Swindells J, Brenwald N, Reading N, Oppenheim B. (2010). An Evaluation of
Diagnostic Tests for Clostridium difficile Infection. J Clin Microbiol 48(2): 606-608.
Tam CC, Rodrigues LC, O'Brien SJ (2003). The study of infectious intestinal disease
in England: what risk factors for presentation to general practice tell us about
potential for selection bias in case-control studies of reported cases of diarrhoea. Int
J Epidemiol 32(1): 99-105.
Thomas MK, Majowicz SE, MacDougall L, Sockett PN, Kovacs SJ, Fyfe M, Edge VL,
Doré K, Flint JA, Henson S, Jones AQ (2006). Population distribution and burden of
acute gastrointestinal illness in British Columbia, Canada. BMC Public Health 6: 307.
Tiemessen CT, Nel MJ (1996). Detection and typing of subgroup F adenoviruses
using the polymerase chain reaction. J Virol Methods 59(1-2):73-82.
Tompkins DS, Hudson MJ, Smith HR, Eglin RP, Wheeler JG, Brett MM, Owen RJ,
Brazier JS, Cumberland P, King V, Cook PE. (1999). A study of infectious intestinal
disease in England: microbiological findings in cases and controls. Commun Dis
Public Health 2(2): 108-13.
UK Biobank Co-ordinating Centre (2006). UK Biobank: Report of the integrated pilot
phase. Available at <http://www.ukbiobank.ac.uk/docs/IntegratedPilotReport.pdf>.
Accessed 20th July 2010.
Verbrugge LM (1980). Health diaries. Med Care 18: 73–95.
Wall PG, de Louvois J, Gilbert RJ, Rowe B. (1996). Food poisoning: notifications,
laboratory reports, and outbreaks – where do the statistics come from and what do
they mean? Communicable Disease Report CDR Review 6: R93-R100.
Page 214 of 427
Westgard JO, Groth T, Aronsson T, Falk H, de Verdier C-H (1997). Performance
characteristics of rules for internal quality control : probabilities for false rejection and
error detection. Clin Chem 23: 1857-67.
Wheeler JG, Sethi D, Cowden JM, Wall PG, Rodrigues LC, Tompkins DS, Hudson
MJ, Roderick PJ (1999). Study of infectious intestinal disease in England: rates in
the community, presenting to general practice, and reported to national surveillance.
The Infectious Intestinal Disease Study Executive. BMJ 318(7190): 1046-50.
de Wit MA, Koopmans MP, Kortbeek LM, Wannet WJ, Vinje J, van Leusden F,
Bartelds AI, van Duynhoven YT (2001). Sensor, a population-based cohort study on
gastroenteritis in the Netherlands: incidence and etiology. Am J Epidemiol 154: 666-
74.
de Wit MA, Koopmans MP, Kortbeek LM, van Leeuwen NJ, Bartelds AI, van
Duynhoven YT (2001a). Gastroenteritis in sentinel general practices, The
Netherlands. Emerg Infect Dis. 7(1): 82-91.
de Wit MA, Koopmans MP, Kortbeek LM, van Leeuwen NJ, Vinjé J, van Duynhoven
YT (2001b). Etiology of gastroenteritis in sentinel general practices in The
Netherlands. Clin Infect Dis 33(3):280-8.
Page 215 of 427
ANNEX: SUPPLEMENTARY RESULTS
Chapter 4 Annex Title Page
Table A4.1 Distribution of IID2 Enumeration and GP Presentation
practices by practice list size and number of GPs
217
Table A4.2 Age and sex distribution of Cohort Study participants
compared with the UK census population
218
Table A4.3 Distribution of Cohort Study participants by ethnic
group, socioeconomic classification, area-level
deprivation and urban-rural classification, compared
with the UK population
219
Table A4.4 Number and percentage of Cohort Study participants
choosing email and postcard follow-up
220
Table A4.5 Reasons for dropping out among IID2 Cohort
participants
220
Table A4.6 Factors associated with dropping out of the Cohort
Study – Results from multivariable logistic regression.
221
Figure A4.1 Factors associated with submitting a questionnaire
among Cohort Study participants reporting symptoms
of diarrhoea and/or vomiting – Odds ratios (ORs) and
95% CIs from multivariable logistic regression
222
Table A4.7 Age and sex structure of Telephone Survey
participants compared with the UK census population
223
Table A4.8 Distribution of ethnic group among Telephone Survey
participants relative to the UK census population
225
Table A4.9 Distribution of household size among Telephone
Survey participants compared with the UK census
population
226
Table A4.10 Distribution of area-level deprivation among
Telephone Survey participants compared with the UK
census population
227
Page 216 of 427
Title Page
Table A4.11 Distribution of urban-rural classification among
Telephone Survey participants compared with the UK
census population
228
Table A4.12 Percentage of definite cases with specimens
requested by age group – GP Enumeration Study
229
Table A4.13 Percentage of specimens submitted among definite
cases with specimens requested – GP Enumeration
Study
229
Table A4.14 Percentage of cases with a recorded microbiological
result among definite cases known to have submitted
a specimen – GP Enumeration Study
229
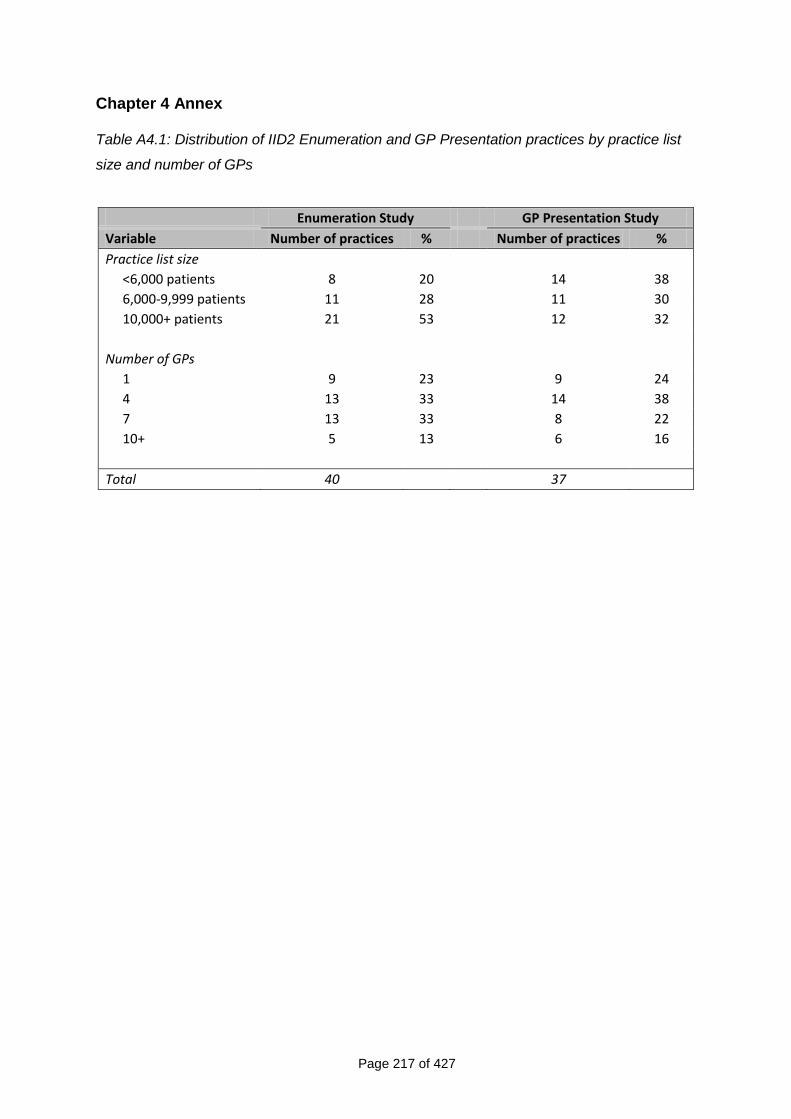
Page 217 of 427
Chapter 4 Annex Table A4.1: Distribution of IID2 Enumeration and GP Presentation practices by practice list
size and number of GPs
Enumeration Study GP Presentation Study
Variable Number of practices % Number of practices %
Practice list size
<6,000 patients 8 20 14 38
6,000-9,999 patients 11 28 11 30
10,000+ patients 21 53 12 32
Number of GPs
1 9 23 9 24
4 13 33 14 38
7 13 33 8 22
10+ 5 13 6 16
Total 40 37
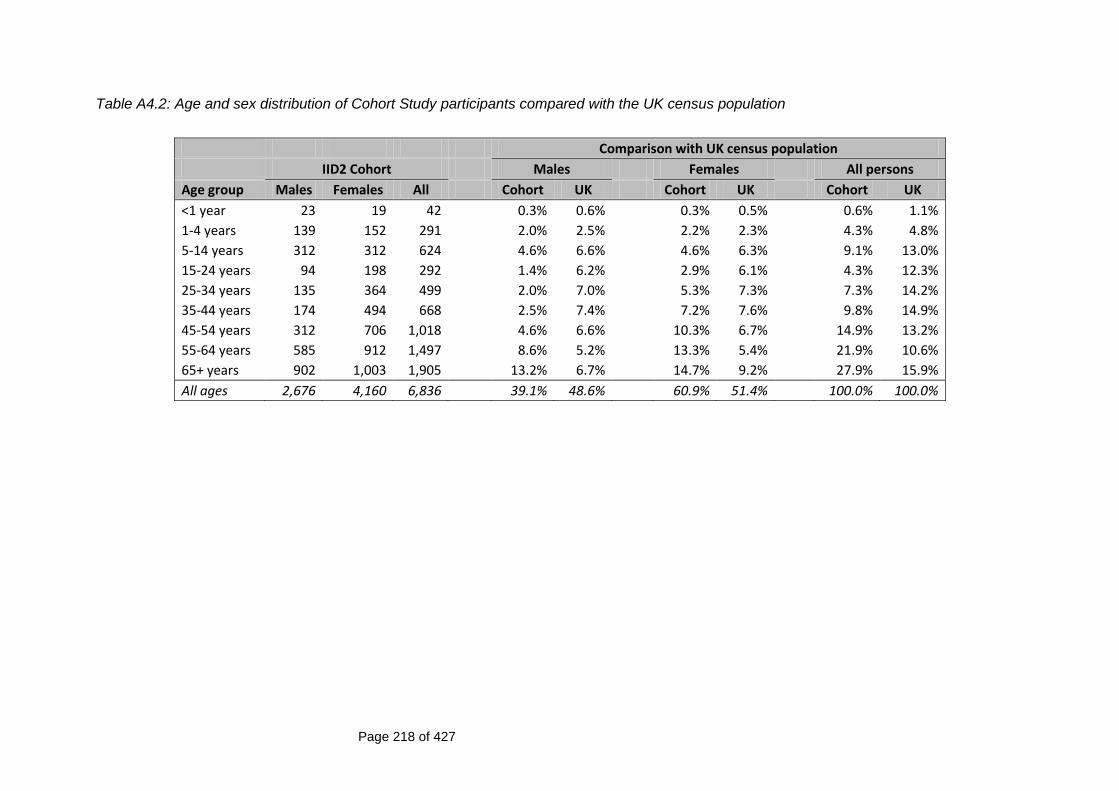
Page 218 of 427
Table A4.2: Age and sex distribution of Cohort Study participants compared with the UK census population
Comparison with UK census population
IID2 Cohort Males Females All persons
Age group Males Females All Cohort UK Cohort UK Cohort UK
<1 year 23 19 42 0.3% 0.6% 0.3% 0.5% 0.6% 1.1%
1-4 years 139 152 291 2.0% 2.5% 2.2% 2.3% 4.3% 4.8%
5-14 years 312 312 624 4.6% 6.6% 4.6% 6.3% 9.1% 13.0%
15-24 years 94 198 292 1.4% 6.2% 2.9% 6.1% 4.3% 12.3%
25-34 years 135 364 499 2.0% 7.0% 5.3% 7.3% 7.3% 14.2%
35-44 years 174 494 668 2.5% 7.4% 7.2% 7.6% 9.8% 14.9%
45-54 years 312 706 1,018 4.6% 6.6% 10.3% 6.7% 14.9% 13.2%
55-64 years 585 912 1,497 8.6% 5.2% 13.3% 5.4% 21.9% 10.6%
65+ years 902 1,003 1,905 13.2% 6.7% 14.7% 9.2% 27.9% 15.9%
All ages 2,676 4,160 6,836 39.1% 48.6% 60.9% 51.4% 100.0% 100.0%
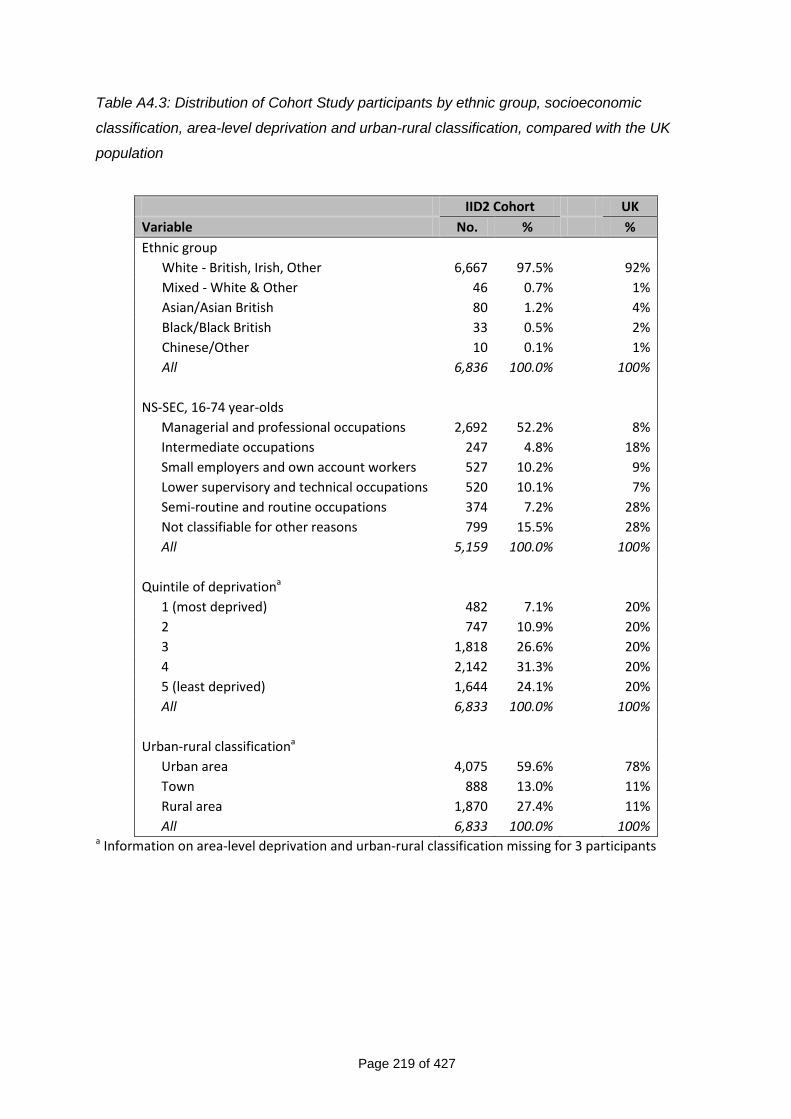
Page 219 of 427
Table A4.3: Distribution of Cohort Study participants by ethnic group, socioeconomic
classification, area-level deprivation and urban-rural classification, compared with the UK
population
IID2 Cohort UK
Variable No. % %
Ethnic group
White - British, Irish, Other 6,667 97.5% 92%
Mixed - White & Other 46 0.7% 1%
Asian/Asian British 80 1.2% 4%
Black/Black British 33 0.5% 2%
Chinese/Other 10 0.1% 1%
All 6,836 100.0% 100%
NS-SEC, 16-74 year-olds
Managerial and professional occupations 2,692 52.2% 8%
Intermediate occupations 247 4.8% 18%
Small employers and own account workers 527 10.2% 9%
Lower supervisory and technical occupations 520 10.1% 7%
Semi-routine and routine occupations 374 7.2% 28%
Not classifiable for other reasons 799 15.5% 28%
All 5,159 100.0% 100%
Quintile of deprivationa
1 (most deprived) 482 7.1% 20%
2 747 10.9% 20%
3 1,818 26.6% 20%
4 2,142 31.3% 20%
5 (least deprived) 1,644 24.1% 20%
All 6,833 100.0% 100%
Urban-rural classificationa
Urban area 4,075 59.6% 78%
Town 888 13.0% 11%
Rural area 1,870 27.4% 11%
All 6,833 100.0% 100% a Information on area-level deprivation and urban-rural classification missing for 3 participants
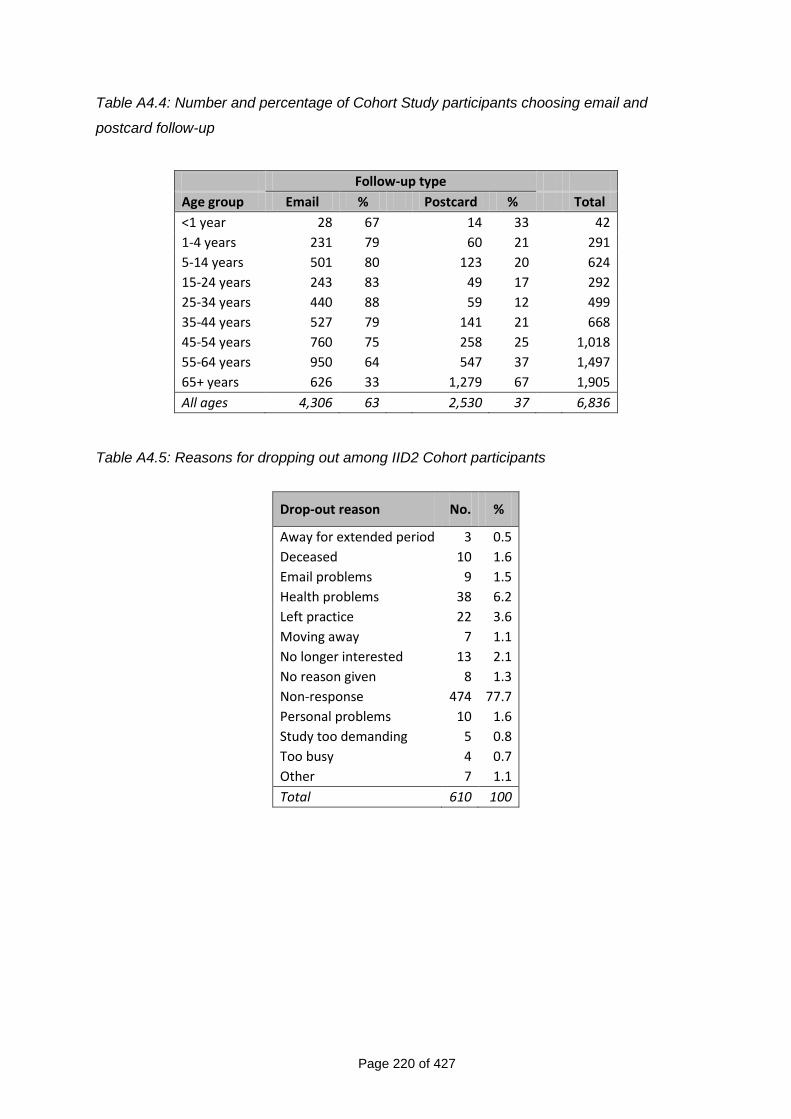
Page 220 of 427
Table A4.4: Number and percentage of Cohort Study participants choosing email and
postcard follow-up
Follow-up type
Age group Email % Postcard % Total
<1 year 28 67 14 33 42
1-4 years 231 79 60 21 291
5-14 years 501 80 123 20 624
15-24 years 243 83 49 17 292
25-34 years 440 88 59 12 499
35-44 years 527 79 141 21 668
45-54 years 760 75 258 25 1,018
55-64 years 950 64 547 37 1,497
65+ years 626 33 1,279 67 1,905
All ages 4,306 63 2,530 37 6,836
Table A4.5: Reasons for dropping out among IID2 Cohort participants
Drop-out reason No. %
Away for extended period 3 0.5
Deceased 10 1.6
Email problems 9 1.5
Health problems 38 6.2
Left practice 22 3.6
Moving away 7 1.1
No longer interested 13 2.1
No reason given 8 1.3
Non-response 474 77.7
Personal problems 10 1.6
Study too demanding 5 0.8
Too busy 4 0.7
Other 7 1.1
Total 610 100
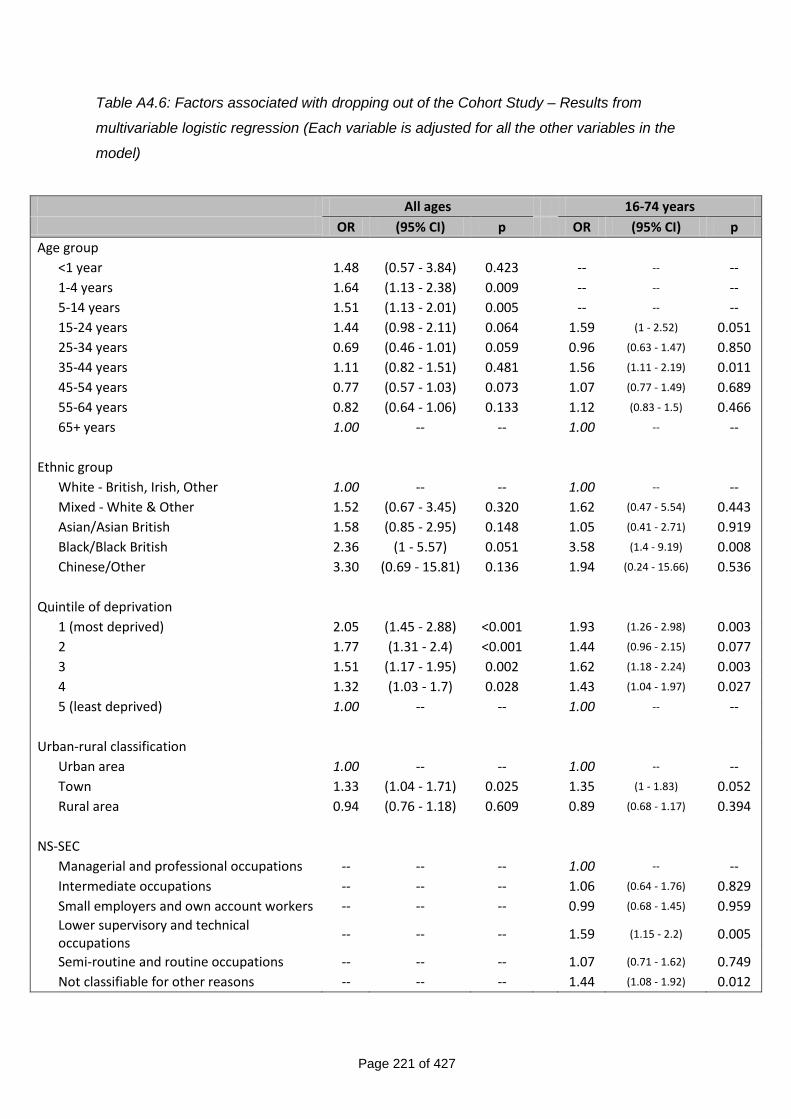
Page 221 of 427
Table A4.6: Factors associated with dropping out of the Cohort Study – Results from
multivariable logistic regression (Each variable is adjusted for all the other variables in the
model)
All ages 16-74 years
OR (95% CI) p OR (95% CI) p
Age group
<1 year 1.48 (0.57 - 3.84) 0.423 -- -- --
1-4 years 1.64 (1.13 - 2.38) 0.009 -- -- --
5-14 years 1.51 (1.13 - 2.01) 0.005 -- -- --
15-24 years 1.44 (0.98 - 2.11) 0.064 1.59 (1 - 2.52) 0.051
25-34 years 0.69 (0.46 - 1.01) 0.059 0.96 (0.63 - 1.47) 0.850
35-44 years 1.11 (0.82 - 1.51) 0.481 1.56 (1.11 - 2.19) 0.011
45-54 years 0.77 (0.57 - 1.03) 0.073 1.07 (0.77 - 1.49) 0.689
55-64 years 0.82 (0.64 - 1.06) 0.133 1.12 (0.83 - 1.5) 0.466
65+ years 1.00 -- -- 1.00 -- --
Ethnic group
White - British, Irish, Other 1.00 -- -- 1.00 -- --
Mixed - White & Other 1.52 (0.67 - 3.45) 0.320 1.62 (0.47 - 5.54) 0.443
Asian/Asian British 1.58 (0.85 - 2.95) 0.148 1.05 (0.41 - 2.71) 0.919
Black/Black British 2.36 (1 - 5.57) 0.051 3.58 (1.4 - 9.19) 0.008
Chinese/Other 3.30 (0.69 - 15.81) 0.136 1.94 (0.24 - 15.66) 0.536
Quintile of deprivation
1 (most deprived) 2.05 (1.45 - 2.88) <0.001 1.93 (1.26 - 2.98) 0.003
2 1.77 (1.31 - 2.4) <0.001 1.44 (0.96 - 2.15) 0.077
3 1.51 (1.17 - 1.95) 0.002 1.62 (1.18 - 2.24) 0.003
4 1.32 (1.03 - 1.7) 0.028 1.43 (1.04 - 1.97) 0.027
5 (least deprived) 1.00 -- -- 1.00 -- --
Urban-rural classification
Urban area 1.00 -- -- 1.00 -- --
Town 1.33 (1.04 - 1.71) 0.025 1.35 (1 - 1.83) 0.052
Rural area 0.94 (0.76 - 1.18) 0.609 0.89 (0.68 - 1.17) 0.394
NS-SEC
Managerial and professional occupations -- -- -- 1.00 -- --
Intermediate occupations -- -- -- 1.06 (0.64 - 1.76) 0.829
Small employers and own account workers -- -- -- 0.99 (0.68 - 1.45) 0.959
Lower supervisory and technical occupations
-- -- -- 1.59 (1.15 - 2.2) 0.005
Semi-routine and routine occupations -- -- -- 1.07 (0.71 - 1.62) 0.749
Not classifiable for other reasons -- -- -- 1.44 (1.08 - 1.92) 0.012
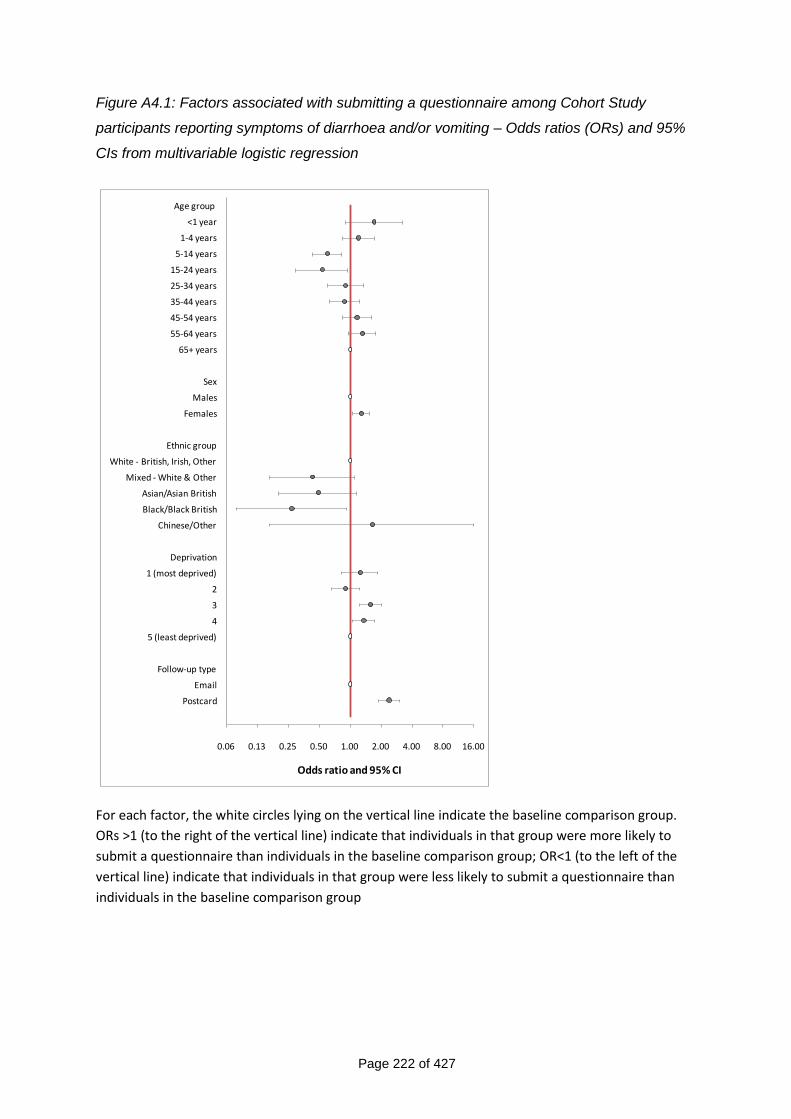
Page 222 of 427
Figure A4.1: Factors associated with submitting a questionnaire among Cohort Study
participants reporting symptoms of diarrhoea and/or vomiting – Odds ratios (ORs) and 95%
CIs from multivariable logistic regression
0.06 0.13 0.25 0.50 1.00 2.00 4.00 8.00 16.00
Age group
<1 year
1-4 years
5-14 years
15-24 years
25-34 years
35-44 years
45-54 years
55-64 years
65+ years
Sex
Males
Females
Ethnic group
White - British, Irish, Other
Mixed - White & Other
Asian/Asian British
Black/Black British
Chinese/Other
Deprivation
1 (most deprived)
2
3
4
5 (least deprived)
Follow-up type
Postcard
Odds ratio and 95% CI
For each factor, the white circles lying on the vertical line indicate the baseline comparison group.
ORs >1 (to the right of the vertical line) indicate that individuals in that group were more likely to
submit a questionnaire than individuals in the baseline comparison group; OR<1 (to the left of the
vertical line) indicate that individuals in that group were less likely to submit a questionnaire than
individuals in the baseline comparison group
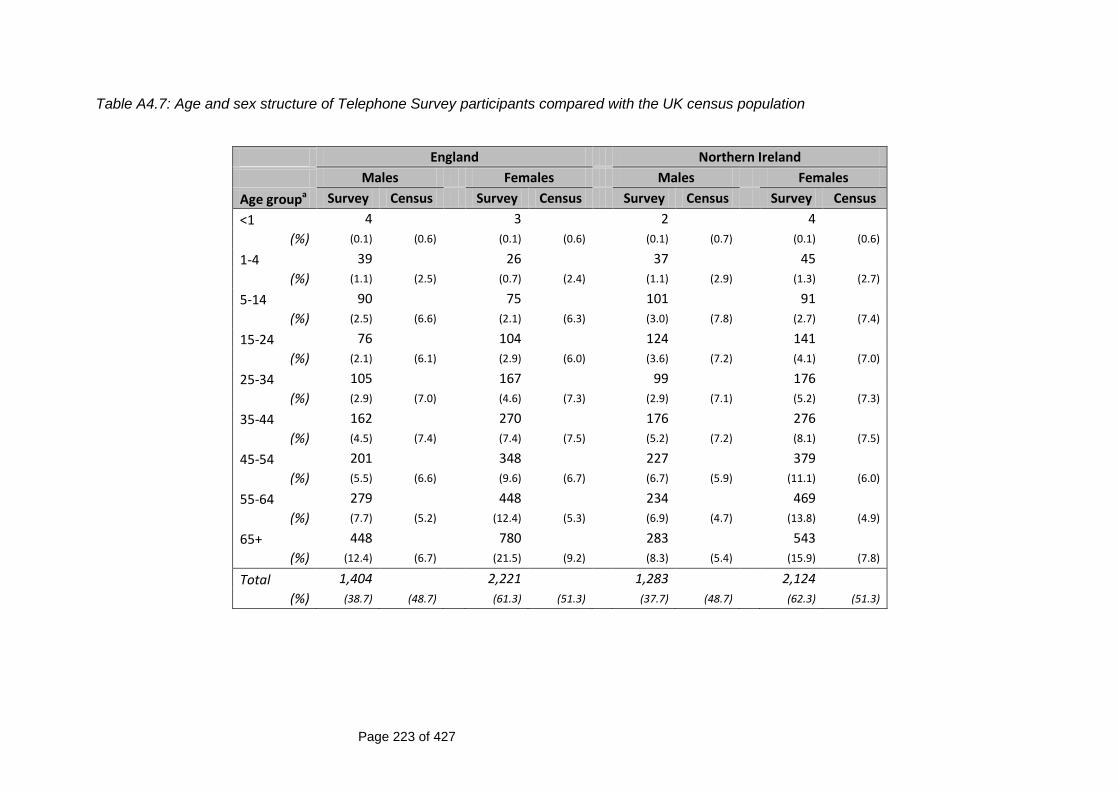
Page 223 of 427
Table A4.7: Age and sex structure of Telephone Survey participants compared with the UK census population
England Northern Ireland
Males Females Males Females
Age groupa Survey Census Survey Census Survey Census Survey Census
<1 4 3 2 4
(%) (0.1) (0.6) (0.1) (0.6) (0.1) (0.7) (0.1) (0.6)
1-4 39 26 37 45
(%) (1.1) (2.5) (0.7) (2.4) (1.1) (2.9) (1.3) (2.7)
5-14 90 75 101 91
(%) (2.5) (6.6) (2.1) (6.3) (3.0) (7.8) (2.7) (7.4)
15-24 76 104 124 141
(%) (2.1) (6.1) (2.9) (6.0) (3.6) (7.2) (4.1) (7.0)
25-34 105 167 99 176
(%) (2.9) (7.0) (4.6) (7.3) (2.9) (7.1) (5.2) (7.3)
35-44 162 270 176 276
(%) (4.5) (7.4) (7.4) (7.5) (5.2) (7.2) (8.1) (7.5)
45-54 201 348 227 379
(%) (5.5) (6.6) (9.6) (6.7) (6.7) (5.9) (11.1) (6.0)
55-64 279 448 234 469
(%) (7.7) (5.2) (12.4) (5.3) (6.9) (4.7) (13.8) (4.9)
65+ 448 780 283 543
(%) (12.4) (6.7) (21.5) (9.2) (8.3) (5.4) (15.9) (7.8)
Total 1,404 2,221 1,283 2,124
(%) (38.7) (48.7) (61.3) (51.3) (37.7) (48.7) (62.3) (51.3)
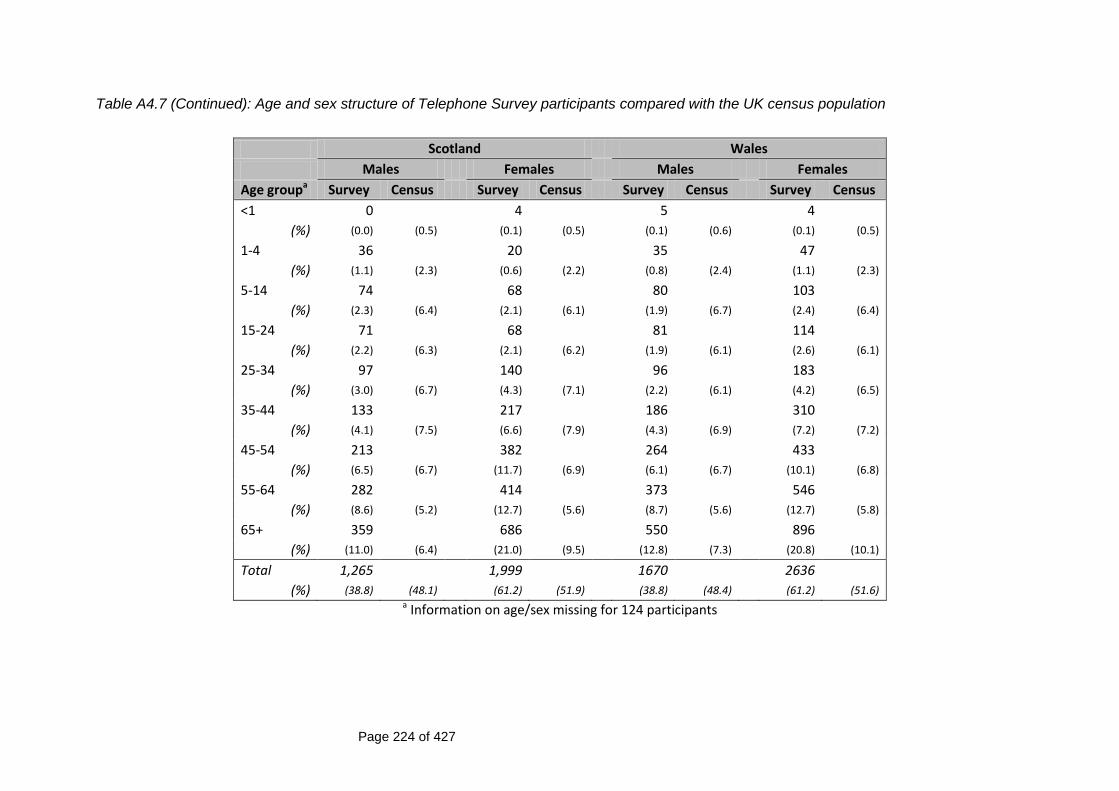
Page 224 of 427
Table A4.7 (Continued): Age and sex structure of Telephone Survey participants compared with the UK census population
Scotland Wales
Males Females Males Females
Age groupa Survey Census Survey Census Survey Census Survey Census
<1 0 4 5 4
(%) (0.0) (0.5) (0.1) (0.5) (0.1) (0.6) (0.1) (0.5)
1-4 36 20 35 47
(%) (1.1) (2.3) (0.6) (2.2) (0.8) (2.4) (1.1) (2.3)
5-14 74 68 80 103
(%) (2.3) (6.4) (2.1) (6.1) (1.9) (6.7) (2.4) (6.4)
15-24 71 68 81 114
(%) (2.2) (6.3) (2.1) (6.2) (1.9) (6.1) (2.6) (6.1)
25-34 97 140 96 183
(%) (3.0) (6.7) (4.3) (7.1) (2.2) (6.1) (4.2) (6.5)
35-44 133 217 186 310
(%) (4.1) (7.5) (6.6) (7.9) (4.3) (6.9) (7.2) (7.2)
45-54 213 382 264 433
(%) (6.5) (6.7) (11.7) (6.9) (6.1) (6.7) (10.1) (6.8)
55-64 282 414 373 546
(%) (8.6) (5.2) (12.7) (5.6) (8.7) (5.6) (12.7) (5.8)
65+ 359 686 550 896
(%) (11.0) (6.4) (21.0) (9.5) (12.8) (7.3) (20.8) (10.1)
Total 1,265 1,999 1670 2636
(%) (38.8) (48.1) (61.2) (51.9) (38.8) (48.4) (61.2) (51.6) a Information on age/sex missing for 124 participants
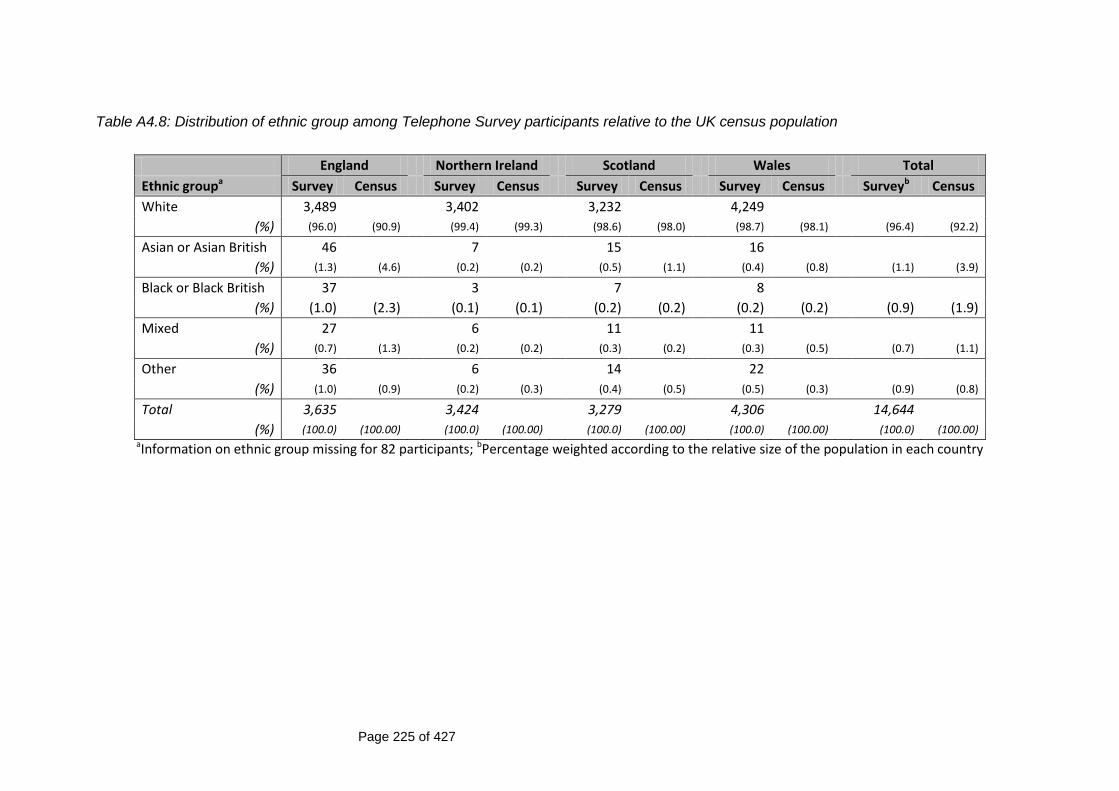
Page 225 of 427
Table A4.8: Distribution of ethnic group among Telephone Survey participants relative to the UK census population
England Northern Ireland Scotland Wales Total
Ethnic groupa Survey Census Survey Census Survey Census Survey Census Surveyb Census
White 3,489 3,402 3,232 4,249
(%) (96.0) (90.9) (99.4) (99.3) (98.6) (98.0) (98.7) (98.1) (96.4) (92.2)
Asian or Asian British 46 7 15 16
(%) (1.3) (4.6) (0.2) (0.2) (0.5) (1.1) (0.4) (0.8) (1.1) (3.9)
Black or Black British 37 3 7 8
(%) (1.0) (2.3) (0.1) (0.1) (0.2) (0.2) (0.2) (0.2) (0.9) (1.9)
Mixed 27 6 11 11
(%) (0.7) (1.3) (0.2) (0.2) (0.3) (0.2) (0.3) (0.5) (0.7) (1.1)
Other 36 6 14 22
(%) (1.0) (0.9) (0.2) (0.3) (0.4) (0.5) (0.5) (0.3) (0.9) (0.8)
Total 3,635 3,424 3,279 4,306 14,644
(%) (100.0) (100.00) (100.0) (100.00) (100.0) (100.00) (100.0) (100.00) (100.0) (100.00) aInformation on ethnic group missing for 82 participants; bPercentage weighted according to the relative size of the population in each country
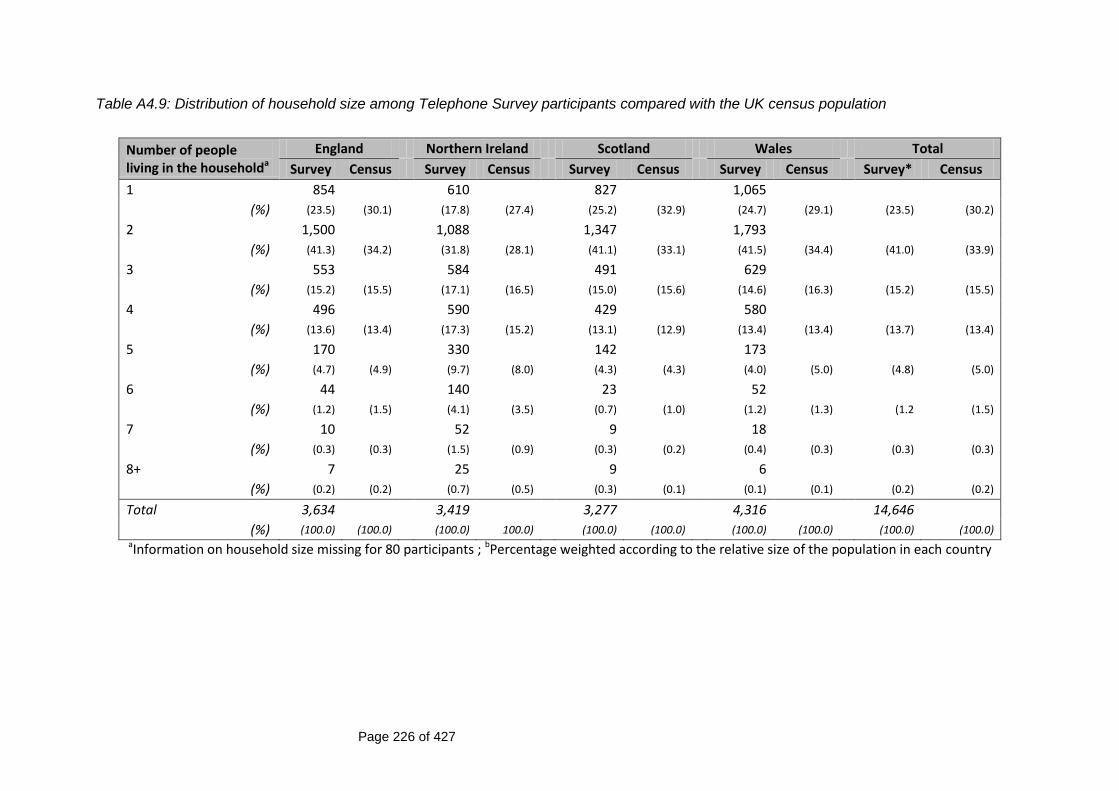
Page 226 of 427
Table A4.9: Distribution of household size among Telephone Survey participants compared with the UK census population
Number of people living in the householda
England Northern Ireland Scotland Wales Total
Survey Census Survey Census Survey Census Survey Census Survey* Census
1 854 610 827 1,065
(%) (23.5) (30.1) (17.8) (27.4) (25.2) (32.9) (24.7) (29.1) (23.5) (30.2)
2 1,500 1,088 1,347 1,793
(%) (41.3) (34.2) (31.8) (28.1) (41.1) (33.1) (41.5) (34.4) (41.0) (33.9)
3 553 584 491 629
(%) (15.2) (15.5) (17.1) (16.5) (15.0) (15.6) (14.6) (16.3) (15.2) (15.5)
4 496 590 429 580
(%) (13.6) (13.4) (17.3) (15.2) (13.1) (12.9) (13.4) (13.4) (13.7) (13.4)
5 170 330 142 173
(%) (4.7) (4.9) (9.7) (8.0) (4.3) (4.3) (4.0) (5.0) (4.8) (5.0)
6 44 140 23 52
(%) (1.2) (1.5) (4.1) (3.5) (0.7) (1.0) (1.2) (1.3) (1.2 (1.5)
7 10 52 9 18
(%) (0.3) (0.3) (1.5) (0.9) (0.3) (0.2) (0.4) (0.3) (0.3) (0.3)
8+ 7 25 9 6
(%) (0.2) (0.2) (0.7) (0.5) (0.3) (0.1) (0.1) (0.1) (0.2) (0.2)
Total 3,634 3,419 3,277 4,316 14,646
(%) (100.0) (100.0) (100.0) 100.0) (100.0) (100.0) (100.0) (100.0) (100.0) (100.0) aInformation on household size missing for 80 participants ; bPercentage weighted according to the relative size of the population in each country
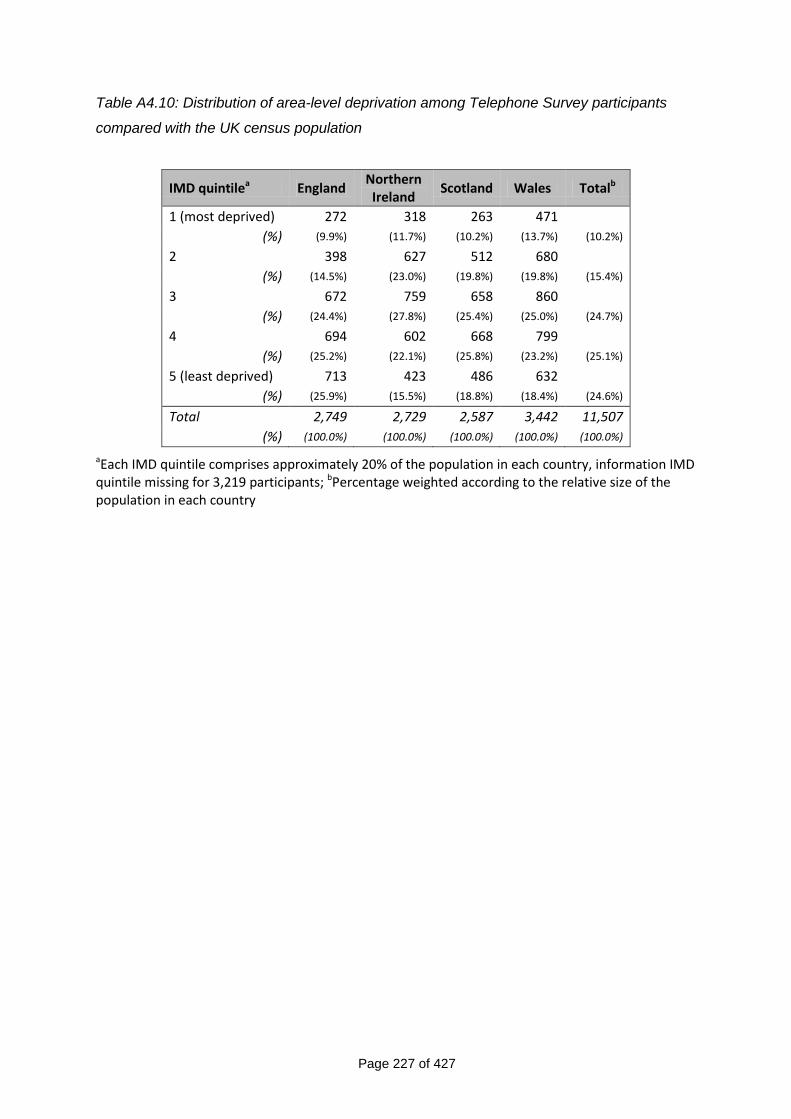
Page 227 of 427
Table A4.10: Distribution of area-level deprivation among Telephone Survey participants
compared with the UK census population
IMD quintilea England Northern Ireland
Scotland Wales Totalb
1 (most deprived) 272 318 263 471
(%) (9.9%) (11.7%) (10.2%) (13.7%) (10.2%)
2 398 627 512 680
(%) (14.5%) (23.0%) (19.8%) (19.8%) (15.4%)
3 672 759 658 860
(%) (24.4%) (27.8%) (25.4%) (25.0%) (24.7%)
4 694 602 668 799
(%) (25.2%) (22.1%) (25.8%) (23.2%) (25.1%)
5 (least deprived) 713 423 486 632
(%) (25.9%) (15.5%) (18.8%) (18.4%) (24.6%)
Total 2,749 2,729 2,587 3,442 11,507
(%) (100.0%) (100.0%) (100.0%) (100.0%) (100.0%)
aEach IMD quintile comprises approximately 20% of the population in each country, information IMD quintile missing for 3,219 participants; bPercentage weighted according to the relative size of the population in each country
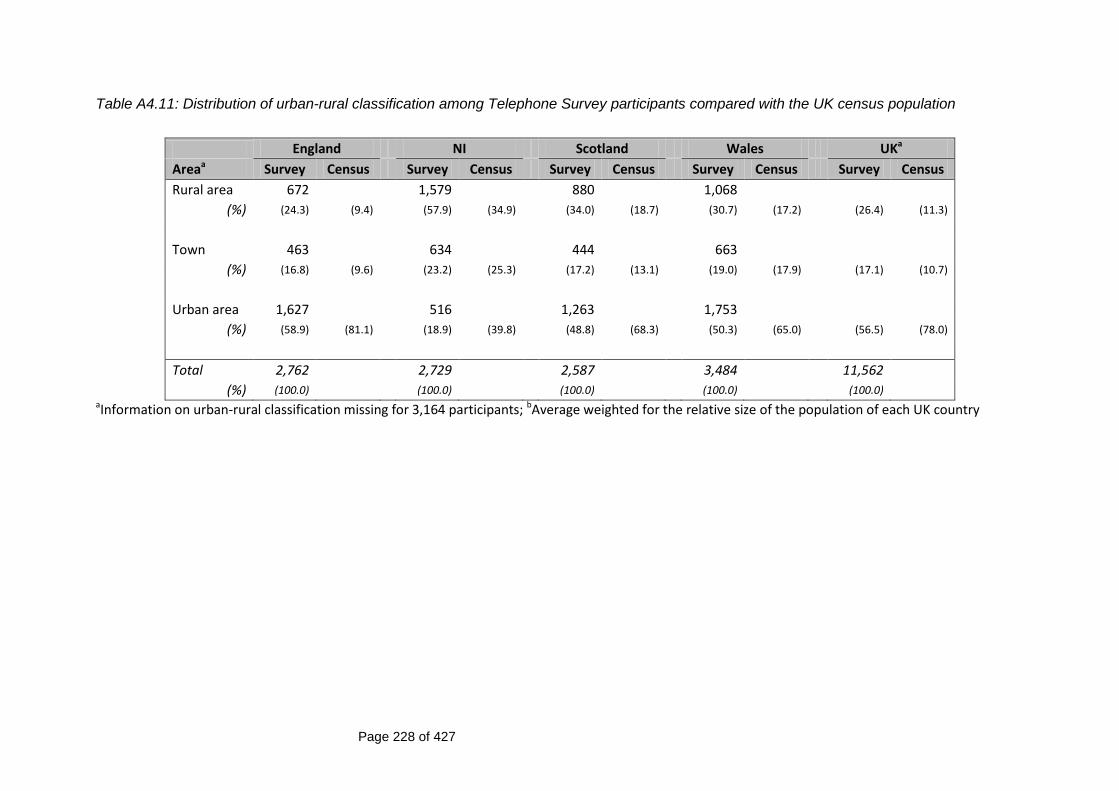
Page 228 of 427
Table A4.11: Distribution of urban-rural classification among Telephone Survey participants compared with the UK census population
England NI Scotland Wales UKa
Areaa Survey Census Survey Census Survey Census Survey Census Survey Census
Rural area 672 1,579 880 1,068
(%) (24.3) (9.4) (57.9) (34.9) (34.0) (18.7) (30.7) (17.2) (26.4) (11.3)
Town 463 634 444 663
(%) (16.8) (9.6) (23.2) (25.3) (17.2) (13.1) (19.0) (17.9) (17.1) (10.7)
Urban area 1,627 516 1,263 1,753
(%) (58.9) (81.1) (18.9) (39.8) (48.8) (68.3) (50.3) (65.0) (56.5) (78.0)
Total 2,762 2,729 2,587 3,484 11,562
(%) (100.0) (100.0) (100.0) (100.0) (100.0) aInformation on urban-rural classification missing for 3,164 participants; bAverage weighted for the relative size of the population of each UK country
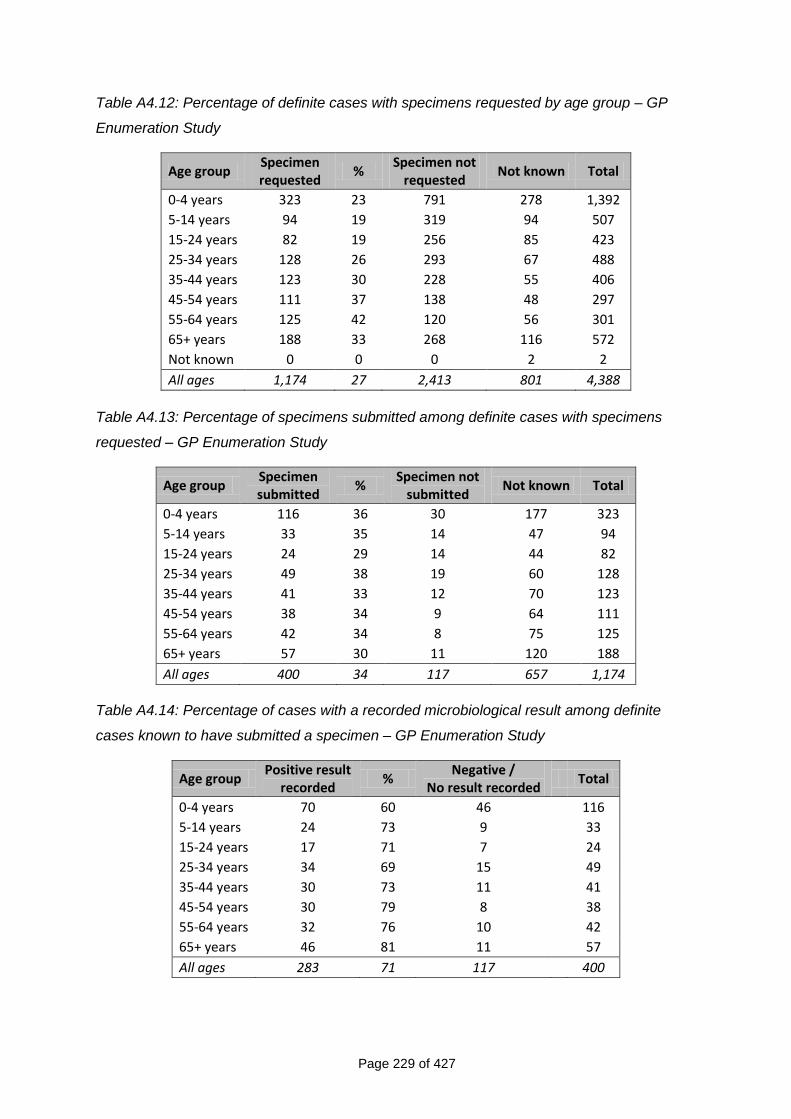
Page 229 of 427
Table A4.12: Percentage of definite cases with specimens requested by age group – GP
Enumeration Study
Age group Specimen requested
% Specimen not
requested Not known Total
0-4 years 323 23 791 278 1,392
5-14 years 94 19 319 94 507
15-24 years 82 19 256 85 423
25-34 years 128 26 293 67 488
35-44 years 123 30 228 55 406
45-54 years 111 37 138 48 297
55-64 years 125 42 120 56 301
65+ years 188 33 268 116 572
Not known 0 0 0 2 2
All ages 1,174 27 2,413 801 4,388
Table A4.13: Percentage of specimens submitted among definite cases with specimens
requested – GP Enumeration Study
Age group Specimen submitted
% Specimen not
submitted Not known Total
0-4 years 116 36 30 177 323
5-14 years 33 35 14 47 94
15-24 years 24 29 14 44 82
25-34 years 49 38 19 60 128
35-44 years 41 33 12 70 123
45-54 years 38 34 9 64 111
55-64 years 42 34 8 75 125
65+ years 57 30 11 120 188
All ages 400 34 117 657 1,174
Table A4.14: Percentage of cases with a recorded microbiological result among definite
cases known to have submitted a specimen – GP Enumeration Study
Age group Positive result
recorded %
Negative / No result recorded
Total
0-4 years 70 60 46 116
5-14 years 24 73 9 33
15-24 years 17 71 7 24
25-34 years 34 69 15 49
35-44 years 30 73 11 41
45-54 years 30 79 8 38
55-64 years 32 76 10 42
65+ years 46 81 11 57
All ages 283 71 117 400
Page 230 of 427
Chapter 5 Annex Title Page
Figure A5.1 Variation in rates of IID in the Cohort Study – Rate
ratios (RRs) and 95% confidence intervals
231
Figure A5.2 Incidence rates of IID in the community cohort by time
in study
232
Figure A5.3 Incidence rate of IID in the community cohort by
participants‟ week of follow-up
232
Table A5.1 Incidence rate of overall IID in the Telephone Survey
by recall period and household size
233
Table A5.2 Incidence rate of overall IID in the Telephone Survey
by recall period and area-level deprivation
233
Table A5.3 Incidence rate of overall IID in the Telephone Survey
by recall period and urban-rural classification
233
Figure A5.4 Decay in the reporting of symptoms among
Telephone Survey participants by recall group
234
Figure A5.5 Variation in rates of IID in the GP Presentation Study
– Rate ratios and 95% CIs
235
Table A5.4 Number and percentage of definite IID cases
reporting having travelled outside the UK in the 10
days prior to illness onset by age group – Cohort
Study
236
Table A5.5 Number and percentage of definite IID cases
reporting having travelled outside the UK in the 10
days prior to illness onset by age group – GP
Presentation Study
236
Table A5.6 Incidence rate of putatively travel-related IID by age
group – Cohort Study
236
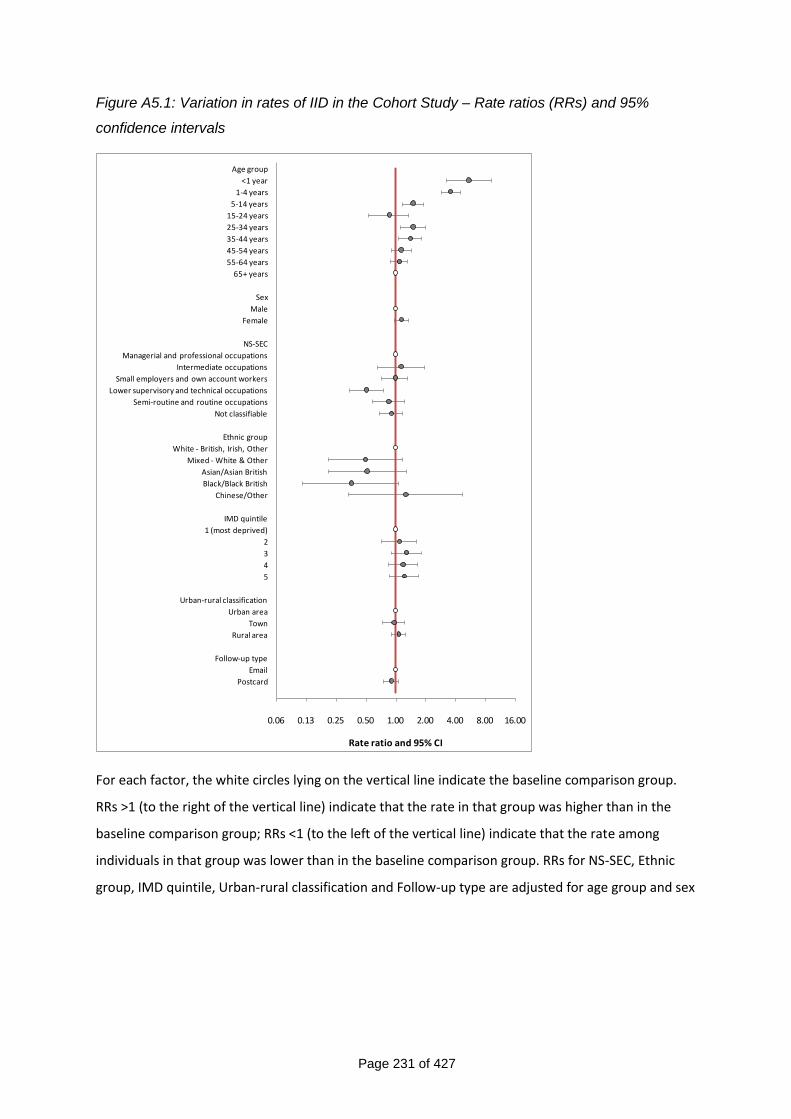
Page 231 of 427
Figure A5.1: Variation in rates of IID in the Cohort Study – Rate ratios (RRs) and 95%
confidence intervals
0.06 0.13 0.25 0.50 1.00 2.00 4.00 8.00 16.00
Age group
<1 year
1-4 years
5-14 years
15-24 years
25-34 years
35-44 years
45-54 years
55-64 years
65+ years
Sex
Male
Female
NS-SEC
Managerial and professional occupations
Intermediate occupations
Small employers and own account workers
Lower supervisory and technical occupations
Semi-routine and routine occupations
Not classifiable
Ethnic group
White - British, Irish, Other
Mixed - White & Other
Asian/Asian British
Black/Black British
Chinese/Other
IMD quintile
1 (most deprived)
2
3
4
5
Urban-rural classification
Urban area
Town
Rural area
Follow-up type
Postcard
Rate ratio and 95% CI For each factor, the white circles lying on the vertical line indicate the baseline comparison group.
RRs >1 (to the right of the vertical line) indicate that the rate in that group was higher than in the
baseline comparison group; RRs <1 (to the left of the vertical line) indicate that the rate among
individuals in that group was lower than in the baseline comparison group. RRs for NS-SEC, Ethnic
group, IMD quintile, Urban-rural classification and Follow-up type are adjusted for age group and sex
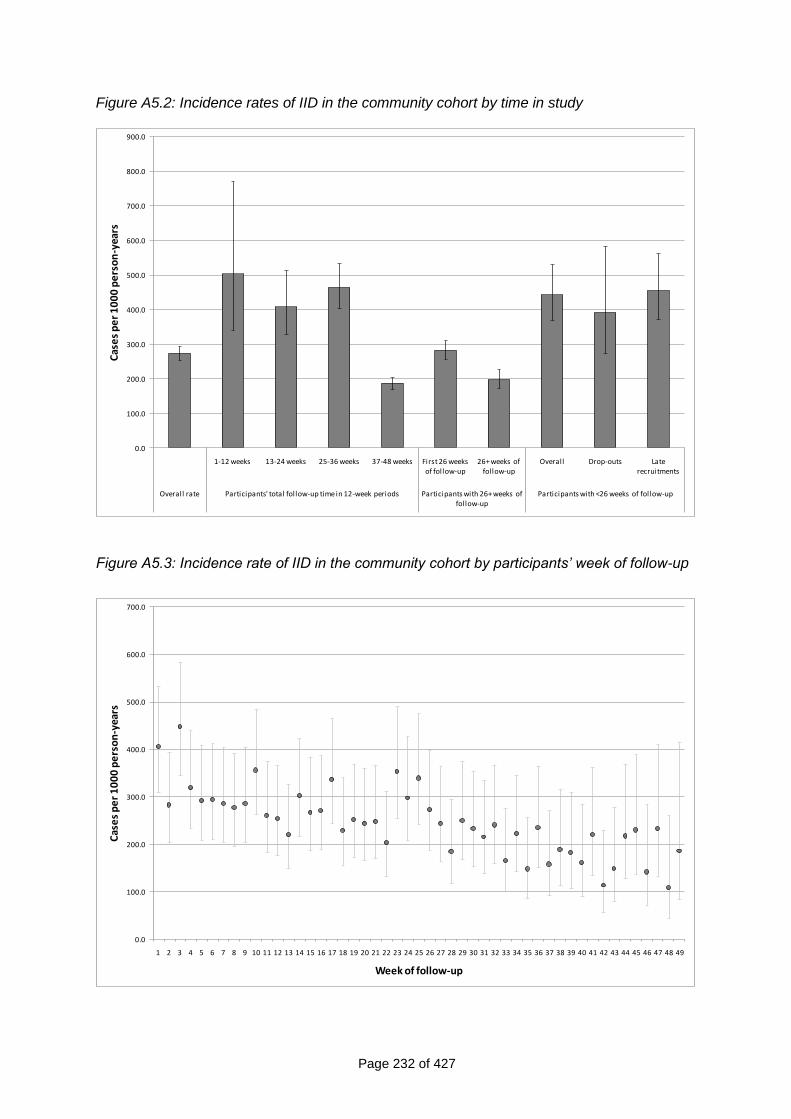
Page 232 of 427
Figure A5.2: Incidence rates of IID in the community cohort by time in study
0.0
100.0
200.0
300.0
400.0
500.0
600.0
700.0
800.0
900.0
1-12 weeks 13-24 weeks 25-36 weeks 37-48 weeks First 26 weeks of follow-up
26+ weeks of follow-up
Overall Drop-outs Late recruitments
Overall rate Participants' total follow-up time in 12-week periods Participants with 26+ weeks of follow-up
Participants with <26 weeks of follow-up
Cas
es
pe
r 1
00
0 p
ers
on
-yea
rs
Figure A5.3: Incidence rate of IID in the community cohort by participants‟ week of follow-up
0.0
100.0
200.0
300.0
400.0
500.0
600.0
700.0
1 2 3 4 5 6 7 8 9 10 11 12 13 14 15 16 17 18 19 20 21 22 23 24 25 26 27 28 29 30 31 32 33 34 35 36 37 38 39 40 41 42 43 44 45 46 47 48 49
Cas
es
pe
r 1
00
0 p
ers
on
-yea
rs
Week of follow-up
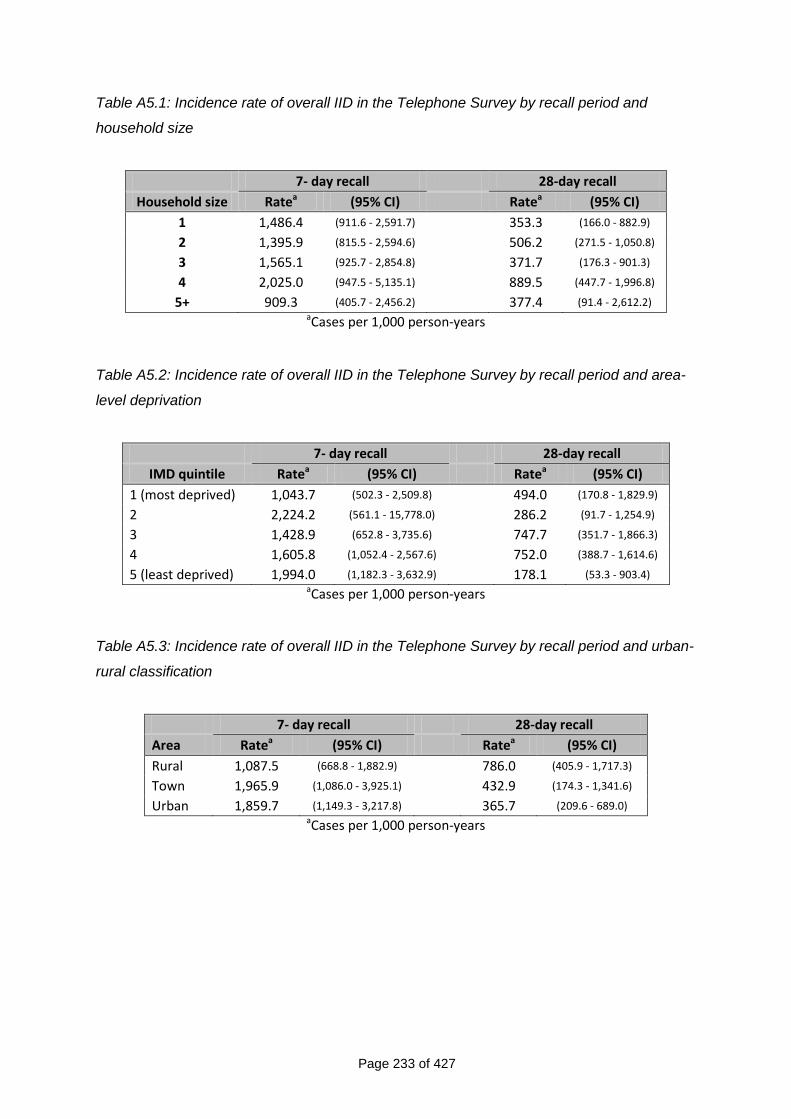
Page 233 of 427
Table A5.1: Incidence rate of overall IID in the Telephone Survey by recall period and
household size
7- day recall 28-day recall
Household size Ratea (95% CI) Ratea (95% CI)
1 1,486.4 (911.6 - 2,591.7) 353.3 (166.0 - 882.9)
2 1,395.9 (815.5 - 2,594.6) 506.2 (271.5 - 1,050.8)
3 1,565.1 (925.7 - 2,854.8) 371.7 (176.3 - 901.3)
4 2,025.0 (947.5 - 5,135.1) 889.5 (447.7 - 1,996.8)
5+ 909.3 (405.7 - 2,456.2) 377.4 (91.4 - 2,612.2) aCases per 1,000 person-years
Table A5.2: Incidence rate of overall IID in the Telephone Survey by recall period and area-
level deprivation
7- day recall 28-day recall
IMD quintile Ratea (95% CI) Ratea (95% CI)
1 (most deprived) 1,043.7 (502.3 - 2,509.8) 494.0 (170.8 - 1,829.9)
2 2,224.2 (561.1 - 15,778.0) 286.2 (91.7 - 1,254.9)
3 1,428.9 (652.8 - 3,735.6) 747.7 (351.7 - 1,866.3)
4 1,605.8 (1,052.4 - 2,567.6) 752.0 (388.7 - 1,614.6)
5 (least deprived) 1,994.0 (1,182.3 - 3,632.9) 178.1 (53.3 - 903.4) aCases per 1,000 person-years
Table A5.3: Incidence rate of overall IID in the Telephone Survey by recall period and urban-
rural classification
7- day recall 28-day recall
Area Ratea (95% CI) Ratea (95% CI)
Rural 1,087.5 (668.8 - 1,882.9) 786.0 (405.9 - 1,717.3)
Town 1,965.9 (1,086.0 - 3,925.1) 432.9 (174.3 - 1,341.6)
Urban 1,859.7 (1,149.3 - 3,217.8) 365.7 (209.6 - 689.0) aCases per 1,000 person-years
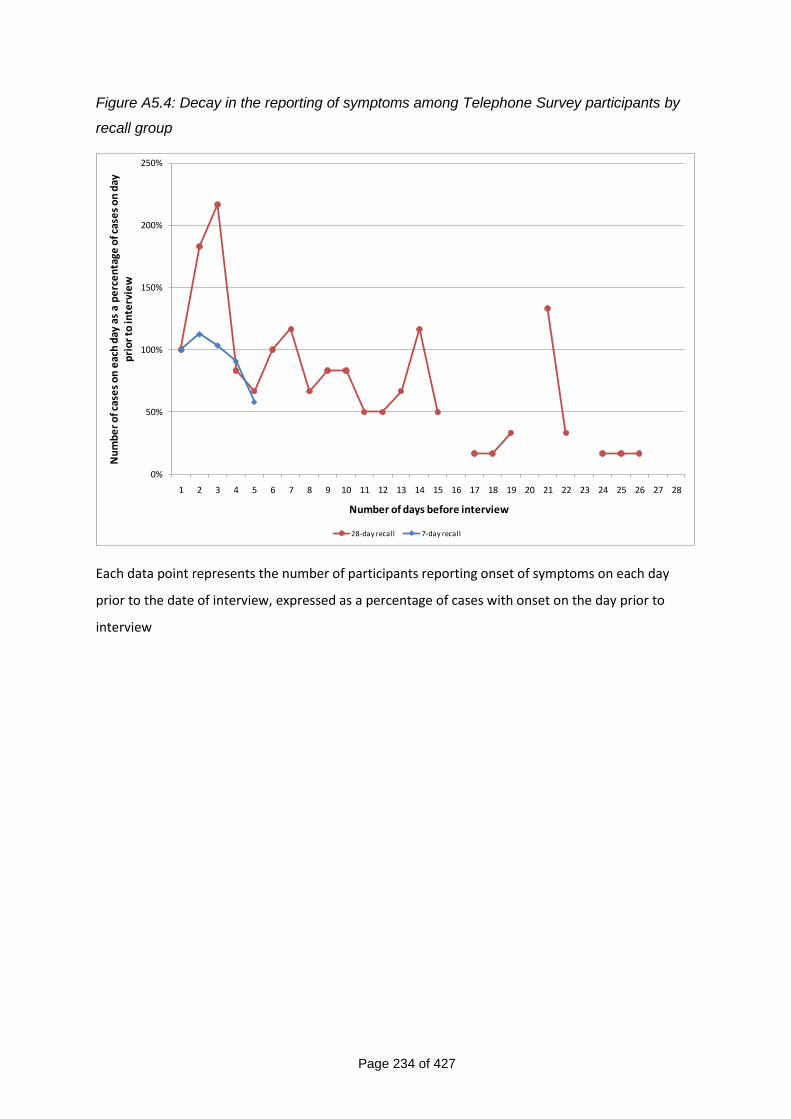
Page 234 of 427
Figure A5.4: Decay in the reporting of symptoms among Telephone Survey participants by
recall group
0%
50%
100%
150%
200%
250%
1 2 3 4 5 6 7 8 9 10 11 12 13 14 15 16 17 18 19 20 21 22 23 24 25 26 27 28
Nu
mb
er
of c
ase
s o
n e
ach
day
as
a p
erc
en
tage
of c
ase
s o
n d
ay
pri
or
to in
terv
iew
Number of days before interview
28-day recall 7-day recall
Each data point represents the number of participants reporting onset of symptoms on each day
prior to the date of interview, expressed as a percentage of cases with onset on the day prior to
interview
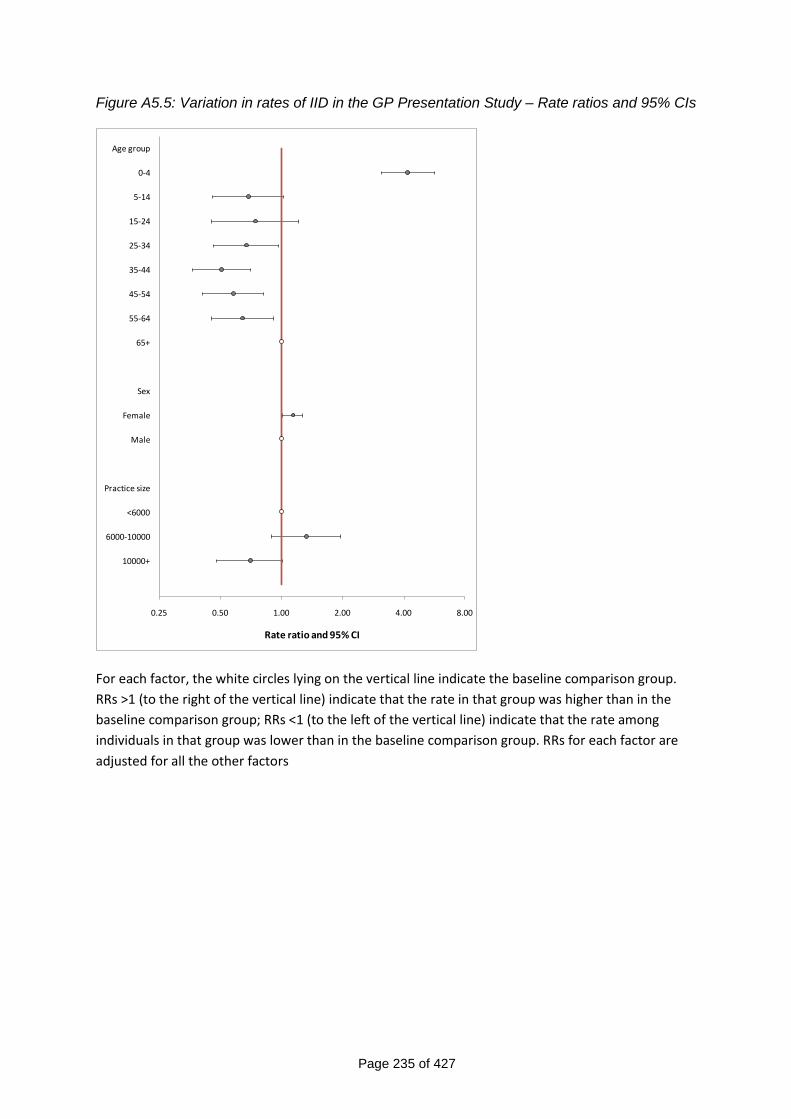
Page 235 of 427
Figure A5.5: Variation in rates of IID in the GP Presentation Study – Rate ratios and 95% CIs
0.25 0.50 1.00 2.00 4.00 8.00
Age group
0-4
5-14
15-24
25-34
35-44
45-54
55-64
65+
Sex
Female
Male
Practice size
<6000
6000-10000
10000+
Rate ratio and 95% CI
For each factor, the white circles lying on the vertical line indicate the baseline comparison group.
RRs >1 (to the right of the vertical line) indicate that the rate in that group was higher than in the
baseline comparison group; RRs <1 (to the left of the vertical line) indicate that the rate among
individuals in that group was lower than in the baseline comparison group. RRs for each factor are
adjusted for all the other factors
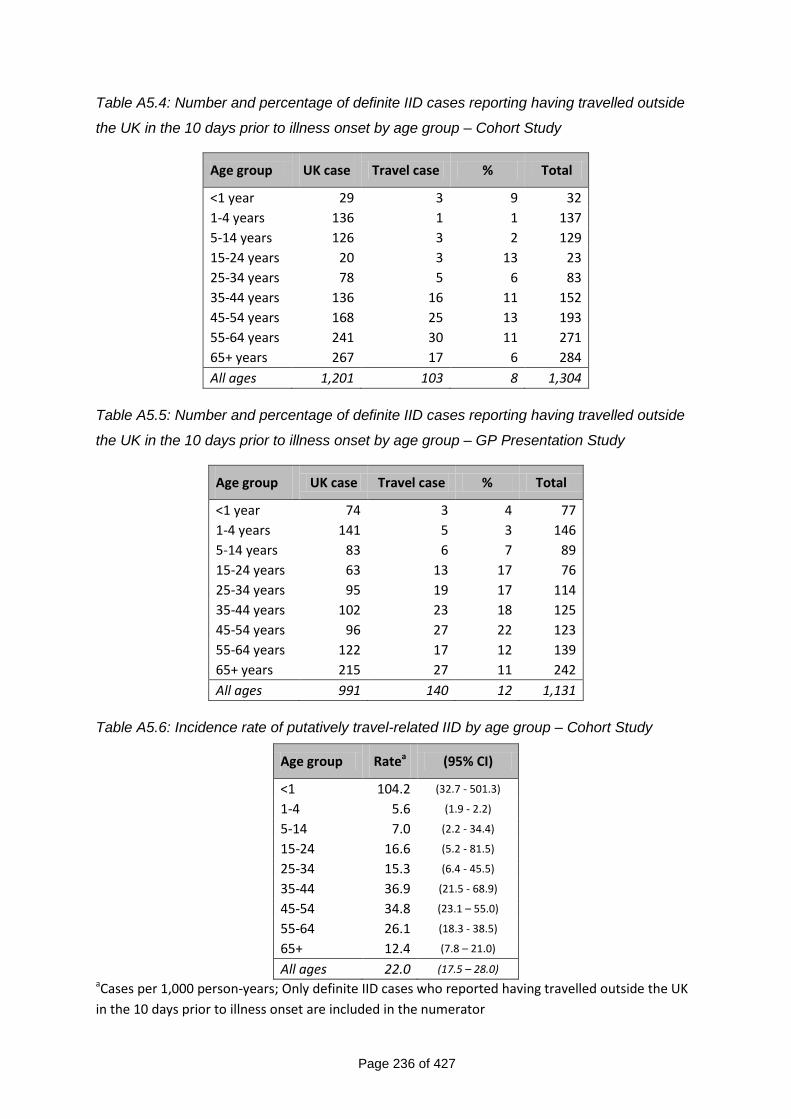
Page 236 of 427
Table A5.4: Number and percentage of definite IID cases reporting having travelled outside
the UK in the 10 days prior to illness onset by age group – Cohort Study
Age group UK case Travel case % Total
<1 year 29 3 9 32
1-4 years 136 1 1 137
5-14 years 126 3 2 129
15-24 years 20 3 13 23
25-34 years 78 5 6 83
35-44 years 136 16 11 152
45-54 years 168 25 13 193
55-64 years 241 30 11 271
65+ years 267 17 6 284
All ages 1,201 103 8 1,304
Table A5.5: Number and percentage of definite IID cases reporting having travelled outside
the UK in the 10 days prior to illness onset by age group – GP Presentation Study
Age group UK case Travel case % Total
<1 year 74 3 4 77
1-4 years 141 5 3 146
5-14 years 83 6 7 89
15-24 years 63 13 17 76
25-34 years 95 19 17 114
35-44 years 102 23 18 125
45-54 years 96 27 22 123
55-64 years 122 17 12 139
65+ years 215 27 11 242
All ages 991 140 12 1,131
Table A5.6: Incidence rate of putatively travel-related IID by age group – Cohort Study
Age group Ratea (95% CI)
<1 104.2 (32.7 - 501.3)
1-4 5.6 (1.9 - 2.2)
5-14 7.0 (2.2 - 34.4)
15-24 16.6 (5.2 - 81.5)
25-34 15.3 (6.4 - 45.5)
35-44 36.9 (21.5 - 68.9)
45-54 34.8 (23.1 – 55.0)
55-64 26.1 (18.3 - 38.5)
65+ 12.4 (7.8 – 21.0)
All ages 22.0 (17.5 – 28.0) aCases per 1,000 person-years; Only definite IID cases who reported having travelled outside the UK
in the 10 days prior to illness onset are included in the numerator
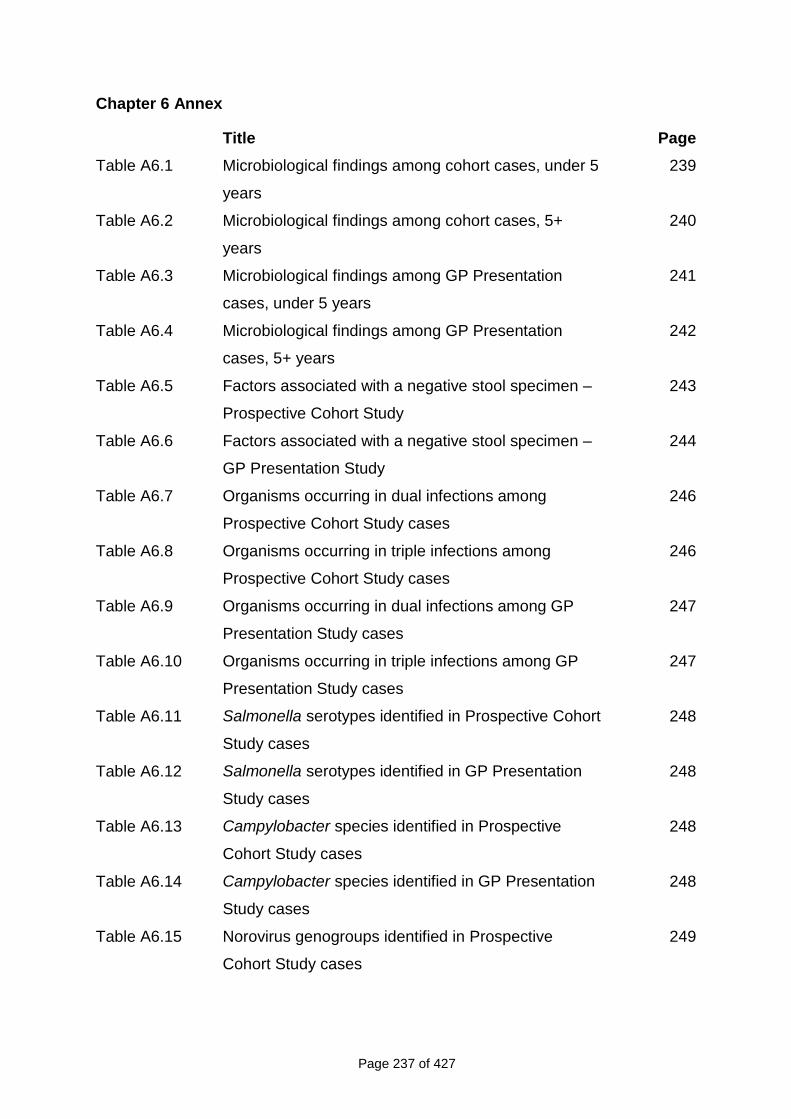
Page 237 of 427
Chapter 6 Annex
Title Page
Table A6.1 Microbiological findings among cohort cases, under 5
years
239
Table A6.2 Microbiological findings among cohort cases, 5+
years
240
Table A6.3 Microbiological findings among GP Presentation
cases, under 5 years
241
Table A6.4 Microbiological findings among GP Presentation
cases, 5+ years
242
Table A6.5 Factors associated with a negative stool specimen –
Prospective Cohort Study
243
Table A6.6 Factors associated with a negative stool specimen –
GP Presentation Study
244
Table A6.7 Organisms occurring in dual infections among
Prospective Cohort Study cases
246
Table A6.8 Organisms occurring in triple infections among
Prospective Cohort Study cases
246
Table A6.9 Organisms occurring in dual infections among GP
Presentation Study cases
247
Table A6.10 Organisms occurring in triple infections among GP
Presentation Study cases
247
Table A6.11 Salmonella serotypes identified in Prospective Cohort
Study cases
248
Table A6.12 Salmonella serotypes identified in GP Presentation
Study cases
248
Table A6.13 Campylobacter species identified in Prospective
Cohort Study cases
248
Table A6.14 Campylobacter species identified in GP Presentation
Study cases
248
Table A6.15 Norovirus genogroups identified in Prospective
Cohort Study cases
249
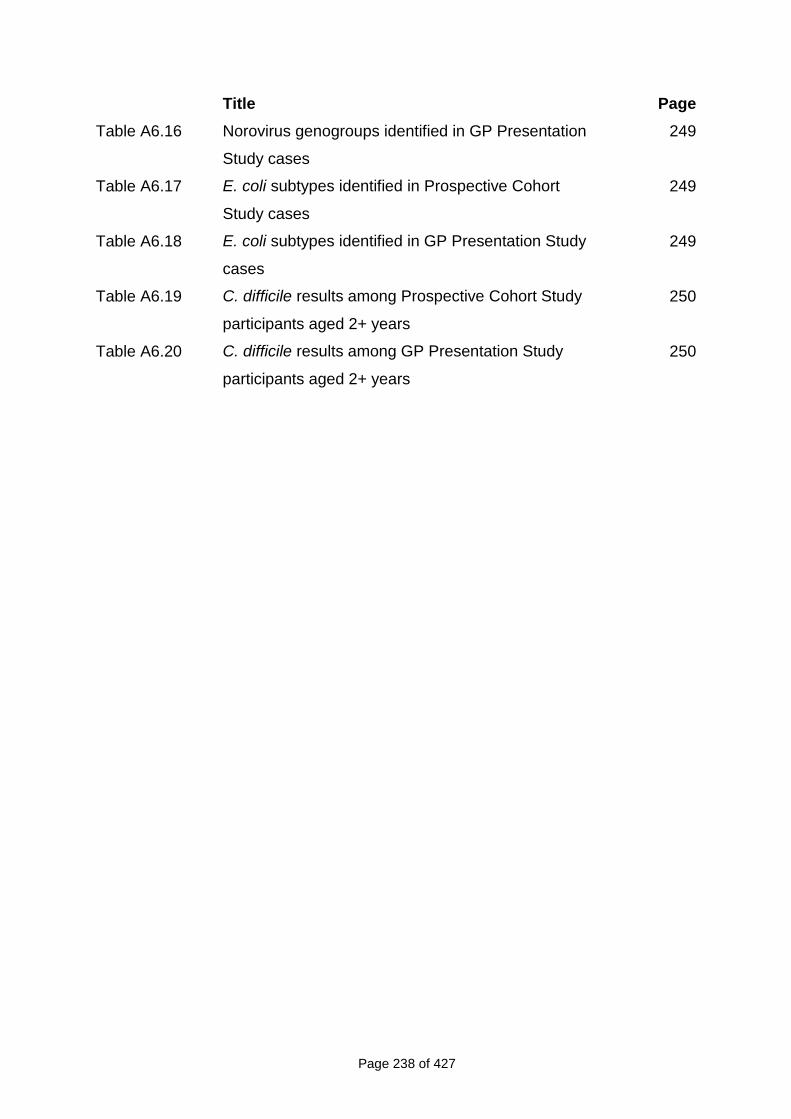
Page 238 of 427
Title Page
Table A6.16 Norovirus genogroups identified in GP Presentation
Study cases
249
Table A6.17 E. coli subtypes identified in Prospective Cohort
Study cases
249
Table A6.18 E. coli subtypes identified in GP Presentation Study
cases
249
Table A6.19 C. difficile results among Prospective Cohort Study
participants aged 2+ years
250
Table A6.20 C. difficile results among GP Presentation Study
participants aged 2+ years
250
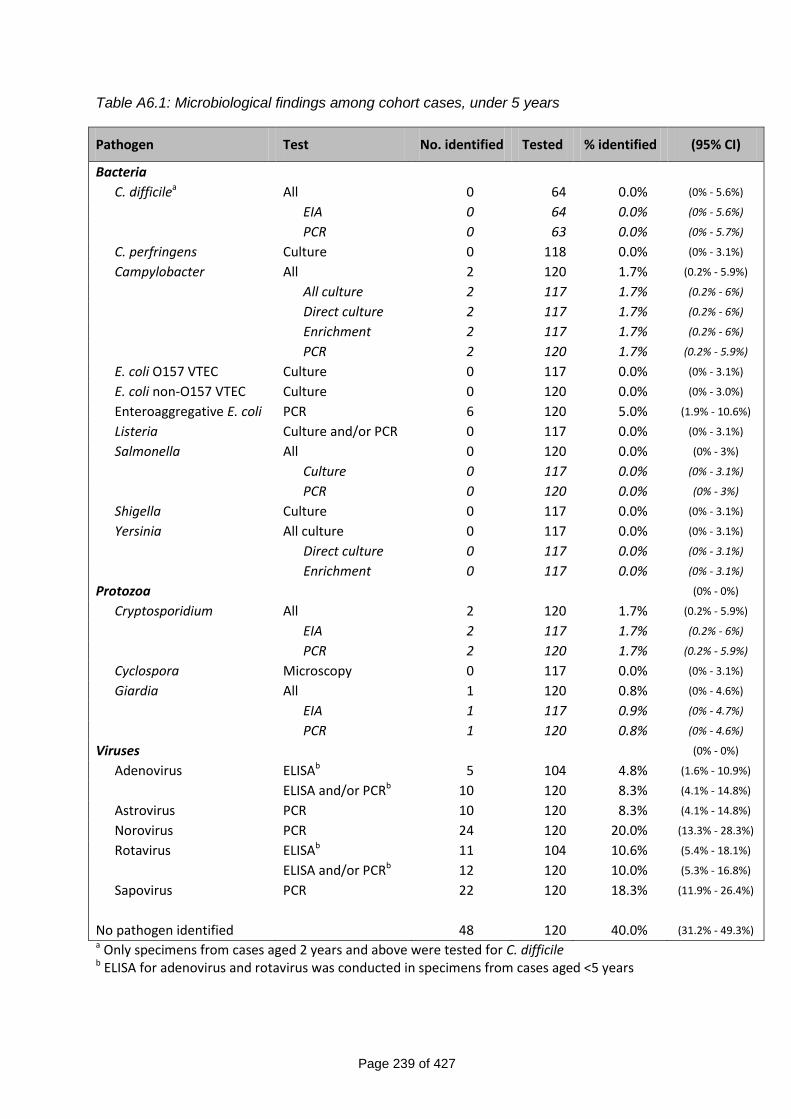
Page 239 of 427
Table A6.1: Microbiological findings among cohort cases, under 5 years
Pathogen Test No. identified Tested % identified (95% CI)
Bacteria
C. difficilea All 0 64 0.0% (0% - 5.6%)
EIA 0 64 0.0% (0% - 5.6%)
PCR 0 63 0.0% (0% - 5.7%)
C. perfringens Culture 0 118 0.0% (0% - 3.1%)
Campylobacter All 2 120 1.7% (0.2% - 5.9%)
All culture 2 117 1.7% (0.2% - 6%)
Direct culture 2 117 1.7% (0.2% - 6%)
Enrichment 2 117 1.7% (0.2% - 6%)
PCR 2 120 1.7% (0.2% - 5.9%)
E. coli O157 VTEC Culture 0 117 0.0% (0% - 3.1%)
E. coli non-O157 VTEC Culture 0 120 0.0% (0% - 3.0%)
Enteroaggregative E. coli PCR 6 120 5.0% (1.9% - 10.6%)
Listeria Culture and/or PCR 0 117 0.0% (0% - 3.1%)
Salmonella All 0 120 0.0% (0% - 3%)
Culture 0 117 0.0% (0% - 3.1%)
PCR 0 120 0.0% (0% - 3%)
Shigella Culture 0 117 0.0% (0% - 3.1%)
Yersinia All culture 0 117 0.0% (0% - 3.1%)
Direct culture 0 117 0.0% (0% - 3.1%)
Enrichment 0 117 0.0% (0% - 3.1%)
Protozoa (0% - 0%)
Cryptosporidium All 2 120 1.7% (0.2% - 5.9%)
EIA 2 117 1.7% (0.2% - 6%)
PCR 2 120 1.7% (0.2% - 5.9%)
Cyclospora Microscopy 0 117 0.0% (0% - 3.1%)
Giardia All 1 120 0.8% (0% - 4.6%)
EIA 1 117 0.9% (0% - 4.7%)
PCR 1 120 0.8% (0% - 4.6%)
Viruses (0% - 0%)
Adenovirus ELISAb 5 104 4.8% (1.6% - 10.9%)
ELISA and/or PCRb 10 120 8.3% (4.1% - 14.8%)
Astrovirus PCR 10 120 8.3% (4.1% - 14.8%)
Norovirus PCR 24 120 20.0% (13.3% - 28.3%)
Rotavirus ELISAb 11 104 10.6% (5.4% - 18.1%)
ELISA and/or PCRb 12 120 10.0% (5.3% - 16.8%)
Sapovirus PCR 22 120 18.3% (11.9% - 26.4%)
No pathogen identified 48 120 40.0% (31.2% - 49.3%) a Only specimens from cases aged 2 years and above were tested for C. difficile b ELISA for adenovirus and rotavirus was conducted in specimens from cases aged <5 years
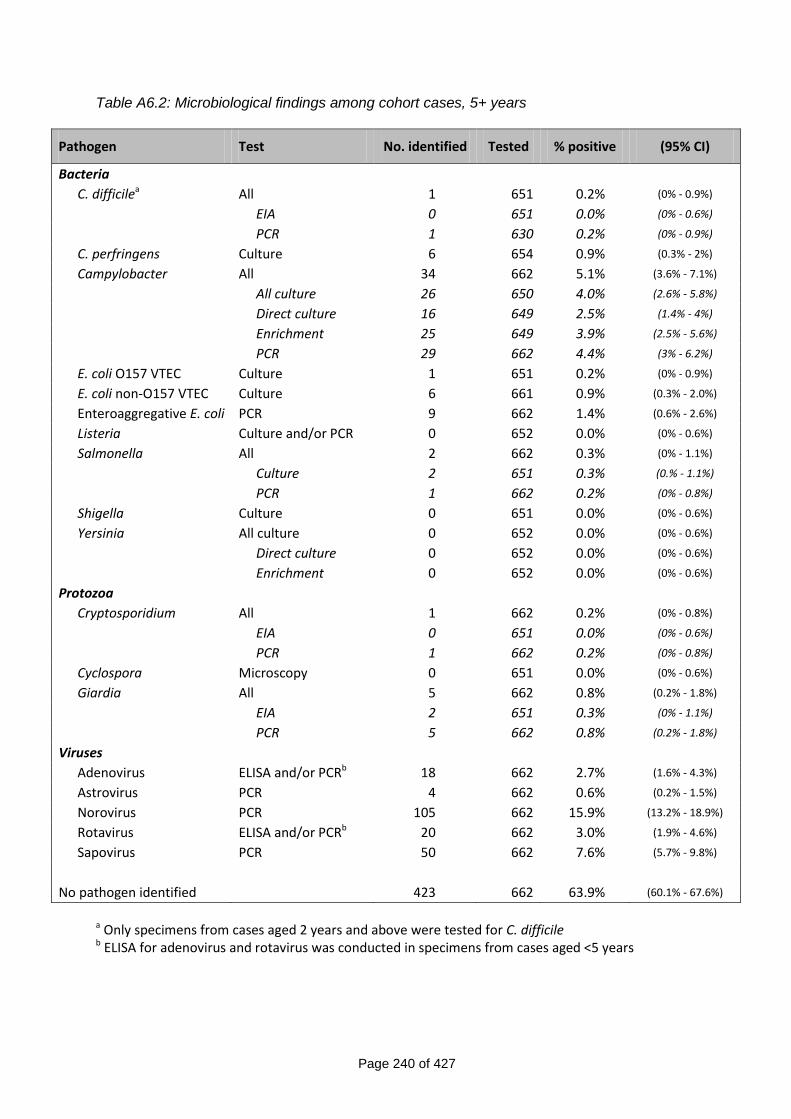
Page 240 of 427
Table A6.2: Microbiological findings among cohort cases, 5+ years
Pathogen Test No. identified Tested % positive (95% CI)
Bacteria
C. difficilea All 1 651 0.2% (0% - 0.9%)
EIA 0 651 0.0% (0% - 0.6%)
PCR 1 630 0.2% (0% - 0.9%)
C. perfringens Culture 6 654 0.9% (0.3% - 2%)
Campylobacter All 34 662 5.1% (3.6% - 7.1%)
All culture 26 650 4.0% (2.6% - 5.8%)
Direct culture 16 649 2.5% (1.4% - 4%)
Enrichment 25 649 3.9% (2.5% - 5.6%)
PCR 29 662 4.4% (3% - 6.2%)
E. coli O157 VTEC Culture 1 651 0.2% (0% - 0.9%)
E. coli non-O157 VTEC Culture 6 661 0.9% (0.3% - 2.0%)
Enteroaggregative E. coli PCR 9 662 1.4% (0.6% - 2.6%)
Listeria Culture and/or PCR 0 652 0.0% (0% - 0.6%)
Salmonella All 2 662 0.3% (0% - 1.1%)
Culture 2 651 0.3% (0.% - 1.1%)
PCR 1 662 0.2% (0% - 0.8%)
Shigella Culture 0 651 0.0% (0% - 0.6%)
Yersinia All culture 0 652 0.0% (0% - 0.6%)
Direct culture 0 652 0.0% (0% - 0.6%)
Enrichment 0 652 0.0% (0% - 0.6%)
Protozoa
Cryptosporidium All 1 662 0.2% (0% - 0.8%)
EIA 0 651 0.0% (0% - 0.6%)
PCR 1 662 0.2% (0% - 0.8%)
Cyclospora Microscopy 0 651 0.0% (0% - 0.6%)
Giardia All 5 662 0.8% (0.2% - 1.8%)
EIA 2 651 0.3% (0% - 1.1%)
PCR 5 662 0.8% (0.2% - 1.8%)
Viruses
Adenovirus ELISA and/or PCRb 18 662 2.7% (1.6% - 4.3%)
Astrovirus PCR 4 662 0.6% (0.2% - 1.5%)
Norovirus PCR 105 662 15.9% (13.2% - 18.9%)
Rotavirus ELISA and/or PCRb 20 662 3.0% (1.9% - 4.6%)
Sapovirus PCR 50 662 7.6% (5.7% - 9.8%)
No pathogen identified 423 662 63.9% (60.1% - 67.6%)
a Only specimens from cases aged 2 years and above were tested for C. difficile b ELISA for adenovirus and rotavirus was conducted in specimens from cases aged <5 years
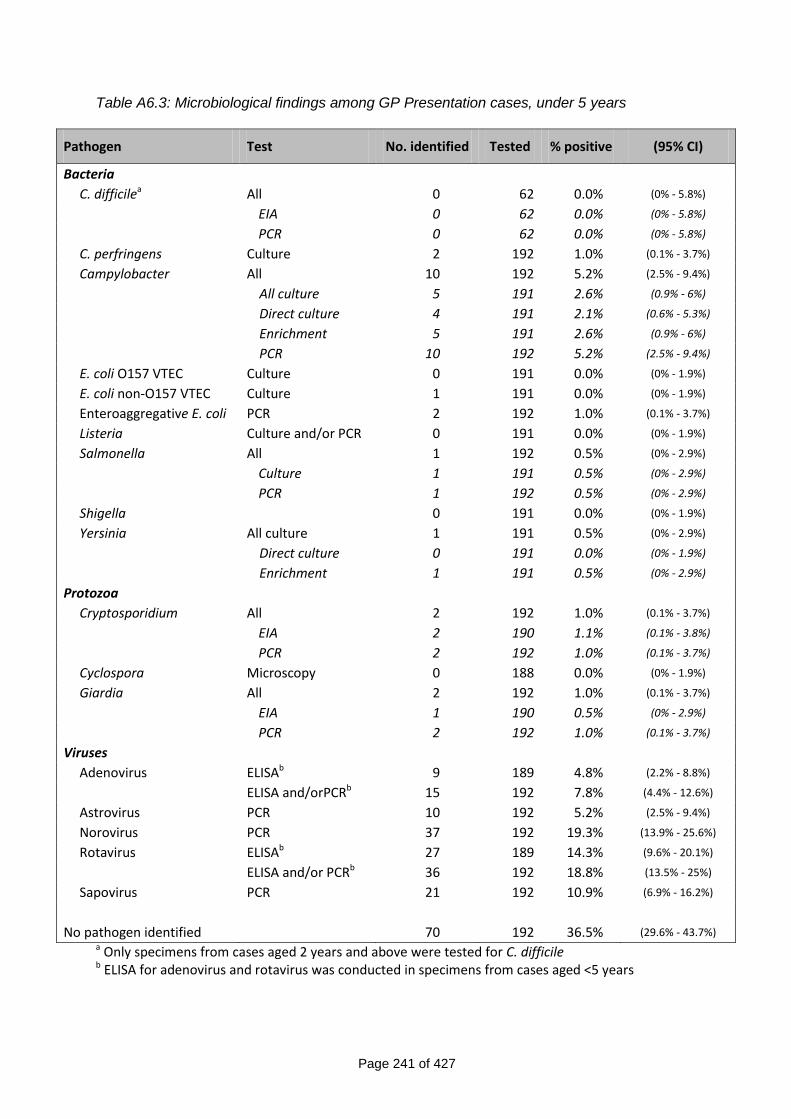
Page 241 of 427
Table A6.3: Microbiological findings among GP Presentation cases, under 5 years
Pathogen Test No. identified Tested % positive (95% CI)
Bacteria
C. difficilea All 0 62 0.0% (0% - 5.8%)
EIA 0 62 0.0% (0% - 5.8%)
PCR 0 62 0.0% (0% - 5.8%)
C. perfringens Culture 2 192 1.0% (0.1% - 3.7%)
Campylobacter All 10 192 5.2% (2.5% - 9.4%)
All culture 5 191 2.6% (0.9% - 6%)
Direct culture 4 191 2.1% (0.6% - 5.3%)
Enrichment 5 191 2.6% (0.9% - 6%)
PCR 10 192 5.2% (2.5% - 9.4%)
E. coli O157 VTEC Culture 0 191 0.0% (0% - 1.9%)
E. coli non-O157 VTEC Culture 1 191 0.0% (0% - 1.9%)
Enteroaggregative E. coli PCR 2 192 1.0% (0.1% - 3.7%)
Listeria Culture and/or PCR 0 191 0.0% (0% - 1.9%)
Salmonella All 1 192 0.5% (0% - 2.9%)
Culture 1 191 0.5% (0% - 2.9%)
PCR 1 192 0.5% (0% - 2.9%)
Shigella 0 191 0.0% (0% - 1.9%)
Yersinia All culture 1 191 0.5% (0% - 2.9%)
Direct culture 0 191 0.0% (0% - 1.9%)
Enrichment 1 191 0.5% (0% - 2.9%)
Protozoa
Cryptosporidium All 2 192 1.0% (0.1% - 3.7%)
EIA 2 190 1.1% (0.1% - 3.8%)
PCR 2 192 1.0% (0.1% - 3.7%)
Cyclospora Microscopy 0 188 0.0% (0% - 1.9%)
Giardia All 2 192 1.0% (0.1% - 3.7%)
EIA 1 190 0.5% (0% - 2.9%)
PCR 2 192 1.0% (0.1% - 3.7%)
Viruses
Adenovirus ELISAb 9 189 4.8% (2.2% - 8.8%)
ELISA and/orPCRb 15 192 7.8% (4.4% - 12.6%)
Astrovirus PCR 10 192 5.2% (2.5% - 9.4%)
Norovirus PCR 37 192 19.3% (13.9% - 25.6%)
Rotavirus ELISAb 27 189 14.3% (9.6% - 20.1%)
ELISA and/or PCRb 36 192 18.8% (13.5% - 25%)
Sapovirus PCR 21 192 10.9% (6.9% - 16.2%)
No pathogen identified 70 192 36.5% (29.6% - 43.7%) a Only specimens from cases aged 2 years and above were tested for C. difficile b ELISA for adenovirus and rotavirus was conducted in specimens from cases aged <5 years
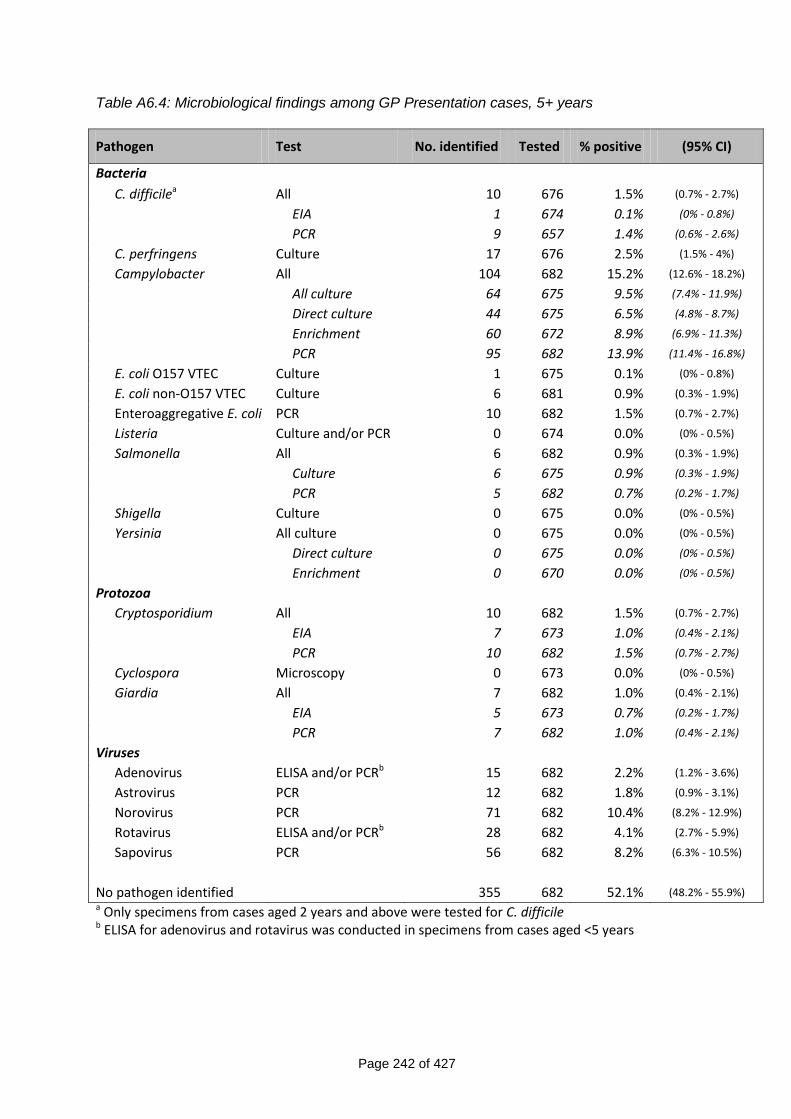
Page 242 of 427
Table A6.4: Microbiological findings among GP Presentation cases, 5+ years
Pathogen Test No. identified Tested % positive (95% CI)
Bacteria
C. difficilea All 10 676 1.5% (0.7% - 2.7%)
EIA 1 674 0.1% (0% - 0.8%)
PCR 9 657 1.4% (0.6% - 2.6%)
C. perfringens Culture 17 676 2.5% (1.5% - 4%)
Campylobacter All 104 682 15.2% (12.6% - 18.2%)
All culture 64 675 9.5% (7.4% - 11.9%)
Direct culture 44 675 6.5% (4.8% - 8.7%)
Enrichment 60 672 8.9% (6.9% - 11.3%)
PCR 95 682 13.9% (11.4% - 16.8%)
E. coli O157 VTEC Culture 1 675 0.1% (0% - 0.8%)
E. coli non-O157 VTEC Culture 6 681 0.9% (0.3% - 1.9%)
Enteroaggregative E. coli PCR 10 682 1.5% (0.7% - 2.7%)
Listeria Culture and/or PCR 0 674 0.0% (0% - 0.5%)
Salmonella All 6 682 0.9% (0.3% - 1.9%)
Culture 6 675 0.9% (0.3% - 1.9%)
PCR 5 682 0.7% (0.2% - 1.7%)
Shigella Culture 0 675 0.0% (0% - 0.5%)
Yersinia All culture 0 675 0.0% (0% - 0.5%)
Direct culture 0 675 0.0% (0% - 0.5%)
Enrichment 0 670 0.0% (0% - 0.5%)
Protozoa
Cryptosporidium All 10 682 1.5% (0.7% - 2.7%)
EIA 7 673 1.0% (0.4% - 2.1%)
PCR 10 682 1.5% (0.7% - 2.7%)
Cyclospora Microscopy 0 673 0.0% (0% - 0.5%)
Giardia All 7 682 1.0% (0.4% - 2.1%)
EIA 5 673 0.7% (0.2% - 1.7%)
PCR 7 682 1.0% (0.4% - 2.1%)
Viruses
Adenovirus ELISA and/or PCRb 15 682 2.2% (1.2% - 3.6%)
Astrovirus PCR 12 682 1.8% (0.9% - 3.1%)
Norovirus PCR 71 682 10.4% (8.2% - 12.9%)
Rotavirus ELISA and/or PCRb 28 682 4.1% (2.7% - 5.9%)
Sapovirus PCR 56 682 8.2% (6.3% - 10.5%)
No pathogen identified 355 682 52.1% (48.2% - 55.9%) a Only specimens from cases aged 2 years and above were tested for C. difficile b ELISA for adenovirus and rotavirus was conducted in specimens from cases aged <5 years
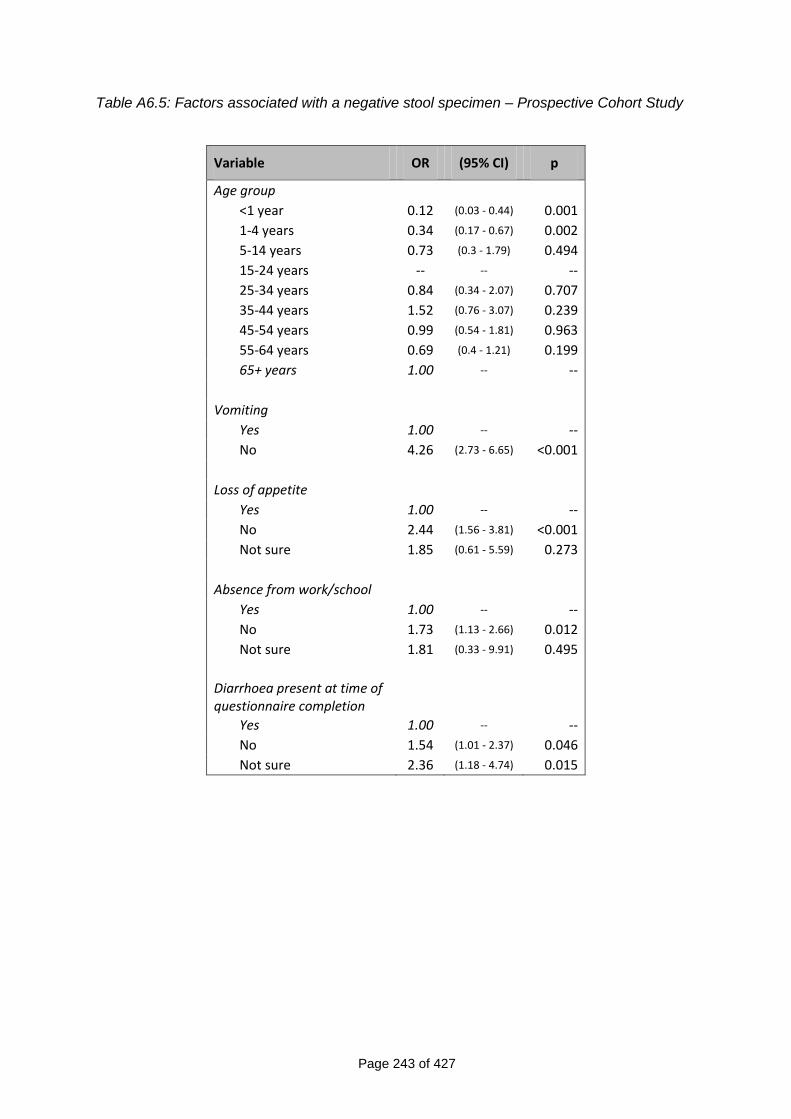
Page 243 of 427
Table A6.5: Factors associated with a negative stool specimen – Prospective Cohort Study
Variable OR (95% CI) p
Age group
<1 year 0.12 (0.03 - 0.44) 0.001
1-4 years 0.34 (0.17 - 0.67) 0.002
5-14 years 0.73 (0.3 - 1.79) 0.494
15-24 years -- -- --
25-34 years 0.84 (0.34 - 2.07) 0.707
35-44 years 1.52 (0.76 - 3.07) 0.239
45-54 years 0.99 (0.54 - 1.81) 0.963
55-64 years 0.69 (0.4 - 1.21) 0.199
65+ years 1.00 -- --
Vomiting
Yes 1.00 -- --
No 4.26 (2.73 - 6.65) <0.001
Loss of appetite
Yes 1.00 -- --
No 2.44 (1.56 - 3.81) <0.001
Not sure 1.85 (0.61 - 5.59) 0.273
Absence from work/school
Yes 1.00 -- --
No 1.73 (1.13 - 2.66) 0.012
Not sure 1.81 (0.33 - 9.91) 0.495
Diarrhoea present at time of questionnaire completion
Yes 1.00 -- --
No 1.54 (1.01 - 2.37) 0.046
Not sure 2.36 (1.18 - 4.74) 0.015
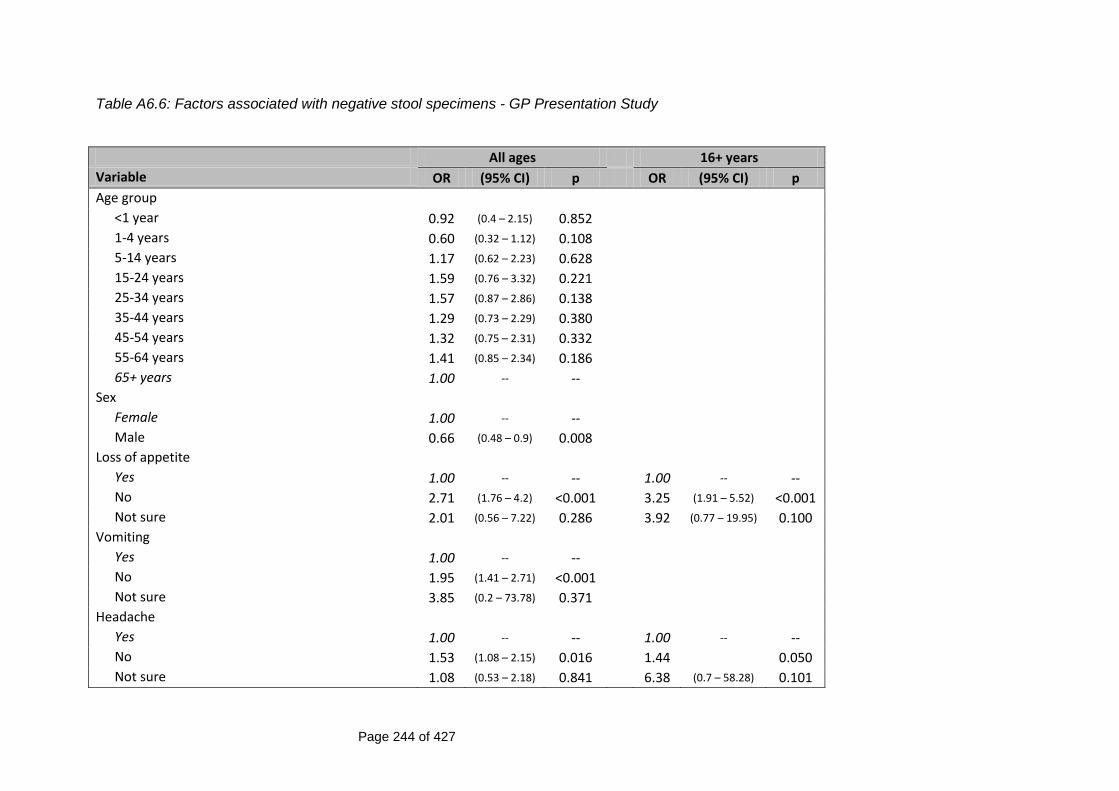
Page 244 of 427
Table A6.6: Factors associated with negative stool specimens - GP Presentation Study
All ages 16+ years
Variable OR (95% CI) p OR (95% CI) p
Age group
<1 year 0.92 (0.4 – 2.15) 0.852
1-4 years 0.60 (0.32 – 1.12) 0.108
5-14 years 1.17 (0.62 – 2.23) 0.628
15-24 years 1.59 (0.76 – 3.32) 0.221
25-34 years 1.57 (0.87 – 2.86) 0.138
35-44 years 1.29 (0.73 – 2.29) 0.380
45-54 years 1.32 (0.75 – 2.31) 0.332
55-64 years 1.41 (0.85 – 2.34) 0.186
65+ years 1.00 -- --
Sex
Female 1.00 -- --
Male 0.66 (0.48 – 0.9) 0.008
Loss of appetite
Yes 1.00 -- -- 1.00 -- --
No 2.71 (1.76 – 4.2) <0.001 3.25 (1.91 – 5.52) <0.001
Not sure 2.01 (0.56 – 7.22) 0.286 3.92 (0.77 – 19.95) 0.100
Vomiting
Yes 1.00 -- --
No 1.95 (1.41 – 2.71) <0.001
Not sure 3.85 (0.2 – 73.78) 0.371
Headache
Yes 1.00 -- -- 1.00 -- --
No 1.53 (1.08 – 2.15) 0.016 1.44 0.050
Not sure 1.08 (0.53 – 2.18) 0.841 6.38 (0.7 – 58.28) 0.101
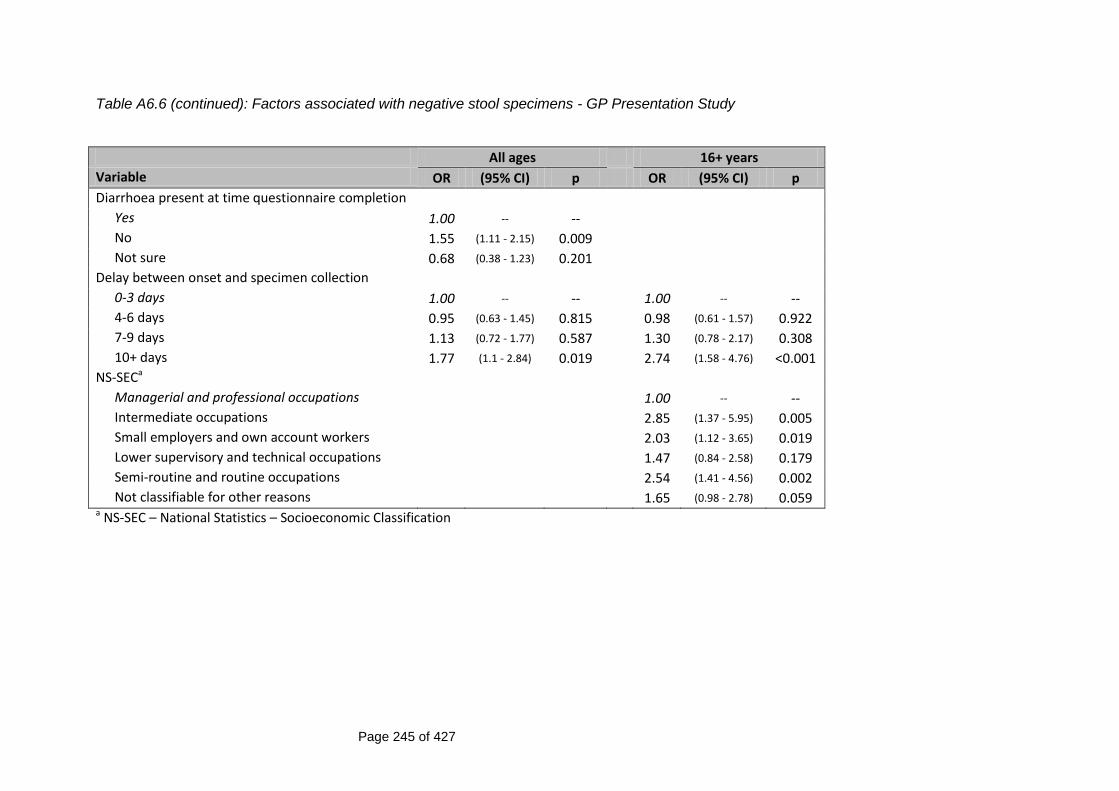
Page 245 of 427
Table A6.6 (continued): Factors associated with negative stool specimens - GP Presentation Study
All ages 16+ years
Variable OR (95% CI) p OR (95% CI) p
Diarrhoea present at time questionnaire completion
Yes 1.00 -- --
No 1.55 (1.11 - 2.15) 0.009
Not sure 0.68 (0.38 - 1.23) 0.201
Delay between onset and specimen collection
0-3 days 1.00 -- -- 1.00 -- --
4-6 days 0.95 (0.63 - 1.45) 0.815 0.98 (0.61 - 1.57) 0.922
7-9 days 1.13 (0.72 - 1.77) 0.587 1.30 (0.78 - 2.17) 0.308
10+ days 1.77 (1.1 - 2.84) 0.019 2.74 (1.58 - 4.76) <0.001
NS-SECa
Managerial and professional occupations 1.00 -- --
Intermediate occupations 2.85 (1.37 - 5.95) 0.005
Small employers and own account workers 2.03 (1.12 - 3.65) 0.019
Lower supervisory and technical occupations 1.47 (0.84 - 2.58) 0.179
Semi-routine and routine occupations 2.54 (1.41 - 4.56) 0.002
Not classifiable for other reasons 1.65 (0.98 - 2.78) 0.059 a NS-SEC – National Statistics – Socioeconomic Classification
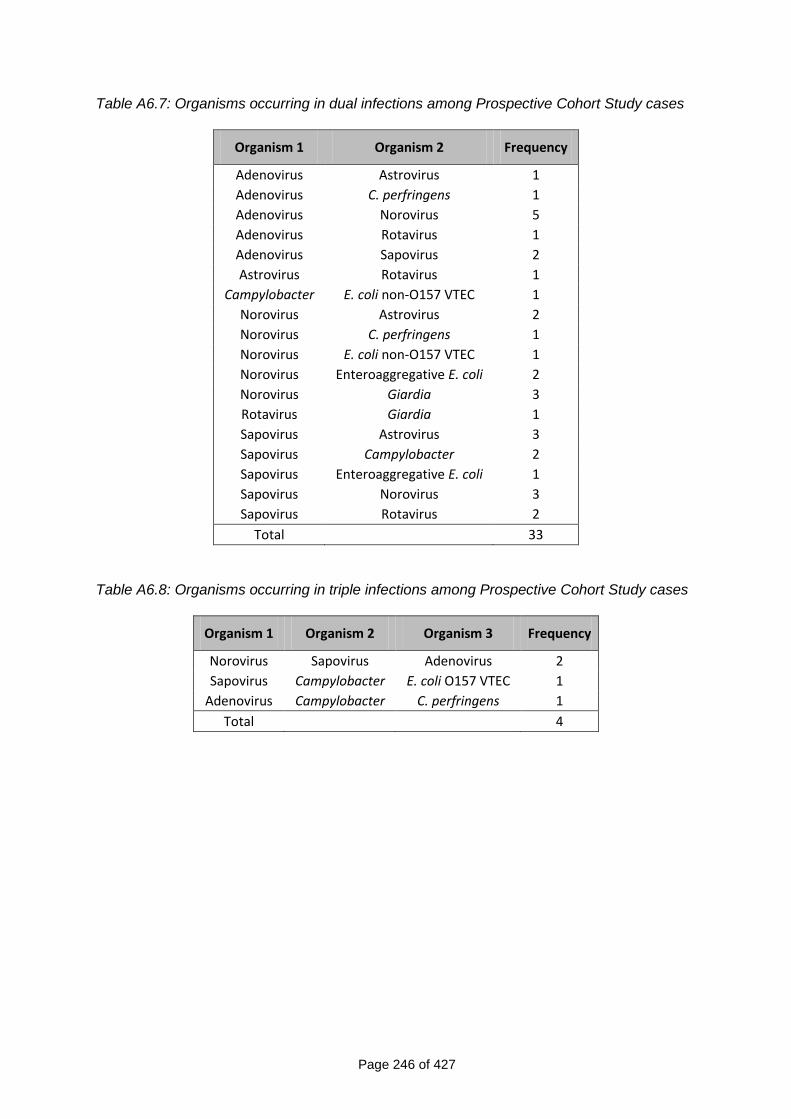
Page 246 of 427
Table A6.7: Organisms occurring in dual infections among Prospective Cohort Study cases
Organism 1 Organism 2 Frequency
Adenovirus Astrovirus 1
Adenovirus C. perfringens 1
Adenovirus Norovirus 5
Adenovirus Rotavirus 1
Adenovirus Sapovirus 2
Astrovirus Rotavirus 1
Campylobacter E. coli non-O157 VTEC 1
Norovirus Astrovirus 2
Norovirus C. perfringens 1
Norovirus E. coli non-O157 VTEC 1
Norovirus Enteroaggregative E. coli 2
Norovirus Giardia 3
Rotavirus Giardia 1
Sapovirus Astrovirus 3
Sapovirus Campylobacter 2
Sapovirus Enteroaggregative E. coli 1
Sapovirus Norovirus 3
Sapovirus Rotavirus 2
Total 33
Table A6.8: Organisms occurring in triple infections among Prospective Cohort Study cases
Organism 1 Organism 2 Organism 3 Frequency
Norovirus Sapovirus Adenovirus 2
Sapovirus Campylobacter E. coli O157 VTEC 1
Adenovirus Campylobacter C. perfringens 1
Total 4
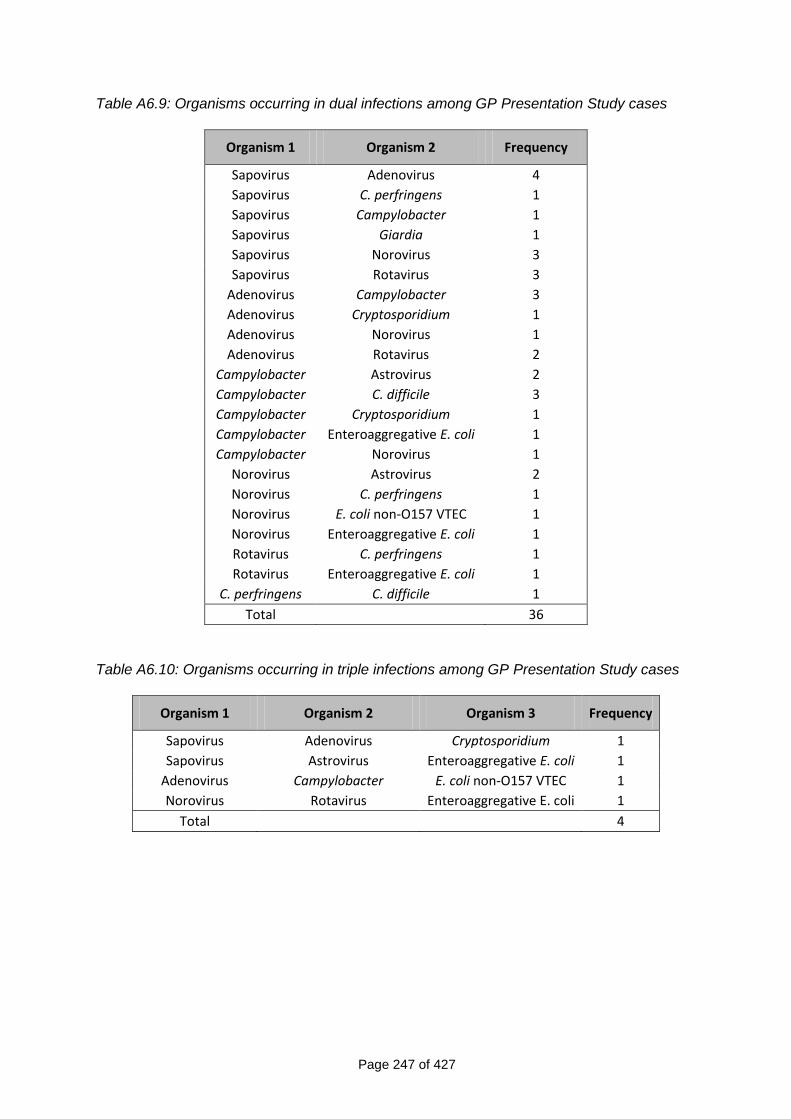
Page 247 of 427
Table A6.9: Organisms occurring in dual infections among GP Presentation Study cases
Organism 1 Organism 2 Frequency
Sapovirus Adenovirus 4
Sapovirus C. perfringens 1
Sapovirus Campylobacter 1
Sapovirus Giardia 1
Sapovirus Norovirus 3
Sapovirus Rotavirus 3
Adenovirus Campylobacter 3
Adenovirus Cryptosporidium 1
Adenovirus Norovirus 1
Adenovirus Rotavirus 2
Campylobacter Astrovirus 2
Campylobacter C. difficile 3
Campylobacter Cryptosporidium 1
Campylobacter Enteroaggregative E. coli 1
Campylobacter Norovirus 1
Norovirus Astrovirus 2
Norovirus C. perfringens 1
Norovirus E. coli non-O157 VTEC 1
Norovirus Enteroaggregative E. coli 1
Rotavirus C. perfringens 1
Rotavirus Enteroaggregative E. coli 1
C. perfringens C. difficile 1
Total 36
Table A6.10: Organisms occurring in triple infections among GP Presentation Study cases
Organism 1 Organism 2 Organism 3 Frequency
Sapovirus Adenovirus Cryptosporidium 1
Sapovirus Astrovirus Enteroaggregative E. coli 1
Adenovirus Campylobacter E. coli non-O157 VTEC 1
Norovirus Rotavirus Enteroaggregative E. coli 1
Total 4
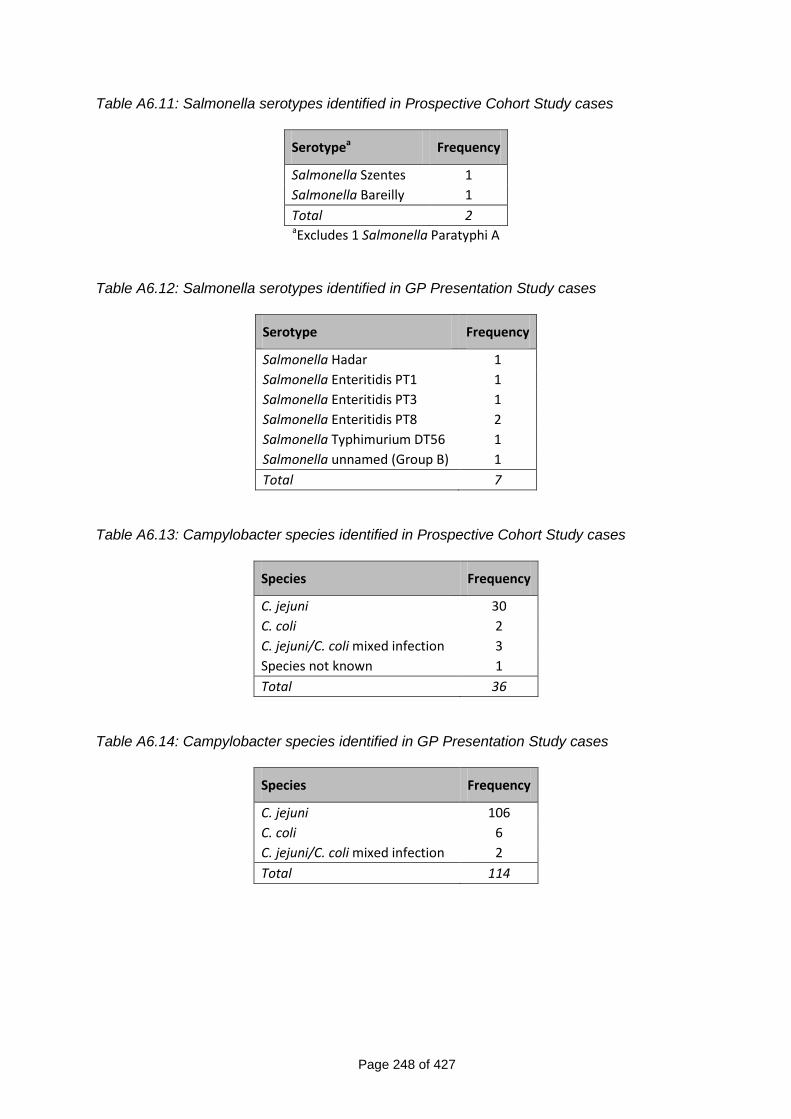
Page 248 of 427
Table A6.11: Salmonella serotypes identified in Prospective Cohort Study cases
Serotypea Frequency
Salmonella Szentes 1
Salmonella Bareilly 1
Total 2
aExcludes 1 Salmonella Paratyphi A Table A6.12: Salmonella serotypes identified in GP Presentation Study cases
Serotype Frequency
Salmonella Hadar 1
Salmonella Enteritidis PT1 1
Salmonella Enteritidis PT3 1
Salmonella Enteritidis PT8 2
Salmonella Typhimurium DT56 1
Salmonella unnamed (Group B) 1
Total 7
Table A6.13: Campylobacter species identified in Prospective Cohort Study cases
Species Frequency
C. jejuni 30
C. coli 2
C. jejuni/C. coli mixed infection 3
Species not known 1
Total 36
Table A6.14: Campylobacter species identified in GP Presentation Study cases
Species Frequency
C. jejuni 106
C. coli 6
C. jejuni/C. coli mixed infection 2
Total 114
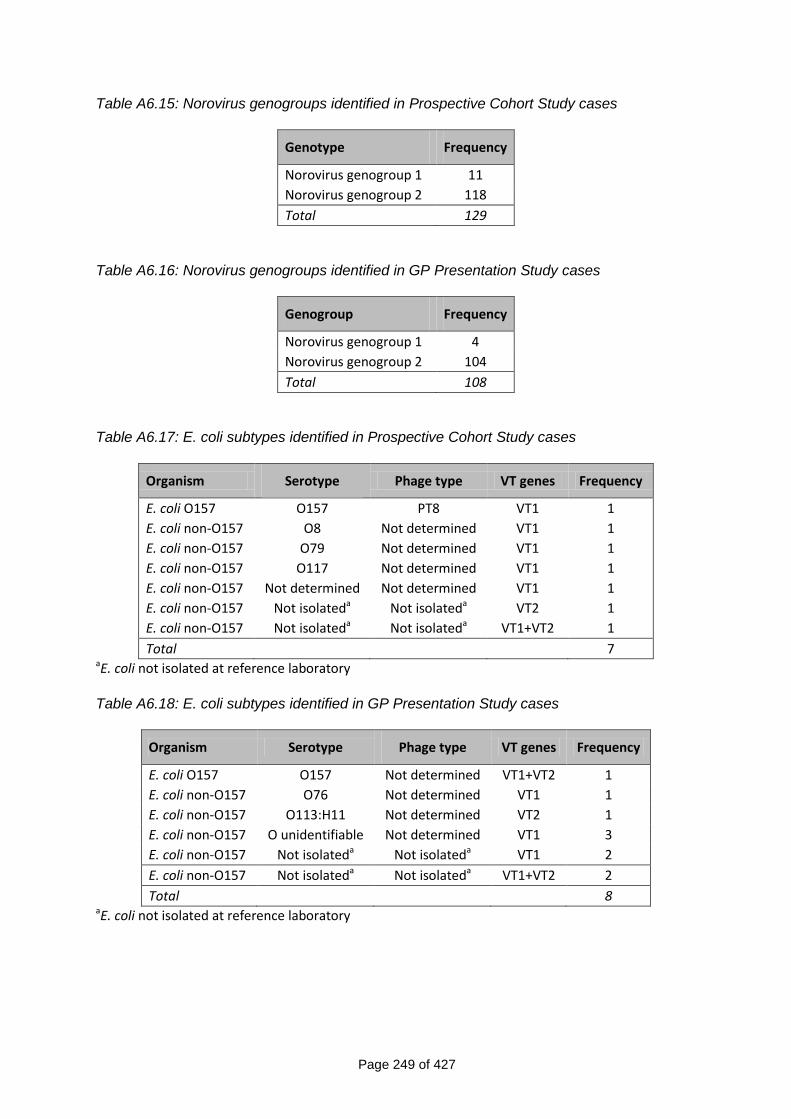
Page 249 of 427
Table A6.15: Norovirus genogroups identified in Prospective Cohort Study cases
Genotype Frequency
Norovirus genogroup 1 11
Norovirus genogroup 2 118
Total 129
Table A6.16: Norovirus genogroups identified in GP Presentation Study cases
Genogroup Frequency
Norovirus genogroup 1 4
Norovirus genogroup 2 104
Total 108
Table A6.17: E. coli subtypes identified in Prospective Cohort Study cases
Organism Serotype Phage type VT genes Frequency
E. coli O157 O157 PT8 VT1 1
E. coli non-O157 O8 Not determined VT1 1
E. coli non-O157 O79 Not determined VT1 1
E. coli non-O157 O117 Not determined VT1 1
E. coli non-O157 Not determined Not determined VT1 1
E. coli non-O157 Not isolateda Not isolateda VT2 1
E. coli non-O157 Not isolateda Not isolateda VT1+VT2 1
Total 7 aE. coli not isolated at reference laboratory Table A6.18: E. coli subtypes identified in GP Presentation Study cases
Organism Serotype Phage type VT genes Frequency
E. coli O157 O157 Not determined VT1+VT2 1
E. coli non-O157 O76 Not determined VT1 1
E. coli non-O157 O113:H11 Not determined VT2 1
E. coli non-O157 O unidentifiable Not determined VT1 3
E. coli non-O157 Not isolateda Not isolateda VT1 2
E. coli non-O157 Not isolateda Not isolateda VT1+VT2 2
Total 8 aE. coli not isolated at reference laboratory
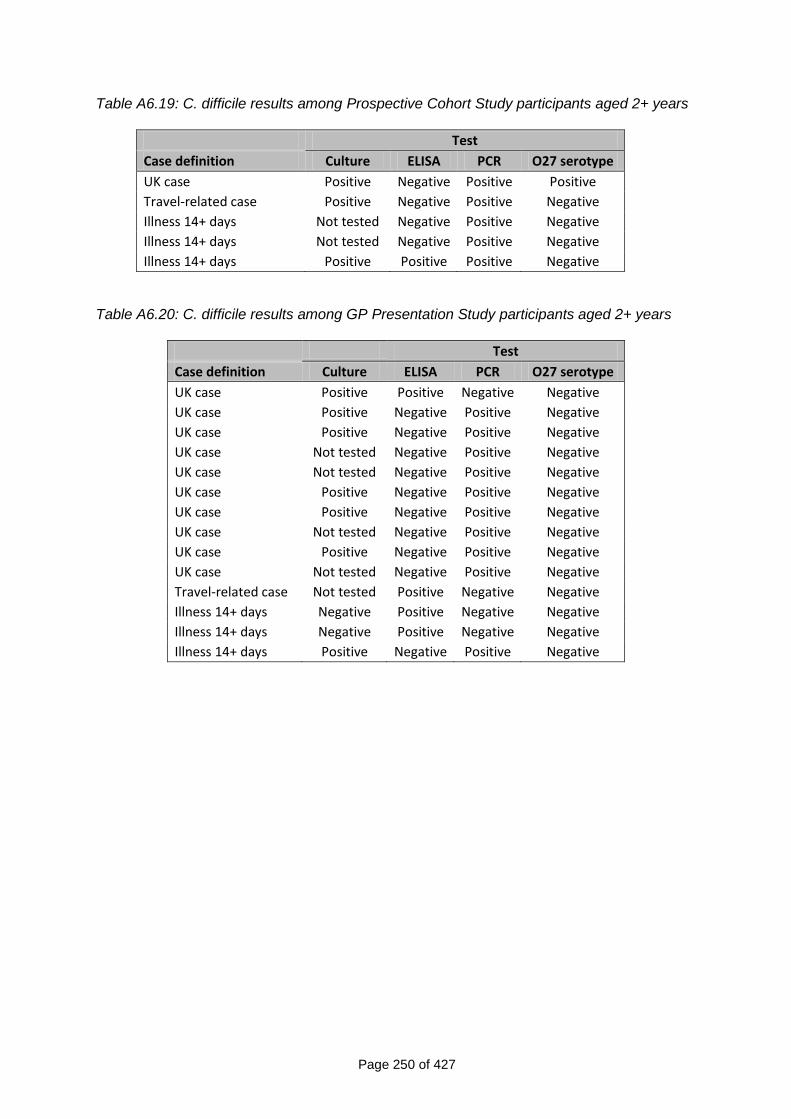
Page 250 of 427
Table A6.19: C. difficile results among Prospective Cohort Study participants aged 2+ years
Test
Case definition Culture ELISA PCR O27 serotype
UK case Positive Negative Positive Positive
Travel-related case Positive Negative Positive Negative
Illness 14+ days Not tested Negative Positive Negative
Illness 14+ days Not tested Negative Positive Negative
Illness 14+ days Positive Positive Positive Negative
Table A6.20: C. difficile results among GP Presentation Study participants aged 2+ years
Test
Case definition Culture ELISA PCR O27 serotype
UK case Positive Positive Negative Negative
UK case Positive Negative Positive Negative
UK case Positive Negative Positive Negative
UK case Not tested Negative Positive Negative
UK case Not tested Negative Positive Negative
UK case Positive Negative Positive Negative
UK case Positive Negative Positive Negative
UK case Not tested Negative Positive Negative
UK case Positive Negative Positive Negative
UK case Not tested Negative Positive Negative
Travel-related case Not tested Positive Negative Negative
Illness 14+ days Negative Positive Negative Negative
Illness 14+ days Negative Positive Negative Negative
Illness 14+ days Positive Negative Positive Negative
Related Documents