WETLAND SOLUTIONS, INC. Final Report Ichetucknee River, Florida Assessment of the Effects of Human Use on Turbidity Prepared for Three Rivers Trust FNPC January 2011

Welcome message from author
This document is posted to help you gain knowledge. Please leave a comment to let me know what you think about it! Share it to your friends and learn new things together.
Transcript

WETLAND SOLUTIONS, INC.
F i n a l R e p o r t
Ichetucknee River, Florida Assessment of the Effects of Human
Use on Turbidity
Prepared for
Three Rivers Trust FNPC January 2011

F i n a l R e p o r t
Ichetucknee River, Florida Assessment of the Effects of Human
Use on Turbidity
Prepared for
Three Rivers Trust FNPC January 2011

WETLAND SOLUTIONS, INC.
I
Table of Contents
Table of Contents ......................................................................................................................... i List of Exhibits ............................................................................................................................. ii 1.0 Introduction......................................................................................................................1
1.1 Introduction ...........................................................................................................1 1.2 Scope of This Study ............................................................................................1
2.0 Description of the Ichetucknee System ......................................................................3 2.1 General Location ................................................................................................3 2.2 State-Owned Lands and Designations.............................................................4 2.3 Recreational Use of Ichetucknee Springs State Park ....................................4
3.0 Review of Existing Relevant Studies Pertaining to the Ichetucknee and Similar Spring Systems in Florida...........................................................................................................6
3.1 Introduction ...........................................................................................................6 3.2 Ichetucknee Springs State Park Unit Management Plan (FDEP 2000a)....6 3.3 Recreational Use and Economic Impact (Bonn and Bell 2003) ...................7 3.4 Effects of Nutrients and Light Availability on Submerged Aquatic Macrophytes (Canfield and Hoyer 1988) ......................................................................7 3.5 Submerged Aquatic Plant Community Mapping – 2003 (Kurz et al. 2003) 7 3.6 Submerged Aquatic Plant Community Mapping – 2004 (Kurz et al. 2004) 9 3.7 Florida Bioassessments and Ecosummaries (FDEP) ....................................9 3.8 Carrying Capacity of the Ichetucknee Springs and River (DuToit 1979) ..10 3.9 Ichetucknee Springs and River Environmental Health – 2008 Report Card (WSI 2008).......................................................................................................................11 3.10 An Ecosystem-Level Study of Florida’s Springs (WSI 2010)......................11
4.0 Ichetucknee River Study Methods.............................................................................12 4.1 Introduction .........................................................................................................12 4.2 Human Use.........................................................................................................12 4.3 Water Quality Sampling ....................................................................................12
4.3.1 Data Sonde Installations.......................................................................12 4.3.2 Longitudinal Transects.........................................................................15
4.4 Light Attenuation ................................................................................................15 5.0 Results and Discussion ................................................................................................17
5.1 Introduction .........................................................................................................17 5.2 Human Use.........................................................................................................17 5.3 Light Attenuation ................................................................................................21 5.4 Horizontal Secchi Distance ..............................................................................23 5.5 Turbidity...............................................................................................................24 5.6 Human-Induced Turbidity .................................................................................31
6.0 Conclusions and Recommendations..........................................................................33 6.3 Future Work ........................................................................................................35
7.0 References Cited ............................................................................................................36 Appendix A..................................................................................................................................38 Water Quality Transects in the Ichetucknee Springs State Park.......................................38

WETLAND SOLUTIONS, INC.
II
List of Exhibits 1-1 Ichetucknee Springs State Park Location Map
2-1 Map of Ichetucknee Springs State Park and the Ichetucknee River to Its Confluence with the Santa Fe River
2-2 Ichetucknee Springs State Park Monthly and Annual Attendance (July 1983 – November 2010)
4-1 Sonde Deployment Locations in Ichetucknee Springs State Park
4-2 Sampling Events and Data Collected
5-1 Ichetucknee Springs State Park Daily Attendance for May 1, 2010 – November 30, 2010
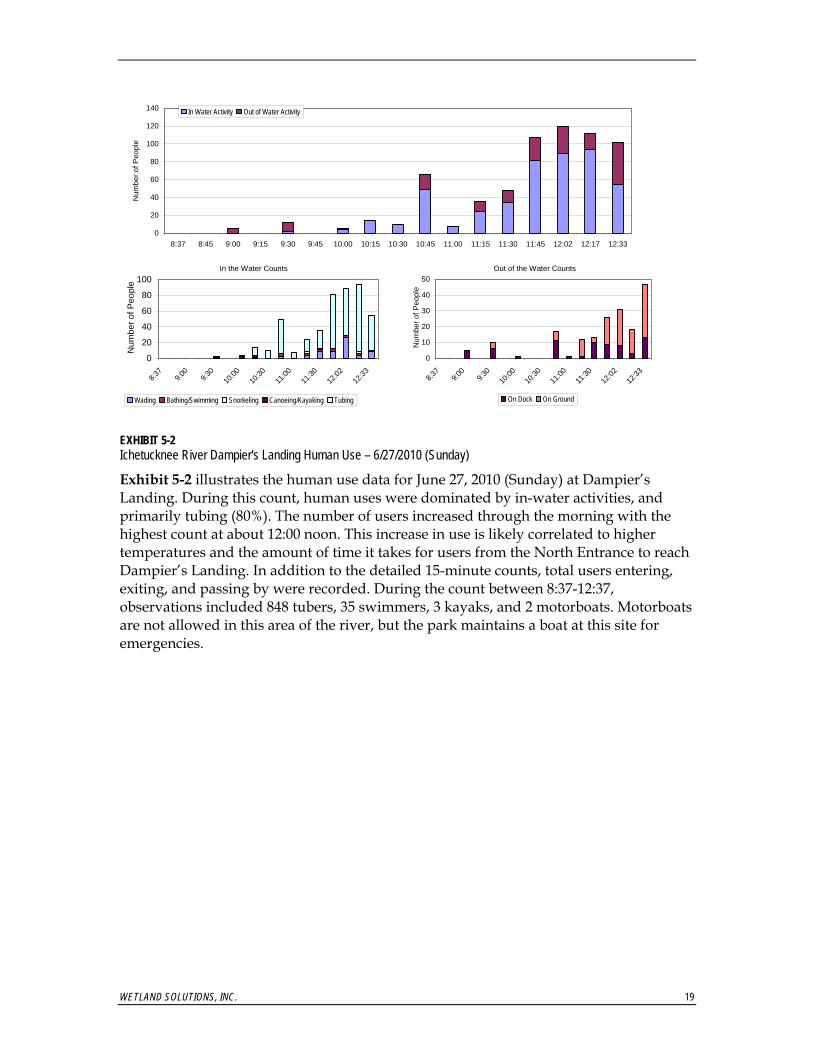
5-2 Ichetucknee River Dampier's Landing Human Use – 6/27/2010 (Sunday)
5-3 Ichetucknee River Dampier's Landing Human Use – 7/6/2010 (Tuesday)
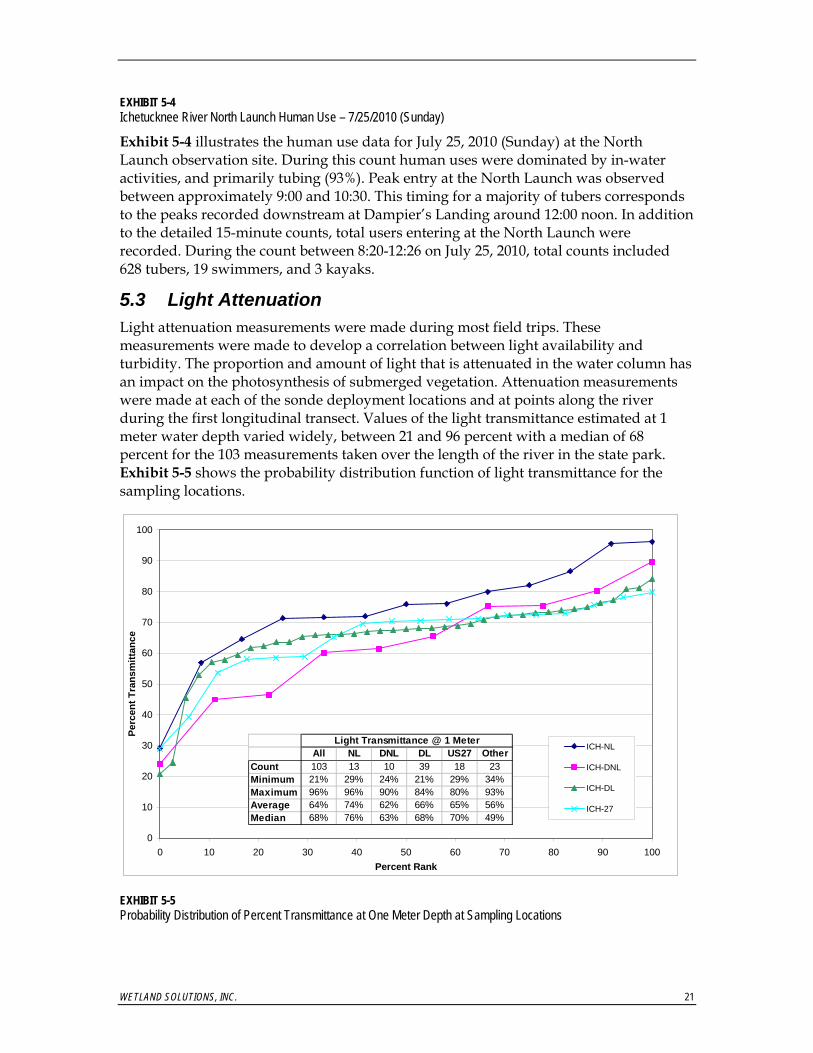
5-4 Ichetucknee River North Launch Human Use – 7/25/2010 (Sunday)
5-5 Probability Distribution of Percent Transmittance at One Meter Depth at Sampling Locations
5-6 Turbidity and Light Attenuation Time Series at US27 on August 1, 2010
5-7 Turbidity Versus Light Attenuation at US27 on August 1, 2010
5-8 Horizontal Secchi Measurements by Location
5-9 Turbidity Upstream of the North Launch from July 14, 2010 to August 1, 2010 by Weekday and Weekend Day
5-10 Turbidity Downstream of the North Launch from July 14, 2010 to July 17, 2010 by Weekday and Weekend Day
5-11 Turbidity at Dampier's Landing from June 16, 2010 to July 6, 2010 by Weekday and Weekend Day
5-12 Turbidity at US 27 from June 16, 2010 to July 6, 2010 and August 13, 2010 to September 9, 2010 by Weekday and Weekend Day
5-13 Turbidity Upstream of the North Launch from October 7, 2010 to October 12, 2010 and December 2, 2010 – December 9, 2010 by Weekday and Weekend Day
5-14 Turbidity Downstream of the North Launch from December 2, 2010 to December 9, 2010 by Weekday and Weekend Day
5-15 Turbidity at Dampier's Landing from November 24, 2010 to December 2, 2010 by Weekday and Weekend Day

WETLAND SOLUTIONS, INC.
III
5-16 Turbidity at US 27 from October 7, 2010 to October 21, 2010 and November 24, 2010 to December 2, 2010 by Weekday and Weekend Day
5-17 Ichetucknee River Water Quality Transect from North Launch to US 27 on 7/26/2010 (AM: 9:30 - 12:30; PM: 14:14 - 16:16), 8/1/2010 (8:52 - 10:35), and 12/21/2010 (8:53 - 10:18)
5-18 Ichetucknee River Water Quality Transect from North Launch Behind Users on the Morning of 7/26/2010 Showing Increased Turbidity Compared to Other Transects
5-19 Ichetucknee River Detailed Human Use Density (in-water users at the time of observation) and Turbidity – Dampier’s Landing 6/27/2010 and 7/6/2010, and North Tube Launch on 7/25/2010
WETLAND SOLUTIONS, INC. 1
1.0 Introduction
1.1 Introduction The Ichetucknee Spring and Spring Run System (Ichetucknee System) is located in North Florida and is a focal point for outdoor recreation in the area (Exhibit 1-1). The first three miles of the Ichetucknee System are located in Ichetucknee Springs State Park (ISSP). This reach includes the head spring as well as eight additional named springs and multiple unnamed springs.
ISSP is a well-known tourist destination and each year attracts approximately 200,000 people for outdoor recreation. These users interact with the Ichetucknee System natural environment through numerous water-contact or water-dependent activities such as tubing, snorkeling, swimming, and canoeing/kayaking. This intensive human use has been the subject of previous research at this state park (DuToit 1979) and has been shown to have the potential to create detrimental impacts to the ecology of the Ichetucknee System.
In spite of limits on human use enacted by the ISSP in 1988 in an attempt to achieve a sustainable human carrying capacity for the Ichetucknee System, human-induced impacts continue to be observed in some areas. Reductions in water clarity apparently due to human activities and possible related biological effects in the spring run ecosystem are an ongoing concern for the management of ISSP. This report provides results from a six-month study intended to document the effects of existing human uses specifically on turbidity (suspended particulate matter) in the Ichetucknee System and to discuss the potential ecological effects resulting from human-induced turbidity.
1.2 Scope of This Study The purpose of this project was to document the direct relationship between human use and turbidity, and subsequent indirect effects of turbidity on water clarity, light transmission, and ecosystem productivity. This study was conducted over approximately six months to provide data spanning a range of seasons that affect human uses and aquatic ecosystem productivity. Turbidity data were collected at multiple stations within the Ichetucknee System between the Head Spring and the US 27 Takeout during periods of low, medium, and high human use activities. Typically, summer is a period of highest human use in the Ichetucknee System when tubers take advantage of the warm weather to float down the river. Summer weekends typically have the highest daily human use. The ISSP operates a shuttle service during the summer (Memorial Day weekend to Labor Day) to accommodate these high user populations. During the remainder of the year, human use is lower and includes a higher percentage of canoe/kayak use. During the non-peak season, users may enter through the access gate at US 27, in addition to the north and south entry stations and the shuttle is not operated.

WETLAND SOLUTIONS, INC. 2
Ichetucknee Springs State Park
EXHIBIT 1-1 Ichetucknee Springs State Park Location Map

WETLAND SOLUTIONS, INC.
3
2.0 Description of the Ichetucknee System
2.1 General Location The Ichetucknee System is located in north central Florida in west Columbia County and east Suwannee County. Ichetucknee Springs is located at the north end of the Ichetucknee River and 16 miles southwest of the City of Lake City. The Ichetucknee River is formed by nine named and several unnamed springs, and flows for approximately 3.0 miles to the south from Ichetucknee Springs to US 27 (Exhibit 2-1). This highway crossing is 8.8 miles east of Branford and 4.7 miles northwest of Fort White. From its crossing with US 27 the Ichetucknee River flows an additional 1.8 miles to its confluence with the Santa Fe River, about 6.7 miles upstream from where the Santa Fe River enters the Suwannee River.
IchetuckneeHead Spring Cedar Head Spring
Blue HoleSpring
MissionSpring
Devil's EyeSpring
Grassy Hole SpringMill PondSpring
Dampiers Landing
Coffee Spring
ICHETUCKNEERIVER
STATE PARK
Hwy 27
Santa Fe River
Iche
tuck
nee
Rive
r
EXHIBIT 2-1 Map of Ichetucknee Springs State Park and the Ichetucknee River to Its Confluence with the Santa Fe River

WETLAND SOLUTIONS, INC.
4
2.2 State-Owned Lands and Designations The ISSP includes approximately 2,250 ac located in Columbia and Suwannee counties and surrounds or borders about 3.3 miles of the Ichetucknee River. All of the key Floridian aquifer springs feeding the Ichetucknee River (Blue Hole, Mission, Devil’s Eye, Grassy Hole, Mill Pond, and Coffee) are located within the boundaries of the ISSP. The recreational and conservation focus of the ISSP is the spring/spring run ecosystem with an area of about 26 ac; however, ISSP also includes approximately 1,230 ac of important, largely undeveloped xeric scrub and mesic forest habitat, 127 ac of forested and herbaceous wetlands, and about 900 acres of mixed upland forest.
2.3 Recreational Use of Ichetucknee Springs State Park The aquatic system located within the ISSP supports a significant traffic of humans each year floating in inflatable rafts (tubing), kayaking, canoeing, wading, and swimming. Annual park visitation since 1983 has averaged 172,048 visitors per year and annual totals have ranged from about 130,000 to 219,447 visitors per year (John Reynolds, personal communication). Exhibit 2-2 shows monthly and annual park use for the period from 1983 to 2010. No motorized boats are allowed on the Ichetucknee River within the ISSP. The segment of the Ichetucknee River downstream of US 27 is lined with single-family residences. Motorboats do enter the lower 1.8 miles of the Ichetucknee River from the Santa Fe River. Fishing and scuba diving are also common forms of recreation practiced in the southern segment of the Ichetucknee River.
1782
26
1744
68
1825
12
1906
25
2023
62
1809
76
1390
57
1303
84
1344
02 1594
53
1671
35
1558
60
1890
25
1708
90 1950
54
1846
07
2194
47
1884
01
1888
45
1737
55
1623
85
1306
31
1676
29
1813
87
1887
76
1619
90 1841
51
1349
12
0
50000
100000
150000
200000
250000
7/1/83 6/30/86 6/30/89 6/30/92 7/1/95 6/30/98 6/30/01 6/30/04 7/1/07 6/30/10
Date
Park
Atte
ndan
ce
MonthlyAnnual
EXHIBIT 2-2 Ichetucknee Springs State Park Monthly and Annual Attendance (July 1983 – November 2010)
The ISSP is open year round, but offers additional services during summer. The summer season begins Memorial Day weekend and runs through Labor Day. The park limits use on the river during summer and winter, based largely on the 1979 research report by Charles DuToit: The Carrying Capacity of the Ichetucknee Springs and River. These limits include a maximum of 750 people per day at the North Entrance of ISSP and approximately 2,250 people at the midpoint launch, with no tubing allowed on the north portion of the river upstream of the North Tube Launch to allow for regrowth of

WETLAND SOLUTIONS, INC.
5
vegetation (FDRP 2010). When the limit at the North Entrance is reached the entrance is closed to tubers and only allows swimmers in the Head Springs at that location. The North Entrance opens at 8:00 A.M. and during peak season weekend days can reach the capacity of 750 within as little as 10 minutes of opening. The midpoint launch is accessed by riding a tram from the South Entrance parking lot at Dampier’s Landing upstream. When the capacity of 2,250 is reached this tram service stops operating. Until recently the only limit on use at Dampier’s Landing is the capacity of the South Entrance parking lot. When the parking lot is full, additional cars are allowed in on a one-in per one-out basis. However, recently cars have begun parking outside of the gate along US 27.

WETLAND SOLUTIONS, INC. 6
3.0 Review of Existing Relevant Studies Pertaining to the Ichetucknee and Similar Spring Systems in Florida
3.1 Introduction This section provides a brief summary of the published information of importance to understanding human use, turbidity, and their effects on the ecosystem in the Ichetucknee System and other similar spring systems. This is not meant to be an exhaustive literature review but rather is intended to provide an overview of the major types of existing springs environmental and human-use information pertinent to this study.
3.2 Ichetucknee Springs State Park Unit Management Plan (FDEP 2000a) The ISSP Unit Management Plan presents a description of the existing natural and cultural resources of the park and recommends management measures and research needs to accomplish management objectives (FDEP 2000a). Outdoor public recreation is the designated single use of the ISSP property. This primary purpose is described as “resource-based outdoor recreation and conservation”. Management for this primary purpose involves achieving a balance between the goals of maintaining and enhancing natural conditions and at the same time providing various recreational opportunities and includes the following four specific goals:
1. Identify, preserve, protect, and restore natural resources.
2. Identify, preserve, protect, and restore cultural resources.
3. Provide safe, appropriate, quality, outdoor recreational opportunities for park visitors.
4. Monitor activities outside the park that may impact parklands and maintain public awareness of park resource management needs.
Timber management (harvesting) is identified as a secondary management purpose for ISSP. Timber harvesting is expected to supplement park visitor entry fees as a means of supporting park management activities.
The ISSP Unit Management plan includes a detailed description of the park’s geology, geography, soils, water quality, spring discharge, natural ecological communities, and cultural resources.

WETLAND SOLUTIONS, INC. 7
3.3 Recreational Use and Economic Impact (Bonn and Bell 2003) Bonn and Bell (2003) conducted an economic evaluation of ISSP as well as three other first magnitude springs included in Florida state parks (Wakulla, Homosassa, and Volusia Blue). From 1992-2002 ISSP, visitation increased from 134,000 visitors/yr to 189,000 visitors/yr. The peak season for public use of ISSP is May through August and is associated with water-contact recreation (skin diving, floating on inner tubes, kayaks, and canoes). Estimated spending by visitors to ISSP was $23 million/yr in 2002 ($34/visitor). Approximately 90% of the visitors to ISSP were from locations outside of Columbia and Suwannee Counties. Of the four springs-based state parks studied for this report, the Ichetucknee Springs Group had the highest estimated economic impact.
3.4 Effects of Nutrients and Light Availability on Submerged Aquatic Macrophytes (Canfield and Hoyer 1988) Canfield and Hoyer (1988) surveyed 17 Florida streams to examine relationships between aquatic macrophyte abundance and nutrient enrichment. Six spring run streams including the Ichetucknee River were included in the survey. Mean aquatic macrophyte standing stock in the Ichetucknee River was reported to be 3,600 g fresh weight/m2 with a range of seasonal values from 2,500 to 4,700 g/m2. Canopy cover averaged 23 percent, depth averaged 1.1 m, and channel width was 24 m, during the study period. Other spring-fed streams had the following macrophyte biomass estimates: Alexander Springs – 4,400 g/m2, Rock Springs – 2,200 g/m2, Wacissa River – 9,700 g/m2, Little Wekiva River – 2,200 g/m2, and Wekiva River – 1,800 g/m2. Macrophyte abundance was significantly negatively correlated with canopy coverage (positively correlated with light availability) and not found to be correlated with nutrient (nitrogen and phosphorus) availability. Substrate type, water depth, and current velocity were also found to affect aquatic macrophyte abundance.
The authors also measured nutrient export rates and macrophyte tissue nutrient levels in the 17 study streams. The Ichetucknee River was estimated to have an annual average nitrogen mass flow of 98,000 to 100,000 kg/yr (assumes mean total nitrogen water column concentration of 0.26 mg/L) while plant tissues had estimated total nitrogen standing stocks of 710 to 830 kg. These calculations indicated that only 0.7 to 0.8% of the annual nitrogen flow in the water column would supply the entire nitrogen standing stock in the plants. Based on these and similar calculations for the 17 Florida streams, the authors concluded that most aquatic macrophytes are dependent upon nutrient uptake through their roots and that further reducing nutrient concentrations in the surface water would not result in a concomitant reduction in macrophyte biomass.
3.5 Submerged Aquatic Plant Community Mapping – 2003 (Kurz et al. 2003) The Ichetucknee System is dominated by the following species of submerged and emergent aquatic vegetation (Kurz et al. 2003):
• Sagittaria kurziana (tapegrass)
WETLAND SOLUTIONS, INC. 8
• Zizania aquatica (wild rice)
• Vallisneria americana (eelgrass)
• Chara sp. (stonewort)
• Myriophyllum heterophyllum (water milfoil)
• Ludwigia repens (water primrose)
• Hydrocotyle sp. (water pennywort)
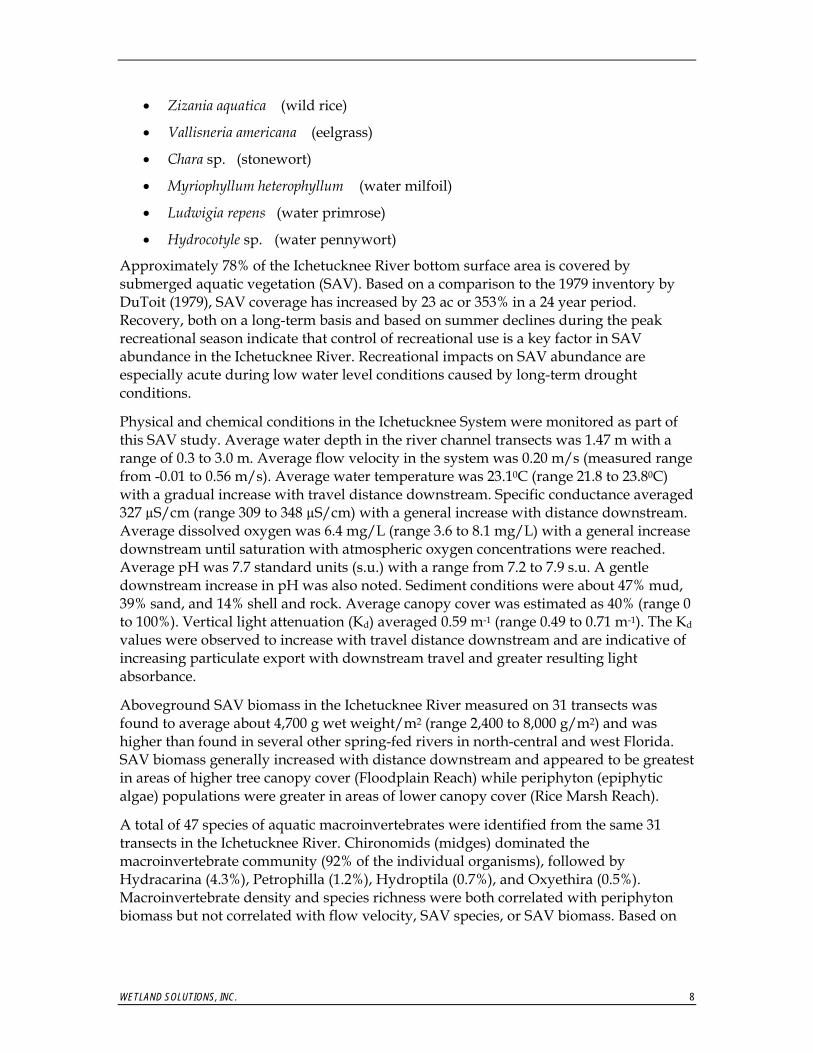
Approximately 78% of the Ichetucknee River bottom surface area is covered by submerged aquatic vegetation (SAV). Based on a comparison to the 1979 inventory by DuToit (1979), SAV coverage has increased by 23 ac or 353% in a 24 year period. Recovery, both on a long-term basis and based on summer declines during the peak recreational season indicate that control of recreational use is a key factor in SAV abundance in the Ichetucknee River. Recreational impacts on SAV abundance are especially acute during low water level conditions caused by long-term drought conditions.
Physical and chemical conditions in the Ichetucknee System were monitored as part of this SAV study. Average water depth in the river channel transects was 1.47 m with a range of 0.3 to 3.0 m. Average flow velocity in the system was 0.20 m/s (measured range from -0.01 to 0.56 m/s). Average water temperature was 23.10C (range 21.8 to 23.80C) with a gradual increase with travel distance downstream. Specific conductance averaged 327 µS/cm (range 309 to 348 µS/cm) with a general increase with distance downstream. Average dissolved oxygen was 6.4 mg/L (range 3.6 to 8.1 mg/L) with a general increase downstream until saturation with atmospheric oxygen concentrations were reached. Average pH was 7.7 standard units (s.u.) with a range from 7.2 to 7.9 s.u. A gentle downstream increase in pH was also noted. Sediment conditions were about 47% mud, 39% sand, and 14% shell and rock. Average canopy cover was estimated as 40% (range 0 to 100%). Vertical light attenuation (Kd) averaged 0.59 m-1 (range 0.49 to 0.71 m-1). The Kd values were observed to increase with travel distance downstream and are indicative of increasing particulate export with downstream travel and greater resulting light absorbance.
Aboveground SAV biomass in the Ichetucknee River measured on 31 transects was found to average about 4,700 g wet weight/m2 (range 2,400 to 8,000 g/m2) and was higher than found in several other spring-fed rivers in north-central and west Florida. SAV biomass generally increased with distance downstream and appeared to be greatest in areas of higher tree canopy cover (Floodplain Reach) while periphyton (epiphytic algae) populations were greater in areas of lower canopy cover (Rice Marsh Reach).
A total of 47 species of aquatic macroinvertebrates were identified from the same 31 transects in the Ichetucknee River. Chironomids (midges) dominated the macroinvertebrate community (92% of the individual organisms), followed by Hydracarina (4.3%), Petrophilla (1.2%), Hydroptila (0.7%), and Oxyethira (0.5%). Macroinvertebrate density and species richness were both correlated with periphyton biomass but not correlated with flow velocity, SAV species, or SAV biomass. Based on

WETLAND SOLUTIONS, INC. 9
the diversity and abundance of macroinvertebrates found on SAV, the Ichetucknee River is classified as “healthy” compared to other Florida streams and rivers.
3.6 Submerged Aquatic Plant Community Mapping – 2004 (Kurz et al. 2004) Kurz et al. (2004) conducted a re-study of SAV and water quality in the Ichetucknee River in 2004. Portions of the river subject to recreational use were re-mapped and data were compared to SAV cover estimates from the previous year. Total estimated SAV cover was not measurably different between the two years (2% decline overall). Mean wet weight biomass during the 2004 sampling was 4,560 g/m2. Spatial mapping of the river indicated that most of the river is less than 2 m in depth with about 50% (75,000 m2) less than 1 m deep. Less than 5% (5,000 m2) is over 2 m in depth. Flow velocity was found to be greatest in deeper river segments. Correlations between nutrient concentrations and SAV cover, biomass, and epiphyton density showed no significant relationships. Water quality characteristics of individual springs were found to be variable, both over time at a single spring and between different springs. Ichetucknee Main Spring had the highest recorded nitrate nitrogen concentration on the date of sampling (780 µg/L), had the lowest total phosphorus reading (24 µg/L), and the highest dissolved oxygen concentration (4.2 mg/L) compared to the other five springs that were sampled. Nitrate nitrogen concentrations declined in a consistent pattern with distance downstream in the Ichetucknee River with an upstream concentration of 763 µg/L and a downstream concentration of 463 µg/L. Total phosphorus concentrations increased with distance downstream from 23 µg/L near the Main Spring to 53 µg/L downstream.
3.7 Florida Bioassessments and Ecosummaries (FDEP) The Florida Department of Environmental Protection (FDEP) has been conducting investigations of macroinvertebrate populations (bioassessments) and multiple chemical and biological measures (ecosummaries) in the Ichetucknee River since 1975 (FDEP 1997, 2000b, 2001a, 2001b, 2002a, 2002b, 2002c, 2003a, 2003b, 2003c, 2003d, 2004a, 2004b, 2004c, 2004d, and 2005a). The 1997 report summarized past information available just upstream of the US 27 bridge for the 22 year period-of-record. FDEP found that macroinvertebrate communities in the Ichetucknee River indicate healthy conditions compared to eleven “undisturbed” Florida spring fed streams. They also concluded that overall stream health had improved during the POR since 1975, possibly due to improved management of the resource through control of recreational use. Subsequent ecosummaries from 2000 through 2005 provided slightly different results based on a combination of chemical parameters and populations of bacteria, periphyton, and macroinvertebrates. The main conclusions over this most recent five-year sampling period were that:
• Chemical data indicate that the Ichetucknee River has elevated nitrate nitrogen levels, higher than about 70-90% of Florida streams and that other pollutants are not elevated compared to other streams
• Populations of bacteria indicating fecal contamination (Enterococci, Escherichia coli, and fecal coliforms) are variable but sometimes high

WETLAND SOLUTIONS, INC. 10
• Periphyton parameters indicate eutrophic (high nutrient) conditions
• Macroinvertebrate data tend to be variable with Stream Condition Index (SCI) scores ranging from Excellent to Poor
The consistent conclusion of FDEP’s quarterly assessments is that the elevated nitrate nitrogen concentrations are of concern in the Ichetucknee River.
3.8 Carrying Capacity of the Ichetucknee Springs and River (DuToit 1979) DuToit (1979) conducted a field study in 1977-78 of the types and amounts of recreational use that could be sustained in the Ichetucknee River without causing irreversible harm. Specific recreational activities that were evaluated were swimming, canoeing, scuba diving, and tubing. Tubing was found to be the dominant form of human use of the resource with up to 3,000 people per day during the summer weekends and approximately 1,000 people on weekdays. Shallow and narrow stream reaches, primarily in the upstream area, received the greatest impacts from this form of recreation. This was due largely to the interaction of users in this area which included wading in the shallows and trampling of plants. As users move downstream they tended to become more passive, which was attributed to the cold water. This use had a limit of 100 tubers per hour recommended to prevent further deterioration.
Scuba diving was found to have the greatest impact around specific springs such as Blue Hole. Scuba diving occurred primarily during winter and had a significant effect when too many divers were in the boil. In this condition divers wait on the fringes and stirred up sediments and uprooted vegetation. This damage was found to far exceed the growth rates of new plants as measured in excluded areas. A limit of 12 divers per hour was recommended to minimize this damage and allow gradual recovery.
Canoeing was found to have little impact to plant and animal communities in the river. Swimming was also found to have a minimal effect because of the low number of participants and location of the activity in Blue Hole and the Head Spring. Although these types of activities did not have recommended limits, it was suggested that certain springs (Head Spring and Blue Hole) should be designated as swim areas while other areas should be protected.
Significant analysis was done of re-growth rates of plants and mapping of plant communities. This included excluding areas from recreation to examine the re-growth in protected areas. These analyses found that amounts of damage in recreational areas were typically in excess of what could re-grow in a reasonable period of time.
Dutoit’s research and recommendations led to a number of substantial changes to management of the ISSP. Tubing and diving activities were restricted in some areas to allow re-colonization and maintenance of healthy growths of aquatic macrophytes and the fauna they support. Several of the springs were closed to all uses to allow macrophyte re-growth. This included fencing in some cases and signage in others. This study was also used in the iterative process of developing the current maximum human carrying capacity allowed in different stream segments.

WETLAND SOLUTIONS, INC. 11
3.9 Ichetucknee Springs and River Environmental Health – 2008 Report Card (WSI 2008) This study evaluated ecological health of the Ichetucknee Springs and River based on six criteria: spring discharge, water clarity, nitrate, allergic reactions, submerged aquatic vegetation, and algae cover. The spring was graded on these criteria based on historic data, or data from similar systems. Water clarity was found to be good, a B+, when compared to similar springs. It was noted during this study that the quantity of submerged aquatic vegetation had continuously increased over a 20-year period-of-record, but that SAV species diversity had been reduced. The spring received a D grade for nitrate levels and attached algae.
3.10 An Ecosystem-Level Study of Florida’s Springs (WSI 2010) This study evaluated 12 Florida Springs within four of Florida’s water management districts. This study found that while specific springs are temporally consistent, there is considerable variability between different springs in terms of their biology, water quality, flora/fauna, and ecological functions. Water quality was evaluated in each spring including dissolved oxygen, specific conductance, pH, nitrate, and phosphorus. Physical parameters sampled included discharge, spring volume, horizontal Secchi, and light attenuation. Plant cover, fish populations, and whole ecosystem productivity and respiration were also evaluated and compared between springs.
The Ichetucknee System was monitored in July 2009 for this study. The upper 5,100 m (3.2 miles) of the Ichetucknee River was studied with an estimated surface area of 17.1 ha (42 ac) and an average depth of 0.93 m (3.05 ft). Nitrate nitrogen decreased from about 1 mg/L at the Head Spring to 0.36 mg/L at the US 27 take-out station. Chlorophyll a concentrations increased from 1.3 ug/L at the Head Spring to 2.1 ug/L at the US 27 station. Turbidity increased with distance downstream, from 0.22 NTU at the Head Spring to 0.84 NTU at the US 27 station. In terms of water clarity, the maximum horizontal Secchi measurement recorded for Ichetucknee was 32 meters.
Light attenuation measurements showed approximately 87% transmittance at one meter depth in the Head Spring, declining to 69% at Dampier’s Landing and 44% at the US 27 station. The net export of particulate matter at the US 27 station averaged 7.3 g/m2/d and 32% of this matter was organic (lost on ignition). Canopy shading over the Ichetucknee Spring run was estimated as 65% and SAV percent area coverage was estimated as 78% in the run and 66% in the Head Spring. Overall plant diversity (SAV and emergent plants) was relatively high at Ichetucknee compared to the other springs studied, with 44 species observed. Insect emergence rates from the Ichetucknee Run averaged 72 individuals per m2 per day. A total of 28 fish species were observed on repeat counts for an average live weight biomass of 90 kg/ha. During this study period in July, the highest human use activity was tubing in the run. The gross primary productivity estimated in the spring run averaged 8.3 g O2/m2/d and community respiration averaged 15.7 g O2/m2/d for a slightly negative net primary production during this study period. The estimated photosynthetic efficiency for the Ichetucknee Run was low compared to other spring runs at about 2.3% of the useable incoming light.

.
WETLAND SOLUTIONS, INC. 12
4.0 Ichetucknee River Study Methods
4.1 Introduction Data were collected in the Ichetucknee System to allow for characterization of human uses and turbidity. Data collection also included water quality field parameters, Secchi measurements (water clarity), and light transmission. Sampling for water quality, turbidity, water clarity, and light transmission was conducted during three sampling periods in the last half of 2010: the summer study period (Memorial Day through Labor Day), medium use period (September through October), and low-use period (November and December).
The methods used and data collected are discussed in more detail below.
4.2 Human Use Human use is an important component of this study and accurate estimates of usage are necessary for understanding the effects of recreation on the Ichetucknee System. The park monitors daily summer attendance. No camping is allowed at the park so nighttime usage is zero. During the off-season a self-service station is used for entry and specific daily counts of individuals are not made.
Detailed human use counts were made on three occasions during the summer study period at the park, two at Dampier’s Landing and one at the North Launch and the Head Spring. Counts categorized human uses based on in-water and out-of-water activities and further by type of use (tubing, snorkeling, canoeing, etc.). Additionally total counts were made for entries, exits, and pass-bys by type where applicable.
Primary in-water contact activities were categorized as: wading (less than waist deep), bathing (greater than waist deep and less than neck deep), swimming, snorkeling, tubing, and canoeing/kayaking. Primary out-of-water activities included: on-ground and on-dock. For each of these activity categories, the counts of all persons within the observation area were made at about 15 minute intervals. Individual counts were multiplied by 0.25 hours (15 minutes) to estimate the average person-hours throughout the period of observation.
Human use densities during the medium to low-use periods were only characterized by park entry data.
4.3 Water Quality Sampling 4.3.1 Data Sonde Installations A YSI 6920 recording data sonde was deployed at four stations in the Ichetucknee System to collect continuous measurements of temperature, dissolved oxygen, pH, specific conductance, and turbidity. These data were automatically collected at pre-programmed intervals of 10-30 minutes. Length of deployment varied based on sampling frequency, but was generally 7-14 days per deployment.

.
WETLAND SOLUTIONS, INC. 13
Sonde sampling was made at several discrete locations to evaluate spatial changes in water quality and specifically turbidity. Sampling locations were chosen to assess the effects of a typical range of human use activities and intensities on turbidity. Sampling locations are shown in Exhibit 4-1. Additional considerations included sampling access and sonde security.
The first sonde station was in the spring run upstream of the North Tube Launch, and below the Head Spring. This location provides the background water quality for the spring run during nighttime hours and samples the effects of daytime human uses in the Head Spring swim area on water quality. Since photosynthetic activity of the plants and algae contribute pseudo-plankton to the water, this station also provides a baseline above most of the productive portion of the Ichetucknee System.
The second station was located approximately 200 meters downstream of the North Launch and is upstream of the confluence with the outlet from Cedar Head Springs and Blue Hole. At this station the sonde was attached to a submerged log and was immediately upstream of a section that concentrates tubers through a narrowed cross-section. This station was used to characterize the quality of water in the northern portion of the spring run that experiences limited use (maximum of 750 persons per day), but is shallower allowing for more direct human interaction with the plants and sediments.
The third station and sonde installation was at the dock at Dampier’s Landing, and provided data representative of recreational uses in the Ichetucknee System from the Midpoint Launch to Dampier’s Landing.
The final station was located at the takeout dock at US 27. This location is near the downstream boundary of ISSP and provides data to understand cumulative effects from all upstream human uses in ISSP.

.
WETLAND SOLUTIONS, INC. 14
IchetuckneeHead Spring
Hwy 27
ICHETUCKNEESPRINGS
STATE PARK
Dampiers Landing
US27 Takeout
U/S of North Launch200m D/S of North Launch
Midpoint Launch
Sonde StationsOther Locations of Interest
EXHIBIT 4-1 Sonde Deployment Locations in Ichetucknee Springs State Park
Field trips were made on multiple occasions to deploy, redeploy, and retrieve the data sondes (Exhibit 4-2).
.
WETLAND SOLUTIONS, INC. 15
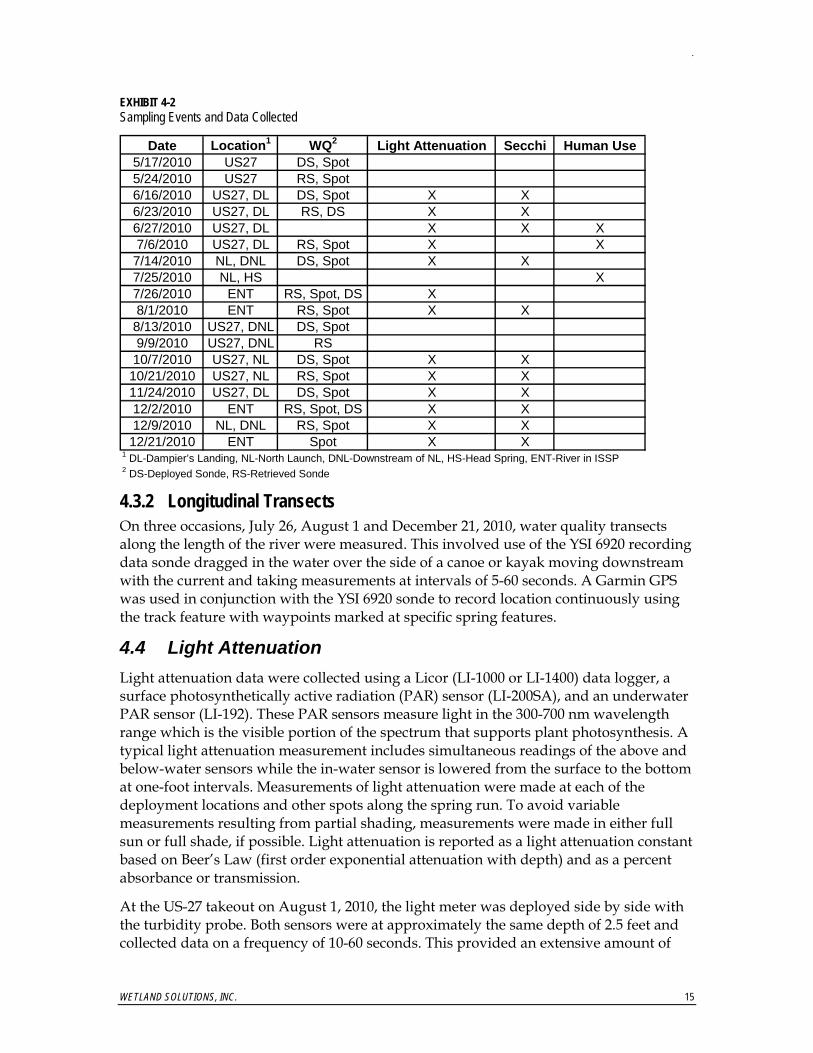
EXHIBIT 4-2 Sampling Events and Data Collected
Date Location1 WQ2 Light Attenuation Secchi Human Use5/17/2010 US27 DS, Spot5/24/2010 US27 RS, Spot6/16/2010 US27, DL DS, Spot X X6/23/2010 US27, DL RS, DS X X6/27/2010 US27, DL X X X7/6/2010 US27, DL RS, Spot X X7/14/2010 NL, DNL DS, Spot X X7/25/2010 NL, HS X7/26/2010 ENT RS, Spot, DS X8/1/2010 ENT RS, Spot X X8/13/2010 US27, DNL DS, Spot9/9/2010 US27, DNL RS10/7/2010 US27, NL DS, Spot X X10/21/2010 US27, NL RS, Spot X X11/24/2010 US27, DL DS, Spot X X12/2/2010 ENT RS, Spot, DS X X12/9/2010 NL, DNL RS, Spot X X12/21/2010 ENT Spot X X
1 DL-Dampier’s Landing, NL-North Launch, DNL-Downstream of NL, HS-Head Spring, ENT-River in ISSP2 DS-Deployed Sonde, RS-Retrieved Sonde
4.3.2 Longitudinal Transects On three occasions, July 26, August 1 and December 21, 2010, water quality transects along the length of the river were measured. This involved use of the YSI 6920 recording data sonde dragged in the water over the side of a canoe or kayak moving downstream with the current and taking measurements at intervals of 5-60 seconds. A Garmin GPS was used in conjunction with the YSI 6920 sonde to record location continuously using the track feature with waypoints marked at specific spring features.
4.4 Light Attenuation Light attenuation data were collected using a Licor (LI-1000 or LI-1400) data logger, a surface photosynthetically active radiation (PAR) sensor (LI-200SA), and an underwater PAR sensor (LI-192). These PAR sensors measure light in the 300-700 nm wavelength range which is the visible portion of the spectrum that supports plant photosynthesis. A typical light attenuation measurement includes simultaneous readings of the above and below-water sensors while the in-water sensor is lowered from the surface to the bottom at one-foot intervals. Measurements of light attenuation were made at each of the deployment locations and other spots along the spring run. To avoid variable measurements resulting from partial shading, measurements were made in either full sun or full shade, if possible. Light attenuation is reported as a light attenuation constant based on Beer’s Law (first order exponential attenuation with depth) and as a percent absorbance or transmission.
At the US-27 takeout on August 1, 2010, the light meter was deployed side by side with the turbidity probe. Both sensors were at approximately the same depth of 2.5 feet and collected data on a frequency of 10-60 seconds. This provided an extensive amount of

.
WETLAND SOLUTIONS, INC. 16
data for comparison of the light attenuation (K) coefficient and turbidity. To evaluate this relationship at higher turbidity values, artificial high turbidity events were caused by a diver who purposefully stirred up loose sediments and algae upstream of the sensor location. These events created turbidity spikes that were used to evaluate light attenuation at higher turbidities.
Horizontal Secchi disk measurements provide a quantitative estimate of water clarity. Typical Secchi measurements involve lowering the disk from a boat, but due to the relatively high water clarity in the Ichetucknee System, depth is rarely sufficient to evaluate the Secchi depth and instead a horizontal Secchi distance is measured. For this measurement a disk is stretched on a tape horizontally until it disappears. The viewer notes the distance and then swims back toward the disk until it reappears. The average of these measurements is the horizontal Secchi distance.
WETLAND SOLUTIONS, INC. 17
5.0 Results and Discussion
5.1 Introduction This report focuses on the entire data collection period at ISSP. The data collection occurred during portions of approximately 8 months, between May and December of 2010.
Summer is expected to be the period of highest human use and plant primary productivity in the spring as a result of the higher incoming solar radiation. Both higher human use and plant productivity are expected to be positively correlated with increased turbidity in the stream with distance downstream from the spring boils. Since existing nutrient conditions in the ISSP are elevated well above normal, elevated primary productivity and increased plant-derived turbidity cannot be strictly considered to be “normal” or “natural” turbidity since nutrient increases are often correlated with increased algal and plant primary productivity (WSI 2008). The purpose of this investigation was to assess all sources of increased turbidity in the springs and spring run, but the major focus was on the effects of the relatively short-term human recreation impacts. This section presents the results from the entire sampling period to characterize turbidity in the ISSP system during days of higher (summer weekends), moderate (summer weekdays, off-season weekends), and lower (off-season weekdays) recreational use.
5.2 Human Use Daily human use counts were provided for ISSP based on entrance fees (John Reynolds, personal communication). The North Entrance limits entry to 750 people per day for tubing. This capacity is typically met on weekends during the summer season before noon, and sometimes as quickly as 10 minutes after opening. Entry at the south entrance is not limited by number, but during some periods has been limited by parking. Currently, users are allowed to park along the entrance road and outside of the entrance along US 27. Total entry during summer was as high as 6,707 people in a single day on May 30, 2010, and as low as 141 on September 1, 2010, during the summer. Weekend use for the 3-day Memorial Day weekend was 16,362 people. Average summer use was 1,801 people per day with a majority of use occurring on weekends.
Uses of the park during the off-season are different than during summer because of the lack of a tram service and the change in weather patterns. During the off-season dominant uses are tubing, canoeing/kayaking, and SCUBA diving. Tubing in the off-season is only allowed between the Midpoint Launch and US27 to allow re-growth of vegetation along the upstream reach, and SCUBA diving is allowed in Blue Hole Spring (FDRP 2010). Also during the off-season tubers must walk back along the path to return to theirs cars. Off-season use during the study (May 1-May 28 and September 7-November 30) varied between 0 and 1,392 people per day with an average of 212. It is observed that as the weather gets colder fewer people enter the park and as temperatures warm more people enter the park. Exhibit 5-1 shows the daily park

WETLAND SOLUTIONS, INC. 18
attendance for the period starting May 1, 2010. For every season of the year, weekend use is typically the highest during the week.
0
1,000
2,000
3,000
4,000
5,000
6,000
7,000
8,000
5/1/2010 5/31/2010 6/30/2010 7/30/2010 8/29/2010 9/28/2010 10/28/2010 11/27/2010
Date
Daily
Par
k At
tend
ance
EXHIBIT 5-1 Ichetucknee Springs State Park Daily Attendance for May 1, 2010 – November 30, 2010
Detailed human use counts were made at Dampier’s Landing on June 27 (Sunday) and July 6 (Tuesday) and at the North Tube Launch on July 25, 2010 (Sunday) during the summer season. Detailed human use data are summarized in Exhibits 5-2 through 5-4 for the three detailed human use counts. The primary water contact use on the river during summer was tubing with approximately 80-93% of the users in tubes. At the North Launch the second most common use was swimming. At Dampier’s Landing the second most common use was wading followed by swimming, snorkeling, and finally canoeing and kayaking. There were also a small number of people who remained on shore at both sites with no water contact.
WETLAND SOLUTIONS, INC. 19
0
20
40
60
80
100
120
140
8:37 8:45 9:00 9:15 9:30 9:45 10:00 10:15 10:30 10:45 11:00 11:15 11:30 11:45 12:02 12:17 12:33
Num
ber o
f Peo
ple
In Water Activity Out of Water Activity
In the Water Counts
0
20
40
60
80
100
8:37
9:00
9:30
10:00
10:30
11:00
11:30
12:02
12:33
Num
ber o
f Peo
ple
Wading Bathing/Swimming Snorkeling Canoeing/Kayaking Tubing
Out of the Water Counts
0
10
20
30
40
50
8:37
9:00
9:30
10:00
10:30
11:00
11:30
12:02
12:33
Num
ber o
f Peo
ple
On Dock On Ground
EXHIBIT 5-2 Ichetucknee River Dampier's Landing Human Use – 6/27/2010 (Sunday)
Exhibit 5-2 illustrates the human use data for June 27, 2010 (Sunday) at Dampier’s Landing. During this count, human uses were dominated by in-water activities, and primarily tubing (80%). The number of users increased through the morning with the highest count at about 12:00 noon. This increase in use is likely correlated to higher temperatures and the amount of time it takes for users from the North Entrance to reach Dampier’s Landing. In addition to the detailed 15-minute counts, total users entering, exiting, and passing by were recorded. During the count between 8:37-12:37, observations included 848 tubers, 35 swimmers, 3 kayaks, and 2 motorboats. Motorboats are not allowed in this area of the river, but the park maintains a boat at this site for emergencies.

WETLAND SOLUTIONS, INC. 20
0
10
20
30
40
50
60
70
8:35 8:45 9:00 9:15 9:30 9:45 10:00 10:15 10:30 10:45 11:00 11:15 11:30 11:45 12:00 12:15 12:30 12:45 13:00 13:15
Num
ber o
f Peo
ple
In Water Activity Out of Water Activity
In the Water Counts
0102030405060
8:35
9:00
9:30
10:00
10:30
11:00
11:30
12:00
12:30
13:00
Num
ber o
f Peo
ple
Wading Bathing/Swimming Snorkeling Canoeing/Kayaking Tubing
Out of the Water Counts
0
5
10
15
20
25
8:35
9:00
9:30
10:00
10:30
11:00
11:30
12:00
12:30
13:00
Num
ber o
f Peo
ple
On Dock On Ground
EXHIBIT 5-3 Ichetucknee River Dampier's Landing Human Use – 7/6/2010 (Tuesday)
Exhibit 5-3 illustrates the human use data from July 6, 2010 (Tuesday) at Dampier’s Landing. During this count, human uses were dominated by in-water activities, and primarily tubing (88%). Similar to the previous count in June, peak user numbers were counted at approximately 12:00 noon at Dampier’s Landing. In addition to the detailed 15-minute counts total users entering, exiting, and passing by were recorded. During the count between 8:35-13:15, total counts included 460 tubers, 48 swimmers, and 6 kayaks.
0
10
20
30
40
50
60
70
8:18
8:32
8:45
8:55
9:06
9:18
9:32
9:47
10:02
10:17
10:29
10:44
10:58
11:18
11:37
11:49
12:11
12:20
12:30
Num
ber o
f Peo
ple
In Water Activity Out of Water Activity
In the Water Counts
05
1015202530
8:18
8:38
8:55
9:13
9:32
9:57
10:17
10:33
10:58
11:30
11:49
12:17
12:30
Num
ber o
f Peo
ple
Wading Bathing/Swimming Snorkeling Canoeing/Kayaking Tubing
Out of the Water Counts
05
10152025303540
8:18
8:38
8:55
9:13
9:32
9:57
10:17
10:33
10:58
11:30
11:49
12:17
12:30
Num
ber o
f Peo
ple
On Dock On Ground
WETLAND SOLUTIONS, INC. 21
EXHIBIT 5-4 Ichetucknee River North Launch Human Use – 7/25/2010 (Sunday)
Exhibit 5-4 illustrates the human use data for July 25, 2010 (Sunday) at the North Launch observation site. During this count human uses were dominated by in-water activities, and primarily tubing (93%). Peak entry at the North Launch was observed between approximately 9:00 and 10:30. This timing for a majority of tubers corresponds to the peaks recorded downstream at Dampier’s Landing around 12:00 noon. In addition to the detailed 15-minute counts, total users entering at the North Launch were recorded. During the count between 8:20-12:26 on July 25, 2010, total counts included 628 tubers, 19 swimmers, and 3 kayaks.
5.3 Light Attenuation Light attenuation measurements were made during most field trips. These measurements were made to develop a correlation between light availability and turbidity. The proportion and amount of light that is attenuated in the water column has an impact on the photosynthesis of submerged vegetation. Attenuation measurements were made at each of the sonde deployment locations and at points along the river during the first longitudinal transect. Values of the light transmittance estimated at 1 meter water depth varied widely, between 21 and 96 percent with a median of 68 percent for the 103 measurements taken over the length of the river in the state park. Exhibit 5-5 shows the probability distribution function of light transmittance for the sampling locations.
0
10
20
30
40
50
60
70
80
90
100
0 10 20 30 40 50 60 70 80 90 100Percent Rank
Perc
ent T
rans
mitt
ance
ICH-NL
ICH-DNL
ICH-DL
ICH-27
All NL DNL DL US27 OtherCount 103 13 10 39 18 23Minimum 21% 29% 24% 21% 29% 34%Maximum 96% 96% 90% 84% 80% 93%Average 64% 74% 62% 66% 65% 56%Median 68% 76% 63% 68% 70% 49%
Light Transmittance @ 1 Meter
EXHIBIT 5-5 Probability Distribution of Percent Transmittance at One Meter Depth at Sampling Locations

WETLAND SOLUTIONS, INC. 22
Attenuation measurements showed a decrease in maximum transmittance when moving downstream in the river. All stations had some low transmittance values recorded in the range of 20 to 30%. At each of the stations low transmittance values were the exception with very few or only a single value. The station downstream of the North Launch showed lower than expected transmittance values possibly related to turbulent flow in the vicinity of several downed trees. The effects of turbulence and high flows were observed at several of the stations. In these locations ripples in the water surface caused shadows that affected light measurements at one or more depths.
The light attenuation and turbidity time series measurements taken at the US27 takeout point on August 1, 2010 are shown in Exhibit 5-6. The peak turbidity values on this exhibit occurred due to artificial turbidity events created to provide a broader calibration range for the correlation between turbidity and light attenuation. Several of these events had turbidity values of more than 6 NTU, or approximately 3 to 8 times background concentrations. The correlation between turbidity and light transmittance was evaluated and is shown in Exhibit 5-7. Based on this correlation an inverse relationship exists between light transmittance and turbidity.
0
10
20
30
40
50
60
70
11:31 11:45 12:00 12:14 12:28 12:43 12:57 13:12 13:26 13:40
Time
Perc
ent T
rans
mitt
ance
@ 1
Met
er
0
2
4
6
8
10
12
14
16
Turb
idity
(NTU
)
EXHIBIT 5-6 Turbidity and Light Attenuation Time Series at US27 on August 1, 2010

WETLAND SOLUTIONS, INC. 23
y = -2.778x + 47.943R2 = 0.3843
0
10
20
30
40
50
60
0 1 2 3 4 5 6 7 8
50 Second Rolling Average Turbidity (NTU)
50 S
econ
d R
ollin
g A
vera
ge o
f Per
cent
Tra
nsm
ittan
ce a
t 1 M
eter
EXHIBIT 5-7 Turbidity versus Light Transmittance at US27 on August 1, 2010
5.4 Horizontal Secchi Distance Secchi distance was estimated during several field events and is shown in Exhibit 5-8. Anecdotally, it was noted that as the number of users increased, Secchi distance decreased. The maximum observed Secchi was in the vicinity of the North Launch and was 49.4 m. At the North Launch measurement of a longer maximum Secchi length was restricted because of limited straight channel length available for observation. Therefore, a straight section immediately downstream of the North Launch was used for later Secchi measurements. The lowest Secchi distance recorded was 7.8 m at the US 27 takeout. The average at Dampier’s Landing was 13.9 m and the average at US 27 was 12.3 m. Based on the Secchi measurements it appears that a significant decline occurs between the Head Spring and Dampier’s Landing and that values from Dampier’s Landing to US 27 are relatively constant. This finding is similar to the observations noted above for light transmittance at these stations with the exception of the Downstream of North Launch station which had a higher Secchi distance but a lower light transmittance than the two stations further downstream.

WETLAND SOLUTIONS, INC. 24
0
10
20
30
40
50
60
Station
Secc
hi D
ista
nce
(m)
Peak Season
Off-Season
NL DNL DL US27
EXHIBIT 5-8 Horizontal Secchi Measurements by Location
5.5 Turbidity Turbidity and water quality measurements were taken continuously for one to two week periods at each of the four stations. These data provide information concerning the diurnal and day-to-day patterns of water quality in the river. Turbidity values in the river ranged between 0 and approximately 20 NTU. Exhibits 5-9 – 5-12 show the data for turbidity at each station by weekday and weekend for the peak season. These data show a diurnal pattern in turbidity at all stations. At the station downstream of the North Launch during the deployment from July 14, 2010 to August 1, 2010, extreme values of turbidity (both daytime and nighttime) were reported during a significant portion of the deployment. Similar high results were recorded at the downstream of North Launch station during a second deployment from August 13, 2010 to September 9, 2010. These data were deemed questionable, probably due to an instrument malfunction or bioturbation by small fish, and not representative of water conditions; and were not included in the graphs for these stations.

WETLAND SOLUTIONS, INC. 25
0
1
2
3
4
5
6
0:00 2:24 4:48 7:12 9:36 12:00 14:24 16:48 19:12 21:36 0:00Time
Turb
idity
(NTU
)Weekday
Weekend
Average ± 1 Std Dev
EXHIBIT 5-9 Turbidity Upstream of the North Launch from July 14, 2010 to August 1, 2010 by Weekday and Weekend Day
0
0.5
1
1.5
2
2.5
3
3.5
4
4.5
0:00 2:24 4:48 7:12 9:36 12:00 14:24 16:48 19:12 21:36 0:00Time
Turb
idity
(NTU
)
Weekday
Weekend
Average ± 1 Std Dev
EXHIBIT 5-10 Turbidity Downstream of the North Launch from July 14, 2010 to July 17, 2010 by Weekday and Weekend Day

WETLAND SOLUTIONS, INC. 26
0
0.5
1
1.5
2
2.5
3
3.5
4
4.5
5
0:00 2:24 4:48 7:12 9:36 12:00 14:24 16:48 19:12 21:36 0:00Time
Turb
idity
(NTU
)Weekday
Weekend
Average ± 1 Std Dev
EXHIBIT 5-11 Turbidity at Dampier's Landing from June 16, 2010 to July 6, 2010 by Weekday and Weekend Day
0
0.5
1
1.5
2
2.5
3
3.5
4
4.5
0:00 2:24 4:48 7:12 9:36 12:00 14:24 16:48 19:12 21:36 0:00
Time
Turb
idity
(NTU
)
Weekday
Weekend
Average ± 1 Std Dev
EXHIBIT 5-12 Turbidity at US 27 from June 16, 2010 to July 6, 2010 and August 13, 2010 to September 9, 2010 by Weekday and Weekend Day
These data show that turbidity generally increases downstream even during periods when users are not present. This is likely related to export from the surrounding forest, primary productivity, and suspension of fine grained sediments. Daily variation occurs

WETLAND SOLUTIONS, INC. 27
at all of the stations due to human use and primary productivity/export from the system. This contributes approximately 0.2-2 NTU on average of additional turbidity at the measured stations. At the sonde upstream of the North Launch it is expected that the effect of primary productivity is reduced because of the short upstream length to the Head Spring. This station had approximately 2 NTU of additional turbidity during weekends and 0.2 NTU during weekdays. Turbidity values at this location show increases in turbidity related to human use in the Head Spring during weekend days.
Off-season turbidity measurements were made after the close of tram services following Labor Day. These measurements were made at the same stations for approximately one to two week deployments. At the North Launch station during the deployment from October 7, 2010 to October 21, 2010, as at the station downstream of the North Launch during the peak season the sonde experienced fouling or malfunctioned and most data were not used. Positions of sondes were adjusted at the North Launch and downstream of the North Launch because of the problems with the data sets. Exhibits 5-13 – 5-16 show the data at each station by weekday and weekend. During the off-season, minimal differences were observed between the weekday and weekend use. As during the peak season deployments a diurnal change in turbidity was observed at Dampier’s Landing and US 27. A single value of 19.4 NTU was recorded upstream of the North Launch station; this was not eliminated as there appeared to be a “real” disturbance during this period, possibly related to material catching on the sensors or bioturbation by an animal or human.
0
1
2
3
4
5
6
7
8
9
10
0:00 2:24 4:48 7:12 9:36 12:00 14:24 16:48 19:12 21:36 0:00Time
Turb
idity
(NTU
)
Weekday
Weekend
Average ± 1 Std Dev
EXHIBIT 5-13 Turbidity Upstream of the North Launch from October 7, 2010 to October 12, 2010 and December 2, 2010 – December 9, 2010 by Weekday and Weekend Day

WETLAND SOLUTIONS, INC. 28
0
0.2
0.4
0.6
0.8
1
1.2
1.4
1.6
1.8
0:00 2:24 4:48 7:12 9:36 12:00 14:24 16:48 19:12 21:36 0:00Time
Turb
idity
(NTU
)Weekday
Weekend
Average ± 1 Std Dev
EXHIBIT 5-14 Turbidity Downstream of the North Launch from December 2, 2010 to December 9, 2010 by Weekday and Weekend Day
0
0.5
1
1.5
2
2.5
3
0:00 2:24 4:48 7:12 9:36 12:00 14:24 16:48 19:12 21:36 0:00Time
Turb
idity
(NTU
)
Weekday
Weekend
Average ± 1 Std Dev
EXHIBIT 5-15 Turbidity at Dampier's Landing from November 24, 2010 to December 2, 2010 by Weekday and Weekend Day

WETLAND SOLUTIONS, INC. 29
0
0.5
1
1.5
2
2.5
0:00 2:24 4:48 7:12 9:36 12:00 14:24 16:48 19:12 21:36 0:00
Time
Turb
idity
(NTU
)Weekday
WeekendAverage ± 1 Std Dev
EXHIBIT 5-16 Turbidity at US 27 from October 7, 2010 to October 21, 2010 and November 24, 2010 to December 2, 2010 by Weekday and Weekend Day
The effect of exported material on turbidity at the North Launch and downstream of North Launch stations appears to be minimal. At both Dampier’s Landing and US 27 there is a diurnal trend that adds approximately 0.2 to 0.3 NTU. This increase in turbidity during the daylight hours is likely related to primary productivity and export of algal cells, as recreational pressures were significantly lower during these sonde deployments.
In addition to water quality at the four stations, on three days water quality measurements were taken along the length of the river in the ISSP. Turbidity values are shown for all three profiles in Exhibit 5-17. For turbidity the morning transect on July 26, 2010 showed a value of approximately 0.2 NTU at the upstream end which increased downstream to approximately 1.2 NTU in the vicinity of the midpoint entrance and 0.8 NTU at the US27 takeout. This morning event also captured localized turbidity created by a group of approximately eight people in tubes and swimming in the northern section of the river for a short distance downstream (until they were passed). This turbidity event is shown in Exhibit 5-18 compared to the other turbidity values through this reach. In the afternoon, values at the upstream end were approximately 0.2 NTU and increased downstream to approximately 1.5 NTU at the US27 takeout. The third profile on the morning of August 1, 2010 had values of turbidity at the upstream end of approximately 0.1 NTU which increased downstream to approximately 0.9 NTU at the US27 takeout. The final turbidity transect was measured on December 21, 2010. This transect had values of approximately 0.1 NTU to 0.5 NTU along this length of the river.

WETLAND SOLUTIONS, INC. 30
Final TakeoutDampier's LandingMidpoint DockMill PondDev il's Ey eMissionBlue HoleNorth Launch
0.0
0.5
1.0
1.5
2.0
2.5
0.00 0.50 1.00 1.50 2.00 2.50 3.00 3.50 4.00 4.50 5.00 5.50Linear Distance (km)
Turb
idity
(NTU
)
7/26/10 AM 7/26/10 PM 8/1/10 AM 12/21/10 AM
EXHIBIT 5-17 Ichetucknee River Water Quality Transect from North Launch to US 27 on 7/26/2010 (AM: 9:30 - 12:30; PM: 14:14 - 16:16), 8/1/2010 (8:52 - 10:35), and 12/21/2010 (8:53 - 10:18)
North Launch
0.0
1.0
2.0
3.0
4.0
5.0
6.0
7.0
8.0
0.06Linear Distance (km)
Turb
idity
(NTU
)
7/26/10 AM 7/26/10 PM 8/1/10 AM 12/21/10 AM
EXHIBIT 5-18 Ichetucknee River Water Quality Transect from North Launch Behind Users on the Morning of 7/26/2010 Showing Increased Turbidity Compared to Other Transects

WETLAND SOLUTIONS, INC. 31
The turbidity values measured during the afternoon transect are noticeably higher than those measured in the morning, with an average difference of approximately 0.7 NTU. This is likely related to a combination of human use and increased export from the system late in the afternoon as a result of primary productivity and travel time. The off-season transect had lower values along the river than any of the peak season transects by approximately 0.3 NTU. During this transect measurement event, only five other users in canoes and kayaks were observed on the river. Values for other water quality parameters are provided in Appendix A.
5.6 Human-Induced Turbidity At the locations where human use counts were completed, turbidity was compared to user numbers. At Dampier’s Landing a positive correlation existed between number of people and turbidity values. For the count at the Head Spring a correlation was found between people in the main boil and the sonde located above the North Launch. These correlations are shown in Exhibit 5-19. During this period the sonde downstream of the North Launch produced unreliable data and a comparison could not be made between tubers entering the water and the turbidity values at that station.
y = 0.0151x + 0.4539R2 = 0.8816
y = 0.0086x + 0.6162R2 = 0.3604
y = 0.0079x + 0.0817R2 = 0.3357
0
0.5
1
1.5
2
2.5
0 10 20 30 40 50 60 70 80 90 100
Total In-Water Users
Turb
idity
(NTU
)
7/25/20106/27/20107/6/2010
EXHIBIT 5-19 Ichetucknee River Detailed Human Use Density (in-water users at the time of observation) and Turbidity – Dampier’s Landing 6/27/2010 and 7/6/2010, and North Tube Launch on 7/25/2010
Human use does have an effect on the turbidity in the river, but the effect is confounded by the daily changes in productivity and export from the system. To evaluate the human aspect and eliminate the effect of primary productivity on turbidity the lowest human use days were examined to approximate background turbidity for each station, except the station upstream of the North Launch. Above the North Launch turbidity due to productivity is not expected to contribute a significant amount to the overall turbidity because of a lack of vegetation in this very short reach to the Head Spring. This

WETLAND SOLUTIONS, INC. 32
hypothesis is supported by the low diurnal turbidity values recorded the sonde location upstream of the North Launch.
Based on the examinations it was deemed to be problematic to completely eliminate the human influence at downstream stations. Even during the lowest attendance days of the peak season deployment at Dampier’s Landing and US 27, total daily park attendance during the summer months was over 700 people. Attendance was over 1,200 people per day during the peak season deployment at the two upstream stations. In addition low attendance can be the result of weather which would also affect the productivity and turbidity. Furthermore even with the human use numbers, without detailed human use counts it is not precisely known when or where users entered the river. General observations that can be made from these data are:
• Peak season night time turbidity values are approximately 0.2, 0.7, 0.7, and 1.5 NTU at the North Launch, downstream of the North Launch, Dampier’s Landing, and US 27, respectively.
• Differences between weekday and weekend turbidity values during the peak season are primarily due to human use.
• Night time turbidity values during the off-season are all less than approximately 0.4 NTU.
• Daytime net primary productivity during the peak season appears to contribute approximately 0.3 to 0.5 NTU at all stations except the station upstream of the North Launch which appears to have virtually no productivity related turbidity.
• During the off-season daytime productivity appears to contribute approximately 0.2 to 0.3 NTU at Dampier’s Landing and US 27.
• Peak weekend, mid-day average turbidity values recorded at each station during this summer period were about 4.5, 3.5, and 3.8 NTU at the North Launch, Dampier’s Landing, and US 27, respectively.
• Average weekend, peak season values recorded at each station showed an increase of 2.2, 1.0, and 0.9 NTU at the North Launch, Dampier’s Landing, and US 27, respectively, when compared to average peak season weekday values.
• Weekend and weekday turbidity values were similar during the off season.

WETLAND SOLUTIONS, INC. 33
6.0 Conclusions and Recommendations 6.1 Findings Ichetucknee Springs State Park is a unique attraction in North Florida. The park is very popular for water-dependent recreation and is well used due to its convenient location and layout. The summer tram service makes shuttling of vehicles unnecessary. This ease of use makes the park accessible for a large number of users. On one hand, this use contributes to a better understanding and appreciation of Florida’s springs and natural environment by the general public. However, excessive recreational use has been shown to cause ecological damage. The focus of this study was on documenting the effects of water-dependent human uses on turbidity in the Ichetucknee Head Spring and in the spring run. Turbidity in turn has the potential to detrimentally affect aquatic plant primary productivity (the energy basis supporting the aquatic food chain) due to changes in light availability and to reduce the aesthetic experience for human users in the ISSP.
Data presented in this report are representative of the 2010 conditions at ISSP during peak season (summer), moderate-use period (September – October), and the off season (winter). Primary conclusions from this study are:
• Background turbidity values in the ISSP are very low (typically <2 NTU);
• Turbidity tends to increase (and water clarity decreases) with distance downstream and during the daylight hours due to the addition of fine particulates (pseudoplankton) produced as a result of net primary productivity;
• Water-dependent human uses (principally tubing, wading, and swimming) have a measurable effect on turbidity and water clarity at ISSP during the peak season;
• Weekend days during the peak season typically have the highest turbidity values;
• Human interaction with the sediments and plants primarily occurs in the shallow upstream section of the ISSP above the Midpoint Launch.
The data and other observations presented in this report demonstrate that water-dependent human uses do have an effect on turbidity. This effect is variable, but included spikes in some cases with measured turbidity values more than 20 times background levels. It was noted that turbidity caused by humans appeared in most cases to either settle rapidly and/or be diluted so as not to be visibly transported downstream a significant distance. Attached algae that slough off of the submerged plants (pseudoplankton) and mucky sediments that are disturbed by humans tend to stay suspended longer than sediments which include a significant coarse (sand) fraction. Localized human induced turbidity was especially apparent in the upstream reach above the Midpoint Launch likely due to shallower mean depths, finer grain sediments, and greater interactions between humans and the plants/sediments.

WETLAND SOLUTIONS, INC. 34
Nighttime turbidity during the summer season increased from approximately 0.2 NTU immediately downstream from the Ichetucknee Head Spring to approximately 1.2 NTU at US 27. This was apparent from field observations, river profiles, and sonde deployments at each location. Nighttime turbidity values were approximately the same between weekend and weekdays even during the summer high-use season. This finding indicates that increased turbidity from high daytime use does not continue to have an effect during the following night.
Consistently, higher daytime turbidity was measured on peak season weekend days compared to week days, providing evidence of the cause-and-effect relationship between human use intensity and increased turbidity. Daytime turbidity values measured during periods of lower in-water recreational uses tended to be about 0.3 to 0.5 NTU higher than nighttime values, providing an indication of the effects of primary plant productivity alone on ambient turbidity.
Off season turbidity is generally lower than during the peak season. Values are typically 0.1 to 0.2 NTU at the upstream end of the Ichetucknee River and increase only slightly to approximately 0.3 to 0.4 NTU downstream at US 27. During the winter off-season sampling period, weekday and weekend values did not show an appreciable difference at any of the stations indicating that human uses during this period do not result in measurable turbidity.
Based on the sonde and light meter installation at US 27 it was demonstrated that increasing turbidity decreases light transmittance in the spring water. This effects the light available to plants and no doubt reduces overall rates of photosynthesis. Reductions in plant primary productivity rates due to human-induced turbidity during the summer season are likely to lower the rate of secondary productivity of the aquatic fauna. The magnitude of this hypothesized effect was not quantified in this study.
Horizontal Secchi distance measurements indicated that water clarity or visibility declines markedly between the upstream and downstream portions of the ISSP study reach. Horizontal Secchi readings averaged about 40 m at the upstream end of the ISSP stream segment and about 12 m at the downstream US 27 station. Peak season horizontal Secchi distances tended to be lower than values measured during the off-season. Horizontal Secchi distance was not highly correlated with light transmittance or with turbidity but nevertheless appears to provide a better indication of actual visible water clarity as observed by a snorkeler swimming in the Ichetucknee River.
6.2 Discussion Anastasiou (2006) examined spatial and temporal trends in water clarity in the Rainbow River. This study looked at the water clarity based on horizontal Secchi distance measurements at eight stations in the main channel of the Rainbow River. Water quality parameters were also evaluated to determine the existence of a potential link between water clarity and chlorophyll. Similar to the current study of the Ichetucknee System, Anastasiou’s study found that water clarity as measured by a horizontal Secchi distance decreased markedly in the first 1.2 miles of river, from an average of 60 meters to 20 meters. Water clarity continued to degrade from this point downstream, but less rapidly to 10 meters at 5.6 miles downstream. Using an exponential decay function it was

WETLAND SOLUTIONS, INC. 35
determined that about 82 percent of the variability in water clarity could be explained by chlorophyll concentrations. It was also found that at very low chlorophyll concentrations there was a very significant decline in clarity as concentrations increased, but this decline became less significant at chlorophyll concentrations greater than 1.0 µg/L. Anastasiou (2006) did not collect turbidity data to correlate with chlorophyll concentrations. Additional work is currently planned by the University of Florida Fisheries and Aquatic Sciences Department (Dr. Chuck Cichra) and funded by FDEP at the Rainbow River to further investigate the effects of recreation on the aquatic plant community and water quality. It would be helpful if this study included measurements of the relationship between turbidity and water clarity.
6.3 Future Work Further research at the ISSP should include an evaluation of the success of human use restrictions used by the park to control changes in aquatic plant communities. Currently, ISSP staff does not summarize user data in sufficient detail to allow estimates of specific human uses. In the past, park rangers provided more detailed summaries of human-use activities in the park. That level of detailed information gathering and analysis may be useful for re-assessing the optimal human carrying capacity of the Ichetucknee System that is protective of water clarity and the native plant populations.
Additional horizontal Secchi data should be routinely collected to evaluate the impact of human uses on visibility. From the data collected and visual observations during the present study, a significant decline in clarity and light attenuation occurs with small changes in turbidity. This decrease in clarity has impacts not only for the ecosystem, but also for the park users. Horizontal Secchi measurements in combination with chlorophyll measurements could also be used to evaluate the applicability of an equation similar to that from Anastasiou (2006) at Ichetucknee. This could help determine the portion of the decrease in light availability from upstream to downstream that is directly due to the net export of pseudoplankton chlorophyll downstream compared to human caused turbidity.
Additional measurements of turbidity and light attenuation should be made in both the upstream (North Launch to Midpoint) and downstream (Midpoint to US 27) reaches to evaluate the relationship between small changes in turbidity and decreases in light availability. These measurements could provide a relationship to estimate losses in primary productivity resulting from turbidity increases in the Ichetucknee System.
Further measurements should be made of the direct effects of users. This should include an evaluation of the physical damage to vegetation, localized turbidity created, and the export of vegetation by types of use.

WETLAND SOLUTIONS, INC. 36
7.0 References Cited Anastasiou, C. 2006. An Investigation of the Spatial and Temporal Trends in Water Clarity: Rainbow River, Florida. Prepared for the Florida Department of Environmental Protection. Temple Terrace, Florida.
Bonn, M.A. and F.W. Bell. 2003. Economic Impact of Selected Florida Springs on Surrounding Local Areas. Prepared for the Florida Department of Environmental Protection. Tallahassee, Florida.
Canfield, D.E. and M.V. Hoyer. 1988. Influence of Nutrient Enrichment and Light Availability on the Abundance of Aquatic Macrophytes in Florida Streams. Canadian Journal of Fisheries and Aquatic Sciences 45(8): 1467-1472.
DuToit, C.H. 1979. The Carrying Capacity of the Ichetucknee Springs and River. Master of Science Thesis. University of Florida. Gainesville, FL. 176 pp.
Florida Department of Environmental Protection (FDEP) 2000a. Ichetucknee Springs State Park Approved Unit Management Plan. Division of Recreation and Parks, Tallahassee, FL.
Florida Department of Environmental Protection (FDEP) 1997. Bioassessment: Ichetucknee River. April 1997. Environmental Assessment Section, Tallahassee, FL.
Florida Department of Environmental Protection (FDEP) 2000b. Ecosummary: Ichetucknee Springs. October 5, 2000. Environmental Assessment Section, Tallahassee, FL.
Florida Department of Environmental Protection (FDEP) 2001a. Ecosummary: Ichetucknee Springs. March 14, 2001. Environmental Assessment Section, Tallahassee, FL.
Florida Department of Environmental Protection (FDEP) 2001b. Ecosummary: Ichetucknee Springs. October 15, 2001. Environmental Assessment Section, Tallahassee, FL.
Florida Department of Environmental Protection (FDEP) 2002a. Ecosummary: Ichetucknee Springs. April 9, 2002. Environmental Assessment Section, Tallahassee, FL.
Florida Department of Environmental Protection (FDEP) 2002b. Ecosummary: Ichetucknee Springs. August 28, 2002. Environmental Assessment Section, Tallahassee, FL.
Florida Department of Environmental Protection (FDEP) 2002c. Ecosummary: Ichetucknee Springs. October 17, 2002. Environmental Assessment Section, Tallahassee, FL.
Florida Department of Environmental Protection (FDEP) 2003a. Ecosummary: Ichetucknee Springs. January 17, 2003. Environmental Assessment Section, Tallahassee, FL.

WETLAND SOLUTIONS, INC. 37
Florida Department of Environmental Protection (FDEP) 2003b. Ecosummary: Ichetucknee Springs. June 5, 2003. Environmental Assessment Section, Tallahassee, FL.
Florida Department of Environmental Protection (FDEP) 2003c. Ecosummary: Ichetucknee Springs. July 31, 2003. Environmental Assessment Section, Tallahassee, FL.
Florida Department of Environmental Protection (FDEP) 2003d. Ecosummary: Ichetucknee Springs. September 30, 2003. Environmental Assessment Section, Tallahassee, FL.
Florida Department of Environmental Protection (FDEP) 2004a. Ecosummary: Ichetucknee Springs. January 29, 2004. Environmental Assessment Section, Tallahassee, FL.
Florida Department of Environmental Protection (FDEP) 2004b. Ecosummary: Ichetucknee Springs. April 27, 2004. Environmental Assessment Section, Tallahassee, FL.
Florida Department of Environmental Protection (FDEP) 2004c. Ecosummary: Ichetucknee Springs. August 25, 2004. Environmental Assessment Section, Tallahassee, FL.
Florida Department of Environmental Protection (FDEP) 2004d. Ecosummary: Ichetucknee Springs. November 18, 2004. Environmental Assessment Section, Tallahassee, FL.
Florida Department of Environmental Protection (FDEP) 2005a. Ecosummary: Ichetucknee Springs. January 28, 2005. Environmental Assessment Section, Tallahassee, FL.
Florida Division of Recreation and Parks (FDRP). 2010. Florida State Parks. World Wide Web electronic publication. http://www.floridastateparks.org/ichetuckneesprings/ activities.cfm, retrieved December 16, 2010.
Kurz, R.C., P. Sinphay, W.E. Hershfeld, A.B. Krebs, A.T. Peery, D.C. Woithe, S.K. Notestein, T.K. Frazer, J.A. Hale, and S.R. Keller. 2003. Mapping and Monitoring Submerged Aquatic Vegetation in Ichetucknee and Manatee Springs. Final Report. Suwannee River Water Management District, Live Oak, Florida.
Kurz, R.C., D.C. Woithe, S.K. Notestein, T.K. Frazer, J.A. Hale, and S.R. Keller. 2004. Mapping and Monitoring Submerged Aquatic Vegetation in Ichetucknee Springs - 2004. Final Report. Suwannee River Water Management District, Live Oak, Florida. June 30, 2004.
Wetland Solutions, Inc. (WSI). 2008. 2008 Ichetucknee Springs and River Environmental Health – 2008 Report Card. March 16, 2009. Prepared for Three Sisters FNPC, Inc. 7 pp.
Wetland Solutions, Inc. (WSI). 2010. An Ecosystem-Level Study of Florida’s Springs. Final Report. February 26, 2010. Prepared for the Florida Fish and Wildlife Conservation Commission, Tallahassee, FL. FWC Project Agreement No. 08010. 232 pp.

WETLAND SOLUTIONS, INC.
Appendix A
Water Quality Transects in the Ichetucknee Springs State Park
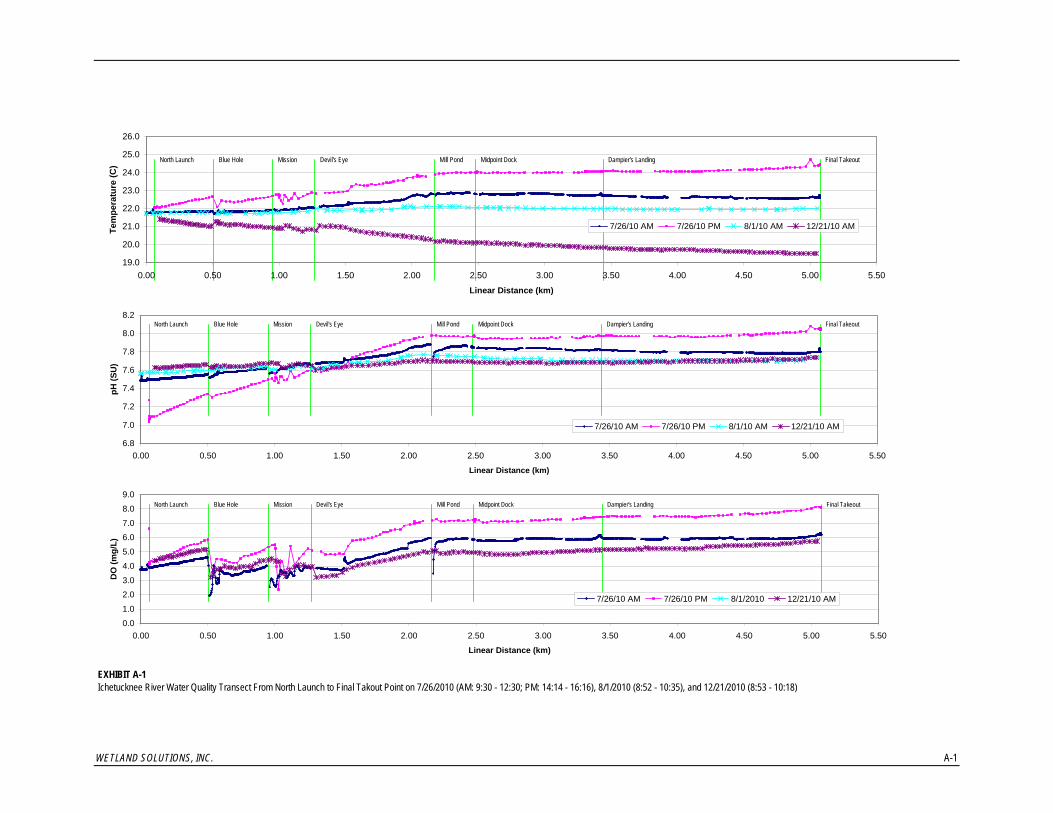
WETLAND SOLUTIONS, INC. A-1
EXHIBIT A-1Ichetucknee River Water Quality Transect From North Launch to Final Takout Point on 7/26/2010 (AM: 9:30 - 12:30; PM: 14:14 - 16:16), 8/1/2010 (8:52 - 10:35), and 12/21/2010 (8:53 - 10:18)
Final TakeoutDampier's LandingMidpoint DockMill PondDevil's EyeMissionBlue HoleNorth Launch
19.0
20.0
21.0
22.0
23.0
24.0
25.0
26.0
0.00 0.50 1.00 1.50 2.00 2.50 3.00 3.50 4.00 4.50 5.00 5.50
Linear Distance (km)
Tem
pera
ture
(C)
7/26/10 AM 7/26/10 PM 8/1/10 AM 12/21/10 AM
North Launch Blue Hole Mission Devil's Eye Mill Pond Midpoint Dock Dampier's Landing Final Takeout
6.8
7.0
7.2
7.4
7.6
7.8
8.0
8.2
0.00 0.50 1.00 1.50 2.00 2.50 3.00 3.50 4.00 4.50 5.00 5.50
Linear Distance (km)
pH (S
U)
7/26/10 AM 7/26/10 PM 8/1/10 AM 12/21/10 AM
Final TakeoutDampier's LandingMidpoint DockMill PondDevil's EyeMissionBlue HoleNorth Launch
0.0
1.0
2.0
3.0
4.0
5.0
6.0
7.0
8.0
9.0
0.00 0.50 1.00 1.50 2.00 2.50 3.00 3.50 4.00 4.50 5.00 5.50
Linear Distance (km)
DO
(mg/
L)
7/26/10 AM 7/26/10 PM 8/1/2010 12/21/10 AM

WETLAND SOLUTIONS, INC. A-2
EXHIBIT A-2Ichetucknee River Water Quality Transect From North Launch to Final Takout Point on 7/26/2010 (AM: 9:30 - 12:30; PM: 14:14 - 16:16), 8/1/2010 (8:52 - 10:35), and 12/21/2010 (8:53 - 10:18)
North Launch Blue Hole Mission Devil's Eye Mill Pond Midpoint Dock Dampier's Landing Final Takeout
305
310
315
320
325
330
335
340
345
0.00 0.50 1.00 1.50 2.00 2.50 3.00 3.50 4.00 4.50 5.00 5.50
Linear Distance (km)
SpC
(uS/
cm)
7/26/10 AM 7/26/10 PM 8/1/10 AM 12/21/10 AM
North Launch Blue Hole Mission Devil's Eye Mill Pond Midpoint Dock Dampier's Landing Final Takeout
0.0
0.5
1.0
1.5
2.0
2.5
0.00 0.50 1.00 1.50 2.00 2.50 3.00 3.50 4.00 4.50 5.00 5.50
Linear Distance (km)
Turb
idity
(NTU
)
7/26/10 AM 7/26/10 PM 8/1/10 AM 12/21/10 AM
Related Documents