Introduction 1 ESPRIT EP 29902 DEMINE Final Report Deliverable D16 (V4.0_public_report) written by the DEMINE partners: Technische Universität Ilmenau (TUI) Messtechnik, Ortung und Datenverarbeitung GmbH (MEODAT) Stiftung Menschen gegen Minen e.V. (MgM) Vrije Universiteit Brussel (VUB) Ingegneria dei Sistemi S.p.A. (IDS) Defence Evaluation and Research Agency (DERA / QinetiQ) Fluid Gravity Engineering Limited (AEL) Thüringer Agentur für Technologietransfer GmbH (THATI i.L.) D16pub_4.doc Copyright DEMINE partners 2002 1 Created on 15.10.02 The contents of this report represent the opinions of the DEMINE project partners

Welcome message from author
This document is posted to help you gain knowledge. Please leave a comment to let me know what you think about it! Share it to your friends and learn new things together.
Transcript
Introduction 1
ESPRIT
EP 29902 DEMINE
Final Report Deliverable D16 (V4.0_public_report)
written by the DEMINE partners:
Technische Universität Ilmenau (TUI) Messtechnik, Ortung und Datenverarbeitung GmbH (MEODAT) Stiftung Menschen gegen Minen e.V. (MgM) Vrije Universiteit Brussel (VUB) Ingegneria dei Sistemi S.p.A. (IDS) Defence Evaluation and Research Agency (DERA / QinetiQ) Fluid Gravity Engineering Limited (AEL) Thüringer Agentur für Technologietransfer GmbH (THATI i.L.)
D16pub_4.doc Copyright DEMINE partners 2002 1 Created on 15.10.02
The contents of this report represent the opinions of the DEMINE project partners
Introduction 1
Contents
1. Introduction.......................................................................................................... 5
2. Physical Basis and Technical Objectives............................................................. 7
3. Organisation of work.......................................................................................... 11
4. Investigation of electromagnetic scattering by mines......................................... 15
4.1. Simulation of Electromagnetic filed Scattering by APLs ............................. 15
4.2. Laboratory Measurements.......................................................................... 21
5. Development of the DEMINE sub-system ......................................................... 23
5.1. Preliminary Remarks .................................................................................. 23
5.2. Antenna ...................................................................................................... 24
5.3. Radar Electronics ....................................................................................... 34
5.3.1. Conception of UWB-radar head .......................................................... 35
5.3.2. The development of the UWB-radar electronics.................................. 38
5.3.3. Results ................................................................................................ 42
5.4. Radar Head Positioning.............................................................................. 48
5.4.1. Scanning Concept ............................................................................... 50
5.4.2. Ultrasonic Sensor Positioning.............................................................. 50
5.4.3. Wire Encoder Position ......................................................................... 55
5.5. Data Interface ............................................................................................. 56
5.6. MMI ............................................................................................................ 59
5.7. Prototype .................................................................................................... 61
6. Data Processing and Classification ................................................................... 65
6.1. Introduction................................................................................................. 65
6.2. Data Pre-processing................................................................................... 65
D16pub_4.doc Copyright DEMINE partners 2002 2 Created on 15.10.02
The contents of this report represent the opinions of the DEMINE project partners
6.2.1. Data Resampling................................................................................. 66
Introduction 1
6.2.2. Background Removal .......................................................................... 67
6.3. Image Processing....................................................................................... 71
6.4. Imaging....................................................................................................... 72
6.4.1. 2-D SAR for DEMINE .......................................................................... 73
6.4.2. Full 3-D SAR for DEMINE ................................................................... 75
6.5. Volume Reduction ...................................................................................... 76
6.6. Detection .................................................................................................... 77
6.7. Feature Extraction ...................................................................................... 78
6.7.1. Background ......................................................................................... 78
6.7.2. Time Domain Analysis - Cross-Correlation of target signatures .......... 78
6.7.3. Spectral Analysis ................................................................................. 82
6.7.4. Time-Frequency analysis .................................................................... 84
6.7.5. Conclusion........................................................................................... 85
6.8. Shape Classification from SAR Images...................................................... 86
6.8.1. Background ......................................................................................... 86
6.8.2. Analysis Method .................................................................................. 86
6.8.3. Results ................................................................................................ 87
6.9. General Conclusion on Data Processing/Classification.............................. 88
7. Test of the DEMINE-System.............................................................................. 90
7.1. Laboratory Test .......................................................................................... 91
7.2. Ispra Tests.................................................................................................. 94
7.3. Angola Test ................................................................................................ 97
8. Dissemination .................................................................................................. 101
8.1. Dissemination Introduction ....................................................................... 101
8.2. Main Diffusion Activities Undertaken ........................................................ 101
8.2.1. Project and partner web sites ............................................................ 101
8.2.2. Clustering .......................................................................................... 101
8.2.3. Conference papers/participation, articles .......................................... 101
8.2.4. Networks ........................................................................................... 103
8.2.5. Advertising Material ........................................................................... 103
8.2.6. Field tests .......................................................................................... 103
8.2.7. Television Documentary .................................................................... 103
8.3. Future Dissemination Plans...................................................................... 103
9. Performance Envelope and Review of Project Objectives............................... 104
D16pub_4.doc Copyright DEMINE partners 2002 3 Created on 15.10.02
The contents of this report represent the opinions of the DEMINE project partners
Introduction 1
9.1. DEMINE Performance Envelope .............................................................. 104
9.1.1. 1-D Array Antenna Resolution........................................................... 104
9.1.2. 3-D SAR Imaging and & Clutter Reduction........................................ 108
9.1.3. Operational height ............................................................................. 109
9.1.4. Soil .................................................................................................... 109
9.1.5. Clutter................................................................................................ 112
9.1.6. Types of mines .................................................................................. 112
9.1.7. Summary of the DEMINE Array characteristics................................. 113
9.1.8. Performance envelope summary....................................................... 113
9.2. Review of Project Objectives .................................................................... 116
9.3. Improvements on the DEMINE project results.......................................... 119
9.3.1. Performance envelope ...................................................................... 119
9.3.2. Improvements required to the DEMINE detector............................... 119
10. Exploitation................................................................................................... 121
Introduction.......................................................................................................... 121
10.1. Single sensor hand held humanitarian demining detector..................... 121
Confidential ................................................................................................... 121
10.2. Further humanitarian demining detection systems................................ 121
10.2.1. Enhancement of three existing technologies and data fusion algorithms for the test and DEmonstration of Multi-sensor lANdmine Detection techniques (DEMAND) .................................................................................... 122
10.2.2. QinetiQ Portable Humanitarian Mine Detector (PHMD) ................. 123
10.2.3. Other humanitarian demining systems........................................... 123
10.2.4. Humanitarian demining equipment, techniques, test site in Angola123
10.3. Additional products ............................................................................... 124
10.3.1. General surface penetrating radar detector ................................... 124
10.3.2. Integrated Ultra Wide Band Electronics ......................................... 125
10.3.3. Antennas........................................................................................ 125
10.3.4. Positioning system......................................................................... 125
10.4. Exploitation Conclusion......................................................................... 125
11. Conclusion ................................................................................................... 127
D16pub_4.doc Copyright DEMINE partners 2002 4 Created on 15.10.02
The contents of this report represent the opinions of the DEMINE project partners
Introduction 1
1. Introduction Anti-personnel Landmines (APLs) are a world wide problem which cause human suf-fering and restrict economic growth. A majority of world nations are committed to solving this problem as represented by the Ottawa Treaty. In order to solve the prob-lem of the danger and threat of APLs, suspected land must be subjected to proce-dures which declare it free from APLs ensuring any APLs are found, removed and destroyed.
The detection of buried APLs is however a very difficult matter as there is no unique criteria which characterises hidden APLs. The classical criteria used by human be-ings to classify objects is largely based on optical appearances i.e. by a vast number of features derived from size, shape, colour and surface structure. This procedure fails however for buried or hidden APLs. The human being is therefore dependent upon technical means to detect these objects.
There are a great deal of properties of mines which may be used for this purpose. Unfortunately each property such as eddy current induction, electromagnetic wave scattering, investigation of chemical composition, radiation of thermal noise etc. may be confused with other objects. At present, the only widely used sensor technology in the field is metal detector technology. This technology has however the disadvantage that it cannot find mines with no or very low metal content and that may false alarms are caused in ex-war zones due to metal detectors finding all metal in the ground. These false alarm increase the cost of demining in terms of time and resources and can also lead to risk taking. The DEMINE system is an answer to this problem in that it searches for mine like objects as opposed to metal. The objective in this project was to design a working single sensor system although from the first initiation of the project it was apparent that a successful single sensor system could be combined with other sensors to provide a multi-sensor device.
The DEMINE sensor is a high resolution, short range radar – in the following called Surface Penetrating Radar (SPR) – which gains its information from the scattering of electromagnetic waves. A single sensor in our sense is not a system which is based on one individual sensor element rather it is a measurement system working on a uniform principle as such the phrase single sensor system also covers sensor arrays.
A fundamental aspect of the research within the DEMINE project is to be seen in the creation of an ultra-wideband sensor array. The application of SPR arrays has two aspects. The first one is connected with a quicker survey speed since a larger area is under investigation. Whereas, the second point is that the gathered data provides more information content as targets may be “seen from different aspect angles”. It should be noted that the last point is connected with very complicated data process-ing. Current processing (e.g. SAR processing) of gathered data normally suppose small point targets which do not show a scattering dependent on the aspect angle.
At this point it should be explicitly drawn to the readers attention that several highly sophisticated techniques are required to build such an SPR-array and to provide ap-propriate data processing. One should as such always consider that such devices will be High-Tec systems which means a contradiction has to be solved between sophis-ticated hard- and software and application in hard environments by less skilled opera-
D16pub_4.doc Copyright DEMINE partners 2002 5 Created on 15.10.02
The contents of this report represent the opinions of the DEMINE project partners
Introduction 1
tors. In the DEMINE project the main emphasis in this relatively short RTD project was to be found on technical and scientific questions in order to first solve the fun-damental problems. We have however been able to solve the technical questions in a manner which may be implemented in practice by an appropriate re-design.
The report summarises the technical and scientific work within the DEMINE project. Starting from a short introduction of the physical problem of object recognition by wave scattering, the technical requirements of a SPR system will be introduced in a very global manner. The following chapters provide an overview of the organisation and implementation of work. Chapter 4 deals with detailed information with regards to the required technical parameters and chapter 5 describes the key sub-systems comprising the DEMINE SPR. The report concludes with our test strategies and per-formance envelope as well as an overview to the dissemination and exploitation ac-tivities.
D16pub_4.doc Copyright DEMINE partners 2002 6 Created on 15.10.02
The contents of this report represent the opinions of the DEMINE project partners
Physical Basis and Technical Objectives 2
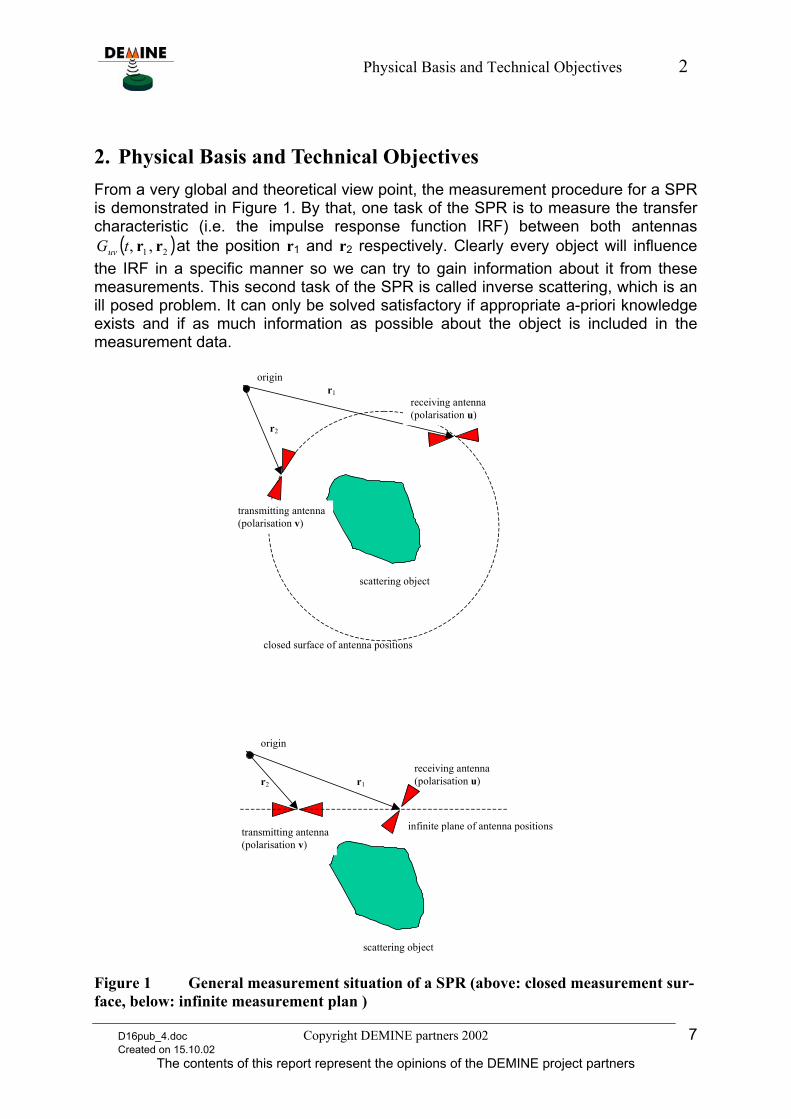
2. Physical Basis and Technical Objectives From a very global and theoretical view point, the measurement procedure for a SPR is demonstrated in Figure 1. By that, one task of the SPR is to measure the transfer characteristic (i.e. the impulse response function IRF) between both antennas
at the position r( 21 ,, rrtGuv ) 1 and r2 respectively. Clearly every object will influence the IRF in a specific manner so we can try to gain information about it from these measurements. This second task of the SPR is called inverse scattering, which is an ill posed problem. It can only be solved satisfactory if appropriate a-priori knowledge exists and if as much information as possible about the object is included in the measurement data.
scattering object
transmitting antenna(polarisation v)
receiving antenna(polarisation u)
originr1
r2
closed surface of antenna positions
scattering object
transmitting antenna(polarisation v)
receiving antenna(polarisation u)
origin
r1r2
infinite plane of antenna positions
Figure 1 General measurement situation of a SPR (above: closed measurement sur-face, below: infinite measurement plan )
D16pub_4.doc Copyright DEMINE partners 2002 7 Created on 15.10.02
The contents of this report represent the opinions of the DEMINE project partners
Physical Basis and Technical Objectives 2
It can be shown that all electrical accessible information is gathered
1. if the antennas represent point sources δ(t,r),
2. if all IRFs are measured for any combinations of the antenna location r1 and r2 covering a closed surface around the object or an infinite plane surface , and
3. if all orthogonal components of the stimulation field as well as the scattered field are referred to each other.
In practice, these theoretical conditions can of course only be satisfied with certain deviations. Referring to the situation in Figure 1b the practical constraints concerning the technical implementation are:
• transmitter and receiver antennas must form an 2D array having dimensions larger than the object under investigation
• the antennas must be polarimetric
• the beam width of the antennas must be as large as possible, and
• the bandwidth and the dynamic of the system must be as large as possible.
The usable bandwidth is limited at the lower side by the dimensions of the antennas and at the upper side by the properties of soil. It prevents the penetration of electro-magnetic waves if their frequency is too high. On the other hand the larger the band-width of the sounding signal the better the recognition of the objects will be. Thus a reasonable compromise must be found.
Further constrains are added by considering the device handling. In the case of a hand held system as in the DEMINE project, the dimensions of the sensor array are limited by ergonomics. Furthermore deminers require a free view to the ground to be blocked as little as possible. Since the last point could not by solved with a full 2D array, it was decided to develop a linear 1D array well aware that this is connected with a certain loss on information. However by taking into consideration that mines are man made objects, it was calculated that the information loss would be small. Nevertheless, the data processing must contain also 2D and 3D processing compo-nents, thus the reduction to one array dimension causes additionally the need of a precise position measurement in order to know the exact antenna locations.
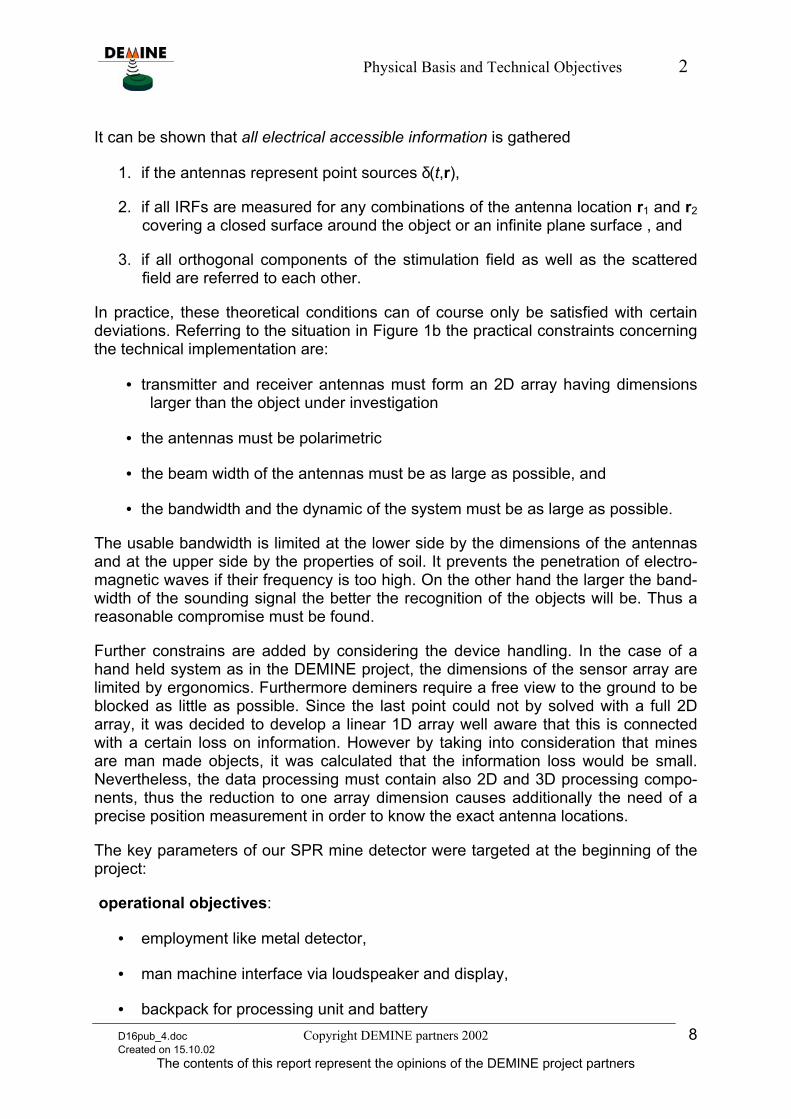
The key parameters of our SPR mine detector were targeted at the beginning of the project:
operational objectives:
• employment like metal detector,
• man machine interface via loudspeaker and display,
• backpack for processing unit and battery D16pub_4.doc Copyright DEMINE partners 2002 8 Created on 15.10.02
The contents of this report represent the opinions of the DEMINE project partners
Physical Basis and Technical Objectives 2
technical objectives:
0verall system:
• weight 10 –20 kg
• power consumption 50 –100W
• 50...80 cm scan width
• resolution 2.. 3cm
• scan rate up to 50 cm/s
• suitable and the safe man machine interface for device operation control and data exchange.
antenna configuration:
• broad-band array, possibly polarimetric
• bandwidth in the order of .5 ... 5GHz, minimum upper band edge 2.5 GHz
radar electronics:
The radar electronics must be able to cover the required bandwidth, to respect an unambiguity range larger than approximately 5 m and to operate with a multi-channel arrangement (antenna array). Thus a fast acquisition rate from the electronics was required for this application. Both the bandwidth and the multi-channel capability as well as the measurement speed pose problems, which are difficult to overcome by the classical UWB-measurement principles (pulse, FMCW; step frequency). It was the invention of the new UWB-principle – the so-called digital UWB-correlation – which made it possible to develop and implement the DEMINE conception. The key figures of the new electronics were indicated as:
• internal clock rate 5 – 10 GHz
• length of impulse 511 points
• sampling rate higher than12 MHz/ scan rate up to 40 kHz
• dynamic range better than 50 dB / averaging 1:32000
• total power per channel 5...10 W
D16pub_4.doc Copyright DEMINE partners 2002 9 Created on 15.10.02
The contents of this report represent the opinions of the DEMINE project partners
Physical Basis and Technical Objectives 2
positioning:
• accuracy in the order of the radar resolution
• update rate 1 ... 100Hz
signal processing:
The task of the signal processing is to characterise the scattering objects by inverse methods. That means, mines, no mine objects, soil and the surface of soil / vegeta-tion must be respected in an appropriate manner.
• 1D-, 2D-, 3D-signal processing
• feature extraction and classification in real-time
Throughout the project, it was always necessary to carefully consider the system conception and the whole technical work with respect to the achievement of the best technical parameters at reasonable costs for the final system.
D16pub_4.doc Copyright DEMINE partners 2002 10 Created on 15.10.02
The contents of this report represent the opinions of the DEMINE project partners
Organisation of work 3
3. Organisation of work The DEMINE consortium contained the following companies, institutions and Foundation:
Fluid Gravity Engineering Ltd, Applied Electromagnetics (AEL)
Defence and Evaluation Research Agency (now QinetiQ Ltd) (DERA)
IDS Ingegneria dei Sistemi S.p.A. (IDS)
MEODAT Messtechnik, Ortung und Datenverarbeitung GmbH (MEODAT)
Stiftung Menschen gegen Minen e.V. (MgM)
Technische Universität Ilmenau (TUI)
Vrije Universiteit Brussel (VUB)
Sub-contractor:
Thüringer Agentur für Technologietransfer und Innovationsförderung GmbH (THATI)
The temporal organisation of work was determined by the analysis of the problem in the first step from which the system configuration (see Figure 2 and Figure 3) and the key parameters were deduced. The different development tasks were then divided between the partners.
The radar electronics, and here mainly the radar chips, were the most critical part with respect to the time schedule and the overall performance. It should be noted, that an integrated UWB-principle had up until this project never been built or applied as an UWB radar sensor. The proof of the functioning of the principle was as such in the foreground at the beginning of the project. Some chip re-designs were also planned from the beginning in order to apply the experience gathered with the first trials. Furthermore, we had to respect the timetables from the chip supplier. The first idea was to manufacture the chips in GaAs-technology because of the required bandwidth but at that time the SiGe-technology became more and more interesting for RF-applications. In the end, we decided in favour of this technology last but not least with regards to the manufacturing cost.
In parallel to the development of the hardware components and subsystems, labora-tory measurements with radar scanners at TUI and VUB were undertaken in order to gather (semi-real) data as input for the development of the signal processing. After finalising the different sub-systems, the complete equipment was assembled and tested in laboratory environments as well as at JRC Ispra and at our test field in On-jiva, Angola.
D16pub_4.doc Copyright DEMINE partners 2002 11 Created on 15.10.02
The contents of this report represent the opinions of the DEMINE project partners
Organisation of work 3
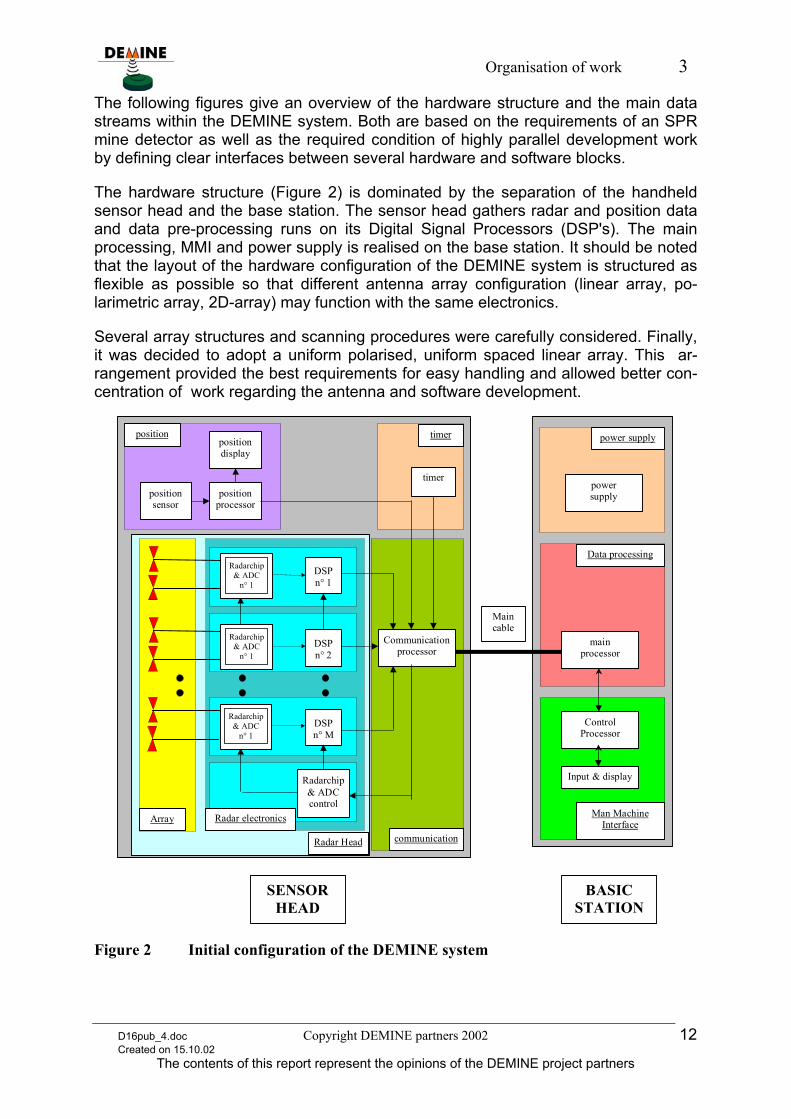
The following figures give an overview of the hardware structure and the main data streams within the DEMINE system. Both are based on the requirements of an SPR mine detector as well as the required condition of highly parallel development work by defining clear interfaces between several hardware and software blocks.
The hardware structure (Figure 2) is dominated by the separation of the handheld sensor head and the base station. The sensor head gathers radar and position data and data pre-processing runs on its Digital Signal Processors (DSP's). The main processing, MMI and power supply is realised on the base station. It should be noted that the layout of the hardware configuration of the DEMINE system is structured as flexible as possible so that different antenna array configuration (linear array, po-larimetric array, 2D-array) may function with the same electronics.
Several array structures and scanning procedures were carefully considered. Finally, it was decided to adopt a uniform polarised, uniform spaced linear array. This ar-rangement provided the best requirements for easy handling and allowed better con-centration of work regarding the antenna and software development.
DSPn° 1
DSPn° 2
DSPn° M
Radarchip& ADCcontrol
Communicationprocessor
timer
positiondisplay
positionsensor
positionprocessor
mainprocessor
ControlProcessor
powersupply
Maincable
SENSORHEAD
BASICSTATION
Array
position timer
communication
Man MachineInterface
power supply
Data processing
Input & display
Radar Head
Radarchip& ADC
n° 1
Radarchip& ADC
n° 1
Radarchip& ADC
n° 1
Radar electronics
Figure 2 Initial configuration of the DEMINE system
D16pub_4.doc Copyright DEMINE partners 2002 12 Created on 15.10.02
The contents of this report represent the opinions of the DEMINE project partners
Organisation of work 3
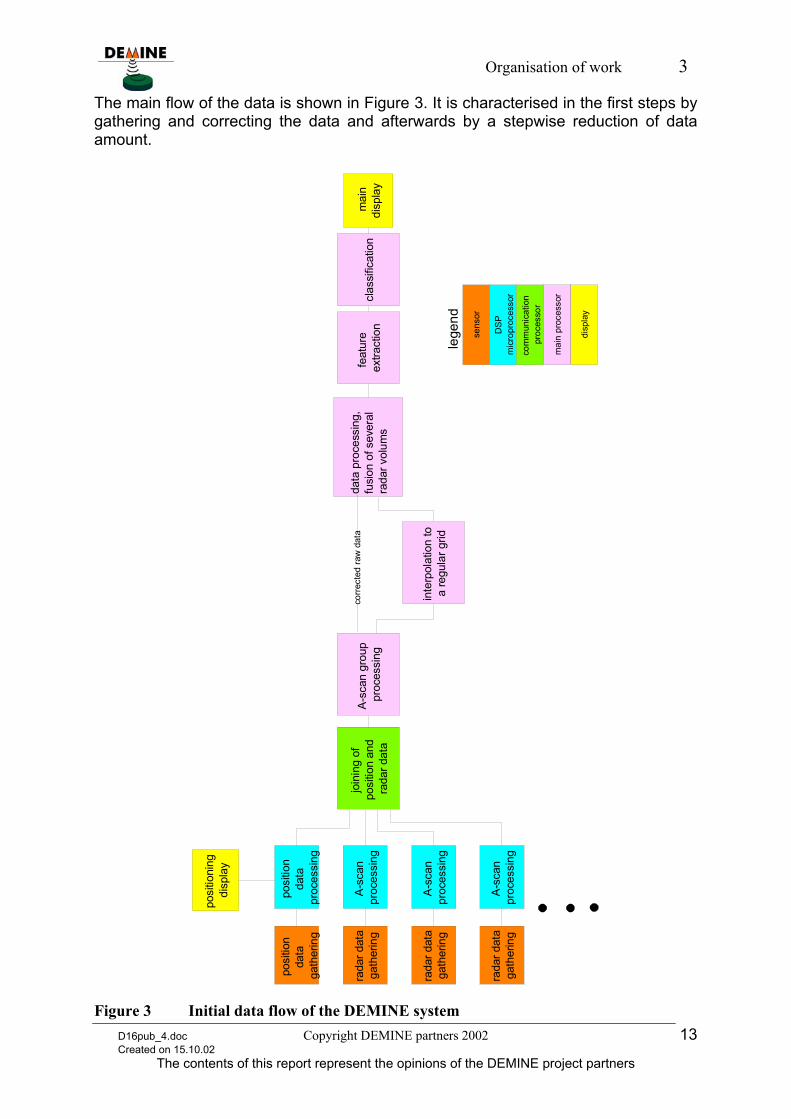
The main flow of the data is shown in Figure 3. It is characterised in the first steps by gathering and correcting the data and afterwards by a stepwise reduction of data amount.
posi
tion
data
ga
ther
ing
posi
tion
data
pr
oces
sing
rada
r dat
a ga
ther
ing
A-sc
an
proc
essi
ngjo
inin
g of
po
sitio
n an
d ra
dar d
ata
inte
rpol
atio
n to
a
regu
lar g
rid
data
pro
cess
ing,
fusi
on o
f sev
eral
ra
dar v
olum
s
feat
ure
extra
ctio
ncl
assi
ficat
ion
posi
tioni
ng
disp
lay
mai
ndi
spla
y
rada
r dat
a ga
ther
ing
A-sc
an
proc
essi
ng
rada
r dat
a ga
ther
ing
A-sc
an
proc
essi
ng
sens
or
DSP
mic
ropr
oces
sor
com
mun
icat
ion
proc
esso
r
mai
n pr
oces
sor
lege
nd
A-sc
an g
roup
pr
oces
sing
disp
lay
corre
cted
raw
dat
a
Figure 3 Initial data flow of the DEMINE system D16pub_4.doc Copyright DEMINE partners 2002 13 Created on 15.10.02
The contents of this report represent the opinions of the DEMINE project partners
Organisation of work 3
The overall work and the responsibility within the project was divided between the partners as shown below in order to achieve high parallel work:
• project administration: TUI, THATI
• overall system, technical management: IDS, (TUI)
• end user requirements and system handling: MgM
• analysis of wave scattering at mines: AEL
• preliminary laboratory test with antenna arrays: TUI, VUB
• UWB-antennas: AEL, DERA
• radar electronics and hardware near programming : MEODAT, TUI
• positioning system: DERA
• over all system, data interfaces, man machine interface: IDS
• signal processing, feature extraction and classification: VUB, DERA, AEL
• system assembly: IDS, TUI, MEODAT
• test (laboratory and field): all
• exploitation, dissemination: IDS, TUI, THATI
Regular meetings revolving between partners provided for synchronisation of the work, for discussion of theoretical questions and for decisions as to further steps. The integration work was mainly undertaken in Ilmenau and in Pisa. There was strong contact between all partners via e-mail. The tests of the complete system were per-formed in the laboratories of the TUI, at IDS in Pisa, at JRC Ispra and at our test field in Onjiva, Angola.
It should be emphasised that the inclusion of some members of the consortium in MgM field trials in Namibia in the early beginning of the project and in Angola at the end provided a great deal of experience and impressions of the humanitarian demin-ing problem and deminers work.
The development work of the consortium is documented in 16 deliverables and some white papers:
Del. 1: The Requirements for the DEMINE detector
Del. 2: The Conception and Specifications for the DEMINE detector
Del. 3: First Chip and initial tests
D16pub_4.doc Copyright DEMINE partners 2002 14 Created on 15.10.02
The contents of this report represent the opinions of the DEMINE project partners
Investigation of electromagnetic scattering by mines 4
Del. 4: Dissemination Report 1
Del. 5: Exploitation and business plan Report 1
Del. 6: Full Report on the antenna solution
Del. 7: Full Report on the positioning system solution
Del. 8: Full report on the radar electronics solution
Del. 9: Full report on the data processing and classification solution
Del. 10: Prototype 1a + b
Del. 11: Report on the DEMINE Laboratory Testing
Del. 12: Report on DEMINE in the Field Testing
Del. 13: Prototype 2
Del. 14: Dissemination Report 2
Del. 15 Exploitation and business plan Report 2
Del. 16 Final Report
4. Investigation of electromagnetic scattering by mines In order to further understand critical system parameters and to be able to start the development of signal processing, the behaviour of APLs in the electrical field was simulated and measured by a laboratory equipment.
4.1. Simulation of Electromagnetic filed Scattering by APLs
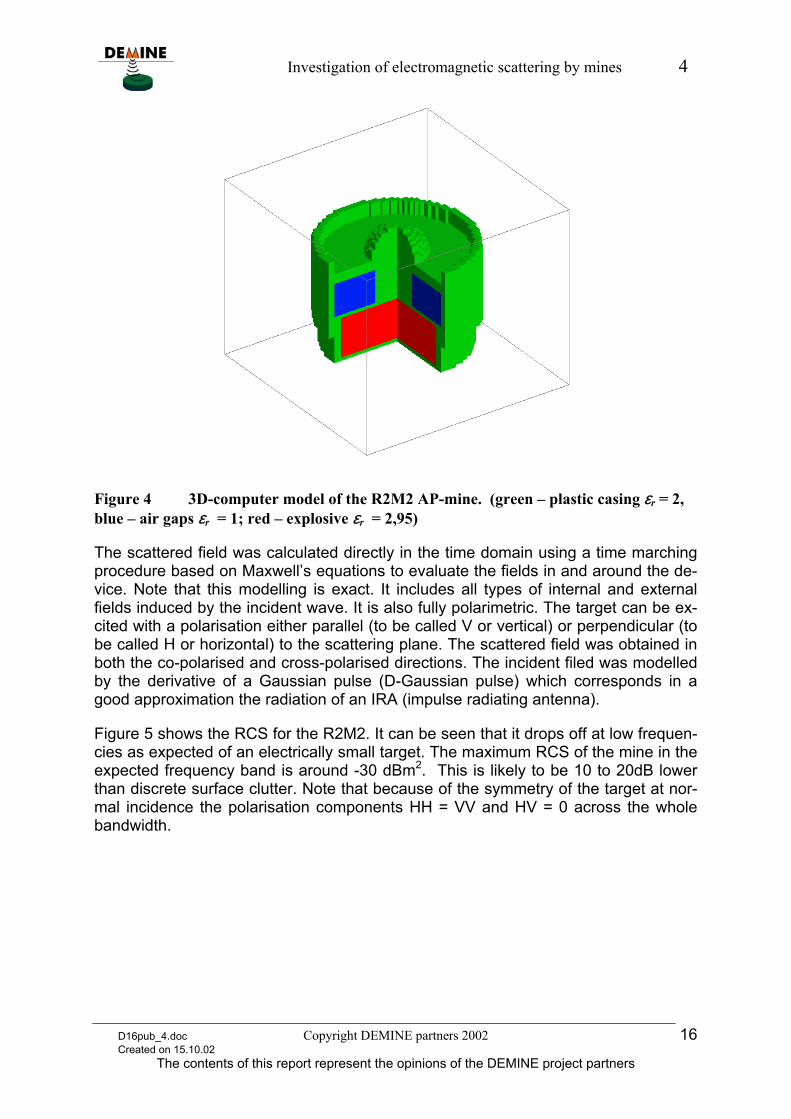
We have concentrated on the R2M2 AP-mine as a typical ‘difficult’ target to find using existing detectors. A cut-away of the mine model is shown in figure 4. The mine was modelled under plane wave incidence in an infinite dry sand medium of εr = 2.5. This then represents one of the most difficult radar detection environments for such de-vices.
D16pub_4.doc Copyright DEMINE partners 2002 15 Created on 15.10.02
The contents of this report represent the opinions of the DEMINE project partners
Investigation of electromagnetic scattering by mines 4
Figure 4 3D-computer model of the R2M2 AP-mine. (green – plastic casing εr = 2, blue – air gaps εr = 1; red – explosive εr = 2,95)
The scattered field was calculated directly in the time domain using a time marching procedure based on Maxwell’s equations to evaluate the fields in and around the de-vice. Note that this modelling is exact. It includes all types of internal and external fields induced by the incident wave. It is also fully polarimetric. The target can be ex-cited with a polarisation either parallel (to be called V or vertical) or perpendicular (to be called H or horizontal) to the scattering plane. The scattered field was obtained in both the co-polarised and cross-polarised directions. The incident filed was modelled by the derivative of a Gaussian pulse (D-Gaussian pulse) which corresponds in a good approximation the radiation of an IRA (impulse radiating antenna).
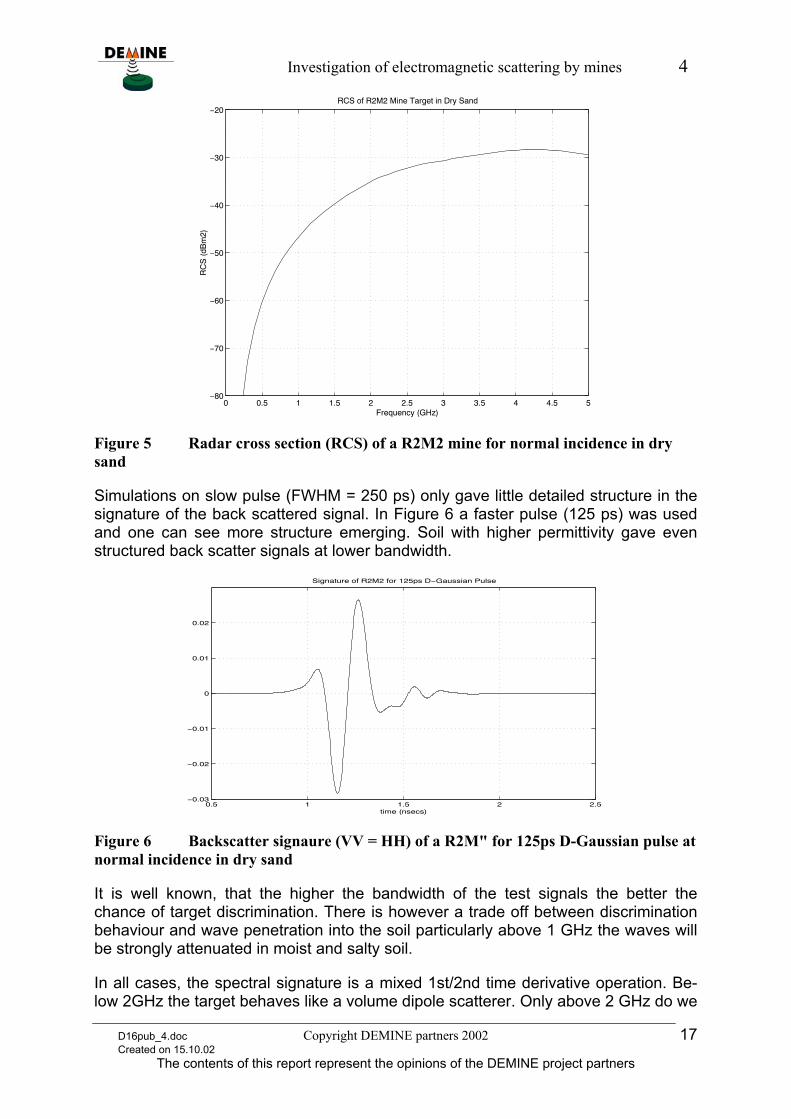
Figure 5 shows the RCS for the R2M2. It can be seen that it drops off at low frequen-cies as expected of an electrically small target. The maximum RCS of the mine in the expected frequency band is around -30 dBm2. This is likely to be 10 to 20dB lower than discrete surface clutter. Note that because of the symmetry of the target at nor-mal incidence the polarisation components HH = VV and HV = 0 across the whole bandwidth.
D16pub_4.doc Copyright DEMINE partners 2002 16 Created on 15.10.02
The contents of this report represent the opinions of the DEMINE project partners
Investigation of electromagnetic scattering by mines 4
0 0.5 1 1.5 2 2.5 3 3.5 4 4.5 5−80
−70
−60
−50
−40
−30
−20RCS of R2M2 Mine Target in Dry Sand
Frequency (GHz)
RC
S (
dBm
2)
Figure 5 Radar cross section (RCS) of a R2M2 mine for normal incidence in dry sand
Simulations on slow pulse (FWHM = 250 ps) only gave little detailed structure in the signature of the back scattered signal. In Figure 6 a faster pulse (125 ps) was used and one can see more structure emerging. Soil with higher permittivity gave even structured back scatter signals at lower bandwidth.
0.5 1 1.5 2 2.5−0.03
−0.02
−0.01
0
0.01
0.02
time (nsecs)
Signature of R2M2 for 125ps D−Gaussian Pulse
Figure 6 Backscatter signaure (VV = HH) of a R2M" for 125ps D-Gaussian pulse at normal incidence in dry sand
It is well known, that the higher the bandwidth of the test signals the better the chance of target discrimination. There is however a trade off between discrimination behaviour and wave penetration into the soil particularly above 1 GHz the waves will be strongly attenuated in moist and salty soil.
In all cases, the spectral signature is a mixed 1st/2nd time derivative operation. Be-low 2GHz the target behaves like a volume dipole scatterer. Only above 2 GHz do we
D16pub_4.doc Copyright DEMINE partners 2002 17 Created on 15.10.02
The contents of this report represent the opinions of the DEMINE project partners
Investigation of electromagnetic scattering by mines 4
start to get useful specular information. A good A-scan target classification requires higher frequency information (2 - 5 GHz for example would be better than 0.3-3.3 GHz). This however supposes higher requirements to the hardware with respect to bandwidth and dynamic.
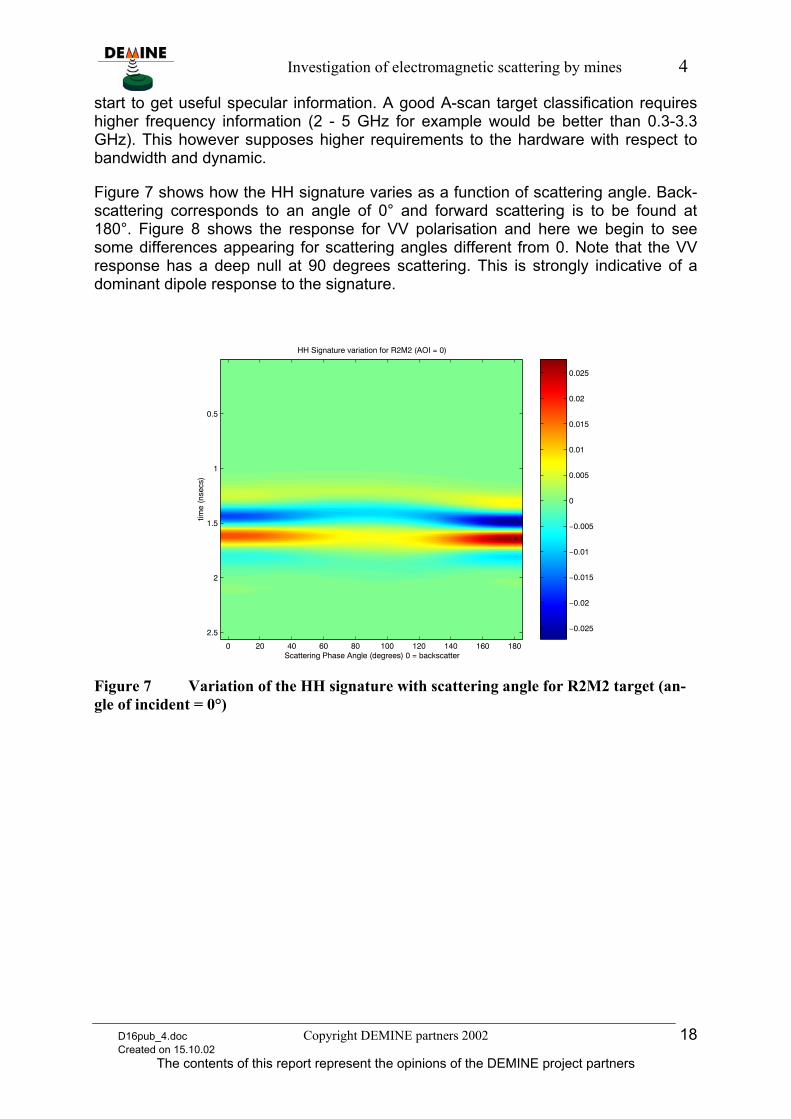
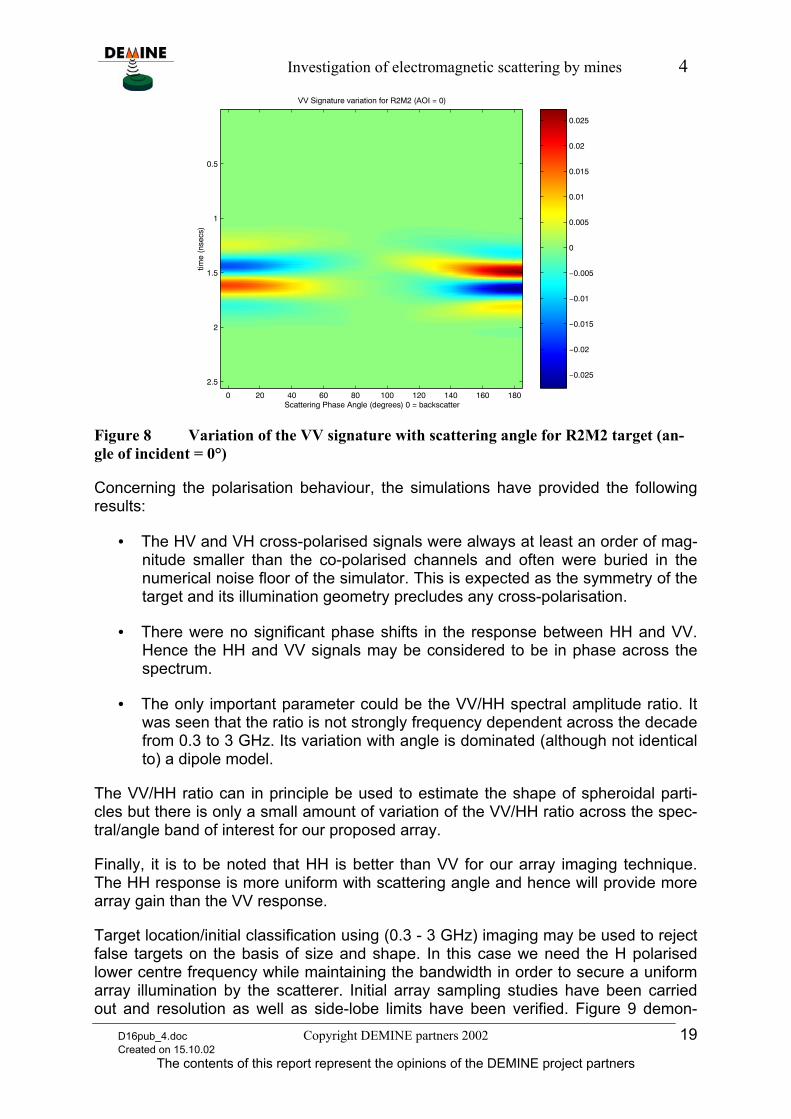
Figure 7 shows how the HH signature varies as a function of scattering angle. Back-scattering corresponds to an angle of 0° and forward scattering is to be found at 180°. Figure 8 shows the response for VV polarisation and here we begin to see some differences appearing for scattering angles different from 0. Note that the VV response has a deep null at 90 degrees scattering. This is strongly indicative of a dominant dipole response to the signature.
Scattering Phase Angle (degrees) 0 = backscatter
time
(nse
cs)
HH Signature variation for R2M2 (AOI = 0)
0 20 40 60 80 100 120 140 160 180
0.5
1
1.5
2
2.5 −0.025
−0.02
−0.015
−0.01
−0.005
0
0.005
0.01
0.015
0.02
0.025
Figure 7 Variation of the HH signature with scattering angle for R2M2 target (an-gle of incident = 0°)
D16pub_4.doc Copyright DEMINE partners 2002 18 Created on 15.10.02
The contents of this report represent the opinions of the DEMINE project partners
Investigation of electromagnetic scattering by mines 4
Scattering Phase Angle (degrees) 0 = backscatter
time
(nse
cs)
VV Signature variation for R2M2 (AOI = 0)
0 20 40 60 80 100 120 140 160 180
0.5
1
1.5
2
2.5−0.025
−0.02
−0.015
−0.01
−0.005
0
0.005
0.01
0.015
0.02
0.025
Figure 8 Variation of the VV signature with scattering angle for R2M2 target (an-gle of incident = 0°)
Concerning the polarisation behaviour, the simulations have provided the following results:
• The HV and VH cross-polarised signals were always at least an order of mag-nitude smaller than the co-polarised channels and often were buried in the numerical noise floor of the simulator. This is expected as the symmetry of the target and its illumination geometry precludes any cross-polarisation.
• There were no significant phase shifts in the response between HH and VV. Hence the HH and VV signals may be considered to be in phase across the spectrum.
• The only important parameter could be the VV/HH spectral amplitude ratio. It was seen that the ratio is not strongly frequency dependent across the decade from 0.3 to 3 GHz. Its variation with angle is dominated (although not identical to) a dipole model.
The VV/HH ratio can in principle be used to estimate the shape of spheroidal parti-cles but there is only a small amount of variation of the VV/HH ratio across the spec-tral/angle band of interest for our proposed array.
Finally, it is to be noted that HH is better than VV for our array imaging technique. The HH response is more uniform with scattering angle and hence will provide more array gain than the VV response.
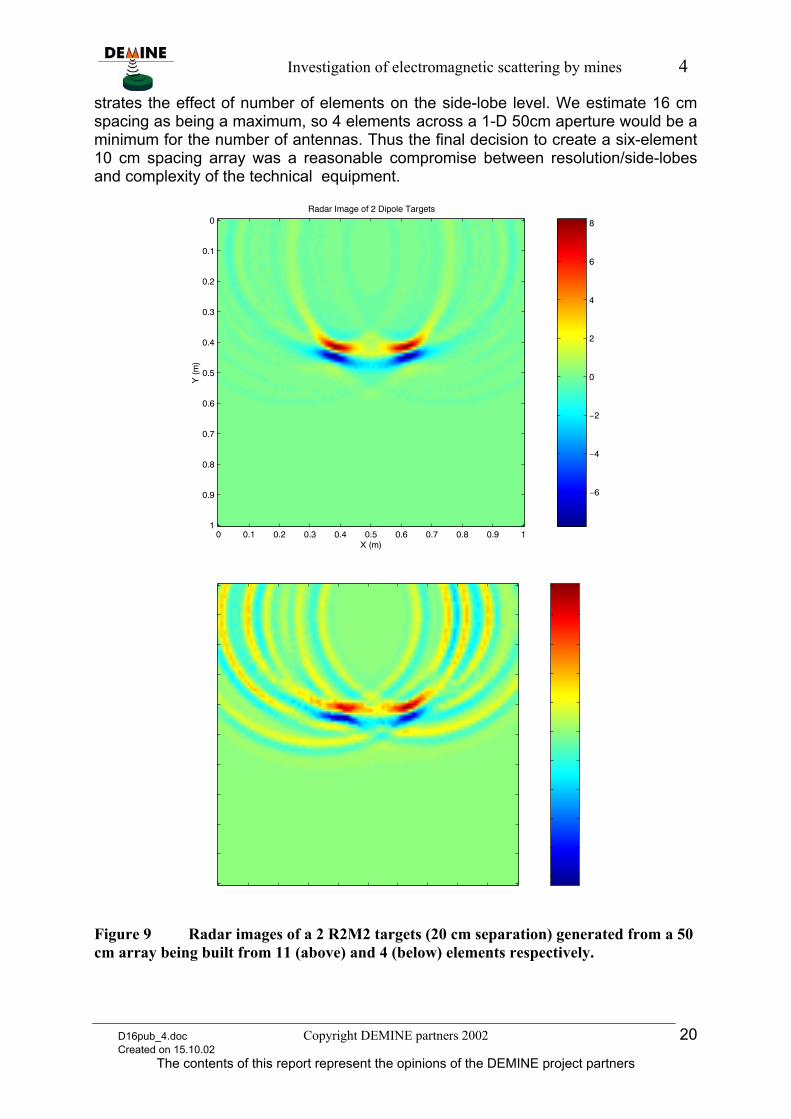
Target location/initial classification using (0.3 - 3 GHz) imaging may be used to reject false targets on the basis of size and shape. In this case we need the H polarised lower centre frequency while maintaining the bandwidth in order to secure a uniform array illumination by the scatterer. Initial array sampling studies have been carried out and resolution as well as side-lobe limits have been verified. Figure 9 demon-
D16pub_4.doc Copyright DEMINE partners 2002 19 Created on 15.10.02
The contents of this report represent the opinions of the DEMINE project partners
Investigation of electromagnetic scattering by mines 4
strates the effect of number of elements on the side-lobe level. We estimate 16 cm spacing as being a maximum, so 4 elements across a 1-D 50cm aperture would be a minimum for the number of antennas. Thus the final decision to create a six-element 10 cm spacing array was a reasonable compromise between resolution/side-lobes and complexity of the technical equipment.
X (m)
Y (
m)
Radar Image of 2 Dipole Targets
0 0.1 0.2 0.3 0.4 0.5 0.6 0.7 0.8 0.9 1
0
0.1
0.2
0.3
0.4
0.5
0.6
0.7
0.8
0.9
1
−6
−4
−2
0
2
4
6
8
X (m)
Y (
m)
Radar Image of 2 Dipole Targets
0 0.1 0.2 0.3 0.4 0.5 0.6 0.7 0.8 0.9 1
0
0.1
0.2
0.3
0.4
0.5
0.6
0.7
0.8
0.9
1−1
−0.8
−0.6
−0.4
−0.2
0
0.2
0.4
0.6
0.8
1
Figure 9 Radar images of a 2 R2M2 targets (20 cm separation) generated from a 50 cm array being built from 11 (above) and 4 (below) elements respectively.
D16pub_4.doc Copyright DEMINE partners 2002 20 Created on 15.10.02
The contents of this report represent the opinions of the DEMINE project partners
Investigation of electromagnetic scattering by mines 4
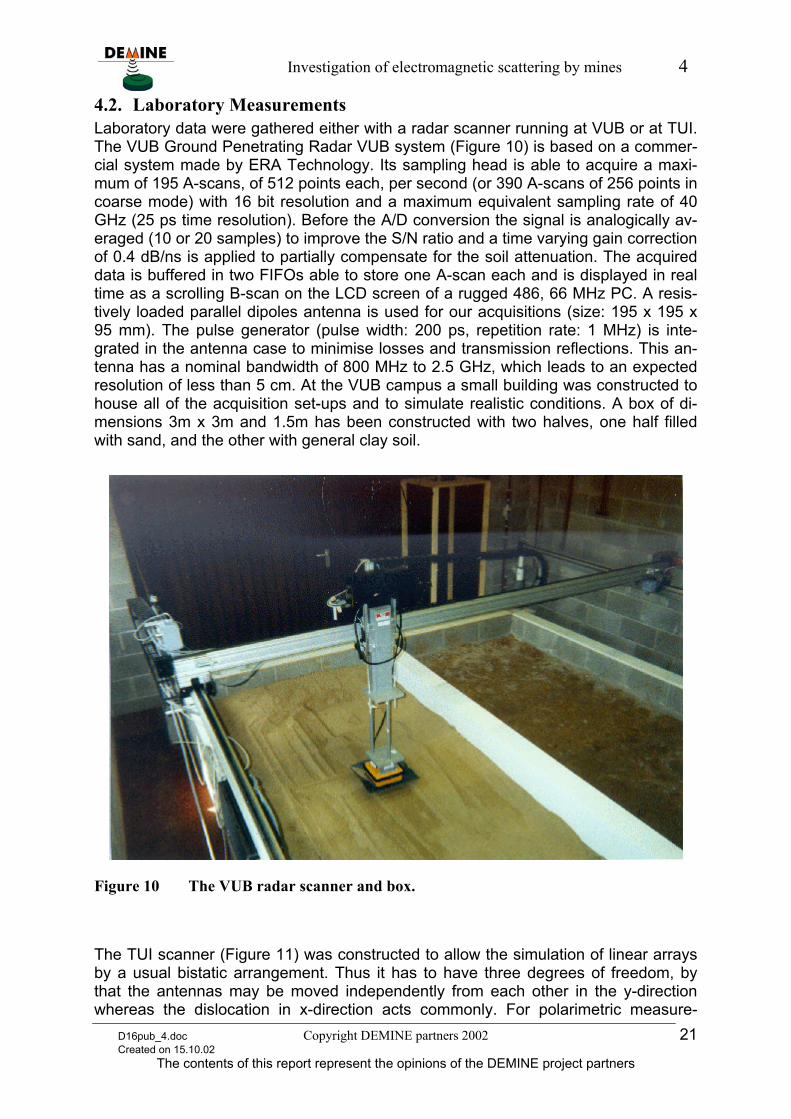
4.2. Laboratory Measurements Laboratory data were gathered either with a radar scanner running at VUB or at TUI. The VUB Ground Penetrating Radar VUB system (Figure 10) is based on a commer-cial system made by ERA Technology. Its sampling head is able to acquire a maxi-mum of 195 A-scans, of 512 points each, per second (or 390 A-scans of 256 points in coarse mode) with 16 bit resolution and a maximum equivalent sampling rate of 40 GHz (25 ps time resolution). Before the A/D conversion the signal is analogically av-eraged (10 or 20 samples) to improve the S/N ratio and a time varying gain correction of 0.4 dB/ns is applied to partially compensate for the soil attenuation. The acquired data is buffered in two FIFOs able to store one A-scan each and is displayed in real time as a scrolling B-scan on the LCD screen of a rugged 486, 66 MHz PC. A resis-tively loaded parallel dipoles antenna is used for our acquisitions (size: 195 x 195 x 95 mm). The pulse generator (pulse width: 200 ps, repetition rate: 1 MHz) is inte-grated in the antenna case to minimise losses and transmission reflections. This an-tenna has a nominal bandwidth of 800 MHz to 2.5 GHz, which leads to an expected resolution of less than 5 cm. At the VUB campus a small building was constructed to house all of the acquisition set-ups and to simulate realistic conditions. A box of di-mensions 3m x 3m and 1.5m has been constructed with two halves, one half filled with sand, and the other with general clay soil.
Figure 10 The VUB radar scanner and box.
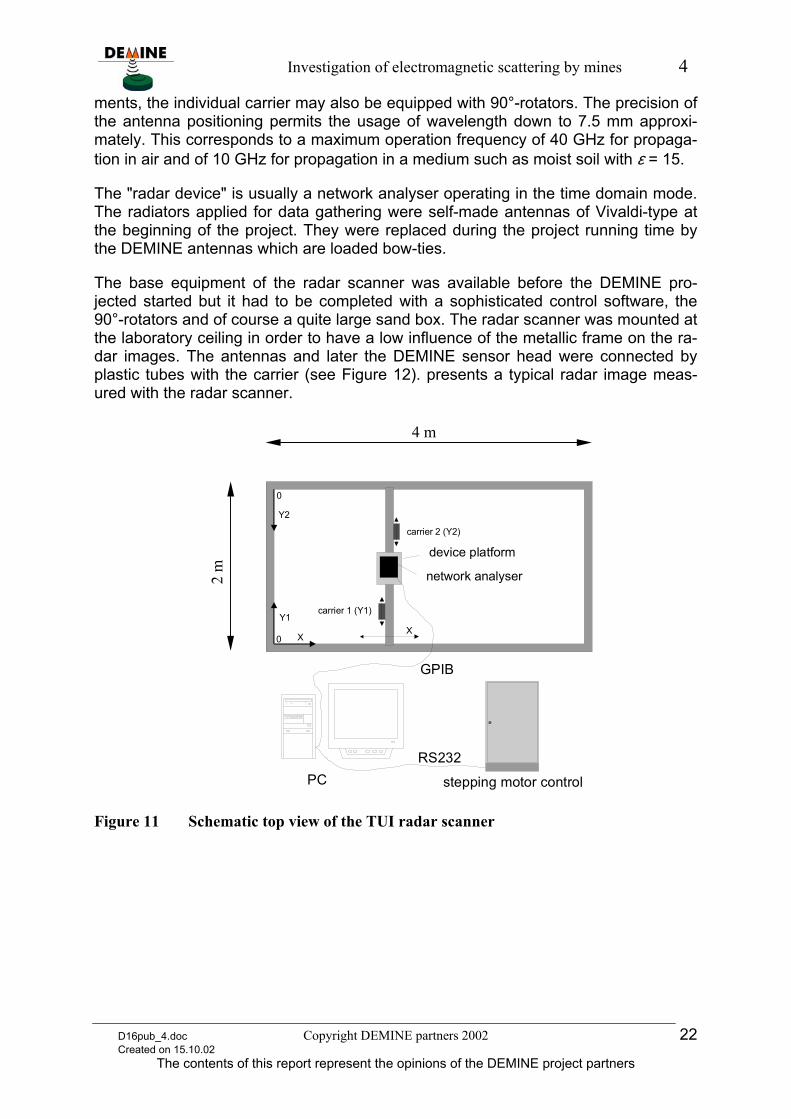
The TUI scanner (Figure 11) was constructed to allow the simulation of linear arrays by a usual bistatic arrangement. Thus it has to have three degrees of freedom, by that the antennas may be moved independently from each other in the y-direction whereas the dislocation in x-direction acts commonly. For polarimetric measure-
D16pub_4.doc Copyright DEMINE partners 2002 21 Created on 15.10.02
The contents of this report represent the opinions of the DEMINE project partners
Investigation of electromagnetic scattering by mines 4
ments, the individual carrier may also be equipped with 90°-rotators. The precision of the antenna positioning permits the usage of wavelength down to 7.5 mm approxi-mately. This corresponds to a maximum operation frequency of 40 GHz for propaga-tion in air and of 10 GHz for propagation in a medium such as moist soil with ε = 15.
The "radar device" is usually a network analyser operating in the time domain mode. The radiators applied for data gathering were self-made antennas of Vivaldi-type at the beginning of the project. They were replaced during the project running time by the DEMINE antennas which are loaded bow-ties.
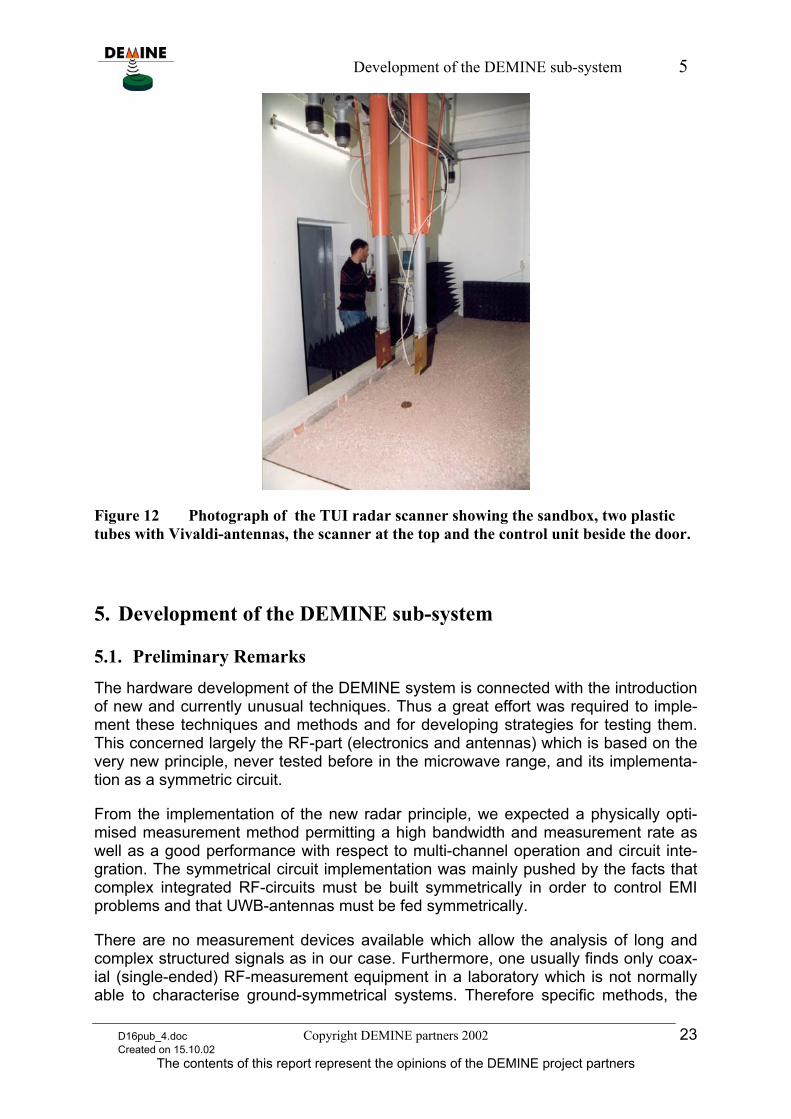
The base equipment of the radar scanner was available before the DEMINE pro-jected started but it had to be completed with a sophisticated control software, the 90°-rotators and of course a quite large sand box. The radar scanner was mounted at the laboratory ceiling in order to have a low influence of the metallic frame on the ra-dar images. The antennas and later the DEMINE sensor head were connected by plastic tubes with the carrier (see Figure 12). presents a typical radar image meas-ured with the radar scanner.
Y2
Y1
X0
0
carrier 2 (Y2)
carrier 1 (Y1)
X
RS232
stepping motor controlPC
GPIB
device platform
network analyser
4 m
2 m
Figure 11 Schematic top view of the TUI radar scanner
D16pub_4.doc Copyright DEMINE partners 2002 22 Created on 15.10.02
The contents of this report represent the opinions of the DEMINE project partners
Development of the DEMINE sub-system 5
Figure 12 Photograph of the TUI radar scanner showing the sandbox, two plastic tubes with Vivaldi-antennas, the scanner at the top and the control unit beside the door.
5. Development of the DEMINE sub-system
5.1. Preliminary Remarks
The hardware development of the DEMINE system is connected with the introduction of new and currently unusual techniques. Thus a great effort was required to imple-ment these techniques and methods and for developing strategies for testing them. This concerned largely the RF-part (electronics and antennas) which is based on the very new principle, never tested before in the microwave range, and its implementa-tion as a symmetric circuit.
From the implementation of the new radar principle, we expected a physically opti-mised measurement method permitting a high bandwidth and measurement rate as well as a good performance with respect to multi-channel operation and circuit inte-gration. The symmetrical circuit implementation was mainly pushed by the facts that complex integrated RF-circuits must be built symmetrically in order to control EMI problems and that UWB-antennas must be fed symmetrically.
There are no measurement devices available which allow the analysis of long and complex structured signals as in our case. Furthermore, one usually finds only coax-ial (single-ended) RF-measurement equipment in a laboratory which is not normally able to characterise ground-symmetrical systems. Therefore specific methods, the
D16pub_4.doc Copyright DEMINE partners 2002 23 Created on 15.10.02
The contents of this report represent the opinions of the DEMINE project partners
Development of the DEMINE sub-system 5
so-called modal decomposition – must be introduced in order to investigate the an-tennas and RF-chips.
The high data rates within the digital system – mainly the ADC and the following stages – also required special and sophisticated test methods.
5.2. Antenna
The antenna solution is critical to the DEMINE SPR device in that it must transmit a faithful version of the pseudo-random signal generated by the radar chip. The im-pulse response function (IRF) of the antenna must be as short as possible such kind of antennas are called impulse radiating antenna (IRA). The antenna elements were required to be compact and lightweight, for handheld sensor operation. Techniques spun-off from printed circuit manufacture were to be used in order to keep the com-plexity and costs low. The following specifications were placed on the antenna ele-ments:
• Instantaneous Bandwidth: 1-4 GHz • Balanced Feed Impedance: 100 Ohms • Reflection Co-efficient: <-15dB across the band • Radiated Beamwidth: >±45 degrees • Dimensions: <10cm diameter
D16pub_4.doc Copyright DEMINE partners 2002 24 Created on 15.10.02
The contents of this report represent the opinions of the DEMINE project partners
Development of the DEMINE sub-system 5
50 cm
32 cm10 cm
ComputationalBoundaries
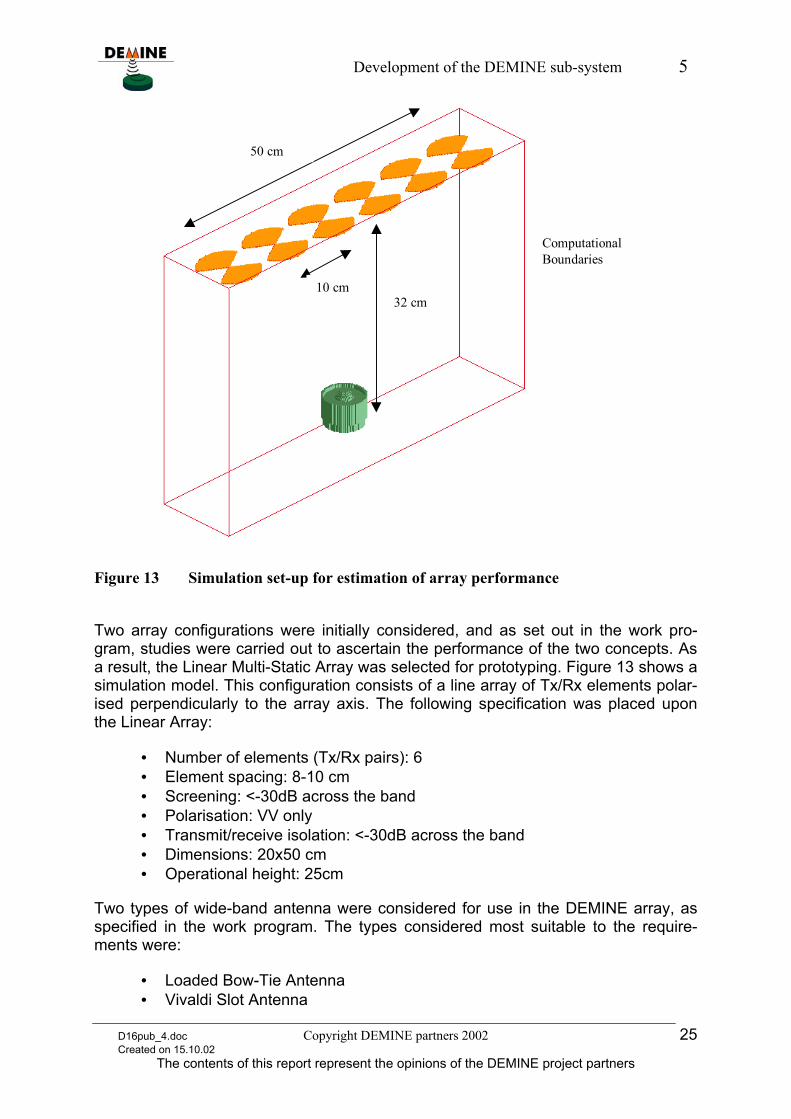
Figure 13 Simulation set-up for estimation of array performance
Two array configurations were initially considered, and as set out in the work pro-gram, studies were carried out to ascertain the performance of the two concepts. As a result, the Linear Multi-Static Array was selected for prototyping. Figure 13 shows a simulation model. This configuration consists of a line array of Tx/Rx elements polar-ised perpendicularly to the array axis. The following specification was placed upon the Linear Array:
• Number of elements (Tx/Rx pairs): 6 • Element spacing: 8-10 cm • Screening: <-30dB across the band • Polarisation: VV only • Transmit/receive isolation: <-30dB across the band • Dimensions: 20x50 cm • Operational height: 25cm
Two types of wide-band antenna were considered for use in the DEMINE array, as specified in the work program. The types considered most suitable to the require-ments were:
• Loaded Bow-Tie Antenna • Vivaldi Slot Antenna
D16pub_4.doc Copyright DEMINE partners 2002 25 Created on 15.10.02
The contents of this report represent the opinions of the DEMINE project partners
Development of the DEMINE sub-system 5
The Loaded Bow Tie would require distributed resistive loading to obtain the required bandwidth of operation. The Vivaldi Slot antenna offered simple manufacturing and better efficiency. However, measurements showed that the temporal dispersion and impedance variation across the bandwidth introduced by this type of antenna were too great and the specification could not be satisfied.
The Loaded Bow-Tie (LBT) solution was therefore pursued as the best route to satis-fying the specification. In order that the bandwidth and impedance were optimised, numerical modelling techniques were used to produce a design for the resistive load-ing on the antenna. Further modelling work was then carried out to ascertain whether the screening and isolation requirements could be satisfied.
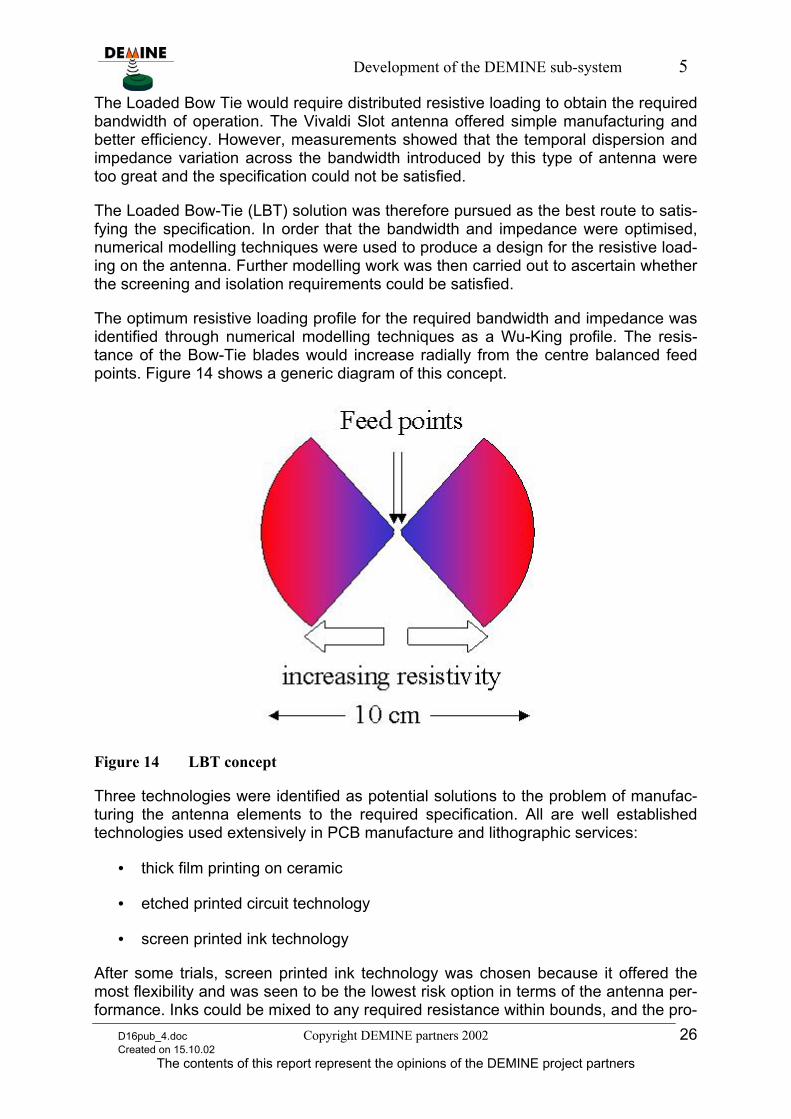
The optimum resistive loading profile for the required bandwidth and impedance was identified through numerical modelling techniques as a Wu-King profile. The resis-tance of the Bow-Tie blades would increase radially from the centre balanced feed points. Figure 14 shows a generic diagram of this concept.
Figure 14 LBT concept
Three technologies were identified as potential solutions to the problem of manufac-turing the antenna elements to the required specification. All are well established technologies used extensively in PCB manufacture and lithographic services:
• thick film printing on ceramic
• etched printed circuit technology
• screen printed ink technology
After some trials, screen printed ink technology was chosen because it offered the most flexibility and was seen to be the lowest risk option in terms of the antenna per-formance. Inks could be mixed to any required resistance within bounds, and the pro-
D16pub_4.doc Copyright DEMINE partners 2002 26 Created on 15.10.02
The contents of this report represent the opinions of the DEMINE project partners
Development of the DEMINE sub-system 5
file could be built up from many layers, thus eliminating the possibility of inter-segment discontinuities.
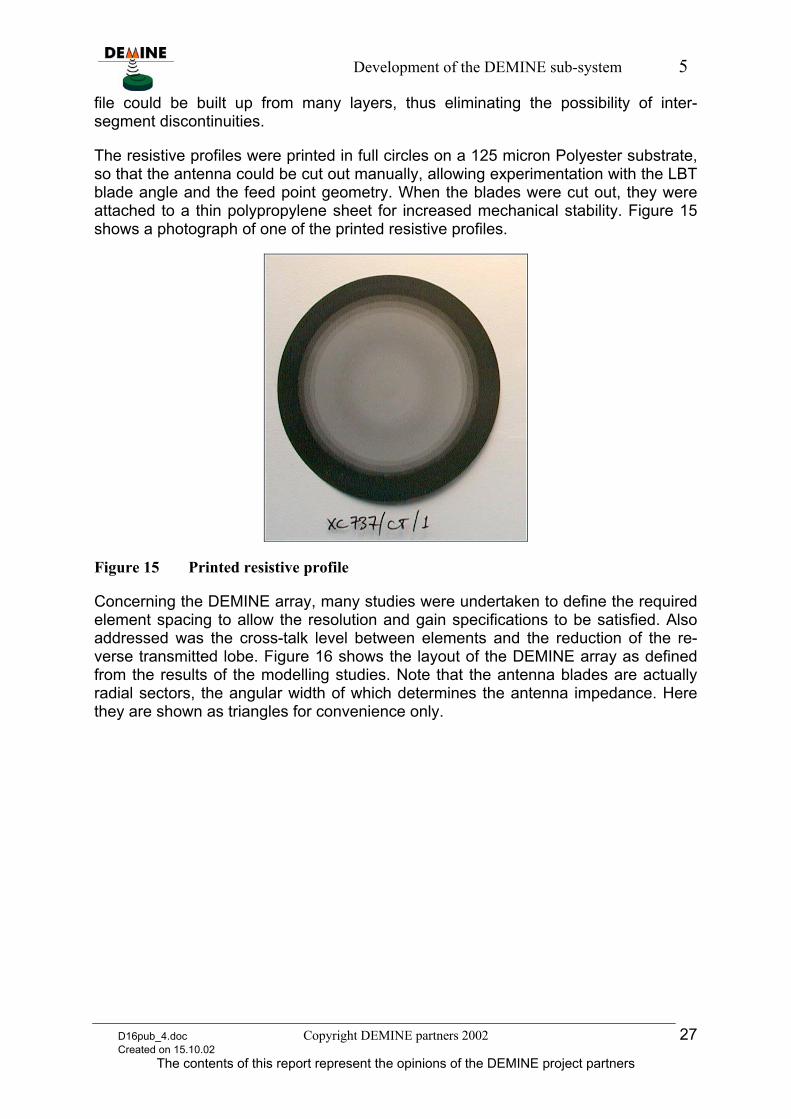
The resistive profiles were printed in full circles on a 125 micron Polyester substrate, so that the antenna could be cut out manually, allowing experimentation with the LBT blade angle and the feed point geometry. When the blades were cut out, they were attached to a thin polypropylene sheet for increased mechanical stability. Figure 15 shows a photograph of one of the printed resistive profiles.
Figure 15 Printed resistive profile
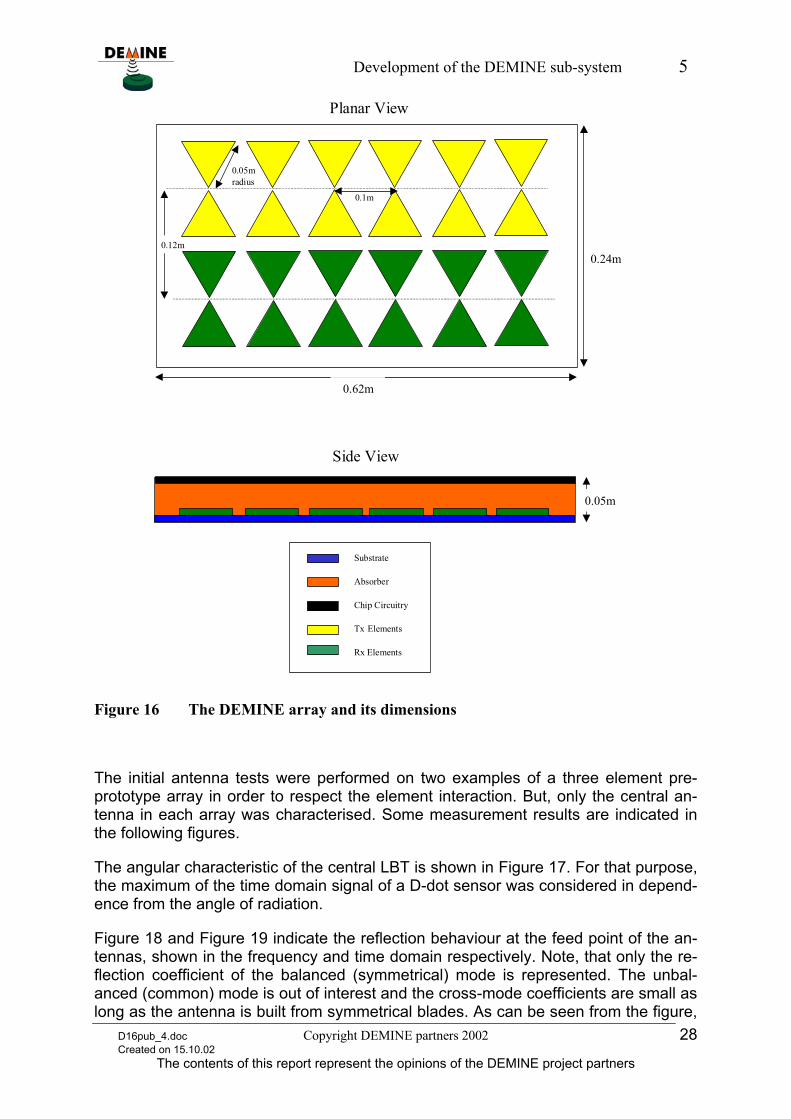
Concerning the DEMINE array, many studies were undertaken to define the required element spacing to allow the resolution and gain specifications to be satisfied. Also addressed was the cross-talk level between elements and the reduction of the re-verse transmitted lobe. Figure 16 shows the layout of the DEMINE array as defined from the results of the modelling studies. Note that the antenna blades are actually radial sectors, the angular width of which determines the antenna impedance. Here they are shown as triangles for convenience only.
D16pub_4.doc Copyright DEMINE partners 2002 27 Created on 15.10.02
The contents of this report represent the opinions of the DEMINE project partners
Development of the DEMINE sub-system 5
0.24m
0.1m
0.12m
0.62m
0.05mradius
0.05m
Side View
Planar View
Substrate
Absorber
Chip Circuitry
Tx Elements
Rx Elements
Figure 16 The DEMINE array and its dimensions
The initial antenna tests were performed on two examples of a three element pre-prototype array in order to respect the element interaction. But, only the central an-tenna in each array was characterised. Some measurement results are indicated in the following figures.
The angular characteristic of the central LBT is shown in Figure 17. For that purpose, the maximum of the time domain signal of a D-dot sensor was considered in depend-ence from the angle of radiation.
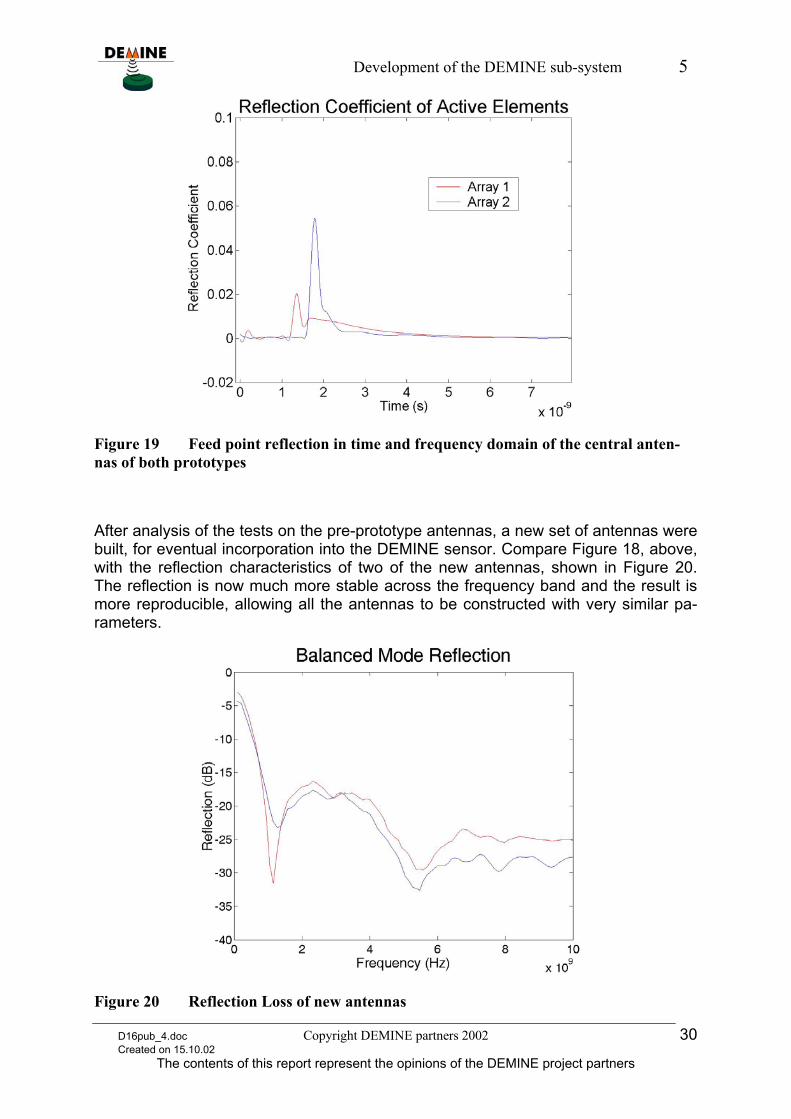
Figure 18 and Figure 19 indicate the reflection behaviour at the feed point of the an-tennas, shown in the frequency and time domain respectively. Note, that only the re-flection coefficient of the balanced (symmetrical) mode is represented. The unbal-anced (common) mode is out of interest and the cross-mode coefficients are small as long as the antenna is built from symmetrical blades. As can be seen from the figure,
D16pub_4.doc Copyright DEMINE partners 2002 28 Created on 15.10.02
The contents of this report represent the opinions of the DEMINE project partners
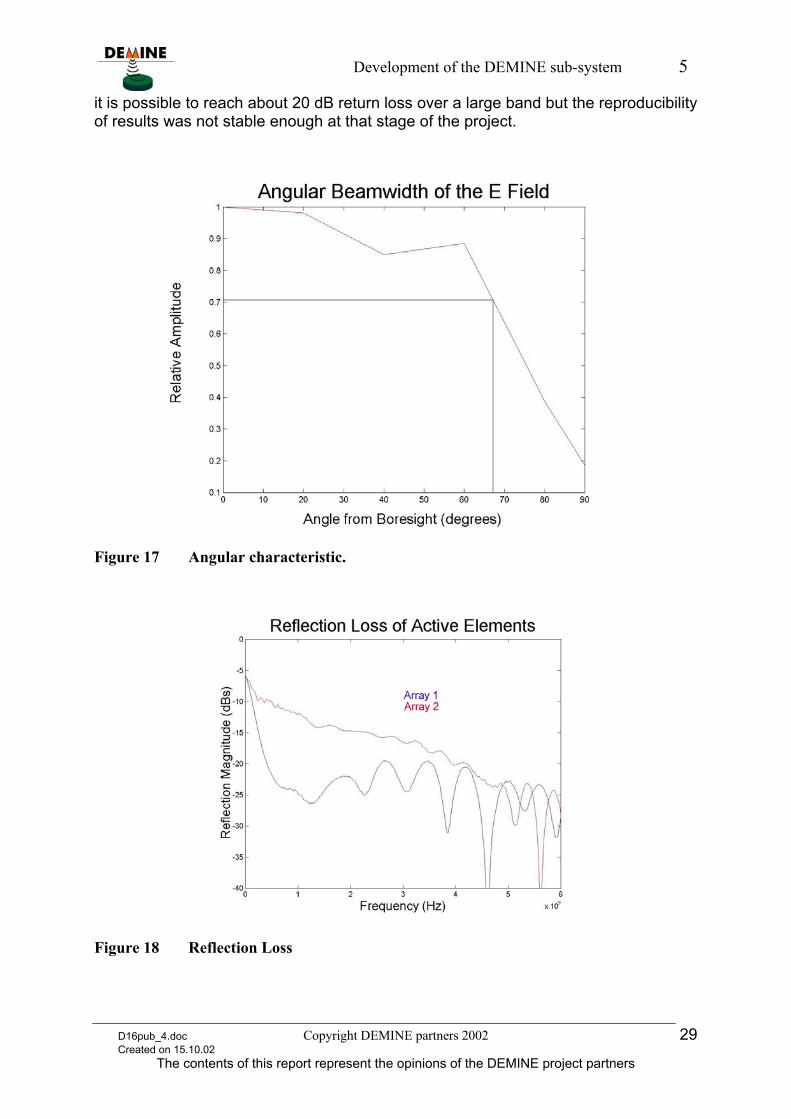
Development of the DEMINE sub-system 5
it is possible to reach about 20 dB return loss over a large band but the reproducibility of results was not stable enough at that stage of the project.
Figure 17 Angular characteristic.
Figure 18 Reflection Loss
D16pub_4.doc Copyright DEMINE partners 2002 29 Created on 15.10.02
The contents of this report represent the opinions of the DEMINE project partners
Development of the DEMINE sub-system 5
Figure 19 Feed point reflection in time and frequency domain of the central anten-nas of both prototypes
After analysis of the tests on the pre-prototype antennas, a new set of antennas were built, for eventual incorporation into the DEMINE sensor. Compare Figure 18, above, with the reflection characteristics of two of the new antennas, shown in Figure 20. The reflection is now much more stable across the frequency band and the result is more reproducible, allowing all the antennas to be constructed with very similar pa-rameters.
Figure 20 Reflection Loss of new antennas
D16pub_4.doc Copyright DEMINE partners 2002 30 Created on 15.10.02
The contents of this report represent the opinions of the DEMINE project partners
Development of the DEMINE sub-system 5
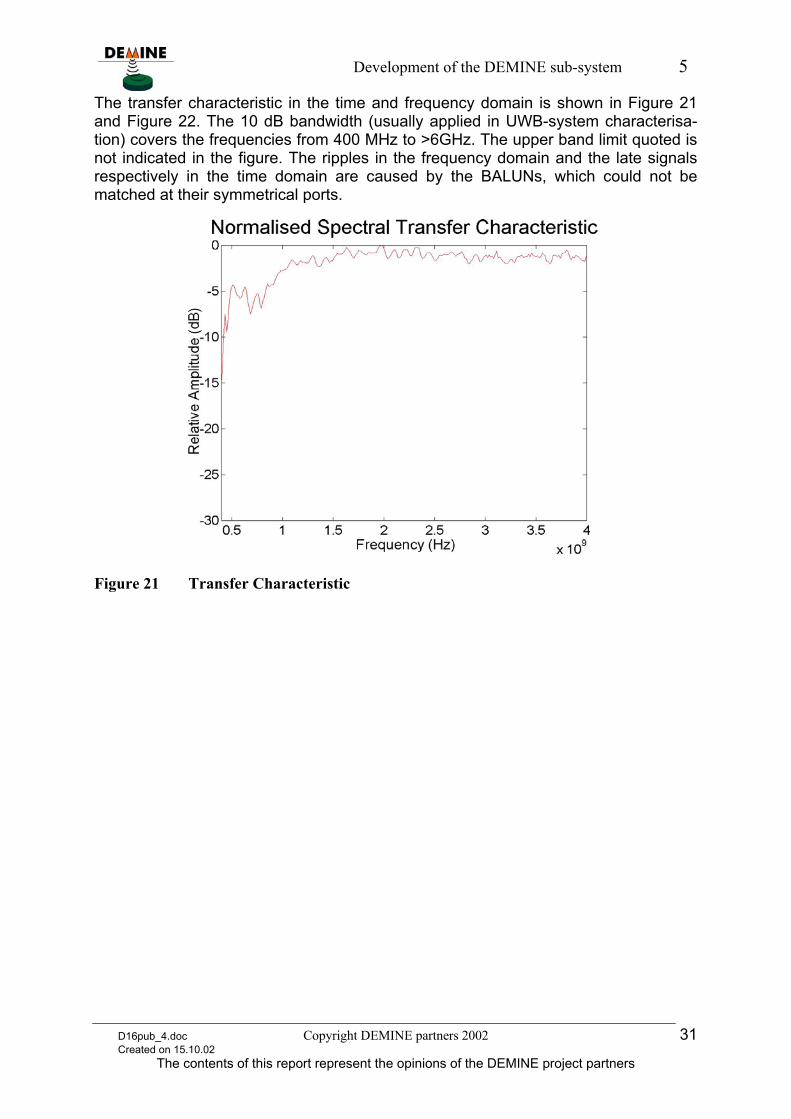
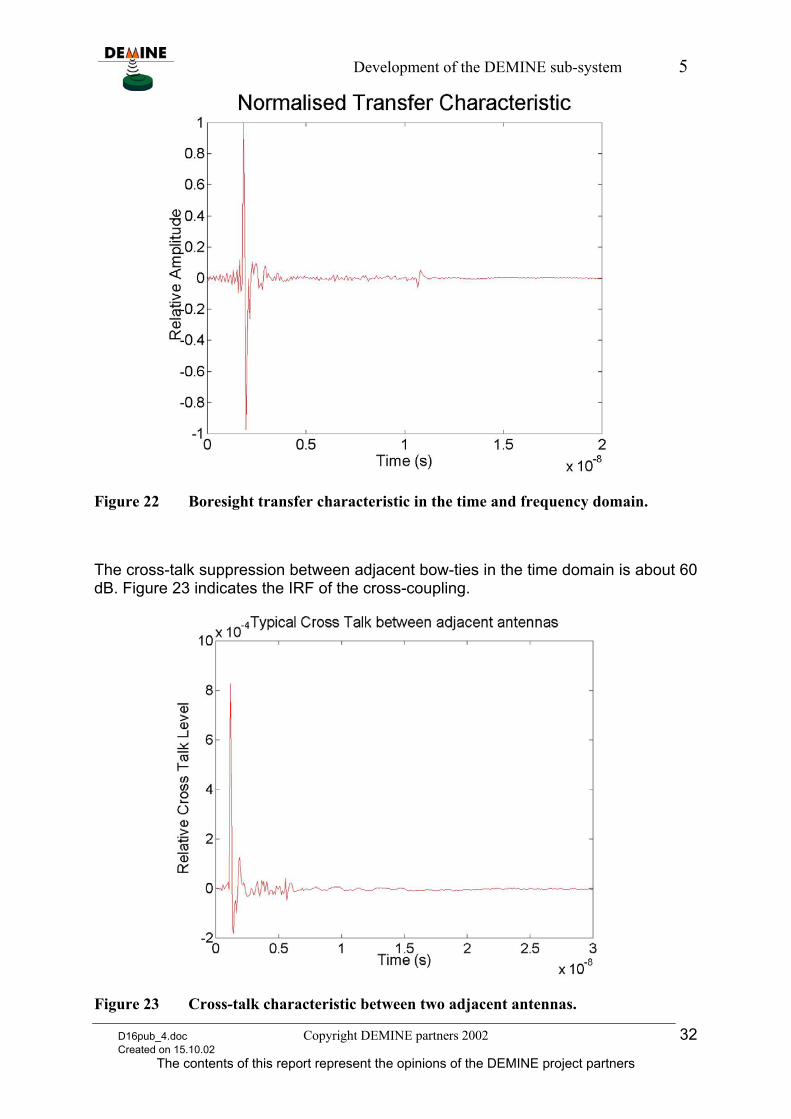
The transfer characteristic in the time and frequency domain is shown in Figure 21 and Figure 22. The 10 dB bandwidth (usually applied in UWB-system characterisa-tion) covers the frequencies from 400 MHz to >6GHz. The upper band limit quoted is not indicated in the figure. The ripples in the frequency domain and the late signals respectively in the time domain are caused by the BALUNs, which could not be matched at their symmetrical ports.
Figure 21 Transfer Characteristic
D16pub_4.doc Copyright DEMINE partners 2002 31 Created on 15.10.02
The contents of this report represent the opinions of the DEMINE project partners
Development of the DEMINE sub-system 5
Figure 22 Boresight transfer characteristic in the time and frequency domain.
The cross-talk suppression between adjacent bow-ties in the time domain is about 60 dB. Figure 23 indicates the IRF of the cross-coupling.
Figure 23 Cross-talk characteristic between two adjacent antennas.
D16pub_4.doc Copyright DEMINE partners 2002 32 Created on 15.10.02
The contents of this report represent the opinions of the DEMINE project partners
Development of the DEMINE sub-system 5
The results are good and show that the designed antennas and the array layout meets the specification laid down for the DEMINE device but these results should not deceive the reader into thinking that the efficiency of IRAs is always low by the physi-cal nature of such radiators. The stringent requirements placed on the antennas for the DEMINE system means that a matching network is required between the antenna and the drive circuitry so as not to compromise other parameters such as beamwidth and physical size. Thus, the efficiency of these particular antennas is reduced from that which would normally be achievable.
These antennas may be exploited also for many other applications such as UWB-micro wave imaging and surveillance. The weight of the antenna arrangement is mainly determined by the absorber material. It may be further reduced by replacing the commercial absorbing foam by a custom designed Styrofoam based absorber but such a design is not currently available so that further experiments are needed to develop it.
D16pub_4.doc Copyright DEMINE partners 2002 33 Created on 15.10.02
The contents of this report represent the opinions of the DEMINE project partners
Development of the DEMINE sub-system 5
5.3. Radar Electronics
One of the key components of a SPR-Mine detector is its radar electronics. Today’s UWB-systems used in short range high resolution radar devices such as mine detec-tors work mostly either as pulse radar or in a sine-wave mode. These systems do not operate in an optimum manner either seen from the system theory or from the view point of system implementation.
The basic idea converted into the DEMINE electronics has been known for a long time (although never used for SPR) and has been applied in many of the long range radar systems. It consists in spreading the transmitter energy in time in order to get a high signal energy at a low peak power. The receiver for its part compresses the cap-tured signal by matched filtering or correlation in order to achieve high spatial resolu-tion.
The same is undertaken by the DEMINE radar. The novelty is however to be seen in the fact that it has succeeded for the first time in applying impulse compression tech-niques to signals having a bandwidth extending the GHz limit. The trick is to build as much of the radar electronics as possible from digital circuits – even in the RF- and IF-parts – so that software dominates the measurement function to a large extent. This provides for:
• high flexibility in the system conception,
• high stability in the system parameters,
• extremely high measurement rate,
• integration friendly manufacturing and many others advantages.
Starting with the theoretical based system conception of a new UWB-principle at the beginning of the DEMINE project, the radar electronics was successfully designed and tested within only two years. Some parts of the radar electronics was imple-mented into customer integrated semiconductor chips. The initially preferred GaAs based chip integration was changed in order to benefit from the newer, cheaper and strongly pushed SiGe-technology. The potential of the SiGe technology is to been seen in its ability to create low noise RF-transistors with moderate power consump-tion and moderate prices – a must for hand held mine detectors.
Through the integrated electronics and the cost effective manufacture, the new UWB-principle in connection with the new semiconductor technology enables a great deal of new and still unknown applications in the field of microwave measurements, radar sensors, microwave imaging, impurity sensors, medical sensors, surveillance sen-sors – a current problem of tragic importance - and many others such as ultra-wideband communications.
We believe that the new integrated UWB-technology will open the door to the indus-trial application of a great deal of RF- and microwave sensors on a large scale, since expensive and heavy devices such as network analysers may be replaced by a few SiGe chips and some commercially available low cost digital circuits. Another practi-
D16pub_4.doc Copyright DEMINE partners 2002 34 Created on 16.10.02
The contents of this report represent the opinions of the DEMINE project partners
Development of the DEMINE sub-system 5
cally important aspect is that mainly the software running onto the measurement head determines the measurement principle (i.e. time domain or frequency domain measurement). We call it SDM – software defined measurement. Thus without changing any hardware, the measurement head may be applied for a great deal of different tasks by adapting the software only.
Within the last year, a discussion about ultra-wideband communication has also started in Europe. By that one tries to overcome the limited resources of free fre-quency band for new applications and to avoid problems of data communication within closed spaces and of short distances. As known from the still unpublished "book of vision" of the WWRF (Wireless World Research Forum), the pioneers of that technique are to be found in the US. Two of the few European enterprise and institu-tion which have practical experiences with such technology are MEODAT and TUI. Where as their concept is superior to other known principles if one believes the judge of a large American enterprise which is engaged in corresponding developments.
In what follows, a short overview about the conception, the development procedure and the main results shall be given. The reader may find more detailed information in corresponding DEMINE reports and conference publications.
5.3.1. Conception of UWB-radar head
The key to an UWB software radar is the choice of an appropriate stimulation signal because the whole device structure depends upon it. The most important demands directly influenced by the stimulus are summarised by the following points:
• Spread spectrum signal
• Low crest factor signal
• Simple generation in the RF- and microwave domain
• Periodic signal to perform under-sampling and synchronous averaging
• Simple synchronisation of sampling clock
• Fast and simple signal processing algorithms to perform impulse compression or corresponding operations
• High immunity against EMI
Pseudo random codes especially the Maximum Length Binary Sequence meet all these requirements.
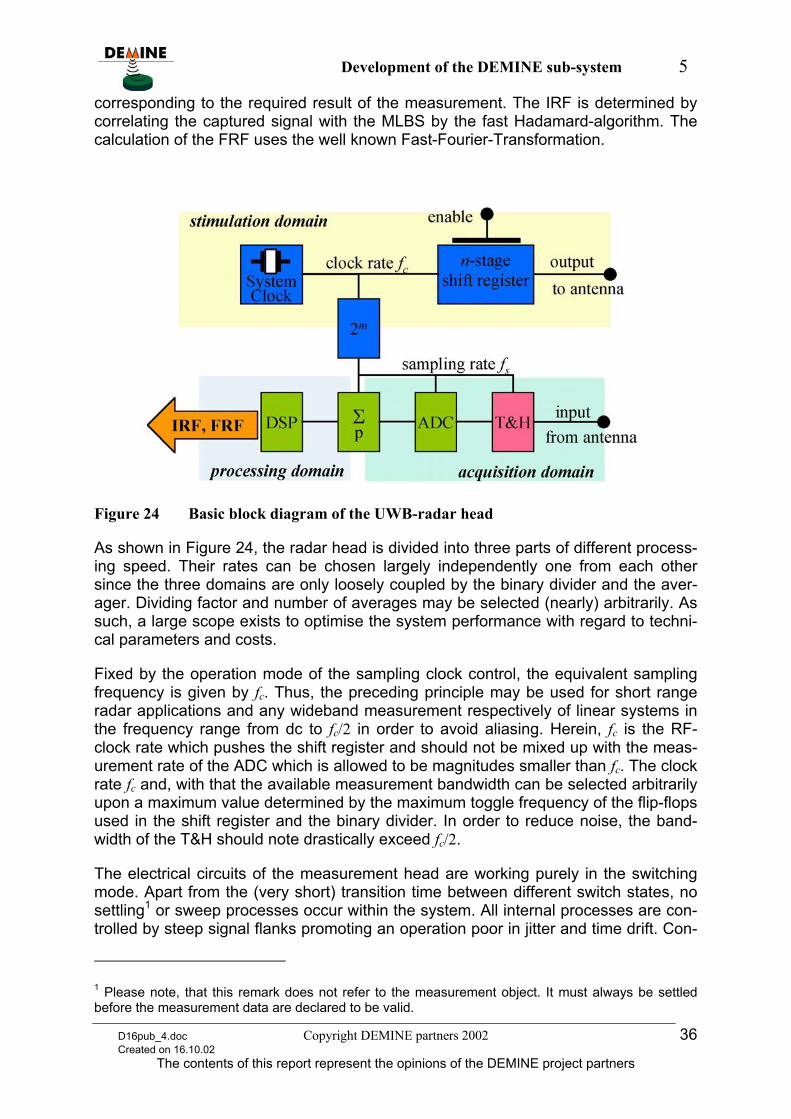
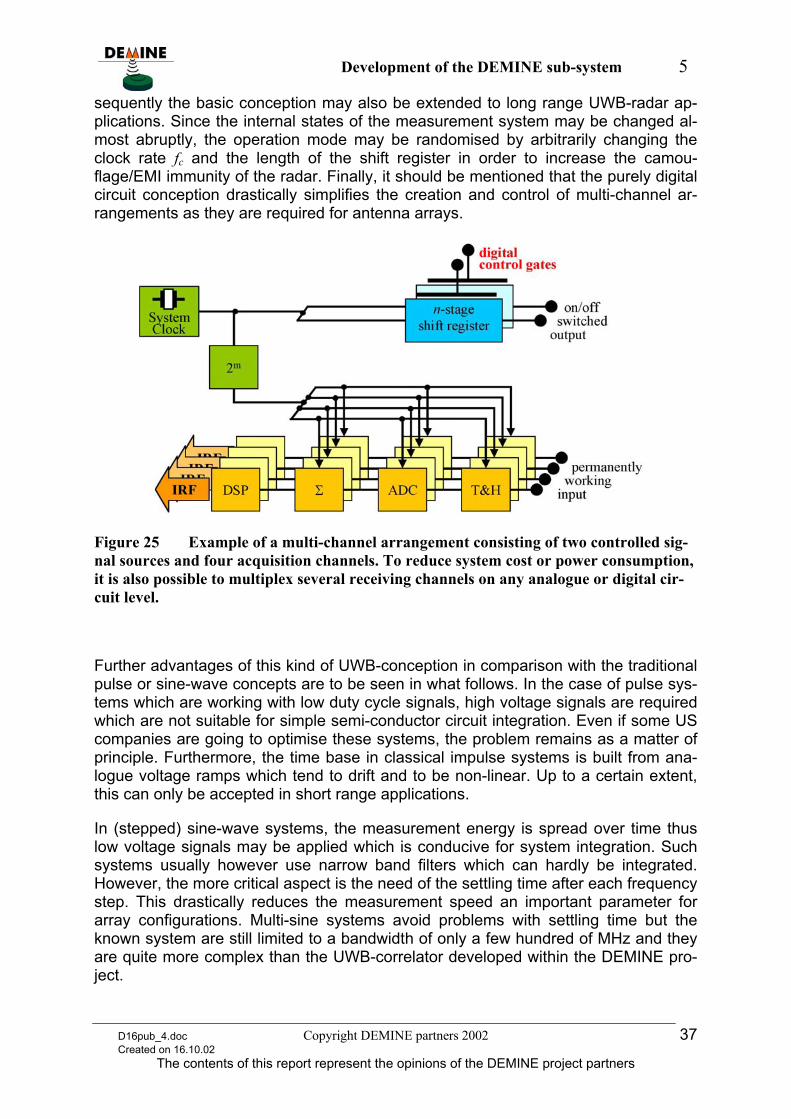
Figure 24 summarises the basic components of the base band variant of the MLBS radar head how it is applied in the DEMINE system. Controlled by a single tone clock, a digital shift register generates the MLBS signal and a binary divider (2m) provides the sampling clock. The measurement data are captured by a T&H-circuit, trans-formed into the digital domain (ADC), synchronously averaged (Σ) and finally proc-essed (DSP) in an appropriate manner. Usually the DSP calculates the impulse re-sponse function (IRF) for example, the frequency response function (FRF) or others
D16pub_4.doc Copyright DEMINE partners 2002 35 Created on 16.10.02
The contents of this report represent the opinions of the DEMINE project partners
Development of the DEMINE sub-system 5
corresponding to the required result of the measurement. The IRF is determined by correlating the captured signal with the MLBS by the fast Hadamard-algorithm. The calculation of the FRF uses the well known Fast-Fourier-Transformation.
Figure 24 Basic block diagram of the UWB-radar head
As shown in Figure 24, the radar head is divided into three parts of different process-ing speed. Their rates can be chosen largely independently one from each other since the three domains are only loosely coupled by the binary divider and the aver-ager. Dividing factor and number of averages may be selected (nearly) arbitrarily. As such, a large scope exists to optimise the system performance with regard to techni-cal parameters and costs.
Fixed by the operation mode of the sampling clock control, the equivalent sampling frequency is given by fc. Thus, the preceding principle may be used for short range radar applications and any wideband measurement respectively of linear systems in the frequency range from dc to fc/2 in order to avoid aliasing. Herein, fc is the RF-clock rate which pushes the shift register and should not be mixed up with the meas-urement rate of the ADC which is allowed to be magnitudes smaller than fc. The clock rate fc and, with that the available measurement bandwidth can be selected arbitrarily upon a maximum value determined by the maximum toggle frequency of the flip-flops used in the shift register and the binary divider. In order to reduce noise, the band-width of the T&H should note drastically exceed fc/2.
The electrical circuits of the measurement head are working purely in the switching mode. Apart from the (very short) transition time between different switch states, no settling1 or sweep processes occur within the system. All internal processes are con-trolled by steep signal flanks promoting an operation poor in jitter and time drift. Con-
1 Please note, that this remark does not refer to the measurement object. It must always be settled before the measurement data are declared to be valid.
D16pub_4.doc Copyright DEMINE partners 2002 36 Created on 16.10.02
The contents of this report represent the opinions of the DEMINE project partners
Development of the DEMINE sub-system 5
sequently the basic conception may also be extended to long range UWB-radar ap-plications. Since the internal states of the measurement system may be changed al-most abruptly, the operation mode may be randomised by arbitrarily changing the clock rate fc and the length of the shift register in order to increase the camou-flage/EMI immunity of the radar. Finally, it should be mentioned that the purely digital circuit conception drastically simplifies the creation and control of multi-channel ar-rangements as they are required for antenna arrays.
Figure 25 Example of a multi-channel arrangement consisting of two controlled sig-nal sources and four acquisition channels. To reduce system cost or power consumption, it is also possible to multiplex several receiving channels on any analogue or digital cir-cuit level.
Further advantages of this kind of UWB-conception in comparison with the traditional pulse or sine-wave concepts are to be seen in what follows. In the case of pulse sys-tems which are working with low duty cycle signals, high voltage signals are required which are not suitable for simple semi-conductor circuit integration. Even if some US companies are going to optimise these systems, the problem remains as a matter of principle. Furthermore, the time base in classical impulse systems is built from ana-logue voltage ramps which tend to drift and to be non-linear. Up to a certain extent, this can only be accepted in short range applications.
In (stepped) sine-wave systems, the measurement energy is spread over time thus low voltage signals may be applied which is conducive for system integration. Such systems usually however use narrow band filters which can hardly be integrated. However, the more critical aspect is the need of the settling time after each frequency step. This drastically reduces the measurement speed an important parameter for array configurations. Multi-sine systems avoid problems with settling time but the known system are still limited to a bandwidth of only a few hundred of MHz and they are quite more complex than the UWB-correlator developed within the DEMINE pro-ject.
D16pub_4.doc Copyright DEMINE partners 2002 37 Created on 16.10.02
The contents of this report represent the opinions of the DEMINE project partners
Development of the DEMINE sub-system 5
The UWB-radar head works with low level UWB-signals spreading their energy over a large time. By that
• it can be easy integrated in an appropriate semi-conductor technology (inte-grated RF-transistors "don't like" high voltages), and
• the measurement speed will be very high, since the wide band signal do not require extensive settling times.
Furthermore, the system conception is open for a flexible choice of the processing speed. It can be freely optimised corresponding to technical and economical con-straints. The new semiconductor technology 0.25µ-SiGe:C-BiCMOS, introduced by our chip supplier and the further improvement to 0.18µ minimal structure size, will even provide the opportunity to completely integrate the radar circuit including the digital processing parts. This would considerably improve the performance and with respect to future UWB communication systems it would create a strong competition against the US pioneers of the UWB radio.
5.3.2. The development of the UWB-radar electronics
The DEMINE radar represents a very new ultra wideband measurement principle never tested before in the microwave range. Thus, starting from some basic investi-gations regarding the new principle, the whole development concerning the micro-wave implementation was to do within the DEMINE project.
All the work was subjected to enormous pressure with regards to time and by the technological risk connected with the manufacture of the RF-subsystem. Newest technologies for chip manufacture and chip mounting were investigated in close co-operation with leading German enterprises as well as several institutions of the Technical University of Ilmenau. The application of these technologies and the acceptance of the corresponding risks was necessary in order to meet our ultimate ambitions. We believe however that our effort was very successful since even the first trial gave very promising results.
The development was divided into three main streams which were treated in parallel in order to save time:
• development of the RF-chips
• development of chip-mounting and RF-circuits, and
• development of digital hard- and software for signal capturing and data pre-processing.
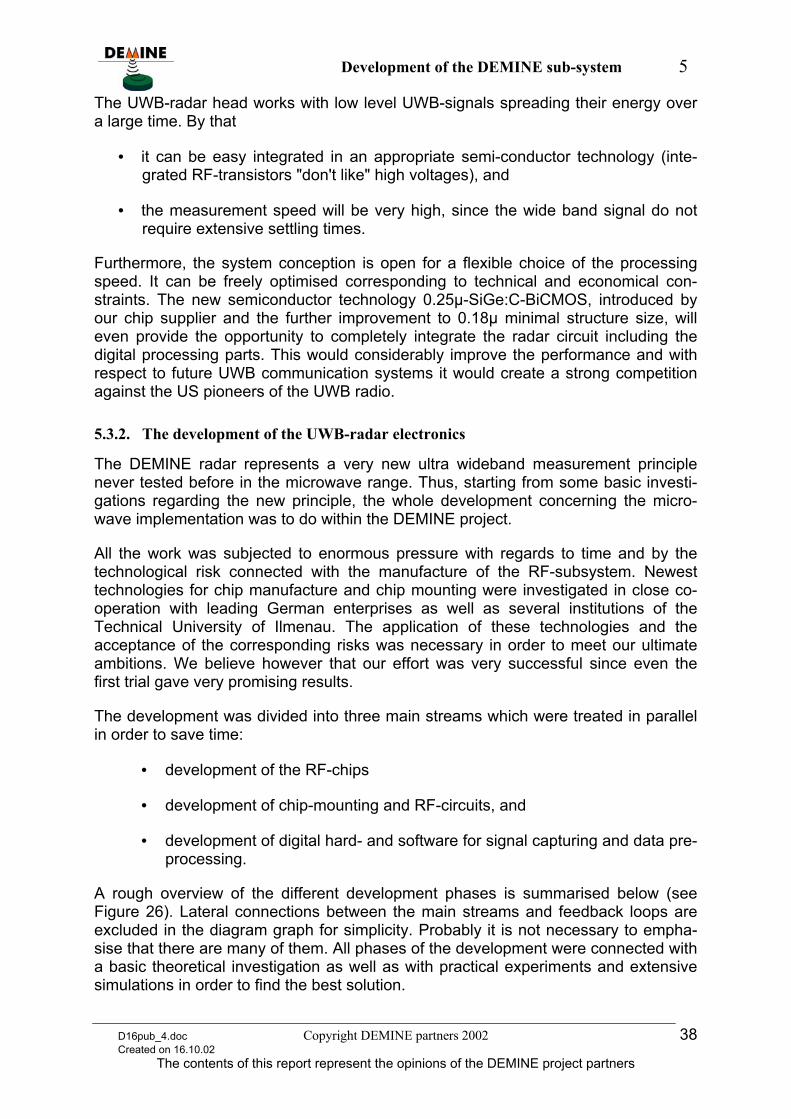
A rough overview of the different development phases is summarised below (see Figure 26). Lateral connections between the main streams and feedback loops are excluded in the diagram graph for simplicity. Probably it is not necessary to empha-sise that there are many of them. All phases of the development were connected with a basic theoretical investigation as well as with practical experiments and extensive simulations in order to find the best solution.
D16pub_4.doc Copyright DEMINE partners 2002 38 Created on 16.10.02
The contents of this report represent the opinions of the DEMINE project partners
Development of the DEMINE sub-system 5
systemconception
RF-part digital part
mounting ofchips andelctronic
components
function testand
qualification
overall testand
quatification
developing ofcalibration
routines
programmingof
multi-channeloperation
RF-IC's
create a librarywith elementary
circuits
circuit design ofcomplete chip
layout design
chipmanufacture
waver test
chip carrier
investigation ofsuitable carrier
technology
investigation ofsuitable
mountingtechnology
design ofmulti-layer
wiring elements
layout design
manufacture
design of hard-and softwareconfiguartion
circuit designincluding FPGA
and DSPselection
6 layer PCBdesign andmanufacture
implementationand test
hardwareprogramming
programming ofbasic
oparations andcorrelation
Figure 26 Flow graph of the most important development steps of the new radar head.
D16pub_4.doc Copyright DEMINE partners 2002 39 Created on 16.10.02
The contents of this report represent the opinions of the DEMINE project partners
Development of the DEMINE sub-system 5
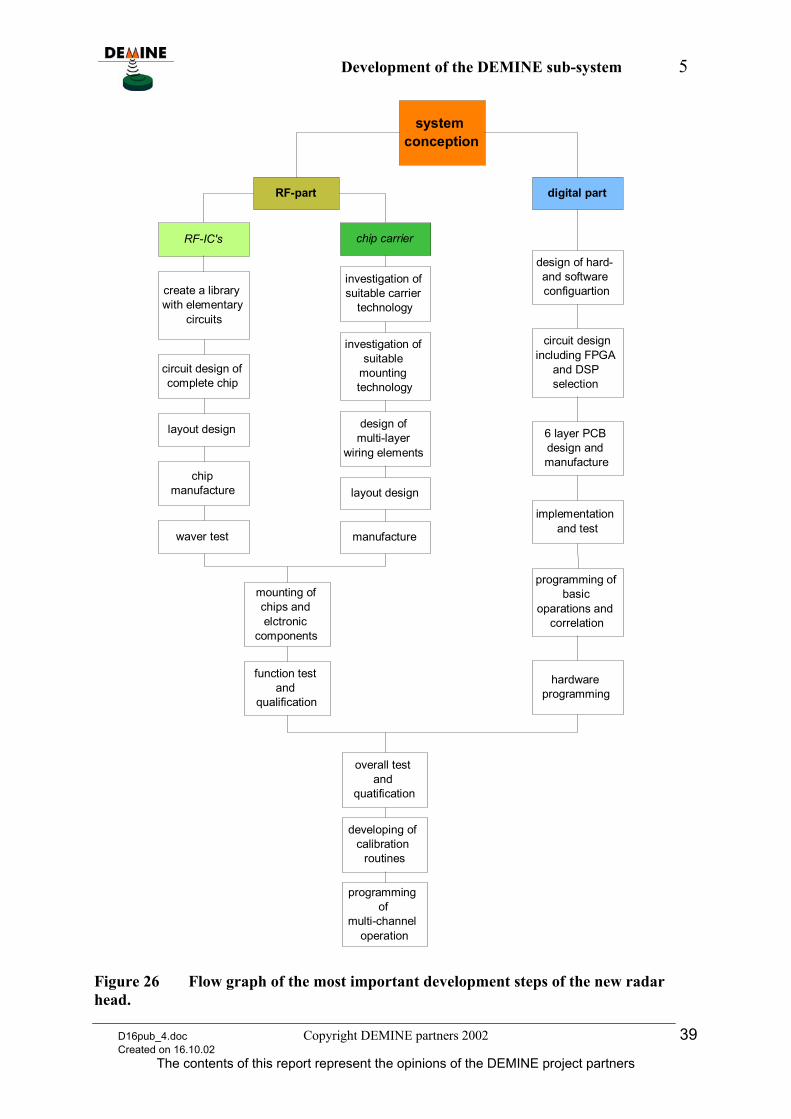
The result of the chip manufacturing – certainly the most critical part but not our re-sponsibility - is a so called multi project wafer (MPW) which supplies different cus-tomers with their chips (see Figure 27).
DEMINE Rx-chip
DEMINE Tx-chip
Figure 27 Multi-project wafer. The chips of all customers plus some test structures are properly ranged in a rectangular area and these are arranged in a 7x7 matrix over the wafer (The corners are left vacant of course). The chips with the best properties are ranged within a ring around the half wafer radius. In the centre and at the outer parts the refuse rate increases.
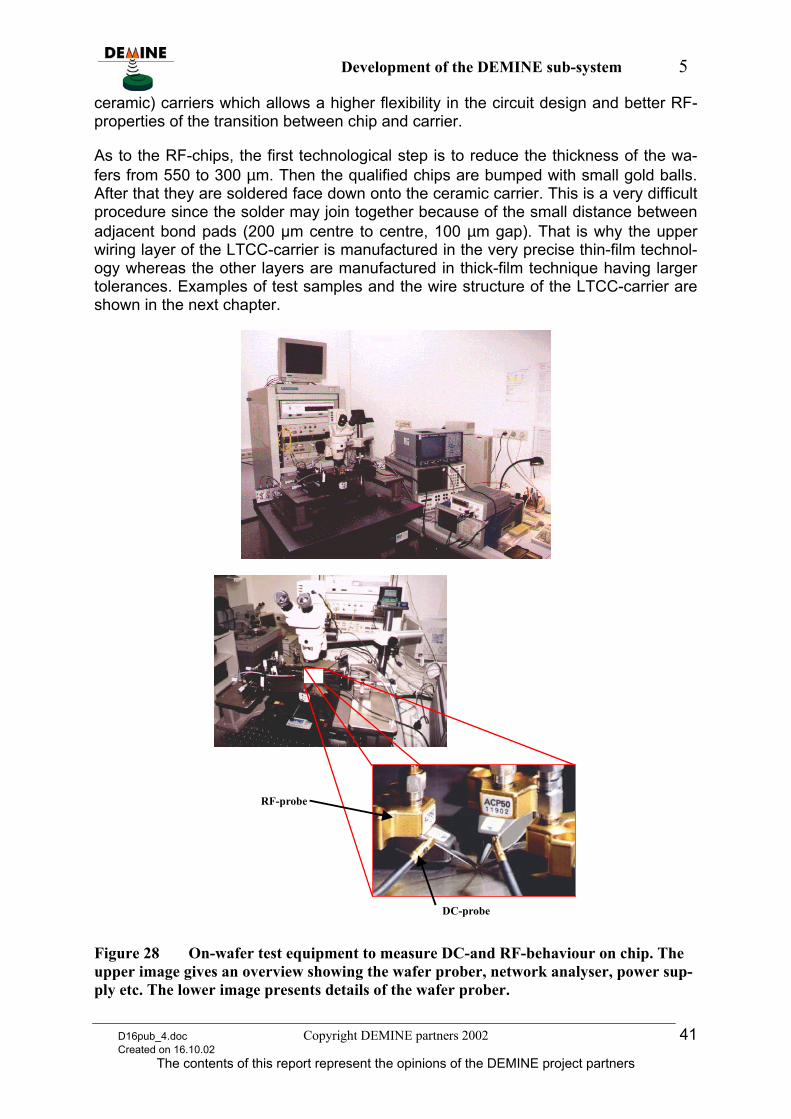
As first a go/no-go test of all chips is performed on the wafer (Figure 28 shows the appropriate equipment). The defect exemplars are inked and excluded for the next steps. The tests include both DC- and RF-behaviour. The RF-tests however did not cover all sub-components because only three RF-probes could be placed on the chips because of their small size. Furthermore, it was only possible to test the sym-metrical RF-ports by ground referred probes since no symmetrical probes are avail-able.
Next, the wafers are prepared for mounting on an appropriate carrier. At the first tri-als, wire bonding on Al2O3-ceramic was used. Later, we preferred the more sophisti-cated flip-chip technique in connection with 4 Layer LTCC (low temperature co-fired
D16pub_4.doc Copyright DEMINE partners 2002 40 Created on 16.10.02
The contents of this report represent the opinions of the DEMINE project partners
Development of the DEMINE sub-system 5
ceramic) carriers which allows a higher flexibility in the circuit design and better RF-properties of the transition between chip and carrier.
As to the RF-chips, the first technological step is to reduce the thickness of the wa-fers from 550 to 300 µm. Then the qualified chips are bumped with small gold balls. After that they are soldered face down onto the ceramic carrier. This is a very difficult procedure since the solder may join together because of the small distance between adjacent bond pads (200 µm centre to centre, 100 µm gap). That is why the upper wiring layer of the LTCC-carrier is manufactured in the very precise thin-film technol-ogy whereas the other layers are manufactured in thick-film technique having larger tolerances. Examples of test samples and the wire structure of the LTCC-carrier are shown in the next chapter.
DC-probe
RF-probe
Figure 28 On-wafer test equipment to measure DC-and RF-behaviour on chip. The upper image gives an overview showing the wafer prober, network analyser, power sup-ply etc. The lower image presents details of the wafer prober.
D16pub_4.doc Copyright DEMINE partners 2002 41 Created on 16.10.02
The contents of this report represent the opinions of the DEMINE project partners
Development of the DEMINE sub-system 5
Supplementary to the design of the chips and their wiring technology, the remaining RF subsystems like symmetrical wideband amplifiers, anti-aliasing filters, MUX etc. including an appropriate test strategy were developed and implemented.
Within the second chip generation, test signal generation and synchronisation was separated in order to be more flexible and to reduce power consumption.
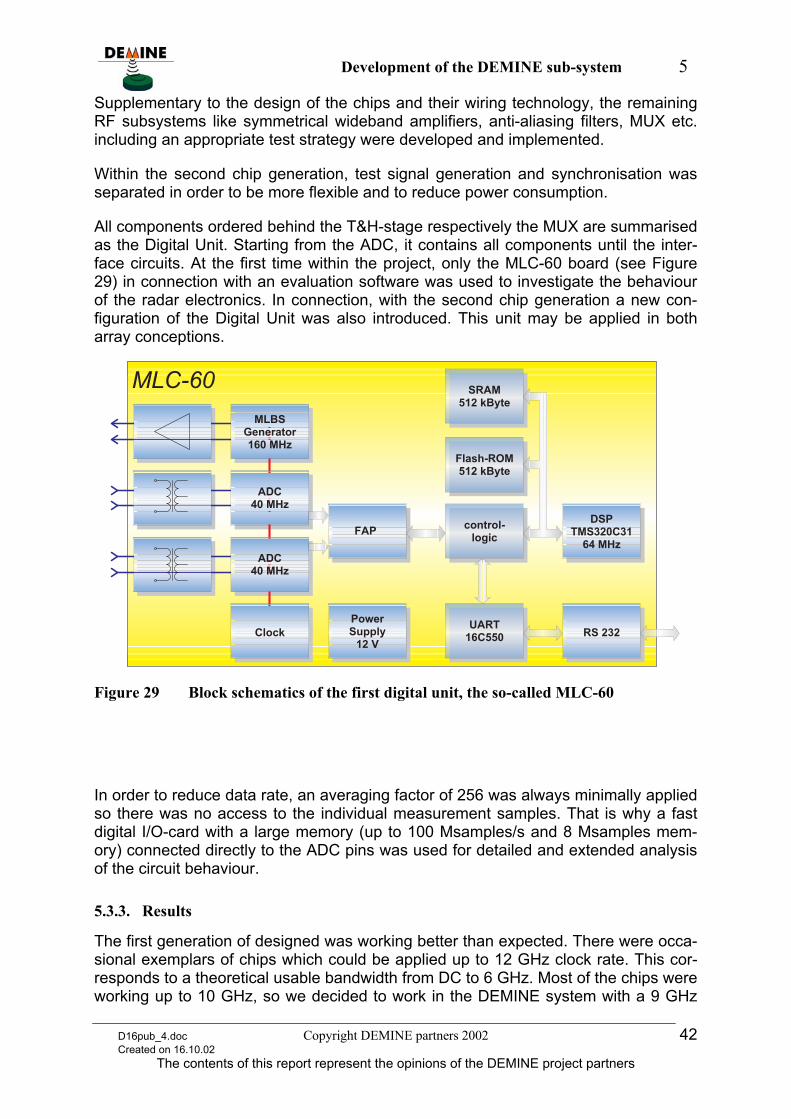
All components ordered behind the T&H-stage respectively the MUX are summarised as the Digital Unit. Starting from the ADC, it contains all components until the inter-face circuits. At the first time within the project, only the MLC-60 board (see Figure 29) in connection with an evaluation software was used to investigate the behaviour of the radar electronics. In connection, with the second chip generation a new con-figuration of the Digital Unit was also introduced. This unit may be applied in both array conceptions.
� � �� � � � � � �
� � � � �
� � � �� � � � � � �
� � � � � � � � �� � � � � � �
� � � � � � � �
! " � # ! � �� ! $ %
� � � � �
� & � �' � " � # � � ! # � � � � �
� � � � � � �
� � �
� ! �
� ! ( � #� ) * * � � � +
� � � � � � �
� � � � � �
Figure 29 Block schematics of the first digital unit, the so-called MLC-60
In order to reduce data rate, an averaging factor of 256 was always minimally applied so there was no access to the individual measurement samples. That is why a fast digital I/O-card with a large memory (up to 100 Msamples/s and 8 Msamples mem-ory) connected directly to the ADC pins was used for detailed and extended analysis of the circuit behaviour.
5.3.3. Results
The first generation of designed was working better than expected. There were occa-sional exemplars of chips which could be applied up to 12 GHz clock rate. This cor-responds to a theoretical usable bandwidth from DC to 6 GHz. Most of the chips were working up to 10 GHz, so we decided to work in the DEMINE system with a 9 GHz
D16pub_4.doc Copyright DEMINE partners 2002 42 Created on 16.10.02
The contents of this report represent the opinions of the DEMINE project partners
Development of the DEMINE sub-system 5
clock in order to have some system reserves. Thus the bandwidth of the DEMINE radar is about 4.5 GHz.
The preparation of the second chip generation needed much more time than ex-pected. This design however improved the maximum average clock rate to 15 GHz. Thus by improved transistor models and a certified technology, 20 GHz clock rate i.e. a bandwidth up to 10 GHz seems to be within reach.
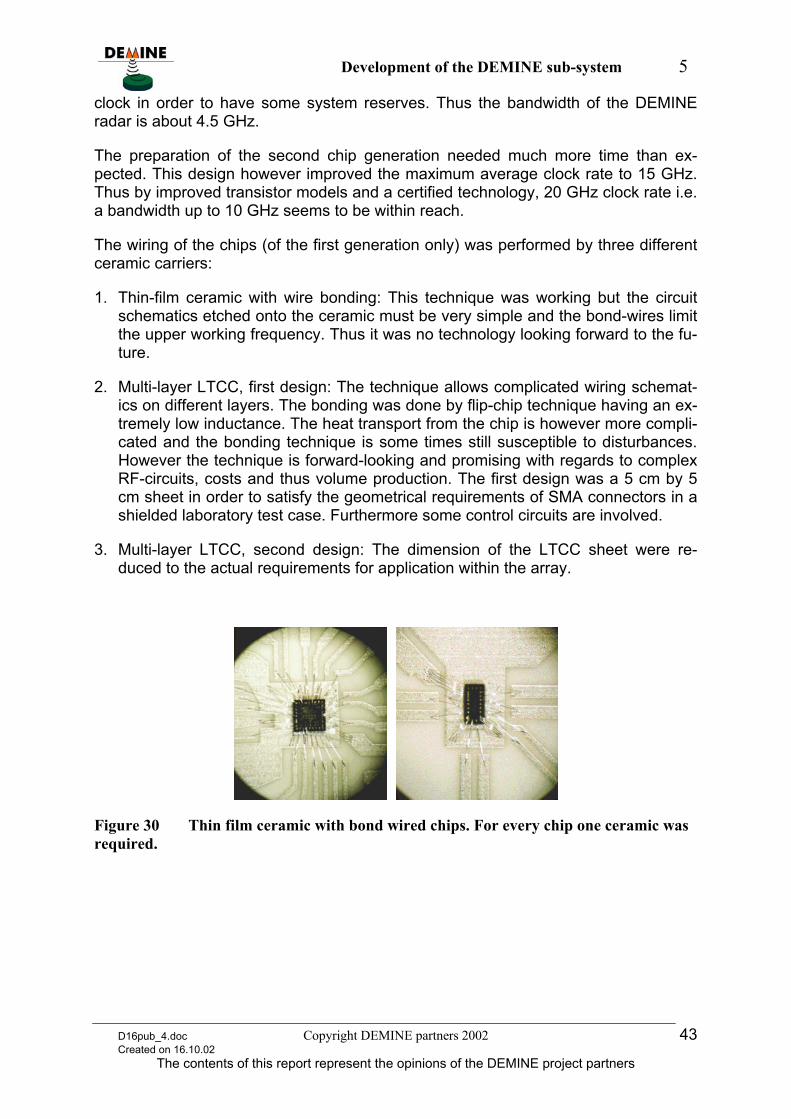
The wiring of the chips (of the first generation only) was performed by three different ceramic carriers:
1. Thin-film ceramic with wire bonding: This technique was working but the circuit schematics etched onto the ceramic must be very simple and the bond-wires limit the upper working frequency. Thus it was no technology looking forward to the fu-ture.
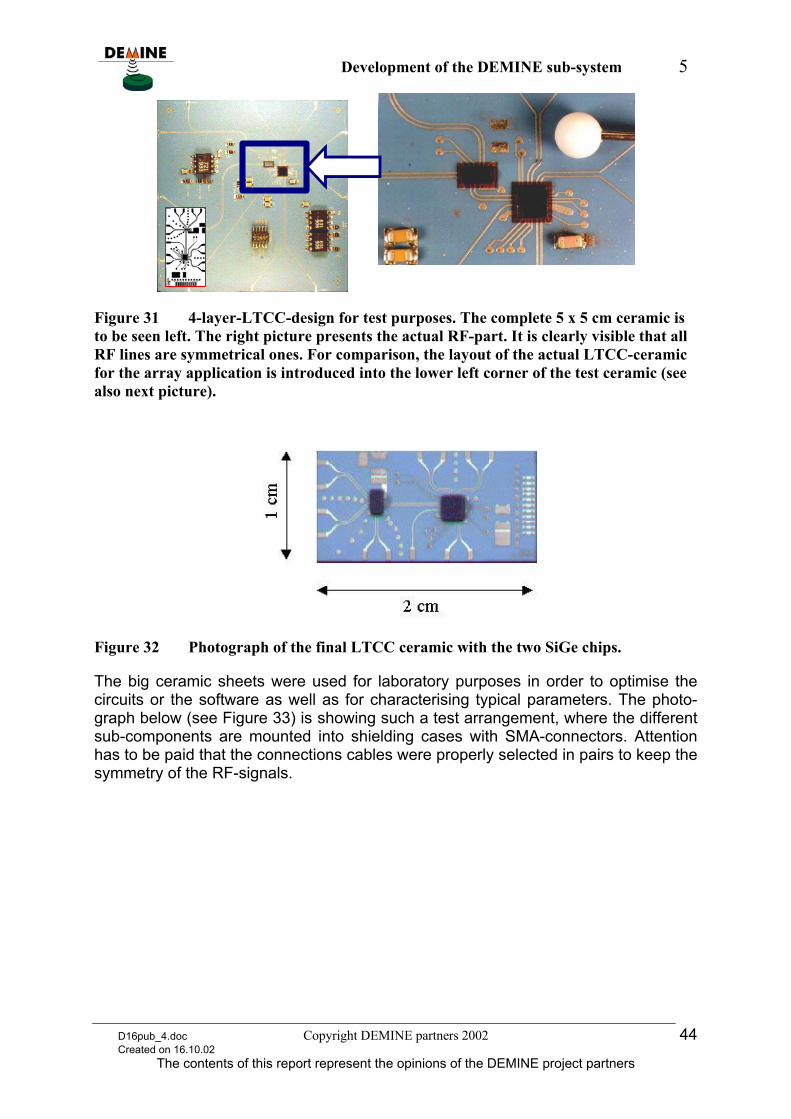
2. Multi-layer LTCC, first design: The technique allows complicated wiring schemat-ics on different layers. The bonding was done by flip-chip technique having an ex-tremely low inductance. The heat transport from the chip is however more compli-cated and the bonding technique is some times still susceptible to disturbances. However the technique is forward-looking and promising with regards to complex RF-circuits, costs and thus volume production. The first design was a 5 cm by 5 cm sheet in order to satisfy the geometrical requirements of SMA connectors in a shielded laboratory test case. Furthermore some control circuits are involved.
3. Multi-layer LTCC, second design: The dimension of the LTCC sheet were re-duced to the actual requirements for application within the array.
Figure 30 Thin film ceramic with bond wired chips. For every chip one ceramic was required.
D16pub_4.doc Copyright DEMINE partners 2002 43 Created on 16.10.02
The contents of this report represent the opinions of the DEMINE project partners
Development of the DEMINE sub-system 5
Figure 31 4-layer-LTCC-design for test purposes. The complete 5 x 5 cm ceramic is to be seen left. The right picture presents the actual RF-part. It is clearly visible that all RF lines are symmetrical ones. For comparison, the layout of the actual LTCC-ceramic for the array application is introduced into the lower left corner of the test ceramic (see also next picture).
Figure 32 Photograph of the final LTCC ceramic with the two SiGe chips.
The big ceramic sheets were used for laboratory purposes in order to optimise the circuits or the software as well as for characterising typical parameters. The photo-graph below (see Figure 33) is showing such a test arrangement, where the different sub-components are mounted into shielding cases with SMA-connectors. Attention has to be paid that the connections cables were properly selected in pairs to keep the symmetry of the RF-signals.
D16pub_4.doc Copyright DEMINE partners 2002 44 Created on 16.10.02
The contents of this report represent the opinions of the DEMINE project partners
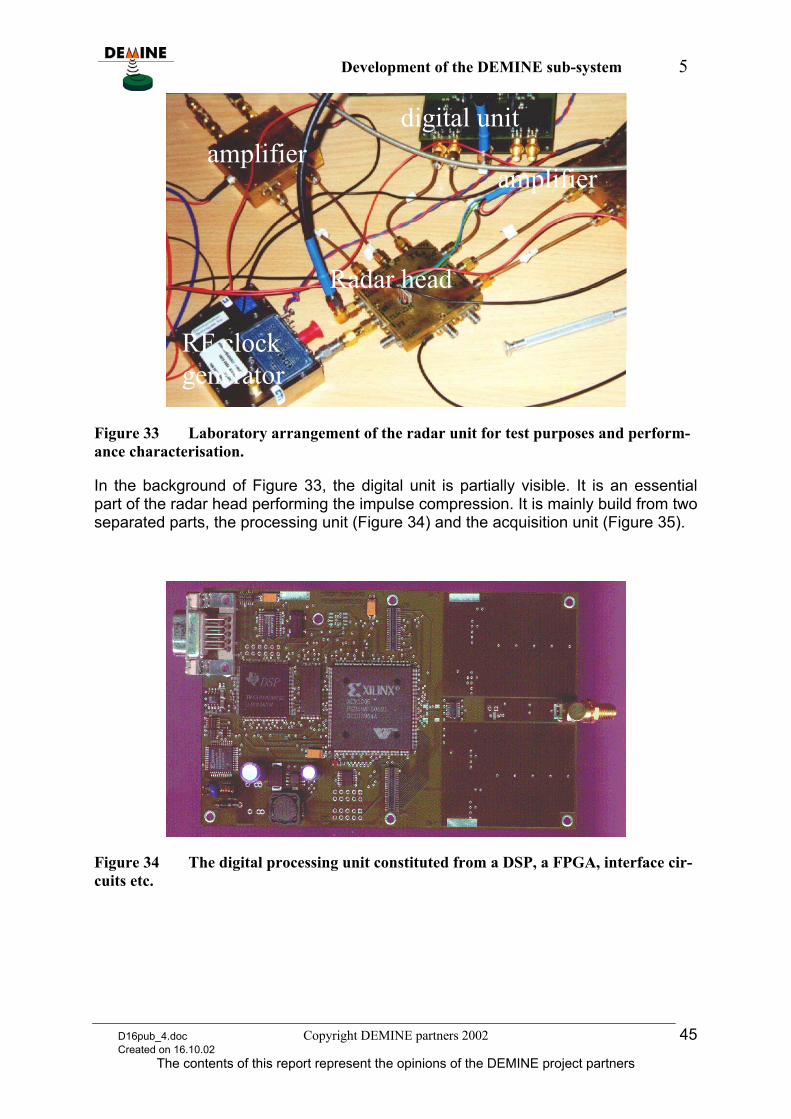
Development of the DEMINE sub-system 5
RF clock generator
digital unit
Radar head
amplifier amplifier
Figure 33 Laboratory arrangement of the radar unit for test purposes and perform-ance characterisation.
In the background of Figure 33, the digital unit is partially visible. It is an essential part of the radar head performing the impulse compression. It is mainly build from two separated parts, the processing unit (Figure 34) and the acquisition unit (Figure 35).
Figure 34 The digital processing unit constituted from a DSP, a FPGA, interface cir-cuits etc.
D16pub_4.doc Copyright DEMINE partners 2002 45 Created on 16.10.02
The contents of this report represent the opinions of the DEMINE project partners
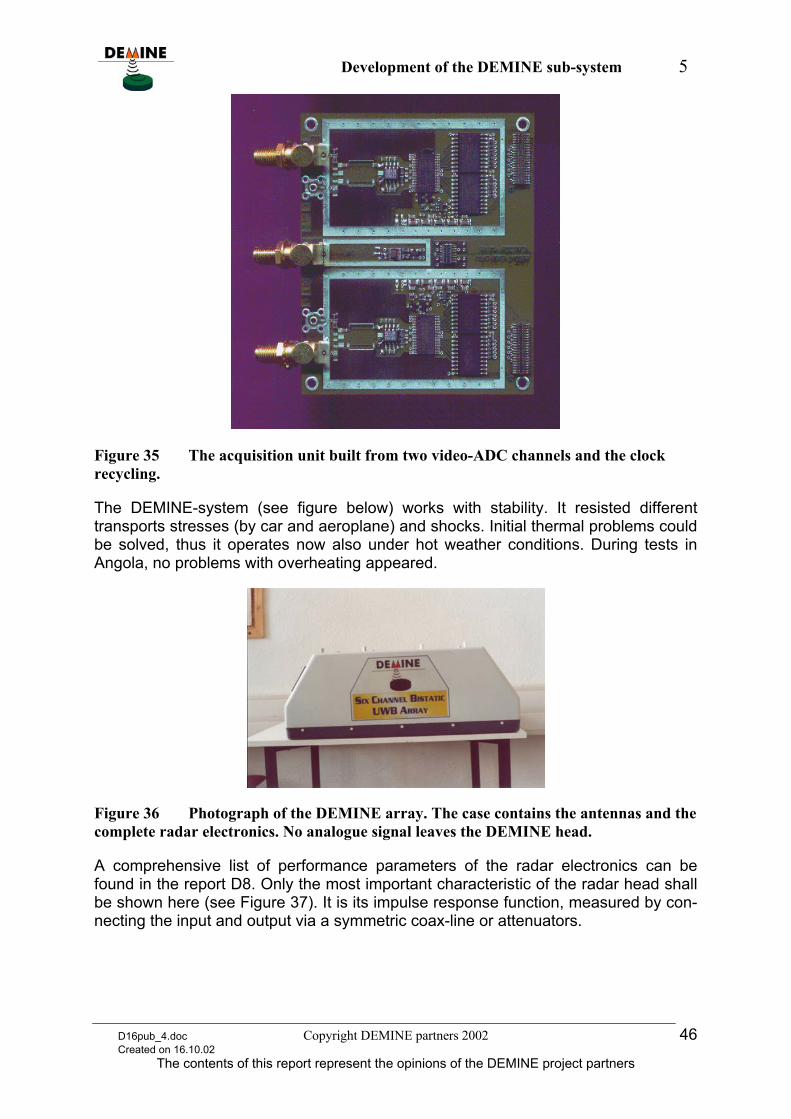
Development of the DEMINE sub-system 5
Figure 35 The acquisition unit built from two video-ADC channels and the clock recycling.
The DEMINE-system (see figure below) works with stability. It resisted different transports stresses (by car and aeroplane) and shocks. Initial thermal problems could be solved, thus it operates now also under hot weather conditions. During tests in Angola, no problems with overheating appeared.
Figure 36 Photograph of the DEMINE array. The case contains the antennas and the complete radar electronics. No analogue signal leaves the DEMINE head.
A comprehensive list of performance parameters of the radar electronics can be found in the report D8. Only the most important characteristic of the radar head shall be shown here (see Figure 37). It is its impulse response function, measured by con-necting the input and output via a symmetric coax-line or attenuators.
D16pub_4.doc Copyright DEMINE partners 2002 46 Created on 16.10.02
The contents of this report represent the opinions of the DEMINE project partners
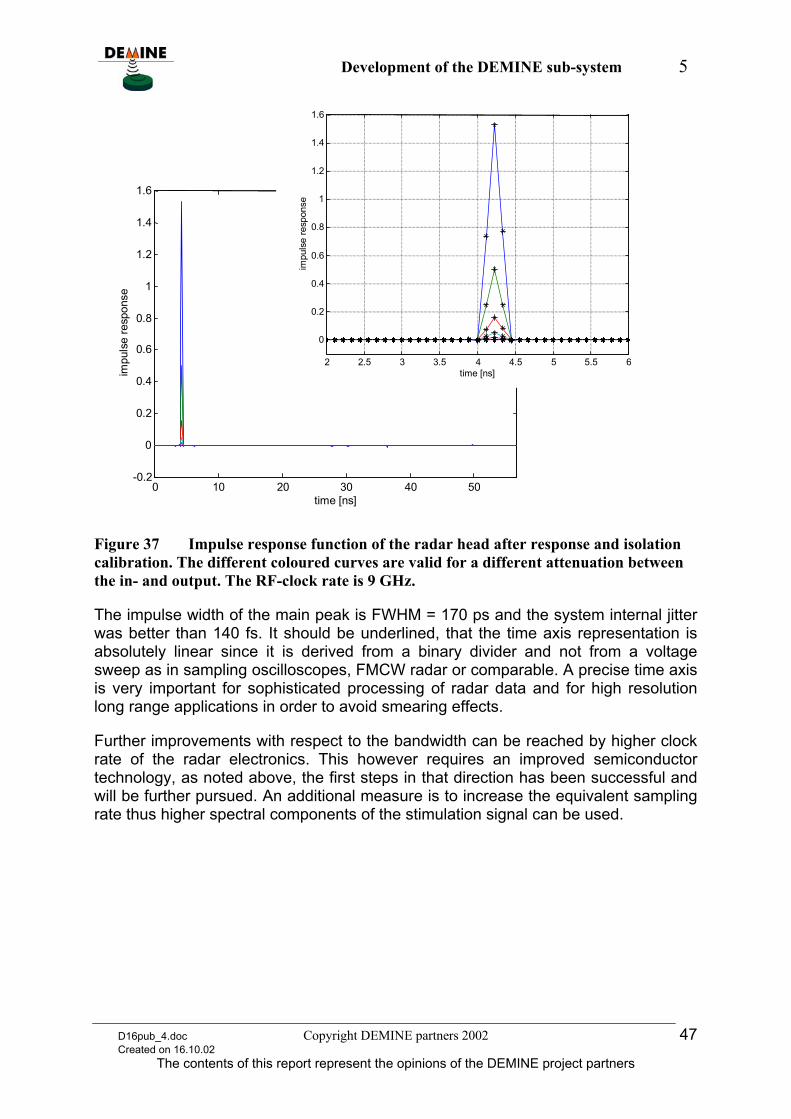
Development of the DEMINE sub-system 5
0 10 20 30 40 50-0.2
0
0.2
0.4
0.6
0.8
1
1.2
1.4
1.6
time [ns]
impu
lse
resp
onse
2 2.5 3 3.5 4 4.5 5 5.5 6
0
0.2
0.4
0.6
0.8
1
1.2
1.4
1.6
time [ns]
impu
lse
resp
onse
Figure 37 Impulse response function of the radar head after response and isolation calibration. The different coloured curves are valid for a different attenuation between the in- and output. The RF-clock rate is 9 GHz.
The impulse width of the main peak is FWHM = 170 ps and the system internal jitter was better than 140 fs. It should be underlined, that the time axis representation is absolutely linear since it is derived from a binary divider and not from a voltage sweep as in sampling oscilloscopes, FMCW radar or comparable. A precise time axis is very important for sophisticated processing of radar data and for high resolution long range applications in order to avoid smearing effects.
Further improvements with respect to the bandwidth can be reached by higher clock rate of the radar electronics. This however requires an improved semiconductor technology, as noted above, the first steps in that direction has been successful and will be further pursued. An additional measure is to increase the equivalent sampling rate thus higher spectral components of the stimulation signal can be used.
D16pub_4.doc Copyright DEMINE partners 2002 47 Created on 16.10.02
The contents of this report represent the opinions of the DEMINE project partners
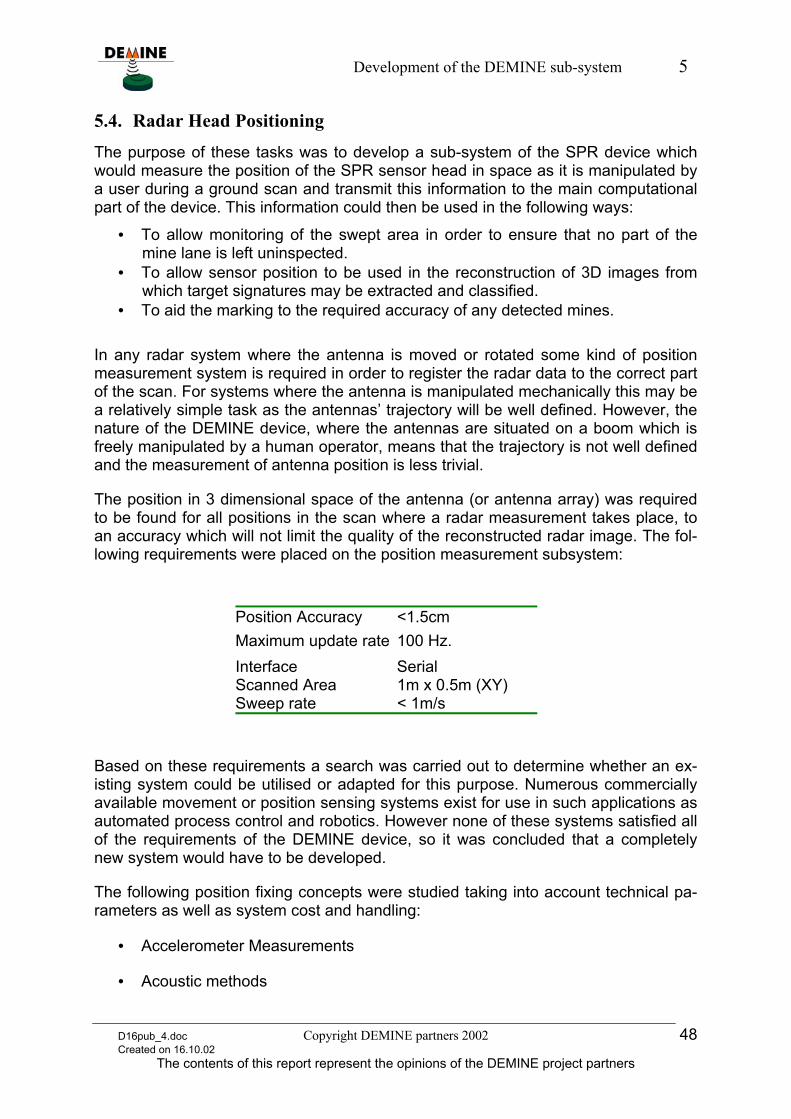
Development of the DEMINE sub-system 5
5.4. Radar Head Positioning
The purpose of these tasks was to develop a sub-system of the SPR device which would measure the position of the SPR sensor head in space as it is manipulated by a user during a ground scan and transmit this information to the main computational part of the device. This information could then be used in the following ways:
• To allow monitoring of the swept area in order to ensure that no part of the mine lane is left uninspected.
• To allow sensor position to be used in the reconstruction of 3D images from which target signatures may be extracted and classified.
• To aid the marking to the required accuracy of any detected mines. In any radar system where the antenna is moved or rotated some kind of position measurement system is required in order to register the radar data to the correct part of the scan. For systems where the antenna is manipulated mechanically this may be a relatively simple task as the antennas’ trajectory will be well defined. However, the nature of the DEMINE device, where the antennas are situated on a boom which is freely manipulated by a human operator, means that the trajectory is not well defined and the measurement of antenna position is less trivial.
The position in 3 dimensional space of the antenna (or antenna array) was required to be found for all positions in the scan where a radar measurement takes place, to an accuracy which will not limit the quality of the reconstructed radar image. The fol-lowing requirements were placed on the position measurement subsystem:
Position Accuracy <1.5cm Maximum update rate 100 Hz. Interface Serial Scanned Area 1m x 0.5m (XY) Sweep rate < 1m/s
Based on these requirements a search was carried out to determine whether an ex-isting system could be utilised or adapted for this purpose. Numerous commercially available movement or position sensing systems exist for use in such applications as automated process control and robotics. However none of these systems satisfied all of the requirements of the DEMINE device, so it was concluded that a completely new system would have to be developed.
The following position fixing concepts were studied taking into account technical pa-rameters as well as system cost and handling:
• Accelerometer Measurements
• Acoustic methods
D16pub_4.doc Copyright DEMINE partners 2002 48 Created on 16.10.02
The contents of this report represent the opinions of the DEMINE project partners
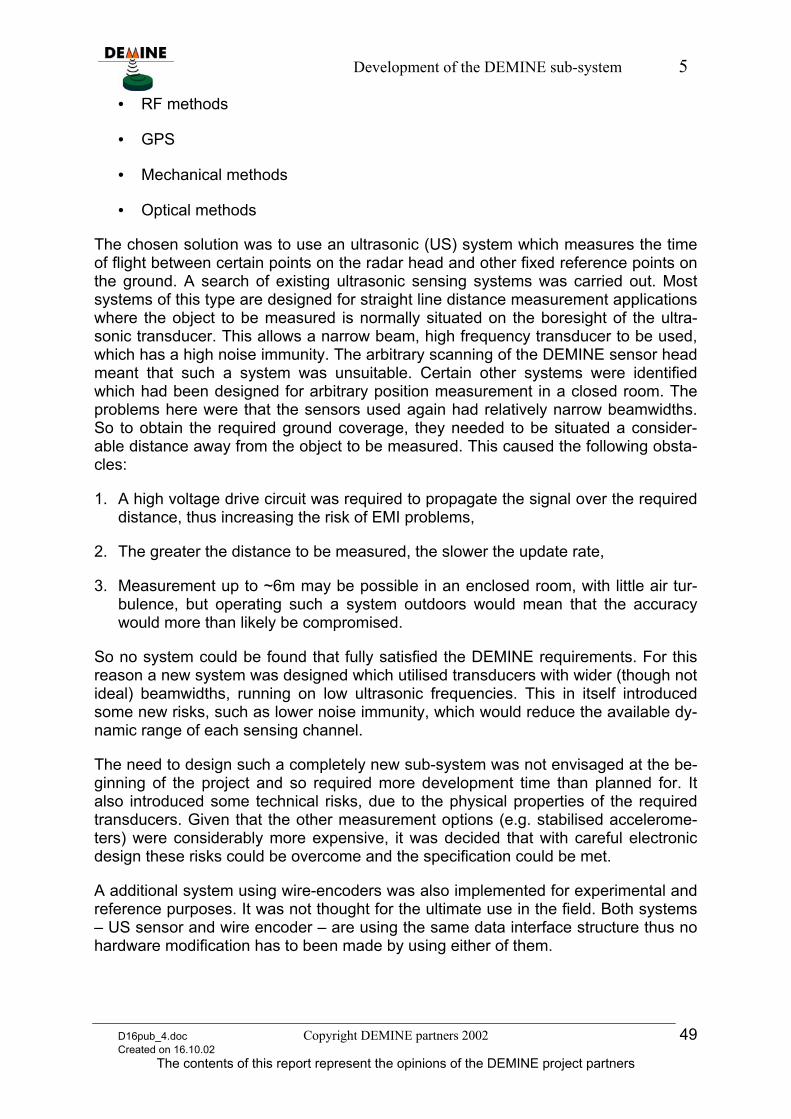
Development of the DEMINE sub-system 5
• RF methods
• GPS
• Mechanical methods
• Optical methods
The chosen solution was to use an ultrasonic (US) system which measures the time of flight between certain points on the radar head and other fixed reference points on the ground. A search of existing ultrasonic sensing systems was carried out. Most systems of this type are designed for straight line distance measurement applications where the object to be measured is normally situated on the boresight of the ultra-sonic transducer. This allows a narrow beam, high frequency transducer to be used, which has a high noise immunity. The arbitrary scanning of the DEMINE sensor head meant that such a system was unsuitable. Certain other systems were identified which had been designed for arbitrary position measurement in a closed room. The problems here were that the sensors used again had relatively narrow beamwidths. So to obtain the required ground coverage, they needed to be situated a consider-able distance away from the object to be measured. This caused the following obsta-cles:
1. A high voltage drive circuit was required to propagate the signal over the required distance, thus increasing the risk of EMI problems,
2. The greater the distance to be measured, the slower the update rate,
3. Measurement up to ~6m may be possible in an enclosed room, with little air tur-bulence, but operating such a system outdoors would mean that the accuracy would more than likely be compromised.
So no system could be found that fully satisfied the DEMINE requirements. For this reason a new system was designed which utilised transducers with wider (though not ideal) beamwidths, running on low ultrasonic frequencies. This in itself introduced some new risks, such as lower noise immunity, which would reduce the available dy-namic range of each sensing channel.
The need to design such a completely new sub-system was not envisaged at the be-ginning of the project and so required more development time than planned for. It also introduced some technical risks, due to the physical properties of the required transducers. Given that the other measurement options (e.g. stabilised accelerome-ters) were considerably more expensive, it was decided that with careful electronic design these risks could be overcome and the specification could be met.
A additional system using wire-encoders was also implemented for experimental and reference purposes. It was not thought for the ultimate use in the field. Both systems – US sensor and wire encoder – are using the same data interface structure thus no hardware modification has to been made by using either of them.
D16pub_4.doc Copyright DEMINE partners 2002 49 Created on 16.10.02
The contents of this report represent the opinions of the DEMINE project partners
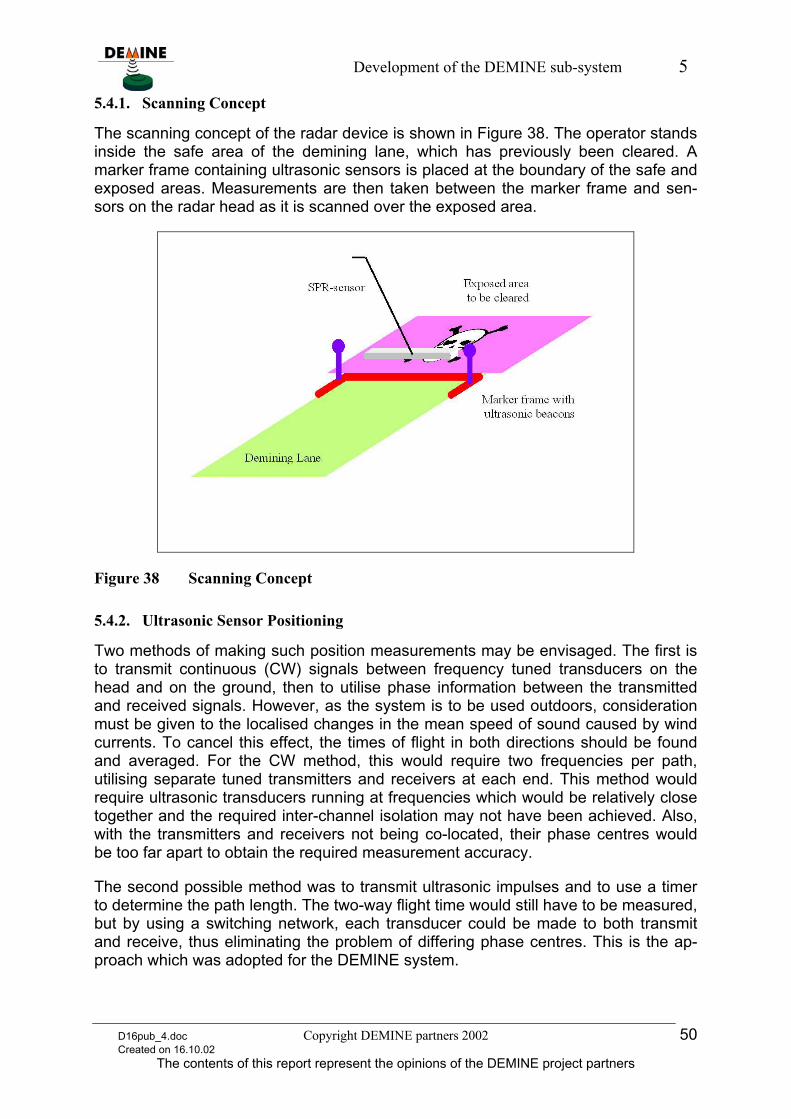
Development of the DEMINE sub-system 5
5.4.1. Scanning Concept
The scanning concept of the radar device is shown in Figure 38. The operator stands inside the safe area of the demining lane, which has previously been cleared. A marker frame containing ultrasonic sensors is placed at the boundary of the safe and exposed areas. Measurements are then taken between the marker frame and sen-sors on the radar head as it is scanned over the exposed area.
Figure 38 Scanning Concept
5.4.2. Ultrasonic Sensor Positioning
Two methods of making such position measurements may be envisaged. The first is to transmit continuous (CW) signals between frequency tuned transducers on the head and on the ground, then to utilise phase information between the transmitted and received signals. However, as the system is to be used outdoors, consideration must be given to the localised changes in the mean speed of sound caused by wind currents. To cancel this effect, the times of flight in both directions should be found and averaged. For the CW method, this would require two frequencies per path, utilising separate tuned transmitters and receivers at each end. This method would require ultrasonic transducers running at frequencies which would be relatively close together and the required inter-channel isolation may not have been achieved. Also, with the transmitters and receivers not being co-located, their phase centres would be too far apart to obtain the required measurement accuracy.
The second possible method was to transmit ultrasonic impulses and to use a timer to determine the path length. The two-way flight time would still have to be measured, but by using a switching network, each transducer could be made to both transmit and receive, thus eliminating the problem of differing phase centres. This is the ap-proach which was adopted for the DEMINE system.
D16pub_4.doc Copyright DEMINE partners 2002 50 Created on 16.10.02
The contents of this report represent the opinions of the DEMINE project partners
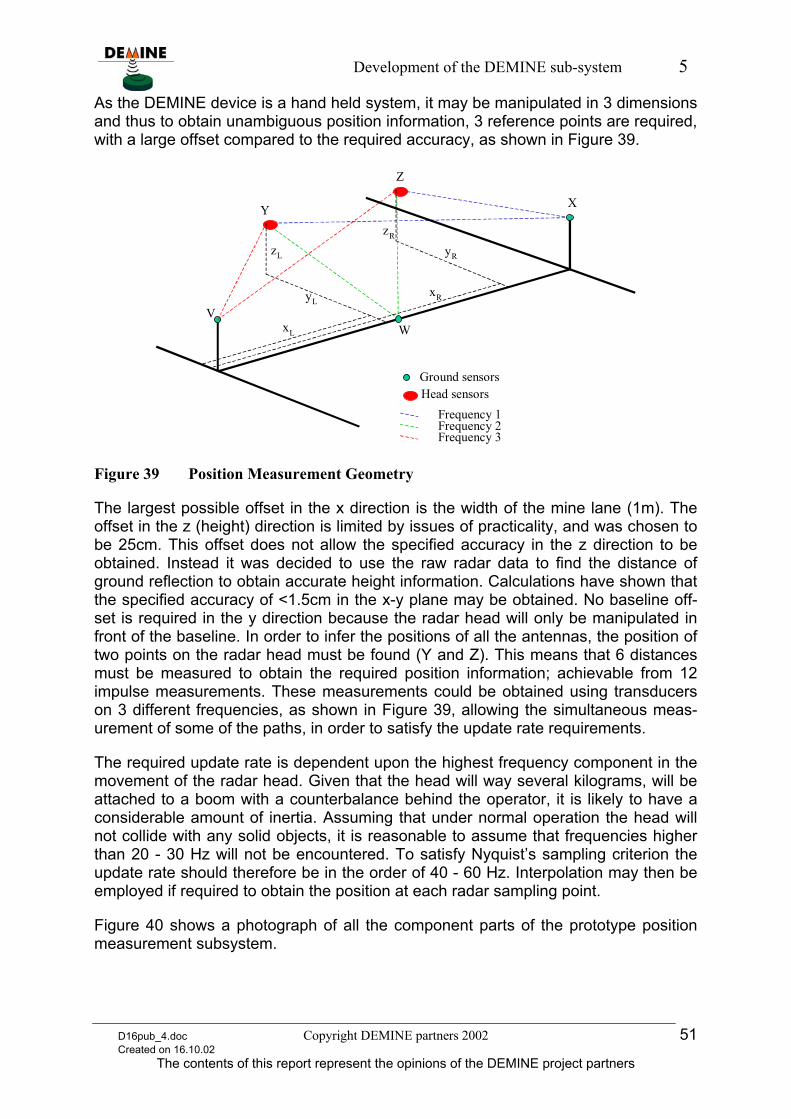
Development of the DEMINE sub-system 5
As the DEMINE device is a hand held system, it may be manipulated in 3 dimensions and thus to obtain unambiguous position information, 3 reference points are required, with a large offset compared to the required accuracy, as shown in Figure 39.
VW
XY
Z
xL
yL
zL
xR
yR
zR
Ground sensorsHead sensors
Frequency 1Frequency 2Frequency 3
Figure 39 Position Measurement Geometry
The largest possible offset in the x direction is the width of the mine lane (1m). The offset in the z (height) direction is limited by issues of practicality, and was chosen to be 25cm. This offset does not allow the specified accuracy in the z direction to be obtained. Instead it was decided to use the raw radar data to find the distance of ground reflection to obtain accurate height information. Calculations have shown that the specified accuracy of <1.5cm in the x-y plane may be obtained. No baseline off-set is required in the y direction because the radar head will only be manipulated in front of the baseline. In order to infer the positions of all the antennas, the position of two points on the radar head must be found (Y and Z). This means that 6 distances must be measured to obtain the required position information; achievable from 12 impulse measurements. These measurements could be obtained using transducers on 3 different frequencies, as shown in Figure 39, allowing the simultaneous meas-urement of some of the paths, in order to satisfy the update rate requirements.
The required update rate is dependent upon the highest frequency component in the movement of the radar head. Given that the head will way several kilograms, will be attached to a boom with a counterbalance behind the operator, it is likely to have a considerable amount of inertia. Assuming that under normal operation the head will not collide with any solid objects, it is reasonable to assume that frequencies higher than 20 - 30 Hz will not be encountered. To satisfy Nyquist’s sampling criterion the update rate should therefore be in the order of 40 - 60 Hz. Interpolation may then be employed if required to obtain the position at each radar sampling point.
Figure 40 shows a photograph of all the component parts of the prototype position measurement subsystem.
D16pub_4.doc Copyright DEMINE partners 2002 51 Created on 16.10.02
The contents of this report represent the opinions of the DEMINE project partners

Development of the DEMINE sub-system 5
Figure 40 Prototype Position Measurement Subsystem
The ultrasonic transducers are situated on Perspex pillars along the 1m baseline of the marker frame. The red markers at the front of the frame are used to obtain a stand-off distance of 10cm from the edge of the scanned area. This ensures that the sensors operate within their linear range.
The 3 smaller units are transmit and receive drivers. They amplify the transmit signal to the level required for detection at approximately 2m distance, and contain an ana-logue switch which isolates the transmit amplifier during the receive cycle. One unit is situated on the marker frame and the other two reside on the left and right of the ra-dar head, driving the left and right transducers. The following set of connections are made to the driver unit for each frequency:
• Transmit signal,
• Receive signal,
• Analogue switch control signal. These connections are made from the sensor units, which are situated adjacent to the driver units. The head sensor unit contains 6 sensor circuits, 3 for each of the 2 sensor positions on the radar head, covering the 3 ultrasonic frequencies. The ground sensor unit contains 3 sensor circuits, covering the 3 positions (and frequen-cies) along the baseline. A series of digital control signals are sent back and forth between the sensor units and the base unit to control the data acquisition. The base unit contains the acquisi-tion control, sensor handshaking and data formatting circuitry. Power distribution via dc-dc converters is also contained in the base unit, along with the serial data inter-face, and the command bus interface. The prototype base unit is relatively large and heavy as it contains several prototype circuits which are yet to be committed to PCB, so it is situated on the ground near the marker frame. Future development of the sys-tem should include miniaturisation of the base unit such that it may be incorporated into the main base station, contained in the operator’s backpack.
D16pub_4.doc Copyright DEMINE partners 2002 52 Created on 16.10.02
The contents of this report represent the opinions of the DEMINE project partners
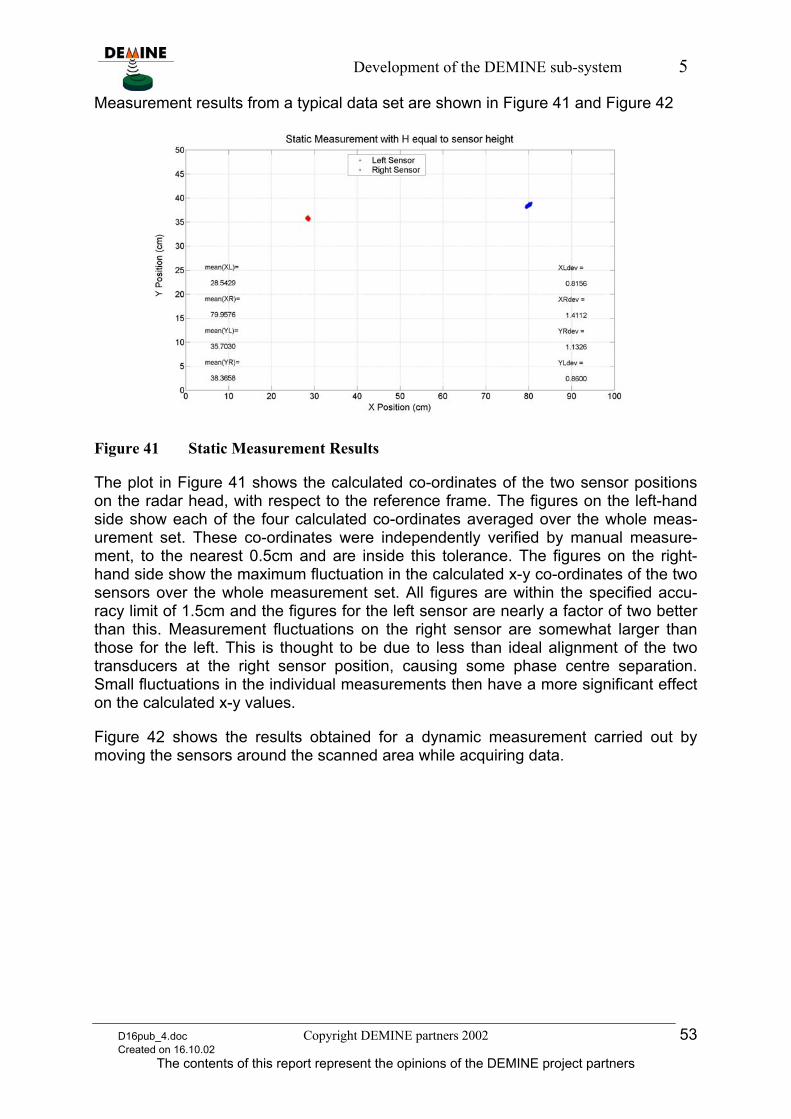
Development of the DEMINE sub-system 5
Measurement results from a typical data set are shown in Figure 41 and Figure 42
Figure 41 Static Measurement Results
The plot in Figure 41 shows the calculated co-ordinates of the two sensor positions on the radar head, with respect to the reference frame. The figures on the left-hand side show each of the four calculated co-ordinates averaged over the whole meas-urement set. These co-ordinates were independently verified by manual measure-ment, to the nearest 0.5cm and are inside this tolerance. The figures on the right-hand side show the maximum fluctuation in the calculated x-y co-ordinates of the two sensors over the whole measurement set. All figures are within the specified accu-racy limit of 1.5cm and the figures for the left sensor are nearly a factor of two better than this. Measurement fluctuations on the right sensor are somewhat larger than those for the left. This is thought to be due to less than ideal alignment of the two transducers at the right sensor position, causing some phase centre separation. Small fluctuations in the individual measurements then have a more significant effect on the calculated x-y values.
Figure 42 shows the results obtained for a dynamic measurement carried out by moving the sensors around the scanned area while acquiring data.
D16pub_4.doc Copyright DEMINE partners 2002 53 Created on 16.10.02
The contents of this report represent the opinions of the DEMINE project partners
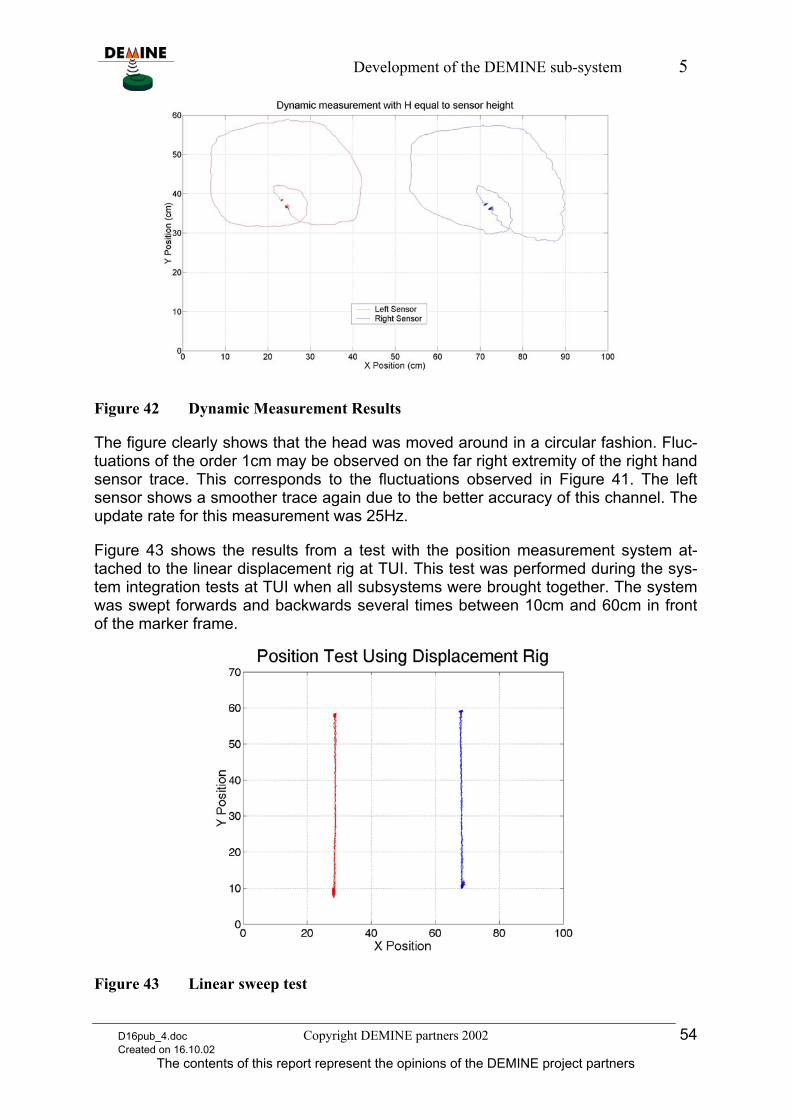
Development of the DEMINE sub-system 5
Figure 42 Dynamic Measurement Results
The figure clearly shows that the head was moved around in a circular fashion. Fluc-tuations of the order 1cm may be observed on the far right extremity of the right hand sensor trace. This corresponds to the fluctuations observed in Figure 41. The left sensor shows a smoother trace again due to the better accuracy of this channel. The update rate for this measurement was 25Hz.
Figure 43 shows the results from a test with the position measurement system at-tached to the linear displacement rig at TUI. This test was performed during the sys-tem integration tests at TUI when all subsystems were brought together. The system was swept forwards and backwards several times between 10cm and 60cm in front of the marker frame.
Figure 43 Linear sweep test
D16pub_4.doc Copyright DEMINE partners 2002 54 Created on 16.10.02
The contents of this report represent the opinions of the DEMINE project partners
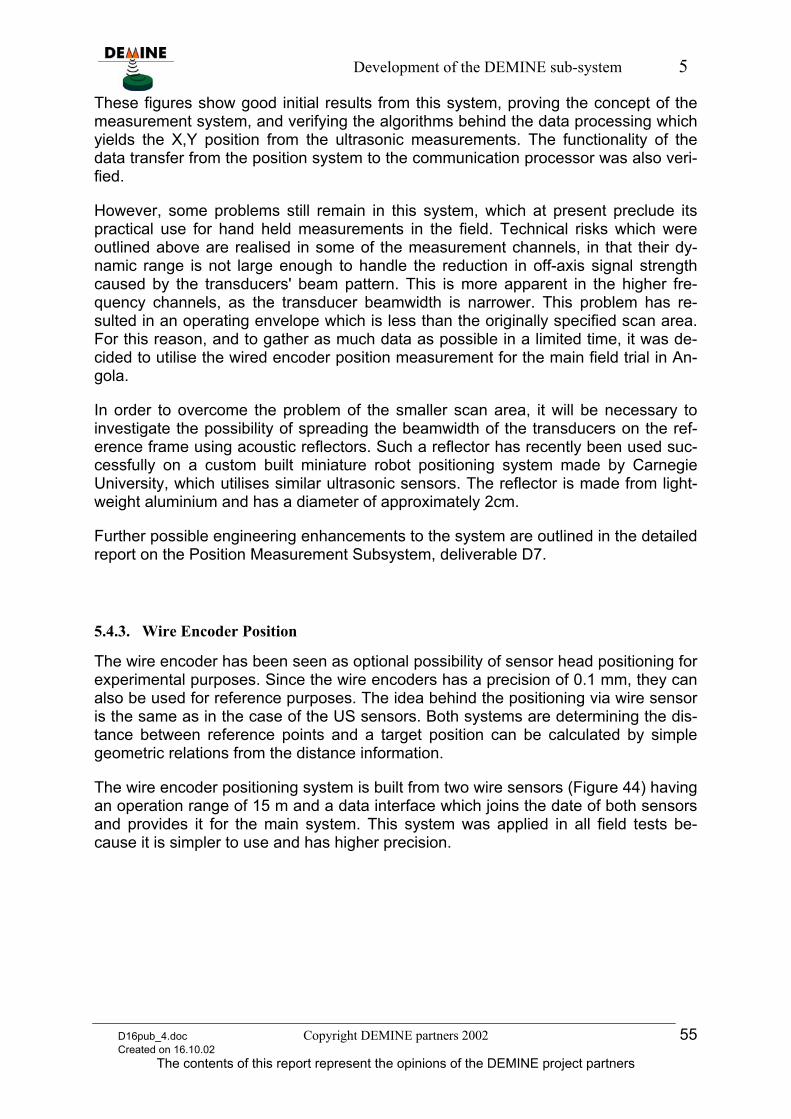
Development of the DEMINE sub-system 5
These figures show good initial results from this system, proving the concept of the measurement system, and verifying the algorithms behind the data processing which yields the X,Y position from the ultrasonic measurements. The functionality of the data transfer from the position system to the communication processor was also veri-fied.
However, some problems still remain in this system, which at present preclude its practical use for hand held measurements in the field. Technical risks which were outlined above are realised in some of the measurement channels, in that their dy-namic range is not large enough to handle the reduction in off-axis signal strength caused by the transducers' beam pattern. This is more apparent in the higher fre-quency channels, as the transducer beamwidth is narrower. This problem has re-sulted in an operating envelope which is less than the originally specified scan area. For this reason, and to gather as much data as possible in a limited time, it was de-cided to utilise the wired encoder position measurement for the main field trial in An-gola.
In order to overcome the problem of the smaller scan area, it will be necessary to investigate the possibility of spreading the beamwidth of the transducers on the ref-erence frame using acoustic reflectors. Such a reflector has recently been used suc-cessfully on a custom built miniature robot positioning system made by Carnegie University, which utilises similar ultrasonic sensors. The reflector is made from light-weight aluminium and has a diameter of approximately 2cm.
Further possible engineering enhancements to the system are outlined in the detailed report on the Position Measurement Subsystem, deliverable D7.
5.4.3. Wire Encoder Position
The wire encoder has been seen as optional possibility of sensor head positioning for experimental purposes. Since the wire encoders has a precision of 0.1 mm, they can also be used for reference purposes. The idea behind the positioning via wire sensor is the same as in the case of the US sensors. Both systems are determining the dis-tance between reference points and a target position can be calculated by simple geometric relations from the distance information.
The wire encoder positioning system is built from two wire sensors (Figure 44) having an operation range of 15 m and a data interface which joins the date of both sensors and provides it for the main system. This system was applied in all field tests be-cause it is simpler to use and has higher precision.
D16pub_4.doc Copyright DEMINE partners 2002 55 Created on 16.10.02
The contents of this report represent the opinions of the DEMINE project partners
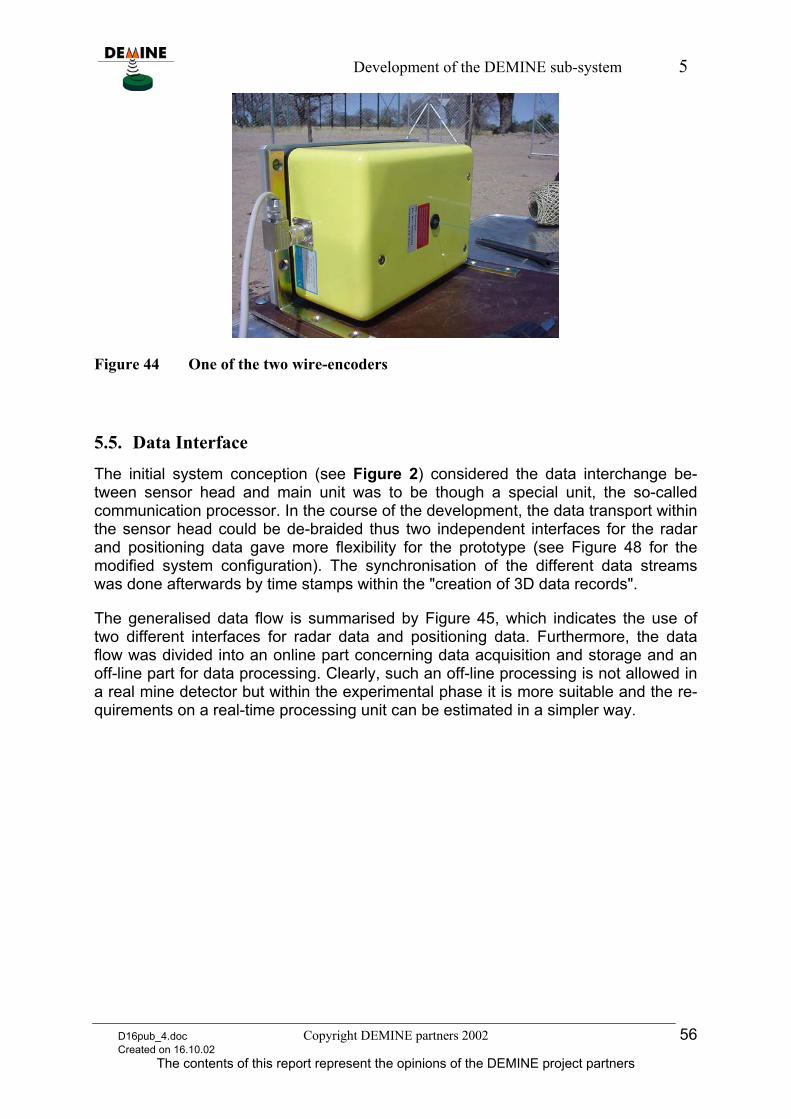
Development of the DEMINE sub-system 5
Figure 44 One of the two wire-encoders
5.5. Data Interface
The initial system conception (see Figure 2) considered the data interchange be-tween sensor head and main unit was to be though a special unit, the so-called communication processor. In the course of the development, the data transport within the sensor head could be de-braided thus two independent interfaces for the radar and positioning data gave more flexibility for the prototype (see Figure 48 for the modified system configuration). The synchronisation of the different data streams was done afterwards by time stamps within the "creation of 3D data records".
The generalised data flow is summarised by Figure 45, which indicates the use of two different interfaces for radar data and positioning data. Furthermore, the data flow was divided into an online part concerning data acquisition and storage and an off-line part for data processing. Clearly, such an off-line processing is not allowed in a real mine detector but within the experimental phase it is more suitable and the re-quirements on a real-time processing unit can be estimated in a simpler way.
D16pub_4.doc Copyright DEMINE partners 2002 56 Created on 16.10.02
The contents of this report represent the opinions of the DEMINE project partners
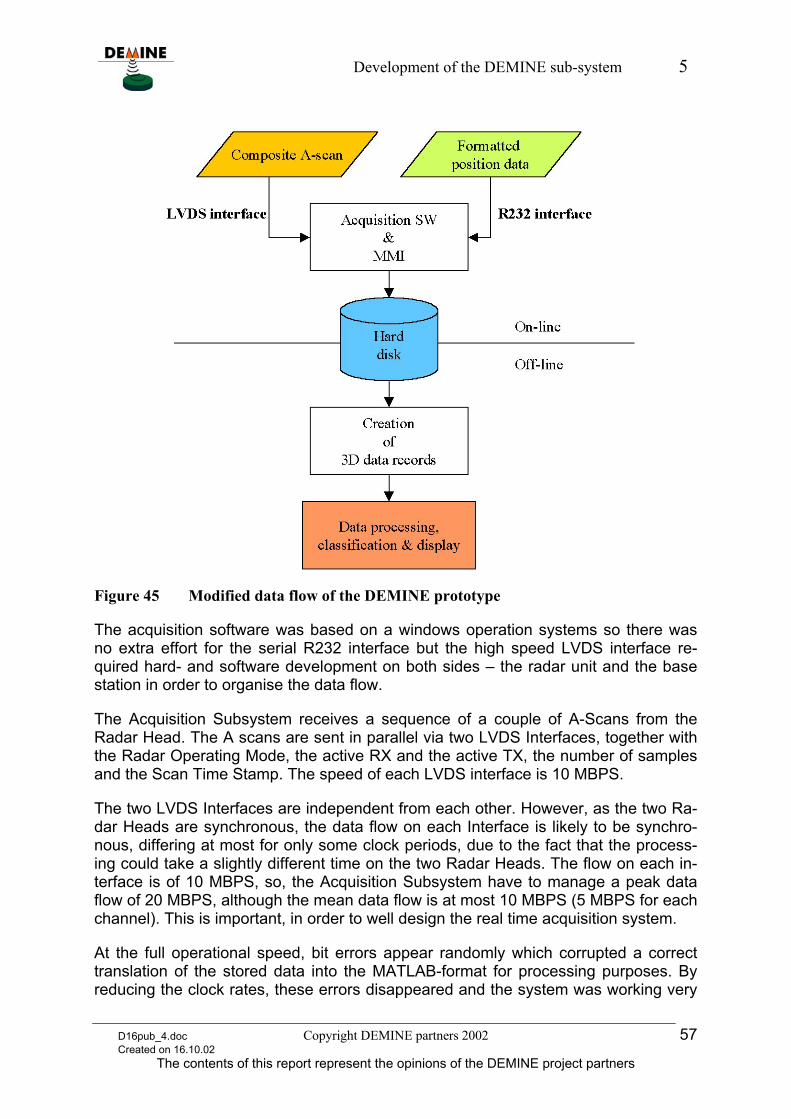
Development of the DEMINE sub-system 5
Figure 45 Modified data flow of the DEMINE prototype
The acquisition software was based on a windows operation systems so there was no extra effort for the serial R232 interface but the high speed LVDS interface re-quired hard- and software development on both sides – the radar unit and the base station in order to organise the data flow.
The Acquisition Subsystem receives a sequence of a couple of A-Scans from the Radar Head. The A scans are sent in parallel via two LVDS Interfaces, together with the Radar Operating Mode, the active RX and the active TX, the number of samples and the Scan Time Stamp. The speed of each LVDS interface is 10 MBPS.
The two LVDS Interfaces are independent from each other. However, as the two Ra-dar Heads are synchronous, the data flow on each Interface is likely to be synchro-nous, differing at most for only some clock periods, due to the fact that the process-ing could take a slightly different time on the two Radar Heads. The flow on each in-terface is of 10 MBPS, so, the Acquisition Subsystem have to manage a peak data flow of 20 MBPS, although the mean data flow is at most 10 MBPS (5 MBPS for each channel). This is important, in order to well design the real time acquisition system.
At the full operational speed, bit errors appear randomly which corrupted a correct translation of the stored data into the MATLAB-format for processing purposes. By reducing the clock rates, these errors disappeared and the system was working very
D16pub_4.doc Copyright DEMINE partners 2002 57 Created on 16.10.02
The contents of this report represent the opinions of the DEMINE project partners
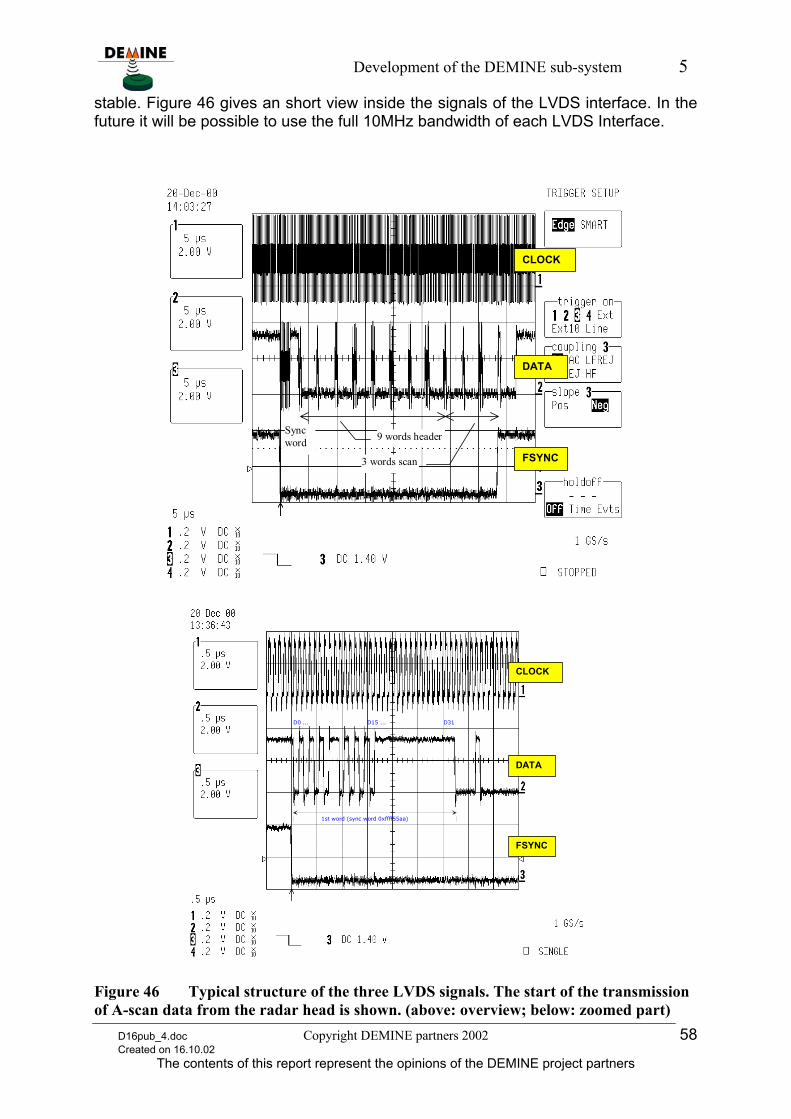
Development of the DEMINE sub-system 5
stable. Figure 46 gives an short view inside the signals of the LVDS interface. In the future it will be possible to use the full 10MHz bandwidth of each LVDS Interface.
9 words header
3 words scan
Syncword
FSYNC
DATA
CLOCK
D0 ... D31
1st word (sync word 0xffff55aa)
D15 ...
FSYNC
DATA
CLOCK
Figure 46 Typical structure of the three LVDS signals. The start of the transmission of A-scan data from the radar head is shown. (above: overview; below: zoomed part)
D16pub_4.doc Copyright DEMINE partners 2002 58 Created on 16.10.02
The contents of this report represent the opinions of the DEMINE project partners
Development of the DEMINE sub-system 5
Since the windows operational systems prevents a continuous and stable access to the hard disk, the continuous data stream from the radar head must be guided over an buffer memory. This memory was built from two blocks. One block was always continuously loaded by the measurement data whereas the second block leaves its data discontinuously to the hard disk. If the first block was loaded by the measure-ment data both block were swapped.
5.6. MMI
The MMI SW is an Application under Windows which allows the user to give com-mands to the system in order to set up and control the scanning procedure. The MMI SW is installed and runs in the Acquisition Subsystem.
The Figure 47 is shows the starting window of the MMI. The main capabilities of the MMI are:
To enter parameters that customize each acquisition.
To start and stop the radar survey (start of data storage on the hard disk of the Acquisition Unit and generation of the Start Of Acquisition SOA command to the Radar Electronics and the Position Unit).
Referring to Figure 47, four main areas can be identified in the starting window of the MMI:
The group of buttons identified as HEAD allow to manage the Radar Head.
The group of buttons identified as DISK allow to manage the storage of Radar data and Position Data on the Acquisition Unit’s hard disk.
The WRITE PROGRESS bar permit to monitor the amount of data stored.
The squared white window on the upper left of Figure 47 is designed to show the position of the array during the acquisition; this utility was not implemented in the prototype.
D16pub_4.doc Copyright DEMINE partners 2002 59 Created on 16.10.02
The contents of this report represent the opinions of the DEMINE project partners
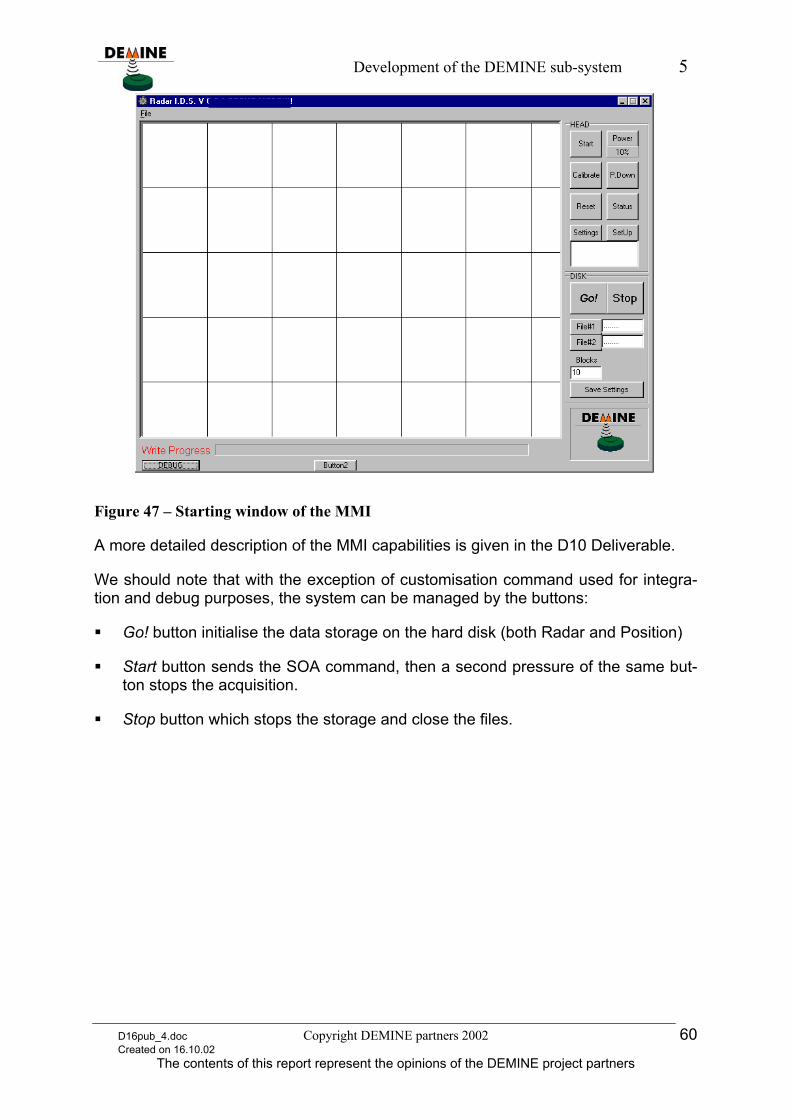
Development of the DEMINE sub-system 5
Figure 47 – Starting window of the MMI
A more detailed description of the MMI capabilities is given in the D10 Deliverable.
We should note that with the exception of customisation command used for integra-tion and debug purposes, the system can be managed by the buttons:
Go! button initialise the data storage on the hard disk (both Radar and Position)
Start button sends the SOA command, then a second pressure of the same but-ton stops the acquisition.
Stop button which stops the storage and close the files.
D16pub_4.doc Copyright DEMINE partners 2002 60 Created on 16.10.02
The contents of this report represent the opinions of the DEMINE project partners
Development of the DEMINE sub-system 5
5.7. Prototype
The main concepts of the equipment developed in the conception phase were:
the hardware structure is dominated by the separation of the handheld Sensor Head and the Basic Station.
the Sensor Head gathers radar and position data and data pre-processing runs on its DSP's.
the main processing, MMI and power supply are integrated in the base station.
Such initial system conception (see Figure 2) was optimised as follow:
in order to reduce complexity and consumption only two DSPs are used, each processing the data of 3 radar chip & ADC. The reduction of the number of DSPs has been possible by the application of the newest processors and FPGAs having a largely improved processing power and reduced power consumption.
for simplicity the timer was included inside the radar electronics.
suitable technology was used to substitute the communication processor with a simpler and more efficient LVDS fast serial interfaces.
the main processor and the MMI were joined in a single computing unit, saving complexity, consumption and weight.
Further changes were done in order to simplify the development:
a ground based battery was added for radar head and position
a ground based power supply (dedicated to the radar head) was added to the bat-teries
base position was moved from the backpack equipment to the ground equipment.
Figure 48 shows the improved conception.
D16pub_4.doc Copyright DEMINE partners 2002 61 Created on 16.10.02
The contents of this report represent the opinions of the DEMINE project partners
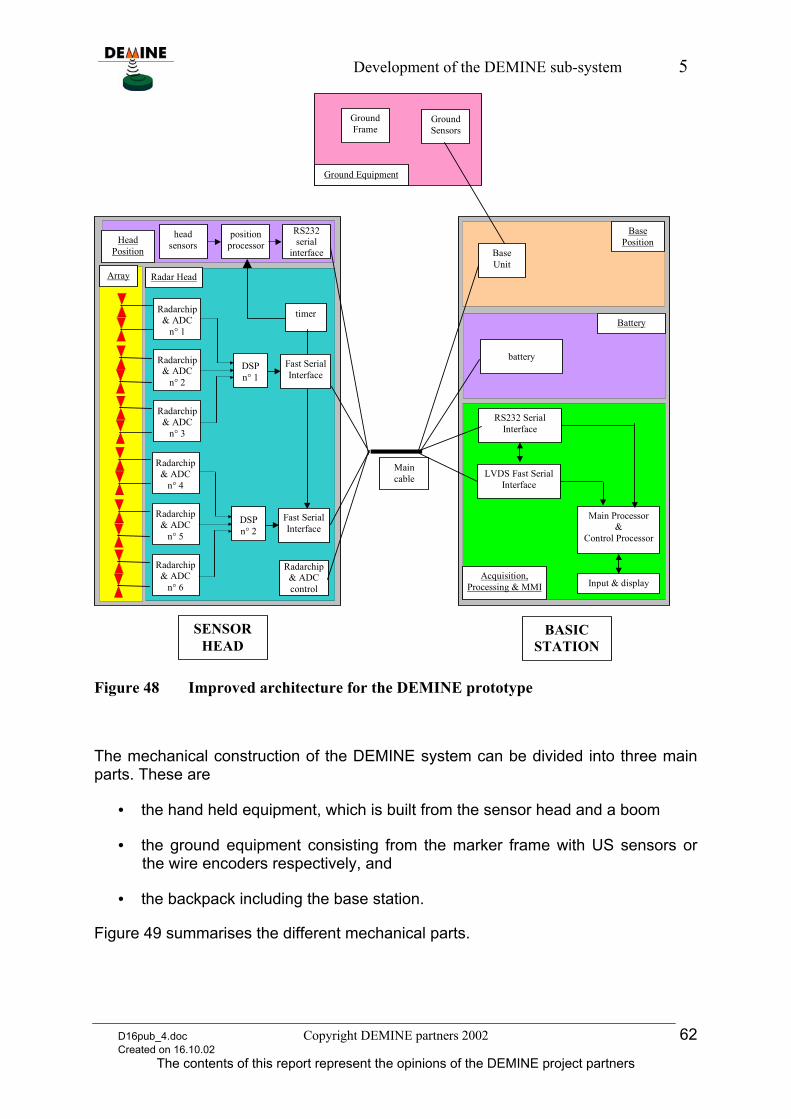
Development of the DEMINE sub-system 5
Radarchip& ADCcontrol
timer
Maincable
SENSORHEAD
BASICSTATION
Array
headsensors
positionprocessorHead
Position
Radar Head
Main Processor&
Control Processor
Acquisition,Processing & MMI Input & display
LVDS Fast SerialInterface
RS232 SerialInterface
RS232serial
interface
Radarchip& ADC
n° 1
Radarchip& ADC
n° 2
Radarchip& ADC
n° 3
DSPn° 1
Fast SerialInterface
Radarchip& ADC
n° 4
Radarchip& ADC
n° 5
Radarchip& ADC
n° 6
DSPn° 2
Fast SerialInterface
GroundSensors
GroundFrame
BaseUnit
battery
Battery
BasePosition
Ground Equipment
Figure 48 Improved architecture for the DEMINE prototype
The mechanical construction of the DEMINE system can be divided into three main parts. These are
• the hand held equipment, which is built from the sensor head and a boom
• the ground equipment consisting from the marker frame with US sensors or the wire encoders respectively, and
• the backpack including the base station.
Figure 49 summarises the different mechanical parts.
D16pub_4.doc Copyright DEMINE partners 2002 62 Created on 16.10.02
The contents of this report represent the opinions of the DEMINE project partners
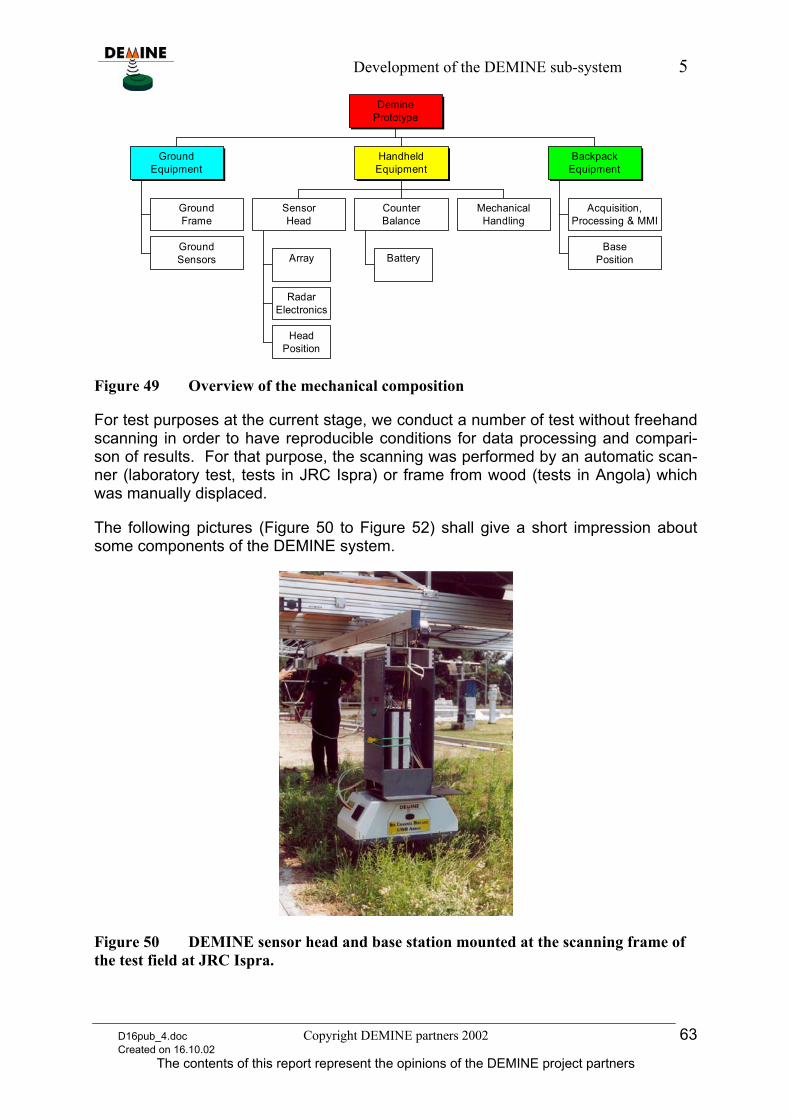
Development of the DEMINE sub-system 5
GroundFrame
GroundSensors
GroundEquipment
Array
RadarElectronics
HeadPosition
SensorHead
Battery
CounterBalance
MechanicalHandling
HandheldEquipment
Acquisition,Processing & MMI
BasePosition
BackpackEquipment
DeminePrototype
Figure 49 Overview of the mechanical composition
For test purposes at the current stage, we conduct a number of test without freehand scanning in order to have reproducible conditions for data processing and compari-son of results. For that purpose, the scanning was performed by an automatic scan-ner (laboratory test, tests in JRC Ispra) or frame from wood (tests in Angola) which was manually displaced.
The following pictures (Figure 50 to Figure 52) shall give a short impression about some components of the DEMINE system.
Figure 50 DEMINE sensor head and base station mounted at the scanning frame of the test field at JRC Ispra.
D16pub_4.doc Copyright DEMINE partners 2002 63 Created on 16.10.02
The contents of this report represent the opinions of the DEMINE project partners
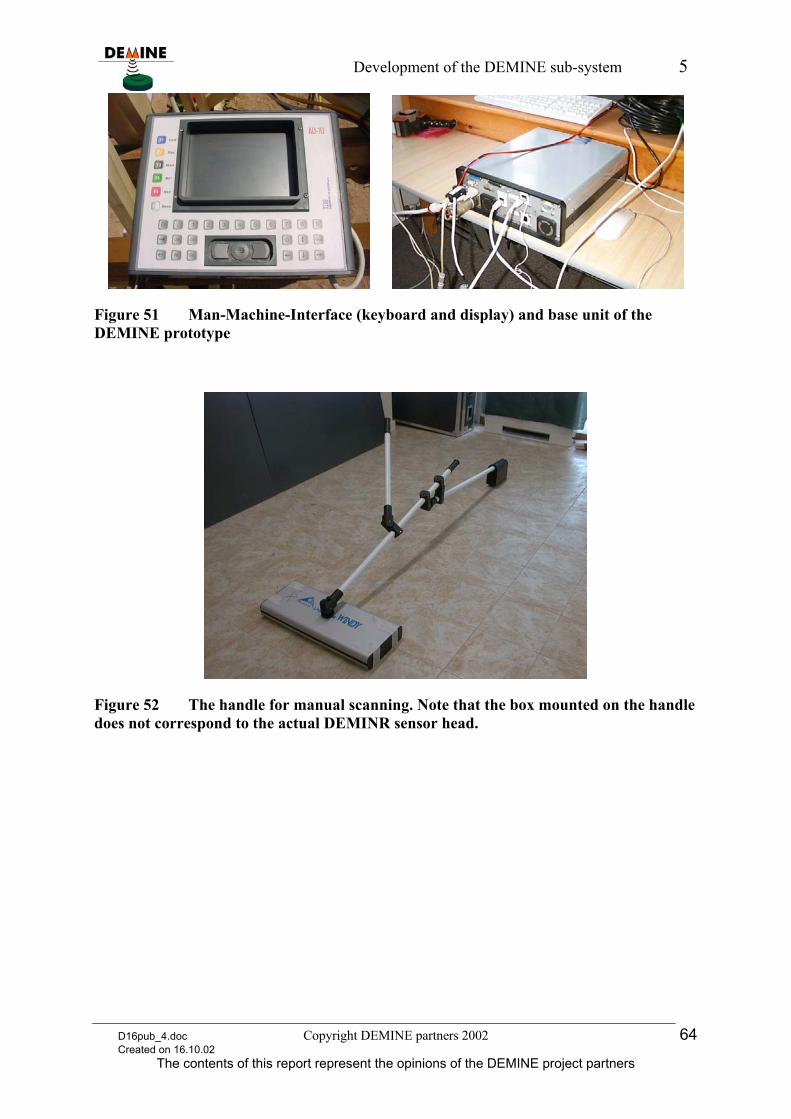
Development of the DEMINE sub-system 5
Figure 51 Man-Machine-Interface (keyboard and display) and base unit of the DEMINE prototype
Figure 52 The handle for manual scanning. Note that the box mounted on the handle does not correspond to the actual DEMINR sensor head.
D16pub_4.doc Copyright DEMINE partners 2002 64 Created on 16.10.02
The contents of this report represent the opinions of the DEMINE project partners
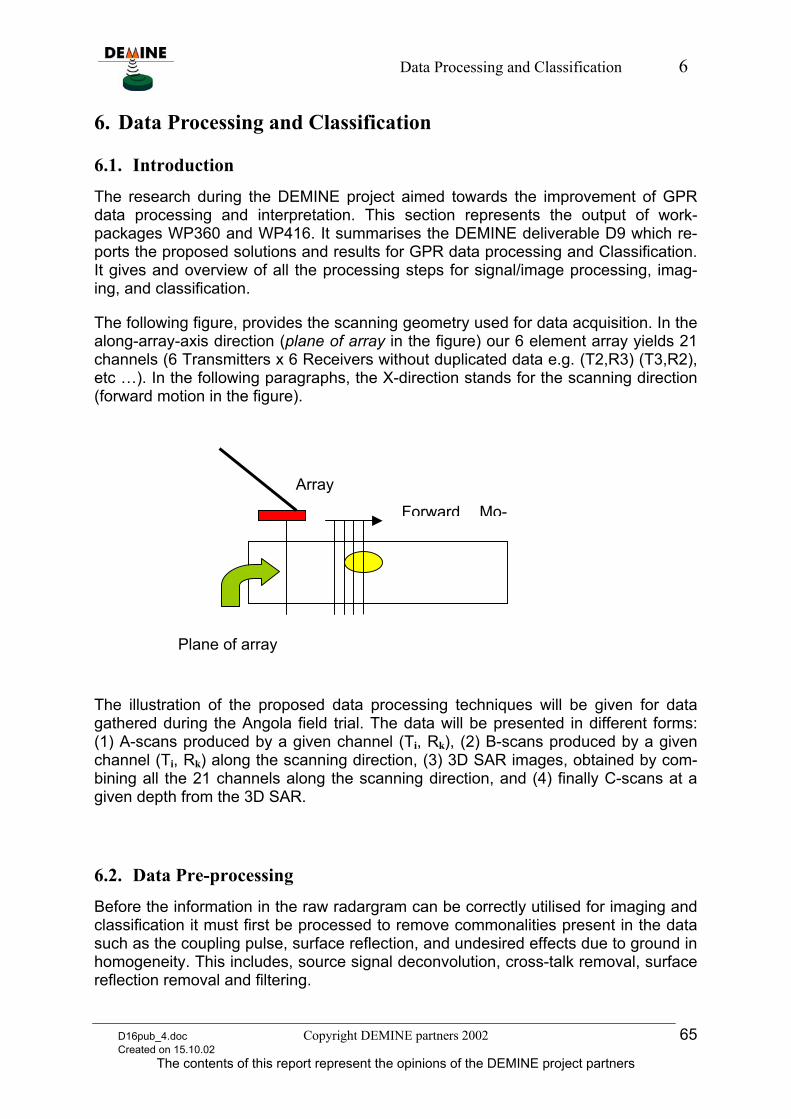
Data Processing and Classification 6
6. Data Processing and Classification
6.1. Introduction
The research during the DEMINE project aimed towards the improvement of GPR data processing and interpretation. This section represents the output of work-packages WP360 and WP416. It summarises the DEMINE deliverable D9 which re-ports the proposed solutions and results for GPR data processing and Classification. It gives and overview of all the processing steps for signal/image processing, imag-ing, and classification.
The following figure, provides the scanning geometry used for data acquisition. In the along-array-axis direction (plane of array in the figure) our 6 element array yields 21 channels (6 Transmitters x 6 Receivers without duplicated data e.g. (T2,R3) (T3,R2), etc …). In the following paragraphs, the X-direction stands for the scanning direction (forward motion in the figure).
Plane of array
Array
Forward Mo-
The illustration of the proposed data processing techniques will be given for data gathered during the Angola field trial. The data will be presented in different forms: (1) A-scans produced by a given channel (Ti, Rk), (2) B-scans produced by a given channel (Ti, Rk) along the scanning direction, (3) 3D SAR images, obtained by com-bining all the 21 channels along the scanning direction, and (4) finally C-scans at a given depth from the 3D SAR.
6.2. Data Pre-processing
Before the information in the raw radargram can be correctly utilised for imaging and classification it must first be processed to remove commonalities present in the data such as the coupling pulse, surface reflection, and undesired effects due to ground in homogeneity. This includes, source signal deconvolution, cross-talk removal, surface reflection removal and filtering.
D16pub_4.doc Copyright DEMINE partners 2002 65 Created on 15.10.02
The contents of this report represent the opinions of the DEMINE project partners
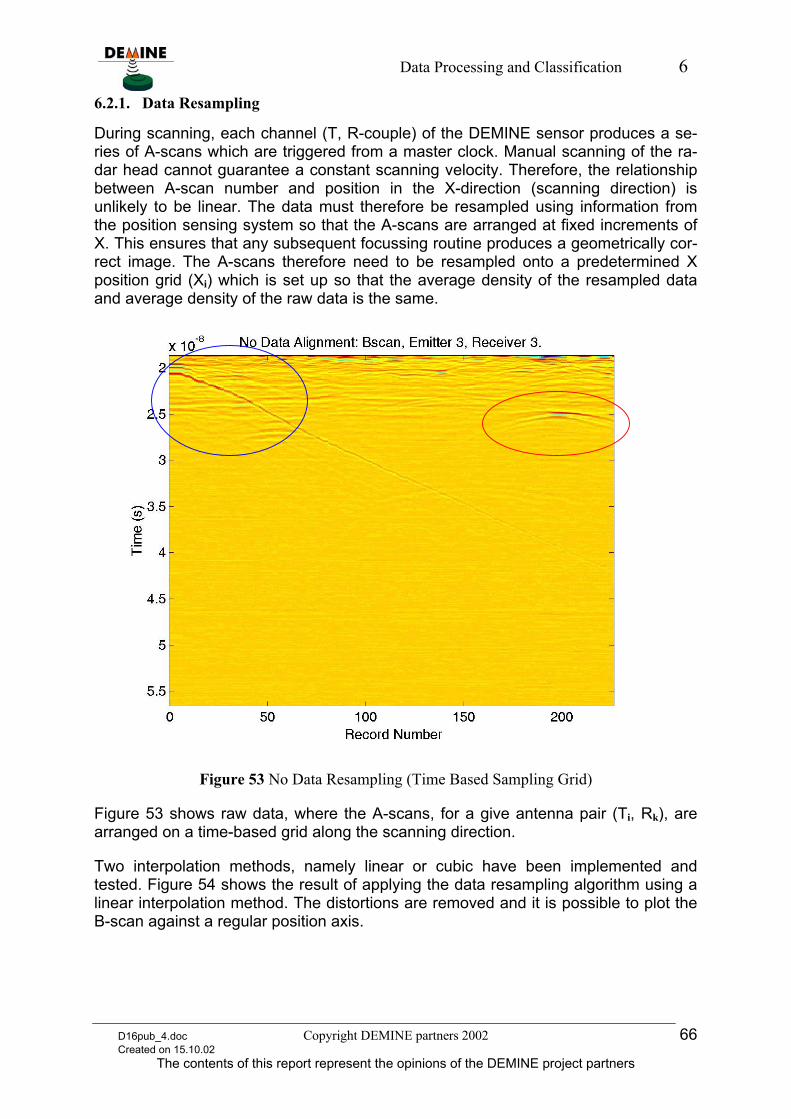
Data Processing and Classification 6
6.2.1. Data Resampling
During scanning, each channel (T, R-couple) of the DEMINE sensor produces a se-ries of A-scans which are triggered from a master clock. Manual scanning of the ra-dar head cannot guarantee a constant scanning velocity. Therefore, the relationship between A-scan number and position in the X-direction (scanning direction) is unlikely to be linear. The data must therefore be resampled using information from the position sensing system so that the A-scans are arranged at fixed increments of X. This ensures that any subsequent focussing routine produces a geometrically cor-rect image. The A-scans therefore need to be resampled onto a predetermined X position grid (Xi) which is set up so that the average density of the resampled data and average density of the raw data is the same.
Figure 53 No Data Resampling (Time Based Sampling Grid)
Figure 53 shows raw data, where the A-scans, for a give antenna pair (Ti, Rk), are arranged on a time-based grid along the scanning direction.
Two interpolation methods, namely linear or cubic have been implemented and tested. Figure 54 shows the result of applying the data resampling algorithm using a linear interpolation method. The distortions are removed and it is possible to plot the B-scan against a regular position axis.
D16pub_4.doc Copyright DEMINE partners 2002 66 Created on 15.10.02
The contents of this report represent the opinions of the DEMINE project partners
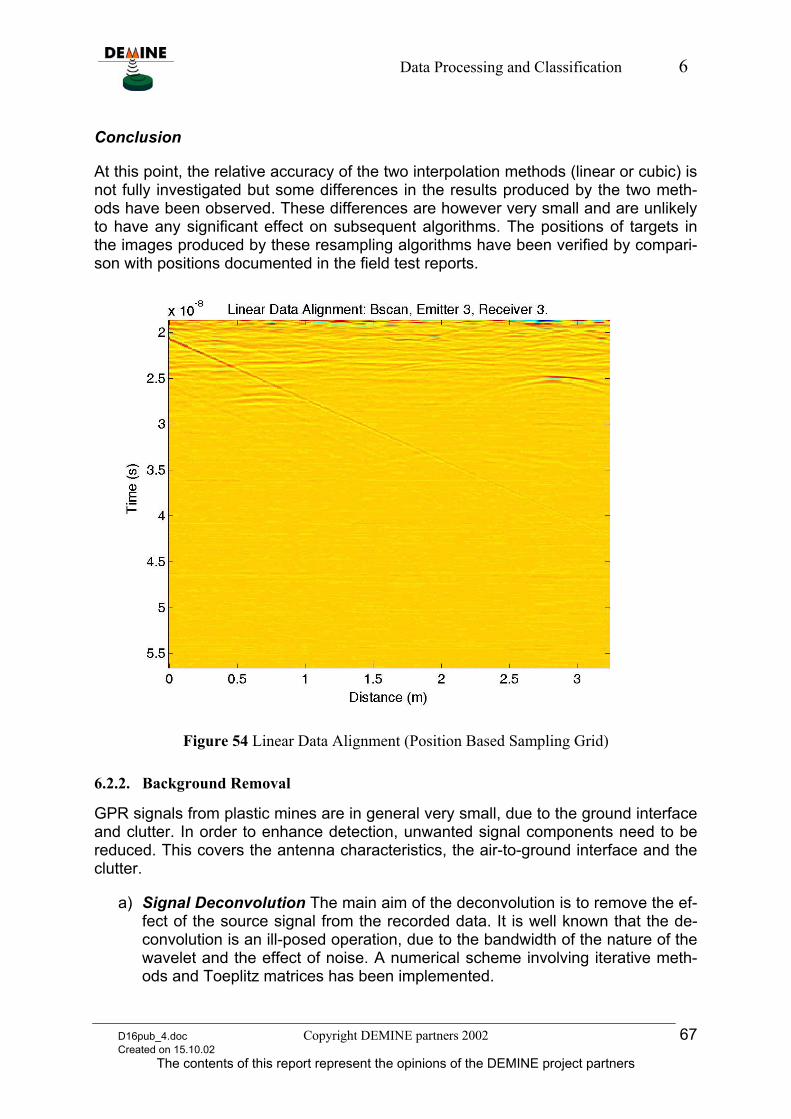
Data Processing and Classification 6
Conclusion
At this point, the relative accuracy of the two interpolation methods (linear or cubic) is not fully investigated but some differences in the results produced by the two meth-ods have been observed. These differences are however very small and are unlikely to have any significant effect on subsequent algorithms. The positions of targets in the images produced by these resampling algorithms have been verified by compari-son with positions documented in the field test reports.
Figure 54 Linear Data Alignment (Position Based Sampling Grid)
6.2.2. Background Removal
GPR signals from plastic mines are in general very small, due to the ground interface and clutter. In order to enhance detection, unwanted signal components need to be reduced. This covers the antenna characteristics, the air-to-ground interface and the clutter.
a) Signal Deconvolution The main aim of the deconvolution is to remove the ef-fect of the source signal from the recorded data. It is well known that the de-convolution is an ill-posed operation, due to the bandwidth of the nature of the wavelet and the effect of noise. A numerical scheme involving iterative meth-ods and Toeplitz matrices has been implemented.
D16pub_4.doc Copyright DEMINE partners 2002 67 Created on 15.10.02
The contents of this report represent the opinions of the DEMINE project partners
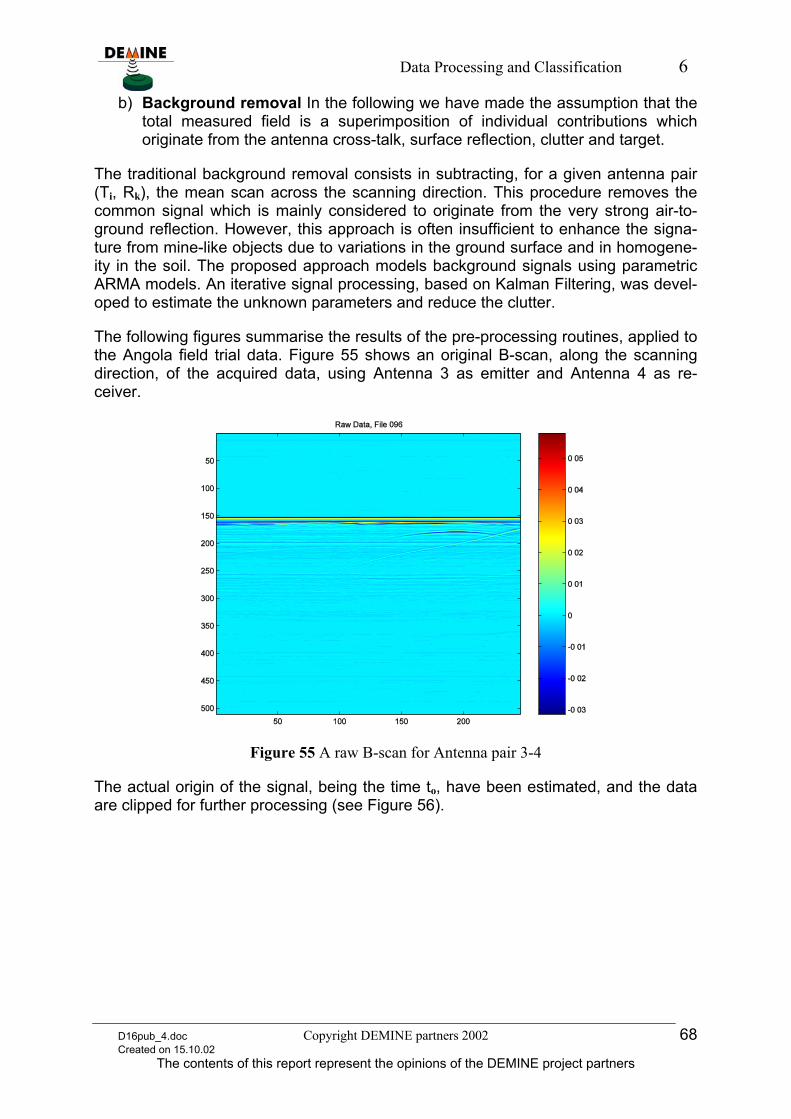
Data Processing and Classification 6
b) Background removal In the following we have made the assumption that the total measured field is a superimposition of individual contributions which originate from the antenna cross-talk, surface reflection, clutter and target.
The traditional background removal consists in subtracting, for a given antenna pair (Ti, Rk), the mean scan across the scanning direction. This procedure removes the common signal which is mainly considered to originate from the very strong air-to-ground reflection. However, this approach is often insufficient to enhance the signa-ture from mine-like objects due to variations in the ground surface and in homogene-ity in the soil. The proposed approach models background signals using parametric ARMA models. An iterative signal processing, based on Kalman Filtering, was devel-oped to estimate the unknown parameters and reduce the clutter.
The following figures summarise the results of the pre-processing routines, applied to the Angola field trial data. Figure 55 shows an original B-scan, along the scanning direction, of the acquired data, using Antenna 3 as emitter and Antenna 4 as re-ceiver.
Figure 55 A raw B-scan for Antenna pair 3-4
The actual origin of the signal, being the time to, have been estimated, and the data are clipped for further processing (see Figure 56).
D16pub_4.doc Copyright DEMINE partners 2002 68 Created on 15.10.02
The contents of this report represent the opinions of the DEMINE project partners
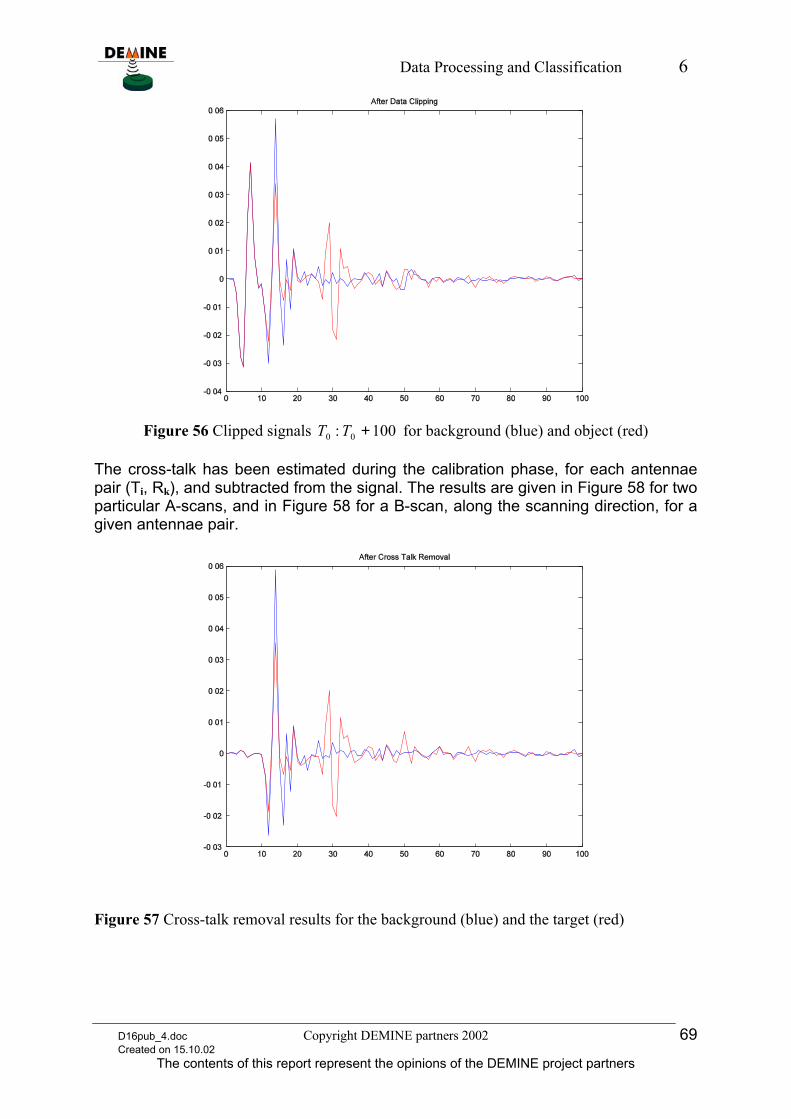
Data Processing and Classification 6
Figure 56 Clipped signals T for background (blue) and object (red) 100: 00 +T
The cross-talk has been estimated during the calibration phase, for each antennae pair (Ti, Rk), and subtracted from the signal. The results are given in Figure 58 for two particular A-scans, and in Figure 58 for a B-scan, along the scanning direction, for a given antennae pair.
Figure 57 Cross-talk removal results for the background (blue) and the target (red)
D16pub_4.doc Copyright DEMINE partners 2002 69 Created on 15.10.02
The contents of this report represent the opinions of the DEMINE project partners
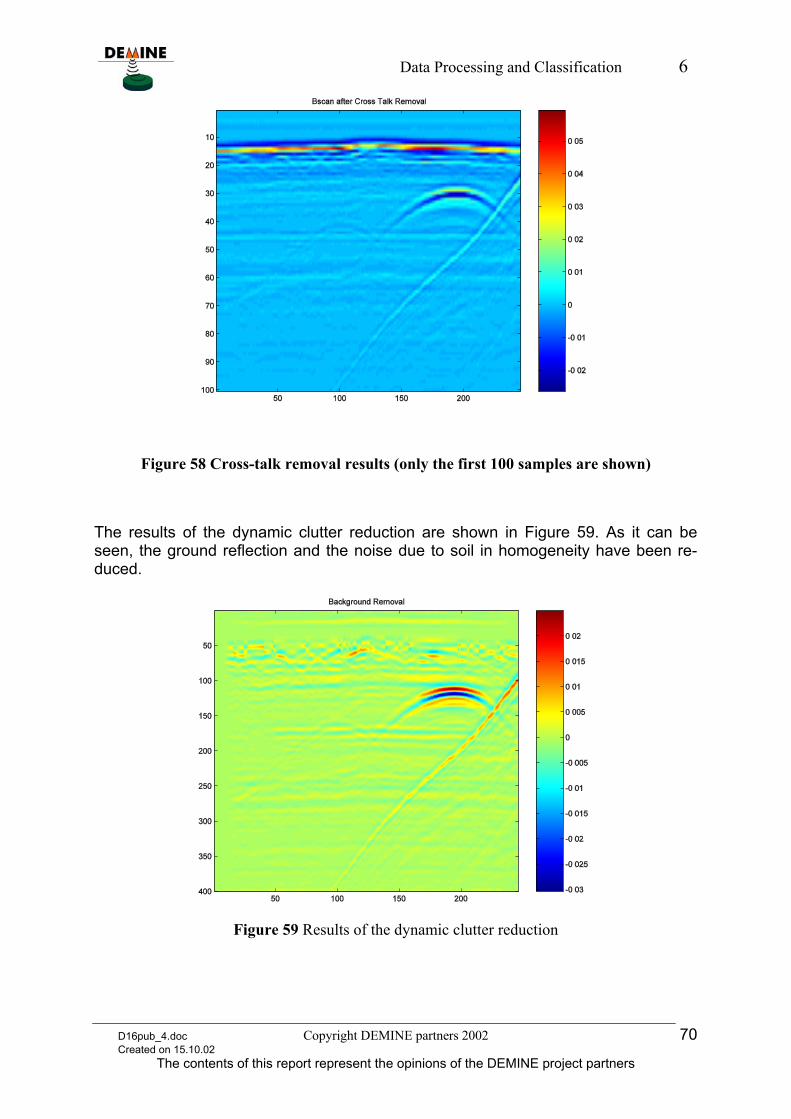
Data Processing and Classification 6
Figure 58 Cross-talk removal results (only the first 100 samples are shown)
The results of the dynamic clutter reduction are shown in Figure 59. As it can be seen, the ground reflection and the noise due to soil in homogeneity have been re-duced.
Figure 59 Results of the dynamic clutter reduction
D16pub_4.doc Copyright DEMINE partners 2002 70 Created on 15.10.02
The contents of this report represent the opinions of the DEMINE project partners
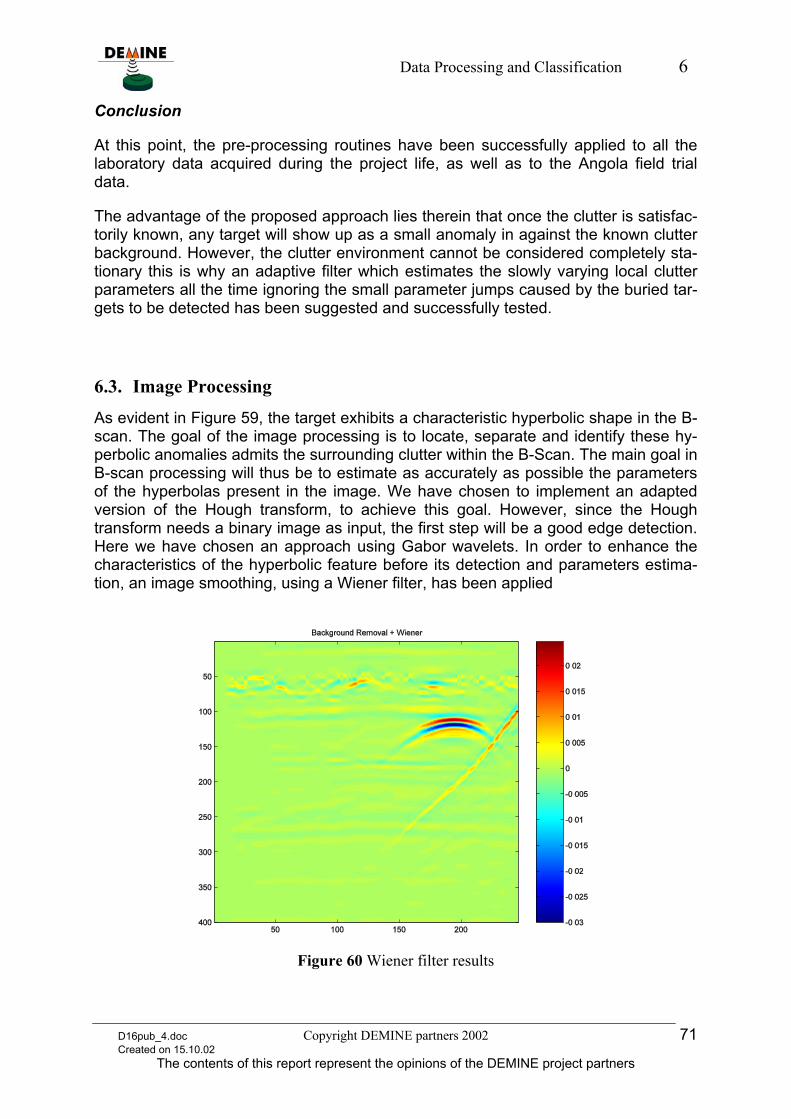
Data Processing and Classification 6
Conclusion
At this point, the pre-processing routines have been successfully applied to all the laboratory data acquired during the project life, as well as to the Angola field trial data.
The advantage of the proposed approach lies therein that once the clutter is satisfac-torily known, any target will show up as a small anomaly in against the known clutter background. However, the clutter environment cannot be considered completely sta-tionary this is why an adaptive filter which estimates the slowly varying local clutter parameters all the time ignoring the small parameter jumps caused by the buried tar-gets to be detected has been suggested and successfully tested.
6.3. Image Processing
As evident in Figure 59, the target exhibits a characteristic hyperbolic shape in the B-scan. The goal of the image processing is to locate, separate and identify these hy-perbolic anomalies admits the surrounding clutter within the B-Scan. The main goal in B-scan processing will thus be to estimate as accurately as possible the parameters of the hyperbolas present in the image. We have chosen to implement an adapted version of the Hough transform, to achieve this goal. However, since the Hough transform needs a binary image as input, the first step will be a good edge detection. Here we have chosen an approach using Gabor wavelets. In order to enhance the characteristics of the hyperbolic feature before its detection and parameters estima-tion, an image smoothing, using a Wiener filter, has been applied
Figure 60 Wiener filter results
D16pub_4.doc Copyright DEMINE partners 2002 71 Created on 15.10.02
The contents of this report represent the opinions of the DEMINE project partners
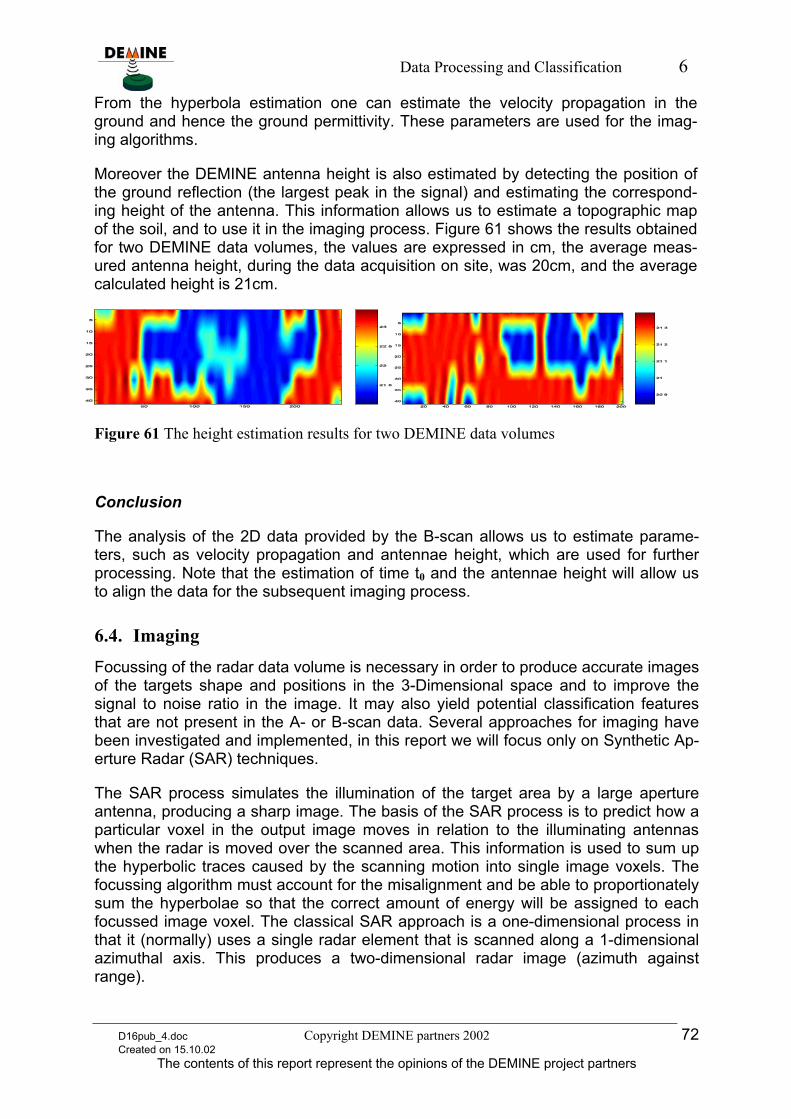
Data Processing and Classification 6
From the hyperbola estimation one can estimate the velocity propagation in the ground and hence the ground permittivity. These parameters are used for the imag-ing algorithms.
Moreover the DEMINE antenna height is also estimated by detecting the position of the ground reflection (the largest peak in the signal) and estimating the correspond-ing height of the antenna. This information allows us to estimate a topographic map of the soil, and to use it in the imaging process. Figure 61 shows the results obtained for two DEMINE data volumes, the values are expressed in cm, the average meas-ured antenna height, during the data acquisition on site, was 20cm, and the average calculated height is 21cm.
Figure 61 The height estimation results for two DEMINE data volumes
Conclusion
The analysis of the 2D data provided by the B-scan allows us to estimate parame-ters, such as velocity propagation and antennae height, which are used for further processing. Note that the estimation of time t0 and the antennae height will allow us to align the data for the subsequent imaging process.
6.4. Imaging
Focussing of the radar data volume is necessary in order to produce accurate images of the targets shape and positions in the 3-Dimensional space and to improve the signal to noise ratio in the image. It may also yield potential classification features that are not present in the A- or B-scan data. Several approaches for imaging have been investigated and implemented, in this report we will focus only on Synthetic Ap-erture Radar (SAR) techniques.
The SAR process simulates the illumination of the target area by a large aperture antenna, producing a sharp image. The basis of the SAR process is to predict how a particular voxel in the output image moves in relation to the illuminating antennas when the radar is moved over the scanned area. This information is used to sum up the hyperbolic traces caused by the scanning motion into single image voxels. The focussing algorithm must account for the misalignment and be able to proportionately sum the hyperbolae so that the correct amount of energy will be assigned to each focussed image voxel. The classical SAR approach is a one-dimensional process in that it (normally) uses a single radar element that is scanned along a 1-dimensional azimuthal axis. This produces a two-dimensional radar image (azimuth against range).
D16pub_4.doc Copyright DEMINE partners 2002 72 Created on 15.10.02
The contents of this report represent the opinions of the DEMINE project partners
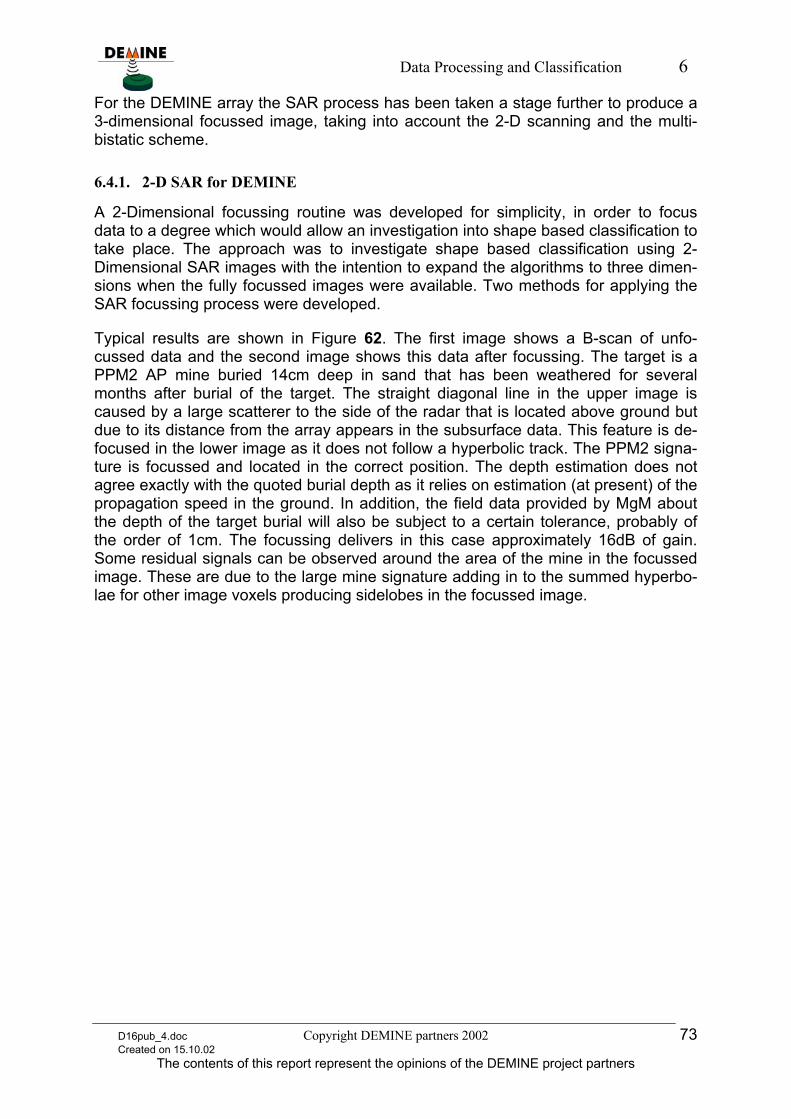
Data Processing and Classification 6
For the DEMINE array the SAR process has been taken a stage further to produce a 3-dimensional focussed image, taking into account the 2-D scanning and the multi-bistatic scheme.
6.4.1. 2-D SAR for DEMINE
A 2-Dimensional focussing routine was developed for simplicity, in order to focus data to a degree which would allow an investigation into shape based classification to take place. The approach was to investigate shape based classification using 2-Dimensional SAR images with the intention to expand the algorithms to three dimen-sions when the fully focussed images were available. Two methods for applying the SAR focussing process were developed.
Typical results are shown in Figure 62. The first image shows a B-scan of unfo-cussed data and the second image shows this data after focussing. The target is a PPM2 AP mine buried 14cm deep in sand that has been weathered for several months after burial of the target. The straight diagonal line in the upper image is caused by a large scatterer to the side of the radar that is located above ground but due to its distance from the array appears in the subsurface data. This feature is de-focused in the lower image as it does not follow a hyperbolic track. The PPM2 signa-ture is focussed and located in the correct position. The depth estimation does not agree exactly with the quoted burial depth as it relies on estimation (at present) of the propagation speed in the ground. In addition, the field data provided by MgM about the depth of the target burial will also be subject to a certain tolerance, probably of the order of 1cm. The focussing delivers in this case approximately 16dB of gain. Some residual signals can be observed around the area of the mine in the focussed image. These are due to the large mine signature adding in to the summed hyperbo-lae for other image voxels producing sidelobes in the focussed image.
D16pub_4.doc Copyright DEMINE partners 2002 73 Created on 15.10.02
The contents of this report represent the opinions of the DEMINE project partners
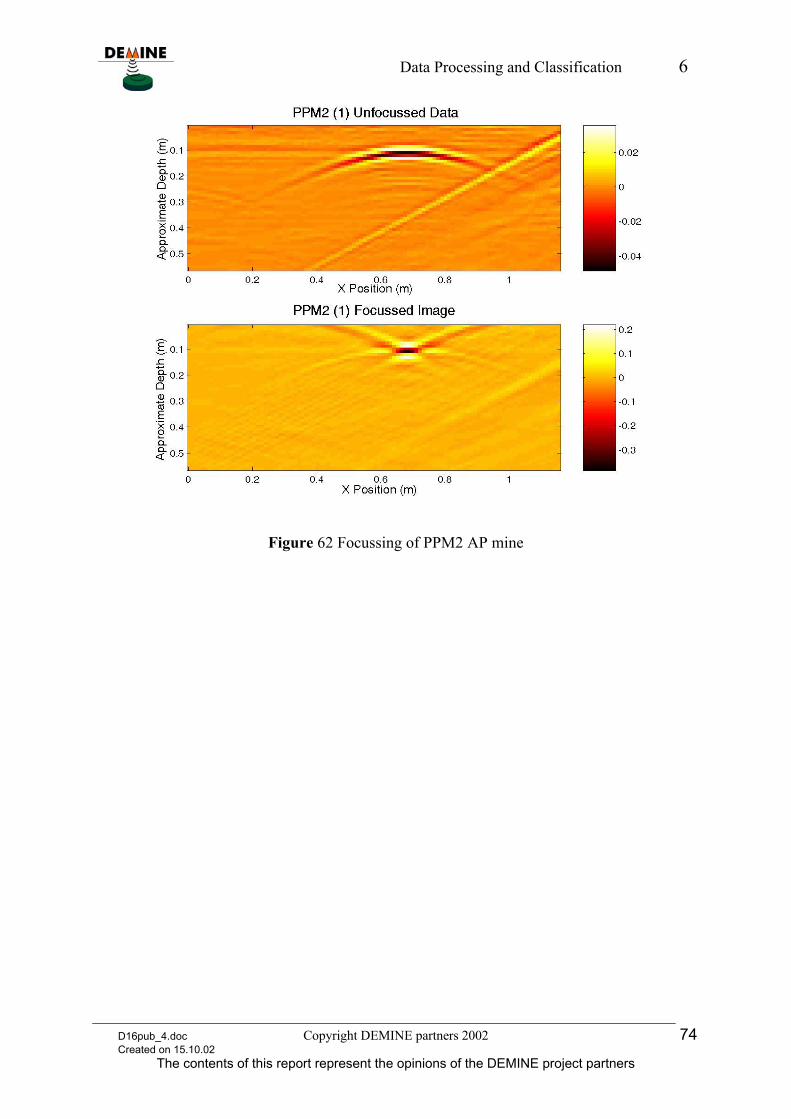
Data Processing and Classification 6
Figure 62 Focussing of PPM2 AP mine
D16pub_4.doc Copyright DEMINE partners 2002 74 Created on 15.10.02
The contents of this report represent the opinions of the DEMINE project partners
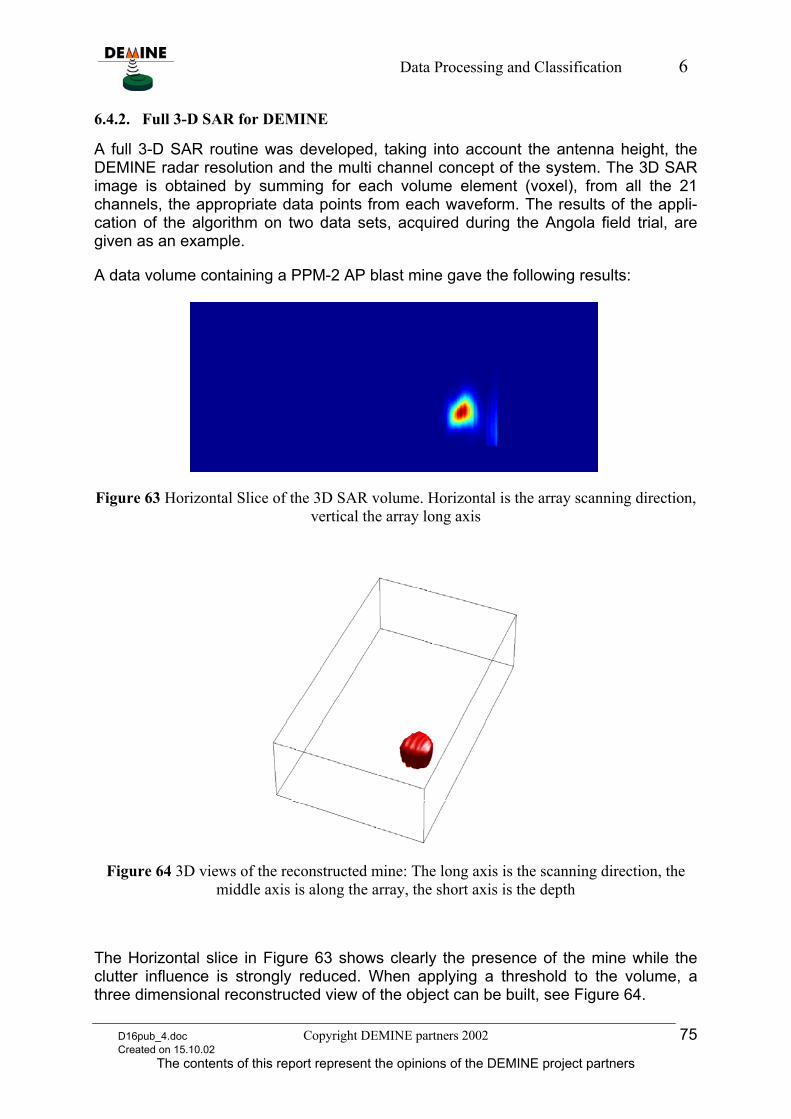
Data Processing and Classification 6
6.4.2. Full 3-D SAR for DEMINE
A full 3-D SAR routine was developed, taking into account the antenna height, the DEMINE radar resolution and the multi channel concept of the system. The 3D SAR image is obtained by summing for each volume element (voxel), from all the 21 channels, the appropriate data points from each waveform. The results of the appli-cation of the algorithm on two data sets, acquired during the Angola field trial, are given as an example.
A data volume containing a PPM-2 AP blast mine gave the following results:
Figure 63 Horizontal Slice of the 3D SAR volume. Horizontal is the array scanning direction, vertical the array long axis
Figure 64 3D views of the reconstructed mine: The long axis is the scanning direction, the middle axis is along the array, the short axis is the depth
The Horizontal slice in Figure 63 shows clearly the presence of the mine while the clutter influence is strongly reduced. When applying a threshold to the volume, a three dimensional reconstructed view of the object can be built, see Figure 64.
D16pub_4.doc Copyright DEMINE partners 2002 75 Created on 15.10.02
The contents of this report represent the opinions of the DEMINE project partners
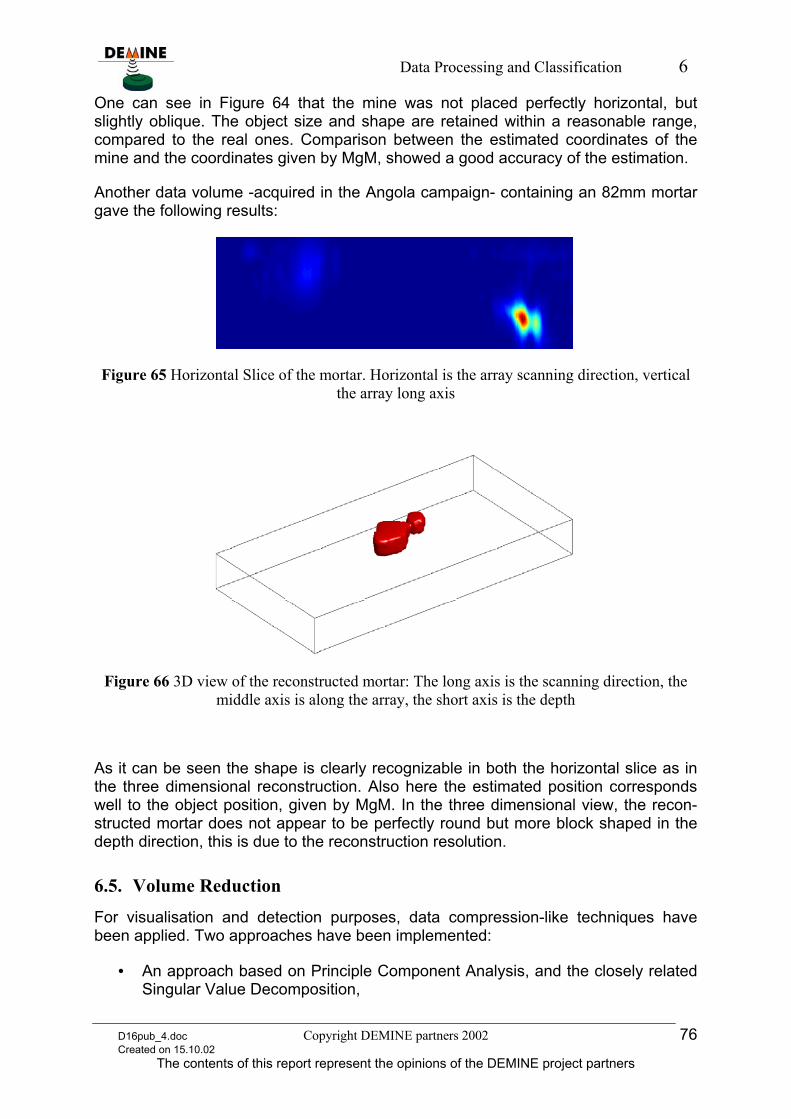
Data Processing and Classification 6
One can see in Figure 64 that the mine was not placed perfectly horizontal, but slightly oblique. The object size and shape are retained within a reasonable range, compared to the real ones. Comparison between the estimated coordinates of the mine and the coordinates given by MgM, showed a good accuracy of the estimation.
Another data volume -acquired in the Angola campaign- containing an 82mm mortar gave the following results:
Figure 65 Horizontal Slice of the mortar. Horizontal is the array scanning direction, vertical the array long axis
Figure 66 3D view of the reconstructed mortar: The long axis is the scanning direction, the middle axis is along the array, the short axis is the depth
As it can be seen the shape is clearly recognizable in both the horizontal slice as in the three dimensional reconstruction. Also here the estimated position corresponds well to the object position, given by MgM. In the three dimensional view, the recon-structed mortar does not appear to be perfectly round but more block shaped in the depth direction, this is due to the reconstruction resolution.
6.5. Volume Reduction
For visualisation and detection purposes, data compression-like techniques have been applied. Two approaches have been implemented:
• An approach based on Principle Component Analysis, and the closely related Singular Value Decomposition,
D16pub_4.doc Copyright DEMINE partners 2002 76 Created on 15.10.02
The contents of this report represent the opinions of the DEMINE project partners
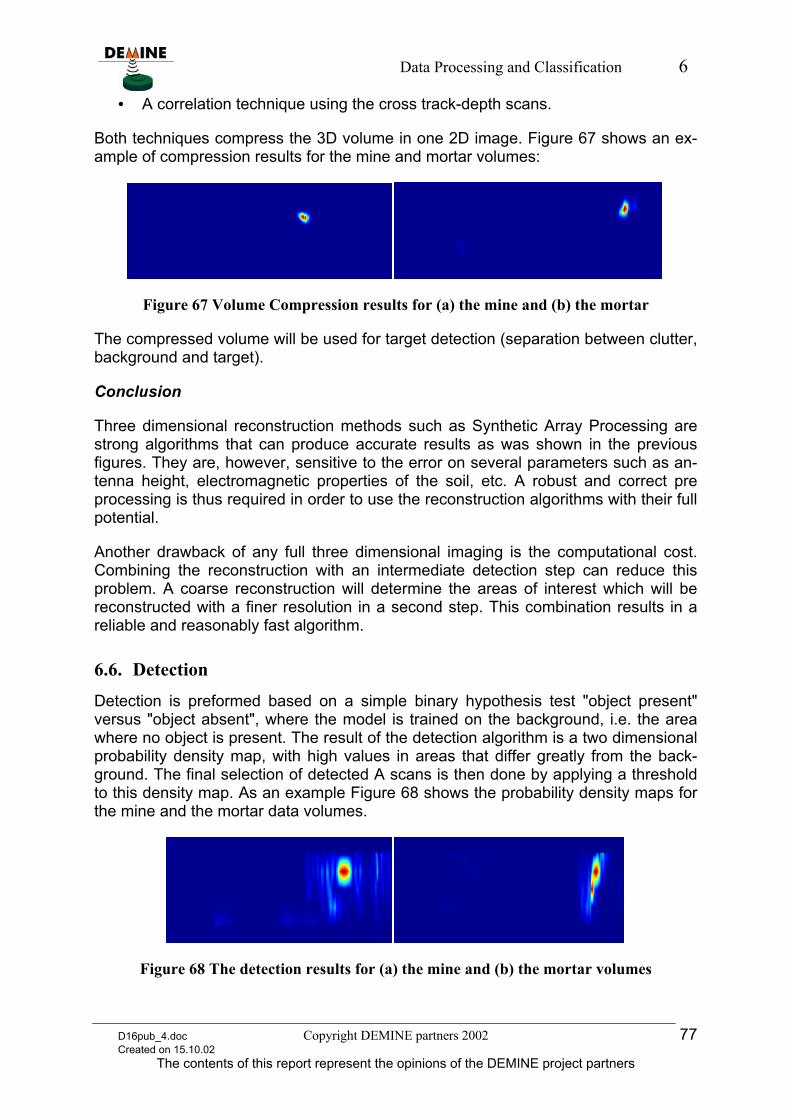
Data Processing and Classification 6
• A correlation technique using the cross track-depth scans.
Both techniques compress the 3D volume in one 2D image. Figure 67 shows an ex-ample of compression results for the mine and mortar volumes:
Figure 67 Volume Compression results for (a) the mine and (b) the mortar
The compressed volume will be used for target detection (separation between clutter, background and target).
Conclusion
Three dimensional reconstruction methods such as Synthetic Array Processing are strong algorithms that can produce accurate results as was shown in the previous figures. They are, however, sensitive to the error on several parameters such as an-tenna height, electromagnetic properties of the soil, etc. A robust and correct pre processing is thus required in order to use the reconstruction algorithms with their full potential.
Another drawback of any full three dimensional imaging is the computational cost. Combining the reconstruction with an intermediate detection step can reduce this problem. A coarse reconstruction will determine the areas of interest which will be reconstructed with a finer resolution in a second step. This combination results in a reliable and reasonably fast algorithm.
6.6. Detection
Detection is preformed based on a simple binary hypothesis test "object present" versus "object absent", where the model is trained on the background, i.e. the area where no object is present. The result of the detection algorithm is a two dimensional probability density map, with high values in areas that differ greatly from the back-ground. The final selection of detected A scans is then done by applying a threshold to this density map. As an example Figure 68 shows the probability density maps for the mine and the mortar data volumes.
Figure 68 The detection results for (a) the mine and (b) the mortar volumes
D16pub_4.doc Copyright DEMINE partners 2002 77 Created on 15.10.02
The contents of this report represent the opinions of the DEMINE project partners
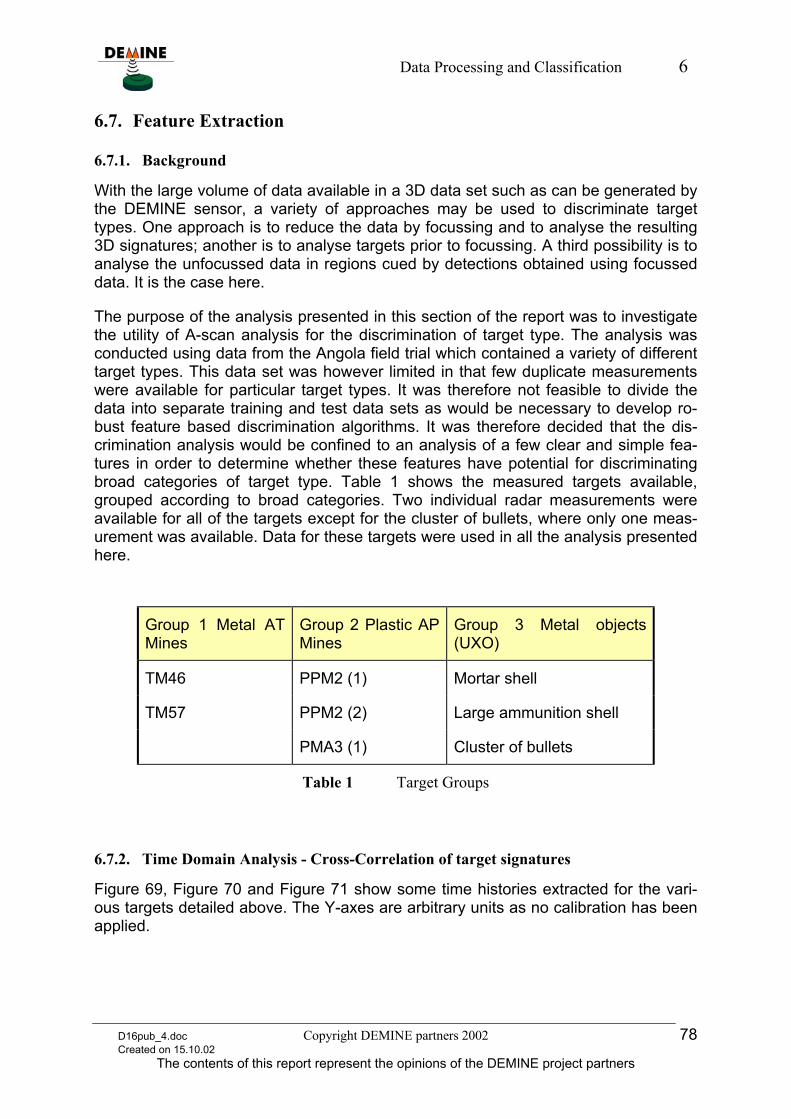
Data Processing and Classification 6
6.7. Feature Extraction
6.7.1. Background
With the large volume of data available in a 3D data set such as can be generated by the DEMINE sensor, a variety of approaches may be used to discriminate target types. One approach is to reduce the data by focussing and to analyse the resulting 3D signatures; another is to analyse targets prior to focussing. A third possibility is to analyse the unfocussed data in regions cued by detections obtained using focussed data. It is the case here.
The purpose of the analysis presented in this section of the report was to investigate the utility of A-scan analysis for the discrimination of target type. The analysis was conducted using data from the Angola field trial which contained a variety of different target types. This data set was however limited in that few duplicate measurements were available for particular target types. It was therefore not feasible to divide the data into separate training and test data sets as would be necessary to develop ro-bust feature based discrimination algorithms. It was therefore decided that the dis-crimination analysis would be confined to an analysis of a few clear and simple fea-tures in order to determine whether these features have potential for discriminating broad categories of target type. Table 1 shows the measured targets available, grouped according to broad categories. Two individual radar measurements were available for all of the targets except for the cluster of bullets, where only one meas-urement was available. Data for these targets were used in all the analysis presented here.
Group 1 Metal AT Mines
Group 2 Plastic AP Mines
Group 3 Metal objects (UXO)
TM46 PPM2 (1) Mortar shell
TM57 PPM2 (2) Large ammunition shell
PMA3 (1) Cluster of bullets
Table 1 Target Groups
6.7.2. Time Domain Analysis - Cross-Correlation of target signatures
Figure 69, Figure 70 and Figure 71 show some time histories extracted for the vari-ous targets detailed above. The Y-axes are arbitrary units as no calibration has been applied.
D16pub_4.doc Copyright DEMINE partners 2002 78 Created on 15.10.02
The contents of this report represent the opinions of the DEMINE project partners
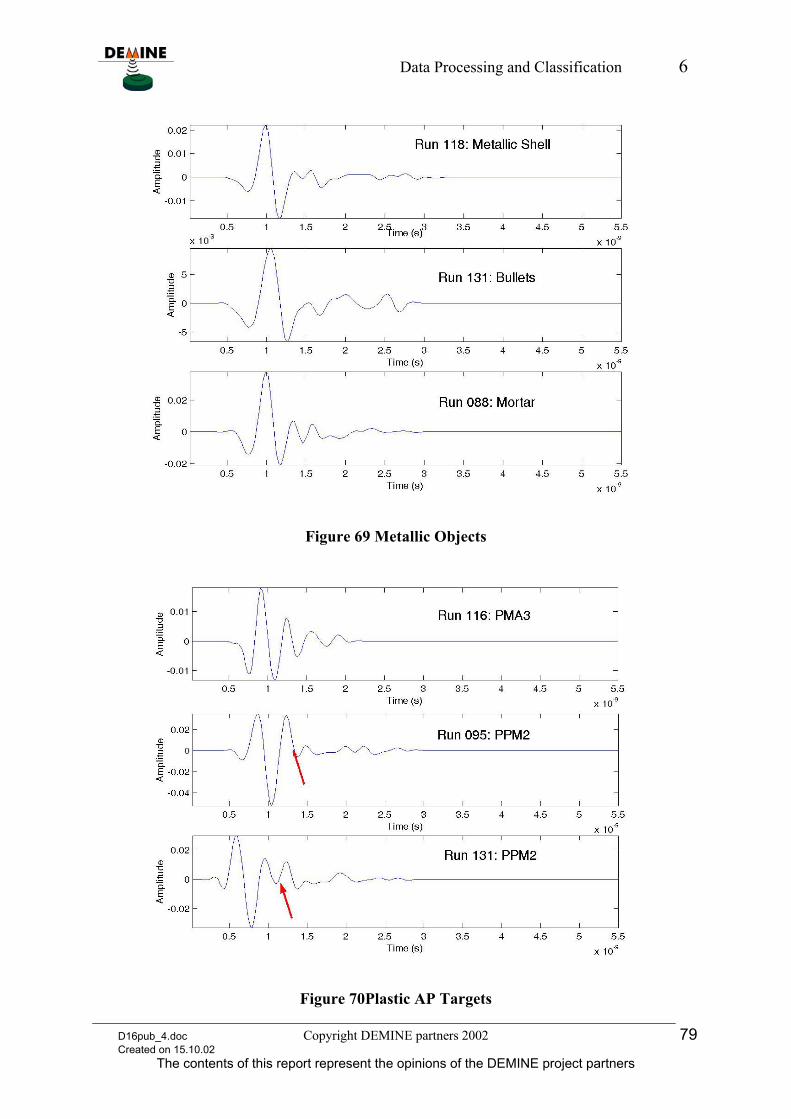
Data Processing and Classification 6
Figure 69 Metallic Objects
Figure 70Plastic AP Targets
D16pub_4.doc Copyright DEMINE partners 2002 79 Created on 15.10.02
The contents of this report represent the opinions of the DEMINE project partners
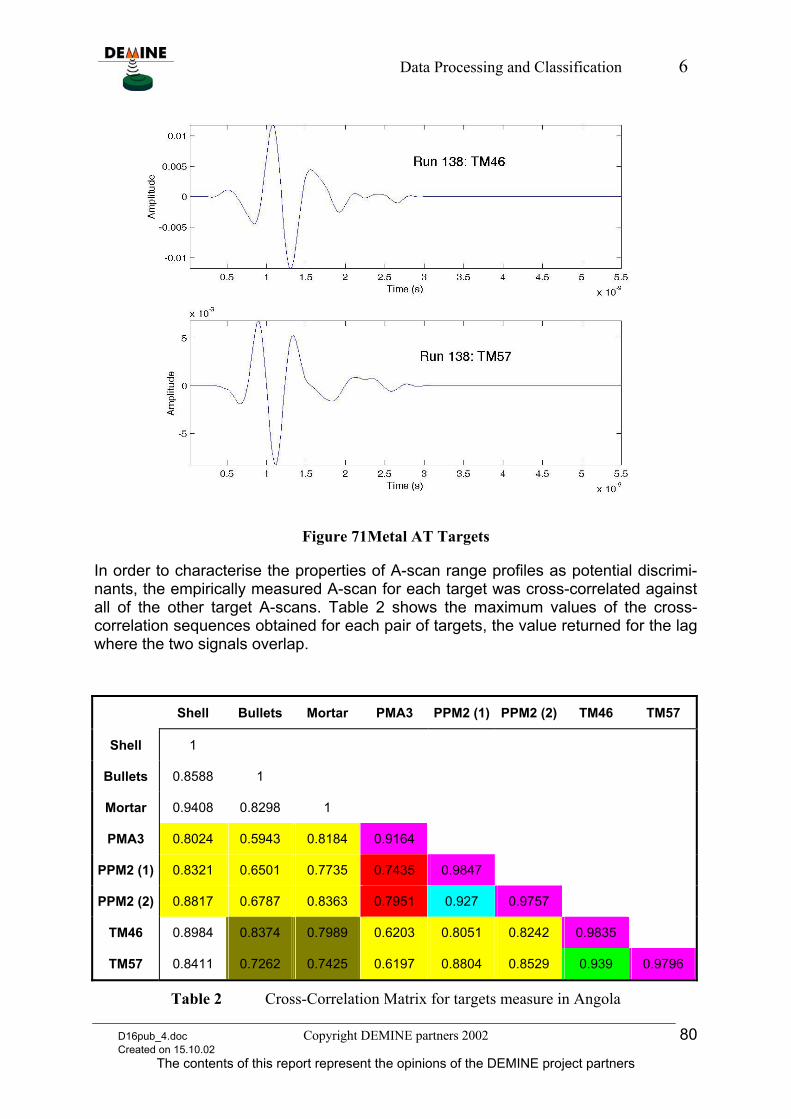
Data Processing and Classification 6
Figure 71Metal AT Targets
In order to characterise the properties of A-scan range profiles as potential discrimi-nants, the empirically measured A-scan for each target was cross-correlated against all of the other target A-scans. Table 2 shows the maximum values of the cross-correlation sequences obtained for each pair of targets, the value returned for the lag where the two signals overlap.
Shell Bullets Mortar PMA3 PPM2 (1) PPM2 (2) TM46 TM57
Shell 1
Bullets 0.8588 1
Mortar 0.9408 0.8298 1
PMA3 0.8024 0.5943 0.8184 0.9164
PPM2 (1) 0.8321 0.6501 0.7735 0.7435 0.9847
PPM2 (2) 0.8817 0.6787 0.8363 0.7951 0.927 0.9757
TM46 0.8984 0.8374 0.7989 0.6203 0.8051 0.8242 0.9835
TM57 0.8411 0.7262 0.7425 0.6197 0.8804 0.8529 0.939 0.9796
Table 2 Cross-Correlation Matrix for targets measure in Angola
D16pub_4.doc Copyright DEMINE partners 2002 80 Created on 15.10.02
The contents of this report represent the opinions of the DEMINE project partners
Data Processing and Classification 6
If the A-scans of targets in a given category are useful discriminants then high cross correlations are expected within categories and low cross correlations are expected between categories. If elements in the table with values above 0.85 are considered as indicating a possible similarity between two targets and those with values above 0.9 are considered as indicating firm similarities between targets, then one can con-clude that in general terms:
• the 2 examples of the PPM2 AP mine correlate well, ( )
• the 2 types of metal AT mine correlate well, ( )
• the plastic targets generally do not correlate well with the metal ones, ( )
• the 2 different types of plastic mine do not correlate well, ( )
• metal targets with small scattering areas (e.g. bullet cases) do not correlate well with metal targets with large scattering areas (e.g. AT mines), ( )
• Measurements on individual targets are repeatable ( )
Note that the elements containing cross correlation coefficients of 1 indicate that re-peat measurements on those targets were not able to be analysed, so to complete the table the signatures were auto correlated.
These observations confirm the potential of A-scan analysis to:
• discriminate plastic objects from metal ones,
• to discriminate between metal mines and small clutter objects and
• to discriminate between the type of plastic mine.
However, there are some anomalies in the table which do not follow these rules, so this indicator alone cannot be used to classify targets - it must be combined with sev-eral others in order to produce robust performance. There are also certain factors, which have not been compensated for here which can affect target signatures which in turn may affect the ability to classify the target. One such effect is indicated in Figure 69 by the red arrows. The two PPM2 mines were buried at depths of 14cm and 2cm. The highlighted area indicates a feature that is inconsistent between the two traces. There are several possible causes for this:
• Variations between the impulse responses of the 2 measuring radar channels,
• Multiple reflections between the ground/air interface and the mine,
• Multiple reflections between the ground/air interface and the radar itself,
D16pub_4.doc Copyright DEMINE partners 2002 81 Created on 15.10.02
The contents of this report represent the opinions of the DEMINE project partners
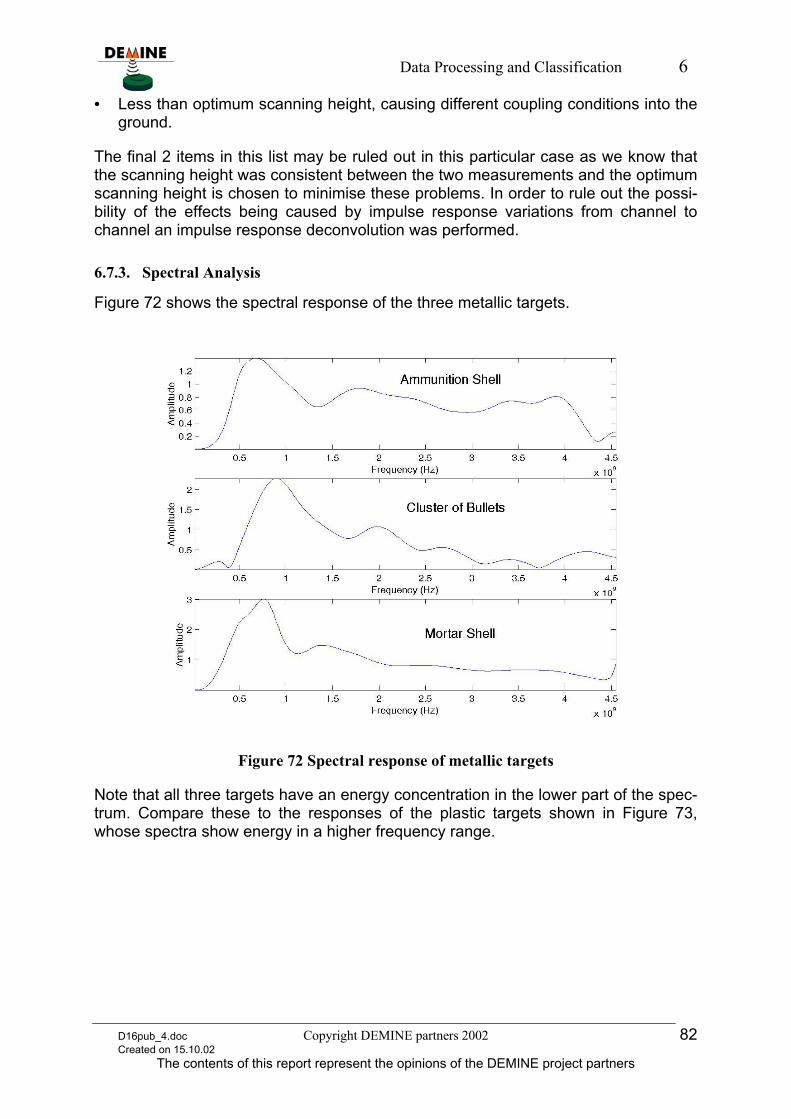
Data Processing and Classification 6
• Less than optimum scanning height, causing different coupling conditions into the ground.
The final 2 items in this list may be ruled out in this particular case as we know that the scanning height was consistent between the two measurements and the optimum scanning height is chosen to minimise these problems. In order to rule out the possi-bility of the effects being caused by impulse response variations from channel to channel an impulse response deconvolution was performed.
6.7.3. Spectral Analysis
Figure 72 shows the spectral response of the three metallic targets.
Figure 72 Spectral response of metallic targets
Note that all three targets have an energy concentration in the lower part of the spec-trum. Compare these to the responses of the plastic targets shown in Figure 73, whose spectra show energy in a higher frequency range.
D16pub_4.doc Copyright DEMINE partners 2002 82 Created on 15.10.02
The contents of this report represent the opinions of the DEMINE project partners
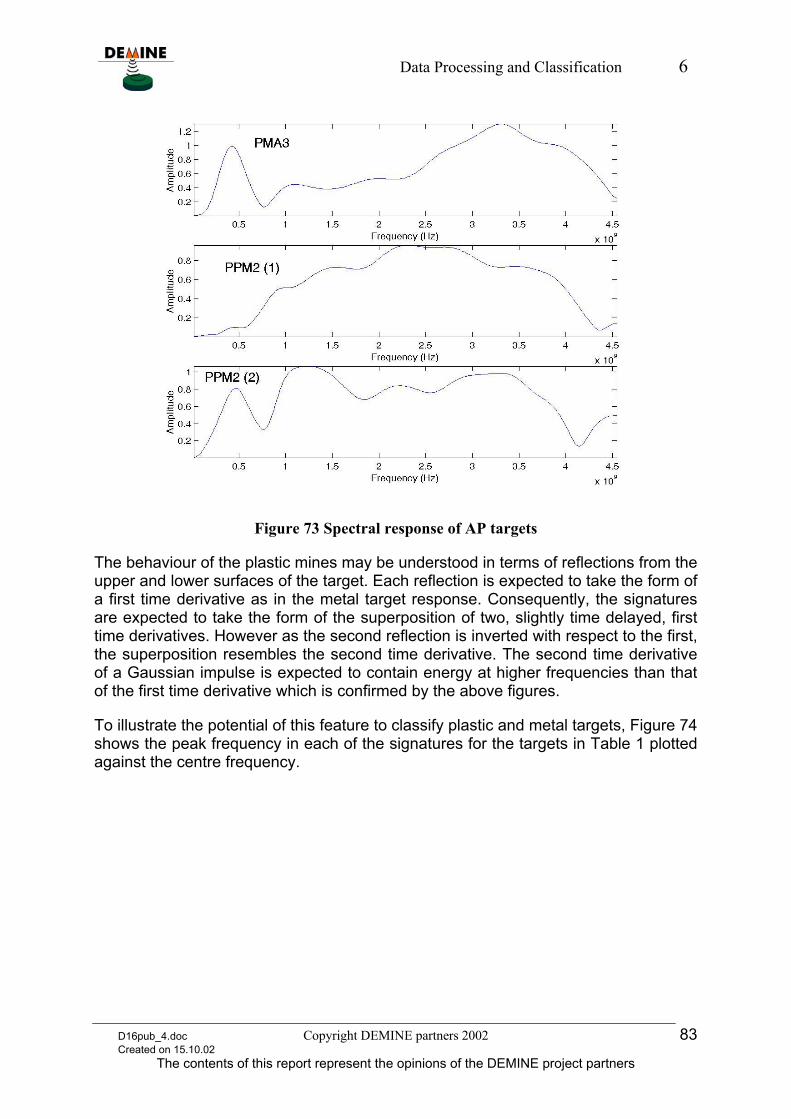
Data Processing and Classification 6
Figure 73 Spectral response of AP targets
The behaviour of the plastic mines may be understood in terms of reflections from the upper and lower surfaces of the target. Each reflection is expected to take the form of a first time derivative as in the metal target response. Consequently, the signatures are expected to take the form of the superposition of two, slightly time delayed, first time derivatives. However as the second reflection is inverted with respect to the first, the superposition resembles the second time derivative. The second time derivative of a Gaussian impulse is expected to contain energy at higher frequencies than that of the first time derivative which is confirmed by the above figures.
To illustrate the potential of this feature to classify plastic and metal targets, Figure 74 shows the peak frequency in each of the signatures for the targets in Table 1 plotted against the centre frequency.
D16pub_4.doc Copyright DEMINE partners 2002 83 Created on 15.10.02
The contents of this report represent the opinions of the DEMINE project partners
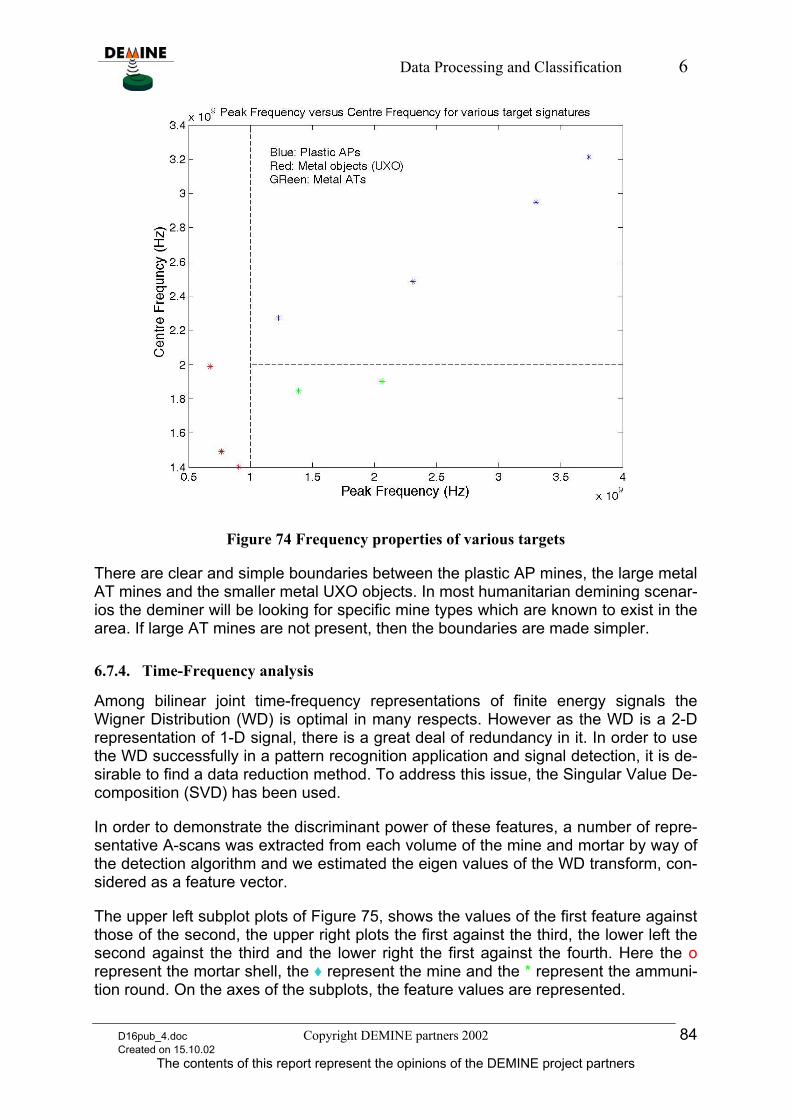
Data Processing and Classification 6
Figure 74 Frequency properties of various targets
There are clear and simple boundaries between the plastic AP mines, the large metal AT mines and the smaller metal UXO objects. In most humanitarian demining scenar-ios the deminer will be looking for specific mine types which are known to exist in the area. If large AT mines are not present, then the boundaries are made simpler.
6.7.4. Time-Frequency analysis
Among bilinear joint time-frequency representations of finite energy signals the Wigner Distribution (WD) is optimal in many respects. However as the WD is a 2-D representation of 1-D signal, there is a great deal of redundancy in it. In order to use the WD successfully in a pattern recognition application and signal detection, it is de-sirable to find a data reduction method. To address this issue, the Singular Value De-composition (SVD) has been used.
In order to demonstrate the discriminant power of these features, a number of repre-sentative A-scans was extracted from each volume of the mine and mortar by way of the detection algorithm and we estimated the eigen values of the WD transform, con-sidered as a feature vector.
The upper left subplot plots of Figure 75, shows the values of the first feature against those of the second, the upper right plots the first against the third, the lower left the second against the third and the lower right the first against the fourth. Here the o represent the mortar shell, the ♦ represent the mine and the * represent the ammuni-tion round. On the axes of the subplots, the feature values are represented.
D16pub_4.doc Copyright DEMINE partners 2002 84 Created on 15.10.02
The contents of this report represent the opinions of the DEMINE project partners
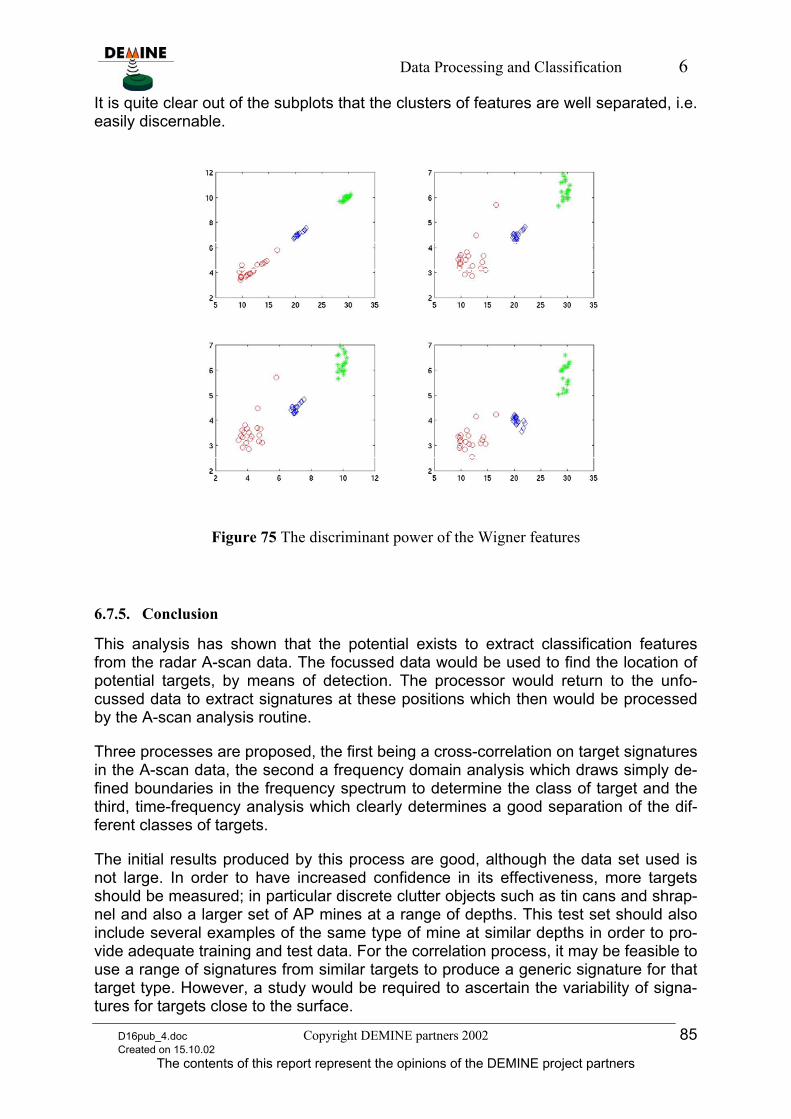
Data Processing and Classification 6
It is quite clear out of the subplots that the clusters of features are well separated, i.e. easily discernable.
Figure 75 The discriminant power of the Wigner features
6.7.5. Conclusion
This analysis has shown that the potential exists to extract classification features from the radar A-scan data. The focussed data would be used to find the location of potential targets, by means of detection. The processor would return to the unfo-cussed data to extract signatures at these positions which then would be processed by the A-scan analysis routine.
Three processes are proposed, the first being a cross-correlation on target signatures in the A-scan data, the second a frequency domain analysis which draws simply de-fined boundaries in the frequency spectrum to determine the class of target and the third, time-frequency analysis which clearly determines a good separation of the dif-ferent classes of targets.
The initial results produced by this process are good, although the data set used is not large. In order to have increased confidence in its effectiveness, more targets should be measured; in particular discrete clutter objects such as tin cans and shrap-nel and also a larger set of AP mines at a range of depths. This test set should also include several examples of the same type of mine at similar depths in order to pro-vide adequate training and test data. For the correlation process, it may be feasible to use a range of signatures from similar targets to produce a generic signature for that target type. However, a study would be required to ascertain the variability of signa-tures for targets close to the surface.
D16pub_4.doc Copyright DEMINE partners 2002 85 Created on 15.10.02
The contents of this report represent the opinions of the DEMINE project partners
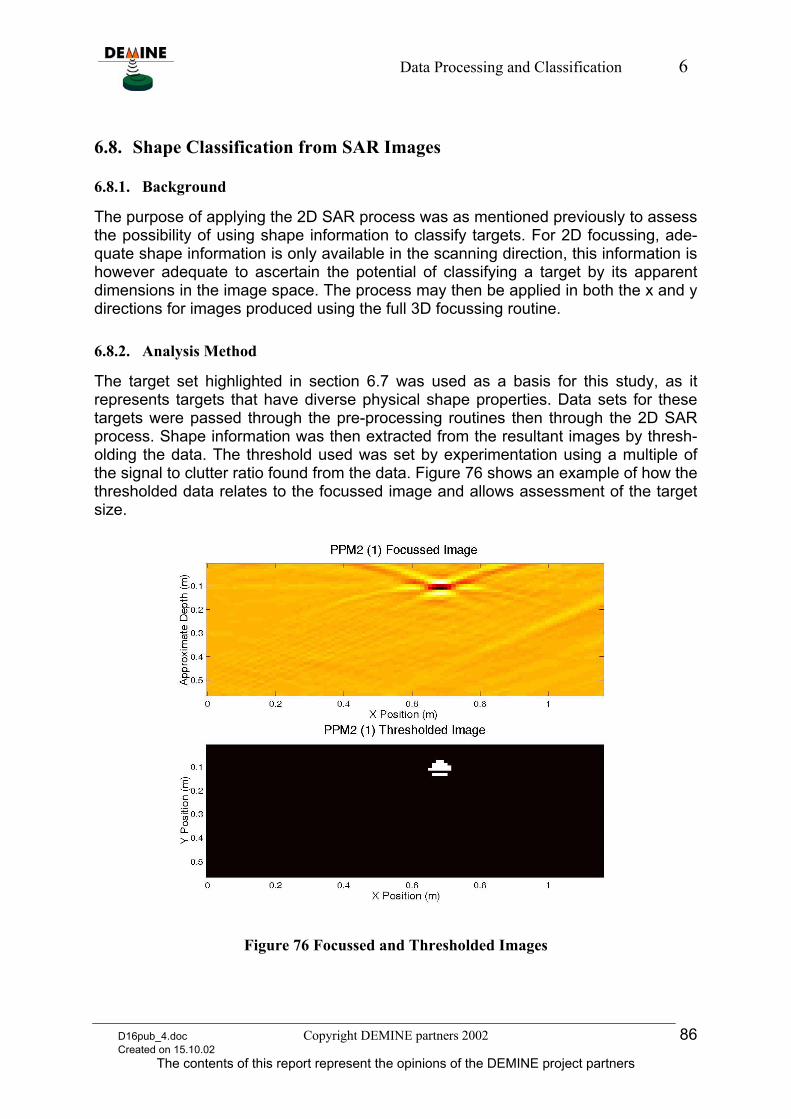
Data Processing and Classification 6
6.8. Shape Classification from SAR Images
6.8.1. Background
The purpose of applying the 2D SAR process was as mentioned previously to assess the possibility of using shape information to classify targets. For 2D focussing, ade-quate shape information is only available in the scanning direction, this information is however adequate to ascertain the potential of classifying a target by its apparent dimensions in the image space. The process may then be applied in both the x and y directions for images produced using the full 3D focussing routine.
6.8.2. Analysis Method
The target set highlighted in section 6.7 was used as a basis for this study, as it represents targets that have diverse physical shape properties. Data sets for these targets were passed through the pre-processing routines then through the 2D SAR process. Shape information was then extracted from the resultant images by thresh-olding the data. The threshold used was set by experimentation using a multiple of the signal to clutter ratio found from the data. Figure 76 shows an example of how the thresholded data relates to the focussed image and allows assessment of the target size.
Figure 76 Focussed and Thresholded Images
D16pub_4.doc Copyright DEMINE partners 2002 86 Created on 15.10.02
The contents of this report represent the opinions of the DEMINE project partners
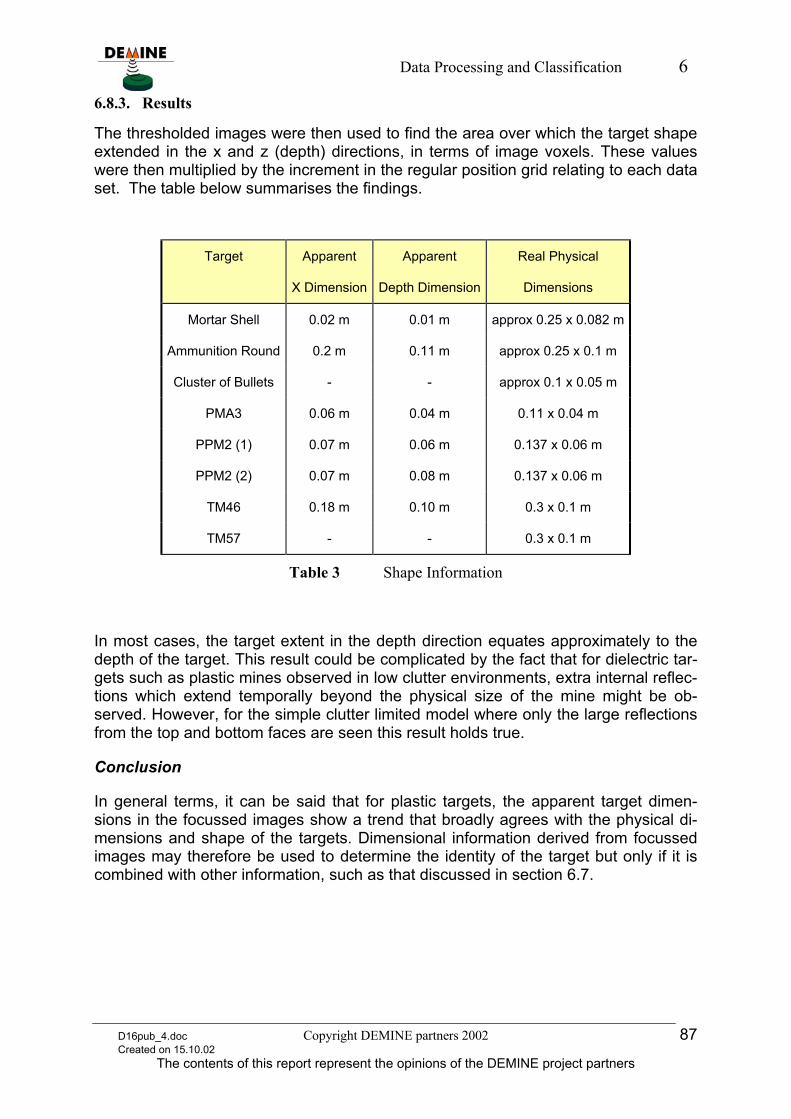
Data Processing and Classification 6
6.8.3. Results
The thresholded images were then used to find the area over which the target shape extended in the x and z (depth) directions, in terms of image voxels. These values were then multiplied by the increment in the regular position grid relating to each data set. The table below summarises the findings.
Target Apparent
X Dimension
Apparent
Depth Dimension
Real Physical
Dimensions
Mortar Shell 0.02 m 0.01 m approx 0.25 x 0.082 m
Ammunition Round 0.2 m 0.11 m approx 0.25 x 0.1 m
Cluster of Bullets - - approx 0.1 x 0.05 m
PMA3 0.06 m 0.04 m 0.11 x 0.04 m
PPM2 (1) 0.07 m 0.06 m 0.137 x 0.06 m
PPM2 (2) 0.07 m 0.08 m 0.137 x 0.06 m
TM46 0.18 m 0.10 m 0.3 x 0.1 m
TM57 - - 0.3 x 0.1 m
Table 3 Shape Information
In most cases, the target extent in the depth direction equates approximately to the depth of the target. This result could be complicated by the fact that for dielectric tar-gets such as plastic mines observed in low clutter environments, extra internal reflec-tions which extend temporally beyond the physical size of the mine might be ob-served. However, for the simple clutter limited model where only the large reflections from the top and bottom faces are seen this result holds true.
Conclusion
In general terms, it can be said that for plastic targets, the apparent target dimen-sions in the focussed images show a trend that broadly agrees with the physical di-mensions and shape of the targets. Dimensional information derived from focussed images may therefore be used to determine the identity of the target but only if it is combined with other information, such as that discussed in section 6.7.
D16pub_4.doc Copyright DEMINE partners 2002 87 Created on 15.10.02
The contents of this report represent the opinions of the DEMINE project partners
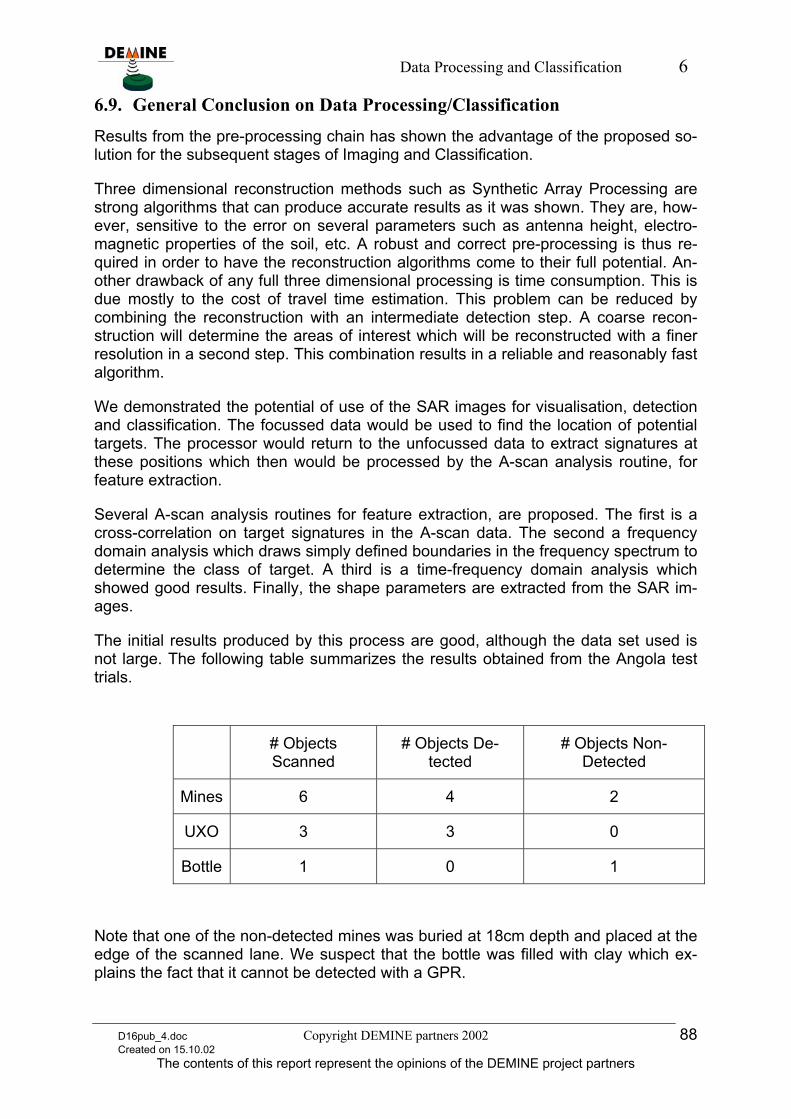
Data Processing and Classification 6
6.9. General Conclusion on Data Processing/Classification
Results from the pre-processing chain has shown the advantage of the proposed so-lution for the subsequent stages of Imaging and Classification.
Three dimensional reconstruction methods such as Synthetic Array Processing are strong algorithms that can produce accurate results as it was shown. They are, how-ever, sensitive to the error on several parameters such as antenna height, electro-magnetic properties of the soil, etc. A robust and correct pre-processing is thus re-quired in order to have the reconstruction algorithms come to their full potential. An-other drawback of any full three dimensional processing is time consumption. This is due mostly to the cost of travel time estimation. This problem can be reduced by combining the reconstruction with an intermediate detection step. A coarse recon-struction will determine the areas of interest which will be reconstructed with a finer resolution in a second step. This combination results in a reliable and reasonably fast algorithm.
We demonstrated the potential of use of the SAR images for visualisation, detection and classification. The focussed data would be used to find the location of potential targets. The processor would return to the unfocussed data to extract signatures at these positions which then would be processed by the A-scan analysis routine, for feature extraction.
Several A-scan analysis routines for feature extraction, are proposed. The first is a cross-correlation on target signatures in the A-scan data. The second a frequency domain analysis which draws simply defined boundaries in the frequency spectrum to determine the class of target. A third is a time-frequency domain analysis which showed good results. Finally, the shape parameters are extracted from the SAR im-ages.
The initial results produced by this process are good, although the data set used is not large. The following table summarizes the results obtained from the Angola test trials.
# Objects Scanned
# Objects De-tected
# Objects Non-Detected
Mines 6 4 2
UXO 3 3 0
Bottle 1 0 1
Note that one of the non-detected mines was buried at 18cm depth and placed at the edge of the scanned lane. We suspect that the bottle was filled with clay which ex-plains the fact that it cannot be detected with a GPR.
D16pub_4.doc Copyright DEMINE partners 2002 88 Created on 15.10.02
The contents of this report represent the opinions of the DEMINE project partners

Test of the DEMINE-System 7
In order to have increased confidence in its effectiveness, more targets should be measured; in particular discrete clutter objects such as tin cans and shrapnel and also a larger set of AP mines at a range of depths.
This test set should also include several examples of the same type of mine at similar depths in order to provide adequate training and test data. For the correlation proc-ess, it may be feasible to use a range of signatures from similar targets to produce a generic signature for that target type. However, a study would be required to ascer-tain the variability of signatures for targets close to the surface.
D16pub_4.doc Copyright DEMINE partners 2002 89 Created on 15.10.02
The contents of this report represent the opinions of the DEMINE project partners
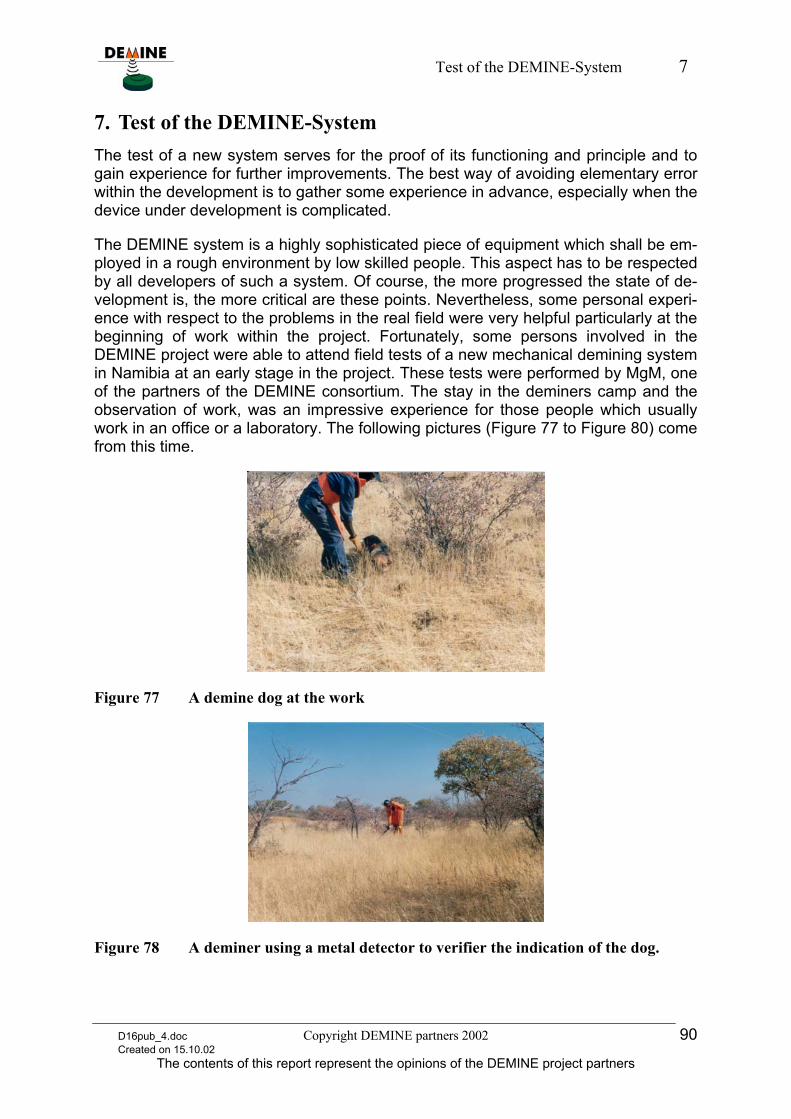
Test of the DEMINE-System 7
7. Test of the DEMINE-System The test of a new system serves for the proof of its functioning and principle and to gain experience for further improvements. The best way of avoiding elementary error within the development is to gather some experience in advance, especially when the device under development is complicated.
The DEMINE system is a highly sophisticated piece of equipment which shall be em-ployed in a rough environment by low skilled people. This aspect has to be respected by all developers of such a system. Of course, the more progressed the state of de-velopment is, the more critical are these points. Nevertheless, some personal experi-ence with respect to the problems in the real field were very helpful particularly at the beginning of work within the project. Fortunately, some persons involved in the DEMINE project were able to attend field tests of a new mechanical demining system in Namibia at an early stage in the project. These tests were performed by MgM, one of the partners of the DEMINE consortium. The stay in the deminers camp and the observation of work, was an impressive experience for those people which usually work in an office or a laboratory. The following pictures (Figure 77 to Figure 80) come from this time.
Figure 77 A demine dog at the work
Figure 78 A deminer using a metal detector to verifier the indication of the dog.
D16pub_4.doc Copyright DEMINE partners 2002 90 Created on 15.10.02
The contents of this report represent the opinions of the DEMINE project partners
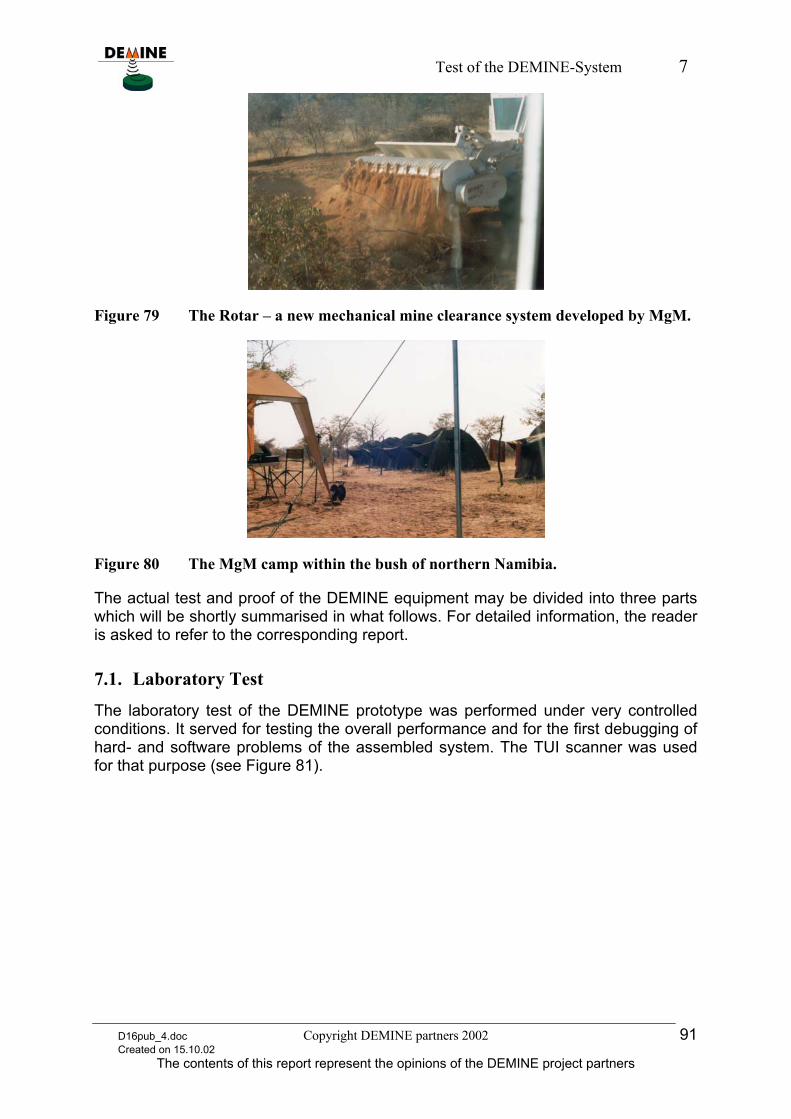
Test of the DEMINE-System 7
Figure 79 The Rotar – a new mechanical mine clearance system developed by MgM.
Figure 80 The MgM camp within the bush of northern Namibia.
The actual test and proof of the DEMINE equipment may be divided into three parts which will be shortly summarised in what follows. For detailed information, the reader is asked to refer to the corresponding report.
7.1. Laboratory Test
The laboratory test of the DEMINE prototype was performed under very controlled conditions. It served for testing the overall performance and for the first debugging of hard- and software problems of the assembled system. The TUI scanner was used for that purpose (see Figure 81).
D16pub_4.doc Copyright DEMINE partners 2002 91 Created on 15.10.02
The contents of this report represent the opinions of the DEMINE project partners
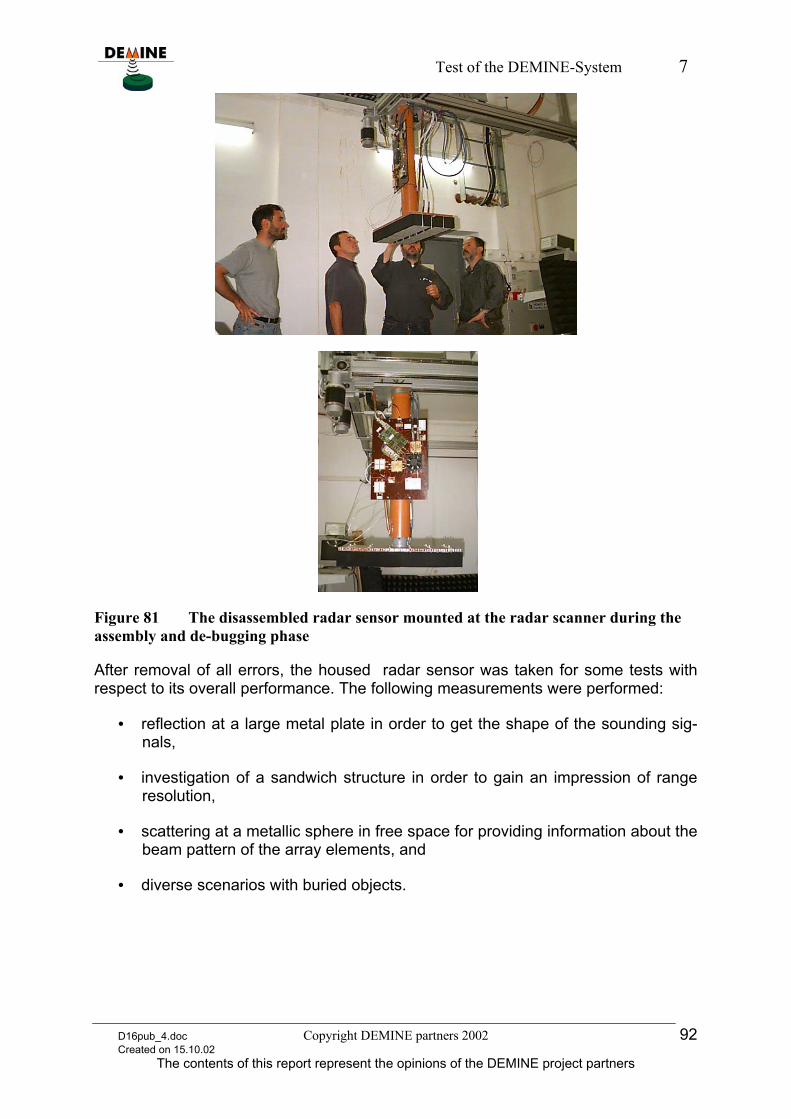
Test of the DEMINE-System 7
Figure 81 The disassembled radar sensor mounted at the radar scanner during the assembly and de-bugging phase
After removal of all errors, the housed radar sensor was taken for some tests with respect to its overall performance. The following measurements were performed:
• reflection at a large metal plate in order to get the shape of the sounding sig-nals,
• investigation of a sandwich structure in order to gain an impression of range resolution,
• scattering at a metallic sphere in free space for providing information about the beam pattern of the array elements, and
• diverse scenarios with buried objects.
D16pub_4.doc Copyright DEMINE partners 2002 92 Created on 15.10.02
The contents of this report represent the opinions of the DEMINE project partners
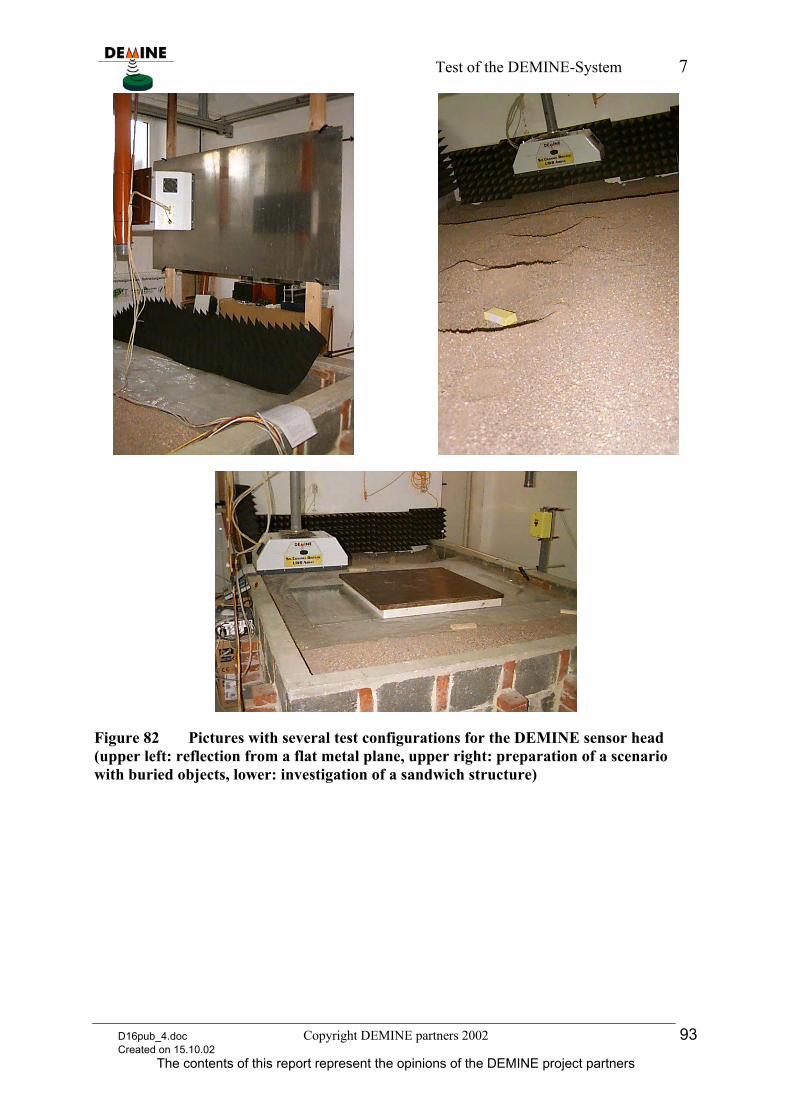
Test of the DEMINE-System 7
Figure 82 Pictures with several test configurations for the DEMINE sensor head (upper left: reflection from a flat metal plane, upper right: preparation of a scenario with buried objects, lower: investigation of a sandwich structure)
D16pub_4.doc Copyright DEMINE partners 2002 93 Created on 15.10.02
The contents of this report represent the opinions of the DEMINE project partners
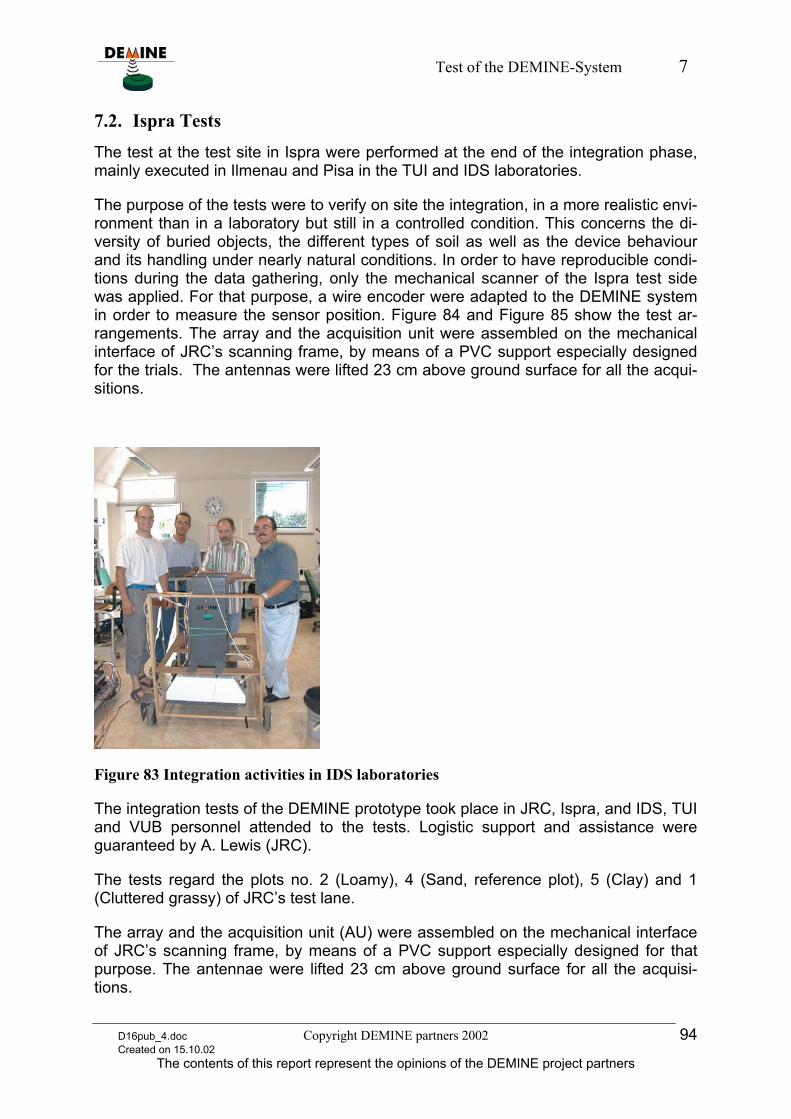
Test of the DEMINE-System 7
7.2. Ispra Tests
The test at the test site in Ispra were performed at the end of the integration phase, mainly executed in Ilmenau and Pisa in the TUI and IDS laboratories.
The purpose of the tests were to verify on site the integration, in a more realistic envi-ronment than in a laboratory but still in a controlled condition. This concerns the di-versity of buried objects, the different types of soil as well as the device behaviour and its handling under nearly natural conditions. In order to have reproducible condi-tions during the data gathering, only the mechanical scanner of the Ispra test side was applied. For that purpose, a wire encoder were adapted to the DEMINE system in order to measure the sensor position. Figure 84 and Figure 85 show the test ar-rangements. The array and the acquisition unit were assembled on the mechanical interface of JRC’s scanning frame, by means of a PVC support especially designed for the trials. The antennas were lifted 23 cm above ground surface for all the acqui-sitions.
Figure 83 Integration activities in IDS laboratories
The integration tests of the DEMINE prototype took place in JRC, Ispra, and IDS, TUI and VUB personnel attended to the tests. Logistic support and assistance were guaranteed by A. Lewis (JRC).
The tests regard the plots no. 2 (Loamy), 4 (Sand, reference plot), 5 (Clay) and 1 (Cluttered grassy) of JRC’s test lane.
The array and the acquisition unit (AU) were assembled on the mechanical interface of JRC’s scanning frame, by means of a PVC support especially designed for that purpose. The antennae were lifted 23 cm above ground surface for all the acquisi-tions.
D16pub_4.doc Copyright DEMINE partners 2002 94 Created on 15.10.02
The contents of this report represent the opinions of the DEMINE project partners
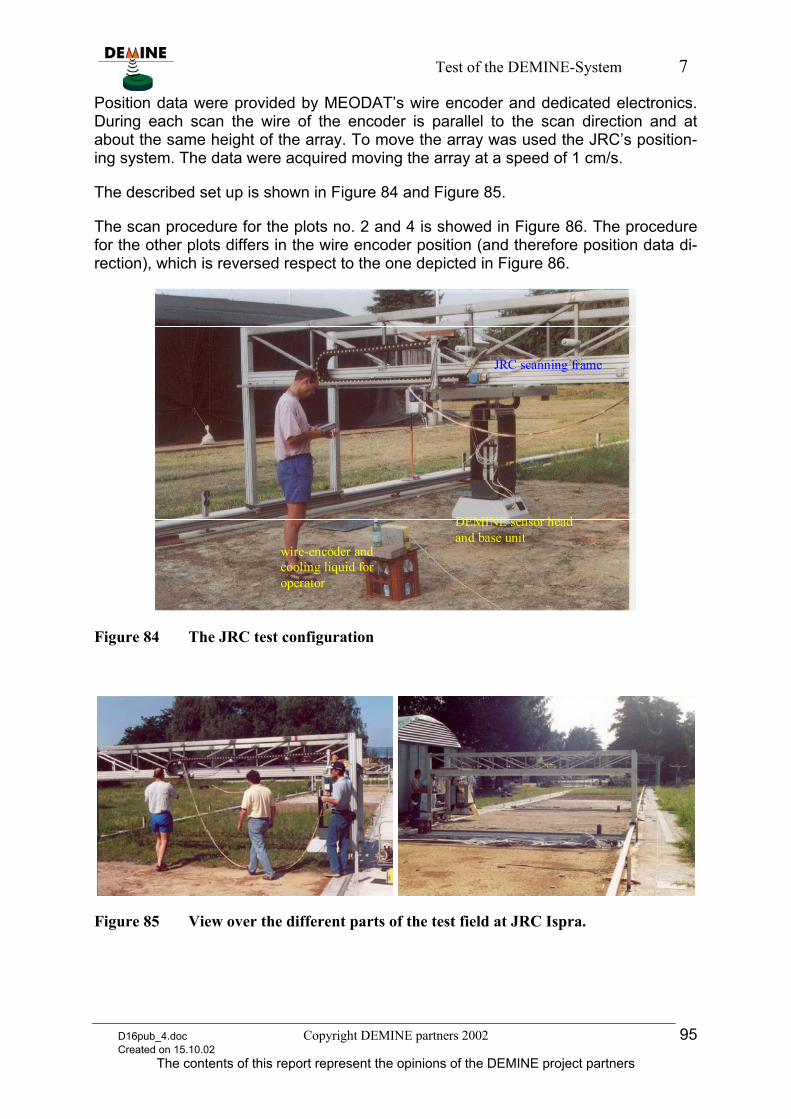
Test of the DEMINE-System 7
Position data were provided by MEODAT’s wire encoder and dedicated electronics. During each scan the wire of the encoder is parallel to the scan direction and at about the same height of the array. To move the array was used the JRC’s position-ing system. The data were acquired moving the array at a speed of 1 cm/s.
The described set up is shown in Figure 84 and Figure 85.
The scan procedure for the plots no. 2 and 4 is showed in Figure 86. The procedure for the other plots differs in the wire encoder position (and therefore position data di-rection), which is reversed respect to the one depicted in Figure 86.
DEMINE sensor headand base unit
JRC scanning frame
wire-encoder andcooling liquid foroperator
Figure 84 The JRC test configuration
Figure 85 View over the different parts of the test field at JRC Ispra.
D16pub_4.doc Copyright DEMINE partners 2002 95 Created on 15.10.02
The contents of this report represent the opinions of the DEMINE project partners
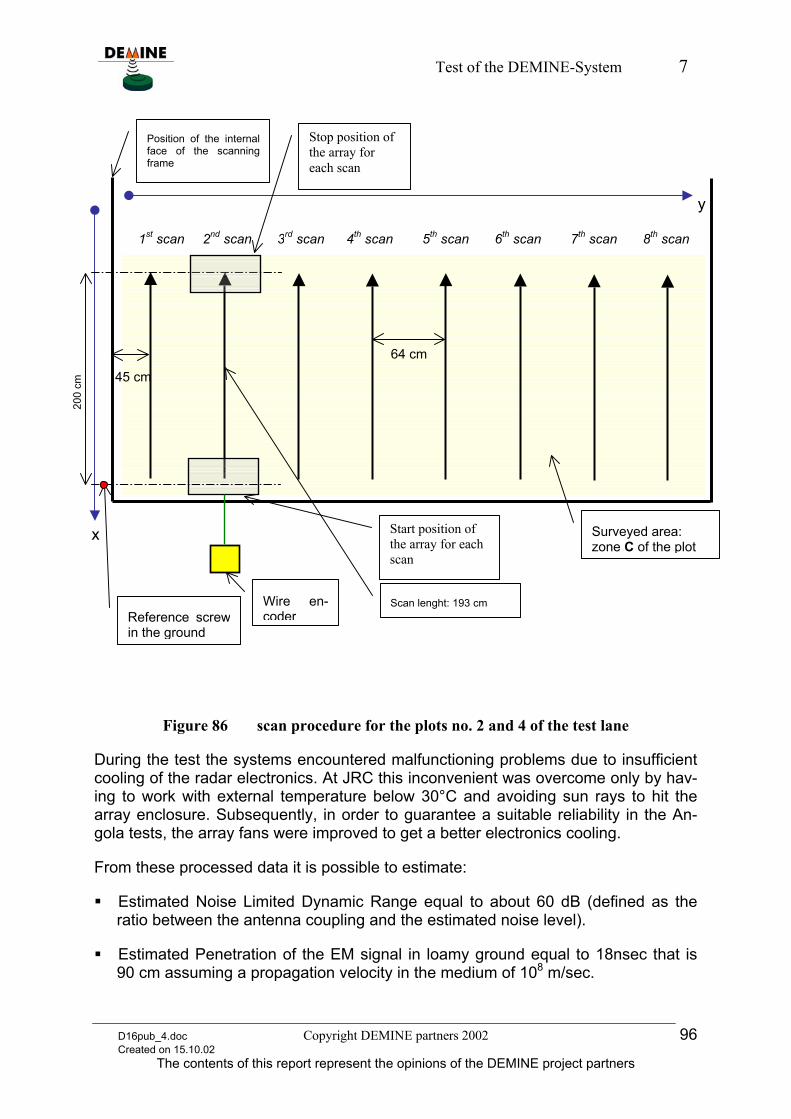
Test of the DEMINE-System 7
Wire en-coder
Scan lenght: 193 cm
200
cm
Position of the internalface of the scanningframe
Stop position of the array for each scan
1st scan 2nd scan 3rd scan 4th scan 5th scan 6th scan 7th scan 8th scan
45 cm
64 cm
Start position of the array for each scan
Reference screwin the ground
Surveyed area: zone C of the plot
y
x
Figure 86 scan procedure for the plots no. 2 and 4 of the test lane
During the test the systems encountered malfunctioning problems due to insufficient cooling of the radar electronics. At JRC this inconvenient was overcome only by hav-ing to work with external temperature below 30°C and avoiding sun rays to hit the array enclosure. Subsequently, in order to guarantee a suitable reliability in the An-gola tests, the array fans were improved to get a better electronics cooling.
From these processed data it is possible to estimate:
Estimated Noise Limited Dynamic Range equal to about 60 dB (defined as the ratio between the antenna coupling and the estimated noise level).
Estimated Penetration of the EM signal in loamy ground equal to 18nsec that is 90 cm assuming a propagation velocity in the medium of 108 m/sec.
D16pub_4.doc Copyright DEMINE partners 2002 96 Created on 15.10.02
The contents of this report represent the opinions of the DEMINE project partners
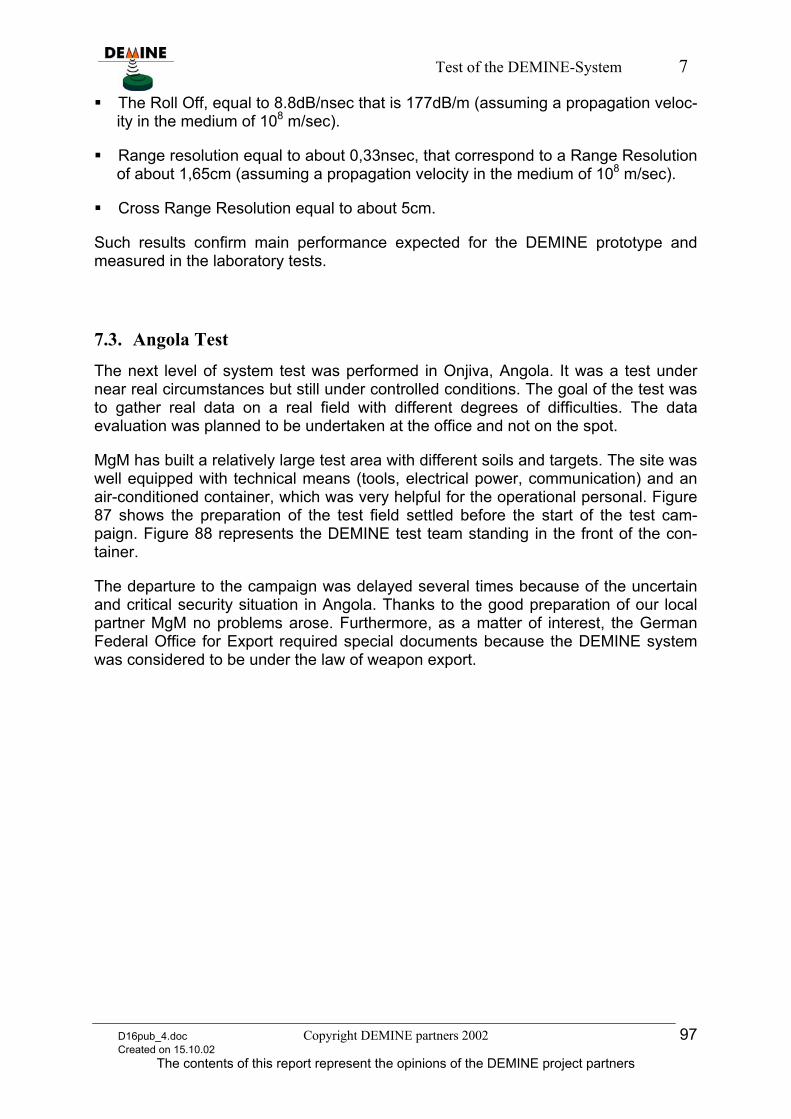
Test of the DEMINE-System 7
The Roll Off, equal to 8.8dB/nsec that is 177dB/m (assuming a propagation veloc-ity in the medium of 108 m/sec).
Range resolution equal to about 0,33nsec, that correspond to a Range Resolution of about 1,65cm (assuming a propagation velocity in the medium of 108 m/sec).
Cross Range Resolution equal to about 5cm.
Such results confirm main performance expected for the DEMINE prototype and measured in the laboratory tests.
7.3. Angola Test
The next level of system test was performed in Onjiva, Angola. It was a test under near real circumstances but still under controlled conditions. The goal of the test was to gather real data on a real field with different degrees of difficulties. The data evaluation was planned to be undertaken at the office and not on the spot.
MgM has built a relatively large test area with different soils and targets. The site was well equipped with technical means (tools, electrical power, communication) and an air-conditioned container, which was very helpful for the operational personal. Figure 87 shows the preparation of the test field settled before the start of the test cam-paign. Figure 88 represents the DEMINE test team standing in the front of the con-tainer.
The departure to the campaign was delayed several times because of the uncertain and critical security situation in Angola. Thanks to the good preparation of our local partner MgM no problems arose. Furthermore, as a matter of interest, the German Federal Office for Export required special documents because the DEMINE system was considered to be under the law of weapon export.
D16pub_4.doc Copyright DEMINE partners 2002 97 Created on 15.10.02
The contents of this report represent the opinions of the DEMINE project partners
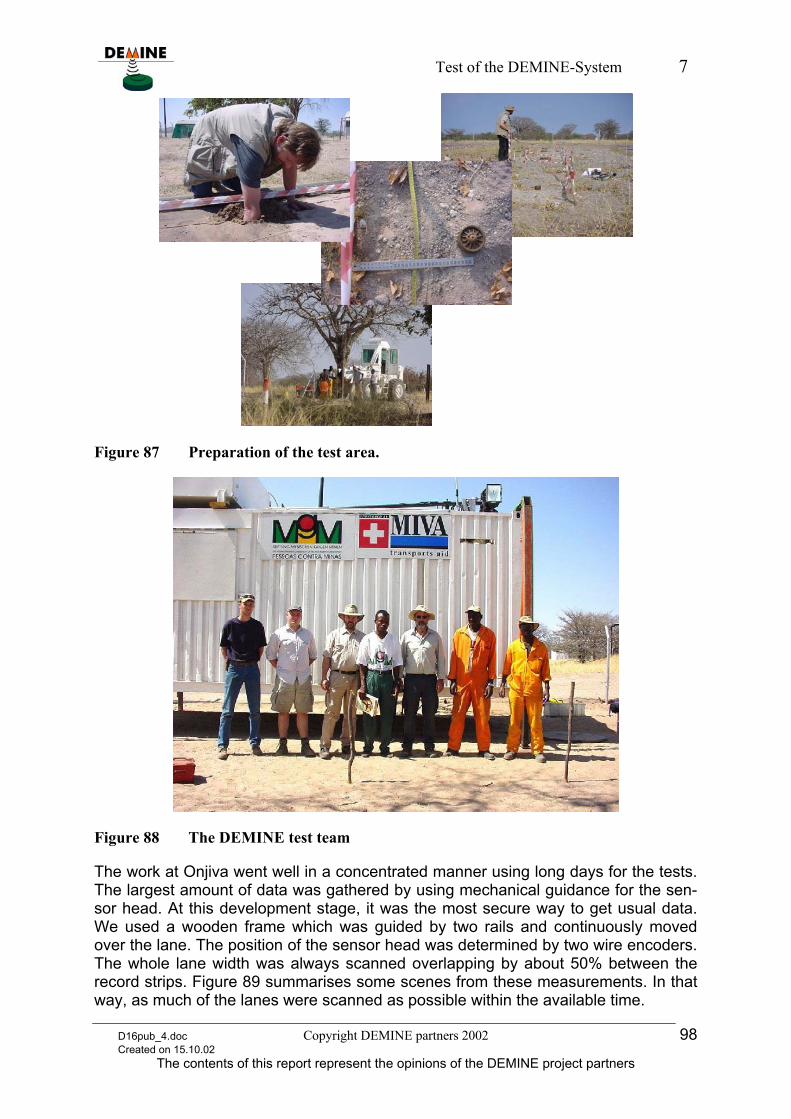
Test of the DEMINE-System 7
Figure 87 Preparation of the test area.
Figure 88 The DEMINE test team
The work at Onjiva went well in a concentrated manner using long days for the tests. The largest amount of data was gathered by using mechanical guidance for the sen-sor head. At this development stage, it was the most secure way to get usual data. We used a wooden frame which was guided by two rails and continuously moved over the lane. The position of the sensor head was determined by two wire encoders. The whole lane width was always scanned overlapping by about 50% between the record strips. Figure 89 summarises some scenes from these measurements. In that way, as much of the lanes were scanned as possible within the available time.
D16pub_4.doc Copyright DEMINE partners 2002 98 Created on 15.10.02
The contents of this report represent the opinions of the DEMINE project partners
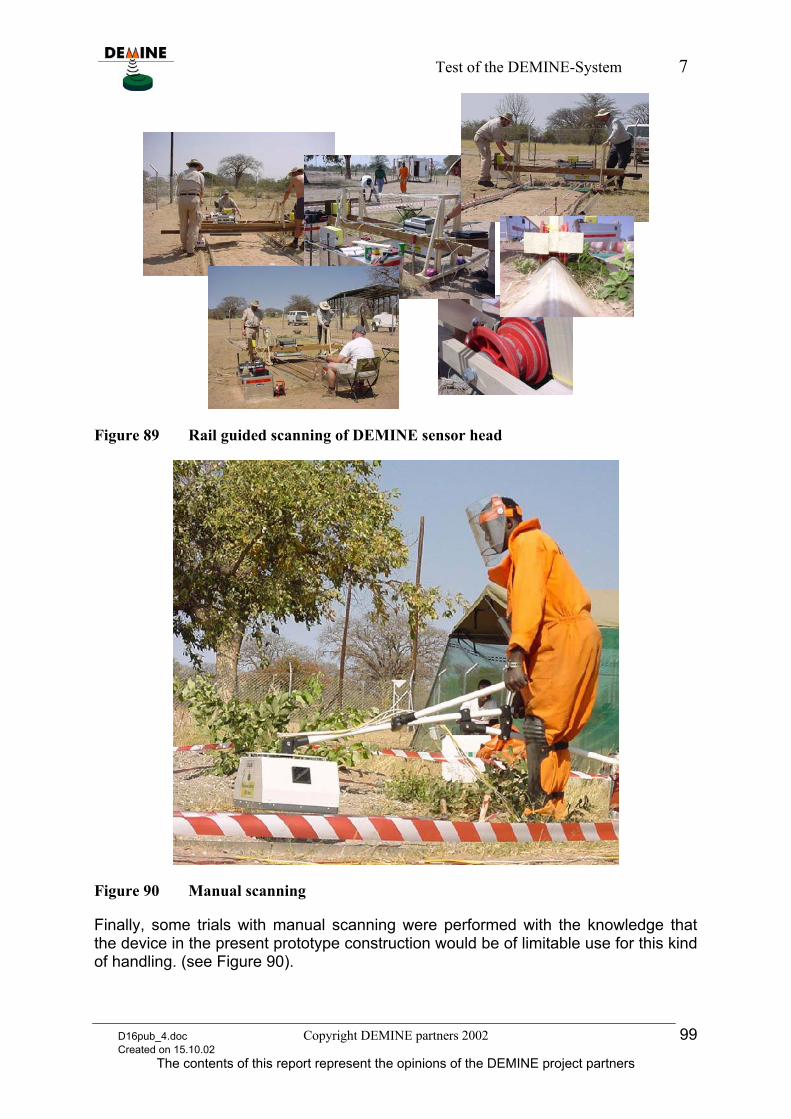
Test of the DEMINE-System 7
Figure 89 Rail guided scanning of DEMINE sensor head
Figure 90 Manual scanning
Finally, some trials with manual scanning were performed with the knowledge that the device in the present prototype construction would be of limitable use for this kind of handling. (see Figure 90).
D16pub_4.doc Copyright DEMINE partners 2002 99 Created on 15.10.02
The contents of this report represent the opinions of the DEMINE project partners
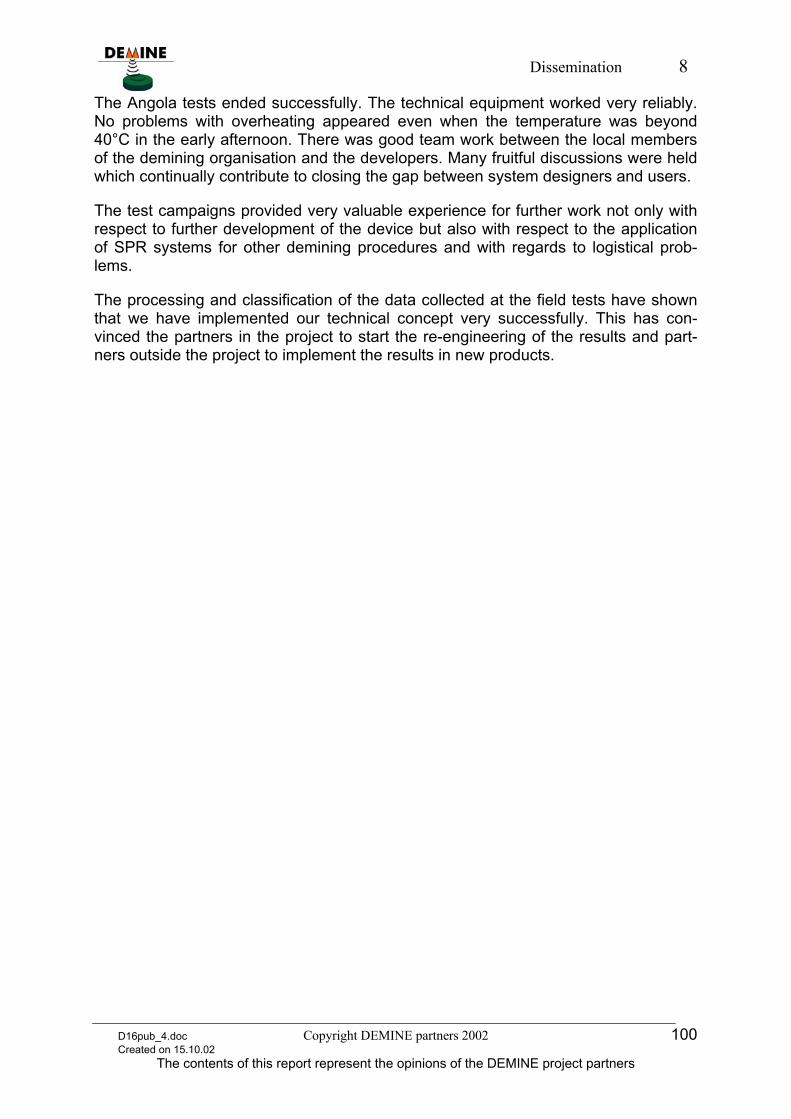
Dissemination 8
The Angola tests ended successfully. The technical equipment worked very reliably. No problems with overheating appeared even when the temperature was beyond 40°C in the early afternoon. There was good team work between the local members of the demining organisation and the developers. Many fruitful discussions were held which continually contribute to closing the gap between system designers and users.
The test campaigns provided very valuable experience for further work not only with respect to further development of the device but also with respect to the application of SPR systems for other demining procedures and with regards to logistical prob-lems.
The processing and classification of the data collected at the field tests have shown that we have implemented our technical concept very successfully. This has con-vinced the partners in the project to start the re-engineering of the results and part-ners outside the project to implement the results in new products.
D16pub_4.doc Copyright DEMINE partners 2002 100 Created on 15.10.02
The contents of this report represent the opinions of the DEMINE project partners

Dissemination 8
8. Dissemination
8.1. Dissemination Introduction We were very successful in our Research and Technological Development which as a result has enabled us to disseminate a number of state of the findings and results. We have been able to publish our developments in articles and at conferences as well as through the internet. We have witnessed a very notable increase in the num-ber of organisations contacting us with interest in our technologies as a direct result of the developments from this project and their dissemination. Highlights include the following: Partners in the project were contacted by other companies eager to develop a
vehicular multi-sensor anti-personnel landmine(APL) detector as part of a European Commission sponsored 5th Framework Programme. This detector is being presently developed.
One partner in the project was contacted by a customer wishing to develop a handheld multisensor APL detector. This detector is being presently devel-oped.
A research group has been established with a German chip manufacturer A number of leading US companies have expressed interest in our technolo-
gies which are beyond their state of the art
8.2. Main Diffusion Activities Undertaken
8.2.1. Project and partner web sites
Main project web site: http://www-emt.tu-ilmenau.de/demine
Consortium member web sites: AEL, DERA now QinetiQ, MEODAT, MgM, VUB
8.2.2. Clustering
The project and its results have been presented to other national European Union sponsored research and development projects. The project was most recently pre-sented to the European Commission cluster meeting between 13-14 October 2001 and May 2002.
8.2.3. Conference papers/participation, articles
Members of the consortium have disseminated the project and its results/intended results through the following papers and participation:
"A new UWB-Principle for Sensor-Array Applications" (IMTC 99, Venice, Italy) "Ein neues Breitbandmeßverfahren für das Basisband" (IEEE-Workshop,
Ilmenau, Germany 99)
D16pub_4.doc Copyright DEMINE partners 2002 101 Created on 15.10.02
The contents of this report represent the opinions of the DEMINE project partners
Dissemination 8
"Direct and indirect continuing technology transfer and establishment of long term business partnerships in the framework of a RTD project" (Innovation Relay Centre (IRC) Good Practice Workshop, September 99, Brussels, Belgium)
"A UWB Antenna Array for Ground Penetrating Radar Mine Detection", Millenium conference on antennae and propagation (9-14 April 2000, Davos, Switzerland)
“Cost-efficient Surface Penetrating Radar Device for Humanitarian Demining”, EUROEM 2000 (30 May-2 June 2000, Edinburgh, Scotland, UK)
A paper entitled ‘Integrated UWB Radar Circuit for Base Band Applications from DC to 5 GHz’ was written and presented at the German Radar Symposium (11 - 12th October 2000, Berlin)
“12-GHz-SiGe Ultra Wideband Radar Circuit” (25-26 September 2000, Minneapo-lis, MN, USA)
• Presentation on the IENA 2000 in Nürnberg, Germany
• Application for the Thuringian innovation award 2000
• Presentation at the Innovation Day fair in Germany 2000
• Presentation at workshop in Eisenach, Germany (November 2000) on partner-ships between industry and research
• Van Kempen, L.; Sahli, H.; Brooks, J., and Cornelis, J. New results on clutter re-duction and parameter estimation for landmine detection using GPR. In: 8th Inter-national Conference on Ground Penetrating Radar, GPR 2000, pp. 872-879. (May 2000; Gold Coast, Australia).
• Brooks, J.; Van Kempen, L., and Sahli, H. A primary study in adaptive reduction and buried minelike target enhancement from GPR data. SPIE Detection and Remediation Technologies for Mines and Minelike Targets V, 2000, (vol. 4038). (April 2000; Orlando, USA).
• Presentation at MINWARA 2001, Australian-American joint conference on the technologies of mine countermeasures
• J. Sachs, P. Peyerl: Integrated Networkanalyser Module for Microwave Moisture Sensors
• J. Sachs, J. Dvoracek, A. Schneider, J. Friedrich, R. Zetik: Ultra-Wideband Meth-ods applied for Moisture and Liquid Sensing
• Publication in the German regional newspaper Thüringen Landeszeitung
• Publication in the German national newspaper die BILD Zeitung
• Publication in the German regional newspaper Freies Wort
• Fourth International Conference on “Electromagnetic Wave Interaction with Water and Moist Substances”, Weimar, Germany
D16pub_4.doc Copyright DEMINE partners 2002 102 Created on 15.10.02
The contents of this report represent the opinions of the DEMINE project partners
Performance Envelope and Review of Project Objectives 9
8.2.4. Networks
Partners in the consortium have ensured , where they were previously not members, that they are now members of the following networks: ARIS Network: http://demining.jrc.it/aris
ARIS Action for Research and Information Support in Civilian Demining is a Euro-pean Network of Excellence which is intended to improve the effectiveness of R&D in demining technologies. It is a forum for information exchange between users, researchers, developers and producers of detection devices and systems.
MgM Network: http://www.mgm.org, [email protected] MgM´s Demining network is a world network of those interested and involved in every area of humanitarian demining.
The Innovation Relay Centre (IRC) Network: http://www.cordis.lu/irc has been used by the partners to disseminate their results. Since their creation in 1995, the Innova-tion Relay Centres (IRCs) have become a leading European network for the promo-tion of technology partnerships and transfer between small and medium-sized com-panies. Today, there are 53 Relay Centres, incorporating ca.170 organisations in the European Union, Iceland, Norway and Israel, with further 10 Fellow Members in Cen-tral and Eastern Europe.
8.2.5. Advertising Material
Hardcopy advertising material has been produced for example posters which we have been able to use at conferences. Tailor made information leaflets have also been designed as and where necessary for particular events.
8.2.6. Field tests
The DEMINE detector was tested at the JRC in Ispra and also at our project test field in Onjiva, Angola field tests. Results of these tests have been published on our web site. At the tests in Angola apart from our own humanitarian demining enduser we also had attendance from another demining NGO enduser.
8.2.7. Television Documentary
(Mitteldeutscher Rundfunk) made a short television documentary about our project which was aired in Germany on 21 August 2001. This television company is also in-terested in making follow ups to the documentary which would incorporate further field tests and perhaps the additional multi-sensor technologies described above.
8.3. Future Dissemination Plans
All members of the consortium are committed to exploiting the results from the pro-ject. An integral part of this exploitation is considered to be dissemination of results which arise from the engineering work being undertaken in order to enable further penetration of the DEMINE results in their markets. This further dissemination and marketing will also draw attention to the original DEMINE project.
D16pub_4.doc Copyright DEMINE partners 2002 103 Created on 15.10.02
The contents of this report represent the opinions of the DEMINE project partners
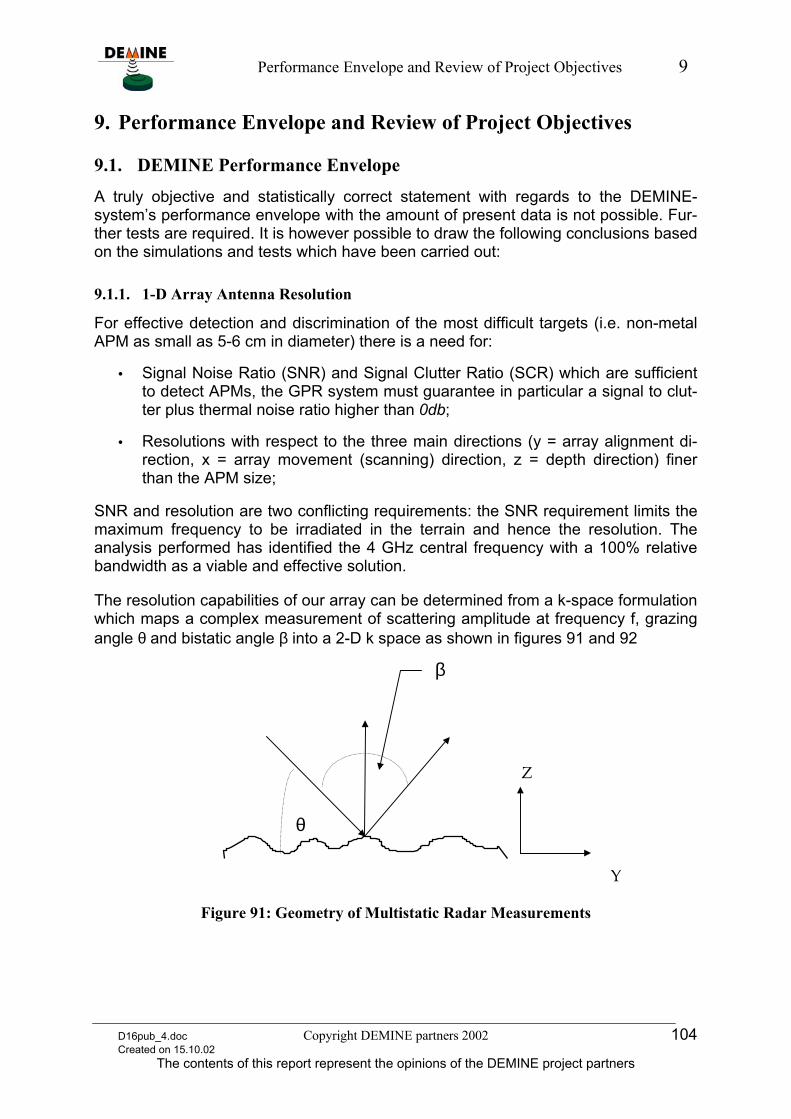
Performance Envelope and Review of Project Objectives 9
9. Performance Envelope and Review of Project Objectives
9.1. DEMINE Performance Envelope
A truly objective and statistically correct statement with regards to the DEMINE-system’s performance envelope with the amount of present data is not possible. Fur-ther tests are required. It is however possible to draw the following conclusions based on the simulations and tests which have been carried out:
9.1.1. 1-D Array Antenna Resolution
For effective detection and discrimination of the most difficult targets (i.e. non-metal APM as small as 5-6 cm in diameter) there is a need for:
• Signal Noise Ratio (SNR) and Signal Clutter Ratio (SCR) which are sufficient to detect APMs, the GPR system must guarantee in particular a signal to clut-ter plus thermal noise ratio higher than 0db;
• Resolutions with respect to the three main directions (y = array alignment di-rection, x = array movement (scanning) direction, z = depth direction) finer than the APM size;
SNR and resolution are two conflicting requirements: the SNR requirement limits the maximum frequency to be irradiated in the terrain and hence the resolution. The analysis performed has identified the 4 GHz central frequency with a 100% relative bandwidth as a viable and effective solution.
The resolution capabilities of our array can be determined from a k-space formulation which maps a complex measurement of scattering amplitude at frequency f, grazing angle θ and bistatic angle β into a 2-D k space as shown in figures 91 and 92
β
θ
Z
Y
Figure 91: Geometry of Multistatic Radar Measurements
D16pub_4.doc Copyright DEMINE partners 2002 104 Created on 15.10.02
The contents of this report represent the opinions of the DEMINE project partners
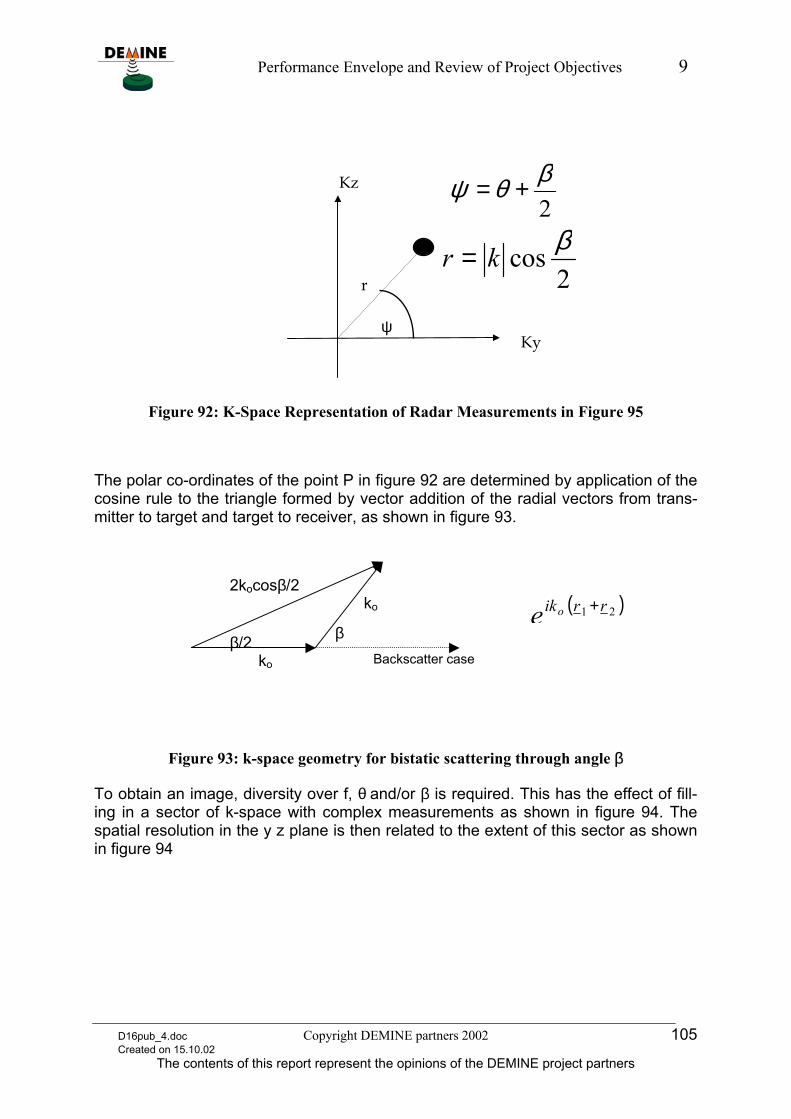
Performance Envelope and Review of Project Objectives 9
2βθψ +=
2cos βkr =
ψ
r
Kz
Ky
Figure 92: K-Space Representation of Radar Measurements in Figure 95
The polar co-ordinates of the point P in figure 92 are determined by application of the cosine rule to the triangle formed by vector addition of the radial vectors from trans-mitter to target and target to receiver, as shown in figure 93.
( )21 rrikoe +
β/2 ko
ko
β
2kocosβ/2
Backscatter case
Figure 93: k-space geometry for bistatic scattering through angle β
To obtain an image, diversity over f, θ and/or β is required. This has the effect of fill-ing in a sector of k-space with complex measurements as shown in figure 94. The spatial resolution in the y z plane is then related to the extent of this sector as shown in figure 94
D16pub_4.doc Copyright DEMINE partners 2002 105 Created on 15.10.02
The contents of this report represent the opinions of the DEMINE project partners
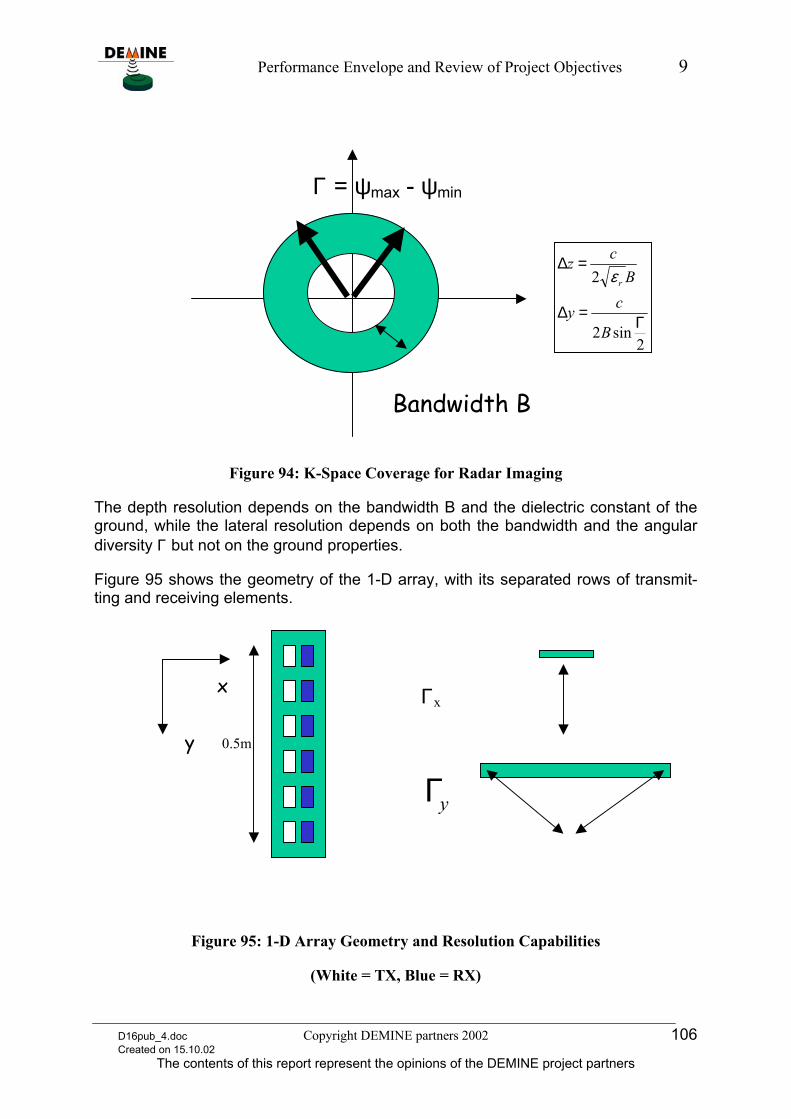
Performance Envelope and Review of Project Objectives 9
Bandwidth B
Γ = ψmax - ψmin
2sin2
2
Γ=∆
=∆
B
cy
Bczrε
Figure 94: K-Space Coverage for Radar Imaging
The depth resolution depends on the bandwidth B and the dielectric constant of the ground, while the lateral resolution depends on both the bandwidth and the angular diversity Γ but not on the ground properties.
Figure 95 shows the geometry of the 1-D array, with its separated rows of transmit-ting and receiving elements.
0.5m y
x Γx
yΓ
Figure 95: 1-D Array Geometry and Resolution Capabilities
(White = TX, Blue = RX)
D16pub_4.doc Copyright DEMINE partners 2002 106 Created on 15.10.02
The contents of this report represent the opinions of the DEMINE project partners
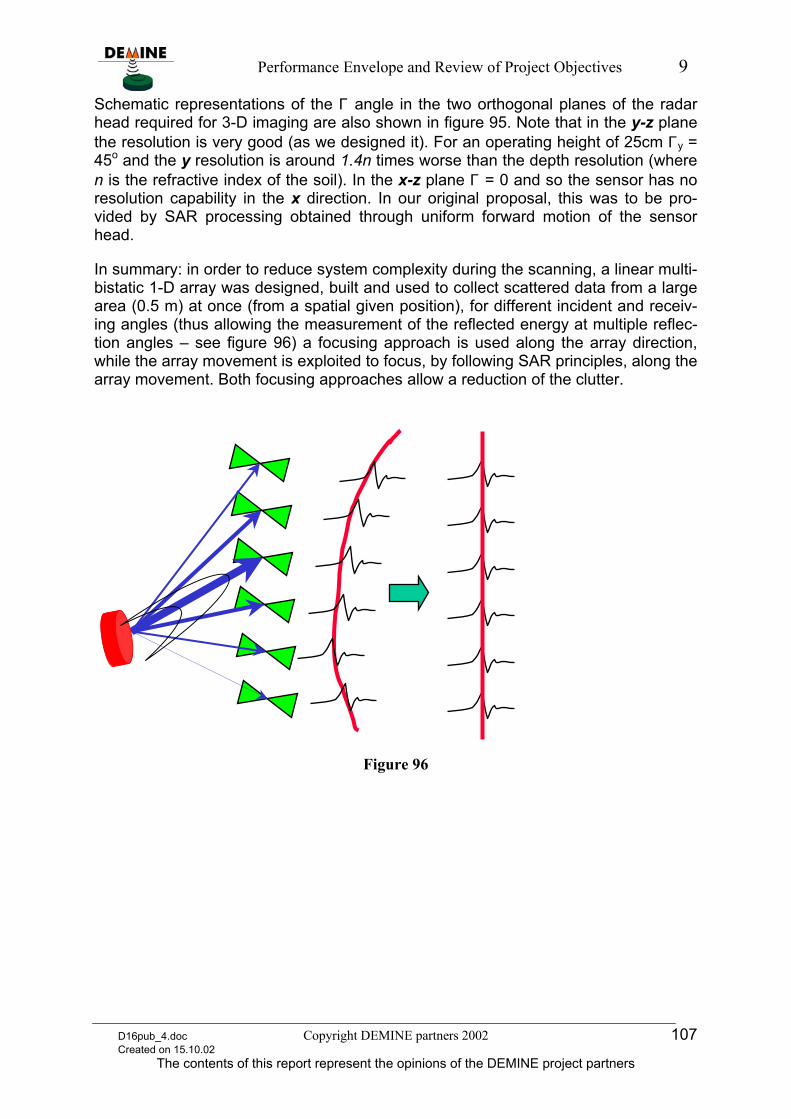
Performance Envelope and Review of Project Objectives 9
Schematic representations of the Γ angle in the two orthogonal planes of the radar head required for 3-D imaging are also shown in figure 95. Note that in the y-z plane the resolution is very good (as we designed it). For an operating height of 25cm Γy = 45o and the y resolution is around 1.4n times worse than the depth resolution (where n is the refractive index of the soil). In the x-z plane Γ = 0 and so the sensor has no resolution capability in the x direction. In our original proposal, this was to be pro-vided by SAR processing obtained through uniform forward motion of the sensor head.
In summary: in order to reduce system complexity during the scanning, a linear multi-bistatic 1-D array was designed, built and used to collect scattered data from a large area (0.5 m) at once (from a spatial given position), for different incident and receiv-ing angles (thus allowing the measurement of the reflected energy at multiple reflec-tion angles – see figure 96) a focusing approach is used along the array direction, while the array movement is exploited to focus, by following SAR principles, along the array movement. Both focusing approaches allow a reduction of the clutter.
Figure 96
D16pub_4.doc Copyright DEMINE partners 2002 107 Created on 15.10.02
The contents of this report represent the opinions of the DEMINE project partners
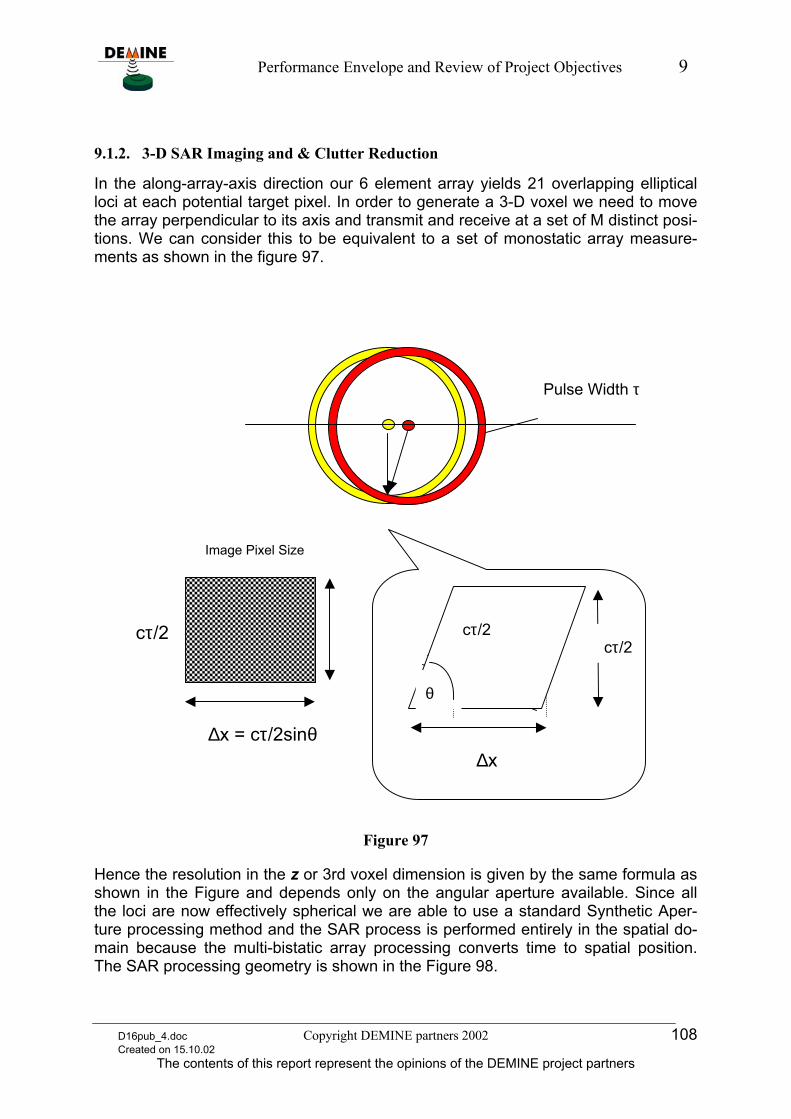
Performance Envelope and Review of Project Objectives 9
9.1.2. 3-D SAR Imaging and & Clutter Reduction
In the along-array-axis direction our 6 element array yields 21 overlapping elliptical loci at each potential target pixel. In order to generate a 3-D voxel we need to move the array perpendicular to its axis and transmit and receive at a set of M distinct posi-tions. We can consider this to be equivalent to a set of monostatic array measure-ments as shown in the figure 97.
cτ/2
θ
Pulse Width τ
∆x = cτ/2sinθ
Image Pixel Size
cτ/2
∆x
cτ/2
Figure 97
Hence the resolution in the z or 3rd voxel dimension is given by the same formula as shown in the Figure and depends only on the angular aperture available. Since all the loci are now effectively spherical we are able to use a standard Synthetic Aper-ture processing method and the SAR process is performed entirely in the spatial do-main because the multi-bistatic array processing converts time to spatial position. The SAR processing geometry is shown in the Figure 98.
D16pub_4.doc Copyright DEMINE partners 2002 108 Created on 15.10.02
The contents of this report represent the opinions of the DEMINE project partners
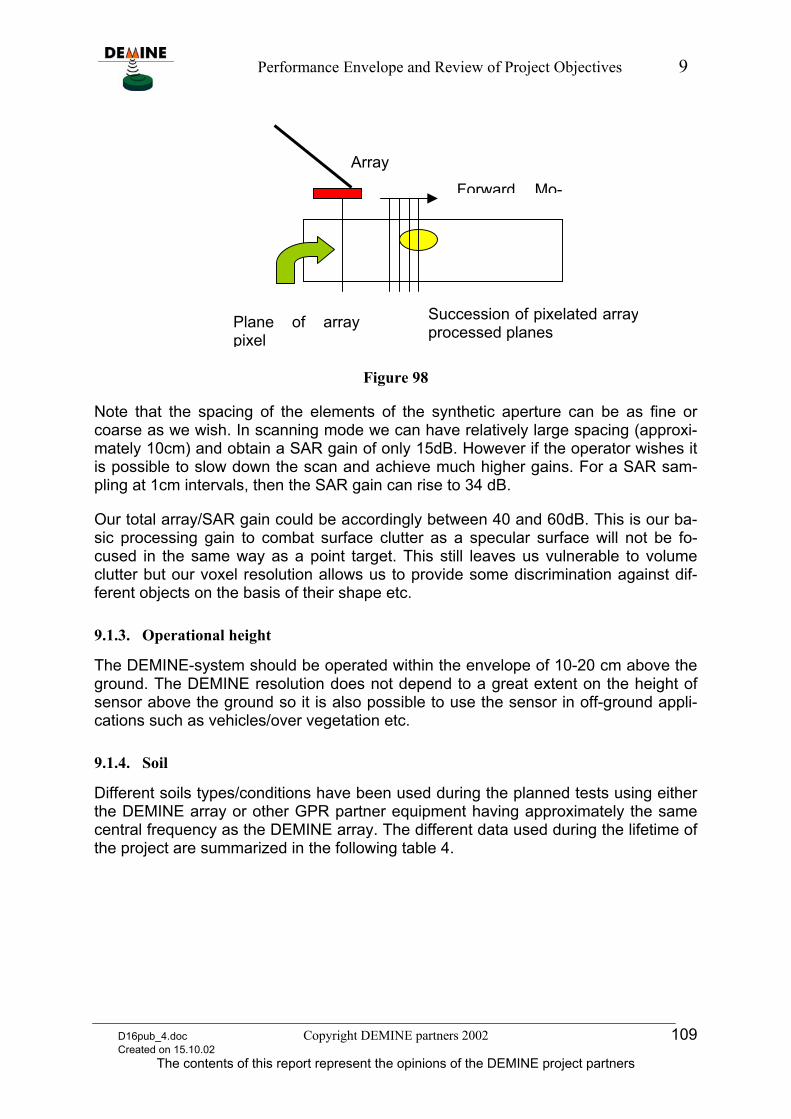
Performance Envelope and Review of Project Objectives 9
Succession of pixelated arrayprocessed planes Plane of array
pixel
Array
Forward Mo-
Figure 98
Note that the spacing of the elements of the synthetic aperture can be as fine or coarse as we wish. In scanning mode we can have relatively large spacing (approxi-mately 10cm) and obtain a SAR gain of only 15dB. However if the operator wishes it is possible to slow down the scan and achieve much higher gains. For a SAR sam-pling at 1cm intervals, then the SAR gain can rise to 34 dB.
Our total array/SAR gain could be accordingly between 40 and 60dB. This is our ba-sic processing gain to combat surface clutter as a specular surface will not be fo-cused in the same way as a point target. This still leaves us vulnerable to volume clutter but our voxel resolution allows us to provide some discrimination against dif-ferent objects on the basis of their shape etc.
9.1.3. Operational height
The DEMINE-system should be operated within the envelope of 10-20 cm above the ground. The DEMINE resolution does not depend to a great extent on the height of sensor above the ground so it is also possible to use the sensor in off-ground appli-cations such as vehicles/over vegetation etc.
9.1.4. Soil
Different soils types/conditions have been used during the planned tests using either the DEMINE array or other GPR partner equipment having approximately the same central frequency as the DEMINE array. The different data used during the lifetime of the project are summarized in the following table 4.
D16pub_4.doc Copyright DEMINE partners 2002 109 Created on 15.10.02
The contents of this report represent the opinions of the DEMINE project partners
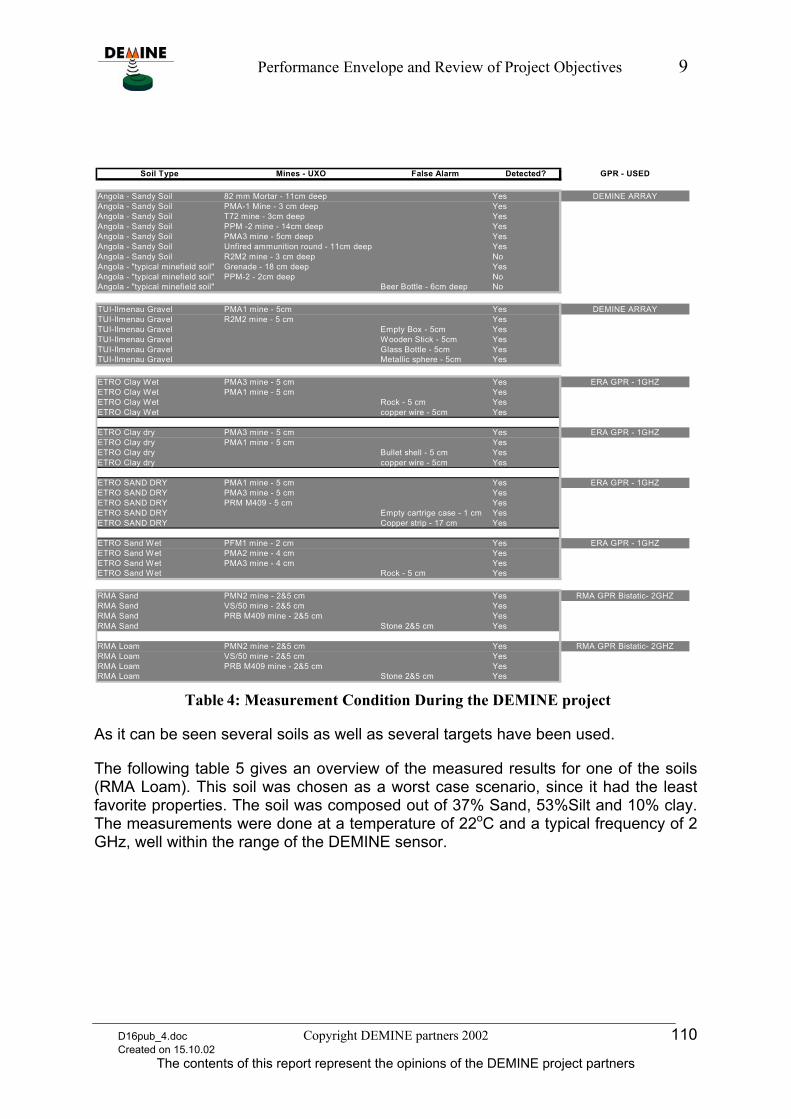
Performance Envelope and Review of Project Objectives 9
Soil Type Mines - UXO False Alarm Detected? GPR - USED
Angola - Sandy Soil 82 mm Mortar - 11cm deep Yes DEMINE ARRAYAngola - Sandy Soil PMA-1 Mine - 3 cm deep YesAngola - Sandy Soil T72 mine - 3cm deep YesAngola - Sandy Soil PPM -2 mine - 14cm deep YesAngola - Sandy Soil PMA3 mine - 5cm deep YesAngola - Sandy Soil Unfired ammunition round - 11cm deep YesAngola - Sandy Soil R2M2 mine - 3 cm deep NoAngola - "typical minefield soil" Grenade - 18 cm deep YesAngola - "typical minefield soil" PPM-2 - 2cm deep NoAngola - "typical minefield soil" Beer Bottle - 6cm deep No
TUI-Ilmenau Gravel PMA1 mine - 5cm Yes DEMINE ARRAYTUI-Ilmenau Gravel R2M2 mine - 5 cm YesTUI-Ilmenau Gravel Empty Box - 5cm YesTUI-Ilmenau Gravel Wooden Stick - 5cm YesTUI-Ilmenau Gravel Glass Bottle - 5cm YesTUI-Ilmenau Gravel Metallic sphere - 5cm Yes
ETRO Clay Wet PMA3 mine - 5 cm Yes ERA GPR - 1GHZETRO Clay Wet PMA1 mine - 5 cm YesETRO Clay Wet Rock - 5 cm YesETRO Clay Wet copper wire - 5cm Yes
ETRO Clay dry PMA3 mine - 5 cm Yes ERA GPR - 1GHZETRO Clay dry PMA1 mine - 5 cm YesETRO Clay dry Bullet shell - 5 cm YesETRO Clay dry copper wire - 5cm Yes
ETRO SAND DRY PMA1 mine - 5 cm Yes ERA GPR - 1GHZETRO SAND DRY PMA3 mine - 5 cm YesETRO SAND DRY PRM M409 - 5 cm YesETRO SAND DRY Empty cartrige case - 1 cm YesETRO SAND DRY Copper strip - 17 cm Yes
ETRO Sand Wet PFM1 mine - 2 cm Yes ERA GPR - 1GHZETRO Sand Wet PMA2 mine - 4 cm YesETRO Sand Wet PMA3 mine - 4 cm YesETRO Sand Wet Rock - 5 cm Yes
RMA Sand PMN2 mine - 2&5 cm Yes RMA GPR Bistatic- 2GHZRMA Sand VS/50 mine - 2&5 cm YesRMA Sand PRB M409 mine - 2&5 cm YesRMA Sand Stone 2&5 cm Yes
RMA Loam PMN2 mine - 2&5 cm Yes RMA GPR Bistatic- 2GHZRMA Loam VS/50 mine - 2&5 cm YesRMA Loam PRB M409 mine - 2&5 cm YesRMA Loam Stone 2&5 cm Yes
Table 4: Measurement Condition During the DEMINE project
As it can be seen several soils as well as several targets have been used.
The following table 5 gives an overview of the measured results for one of the soils (RMA Loam). This soil was chosen as a worst case scenario, since it had the least favorite properties. The soil was composed out of 37% Sand, 53%Silt and 10% clay. The measurements were done at a temperature of 22oC and a typical frequency of 2 GHz, well within the range of the DEMINE sensor.
D16pub_4.doc Copyright DEMINE partners 2002 110 Created on 15.10.02
The contents of this report represent the opinions of the DEMINE project partners
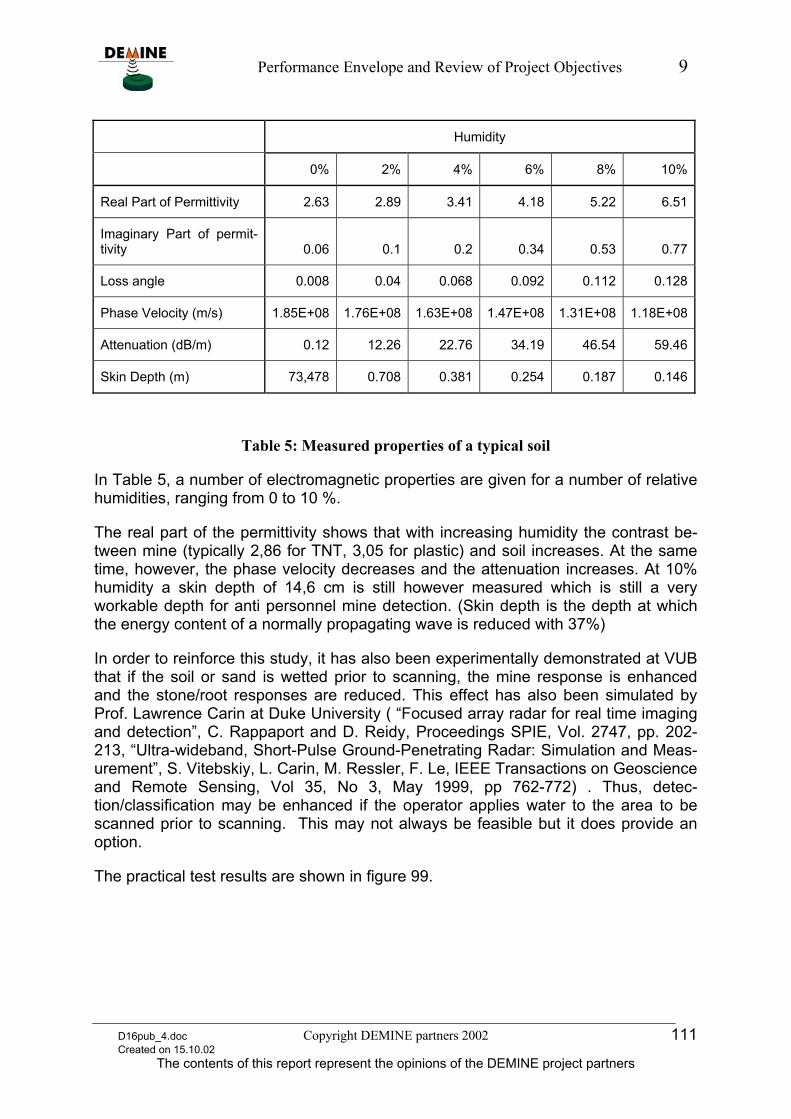
Performance Envelope and Review of Project Objectives 9
Humidity
0% 2% 4% 6% 8% 10%
Real Part of Permittivity 2.63 2.89 3.41 4.18 5.22 6.51
Imaginary Part of permit-tivity 0.06 0.1 0.2 0.34 0.53 0.77
Loss angle 0.008 0.04 0.068 0.092 0.112 0.128
Phase Velocity (m/s) 1.85E+08 1.76E+08 1.63E+08 1.47E+08 1.31E+08 1.18E+08
Attenuation (dB/m) 0.12 12.26 22.76 34.19 46.54 59.46
Skin Depth (m) 73,478 0.708 0.381 0.254 0.187 0.146
Table 5: Measured properties of a typical soil
In Table 5, a number of electromagnetic properties are given for a number of relative humidities, ranging from 0 to 10 %.
The real part of the permittivity shows that with increasing humidity the contrast be-tween mine (typically 2,86 for TNT, 3,05 for plastic) and soil increases. At the same time, however, the phase velocity decreases and the attenuation increases. At 10% humidity a skin depth of 14,6 cm is still however measured which is still a very workable depth for anti personnel mine detection. (Skin depth is the depth at which the energy content of a normally propagating wave is reduced with 37%)
In order to reinforce this study, it has also been experimentally demonstrated at VUB that if the soil or sand is wetted prior to scanning, the mine response is enhanced and the stone/root responses are reduced. This effect has also been simulated by Prof. Lawrence Carin at Duke University ( “Focused array radar for real time imaging and detection”, C. Rappaport and D. Reidy, Proceedings SPIE, Vol. 2747, pp. 202-213, “Ultra-wideband, Short-Pulse Ground-Penetrating Radar: Simulation and Meas-urement”, S. Vitebskiy, L. Carin, M. Ressler, F. Le, IEEE Transactions on Geoscience and Remote Sensing, Vol 35, No 3, May 1999, pp 762-772) . Thus, detec-tion/classification may be enhanced if the operator applies water to the area to be scanned prior to scanning. This may not always be feasible but it does provide an option.
The practical test results are shown in figure 99.
D16pub_4.doc Copyright DEMINE partners 2002 111 Created on 15.10.02
The contents of this report represent the opinions of the DEMINE project partners
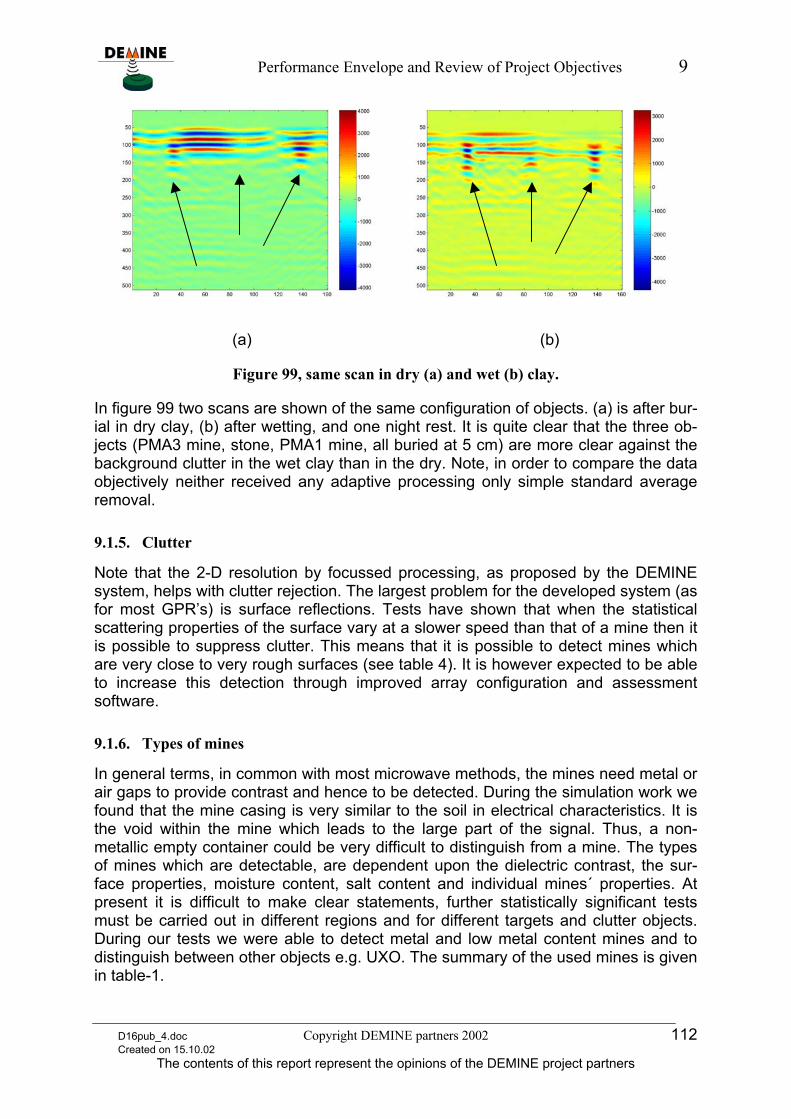
Performance Envelope and Review of Project Objectives 9
(a) (b)
Figure 99, same scan in dry (a) and wet (b) clay.
In figure 99 two scans are shown of the same configuration of objects. (a) is after bur-ial in dry clay, (b) after wetting, and one night rest. It is quite clear that the three ob-jects (PMA3 mine, stone, PMA1 mine, all buried at 5 cm) are more clear against the background clutter in the wet clay than in the dry. Note, in order to compare the data objectively neither received any adaptive processing only simple standard average removal.
9.1.5. Clutter
Note that the 2-D resolution by focussed processing, as proposed by the DEMINE system, helps with clutter rejection. The largest problem for the developed system (as for most GPR’s) is surface reflections. Tests have shown that when the statistical scattering properties of the surface vary at a slower speed than that of a mine then it is possible to suppress clutter. This means that it is possible to detect mines which are very close to very rough surfaces (see table 4). It is however expected to be able to increase this detection through improved array configuration and assessment software.
9.1.6. Types of mines
In general terms, in common with most microwave methods, the mines need metal or air gaps to provide contrast and hence to be detected. During the simulation work we found that the mine casing is very similar to the soil in electrical characteristics. It is the void within the mine which leads to the large part of the signal. Thus, a non-metallic empty container could be very difficult to distinguish from a mine. The types of mines which are detectable, are dependent upon the dielectric contrast, the sur-face properties, moisture content, salt content and individual mines´ properties. At present it is difficult to make clear statements, further statistically significant tests must be carried out in different regions and for different targets and clutter objects. During our tests we were able to detect metal and low metal content mines and to distinguish between other objects e.g. UXO. The summary of the used mines is given in table-1.
D16pub_4.doc Copyright DEMINE partners 2002 112 Created on 15.10.02
The contents of this report represent the opinions of the DEMINE project partners
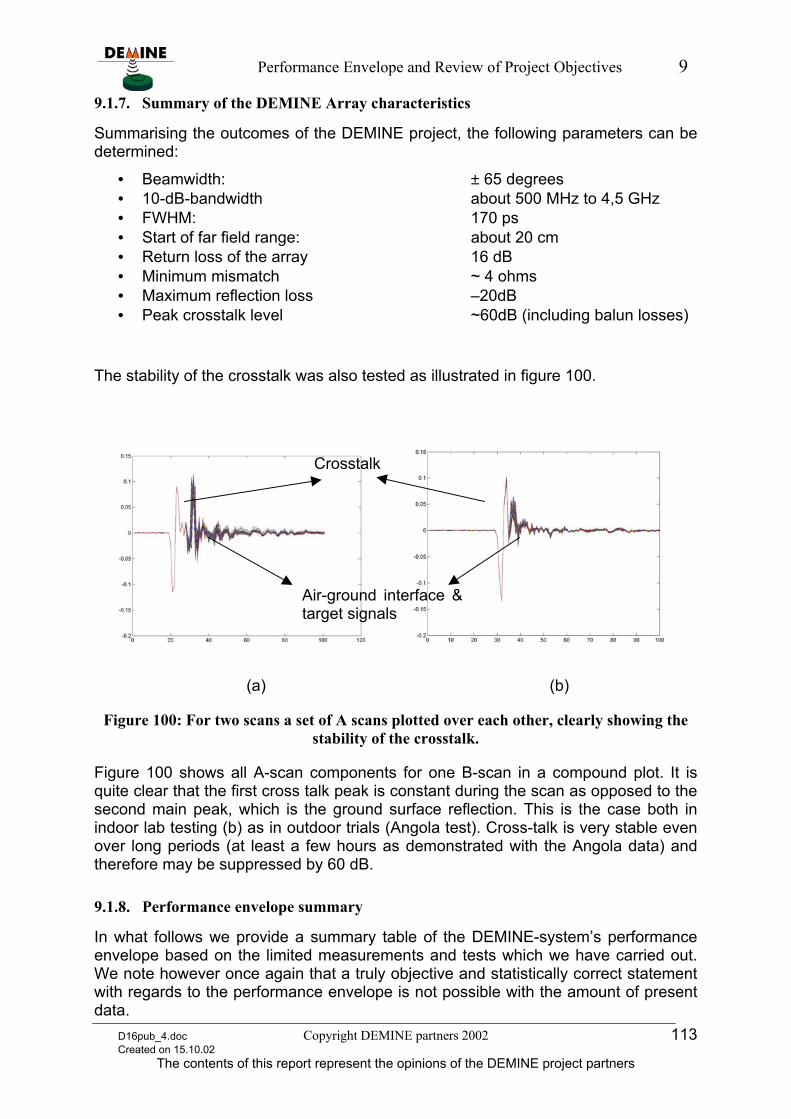
Performance Envelope and Review of Project Objectives 9
9.1.7. Summary of the DEMINE Array characteristics
Summarising the outcomes of the DEMINE project, the following parameters can be determined:
• Beamwidth: ± 65 degrees • 10-dB-bandwidth about 500 MHz to 4,5 GHz • FWHM: 170 ps • Start of far field range: about 20 cm • Return loss of the array 16 dB • Minimum mismatch ~ 4 ohms • Maximum reflection loss –20dB • Peak crosstalk level ~60dB (including balun losses)
The stability of the crosstalk was also tested as illustrated in figure 100.
Crosstalk
Air-ground interface &target signals
(a) (b)
Figure 100: For two scans a set of A scans plotted over each other, clearly showing the stability of the crosstalk.
Figure 100 shows all A-scan components for one B-scan in a compound plot. It is quite clear that the first cross talk peak is constant during the scan as opposed to the second main peak, which is the ground surface reflection. This is the case both in indoor lab testing (b) as in outdoor trials (Angola test). Cross-talk is very stable even over long periods (at least a few hours as demonstrated with the Angola data) and therefore may be suppressed by 60 dB.
9.1.8. Performance envelope summary
In what follows we provide a summary table of the DEMINE-system’s performance envelope based on the limited measurements and tests which we have carried out. We note however once again that a truly objective and statistically correct statement with regards to the performance envelope is not possible with the amount of present data.
D16pub_4.doc Copyright DEMINE partners 2002 113 Created on 15.10.02
The contents of this report represent the opinions of the DEMINE project partners
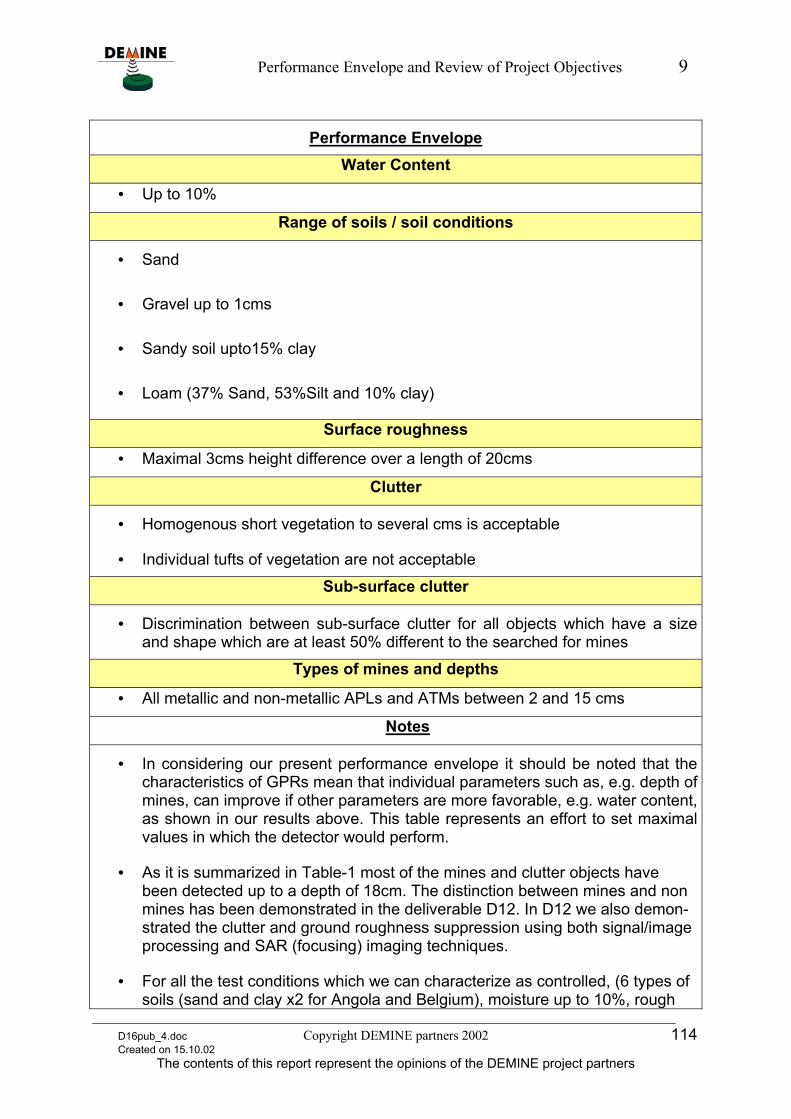
Performance Envelope and Review of Project Objectives 9
Performance Envelope Water Content
• Up to 10%
Range of soils / soil conditions
• Sand
• Gravel up to 1cms
• Sandy soil upto15% clay
• Loam (37% Sand, 53%Silt and 10% clay)
Surface roughness
• Maximal 3cms height difference over a length of 20cms
Clutter
• Homogenous short vegetation to several cms is acceptable
• Individual tufts of vegetation are not acceptable Sub-surface clutter
• Discrimination between sub-surface clutter for all objects which have a size and shape which are at least 50% different to the searched for mines
Types of mines and depths
• All metallic and non-metallic APLs and ATMs between 2 and 15 cms
Notes
• In considering our present performance envelope it should be noted that the characteristics of GPRs mean that individual parameters such as, e.g. depth of mines, can improve if other parameters are more favorable, e.g. water content, as shown in our results above. This table represents an effort to set maximal values in which the detector would perform.
• As it is summarized in Table-1 most of the mines and clutter objects have been detected up to a depth of 18cm. The distinction between mines and non mines has been demonstrated in the deliverable D12. In D12 we also demon-strated the clutter and ground roughness suppression using both signal/image processing and SAR (focusing) imaging techniques.
• For all the test conditions which we can characterize as controlled, (6 types of soils (sand and clay x2 for Angola and Belgium), moisture up to 10%, rough
D16pub_4.doc Copyright DEMINE partners 2002 114 Created on 15.10.02
The contents of this report represent the opinions of the DEMINE project partners

Performance Envelope and Review of Project Objectives 9
surface without vegetation, type of targets, antenna height 20cm), the detec-tion rate is 90% (see summary in Table-1). NOTE THAT THIS NUMBER IS NOT STATISTICALLY SIGNIFICANT.
• Some shallowly buried mines (3 cm deep) have not been detected, one of them because of its position (at the edge of the scanned area), for the others we suspect the antenna height. The Beer Bottle at 6cm deep has not been de-tected because it was filled with clay.
D16pub_4.doc Copyright DEMINE partners 2002 115 Created on 15.10.02
The contents of this report represent the opinions of the DEMINE project partners

Performance Envelope and Review of Project Objectives 9
9.2. Review of Project Objectives
(based on the first field tests in Angola in particular light of the initial ob-jectives (i.e. before the project started) with particular reference to the tar-get performance)
Target Performance and Outcome *(1 = Objective 100% reached, 6 = Objective 0% reached)
Initial Operational Objectives Outcome Measure of success 1-6*
Target weight: 10-20 kg 12 kg 1
Target power consumption: 50-100 W 55 W 1
Scan width 50-80 cms 60 cms 1
Scan rate up to 50 cm/s 10 cm/s2 3
Operated in standing position similar to metal detector
Mechanism built and tested3 4
Audio speakers and visual display No audio speakers4, visual display 3
System balanced Yes 2
Batteries and possibly computer stored in back pack
Prototype without backpack 5
Identification of metal and non-metallic mines
70% identified5 3
Minimal false alarm rate as possible (e.g. discrimination against shrapnel and car-tridges) improvement of 3-5 times on the best of present devices
Low false alarm rate6 2
2 With 2048 averages per scan
3 Present weight of the prototype and the limited operational range of the positioning system make the detector not as easy to use as a MD.
4 Audio speakers may be added relatively simply this however would follow first when on-line process-ing and classification is implemented
5 This value is based on the first ever tests / measurement gathering with the first field demonstra-tor/prototype in Angola. The measurements at the tests are also a basis on which to further develop the detector. A safe statistic may only be given with a great deal more tests and evaluation.
D16pub_4.doc Copyright DEMINE partners 2002 116 Created on 15.10.02
The contents of this report represent the opinions of the DEMINE project partners
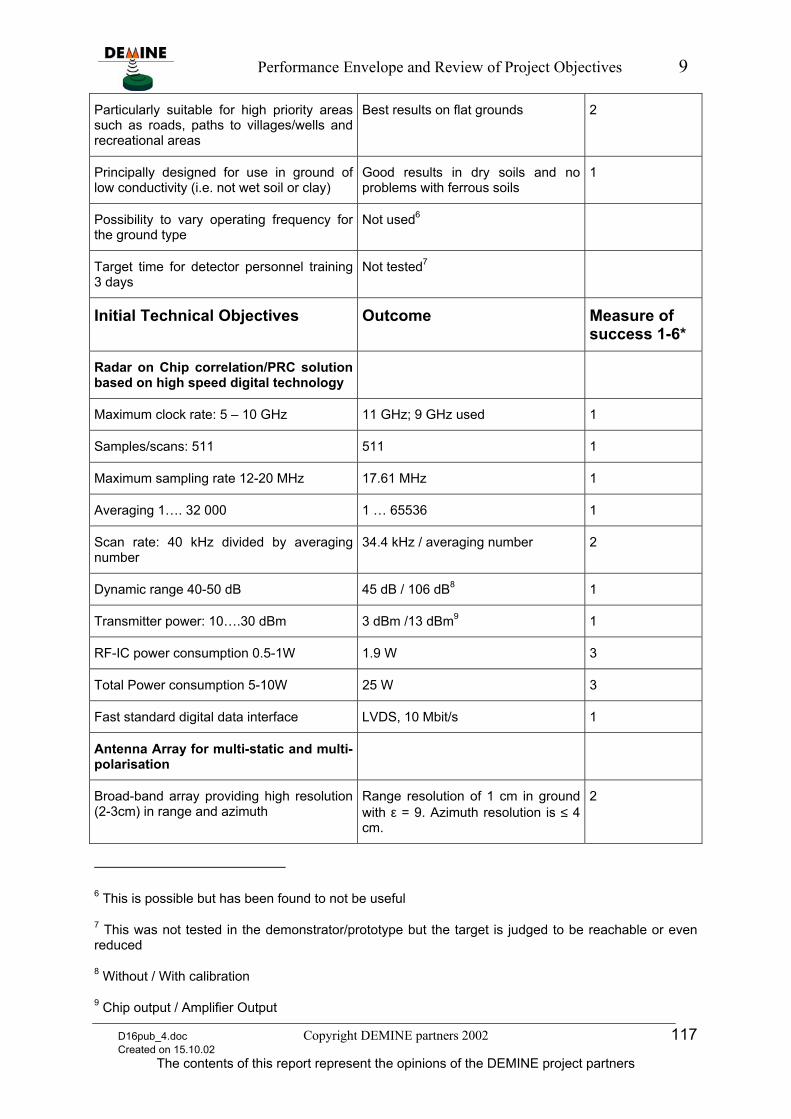
Performance Envelope and Review of Project Objectives 9
Particularly suitable for high priority areas such as roads, paths to villages/wells and recreational areas
Best results on flat grounds 2
Principally designed for use in ground of low conductivity (i.e. not wet soil or clay)
Good results in dry soils and no problems with ferrous soils
1
Possibility to vary operating frequency for the ground type
Not used6
Target time for detector personnel training 3 days
Not tested7
Initial Technical Objectives Outcome Measure of success 1-6*
Radar on Chip correlation/PRC solution based on high speed digital technology
Maximum clock rate: 5 – 10 GHz 11 GHz; 9 GHz used 1
Samples/scans: 511 511 1
Maximum sampling rate 12-20 MHz 17.61 MHz 1
Averaging 1…. 32 000 1 … 65536 1
Scan rate: 40 kHz divided by averaging number
34.4 kHz / averaging number 2
Dynamic range 40-50 dB 45 dB / 106 dB8 1
Transmitter power: 10….30 dBm 3 dBm /13 dBm9 1
RF-IC power consumption 0.5-1W 1.9 W 3
Total Power consumption 5-10W 25 W 3
Fast standard digital data interface LVDS, 10 Mbit/s 1
Antenna Array for multi-static and multi-polarisation
Broad-band array providing high resolution (2-3cm) in range and azimuth
Range resolution of 1 cm in ground with ε = 9. Azimuth resolution is ≤ 4 cm.
2
6 This is possible but has been found to not be useful
7 This was not tested in the demonstrator/prototype but the target is judged to be reachable or even reduced
8 Without / With calibration
9 Chip output / Amplifier Output
D16pub_4.doc Copyright DEMINE partners 2002 117 Created on 15.10.02
The contents of this report represent the opinions of the DEMINE project partners
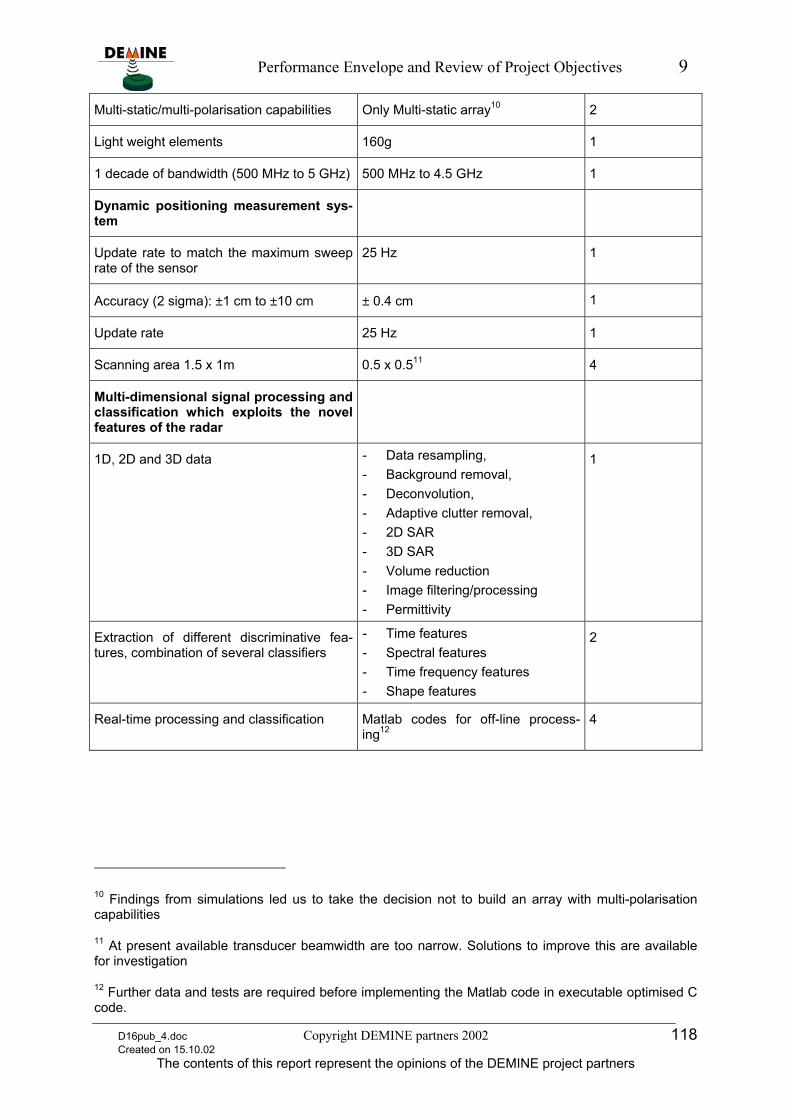
Performance Envelope and Review of Project Objectives 9
Multi-static/multi-polarisation capabilities Only Multi-static array10 2
Light weight elements 160g 1
1 decade of bandwidth (500 MHz to 5 GHz) 500 MHz to 4.5 GHz 1
Dynamic positioning measurement sys-tem
Update rate to match the maximum sweep rate of the sensor
25 Hz 1
Accuracy (2 sigma): ±1 cm to ±10 cm ± 0.4 cm 1
Update rate 25 Hz 1
Scanning area 1.5 x 1m 0.5 x 0.511 4
Multi-dimensional signal processing and classification which exploits the novel features of the radar
1D, 2D and 3D data - Data resampling, - Background removal, - Deconvolution, - Adaptive clutter removal, - 2D SAR - 3D SAR - Volume reduction - Image filtering/processing - Permittivity
1
Extraction of different discriminative fea-tures, combination of several classifiers
- Time features - Spectral features - Time frequency features - Shape features
2
Real-time processing and classification Matlab codes for off-line process-ing12
4
10 Findings from simulations led us to take the decision not to build an array with multi-polarisation capabilities
11 At present available transducer beamwidth are too narrow. Solutions to improve this are available for investigation
12 Further data and tests are required before implementing the Matlab code in executable optimised C code.
D16pub_4.doc Copyright DEMINE partners 2002 118 Created on 15.10.02
The contents of this report represent the opinions of the DEMINE project partners
Performance Envelope and Review of Project Objectives 9
9.3. Improvements on the DEMINE project results
9.3.1. Performance envelope
This section refers to an improved performance enveloped for an improved concept based on the DEMINE results.
All surface penetrating radars are governed by particular parameters given by phys-ics. Increased water and salt content of ground reduce the propagation of SPR sig-nals. On this basis some grounds will never be suitable for SPR detectors for hu-manitarian demining and accordingly no SPR will be able to detect 100% of APLs in all soil types. The parameters we have reached in this project for water content and soil types are we believe on the boundaries of what is achievable. Further great in-vestment in SPR electronics would only be likely to improve these parameters to a small extent. In considering the parameters of surface roughness, clutter and sub-surface clutter we predict that improved performance could be achieved through an improved bandwidth (covering at least 7 and up to 10 GHz) combined with a real and polarimetric array (for distinguishing between APLs and clutter) and suitable data processing software. Such a system could offer improvement to the three parameters mentioned because of improved time frequency features and Eigen-moden extraction of the mines. The parameter of the types of mines which we are able to detect may not be improved – all metallic and non-metallic mines – although the performance envelope for the depths of the mines could also be improved through a system with increased bandwidth such as that described above. This system could enable us to also detect mines with depths of between 0 and 2cms. It should be noted that our present performance envelope maximum depth is based on the worst case scenario ground in which we could operate the system, more favourable ground would provide for greater depth performance.
The increase in performance offered by such as system may not be estimated at this point in time and would be dependent on the chip technology available. As an exam-ple, the chip technology used in the DEMINE project (0,8µ SiGe) was able to provide the bandwidth of 4,5 GHz, a project which is presently exploiting results from DEMINE (the DEMAND project) uses improved chip technology now offered by a chip manufacturer which we hope may achieve a bandwidth of 7,5 GHz. The re-sources required in order to develop such an improved system and to carry out statis-tically significant testing are estimated to be €3–6M.
9.3.2. Improvements required to the DEMINE detector
This section refers to product engineering under the DEMINE concept.
The improvements to the DEMINE detector which are required in order to be able to market it as a functioning product have been described in the technology implemen-tation plan (TIP) and may also be derived from the previous section on the review of the project objectives. The main improvements are:
• The positioning system D16pub_4.doc Copyright DEMINE partners 2002 119 Created on 15.10.02
The contents of this report represent the opinions of the DEMINE project partners
Exploitation 10
• The man machine interface
• Real-time Data processing and classification
These improvements it should be noted are in order to be able to provide a function-ing product. We do not expect to be able to improve the performance envelope be-yond that which has been described in section 10.1 to any significant extent. An ex-ception would be that further extensive tests could provide a statistically significant probability of detection which could be beyond 90%. In addition, it would be possible to implement the newest chip technology within the DEMINE concept i.e. the multi-static array with possible advantages. Our exploitation plan which is summarised in the next section provides an estimate, by the main implementer IDS, of the resources required to carry out the improvements described here.
D16pub_4.doc Copyright DEMINE partners 2002 120 Created on 15.10.02
The contents of this report represent the opinions of the DEMINE project partners

Exploitation 10
10. Exploitation
Introduction
Previous chapters in this report have highlighted the key hard and software sub-systems for the DEMINE system which have been developed and results of their test-ing. The test results have been very positive convincing the partners of the benefits which the key radar technology offers to humanitarian demining and also to other applications. The results are an encouraging basis upon which to continue further development of the radar technology and to start further investigations into the engineering of final products. During the project exploitation work was carried out in order reach the fol-lowing goals:
• To develop improved market knowledge on humanitarian demining in order to be able to take business decisions
• To develop a plan of how the project results could be exploited in a commer-cialised single sensor hand held humanitarian demining detector
• To highlight and where possible plan how the results could be exploited in fur-ther humanitarian demining detection systems
• To highlight how the results could be exploited in further industrial products Deliverables for the project included the Technology Implementation Plan and an ad-ditional Exploitation and Business Plan. In what follows we provide the results of the work undertaken to achieve the above goals. Section 1 End Product is a result of the work undertaken in order to reach the first two goals and includes a product concept, preliminary marketing plan, route to exploitation, estimated budget and partner agreements. Section 2 contains informa-tion on how the project results are being exploited in Other Humanitarian Demining Detection Systems. Section 3 highlights the potential and plans for exploiting the re-sults in Additional industrial products.
10.1. Single sensor hand held humanitarian demining detector
Confidential
10.2. Further humanitarian demining detection systems
During the course of the project the consortium partners decided that one very good path towards the exploitation of the project results was through their integration in other humanitarian demining detection systems. The key considerations which led to this decision were:
• Prevailing research and development results and clustering activities which highlighted that high-tech multi-sensor mine detection technologies with data fusion are likely to offer better all-round performances
D16pub_4.doc Copyright DEMINE partners 2002 121 Created on 15.10.02
The contents of this report represent the opinions of the DEMINE project partners
Exploitation 10
• With a view to the first point that company investment would be better placed in a multi-sensor solution
• European and National research and development funds available for the de-velopment and demonstration of multi-sensor technology for humanitarian demining
In what follows we shortly introduce the humanitarian demining systems in which pro-ject results and knowledge are being exploited. One of the projects (DEMAND) has already been mentioned above. Partners from the DEMINE project are in bold.
10.2.1. Enhancement of three existing technologies and data fusion algorithms for the test and DEmonstration of Multi-sensor lANdmine Detection techniques (DE-MAND)
Partners:
• Technische Universität Ilmenau (TUI), Germany • IDS Ingegneria dei Sistemi S.p.A. (IDS), Italy • Biosensor Applications Sweden AB (BAAB), Sweden • GTD Ingeniería de Sistemas y Software Industrial S.A. (GTD), Spain • MEODAT Messtechnik, Ortung und Datenverarbeitung GmbH (MEODAT),
Germany • Schiebel Elektronische Geräte GmbH (SCHIEBEL), Austria • Statens Raeddningsverk, (Swedish Rescue Services Agency, SRSA), Sweden
Description:
Construction of a multi-sensor demining system based on:
• Metal Detector array (by SCHIEBEL)
• GPR array (by IDS, TUI, MEODAT)
• Biotechnology Vapour sensor (by BAAB)
• Data Fusion (by GTD)
Develop Operational Procedures (by SRSA) for suitable scenarios combining (by Data Fusion) :
• Area reduction capabilities (Biotechnology Vapour sensor)
• Close-in detection capabilities (MD & GPR arrays)
Evaluate system performance for selected scenarios
Sponsor of source of financing:
• European Union 5th Framework programme
D16pub_4.doc Copyright DEMINE partners 2002 122 Created on 15.10.02
The contents of this report represent the opinions of the DEMINE project partners

Exploitation 10
Total budget:
• ca. 4 M EUR
10.2.2. QinetiQ Portable Humanitarian Mine Detector (PHMD)
Partners:
• QinetiQ (formerly DERA), UK • Sub-contractors including Guartel Ltd and MEODAT GmbH
Description:
Combined ground penetrating radar array and metal detector, assisted by capacitive sensors. Units to be tested under the International test and evaluation programme (ITEP) and with Norwegian People’s Aid. Further funding is being sought to enable comprehensive user evaluation of a number of units and development of production
Sponsor of source of financing:
• Funded by United Kingdom Treasury Capital Modernisation Fund, sponsored by UK Ministry of defence and Department of International development
Total Budget:
• 3 M UK pounds sterling
10.2.3. Other humanitarian demining systems
Consortium partners have been approached by NGOs carrying out demining as well as commercial companies wishing to evaluate the key radar technology for specific operational needs and scenarios, these include:
• A detector for mine clearance on railway tracks
• A detector for quality assurance
• A vehicle mounted system for clearance operations in the desert
Consortium partners are presently seeking funds in order to provide suitable units for end user evaluation
10.2.4. Humanitarian demining equipment, techniques, test site in Angola
The DEMINE test site in Onjiva, Angola is an ideal site in order to test equipment af-ter laboratory testing in near real field conditions. This site is available for other de-velopers of humanitarian demining systems and techniques as well as for the training of dogs.
Description:
D16pub_4.doc Copyright DEMINE partners 2002 123 Created on 15.10.02
The contents of this report represent the opinions of the DEMINE project partners
Exploitation 10
• Seven test lanes have been prepared, each measuring a nominal 11m x 1.5m
• 3 different soil types
• 72 targets, including typical false alarms placed
• Exact positions of targets recorded
10.3. Additional products
During the project the emphasis on exploitation was placed on humanitarian demin-ing technology. The consortium partners have however realised the potential to be gained from transferring project results from DEMINE into industrial products. In what follows we describe the most important additional parallel application a General SPR detector before highlighting which of the sub-system results offer the most opportu-nity for exploitation in additional products.
Due to the limited resources and work plan in the project detailed work was not car-ried out for these additional applications although in the Technology Implementation Plan (TIP) we included information on market sectors and individual partner fore-casts. Further technological and market details including the main implementers, IDS´s strengths, are also included in the project Business and Exploitation Plan de-liverable.
10.3.1. General surface penetrating radar detector
The radar equipment can be used for any survey (contact and non contact) where very high resolution is required at shallow depth.
The following applications have good market opportunities:
• Pipe detection at shallow depth
Pipe detection is usually performed at depth ranging from 60 to 2000 cm, where most utilities are installed. Recently the mini trencher technique is increasingly used due to very low installation costs. The mini trencher uses a cutting disk able to perform a little trench (7cm wide, 30cm depth) for the installation of pipes and cables. This kind of solution requires a preliminary radar survey, in order to avoid both the cost due to the repair of pipes broken during the dig and the risk of accident in case of breakage of electrical cables or gas pipes. The DEMINE equipment with minor adjustments, could be a reliable and high performance solution for this application.
• Inspection of roads
Inspection of roads includes several different applications, depending of the targets type (layers, voids, water, artefacts) and the target dimension and depth. The re-quirements are shallow depth and high resolution: detection layers, voids, water, and anomalies in asphalt/concrete. The DEMINE detector can overcome such require-ments.
D16pub_4.doc Copyright DEMINE partners 2002 124 Created on 15.10.02
The contents of this report represent the opinions of the DEMINE project partners
Exploitation 10
10.3.2. Integrated Ultra Wide Band Electronics
The radar chip developed by TUI and MEODAT represents the realisation of a very innovative technology. The main applications are in georadar, military high-resolution radar, imaging radar, car anti-collision devices and communications e.t.c. In practice the radar chip offers, at low cost, a high performance, spread spectrum transmission, with advantages in term of:
• Resistance to disturbances (EMI)
• Low detectability (e.g. military applications)
• High resolution, sensitivity, data rate.
10.3.3. Antennas
The ultra wide band antennas developed in the DEMINE project can be applied to measurement equipment (network analyser) for near field and far field measurements with advantages due to their low cost, low dimensions, low weight, wide bandwidth and, therefore, capability to be used in conjunction with most commercial “position-ers”.
10.3.4. Positioning system
The DEMINE positioning system offers to provide economical 3D-position measure-ment inside a cube of 1 meter dimensions with an accuracy of approximately 1cm. The dimensions of the measurement cube could be easily improved. Further work is still required as noted above to improve the positioning system.
10.4. Exploitation Conclusion
The results of market and exploitation work in the project were:
• A product concept for a single sensor hand held humanitarian demining detec-tor based on the DEMINE results
• A preliminary marketing plan for the single hand held sensor
• The exploitation and financing route for the single hand held sensor
• Initial partner agreements on roles and responsibilities for the single hand held sensor
• Funding for the implementation of DEMINE results, knowledge and their fur-ther development in two multi-sensor detection systems for humanitarian demining
• Requests for evaluation of the technology for specific humanitarian demining needs and scenarios for which funding is being sought
D16pub_4.doc Copyright DEMINE partners 2002 125 Created on 15.10.02
The contents of this report represent the opinions of the DEMINE project partners
Conclusion 11
• A valuable test site in Angola for development, testing, evaluation and training of demining technology and procedures
• Highlighting of non demining applications in which results may be exploited
• The exploitation and financing route for a general surface penetrating radar detector which supports the route for the exploitation and financing route for the single hand held sensor for humanitarian demining detector
These exploitation results certify that the DEMINE project results are being exploited both for humanitarian demining and in industrial applications.
The exploitation route highlights that a decision on whether to manufacture the single hand held sensor for humanitarian demining will be taken at the end of 2003 based on application and market parameters highlighted above. The core technology in DEMINE i.e. the radar based on chip technology, antenna technology and data proc-essing are however being implemented and further developed in two multi-sensor humanitarian demining detection systems. We are also seeking to implement the re-sults in further systems.
D16pub_4.doc Copyright DEMINE partners 2002 126 Created on 15.10.02
The contents of this report represent the opinions of the DEMINE project partners
Conclusion 11
11. Conclusion Since the middle of the 1990s increased world attention has been placed on the hu-man and economic problem of anti-personnel landmines (APLs) left over in previous combat zones. The European Union along with a majority of world nations have signi-fied a commitment to removing this problem as quickly as possible. Organisations conducting demining state that present demining techniques with professional proce-dures are able to detect and clear the APLs left in the world it just a question of time and money. The European Union and other world nations provide funding for re-search and development for humanitarian demining technology in the expectation of receiving technological solutions which will reduce the overall cost of APL detection and clearance through increased speed.
The most common tool used for demining since its invention in the first half of the last century is the metal detector. The metal detector, as is apparent from its name, de-tects metal and not mines per se. APL detection and their ensuing clearance with metal detectors is accordingly really metal detection and its ensuing clearance. One way in which the research and development community for humanitarian demining is trying to fulfill political expectations is through the tackling of this inherent deficit in the metal detector.
One technology which offers the potential to reduce this deficit is surface penetrating radar (SPR). The advantage of SPR is that it promises to distinguish between mine like objects and non-mine like objects. Clearly, such a solution would be an improve-ment on metal or not metal, particularly as ex-combat zones are very often contami-nated with a great deal of metal.
The DEMINE detector and its technology is not the first SPR technology which has been tested or developed for mine detection. It is however an SPR technology which has considerably moved forward the boundaries of SPR technology underlining the definite potential to humanitarian demining from SPR technology. The boundaries of SPR technology have been brought forward by DEMINE through:
• Fast and stable electronics
• Improved antennas
• Improved software for target detection and discrimination
The fast and stable electronics supported by the antennas provide information of a quality and quantity of which we are aware of no comparison. The quality of the in-formation allows the use of more sophisticated signal processing than in other SPRs. The result is that the promise of SPR technology is closer to a fieldable tool for hu-manitarian demining. Technical parameters partially exceed the initial expectations and hopes.
In our deliverables D9 and D11-12 and in this report particularly in the section per-formance envelope we have described the possibilities offered by the technology based on the limited tests we were able to conduct during the period of the project.
D16pub_4.doc Copyright DEMINE partners 2002 127 Created on 15.10.02
The contents of this report represent the opinions of the DEMINE project partners
Conclusion 11
Promising results have been after only 30 months (project duration) to design, build and test what was initially only a concept.
In preparing the initial proposal for DEMINE the consortium sought to answer hu-manitarian expectations for the development of a single hand-held sensor for hu-manitarian demining. During the project we have also developed a route towards ex-ploiting the project results in an engineered single-sensor hand-held detector. Seek-ing for multi-sensor solutions which could offer more returns in terms of reduced cost for humanitarian demining we have also ensured that the results from this project are being integrated in two multi-sensors (one vehicular and one hand-held) as described in our Technology Implementation Plan (TIP) and Deliverable D15 as well as in this report. Following further technological investigations and developments including market developments a go, no-go, decision for the single sensor hand-held detector is planned at the end of 2003.
Results from the project will also flow into a number of industrial applications as de-scribed in our Technology Implementation Plan (TIP) and Deliverable D15 as well as in this report.
The project has been very successful for the partners and we believe the goals of humanitarian demining in providing results which increase the state-of-the-art through the application of innovation offering a return on investment which is estimated to be far greater than the investment in the project.
D16pub_4.doc Copyright DEMINE partners 2002 128 Created on 15.10.02
The contents of this report represent the opinions of the DEMINE project partners
Related Documents