i Final Report for Two Research Studies: Economic Benefits of Tree Preservation and Compact Development for the Ohio Balanced Growth Program Prepared for: the Ohio Water Resources Council and the Ohio Lake Erie Commission For Submission July 31, 2013 Prepared by: Levin College of Urban Affairs Wendy Kellogg, Ph.D., Project Director [email protected] 216-687-5265 2121 Euclid Ave. Cleveland State University Cleveland, Ohio 44115 Project Team: Kathryn Hexter Dr. Brian Mikelbank Robert J. Laverne Molly Schnoke Charles Post Caylen Payne Nat Neider Minkyu Yeom

Welcome message from author
This document is posted to help you gain knowledge. Please leave a comment to let me know what you think about it! Share it to your friends and learn new things together.
Transcript

i
Final Report for Two Research Studies: Economic Benefits of Tree Preservation and Compact Development for the Ohio Balanced Growth Program
Prepared for: the Ohio Water Resources Council and
the Ohio Lake Erie Commission
For Submission July 31, 2013
Prepared by:
Levin College of Urban Affairs Wendy Kellogg, Ph.D., Project Director
216-687-5265
2121 Euclid Ave. Cleveland State University
Cleveland, Ohio 44115
Project Team: Kathryn Hexter
Dr. Brian Mikelbank Robert J. Laverne
Molly Schnoke Charles Post
Caylen Payne Nat Neider
Minkyu Yeom

ii
Table of Contents Section Page Figures and Tables iv 1.0 Project Overview & Executive Summary 1 2.0 Rationale and Research Questions 2 2.1 Benefits and Challenges to Tree Preservation 2 2.1.1 Research Questions on Economic Value of Trees 5 2.2 Benefits and Challenges to Compact Development as a Model 5 2.2.1 Research Questions on Compact Development 6 3.0 Research Design and Conceptual Model 7 4.0 Data Collection, Analysis and Results 9 4.1 Home Sale Price & Hedonic Modeling by Parcel 9 4.1.1 Data Description 9 4.1.1.1 Home Sales and Parcels 9 4.1.1.2 Tree Canopy, Dominance and Location 12 4.1.2 Modeling Sequence and Results 15 4.2 Characterization of Developments 31 4.2.1 Location of Developments 31 4.2.2 Identification of Compact Density Developments 33 4.2.3 Characterization of Developments by Type 34 4.3 Market Characteristics for Trees and Compact Development 37 4.3.1 Supply: Home Developers 38 4.3.2 Demand: Real Estate Agents 45 4.3.3 Context: Local Jurisdictions 50 5.0 Summary of Findings and Discussion 55 5.1 Characteristics of Homes and Developments During the Study Period 55 5.2 Findings Related to Economic Value of Tree Preservation 55 5.2.1 Research Question #1: Influence of Preserved Trees on Home Sale Prices 55 5.2.2 Research Question#2: Benefits and Costs to Developers Associated with
Tree Preservation 56
5.2.3 Research Question #3: Benefits and Costs Savings to Community Associated with Tree Preservation
57
5.3 Findings Related to Compact Development 57 5.3.1 Research Question #4: Market for Compact Development and Tree
Preservation Practices 57
5.3.2 Research Question #5: What Are the Cost And Sales Benefits to Developers?
58

iii
5.3.3 Research Question #6: What cost savings and economic benefits might accrue to communities?
59
6.0 Recommendations 60 6.1 Future/Additional Research 60 6.2 Policy Implications 61 7.0 References 64 8.0 Appendices 68 Appendix A. Notes on Obtaining Parcel Data Appendix B. Davey Resource Group Canopy Classification Methodology Appendix C. Summary of Identified Subdivisions in Study Area Appendix D. Historic Land Cover And Site Design for Six Sample Types of
Developments
Appendix E. Housing Developer Interview Questionnaire Appendix F. Real Estate Agent Interview Questionnaire Appendix G. Telephone Survey for Local Jurisdictions Appendix H. Personnel Bios
iv
Figures Figure 1. Modified and Adopted Research Design 8 Figure 2. Housing Sale Locations 11 Figure 3. Schematic of Tree Canopy and Other Data Collection and Analysis 15 Figure 4. Development Sites and Scattered Housing Sites 33 Figure 5. Subdivision Locations by Proximity of “Neighboring” Parcels 34 Figure 6. Typology of Housing Developments 36 Figure 7. Identified Subdivisions by Type 36 Figure 8. Location of Compact Development Projects in Balanced Growth Watersheds
in the Lake Erie Basin. 61
Tables Table 1. Summary of Data Needs and Sources 9 Table 2. New Construction Home Sales by County 11 Table 3. Sales by Year 11 Table 4. Tree Canopy by County 13 Table 5. Data Description for Regression Modeling 17 Table 6. Descriptive Statistics of Regression Input Data 19 Table 7. Model “A” Results 23 Table 8. Model “B” Results 26 Table 9. Lot Size by County 28 Table 10. Model “C” Results 29 Table 11. Summary of Development and Scattered Site Sales 32 Table 12. Development vs. Scattered Site Sales by County 32 Table 13. Numeric Distribution of Types of Development 37

1
1.0 Project Overview A team of faculty, research staff and graduate students at the Levin College of Urban Affairs completed two studies to assist the Ohio Lake Erie Commission and the Ohio Water Resources Program in developing guidelines for Best Practices for local governments in the Ohio Balanced Growth Program. The RFP called for research on the economic benefits of Tree Protection (preservation of existing trees on site during the development process) and Compact Development, both of which have stormwater management benefits that can contribute to the achievement of goals of the Ohio Balanced Growth Program. The RFP noted that the focus for the research should be on communities at the urban fringe subject to development pressure, and that if possible, information should relate to developments in communities within Balanced Growth Watersheds. After an exploratory stage (described below in Section 4.1), our research focused on the six counties comprising the metropolitan area of Cleveland, Ohio (Cuyahoga, Lake, Geauga, Summit, Medina and Lorain) between 2009 and 2012. These counties contain seven Ohio Balanced Growth Watershed planning areas (Chagrin River, Brandywine Creek, Furnace Run, Chippewa Creek, Big Creek, Upper Chippewa Creek, and Upper West Branch of the Rocky River. The research project has used normal methods of inquiry to provide information on the economic benefits of tree protection and compact development. We used a mixed method research design, combining quantitative and qualitative techniques. This approach used data obtained through digitized satellite imagery of tree canopy from Davey Resources Group, Google earth imagery to identify residential development site design, existing databases of auditors’ sale price and home square footage characteristics, a telephone survey to planning and building departments in local jurisdictions, and guided interviews with residential developers and real estate agents. This allowed for development of a nuanced and comprehensive understanding of the economic value that may accrue as a result of tree preservation and the economic benefits and cost savings accruing from a more compact built residential form as well as challenges to implementing these aspects of home development. The Ohio Balanced Growth Program has provided guidance to local governments and supported community-based processes to plan for watershed protection. The array of policies and programs, identified through previously funded research (Kellogg 2007) and state agency processes, includes incentives for the development community and local governments to adopt mechanisms from the Best Local Land Use Practices (and State’s Balanced Growth Strategy documents (Ohio Lake Erie Commission, 2011). The current research augments these efforts by providing Ohio-based information and case studies. The research results can inform policy, incentives and guidelines for tree protection and compact development, specifically, both of which will provide stormwater management benefits to local communities in the Lake Erie tributary rivers. The research was designed to provide a picture of the economic value of tree preservation and compact development in

2
terms of sales prices in a large geographic area (metropolitan), as well as an understanding of the current market for compact development (from suppliers and agents working with demand sector), and to provide examples of these values and challenges through a summary case study of a subset of development projects in the metropolitan region during the years 2009 through 2011. Our results from the hedonic modeling indicate that increasing square footage of tree canopy on a lot increases sale price from 1% to 5% depending on county in the study area. However if the total percent of the lot covered by tree canopy exceeds a limit revealed by the regression model, tree canopy can serve to negatively influence sale price. Results from qualitative studies of market demand based on interviews with developers and real estate agents indicates there is indeed a market for development at density commensurate with “compact development” models in several of the counties in the study area. To summarize, sellers (developers and real estate agents) recognize the market, as do buyers. 2.0 Rationale and Research Questions 2.1 Benefits and Challenges to Tree Preservation Forestry and water resource managers suggest that the preservation of existing trees in the land development process will provide a wide range of benefits to communities (Dwyer et al, 1992; Hudson, 2000). These benefits accrue in environmental (e.g., storm water sequestration, air quality improvements,) economic (e.g., energy conservation) and social (e.g., noise abatement, enhanced social interaction) aspects of communities.
Trees and forest canopy provide numerous environmental benefits to urban and suburban dwellers, including oxygen production (Nowak, Hoehn, and Crane 2007) and air pollutant removal through absorption into leaves and bark helping to prevent low level ozone and remove particulates (Nowak 1994; Nowak, et al 2006). These changes provide a healthier ambient environment for urban residents as well. Trees also can reduce of urban heat island effect through lowering surface temperatures from shade (Akbari et al 2001) and sequestering carbon (Nowak and Crane 2002; Banzhaf 2007).
In terms of water, urban trees capture stormwater and reduce overland runoff through infiltration and absorption into leaves and root systems (Xiao and McPherson, 2002; McPherson, et al 2006; Young 2011)); purify and reduce surface water temperatures (Jeng et al 2005; Rossi and Hari, 2007). The effect of trees and tree canopy on water generates the importance of tree canopy protection for the health and biodiversity of Lake Erie and its tributary streams.
3
Trees also may contribute economic value by their presence. Indirect benefits include reduction in storm water infrastructure costs in the hundreds of millions of dollars due to the presence of trees (Young 2011; McPherson et al 2006). Direct benefits include changes in housing sale price. In most cases, the presence of well-maintained landscape trees that are properly located around residential homes, commercial businesses, and even office properties are considered assets and contribute favorably to the value of the real estate. However poorly maintained, diseased or structurally unstable trees can be liabilities that diminish real estate value. A study conducted in Athens Georgia between 1978 and 1980 considered 844 single family residential properties and found that the presence of landscape trees contributed approximately 3.5% to 4.5% to selling price. Researchers found that intermediate to large landscape trees contributed more than smaller trees regardless of species. This study used hedonic modeling to test the correlation between trees and real estate value (Anderson & Cordell, 1988). A study conducted in Quebec City between 1993 and 2000 considered 760 single-family residential properties. This study used hedonic modeling to test the correlation between trees and real estate value. Researchers identified 31 attributes of trees and the surrounding landscape that were used as variables within a hedonic model to test the strength of their influence on real estate selling price. The findings suggest that quality landscaping that includes trees, shrubs, turf or other landscape plants contribute favorably (0.2% for each percentage point of tree canopy cover) to residential property selling price, providing tree cover was not too dense. The researchers state: ”By and large, a positive tree cover differential—or a more-than-unity ratio—between the property and its immediate neighborhood translates into a higher house value.” But they also point out: “an above-average density of the vegetation visible from the property impacts negatively on prices.” This suggests that if a residential property has more tree canopy than the surrounding visible neighborhood the effect on property value is positive, but if a higher percent canopy cover is visible from the property than exists on the property the effect on property value is negative. The researchers also report that a landscaped patio, a hedge, as well as landscaped curbs add respectively 12.4%, 3.6% and 4.4% to the market value of a house, respectively (Des Rosiers, Thériault, Kestens, & Villeneuve, 2002). A second study conducted in Quebec City between 1993 and 2001 considered 640 single-family residential property sales. Rather than employing a hedonic price model, researchers used surveys of property purchasers to gage the importance of trees to their decision to purchase the house. They found that in some cases the presence of trees played an important positive role in the purchaser’s value of the property, and in some cases the presence of trees was viewed as a liability that detracted from the property value. The range of perceived value was negative 9% to positive 15% (Thériault, Kestens, & Des Rosiers, 2002). A study conducted in Baton Rouge, Louisiana between 1985 and 1994 considered the effect of mature trees (greater than 9 inches trunk diameter measured at 4.5 feet above the ground)

4
on single-family residential property values. The sample size used in the multiple regression analysis was 269 properties. The model suggests that mature trees contribute about 1.9% to the selling price of the homes in the study market (Dombrow, Rodriguez, & Sirmans, 2000). A study conducted in Portland, Oregon between 2006 and 2007 considered 3,479 residential property sales. For each property the number of street trees (trees growing immediately adjacent to the property within the street right-of-way) was recorded. Attributes of the trees including trunk diameter, height, type (small ornamental, deciduous, conifer) and condition were recorded. To gather tree canopy cover information for the entire residential property aerial imagery was analyzed. Hedonic models were used to test the correlation between the presence of trees and property selling price. The researchers found that the number of street trees fronting a property and the percentage of canopy cover within 100 feet of the structure positively influenced selling price. On average the combined increase in selling price was $8,870. Also, the average time on market was reduced by 1.7 days (Donovan & Butry, 2010). A study conducted in Ramsey (which includes the city of St. Paul) and Dakota counties in Minnesota in 2005 considered 9,992 single-family residential property sales. A hedonic model was used to test the correlation between tree canopy within set distances from a residential parcel and the parcel’s selling price. The model indicates that tree canopy within a 100-meter radius and a 250-meter radius positively affects selling price. This positive effect is apparent for tree canopy percentage up to 44% within a 100-meter radius and 60% within a 250 meter radius. Higher tree canopy percentages then had a detrimental effect on selling price. The researchers state: “These results indicate that the owners of single family residences will pay more for homes with higher levels of tree cover in the local neighborhood of their property (i.e., within 250 m). However, they provide much less evidence that owners of single family residences will pay more for homes with higher tree cover on their own lot or in neighborhoods with high tree cover beyond 250 m from their parcels.” The study also sheds light on what level of percent canopy cover is generally seen as an asset and what level of tree canopy cover is generally seen as a liability. The researchers state: “increasing levels of parcel level tree cover were related to decreased home sale prices up to approximately to 23% tree cover and thereafter to increased home sale prices. The coefficient for tree cover in the 100m neighborhood was positive while the coefficient for the squared term was negative, with both coefficients being statistically significant. Thus, increasing tree cover within a 100 m buffer increased home sale price up to 44% tree cover and thereafter led to decreasing sale price.” The authors conclude: “Home owners appear to place less value on tree cover beyond their immediate local neighborhood and on tree cover over 40% in their immediate local neighborhood” (Sander, Polasky, & Haight, 2010).
A study conducted in Finland considered the selling price of apartments relative to their proximity to urban woodlands and green spaces instead of the presence of trees directly on the property. The study included sales records of 1,006 apartments between 1984 and 1986. The study concluded that in general urban woodlands and access to green space have a positive influence on apartment selling price, although the direct distance from the apartment to the nearest wooded park had a negative correlation with selling price. The researchers

5
state: “The results show that the environmental variables, with the exception of direct distance to nearest forested park, had a significant positive influence on apartment price. On the average, increasing amount of forested areas in the housing district as well as nearness to watercourse and recreation area increased apartment prices. In contrast, forest parks had a negative effect on prices, which was not expected. Apparently this occurred because the range of variable values remained small since most of the apartments (78%) were at a distance of 100 m or closer from a forested area” (Tyrväinen, 1997). This study may be relevant to compact development housing sales that have little room on individual properties to support trees but may have access to nearby preserved green space.
While many of these benefits can accrue from tree preservation (which increases the mature trees in a development or on a parcel) the real estate development community historically has resisted adoption of site preparation practices that increase site preparation costs or impose additional time on site preparation, including tree preservation. The current research effort seeks to identify benefits to preservation practices that will shift the calculation of “time” and “money” to include the direct benefit from economic value of trees as reflected in sale price. Our research sought to provide information regarding economic benefits of trees in an Ohio context. We first focused on the direct economic benefits to the sale prices of land as real estate, and developed a hedonic price model to assess the economic value of preserved trees on parcels in new developments in the six counties comprising the metropolitan area of Cleveland, Ohio (Cuyahoga, Lake, Geauga, Summit, Medina and Lorain) between 2009 and 2012. The purpose of the modeling was to answer research question #1 below.
Qualitative research (interviews and document review) was used to gain information from the land development community and real estate agents to provide additional information to answer research question #1, and to answer research questions #2. Finally, qualitative research methods (interviews, telephone survey, and document review) were used to collect information from local jurisdictions to answer research question #3.
2.1.1 Research Questions on the Economic Value of Trees:
1. What is the influence of preserved trees on sale price of a home on a parcel? 2. What benefits and costs accrue to developers and what are the challenges to tree
preservation? 3. What benefits or cost savings to the community may accrue secondarily?
2.2 Benefits and Challenges to Compact Development as a Model Urban planners have asserted that compact development, mirroring the scale and densities of traditional late 19th century urban neighborhoods, can provide numerous economic, social and environmental benefits. This more compact development scenario embodying small lot sizes and higher numbers of units per acre (6 to 10) allows for walking and reduced reliance on use of the automobile. This density and proximity of housing is the prerequisite to linking

6
residential housing units to retail or office areas that characterize the “life style” developments in American cities and suburbs (e.g., Crocker Park in Westlake, Ohio). This density also may allow for more social interaction when houses are in closer proximity (Mehta 2009; Greenberg 1995). Clustered housing units on a given site may allow a portion of a development site to be preserved for open space and storm water management to reduce off-site impacts (Hood, Clausen & Warner, 2007). Estimates of economic value of site design and developer costs and benefits are mixed (Williams & Wise 2009). Some evidence suggests this design configuration raises home values (Cortright 2009). The benefits in some cases may accrue directly to developers in sales volume and prices (Mikelbank 2008).
Indirect economic benefits may also accrue to communities because walkable communities perform better economically due to increase pedestrian activities bringing elevated retail revenues (Greenberg 1995; Leinberger and Alfonzo 2012) when housing is in walkable distance to retail stores. Local jurisdictions may also benefit directly from compact development through infrastructure cost savings as fewer feet of infrastructure (sidewalks and streets) is built and maintained (Brookings Institution; Littman 2004). Enhanced tax revenue may accrue if compact units generate higher property values. Compact development may also support storm water management by saving open space and reducing pollutant loadings per capita (Jacob 2011). Primarily qualitative methods (interviews and document review) were used to answer research questions 4 though 6. Respondents included residential land developers, real estate agents (working across the study area), and planners and fiscal officers in local jurisdictions that experienced residential development at a density requisite for “compact” development during the study timeframe. 2.2.1 Research Questions on the Status of Compact Development (from the RFP)
4. Is there a market for compact development in Ohio communities? 5. What are the cost and sales benefits to developers? 6. What cost savings and economic benefits might accrue to communities in terms of
services, infrastructure and tax income from compact development when compared to low-density development?
The remainder of this report documents the following aspects of the study. In Section 3 we review the research design and conceptual model used for mixed-methodology approach. Section 4 describes the data collection, data analysis and results of these analyses for the three major components of the study: home sales and the hedonic modeling at the parcel level as related to trees and compact development; characterization of developments during the study period in terms of number, location in the study area and qualities of tree preservation and compact densities; and market characteristics of benefits and challenges from the perspective of home developers, real estate agents and local jurisdictions.

7
Section 5 discusses the results of these three components are then discussed to respond to the research questions. Section 6 provides suggestions for future research and some policy implications of the overall study results. 3.0 Research Design and Conceptual Model Our research design combined quantitative and qualitative methods to gather and analyze useful information in an Ohio context. Data uncertainties at the beginning of the project included the existence of sufficient home sales in the study years (2009-2011) adequate for hedonic modeling, ability to exclude foreclosure-based sales from the data, ability to discern land cover prior to development for specific sites, and relative property value fluctuations due to the housing market crisis. These issues were resolved.
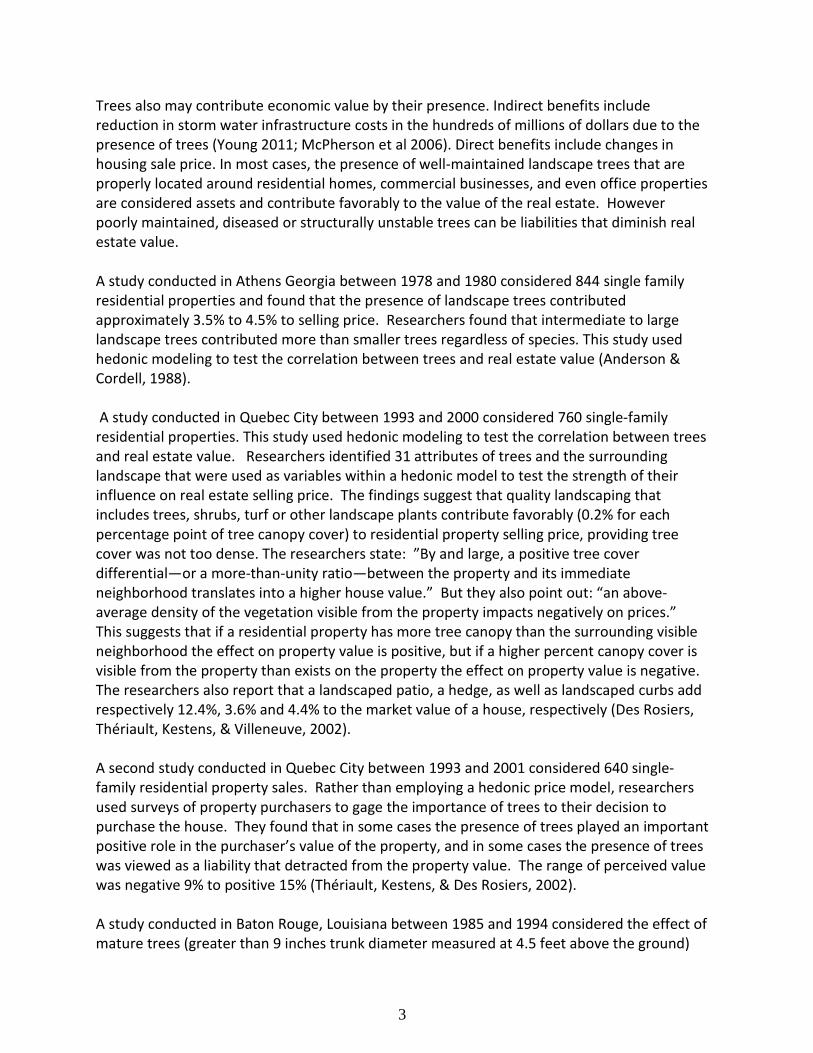
Figure 1. presents our research process as it was adapted for one metropolitan area, Cleveland (as per the early review and data and discussion with the state client). This mixed-method approach allowed for a more robust analysis, but required multiple types of data. Table 1. summarizes the data needs for the research and the sources of data.
8
9
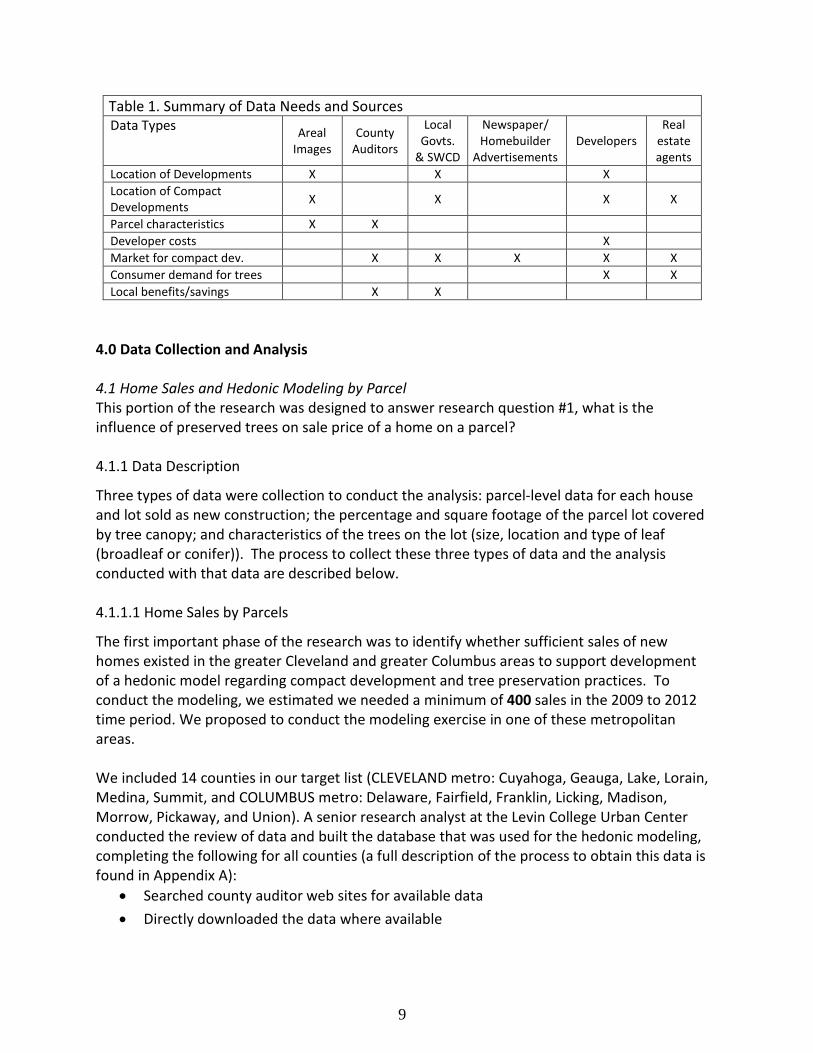
Table 1. Summary of Data Needs and Sources Data Types Areal
Images County
Auditors
Local Govts.
& SWCD
Newspaper/ Homebuilder
Advertisements Developers
Real estate agents
Location of Developments X X X Location of Compact Developments X X X X
Parcel characteristics X X Developer costs X Market for compact dev. X X X X X Consumer demand for trees X X Local benefits/savings X X
4.0 Data Collection and Analysis 4.1 Home Sales and Hedonic Modeling by Parcel This portion of the research was designed to answer research question #1, what is the influence of preserved trees on sale price of a home on a parcel? 4.1.1 Data Description
Three types of data were collection to conduct the analysis: parcel-level data for each house and lot sold as new construction; the percentage and square footage of the parcel lot covered by tree canopy; and characteristics of the trees on the lot (size, location and type of leaf (broadleaf or conifer)). The process to collect these three types of data and the analysis conducted with that data are described below. 4.1.1.1 Home Sales by Parcels
The first important phase of the research was to identify whether sufficient sales of new homes existed in the greater Cleveland and greater Columbus areas to support development of a hedonic model regarding compact development and tree preservation practices. To conduct the modeling, we estimated we needed a minimum of 400 sales in the 2009 to 2012 time period. We proposed to conduct the modeling exercise in one of these metropolitan areas. We included 14 counties in our target list (CLEVELAND metro: Cuyahoga, Geauga, Lake, Lorain, Medina, Summit, and COLUMBUS metro: Delaware, Fairfield, Franklin, Licking, Madison, Morrow, Pickaway, and Union). A senior research analyst at the Levin College Urban Center conducted the review of data and built the database that was used for the hedonic modeling, completing the following for all counties (a full description of the process to obtain this data is found in Appendix A):
• Searched county auditor web sites for available data • Directly downloaded the data where available

10
• Contacted county auditor personnel where the data were not available directly, and/or where we needed the available data to be supplemented with additional data
• Processed the data and converted from the original format into SAS files • Where necessary, merged sales file data with property characteristics data • Filtered to include only single-family and residential condos • Filtered to select first sale after house was built; this often required manually checking
information on the county auditor web site • Filtered to include only those sales which appeared to involve residential buyers (as
opposed to company buyers)
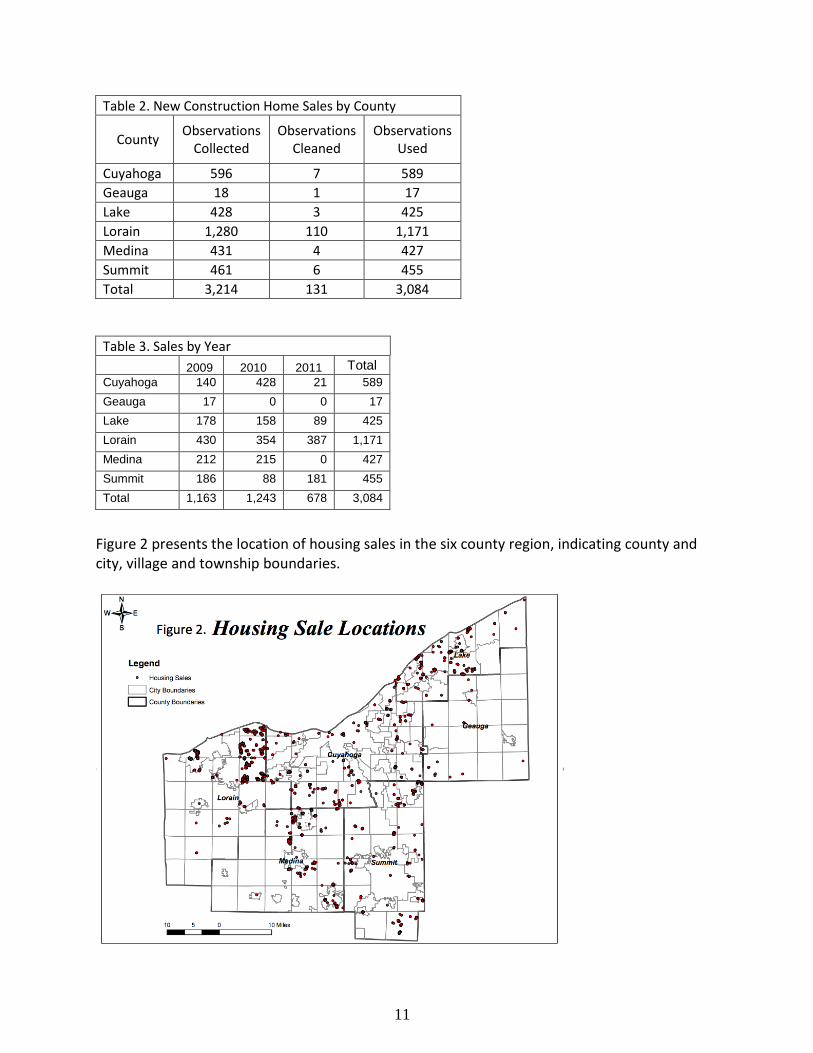
The results of this effort allowed us to determine that sufficient numbers of new housing construction to use hedonic modeling existed in both greater Columbus and Cleveland. The team advised that the project continue in Cleveland due to the expected difficulties in retrieving information from the development and real estate market professionals who we needed to contribute to the study. Data on newly constructed housing units were collected for all counties in our study area (Cuyahoga, Geauga, Lake, Lorain, Medina and Summit) for 2009, 2010, and 2011. Shown in Table 2, are data for 3,215 units that were collected across the six counties. Data checking and cleaning revealed 131 observations that were not usable for the regression. This was typically due to obvious coding errors (for example, a house with zero square feet) or outlier conditions (for example houses greater than 5,400 square feet), whereby the observations were presumably not part of the modeled market. Table 3 below shows that across the time period of our study, 2010 had the most sales (1243) while 2011 had the fewest.
11
Table 2. New Construction Home Sales by County
County Observations Collected
Observations Cleaned
Observations Used
Cuyahoga 596 7 589 Geauga 18 1 17 Lake 428 3 425 Lorain 1,280 110 1,171 Medina 431 4 427 Summit 461 6 455 Total 3,214 131 3,084
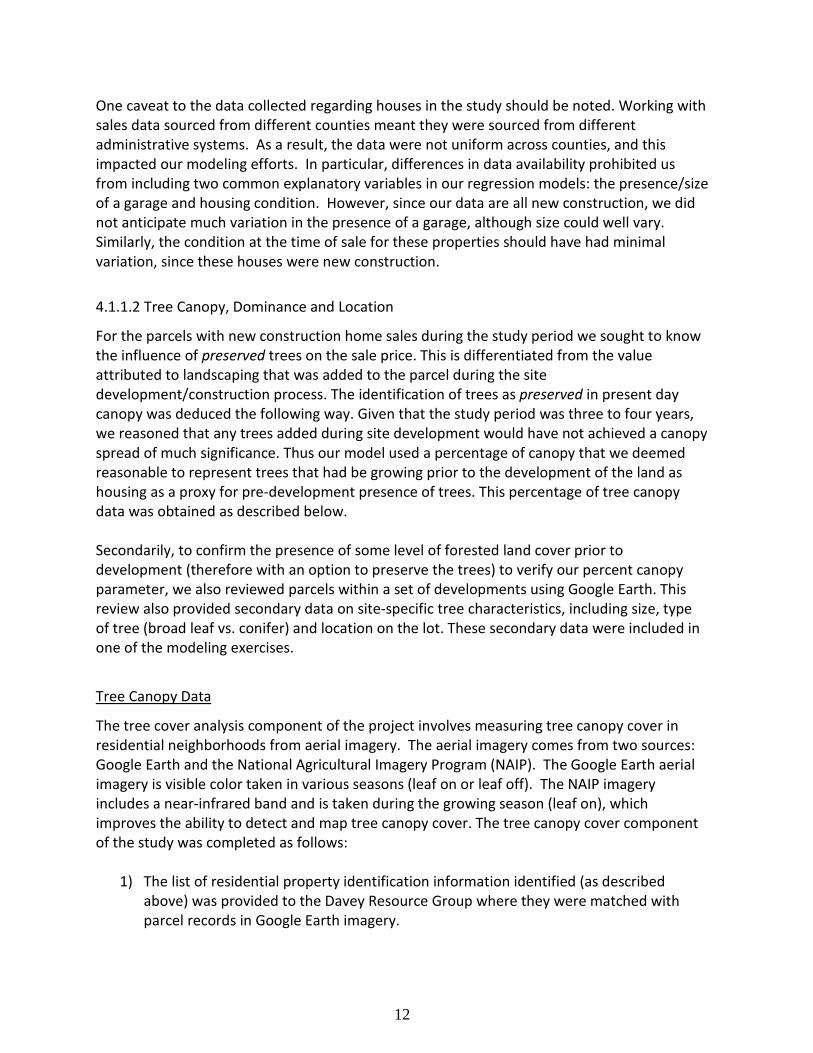
Figure 2 presents the location of housing sales in the six county region, indicating county and city, village and township boundaries.
Table 3. Sales by Year 2009 2010 2011 Total Cuyahoga 140 428 21 589 Geauga 17 0 0 17 Lake 178 158 89 425 Lorain 430 354 387 1,171 Medina 212 215 0 427 Summit 186 88 181 455 Total 1,163 1,243 678 3,084
12
One caveat to the data collected regarding houses in the study should be noted. Working with sales data sourced from different counties meant they were sourced from different administrative systems. As a result, the data were not uniform across counties, and this impacted our modeling efforts. In particular, differences in data availability prohibited us from including two common explanatory variables in our regression models: the presence/size of a garage and housing condition. However, since our data are all new construction, we did not anticipate much variation in the presence of a garage, although size could well vary. Similarly, the condition at the time of sale for these properties should have had minimal variation, since these houses were new construction.
4.1.1.2 Tree Canopy, Dominance and Location
For the parcels with new construction home sales during the study period we sought to know the influence of preserved trees on the sale price. This is differentiated from the value attributed to landscaping that was added to the parcel during the site development/construction process. The identification of trees as preserved in present day canopy was deduced the following way. Given that the study period was three to four years, we reasoned that any trees added during site development would have not achieved a canopy spread of much significance. Thus our model used a percentage of canopy that we deemed reasonable to represent trees that had be growing prior to the development of the land as housing as a proxy for pre-development presence of trees. This percentage of tree canopy data was obtained as described below. Secondarily, to confirm the presence of some level of forested land cover prior to development (therefore with an option to preserve the trees) to verify our percent canopy parameter, we also reviewed parcels within a set of developments using Google Earth. This review also provided secondary data on site-specific tree characteristics, including size, type of tree (broad leaf vs. conifer) and location on the lot. These secondary data were included in one of the modeling exercises.
Tree Canopy Data
The tree cover analysis component of the project involves measuring tree canopy cover in residential neighborhoods from aerial imagery. The aerial imagery comes from two sources: Google Earth and the National Agricultural Imagery Program (NAIP). The Google Earth aerial imagery is visible color taken in various seasons (leaf on or leaf off). The NAIP imagery includes a near-infrared band and is taken during the growing season (leaf on), which improves the ability to detect and map tree canopy cover. The tree canopy cover component of the study was completed as follows:
1) The list of residential property identification information identified (as described above) was provided to the Davey Resource Group where they were matched with parcel records in Google Earth imagery.

13
2) The Google Earth imagery parcel records were then used to cross-reference parcels in National Agriculture Imagery Program (NAIP) color-infrared imagery.
3) An automated image analysis program was used to measure the percent tree canopy cover for each residential property located on the NAIP aerial imagery.
4) Following completion of the automated image analysis, trained image interpreters inspected the tree canopy cover results and added any small tree canopies that were missed. (A full description of the process is provided in Appendix B.)
5) The tree canopies identified on the NAIP imagery were then transferred back to the Google Imagery and combined with the parcel data. The completed files were then returned to Cleveland State University.
With such a large and diverse study area, the degree to which the canopy variables differ by county is also of interest. Table 4 shows that only 42% (1,288 of 3,084) of the sales in our data have any tree canopy at all. Except for Geauga County, which had only 17 sales (all of which were canopied), canopy ranges from 35% of all sales (in Medina County) to 49% of all sales (in Cuyahoga County). The average canopy square footage and percent are also shown for each county. Again, excepting the 17 sales of Geauga County, average canopy square footage and percent ranged from 718 to 2057 and from 4.1 to 8.1, respectively.
Table 4. Tree Canopy by County
No Yes %
Canopied Avg Sq
Ft Avg %
Total Sales
Cuyahoga 300 289 49% 2057 8.1 589 Geauga 0 17 100% 23365 35.9 17 Lake 273 152 36% 1804 7.4 425 Lorain 680 491 42% 790 5.4 1171 Medina 276 151 35% 1078 4.1 427 Summit 267 188 41% 718 5.6 455 Total Sales 1796 1288 42% 1325 6.2 3084
Tree Dominance and Location
Previous studies have explored the potential economic benefits of trees on housing parcels as affected by location, type and dominance. In addition, because the project was concerned with tree preservation and compact development models, for a subset of the parcels characterized by smaller lot size associated with compact development densities (approximately 800), Google Earth was used to acquire additional information regarding trees on the sites. This secondary tree information was used in one of the modeling sequences to potentially provide a more nuanced assessment of value differential than previous studies. The secondary data also acted to spot verify satellite tree canopy data. This information included:
• Relative height – The height of individual trees in one of three categories:

14
o Dominant overstory (mature trees that tower over most others in the landscape);
o Co-dominant overstory (mature trees that are roughly equal in height to other nearby trees); and
o Understory (small-growing mature or immature trees that are shorter than the adjacent house).
• Yard placement – Trees were identified by their placement relative to the house including street trees (planted along the edge of the street), front yard, side yard, or back yard.
• Tree type –Trees are identified as either conifer (such as pine, spruce, fir, hemlock, etc.) or broadleaf (such as maple, oak, ash, birch, etc.)
In addition, the tree size was related to canopy cover and the age or size of the species as related to other trees on the property and the height of the house. For anything taller than the house on the property a dominant label was given to that tree, anything under the height of the house but larger than a dwarf or young tree was given the co-dominant label. Finally, all landscaping and young trees were given the understory label. This process was accomplished by a detailed visual inspection of the parcel in question using Google Earth. Within Google Earth, different aerial views with various axis and zoom settings were used in order to orient the parcel with the lighting at the time the parcel was photographed. The goal of this orientation was to gain a better angle at which to judge the height of various trees using their shadow as an indicator to which other trees and the house itself were compared. In some instances the Google Earth updated images were either with or without leaves on the trees. In these instances where the trees had no leaves the shadow comparison method was used to determine placement on the parcel as well as comparable height values. In order to determine the tree type in this instance a historical image (from 2000) was utilized in Google Earth that had the leaves intact allowing for species and canopy size determination, or vice versa if the updated image was with leaves. Through this process some estimations had to be made in the number and size of certain trees on parcels where there were either a significant number of trees or they were placed in such a manner that the imaging software could not provide a level of detail high enough to differentiate between one or more trees and there various heights. While there may be some level of error involved in this process it is probable that it is very low given that the estimations were only used in less than 10% of the study survey and at a level that will not affect the “overall” picture of study universe. Figure 3. presents a flow diagram of the data collection and analysis process for obtaining tree canopy percentages, canopy square footage, and tree dominance, type and orientation.

15
The secondary tree data was collected as part of the process to identify the location and density of developments (agglomerations of parcels in the study data base). This step was necessary to characterize the types of developments built in the study timeframe (see Section 4.2 below) and to identify developments to serve as potential case study sites (see Section 4.3 below). 4.1.2 Modeling Sequence and Results We used regression analysis to explore the relationship between tree canopy and the price of newly constructed housing in our study area between 2009-2011. Our modeling strategy was

16
to first identify a satisfactory base model. The variables included in the base model, and all subsequent regression analyses fall into three general categories:
1. Data about the house: Year built, lot size, living area, rooms, baths. 2. Data about the neighborhood: density, demographics, housing conditions, school
district quality. 3. Data about location and accessibility: county, proximity parks, highways, and the
county seat. Once a base model was identified, we explored the price impact of tree canopy in several ways. It is an important modeling distinction that our regression process in this regard was exploratory. We did not enter the modeling process to test a well-formulated expectation of the manner in which, or the degree to which, trees or tree canopy might impact house price. In particular, while previous research identifies the advantages of having some canopy, we didn’t anticipate those advantages holding equally throughout the range of possible canopy variables (that is, 1% to 100% canopy). Thus, several models were tested. The two primary canopy variables that we tested were the square footage of the lot that was covered by tree canopy, and the percent of the lot that was covered by tree canopy. A description of the data used in the regression modeling is given in Table 5, along with their source and the abbreviations used in the regression results. Descriptive statistics of the data used in the regression models are shown in Table 6.

17
Table 5. Data Description for Regression Modeling Data Description Characteristics Description Source Abbreviation
County
CUYAHOGA 1 CUYAHOGA GEAUGA 1 GEAUGA LAKE 1 LAKE LORAIN 1 LORAIN MEDINA 1 MEDINA SUMMIT 1 SUMMIT
Housing Characteristics
Housing Sale Price 1 PRICE Housing Lot Size 1 LOTSIZE Housing Lot Size Dummy ( > 7260) 1 Lot_Large Housing Lot Size Dummy ( <or = 7260) 1 Lot_Small Housing Living Area Size 1 LIVE_SIZE Total number of rooms 1 NROOM Total number of baths 1 NBATH Built Year 2009 1 B_2009 Built Year 2010 1 B_2010 Built Year 2011 1 B_2011
Neighborhood Characteristics
Population Density 2, 4 DENSITY B02001 All Minorities Population 2 MINORITY B15002 Bachelor's degree % 2 BA_RATE B15002 MA_RATE + PF_RATE + DOC_RATE 2 GRAD_RATE B25004 Total: Vacancy Status 2 VACANT B11012 Renter-occupied housing units 2 ROCCHU B25091 HB3539 + HB4049 + HB50 over= Housing Burden > 35% 2 HB35_OVER Designation Academic Watch 3 D_AW Designation Continuous Improvement 3 D_CI Designation Academic Watch + Continuous Improvement 3, 4 D_AWCI Designation Effective 3 D_EF Designation Excellent 3 D_EX Designation Excellent with Distinction 3 D_ED Teacher's BA rate 3 T_BA_RATE
Accessibility Characteristics
Public Park Proximity- Within 0.25 mile 4 P_1QT Public Park Proximity- Within 0.5 mile 4 P_2QT Public Park Proximity- Within 0.75 mile 4 P_3QT Public Park Proximity- Within 1 mile 4 P_4QT Public Park Proximity- Within 1.25 mile 4 P_5QT Distance Between Tract Centroid to the Nearest Highway Ramp (Mile) 4 RAMP_RAW Distance Between Tract Centroid to the Nearest County Seat (Mile) 4 C_SEAT_LAW
Canopy Characteristics
Canopy Sq. ft. 4,5 CanSQFT Canopy Percent 4,5 CanPCT Canopy Square foot Large Size Dummy 4,5 Can_Sqft_L

18
Canopy Square foot Small Size Dummy 4,5 Can_Sqft_S Cuyahoga County Canopy Percent Log 4,5 CU_P_LOG Geauga County Canopy Percent Log 4,5 GEA_P_LOG Lake County Canopy Percent Log 4,5 LA_P_LOG Lorain County Canopy Percent Log 4,5 LO_P_LOG Medina County Canopy Percent Log 4,5 ME_P_LOG Summit County Canopy Percent Log 4,5 SU_P_LOG Cuyahoga County Canopy Sq. Log 4,5 CU_SQ_LOG Geauga County Canopy Sq. Log 4,5 GE_SQ_LOG Lake County Canopy Sq. Log 4,5 LA_SQ_LOG Lorain County Canopy Sq. Log 4,5 LO_SQ_LOG Medina County Canopy Sq. Log 4,5 ME_SQ_LOG Summit County Canopy Sq. Log 4,5 SU_SQ_LOG
1 = the respective county 2 = American Community Survey 3 = Ohio Department of Education 4= Author/GIS calculations 5= Satellite imagery from NIAP (National Agriculture Information Program; Davey Tree Resources)

19
Table 6. Descriptive Statistics of Regression Input Data Variable Mean Median Std. Dev. Minimum Maximum
PRICE 247327.90 225000.00 104498.84 104900.00 1509591.00 B_2009 .38 .00 .48 .00 1.00 B_2010 .40 .00 .49 .00 1.00 B_2011 .22 .00 .41 .00 1.00 CUYAHOGA .19 .00 .39 .00 1.00 GEAUGA .01 .00 .07 .00 1.00 LAKE .14 .00 .34 .00 1.00 LORAIN .38 .00 .49 .00 1.00 MEDINA .14 .00 .35 .00 1.00 SUMMIT .15 .00 .35 .00 1.00 LOTSIZE 11371.99 9148.00 11105.51 275.00 149411.00 LIVE_SIZE 2351.20 2240.00 682.24 916.00 5215.00 NROOM 7.09 7.00 1.43 3.00 14.00 NBATH 2.15 2.00 .44 1.00 5.00 DENSITY 1443.75 889.00 1798.57 66.00 56384.00 MINORITY 9.80 6.00 11.98 .00 100.00 BA_RATE 20.57 20.00 7.22 1.00 41.00 GRAD_RATE 12.41 10.00 6.17 .00 43.00 VACANT 6.08 6.30 3.79 .00 47.40 ROCCHU 17.13 12.00 16.08 .00 89.00 HB35_OVER 16.79 16.50 4.66 .00 41.00 D_AW .02 .00 .13 .00 1.00 D_CI .05 .00 .23 .00 1.00 D_AWCI .07 .00 .26 .00 1.00 D_EF .19 .00 .39 .00 1.00 D_EX .29 .00 .45 .00 1.00 D_ED .45 .00 .50 .00 1.00 T_BA_RATE 99.06 99.60 1.43 89.60 100.00 P_1QT .00 .00 .05 .00 1.00 P_2QT .02 .00 .15 .00 1.00 P_3QT .03 .00 .17 .00 1.00 P_4QT .02 .00 .14 .00 1.00 P_5QT .04 .00 .20 .00 1.00 RAMP_RAW 1.98 1.68 1.35 .09 7.12 C_SEAT_LAW 8.90 9.18 4.13 .10 19.27 Lot_Large .66 1.00 .47 .00 1.00 Lot_Small .34 .00 .47 .00 1.00 CanSQFT 1325.29 .00 5580.72 .00 116584.00 CanPCT 6.19 .00 12.54 .00 100.00

20
Model A
Table 7 shows the results of Model A, the first to include measures of tree canopy. While the results of the entire model will be summarized in this initial presentation, for the additional results we will focus on the canopy variables. County indicator variables are included to account for differences in the average price level by county. These indicator variables would account for any price premium or penalty associated with housing in the indicated county. The indicator variable for Lorain County is excluded (to avoid perfect colinearity), so it serves as the reference category – results are interpreted relative to Lorain County. Thus, Cuyahoga and Lake county houses sold for significantly more than Lorain county houses, holding constant all other variables in the model. Summit county houses sold for significantly less. Prices of houses in Medina and Geauga counties were not statistically different than those in Lorain County. The structural characteristics of the house perform as expected. The size of the lot, the amount of livable area in the house, the number of rooms, and the number of bathrooms are all positive and significant. This means that the greater the amount of these variable, the higher the associated sale price. For example, an additional bathroom is associated with a 12.6% increase in price. Year indicator variables are included to account for the impact the passage of time has on housing values. Our data span 2009 through 2011, and 2010 is the left out category. Houses sold in 2009 sold for significantly less, 2.4% less, than those that sold in 2010. There was no significant difference in price between houses sold in 2010 and 2011. The small or insignificant effects are not surprising considering that all of our sales are of new construction, and over a relatively short time period. Neighborhood variables are included to account for the influence of the various conditions that surround the sold house. The variables for minority population and education are consistent with previous research. Higher neighborhood education levels are associated with higher prices. This could reflect an underlying relationship between education and income. Higher proportions of minority population are associated with lower prices. If potential home buyers’ demand is negatively impacted by the race and education (and/or income) characteristics of a neighborhood, that would be reflected in prices, as is the case here. The presence of vacant housing is not significant in the model, and the impact of renter occupancy, although very small, is positive and significant. Housing burden measures the percentage of households that spend more than 35% of their income on housing. Through formulations that included various levels of burden, the impact was consistently significant: the higher the proportion of housing-burdened households, the higher the price of new homes.

21
Interestingly, in the context of new development, the higher the neighborhood population density, the higher the sold price of the home. It is important to note, however, this does not reflect the density of the housing development itself, but that of its entire neighborhood. And given the timing of the census data, relative to the time period of our study, it is likely that the density measurement excludes the newly constructed home. The quality of the local school district is typically an important predictor of housing sale price. The Ohio Department of Education provides a variety of performance measures, but perhaps none more visible than its district report cards. The reference category is Excellent with Distinction, the highest possible grade a district can earn. The distinction appears to carry no price premium in the market, since the “Excellent” grade is not significantly different. Similarly, but unexpectedly, the same holds true for the variable representing the two lowest report card grades represented in our data (Academic Watch and Continuous Improvement). Among the various additional indicators of quality, the rate of bachelor’s degree rate was consistently positive and significant. Our three measures of accessibility capture different aspects of the landscape. The first is a distance-based buffer measurement of accessibility to a park, where distances between 0.75 and 1.24 were significant. The remaining two are network distance measures, one to the nearest highway exit ramp, and the other to the nearest county seat. We used the county seat to represent the central point of the county administrative (and often economic) structure. The negative value on the distance to a highway ramp indicates that households value ramp access (prices decline with increased distance to the nearest highway ramp. Its square is not significant. Distance to the nearest county seat is negative, but its square is positive. The net effect is an increase in price for increased distance from the county seat. Finally, both canopy measures are significant. The square footage of canopy is positive and significant, indicating that tree canopy is valued. Higher amounts of tree canopy are associated with higher sales prices. Conversely, the percentage of the lot covered by canopy is negative. Taken together, these forces work in opposition to each other: the more canopy a lot has, the larger the percentage of the lot it covers. In practical terms, it means that households value canopy (higher levels of canopy are associated with higher sales prices), but prefer the canopy to comprise a small percentage of their overall lot (higher percentages of canopy coverage are associated with lower prices). What does this mean for the “average” sale? With approximately 1325 square feet of canopy, covering approximately 6.2% of the lot, the combined predicted price impact of canopy is 1%, or $2,473 based on an average priced house, with average canopy square feet and percent coverage. Considering a fixed amount of canopy square feet, that canopy is most valuable if it covers the smallest percentage of the lot. For example, for a house with the average amount of canopy (1325 square feet), the price impact of that canopy is 4% if it comprises 2% of the total lot; it is

22
worth 2% if it covers 5% of the lot, and actually has a negative price impact once the canopy covers more than 11.5% of the total lot. The same type of relationship holds when considering a fixed percentage of canopy. For a house with 10% canopy coverage, a negative price impact prevails until canopy square footage reaches 1000. This type of trade-off was the most consistent finding of the regression exercise. Experimenting with different measurement approaches, and/or different variables, and/or different subsets of the data, the positive effect on price of overall canopy and the negative effect on price of percent canopy coverage emerged as the dominant, although not universal, pattern in the data.

23
Table 7. Model “A” Results
Unstandardized Coefficients
Standardized Coefficients
t Sig. Variable Group Variable B Std.
Error Beta
(Constant) 5.630 .294 19.148 .000
County Dummy
Cuyahoga .100 .013 .115 7.521 .000 Geauga .035 .049 .008 .724 .469 Lake .128 .013 .129 10.174 .000 Medina .009 .015 .009 .621 .535 Summit -.099 .014 -.103 -7.157 .000
Hous
ing
Char
acte
ristic
s Lot Size Natural Log .112 .006 .253 17.616 .000 Living Size Natural Log .411 .017 .340 24.452 .000 Number of Rooms .018 .003 .074 5.560 .000 Number of Bathrooms .126 .008 .164 15.011 .000 Built Year 2009 -.024 .008 -.034 -2.817 .005 Built Year 2011 -.002 .011 -.003 -.195 .846
Nei
ghbo
rhoo
d Ch
arac
teris
tics
Population Density / 1000 .017 .003 .091 6.846 .000 Minority Population Percent -.005 .000 -.175 11.039 .000 Bachelor's Degree Percent .006 .001 .117 6.078 .000 Graduate school Degree (MA, PH, PRO) Percent .013 .001 .241 12.234 .000 Vacant Housing Units Percent .001 .001 .006 .493 .622 Renter Occupy Housing Units .002 .000 .102 6.512 .000 Housing Burden (Mortgage) over 35% .009 .001 .124 9.928 .000
Scho
ol
Dist
rict Designation Academic Watch or Continuous Improvement .027 .020 .021 1.350 .177
Designation Effective -.026 .013 -.029 -1.979 .048 Designation Excellent -.013 .009 -.017 -1.363 .173 Teacher's Bachelor's Degree Rate .015 .003 .063 5.677 .000
Acce
ssib
ility
Ch
arac
teris
tics Public Park Proximity- Within 0.25 mile .085 .065 .014 1.323 .186
Public Park Proximity- Within 0.5 mile -.032 .026 -.014 -1.250 .211 Public Park Proximity- Within 0.75 mile .071 .022 .035 3.263 .001

24
Public Park Proximity- Within 1 mile .071 .025 .030 2.886 .004 Public Park Proximity- Within 1.25 mile -.011 .019 -.007 -.597 .550 Access to the Nearest Highway Ramp (Mile) -.019 .007 -.076 -2.940 .003 Access too the Nearest Highway Ramp (Mile) Square .023 .015 .038 1.503 .133 Access to the Nearest County Seat (Mile) -.009 .003 -.105 -3.138 .002 Access to the Nearest County Seat (Mile) Square .095 .013 .228 7.494 .000
Canopy Canopy Square Natural Log .008 .003 .082 3.146 .002 Canopy Percent Natural Log -.024 .007 -.090 -3.627 .000
Adjusted R Square : 0.701 / F: 219.871

25
Model B
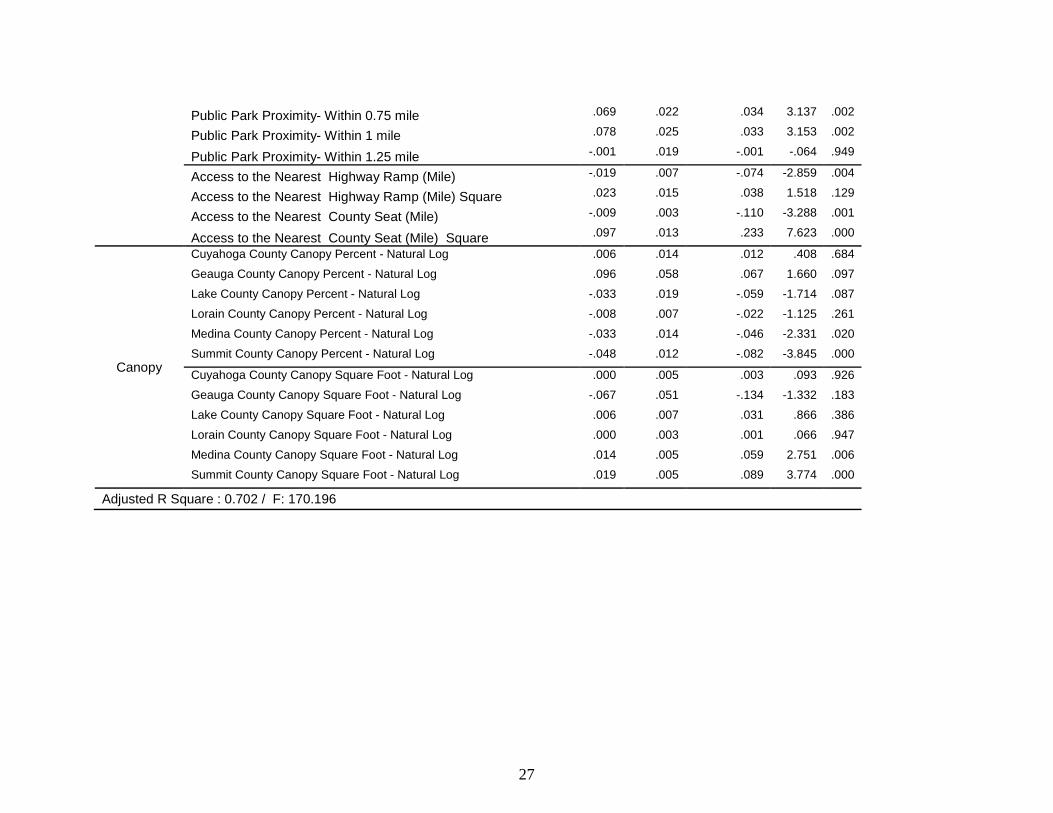
An alternate specification, Model B, explored the degree to which these aggregate canopy impacts varied by county. Thus, we created interaction variables between the county indicator variables and the two canopy predictors. The result is a canopy percent and canopy square footage effect estimated for each county individually, but still within a single regression model. Operating from the concept of scarcity, we posited that canopy might be worth more in locations where canopy was less common and worth less in counties where canopy was commonplace. Recall that Table 4 presented canopy statistics by county. Table 8 shows the results from Model B. Focusing on the canopy results, the percent canopy and square feet of canopy variables attain traditional levels of significance (< 0.05) in only two counties: Medina and Summit. With regard to Medina, our prediction was correct – the value of canopy is significant in the county where the lowest proportion of sales is canopied. At the average values for Medina canopy (1078 square feet and 4.1% coverage), the net price impact is 5%. The results for Summit County don’t fit neatly into the scarcity argument. With 41% canopied sales, it is near the middle of the study area counties. Lake County, for example, had 36% canopied sales (more than Medina but less than Lake), and its canopy variables are not significant. With average canopy values of 718 square feet and 5.6%, the net price impact in Summit county is 4%. None of the other study area counties showed a significant canopy effect. A review of land cover using Google Earth reveals that the dominant historic landscape matrix in the areas of home sales appears to be agricultural. In these cases, we might posit that the higher valuation of tree canopy (signifying the preservation of trees prior to development) may reflect the relative absence of trees in an historic farming area. We cannot explain the lack of significance in Lorain County, which was historic farming area as well.

26
Table 8. Model “B” Results
Model Unstandardized
Coefficients Standardized Coefficients t Sig.
B Std. Error Beta
Variable Group (Constant) 5.722 .296 19.310 .000
County Dummy
Geauga .277 .325 .060 .851 .395
Lake .050 .019 .051 2.580 .010
Lorain -.085 .017 -.121 -5.128 .000
Medina -.093 .021 -.094 -4.472 .000
Summit -.202 .018 -.210 -11.066
.000
Hou
sing
C
hara
cter
istic
s Lot Size Natural Log .113 .007 .254 17.273 .000
Living Size Natural Log .408 .017 .337 24.062 .000
Number of Rooms .018 .003 .074 5.543 .000
Number of Bathrooms .124 .008 .161 14.705 .000
Built Year 2009 -.023 .008 -.033 -2.734 .006
Built Year 2011 -.002 .011 -.003 -.212 .832
Nei
ghbo
rhoo
d C
hara
cter
istic
s
Population Density / 1000 .017 .003 .090 6.766 .000
Minority Population Percent -.005 .000 -.174 10.984 .000
Bachelor's Degree Percent .006 .001 .124 6.399 .000
Graduate school Degree (MA, PH, PRO) Percent .014 .001 .245 12.389 .000
Vacant Housing Units Percent .000 .001 .003 .268 .788
Renter Occupy Housing Units .002 .000 .100 6.406 .000
Housing Burden (Mortgage) over 35% .009 .001 .122 9.729 .000
Scho
ol
Dis
trict
Designation Academic Watch + Continuous Improvement .033 .020 .025 1.609 .108
Designation Effective -.021 .013 -.025 -1.634 .102
Designation Excellent -.013 .010 -.017 -1.335 .182
Teacher's Bachelor's Degree Rate .015 .003 .064 5.661 .000
Dis
tan
ce
Cah
arac
teri
stic
s Public Park Proximity- Within 0.25 mile .070 .065 .011 1.084 .278
Public Park Proximity- Within 0.5 mile -.037 .026 -.016 -1.422 .155
27
Public Park Proximity- Within 0.75 mile .069 .022 .034 3.137 .002
Public Park Proximity- Within 1 mile .078 .025 .033 3.153 .002
Public Park Proximity- Within 1.25 mile -.001 .019 -.001 -.064 .949
Access to the Nearest Highway Ramp (Mile) -.019 .007 -.074 -2.859 .004
Access to the Nearest Highway Ramp (Mile) Square .023 .015 .038 1.518 .129
Access to the Nearest County Seat (Mile) -.009 .003 -.110 -3.288 .001
Access to the Nearest County Seat (Mile) Square .097 .013 .233 7.623 .000
Canopy
Cuyahoga County Canopy Percent - Natural Log .006 .014 .012 .408 .684
Geauga County Canopy Percent - Natural Log .096 .058 .067 1.660 .097
Lake County Canopy Percent - Natural Log -.033 .019 -.059 -1.714 .087
Lorain County Canopy Percent - Natural Log -.008 .007 -.022 -1.125 .261
Medina County Canopy Percent - Natural Log -.033 .014 -.046 -2.331 .020
Summit County Canopy Percent - Natural Log -.048 .012 -.082 -3.845 .000
Cuyahoga County Canopy Square Foot - Natural Log .000 .005 .003 .093 .926
Geauga County Canopy Square Foot - Natural Log -.067 .051 -.134 -1.332 .183
Lake County Canopy Square Foot - Natural Log .006 .007 .031 .866 .386
Lorain County Canopy Square Foot - Natural Log .000 .003 .001 .066 .947
Medina County Canopy Square Foot - Natural Log .014 .005 .059 2.751 .006
Summit County Canopy Square Foot - Natural Log .019 .005 .089 3.774 .000
Adjusted R Square : 0.702 / F: 170.196

28
Model C
The final specification, Model C explored differences in the canopy impact between large and small lots. As our break point between large and small lots we used 1/6 of an acre, or 7260 square feet, deduced by following the Ohio Balanced Growth’s Best Local Land Use Practices definitions. Large lots, by this definition, comprised 2040 observations, of which 50.4% were canopied. Small lots made of up the remaining 1044 observations, 24.9% of which were canopied. Table 9 shows the distribution of large and small lot sales by county. Separate from the regression results, it is a notable finding that a full third of all the new construction sales in the 6 county region from 2009 to 2011 were on lots that fit within a compact development definition.
Table 9. Lot Size by County Lot Size Cuyahoga Geauga Lake Lorain Medina Summit Total Small 256 0 151 366 91 180 1044 Large 333 17 274 805 336 275 2040 Total 589 17 425 1171 427 455 3084
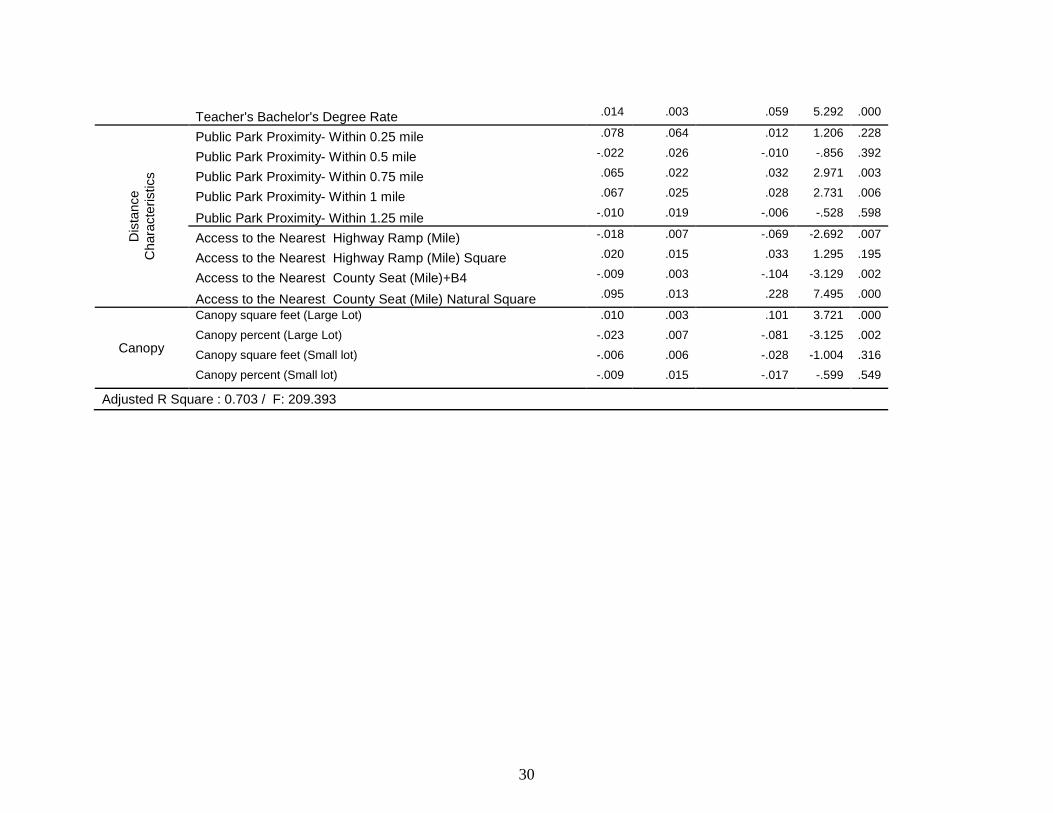
Our expectation of this final regression was that purchasers of smaller lots, might not have an expectation of canopy cover, and so canopy might play a smaller role, or even no role, the explaining house price. Table 10 shows the regression results, which confirmed our expectation. The two canopy variables are not significant for small lots, but they are both significant and positive for large lots. At the average canopy values for large lots (1919 square feet, 7.7% coverage), canopy contributes 3% to house price.

29
Table 10. Model “C” Results
Model Unstandardized
Coefficients Standardized Coefficients t Sig.
B Std. Error Beta
Variable Characteristics (Constant) 5.952 .296 20.130 .000
County Dummy
Geauga -.068 .049 -.015 -1.399 .162
Lake .024 .016 .024 1.492 .136
Lorain -.098 .013 -.140 -7.431 .000
Medina -.088 .018 -.089 -4.914 .000
Summit -.199 .015 -.207 -13.288
.000
Hou
sing
C
hara
cter
istic
s Lot Size Natural Log .104 .007 .234 15.740 .000
Living Size Natural Log .405 .017 .336 24.158 .000
Number of Rooms .017 .003 .073 5.489 .000
Number of Bathrooms .125 .008 .163 14.929 .000
Built Year 2009 -.024 .008 -.034 -2.872 .004
Built Year 2011 .000 .011 .000 -.014 .989
Nei
ghbo
rhoo
d C
hara
cter
istic
s
Population Density / 1000 .017 .003 .091 6.872 .000
Minority Population Percent -.005 .000 -.171 -
10.788 .000
Bachelor's Degree Percent .005 .001 .115 5.974 .000
Graduate school Degree (MA, PH, PRO) Percent .013 .001 .242 12.303 .000
Vacant Housing Units Percent .001 .001 .006 .527 .598
Renter Occupy Housing Units .002 .000 .099 6.348 .000
Housing Burden (Mortgage) over 35% .009 .001 .124 9.965 .000
Scho
ol
Dis
trict
Designation Academic Watch + Continuous Improvement .029 .020 .021 1.417 .156
Designation Effective -.022 .013 -.026 -1.727 .084
Designation Excellent -.010 .009 -.014 -1.071 .284
30
Teacher's Bachelor's Degree Rate .014 .003 .059 5.292 .000
Dis
tanc
e C
hara
cter
istic
s Public Park Proximity- Within 0.25 mile .078 .064 .012 1.206 .228
Public Park Proximity- Within 0.5 mile -.022 .026 -.010 -.856 .392
Public Park Proximity- Within 0.75 mile .065 .022 .032 2.971 .003
Public Park Proximity- Within 1 mile .067 .025 .028 2.731 .006
Public Park Proximity- Within 1.25 mile -.010 .019 -.006 -.528 .598
Access to the Nearest Highway Ramp (Mile) -.018 .007 -.069 -2.692 .007
Access to the Nearest Highway Ramp (Mile) Square .020 .015 .033 1.295 .195
Access to the Nearest County Seat (Mile)+B4 -.009 .003 -.104 -3.129 .002
Access to the Nearest County Seat (Mile) Natural Square .095 .013 .228 7.495 .000
Canopy
Canopy square feet (Large Lot) .010 .003 .101 3.721 .000
Canopy percent (Large Lot) -.023 .007 -.081 -3.125 .002
Canopy square feet (Small lot) -.006 .006 -.028 -1.004 .316
Canopy percent (Small lot) -.009 .015 -.017 -.599 .549
Adjusted R Square : 0.703 / F: 209.393

31
Additional Regression Explorations
During the course of the modeling process, we explored other formulations of the canopy-price relationship. These failed to yield significant findings. First, we explored the presence of a tipping point in the value of canopy cover. A tipping point would be consistent with the thinking that some tree canopy is valued (due to the aesthetic, heating, cooling, etc. benefits), but that too much canopy would be a negative influence on price (lack of sunshine, increased maintenance, etc.) (Sander, Polaski & Haight 2010). We did not find evidence of this relationship. Similarly, we investigated to see whether the amount of canopy mattered not on a percent-by-percent basis, or a square foot-by-square foot basis, but on the basis of broad amounts of canopy. Our motivation here was thinking that households might not distinguish between 4% and 6% canopy, but they might make judgments or have preferences relating to none, some, more than average, or a lot of canopy. We used quartiles, and modifications of quartiles to approximate these categories. We did not find evidence of this relationship. Finally, based on a non-random subset of our sales data, we explored the impact of the type of trees that were present, the number of trees (rather than their canopy), and the location of the trees on the property relative to the house (front, back, side) for the subdivisions we identified as of compact densities using the supplementary data gleaned from Google Earthy (described in Section 4.1.1.2). While none of these explorations were fruitful, neither were they systematic, as the subsequent modeling was completed for the parcels located in higher density subdivisions (800 parcels). A more rigorous treatment of these relationships, for all 184 subdivisions for example, could yield different results. 4.2 Characterization of Developments
A set of analyses (described in this section and in Section 4.3) were designed to answer the research question “is there a market for compact development in North East Ohio?” The housing sales and prices data are at the parcel level. In order to understand these sales as “developments,” we needed to work through the following process:
• Separate the sales in subdivisions vs. those that are scattered site houses • Delineate by location the traditional lower-density development vs. the developments
at densities or lot sizes indicating compact development 4.2.1. Location of Developments (vs. Scattered Site Housing Construction)
Given that our data were comprised completely of new construction sales, we were interested in knowing which parcels were parts of a “development” and which were not. We used two approaches to identify residential “developments” in the region.
32
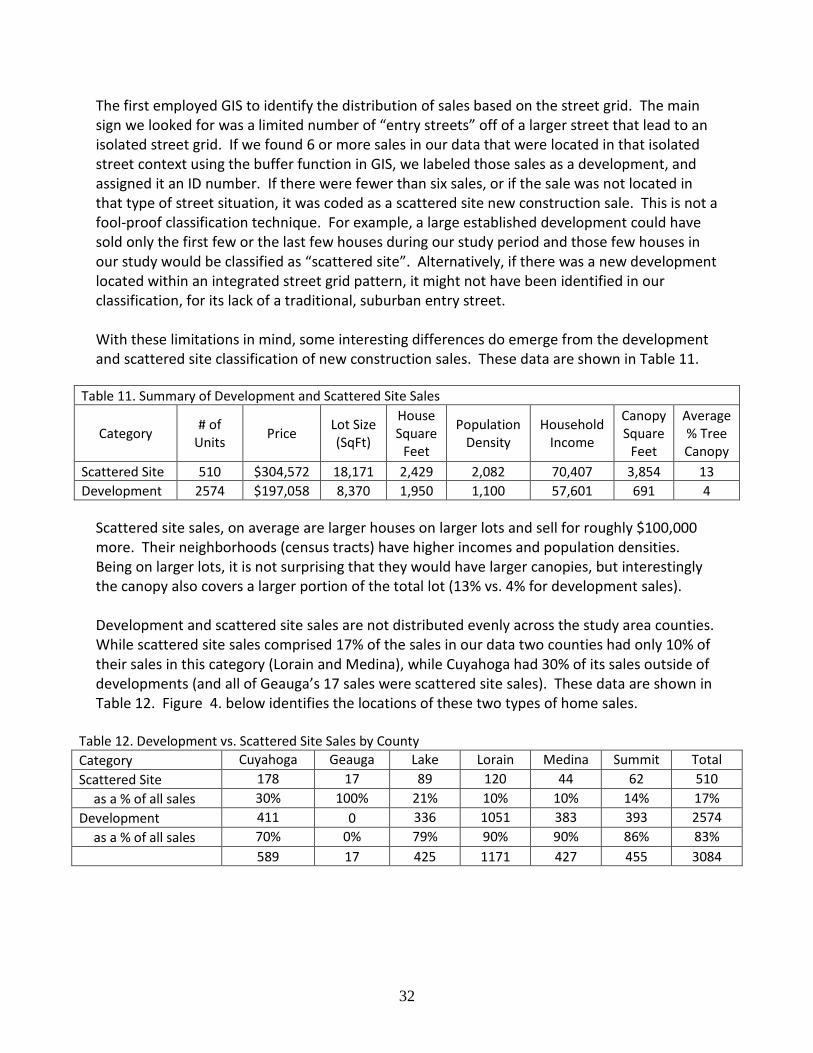
The first employed GIS to identify the distribution of sales based on the street grid. The main sign we looked for was a limited number of “entry streets” off of a larger street that lead to an isolated street grid. If we found 6 or more sales in our data that were located in that isolated street context using the buffer function in GIS, we labeled those sales as a development, and assigned it an ID number. If there were fewer than six sales, or if the sale was not located in that type of street situation, it was coded as a scattered site new construction sale. This is not a fool-proof classification technique. For example, a large established development could have sold only the first few or the last few houses during our study period and those few houses in our study would be classified as “scattered site”. Alternatively, if there was a new development located within an integrated street grid pattern, it might not have been identified in our classification, for its lack of a traditional, suburban entry street. With these limitations in mind, some interesting differences do emerge from the development and scattered site classification of new construction sales. These data are shown in Table 11.
Table 11. Summary of Development and Scattered Site Sales
Category # of Units Price Lot Size
(SqFt)
House Square
Feet
Population Density
Household Income
Canopy Square
Feet
Average % Tree Canopy
Scattered Site 510 $304,572 18,171 2,429 2,082 70,407 3,854 13 Development 2574 $197,058 8,370 1,950 1,100 57,601 691 4
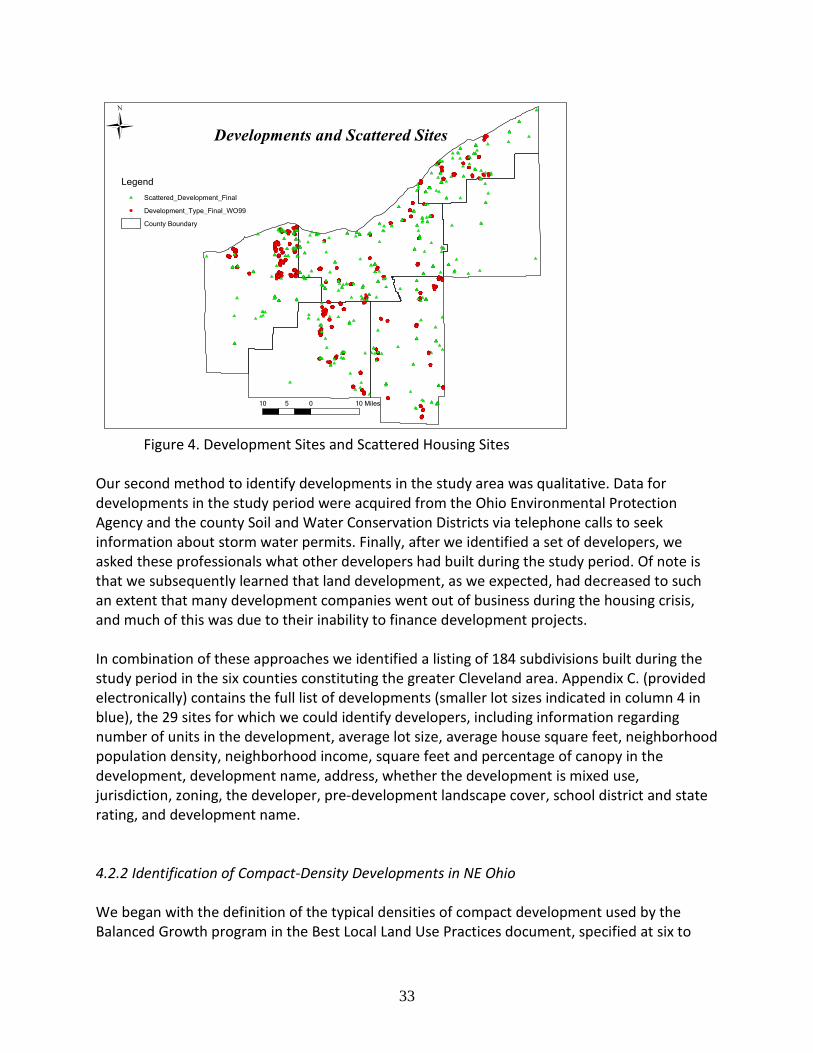
Scattered site sales, on average are larger houses on larger lots and sell for roughly $100,000 more. Their neighborhoods (census tracts) have higher incomes and population densities. Being on larger lots, it is not surprising that they would have larger canopies, but interestingly the canopy also covers a larger portion of the total lot (13% vs. 4% for development sales). Development and scattered site sales are not distributed evenly across the study area counties. While scattered site sales comprised 17% of the sales in our data two counties had only 10% of their sales in this category (Lorain and Medina), while Cuyahoga had 30% of its sales outside of developments (and all of Geauga’s 17 sales were scattered site sales). These data are shown in Table 12. Figure 4. below identifies the locations of these two types of home sales.
Table 12. Development vs. Scattered Site Sales by County Category Cuyahoga Geauga Lake Lorain Medina Summit Total Scattered Site 178 17 89 120 44 62 510
as a % of all sales 30% 100% 21% 10% 10% 14% 17% Development 411 0 336 1051 383 393 2574
as a % of all sales 70% 0% 79% 90% 90% 86% 83% 589 17 425 1171 427 455 3084
33
Figure 4. Development Sites and Scattered Housing Sites
Our second method to identify developments in the study area was qualitative. Data for developments in the study period were acquired from the Ohio Environmental Protection Agency and the county Soil and Water Conservation Districts via telephone calls to seek information about storm water permits. Finally, after we identified a set of developers, we asked these professionals what other developers had built during the study period. Of note is that we subsequently learned that land development, as we expected, had decreased to such an extent that many development companies went out of business during the housing crisis, and much of this was due to their inability to finance development projects. In combination of these approaches we identified a listing of 184 subdivisions built during the study period in the six counties constituting the greater Cleveland area. Appendix C. (provided electronically) contains the full list of developments (smaller lot sizes indicated in column 4 in blue), the 29 sites for which we could identify developers, including information regarding number of units in the development, average lot size, average house square feet, neighborhood population density, neighborhood income, square feet and percentage of canopy in the development, development name, address, whether the development is mixed use, jurisdiction, zoning, the developer, pre-development landscape cover, school district and state rating, and development name. 4.2.2 Identification of Compact-Density Developments in NE Ohio We began with the definition of the typical densities of compact development used by the Balanced Growth program in the Best Local Land Use Practices document, specified at six to

34
eight units per acre. For this study the first task was therefore to analyze the data presented in Table 9 to identify developments that could accommodate compact development densities and lot size and those designed in more traditional large lot, lower density subdivisions. We could also differentiate parcels in developments with 6 new houses in 1/8 mile radius and even higher densities at 10 units in that same radius, showing different levels of density. Figure 5 displays these locations (red and blue dots) as well as the remaining home construction sites.
Figure 5. Subdivision Locations by Proximity of “Neighboring” Parcels It is worth noting that of the 184 subdivisions we identified in the study area during the study time period we did not find any projects that fully fit the model of compact development used by the Balanced Growth Program. Twenty five of these subdivisions had lot sizes of less than 7260 square feet (roughly equivalent to six houses per acre), the minimum density underlying compact developments. To emphasize, the subdivisions we identified in this are those that fulfill the requisite density and lot size for compact development. This first round of identification did not designate whether these subdivisions had open space associated with the compact subdivision lots or whether there was mixed use development included by the developer. Identification of these qualities could be accomplished using the Google Earth method we employed, but would not be easily determined by local records due to the lack of systematic reporting of development by subdivisions or developers in local communities (see section 5.3.3 below). 4.2.3 Characterization of Developments by Type The initial proposal for the project set as a goal to identify specific developments as case studies to explore differences in pre-and post- development canopy characteristics and densities in terms of the influence these characteristics may have on price and to understand the benefits that might accrue to developers and local communities. In order to identify these case studies we carried out the following analyses:

35
• Take results of the development delineation and identification of compact density (vs.
lower density) development • Identify developers of these developments and the relevant local government
jurisdictions • Identify which developments were built on land with significant tree canopy (or not),
which have significant canopy indicating tree preservation (or not) • Obtain cost information for selected developments from the developer and from the
local jurisdiction to identify matched pairs for comparison. We generated a table of all developments in the region from the GIS data, with a goal to identify the developer for each of these. To identify developers who built subdivisions during the study period, several approaches were used. One group of 55 developers was identified as part of the effort to characterize the market for compact developments (described in Section 4.3 below). A graduate student scanned the region’s largest newspaper (the Plain Dealer) to acquire the names of developers and development companies. The data from Ohio EPA on developments yielded some development companies or homebuilders and other data, which included the name of the development and sometimes the city, number of units or street address. A search was then undertaken to identify the gaps in our data regarding developers and the characteristics of the subdivision using these sources: review of developers websites, review of real estate company web sites, meetings of city and village council meetings of developments the team was familiar with, telephone calls to local jurisdictions, developers and planning agencies, and searching on Google with an address or street name of the development that had been identified using GIS. This effort took considerable time and energy, and included many telephone calls and call-backs. We were able to identify the developers for 29 of these developments. For each of these 29 developments (listed in Appendix C as well), we used Google Earth satellite imagery and compiled their historic and current status. This review determined the historic land cover (forested, field, combination, previously developed), verified the percent canopy from the NAIP data, and provided a more detailed understanding of what had been built in these developments. The year 2000 was chosen as a standard against which we compared previous land-use on the parcel level. The exact year of the imagery fluctuated according to aerial imagery limitations as per Google’s data. Thus, some parcels were reviewed from 1994 and others 2003; however the majority was taken from the year 2000, and all images represented pre-development land cover conditions. Comparing the post-development canopy coverage layer with the historical imagery revealed the pre-development level of tree canopy cover and indicated development where tree preservation occurred. It also served as an additional check on the accuracy of the automated tree canopy analysis procedure. To move forward on identifying case study developments we constructed a typology of developments that incorporates the following attributes: historic land cover (forested or field), density (low or high), and current tree canopy/preservation information. Pre-development land cover was considered “forested” if it had 25% or more canopy coverage. Trees were
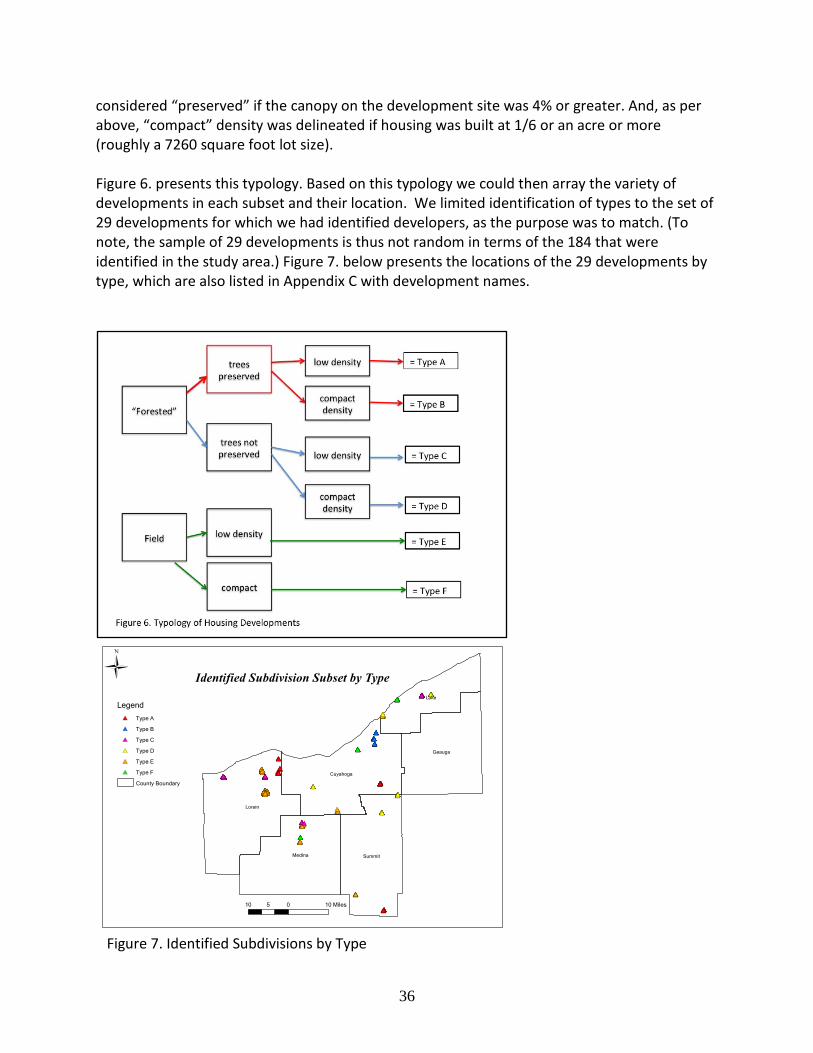
36
considered “preserved” if the canopy on the development site was 4% or greater. And, as per above, “compact” density was delineated if housing was built at 1/6 or an acre or more (roughly a 7260 square foot lot size). Figure 6. presents this typology. Based on this typology we could then array the variety of developments in each subset and their location. We limited identification of types to the set of 29 developments for which we had identified developers, as the purpose was to match. (To note, the sample of 29 developments is thus not random in terms of the 184 that were identified in the study area.) Figure 7. below presents the locations of the 29 developments by type, which are also listed in Appendix C with development names.
Figure 7. Identified Subdivisions by Type

37
Our analysis revealed the following for the 29 developments for which we could identify developers and thus proceeded to identify type:
Table 13. Numeric Distribution of Types of Development Type A B C D E F Number of Developments 5 3 4 5 9 3
To summarize, eight developments had pre-development trees (Types A and B) where trees were preserved. Three of these cases were developed at compact densities (Type B). Interestingly, these Type B developments are all located in NE Cuyahoga County in the inner ring suburbs of South Euclid and Richmond Heights. Forested pre-development sites where trees were not preserve numbered 9 (Types C and D), with Type D developed at compact densities. Finally, twelve of the developments were built on land that was field prior to development, with 9 built at traditional lower densities, and three developments built at compact densities. To provide a more full picture of these types as they are manifest, Appendix D. presents a sample of six of these 29 developments (one for each type), including the Google image used to determine type (historic land cover and current site with parcels delineated). We also visited these six sites and took photographs of the developments to understand what compact and low density and the relative level of canopy means on the ground. We then tried to gather information from the developers to obtain their cooperation in providing financial information about their costs. Despite considerable effort to identify the appropriate contacts at the development companies, we were unable to secure development-specific information about costs or perceived benefits from this group. Thus we were not able to move the project to the end point of “matched” sets of developments as case studies. However, this process, combined with efforts described in Section 4.3 (below) gleaned significant and important information that provides insight to the current state of development practices related to tree preservation and compact development in the study area. We also surveyed the jurisdictions in which these 29 developments occurred (described in Section 4.3.3 below). The process also allowed the team to identify data and analysis needs for future research and preliminary suggestions for policy changes (See Sections 5 and 6 for further detail). 4.3 Market Characteristics for Trees and Compact Development Research questions 4 through six focus on determining whether a market for compact development exists in NE Ohio and to understand what benefits from tree preservation and compact development might accrue from the perspective of developers, real estate agents and local jurisdictions. To answer the question “is there a market,” we identified first the supply of
38
housing in compact density developments through the use of Google Earth and GIS. To understand the demand for compact density developments we sought information from developers (their projects respond to demand) and real estate agents, who can account first hand for consumer demand. Coupled with the quantitative analysis on sale price, the data gathered qualitatively provide a more robust understanding of the market and how demand and supply can currently be characterized. 4.3.1 Supply: Home Developers Methodology for Market Characterization
1. Conduct background research on the costs and benefits and market demands for compact development and tree preservation.
Summary of Background Research Research studies on the costs and benefits of compact development as well as market demand studies were obtained from a number of sources including: The Sonoran Institute, RCL Co., Belden Russonello & Stewart, Research and Communications, Victoria Transport Policy Institute, Urban 3 Consulting, Lincoln Land Policy Institute, New Jersey Future and the Urban Land Institute. Nationally, the market for new construction continues to be dominated by sprawling, less sustainable, lower density single-family greenfield development that typifies the suburban American landscape since WW II. In addition, rural communities in Ohio (townships, small cities) encourage this style of development through large lot zoning, often justified by the need for septic systems and wells, but also to preserve their rural character. However, research shows that there is a market for alternative types of development including compact development and sustainable development. The market for compact development is changing along with shifts in demographics and consumer preferences. A number of studies have looked at the demand for compact development. However, the findings have been inconsistent. Some find that demand remains stronger for lower density homes, other studies of more recent trends contradict these results pointing to relatively significant demand for compact development projects and even measure a market premium of between $5,000 to $35,000 for developments that incorporate ‘Smart Growth’ features (Eppli and Tu 1999). Attitudes toward compact development and smart growth vary with age and stage in life (Myers, Gearin 2001). Preferences for lower density development may be a reflection of a lack of choices in the market place, especially for new construction. Certain resale markets remain strong, such as in older, walkable, high-density communities with pre-World War II housing. The demand for older, more sprawling communities is lower. Only about 1 to 2 percent of the total market dictates new development preference (Myers, Gearin 2001).

39
By and large, families prefer single family detached suburban homes in order to achieve desired levels of safety, privacy, and the corresponding educational opportunities for their children. Conversely, young adults and ‘empty nesters’ look to smaller dwellings in order to reduce expenses and maintenance responsibilities. Recent demographic factors also play a role in changing preferences as more households either delay or forego having children and the aging baby boomer population seeks to downsize. Although many baby boomers may choose to age in place, and not all childless households will choose dense communities to live in, these demographic shifts may correlate to increased demand for compact development. Other trends influencing market preference toward compact development include: increasing fuel prices, mounting traffic congestion, decreased crime, urban economic vitality, and an increasing positive image (or elimination of old stigmas) related to denser development (Myers, Gearin 2001). Our understanding of projected demand for infill compact development in and near urban cores driven by empty nesting baby boomers remains incomplete, but a study completed in 2005 suggests that in the Midwest, parts of western Pennsylvania, western Virginia, and West Virginia, portions of Florida, and the Pacific Northwest all have witnessed increases in the percentage of their populations that is composed of baby boomers (Rogerson and Kim 2005). This generation of elder Americans has driven demand for suburban housing beginning in the 1970s in a suburban mode, and will continue to drive housing demand as seniors seek smaller houses or apartments with less maintenance requirements (Dowell and Ryu 2008). Demand for compact and multifamily housing in suburbs near public transit continues to be strong and has a healthy outlook for 2013 and beyond (ULI 2013). The U.S. population is expected to grow by 95 million people over the next 30 years, with most of that growth occurring in the suburbs. Demand spurred by this growth shifting away from auto-oriented sprawling communities. Despite high projected demand for suburban compact development, significant challenges exist to developing more compactly. These challenges include the lack of cross-jurisdictional infrastructure planning and coordination on the part of local government entities, state departments of transportation, developers and others. Overcoming these challenges will require cooperation among stakeholders in order to identify and implement innovative solutions to infrastructure coordination, funding and financing challenges. (ULI 2012).
2. Build a database of residential developers with projects in the study area during the time period 2007-2012.
The team contacted the Ohio Environmental Protection Agency (OEPA), Northeast Ohio Home Builders Association, the Ohio American Planning Association (OAPA), and other local real estate networks to identify residential developers with projects in Northeast Ohio during the study period. Ohio EPA provided a list of applications from developers for residential construction storm water permits that had been closed out during the study’s time frame of 2007-2012. These permits were issued under the National Pollutant Discharge Elimination System (NPDES) General Permit for Discharges of Storm Water Associated with Construction Activity. This provided a good starting point for our database. The initial list was supplemented with information drawn from conversations with the Northeast Ohio Builders Association, the

40
OAPA, and Levin College faculty and staff who have worked with developers (R. Simons, K. Hexter, W. Kellogg). Further, an in-person interview was conducted with Chief Building Inspector Guy Fursdon, of North Ridgeville, the study area’s fastest growing municipality, to learn which developers were active in his community and the types of developments they were building. Contact was also made with the Ohio CDC Association, fourteen Zoning Departments within the 6 county study area, the County of Lorain Planning Department, and the Cuyahoga County Planning Department. We also cross checked the list of developers with the list of over 3,000 home sales compiled by Brian Mikelbank for this study and identified the principal developer, builder, total units in the development, average lot size within development, and relevant zoning ordinances (from city/county/township zoning departments) as was feasible. A total of 55 developers were identified as being active in residential development projects in Northeast Ohio.
1. Conduct developer interviews
The original work plan proposed focus groups with developers to gather information on the costs and benefits of compact development and tree preservation. However, based on the initial contacts with developers and the interviews noted above, we concluded that developers were not willing to participate in focus groups. We shifted our approach to one-on-one interviews; some were done in person and some via telephone. In March 2013, interview requests were sent via e-mail to the list of developers, followed up by two phone calls to each individual developer on the list. Out of a list of 55 developers active in Northeast Ohio, five agreed to be interviewed. Interviews, both in-person and by telephone were conducted in April and May of 2013. The interview guide, based in part on the results of the background research, is included in Appendix E. Developers were asked to comment on the types of development they build, the location, their experience with more compact development models, their experience with market for compact development, their experience with tree preservation, challenges to compact building, local and state regulation and the factors influencing the type of developments they build. Summary of Responses Type of Developments They Currently Build All 5 developers participating in our study do compact development. Two do only compact including mixed use; one does compact infill and conservation development; two do all types of development with one focusing on mostly greenfield sites. The developers interviewed work all over Northeast Ohio, including communities in each of the study area. When asked why they chose to do compact development, they cited a variety of reasons. One developer said that the company mission included concern with social benefits, and that led them to compact and mixed use and urban infill projects. One developer noted that the

41
compact model makes housing more affordable. However, they also use words like “believe” in compact development, it is part of their “social mission” to design and build compact developments that are better quality. One developer thought that compact development has value because it contributes to social fabric—neighbors, walkability, close to work, etc.
Foremost among the reasons, however, was cost and economics. They prefer higher density because the projects are more profitable and have lower costs in terms of water and sewer infrastructure. Builders want to build as densely as possible. The economics support it. When looking at a development, developers look at base land cost, development cost and sticks and bricks. ‘Sticks and bricks’ or the price per square foot cost of the structure is pretty constant across types of development. On a per lot basis, the land is about 25% of the price. Therefore, the higher the land value, the more density the developer will try to get. In order to do higher densities, you must have sewer and water.
One developer noted that compact development in some cases allows them to preserve some green space or trees, because “people want trees and green space behind them. Another developer noted that greenspace is an amenity that makes the subdivision much better overall. He understands the aquifer, water quality and flooding issues, so he tried to have green space in his developments. Market for Compact Development When asked directly about whether there is a market for Compact Development in Ohio, they confirmed that they believe there is a market. One developer told us the market is there, but it is limited. Another told us that the market is very localized. They do believe, however, that there is a pent up demand for traditional neighborhood design in a “new build” setting, especially for developments that are tied into the urban fabric with smart growth amenities. The “green” market also overlaps at times with the “compact” market. One noted that ‘Green features have been more important to marketability than anything else. Reframing compact development as green design will help market it. ‘ All of the developers mentioned the need for the development to be part of something bigger, part of a community, a context, woven into the community fabric with walkability and proximity to restaurants, parks, shopping. It needs to be tied into a fabric with smart growth amenities: Development must tie into surrounding area, architecturally and type. Demand depends on location; buyers want walkability and proximity to restaurants, parks, shopping. In terms of who is attracted to compact development, the primary market is the aging population (empty nesters). They want small lots and reasonably sized houses but can’t find them. They want a downstairs master. But a downstairs master requires a larger footprint and so needs a fairly large lot (at least 60x120). Young starters can’t afford a four bedroom house on one acre and so may be attracted to reasonably priced, attached starter homes in compact developments.
But the developers noted that the market is more than just empty nesters and young single professionals. Young families and others are also interested. You are selling the lifestyle: eco friendly, close proximity to amenities and culture. The developers noted that in order to sell

42
their products, they need to understand what people want. People don’t want cookie cutter garages with lines of mailboxes at the street. They want a natural setting, undisturbed. They want a back-porch. There is no shortage of demand for this type of development, but the developers cannot get the zoning to build them.
Tree Preservation When asked about tree preservation, they note they do preserve trees, but mostly on the periphery to act as a buffer. All the developers noted, that it is difficult to preserve trees on a compact home site because the construction and infrastructure damage the roots. They understood the issues of compacting the soil around the trees and the damage that can be caused. Unless there is a significant tree or the tree is in a strategic location, they will clear cut on the lots and leave trees on the periphery. Site development costs influence the decision about trees significantly. One developer related how for a development in the western part of the study area he left the trees but had to trim the yield of houses by 15% (48 vs. 53 homes) to get quality lots. This created a loss of gross revenue. Time is a factor. How to design and build out the site is always a function of income, with four considerations: the value of land to landowner, the return to developer/builder, and reduced maintenance cost to governing agencies (sewer authority, municipality, storm water directed to undeveloped areas). We asked if they could leave trees would they? One developer doesn’t think the general public wants trees—or that they have a love-hate relationship with trees. People are afraid the trees will fall on their house. In terms of market, there is a mix of homeowners who want mature trees and those who don’t. Some people will pay more, but the sites are more expensive to develop. In their opinion, the best way to preserve trees is to clear cut around the development and then leave the trees on the periphery. Stormwater Our developers were asked how the address stormwater? They did not think stormwater was really an issue. Only one talked about the need to offer some flexibility on run-off regulations when doing compact development, especially attached units, because they will have less run off than a traditional home. However, one developer thought that stormwater was key. The cost of building compact vs. regular is only plus or minus 10%. Stormwater management is a challenge and can add to the cost. Incentives and more flexibility should be offered to modify the standards for stormwater run-off during the design phase. Factors Shaping Development Type We asked them what factors do you take into account when deciding what type of development to build? For developers that do only compact, the biggest factor is “mission” or the value they place on building communities, not just houses. For those who do both, location, including zoning and regulation, and price point seem to be the biggest factors.

43
One developer mentioned that he considers how to create mixed income and mixed use developments. Incentives and subsidies are needed to support this type of development in more urbanized areas. The “Walkability score” is important to tie the site to the existing social fabric. The second biggest factor is financing. Infill often involves brownfield costs. Building compact development added about 3% during the construction process. This developer has used TIF financing for his projects, but the banks’ willingness to invest varies by neighborhood. Where banks are used to financing sprawl developments, it is difficult to get them to step outside their comfort zone. Bankers are beginning to recognize the value of LEED and green building styles as an amenity. Financing is usually a mix of public and private. Other developers mentioned building affordable housing units were subsidized with Candida fund dollars; one project in the City of Cleveland is using New Market Tax Credits to subsidize 20% of apartments. Another developer mentioned the answer as to what to build is ultimately driven by local regulation. The easiest path is to meet current zoning. Rezoning is hard. Ohio is a referendum state. Residents can stop a development through a referendum, even after months of work with the planning department or zoning board. Local Regulations/ Incentives There seemed to be divergent views on the importance of local regulations and incentives. One developer’s view was that zoning can always be changed and the biggest factor is availability of funding. Others responded that time is money and developers don’t want to go through the often lengthy and contentious process of requesting a zoning variance. “Builders generally build what the code permits.” The developer doesn’t want to request a rezoning and they definitely want to avoid a referendum (n.b. Ohio is a referendum state). They want to get in, develop the site and then turn it over to a builder who wants to build a house that maxes out the lot to maximize profit. Most cities and townships don’t “get” the benefits of compact development. Large lot zoning is also intended to keep out lower income and minority populations. “Bigger houses equal better people.” Compact development market is seen as empty nesters and young professionals. Some cities don’t want this demographic. The developers perceive that some communities are biased toward higher income people because they get most of their income from income tax. The city and school district are not the same government. Cities are trying to build an image: bigger houses = better people. Outer ring suburbs are trying to be desirable and exclusive. They don’t allow compact development for reasons related to economic and racial segregation. Cities don’t necessarily want empty nesters, they’re OK if they have lived there, but they don’t want to attract them. Developers don’t want to build exclusively for empty nesters. All of the developers interviewed said they would build more compact development if permitted to do so by zoning and other regulations. For example, one developer was involved with a compact development that was approved by the zoning commission but was later challenged and overturned through a referendum vote. That development was to have included preservation of a stand of 100-year-old trees and a wetland. One community

44
(Macedonia) allows a reduction in lot size requirements to two units per acre if the total development is over 25 acres (note, this density does not conform to the OBG definition). In terms of incentives, the developers mentioned the benefits of tax abatements (in Cleveland and Lakewood), and use of New Market and Historic Preservation Tax Credits as important aspects of their calculus on what to build and where. Several developers mentioned the tendency on the part of planning and zoning boards to “knuckle under” to community. If they had zoning codes and design standards, they would spur development (as these would rationalize the development permitting process). There is some variation depending on the municipality. The City of Green has done a good job of looking at land use and land use plan. They allow higher density among office, commercial and retail. They understand the importance of design. No other places in NE Ohio “get it.” Another developer noted that his idea of an ideal zoning code would be to tell him the gross density per acre, the required set-back from street and rear set-back, and the minimum number of feet between buildings. Then he can do the rest. Cities are biased toward higher income people because they get most of their income from income tax. The city and school district are not the same government. Cities are trying to build an image: bigger house = better people. Outer ring suburbs are trying to be desirable and exclusive. They don’t allow compact development for reasons related to economic and racial segregation. Cities don’t necessarily want empty nesters, they’re OK if they have lived there, but they don’t want to attract them. Developers don’t want to build exclusively for empty nesters. Builders generally build what the code permits. The developer doesn’t want to request a rezoning and they definitely want to avoid a referendum. They want to get in, develop the site and then turn it over to a builder who wants to build a house that maxes out the lot to maximize profit. Some communities have large lot zoning. They require conditional use permits to build on smaller lots. Regulations about water lines and meters also limit density. For example, cities require that each home have its own sanitary sewer hook up, but perhaps there could be a single hookup with a master meter for sewer. This falls under the jurisdiction of the North East Ohio Regional Sewer District. State Regulations/Incentives Since zoning is local and zoning is the biggest barrier to compact development, most of the developers felt there was not much the state could do. Despite this, they offered suggestions for state transportation policies, regulations regarding septic systems and storm water management and incentives to local governments. Developers would like to see state transportation policy changed to stop funding highways to the exurbs and start using the money to rebuild infrastructure in inner ring suburbs and cities. The state should provide money to cities to promote compact and green development projects.

45
In terms of state regulations, one developer commented on the cost of regulation. Fees and approvals take time and time is money. He also suggested that ODNR re-examine its rules regarding septic systems. Townships and municipalities are using these regulations to justify large lot zoning that has the effect of excluding compact and more affordable housing. From a regional planning standpoint Townships and Villages don’t want development. If they are going to have development, existing codes permit only large lots. Developers suggested that the state should incentivize planning and zoning authorities to develop more regionally oriented plans and ordinances. Developers also suggested that the state can also be helpful in financing brownfield clean-up in urban and suburban locations and incentivizing design elements such as rain gardens, bio-retention, street resurfacing (pervious pavement) sidewalks, neo-traditional with alleys (alleys could be pervious pavement). All of these can address water quality and reduce runoff. For example, Chicago is planning to redo miles of alleys in pervious pavement. Pervious pavement is triple the cost of regular pavement, so the state could offer incentives. The state could also incentivize cities to allow for density swaps or transfer development rights.
Costs And Benefits For You/For Community to Compact Development One developer estimates that quality compact development when combined with Smart Growth principles in a good location can command a price premium of $200 per square foot compared with lower density subdivisions. Others cited benefits of compact development to the community such as lower street maintenance and other service costs. The open land absorbs more water and helps recharge aquifers and in stormwater management. He suggests that NEORSD and the Akron sewer system should calculate this and develop costs accordingly. The developers suggested that our current zoning is archaic; we’ve created a problem. Two developers provided case studies of developments they had completed using a compact density Appendix F presents these cases. Case study #1 is of a true mixed-use development. In Case #2 the developer penciled out his costs and benefits for a development of traditional configuration and one using compact development attributes for the same lot. In this case the number of housing units remains constant. This is based on the zoning for the community in which he set the case. As can be seen in Scenario 2, the compact development scenario provided substantial savings in development costs. The developer also indicated that because the annualized return would be double that of the traditional site design, he could recoup his investment faster and move on to the next housing project. 4.3.2 Demand: Real Estate Agents The original work plan proposed conducting focus groups with prospective homebuyers to gather information on the existence of a market for compact development and for tree preservation in NE Ohio. The research team approached the local board of realtors seeking

46
advice and assistance in identifying and recruiting homebuyers for the focus group. Based on initial conversations about the project, we were advised that it would be prohibitively difficult to get potential homebuyers to participate in such focus groups. We were further advised that homebuyers would not be the best source to gather the information that the research team was seeking. Based on that advice, we shifted the approach to one-on-one interviews with real estate agents in one-on-one interviews conducted via telephone. The Board of Realtors provided the research team a list of 10 agents representing the diverse geography of the region and diverse types of housing. Five of these agents agreed to participate in an interview. Interviews were conducted with real estate agents (brokers) from the following companies and locations:
• RE/Max Crossroads, Strongsville • RE/Max Trinity, Brecksville • RE/MAX Haven Realty, Solon • Howard Hanna, Westlake
Summary Highlights Though the real estate agents interviewed worked with a varied clientele, they provided similar and consistent descriptions of the attributes– both at the community and property level– that are most desirable to prospective homebuyers.
• Schools – real estate agents were clear that the quality of the public schools in a given community was one of the most important factors in the home buying decision. Schools add value to the community and are perceived as adding value to an individual property, regardless of whether homebuyers do or do not have school aged children. Great homes in poor or bad school districts do not sell as well as good homes in great school districts.
• Outdoor spaces – Outdoor spaces, large or small, elaborate or simple, whether they be porches, decks or patios matter to homebuyers. They want an outdoor space in which they can relax.
• Privacy – homebuyers are interested in a place to live that affords them some level of
privacy. This is especially true in relation to backyards and outdoor recreation spaces. Often times, this was described as backyards with trees for privacy, tree borders that give a homeowner privacy, etc.
• Mature trees – Prospective homebuyers are not attracted to properties that don’t have any trees. But large trees can pose concerns for homebuyers as well.

47
Agent Experience and Background In terms of the agents’ experience and background, they work in a variety of locations across the six county area, with Cuyahoga, Medina and Lorain counties most often mentioned. Realtors interviewed conducted from 50% to 80% of their work in Cuyahoga County, with their remaining sales territory in the other counties in the study area. Agents have been in the industry from 10 to over 25 years. They reported working with both sellers and buyers, especially over the course of their careers. One indicated that they work mostly with sellers at present, while the other two work with both. Clients In terms of their clients, the agents reported that their typical clients are looking for a home in a range of prices from short sales to upscale ($200-$400K) purchase prices. Collectively, the realtors interviewed work with everyone from 1st time homebuyers, those selling their first house and buying their next house, to those seniors who are downsizing. They’ve worked with short sales and high end custom builds. One realtor who reported working with mostly upscale homebuyers said that her clients generally range in age from between 30 to 50 years old.
The realtors interviewed agreed that different communities attract different types of buyers. Housing Characteristics and Amenities We asked the agents about the housing that they were selling to homebuyers. In terms of amenities, they reported clients desire a range, from general condition descriptions to specific attributes of a home, parcel and community. However, as one realtor stated “there are many things that you can list that are not going to be important to everyone.”
Nevertheless, the one amenity that the realtors were very firm about was the quality of the school district in the community. Each realtor indicated this as being one of the most important factors in a homebuyer’s decision. This was true even for buyers who did not have school age children, any children at all and families who had children they intended to send to private schools. Moreover, one realtor indicated that homebuyers (and homeowners) view their taxes as being for schools and the strength of the community (based on it school system) will always bring value to a home.
In general, the home and property need to be in good condition with limited to no updating needed. There are homebuyers who do not want to have to make any updates, repairs or changes to a house. Though there are people who are willing to update, most want move-in-ready which often means that they don’t even want to paint.
When realtors discussed the specifics of a property, they indicated that homebuyers are looking for properties with more than one bathroom and finished basements. Outside of the house they are looking for a private outside area like a deck, porch or patio. This was true whether it was in an urban location or in the communities farther out (ex-urban). All of the realtors said, “Everyone likes trees”.

48
Beyond the attention to schools, other community amenities that homebuyers look for are things such as convenience to highways and something to do, such as playgrounds or recreation centers and park systems. In places such as Brecksville, many homebuyers desire to be located near the park system that engulfs the community. In the more urban areas like Cleveland people like the urban hot spots – being close to restaurants, bars and shops. We asked realtors to rank the characteristics and amenities most often sought by their buyers. (The complete list can be seen in Appendix F). The four highest ranked qualities were a swimming pool/patio or other outside amenities (outside amenities to include trees), the distance (time or miles) to work being under 20 minutes, low property taxes, and good schools.
We asked realtors about trees and tree canopy in developments and whether trees impact buyers’ decisions in purchasing a property. Trees were described as being an attribute that prospective homebuyers desire – “everyone likes trees”. Realtors indicate that clients do not like to move into subdivisions where the builder/developer has cut down all the trees. Homebuyers describe these places as dull and barren. Even when the builder/developer has put in some landscaping, such as small decorative trees or planted new young trees, having mature trees is viewed as better and more desirable. One realtor said about the small/little trees that get planted in new developments without any other trees “why bother.” There are some people who look specifically for properties with large mature trees.
However, on the flip side, having really big trees can create concern for some buyers. In these cases they are worried about the maintenance and cost associated with their care and the overall yard care - “people don’t like to rake.” Sometimes their concerns are in relation to safety issues such as trees falling in storms.
Sometimes, the location of trees on a given property may impact a buyer’s decision to purchase a property. Mature trees that are close to the house raise concern among buyers (roots damaging foundations, limbs falling on roofs, etc.). But in general, buyers prefer trees to be located in such a way that affords them privacy. Most likely this is in the backyard. Privacy was characterized as being especially important in communities/locations where properties where closer together (most notably in compact developments). A realtor said that homebuyers don’t want to walk out of their door and look straight into someone’s dining room. In many cases in compact developments, realtors said having trees would be good to help prevent homebuyers from feeling they were right on top of their neighbors. We asked about whether clients tend to seek/be open to higher densities? They cited single young professionals and married young professionals with out children as the most frequently being open to this housing type. This group was followed by seniors/empty nesters.
The agents related that in new construction, higher density communities where there is just house after house, the new homebuyer is interested in the new, not necessarily the density part of the development. Often these buyers encounter a problem when they resell it. Buyers

49
aren’t interested in them. Now the houses are viewed as too close together, but no longer new. These types of developments are not good as resale properties.
On the other hand, the row houses, described as being most often desired by the double income, no kids homebuyers tend to be more attractive. There is less responsibility associated with these properties and the homeowners are ones who are less interested in the yard or gardening. Homeowners will only have to take care of their own small space. These tend to be more popular in an urban environment.
The realtors also confirmed conventional wisdom: they had assisted homebuyers moving to urban environments (downtown) and once the clients decided to start a family, they chose to move back to “the burbs” for the more traditional single family home. Amenities and Home Sale Price Realtors were asked about the types of community amenities that contribute the most to overall property value/sale price. All responded that schools were the single most important community amenity in terms of contributing the most to the overall sale price of a property, but also what draws prospective homebuyers to even consider purchasing in any given community. “They choose the community first, and then look for the house.”
One realtor felt that the quality of community recreation centers was a growing consideration for homebuyers. This may be truer in more affluent communities that are investing considerable dollars on such amenities like community pools and recreation. Prospective homebuyers inquire about the quality of city services, but to a lesser degree than the schools.
We also asked about amenities, other than square footage of homes, on the subdivision level, that contribute the most to overall property value/sale price. The real estate agents made a distinction between developments with homeowners associations with fees and those that were not part of a homeowners association. If a homeowner is paying a monthly or annual homeowners association fee, then pools, playground/recreation spaces in developments are the amenities that contribute most to property values. In places that are not developments with HOA fees, trees, sidewalks and walking trails/access to parks were subdivision level amenities that contributed most to the sale price of a property.
A similar questions was asked about amenities on the parcel level. Privacy is an important consideration for homebuyers. Properties that have trees or fences are more desired and contribute to the value. This is not necessarily true of landscaping. Landscaping doesn’t contribute to the value (not willing to pay more), but makes it more saleable.
The outdoor/backyard spaces associated with a home are important in determining the sale price of a house. Prospective homebuyers like properties that have outdoor decks, porches or patio spaces. These spaces are closely associated with the privacy of a property. Backyard decks and patios that are treed for privacy are the most desirable and add the greatest value. Homebuyers regard these outdoor spaces favorably whether the property is on large lot or

50
small (compact) lot. One realtor said that in some cases, privacy is more important in compact/dense housing developments than on large lots.
Compact Development Market We asked the realtors what they thought it would take to either get developers to build more compact development or for buyers to want to purchase compact development subdivisions. What are the conditions that would make that happen? Not all of the realtors interviewed were in agreement that compact developments were a good idea. A realtor felt that in general “I don’t think that people like it” and feels that density itself isn’t appealing. Homebuyers often say that the neighbor is too close, it feels too tight, don’t want to see my neighbor in their dining room, hear their neighbor in the middle of the night. This realtor felt that if they like that kind of feel, they would live in the inner city/downtown.
Other realtors weren’t sure what action could be taken to encourage either the development of compact subdivisions or create homebuyer interest in them. The greatest determining force is the economy. Despite their concerns, 25 of the 184 developments we identified across the study region were built at densities and lot sizes comparable to compact development models.
4.3.3 Context: Local Jurisdictions Once we had identified our subset of “known” developments, we sought input regarding the economic benefits of trees and compact development from the local jurisdictions in which these developments were built. We created a telephone-based survey and sought contacts at the 29 jurisdictions, including approaching planning, building, finance and other relevant units within local government depending on how their administrative offices are organized. Appendix G presents the questionnaire used for telephone interviews. We were able to conduct the survey for seven of these jurisdictions (despite repeated emails and telephone calls). These jurisdictions are located in Cuyahoga (at the fringe), Medina, Summit, Lake and Lorain counties. Summary When speaking to local government officials that deal with subdivision development it becomes clear that the only thing that is consist is that everything is different. Each jurisdiction has a different set of rules and regulations. Each jurisdiction seems to have a different mindset or approach to development that drives not only the regulations but also the market forces that might attract compact developments. And each jurisdiction seems to retain different types of data held by different subunits within local government about housing development in its community (making it exceedingly difficult to obtain information comprehensively). Oversight of Developments When asked about the differences about the oversight or inspection of developments that preserve trees or encourage compact developments the responses from officials were relatively

51
consistent. By and large there are no differences between traditional development oversight and the types of developments we are examining. Respondents did note the following:
Green The community has general requirements for all subdivisions, but nothing specific for conservation/tree preservation types. The community stormwater prevention plan is designed to minimize soil disturbance, and the permitting fees are based on the area of disturbance. This means that if a developer disturbs less area, as would be the case when trees are maintained or compact development is used, then the permitting fee would be less.
Avon Lake Zoning code allows for a mixture of density, with “a lot more compact development more recently. “ Many of these developments are managed by HOAs. These associations are frequently the owners of the infrastructure rather than the city. This results in problems for the city because the HOAs want the city to take over when things get expensive. The HOAs are often not saving enough money to pay for the capital improvements and maintenance that is needed for the infrastructure they own. So when things start to breakdown they tend to turn to the city for help, wanting them to bail them out. The city doesn’t want to get stuck with huge capital expenditure 20 years down the road so they are being proactive right now. They are training the HOAs on what it means to be the owner of infrastructure, how to manage it long term, and how to save enough to pay for their capital needs. These problems are not exclusive of compact developments, but they have implications for cost for those types of neighborhoods. Medina County Township Some townships in Medina County entertain the idea toward “life as it’s been” and others “how it could be.” Some don’t want any growth, so they limit lot size at 10 acres or larger. Broadly speaking compact development neighborhoods haven’t really taken off yet in the county. Perhaps things are changing, but it is difficult to tell how fast it is going to congeal. Everyone else is sort of waiting for others to move first. A number of the developments appear to be conservation oriented in nature but are really only doing so because of pragmatism. They don’t want to mess with riparian areas, so they built houses closer together, gave the riparian land to the park district to manage. The SWCD is pushing to protect riparian areas across the county, but their influence and ability to do so varies widely from township to township. The cities within Medina County are probably more inclined to codify the protection of trees or encourage compact development. Brunswick In Brunswick there is no apparent difference between traditional development and the compact or tree preserved developments. Brunswick has a riparian ordinance designed to protect those riparian areas, but it applies to all developments equally. Broadview Heights

52
Nothing different for compact types of neighborhood developments. Barberton For the compact development in Barberton (Newhaven) every house goes through a design review board process. The city master plan dictates the house design. This is unique to that type of development, but the oversight appears to be more about the look of the house more than anything else. Willoughby Willoughby has minimal differences in regulations for compact deelopment. We require verification of fencing or some other protection to keep the construction away from the trees and their individual canopy. Generally the improvements go in a little faster in compact developments so the inspection process is less costly, but not significantly less. Local Government Costs When these local officials were asked about how these developments impact the bottom lines of the local governments the responses were generally the same: they don't have a significant difference compared to traditional developments. Green Not known. Avon Lake All developments are treated the same. City maintains control of water lines and sanitary sewers. Full costs of the infrastructure goes back to the developers. On streets that the city owns they have a street tree program. They go into the neighborhood after the development is completed and put in trees and maintain them long-term. This happens in all types of developments, but not compact development neighborhoods because they don’t have a tree lawn. Medina County Townships Some townships didn’t want the development, so they made restrictive zoning to keep developers out—compact in particular. This ties to infrastructure costs because the larger lots make it easier to have septic systems, which are not publicly owned infrastructure—this makes the burden on the city potentially less. Barberton No difference in cost for compact versus traditional developments. Broadview Heights For commercial developments stormwater fees differ because the larger the impervious area there is in a development, the larger the fee. However, for residential developments they just have a blanket charge of $4/lot charge that doesn’t vary based on imperviousness.

53
Willoughby There is no cost difference. Infrastructure costs in construction on the developer, no savings to city as the city puts in street trees when possible or not at all. No change in costs for police and fire associated with compact development. Developer pays stormwater mitigation costs. Many developments have HOAs, so costs born by residents in terms of maintenance. Tax Policies We next asked these officials if their jurisdiction offered any changes to the tax rate (tax breaks/abatements/credits) to developers or developments that maintain the tree canopy or for compact development. Universally there were no specific tax expenditures offered for the preservation of the tree canopy or for compact developments. Green None exist, but suspect that there would be interest in the future. Avon Lake None exist Medina County Townships. Not clear whether townships have the authority to do this. Cities could do this if they wanted. There is probably not a lot of it going on in Media County. Avon Lake
No abatements or tax breaks have been given for any development in Avon. The only abatements that have been given are for commercial developments.
Barberton All homes built after 2007 in one community reinvestment area of the city receive 50% tax abatement. This is not specific to compact developments, but all types. It appears as though the Barberton development got this abatement because of where it located, but not because of the type of development that it is. Broadview Heights None Willoughby None offered. Tax Benefits Officials were then asked if they could attribute any increase in property or income taxation to these developments. Again across the board there was no known difference between traditional developments and those that kept trees or were compact.
54
Green Nothing they know of specifically, but probably no difference. Avon Lake Nothing specific related to taxation. He knows that these developments did not lower property values, but perhaps offered a greater range of options for purchase—rather than just huge lots with huge houses. Barberton No difference. Broadview Heights None known. Willoughby No differences.

55
5.0 Summary of Findings and Discussion This section summarizes the general characteristics of homes and subdivisions sold during the study period. We then present findings thematically according to the initial research questions. 5.1 Characteristics of Homes and Developments During the Study Period Home construction and sales during the study period were significantly lower than in years prior to the burst of the housing bubble. One realtor described a rebounding housing situation. In their business there has been a huge pick up. Their office is “slammed”. Sales have recently tripled and they feel that it could be as early as beginning of 2014 that the area could start seeing developers working again. We identified 3084new construction housing sales in six counties during the study period (post data cleaning). The highest incidence of sales in Lorain County (1,171 units), primarily in Avon and Avon Lake in the eastern portion of the county near the Cuyahoga County border. Sales were greater in 2009 and 2010, with only half the sales in 2011 compared to each of the previous two years. 5.2 Findings Related to Economic Value of Tree Preservation 5.2.1 Research Question #1: What is the influence of preserved trees on sale price of a home on a parcel?
We learned from our analyses that the issue of tree preservation and economic value is nuanced. First, our efforts to uncover a systematic relationship between tree canopy and house price resulted in a mixed set of results. Perhaps the most consistent finding was the different ways in which canopy impacted house price. The square feet of canopy had a positive impact on price, while the percent of the lot covered by canopy had a negative impact. Although these canopy variables weren’t significant in every regression formulation, when we did uncover significance it was typically in this type of positive (square feet) and negative (percent coverage) format. At the same time, while this relationship held for the study area in aggregate, when we disaggregated by county it held only sometimes (in Medina and Summit counties). It appears then that these two counties are driving the 1 percent average over the five counties; Summit is 4% and Medina 5% increment in sales price due to the presence of at least 4% tree canopy in the lots in the development. We hypothesize that in both cases the development we tracked is primarily in land that was formerly farmland, with some of the lowest canopy remaining due to prior removal of trees for field clearance. It may be, therefore, that the canopy remaining and preserved on developed lots was valued more highly. As the developers and realtors noted, the home sales market in NE Ohio is very localized.

56
In addition, when we classified by lot size, the price differential for trees held only for large lots, not small ones that together constituted our “compact” density developments. There is a difference in perception from both developers and realtors about mature, preserved trees on lots vs. retaining these trees in developments. Developers clearly attribute value to the presence of mature trees at gateway areas into the development and as boundaries for the subdivision (see the photographs in Appendix D). Buyers like having lots of trees around the development, and our professionals pointed out that it’s the package with trees (in the neighborhood, providing privacy at the boundary, etc.) rather than having trees specifically on the home lots. In fact we also learned that many buyers do not want mature trees near their house, no matter the other benefits it might provide. Developers are aware of soil compaction issues related to mature trees, which also leads them to remove trees on the parcels. The end result, however, is less than ideal (Appendix D). Our study at the parcel scale indicates that in areas with few trees, the more square footage in tree canopy the higher the price, but up to a point. It would make sense to encourage developers to pay attention to the location of trees at the time of site design. Developers prefer to develop where there are trees in adjacent land, but clearly neither the homebuyer or the realtor know if these trees will exist in the future. That may exert a downward pressure on sale price, and certainly will affect future sale price if trees on adjacent lots are removed. This uncertainty might be a leverage point to incent developers to leave mature trees at the periphery on the site they control, and if possible, keep trees in stands on the interior of the development so there is visual access to the trees, and their fate is controlled by HOAs and home owners. 5.2.2. Research Question #2: What benefits and costs accrue to developers and what are the challenges to tree preservation?
Developers responded that they do not often preserve trees in the interior of a subdivision because the costs associated with avoiding soil compaction are too great. They will preserve a significant tree within the subdivision boundaries, and preserve trees at the entrance of the subdivision to enhance the appearance. They preserve trees mostly on the periphery to act as a buffer. The realtors we interviewed confirmed this practice, and confirmed that buyers appreciate the trees as buffers. Realtors also noted that some buyers want trees on their lots, and some do not, in fear of the costs of maintenance or trees falling on their homes. One of the developers confirmed this view as well.
All the developers noted, that it is particularly difficult to preserve trees on a compact home site because the construction and infrastructure damage the roots when the lots are so small. They understood the issues of compacting the soils around the trees and the damage that can be caused.

57
Site development costs influence the decision about trees significantly. One developer related how for a development in the western part of the study area he left the trees but had to trim the yield of houses by 15% (48 vs. 53 homes) to get quality lots. This created a loss of gross revenue 5.2.3. Research Question #3: What benefits or cost savings to the community may accrue secondarily? The local jurisdictions we contacted did not have any special regulations, taxes or costs associated with tree preservation. Their costs are associated with planting street trees, which is independent of the internal site design of the subdivision.
5.3 Findings Related to Compact Development 5.3.1 Research Question #4: Is there a market for compact development in Ohio communities? Yes, in some aspects. Our quantitative analysis (using GIS) was completed on the basis of establishing the location of subdivisions at densities that conform with the Balanced Growth definition. In terms of supply, it is significant that one third of the houses sold during the study period are on lot sizes and density per acre to “qualify” in terms of these characteristics as compact. These developments are located in five of the six counties in the study area (excluding Geauga), and are located in areas that have experienced high levels of land development prior to the housing market crash as well. There is a supply, and there was sufficient demand to purchase homes at these densities. However, we should note that we did not identify developments in the six counties in the study years that would fully qualify as compact development as defined by the Ohio Balance Growth Program. Our identification was based on the lot size and correlated density of subdivisions. Several developments in Cuyahoga in Cleveland’s inner ring suburbs were built/sold in close proximity to retail and some other community amenities. These communities, however, have existing densities and street patterns that conform to the Balanced Growth compact development model. We did not identify any such developments in the other five counties sold during the study period based on our Google Earth review of developments. However, further exploration of the 184 development sites is warranted to identify proximity to retail and other amenities associated with true compact development using GIS analysis. National studies project huge increase demand for compact development near public transit (ULI Emerging Trends in Real Estate 2013), with young professionals and empty nesters the primary market. However, the persistent trend in smaller households, particularly in urban and suburban areas, would indicate the continued need into the future for smaller housing stock located near transit and cultural amenities.

58
The team suggests that our research confirms that NE Ohio and Ohio’s other metropolitan areas will likely mirror the nation in the trends affecting housing markets into the next several decades at least. However, the connection must be made from smaller houses in more dense subdivisions or infill areas to public transit that provides a competitive choice for work commutes and access to regional-level cultural and recreational amenities. Making these connections implies a more nodal regional land pattern, which over time can be supported by increased focus on Priority Development Areas at the local government level, by budget decisions in the state’s Department of Transportation, and by MPO priorities for transportation investments. As our developers noted, they would like to see state transportation policy changed to stop funding highways to the exurbs and start using the money to rebuild infrastructure in inner ring suburbs and cities and noted “The state should provide money to cities to promote compact and green development projects.” Future research could support these shifts in several ways. One research project to understand compact development (in the fullest sense) potential would focus on development level amenities, including not only canopy, but additional information about the natural landscape, the built landscape, and the development landscape. Since over 80% of new construction in the region is occurring in developments, “the development” should be considered as a source of positive or negative utility producing amenities (similar to how school districts are currently considered). This would be a significant undertaking since data are not systematically collected or reported at this level of geography, but the benefit would be a much deeper understanding of the context in which more than 8 out of every 10 new housing units is being constructed. 5.3.2 Research Question #5: What are the cost and sales benefits to developers? The developers we interviewed somewhat surprisingly mentioned the social benefits they received from doing compact development: keeping housing affordable, focusing on infill projects when possible, all to the benefit of the surrounding community. These social entrepreneurs have adopted at least a double bottom line: making a profit while providing a more socially responsible product. As stated above in Section 4.3.1, “They prefer higher density because the projects are more profitable and have lower costs in terms of water and sewer infrastructure. Builders want to build as densely as possible.” In order to build at densities conforming to compact development, the developers rightly noted that they must have sewer and water coming to the subdivision site to get permission from sewer districts and local governments for the development. One developer noted that stormwater management on compact development sites was more challenging as part of the site design process. He suggested standards should be more flexible to allow for design modifications.

59
One cost factor mentioned was the cost of financing, or the pursuit of financing for projects. While this barrier is decreasing somewhat, many banks are comfortable financing low density traditional subdivisions, and “it is difficult to get them to step outside their comfort zone.” However, the same respondent noted that bankers are beginning to recognize the value of LEED and green building styles as an amenity, indicating these features are viewed as less risky than in the past. One important and for some, the most important factor in terms of costs and benefits for compact development, is compliance with local zoning codes. Developers do not favor working in communities where they have to get a zoning change to do a compact development, noting that time involved and the uncertainty is too costly. We heard of at least one case where the rezoning was approved by the council, but was overturned by referendum. Our developers noted that some communities prefer large lot zoning as a control on who resides in the community, but that more communities are beginning to understand the benefits of more compact densities and smaller housing units. 5.3.3. Research Question #6: What cost savings and economic benefits might accrue to communities in terms of services, infrastructure and tax income from compact development when compared to low-density development? There is a small literature that presents results focused on benefits from various development amenities and configurations. Based on our review of this literature, we hoped to identify explicit benefits experienced by local communities. Our results suggest that local communities have not experienced enhanced revenue or reduced costs from compact development when compared to traditional low-density development. Some communities either require developers to build infrastructure within the subdivision, or the jurisdiction builds these and charge the costs back to the developer. Cities put in street trees regardless of the density of the development, and none of the respondents noted a savings. In one community, however, compact developments are not provided street trees, which would be a savings, although not from differences in density. Most developments, including compact developments, have an HOA included, so the cost of maintenance of infrastructure is borne by the homeowners, not the local jurisdiction. In the townships our respondents noted that compact development was disfavored, in part because of the implications for infrastructure. Large lot zoning allows for septic systems, which are not public infrastructure and therefore have no cost to the jurisdiction. Compact development, on the other hand, would require sewer and probably water, which would fall to the township to provide. Thus compact development would likely be more expensive for the township jurisdiction. The respondents from the local jurisdictions did not identify any significant difference in terms of revenue or costs between compact and more traditional low-density developments.

60
However, we should note the few jurisdictions (either those interviewed or those called to get information about the subdivisions we identified using GIS) keep data about development organized or searchable at the subdivision level. It is plausible that the community has experienced a difference in tax revenue or cost savings but would not recognize this due to the lack of data properly organized. 6.0 Recommendations 6.1 Future/Additional Research We advanced the tree canopy analysis method to characterize additional tree attributes on the site using digital aerial photographs accessed through Google Earth using a method developed by the urban forester on the team. Our results using this method applied to compact developments did not suggest significance, but this method could be expanded to include low-density parcels as well. A second research suggestion is to return to the GIS database and rerun the hedonic model so that it captures changes in sales price by the presence of trees 100 meter and 200 meters within the center of a given parcel to ascertain the influence on sale price. This is something the team is considering doing to move the exercise to publication, and we will share results of this effort with the OWRC/OLEC staff. This would in some way capture the associated value of trees (if any) as perceived by homebuyers at the subdivision level that was suggested by developers and real estate agents. We noted above that the positive influence of tree canopy was not significant on compact density developments nor did it occur in four of the six counties we studied. Clearly additional research is warranted on this topic before results would form a suitable foundation for specific policy recommendations. What is clear from the work though, is that canopy does play a significant role in explaining house price variations in some situations. The work that should come next would explore the nature of those situations where canopy does and does not matter (for example, if there are trees in the adjacent neighborhood or not). Further research needs to identify what other amenities or features of a development, in addition to density, gives the developers value. Small lots sell for less, but what are the other key components that add value? Developers clearly believe that the small lot penalty (in terms of sale price) can be overcome enough so that developers get the price premium they talked about. Further investigation of the specific requirements in these community zoning codes, location of transit and other amenities consistent with a full compact development model could identify the optimal places to begin working with communities as test cases for compact development across the NE Ohio region. A possible approach to this research would be to fully identify all 184 developments and compare their locations and qualities to the Balanced Growth Watershed communities. We

61
may be able to move this forward this summer and fall as we move to publication of our study in academic journals. A third suggestion for future research is, when we have finalized the findings, to conduct the study again in Columbus. The team would welcome the opportunity to meet with colleagues in the planning program at Ohio State University and identify modifications to the study design and work with them to carry out a second study. A comparison of the results may yield important information for incentives and policies in the Balanced Growth Watershed communities outside the Lake Erie basin. 6.2 Policy Implications The densities we found in all but one of the counties serve as the foundation for compact development. Homebuilders and developers are willing to build on small lots and apparently are selling them. This can serve as a basis for building compact development in the fullest sense if other state investments can be aligned (e.g., transportation investments). We note that some of these small lots are close to existing settled areas and we would make the case to the state that to get the full Compact Development model it will need to incentivize Compact Development in areas with infrastructure (sewer, water, transit, etc.) as was envisioned in the Balanced Growth Program. Our study provides additional evidence that these policies were sound when recommended, and more likely to be adopted with continued state support given the willingness of the development community to build at the requisite density. Our study reveals that the main obstacle to “small lots” has been overcome in many communities across the region. The state can incentivize the other features that developers need to realize the price premium. This too is what local governments would logically support in terms of housing sale value if higher densities are allowed to generate local taxes and likely lower costs for infrastructure maintenance. Our study also revealed that the information concerning development and the issues we were trying to analyze is not well organized. Local jurisdictions do not necessarily organize data on a subdivision basis. Our efforts to collect data about specific projects, and the follow up telephone survey regarding benefits and costs revealed that information is typically held in different units within the jurisdiction (planning, zoning, building, finance, public works). Most often these different units did not know what information the others possessed. We also obtained some of our information from soil and water conservation districts and Ohio EPA, but again, no one agency or unit apparently has access to the full information regarding developments and their regulation. If local jurisdictions do not adequately collect information on the results of various types of subdivisions, they will certainly not recognize any benefits in a systematic way. It is uncertain what the State of Ohio can do to encourage more comprehensive data regarding subdivisions,

62
but without a systematic way to collect and organize such data, it will be very difficult for localities and the state to document and analyze benefits and costs in a comprehensive and robust way. The current situation will pose a challenge to monitoring results of incentives through the Balanced Growth Program over the years as well, as data collection will be cost prohibitive. This situation was anticipated during the Balanced Growth Taskforce work and specifically noted during the process to identify indicators led by then Executive Director Ed Hammett. We suggest that OLEC and OWRC take a leading role in developing technical support for local communities and a program to encourage collection and reporting of data that will allow monitoring of changes in overall land use and development patterns in a more efficient way for the Balanced Growth Program. When compared to the Balanced Growth watersheds in NE Ohio, we see that many of the developments at compact densities we identified fall within the specific subwatersheds that complete a Balanced Growth plan or in other reaches of the tributary. We identified several projects in the lower reaches of the Chagrin River in Lake County; one project on the divide of Chippewa Creek; several in the Upper West Branch of the Rocky River, with several more downstream of this subwatershed, a couple of projects each in Brandywine Creek and the Little Cuyahoga. One compact development project was sold in the Eastern Lake Tributary area in Lake County. Figure 8. below presents these locations.
Figure 8. Location of “Compact Development” Projects in Balanced Growth Watersheds We suggest that it would be fruitful for the OWRC and OLEC to focus on the nexus of communities that already allow higher densities in the BG watersheds to develop a set of test cases that could move these communities forward. Additional research would be needed to identify the specific communities and review their zoning ordinances. Additionally, study should focus on the communities adjacent to urbanized areas that are already allowing subdivisions at the scale and density to serve as the basis of compact development. Citizens should investigate with their elected officials and planning staff specifically how to develop zoning regulations that

63
would encourage mixed use compact development to the extent possible and investigate what other state programs could be brought into play to encourage pedestrian/transit connections in these communities (ODOT for example). The Balanced Growth incentives available to these communities could be strengthened to encourage linking density to other amenities so that developers would realize the price premium that they associate with “smart growth” types of development. OLEC and OWRC should work closely with regional planning and MPO organizations to identify related policies (such as complete streets and TOD zoning) that would support creation of full-fledged compact developments in PDAs. Incentives in the PDAs could be awarded at a higher level if the community and developer moved toward a true comprehensive compact development model. The state’s focus should be placed on encouraging land development in areas already developed with sewer systems to promote compact development. According to developers, compact development cannot work with septic systems, unless the state and counties will allow package plants or other technologies. The realization that much new construction activity is at a compact development friendly lot size may represent an opportunity to encourage BG communities, and others, to go further with their building guidelines. For example, communities might have hesitated to limit large lot development, thinking that it would harm their prospects for residential growth. Communities that already encourage small lot development might now reach further into the Balanced Growth toolkit to encourage even bolder long-term change. At the state level, incentives might be created/revisited along those same lines. If developers are bringing small lot developments to market, perhaps the state could state the bar even higher regarding additional compact growth characteristics (such as mixed use activity or transit accessibility). As the housing market continues its slow recovery, and developers slowly return to the market, this could be a fortuitous time to rethink and review the role the state plays in the way in which the landscape is (or is not) developed.

64
7.0 References
Akbari, H., Pomerantz, M., & Taha, H. 2001. Cool surfaces and shade trees to reduce energy use and improve air quality in urban areas. Solar Energy, 70(3): 295-310.
Anderson, L.M., and H. K. Cordell. 1988. Influence of trees on residential property values in Athens, Georgia (U.S.A.): a survey based on actual sales prices. Landscape and Urban Planning, 15:153-164.
Banzhaf, H. S. 2007. Public benefits of undeveloped lands on urban outskirts: non-market valuation studies and their role in land use plans. Informally published manuscript, Department of Economics Fiscal Research Center, Georgia State University, Atlanta, GA. Retrieved from http://papers.ssrn.com/sol3/papers.cfm?abstract_id=990055
Cortright, J. 2009. Walking the Walk: How Walkability Raises Home Values in U.S. Cities. Washington, DC: CEOs for Cities.
Des Rosiers, F., Thériault, M., Kestens, Y., & Villeneuve, P. 2002. Landscaping and house values: An empirical investigation. Journal of Real Estate Research, 23(1), 139 - 161.
Dimke, K. 2008. Valuation of tree canopy on property values of six communities in Cincinnati, Ohio. (Unpublished doctoral dissertation, The Ohio State University). Retrieved from http://etd.ohiolink.edu/view.cgi/Dimke Kelley C.pdf?osu1211933613.
Dombrow, J., Rodriguez, M., & Sirmans, C. F. (2000). The market value of mature trees in single-family housing markets. The Appraisal Journal, 68(1), 39 - 43.
Donovan, G. H., & Butry, D. T. (2010). Trees in the city: Valuing street trees in Portland, Oregon. Landscape and Urban Planning, 94(2), 77-83. doi: 10.1016/j.landurbplan.2009.07.019.
Dowell, M. and Ryu, S. 2008. Aging baby boomers and the generational housing bubble: Foresight and mitigation of an epic transition. Journal of the American Planning Association, 74 (1): 17-33. DOI 10.1080/01944360701802006
Dwyer, John F., E. Gregory McPherson, Herbert W. Schroeder, and Rowan A. Rowntree. 1992. Assessing the benefits and costs of the urban forest. Journal of Arboriculture 18(5): 227-234.
Eppli, M. and Tu, C. 2001. An empirical examination of traditional neighborhood development. Real Estate Economics, 29 (3): 485-501 .
Greenberg, M. (1995). The poetics of cities: Designing neighborhoods that work. Columbus: Ohio State University Press.
Gujarati, D. M. 2003. Basic Econometrics, 4th edition. McGraw Hill, Madison, WI.
Hood, M., J. Clausen & G. Warner. 2007. Low impact development works! Journal of Soil & Water Conservation 61(2): 58A-61A.
Hudson, Mark. 2000. Ground work: Investigating the need for nature in the city. Evergreen. http://evergreen.ca/en/cg/resources/gw2000/index.html

65
Jacob, J. 2011. "Watersheds, walkability, and stormwater: The role of density". Stormwater: The Journal for Surface Water Quality Professionals, January / February, 32-40. Retrieved from http://www.urbannature.org/publications/documents/ WatershedsWalkabilityandStormwater.pdf
Jeng, H. A. C., Englande, A. J., Bakeer, R. M., & Bradford, H. B. 2005. Impact of urban stormwater runoff on estuarine environmental quality. Estuarine, Coastal and Shelf Science 63(4), 513-526. doi: 10.1016/j.ecss.2004.11.024
Kannan, S. 2010. “The Growing Market for Smart Growth, Consumer Demand and Demographic Drivers” Robert Charles Lesser and Company.
Katen-Narvell, E. “Financial Benefits of Density In Two New Jersey Downtowns.” New Jersey Future, July 2011.
Kellogg, W. 2005. Appendix 2: State Policies and Land use Change in the Ohio Lake Erie Basin—Summary of Focus Group Sessions and Participant Questionnaire http://www.greencitybluelake.org/images/land/wendy_summary_focus_groups.pdf
Kellogg, W. 2007. The State Role in Guiding Land Use Change in the Ohio Lake Erie Basin: Key Policies, Programs, and Incentives for the Ohio Balanced Growth Program, Final Report. Prepared for the Ohio Lake Erie Commission and EcoCity Cleveland; Funded by the Joyce Foundation. http://www.greencitybluelake.org/images/land/wendy_policy_paper.pdf
Laverne, R. J., & Winson-Geideman, K. 2003. The influence of trees and landscaping on rental rates at office buildings. Journal of Arboriculture, 29(5), 281.
Logan, G., Siejka, S. and S. Kannan, The Market for Smart Growth. Robert Charles Lesser and Company, LLC, no date.
Litman, T. 2012.Understanding smart growth savings; what we know about public infrastructure and service cost savings, and how they are misrepresented by critics (10.1.1.124.3119). Victoria Transport Policy Institute. Retrieved from Todd Alexander Litman website: http://citeseerx.ist.psu.edu/viewdoc/summary?doi=10.1.1.124.3119
Marlow, J.E. 2008. Economic and Fiscal Impacts of Smart Growth Policies. July . Lincoln Institute of Land Policy-Sonoran Institute Joint Venture.
McPherson, E.G., J.R. Simpson, P.J. Peper, S.E. Maco, S.L. Gardner, S.K. Cozad, and Xiao, Q. 2006. “Midwest community tree guide: Benefits, costs and strategic planting.” Albany, CA: US Department of Agriculture, Forest Service. Retrieved from http://www.fs.fed.us/psw/programs/uesd/uep/products/2/cufr_626_gtr199_midwest_tree_guide.pdf
Mehta, V. 2009. Look closely and you will see, listen carefully and you will hear: Urban design and social interaction on streets. Journal of Urban Design 14 (1): 29-64. DOI: 10.1080/13574800802452658.

66
Mikelbank, B. 2008. Can New Urbanist Design be Economically Sustainable? The Case of Mill Creek in Cleveland, Ohio. Draft paper. Retrieved from http://www.umbc.edu/csn/files/Download/MILL%20CREEK%20DRAFT%20MIKELBANK_9Jun08.pdf
Minicozzi, J., AICP. 2011. Infrastructure Financing: The Balance of Land-use and the Cost of Infrastructure, Public Interest Projects, February 5, 2011, Powerpoint presentation.
Myers, D. and Gearin, E. 2011. Current Preferences and Future Demand for Denser Residential Environments, Housing Policy Debate, Vol. 12, Issue 4, Fannie Mae Foundation.
Nowak, D. J. 1994. Air pollution removal by Chicago’s urban forest. In E. G. McPherson, D. J. Nowak & R. A. Rowntree (Eds.), Chicago’s Urban Forest Ecosystem: Results of the Chicago Urban Forest Climate Project. Gen. Tech. Rep NE-186 (pp. 63 - 81). Radnor, PA: USDA Forest Service, Northeastern Forest Experiment Station.
Nowak, D. J., & Crane, D. E. 2002. Carbon storage and sequestration by urban trees in the USA. Environmental Pollution, 116(3):381-389.
Nowak, D. J., Hoehn, R., & Crane, D. E. 2007. Oxygen production by urban trees in the United States. Arboriculture & Urban Forestry, 33(3): 220-226.
Ohio Lake Erie Commission. 2004. Linking Land Use to Lake Erie: Best Local Land Use Practices. http://balancedgrowth.ohio.gov/LinkClick.aspx?fileticket=17QB6vd7+Z0=&tabid=57
Ohio Lake Erie Commission. 2011. Ohio Balanced Growth Strategy. http://balancedgrowth.ohio.gov/LinkClick.aspx?fileticket=gTs9v-az2T0=&tabid=56
Ohio Lake Erie Commission. 2012. Linking Water Resources and Best Local Land Use Practices.
Rogerson, P. and Kim, D., 2005 Population Distribution and Redistribution of the Baby-Boom Cohort in the United States: Recent Trends and Implications. Proceedings of the National Academy of Sciences of the United States of America, 102 (43). doi: 10.1073/pnas.0507318102.
Rossi, L., & Hari, R. E. 2007. Screening procedure to assess the impact of urban stormwater temperature to populations of Brown Trout in receiving water. Integrated Environmental Assessment and Management, 3(3): 383-392. doi: 10.1897/1551- 3793(2007)3[383:sptati]2.0.co;2
Sander, H., Polasky, S., & Haight, R. G. (2010). The value of urban tree cover: A hedonic property price model in Ramsey and Dakota Counties, Minnesota, USA. Ecological Economics, 69(8), 1646-1656. doi: http://dx.doi.org/10.1016/j.ecolecon.2010.03.011
“Sonoran Institute, no date. About Town, Building Revenue for Communities.”
Thériault, M., Kestens, Y., & Des Rosiers, F. (2002). The impact of mature trees on house values and on residential location choices in Quebec City. Paper presented at the Integrated Assessment and Decision Support. 1st biennial meeting of the International Environmental Modelling and Software Society University of Lugano, Switzerland.

67
Tyrväinen, L. 1997. The amenity value of the urban forest: an application of the hedonic pricing method. Landscape and Urban Planning, 37(3-4): 211-222.
ULI (Urban Land Institute). 2012. Shifting Suburbs, Reinventing Infrastructure for Compact Development.” Washington, D.C.: Urban Land Institute.
ULI (Urban Land Institute). 2013. Emerging Trends in Real Estate. Washington, D.C.: PwC and the Urban Land Institute.
Williams, E. & W. Wise. 2009. Economic impacts of alternative approaches to storm-water management and land development. Journal of Water Resources Planning and Management 13(6): 537-546.
Wolf, K. L. 1999. Grow for the gold: Trees in business districts tree link (Vol. 14, pp. 4). Olympia, WA: Washington State Department of Natural Resources.
Xiao, Q., & McPherson, E. G. 2002. Rainfall interception by Santa Monica’s municipal urban forest. Urban Ecosystems, 6(4): 291-302.
Young, R. F. 2011. Planting the living city. Journal of the American Planning Association, 77(4): 368-381. Retrieved from http://dx.doi.org/10.1080/01944363.2011.616996
Related Documents