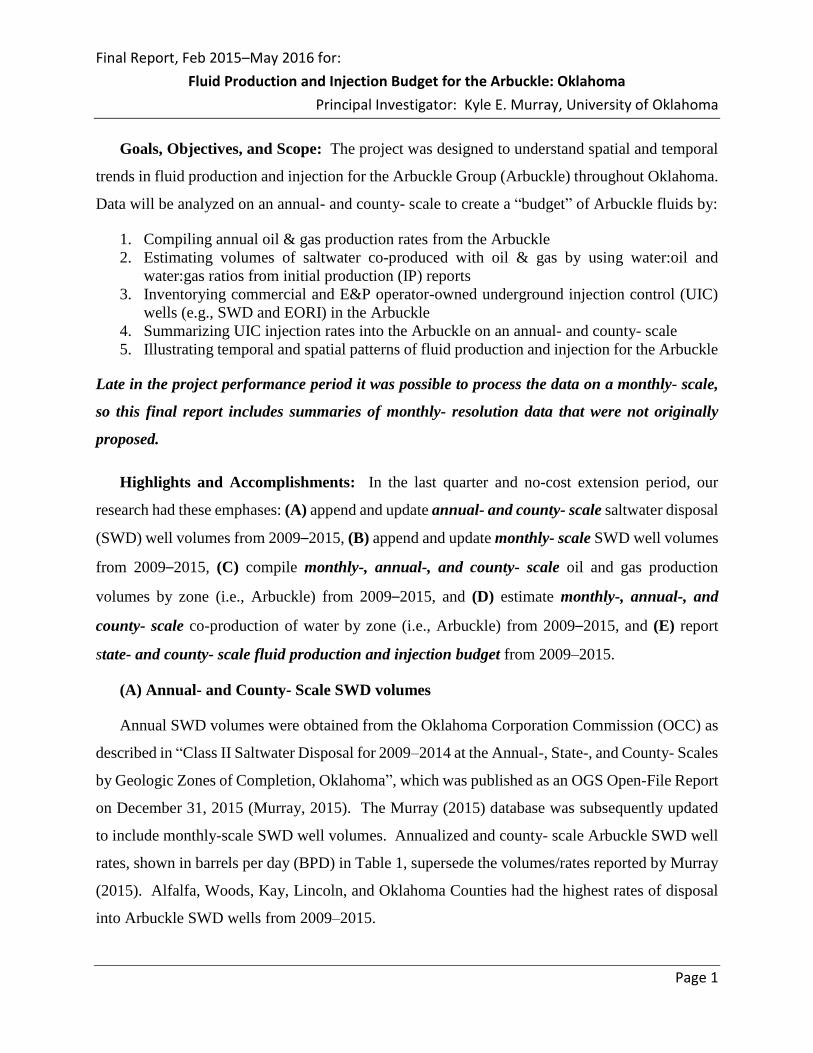
Final Report, Feb 2015–May 2016 for: Fluid Production and Injection Budget for the Arbuckle: Oklahoma Principal Investigator: Kyle E. Murray, University of Oklahoma Page 1 Goals, Objectives, and Scope: The project was designed to understand spatial and temporal trends in fluid production and injection for the Arbuckle Group (Arbuckle) throughout Oklahoma. Data will be analyzed on an annual- and county- scale to create a “budget” of Arbuckle fluids by: 1. Compiling annual oil & gas production rates from the Arbuckle 2. Estimating volumes of saltwater co-produced with oil & gas by using water:oil and water:gas ratios from initial production (IP) reports 3. Inventorying commercial and E&P operator-owned underground injection control (UIC) wells (e.g., SWD and EORI) in the Arbuckle 4. Summarizing UIC injection rates into the Arbuckle on an annual- and county- scale 5. Illustrating temporal and spatial patterns of fluid production and injection for the Arbuckle Late in the project performance period it was possible to process the data on a monthly- scale, so this final report includes summaries of monthly- resolution data that were not originally proposed. Highlights and Accomplishments: In the last quarter and no-cost extension period, our research had these emphases: (A) append and update annual- and county- scale saltwater disposal (SWD) well volumes from 2009–2015, (B) append and update monthly- scale SWD well volumes from 2009–2015, (C) compile monthly-, annual-, and county- scale oil and gas production volumes by zone (i.e., Arbuckle) from 2009–2015, and (D) estimate monthly-, annual-, and county- scale co-production of water by zone (i.e., Arbuckle) from 2009–2015, and (E) report state- and county- scale fluid production and injection budget from 2009–2015. (A) Annual- and County- Scale SWD volumes Annual SWD volumes were obtained from the Oklahoma Corporation Commission (OCC) as described in “Class II Saltwater Disposal for 2009–2014 at the Annual-, State-, and County- Scales by Geologic Zones of Completion, Oklahoma”, which was published as an OGS Open-File Report on December 31, 2015 (Murray, 2015). The Murray (2015) database was subsequently updated to include monthly-scale SWD well volumes. Annualized and county- scale Arbuckle SWD well rates, shown in barrels per day (BPD) in Table 1, supersede the volumes/rates reported by Murray (2015). Alfalfa, Woods, Kay, Lincoln, and Oklahoma Counties had the highest rates of disposal into Arbuckle SWD wells from 2009–2015.

Welcome message from author
This document is posted to help you gain knowledge. Please leave a comment to let me know what you think about it! Share it to your friends and learn new things together.
Transcript
Final Report, Feb 2015–May 2016 for:
Fluid Production and Injection Budget for the Arbuckle: Oklahoma
Principal Investigator: Kyle E. Murray, University of Oklahoma
Page 1
Goals, Objectives, and Scope: The project was designed to understand spatial and temporal
trends in fluid production and injection for the Arbuckle Group (Arbuckle) throughout Oklahoma.
Data will be analyzed on an annual- and county- scale to create a “budget” of Arbuckle fluids by:
1. Compiling annual oil & gas production rates from the Arbuckle
2. Estimating volumes of saltwater co-produced with oil & gas by using water:oil and
water:gas ratios from initial production (IP) reports
3. Inventorying commercial and E&P operator-owned underground injection control (UIC)
wells (e.g., SWD and EORI) in the Arbuckle
4. Summarizing UIC injection rates into the Arbuckle on an annual- and county- scale
5. Illustrating temporal and spatial patterns of fluid production and injection for the Arbuckle
Late in the project performance period it was possible to process the data on a monthly- scale,
so this final report includes summaries of monthly- resolution data that were not originally
proposed.
Highlights and Accomplishments: In the last quarter and no-cost extension period, our
research had these emphases: (A) append and update annual- and county- scale saltwater disposal
(SWD) well volumes from 2009–2015, (B) append and update monthly- scale SWD well volumes
from 2009–2015, (C) compile monthly-, annual-, and county- scale oil and gas production
volumes by zone (i.e., Arbuckle) from 2009–2015, and (D) estimate monthly-, annual-, and
county- scale co-production of water by zone (i.e., Arbuckle) from 2009–2015, and (E) report
state- and county- scale fluid production and injection budget from 2009–2015.
(A) Annual- and County- Scale SWD volumes
Annual SWD volumes were obtained from the Oklahoma Corporation Commission (OCC) as
described in “Class II Saltwater Disposal for 2009–2014 at the Annual-, State-, and County- Scales
by Geologic Zones of Completion, Oklahoma”, which was published as an OGS Open-File Report
on December 31, 2015 (Murray, 2015). The Murray (2015) database was subsequently updated
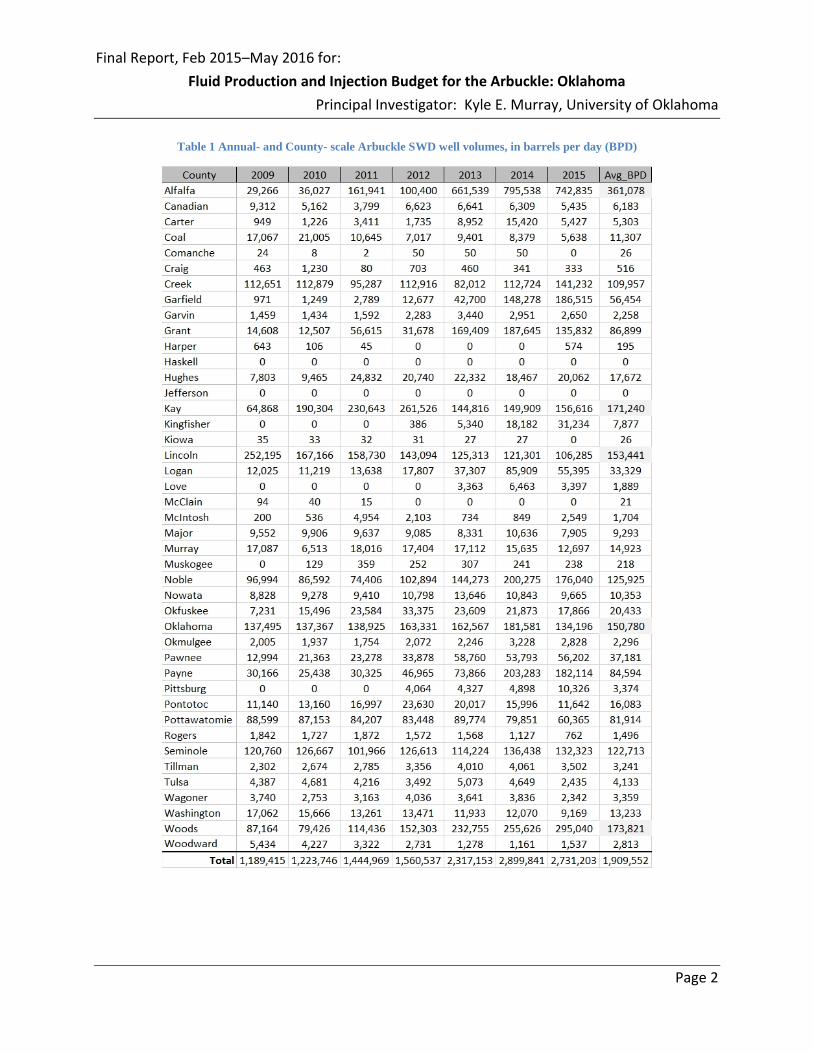
to include monthly-scale SWD well volumes. Annualized and county- scale Arbuckle SWD well
rates, shown in barrels per day (BPD) in Table 1, supersede the volumes/rates reported by Murray
(2015). Alfalfa, Woods, Kay, Lincoln, and Oklahoma Counties had the highest rates of disposal
into Arbuckle SWD wells from 2009–2015.
Final Report, Feb 2015–May 2016 for:
Fluid Production and Injection Budget for the Arbuckle: Oklahoma
Principal Investigator: Kyle E. Murray, University of Oklahoma
Page 2
Table 1 Annual- and County- scale Arbuckle SWD well volumes, in barrels per day (BPD)
Final Report, Feb 2015–May 2016 for:
Fluid Production and Injection Budget for the Arbuckle: Oklahoma
Principal Investigator: Kyle E. Murray, University of Oklahoma
Page 3
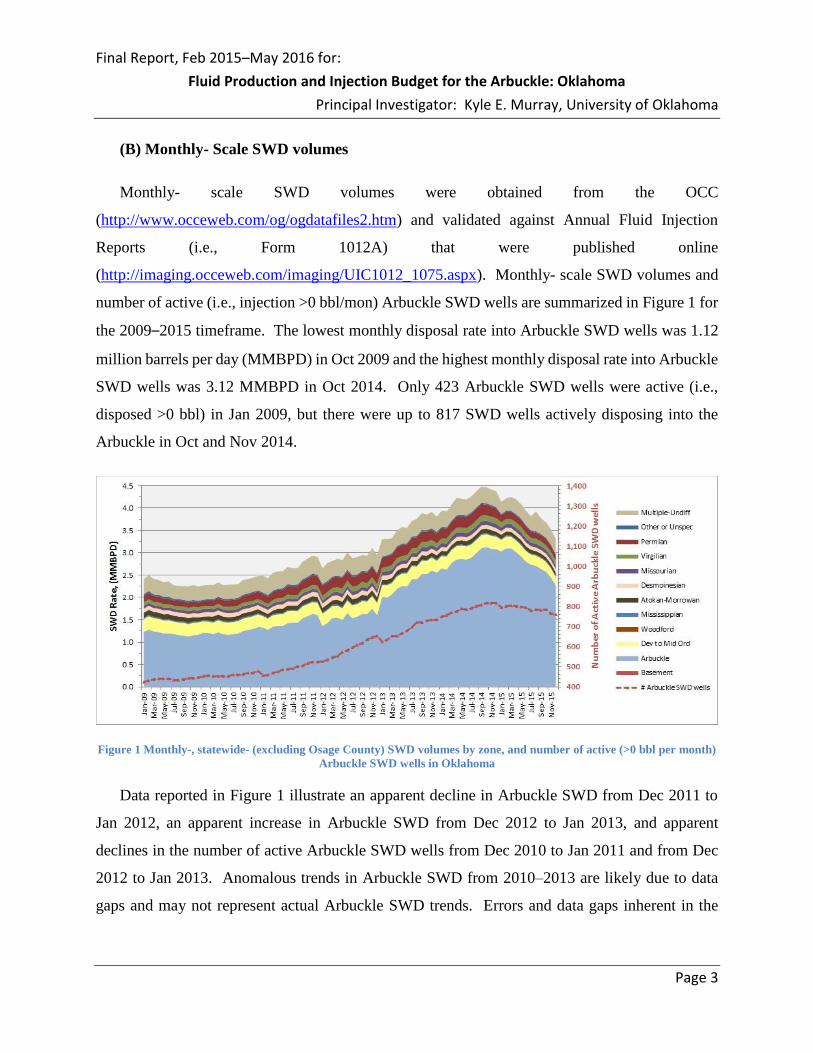
(B) Monthly- Scale SWD volumes
Monthly- scale SWD volumes were obtained from the OCC
(http://www.occeweb.com/og/ogdatafiles2.htm) and validated against Annual Fluid Injection
Reports (i.e., Form 1012A) that were published online
(http://imaging.occeweb.com/imaging/UIC1012_1075.aspx). Monthly- scale SWD volumes and
number of active (i.e., injection >0 bbl/mon) Arbuckle SWD wells are summarized in Figure 1 for
the 2009–2015 timeframe. The lowest monthly disposal rate into Arbuckle SWD wells was 1.12
million barrels per day (MMBPD) in Oct 2009 and the highest monthly disposal rate into Arbuckle
SWD wells was 3.12 MMBPD in Oct 2014. Only 423 Arbuckle SWD wells were active (i.e.,
disposed >0 bbl) in Jan 2009, but there were up to 817 SWD wells actively disposing into the
Arbuckle in Oct and Nov 2014.
Figure 1 Monthly-, statewide- (excluding Osage County) SWD volumes by zone, and number of active (>0 bbl per month)
Arbuckle SWD wells in Oklahoma
Data reported in Figure 1 illustrate an apparent decline in Arbuckle SWD from Dec 2011 to
Jan 2012, an apparent increase in Arbuckle SWD from Dec 2012 to Jan 2013, and apparent
declines in the number of active Arbuckle SWD wells from Dec 2010 to Jan 2011 and from Dec
2012 to Jan 2013. Anomalous trends in Arbuckle SWD from 2010–2013 are likely due to data
gaps and may not represent actual Arbuckle SWD trends. Errors and data gaps inherent in the
Final Report, Feb 2015–May 2016 for:
Fluid Production and Injection Budget for the Arbuckle: Oklahoma
Principal Investigator: Kyle E. Murray, University of Oklahoma
Page 4
current database may be remedied in the future because Form 1012As continue to be submitted to
and/or published by the OCC and incorporated into the UIC database.
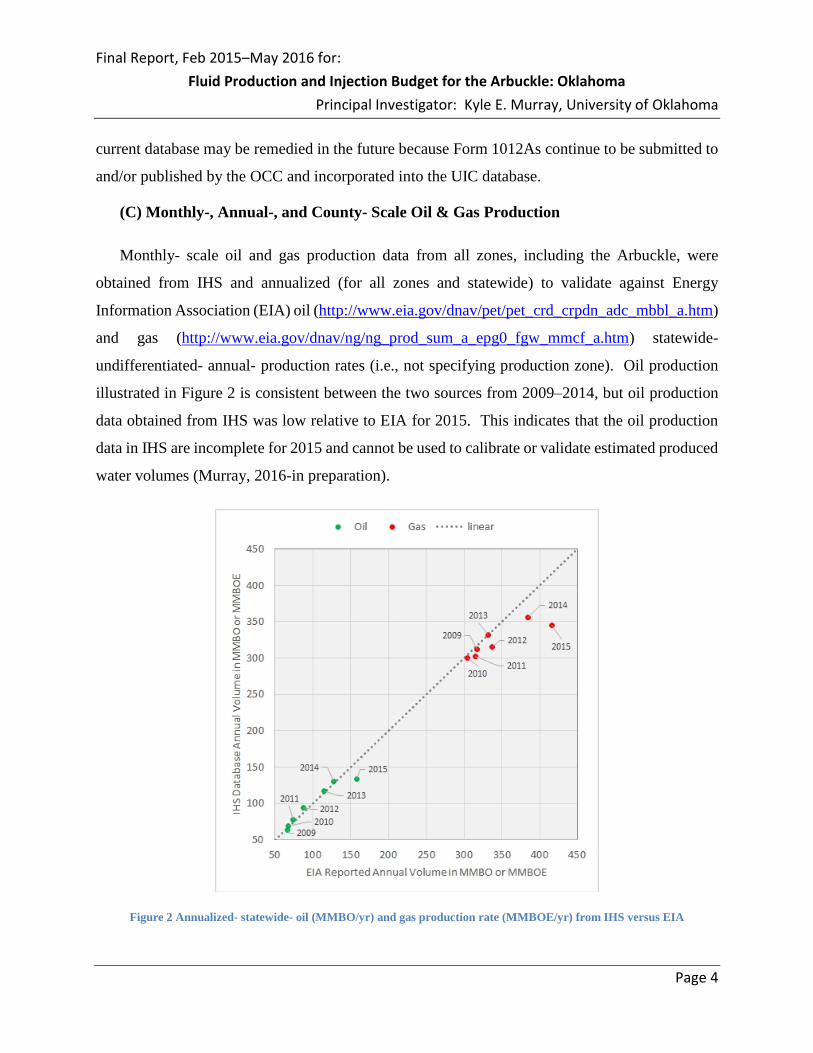
(C) Monthly-, Annual-, and County- Scale Oil & Gas Production
Monthly- scale oil and gas production data from all zones, including the Arbuckle, were
obtained from IHS and annualized (for all zones and statewide) to validate against Energy
Information Association (EIA) oil (http://www.eia.gov/dnav/pet/pet_crd_crpdn_adc_mbbl_a.htm)
and gas (http://www.eia.gov/dnav/ng/ng_prod_sum_a_epg0_fgw_mmcf_a.htm) statewide-
undifferentiated- annual- production rates (i.e., not specifying production zone). Oil production
illustrated in Figure 2 is consistent between the two sources from 2009–2014, but oil production
data obtained from IHS was low relative to EIA for 2015. This indicates that the oil production
data in IHS are incomplete for 2015 and cannot be used to calibrate or validate estimated produced
water volumes (Murray, 2016-in preparation).
Figure 2 Annualized- statewide- oil (MMBO/yr) and gas production rate (MMBOE/yr) from IHS versus EIA
Final Report, Feb 2015–May 2016 for:
Fluid Production and Injection Budget for the Arbuckle: Oklahoma
Principal Investigator: Kyle E. Murray, University of Oklahoma
Page 5
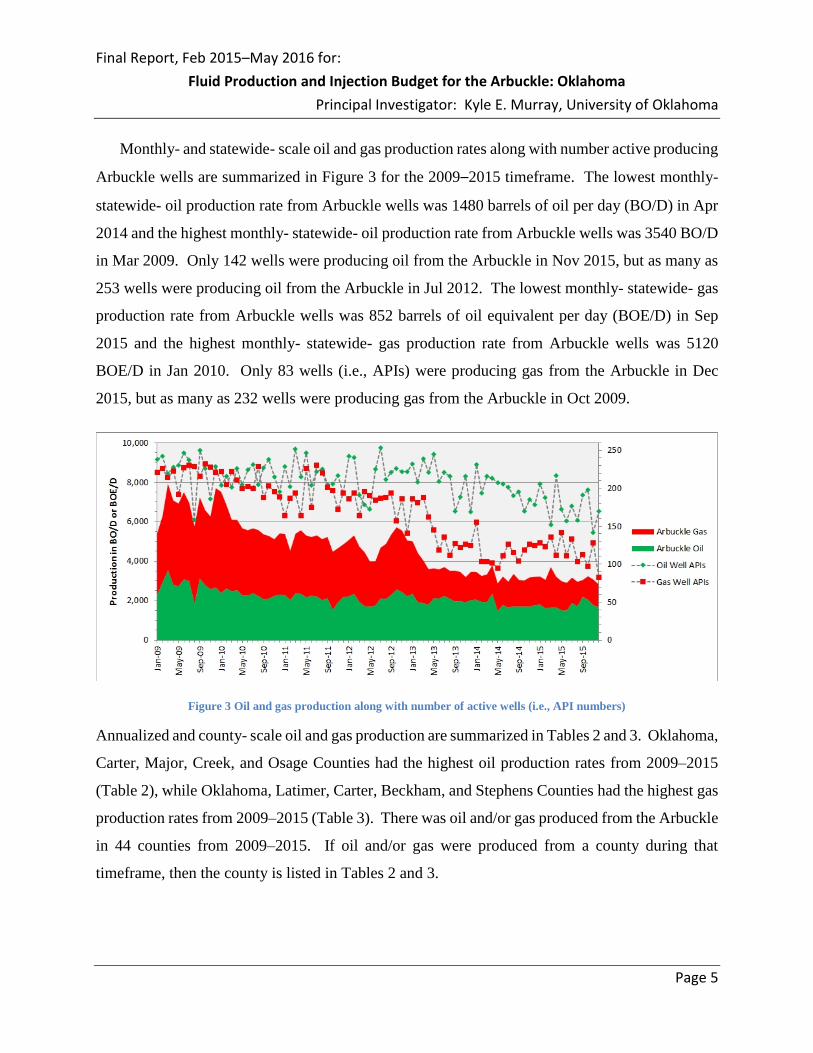
Monthly- and statewide- scale oil and gas production rates along with number active producing
Arbuckle wells are summarized in Figure 3 for the 2009–2015 timeframe. The lowest monthly-
statewide- oil production rate from Arbuckle wells was 1480 barrels of oil per day (BO/D) in Apr
2014 and the highest monthly- statewide- oil production rate from Arbuckle wells was 3540 BO/D
in Mar 2009. Only 142 wells were producing oil from the Arbuckle in Nov 2015, but as many as
253 wells were producing oil from the Arbuckle in Jul 2012. The lowest monthly- statewide- gas
production rate from Arbuckle wells was 852 barrels of oil equivalent per day (BOE/D) in Sep
2015 and the highest monthly- statewide- gas production rate from Arbuckle wells was 5120
BOE/D in Jan 2010. Only 83 wells (i.e., APIs) were producing gas from the Arbuckle in Dec
2015, but as many as 232 wells were producing gas from the Arbuckle in Oct 2009.
Figure 3 Oil and gas production along with number of active wells (i.e., API numbers)
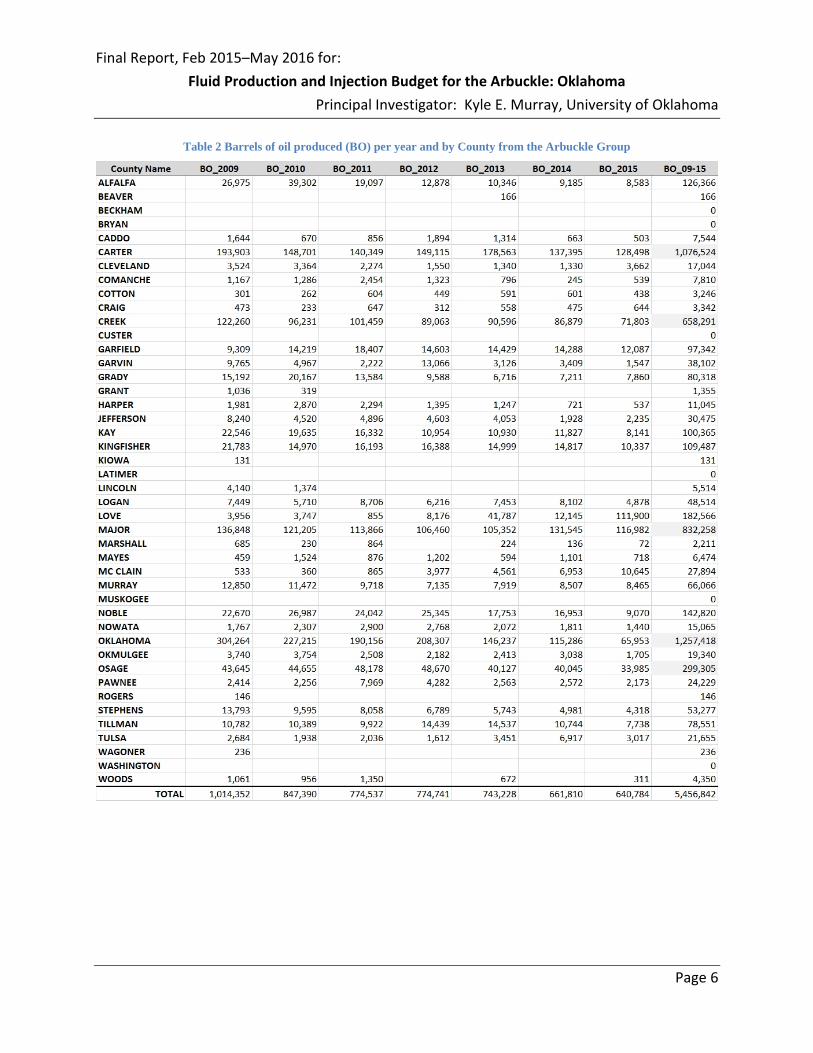
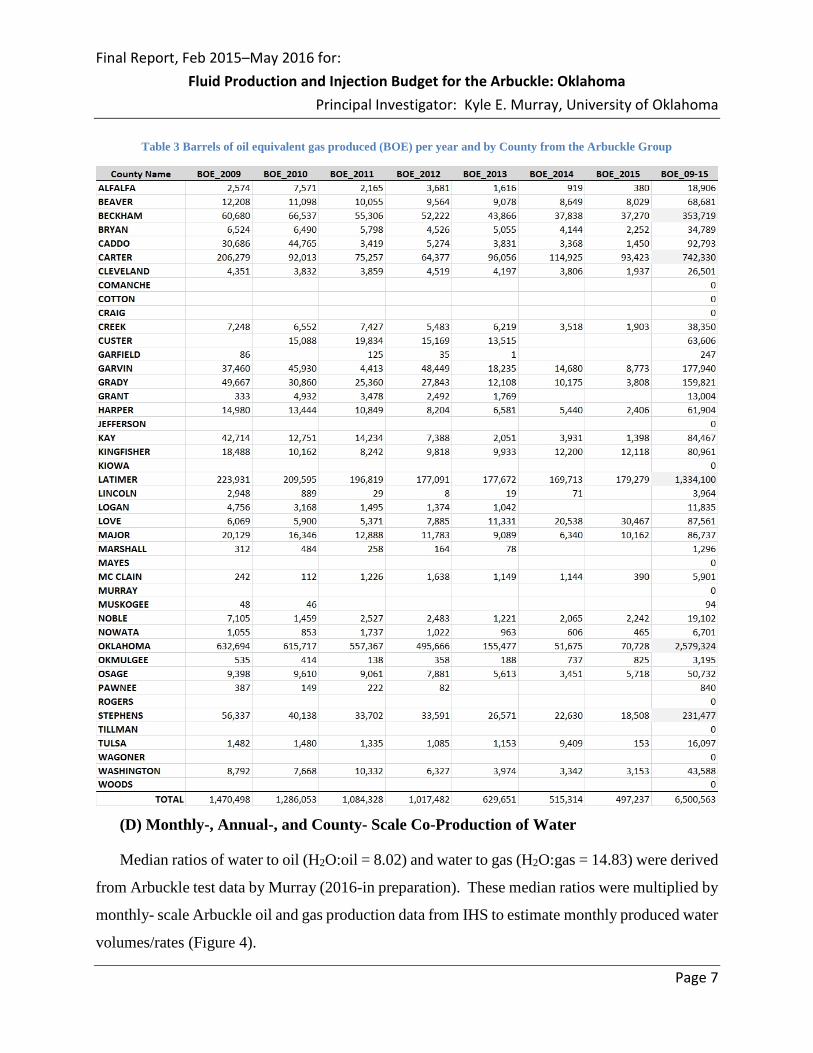
Annualized and county- scale oil and gas production are summarized in Tables 2 and 3. Oklahoma,
Carter, Major, Creek, and Osage Counties had the highest oil production rates from 2009–2015
(Table 2), while Oklahoma, Latimer, Carter, Beckham, and Stephens Counties had the highest gas
production rates from 2009–2015 (Table 3). There was oil and/or gas produced from the Arbuckle
in 44 counties from 2009–2015. If oil and/or gas were produced from a county during that
timeframe, then the county is listed in Tables 2 and 3.
Final Report, Feb 2015–May 2016 for:
Fluid Production and Injection Budget for the Arbuckle: Oklahoma
Principal Investigator: Kyle E. Murray, University of Oklahoma
Page 6
Table 2 Barrels of oil produced (BO) per year and by County from the Arbuckle Group
Final Report, Feb 2015–May 2016 for:
Fluid Production and Injection Budget for the Arbuckle: Oklahoma
Principal Investigator: Kyle E. Murray, University of Oklahoma
Page 7
Table 3 Barrels of oil equivalent gas produced (BOE) per year and by County from the Arbuckle Group
(D) Monthly-, Annual-, and County- Scale Co-Production of Water
Median ratios of water to oil (H2O:oil = 8.02) and water to gas (H2O:gas = 14.83) were derived
from Arbuckle test data by Murray (2016-in preparation). These median ratios were multiplied by
monthly- scale Arbuckle oil and gas production data from IHS to estimate monthly produced water
volumes/rates (Figure 4).
Final Report, Feb 2015–May 2016 for:
Fluid Production and Injection Budget for the Arbuckle: Oklahoma
Principal Investigator: Kyle E. Murray, University of Oklahoma
Page 8
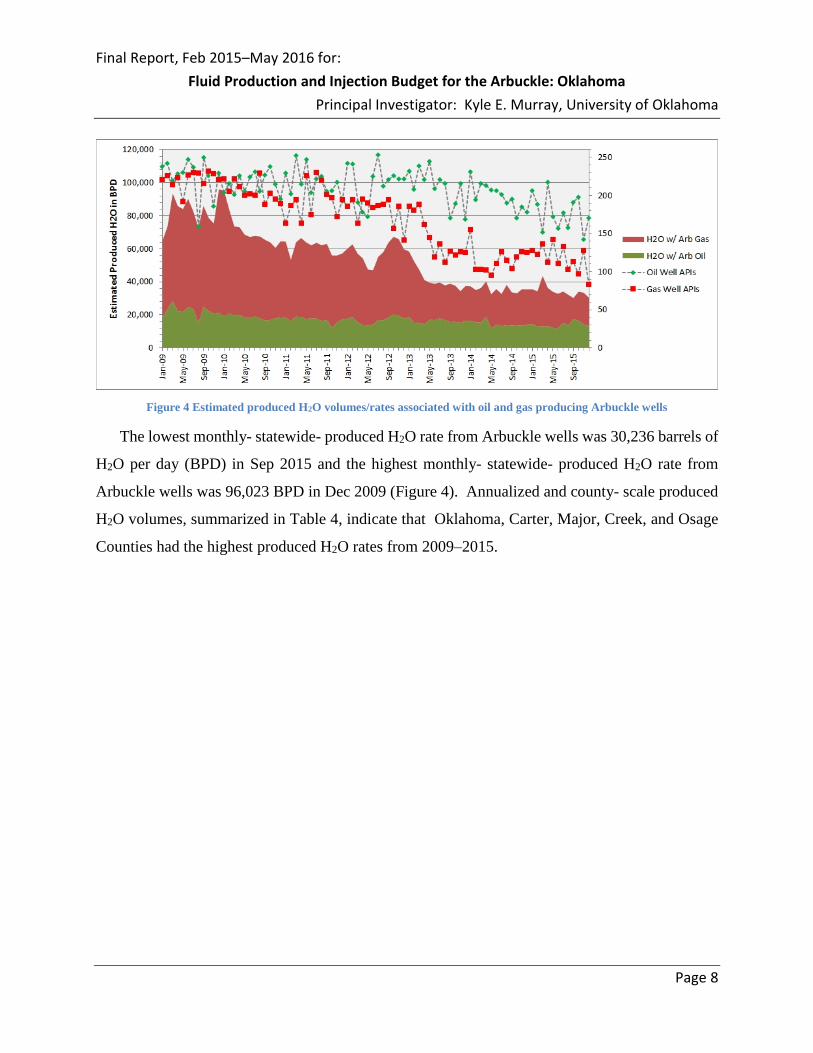
Figure 4 Estimated produced H2O volumes/rates associated with oil and gas producing Arbuckle wells
The lowest monthly- statewide- produced H2O rate from Arbuckle wells was 30,236 barrels of
H2O per day (BPD) in Sep 2015 and the highest monthly- statewide- produced H2O rate from
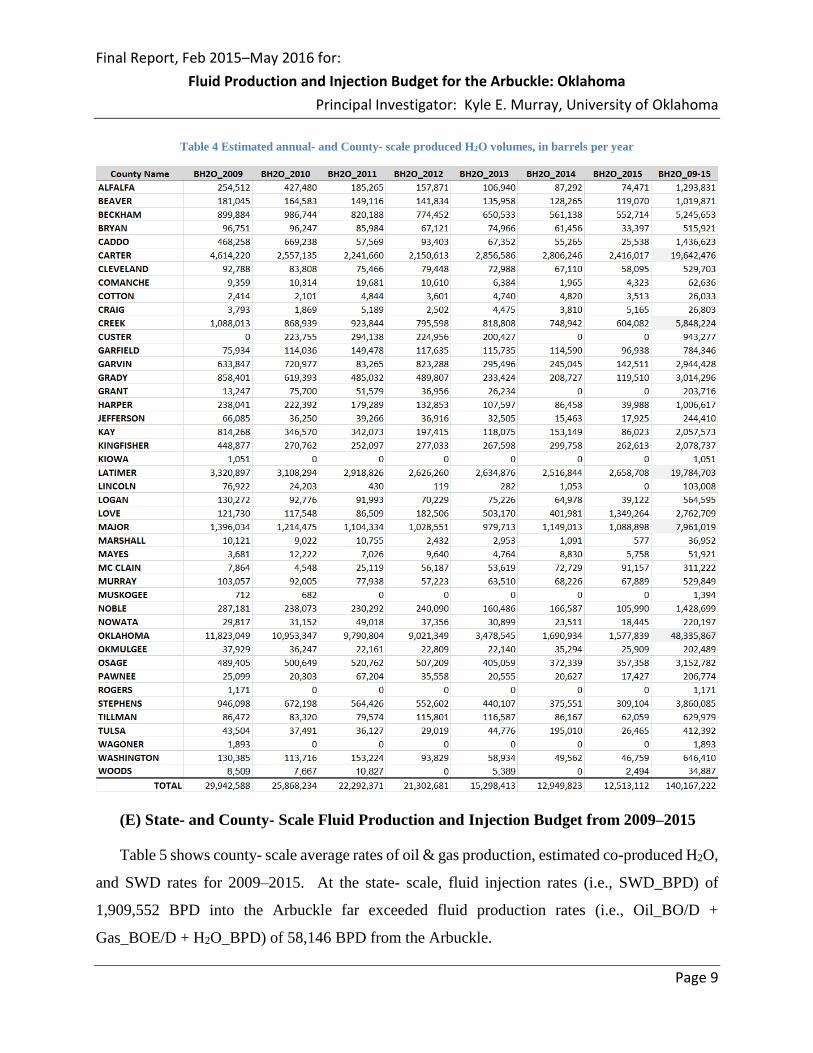
Arbuckle wells was 96,023 BPD in Dec 2009 (Figure 4). Annualized and county- scale produced
H2O volumes, summarized in Table 4, indicate that Oklahoma, Carter, Major, Creek, and Osage
Counties had the highest produced H2O rates from 2009–2015.
Final Report, Feb 2015–May 2016 for:
Fluid Production and Injection Budget for the Arbuckle: Oklahoma
Principal Investigator: Kyle E. Murray, University of Oklahoma
Page 9
Table 4 Estimated annual- and County- scale produced H2O volumes, in barrels per year
(E) State- and County- Scale Fluid Production and Injection Budget from 2009–2015
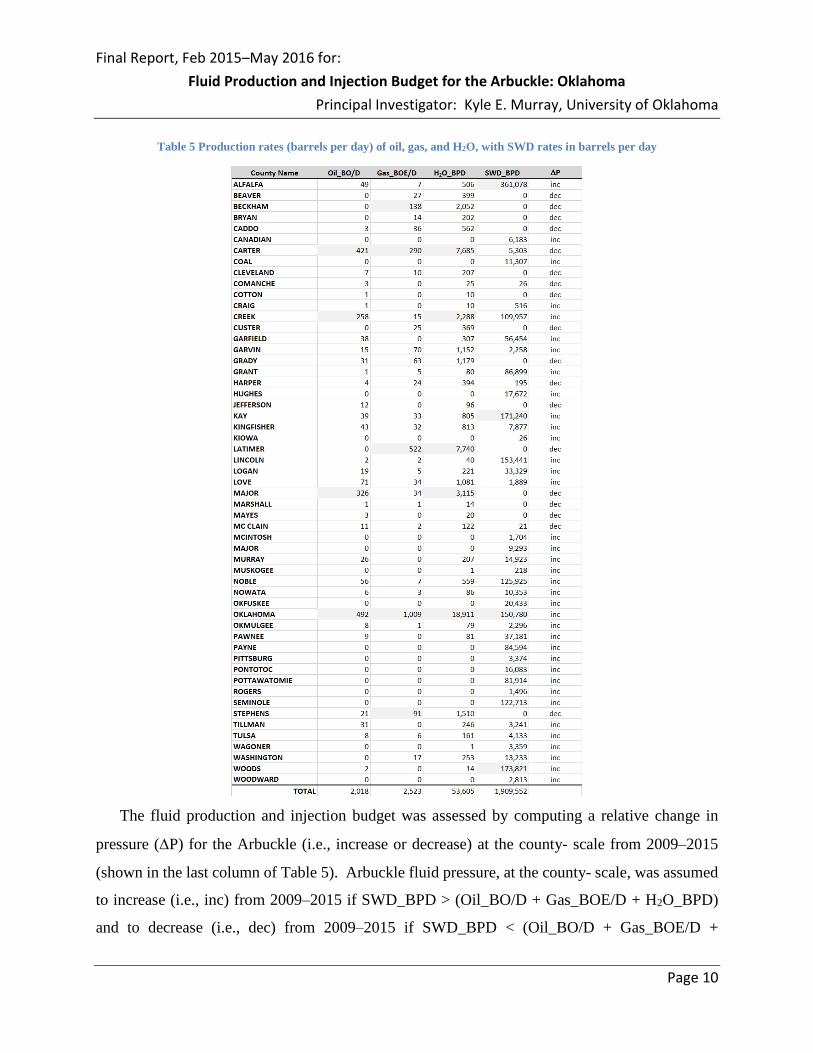
Table 5 shows county- scale average rates of oil & gas production, estimated co-produced H2O,
and SWD rates for 2009–2015. At the state- scale, fluid injection rates (i.e., SWD_BPD) of
1,909,552 BPD into the Arbuckle far exceeded fluid production rates (i.e., Oil_BO/D +
Gas_BOE/D + H2O_BPD) of 58,146 BPD from the Arbuckle.
Final Report, Feb 2015–May 2016 for:
Fluid Production and Injection Budget for the Arbuckle: Oklahoma
Principal Investigator: Kyle E. Murray, University of Oklahoma
Page 10
Table 5 Production rates (barrels per day) of oil, gas, and H2O, with SWD rates in barrels per day
The fluid production and injection budget was assessed by computing a relative change in
pressure (P) for the Arbuckle (i.e., increase or decrease) at the county- scale from 2009–2015
(shown in the last column of Table 5). Arbuckle fluid pressure, at the county- scale, was assumed
to increase (i.e., inc) from 2009–2015 if SWD_BPD > (Oil_BO/D + Gas_BOE/D + H2O_BPD)
and to decrease (i.e., dec) from 2009–2015 if SWD_BPD < (Oil_BO/D + Gas_BOE/D +
Final Report, Feb 2015–May 2016 for:
Fluid Production and Injection Budget for the Arbuckle: Oklahoma
Principal Investigator: Kyle E. Murray, University of Oklahoma
Page 11
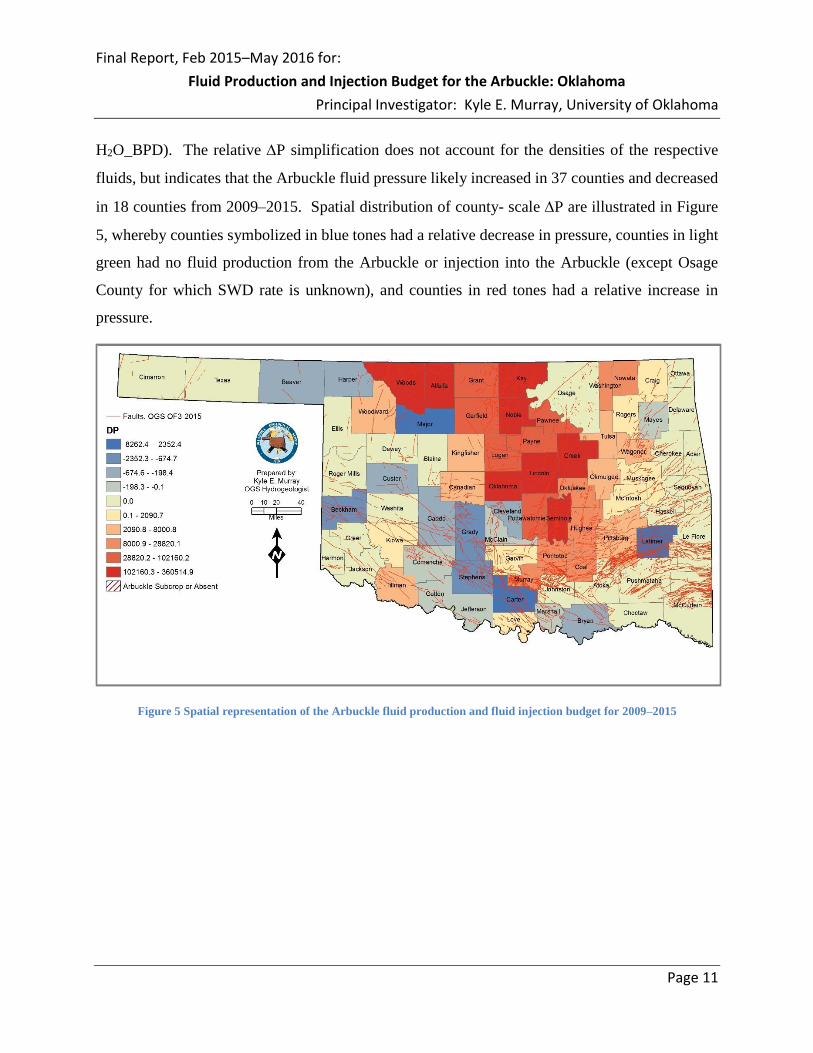
H2O_BPD). The relative P simplification does not account for the densities of the respective
fluids, but indicates that the Arbuckle fluid pressure likely increased in 37 counties and decreased
in 18 counties from 2009–2015. Spatial distribution of county- scale P are illustrated in Figure
5, whereby counties symbolized in blue tones had a relative decrease in pressure, counties in light
green had no fluid production from the Arbuckle or injection into the Arbuckle (except Osage
County for which SWD rate is unknown), and counties in red tones had a relative increase in
pressure.
Figure 5 Spatial representation of the Arbuckle fluid production and fluid injection budget for 2009–2015
Final Report, Feb 2015–May 2016 for:
Fluid Production and Injection Budget for the Arbuckle: Oklahoma
Principal Investigator: Kyle E. Murray, University of Oklahoma
Page 12
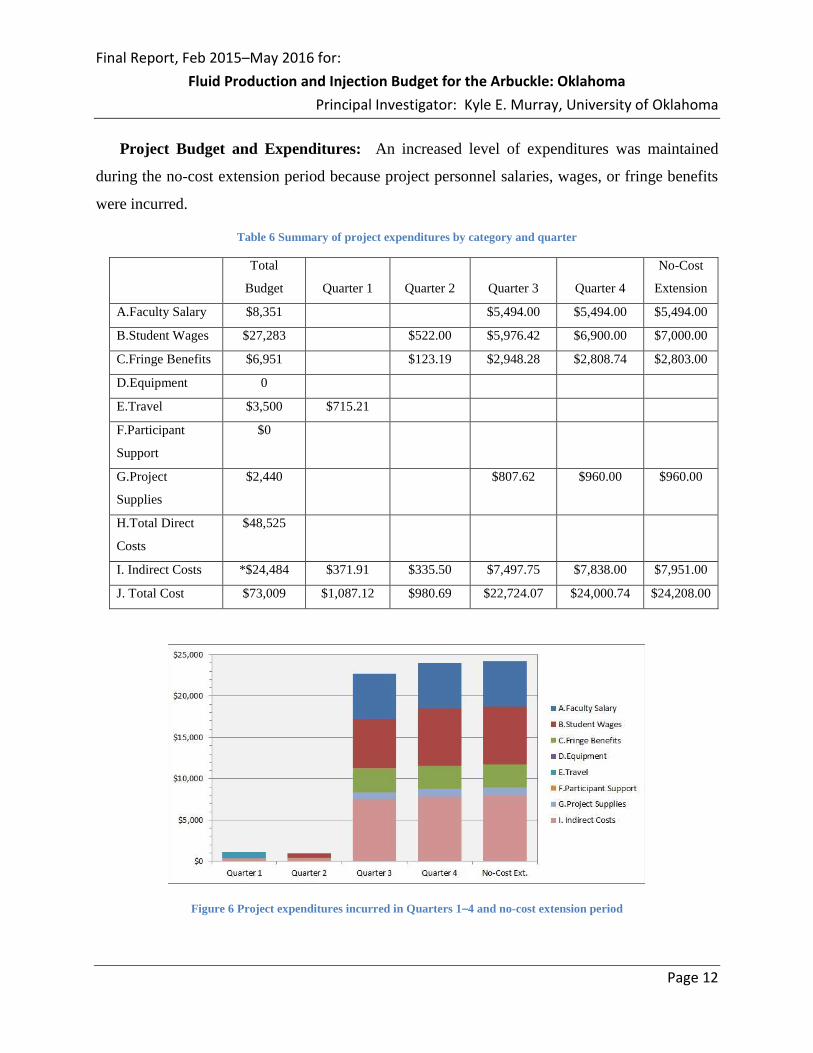
Project Budget and Expenditures: An increased level of expenditures was maintained
during the no-cost extension period because project personnel salaries, wages, or fringe benefits
were incurred.
Table 6 Summary of project expenditures by category and quarter
Total
Budget Quarter 1 Quarter 2 Quarter 3 Quarter 4
No-Cost
Extension
A.Faculty Salary $8,351 $5,494.00 $5,494.00 $5,494.00
B.Student Wages $27,283 $522.00 $5,976.42 $6,900.00 $7,000.00
C.Fringe Benefits $6,951 $123.19 $2,948.28 $2,808.74 $2,803.00
D.Equipment 0
E.Travel $3,500 $715.21
F.Participant
Support
$0
G.Project
Supplies
$2,440 $807.62 $960.00 $960.00
H.Total Direct
Costs
$48,525
I. Indirect Costs *$24,484 $371.91 $335.50 $7,497.75 $7,838.00 $7,951.00
J. Total Cost $73,009 $1,087.12 $980.69 $22,724.07 $24,000.74 $24,208.00
Figure 6 Project expenditures incurred in Quarters 1–4 and no-cost extension period
Final Report, Feb 2015–May 2016 for:
Fluid Production and Injection Budget for the Arbuckle: Oklahoma
Principal Investigator: Kyle E. Murray, University of Oklahoma
Page 13
References:
Murray, K.E., 2015, Class II Saltwater Disposal for 2009–2014 at the Annual-, State-, and
County- Scales by Geologic Zones of Completion, Oklahoma, Oklahoma Geological
Survey Open-File Report (OF5-2015): Norman, OK, p. 18.
Murray, K.E., 2016-in preparation, Co-Produced Water Volumes from Petroleum Resource
Production in Oklahoma, 2009–2015, in preparation for Environmental Science &
Technology.
Related Documents