PT. Geoindo Geotechnical Investigation – Banyu Urip Field, Cepu Block MC / 001 / 02 / Rep. 1 – Final Geotechnical Report - 16/09/02 MOBIL CEPU LIMITED. BANYU URIP FIELD DEVELOPMENT PROJECT CONTRACT NO. C-3010630 CEPU BLOCK, EAST JAVA, INDONESIA GEOTECHNICAL AND TOPOGRAPHIC SURVEY FACTUAL AND INTERPRETATIVE REPORT EXECUTIVE SUMMARY TABLE OF CONTENTS Page No. 1. INTRODUCTION 1 1.1 Introduction and Terms of Reference 1 1.2 Structure of Report 3 1.3 Sources of Information 4 2. PROPOSED DEVELOPMENT 4 3. GENERAL SITE DESCRIPTION 5 3.1 General 5 3.2 Topography and Geomorphology 5 3.3 Regional Geology and Hydrogeology 6 3.4 Surface Drainage 7

Welcome message from author
This document is posted to help you gain knowledge. Please leave a comment to let me know what you think about it! Share it to your friends and learn new things together.
Transcript
PT. Geoindo Geotechnical Investigation – Banyu Urip Field, Cepu Block
MC / 001 / 02 / Rep. 1 – Final Geotechnical Report - 16/09/02
MOBIL CEPU LIMITED.
BANYU URIP FIELD DEVELOPMENT PROJECT CONTRACT NO. C-3010630
CEPU BLOCK,
EAST JAVA, INDONESIA
GEOTECHNICAL AND TOPOGRAPHIC SURVEY
FACTUAL AND INTERPRETATIVE REPORT
EXECUTIVE SUMMARY TABLE OF CONTENTS Page No. 1. INTRODUCTION 1
1.1 Introduction and Terms of Reference 1 1.2 Structure of Report 3 1.3 Sources of Information 4
2. PROPOSED DEVELOPMENT 4 3. GENERAL SITE DESCRIPTION 5
3.1 General 5 3.2 Topography and Geomorphology 5 3.3 Regional Geology and Hydrogeology 6 3.4 Surface Drainage 7
PT. Geoindo Geotechnical Investigation – Banyu Urip Field, Cepu Block
MC / 001 / 02 / Rep. 1 – Final Geotechnical Report - 16/09/02
4. DETAILED TOPOGRAPHIC SURVEY AND GEOTECHNICAL INVESTIGATION 8
4.1 General 8 4.2 Desk Study and Preparation 9
4.2.1 Desk Study 9 4.2.2 Preparation 10
4.3 Fieldwork 11
4.3.1 General 11 4.3.2 Topographic Survey 12
4.3.2.1 General 12 4.3.2.2 Equipment 12 4.3.2.3 Resources 13 4.3.2.4 The Survey 13
4.3.2.4.1 Datum and Map Projection 13 4.3.2.4.2 Benchmark Construction and DGPS Survey 13 4.3.2.4.3 Stake Out 14 4.3.2.4.4 Traverse Survey 14 4.3.2.4.5 Topographic Survey 15 4.3.2.4.6 Flood Monitoring Survey 15 4.3.2.4.7 Bathymetric Survey 16
4.3.2.5 Data Processing and Drawing 16 4.3.3 Engineering Geological Mapping 17
4.3.4 Positioning and Levelling 17 4.3.5 Geotechnical Investigation 17 4.3.6 Geophysical Investigation 24
4.4 Laboratory Testing 29 4.5 Reporting 30 4.6 Quality Control 30
4.6.1 Survey Services 30 4.6.2 Geotechnical Services and Laboratory Testing 31 4.6.3 Documentation 32
4.7 Health Safety and Environmental Program 32
4.7.1 General Safety 32 4.7.2 Safety in Excavation Pit Test 33
PT. Geoindo Geotechnical Investigation – Banyu Urip Field, Cepu Block
MC / 001 / 02 / Rep. 1 – Final Geotechnical Report - 16/09/02
4.7.3 Safety in Drilling Area 34 4.7.4 Safety for Seismic Work 34 4.7.5 Environmental Management 35
4.8 Permits, Permissions and Land Compensation 35
5. GROUND CONDITIONS 36
5.1 General 36 5.2 Ground Conditions 37
5.2.1 Water Intake Structure 37 5.2.2 Reservoir, Airstrip and Open Area 39 5.2.3 Central Processing facility and Pad D 40 5.2.4 Pad B, C and Pad F 43 5.2.5 Export Pipeline Shoreline Facility 45 5.2.6 Bengawan Solo River Crossing 46 5.2.7 Export Pipeline Route 46
5.2.7.1 Section Banyuurip to Rengel 47 5.2.7.2 Section Rengel to Pucangan 47 5.2.7.3 Section Pucangan to Export Pipeline
Shoreline Facility 48
5.3 Faulting 48 6. GEOTECHNICAL ENGINEERING ASSESSMENT 49 6.1 Site Characterisation 49
6.1.1 Siting of the Development 50 6.1.2 Ground Model 51 6.1.3 Geotechnical Design Parameters 54 6.2 Geotechnical Hazards 54
6.2.1 Seismic 54 6.2.1.1 Seismicity 54 6.2.1.2 Liquefaction 57 6.2.1.3 Faulting and Ground Rupture 57 6.2.1.4 Seismic Compaction and Settlement 58 6.2.1.5 Seismic Shaking 59
6.2.2 Natural Slope Instability and Landslides 59 6.2.3 Flooding 59 6.2.4 Regional Subsidence 60 6.2.5 Expansive and Collapsible Soils 61
PT. Geoindo Geotechnical Investigation – Banyu Urip Field, Cepu Block
MC / 001 / 02 / Rep. 1 – Final Geotechnical Report - 16/09/02
6.3 Earthworks and Site Preparation 62 6.3.1 General 62 6.3.2 Site Preparation 64 6.3.3 Excavation 64 6.3.4 Soil Classification and Fill Suitability 65 6.3.5 Fill 67
6.3.5.1 Placement and Compaction 67 6.3.5.2 Treatment 70 6.3.5.3 Shrinkage and Bulking 71 6.3.5.4 Traffickability 71 6.3.5.5 Fill Slopes 71 6.3.5.6 Drainage 72 6.3.5.7 Over Excavation / Engineered Fill 73 6.3.5.8 Surface Erosion 73
6.3.6 Soil Improvement 73
6.3.6.1 General 73 6.3.6.2 Geotextiles 73 6.3.6.3 Geogrids 74 6.3.6.4 Soil Stabilitation 74
6.3.7 Construction Control and Testing 74
6.4 Cuttings Slopes 75 6.5 Foundations 75
6.5.1 General 75 6.5.2 Shallow Foundations 75
6.5.2.1 Foundation Type 75 6.5.2.2 Bearing Capacity and Allowable
Bearing Pressures 76 6.5.2.3 Settlements 77
6.5.3 Deep Foundations 78
6.5.3.1 General 78 6.5.3.2 Vertical Capacity 79 6.5.3.3 Settlement - Single Pile 80 6.5.3.4 Lateral Load Capacity 80 6.5.3.5 Uplift Capacity 80 6.5.3.6 Pile Driving and Installation 80 6.5.3.7 Vibratory Loads 81 6.5.3.8 Short Term and Transient Loads 81 6.5.3.9 Pile Testing 82
PT. Geoindo Geotechnical Investigation – Banyu Urip Field, Cepu Block
MC / 001 / 02 / Rep. 1 – Final Geotechnical Report - 16/09/02
6.5.4 Soil Coefficients 84 6.5.4.1 General 84 6.5.4.2 Active Earth Pressure 84 6.5.4.3 Passive Earth Pressure 84 6.5.4.4 Factors of Safety 85
6.5.5 Modulus of Subgrade Reaction 85 6.5.5.1 Size Adjustment 85 6.5.5.2 Vertical Modulus of Subgrade Reaction kv 85 6.5.5.3 Horizontal Modulus of Subgrade Reaction kh 86
6.5.6 Dynamic Loads 87 6.5.6.1 General-Seismic and Vibratory Equipment 87 6.5.6.2 Compressive and Shear Wave Velocity 87 6.5.6.3 Dynamic Modulus of Elasticity 88 6.5.6.4 Dynamic Shear Modulus 88 6.5.6.5 Poisson’s Ratio 88
6.6 Groundwater and Surface Water 88
6.6.1 General 88 6.6.2 Groundwater 89 6.6.3 Surface Water 90 6.6.4 Seasonal Variations 90
6.7 Soil and Groundwater Corrosivity 91
6.7.1 General 91 6.7.2 Soil and Ground Chemistry 91 6.7.3 Corrosion 91 6.7.4 Soil Resistivity and Corrosion Control 94 6.7.5 Cement Type 95
6.8 Road, Airstrip, Parking and Hardstanding 95
6.9 Rail Road Subgrade 95
6.9.1 General 95 6.9.2 Site Preparation 95 6.9.3 Subgrade 96 6.9.4 Ballast 96 6.9.5 Embankment to Avoid Flooding 96
7. CONCLUSIONS AND RECOMMENDATIONS
FOR FURTHER WORK 96
PT. Geoindo Geotechnical Investigation – Banyu Urip Field, Cepu Block
MC / 001 / 02 / Rep. 1 – Final Geotechnical Report - 16/09/02
LIST OF TABLES 3.1 Regional Geomorphology 3.2 Regional Stratigraphy 4.1 List of Coordinates 4.2 Flood Level Survey 4.3 Geotechnical Investigation 5.1.A Ground Conditions ( Banyu Urip Area ) 5.1.B Ground Conditions ( Rengel - Ngimbang ) 5.1.C Ground Condition ( Tuban Shoreline ) 5.2 Summary of Material Properties 5.3 Earthwork Properties 5.4.A Summary of Insitu Permeability Test Results 5.4.B Summary of Laboratory Permeability Test results 6.1 Engineering Design Parameters 6.2 Allowable Bearing Pressures 6.3 Settlement - Single Pile 6.4 Reservoir Earthwork Quantity 6.5 Chemical Tests LIST OF FIGURES 4. Seismic Zone of Indonesia 5. Ground Models 6. Natural Moisture Content and Atterberg Limits 6.A Natural Moisture Content and Atterberg Limits - TOPSOIL 6.B Natural Moisture Content and Atterberg Limits - ALLCLAY1 6.C Natural Moisture Content and Atterberg Limits - ALLCLAY2 6.D Natural Moisture Content and Atterberg Limits - LiCLAY1 6.E Natural Moisture Content and Atterberg Limits - LiCLAY2 6.F Natural Moisture Content and Atterberg Limits - RTCLAY1 6.G Natural Moisture Content and Atterberg Limits - RTCLAY2 7. Plasticity Chart 8A. Bulk Density ( All Stratum ) 8.A.1 Bulk Density ( ALLCLAY ) 8.A.2 Bulk Density ( ALLCLAY2 ) 8.A.3 Bulk Density ( ALLSAND ) 8.A.4 Bulk Density ( LiCLAY1) 8.A.5 Bulk Density ( LiCLAY1D ) 8.A.6 Bulk Density ( LiCLAY2) 8.A.7 Bulk Density ( LiCLAY2D ) 8.A.8 Bulk Density ( LiCLAY3 ) 8.A.9 Bulk Density ( LiCLAY3D ) 8.A.10 Bulk Density ( RTCLAY1 ) 8.A.11 Bulk Density ( RTCLAY2 ) 8.A.12 Bulk Density ( PaCORAL ) 8.A.13 Bulk Density ( KuCLAY )
PT. Geoindo Geotechnical Investigation – Banyu Urip Field, Cepu Block
MC / 001 / 02 / Rep. 1 – Final Geotechnical Report - 16/09/02
8B. Dry Density ( All Stratum ) 8.B.1 Dry Density ( ALLCLAY1 ) 8.B.2 Dry Density ( ALLCLAY2 ) 8.B.3 Dry Density ( ALLSAND ) 8.B.4 Dry Density ( LiCLAY1 ) 8.B.5 Dry Density ( LiCLAY1D ) 8.B.6 Dry Density ( LiCLAY2 ) 8.B.7 Dry Density ( LiCLAY2D ) 8.B.8 Dry Density ( LiCLAY3 ) 8.B.9 Dry Density ( LiCLAY3D ) 8.B.10 Dry Density ( RTCLAY1) 8.B.11 Dry Density ( RTCLAY2) 8.B.12 Dry Density ( DACORAL) 8.B.13 Dry Density ( KuCLAY ) 9.A Chemical Test Results vs. Depth 9.B Chemical Test Results vs. Reduced Level 10.A Insitu Permeability Test 10.B Laboratory Permeability Test 11.A SPT N-Value ( All Stratum ) 11.B SPT N-Value ( TOPSOIL) 11.C SPT N-Value ( ALLCLAY1 ) 11.D SPT N-Value ( ALLCLAY2 ) 11.E SPT N-Value ( ALLSAND ) 11.F SPT N-Value ( LiCLAY1 ) 11.G SPT N-Value ( LiCLAY1D ) 11.H SPT N-Value ( LiCLAY2 ) 11.I SPT N-Value ( LiCLAY2D ) 11.J SPT N-Value ( LiCLAY3 ) 11.K SPT N-Value ( LiCLAY3D ) 11.L SPT N-Value ( RTCLAY1) 11.M SPT N-Value ( RTCLAY2) 11.N SPT N-Value ( RTSAND ) 11.O SPT N-Value ( FILL ) 11.P SPT N-Value ( PaCORAL) 11.Q SPT N-Value ( PaLIMESTONE ) 11.R SPT N-Value ( PaCLAY ) 11.S SPT N-Value ( KuCLAY) 12.A Undrained Shear Strength - All Stratum 12.B Undrained Shear Strength - TOPSOIL 12.C Undrained Shear Strength - ALLCLAY1 12.D Undrained Shear Strength - ALLCLAY2 12.E Undrained Shear Strength - LiCLAY 1 12.F Undrained Shear Strength - LiCLAY 1D 12.G Undrained Shear Strength - LiCLAY 2 12.H Undrained Shear Strength - LiCLAY 2D 12.I Undrained Shear Strength - LiCLAY 3 12.J Undrained Shear Strength - LiCLAY 3D
PT. Geoindo Geotechnical Investigation – Banyu Urip Field, Cepu Block
MC / 001 / 02 / Rep. 1 – Final Geotechnical Report - 16/09/02
12.K Undrained Shear Strength - RTCLAY1 12.L Undrained Shear Strength - RTCLAY2 12.M Undrained Shear Strength - FILL 12.N Undrained Shear Strength - PaLIMESTONE 12.O Undrained Shear Strength - KuCLAY 13.A Coefficient of Volume Compressibility - All Stratum 13.A.1 Coefficient of Volume Compressibility - TOPSOIL 13.A.2 Coefficient of Volume Compressibility - ALLCLAY1 13.A.3 Coefficient of Volume Compressibility - ALLCLAY2 13.A.4 Coefficient of Volume Compressibility - LiCLAY 1 13.A.4 Coefficient of Volume Compressibility - LiCLAY 1D 13.A.6 Coefficient of Volume Compressibility - LiCLAY 2 13.A.7 Coefficient of Volume Compressibility - LiCLAY 3 13.A.8 Coefficient of Volume Compressibility - LiCLAY 3D 13.A.9 Coefficient of Volume Compressibility - RTCLAY1 13.A.10 Coefficient of Volume Compressibility - RTCLAY2 13.A.11 Coefficient of Volume Compressibility - RTSAND 13.A.12 Coefficient of Volume Compressibility - FILL 13.A.13 Coefficient of Volume Compressibility - PaLIMESTONE 13.A.14 Coefficient of Volume Compressibility - KuCLAY 13.B Static Drained Static Modulus - All Stratum 13.B.1 Static Drained Static Modulus - TOPSOIL 13.B.2 Static Drained Static Modulus - ALLCLAY1 13.B.3 Static Drained Static Modulus - ALLCLAY2 13.B.4 Static Drained Static Modulus - ALLSAND 13.B.5 Static Drained Static Modulus - LiCLAY1 13.B.6 Static Drained Static Modulus - LiCLAY1D 13.B.7 Static Drained Static Modulus - LiCLAY2 13.B.8 Static Drained Static Modulus - LiCLAY2D 13.B.9 Static Drained Static Modulus - LiCLAY3 13.B.10 Static Drained Static Modulus - LiCLAY3D 13.B.11 Static Drained Static Modulus - RTCLAY1 13.B.12 Static Drained Static Modulus - RTCLAY2 13.B.13 Static Drained Static Modulus - RTSAND 13.B.14 Static Drained Static Modulus - FILL 13.B.15 Static Drained Static Modulus - PaCORAL 13.B.16 Static Drained Static Modulus - PaLIMESTONE 13.B.17 Static Drained Static Modulus - KuCLAY 14.A Shear Box Tests ( TOPSOIL - ALLCLAY1 ) 14.B Shear Box Tests ( ALLCLAY2 - RTCLAY1 ) 15.A.1 Triaxial CU Tests RTCLAY and RTCLAY2 ( Total ) 15.A.2 Triaxial CU Tests RTCLAY and RTCLAY2 ( Effective ) 16.A.1 Standard Combined Compaction - AllCLAY1 16.A.2 Standard Combined Compaction - RTCLAY1 16.B.1 Modified Combined Compaction - AllCLAY1 16.B.2 Modified Combined Compaction - RTCLAY1 16.C.1 Lime Stabilisation vs Undrained Shear Strength 16.C.2 Lime Stabilisation vs CBR
PT. Geoindo Geotechnical Investigation – Banyu Urip Field, Cepu Block
MC / 001 / 02 / Rep. 1 – Final Geotechnical Report - 16/09/02
17. Predicted Settlement - Fill Platform at Reservoir Area 18. Rate of Settlement - Lightly Loaded Structures 19.A Rate of Settlement - Raft Foundation for Pad B, Pad C, Pad D & CPF Area 19.B Rate of Settlement - Raft Foundation for Pad F 19.C Rate of Settlement - Raft Foundation for Open Area, Airstrip, Water Intake 19.D Rate of Settlement - Raft Foundation for Reservoir 19.E Rate of Settlement - Raft Foundation for Pipeline Route 19.F Settlement - Raft Foundation 19.G Settlement - Raft Foundation 20.A Predicted Effect of Settlement to Nearby to Shallow Pad Found - Pad B,
Pad C, CPF, Pad F 20.B Predicted Effect of Settlement to Nearby to Shallow Pad Found - CPF
Fracture zone, Open Area, Airstrip, Water Intake 20.C Predicted Effect of Settlement to Nearby to Shallow Pad Found - Reservoir,
Pipeline 21.A Predicted Effect of Settlement to Nearby - Raft Foundation Pad B, Pad C,
CPF, Pad F 21.B Predicted Effect of Settlement to Nearby - Raft Foundation CPF Fracture
zone, Open Area, Airstrip, Water Intake 21.C Predicted Effect of Settlement to Nearby - Raft Foundation Reservoir,
Pipeline 22.A Ultimate Vertical Pile Capacity - Pad B, Pad C 22.B Ultimate Vertical Pile Capacity - Pad F 22.C Ultimate Vertical Pile Capacity - Pad D 22.D Ultimate Vertical Pile Capacity - CPF No Fracture 22.E Ultimate Vertical Pile Capacity - CPF Fracture Zone 22.F Ultimate Vertical Pile Capacity - Open Area 22.G Ultimate Vertical Pile Capacity - Airstrip 22.H Ultimate Vertical Pile Capacity - Reservoir 22.I Ultimate Vertical Pile Capacity - Water Intake 22.J Ultimate Vertical Pile Capacity - Pipeline Route 23.A Pile Lateral Capacity - Pad B And Pad C 23.B Pile Lateral Capacity - Pad B 23.C Pile Lateral Capacity - Pad F 23.D Pile Lateral Capacity - CPF 23.E Pile Lateral Capacity - Open Area 23.F Pile Lateral Capacity - Airstrip 23.G Pile Lateral Capacity - Reservoir 23.H Pile Lateral Capacity - Water Intake 23.I Pile Lateral Capacity - CPF Fracture Zone 23.J Pile Lateral Capacity - Pipeline Route 24. Reservoir Earthwork Quantities
PT. Geoindo Geotechnical Investigation – Banyu Urip Field, Cepu Block
MC / 001 / 02 / Rep. 1 – Final Geotechnical Report - 16/09/02
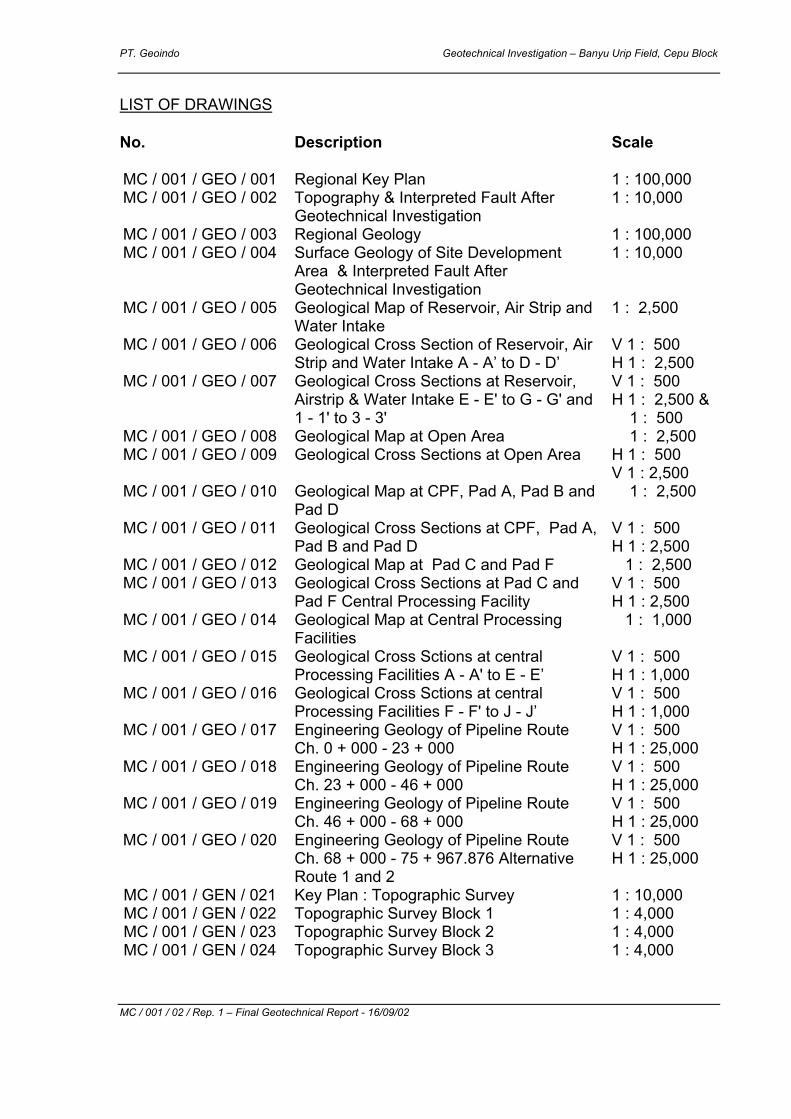
LIST OF DRAWINGS No. Description Scale
MC / 001 / GEO / 001 Regional Key Plan 1 : 100,000 MC / 001 / GEO / 002 Topography & Interpreted Fault After
Geotechnical Investigation 1 : 10,000
MC / 001 / GEO / 003 Regional Geology 1 : 100,000 MC / 001 / GEO / 004 Surface Geology of Site Development
Area & Interpreted Fault After Geotechnical Investigation
1 : 10,000
MC / 001 / GEO / 005 Geological Map of Reservoir, Air Strip and Water Intake
1 : 2,500
MC / 001 / GEO / 006 Geological Cross Section of Reservoir, Air Strip and Water Intake A - A’ to D - D’
V 1 : 500 H 1 : 2,500
MC / 001 / GEO / 007 Geological Cross Sections at Reservoir, Airstrip & Water Intake E - E' to G - G' and 1 - 1' to 3 - 3'
V 1 : 500 H 1 : 2,500 & 1 : 500
MC / 001 / GEO / 008 Geological Map at Open Area 1 : 2,500 MC / 001 / GEO / 009 Geological Cross Sections at Open Area H 1 : 500
V 1 : 2,500 MC / 001 / GEO / 010 Geological Map at CPF, Pad A, Pad B and
Pad D 1 : 2,500
MC / 001 / GEO / 011 Geological Cross Sections at CPF, Pad A, Pad B and Pad D
V 1 : 500 H 1 : 2,500
MC / 001 / GEO / 012 Geological Map at Pad C and Pad F 1 : 2,500 MC / 001 / GEO / 013 Geological Cross Sections at Pad C and
Pad F Central Processing Facility V 1 : 500 H 1 : 2,500
MC / 001 / GEO / 014 Geological Map at Central Processing Facilities
1 : 1,000
MC / 001 / GEO / 015 Geological Cross Sctions at central Processing Facilities A - A' to E - E’
V 1 : 500 H 1 : 1,000
MC / 001 / GEO / 016 Geological Cross Sctions at central Processing Facilities F - F' to J - J’
V 1 : 500 H 1 : 1,000
MC / 001 / GEO / 017 Engineering Geology of Pipeline Route Ch. 0 + 000 - 23 + 000
V 1 : 500 H 1 : 25,000
MC / 001 / GEO / 018 Engineering Geology of Pipeline Route Ch. 23 + 000 - 46 + 000
V 1 : 500 H 1 : 25,000
MC / 001 / GEO / 019 Engineering Geology of Pipeline Route Ch. 46 + 000 - 68 + 000
V 1 : 500 H 1 : 25,000
MC / 001 / GEO / 020 Engineering Geology of Pipeline Route Ch. 68 + 000 - 75 + 967.876 Alternative Route 1 and 2
V 1 : 500 H 1 : 25,000
MC / 001 / GEN / 021 Key Plan : Topographic Survey 1 : 10,000 MC / 001 / GEN / 022 Topographic Survey Block 1 1 : 4,000 MC / 001 / GEN / 023 Topographic Survey Block 2 1 : 4,000 MC / 001 / GEN / 024 Topographic Survey Block 3 1 : 4,000
PT. Geoindo Geotechnical Investigation – Banyu Urip Field, Cepu Block
MC / 001 / 02 / Rep. 1 – Final Geotechnical Report - 16/09/02
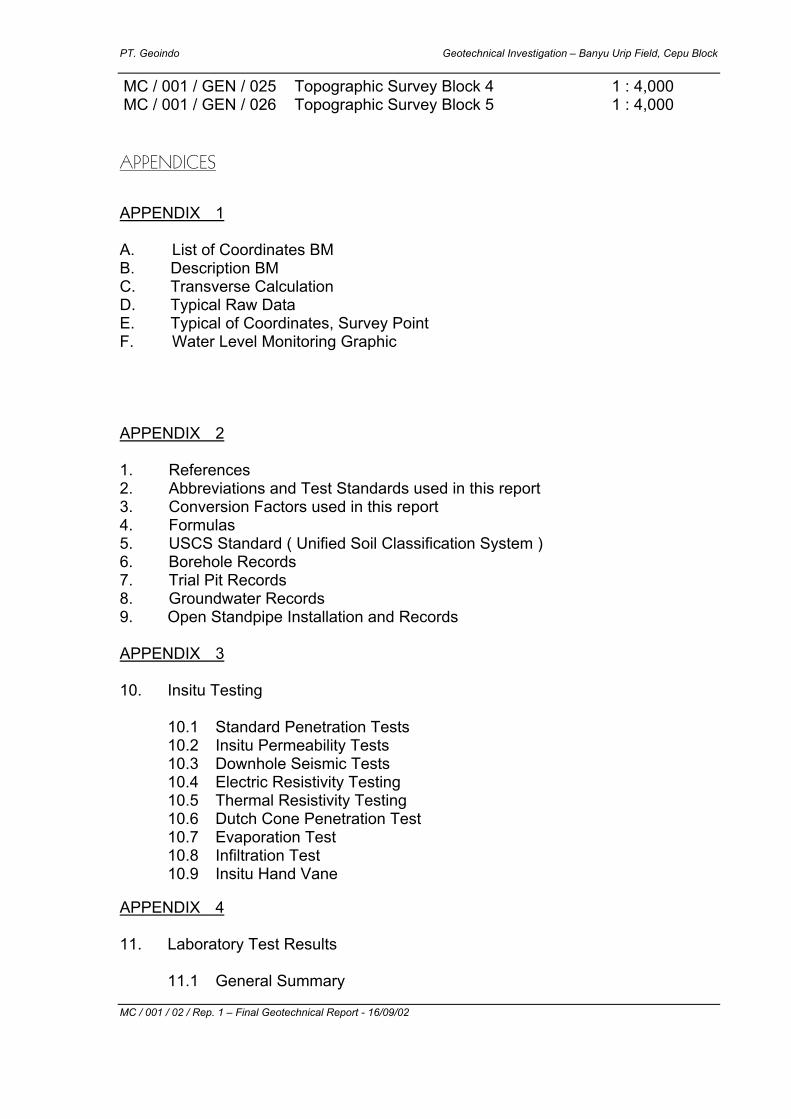
MC / 001 / GEN / 025 Topographic Survey Block 4 1 : 4,000 MC / 001 / GEN / 026 Topographic Survey Block 5 1 : 4,000
APPENDICES APPENDIX 1 A. List of Coordinates BM B. Description BM C. Transverse Calculation D. Typical Raw Data E. Typical of Coordinates, Survey Point F. Water Level Monitoring Graphic APPENDIX 2 1. References 2. Abbreviations and Test Standards used in this report 3. Conversion Factors used in this report 4. Formulas 5. USCS Standard ( Unified Soil Classification System ) 6. Borehole Records 7. Trial Pit Records 8. Groundwater Records 9. Open Standpipe Installation and Records APPENDIX 3 10. Insitu Testing
10.1 Standard Penetration Tests 10.2 Insitu Permeability Tests 10.3 Downhole Seismic Tests 10.4 Electric Resistivity Testing 10.5 Thermal Resistivity Testing 10.6 Dutch Cone Penetration Test 10.7 Evaporation Test 10.8 Infiltration Test 10.9 Insitu Hand Vane
APPENDIX 4 11. Laboratory Test Results
11.1 General Summary
PT. Geoindo Geotechnical Investigation – Banyu Urip Field, Cepu Block
MC / 001 / 02 / Rep. 1 – Final Geotechnical Report - 16/09/02
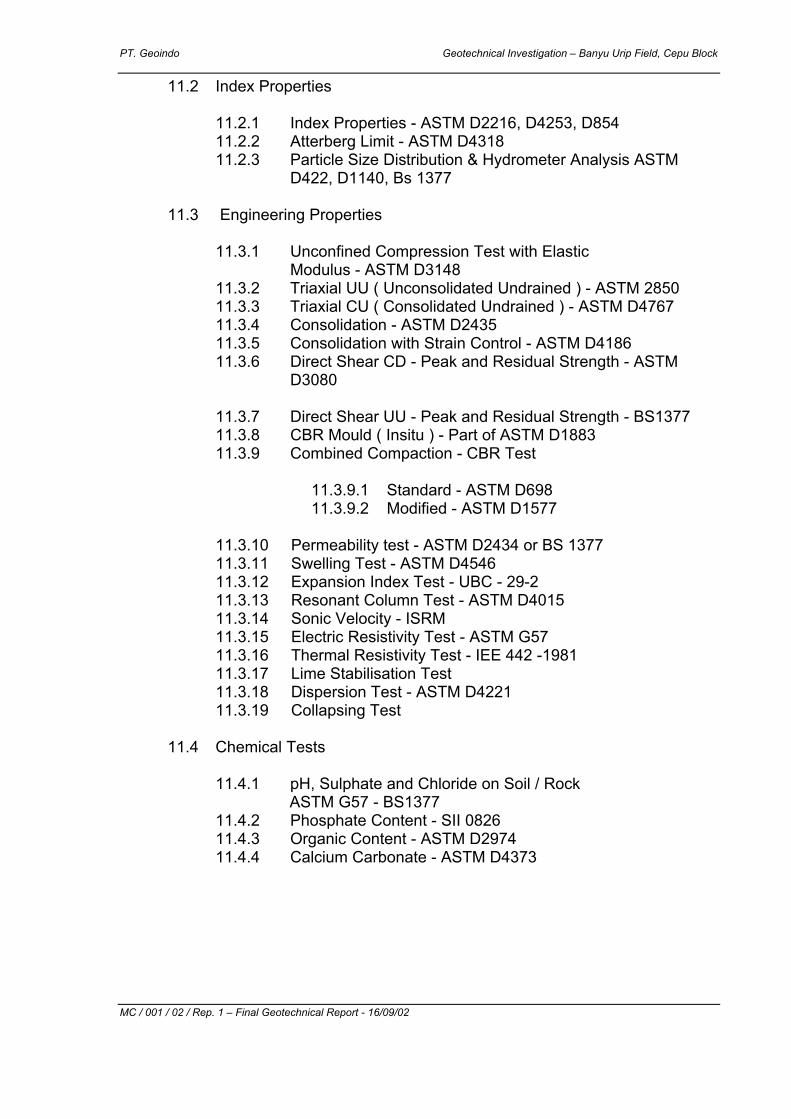
11.2 Index Properties
11.2.1 Index Properties - ASTM D2216, D4253, D854 11.2.2 Atterberg Limit - ASTM D4318 11.2.3 Particle Size Distribution & Hydrometer Analysis ASTM
D422, D1140, Bs 1377
11.3 Engineering Properties
11.3.1 Unconfined Compression Test with Elastic Modulus - ASTM D3148
11.3.2 Triaxial UU ( Unconsolidated Undrained ) - ASTM 2850 11.3.3 Triaxial CU ( Consolidated Undrained ) - ASTM D4767 11.3.4 Consolidation - ASTM D2435 11.3.5 Consolidation with Strain Control - ASTM D4186 11.3.6 Direct Shear CD - Peak and Residual Strength - ASTM
D3080
11.3.7 Direct Shear UU - Peak and Residual Strength - BS1377 11.3.8 CBR Mould ( Insitu ) - Part of ASTM D1883 11.3.9 Combined Compaction - CBR Test
11.3.9.1 Standard - ASTM D698 11.3.9.2 Modified - ASTM D1577
11.3.10 Permeability test - ASTM D2434 or BS 1377 11.3.11 Swelling Test - ASTM D4546 11.3.12 Expansion Index Test - UBC - 29-2 11.3.13 Resonant Column Test - ASTM D4015 11.3.14 Sonic Velocity - ISRM 11.3.15 Electric Resistivity Test - ASTM G57 11.3.16 Thermal Resistivity Test - IEE 442 -1981 11.3.17 Lime Stabilisation Test 11.3.18 Dispersion Test - ASTM D4221 11.3.19 Collapsing Test
11.4 Chemical Tests
11.4.1 pH, Sulphate and Chloride on Soil / Rock ASTM G57 - BS1377
11.4.2 Phosphate Content - SII 0826 11.4.3 Organic Content - ASTM D2974 11.4.4 Calcium Carbonate - ASTM D4373
EXECUTIVE SUMMARY
Mobil Cepu Ltd. ( MCL ) commissioned PT. Geoindo in December 2001 to carry out a geotechnical and topographic survey for their planned oilfield development at Banyu Urip near Cepu, East Java. The development at Banyu Urip will consist of a central Processing Facility ( CPF ), Pads A to F, reservoir, open area and airstrip, water intake structure and other associated facilities / infrastructure. The development will be connected to a shorebased metering station near Tuban by a 79 km pipeline from where the product will then be piped offshore for export. PT. Geoindo carried out a geotechnical and topographic survey between January and April 2002 in order to provide adequate survey and geotechnical information to enable preliminary engineering design by the FEED consultant and to provide EPC contractors information for tender purposes. The geotechnical and topographic survey consisted of a brief desk study review, topographic survey of Banyu Urip development area / water intake only, engineering geological mapping, boreholes ( including overwater boreholes in Bengawan Solo River ) and trial pits with sampling, insitu ( including downhole seismic and electric / thermal resistivity testing ) and laboratory testing. Data evaluation was subsequently carried out together with interpretation, analysis, engineering assessment and reporting. The Banyu Urip area consists of : ◊ Flat flood plain adjacent the Bengawan Solo River at elevation + 20 - 25 m
asl. The floodplain is prone to flooding every year up to levels + 23.0 m asl. ◊ NW-SE trending ridges at elevation + 35 - 50 m asl. ◊ NW-SE trending valleys at elevation + 25 - 35 m asl as part of a NW-SE
trending ridge - valley system. The floodplain is underlain by alluvial clays and basal sand layer which overlies the stiff clays of Lidah Formation. The ridges are underlain by dark grey / blackish and yellow coloured River Terrace clay deposits underlain by a relatively thin sandstone / sand layer which overlies stiff to hard blue and green grey clays of the Lidah Formation.
The valleys are underlain by River Terrace clay deposits sitting directly onto the Lidah clays with no sandstone / sand layer. Groundwater which is found to the depths of investigation is shallow perched water table of limited capacity. Beach or shallow marine deposits consisting of silts, sand and corals with variable composition were encountered at Tuban metering station. These were underlain by limestone and stiff clays. Groundwater at this location is high, almost at ground level. No topographic survey was undertaken at Tuban or along pipeline route. Geotechnical investigation along pipeline was limited to pipeline corrosion testing and major pipeline crossings beneath Bengawan Solo river, rail way and road crossings. Material properties for each stratum have been obtained from insitu and laboratory testing in order to produce preliminary geotechnical engineering design parameters. A geotechnical engineering assessment has been carried out suitable for preliminary engineering design purposes and is discussed in Section 6 of this report. The geotechnical assessment covers site characterization including CPF platform siting, geotechnical hazards, seismicity and faulting, earthworks, slope stability, foundations, roads / airport / railway, corrosion and chemical attack, groundwater and surface water considerations. The main issues arising are that : ◊ Banyu Urip site is possibly from a study of surface topography affected by
NW-SE, E-W trending faults. ◊ CPF location is possibly affected by faulting with a 100 - 200 m wide fault
zone. ◊ Massive earthworks will be involved for construction of reservoir, airstrip and
open area. ◊ Excavation will generate large amount of poor quality bulk fill which will
require “capping layer” and / or soil improvement such as stabilization by quicklime.
Geotechnical problems and considerations have been identified and discussed. Shallow foundations may be possible on alluvial clays, river terrace clays and fill for lightly loaded structures with applied bearing pressures of 50 - 75 kN / m 2 for strips and pads. Raft foundations could also be considered. Sands at Tuban may be prone to liquefaction. More detailed geotechnical analysis and design will be required at detailed design stage prior to or at start of the EPC contract. Exxon Mobil has determined from a study of their 3D and 2D seismic Data that subsurface a fault does run through Pad D in an E W orientation but has assessed from its own 3D seismic data that the fault is a very slow moving gravitational fault rather than a tectonic type fault, and that its presence will have no impact on construction seismic design considerations.
PT. Geoindo Geotechnical Survey - Banyu Urip Field, Cepu Block
MC / 001 / 02 / Rep.1. - Final Geotechnical and Topographic Survey Report - 16/09/02 1
MOBIL CEPU LIMITED
BANYU URIP FIELD DEVELOPMENT PROJECT
CONTRACT NO. C-3010630
CEPU BLOCK EAST JAVA, INDONESIA
GEOTECHNICAL AND TOPOGRAPHICAL SURVEY
FACTUAL AND INTERPRETATIVE REPORT 1. INTRODUCTION 1.1 Introduction and Terms of Reference
Mobil Cepu Ltd. ( MCL ) intend to start construction in 2002 of a new pipeline and facilities as part of the development of their oilfield concession at Banyu Urip, near Cepu, East Java ( see Drawing No. MC / 001 / GEO / 001 ). MCL commissioned PT. Geoindo at end of December 2001 to carry out the geotechnical investigation and topographic survey that will provide surface / subsurface information on the ground conditions and geotechnical recommendations for detailed engineering design purposes. See Drawings MC / 001 / GEO / 002 and 003 for location of current geotechnical investigation points ( Geoindo 2002 - colour : red, blue and green ) as well as previous investigations at or close to the site ( Golders 1999 - colour : purple ).
PT. Geoindo Geotechnical Survey - Banyu Urip Field, Cepu Block
MC / 001 / 02 / Rep.1. - Final Geotechnical and Topographic Survey Report - 16/09/02 2
The current topographic survey and geotechnical investigation fieldwork started on 7th January 2002 after preparation, mobilization and setup of base camps. The fieldwork was carried out between January and March 2002 with laboratory testing and draft reporting completed by mid April 2002 with the final report completed in early July 2002. The topographic survey and geotechnical investigation consisted of brief desk study review, topographic survey of development site and adjacent water intake area, a soils investigation with boreholes and trial pits, including insitu and laboratory testing, groundwater monitoring factual and interpretative report with data evaluation and engineering assessment. This geotechnical report describes the topographic survey and geotechnical investigation, summarises the findings and provides geotechnical recommendations for engineering design of the proposed development. During the course of the fieldwork, PT. Geoindo prepared and submitted a report in two stages which summarized the interpretation of the crude borelog washhole records of the 3D seismic shotholes carried out by El Nusa in 2001 / 2002 as part of 3D seismic survey of the concession. The report ( Report on 3D Seismic Shothole Interpretation - Preliminary Geotechnical Information Rev. 1 No. Ref. MC / 002 / 02 / Rep. 2 dated 06/02/02 ) provided a preliminary geological model with possible faulting identified together with preliminary geotechnical information.
However, Mobil Cepu LTD has since advised that ELNUSA logging of shothole boreholes was of an informal nature and the logging was not supervised and according to MCL the shothole data is unreliable and should not be used in geological interpretation work, in particular geological structure interpretation. However, in the absence of the information that is now available from this investigation the shothole data was considered by Geoindo to be useful prior to the geotechnical investigation fieldwork in providing a first stage general impression of near surface geology if it was correlated with existing and future geotechnical boreholes. In addition it raised areas of special interest with respect to the geotechnical investigation that were looked at in more detail in this investigation.
However, in view of MCL doubts on data reliability it was not considered to be reliable enough for geological interpretation to the
PT. Geoindo Geotechnical Survey - Banyu Urip Field, Cepu Block
MC / 001 / 02 / Rep.1. - Final Geotechnical and Topographic Survey Report - 16/09/02 3
level required for detailed engineering design, in particular that related to geological structure and possible faulting. Therefore, in view of this the shothole data was not used in the interpretation of geological structure other than to backup what was actually found in this current investigation.
1.2 Structure of Report
This report consists of 12 volumes and a Drawing Folio as follows :
◊ Volume 1 : Text, Tables and Figures ◊ Volume 2 to Volume 12 : Appendices 1 to 4 ◊ Folio of Drawings
The report text in Volume 1 consists of 7 sections : Section 1 presents a general introduction and background to the topographic and geotechnical surveys. Section 2 briefly describes the proposed development. A general description of the topography, geomorphology, geology, surface drainage and hydrogeology are given in Section 3. Section 4 describes the work carried out for the topographic and geotechnical survey by PT. Geoindo. Section 5 describes the ground and groundwater conditions encountered together with a summary of material properties derived from insitu and laboratory testing. The geotechnical engineering assessment is presented in Section 6 and includes a discussion of site characterization, geotechnical hazards ( including seismicity, faulting and flooding ), earthwork considerations, cuttings and natural slopes, foundations, groundwater and surface water issues, corrosivity, road / airport and rail road design considerations. All supporting tables and figures are also included in Volume 1. The factual data consisting of borehole / trial pit records, insitu and laboratory test results are presented in Appendix 1, 2, 3 and 4 respectively which are given in Volumes 2 to 12 of the report. A total of 12 No. volumes.
PT. Geoindo Geotechnical Survey - Banyu Urip Field, Cepu Block
MC / 001 / 02 / Rep.1. - Final Geotechnical and Topographic Survey Report - 16/09/02 4
The report should be read in conjunction with topographic map in Vol. 1 and the Folio of Drawings which presents maps, plans and geological cross-sections derived from the topographic and geotechnical survey.
1.3 Sources of Information
This report is based on the geotechnical and topographic survey carried out by PT. Geoindo in January to April 2002 supplemented by information provided by Mobil Cepu Ltd. Including proposed development layout plans, topographic maps, 3D seismic shothole information (ground level information only) as well as other background data given in discussions and meetings with MCL staff onsite and Jakarta. We have also made extensive use of our own observations and knowledge obtained during the course of the fieldwork at Cepu. Other sources of information were also consulted including our own database of geotechnical investigations in the area as well as various maps, reports, published and unpublished literature which are fully referenced in Appendix 1.
2. PROPOSED DEVELOPMENT
The new development will include :
◊ Well pads B - F ( 5 No. ). Pad A already exists. Pad E was not investigated as the CPF was moved to this location.
◊ Central Processing Facility ( CPF ) with oil storage tanks. ◊ Initial Processing Facility ( IPF ). ◊ Water Intake Structure at Bengawan Solo River to north of CPF. ◊ 79 kilometre 20” diameter ( OD ) export pipeline running from CPF
at Banyu Urip to Tuban. ◊ Shore based metering station at Tuban. ◊ Other facilities including reservoir, airstrip, basecamp, open area
and 2 No. flare stacks.
See Drawing No. MC / 001 / GEO / 002 - 003 for outline of proposed development.
PT. Geoindo Geotechnical Survey - Banyu Urip Field, Cepu Block
MC / 001 / 02 / Rep.1. - Final Geotechnical and Topographic Survey Report - 16/09/02 5
3. GENERAL SITE DESCRIPTION 3.1 General
The development site is located at : ◊ 9210000 N to 9204000 N ◊ 575000 E to 579000 E
covering an area some 6 km x 4 km in size. The site is located in East Java between Cepu and Bojonegoro to the west of Kalitidu ( See Drawing No. MC / 001 / GEO / 001 ). The area is mainly agricultural land with rice paddy cultivation on the flat river flood plain of the Bengawan Solo River which forms the north part of site and mixed agriculture on the undulating hills / ridges which form the south part of the site. The area is characterized by a typical tropical climate with a dry season ( April - October ) and wet / rainy season ( November - March ).
3.2 Topography and Geomorphology
The general topography and geomorphology of the area can be seen in Drawing MC / 001 / GEO / 002. The main Bojonegoro to Cepu road and railway run along the northern boundary of the site. The proposed reservoir, airstrip and basecamp / open area are located on the flat river flood plain of the Bengawan Solo river which flows eastwards in W - E direction 1 to 2 km to north. This area is flat at elevation 23 - 25 m asl, heavily cultivated by rice paddy cultivation and is prone to flooding every year.
To the south of the River Solo floodplain, the ground rises to a series of NW - SE trending ridges upto elevation 50 m asl and separated by 500 - 700 m wide, relatively flat bottomed, NW - SE trending valleys at about elevation 30 - 35 m asl. These valleys are occupied by NW flowing streams which flow northwards to the River Bengawan Solo.
PT. Geoindo Geotechnical Survey - Banyu Urip Field, Cepu Block
MC / 001 / 02 / Rep.1. - Final Geotechnical and Topographic Survey Report - 16/09/02 6
Well pads B - F, CPF and associated facilities straddle the NW - SE trending ridge and wide valley system to south of the flat floodplain. The local villages tend to be located on these ridges also.
3.3 Regional Geology and Hydrogeology
The regional geology taken from published geology maps ( Directorate of Geology ) is shown in Drawing No. MC / 001 / GEO / 003. The Regional Stratigraphy is summarized in Table 3.1 and Interpreted Ground Condition in Table 5.1A to C.
The interpreted geology from site walkover and this topographic / geotechnical survey is shown in Drawing No. MC / 001 / GEO / 005 with geological cross sections in Drawing No. MC / 001 / GEO / 006. The northern half of site is covered by river alluvial deposits consisting upto 15 m interbedded light-dark grey and brown silts / clays with lenses or layers of sands and thin gravels of Pleistocene / Holocene Age ( Quaternary ). The river alluvial deposits are underlain by Lidah Formation deposits. The southern half of the site is underlain by probable River Terrace Deposits ( Recent ) and Lidah Formation of Upper Pliocene to Upper Pleistocene ( Tertiary / Quaternary Age ). The River Terrace Deposits consist of dark grey and yellow clays upto 5 - 10 m thick which are underlain by a thin ( < 2 m thick ) sandstone layer. The underlying Lidah Formation consists of dark grey, blue and green clays / claystone with thin bands of sandstone and limestone less than few metres thick. Total thickness of deposits upto 300 - 400 m. The Lidah deposits are fossilferous and were deposited in a shallow marine basin with a gentle < 12 o dip to the north towards the centre of a sedimentation basin located approximately under the Bengawan Solo river. The site is located on the southern limb of the basin syncline. From published geological maps, no faulting is apparent at the site or in immediate vicinity. Nearest large fault is the E - W trending Ngrau Fault some 10 - 15 kms to the south. However, the current geotechnical investigation work, has indicated that faults might exist within the site.
PT. Geoindo Geotechnical Survey - Banyu Urip Field, Cepu Block
MC / 001 / 02 / Rep.1. - Final Geotechnical and Topographic Survey Report - 16/09/02 7
These possible dislocations or faults trend NW - SE or N - S and have been interpreted as a series of small scale normal faults with throws of 3 - 5 m which also appear to have influenced the existing topography resulting in fault defined valleys and steepened slopes at ridge / valley boundaries. These identified faults were of limited extent being apparent in some cross sections and disappearing or dying out in others. Furthermore, Exxon Mobil geologists undertook interpretation of previous 2D and 3D seismic survey data and identified an additional probably near surface fault trending E-W. The original location of the CPF was moved NW to take into account these probable faults / possible faults.
The location of these probable and possible faults is shown in Drawing No. MC / 001 / GEO / 004. Groundwater is generally < 1 - 2 m below ground level in the river alluvial deposits and probably fluctuates seasonally similar to the seasonal fluctuation of river level in the Bengawan Solo River which is 1 - 2 km to north of the site. Groundwater of limited quantity may be present in underlying sands as a perched water table. Groundwater is expected to be deep > 10 m in the low rolling ridges of the Lidah Formation.
3.4 Surface Drainage The site is bounded 1 - 2 km to the north by the eastward flowing Bengawan Solo River. This is a major river in East Java and river level fluctuates annually upto 10 - 15 m between wet and dry season. River level drops drastically during dry season with river flow slow. However, during the onset of wet / rainy season from October to December river level rises to maximum level between December to March and is faster flowing. The Bengawan Solo River is prone to flash flooding as well as general floods which affect large areas either side of the river, including the northern flat half of the site which is underlain by river alluvium.
PT. Geoindo Geotechnical Survey - Banyu Urip Field, Cepu Block
MC / 001 / 02 / Rep.1. - Final Geotechnical and Topographic Survey Report - 16/09/02 8
Flooding of 1 - 2 m is common. A recent flood alleviation scheme built in 1994 at Lamongan has reduced flood levels and length of flooding period, however flooding still occurs every year though not as severe as pre-1994 levels. The southern half of the site is on higher ground of the gentle rolling hill ridges and wide valleys formed on the Lidah Formation.
This area is dry except for the small stream of Kali Sudu which flows northwards to the Bengawan Solo river from Pad C / F area to north where it runs along west edge of proposed reservoir. The Kali Sudu divides into two tributary branches near Pads C / F called Kali Singkil and Kali Glonggong, which affect Pad C and F respectively. The stream of Kali Gandong flows north to Bengawan Solo River to west of development site.
4. DETAILED TOPOGRAPHIC SURVEY AND GEOTECHNICAL INVESTIGATION
4.1 General
The topographic survey and geotechnical investigation was carried out by PT. Geoindo between December 2001 and April 2002.
The work was divided into 4 main stages :
1. Desk Study and Preparation was carried out in December 2001
prior to start of fieldwork on 7th January 2002. 2. Fieldwork was carried out between 7th January and 15th April 2002
including additional 2 boreholes at the IPF area. Fieldwork consisted of topographic survey, geophysical survey ( thermal / electric resistivity and downhole seismic ), rotary cored boreholes and trial pits, insitu testing and sampling, dutch cone testing, groundwater monitoring and engineering geological mapping.
3. Laboratory Testing was carried out both onsite at our Cepu office and also at our head office in Bandung.
4. Reporting consisted of daily and weekly reports from site during the fieldwork. A Factual and Interpretative Report was subsequently produced which presented the results of the topographic survey and geotechnical investigation as well as summarized findings and geotechnical design recommendations.
PT. Geoindo Geotechnical Survey - Banyu Urip Field, Cepu Block
MC / 001 / 02 / Rep.1. - Final Geotechnical and Topographic Survey Report - 16/09/02 9
The various components of the topographic survey and geotechnical investigation are described below in the following sections of this report.
4.2 Desk Study and Preparation
4.2.1 Desk Study
All available geological, hydrogeological, geotechnical and other relevant data was reviewed at our office in Bandung prior to start of fieldwork. MCL provided : ◊ Previous soil investigation reports by Golders ( 1999 ) ◊ Site development layout including coordinates of all boreholes
required and pipeline route. ◊ Topographic mapping and IKONOS satellite imagery. ◊ 3D Seismic Shothole data ( Elnusa 2001 / 2002 ) ◊ Other information including fault interpretation from 2D / 3D
seismic surveys by MCL.
Background information was also obtained from various discussions and meetings held with MCL both onsite and Jakarta. Published and unpublished information was also consulted from National Coordinating Agency for Surveys and Mapping ( BAKOSURTANAL ) for topographic maps, Directorate of Geology ( GTL ), Geological Research and Development Center ( PPPG ) for geological, hydrogeological and geotechnical maps / data.
The information was combined, reviewed and assessed to obtain a better understanding of the geology and ground conditions of the area. During the course of the geotechnical investigation MCL went to tender for EPC civil construction works and required preliminary geotechnical information prior to completion of the fieldwork. A 3D seismic survey was undertaken by Elnusa for MCL in 2001 which included drilling of shotholes for the seismic survey. MCL commissioned PT. Geoindo at start of January 2002 to review and interpret the 3D seismic shothole data in order to produce a brief report with maps and cross sections that could be provided to third
PT. Geoindo Geotechnical Survey - Banyu Urip Field, Cepu Block
MC / 001 / 02 / Rep.1. - Final Geotechnical and Topographic Survey Report - 16/09/02 10
parties, including bidding EPC contractors, in the form of a preliminary geotechnical information package. A brief report was submitted to MCL on 13th January 2002 which included interpretation of seismic shothole data within the site development area. Subsequently, further interpretation was carried out on additional data made available by MCL and also for additional shothole data covering an extended area beyond the development site. A second revised report on Preliminary Geotechnical Information was issued on 6th February 2002 which included assessment of possible faulting at the site based on the shothole data. The information in this report was preliminary in nature and was expected to be treated with caution prior to the findings of the geotechnical investigation becoming available. The desk study work was subsequently updated, refined and revised when more complete and accurate data was made available from the current topographic survey and geotechnical investigation.
The findings from the desk study and fieldwork have been combined in this report to produce better understanding of the geology and geotechnical aspects at the site as summarized and discussed in the next sections of this report.
4.2.2 Preparation
Preparation prior to start of fieldwork included : ◊ Detailed investigation programme including work plan, resources,
equipment, methodology and preparation plans were submitted to MCL for approval in December 2001.
The work scope was different from that tendered and included : • Fieldwork during wet season and floods at the site instead of
as anticipated being carried out in dry season. • One CPF location instead of 3 No. as tendered. • Revised and amended Bill of Quantities adjusted for new work
scope. • Topographic survey.
PT. Geoindo Geotechnical Survey - Banyu Urip Field, Cepu Block
MC / 001 / 02 / Rep.1. - Final Geotechnical and Topographic Survey Report - 16/09/02 11
During the course of the fieldwork further changes to work scope were made by MCL including :
• CPF location moved to a new location. • Additional boreholes in IPF area • Additional boreholes along the pipe line alignment • Additional survey at water intake structure and adjacent river. • Additional laboratory testing including collapsing soil tests and
lime stabilization tests. • Provision of Preliminary Geotechnical Information based on
interpretation of recent 3D seismic shothole data. • Stoppage of work whilst MCL obtained permits / permission
from local government.
◊ HSE ( Health, Safety and Environmental ) programme and plan was submitted to MCL in December 2001 prior to fieldwork for approval.
◊ Resources were arranged and mobilized in December 2001 / start
of January 2002.
◊ Equipment was arranged, checked and mobilized in December 2001 / start of January 2002.
◊ Basecamp and site office were set up in December 2001 and
prepared. A soils testing laboratory was established at the site office.
◊ Space and facilities were made available to MCL supervising staff.
Communication links were established including phone, fax and email.
◊ Various visits were made to site in December 2002 prior to
fieldwork startup in order to put in place preparation work and establish basecamp / site office.
4.3 Fieldwork
4.3.1 General
The fieldwork consisted of topographic survey, engineering geological mapping, positioning and levelling of investigation points, geotechnical and geophysical investigation.
PT. Geoindo Geotechnical Survey - Banyu Urip Field, Cepu Block
MC / 001 / 02 / Rep.1. - Final Geotechnical and Topographic Survey Report - 16/09/02 12
The various components of the fieldwork are discussed in more detail in the following sections.
4.3.2 Topographic Survey 4.3.2.1 General
PT. Geoindo were commissioned by MCL to carry out a topographic survey for facilities development at Banyu Urip, Jambaran and Alastua field. The topographic survey work was carried out between 9 January 2002 to 14 March 2002 and consisted of : ♦ Setting out boreholes and other geotechnical investigation points. ♦ Construction of 12 benchmarks and tie in by DGPS survey to MCL
reference datums ♦ Traverse survey to tie in benchmarks ♦ Detail Topographic Survey 975 Ha ♦ Data processing and reporting All survey equipment used in this project was calibrated and calibration certificates for each equipment can be seen in Appendix 1.
The survey was intended to produce Detail Topographic maps of the project area at a scale of 1 : 4000 showing detail terrain condition, features, existing roads, drainage, ricefields, etc.
4.3.2.2 Equipment
Equipment used was : ♦ Three units Leica 300 series dual frequency of DGPS complete
with accessories. ♦ Four units of Leica TCA 1100 Total Station complete with
accessories. ♦ One unit of Ceeducer echosounder ♦ Two hand held Garmin DGPS. ♦ One note book computer Pentium III.
PT. Geoindo Geotechnical Survey - Banyu Urip Field, Cepu Block
MC / 001 / 02 / Rep.1. - Final Geotechnical and Topographic Survey Report - 16/09/02 13
4.3.2.3 Resources The field survey was carried out between 9th January 2002 and 10th March 2002 including stand by from 17th January 2002 until 7th February 2002 ( 19 days ), by three main teams and two additional teams. Each team consisted of one surveyor assisted by 1 assistant and 3 laborers. One chief surveyor as team leader coordinated the survey teams.
4.3.2.4 The Survey
The survey was carried out in 38 days.
4.3.2.4.1 Datum and Map Projection.
The reference datum, projection and geodetic parameters used for the survey are summarised below. The reference datums used for the survey were existing MCL benchmarks CPF 01, CPF 02, CPF 03, CPF 04, CPF 05, CPF 06, CPF 07, CPF 08 which were spread throughout the survey area. Datum projection and geodetic parameters which were used for the survey were:
Reference frame ( ellipsoid ) : WGS 84 Semi Major Axis : 6378137.0 Inverse Flattening : 1/299.1528128 Projection : UTM Zone : 49 Latitude of Origin : 0 o N Central meridian : 111 0 E Scale Factor on Central Meridian : 0.9996 False Easting : 500000 M False Northing : 10000000 M Unit of Measurement : International Meters
The coordinates and elevations of the reference datums used for the survey are given in Table 1.
4.3.2.4.2 Benchmark Construction and DGPS Survey
10 No. new benchmarks were constructed and positioned throughout the survey area as reference benchmarks.
PT. Geoindo Geotechnical Survey - Banyu Urip Field, Cepu Block
MC / 001 / 02 / Rep.1. - Final Geotechnical and Topographic Survey Report - 16/09/02 14
DGPS survey was carried out in reference to existing MCL benchmarks CPF 01 and CPF 02 in order to tie in new benchmarks to existing MCL benchmarks. The DGPS survey was carried out using static method and carrier phase measurement with minimum time of observation for each point of 30 minutes to maintain the accuracy of baseline.
The raw data collected from the survey was then downloaded and processed using SKI program. Least square method was applied for calculation of each baseline.
4.3.2.4.3 Stake Out
73 borehole, 80 DCPT, 53 test pit and 97 resistivity test positions were staked out at reservoir, airstrip, well pads, processing area and along pipeline route using 1 unit Garmin hand held DGPS and then all positions picked up using more precise Leica DGPS dual frequency equipment with rapid static method. All investigated points were located in rice paddies, agricultural land, near river edge and edge of railway in field.
Actual positions of the boreholes are tabulated in Table 2. The condition and elevations of geotechnical investigation points are given on the relevant logs or result sheets in the Appendices of this report.
4.3.2.4.4 Traverse Survey
All of the traverse survey was carried out using Leica TCA 1100 total station for the horizontal and vertical network, through a selected gently sloping path with multiple direct-reverse observations at each survey point to ensure survey accuracy. Traverse survey was then carried out for all the new constructed benchmarks and tied in to reference datum new benchmarks and existing MCL benchmarks.
PT. Geoindo Geotechnical Survey - Banyu Urip Field, Cepu Block
MC / 001 / 02 / Rep.1. - Final Geotechnical and Topographic Survey Report - 16/09/02 15
All the new benchmarks used as a reference for detail topographic survey work are given in Table 3 and Appendix 2. The raw data collected from the survey was then downloaded into Softdesk Civil Survey program where Bowditch rule method was applied for calculation of data.
4.3.2.4.5 Topographic Survey
The survey was carried out using 4 units of Leica Total Station TCA 1100 equipment. Detail Topographic survey was carried out and tied in to the newly constructed benchmarks. The survey was carried out using grid method. Distance between survey points for detail topographic survey was kept to 10 m or less depending on the terrain condition. Features which were recorded in the survey were existing drainage, roads, rivers, rice fields etc.
4.3.2.4.6 Flood Monitoring Survey
Three manual flood monitoring stations were constructed at three locations ( Water Intake, Reservoir and Pad C area ). Water level monitoring is very important to see the trend of water level increasing ( or decreasing ) and its behavior. Prediction can then be made as to when river water level will rise to above existing river bank level and potential for flooding to occur around location. Monitoring has been carried out since 29th January 2002 after installing reference datums on side of river i.e. morning, noon and afternoon. According to monitoring results when river water level at proposed Water Intake location remains below 20.16 m, then there will be no impact on proposed reservoir, airstrip or open area, but if water level at proposed Water Intake location rises up to more than 20.60 m for more than about + 6 hours, then water level at reservoir, airstrip or open area will rise directly. There is no significant correlation
PT. Geoindo Geotechnical Survey - Banyu Urip Field, Cepu Block
MC / 001 / 02 / Rep.1. - Final Geotechnical and Topographic Survey Report - 16/09/02 16
between river level rise at proposed locations of water intake and Reservoir to Pad C location.
Detail of flood monitoring survey data can be seen in Appendix 1F.
4.3.2.4.7 Bathymetric Survey
Bathymetric survey was carried out at Bengawan Solo river for Water Intake location. Line interval of vessel tracking line was about 15 m. The CEEDUCER echosounder was used as depth measurement equipment and DGPS Leica system 300 complete with RTK ( Real Time Kinematic ) as positioning equipment.
Each depth measurement from echosounder synchronized with position from DGPS and recorded automatically.
Both units were mounted in a small shallow draft boat hired locally. Areas that were difficult to survey by boat, from the high water line to the water line, were covered by topographic survey, thus avoiding any gaps in the survey data. The survey was carried out using DGPS Leica positioning and survey system 300 equipment with kinematic on the fly method.
The data was processed and output after transformation in accordance with the required specification geodetic reference system for the area.
4.3.2.5 Data Processing and Drawing
All data collected from the field survey was downloaded into our notebook computers in the base camp on daily basis and processed using our Softdesk survey program to generate the topographic map. The final report was produced, approved and finalised in our Bandung Office and included finalisation of the draft drawings.
PT. Geoindo Geotechnical Survey - Banyu Urip Field, Cepu Block
MC / 001 / 02 / Rep.1. - Final Geotechnical and Topographic Survey Report - 16/09/02 17
4.3.3 Engineering Geological Mapping
Engineering geological mapping of the site and pipeline route was carried out by our engineering geologists during the course of the fieldwork. Topographic base maps were produced from the current topographic survey which was combined with existing topographic maps by Bakosurtanal and those provided by MCL. The engineering geological information was superimposed on the topographic base maps together with information from both this and previous geotechnical investigations in order to provide better understanding of the geology and ground conditions of the area.
4.3.4 Positioning and Levelling
All geotechnical investigation points such as borehole, trial pit, dutch cone and insitu test locations were staked out by surveyors using a combination of Total Station and RTK ( Real Time Kinematic ) DGPS equipment. Positions of all geotechnical investigation points and geophysical survey were agreed with MCL and referenced to existing MCL datums as discussed in Section 4.3.2. Coordinates and elevations of the investigated points, were surveyed to accuracy of : Horizontal + / - 5 mm Vertical + / - 10 mm and are summarised in Table 4.1 List of Coordinates.
4.3.5 Geotechnical Investigation
The geotechnical investigation fieldwork consisted of boreholes, test pits, dutch cone testing, insitu testing and sampling as well as geophysical survey work at locations provided and approved by MCL and as summarized in Table 4.3 Geotechnical Investigation.
PT. Geoindo Geotechnical Survey - Banyu Urip Field, Cepu Block
MC / 001 / 02 / Rep.1. - Final Geotechnical and Topographic Survey Report - 16/09/02 18
◊ Boreholes
A total of 75 boreholes were drilled to depths between 5 to 50 m with total drilled amount of 2648.5 m as follows :
• 16 No. boreholes along proposed export pipe route
- 3 No. boreholes at Bengawan Solo River Crossing
( P1,P2,P3 ) - 1 No. boreholes at Kalitidu river side ( D) - 2 No. boreholes near Mudi Facility ( P4, P5 ) - 4 No. boreholes at Rail Road Crossing ( A, F, P6, P6 A ) - 2 No. boreholes at Bojonegoro Road Crossing ( P7,P8 ) - 4 No. boreholes at Pipeline Route (I, L, M-a, M-b )
• 29 No. boreholes at new Central Processing Facility • 2 No. boreholes at Rejected / Original Central Processing Facility
Area • 12 No. boreholes at 4 No. Well Pads.
- 3 No. boreholes at Pad B - 3 No. boreholes at Pad C - 3 No. boreholes at Pad D - Boreholes at Pad E were cancelled - 3 No. boreholes at Pad F
• 4 No. boreholes at water intake structure. • 6 No. boreholes at water reservoir and airstrip. • 2 No. boreholes Open Area. • 2 No. boreholes at Oil Storage locations. • 2 No. boreholes at Initial Processing Facility ( IPF ).
Drilling comprised of :
• Continuous core drilling in soil and rock to produce core at 73 mm
diameter.
♦ Drilling Equipment Type : Skid-mounted rotary drill ( for detail see relevant borehole record ) Casing : 89 mm diameter Bit : Shoe bit Rods : Various lengths Barrel : Single barrel ( 73mm diameter core ), with internal split sampler
PT. Geoindo Geotechnical Survey - Banyu Urip Field, Cepu Block
MC / 001 / 02 / Rep.1. - Final Geotechnical and Topographic Survey Report - 16/09/02 19
♦ Dry rotary drilling methods
Dry rotary system of drilling was used and is the drilling system where there is no water / fluid used during coring and taking of samples. Water was used for cutting clean up and installation of casing during drilling. Water was also used whenever insitu testing was carried out ( permeability, SPT especially under groundwater ). These conditions will have affected observations of groundwater level especially during drilling. Hole was advanced by cutting bit on end of power-driven rotating drill rod to which pressure was applied hydraulically. Disturbed samples were taken by single barrel as continous core ( except where Shelby undisturbed sample taken ) and split sampler for Standard Penetration Test ( SPT ). Casing was installed to prevent the hole from collapse for some in situ testing i.e. permeability test, etc. The details are shown on the borehole records.
• Undisturbed “ Shelby tube ” soil sampling was taken at
specificdepths.
The sampling method used was as follows : Undisturbed Sample Shelby tube was used when undisturbed samples were required and was pushed hydraulically into ground to obtain sample. Detailed procedure was as follows: - Clean up hole from cuttings - Measure depth of sample position required - Measure groundwater level if any - Measure length of Shelby tube If sample is below groundwater level, put in the water up to ground surface to prevent suction while pull out the sample. ◊ Push slowly rods and Shelby tube by using hydraulic pressure.
PT. Geoindo Geotechnical Survey - Banyu Urip Field, Cepu Block
MC / 001 / 02 / Rep.1. - Final Geotechnical and Topographic Survey Report - 16/09/02 20
◊ Pull out the sample tube then remove from rods and clean up outside of Shelby tube and throw out the cuttings.
◊ Measure length of sample then make a description ◊ Seal up top and bottom part of Shelby tube with paraffin wax ◊ Give a label ( Borehole No, location, depth, etc. ) ◊ Put the sample in a box and prevent from direct contact with
sunshine.
• Handvane shear strength and Pocket penetrometer testing on samples.
• Standard penetration testing ( SPT ) at 1 - 2 m intervals. • Insitu permeability testing at specific locations. • Vane shear testing at specific locations. • Measurement of ground water level. The groundwater level was
measured after completion of boring and compared with static groundwater levels observed from dug wells close to the observation area.
• Down the hole seismic survey at specific locations. • Installation of standpipe piezometers at specific locations if
required.
Piezometer construction method consisted of : ♦ Measure groundwater level especially confined aquifer which
not affected by drilling water. ♦ Make a screen in the PVC casing as planned depending on
lithological variation, mainly in permeable layer. The length of perforated standpipe to about 2 m depth under static water level.
♦ Make a clayey seal at the bottom of hole when the piezometer installed at higher elevation than base of hole.
♦ Put in the PVC 2” diameter ( clamped at the bottom side of PVC ) one by one the 89mm casing was pulled out from the hole.
♦ Put in the gravel pack / clean sand to annulus as required ♦ Make a clay / bentonite seal at the top of screen ♦ Put in the cement grout to annulus and make foundation on
the ground with thickness about 10 cm ♦ Cut off PVC and leave 50cm above ground surface, and then
put on a clamp on the top of PVC. ♦ Make a label (Borehole No., etc. )
The work is summarized in Table 4 and 5. Average drilling rate of about 5 - 15 m per day per rig was achieved. Moving from location to location was slowed due to flooding and
PT. Geoindo Geotechnical Survey - Banyu Urip Field, Cepu Block
MC / 001 / 02 / Rep.1. - Final Geotechnical and Topographic Survey Report - 16/09/02 21
lack of roads / tracks in area which necessitated dismantling and moving manually. In addition, the need to socialize the work and get approval from the local people was a lengthy and diplomatic process which had to be carried out for each new location. Upon completion of drilling each borehole was backfilled with cement grout except for those that had PVC tubes installed for down hole seismic survey or installation of perforated PVC pipe piezometers to monitor groundwater levels. Upto eleven drilling rigs were used to undertake the work. Insitu testing was carried out in the boreholes and consisted of standard penetration tests, permeability tests and vane shear tests as described below.
A. Standard Penetration Testing
Standard Penetration Test procedure
♦ Clean up a hole from cutting ( except if undisturbed samples
had been taken before ) ♦ Insert Split Spoon sampler with 450mm length ♦ Measure and note hole depth and be sure that the depth of
hole is equal to the depth of split spoon sampler as inserted ( making sure that all cuttings removed and cleared )
♦ Mark up the rods above ground surface every 75 mm along 450 mm or 6 x 75 mm
♦ Measure and note groundwater level ♦ If the test was carried out in sand layer with groundwater
level above, put in water into the casing until full to prevent suction and hydrostatic water softening / loosening
♦ Drop the hammer ( 63.5 kg ) onto anvil over 760 mm height ♦ Count and note value every 75 mm / 150 mm penetration
and stop at 450 mm penetration or after cumulative value reach 50 at the third 75 mm / 225 mm penetration or in the first and the second penetrations
♦ Pull out all the tools and put sample from split spoon into plastic bag and into the core boxes
The Standard Penetration Test ( SPT ) was carried out using similar equipment and operation method as described above.
Standard Penetration Testing ( SPT ) was carried out in each borehole at about 1.5 m intervals in accordance to ASTM standards.
PT. Geoindo Geotechnical Survey - Banyu Urip Field, Cepu Block
MC / 001 / 02 / Rep.1. - Final Geotechnical and Topographic Survey Report - 16/09/02 22
A falling hammer weighing 63.5 kgs was raised 0.75 m and dropped onto an anvil which drove a small diameter split spoon sampler into the soil / rock being tested.
The blow count was measured for each 75 mm penetration for a total penetrated length of 450 mm. The first 150 mm was generally taken as a seating drive. The blow count for the last 300 mm was taken as the N - value. In rock because penetration may be minimal the blow count was recorded for whatever penetration was achieved and the N value estimated by extrapolation for an equivalent 300 mm penetration. The SPT N - values are shown on the borehole records in Appendix 1 Section 6 and summarised in tabular form in Appendix 3 Section 10.1.
B. Permeability Testing
Selected boreholes were tested at about 5 m intervals. The borehole was drilled, steel casing inserted ( 89 mm diameter ) and the borehole advanced by open hole drilling to create a test section of variable length but with a diameter of about 73 mm. Falling head permeability testing was carried out from the bottom of the casing with the bottom of the borehole same as the casing or from a section of open borehole advanced in front of the casing. The original ground water level was measured or obtained from records. Water was placed into the borehole and the drop in water level within the borehole measured with time. The data was then plotted graphically and the curve approximating to the actual situation was then used for analysis and calculation of field permeability. Generally, the first or top part of the curve was taken because in some tests it was evident that with time and decrease in head of water within the borehole there was sedimentation, masking of actual permeability due to sub artesian water mixing with the test section water as well as other effects.
PT. Geoindo Geotechnical Survey - Banyu Urip Field, Cepu Block
MC / 001 / 02 / Rep.1. - Final Geotechnical and Topographic Survey Report - 16/09/02 23
The testing was carried out in accordance with British Standards ( BS 5930 ). The observations, calculations, graphs and results are presented in Appendix 2.
C. Shear Vane Testing
Shear vane testing was carried out using a Geonor hand vane on core and in test pits. The test was carried out by inserting vane of appropriate blade size into the ground or into the core and rotating the vane. The torque obtained was recorded and shear strength for the depth calculated. Both peak and remoulded shear strength were taken. Summary and details of test results are presented in Appendix 2 Section 10.3.
◊ Test Pits
53 No. test pits to maximum depth of 2.5 m were excavated by manual techniques and logged by an experienced engineering geologist to provide information on near surface geology, strength of upper layer as well as obtain samples for earthwork properties determination. Vane shear tests were also carried out.
At least one block sample, one CBR mould sample and one bulk sample was taken from each test pit for laboratory testing. CBR sampling method : ♦ Measure the dimension of mold ( diameter and height ) ♦ Clean and prepare sample area ♦ Carefully push the mold at the sample depth from top to
bottom ♦ Cut the bottom of sample and seal with paraffin wax at
top and bottom of sample. The trial pit records are presented in Appendix 1 Section 7.
PT. Geoindo Geotechnical Survey - Banyu Urip Field, Cepu Block
MC / 001 / 02 / Rep.1. - Final Geotechnical and Topographic Survey Report - 16/09/02 24
◊ Logging and Supervision
The boreholes and trial pits have been logged and supervised on site by three engineering geologists. Draft logs were produced onsite on a daily basis and sent to main office in Bandung for finalization prior to submission to MCL. Borehole log format was approved by MCL prior to start of fieldwork. The engineering geologists supported by engineering technicians also carried out the engineering geological mapping as well as supervised insitu testing. The results of this testing were loaded onto our computers on a daily basis and draft results produced on an ongoing basis during the fieldwork. The insitu test results are presented in Appendix 2.
◊ Dutch Cone Penetration Testing
A Total of 80 No. of Dutch Cone penetration tests have been carried out by three 2.5 tonne capacity dutch cone rigs using a Begemann Cone. The tests were carried out to refusal ( > 250 kg / cm 2 ) and measured end resistance ( qc ), Local Skin Friction (qf ) and Friction Ratio ( qf / qc = Fr ). The dutch cone test data has provided valuable information in support of the borehole / trial pit data regarding geology and soil strength. Cone data interpretation results include soil type, equivalent blow count, friction angle and undrained shear strength. Some of the Dutch Cone tests were carried out adjacent to boreholes for calibration of Dutch Cone data with borehole data. The results are presented in Appendix 2 Section 10.7. One to two dutch cone tests were completed per day per rig.
4.3.6 Geophysical Investigation
Geophysical testing was carried out in order to provide resistivity and dynamic properties of the subsurface soils for design purposes.
PT. Geoindo Geotechnical Survey - Banyu Urip Field, Cepu Block
MC / 001 / 02 / Rep.1. - Final Geotechnical and Topographic Survey Report - 16/09/02 25
The geophysical testing is outlined below and consisted of :
(1) Downhole Seismic Testing (2) Electric Resistivity Survey (3) Thermal Resistivity Testing ◊ Downhole Seismic Testing
Down hole seismic testing was carried out on 20 / 21 March 2002 in 3 boreholes at the CPF location in boreholes BHCP39, BCP45, BHCP 49 upto 50 m depth and 1 borehole upto 25 m depth at BHCP 35 :
The basic data acquisition system consisted of : Energy Source : Sledge Hammer and Plate Receivers : 12 No. Velocity Logging Sondes ( VLS ) Recording System : Field Graph Model 1220.32 Seismic Amplifier : OYO TR-7
Prior to Downhole Seismic Testing, the boreholes were drilled by rotary coring method to minimize sidewall disturbance and then cased with a 2” PVC pipe. PVC was installed to the bottom of bore hole and the annular space between the pvc and the borehole was grouted by cement to enhance passage of seismic energy. Seismic properties were obtained by laboratory testing on core of the above selected boreholes in order to obtain laboratory determined seismic velocity and resonant column test derived seismic properties that are representative of the strata encountered within the 50 m deep boreholes at the CPF location. Down the borehole seismic testing was carried out by placing the array of velocity logging ( VLS ) equipment consisting of a string of geophones into the borehole at selected depth intervals. The geophone string consisted of 12 geophones at two metre spacing with a total length of 22 metres which was placed at top of borehole and test carried out and then again the array was lowered to base of borehole and test carried out again. In fact the seismic test at every borehole could only be carried out down to 45 metres since the lowest geophone was blocked by borehole debris and cuttings which had settled to the bottom of the hole.
PT. Geoindo Geotechnical Survey - Banyu Urip Field, Cepu Block
MC / 001 / 02 / Rep.1. - Final Geotechnical and Topographic Survey Report - 16/09/02 26
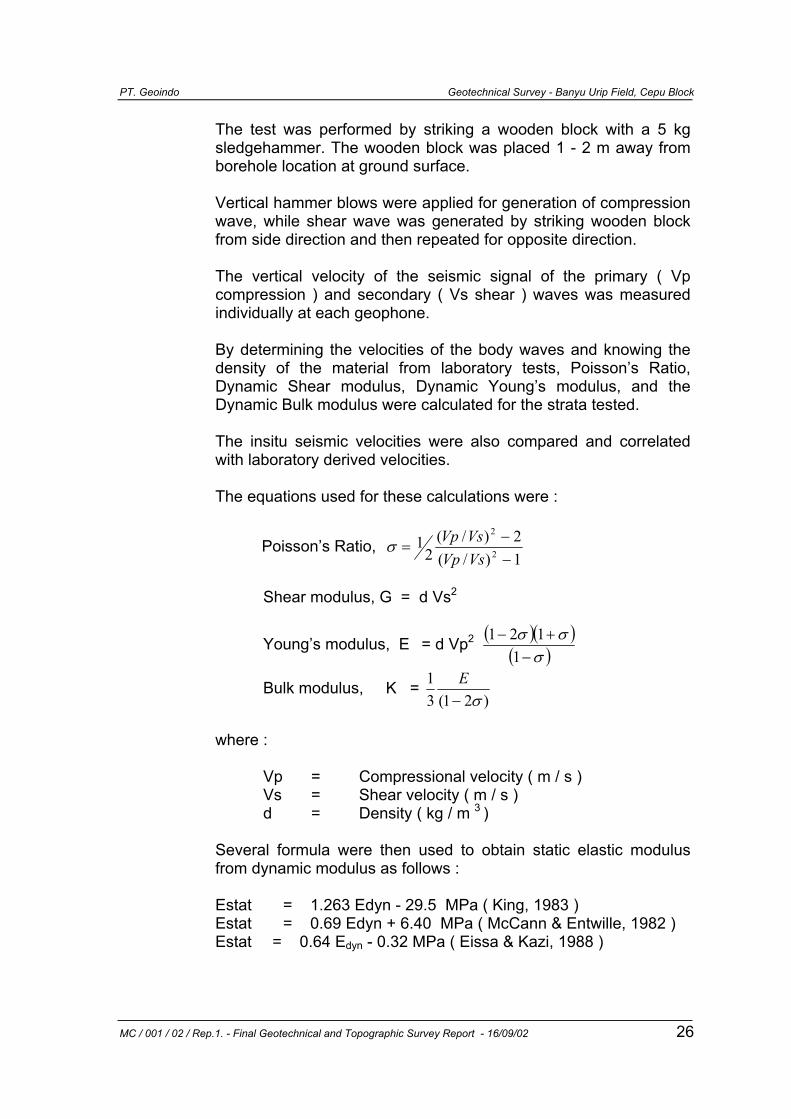
The test was performed by striking a wooden block with a 5 kg sledgehammer. The wooden block was placed 1 - 2 m away from borehole location at ground surface. Vertical hammer blows were applied for generation of compression wave, while shear wave was generated by striking wooden block from side direction and then repeated for opposite direction. The vertical velocity of the seismic signal of the primary ( Vp compression ) and secondary ( Vs shear ) waves was measured individually at each geophone. By determining the velocities of the body waves and knowing the density of the material from laboratory tests, Poisson’s Ratio, Dynamic Shear modulus, Dynamic Young’s modulus, and the Dynamic Bulk modulus were calculated for the strata tested. The insitu seismic velocities were also compared and correlated with laboratory derived velocities. The equations used for these calculations were :
Poisson’s Ratio, 1)/(2)/(
21
2
2
−−
=VsVpVsVpσ
Shear modulus, G = d Vs2
Young’s modulus, E = d Vp2 ( ) )(( )σ
σσ−
+−1121
Bulk modulus, K = )21(3
1σ−
E
where :
Vp = Compressional velocity ( m / s ) Vs = Shear velocity ( m / s ) d = Density ( kg / m 3 )
Several formula were then used to obtain static elastic modulus from dynamic modulus as follows : Estat = 1.263 Edyn - 29.5 MPa ( King, 1983 ) Estat = 0.69 Edyn + 6.40 MPa ( McCann & Entwille, 1982 ) Estat = 0.64 Edyn - 0.32 MPa ( Eissa & Kazi, 1988 )
PT. Geoindo Geotechnical Survey - Banyu Urip Field, Cepu Block
MC / 001 / 02 / Rep.1. - Final Geotechnical and Topographic Survey Report - 16/09/02 27
The various relationships summarised above are linear whilst dynamic moduli may not necessarily behave in a linear way as well as the static moduli derived from dynamic moduli may also not necessarily be reflective of the way the soil behaves beneath a large foundation. Nevertheless, one can draw some useful conclusions from the data which can then be cross correlated with static elastic moduli derived from laboratory and insitu testing. The observed vertical travel lines were plotted against depth and the results together with calculated moduli and other relevant test data are given in Appendix 2 section 10.3.
◊ Resistivity Survey
Resistivity survey was carried out at 97 points along the pipeline route and also at the development site using Wenner Method. The equipment used was a NANIURA Resistivity System. The survey provided resistivity data for soils at each specified location to depths of 0.75, 1.50, 2.25, 3.0 and 4.5 metres which is expected to be below proposed grade of pipeline.
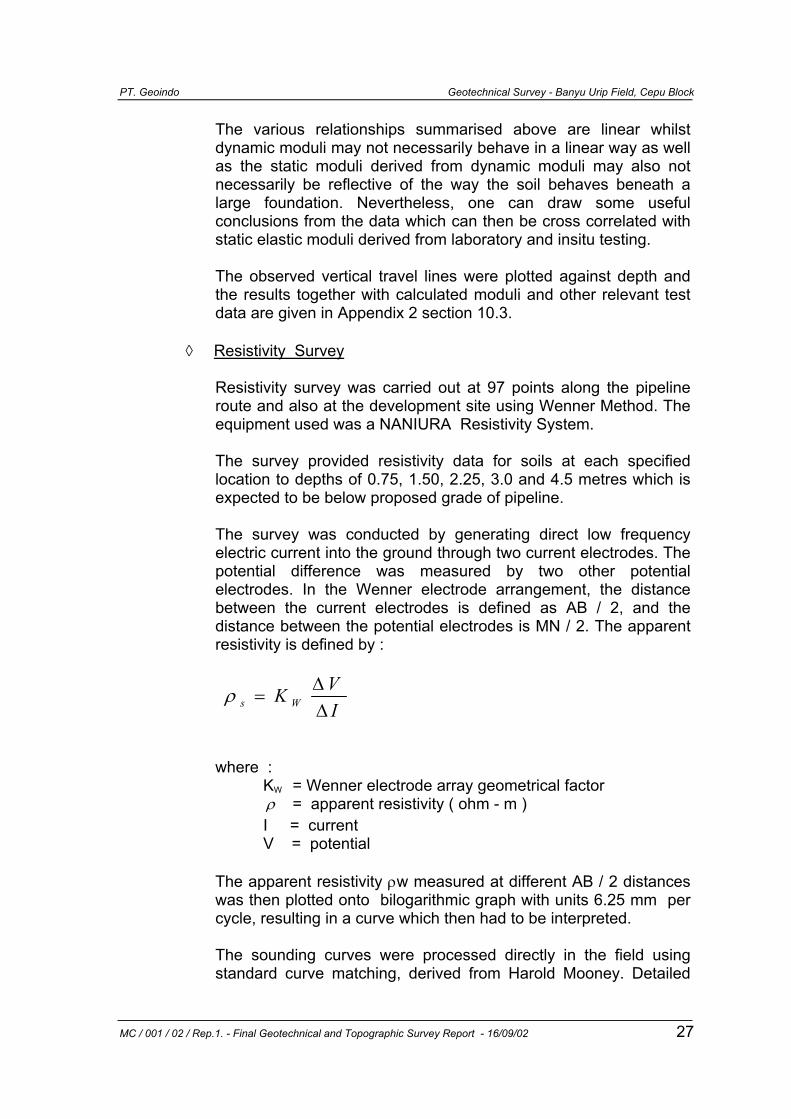
The survey was conducted by generating direct low frequency electric current into the ground through two current electrodes. The potential difference was measured by two other potential electrodes. In the Wenner electrode arrangement, the distance between the current electrodes is defined as AB / 2, and the distance between the potential electrodes is MN / 2. The apparent resistivity is defined by :
IVK Ws ∆
∆=ρ
where : KW = Wenner electrode array geometrical factor ρ = apparent resistivity ( ohm - m ) I = current V = potential
The apparent resistivity ρw measured at different AB / 2 distances was then plotted onto bilogarithmic graph with units 6.25 mm per cycle, resulting in a curve which then had to be interpreted. The sounding curves were processed directly in the field using standard curve matching, derived from Harold Mooney. Detailed
PT. Geoindo Geotechnical Survey - Banyu Urip Field, Cepu Block
MC / 001 / 02 / Rep.1. - Final Geotechnical and Topographic Survey Report - 16/09/02 28
processing was carried out in the office using a proprietary program. The resistivity curve obtained from the field measurement reflects the vertical layers of rock / soil below the central point. The thickness ( z ) and specific resistivity ( ρ ) of each rock / soil layer below the central point and the final interpretation are presented in the form of vertical lithology logs under each central point, which then can be used as additional data in generating geological cross sections after combining with other field data from boreholes, dutch cone tests and trial pits. However, it should be noted that the main purpose of the electric resistivity soundings was to provide information on corrosivity of the ground in relation to the planned 80 km long subsurface pipeline.
The results and findings are presented in Appendix 2 Section 10.4.
◊ Thermal Resistivity Testing
Thermal Resistivity Testing was carried out at 97 points at the same location as the electric resistivity tests.
The purpose of the thermal field resistivity tests is to provide thermal resistivity data for soils to a maximum depth 1.80 metres below existing ground level. In general, the thermal resistivity tests followed the standard procedure which has been proposed as an ASTM standard by Hans Winterkorn in 1964, or IEEE 442.
Thermal resistivity testing was carried out by inserting a thermal needle into the ground. The needle was inserted so that the middle thermocouple was located at the test depth. Resistivity then was determined at the cable depth and 30 cm above and below the depth. After insertion was completed, 10 - 15 minutes was allowed for the needle to reach thermal equilibrium with the surrounding ground while monitoring the temperature at 2 min intervals. The time for test was dependent on the difference between the air temperature and earth temperature. A power level was then selected to give at least 3o C - 4o C temperature rise over approximately one logarithmic cycle of time to allow for easy interpretation of the measured data.
Temperature was recorded for each thermocouple junction in turn at 30 s intervals for the first 5 min to ensure that the needle did not
PT. Geoindo Geotechnical Survey - Banyu Urip Field, Cepu Block
MC / 001 / 02 / Rep.1. - Final Geotechnical and Topographic Survey Report - 16/09/02 29
overheat. The temperature was kept below 75o C during the first 5 min under normal conditions. Recording temperature was continued at 1 min intervals for following 30 - 40 min.
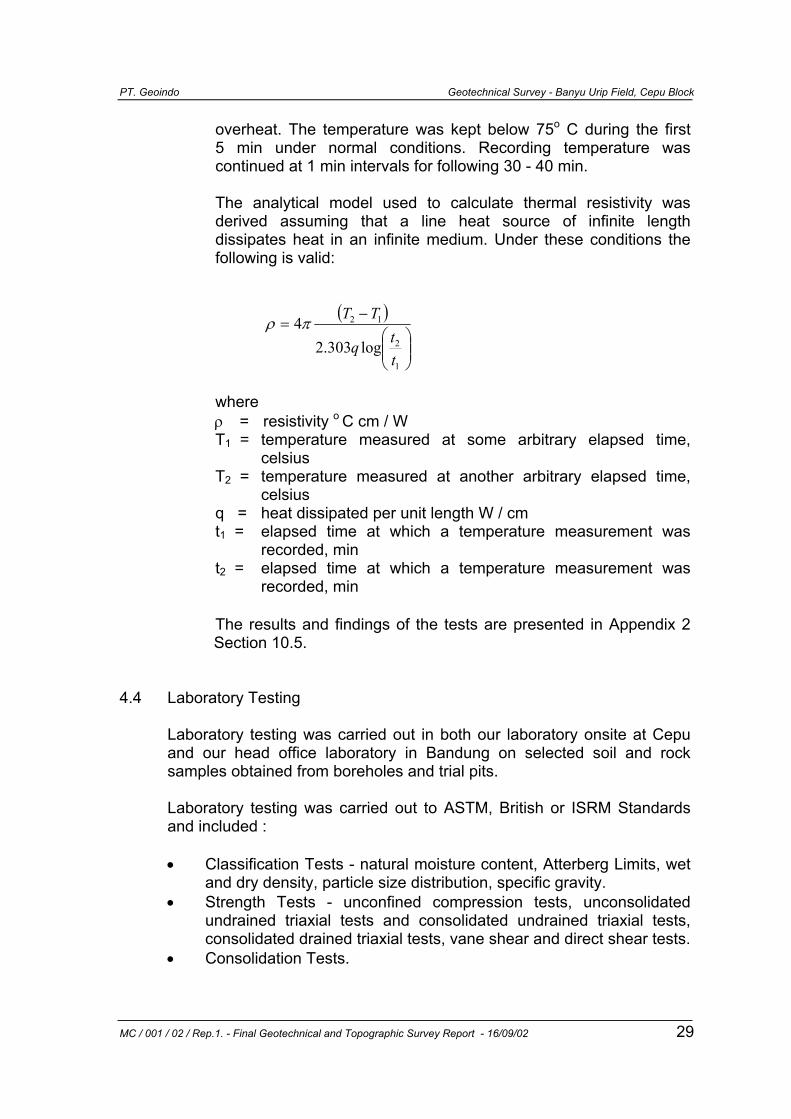
The analytical model used to calculate thermal resistivity was derived assuming that a line heat source of infinite length dissipates heat in an infinite medium. Under these conditions the following is valid:
( )
−
=
1
2
12
log303.24
ttq
TTπρ
where
ρ = resistivity o C cm / W T1 = temperature measured at some arbitrary elapsed time,
celsius T2 = temperature measured at another arbitrary elapsed time,
celsius q = heat dissipated per unit length W / cm t1 = elapsed time at which a temperature measurement was
recorded, min t2 = elapsed time at which a temperature measurement was
recorded, min
The results and findings of the tests are presented in Appendix 2 Section 10.5.
4.4 Laboratory Testing
Laboratory testing was carried out in both our laboratory onsite at Cepu and our head office laboratory in Bandung on selected soil and rock samples obtained from boreholes and trial pits. Laboratory testing was carried out to ASTM, British or ISRM Standards and included : • Classification Tests - natural moisture content, Atterberg Limits, wet
and dry density, particle size distribution, specific gravity. • Strength Tests - unconfined compression tests, unconsolidated
undrained triaxial tests and consolidated undrained triaxial tests, consolidated drained triaxial tests, vane shear and direct shear tests.
• Consolidation Tests.
PT. Geoindo Geotechnical Survey - Banyu Urip Field, Cepu Block
MC / 001 / 02 / Rep.1. - Final Geotechnical and Topographic Survey Report - 16/09/02 30
• Permeability Tests. • CBR Tests. • Combined Compaction - CBR and vane Tests. • Swelling Tests. • Lime Stabilisation Tests. • Chemical Tests - pH, sulphate and chloride. • Sonic Velocity Test. • Resonant Column Test.
4.5 Reporting
A factual and Interpretative Report has been produced which presents standard data from the investigation such as borehole, Dutch Cone testing and trial pits records, result of insitu and laboratory tests as well as interpretation of the results, summary of the findings, evaluation and engineering assessment, including geotechnical design recommendations.
4.6 Quality Control
Quality control was applied throughout all stages of work in this project : 1. Survey 2. Geotechnical include fieldwork, laboratory testing and geotechnical
engineering consulting
4.6.1 Survey Services
Topographic survey of 975 HA project area and stake out of the investigation points were carried out by 5 survey teams using 4 units of Leica TC1100, 1 set of Leica DGPS System 300 dual frequency 12 channels (consisting of 3 units) and 1 unit of Ceeducer echosounder which were operated by 5 senior surveys and 5 assistant surveyors lead by 1 geodetic engineer. The equipment was calibrated directly in the field prior to the field survey by senior personnel from Geodetic Faculty of Bandung Institute of Technology who is authorized to carry out and produce calibration certificates. All our survey equipment have self calibration devices which will compensate tolerable errors during the survey. The self calibration for each equipment was conducted every morning prior to survey and was reported to MCL on weekly basis.
PT. Geoindo Geotechnical Survey - Banyu Urip Field, Cepu Block
MC / 001 / 02 / Rep.1. - Final Geotechnical and Topographic Survey Report - 16/09/02 31
The surveyors carried out work, checked and verified themselves that their work was correct, signed off and reported to Project Manager supported by Project Coordinator who checked, verified, signed off and reported to either MCL ( Company Representative ) or his assistants. The survey data was downloaded directly from the total stations and DGPS data recorder into a computer and the surveyor then processed and edited the data, procedures, actual coordinates and elevation data of investigation location. Any problems or queries were resolved by reference back to head office and Project Coordinator who reported to Project Manager, prior to feed back to survey team onsite. This feedback was then adopted by the survey team as part of an evolving process as the work proceeded. The documentation involved is in the form of spreadsheet data, as hard copy and electronic data, QA / QC reports from survey as well as daily work reports signed by Geoindo and submitted to MCL.
4.6.2 Geotechnical Services and Laboratory Testing
Laboratory testing work was carried out to relevant international standards or procedures ( ASTM, British or ISRM ) by our 7 trained, qualified and experienced technical staff. The results were checked and verified by technician responsible for the test who produced the results on standard Geoindo forms. The technician then signed off and submitted to senior engineer / engineering geologist ( Project Coordinator ) who in turn checked and reviewed the results and then signed off also. The results and report are submitted to Project Manager who made final checks and reviews prior to use in following analysis. Geotechnical consultancy work including fieldwork, supervision, factual and interpretative reports, engineering evaluation, analysis, recommendations and design work was carried out by trained and qualified Geotechnical Engineers supported by Engineering Geologists under the direction and control of Project Manager. The work was then carried out with internal checks and verification by technical staff. All laboratory and field equipment is calibrated regularly on a two yearly basis. Continual checks were maintained. Equipment which shows
PT. Geoindo Geotechnical Survey - Banyu Urip Field, Cepu Block
MC / 001 / 02 / Rep.1. - Final Geotechnical and Topographic Survey Report - 16/09/02 32
significant faults or errors is sent to manufacturer for servicing, check and recalibration. Laboratory tests were carried out both in our site office in Cepu and in our Bandung office.
4.6.3 Documentation
All documents, reports, drawings and electronic data files are given a unique reference number and the hard copy and electronic files produced and stored in the appropriate drawing cabinet / hanger, files or box on Bandung office. All electronic files which were generated in the field and in our Bandung office were doubled backed up in our servers both in Cepu site office and Bandung office which were connected by internet. Final result was then backed up into CD Rom media to ensure that if the computers crashed the files are not lost and can be retrieved again.
4.7 Health Safety and Environmental Programme 4.7.1 General Safety.
On site, PT. Geoindo adhered to MCL site safety plan which includes Safety Guidelines given in the Tender Document, with particular attention focused on ensuring that all employees used correct PPE ( Personal Protection Equipment ) specific for task being undertaken. During the field work, PT. Geoindo provided a health and safety work environment for employees and visitors as follows :
• Promoted active participation of all employees in the safety
programme. • Provided all employees and visitors with appropriate safety training
and equipment. • Provided all employees with an opportunity to improve their health and
safety on site. • Had used safety performance as a key to measure assessment of
individual performance. • Investigated incidents and identified root causes to prevent
recurrence. • Carried out regular inspection and hazard analyses to continue to
improve the safety of the work place.
PT. Geoindo Geotechnical Survey - Banyu Urip Field, Cepu Block
MC / 001 / 02 / Rep.1. - Final Geotechnical and Topographic Survey Report - 16/09/02 33
• Ensured that occupational health and safety is an essential and integral part of management accountability. Occupational health and safety considerations have equal status with other primary business objectives.
• Promoted health and safety as a way of life, both at work and at home.
PT. Geoindo was responsible for the safety and first-aid programme which included :
• Identification of existing and potential hazards. • Safety rules, inspection procedures, and enforcement actions. • Safety training sessions, including for first aid and fire fighting. • Accident procedures, including definition of rallying areas ( for head
count ) and escape routes in case of emergency. • Keeping the site and contract works in an orderly state and in such
condition as to avoid danger to persons and property. • Providing a safe working environment. • Identifying any significant hazard and advising the engineer / client. • Ensuring that employees are not necessarily exposed to hazards. • Having proper procedures for dealing with emergencies. • Maintaining a register of accidents and serious harm and providing
copies of reports to engineer / client. • Investigate accidents and their cause. • Ensuring that workers are appropriately supervised. • Providing all watching and providing, erecting, maintaining and
removing all barricades, fencing, temporary roadways and footpaths, signs that are necessary for the effective protection of property, for traffic and for the safety of others.
4.7.2 Safety in Excavation Pit Test
Soil excavation work for trial pit testing ( 1.5 x 1.5 x 3.7 m maximum depth ) was carried out by considering safety as described below :
• Test pits were excavated in 1 to 2 or 1 to 3 slopes to keep the wall
standing without support especially wet slurry soil such in paddy field which is common in the project area
• Steps or bamboo ladder were used to enter the pit for the logging and sampling
• Suction pump were always stood by the pit to keep the pit dry to enable desired excavation depth to be achieved and to enable logging and sampling process.
• Test pit excavation, logging, sampling and backfilling of every pit was carried out in one day to avoid humans or animals such as cattle from falling into the pit.
PT. Geoindo Geotechnical Survey - Banyu Urip Field, Cepu Block
MC / 001 / 02 / Rep.1. - Final Geotechnical and Topographic Survey Report - 16/09/02 34
• Safety training was given to every worker before they perform their job. Safety information was presented every day in the morning. Every worker involved was well equipped with personal protective equipment and safety engineer will monitor the application.
• At the end of every excavation, all openings were backfilled with soil excavated. Debris was cleaned during the fieldwork.
• Safety engineer monitored daily activity. Check list record was provided and corrective action or warning to every worker was given in order to prevent accidents.
4.7.3 Safety in Drilling Area
Drilling work was undertaken by considering safety as described below :
• Equipment was located in one side of the drilling area to the opposite end of water re-circulation reservoir area.
• All equipment was checked prior to use in order to ensure that it is in good and safe condition. Drilling machine was operated by an operator that had previously had relevant training and experience in operating the machine.
• All drilling pipe was stacked and secured in such a way that will not slide, fall or collapse.
• All workers which were involved in this work were equipped with personnel protective equipment. Safety meeting was given to them everyday. Safety engineer and drilling supervisor performed inspection every day and give direct instruction if work location is dirty and if equipment(s), tool(s), material(s) are found in an unsafe condition.
• Mud from the borehole was collected in a sediment trap and drilling fluid consisting of muddy water was flowed through a previous made drainage channel and collect in a re-circulation reservoir so that the water can be re-used for wash boring work.
• At the end of each borehole, the site was cleaned and sediment trap, open channel drainage, water circulation reservoir was filled with excavated soil. Boreholes were backfilled.
• For over water drilling at Bengawan Solo river, the drilling equipment was put on drilling platform which was constructed above seasonal high water level. All workers involved in this work wore life jackets.
4.7.4 Safety for Seismic Work
Energy source in down hole seismic survey was generated by sledge hammer instead of explosive material thus safer and more practical.
PT. Geoindo Geotechnical Survey - Banyu Urip Field, Cepu Block
MC / 001 / 02 / Rep.1. - Final Geotechnical and Topographic Survey Report - 16/09/02 35
Safety actions which was carried out for this work were as follows:
• All workers were equipped with personnel protective equipment and given prior training to improve knowledge about safety procedure. Workers involved were geologists / geophysicists and diggers.
• At the end of survey, the site was cleared and cleaned.
4.7.5 Environmental Management Environmental management programme was conducted as follows :
• Foster commitment to the environmental management programme to
ensure that damage to the environment is prevented and sustainable economic activity can be continued for the long-term benefit of the community.
• Comply with all applicable government laws for protection of the environment including the discharge and quality of waste material, noxious fumes, noise emission, de-vegetation and the pollution or erosion of soil.
• Ensure that project operation are developed or constructed in an environmentally sound and safe manner.
4.8 Permits, Permissions and Land Compensation
Prior to the start of the field work as the contract was awarded at the 10th December 2001, MCL stated that permits to enter and work in the job site had been arranged and granted by the local government. As had been planned, the field work was started at 7th January 2002 but was then stopped by the local government at 17th January 2002 who stated that MCL had not arranged the work permits for the geotechnical investigation and the topographic survey. After 21 days of stoppage, finally the local government issued the work permit to MCL and the field work was restarted on 7th February 2002. Two of PT. Geoindo drilling rigs were stolen by a group of Gayam villagers at the first day of arrival. After negotiations and payment of a ransom the rigs were given back but in a broken condition. The unfriendly treatment by the villagers to PT. Geoindo field crew was also shown by forcing field crews to use their services but at excessive and unreasonable rates but worse was when the life of some crew was threatened if they refused the villagers offering of services.
PT. Geoindo Geotechnical Survey - Banyu Urip Field, Cepu Block
MC / 001 / 02 / Rep.1. - Final Geotechnical and Topographic Survey Report - 16/09/02 36
It was then PT. Geoindo themselves who tried to approach the heads of the villages and other important persons to cease the confrontation. It was never clear about the reason why the villagers were opposing outsiders but from the information collected from the villagers who had contacted the PT. Geoindo’s crew it seems that the parties who had made investigations or worked in this area previously had broken their promises especially on land or crop damages compensation. Knowing this problem, PT. Geoindo arranged a special team who worked only to give information and pay for the damages. At the end of the project the threatening was much less even though small clashes still happened because it was impossible to approach every villager since it was too time consuming with PT. Geoindo optimized their working hours due to the strict work programme. It is suggested that MCL will have to make considerable effort to ensure good relationship with the local government and local inhabitants to avoid difficult social problems arising in the future.
5. GROUND CONDITIONS 5.1 General
The assessment of ground / groundwater conditions is based : ◊ on a review of regional and specific geological maps and reports which
were published by Geological Research and Development Center ( GRDC ) and Environmental Geology Directorate ( EGD ) at Bandung
◊ combined with previous Banyu Urip investigations by Golder 1999 ◊ present Topographical and Geotechnical investigation by Geoindo,
2002 to produce a series of engineering geological units that have characteristics, ground / groundwater conditions and geotechnical considerations.
The interpreted surface geology and engineering geological cross sections of the area are shown in Drawing No. MC / 001 / GEO / 004 to 020 and Table 5.1.A to C ( Ground Conditions ).
PT. Geoindo Geotechnical Survey - Banyu Urip Field, Cepu Block
MC / 001 / 02 / Rep.1. - Final Geotechnical and Topographic Survey Report - 16/09/02 37
5.2. Ground Conditions
The area is underlain by a sequence of Quaternary fluvial and coastal deposits with marine sedimentary soils and rocks of Quaternary and Tertiary age. Regionally, the area is covered by Alluvium deposits, Terrace Deposits, Lidah, Paciran and Kujung Formations, etc. ( see Table 2 - Regional Geology ).
5.2.1 Water Intake Structure
Water Intake is located in flat area adjacent the Bengawan Solo River with elevation about 19 m asl. The site is underlain by alluvium ( ALLCLAY1, ALLCLAY2 & ALLSAND ) which in turn is underlain by clays of the Lidah Formation ( LICLAY3 ). Detail description of each stratum as follows : ◊ TOP SOIL
Top soil generally consists of very soft to soft, brown to yellowish brown, medium to high plasticity, sandy silty CLAY and clayey SILT, root remains, moist to wet. Undrained shear strength from hand vane is less than 10 kPa. USCS classification is CH. Thickness is about 0.1 to 0.5 m.
◊ ALLCLAY1 - Alluvial Clay 1
Allclay1 generally consists of firm to stiff, yellowish brown to dark grey with yellow mottled, high plasticity, silty CLAY with occasional fine to coarse, subrounded to subangular limestone gravel, moist. SPT-N value ranges from 5 to 10 with average 7. Peak undrained shear strength from hand vane test ranges from 20 to 152 kPa with average 67 kPa and remolded strength ranges from 4 to 46 kPa with average 31 kPa. USCS classification is CH. Thickness is about 3 to 5 m.
◊ ALLCLAY2 - Alluvial Clay 2
Allclay2 generally consists of stiff to very stiff, dark grey with yellow speckles, high plasticity, silty CLAY with slightly sandy and occasional fine to coarse, subrounded to subangular limestone gravel, moist. SPT - N values range from 9 to 15 with average 12. Peak undrained
PT. Geoindo Geotechnical Survey - Banyu Urip Field, Cepu Block
MC / 001 / 02 / Rep.1. - Final Geotechnical and Topographic Survey Report - 16/09/02 38
shear strength from hand vane test ranges from 50 to 226 kPa with average 124 kPa and remolded strength ranges from 12 to 120 kPa with average 38. USCS classification is CH. Thickness is about 8 to 11 m.
◊ ALLSAND - Alluvial Sand
Allsand generally consists of medium dense to dense, non cemented, grey to dark grey with white speckles, fine to medium grained, subrounded to subangular silty SAND, moist. SPT - N value ranges from 8 to 28 with average 18. USCS classification is SM. Thickness is about 1.5 to 4 m.
◊ LICLAY2 - Blue Lidah Clay 2
Liclay3 generally consists of very stiff to hard, bluish grey, high plasticity, silty CLAY with occasional shell fragments with some places thinly laminated ( 0.05 to 0.20 m ) with moderately strong to strong, grey claystone gravel, moist. SPT - N values range from 22 to 41 with average 32. Peak undrained shear strength from hand vane test ranges from 80 to 260 kPa with average 194 kPa and remolded strength ranges from 18 to 96 kPa with average 39. USCS classification is CH. Thickness is about 7 to 10 m.
◊ LICLAY3 - Green Lidah Clay 3
Liclay3 generally consist of very stiff to hard, bluish grey to greenish grey with white speckles and black mottled, high plasticity, silty CLAY with occasional shell fragments with some places thinly laminated ( 0.05 to 0.20 m ) with moderately strong to strong, grey claystone, moist. SPT - N value ranges from 21 to 44 with average 33. Peak undrained shear strength from hand vane test ranges from 140 to 185 kPa with average 165 kPa and remolded strength ranges from 35 to 40 kPa with average 39. USCS classification is CH. Thickness is more than 20 m.
◊ Groundwater Ground water level beneath the area can be divided as follows : • Shallow unconfined groundwater was encountered at 0.5 to 3 m
depth below ground level. Ground water level appears to be influenced by season and Bengawan Solo River. Ground water is likely to rise during periods of heavy rainfall, especially in rainy season.
PT. Geoindo Geotechnical Survey - Banyu Urip Field, Cepu Block
MC / 001 / 02 / Rep.1. - Final Geotechnical and Topographic Survey Report - 16/09/02 39
• A confined ground water aquifer within alluvium SAND at 10 to 13 depth below ground level.
5.2.2 Reservoir, Air Strip and Open Area Air Strip, Reservoir and Open area are located on the flat river floodplain of the Bengawan Solo River at elevation about 20 to 26 m asl. The sites are underlain by alluvium ( AllCLAY1, ALLCLAY2 & ALLSAND ) which in turn is underlain by clays of the Lidah Formation ( LICLAY1 ). Detail description of each stratum as follows : ◊ TOP SOIL
Top soil generally consists of very soft, dark grey, high plasticity, silty CLAY and clayey SILT, root remains, wet. Undrained shear strength from hand vane is less than 10 kPa. USCS classification is CH.Thickness about 0.4 to 0.65 m.
◊ ALLCLAY1 - Alluvial Clay 1
Allclay1 generally consists of soft to stiff with some places become stiff, dark grey with yellow and white mottled, high plasticity, silty CLAY with occasional fine to coarse limestone gravel, moist to very moist. SPT - N value ranges from 2 to 9 with average 5. Peak undrained shear strength from hand vane test ranges from 20 to 152 kPa with average 67 kPa and remolded strength ranges from 4 to 46 kPa with average 31 kPa. USCS classification is CH. Thickness ranges from 2 to 7 m with average 5 m.
◊ ALLCLAY2 - Alluvial Clay 2
Allclay2 generally consist of stiff to very stiff, dark grey with yellow speckles, high plasticity, silty CLAY with slightly sandy and occasional fine to coarse, subrounded to subangular limestone gravel, moist SPT - N value ranges from 8 to 22 with average 13. Peak undrained shear strength from hand vane test ranges from 80 to 260 kPa with average 194 kPa and remolded strength ranges from 18 to 96 kPa with average 39. USCS classification is CH. Thickness ranges from 3 to 9 m with average 6 m
PT. Geoindo Geotechnical Survey - Banyu Urip Field, Cepu Block
MC / 001 / 02 / Rep.1. - Final Geotechnical and Topographic Survey Report - 16/09/02 40
◊ ALLSAND - Alluvial Sand
Allsand generally consist of medium dense to dense, brownish grey to dark grey with white speckles , fine to medium grained, subrounded to subangular silty SAND, moist SPT - N value ranges from 9 to 59 with average 24USCS classification is SM. Thickness ranges from 3 to 10 m with average 8 m.
◊ LICLAY1 - Yellowish Grey & Grey Lidah Clay 1
Liclay1 generally consists of stiff to very stiff with some places hard, dark grey to brownish grey and yellowish grey to greenish grey, high plasticity, silty CLAY with occasional shell fragments with some places thinly laminated ( 0.05 to 0.20 m ) with moderately strong to strong, grey claystone, moist. Thickness more than 15 m. SPT - N value ranges from 13 to 77 with average 21. USCS classification is CH. Thickness more than 20 m.
◊ Groundwater
Ground water level beneath the area can be divided as follows : • Shallow unconfined groundwater was encountered at 0.5 to 5 m
depth below ground level. Ground water level appears to be influenced by season and Bengawan Solo River. Ground water is likely to rise during periods of heavy rainfall, especially in rainy season.
• A confined ground water aquifer within alluvium SAND at 8 to 11 m depth.
5.2.3 Central Processing Facility, and Pad D
CPF and Pad D are located on a NW-SE trending ridge with elevation ranging from 35 to 40 m asl. The sites are underlain by River Terrace deposits ( RTCLAY1, RTCLAY2 & RTSAND ) which in turn is underlain by Undisturbed Lidah Formation ( LICLAY1, LICLAY2 & LICLAY3 ) and Disturbed Lidah Formation ( LICLAY 1D, LICLAY 2D & LICLAY 3D ) at possible fracture zone which may have been subjected to disturbance or faulting resulting in a clay of lower strength.
PT. Geoindo Geotechnical Survey - Banyu Urip Field, Cepu Block
MC / 001 / 02 / Rep.1. - Final Geotechnical and Topographic Survey Report - 16/09/02 41
Detail description of each stratum is as follows : ◊ TOP SOIL
Top soil generally consists of very soft , dark grey, high plasticity, silty CLAY and clayey SILT, roots remains, wet. Thickness about 0.5 to 1 m. USCS classification is CH. Undrained shear strength from hand vane is less than 10 kPa.
◊ RTCLAY1 - River Terrace Clay 1
Rtclay1 generally consists of firm to stiff, dark grey with yellow and white mottled, high plasticity, silty CLAY with occasional fine to coarse limestone gravel, moist to very moist. Peak undrained shear strength from hand vane test ranges from 45 to 168 kPa with average 76 kPa and remolded strength ranges from 12 to 56 kPa with average 37 kPa. SPT - N value ranges from 2 to 15 with average 6. USCS classification is CH. Thickness ranges from 2 to 7 m with average 5 m.
◊ RTCLAY2 - River Terrace Clay 2
Rtclay2 generally consists of stiff to very stiff, dark grey with yellow speckles, high plasticity, silty CLAY with slightly sandy and occasional fine to coarse, subrounded to subangular limestone gravel, moist. SPT - N value ranges from 5 to 31 with average 15. Peak undrained shear strength from hand vane test ranges from 100 to 260 kPa with average 170 kPa and remolded strength ranges from 30 to 92 kPa with average 56 kPa. USCS classification is CH. Thickness ranges from 3 to 9 m with average 6 m.
◊ RT SAND / SANDSTONE - River Terrace Sand / Sandstone
RT sand / sandstone generally consists of medium dense to dense, brownish grey to dark grey with white speckles, fine to medium grained, subrounded to subangular silty SAND with some places very weak to moderately weak, grey SANDSTONE, tuffaceous, wet. SPT - N value ranges from 9 to 50 with average 25. USCS classification is SM. Thickness ranges from 2 to 7 m with average 5 m. Volcanic material as little mixture on the river terrace sand layer ( RT Sand ) as tuffaceous or some volcanic material as matrix/gravel.
PT. Geoindo Geotechnical Survey - Banyu Urip Field, Cepu Block
MC / 001 / 02 / Rep.1. - Final Geotechnical and Topographic Survey Report - 16/09/02 42
◊ LICLAY1 - Yellowish Grey & Grey Lidah Clay 1
Liclay 1 generally consists of stiff to very stiff, dark grey to brownish grey and yellowish grey to greenish grey, high plasticity, silty CLAY, fresh to moderately - highly weathered with occasional shell fragments with some places thinly laminated ( 0.05 to 0.20 m ) with moderately strong to strong, grey claystone gravel, moist. SPT - N value ranges from 13 to 26 with average 23. Peak undrained shear strength from hand vane test ranges from 78 to 250 kPa with average 150 kPa and remolded strength ranges from 9 to 76 kPa with average 40. USCS classification is CH. Thickness ranges from 7 to 15 m.
◊ LICLAY2 - Blue Lidah Clay 2
Liclay2 generally consists of very stiff to hard, bluish grey, high plasticity, silty CLAY, fresh with occasional shell fragments with some places thinly laminated ( 0.05 to 0.20 m ) with moderately strong to strong, grey claystone, moist. Peak undrained shear strength from hand vane test ranges from 80 to 260 kPa with average 194 kPa and remolded strength ranges from 18 to 96 kPa with average 39. USCS classification is CH. SPT - N value ranges from 16 to 80 with average 29. Thickness ranges from 4 to 11 m.
◊ LICLAY3 - Green Lidah Clay 3
Liclay3 generally consists of very stiff to hard, greenish grey, high plasticity, silty CLAY, fresh with occasional shell fragments with some places thinly laminated ( 0.05 to 0.20 m ) with moderately strong to strong, grey claystone gravel, moist. Peak undrained shear strength from hand vane test ranges from 78 to 260 kPa with average 150 kPa and remolded strength ranges from 9 to 76 kPa with average 40. SPT - value ranges from 22 to 84 with average 28. USCS classification is CH. Thickness more than 20 m. The Lidah Clay has been disturbed and weakened within a 100 - 200 m wide possible fracture zone in areas where faulting may have occurred. The disturbed Lidah Clays are described below :
• LICLAY1 Disturb - Lidah Clay 1 Disturbed
Liclay 1D generally consist of stiff, dark grey to brownish grey and yellowish grey to greenish grey, high plasticity, silty CLAY with occasional shell fragments with some places thinly laminated ( 0.05 to 0.20 m ) with moderately strong to strong, grey claystone, moist. USCS classification is CH. SPT - N value
PT. Geoindo Geotechnical Survey - Banyu Urip Field, Cepu Block
MC / 001 / 02 / Rep.1. - Final Geotechnical and Topographic Survey Report - 16/09/02 43
ranges from 10 to 15 with average 12. Thickness ranges from 7 to 15 m.
• LICLAY2 Disturb - Lidah Clay 2 Disturbed
Liclay 2D generally consists of very stiff to hard, bluish grey, high plasticity, silty CLAY with occasional shell fragments with some places thinly laminated ( 0.05 to 0.20 m ) with moderately strong to strong, grey claystone, moist. USCS classification is CH. SPT - N value ranges from 16 to 80 with average 29. Thickness ranges from 4 to 11 m.
• LICLAY3 Disturb - Lidah Clay 3 Disturbed
Liclay 3D generally consists of stiff to very stiff, greenish grey, high plasticity, silty CLAY with occasional shell fragments with some places thinly laminated ( 0.05 to 0.20 m ) with moderately strong to strong, grey claystone, moist. Thickness more than 15 m. USCS classification is CH. SPT - N value ranges from 10 to 36 with average 19. Thickness more than 20 m.
◊ Groundwater
Ground water level beneath the area can be divided as follows : • Shallow unconfined groundwater was encountered at 1 to 4 m
depth below ground level. • A confined ground water aquifer within River Terrace SAND /
SANDSTONE at 10 to 17 m depth.
5.2.4 Pad B, C, and Pad F Pads C, F and Pad B are located in valleys between the NW-SE ridges with elevation ranging from 30 to 35 m asl. Pad B, C and Pad F are underlain by River Terrace deposits ( RTCLAY1 and RTCLAY2 ) which in turn is underlain by Lidah Formation ( LICLAY1, LICLAY2 ). The RTSand / Sandstone which occurs beneath the ridges is absent in these intervening valleys.
PT. Geoindo Geotechnical Survey - Banyu Urip Field, Cepu Block
MC / 001 / 02 / Rep.1. - Final Geotechnical and Topographic Survey Report - 16/09/02 44
Detail description of each stratum as follows : ◊ TOP SOIL
Top soil generally consists of very soft, dark grey, high plasticity, silty CLAY and clayey SILT, root remains, wet. Thickness about 0.4 to 1 m. USCS classification is CH. Undrained shear strength from hand vane is less than 10 kPa.
◊ RTCLAY1 - River Terrace Clay 1 Rtclay1 generally consists of soft to firm with some places become stiff, dark grey with yellow and white mottled, high plasticity, silty CLAY with occasional fine to coarse limestone gravel, moist to very moist. SPT - N value ranges from 2 to 10 with average 7. Peak undrained shear strength from hand vane test ranges from 45 to 168 kPa with average 76 kPa and remolded strength ranges from 12 to 56 kPa with average 37 kPa. USCS classification is CH. Thickness ranges from 2 to 8 m with average 5 m.
◊ RTCLAY2 - River Terrace Clay 2
Rtclay2 generally consists of stiff to very stiff, dark grey with yellow speckles, high plasticity, silty CLAY with slightly sandy and occasional fine to coarse, subrounded to subangular limestone gravel, moist. SPT - N value ranges from 8 to 15. Peak undrained shear strength from hand vane test ranges from 100 to 260 kPa with average 170 kPa and remolded strength ranges from 30 to 92 kPa with average 56 kPa. USCS classification is CH. Thickness ranges from 4 to 14 m with average 10 m.
◊ LICLAY1 - Yellowish Grey and Grey Lidah Clay 1
Liclay1 generally consists of stiff to hard, dark grey to brownish grey and yellowish grey to greenish grey, high plasticity, silty CLAY with occasional shell fragments with some places thinly laminated ( 0.05 to 0.20 m ) with moderately strong to strong, grey claystone, moist. USCS classification is CH. SPT - N value ranges from 13 to 77 with average 21. Thickness more than 15 m.
◊ LICLAY2 - Blue Lidah Clay 2
Liclay2 generally consists of stiff to hard, bluish grey, high plasticity, silty CLAY with occasional shell fragments with some places thinly laminated ( 0.05 to 0.20 m ) with moderately strong to strong, grey claystone, moist. USCS classification is CH. Peak undrained shear
PT. Geoindo Geotechnical Survey - Banyu Urip Field, Cepu Block
MC / 001 / 02 / Rep.1. - Final Geotechnical and Topographic Survey Report - 16/09/02 45
strength from hand vane test ranges from 78 to 260 kPa with average 150 kPa and remolded strength ranges from 9 to 76 kPa with average 40. SPT - N value ranges from 17 to 77 with average 23. Thickness more than 10 m.
◊ Groundwater
Ground water level beneath the area occurs as shallow unconfined groundwater ( water logged ) at 1 to 4 m depth below ground level in rainy season and would be dry in dry season. No confined ground water aquifer was found as expected in view of absence of River Terrace sands / sandstone.
5.2.5 Export Pipeline Shoreline Facility
Export Pipeline Shoreline Facility is located on the flat coastal plain along shoreline near Mudi Metering Station Facility Tuban. Stratum beneath Export Pipeline Shoreline Facility as follows: o Firm to stiff, brownish yellow to yellowish brown, high plasticity, silty
CLAY with slightly gravel, moist. Thickness is about 1.2 m. USCS classification is CH.
o Very loose to medium dense, yellowish white to pale white, CORAL
SAND composed at coral, algae, and foraminifer that were mixed in very soft CLAY, wet. Thickness is about 9 m. USCS classification is CH. SPT - N value ranges from 2 to 15 with average 5.
o Very weak to moderately strong, some places become strong,
yellowish white to white, LIMESTONE. Thickness is about 3 m. USCS classification is CH. SPT - N value ranges from 15 to 125 with average 54.
o Stiff to very stiff with some places become hard, greyish yellow to
yellow and greenish grey with depth, silty CLAY with intercalations of weak to moderately weak, CLAYSTONE. Thickness more than 15 m. USCS classification is CH. SPT - N value ranges from 13 to 19 with average 15.
o Groundwater level found close to surface at 0.5 to 0.1 m depth below
ground level.
PT. Geoindo Geotechnical Survey - Banyu Urip Field, Cepu Block
MC / 001 / 02 / Rep.1. - Final Geotechnical and Topographic Survey Report - 16/09/02 46
5.2.6 Bengawan Solo River Crossing
◊ TOP SOIL
Top soil generally consists of very soft , dark grey, high plasticity, silty CLAY and clayey SILT, roots remains, wet. Thickness about 0.4 to 0.5 m. USCS classification is CH. Undrained shear strength from hand vane is less than 10 kPa.
◊ ALLCLAY1 - Alluvial Clay 1
Allclay1 generally consists of firm to stiff, dark grey to yellowish brown, high plasticity, silty CLAY with occasional fine to coarse limestone gravel, moist to very moist. SPT - N value ranges from 2 to 12 with average 6. USCS classification is CH. Thickness ranges 3 to 7 m with average 5 m.
◊ ALLSAND - Alluvial Sand
Allsand generally consists of loose to medium dense, brownish grey to dark grey with white speckles, fine to medium grained, subrounded to subangular silty SAND, moist. Thickness ranges 3 to 10 m with average 8 m. USCS classification is SM. SPT - N value ranges from 4 to 22 with average 13.
◊ LICLAY1 - Yellowish Grey and Grey Lidah Clay 1
Liclay2 generally consists of stiff to hard, dark grey to brownish grey and yellowish grey to greenish grey, high plasticity, silty CLAY with occasional shell fragments with some places thinly laminated ( 0.05 to 0.20 m ) with moderately strong to strong, grey claystone, moist.. USCS classification is CH. SPT - N value ranges from 7 to 23 with average 17. Thickness more than 20 m.
◊ Groundwater Ground water level about 2 to 3 m depth at time of investigation which is influenced by adjacent Bengawan Solo River.
5.2.7 Export Pipeline Route
The Geological Map of Bojonegoro and Tuban indicates the geology along the pipeline route to be divided into 3 sections; namely Section Banyuurip to Rengel, Section Rengel to Pucangan and Section
PT. Geoindo Geotechnical Survey - Banyu Urip Field, Cepu Block
MC / 001 / 02 / Rep.1. - Final Geotechnical and Topographic Survey Report - 16/09/02 47
Pucangan to Export Pipeline Shoreline Facility ( See Drawing Nos. MC / 001 / GEO / 017 to 020 ).
5.2.7.1 Section Banyuurip to Rengel
Geology beneath Banyuurip to Rengel section consists of Alluvium, and Lidah Formation ( See Drawing No. MC / 001 / GEO / 018 to 020 ). The river alluvium generally consists of firm to stiff, yellow brown to grey, plastic clays / silts. Thickness is about 8 - 12 m. The base of the alluvium is generally defined by a thin sand layer about 1 m thick and some places thickens up to 8 m. This thickening sand may represent an old river channel close to the existing river. Generally Lidah Formation may consist of stiff to hard, yellowish to greenish grey and bluish grey, high plasticity, silty CLAY with occasional shell fragments with some places thinly laminated ( 0.05 to 0.20 m ) with moderately strong to strong, grey claystone, and limestone gravel. Thickness more than 70 m. Ground water level may be found between 1 m to 2 m below ground level.
5.2.7.2 Section Rengel to Pucangan
Geology beneath the Rengel to Pucangan section is mainly the weathered zone of Paciran Formation, which consists of stiff to very stiff, brown to light grey, low to medium plasticity, gravelly CLAY and clayey SILT in some places limestone boulders are common. Soil thickness ranges from 1 m to 5 m ( See Drawing No. MC / 001 / GEO / 017 to 018 ).
The lower part is mainly composed of fresh Paciran Formation which consist of moderately weak to moderately strong, grayish white, grey, brown, limestone with algae, coral, larger foraminifers. Thickness approximately 100 m. Ground water level may be found between 10 m to 25 m below ground level.
PT. Geoindo Geotechnical Survey - Banyu Urip Field, Cepu Block
MC / 001 / 02 / Rep.1. - Final Geotechnical and Topographic Survey Report - 16/09/02 48
5.2.7.3 Section Pucangan to Export Pipeline Shoreline Facility
Geology beneath Pucangan to Export Pipeline Shoreline Facility is underlain by alluvium which in turn underlain by Kujung Formation ( See Drawing No. MC / 001 / GEO / 017 ). Geologically, upper part is mainly composed of Alluvium which consist of firm to stiff, low to medium plasticity, clayey SILT, occasionally sand and gravel. Thickness about 10 to 15 m. Lower part is composed of Kujung Formation, which consists of stiff to very stiff, greenish grey with brown mottled, silty CLAY clayey SILT with some places become very weak to moderately strong Limestone. Thickness more than 30 m. Shallow groundwater level is may be found between 2 to 3 m below ground level and Deep groundwater level between 25 m to 50 m below ground level.
5.3 Faulting
The regional geological maps of Bojonegoro quadrangles, do not indicate presence of faulting at Banyu Urip area. Pertamina (Yohanes), 1997, made a special study at Cepu and surrounding area identified folding and faulting. Folding axis have E - W orientation such as Balun, Tobo, Tambakrama anticlines. Faults of the area can be divided into two patterns, namely strike slip fault with SW - NE orientation and reverse/ inverse fault with E - W orientation. These faults were considered to have been the result of a tectonic compression regime in Neogene age. This tectonic regime caused reactivation of normal faults with the basement rocks at depth. These normal faults became inverse faults which continued upwards to Neogene formations. A possible NW - SE fault was found by the current geotechnical investigation indicated by finding of slickensided / fracture zones ( BHCP 32, 33, 34, 35, 39, 40, 41, 46, 47, and 49 ) and a lower strength disturbed zones indicated by Standard Penetration Test (SPT) with N values which becoming lower than undisturbed layer of the same geological strata. The E-W possible fault which was indicated from Exxon 3D seismic team was believed to be originated by a non tectonic gravitational deformation due to difference of rate of consolidation of young Pleistocene of sediment.
PT. Geoindo Geotechnical Survey - Banyu Urip Field, Cepu Block
MC / 001 / 02 / Rep.1. - Final Geotechnical and Topographic Survey Report - 16/09/02 49
This gravity fault may produce slow earth settlement movement but global analogies show that these events are not typically of engineering significance **). It is recommended that for sensitive areas such as CPF location high resolution survey be carried out combined with normal geotechnical investigation ( boreholes, dutch cones, test pits ). The geotechnical investigation concluded that the Central Processing Facility locations ( both previous and new ) may have been subjected to faulting and be affected by faults with what appears to be fault zones 100 - 200 m wide with soils weaker by about 50 % within the disturbed zone. It is recommended that the sensitive structures or parts of the development take this into account for detailed design and if possible be relocated to an area free of possible faults and disturbance. It is recommended high resolution seismic survey and full geotechnical investigations ( including topographic survey ) be carried out for new location(s). Further work and study is required to assess whether these possible faults are still active. However, it should be noted that studies by MCL / Exxon Mobil ( meeting July 2002 ) seem to indicate that these faults are not tectonic but geological basin subsidence related and MCL / Exxon consider these to pose no seismic and engineering hazard to the development.
6. GEOTECHNICAL ENGINEERING ASSESSMENT 6.1 Site Characterisation
This section of the report discusses the various geotechnical aspects that need to be considered for follow on design of the facilities at Banyu Urip and Tuban as well as the pipeline. The geotechnical assessment was based on the information obtained from the current desk study and geotechnical investigation which was based on a limited conceptual layout design. Further detailed investigations may need to be carried out in support of detailed design undertaken by Mobil Cepu Ltd. and their EPC contractors, when detailed design information is available, however this assessment is adequate for preliminary design purposes and EPC tender.
* Seismotectonic Model / Seismic Hazard explained by Exxon Mobil 3D seismic team.
PT. Geoindo Geotechnical Survey - Banyu Urip Field, Cepu Block
MC / 001 / 02 / Rep.1. - Final Geotechnical and Topographic Survey Report - 16/09/02 50
In addition, further and much more detailed geotechnical analysis and engineering will need to be carried out for detailed design and construction.
6.1.1 Siting of the Development
The geotechnical investigation was carried out for a conceptual development produced by Flour Daniel for Mobil Cepu Ltd. The main development area is concentrated at Banyu Urip with the water intake structure nearby. An 80 km pipeline connects the development area to a metering station on the beach near Tuban which will then be connected to offshore loading facilities. A preliminary study was carried out at start of investigation in two stages by Geoindo using 3D seismic shothole data. Geological plans with interpreted possible faults or dislocations and cross sections were produced for the main development at Banyu Urip. The CPF location was moved by MCL from the original position to a new position on top of a flat topped ridge to northwest : ◊ In order to avoid excess cut and fill earthworks which would have
resulted from original position which straddled ridge and valleys. ◊ In order to avoid building on thick fill which would have resulted in
potentially large and uneven settlements. ◊ In order to avoid possible faults identified from seismic shothole cross-
sections. Subsequently, the geotechnical investigation was completed with boreholes, dutch cones, test pits and insitu tests including limited seismic survey at the new CPF location. New and more complete information on the geology was obtained which indicated possible faulting. A northwest-southeast fault with small branch faults possibly runs through the whole length of the new CPF location with a 100 - 200 m wide zone of disturbed ground with lower strength and heavily slickensided from previous fault / ground movements ( see Drawing No. MC / 001 / GEO / 014 ). The CPF location should avoid straddling any such young faults should they be proven to be currently active in terms of applicable Building Code
PT. Geoindo Geotechnical Survey - Banyu Urip Field, Cepu Block
MC / 001 / 02 / Rep.1. - Final Geotechnical and Topographic Survey Report - 16/09/02 51
requirements as they could act as lines of weakness which may become the focus or concentration of higher seismic energies during earthquake events. Ground rupture, large ground accelerations and ground shaking, large and uneven differential movements could all potentially occur within any active fault zone if a particularly damaging earthquake event were to occur. In view of the development being located within an active seismic area it is considered that such an event could occur within the lifetime of the proposed development.
Consideration could be given to carrying out further studies such as additional drilling and high resolution seismic surveys to confirm the existence and better define the possible faulting identified from the geotechnical investigation. However, the proof of faulting and interpreted fault locations is already strong enough to consider moving the CPF to a new location which does not straddle active faults or fault zones. Therefore, we recommend that the CPF be moved to a new location. If MCL decide to move the CPF location then 1 - 2 new locations should be investigated using high resolution seismic survey. If the site(s) are clear of faults and the CPF can be moved to avoid any identified faults / fault zones then a more thorough geotechnical investigation should be carried out similar to that carried out for the CPF location in this recent geotechnical investigation.
6.1.2 Ground Model
The engineering geological aspects together with ground and groundwater conditions have been described in previous sections 3 and 5. For the geotechnical engineering assessment a series of simplified ground models were developed as described below and shown in Figure 5 - Ground Models. A. Banyu Urip - Main Development
There are 3 basic ground models with minor variations depending on location :
PT. Geoindo Geotechnical Survey - Banyu Urip Field, Cepu Block
MC / 001 / 02 / Rep.1. - Final Geotechnical and Topographic Survey Report - 16/09/02 52
1. Alluvial Floodplain + 20 to 25 m asl Flat, prone to flooding upto 1 - 2 m with northward flowing streams.
The floodplain is that of the Bengawan Solo River and is covered with rice field cultivation, The floodplain is underlain by 10 - 16 m soft-firm becoming stiff alluvial clays / silts with a basal sand layer ( 2 - 4 m thick ) which overlies the Lidah Clay Formation. Sub artesian groundwater is found within the alluvial sands.
2. NW - SE Ridges + 40 - 50 m asl Flat topped or rounded NW - SE trending ridges. The ridges are generally dry with no streams. Mixed agriculture is cultivated ( including sweetcorn ) and is underlain by River Terrace deposits consisting of a upper dark grey blackish and lower yellow silts and clays with total combined thickness 11 m and a thin basal sandstone ( 2 - 7 m thick ) at about elevation + 30 - 31 m asl with total thickness of 10 - 18 m. The upper layers are prone to swelling. The River Terrace deposits are underlain by the green and blue very stiff clays of the Lidah Formation. The upper part is often weathered or altered to yellow / orange coloured clays. Sub-artesian groundwater is found within the sandstone / sand layer.
3. NW - SE Valleys + 25 - 35 m asl Flat bottomed, gently sloping valleys trending NW - SE parallel to and in between the NW - SE ridges.
A typical ridge - valley system. The valleys contain northward flowing streams which originate from springs located at + 30 - 31 m or higher within the River Terrace sandstone / sand layer which occurs beneath the ridges. River Terrace deposits, similar to dark grey - blackish and yellow soils found at the ridge, underlie the valleys. However, the basal sandstone / sands ( found beneath ridges ) is absent. The River Terrace deposits lie directly on top of the green and blue clays of the Lidah Formation.
PT. Geoindo Geotechnical Survey - Banyu Urip Field, Cepu Block
MC / 001 / 02 / Rep.1. - Final Geotechnical and Topographic Survey Report - 16/09/02 53
The valleys are generally dry with some places having surface run off.
The whole area is possibly intersected by a series or NW-SE, E-W and NE-SW trending lineaments together with disturbance and dislocations within geological strata beneath the area at certain locations that could be related to possible faults and disturbed ground adjacent faults. The soils within these zones is the same geologically as outside these zones other than geotechnically the disturbance has resulted in much slickensiding and movement which in turn has produced soils of lower strength and stiffness than undisturbed adjacent soils from same geological strata.
B. Pipeline Route
Geotechnical investigation along the pipeline route was limited to :
◊ boreholes, dutch cones and trial pits at river ( Bengawan Solo River ) or rail / road crossings;
◊ shallow resistivity testing ( electric & thermal ) at about 1 km intervals.
The surface geology has been obtained from published geological maps and plans with long section have been plotted in Drawing Nos. MC / 001 / GEO / 017 to 020 along the whole length of the route. No topographic survey was available at time of geotechnical investigation and it is recommended that a detailed topographic survey be undertaken along the pipeline route “right of way” ( ROW ) prior to final design and construction. No geotechnical models were produced other than for the crossings.
C. Tuban Metering Station
The proposed metering station will be located on beach deposits adjacent the shore near Tuban which consist of sands, gravels and corals of variable density but generally loose in top 5 - 10 m with high groundwater levels almost at ground level.
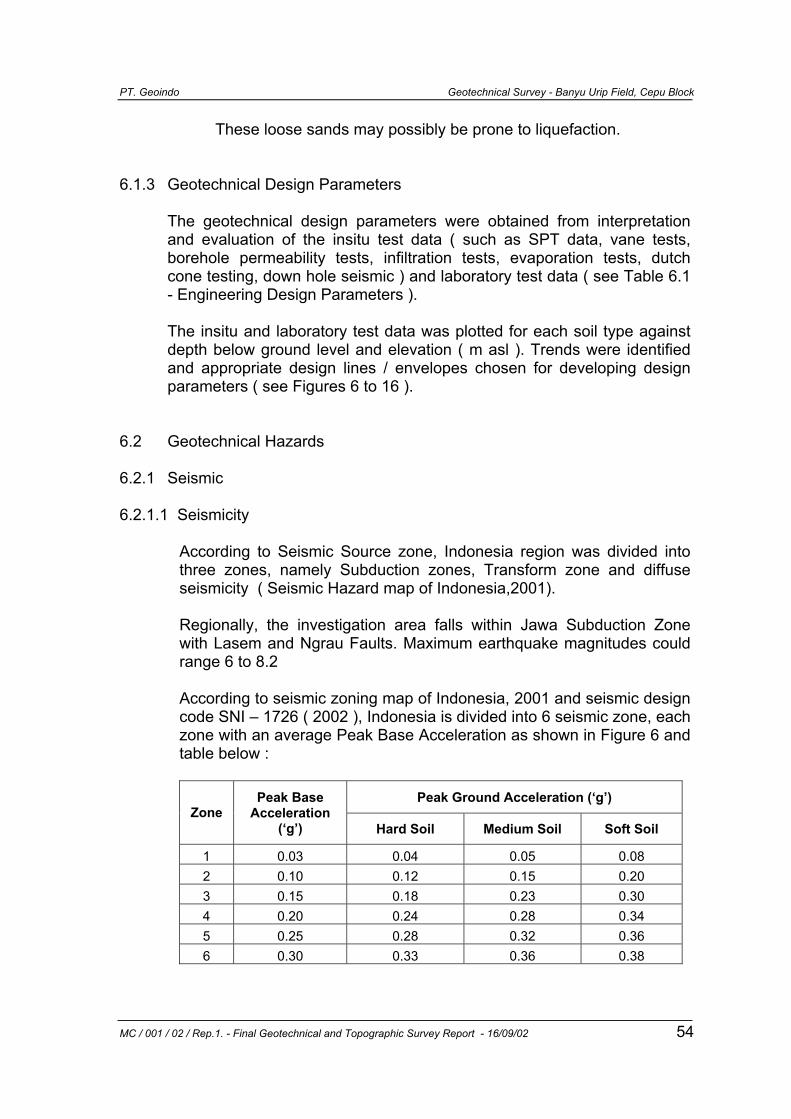
PT. Geoindo Geotechnical Survey - Banyu Urip Field, Cepu Block
MC / 001 / 02 / Rep.1. - Final Geotechnical and Topographic Survey Report - 16/09/02 54
These loose sands may possibly be prone to liquefaction. 6.1.3 Geotechnical Design Parameters
The geotechnical design parameters were obtained from interpretation and evaluation of the insitu test data ( such as SPT data, vane tests, borehole permeability tests, infiltration tests, evaporation tests, dutch cone testing, down hole seismic ) and laboratory test data ( see Table 6.1 - Engineering Design Parameters ). The insitu and laboratory test data was plotted for each soil type against depth below ground level and elevation ( m asl ). Trends were identified and appropriate design lines / envelopes chosen for developing design parameters ( see Figures 6 to 16 ).
6.2 Geotechnical Hazards 6.2.1 Seismic
6.2.1.1 Seismicity
According to Seismic Source zone, Indonesia region was divided into three zones, namely Subduction zones, Transform zone and diffuse seismicity ( Seismic Hazard map of Indonesia,2001). Regionally, the investigation area falls within Jawa Subduction Zone with Lasem and Ngrau Faults. Maximum earthquake magnitudes could range 6 to 8.2 According to seismic zoning map of Indonesia, 2001 and seismic design code SNI – 1726 ( 2002 ), Indonesia is divided into 6 seismic zone, each zone with an average Peak Base Acceleration as shown in Figure 6 and table below :
Peak Ground Acceleration (‘g’)
Zone Peak Base
Acceleration (‘g’) Hard Soil Medium Soil Soft Soil
1 0.03 0.04 0.05 0.08 2 0.10 0.12 0.15 0.20 3 0.15 0.18 0.23 0.30 4 0.20 0.24 0.28 0.34 5 0.25 0.28 0.32 0.36 6 0.30 0.33 0.36 0.38
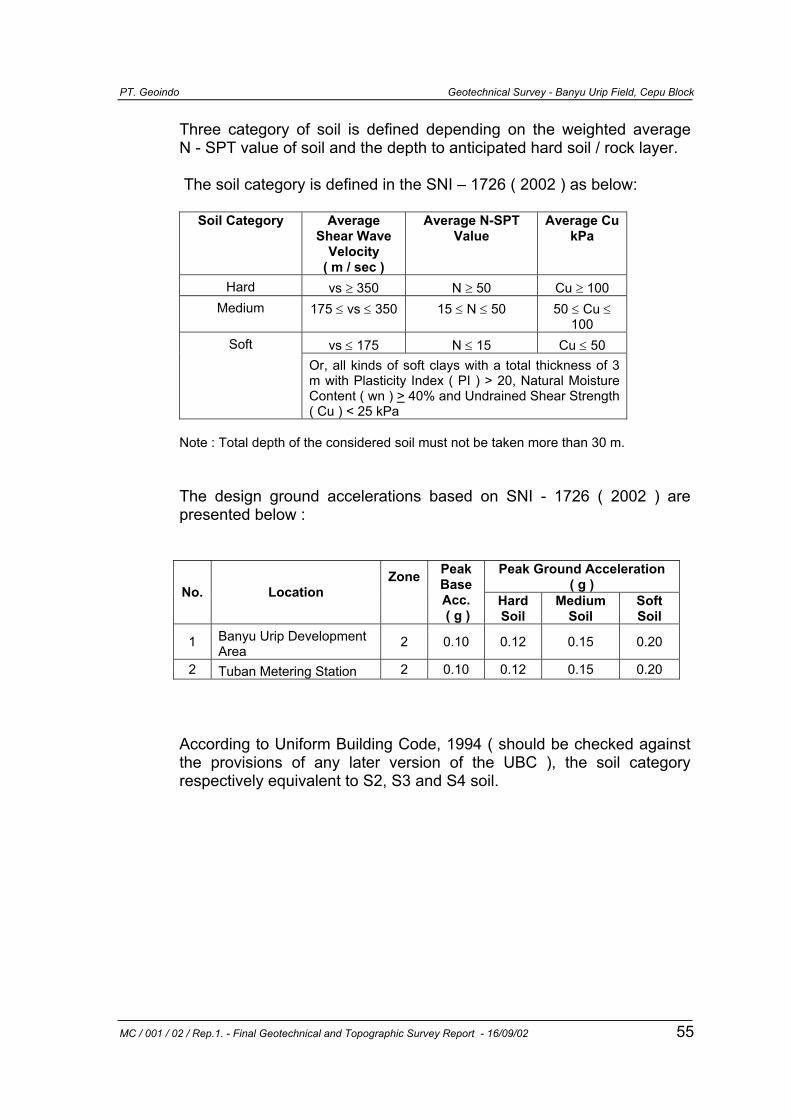
PT. Geoindo Geotechnical Survey - Banyu Urip Field, Cepu Block
MC / 001 / 02 / Rep.1. - Final Geotechnical and Topographic Survey Report - 16/09/02 55
Three category of soil is defined depending on the weighted average N - SPT value of soil and the depth to anticipated hard soil / rock layer. The soil category is defined in the SNI – 1726 ( 2002 ) as below:
Soil Category Average Shear Wave
Velocity ( m / sec )
Average N-SPT Value
Average Cu kPa
Hard vs ≥ 350 N ≥ 50 Cu ≥ 100 Medium 175 ≤ vs ≤ 350 15 ≤ N ≤ 50 50 ≤ Cu ≤
100 Soft vs ≤ 175 N ≤ 15 Cu ≤ 50
Or, all kinds of soft clays with a total thickness of 3 m with Plasticity Index ( PI ) > 20, Natural Moisture Content ( wn ) > 40% and Undrained Shear Strength ( Cu ) < 25 kPa
Note : Total depth of the considered soil must not be taken more than 30 m. The design ground accelerations based on SNI - 1726 ( 2002 ) are presented below :
Peak Ground Acceleration ( g ) No. Location
Zone
Peak Base Acc. ( g )
Hard Soil
Medium Soil
Soft Soil
1 Banyu Urip Development Area
2 0.10 0.12 0.15 0.20
2 Tuban Metering Station 2 0.10 0.12 0.15 0.20
According to Uniform Building Code, 1994 ( should be checked against the provisions of any later version of the UBC ), the soil category respectively equivalent to S2, S3 and S4 soil.
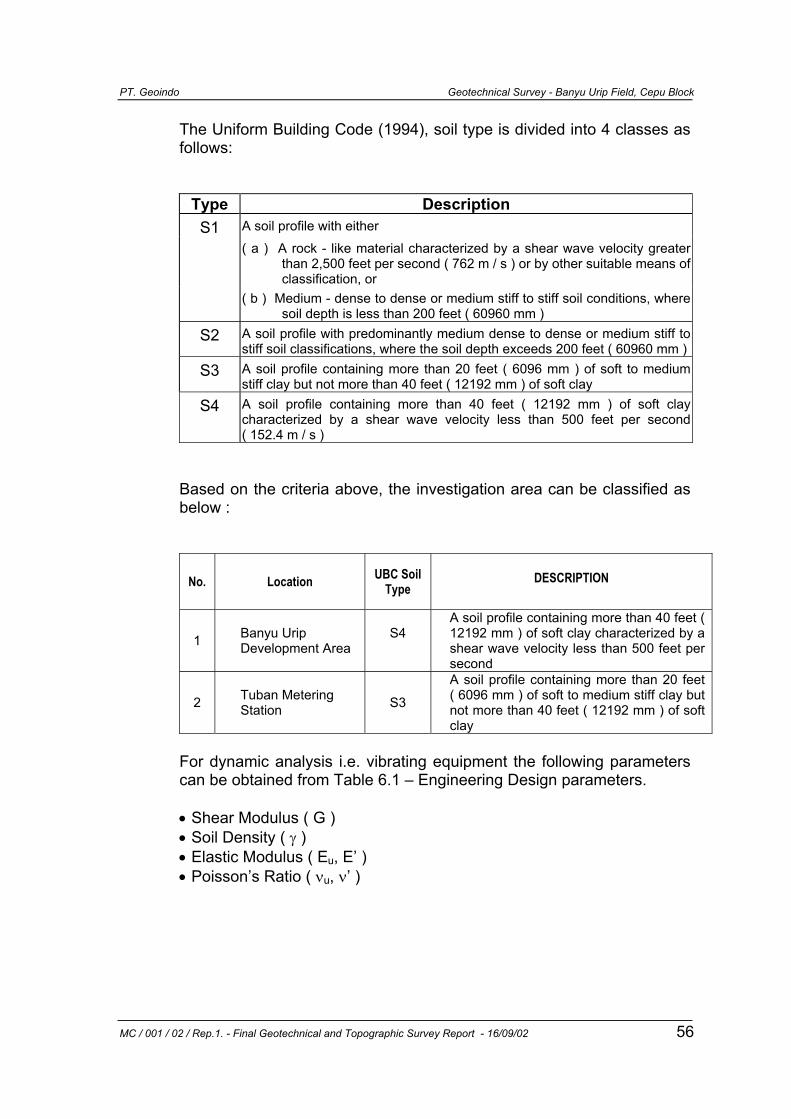
PT. Geoindo Geotechnical Survey - Banyu Urip Field, Cepu Block
MC / 001 / 02 / Rep.1. - Final Geotechnical and Topographic Survey Report - 16/09/02 56
The Uniform Building Code (1994), soil type is divided into 4 classes as follows:
Type Description S1 A soil profile with either
( a ) A rock - like material characterized by a shear wave velocity greater than 2,500 feet per second ( 762 m / s ) or by other suitable means of classification, or
( b ) Medium - dense to dense or medium stiff to stiff soil conditions, where soil depth is less than 200 feet ( 60960 mm )
S2 A soil profile with predominantly medium dense to dense or medium stiff to stiff soil classifications, where the soil depth exceeds 200 feet ( 60960 mm )
S3 A soil profile containing more than 20 feet ( 6096 mm ) of soft to medium stiff clay but not more than 40 feet ( 12192 mm ) of soft clay
S4 A soil profile containing more than 40 feet ( 12192 mm ) of soft clay characterized by a shear wave velocity less than 500 feet per second ( 152.4 m / s )
Based on the criteria above, the investigation area can be classified as below :
No. Location UBC Soil Type
DESCRIPTION
1 Banyu Urip Development Area
S4
A soil profile containing more than 40 feet ( 12192 mm ) of soft clay characterized by a shear wave velocity less than 500 feet per second
2 Tuban Metering Station S3
A soil profile containing more than 20 feet ( 6096 mm ) of soft to medium stiff clay but not more than 40 feet ( 12192 mm ) of soft clay
For dynamic analysis i.e. vibrating equipment the following parameters can be obtained from Table 6.1 – Engineering Design parameters. • Shear Modulus ( G ) • Soil Density ( γ ) • Elastic Modulus ( Eu, E’ ) • Poisson’s Ratio ( νu, ν’ )
PT. Geoindo Geotechnical Survey - Banyu Urip Field, Cepu Block
MC / 001 / 02 / Rep.1. - Final Geotechnical and Topographic Survey Report - 16/09/02 57
6.2.1.2 Liquefaction
Liquefaction under earthquake loading will occur in loose to very loose poorly graded sand with high ground water level. There are only two sand layers in the project area : river terrace weathered sandstone and alluvium sand. Even though the ground water level is high but since mostly both are consisting of well graded, medium dense to very dense (N value of river terrace sand between 20 to 40 and 15 to 30 for alluvium sand) silty sand then liquefaction is likely not to occur under earthquake loading. Underground river crossings along the proposed export pipeline are recommended to be constructed below the sand layer to avoid liquefaction. The shore line facility in Tuban will sit on about 8 meter thick of loose gravel - clay sand ( N value of less than 3) underlain by a hard limestone and very stiff clay. Buildings over this area are recommended to be supported on piles to a depth of > 8 meter below the ground to avoid possible liquefaction.
6.2.1.3 Faulting and Ground Rupture
◊ Faulting
Based on the present investigation, the possible faults have mainly NW - SE orientation with secondary N-S orientation. An E - W orientated fault was also identified. To identify a fault as active, potentially active, or inactive (dead), US Nuclear Regulatory Commission (NRC) consider a fault active if it is undergoing creep, or has undergone movement in the past 35,000 years ( during Holocene epoch ) or has more than 500,000 years of history or connected to a capable / active fault. International Atomic Energy Commissions ( IAEC ) considers a fault active if it has undergone movement in late Quaternary, if there is a topographic evidence with located events, if there is creep along the fault or if it is connected to a capable fault. The Alguist – Priolo Earthquake Fault Zoning Act of 1972 for California defines an “active” fault as one which has surface rupture younger than 11,000 years and requires that structures for human
PT. Geoindo Geotechnical Survey - Banyu Urip Field, Cepu Block
MC / 001 / 02 / Rep.1. - Final Geotechnical and Topographic Survey Report - 16/09/02 58
occupancy cannot be placed over an active fault and must be set back from the active fault, in general case, by at least 50 feet. Based on youngest slickensided evidence which was found in River Terrace deposits ( Rtclay2 ) deposited about + 500,000 y.a, the faults at investigation area could be potentially active and further investigation is recommended. The Terrace deposits and alluvium should be dated and from presence of slickensides and dislocations within the strata it can then be determined more accurately when these were last subjected to movement.
As a consequence all structures / buildings should avoid being located on top of faults or fault / fracture zones, if they are proven to be active.
◊ Ground Rupture
Based on Geoindo geotechnical investigation the throw of dislocations / ground rupture of faults was interpreted to be about 3 to 5 m. However, Exxon from seismic analysis identified throws on faults of between 60 ft to 100 ft ( 20 - 30 m ) at deeper layers. It is difficult to predict amount of ground rupture in that faults will tend to move by rupture in response to specific isolated earthquake events. However, in earthquake events rupture or movement is likely to re-occur at existing faults or fault zones. Therefore, pipelines should be designed accordingly when straddling active faults / fault zones and structures either moved to avoid active faults / fault zones or designed to withstand such events.
6.2.1.4 Seismic Compaction and Settlement
Seismic compaction and settlement will mostly happen if an uncompacted or loose, poorly graded and poorly cemented sand is shaken by an earthquake. In general, well graded sand layers in the project area are medium dense to dense and even some layers such as the volcanic originated sand is cemented, thus seismic compaction and settlement is unlikely to happen. Seismic compaction and settlement will not affect the clay soils which are predominant in the project area.
PT. Geoindo Geotechnical Survey - Banyu Urip Field, Cepu Block
MC / 001 / 02 / Rep.1. - Final Geotechnical and Topographic Survey Report - 16/09/02 59
6.2.1.5 Seismic Shaking
Seismic shaking should take into account the ground acceleration which has been described in previous section. Shaking is generally accentuated at or in close proximity of active faults or fault zones thereby possibly exceeding design acceleration. Therefore vibration or settlement sensitive equipment or structures should be located away from active faults. In view of possible faults at site, some sort of safety trigger could be considered for temporary shutdown and sealing off of pipeline and sensitive facilities during an earthquake event.
6.2.2 Natural Slope Instability and Landslides
In general there is no sign of landslide and slope instability in the project area especially in the north-western part where the morphology is mostly flat and gently sloping. Slope failures were only found in the south eastern part outside of the project area, which consists of NW-SE trending ridges and valleys. Slope failures were found where the side slope of ridges is more than 40 o. Slope failures can be triggered by over steep slopes as well as if the soil stratum consists mainly of clay which tend to crack in dry season and become slurry in the wet season. This wet / dry regime may induce shallow flow sides where the surface clays are over wetted by heavy rain, surface runoff, increased soil moisture content and decreased strength due to seasonal cracking / dessication.
6.2.3 Flooding The flat plain in the north-west part of the project area is actually an area which is usually flooded every year. Flooding is caused by the rising of Bengawan Solo river water level in the rainy season. In 1990 Bengawan Solo river had once flooded the area up to 23 meters above msl compared to the average level of the area of only 20.5 to 22.0 meter above msl. Water level monitoring during the investigation showed that a rise of water level of Bengawan Solo river higher than 20.5 meters above msl
PT. Geoindo Geotechnical Survey - Banyu Urip Field, Cepu Block
MC / 001 / 02 / Rep.1. - Final Geotechnical and Topographic Survey Report - 16/09/02 60
will only take 6 hours to flood the north-east part of the project area ( see Appendix 1F - Water Level Monitoring ). Safe elevation above the flood level is 24.75 meters above msl as has been described by the local population near to Sudu bridge as the worst flood level. For the construction of the reservoir embankment purposes the crest embankment should be more than 25.25 meters above msl considering settlement and consolidation which might occur.
6.2.4 Regional Subsidence Regional subsidence in the project area can be expected to occur due to the pumping out of the oil from the ground below the area. Subsidence is likely to be progressive becoming greater with time as more oil is pumped out of oil reservoirs beneath the ground unless re-injection of water is carried out to limit the effect. If the water to be pumped back in is greater in volume than the volume of oil to be pumped out (as it is planned to be carried out in Banyu Urip based on Exxon oil exploration method) the subsidence expected will not occur. The subsidence may become more significant as the area is heavily faulted. Existing faults could be potentially reactivated and become more damaging or prone to movement in large earthquake events. It is recommended that regional ground level monitoring be carried spread over the project area during the oil exploitation operation to anticipate any sudden subsidence which might occur. Since the subsidence might occur over a large area, the monitoring will have to be referenced to benchmarks which are assumed will not be influenced by the subsidence. The positions of these benchmarks will have to be between 10 km to 20 km from the center of the exploitation activity depending on preliminary observations to avoid subsidence influence to the benchmarks.
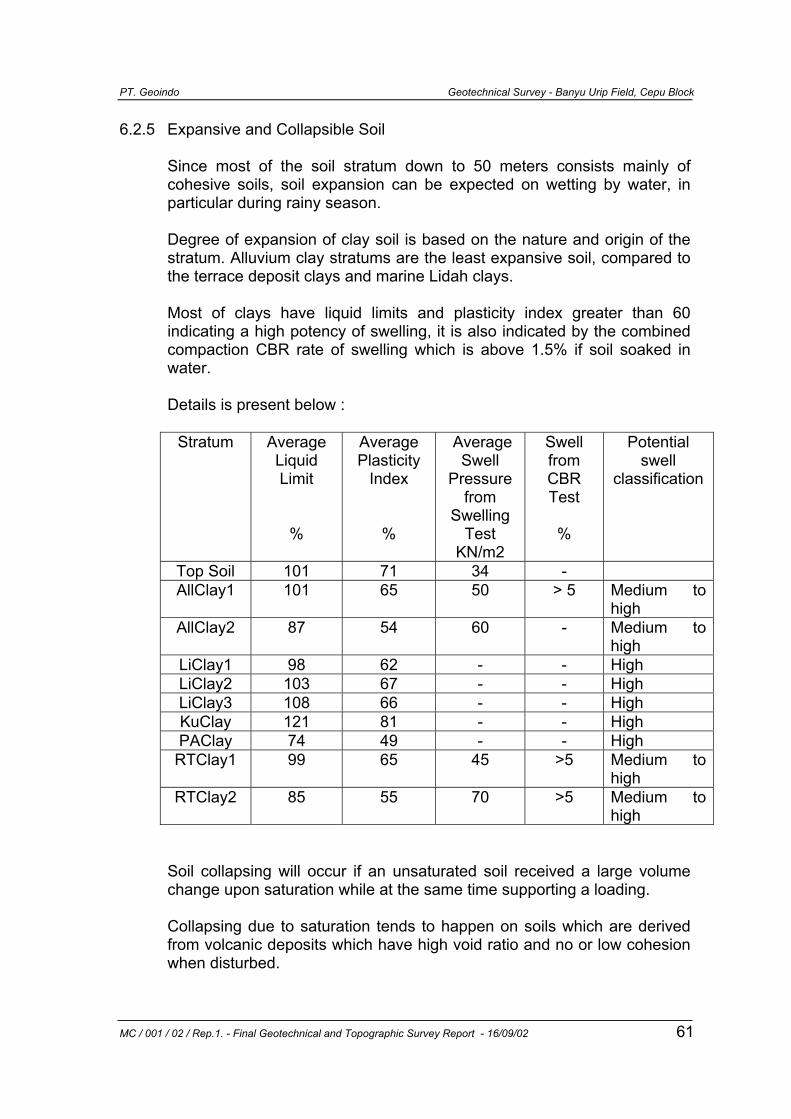
PT. Geoindo Geotechnical Survey - Banyu Urip Field, Cepu Block
MC / 001 / 02 / Rep.1. - Final Geotechnical and Topographic Survey Report - 16/09/02 61
6.2.5 Expansive and Collapsible Soil
Since most of the soil stratum down to 50 meters consists mainly of cohesive soils, soil expansion can be expected on wetting by water, in particular during rainy season. Degree of expansion of clay soil is based on the nature and origin of the stratum. Alluvium clay stratums are the least expansive soil, compared to the terrace deposit clays and marine Lidah clays. Most of clays have liquid limits and plasticity index greater than 60 indicating a high potency of swelling, it is also indicated by the combined compaction CBR rate of swelling which is above 1.5% if soil soaked in water. Details is present below :
Stratum Average Liquid Limit
%
Average Plasticity
Index
%
Average Swell
Pressure from
Swelling Test
KN/m2
Swell from CBR Test
%
Potential swell
classification
Top Soil 101 71 34 - AllClay1 101 65 50 > 5 Medium to
high AllClay2 87 54 60 - Medium to
high LiClay1 98 62 - - High LiClay2 103 67 - - High LiClay3 108 66 - - High KuClay 121 81 - - High PAClay 74 49 - - High
RTClay1 99 65 45 >5 Medium to high
RTClay2 85 55 70 >5 Medium to high
Soil collapsing will occur if an unsaturated soil received a large volume change upon saturation while at the same time supporting a loading. Collapsing due to saturation tends to happen on soils which are derived from volcanic deposits which have high void ratio and no or low cohesion when disturbed.
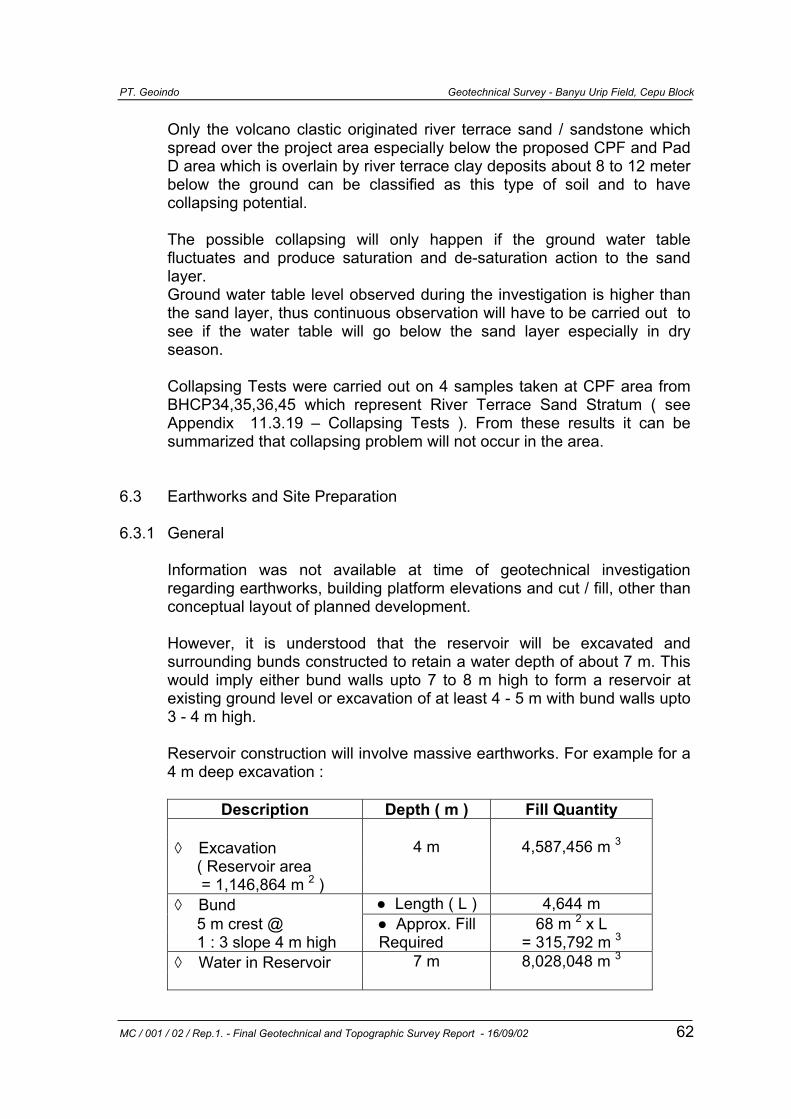
PT. Geoindo Geotechnical Survey - Banyu Urip Field, Cepu Block
MC / 001 / 02 / Rep.1. - Final Geotechnical and Topographic Survey Report - 16/09/02 62
Only the volcano clastic originated river terrace sand / sandstone which spread over the project area especially below the proposed CPF and Pad D area which is overlain by river terrace clay deposits about 8 to 12 meter below the ground can be classified as this type of soil and to have collapsing potential. The possible collapsing will only happen if the ground water table fluctuates and produce saturation and de-saturation action to the sand layer. Ground water table level observed during the investigation is higher than the sand layer, thus continuous observation will have to be carried out to see if the water table will go below the sand layer especially in dry season. Collapsing Tests were carried out on 4 samples taken at CPF area from BHCP34,35,36,45 which represent River Terrace Sand Stratum ( see Appendix 11.3.19 – Collapsing Tests ). From these results it can be summarized that collapsing problem will not occur in the area.
6.3 Earthworks and Site Preparation 6.3.1 General
Information was not available at time of geotechnical investigation regarding earthworks, building platform elevations and cut / fill, other than conceptual layout of planned development.
However, it is understood that the reservoir will be excavated and surrounding bunds constructed to retain a water depth of about 7 m. This would imply either bund walls upto 7 to 8 m high to form a reservoir at existing ground level or excavation of at least 4 - 5 m with bund walls upto 3 - 4 m high. Reservoir construction will involve massive earthworks. For example for a 4 m deep excavation :
Description Depth ( m ) Fill Quantity ◊ Excavation 4 m 4,587,456 m 3 ( Reservoir area = 1,146,864 m 2 ) ◊ Bund ● Length ( L ) 4,644 m 5 m crest @ ● Approx. Fill 68 m 2 x L 1 : 3 slope 4 m high Required = 315,792 m 3 ◊ Water in Reservoir 7 m 8,028,048 m 3
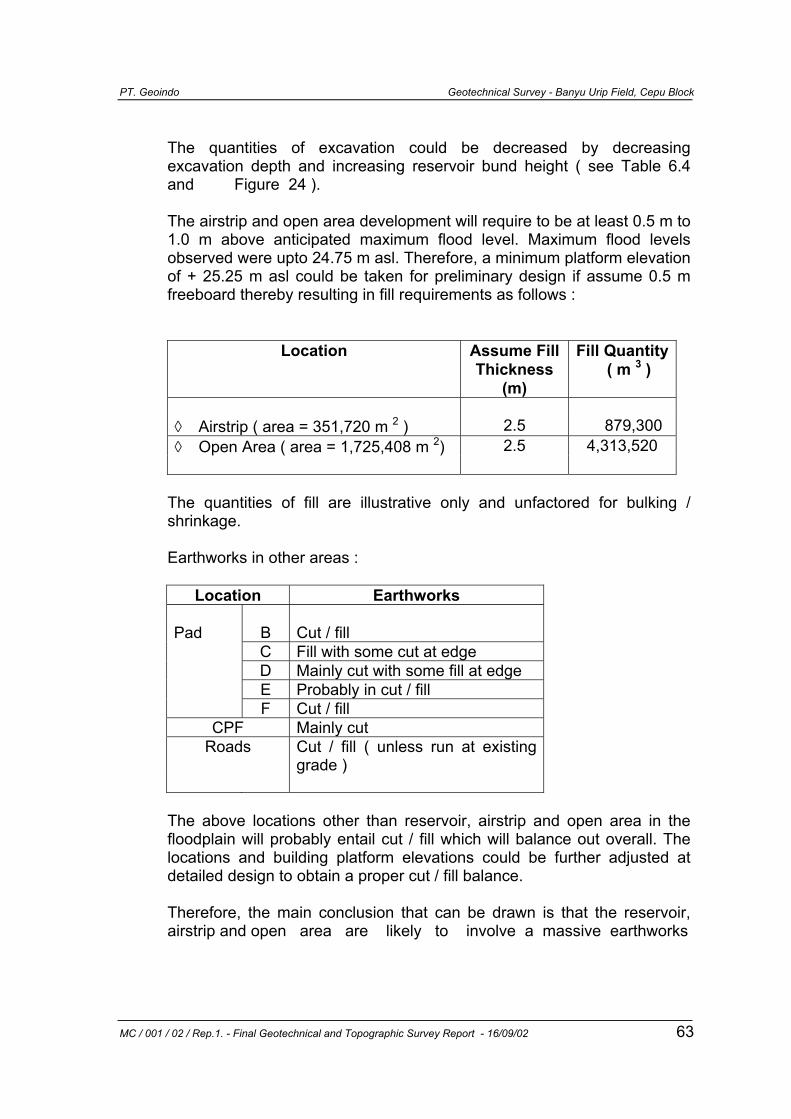
PT. Geoindo Geotechnical Survey - Banyu Urip Field, Cepu Block
MC / 001 / 02 / Rep.1. - Final Geotechnical and Topographic Survey Report - 16/09/02 63
The quantities of excavation could be decreased by decreasing excavation depth and increasing reservoir bund height ( see Table 6.4 and Figure 24 ). The airstrip and open area development will require to be at least 0.5 m to 1.0 m above anticipated maximum flood level. Maximum flood levels observed were upto 24.75 m asl. Therefore, a minimum platform elevation of + 25.25 m asl could be taken for preliminary design if assume 0.5 m freeboard thereby resulting in fill requirements as follows :
Location Assume Fill Thickness
(m)
Fill Quantity ( m 3 )
◊ Airstrip ( area = 351,720 m 2 ) 2.5 879,300 ◊ Open Area ( area = 1,725,408 m 2) 2.5 4,313,520
The quantities of fill are illustrative only and unfactored for bulking / shrinkage. Earthworks in other areas :
Location Earthworks Pad B Cut / fill C Fill with some cut at edge D Mainly cut with some fill at edge E Probably in cut / fill F Cut / fill
CPF Mainly cut Roads Cut / fill ( unless run at existing
grade )
The above locations other than reservoir, airstrip and open area in the floodplain will probably entail cut / fill which will balance out overall. The locations and building platform elevations could be further adjusted at detailed design to obtain a proper cut / fill balance. Therefore, the main conclusion that can be drawn is that the reservoir, airstrip and open area are likely to involve a massive earthworks
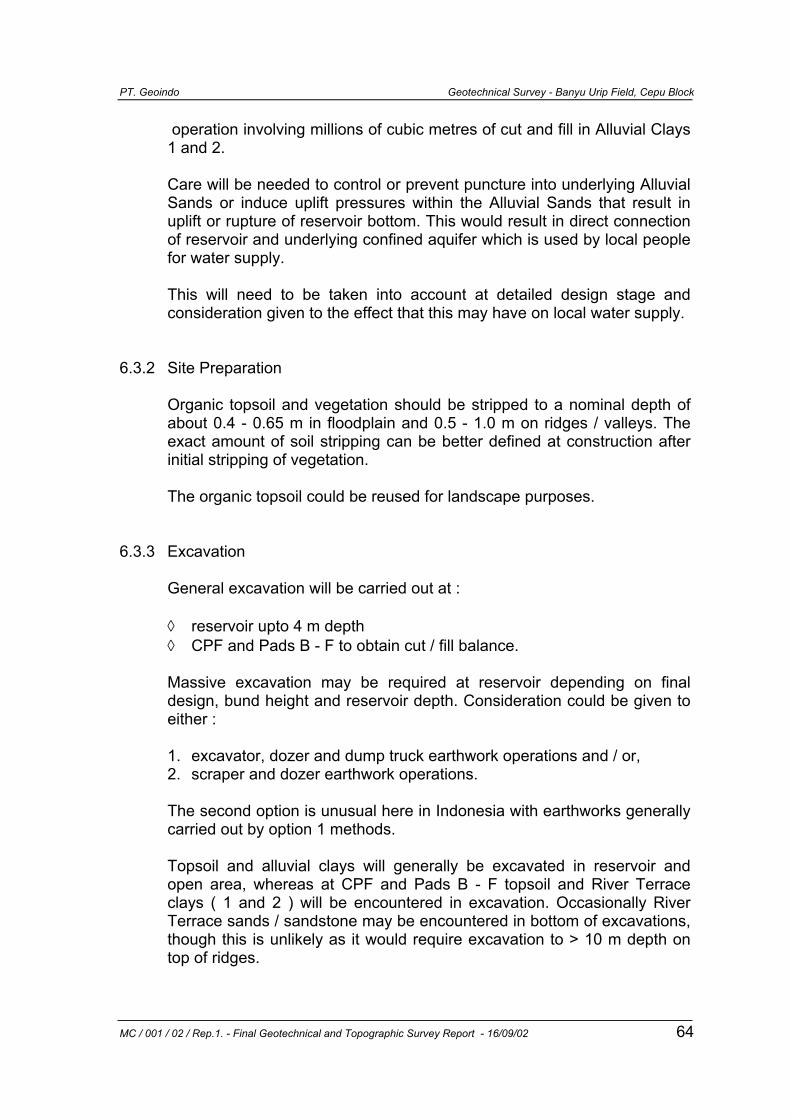
PT. Geoindo Geotechnical Survey - Banyu Urip Field, Cepu Block
MC / 001 / 02 / Rep.1. - Final Geotechnical and Topographic Survey Report - 16/09/02 64
operation involving millions of cubic metres of cut and fill in Alluvial Clays 1 and 2. Care will be needed to control or prevent puncture into underlying Alluvial Sands or induce uplift pressures within the Alluvial Sands that result in uplift or rupture of reservoir bottom. This would result in direct connection of reservoir and underlying confined aquifer which is used by local people for water supply. This will need to be taken into account at detailed design stage and consideration given to the effect that this may have on local water supply.
6.3.2 Site Preparation
Organic topsoil and vegetation should be stripped to a nominal depth of about 0.4 - 0.65 m in floodplain and 0.5 - 1.0 m on ridges / valleys. The exact amount of soil stripping can be better defined at construction after initial stripping of vegetation. The organic topsoil could be reused for landscape purposes.
6.3.3 Excavation
General excavation will be carried out at : ◊ reservoir upto 4 m depth ◊ CPF and Pads B - F to obtain cut / fill balance.
Massive excavation may be required at reservoir depending on final design, bund height and reservoir depth. Consideration could be given to either : 1. excavator, dozer and dump truck earthwork operations and / or, 2. scraper and dozer earthwork operations. The second option is unusual here in Indonesia with earthworks generally carried out by option 1 methods.
Topsoil and alluvial clays will generally be excavated in reservoir and open area, whereas at CPF and Pads B - F topsoil and River Terrace clays ( 1 and 2 ) will be encountered in excavation. Occasionally River Terrace sands / sandstone may be encountered in bottom of excavations, though this is unlikely as it would require excavation to > 10 m depth on top of ridges.
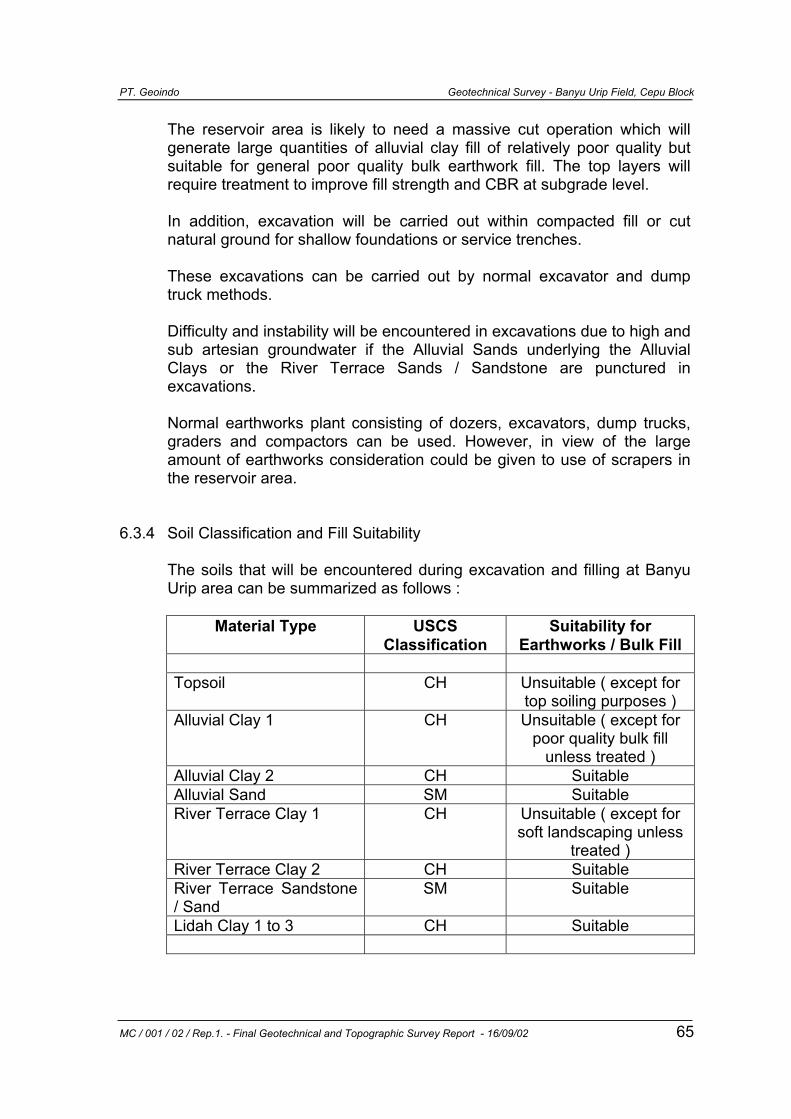
PT. Geoindo Geotechnical Survey - Banyu Urip Field, Cepu Block
MC / 001 / 02 / Rep.1. - Final Geotechnical and Topographic Survey Report - 16/09/02 65
The reservoir area is likely to need a massive cut operation which will generate large quantities of alluvial clay fill of relatively poor quality but suitable for general poor quality bulk earthwork fill. The top layers will require treatment to improve fill strength and CBR at subgrade level. In addition, excavation will be carried out within compacted fill or cut natural ground for shallow foundations or service trenches. These excavations can be carried out by normal excavator and dump truck methods. Difficulty and instability will be encountered in excavations due to high and sub artesian groundwater if the Alluvial Sands underlying the Alluvial Clays or the River Terrace Sands / Sandstone are punctured in excavations. Normal earthworks plant consisting of dozers, excavators, dump trucks, graders and compactors can be used. However, in view of the large amount of earthworks consideration could be given to use of scrapers in the reservoir area.
6.3.4 Soil Classification and Fill Suitability
The soils that will be encountered during excavation and filling at Banyu Urip area can be summarized as follows :
Material Type USCS Classification
Suitability for Earthworks / Bulk Fill
Topsoil CH Unsuitable ( except for
top soiling purposes ) Alluvial Clay 1 CH Unsuitable ( except for
poor quality bulk fill unless treated )
Alluvial Clay 2 CH Suitable Alluvial Sand SM Suitable River Terrace Clay 1 CH Unsuitable ( except for
soft landscaping unless treated )
River Terrace Clay 2 CH Suitable River Terrace Sandstone / Sand
SM Suitable
Lidah Clay 1 to 3 CH Suitable
PT. Geoindo Geotechnical Survey - Banyu Urip Field, Cepu Block
MC / 001 / 02 / Rep.1. - Final Geotechnical and Topographic Survey Report - 16/09/02 66
The alluvial clays, river terrace clays and Lidah clays can be classed as inorganic clays / silts of high plasticity ( CH ). The alluvial sands and River Terrace sandstone / sands can be classed as well graded silty sands ( SM ). The suitability of the above materials will be dependent on the engineering characteristics of the soils encountered. The organic content of top 5 m ranges from 3 - 5 %, however in view of limited borrow materials this should not be taken as a constraint for use. The soft organic topsoil, Alluvial Clay 1 and River Terrace Clay 1 ( dark soils ) are unsuitable for use as good quality bulk fill. This material could be reused in soft landscaping or in case of topsoil reused in top soiling works. The Alluvial Clay 1 and River Terrace Clay 1 soil could be used for fill after treatment such as lime mixing / stabilisation Bulk earthwork fill can generally be obtained from the Alluvial Clay 2 ( However it is to be noted that care must be exercised not to excavate too close to underlying aquifer sand layers), with a small amount from the River Terrace Clay 2 soils or “treated” River Terrace Clay 1 soil or Alluvial Clay 1. However, in view of the absence of better quality fill at the site it is considered acceptable to use Alluvial Clay 1 soil for “poor quality” bulk fill but with the understanding that these materials will have poor workability as well as could have low strengths and high compressibility when compacted. The Alluvial Clay 1 soils would best be used at base of fill with better quality fill at the top or treated to improve fill quality. The dark grey / black River Terrace Clay 1 soils should be avoided for use as bulk fill unless treated. The bulk fill materials ( Alluvial Clay 1 and River Terrace Clay 1 ) that will generally be used will be poor quality and will need to be covered by a “capping layer” ( ~ 1 m thick ) of better quality fill material or treated to improve the material at subgrade level. Earthworks should be programmed for the dry season, especially the reservoir area which floods during rainy season. Good quality sand or rock for use as structural fill is not available at the site and will need to be imported.
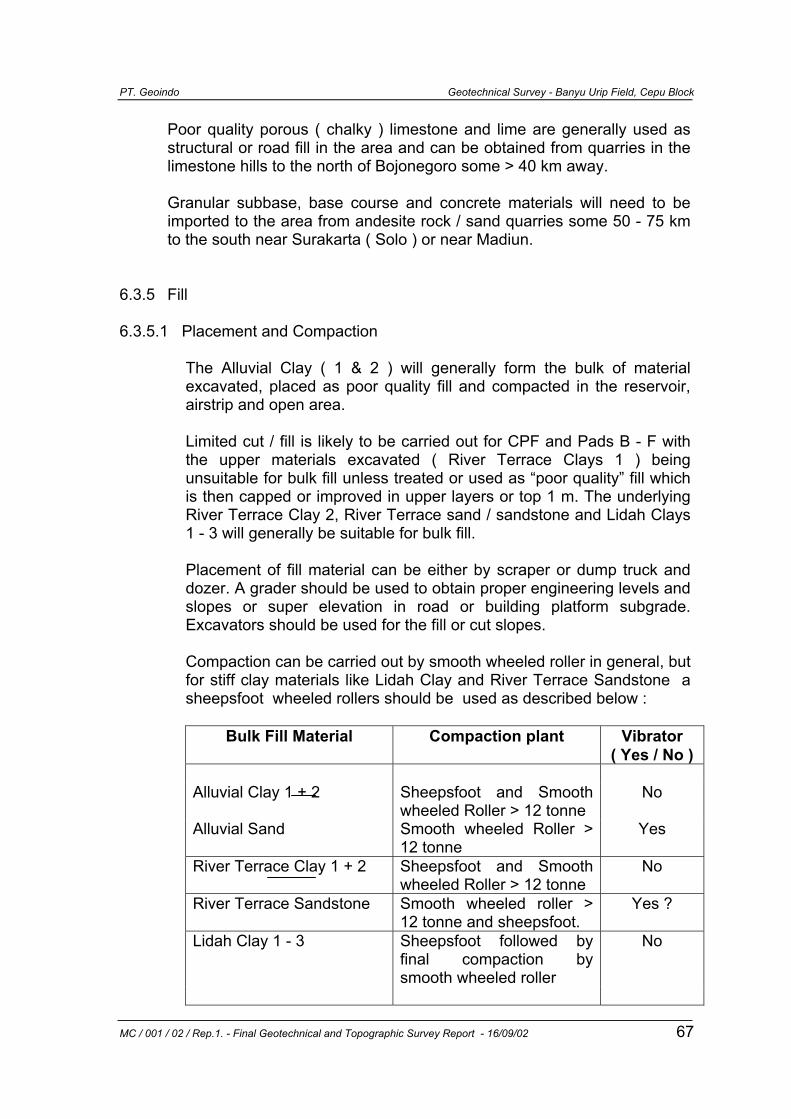
PT. Geoindo Geotechnical Survey - Banyu Urip Field, Cepu Block
MC / 001 / 02 / Rep.1. - Final Geotechnical and Topographic Survey Report - 16/09/02 67
Poor quality porous ( chalky ) limestone and lime are generally used as structural or road fill in the area and can be obtained from quarries in the limestone hills to the north of Bojonegoro some > 40 km away. Granular subbase, base course and concrete materials will need to be imported to the area from andesite rock / sand quarries some 50 - 75 km to the south near Surakarta ( Solo ) or near Madiun.
6.3.5 Fill 6.3.5.1 Placement and Compaction
The Alluvial Clay ( 1 & 2 ) will generally form the bulk of material excavated, placed as poor quality fill and compacted in the reservoir, airstrip and open area. Limited cut / fill is likely to be carried out for CPF and Pads B - F with the upper materials excavated ( River Terrace Clays 1 ) being unsuitable for bulk fill unless treated or used as “poor quality” fill which is then capped or improved in upper layers or top 1 m. The underlying River Terrace Clay 2, River Terrace sand / sandstone and Lidah Clays 1 - 3 will generally be suitable for bulk fill. Placement of fill material can be either by scraper or dump truck and dozer. A grader should be used to obtain proper engineering levels and slopes or super elevation in road or building platform subgrade. Excavators should be used for the fill or cut slopes. Compaction can be carried out by smooth wheeled roller in general, but for stiff clay materials like Lidah Clay and River Terrace Sandstone a sheepsfoot wheeled rollers should be used as described below :
Bulk Fill Material Compaction plant Vibrator ( Yes / No )
Alluvial Clay 1 + 2 Sheepsfoot and Smooth
wheeled Roller > 12 tonne No
Alluvial Sand Smooth wheeled Roller > 12 tonne
Yes
River Terrace Clay 1 + 2 Sheepsfoot and Smooth wheeled Roller > 12 tonne
No
River Terrace Sandstone Smooth wheeled roller > 12 tonne and sheepsfoot.
Yes ?
Lidah Clay 1 - 3 Sheepsfoot followed by final compaction by smooth wheeled roller
No
PT. Geoindo Geotechnical Survey - Banyu Urip Field, Cepu Block
MC / 001 / 02 / Rep.1. - Final Geotechnical and Topographic Survey Report - 16/09/02 68
The fill material should generally be placed in 200 - 300 mm layers and compacted by 4 - 5 passes of a 12 tonne static smooth wheeled roller or sheepsfoot roller. Do not use vibratory mode in clays as this will increase plasticity, increase moisture content and result in wetting up of fill with decrease in trafficability. However, the heavier clays of the Lidah Formation will first require compaction and breaking down by sheepsfoot roller > 12 tonne prior to final rolling by smooth wheeled roller. The alluvial sands and River Terrace Sandstone / sand are unlikely to be encountered other than in base of excavations and therefore are unlikely to be used as bulk fill other than in small quantities locally in the ridge / valley area in the southern part of the development area. Poor workability and traffickability problems are likely in the clay fills ( in particular the Alluvial Clay 1 and River Terrace Clay 1 soils ) especially if these “wet up” as a result of overworking or heavy rain. Therefore, the earthworks should be programmed during the dry season to prevent wetting up of the plastic clay fills and avoid the flooding which occurs every year in the reservoir, airstrip and open area. Organic soils > 2 - 3 % should generally not be used for bulk fill. The soils at the site have organic contents of 3 - 5 % m top 5 m decreasing to 1 - 3 % below 5 m depth. In view of absence of suitable material it is considered that soil with organic content 5 % or less be accepted as suitable for “poor quality” bulk fill. Laboratory combined compaction / CBR ( 2.5 kg ) tests ( see Figures 16.A1 and 16.A2 ) indicate that lightweight plant will not achieve compaction with air voids more than 15 - 20 %. Compacted dry densities of between 1.1. - 1.4 Mg / m3 would be achieved if the Alluvial Clay 1 or River Terrace Clay 1 soils are compacted at Optimum Moisture Content ( OMC ) which ranges from 20 - 30 % and 17 - 33 % for the respective soils.
PT. Geoindo Geotechnical Survey - Banyu Urip Field, Cepu Block
MC / 001 / 02 / Rep.1. - Final Geotechnical and Topographic Survey Report - 16/09/02 69
Furthermore, it was noted that the compacted CBR decreased from 2 - 4 % to less than 2 - 1 % as a result of swelling / expansion when wetted. Natural moisture content is about 60 % and 45 % for Alluvial Clay 1 and River Terrace Clay 1 respectively therefore 1.5 - 3 times wetter than OMC resulting in CBR < 1 % and fill of very poor quality. Drying during excavation, placement and compaction may occur but with improvement in moisture content of only in order of 2 - 5 %. The River Terrace Clay 1 material which contained gravel ( gravelly clay ) showed improved strength characteristics and did not appear to swell / decrease in strength as much as that without gravel. Compaction using heavy plant at moisture contents similar to Optimum Moisture Contents ( 22 - 30 % ) will produce maximum dry densities 1.4 - 1.55 Mg / m3 though these would be lower at Natural Moisture Content ( See Figures 16.B.1 and 16.B2 ). The main conclusion regarding heavier compaction is that air voids can be decreased to < 5 - 10 % after compaction and therefore provide a better compacted fill than that if light compaction used. Nevertheless, although the heavier compacted clay fills will have CBR strengths 6 - 13 %, on “wetting” the compacted soils will swell and CBR reduce to < 1 - 2 %. Therefore, the clay fills will need to be either covered with a capping layer of good quality fill or granular layer; or, improved by treatment such as lime or cement stabilization. Soaked CBR’s of < 2 % will be achieved after placement and compaction. Therefore the top 1 m will require treatment with lime / cement or replacement with granular material which improves subgrade CBR to 30 %. Alternatively pavement or building platform granular subbase could be thickened to compensate for poor subgrade and consideration given to using a geotextile grade separator to prevent adverse mixing and pumping. The quality of the clay / silt fill, layer thickness and compactive effort requires careful control if the fill is to be used either as bulk fill and beneath structures which are sensitive to settlement.
PT. Geoindo Geotechnical Survey - Banyu Urip Field, Cepu Block
MC / 001 / 02 / Rep.1. - Final Geotechnical and Topographic Survey Report - 16/09/02 70
The strength of the fill should be checked during construction as part of quality control by additional testing in order to confirm quality as well as design assumptions regarding strength and settlement. It is recommended that a series of carefully designed, controlled and supervised “site trials” be carried out at the start of earthworks in order to confirm the most suitable approach for filling which not only draws on valuable experience already gained but maximizes the best that can be practically achieved given the materials, weather, construction programme and plant available without jeopardizing design requirements, in particular settlement.
6.3.5.2 Treatment
Alluvial Clay 1 and River Terrace Clay 1 soils which will form the majority of material generated from excavations is generally “poor quality” fill material which will require covering with a “capping layer” of better quality imported fill or improved by treatment such as lime or cement stabilisation. Soil stabilization tests using both natural lime from nearby Rengel ( about 30 km away ) and factory manufactured “quicklime” were carried out on the Alluvial Clay 1 and River Terrace Clay 1 soils. The results and findings are given in the Appendix and summarized in Figure 16.C.1 and 16.C.2. Cement stabilization testing was not carried out for this geotechnical investigation though generally this material is better for stabilization of soil than “quicklime” / “lime” though at a much higher cost. It can be concluded that : ◊ Natural lime will not improve the River Terrace Clay 1 soils at
quantities < 10 % volume, however, small improvement may be possible using natural lime in Alluvial Clay 1 soils though this will need further research.
◊ “quicklime” at volume > 3 % but preferably 5 % will substantially improve the clay fill.
The clay fill soils mixed at natural moisture contents with volume 5 % quicklime can result in improvements in : • Strength 25 - 40 kN / m 2 rising upto > 150 kN / m2.
PT. Geoindo Geotechnical Survey - Banyu Urip Field, Cepu Block
MC / 001 / 02 / Rep.1. - Final Geotechnical and Topographic Survey Report - 16/09/02 71
• CBR increase from < 2 % to 6 %. • Trafficability and ability to support load from structures and
pavement are greatly improved. Stabilisation using natural lime does not appear to be viable at the volumes tested. However, stabilization using “quicklime” does appear to be viable and should be considered as an option to better quality expensive imported fill materials. The use of quicklime may result in cost savings by avoiding excessive use of imported fill / aggregate and by reducing thickness of subbase for road, airport, hardstanding or building platform areas.
6.3.5.3 Shrinkage and Bulking
For preliminary design purposes, bulking of upto 30 % on excavation and shrinkage of upto 16 % could be used. Overall bulking after excavation and compaction of about 10 %. However, further earthworks testing and site trials should be carried out to determine this.
6.3.5.4 Trafficability
Trafficability will be a problem with the clay fills with shear strengths 25 - 50 kN / m 2 and therefore earthworks should be programmed for dry season to enable earthworks plant trafficability. Rutting will occur and should be dealt with each day by grading or dozing to provide a level surface that is graded to allow water to drain away from earthworks should rain occur. The clay fills could be greatly improved for trafficability by treatment with “quicklime”. However, treatment of all the fill material may not be feasible rather it is more likely that only the top 1 m “capping layer” will be treated to reduce costs.
6.3.5.5 Fill Slopes
Compacted fill embankment using alluvium clay 2 in saturated condition - as in the case of reservoir bund - can be designed using 1 vertical and
PT. Geoindo Geotechnical Survey - Banyu Urip Field, Cepu Block
MC / 001 / 02 / Rep.1. - Final Geotechnical and Topographic Survey Report - 16/09/02 72
2 horizontal slope for height of embankment of less then 2 meter, however if height of the embankment to be constructed higher than 2 meters the fill material of the bund of the slope must be improved by soil stabilization using quicklime or cement to improve soil strength. A steeper slope can be constructed if the fill clay is stabilized by adding quicklime which can increase the shear strength from 30 kN / m2 (soft) in natural condition up to 150 kN / m2 (stiff), however cracking due to de-saturation (during reservoir dewatering) will have to be considered. Alternatively shallow slopes with bunds / terracing could also be considered however this would make the bund cross section much larger with corresponding footprint impact also much larger. Geogrid and geotextiles could also be considered, however use of these should be fully analysed.
Fill using river terrace clay 1 in moderately saturated condition – as in the case of CPF and well pad area - can be designed using 1 vertical and 3 horizontal up to 3 meters height of embankment.
6.3.5.6 Drainage The importance of good drainage during and after earthworks can not be overstressed. If fill materials wet up or standing water occurs then the fill surface will deteriorate, traffickability becomes a problem causing earthwork delays or problems. Rainfall should be monitored in order to be able to anticipate rainfall during construction with when, how much or how long predicted. During earthworks, the excavations and fill surfaces should be smoothed or graded to drain or channel rainfall to temporary / permanent ditch drains and sumps from where water can be pumped offsite. Permanent earthworks should have proper concrete or masonry / block wall lined drainage ditches at a gradient which allows self cleaning under normal flow conditions. Suitable silt / sediment traps should be installed at locations where erosion / sedimentation is likely to be a problem.
PT. Geoindo Geotechnical Survey - Banyu Urip Field, Cepu Block
MC / 001 / 02 / Rep.1. - Final Geotechnical and Topographic Survey Report - 16/09/02 73
6.3.5.7 Over Excavation / Engineered Fill Over excavation above groundwater level or engineered fill for foundation improvement at the site may be considered as this can achieve a great reduction in settlement and improve bearing capacity for lightly loaded structure foundations. However, the depth of over excavation will be limited by groundwater. Excavation below groundwater should not be considered.
6.3.5.8 Surface Erosion
Attention must be given in detail design to prevent surface erosion due to stormwater run off (in particular over sloped embankments or bunds) and also wave slap action from stored water on the inside face of the reservoir bund.
6.3.6 Soil Improvement 6.3.6.1 General
Generally, clay soils at the site are considered poor for use as general bulk fill even if fill placement is carried out in dry season. Therefore, in certain circumstances such as beneath roads, airport hardstanding / building platform areas or where slope stabilisation is required it may be necessary to consider alternative soil improvement. Geotextiles, geogrids and soil stabilisation are briefly discussed below.
6.3.6.2 Geotextiles
Geotextiles could be used for slope stabilisation, filtration behind retaining wall or separation purposes to improve subgrade. Geotextiles are currently used for road construction close to the Banyu Urip site as a separator to prevent pumping of clay material up into the subbase which is 100 - 600 mm thick generally. The effect of geotextile on subbase thickness should be further investigated.
PT. Geoindo Geotechnical Survey - Banyu Urip Field, Cepu Block
MC / 001 / 02 / Rep.1. - Final Geotechnical and Topographic Survey Report - 16/09/02 74
6.3.6.3 Geogrids
Geogrids could be used for slope stabilisation in soils or in subbase for road pavement improvement in order to reduce subbase thickness. This should be further investigated to assess cost effectiveness.
6.3.6.4 Soil Stabilisation
The results of the soil stabilisation tests using natural lime and factory produced quicklime lime have been discussed in Section 6.3.4.2. It would appear that quick lime stabilisation is viable with respect to soil stabilisation and the use of this material to obtain cost saving should be explored further.
6.3.7 Construction Control and Testing
The quality of the clay fill should be checked on regular basis during earthworks and a testing programme should be designed to take account of final detailed engineering design. A laboratory should be established at or close to the site in order to be able to carry out following earthwork control testing : ◊ Insitu density / moisture content ◊ Insitu vane shear strength ◊ Insitu CBR ◊ Laboratory derived compaction, density / moisture content, CBR and
shear strength properties ◊ Insitu dutch cone testing ( 2.5 kg rig ). Frequency of testing should be chosen such that a representative sample of tests are carried out that represent the work undertaken at particular stages or times. Site trials are recommended at start of earthworks ( as discussed previously ) in order to produce site procedures for earthworks that are most appropriate and practical to carry out using the soil materials, weather, construction programme and plant available without jeopardizing design requirements and safety.
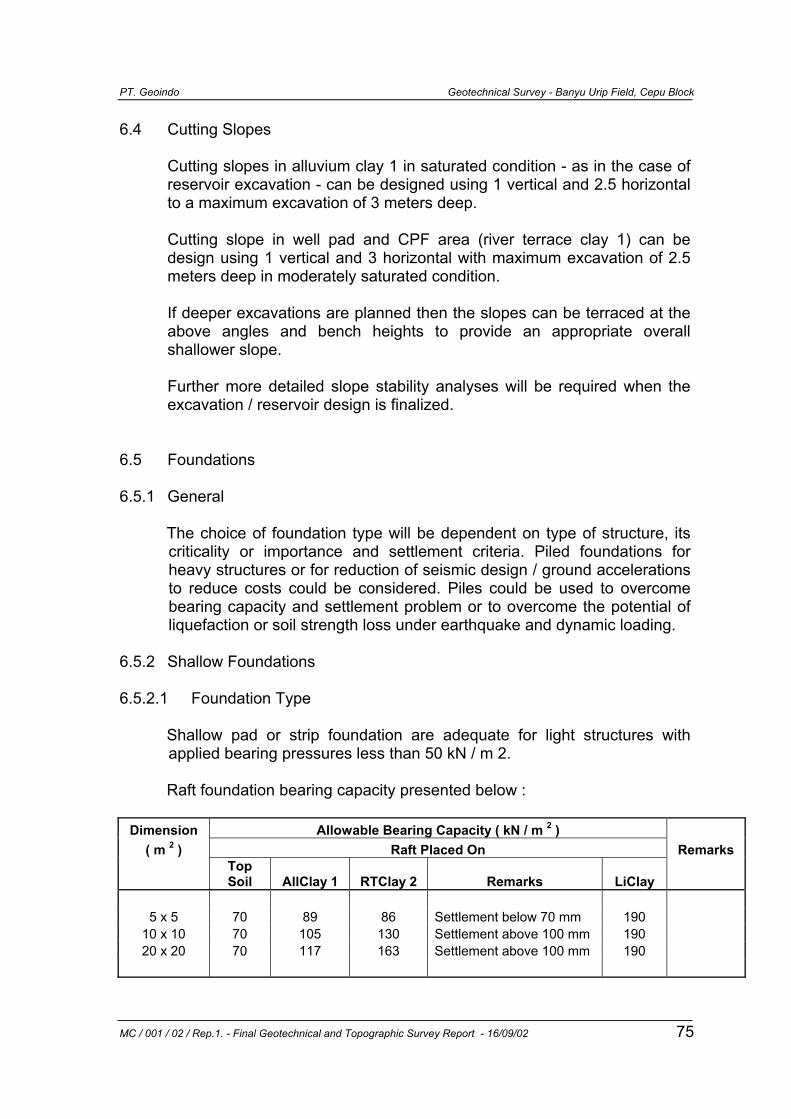
PT. Geoindo Geotechnical Survey - Banyu Urip Field, Cepu Block
MC / 001 / 02 / Rep.1. - Final Geotechnical and Topographic Survey Report - 16/09/02 75
6.4 Cutting Slopes Cutting slopes in alluvium clay 1 in saturated condition - as in the case of reservoir excavation - can be designed using 1 vertical and 2.5 horizontal to a maximum excavation of 3 meters deep. Cutting slope in well pad and CPF area (river terrace clay 1) can be design using 1 vertical and 3 horizontal with maximum excavation of 2.5 meters deep in moderately saturated condition. If deeper excavations are planned then the slopes can be terraced at the above angles and bench heights to provide an appropriate overall shallower slope. Further more detailed slope stability analyses will be required when the excavation / reservoir design is finalized.
6.5 Foundations
6.5.1 General
The choice of foundation type will be dependent on type of structure, its criticality or importance and settlement criteria. Piled foundations for heavy structures or for reduction of seismic design / ground accelerations to reduce costs could be considered. Piles could be used to overcome bearing capacity and settlement problem or to overcome the potential of liquefaction or soil strength loss under earthquake and dynamic loading.
6.5.2 Shallow Foundations 6.5.2.1 Foundation Type
Shallow pad or strip foundation are adequate for light structures with applied bearing pressures less than 50 kN / m 2. Raft foundation bearing capacity presented below :
Dimension Allowable Bearing Capacity ( kN / m 2 )
( m 2 ) Raft Placed On Remarks
Top Soil AllClay 1 RTClay 2 Remarks LiClay
5 x 5 70 89 86 Settlement below 70 mm 190
10 x 10 70 105 130 Settlement above 100 mm 190 20 x 20 70 117 163 Settlement above 100 mm 190
PT. Geoindo Geotechnical Survey - Banyu Urip Field, Cepu Block
MC / 001 / 02 / Rep.1. - Final Geotechnical and Topographic Survey Report - 16/09/02 76
Raft foundation with dimension greater than 5 x 5 m are not recommended. Foundation analyses have been carried out for various foundation widths, depths and applied pressures. If a soil is classified as having a low to medium swell potential, standard construction practices may be followed. However, if the soil possesses a marginal or high swell potential, precautions need to be taken. This may entail the following :
1. Replacing the expansive soil under the foundation. 2. Changing the nature of the expansive soil by such actions as
compaction control, prewetting, installation of moisture barriers and chemical stabilization.
3. Strengthening the structures to withstand heave, constructing structures that are flexible enough to withstand the differential soil heave without failure, or constructing isolated deep foundations below the depth of active zone.
One particular method may be unique for a certain situation only. It is necessary to combine several techniques, and local construction experience should always be taken into consideration. As discuss on section 6.2.5, all soil strata where shallow foundation will be placed, have swelling potential from 45 to 70 kN/m2, if swelling pressure > 50 – 75 kN/m2 which is greater than recommended bearing pressures then this soil is unsuitable for shallow foundation strata.
6.5.2.2 Bearing Capacity and Allowable Bearing Pressure
The design parameters used to determine ultimate bearing capacity are given in Table 6.1. Ultimate bearing capacity was calculated as follows :
qu = cNc + γ DNq + ½ γ BNγ
where, qu = ultimate bearing capacity c = cohesion γ = bulk density D = depth of foundation
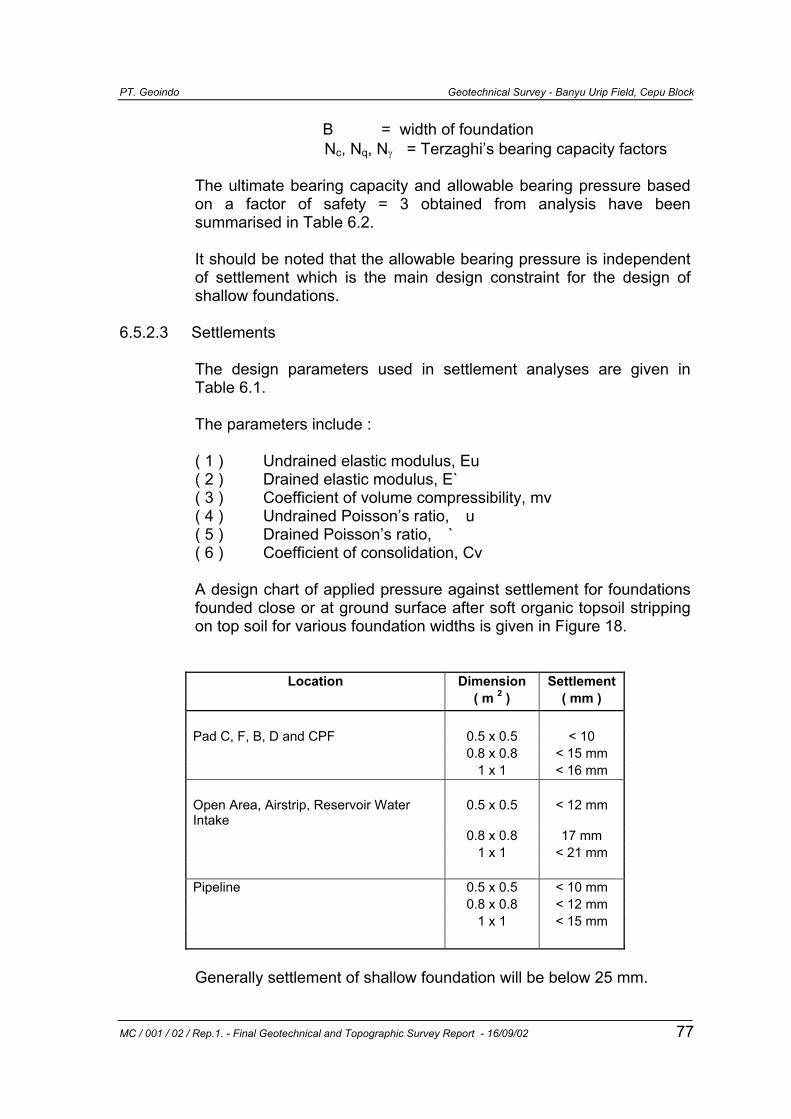
PT. Geoindo Geotechnical Survey - Banyu Urip Field, Cepu Block
MC / 001 / 02 / Rep.1. - Final Geotechnical and Topographic Survey Report - 16/09/02 77
B = width of foundation Nc, Nq, Nγ = Terzaghi’s bearing capacity factors
The ultimate bearing capacity and allowable bearing pressure based on a factor of safety = 3 obtained from analysis have been summarised in Table 6.2.
It should be noted that the allowable bearing pressure is independent of settlement which is the main design constraint for the design of shallow foundations.
6.5.2.3 Settlements
The design parameters used in settlement analyses are given in Table 6.1. The parameters include : ( 1 ) Undrained elastic modulus, Eu ( 2 ) Drained elastic modulus, E` ( 3 ) Coefficient of volume compressibility, mv ( 4 ) Undrained Poisson’s ratio, �u ( 5 ) Drained Poisson’s ratio, �` ( 6 ) Coefficient of consolidation, Cv A design chart of applied pressure against settlement for foundations founded close or at ground surface after soft organic topsoil stripping on top soil for various foundation widths is given in Figure 18.
Location Dimension Settlement ( m 2 ) ( mm )
Pad C, F, B, D and CPF 0.5 x 0.5 < 10 0.8 x 0.8 < 15 mm 1 x 1 < 16 mm Open Area, Airstrip, Reservoir Water Intake
0.5 x 0.5 < 12 mm
0.8 x 0.8 17 mm 1 x 1 < 21 mm Pipeline 0.5 x 0.5 < 10 mm 0.8 x 0.8 < 12 mm 1 x 1 < 15 mm Generally settlement of shallow foundation will be below 25 mm.
PT. Geoindo Geotechnical Survey - Banyu Urip Field, Cepu Block
MC / 001 / 02 / Rep.1. - Final Geotechnical and Topographic Survey Report - 16/09/02 78
Total settlement for shallow pad foundation is shown in Figure 18. Raft foundation will stress a much deeper zone than strip or pad foundation and therefore the resulting higher settlements are likely to be an engineering constraint. Settlement will be more higher if raft foundation placed at Top Soil and much lower if raft placed below top soil ( at RTClay 1 / AllClay1 ).
Settlement analysis has been carried out for raft foundation using parameters given in Table 6.1 for variety of size and load. Total settlement from the various analyses are summarized in Figure 19A to 19H. Figure 19 is divided into 3 main locations for raft foundations as below : ◊ Figure 19A to 19B, assumed raft placed on top soil and RTClay 1 ◊ Figure 19C to 19O, assumed raft placed on top soil and AllClay 1 ◊ Figure 19E, assumed raft placed on top soil and fill at pipeline
route ◊ Figure 19F to 19G, assumed raft placed on top soil imagining raft
on Lidah Clay. From analysis, settlement more than 100 mm is likely to occur if raft dimension greater than 10 x 10 m. Skempton and McDonald ( 1955 ) suggested maximum settlement limit for rafts on clay from 65 mm to 100 mm. Effect of settlement on nearby foundation can be seen on Figure 20A - 20C for shallow foundation and Figure 21A - 21C for raft foundation.
6.5.3 Deep Foundation 6.5.3.1 General
Piles are considered to be the most appropriate foundation solution for heavy structures for the following reasons :
1. Weak and highly compressible upper soil layer. Piles will reduce
settlement and improve load carrying capacity. 2. Piles will damp out vibration from vibrating machine.
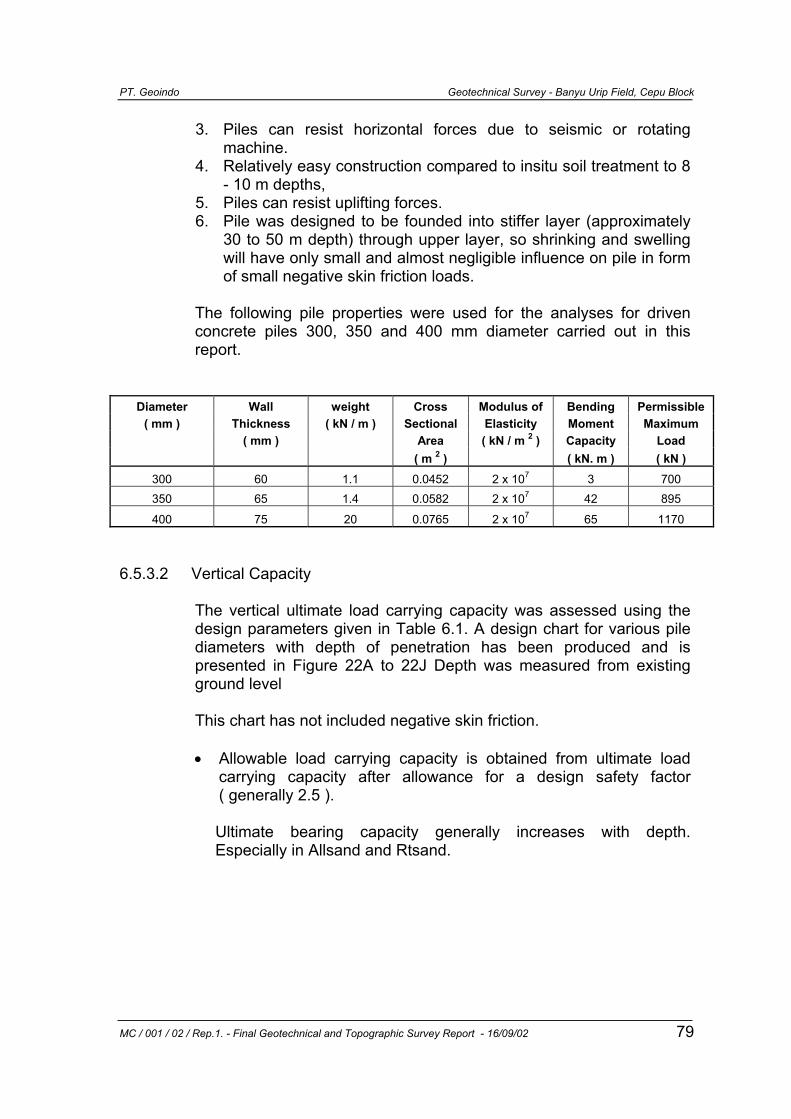
PT. Geoindo Geotechnical Survey - Banyu Urip Field, Cepu Block
MC / 001 / 02 / Rep.1. - Final Geotechnical and Topographic Survey Report - 16/09/02 79
3. Piles can resist horizontal forces due to seismic or rotating machine.
4. Relatively easy construction compared to insitu soil treatment to 8 - 10 m depths,
5. Piles can resist uplifting forces. 6. Pile was designed to be founded into stiffer layer (approximately
30 to 50 m depth) through upper layer, so shrinking and swelling will have only small and almost negligible influence on pile in form of small negative skin friction loads.
The following pile properties were used for the analyses for driven concrete piles 300, 350 and 400 mm diameter carried out in this report.
Diameter Wall weight Cross Modulus of Bending Permissible ( mm ) Thickness ( kN / m ) Sectional Elasticity Moment Maximum
( mm ) Area ( kN / m 2 ) Capacity Load ( m 2 ) ( kN. m ) ( kN )
300 60 1.1 0.0452 2 x 10⁷ 3 700 350 65 1.4 0.0582 2 x 10⁷ 42 895
400 75 20 0.0765 2 x 10⁷ 65 1170 6.5.3.2 Vertical Capacity
The vertical ultimate load carrying capacity was assessed using the design parameters given in Table 6.1. A design chart for various pile diameters with depth of penetration has been produced and is presented in Figure 22A to 22J Depth was measured from existing ground level
This chart has not included negative skin friction.
• Allowable load carrying capacity is obtained from ultimate load
carrying capacity after allowance for a design safety factor ( generally 2.5 ). Ultimate bearing capacity generally increases with depth. Especially in Allsand and Rtsand.
PT. Geoindo Geotechnical Survey - Banyu Urip Field, Cepu Block
MC / 001 / 02 / Rep.1. - Final Geotechnical and Topographic Survey Report - 16/09/02 80
6.5.3.3 Settlement - Single Pile
Settlements for various pile diameter at 25 m and 30 m depth is summarised in Table 6.3. Settlement is generally below 25 mm except at pipeline route where settlement is below 33 mm at depth 30 m for pile with diameter ≥ 300 mm. Piles will work mainly in skin friction. Under liquefaction conditions, no additional vertical load will take place on piles since the liquefied soil loses its shear strength during liquefaction and will therefore not transfer load to the piles during liquefaction. ◊ Pull Out Capacity
Pull out capacity was considered to be the same as skin friction. Caution is needed when the piles are subjected to dynamic or cyclic load since it could reduce the pull out capacity by 30 - 50 %.
6.5.3.4 Lateral Load Capacity
Lateral load capacity was analysed using p-y method for fully embedded pile. Under both static and cyclic load. The results are presented in Figure 23A to 23J showing horizontal loads and related pile head deflection together with maximum bending moments for free and fixed head case respectively.
6.5.3.5 Uplift Capacity
Pull out capacity is considered to be same as skin friction. Ultimate pull out capacity is presented in Figures 22A to 22J. Allowable pull out capacity could be obtained by dividing ultimate pull out capacity with factor of safety 3.
6.5.3.6 Pile Driving and Installation
A minimum of 2.5 ton ram weight is required to drive 300 mm concrete pile to 25 m depth. Stress during driving should be monitored to avoid excessive overstress during pile driving especially concrete pile, which would result in damage and cracking of piles.
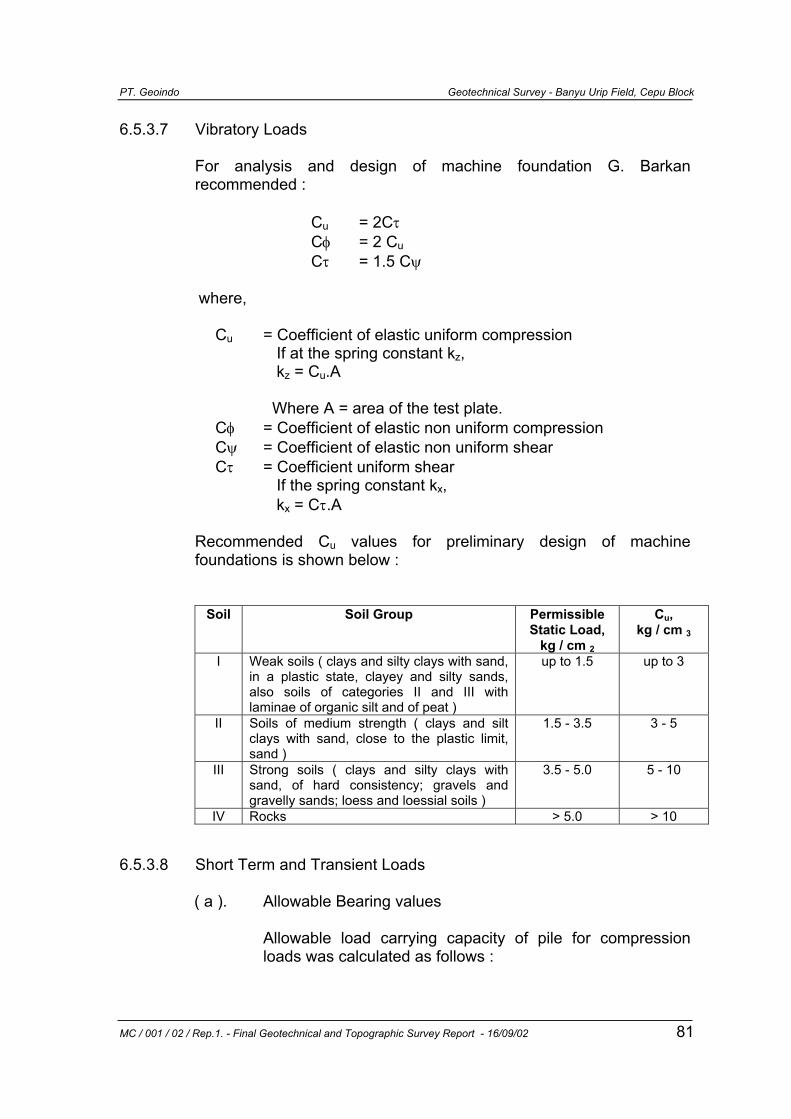
PT. Geoindo Geotechnical Survey - Banyu Urip Field, Cepu Block
MC / 001 / 02 / Rep.1. - Final Geotechnical and Topographic Survey Report - 16/09/02 81
6.5.3.7 Vibratory Loads
For analysis and design of machine foundation G. Barkan recommended :
Cu = 2Cτ Cφ = 2 Cu Cτ = 1.5 Cψ where,
Cu = Coefficient of elastic uniform compression If at the spring constant kz, kz = Cu.A Where A = area of the test plate. Cφ = Coefficient of elastic non uniform compression Cψ = Coefficient of elastic non uniform shear Cτ = Coefficient uniform shear If the spring constant kx,
kx = Cτ.A
Recommended Cu values for preliminary design of machine foundations is shown below :
Soil Soil Group Permissible Static Load,
kg / cm 2
Cu, kg / cm 3
I Weak soils ( clays and silty clays with sand, in a plastic state, clayey and silty sands, also soils of categories II and III with laminae of organic silt and of peat )
up to 1.5 up to 3
II Soils of medium strength ( clays and silt clays with sand, close to the plastic limit, sand )
1.5 - 3.5 3 - 5
III Strong soils ( clays and silty clays with sand, of hard consistency; gravels and gravelly sands; loess and loessial soils )
3.5 - 5.0 5 - 10
IV Rocks > 5.0 > 10
6.5.3.8 Short Term and Transient Loads ( a ). Allowable Bearing values
Allowable load carrying capacity of pile for compression loads was calculated as follows :
PT. Geoindo Geotechnical Survey - Banyu Urip Field, Cepu Block
MC / 001 / 02 / Rep.1. - Final Geotechnical and Topographic Survey Report - 16/09/02 82
FOSQultQ =all
where, Qall = Allowable load carrying capacity Qult = Ultimate load carrying capacity FOS = Factor of Safety = 2,5 for vertical capacity = 3 for pull out / skin friction capacity ( b ). Transient Loads
For foundation design dynamic analysis transient loads such as wind load, earthquake, and vibration of machine should be take into account.
6.5.3.9 Pile Testing
It is recommended that a trial piling programme be carried out using driven concrete and steel tube piles as well as any other alternatives suggested by EPC contractors. Pile load capacity and integrity should be checked during pile driving to confirm actual capacity against design assumptions as follows :
◊ Pile Integrity Test ( for concrete or steel tube piles )
This test could be carried out on all driven piles by one engineer utilising a portable computer and data recording system immediately after all piles are driven and also a period ( say more than one week ) to assess improvement with time.
◊ Load Test ( Pile Dynamic Analysis and Static Load Test )
• Pile Dynamic Analysis ( PDA )
PDA should be carried out on at least two piles during or immediately after driving as well as 2 - 5 days after driving to observe any setup effects.
This test requires pile driving equipment to give shock waves to the piles during or after pile driving.
PT. Geoindo Geotechnical Survey - Banyu Urip Field, Cepu Block
MC / 001 / 02 / Rep.1. - Final Geotechnical and Topographic Survey Report - 16/09/02 83
The dynamic resistance is then converted to static resistance and the ultimate load capacity of the pile determined from dynamic testing. The test can be carried out rapidly with approximately 1 to 2 tests in one day. It is recommended that sensors be attached and PDA testing undertaken during pile driving from start to finish so that an ultimate load capacity with depth relationship can be determined for the whole pile length as opposed to 3 - 4 different piles driven to different depths and a PDA test undertaken on final set.
However, it should be appreciated that PDA testing results in dynamic test results which need to be converted to static test results which reflect how the pile will behave in the ground.
Therefore, it would also be worthwhile to carry out a static load test on at least one pile on each different layer ( Alluvial Clay, Terrace Clay and at Tuban ) to check that the factor used to convert dynamic to static load carrying capacity is valid or requires revision. This would then validate the use of the quicker and cheaper dynamic analysis methods for all test piles for the site as well as other sites throughout the area.
• Static Load Test
It is therefore recommended that consideration be given to carrying out one static load test. This test would involve large scale loading and special construction with aid of construction plant i.e. cranes, excavator, etc. The loads will need to be applied to selected piles until they fail or rupture. The test will take approximately one week. The test would provide the static ultimate load capacity and an indication of the settlement behaviour of a single pile. This would provide validation for the use of the cheaper and quicker PDA method for pile testing.
The above tests will provide information of single pile behaviour and should not be confused with the behaviour of the pile group which is completely different from that of single piles. Nevertheless, the results on single piles can be used indirectly in confirming pile group behaviour. A modified test could also be carried out to simulate cyclic loading.
PT. Geoindo Geotechnical Survey - Banyu Urip Field, Cepu Block
MC / 001 / 02 / Rep.1. - Final Geotechnical and Topographic Survey Report - 16/09/02 84
6.5.4 Soil Coefficient 6.5.4.1 General
The design active and passive earth pressure given in this report assume that the ground surface is horizontal and no build up of groundwater pressure occurs.
6.5.4.2 Active Earth Pressure
(a) The active earth pressure distribution is given as :
KacKaHa 2.. −= γρ where :
γ = Soil unit weight H = Height of soil c = Cohesion of soil Ka = active earth pressure coefficient ranging from 0.60 to
0.8 with φ’ effective internal friction angle from Table 6.1 Engineering Design Parameters.
(b) The earth pressure at rest is taken as :
'sin1 φ−=Ko where :
φ’ = Effective internal friction angle of soil from Table 6.1 - Engineering Design Parameters.
(c) Friction coefficient can be taken as 0.3 for sliding resistance
6.5.4.3 Passive Earth Pressure
(a) The passive earth pressure distribution can generally taken as :
KpcKpHp 2.. −= γρ where :
Kp = passive earth pressure coefficient ranging from 1.40 to 1.70 with φ’ effective internal friction range of soil from Table 6.1 Engineering Design Parameters.
PT. Geoindo Geotechnical Survey - Banyu Urip Field, Cepu Block
MC / 001 / 02 / Rep.1. - Final Geotechnical and Topographic Survey Report - 16/09/02 85
(b) The earth pressure at rest is taken as :
'sin1 φ−=Ko where :
φ’ = Effective internal friction angle of soil from Table 6.1 - Engineering Design Parameters.
(c) Cohesion value for resisting lateral pressure.
Total lateral resistance = W tan δ + Pp
where : W = dead weight of structure tan δ = friction coefficient
Pp = C. H with C 15 cohesion taken from Table 6.1 and H is height of soil.
6.5.4.4 Factors of Safety
A factor of safety can be taken 1.5 to 2.0 for design purposes. 6.5.5 Modulus of Subgrade Reaction 6.5.5.1 Size Adjustment
The coefficient of subgrade reaction is not a constant value, it is influenced by several factors such shape, width, type of foundation and soil reactions due to imposed load or surcharge. To adjust size of the coefficient of subgrade reaction can be divided into two components as follows : (a) Vertical modulus of subgrade reaction ( kv ) which can be
assessed for pile or foundation which is vertically loaded. (b) Horizontal modulus of subgrade reaction ( kh ), which is usually
used for design foundation such as single beam or vertical wall that is laterally loaded.
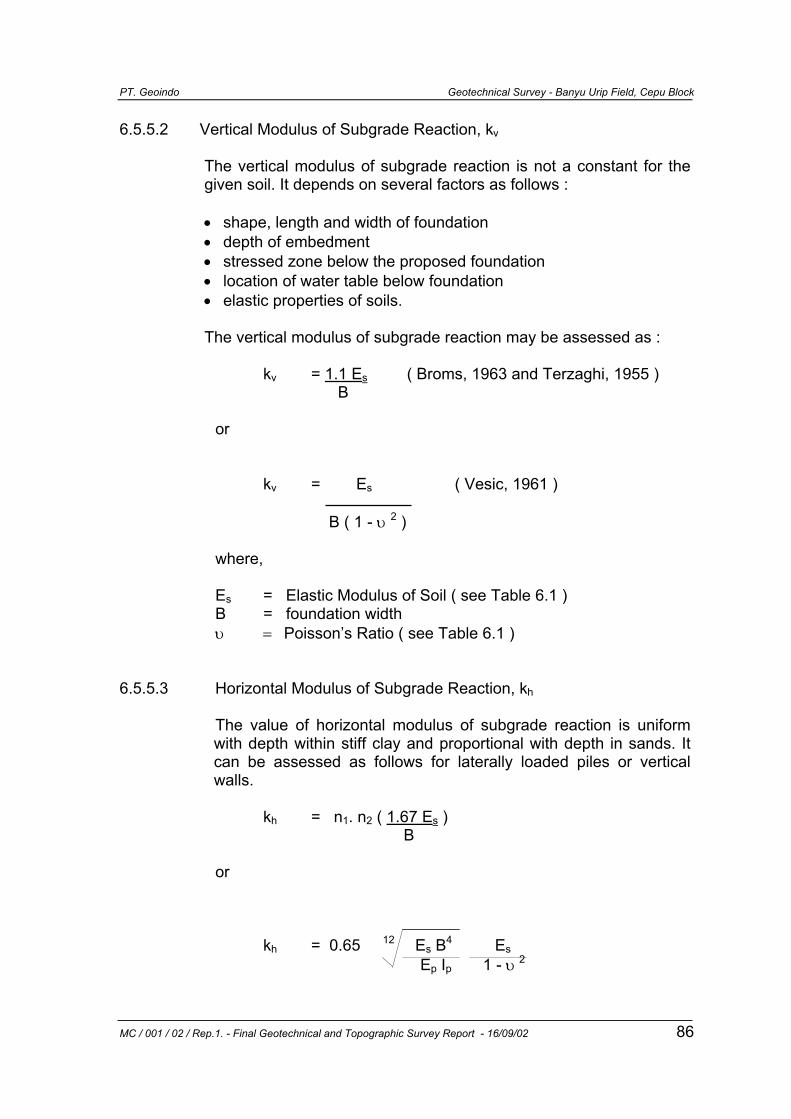
PT. Geoindo Geotechnical Survey - Banyu Urip Field, Cepu Block
MC / 001 / 02 / Rep.1. - Final Geotechnical and Topographic Survey Report - 16/09/02 86
6.5.5.2 Vertical Modulus of Subgrade Reaction, kv
The vertical modulus of subgrade reaction is not a constant for the given soil. It depends on several factors as follows : • shape, length and width of foundation • depth of embedment • stressed zone below the proposed foundation • location of water table below foundation • elastic properties of soils. The vertical modulus of subgrade reaction may be assessed as : kv = 1.1 Es ( Broms, 1963 and Terzaghi, 1955 )
B
or
kv = Es ( Vesic, 1961 )
B ( 1 - υ 2 ) where, Es = Elastic Modulus of Soil ( see Table 6.1 ) B = foundation width υ = Poisson’s Ratio ( see Table 6.1 ) 6.5.5.3 Horizontal Modulus of Subgrade Reaction, kh
The value of horizontal modulus of subgrade reaction is uniform with depth within stiff clay and proportional with depth in sands. It can be assessed as follows for laterally loaded piles or vertical walls. kh = n1. n2 ( 1.67 Es )
B
or kh = 0.65 12 Es B4 Es Ep Ip 1 - υ 2
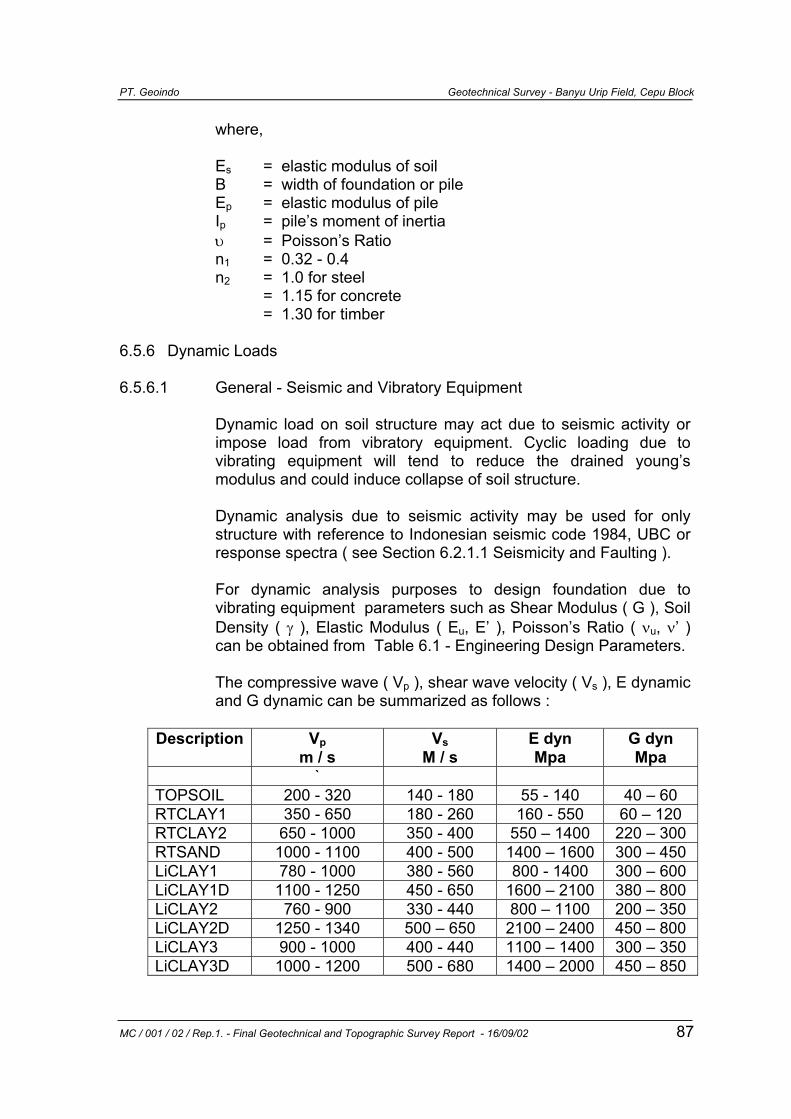
PT. Geoindo Geotechnical Survey - Banyu Urip Field, Cepu Block
MC / 001 / 02 / Rep.1. - Final Geotechnical and Topographic Survey Report - 16/09/02 87
where, Es = elastic modulus of soil B = width of foundation or pile Ep = elastic modulus of pile Ip = pile’s moment of inertia υ = Poisson’s Ratio n1 = 0.32 - 0.4 n2 = 1.0 for steel = 1.15 for concrete = 1.30 for timber 6.5.6 Dynamic Loads 6.5.6.1 General - Seismic and Vibratory Equipment
Dynamic load on soil structure may act due to seismic activity or impose load from vibratory equipment. Cyclic loading due to vibrating equipment will tend to reduce the drained young’s modulus and could induce collapse of soil structure. Dynamic analysis due to seismic activity may be used for only structure with reference to Indonesian seismic code 1984, UBC or response spectra ( see Section 6.2.1.1 Seismicity and Faulting ). For dynamic analysis purposes to design foundation due to vibrating equipment parameters such as Shear Modulus ( G ), Soil Density ( γ ), Elastic Modulus ( Eu, E’ ), Poisson’s Ratio ( νu, ν’ ) can be obtained from Table 6.1 - Engineering Design Parameters. The compressive wave ( Vp ), shear wave velocity ( Vs ), E dynamic and G dynamic can be summarized as follows :
Description Vp m / s
Vs M / s
E dyn Mpa
G dyn Mpa
` TOPSOIL 200 - 320 140 - 180 55 - 140 40 – 60 RTCLAY1 350 - 650 180 - 260 160 - 550 60 – 120 RTCLAY2 650 - 1000 350 - 400 550 – 1400 220 – 300 RTSAND 1000 - 1100 400 - 500 1400 – 1600 300 – 450 LiCLAY1 780 - 1000 380 - 560 800 - 1400 300 – 600 LiCLAY1D 1100 - 1250 450 - 650 1600 – 2100 380 – 800 LiCLAY2 760 - 900 330 - 440 800 – 1100 200 – 350 LiCLAY2D 1250 - 1340 500 – 650 2100 – 2400 450 – 800 LiCLAY3 900 - 1000 400 - 440 1100 – 1400 300 – 350 LiCLAY3D 1000 - 1200 500 - 680 1400 – 2000 450 – 850
PT. Geoindo Geotechnical Survey - Banyu Urip Field, Cepu Block
MC / 001 / 02 / Rep.1. - Final Geotechnical and Topographic Survey Report - 16/09/02 88
6.5.6.2 Compressive and Shear Wave Velocity
Compressive ( Vp ) and shear wave velocities were obtained from Down Hole Seismic Survey which was carried out in boreholes BHCP 39, 45, 49 upto 50 m depth and from sonic velocity testing which was carried out on BHCP39 samples in the laboratory. The observed velocity was plotted against depth as shown in Appendix 3 - 10.3 Downhole Seismic Test and Appendix 4 - 11.3.12 Sonic Velocity - ISRM.
6.5.6.3 Dynamic Modulus of Elasticity
For dynamic analysis e.g. foundation on elastic beam, vibrating equipment or seismic activity, elastic modulus should be taken from geophysical test results or resonant column ( see Appendix 3 - 10.3 Down Hole Seismic test and Appendix 3 - 11.13 - Resonant Column Test.
6.5.6.4 Dynamic Shear Modulus
To obtain shear modulus due to dynamic loads, the ultrasonic and resonant column test results should be taken into account, especially at location within CPF area other than also using those from Table 6.1 obtained from more conventional tests.
6.5.6.5 Poisson’s Ratio
Poisson’s ratio was obtained from literature and comparison with actual laboratory and geophysical test data in order to obtain undrained young’s modulus and shear modulus parameters ( see Table 6.1 ).
6.6 Groundwater and Surface Water 6.6.1 General
Groundwater that was encountered in ground investigation can be divided into two types of aquifer, such as: unconfined aquifer as shallow aquifer and confined aquifer as deep aquifer. Surface water in the floodplain area is mainly influenced by fluctuation of the Bengawan Solo river where yearly river floods occur as a result of general and / or flash flooding in the Bengawan Solo River.
PT. Geoindo Geotechnical Survey - Banyu Urip Field, Cepu Block
MC / 001 / 02 / Rep.1. - Final Geotechnical and Topographic Survey Report - 16/09/02 89
Groundwater is likely to rise during periods of heavy rainfall, especially in rainy season, and fall during dry seasons with dry periods / drought conditions.
6.6.2 Groundwater
a. Shallow
The groundwater levels at reservoir, open area, water intake and airstrip area were 0.5 to 5 m below ground level. Central processing Facilities and Pad D area were 1 to 4 m below ground level.
At the Pad B, C and F, groundwater level occurs as shallow unconfined aquifer at 1 to 4 m depth below ground level in rainy season. Shallow groundwater level along pipeline route was encountered as follows: Export Pipeline Shoreline Facility 0.5 m to 1 m, Bengawan Solo River Crossing about 2 to 3 m depth which is influenced by adjacent Bengawan Solo River, Export Pipeline Route ( Section Banyuurip to Rengel about 1 to 2 m, Section Pucangan to Export Pipeline Shoreline Facility about 2 to 3 m below ground level ).
b. Deep
Deep aquifer was encountered in the ground investigation as expected in the River Terrace Sand / Sandstone and Alluvial Sand layer which underlies River Terrace Clays and Alluvial Clays and which in turn are underlain by the relatively impermeable clays of the Lidah Formation. This results in groundwater being confined in this layer and thus subartesian in nature. At the water intake area deep confined groundwater was encountered at 12 to 18 m depth below ground level, at the reservoir, airstrip and open area about 8 to 11 m, at the Central Processing Facilities and Pad D area about 10 to 17 m below ground level. Confined groundwater aquifer was not found at Pad B, C and F as expected in view of absence of River Terrace Sand / Sandstone. Deep confined groundwater along pipeline routes was encountered in the alluvial sands underlying the Bengawan Solo alluvial clays at Section Rengel to Pucangan about 10 to 25 m below ground level, Section Pucangan to Export Pipeline Shoreline Facilities about 25 m to 50 m below ground level.
PT. Geoindo Geotechnical Survey - Banyu Urip Field, Cepu Block
MC / 001 / 02 / Rep.1. - Final Geotechnical and Topographic Survey Report - 16/09/02 90
c. Influence on foundations
Generally, groundwater level will influence foundations by entering excavation as well as reducing bearing capacity of soil.
The position of the groundwater level may have a significant effect on the bearing capacity. Generally, the submergence of soils will cause loss of the apparent cohesion due to capillary stresses or weak cementation bonds. At the same time the effective unit weight of submerged soils will be reduced to about one-half the weight of the same soils above water.
d. Groundwater control
Groundwater control maybe required to control water level in excavations. The methods that can be considered are open pumping, pre-drainage, deep wells, installation of a well point system. The influence of groundwater and control will require further consideration at detailed engineering design stage.
6.6.3 Surface Water
Surface water mainly influenced by fluctuation of Bengawan Solo River and also by rainfall and run off during rainy season. Water flows into Bengawan Solo River from the development area via seasonal / intermittent streams / small rivers which originate from River Terrace sandstone springs and flow down the upland valleys to the floodplain ( where water is used for irrigation ) and then into the Bengawan Solo River.
6.6.4 Seasonal variations
Seasonal variation should be expected in response to the two seasons, rainy season and dry season, that occur at the development area. Wet season is characterised by heavy rainfall and dry season by no or little rainfall. The Bengawan Solo River can experience seasonal rise / fall of 10 - 15 m, with flooding expected as the river overflows generally up to as much as + 24.75 m asl at the location of the proposed water reservoir or flash floods up to 3 m high above river level at time of event or more during the rainy ( wet ) season.
PT. Geoindo Geotechnical Survey - Banyu Urip Field, Cepu Block
MC / 001 / 02 / Rep.1. - Final Geotechnical and Topographic Survey Report - 16/09/02 91
The southern part of development area is generally dry though streams and small rivers emerge from the River Terrace Sandstone / Sands at various locations and flow in the valleys between ridges down and north towards the Bengawan Solo River. The small rivers and streams tend to partly or completely dry up during the dry season.
6.7 Soil and Groundwater Corrosivity 6.7.1 General
The corrosion of pipeline or steel pile is likely to be a serious problem in two situations:
• Pipeline or piles driven or submerged into disturbed ground ( i.e. fill ).
• Pipeline or piles in marine environment
Pipe line, steel piles and reinforcement installed in undisturbed ground are not generally subject to significant corrosion below the water table. Above the water table, or in a zone of alternate wetting and drying from tidal action, corrosion rates can be increased, depending on temperature, pH and chemistry of the aqueous environment. In soils and groundwater having high sulphate and chloride concentrations and low pH, corrosion would be encountered.
6.7.2 Soil and Ground Chemistry
Chemical testing was carried out on soil and ground water samples In order to obtain information on ground condition and corrosivity of investigation area, especially along pipeline route and at central processing area. The results of the tests as pH, Chloride and Sulphate contents are summarised in Table 6.5 and Figures 9A & 9B.
6.7.3 Corrosion
◊ Classification
1. Based on Sulphate content Various Standards are available for assessing the aggressiveness of the groundwater based on its sulphate as follows:
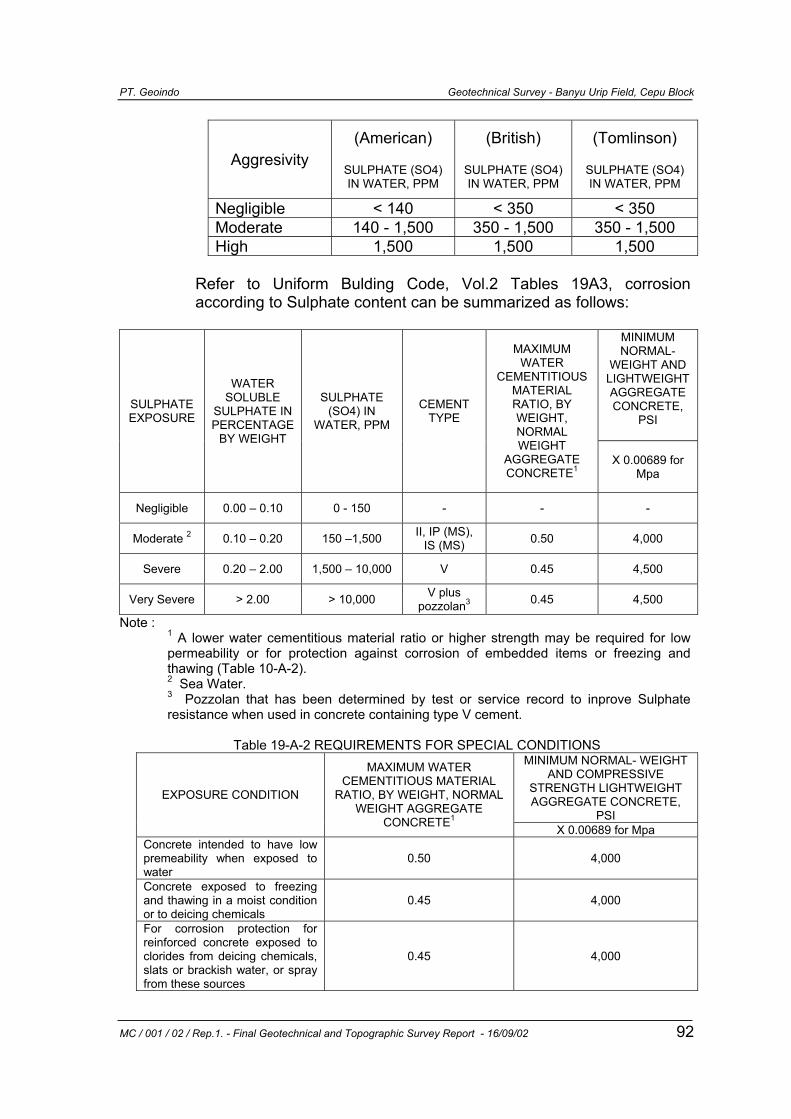
PT. Geoindo Geotechnical Survey - Banyu Urip Field, Cepu Block
MC / 001 / 02 / Rep.1. - Final Geotechnical and Topographic Survey Report - 16/09/02 92
Aggresivity (American)
SULPHATE (SO4) IN WATER, PPM
(British)
SULPHATE (SO4) IN WATER, PPM
(Tomlinson)
SULPHATE (SO4) IN WATER, PPM
Negligible < 140 < 350 < 350 Moderate 140 - 1,500 350 - 1,500 350 - 1,500 High 1,500 1,500 1,500
Refer to Uniform Bulding Code, Vol.2 Tables 19A3, corrosion according to Sulphate content can be summarized as follows:
MINIMUM NORMAL-
WEIGHT AND LIGHTWEIGHT AGGREGATE CONCRETE,
PSI
SULPHATE EXPOSURE
WATER SOLUBLE
SULPHATE IN PERCENTAGE
BY WEIGHT
SULPHATE (SO4) IN
WATER, PPM
CEMENT TYPE
MAXIMUM WATER
CEMENTITIOUS MATERIAL RATIO, BY WEIGHT, NORMAL WEIGHT
AGGREGATE CONCRETE1
X 0.00689 for Mpa
Negligible 0.00 – 0.10 0 - 150 - - -
Moderate 2 0.10 – 0.20 150 –1,500 II, IP (MS), IS (MS) 0.50 4,000
Severe 0.20 – 2.00 1,500 – 10,000 V 0.45 4,500
Very Severe > 2.00 > 10,000 V plus pozzolan3 0.45 4,500
Note : 1 A lower water cementitious material ratio or higher strength may be required for low permeability or for protection against corrosion of embedded items or freezing and thawing (Table 10-A-2). 2 Sea Water. 3 Pozzolan that has been determined by test or service record to inprove Sulphate resistance when used in concrete containing type V cement.
Table 19-A-2 REQUIREMENTS FOR SPECIAL CONDITIONS
MINIMUM NORMAL- WEIGHT AND COMPRESSIVE
STRENGTH LIGHTWEIGHT AGGREGATE CONCRETE,
PSI
EXPOSURE CONDITION
MAXIMUM WATER CEMENTITIOUS MATERIAL
RATIO, BY WEIGHT, NORMAL WEIGHT AGGREGATE
CONCRETE1 X 0.00689 for Mpa Concrete intended to have low premeability when exposed to water
0.50 4,000
Concrete exposed to freezing and thawing in a moist condition or to deicing chemicals
0.45 4,000
For corrosion protection for reinforced concrete exposed to clorides from deicing chemicals, slats or brackish water, or spray from these sources
0.45 4,000
PT. Geoindo Geotechnical Survey - Banyu Urip Field, Cepu Block
MC / 001 / 02 / Rep.1. - Final Geotechnical and Topographic Survey Report - 16/09/02 93
Based on sulphate content, Banyu Urip area range 55 - 320 ppm in the upper part, becoming range 317 to 1872 ppm at lower depths. Along pipe route range 38 - 279 ppm upto 5 m depth becoming range 4040 to 4300 ppm at lower depths. 2. Based on Chloride Content
Refer to Uniform Building Code, Vol.2 Tables 19A3, maximum chloride ion content for corrosion protection can be summarized as follows:
TYPE OF MEMBER
MAXIMUM WATER-SOLUBLE CHLORIDE ION (CL) IN CONCRETE,
PERCENTAGE BY WEIGHT OF CEMENTATITIOUS MATERIALS
Prestressed concrete 0.06 Reinforced concrete exposed to chloride in service 0.15
Reinforced concrete that will be dry or protected from moisture in service
1.00
Other reinforced concrete construction 0.3
3. Based on pH
The BRE Digest ranks pH values of less than 6 as moderately aggressive and less than 3.5 as very aggressive.
4. Miscellaneous aggressive agencies
Barry (1982) lists the following possible sources of attack of concrete. Agent Attack (i) Inorganic acids (e.g
sulphuric, nitric, hydrochloric acid
Can dissolve components of concrete: severity depends on concentration
(ii) Organic acids (e.g. ecetic, lactic, formic, humic acid
Can slowly dissolve concrete. The attack is generally slow
(iii)
Alkalis (e.g. sodium and potassium hydroxide)
Alkalis such as these will dissolve concrete when highly concentrated.
PT. Geoindo Geotechnical Survey - Banyu Urip Field, Cepu Block
MC / 001 / 02 / Rep.1. - Final Geotechnical and Topographic Survey Report - 16/09/02 94
(iv)
Plant and animal fats (e.g. olive oil, fish oil and linseed oil)
Bond strength may be reduce
(v) Mineral oil and coal tar (e.g. light and heavy oil, paraffin)
If low viscosity, these can degrade concrete. Phenols and creosols corrode.
(vi) Organic matter (e.g. landfill refuse)
Organic matter can degrade concrete if hydrolysis results in lime removal.
6.7.4 Soil Resistivity and Corrosion Control
Soil resistivity values; for pipeline design can be based on electric and thermal measurements undertaken for the geotechnical investigation along pipeline route from Banyu Urip to Tuban Shoreline Facility (see Drawing No. MC / 001 / GEO / 018 to 020). The results are tabulated in Appendix 3 (10.4) - Electric resistivity survey and Appendix 3 (10.5) - Thermal resistivity survey. Thermal resistivity values combined with electrical resistivity values and pH can be used to determine corrosivity of the soils along the pipeline route. Moisture content and dry density influence thermal resistivity values. As moisture content and dry density or both increase, the resistivity decreases. Structures of soil particles also affect the resistivity. The shape of soil particles determines surface contact area between particles, which affect the ability of the soil to conduct heat. In regard to corrosion process of a buried pipe, high thermal resistivity tends to be more corrosive especially if the temperature of fluid inside the pipe is warmer than the surrounding soils. This is due to the fact that the corrosion processes accelerate with increased temperature.
From chemical testing and resistivity measurements, Banyu Urip Development area can be concluded that for first 7 m depth, the degree of aggressiveness / corrosiveness is moderate / fairly corrosive, becoming severe or highly corrosive for depth ranges from about 7 m to about 25 m depth.
Along pipeline route (wet area) can be concluded that the degree of aggressiveness / corrosiveness is moderate / fairly corrosive upto 5 m depth. At Tuban Export shoreline Facility is highly corrosive.
PT. Geoindo Geotechnical Survey - Banyu Urip Field, Cepu Block
MC / 001 / 02 / Rep.1. - Final Geotechnical and Topographic Survey Report - 16/09/02 95
Corrosion can be controlled by design of appropriate cathodic protection for pipeline below water table.
6.7.5 Cement Type
Based on sulphate content, cement type that will generally be suitable are II, IP (MS), IS (MS), (UBC, 1984) or IP-K. Pozzolan Cement (SNI) which is specific for corrosive materials.
6.8 Roads, Airstrip, Parking and Hardstanding
Insitu soaked design subgrade CBR 1 % both for AllClay 1 and RTClay 1 can be used for design of roads, airstrip, parking and hardstanding. The final pavement thickness and make up will not only depend on the subgrade strength but also on the traffic loading and number of load repetitions. Combined standard compaction - CBR can increase CBR value on subgrade to 2 % at optimum content 24 % on Allclay1 and 2 - 3 % at optimum moisture content 26 % on RTClay1. Treatment on subgrade with lime stabilization with Quick Lime content range within 5% and Natural moisture content at 100% - 130% can increase CBR value from above 2% to 7% ( see Figure 16.C.2 for detail ).
6.9 Rail Road Subgrade 6.9.1 General
There is an existing government owned railroad in the north part of the project area connecting Cepu and Surabaya which sits on a 1 to 2 meter high embankment. New railroad assumed will be constructed by MCL to connect their facilities to the existing railroad.
6.9.2 Site Preparation New railroad should be constructed on embankment with elevation of not less than 25.25 meter above msl to avoid flooding.
PT. Geoindo Geotechnical Survey - Banyu Urip Field, Cepu Block
MC / 001 / 02 / Rep.1. - Final Geotechnical and Topographic Survey Report - 16/09/02 96
6.9.3 Subgrade Subgrade can be constructed by replacing the first 1 meter topsoil with compacted alluvium clay having a CBR of 1 to 1.5 %. Lime stabilization can be used to increase CBR value up to 2 to 7%. The undrained shear strength will also be increased from firm to very stiff ( 150 Kpa ) if use quicklime ( CaO content of 40 % ) and 5% by weight. Use of geotextile or geogrids as fill separator will reduce the fill thickness while at the same time will increase the bearing capacity of subgrade fill.
6.9.4 Ballast
For preliminary design, thickness of Ballast can be taken as follows : a. Ballast : 150 to 300 mm thick b. Subballast : 150 to 300 mm thick A minimum total thickness for ballast and subballast could be taken as 450 mm.
6.9.5 Embankment to avoid Flooding
Maximum flood level which has occurred is 24.75 meter above msl, Railroad is recommended to be constructed on top of embankment with elevation of not less than 25.25 meter above msl. Embankment can be constructed on top of subgrade composed of compacted lime stabilized clay layer as has already been explained for the road subgrade construction.
7. CONCLUSION AND RECOMMEDATIONS FOR FURTHER WORK
The findings of the investigation and geotechnical assessment in this report are adequate for preliminary design purposes or tender purposes. However, it is recommended that considerable further geotechnical analysis and geotechnical engineering will be required for detailed design in account of the following : ◊ Banyu Urip site is possibly affected by NW-SE, N-S, E-W trending
faults which are young and potentially active. ◊ CPF location is possibly affected by faulting with a 100 - 200 m wide
fault zone.
PT. Geoindo Geotechnical Survey - Banyu Urip Field, Cepu Block
MC / 001 / 02 / Rep.1. - Final Geotechnical and Topographic Survey Report - 16/09/02 97
◊ Consideration should be given to relocate the CPF and alternative
site(s) should be chosen.
◊ Alternative CPF location(s) should be investigated by high resolution seismic survey followed by detailed geotechnical investigation similar to this recent investigation.
◊ Faulting and seismicity is possibly a major issue at Banyu Urip site.
◊ Massive earthworks will be involved for construction of reservoir,
airstrip and open area.
◊ Excavation will generate large amount of poor quality bulk fill which will require “capping layer” and/or soil improvement such as stabilization by quicklime.
Sensitive structures or facilities need to be relocated away from active faults with safety equipment incorporated in design with triggers that shut down or isolate during damaging earthquake events. Geotechnical problems and considerations have been identified and discussed. Shallow foundations will be possible on alluvial clays, river terrace clays and fill for lightly loaded structures with applied bearing pressures of 50 - 75 kN / m 2 for strips and pads. Raft foundations could also be considered. However, seismic design considerations may result in considerable cost saving if designed for deeper piled raft foundation. Likewise, piled raft foundations may be necessary for more heavily loaded or critical structures. Settlements should be limited to < 25 mm for pad / strips with < 60 mm for rafts. Sands at Tuban may be prone to liquefaction and therefore the metering station should be piled. Considerably more detailed geotechnical analysis and design will be required at detailed design stage prior to start of the EPC contract. However, the CPF location should be relocated prior to tender for EPC in order to define where this will be located in relation to the development.
PT. Geoindo Geotechnical Survey - Banyu Urip Field, Cepu Block
MC / 001 / 02 / Rep.1. - Final Geotechnical and Topographic Survey Report - 16/09/02 98
Further topographic and geotechnical survey will be necessary including high resolution seismic survey for the new CPF location which may need to be moved more than once to avoid faulting.
Related Documents