Sugar Research Australia Final Report - Project 2015/016 1 • Leaf sucrose: The link to diseases, physiological disorders such as YCS and sugarcane productivity Final report prepared by: Gerard Scalia, Kate Wathen-Dunn, Annelie Marquardt, Frederik Botha Chief Investigator: Gerard Scalia Research organisation: Sugar Research Australia Co-funder: Queensland Department of Agriculture and Fisheries Date: 1 June 2020 Key Focus Area (KFA): 3. Pest, disease and weed management FINAL REPORT 2015/016

Welcome message from author
This document is posted to help you gain knowledge. Please leave a comment to let me know what you think about it! Share it to your friends and learn new things together.
Transcript

Sugar Research Australia Final Report - Project 2015/016
1
•
Leaf sucrose: The link to diseases,
physiological disorders such as YCS and
sugarcane productivity
Final report prepared by: Gerard Scalia, Kate Wathen-Dunn, Annelie Marquardt, Frederik Botha
Chief Investigator: Gerard Scalia
Research organisation: Sugar Research Australia
Co-funder: Queensland Department of Agriculture and Fisheries
Date: 1 June 2020
Key Focus Area (KFA): 3. Pest, disease and weed management
FINAL REPORT 2015/016

Sugar Research Australia Final Report - Project 2015/016
2
© Sugar Research Australia Limited 2020
Copyright in this document is owned by Sugar Research Australia Limited (SRA) or by one or more other parties which have provided it to SRA, as indicated in the document. With the exception of any material protected by a trade mark, this document is licensed under a Creative Commons Attribution-NonCommercial 4.0 International licence (as described through this link). Any use of this publication, other than as authorised under this licence or copyright law, is prohibited.
http://creativecommons.org/licenses/by-nc/4.0/legalcode - This link takes you to the relevant licence conditions, including the full legal code.
In referencing this document, please use the citation identified in the document.
Disclaimer:
In this disclaimer a reference to “SRA” means Sugar Research Australia Ltd and its directors, officers, employees, contractors and agents.
This document has been prepared in good faith by the organisation or individual named in the document on the basis of information available to them at the date of publication without any independent verification. Although SRA does its best to present information that is correct and accurate, to the full extent permitted by law SRA makes no warranties, guarantees or representations about the suitability, reliability, currency or accuracy of the information in this document, for any purposes.
The information contained in this document (including tests, inspections and recommendations) is produced for general information only. It is not intended as professional advice on any particular matter. No person should act or fail to act on the basis of any information contained in this document without first conducting independent inquiries and obtaining specific and independent professional advice as appropriate.
To the full extent permitted by law, SRA expressly disclaims all and any liability to any persons in respect of anything done by any such person in reliance (whether in whole or in part) on any information contained in this document, including any loss, damage, cost or expense incurred by any such persons as a result of the use of, or reliance on, any information in this document.
The views expressed in this publication are not necessarily those of SRA.
Any copies made of this document or any part of it must incorporate this disclaimer.
Please cite as: Scalia G, Wathen-Dunn K, Marquardt A and Botha FC (2020) Leaf sucrose; the link to diseases, physiological disorders such as YCS and sugarcane productivity: Final Report Project 2015/016. Sugar Research Australia Limited, Brisbane.

Sugar Research Australia Final Report - Project 2015/016
3
ABSTRACT
Yellow canopy syndrome (YCS) is a physiological disorder expressing as yellowing of the mid-canopy.
Rapid growth following a stress period where growth rate of the top internodes has been
compromised creates a supply demand imbalance. This results in high sucrose accumulation in the
leaf which triggers yellowing. Accumulation of sucrose past an upper tolerance level causes partial
stomatal closure, overheating, disruption to photosynthetic machinery, chloroplast destruction and
leaf yellowing. Gene expression, protein and metabolite data all support a disruption to leaf
metabolism as well as a strong association with abiotic stress. The data collectively shows that the
metabolism of YCS-affected plants is compromised throughout the mid-canopy and occurs well
before the onset of visual yellowing. Repartitioning of carbon to starch and other pools is an attempt
to lessen the sucrose load within the source leaf, while also reducing oxidative stress. High levels of
starch accumulation in the midrib veins of YCS leaves can be easily stained and viewed. This method
can be used to reduce misdiagnosis when coaligned with correct symptom development and
expression. There is no CCS penalty association with YCS, and crops can grow out of a YCS event.
Management options to mitigate YCS involve best practice farming to reduce stress on the crop prior
to and during the peak growing season. This will increase the sink capacity in the stalk and prevent a
supply and demand imbalance. The data does not support a single cause and may therefore be
either biotic, abiotic, or a combination of both.
EXECUTIVE SUMMARY
Yellow canopy syndrome was first noted in 2012 as an undiagnosed condition of the sugarcane mid-
canopy. Yellowing of the mid-canopy is concerning as leaves in this region of the plant are
responsible for sucrose production and have the highest rate of photosynthate export. These leaves
are known as the sugar ‘source’ and any disruption to their production may reduce yield or
commercial cane sugar (CCS). Healthy crops are dependent on an unimpeded supply of
photoassimilate from the source to the growing or filling tissue which is known as the ‘sink’. If a
strong sugar gradient between the source and sink is not maintained, sugar transport out of the leaf
will be compromised and a source sink imbalance will ensue. A physical blockage in the phloem or
reduced physical or physiological sink strength will all reduce mass flow of sucrose between the
source and sink. This could be caused by a pathogen or a product of the plant’s defence response to
a biotic agent or physical wounding, or by reduced sink growth. The outcome of this is sucrose
accumulation in the source leaf.
In the pilot project 2014/090 it was shown that YCS plants have elevated levels of leaf sucrose and
altered leaf metabolism, which included a reduction of both photosystems, reduced carbon fixation
and altered partitioning of photosynthate. Based on this finding, the current project aimed to
address this issue by taking an inside-out approach to identify the cause of leaf sucrose
accumulation. The study presented in this report is an in-depth examination of changes to the
plant’s metabolism in response to reduced carbon demand from the sink, which leads to YCS
symptom expression. Understanding the metabolic changes before and after the onset of visual
yellowing is critical to unravelling the cause of high sucrose accumulation in the leaf. Identification of
the cause of YCS symptom expression would be a critical step in the development of a potential YCS
management program. To characterise the changes to metabolism, a combination of physiological

Sugar Research Australia Final Report - Project 2015/016
4
and molecular studies including transcriptome, proteome, and metabolome analyses were
conducted in YCS symptomatic plants (leaf and culm). Gene expression data and protein levels
support a general impact on leaf metabolism which is consistent with changes to source metabolism.
This present study revealed that YCS leaves always have elevated levels of sucrose and α-glucan
(soluble and starch), with highest amounts accumulating in the midrib and leaf sheath. Metabolite
analyses showed that during sucrose accumulation in the source leaf there is a reallocation of
carbon to alternative pools to minimise disruption to the electron transport system. In particular,
more fixed carbon is allocated to starch and soluble α-glucan and a notable upregulation of the
shikimate and phenylpropenoid pathways in the leaf. A reduction in carbon partitioning to the sink
will result in a yield penalty proportional to the reduction in carbon flow. In YCS symptomatic plants,
the changes we see to genes associated with sugar transport, C4 photosynthesis and mitochondrial
metabolism are indicative of a response to reduced carbon flow between the source and sink. This
response is an attempt to minimise changes to metabolism that lead to cellular damage.
Based on the data from this study, we postulate that YCS symptom development is a direct
consequence of the accumulation of sucrose in the leaf created by reduced sucrose export. The
consequence of sucrose accumulation in the leaf is partial stomatal closure, causing reduced
evaporative cooling. This combined with a reduction of energy flow to the final electron acceptors of
the photosystems and more heat dissipation, results in overheating. The uncoupling of the
photosynthetic electron transport system and a reduction in oxidised coenzyme directly drive photo-
oxidative damage, chloroplast destruction and yellowing. Evidently in the YCS symptomatic tissues,
antioxidant activity is induced to try to counteract this problem. Antioxidant production of caffeoyl-
quinic acids and quinate provides buffering of free radical production in the chloroplast. In healthy
leaves, photosynthate export rates are sufficient to prevent sucrose build-up, and adequate levels of
oxidised coenzyme are maintained ensuring full functioning of the electron transport chain.
The results presented here indicate that it is unlikely that a physical blockage is impeding sucrose
translocation, and that leaf sucrose accumulation is primarily driven by changes to the sink tissue. In
the current study we have only studied the culm as a sink for the photosynthate produced and
exported from the leaf. However, it would be safe to argue that a disruption in any major sink or
non-photosynthetic tissue in the sugarcane plant would result in a similar impact on leaf
metabolism.
The internodes in YCS symptomatic plants are indicative of sink tissue that are in a ‘feast’ status i.e.
not carbon starved. This would explain why no CCS penalty is associated with YCS expression. High
yielding crops exhibit strong sink strength and have reduced risk of YCS development.
An insight into carbon repartitioning to starch in the midrib vascular tissue was instrumental in the
development of the midrib stain test. This test has assisted researchers and service providers to
identify YCS and reduce the incidence of misdiagnosis. These research outcomes address many of
the concerns that have plagued the industry since 2012. They also offer an insight into the
management of YCS and a means to evaluate impact on the crop.
One of the most significant outcomes from this research has been the huge advance made in our
understanding of the fundamental physiology of commercial sugarcane varieties. The knowledge
regarding the importance of maintaining leaf sucrose below a critical threshold will find application

Sugar Research Australia Final Report - Project 2015/016
5
in many aspects of future international sugarcane improvement, production, and stress
management.
The data does not support a single cause of YCS expression and is consistent with a source sink
imbalance in which reduced physical or physiological sink tissue capacity inhibits demand. YCS is not
a disease, it is a physiological disorder comparable to source-sink regulated senescence.

Sugar Research Australia Final Report - Project 2015/016
6
TABLE OF CONTENTS
ABSTRACT ............................................................................................................................................. 3
EXECUTIVE SUMMARY .......................................................................................................................... 3
TABLE OF TABLES ................................................................................................................................ 10
TABLE OF FIGURES .............................................................................................................................. 11
1. BACKGROUND ............................................................................................................................. 19
1.1. Yellow canopy syndrome (YCS) ........................................................................................... 19
1.1.1. Leaf sucrose, photosynthesis and metabolism ................................................................. 19
1.1.2. Source sink imbalance ......................................................................................................... 20
1.1.3. Crop stress and management ............................................................................................. 21
1.1.4. Diagnostic ............................................................................................................................. 21
2. PROJECT OBJECTIVES .................................................................................................................. 21
3. OUTPUTS, OUTCOMES AND IMPLICATIONS ................................................................................ 22
3.1. Outputs ............................................................................................................................... 22
3.2. Outcomes and Implications................................................................................................. 23
4. INDUSTRY COMMUNICATION AND ENGAGEMENT ..................................................................... 24
4.1. Industry engagement during course of project ................................................................... 24
4.1.1. Presentations to industry and scientific research community......................................... 24
4.1.2. Industry conference papers ................................................................................................ 24
4.2. Industry communication messages ..................................................................................... 25
5. METHODOLOGY .......................................................................................................................... 26
5.1. Field visits ............................................................................................................................ 26
5.2. Material sampling ............................................................................................................... 26
5.2.1 Leaf, internode and xylem sap ........................................................................................... 27
5.2.2 13C Labelling and sampling .................................................................................................. 29
5.3. Sample processing .............................................................................................................. 30
5.3.1. Lyophilisation of samples .................................................................................................... 30
5.3.2. Extraction method chlorophyll and carbohydrates from lyophilised material or a single
fresh leaf disk ........................................................................................................................................ 31
5.3.3. RNA extraction from fresh mid-leaf powder ..................................................................... 31
5.3.4. Protein extraction from lyophilised leaf material ............................................................. 32
5.3.5. Extraction of metabolites for GC-MS (Untargeted) and LC-MS (Amino Acids and
Untargeted Profiling) ............................................................................................................................ 33
5.3.6. Derivatisation of Polar metabolites .................................................................................... 34
5.3.7. Amino acids .......................................................................................................................... 34
5.3.8. Preparation of xylem sap samples for analyses ................................................................ 34

Sugar Research Australia Final Report - Project 2015/016
7
5.3.9. Callose extraction ................................................................................................................ 34
5.3.10. Apoplastic fluid .................................................................................................................... 34
5.4. Sample analyses .................................................................................................................. 35
5.4.1. Quantification of carbohydrates ........................................................................................ 35
5.4.2. GC-MS analysis ..................................................................................................................... 35
5.4.3. LC-QQQ-MS .......................................................................................................................... 36
5.4.4. Hormone analyses ............................................................................................................... 37
5.4.5. Xylem sap analyses .............................................................................................................. 37
5.4.6. HPLC-ESI-MS/MS.................................................................................................................. 37
5.4.7. RNA-sequencing................................................................................................................... 38
5.4.8. Amino acid quantification ................................................................................................... 38
5.4.9. Photosynthesis ..................................................................................................................... 39
5.4.10. Chlorophyll A fluorescence ................................................................................................. 39
5.4.11. Callose quantification .......................................................................................................... 39
5.4.12. Statistical analyses ............................................................................................................... 40
5.4.13. Transcriptome Assembly ..................................................................................................... 40
5.5. Field trials ............................................................................................................................ 44
5.5.1. Growth regulator ................................................................................................................. 44
5.5.2. Insecticide Trial .................................................................................................................... 45
6. RESULTS AND DISCUSSION .......................................................................................................... 46
6.1. YCS symptom expression .................................................................................................... 46
6.2. Leaf yellowing – disruption to source ................................................................................. 47
6.2.1. Leaf sucrose ......................................................................................................................... 48
6.2.1.1. Consequences of elevated sucrose in the source leaf...................................................... 49
6.2.2. Water content...................................................................................................................... 50
6.2.3. Stomatal conductance and photosynthesis ...................................................................... 51
6.2.4. Gene expression and protein ............................................................................................. 56
6.2.4.1. Light reactions...................................................................................................................... 56
6.2.4.2. Primary Carbon fixation ...................................................................................................... 59
6.2.4.3. Decarboxylation ................................................................................................................... 59
6.2.4.4. Refixation ............................................................................................................................. 62
6.2.4.5. Calvin cycle ........................................................................................................................... 63
6.2.4.6. Pigment biosynthesis & breakdown ................................................................................... 64
6.2.5. Carbohydrate metabolism .................................................................................................. 65
6.2.6. Carbon partitioning ............................................................................................................. 70
6.3. Is leaf sucrose accumulation primarily driven by changes to source or sink? ..................... 75

Sugar Research Australia Final Report - Project 2015/016
8
6.3.1. Phloem loading, transport, and carbon turnover ............................................................. 76
6.3.1.1. Sucrose synthesis and active phloem loading ................................................................... 76
6.3.1.2. Sucrose translocation and carbon turnover (13C labelling) .............................................. 80
6.3.2. Leaf sucrose accumulation at a cellular level .................................................................... 88
6.3.2.1. Apoplastic sugar levels ........................................................................................................ 88
6.3.3. Physical blockage of the phloem and plasmodesmata ..................................................... 89
6.3.3.1. Bioinformatic analyses of both the reference YCS transcriptomes (leaf and internode)
and the raw reads for sequences from phytoplasmas and other micro-organisms ....................... 89
6.3.3.2. Phytoplasma proteins ......................................................................................................... 90
6.3.3.3. Non-sugarcane organisms as potential causal agent of YCS ............................................ 91
6.3.3.4. Callose .................................................................................................................................. 92
6.3.4. Changes to the metabolome, transcriptome, and proteome .......................................... 95
6.3.4.1. Metabolites .......................................................................................................................... 96
6.3.4.2. Gene expression .................................................................................................................. 98
6.3.4.3. Proteins and amino acids .................................................................................................. 103
6.4. Source sink imbalance ....................................................................................................... 107
6.4.1. Manipulation of supply and demand ............................................................................... 110
6.4.2. Source sink imbalance & sink strength ............................................................................ 112
6.4.3. Supply & Demand Balance ................................................................................................ 115
6.5. Crop stress & YCS .............................................................................................................. 120
6.5.1. Transcriptome Results and Discussion............................................................................. 121
6.5.2. Higher abundance transcripts in YCS ............................................................................... 123
6.5.3. Lower abundance transcripts in YCS ................................................................................ 126
6.5.4. Principle component analysis ........................................................................................... 130
6.6. Diagnostics ........................................................................................................................ 135
6.6.1. Sucrose/ Starch YCS Diagnostic ........................................................................................ 135
6.6.1.1. Midrib stain test ................................................................................................................. 135
6.6.2. Novel biomarker ................................................................................................................ 139
6.6.2.1. YCS Biomarker Candidate Discovery ................................................................................ 140
6.7. Management ..................................................................................................................... 143
6.7.1. Growth rate and vigour ..................................................................................................... 144
6.7.2. Insecticide, YCS development, carbon partitioning and sink strength .......................... 145
6.7.2.1. Source leaf sucrose & α-glucan accumulation, YCS expression and sink strength ....... 146
6.7.2.2. Plant response to insect attack ........................................................................................ 152
7. CONCLUSIONS ........................................................................................................................... 153
8. RECOMMENDATIONS FOR FURTHER RD&A .............................................................................. 155

Sugar Research Australia Final Report - Project 2015/016
9
9. PUBLICATIONS ........................................................................................................................... 156
10. ACKNOWLEDGEMENTS ............................................................................................................. 156
11. REFERENCES .............................................................................................................................. 156
12. APPENDIX .................................................................................................................................. 167
12.1. Appendix 1 Publications ................................................................................................ 167
12.2. Appendix 2 Academic publications ............................................................................... 167
12.3. Appendix 3 Presentations ............................................................................................. 167
12.4. Appendix 4 Posters........................................................................................................ 167
12.5. Appendix 5 Data ............................................................................................................ 167
12.6. Appendix 6 METADATA DISCLOSURE ............................................................................ 168

Sugar Research Australia Final Report - Project 2015/016
10
TABLE OF TABLES
Table 1: Details of sampling field visits in this study ........................................................................... 26
Table 2: Gradient LC Method for 6410-QQQ ...................................................................................... 36
Table 3 Assembly metrics for the reference transcriptome ................................................................ 43
Table 4 Insecticide treatments ............................................................................................................ 44
Table 5 13C sucrose and starch turnover rates during the light and dark periods YCS and control Leaf 4
............................................................................................................................................................ 81
Table 6 DE expressed transcripts in YCS samples from genotypes Q200A, Q208A, Q240A & KQ228A
.......................................................................................................................................................... 102
Table 7 Proteins with lower abundance in yellow canopy syndrome (YCS)affected dewlap, midrib,
early-stage (ES) lamina and late-stage (LS) lamina compared to controls including fold changes.
(Marquardt, 2019) ............................................................................................................................ 105
Table 8 Feast & Famine genes .......................................................................................................... 114
Table 9 YCS tissue specific feast and famine gene expression .......................................................... 115
Table 10 shows the transcripts with an over 50 times greater abundance in YCS, sorted by Fold
Change in descending order. ............................................................................................................ 123
Table 11 Transcripts abundance over 50 times lower in YCS than in the healthy controls. .............. 127
Table 12 Annotations of biomarker transcript BLAST matches, and biomarker transcript lengths in
bases ................................................................................................................................................. 141
Table 13 YCS biomarker candidate expression in various tissue types ............................................. 142
Table 14 YCS-2 biomarker candidate primers, forward (F) and (R) reverse sequences..................... 142
Table 15 Treatments and time of application, Cumulative °Cd and internode volume (Leaf Tbase =
8°C) ................................................................................................................................................... 148
Table 16: Metadata disclosure 1 ....................................................................................................... 168
Table 17: Metadata disclosure 2 ....................................................................................................... 168
Sugar Research Australia Final Report - Project 2015/016
11
TABLE OF FIGURES Figure 1 Schematic diagram of sugarcane leaf numbering system used during sampling (A)
photograph indicating Leaf 1 in the leaf with the first visible dewlap from the top (B), modified
Fiskars hole punch 6.35mm Ø and 2mL screw cap tube (C), example of leaf disk sample taken from
early stage (ES) and late stage (LS) YCS lamina (also used for midrib) (D), diamond Drill Bit Core Blue
Ceram (8mm Ø) used to sample internode core section, forceps used to remove sample before
placing in collection tube (E), and xylem sap extracting apparatus where internode piece is inserted
into rubber tubing and regulated compressed air (1 bar) released to push sap out of the xylem into
collection tube (F). .............................................................................................................................. 28
Figure 2 Types of leaf tissue sampling ................................................................................................ 28
Figure 3 13C labelling Q240A in field; 13C delivery chamber (volume: ≈ 100mL) plastic acetate sheet
heat sealed to form a chamber 124 x 80 mm with two 12 mm strips of Consolidated Alloys Butyl
rubber sealant at each end (Bunnings part # 10266). The chamber has an internal pocket 70 x 25 mm
containing a strip of TOM organic ultra-thin absorbent liner 70 x 20mm. Inserted on top of the liner
is a 1.0mm Ø x 100mm clear transmission tube attached to a BD blunt end plastic cannula (303345)
and Terumo Terufusion 3-way Stopcock Luer Lock (TE-TSWSR201) (A); evacuating chamber and filling
with CO2 free air (B); addition of NaH13CO3 + HCl and injection into chamber (C-E) ........................... 29
Figure 4 Bioinformatics process overview for the transcriptome assembly ....................................... 41
Figure 5 YCS symptom expression usually starts where light interception is highest in the middle of
the leaf and on one side of the midrib A) YCS symptoms worse on field margin where exposure to
sunlight is highest B) white midrib C) .................................................................................................. 47
Figure 6 Q240A Lamina quarters sucrose content in Leaf 3 and 4 from Control and YCS stalks; YCS
Leaf 3 is asymptomatic and YCS Leaf 4 is symptomatic. Samples taken in the morning soon after first
light ..................................................................................................................................................... 49
Figure 7 Leaf water content across four field visits (FV), 3 genotypes and three climatic regions. FV10
Q240A Burdekin – lamina A), FV11 KQ228A Burdekin - lamina B), FV12 QC40411 Mackay – lamina C),
FV13 Q240A Maryborough – lamina D and Leaf sheath E) Tukey HSD All-Pairwise Comparisons
(p<0.05) .............................................................................................................................................. 50
Figure 8 Photosynthesis rates in leaves of the canopy of KQ228A in the Burdekin (A) and Q200A in
the Herbert (B) yellow canopy syndrome (YCS) symptomatic and asymptomatic (control) sugarcane
plants. Values ± standard deviation (Marquardt, 2019) .................................................................... 51
Figure 9 Stomatal conductance in leaves of the canopy of KQ228A in the Burdekin (A) and Q200A in
the Herbert (B) yellow canopy syndrome (YCS) symptomatic and asymptomatic (control) sugarcane
plants., YCS. Values ± standard deviation (Marquardt, 2019) ............................................................ 52
Figure 10 Internal CO2 concentration in leaves of the canopy of KQ228A in the Burdekin (A) and
Q200A in the Herbert (B) yellow canopy syndrome (YCS) symptomatic and asymptomatic (control)
sugarcane plants., YCS. Values ± standard deviation (Marquardt, 2019). ........................................... 53
Figure 11 Difference in variable fluorescence kinetics on different positions of the same leaf. OJIP
fluorescence transients were normalised (O.P) and subtracted for the first clip on the greenside of
the leaf. ............................................................................................................................................... 54
Figure 12 Difference in variable fluorescence along the lamina constructed by subtraction of
normalised (O–P) fluorescence values for the asymptomatic leaves from that recorded for the same
age symptomatic leaves. The O–J–I–P fluorescence transients A) recorded in leaves 5 and 6 of
Sugar Research Australia Final Report - Project 2015/016
12
asymptomatic (control) and symptomatic (YCS) Q240A plants B) performance index (PIABS) control,
YCS leaf 5 (asymptomatic) and YCS leaf 6 (symptomatic) C) ............................................................... 54
Figure 13 Chlorophyll a fluorescence transients (A) recorded in leaves 1, 3 and 5 of asymptomatic
(control) and symptomatic (YCS) KQ228A plants. The different stages in the fluorescence transient
(OJIP) are indicated. Difference in variable fluorescence curves (B) constructed by subtraction of
normalised (O-P) fluorescence values for the asymptomatic leaves from that recorded for the same
age symptomatic leaves...................................................................................................................... 55
Figure 14 Representation of photosynthetic electron transport chain proteins embedded in thylakoid
membrane of chloroplast, populated with differential gene expression (DE) data corresponding to
proteins of YCS leaves compared to control leaves. Embedded gene expression data is displayed as
individual transcripts (squares) with a uniform annotation (block of squares). Each annotation
contains four blocks of transcripts: top left shows DE results for green YCS leaf lamina, top right
shows yellow YCS leaf lamina, middle shows YCS midrib results and bottom shows YCS dewlap
results. Corresponding squares in each block are directly comparable (represent the same
transcript). Red represents significant upregulation in YCS tissue compared to control, and blue
represents downregulation. White represents no significant change in gene expression to control
tissue. All DE results are significant to false-discovered rate-corrected P-value of < 0.01. ................. 57
Figure 15 Oxygen-evolving complex (OEC), photosystem II (PSII) and photosystem I (PSI) subunit
gene expression change from control in pre-symptomatic (early-stage; ES) lamina, and post-
symptomatic (late-stage; LS) lamina of yellow canopy syndrome (YCS)-affected sugarcane leaves.
Shown as log2(TPM+1) of average control sample expression (paled, top graph) and log2-fold change
from control (fold change; bottom graph), for each protein coding sequence of OEC components of
PsbO (light blue; ShPsbO; 10 genes), PsbP (purple; ShPsbP; 15 genes) and PsbQ (green; ShPsbQ; 14
genes), PSII components of PsbA (ShPsbA; D1; orange; one gene), PsbB (ShPsbB, where each also
contained partials of ShPsbT, ShPsbN and ShPsbH; grey; six genes), PsbC (ShPsbC, where each also
contained partials of ShPsbZ; yellow; four genes), and PSI components of PsaA and PsaB (ShPsaA,
and ShPsaB genes were found on the same contig; dark blue; 15 genes). Asterisk symbol (*) denotes
significant change in YCS-affected tissue from control based on false discovery rate (FDR)-corrected
p-value <0.001 (Marquardt, 2019). ..................................................................................................... 58
Figure 16 Photosystem II (PSII), Oxygen-evolving complex (OEC), and photosystem I (PSI) subunit
gene expression and protein change from control in pre-symptomatic (early-stage; ES) lamina, and
post-symptomatic (late-stage; LS) lamina of yellow canopy syndrome (YCS)-affected sugarcane
leaves; PSII components of PsbA (ShPsbA; D1; one gene ) (A), OEC components of PsbO (ShPsbO; 10
genes), PsbP (ShPsbP; 15 genes) (B & C) PSI components of PsaA (ShPsaA; 15 genes) (D). ................ 58
Figure 17 Initial carbon fixation in mesophyll cell gene expression change from control in pre-
symptomatic (early-stage; ES) lamina, and post-symptomatic (late-stage; LS) lamina of yellow canopy
syndrome (YCS)-affected sugarcane leaves. Shown as log2(TPM+1) of average control sample
expression (paled, top graph) and log2-fold change from control (fold change; bottom graph), for
each protein coding sequence of carbonic anhydrase (blue; ShCA; 27 genes), phosphoenolpyruvate
carboxylase (purple; ShPPCA; 20 genes), NADP-dependent malate dehydrogenase (green; ShMDHP;
11 genes), C4-specific pyruvate phosphate dikinase (orange; ShPPDK-C4; 13 genes) and pyruvate
phosphate dikinase regulatory protein (grey; ShPDRP; nine genes). Asterisk symbol (*) denotes
significant change in YCS-affected tissue from control based on false discovery rate (FDR)-corrected
p-value <0.001 (Marquardt, 2019). ..................................................................................................... 59
Sugar Research Australia Final Report - Project 2015/016
13
Figure 18 C4 photosynthetic mechanisms. There are two pathways for production and translocation
of C4-acids to the bundle sheath. Three decarboxylation mechanisms exist, but there are doubts
whether PEPCK (reaction 18) is present in the bundle sheath cells. (Botha 2017 Appendix 4) .......... 60
Figure 19 Expression of the three decarboxylation mechanisms in three sugarcane varieties in three
very different production environments (Botha 2017 Appendix 4) .................................................... 60
Figure 20 Expression of mesophyll and bundle sheath carboxylation, and bundle sheath
decarboxylation, genes during early (A) and late stage stress (B). Expression of NADP-ME, NAD-ME,
PEPC, PEPCK and Rubisco LSU during YCS symptom development (C), water stress (D) and
senescence (E). (Botha 2017 Appendix 4) ........................................................................................... 61
Figure 21 Decarboxylation pathways in bundle sheath cell gene expression change from control in
pre-symptomatic (early-stage; ES) lamina, and post-symptomatic (late-stage; LS) lamina of yellow
canopy syndrome (YCS)-affected sugarcane leaves. Shown as log2(TPM+1) of average control sample
expression (paled, top graph) and log2-fold change from control (fold change; bottom graph), for
each protein coding sequence of NADP-dependent malic enzyme (blue; ShNADPME; 26 genes), NAD-
dependent malate dehydrogenase (purple; ShMMDH; seven genes), NAD-dependent malic enzyme
(green; ShNADME; four genes) and phosphoenolpyruvate carboxykinase (orange; ShPEPCK; five
genes). Asterisk symbol (*) denotes significant change in YCS-affected tissue from control based on
false discovery rate (FDR)-corrected p-value <0.001. (Marquardt, 2019) ........................................... 62
Figure 22 Ribulose bisphosphate carboxylase/oxygenase (Rubisco) components in bundle sheath cell
gene expression change from control in pre-symptomatic (early-stage; ES) lamina, and post-
symptomatic (late-stage; LS) lamina of yellow canopy syndrome (YCS)-affected sugarcane leaves.
Shown as log2(TPM+1) of average control sample expression (paled, top graph) and log2-fold change
from control (fold change; bottom graph), for each protein coding sequence of Rubisco large subunit
(blue; ShRbcL; ten genes), Rubisco small subunit (purple; ShRbcS; 16 genes) and Rubisco activase
(green; ShRbcA; 17 genes). Asterisk symbol (*) denotes significant change in YCS-affected tissue from
control based on false discovery rate (FDR)-corrected p-value <0.001 (Marquardt, 2019). ............... 63
Figure 23 Calvin cycle-related gene expression change from control in pre-symptomatic (early-stage;
ES) lamina, and post-symptomatic (late-stage; LS) lamina of yellow canopy syndrome (YCS)-affected
sugarcane leaves. Shown as log2(TPM+1) of average control sample expression (paled, top graph)
and log2-fold change from control (fold change; bottom graph), for each protein coding sequence of
CP12-1 (blue; ShCP12-1; three genes), CP12-2 (purple; ShCP12-2; three genes), glyceraldehyde-3-
phosphate dehydrogenase (GAPDH) A, (green; ShGADA; seven genes, GAPDH B (orange; ShGAPB;
eight genes), NADP-dependent GAPDH (grey; ShGAPN; seven genes), phosphoribulokinase (yellow;
ShPRK; eight genes). Asterisk symbol (*) denotes significant change in YCS-affected tissue from
control based on false discovery rate (FDR)-corrected p-value <0.001 (Marquardt, 2019). ............... 64
Figure 24 Overview of chlorophyll biosynthesis & breakdown, and carotenoid biosynthesis &
breakdown pathway, populated with differential gene expression (DE) data corresponding to
proteins of YCS leaves compared to control leaves. Embedded gene expression data is displayed as
individual transcripts (squares) with a uniform annotation (block of squares). Each annotation
contains four blocks of transcripts: top left shows DE results for green YCS leaf lamina, top right
shows yellow YCS leaf lamina, middle shows YCS midrib results and bottom shows YCS dewlap
results. Corresponding squares in each block are directly comparable (represent the same
transcript). Red represents significant upregulation in YCS tissue compared to control, and blue
represents downregulation. White represents no significant change in gene expression to control
tissue. All DE results are significant to false-discovered rate-corrected P-value of < 0.01. ................. 65

Sugar Research Australia Final Report - Project 2015/016
14
Figure 25 Differential gene expression (DE) data of genes associated with carbohydrate metabolism,
feedback regulation of photosynthesis and sucrose transport in YCS leaves compared to control
leaves. DE data is displayed as individual transcripts (squares) with a uniform annotation (block of
squares). Each gene row shows four blocks of transcripts: DE results for YCS dewlap, midrib, and
green and yellow leaf lamina. Corresponding squares in each block are directly comparable
(represent the same transcript). Red represents significant upregulation in YCS tissue compared to
control, and blue represents downregulation. White represents no significant change in gene
expression to control tissue. All DE results are significant to false-discovered rate-corrected P-value
of < 0.01. ............................................................................................................................................. 67
Figure 26 Changes in the levels of sugars in YCS symptomatic sugarcane plants (Herbert - Q200A,
Mackay - Q208A, Burdekin - KQ228A). Data is normalised against the control leaf four. All these
values have a t-test value below P< 0.05 (Bonferroni-corrected P value). (Botha et al., 2015) ......... 68
Figure 27 Regulation of sucrose and starch levels in asymptomatic control and early and late stages
of YCS, water stress and senescent leaf tissue. ................................................................................... 69
Figure 28 Changes in the levels of sucrose, glucose, fructose, and starch in control, YCS
asymptomatic Leaf 3 and symptomatic Leaf 4 in genotype Q240A . .................................................. 70
Figure 29 Q240A Lamina sections tip to base (A-C), Midrib sections tip to base (D-F) and Sheath (G-I);
sucrose, soluble and insoluble α-glucan content in Control, YCS asymptomatic Leaf 3 and
symptomatic Leaf 4. Samples taken in the morning soon after first light. .......................................... 71
Figure 30 Control and YCS symptomatic leaf midrib stained with 1% iodine solution. ....................... 72
Figure 31 Q240A Leaf 3 and 4, Sucrose: Soluble (A-C) and Insoluble α-Glucan (D-F) ratios in lamina,
midrib and sheath ............................................................................................................................... 73
Figure 32 KQ228A Insecticide treated and Untreated Controls (UTC) senescent leaf Sucrose, Soluble
& Insoluble α-Glucan content. ............................................................................................................ 73
Figure 33 Overview of carbon partitioning pathways overlaid with metabolite data. Coloured circles
display change in metabolite level compared to control. Results normalized where red indicates
upregulation, blue indicates downregulation, on a scale between 1 and -1 (Marquardt et al., 2017) 74
Figure 34 Carbon partitioning and source sink model centres around sucrose levels of accumulation
............................................................................................................................................................ 75
Figure 35 Differential gene expression (DE) data of genes associated with sucrose and starch
synthesis in YCS, senescent and water stress leaves compared to control leaves. DE data is displayed
as individual transcripts (squares) with a uniform annotation (block of squares). DE results for early
and late stage YCS, senescent and water stress lamina. Corresponding squares in each block are
directly comparable (represent the same transcript). Red represents significant upregulation in YCS
tissue compared to control, and blue represents downregulation. White represents no significant
change in gene expression to control tissue. All DE results are significant to false-discovered rate-
corrected P-value of < 0.01. (Marquardt 2017 Appendix 3). .............................................................. 77
Figure 36 Sugarcane active phloem loading: sucrose transporters (SUTs and SWEETs), H+-ATPases
and H+-Pyrophosphatases (H+-PPases) (Marquardt 2017 Appendix 3). .............................................. 78
Figure 37 Transcript abundance of expressed SWEET transcripts in control, early-stage (ES)- and late-
stage (LS)-yellow canopy syndrome (YCS)-affected Q240A sugarcane leaves. Data displayed as
Log2(TPM+1) value of reads mapping to reference transcript. (a) SWEET1a_1, (b) SWEET1a_2, (c)
SWEET2a, (d) SWEET_2b, (e) SWEET3, (f) SWEET4, (g) SWEET13_1, (h) SWEET13_2, (i) SWEET14.
Letters above (or below) sample type within graphs represent significant difference-groupings
Sugar Research Australia Final Report - Project 2015/016
15
between sample types (differential expression analysis result false-discovery rate (FDR)-corrected P-
value<0.05; fold-change>1.5). If letters not displayed within graph - no significant difference
between sample types was present.................................................................................................... 78
Figure 38 Transcript abundance of expressed SUT transcripts in control, early-stage (ES)- and late-
stage (LS)-yellow canopy syndrome (YCS)-affected Q240A sugarcane leaves. Data displayed as
Log2(TPM+1) value of reads mapping to reference transcript. (a) SUT1, (b) SUT2_1, (c) SUT2_2, (d)
SUT2_3, (e) SUT2_4, (f) SUT2_5, (g) SUT4. Letters above sample type within graphs represent
significant difference-groupings between sample types (differential expression analysis result false-
discovery rate (FDR)-corrected P-value<0.05; fold-change>1.5). If letters not displayed within graph -
no significant difference between sample types was present. ........................................................... 79
Figure 39 Transcript abundance of expressed H+-Pyrophosphatase (H+-PPase) transcripts in control,
early-stage (ES)- and late-stage (LS)-yellow canopy syndrome (YCS)-affected Q240A sugarcane leaves.
Data displayed as Log2(TPM+1) value of reads mapping to reference transcript. (a) H+-PPase_1, (b)
H+-PPase_2, (c) H+-PPase_3, (d) H+-PPase_4, (e) H+-PPase_5, (f) H+-PPase_6, (g) H+-PPase_7, (h) H+-
PPase_8. Letters above (or below) sample type within graphs represent significant difference-
groupings between sample types (differential expression analysis result false-discovery rate (FDR)-
corrected P-value<0.05; fold-change>1.5). If letters not displayed within graph - no significant
difference between sample types was present. ................................................................................. 80
Figure 40 Transcript abundance of expressed H+-ATPase transcripts in control, early-stage (ES)- and
late-stage (LS)-yellow canopy syndrome (YCS)-affected Q240A sugarcane leaves. Data displayed as
Log2(TPM+1) value of reads mapping to reference transcript. (a) H+-ATPase_1, (b) H+-ATPase_2, (c)
H+-ATPase_3. Letters above sample type within graphs represent significant difference-groupings
between sample types (differential expression analysis result false-discovery rate (FDR)-corrected P-
value<0.05; fold-change>1.5). If letters not displayed within graph - no significant difference
between sample types was present.................................................................................................... 80
Figure 41 13C starch synthesis during pulse period ............................................................................ 82
Figure 42 Carbon partitioning between sucrose and starch in the bundle sheath cell ....................... 82
Figure 43 13C sucrose synthesis and proportional change across the pulse chase period; AM1 (3
hours), PM1 (8 hours) and PM2 (31 hours) post labelling, control and YCS Leaf 3 and 4. .................. 83
Figure 44 13C sucrose content L3 & 4 at the end of the pulse A) and chase end B) periods ................ 83
Figure 45 13C starch synthesis and proportional change across the pulse-chase period; AM1 (3 hours),
PM1 (8 hours) and PM2 (31 hours) post labelling, control and YCS Leaf 3 and 4. .............................. 84
Figure 46 Sucrose total pool across the pulse-chase period. Tukey HSD All-Pairwise Comparisons
(p<0.05) .............................................................................................................................................. 84
Figure 47 Q240A Leaf 4 sheath sucrose and starch content, AM & PM .............................................. 85
Figure 48 Q240A Leaf 4 lamina sucrose and starch content, AM & PM ............................................. 86
Figure 49 Q240A Leaf 4 sucrose and starch sheath:lamina ratio, AM & PM ....................................... 86
Figure 50 Control and YCS asymptomatic Leaf 3 and symptomatic Leaf 4 sucrose to total α-glucan
ratio morning A) afternoon B) ............................................................................................................ 87
Figure 51 Apoplastic sugar concentrations; sucrose and reducing sugars A) apoplastic sugar ratios B)
............................................................................................................................................................ 89
Figure 52 Heatmap of Q240A sugarcane leaf samples and phytoplasma peptide matches,
quantification comparison through transcriptome contig expression levels. Blue indicates lower
abundance; red indicates higher abundance. Sample replicates listed along base of heatmap (control

Sugar Research Australia Final Report - Project 2015/016
16
= healthy, YCS = yellow canopy syndrome, Sen = senescence, WS = water-stress. Green = early-stage
of stress, yellow = late-stage of stress) ............................................................................................... 91
Figure 53 Q240A Callose content-Curdlan (CE) equivalent, Control and YCS asymptomatic Leaf 3 and
symptomatic Leaf 4, lamina, midrib and sheath A) Lamina gradient B) Midrib gradient C) Sheath D) 93
Figure 54 Lamina Sucrose callose correlation, Control and YCS asymptomatic Leaf 3 (A, C) and
Control and YCS symptomatic Leaf 4 (B, D) ........................................................................................ 93
Figure 55 Increased expression of plasmodesmata- and phloem-specific callose deposition CalS
isoforms in YCS (ES = early stage YCS lamina, LS = late stage YCS lamina) .......................................... 94
Figure 56 Fold change in YCS expression of callose synthase 7, by tissue type................................... 95
Figure 57 PCA analysis Control and YCS AM & PM (Botha et al., 2015) .............................................. 97
Figure 58 VIP scores with the corresponding heat map of statistically significant metabolites from
YCS symptomatic (4Y, 6Y) and asymptomatic (4C, 6C) leaf tissue in the morning and late afternoon
(a). Green and red indicate decreased or increased metabolite levels. Relative abundance of sucrose
(b), glucose (c), fructose (d) and maltose (e) (Marquardt et al., 2017) ............................................... 97
Figure 59 Relative changes in metabolites from YCS symptomatic (4Y, 6Y) and asymptomatic (4C, 6C)
leaf tissue associated with the phenylpropanoid pathway (A–D), and the pentose phosphate cycle (E,
F). Shikimate (A), caffeoyl quinate (B), coumaroyl quinate (C), quinate (D), rhamnose (E), xylose (F),
arabinose (G) and ribose (H) (Marquardt et al., 2017) ........................................................................ 98
Figure 60 Pie chart of Biological Process, subgraph Metabolic Process GO ontology categorization of
808 upregulated genes unique to YCS leaf yellowing (FDR-corrected P-value < 0.001). Numbers in
brackets represent number of genes within category. Category “Other” blankets categories
containing < 0.5% of total number of genes. ...................................................................................... 99
Figure 61 Volcano plot of the expression data. The red dots show the 109 statistically-significant
results. .............................................................................................................................................. 101
Figure 62 Summary of the biological processes represented by the 109 statistically-significant contigs
differentially expressed in the YCS vs Control analysis of data from (Field Visits 3, 4 and 6 combined)
against sugarcane PacBio transcriptome (Hoang et al., 2018) ......................................................... 102
Figure 63 Cellular location of protein proportional abundance in YCS leaf....................................... 104
Figure 64 Number of identified proteins in yellow canopy syndrome (YCS)-affected leaf tissue in
dewlap, midrib, lamina early-stage (ES) and lamina late-stage (LS). Blue end indicates number of
proteins with decreased level, red end indicates number with increased level, and grey indicates
number with no level change compared to controls. Differential abundance (level change) defined as
false discovery rate (FDR)-corrected Pvalue <0.05. (Marquardt, 2019) ............................................ 105
Figure 65 Changes in the levels of amino acids in YCS symptomatic sugarcane plants. Data is
normalised against the control leaf two. All these values have a t-test value below P< 0.05
(Bonferroni-corrected P value). ........................................................................................................ 106
Figure 66 Internode 4 & 6 xylem sap sucrose A), glucose B) and fructose C), Q200A Herbert, KQ228A
Burdekin, Q208A Mackay. Tukey HSD All-Pairwise Comparisons (p<0.05) ....................................... 107
Figure 67 Separation of KQ228A Leaf 4 midrib vascular and parenchymatous tissue using a lino
cutting chisel ..................................................................................................................................... 108
Figure 68 KQ228A Leaf 4 midrib Vascular bundle (VB) and Parenchymatous tissue (PT) sucrose,
soluble & insoluble α-glucan content (AM & PM). (note: sucrose units µmol/g DM; α-glucan units
µmol glucose equivalent/g DM) ........................................................................................................ 108

Sugar Research Australia Final Report - Project 2015/016
17
Figure 69 KQ228A Leaf 4 midrib diurnal flow rate (Total hexose units/hour). Vascular bundle (VB) and
Parenchymatous tissue (PT). ............................................................................................................. 109
Figure 70 Growth regulator treatments KQ228A Leaf 4 sucrose and Total α-Glucan content lamina A
& C), midrib B & D)............................................................................................................................ 110
Figure 71 KQ228A growth regulator trial, internode (1-10) volume cm3. Internode # 1 directly
beneath leaf sheath of true leaf #1 (FVD) ......................................................................................... 111
Figure 72 KQ228A internode 4 volume by treatment A) and leaf area B). GA inhibitor (Moddus) and
YCS have a larger supply to demand function than control. Tukey HSD All-Pairwise Comparisons
(p<0.05) ............................................................................................................................................ 111
Figure 73 KQ228A Internode 4 & 6 sucrose concentration; control, YCS and Moddus ..................... 112
Figure 74 Supply and demand balance, Control A) and YCS B) ......................................................... 116
Figure 75 KQ228A leaf & internode 4 supply demand balance ......................................................... 117
Figure 76 KQ228A Leaf 4 (lamina and midrib inclusive) total sucrose and α-glucan content ........... 117
Figure 77 Source sink tissue, sucrose, and α-glucans ........................................................................ 118
Figure 78 Leaf source (A) and sink (B & C) tissue sucrose & α-glucan content; treatments: control,
YCS and Moddus (GA inhibitor) ........................................................................................................ 118
Figure 79 α-Glucan synthesis through CO2 fixation A) sucrose breakdown B) .................................. 119
Figure 80 Starch proportion of total α-glucan pool Lamina A) Midrib B) Sheath C) .......................... 120
Figure 81 Transcriptomic differential expression analysis showing the biological processes enriched
in the transcripts up-regulated in YCS-affected plants...................................................................... 122
Figure 82 Molecular functions enriched in the transcripts in higher abundance in YCS ................... 122
Figure 83 Volcano plot (log fold change against log p-value) of YCS differential expression results,
with the highly significant transcripts (Bonferroni-corrected p-value = 0.0 and log2 absolute fold
change >1) shown in red. .................................................................................................................. 123
Figure 84 Simplified conceptual model of YCS development. The symptoms of YCS (leaf yellowing)
are the result of sucrose feedback regulatory effects upon photosynthesis in leaf lamina, due to
inadequate sucrose movement out of the leaf whereby sucrose movement through the phloem (out
of the leaf) is influenced at a point beyond the leaf sheath and linked to reduced sink strength. ... 126
Figure 85 Changes in ABA and ABA catabolites in YCS symptomatic and asymptomatic leaves. Q200A
in the Herbert (A), KQ228A in the Burdekin (B) and Q208A in Mackay (C). Values ± standard deviation
(Botha et al., 2015) ........................................................................................................................... 129
Figure 86 PCA plot of YCS and Control expression data, showing PC1 against PC2. ......................... 131
Figure 87 Another PCA plot of YCS and Control expression data, showing PC1 against PC2, this time
with the variety type labelled. .......................................................................................................... 132
Figure 88 PCA plot of YCS and Control expression data, showing PC3 against PC5 .......................... 133
Figure 89 Expression heat map of the 327 highly significant transcripts (Bonferoni = 0.0, log2 fold
change > abs 1). Heat map was clustered using the mean Euclidean distance. ................................ 134
Figure 90 Midrib stain kit contains 1% iodine solution dropper bottle, 10X magnifying hand lens and
lanyard, safety data sheet ................................................................................................................. 135
Figure 91 SRA3A YCS symptomatic and asymptomatic Leaf 4 from the same plot (Herbert RVT trial)
.......................................................................................................................................................... 136
Sugar Research Australia Final Report - Project 2015/016
18
Figure 92 SRA3A YCS symptomatic and asymptomatic Leaf 4 midrib staining and corresponding
lamina and midrib starch content µmol/mg DM noted beside each section (Herbert RVT trial). ..... 136
Figure 93 Sugarcane symptoms – Yellow canopy syndrome A) water deficit stress B) ..................... 137
Figure 94 Leaf 4 midrib cross-section stains (1% iodine solution) YCS A) yellow water deficit B)
control C) and green water deficit D) ................................................................................................ 137
Figure 95 Sugarcane yellow leaf virus (ScYLV) symptomatic Leaf 3 A) close-up showing yellow midrib
and lamina B) ScYLV midrib cross section stained with 1% iodine solution C) and control Leaf 3 midrib
cross section stained with 1% iodine solution D). ScYLV (Vietnam genotype) confirmed sample and
control obtained from quarantine glasshouse SRA Indooroopilly, Brisbane Qld .............................. 138
Figure 96 Midrib stain kit flash cards; YCS zone A) YCS symptom progression B) midrib stain
determination key C) staining instructions and comparative vascular bundle cross section stains D)
.......................................................................................................................................................... 139
Figure 97 Venn diagram of the significantly differentially expressed transcripts in plants affected by
these four conditions; YCS, Water-stress (drought), Senescence and Moddus-treated (GA inhibitor).
The number of transcripts uniquely important in YCS is underlined ................................................ 140
Figure 98 Bioinformatic filtering process to identify potential biomarker candidates unique to YCS141
Figure 99 Gel image of YCS-2 biomarker candidate primer pair 24aF-161R (137bp region) (see Table
14) against asymptomatic controls, early and late-stage YCS leaf, YCS midrib, early and late-stage
water stress and senescent samples ................................................................................................. 142
Figure 100 Gel photo of the YCS biomarker validation test of the Woodford diseased samples. Gel
was run as a 1.5% agarose gel with 0.5x SYBRsafe at 90V for 60 minutes, using 100bp molecular
weight ladder (Promega) as a marker. RSD: Ratoon Stunting Disease, PP: cane infected with rust,
Pokkah Boeng and affected by cold chlorosis, FJG: Fiji Leaf Gall disease, SMV: Sugarcane Striate
Mosaic disease; bl: no template blank control; - : negative Control from FV14 leaf4 sample barcode
5361; + : positive YCS control from FV14 leaf4 sample barcode 5363 (1:10 dilution); MV: Sugarcane
Mosaic Virus; LS: Leaf Scald disease; CS: Chlorotic Streak Disease ................................................... 143
Figure 101 Leaf sucrose and total α-glucan levels in the mid-upper canopy (Leaf 1, 2, 4 & 6) of high
yielding crops for varieties KQ228A, Q240A & Q208A across a full growing season ......................... 144
Figure 102 PCA analysis Q208A, Q240A, KQ228A leaf sucrose, threes sites across a full growing
season (Burdekin irrigated fields >170 t cane/ha) ............................................................................ 145
Figure 103 YCS expression appears after a rainfall event in late January ......................................... 147
Figure 104 Source leaf sucrose and α-glucan accumulation exceeds toxic upper threshold in February
(note: α-glucan units nmol glucose equivalent/mg DM)................................................................... 147
Figure 105 Bifenthrin treatment, YCS occurrence and internode size - internode numbering
corresponds with true leaf number i.e. Internode #1 is the internode directly under the leaf sheath
of true leaf # 1 = FVD). ...................................................................................................................... 148
Figure 106 Untreated February, March, Mg SO4 and UTC plants have reduced sink size A) higher YCS
severity, compared to bifenthrin treated plants (Continuous, January, November and December) B)
and reduced plant vigour C) .............................................................................................................. 150
Figure 107 Sink size of top 23 internode volumes and bifenthrin treatment period ........................ 151
Figure 108 Burdekin insecticide trial 2017/18 yield (TCH) and sink strength (top 23 internode total
volume representing the period from the first Bifenthrin spray which staggers monthly for each
treatment except Continuous) .......................................................................................................... 151

Sugar Research Australia Final Report - Project 2015/016
19
1. BACKGROUND
1.1. Yellow canopy syndrome (YCS)
Wide-scale mid-canopy yellowing of sugarcane occurred in the peak of the growth season
(December to March) in Northern Queensland in 2012. The timing and pattern of symptom
expression were atypical for known sugarcane diseases and nutrient stress. Although partially similar
to Yellow Leaf Syndrome (YLS) (Lehrer and Komor, 2008) there were enough differences to lead to a
decision to call this phenomenon Yellow canopy syndrome (YCS). Since the first widespread
occurrence in Gordonvale, Nth Queensland in 2012, YCS has been identified as far south as
Maryborough in the south-east of Queensland. YCS was not characterised before 2012, so was either
not present or not prevalent before this date.
There are many causes of leaf yellowing in sugarcane which are mostly due to water stress (deficit or
waterlogging), pathogens, agrochemicals, nutrient and mineral deficiencies. Initial investigation
ruled out water stress as a cause of YCS, as associated leaf colouring and pattern of development,
morphology and total leaf canopy affliction did not correlate with YCS symptoms. Analysis of soil and
leaf nitrogen, iron, and other mineral nutrients, as well as heavy metals found no deficiencies or
toxicities associated with YCS. At the request of industry, early screening of YCS leaf tissue also found
no evidence of the metabolite aminomethylphosphonic acid (AMPA) which is a biodegraded form of
glyphosate (Gomes et al., 2016). YCS symptomatic plants also tested negative for all known
sugarcane pathogens. These and other studies are detailed in the final report of project 2014/049.
Considering all obvious causes of yellowing were being ruled out, it was clear that a different
approach was required to find the cause of YCS expression. It is well known that leaf yellowing is a
common symptom of the Poaceae family when there is high carbohydrates accumulation in the
source leaves (Fontaniella et al., 2003). Chlorophyll loss initiated this way is also associated with
accumulation of pigments such as zeaxanthin and anthocyanins, giving the leaf a golden-yellow
colour (Allison and Weinmann, 1970; Tollenaar and Daynard, 1982; Rajcan and Tollenaar, 1999).
Therefore, understanding the metabolic disruptions occurring within the asymptomatic and
symptomatic YCS leaf associated with carbohydrate accumulation would be essential to identifying
the potential cause of this disorder.
1.1.1. Leaf sucrose, photosynthesis and metabolism
Initial investigations showed that YCS symptomatic source leaves contained high levels of sucrose
and glucan. To investigate the cause of high levels of these metabolites, a clear understanding of
where sucrose accumulates in the leaf (lamina, midrib, dewlap, and sheath) and location of the
highest concentrations is paramount. Surprisingly, a search of the literature revealed only three
other studies have been conducted in relation to the distribution of sucrose along the sugarcane leaf
and within the varying tissues (Hatch and Glasziou, 1964; Mattiello et al., 2015; Bassi et al., 2018).
We postulated that this information would help to reveal if leaf sucrose accumulation was due to
compromised phloem loading or phloem transport in the YCS plant.
A good measure of leaf health in C4 plants can be determined by the sucrose level in the
photosynthetic cells. Under high levels of carbohydrate accumulation in the source leaf there is a
downregulation of the photosynthetic genes which induces yellowing of the lamina (Tollenaar and

Sugar Research Australia Final Report - Project 2015/016
20
Daynard, 1982; Krapp and Stitt, 1995; Jensen, 1996; Russin et al., 1996; Rajcan and Tollenaar, 1999;
Graham and Martin, 2000; Braun et al., 2006). Therefore, understanding the extent to which this
happens in YCS leaves would be critical in determining whether there is any potential for
downstream changes that would be responsible for initiating chlorosis.
Studies investigating the upstream effect of sugar accumulation on photosynthesis downregulation
show that this mechanism is regulated through sugar sensing molecules. These metabolites initiate
feedback inhibition of photosynthesis together with carbon redirection and partitioning to other
pools (Gupta and Kaur, 2005; Braun et al., 2006; McCormick et al., 2008; Lunn et al., 2014; Nuccio et
al., 2015; Figueroa and Lunn, 2016). Once again, the extent to which this may be occurring in YCS
plants is important to know as this would have significant impact on the regulatory mechanisms
surrounding carbon accumulation and partitioning in the leaf. Also, of interest would be the rate of
carbon fixation and decarboxylation, as increased sucrose synthesis may also lead to excess
accumulation in the leaf.
The disruption to these key biological functions within the plant needs to be clearly understood to
characterise changes prior to and during YCS development and after the onset of visible yellowing.
To study these issues, a comprehensive sugarcane leaf metabolome, transcriptome and proteome
database would be required.
1.1.2. Source sink imbalance
Leaf sucrose accumulation may also occur if there is a disruption to mass flow from the source leaf
to the main sink tissue of the culm or roots. Such a disruption could occur in YCS plants if there is a
physical blockage of the phloem or a limitation to sink strength. To differentiate between the two
would require investigation of plant defence responses, identification of an abundant microbial
entity and characterisation of sink tissue strength. (Rae and Pierre, 2018) found no differences in
total root and fine root length, diameter and percentage of fine roots relative to the total root
length, between YCS plants and healthy controls. However, it is not plausible to rule out altered root
development as a possible cause of reduced carbon demand in YCS plants from one study. It is also
important to note that internodes directly beneath YCS symptomatic source leaves receive carbon
well before the roots. Thus, any altered sink capacity in the internodes would initiate a faster
response in the source tissue than would changes to root development. Therefore, investigations
into causes of source sink imbalance would be best focussed on changes to internode development.
Phloem transport of sucrose occurs along a pressure gradient between the leaf and culm. This
gradient is established and maintained by adequate loading of the phloem in the source, and
efficient unloading at the sink. This is maintained by critical enzymes involved in sucrose turnover
and carbon partitioning (Black et al., 1995; Koch, 1996; Morey et al., 2018). The metabolic rate and
storage within the sink tissue together with the physical size of the sink organ determines sink
strength (Bihmidine et al., 2013).
The metabolic processes that are responsible for maintaining healthy source sink relationships are
poorly studied in general and almost none exist in sugarcane. A large part of the problem is
associated with the fragmented nature of most previous studies. In this study we postulated that
some of these shortfalls could be avoided by constructing comprehensive sugarcane metabolome,
transcriptome and proteome databases from the relevant source and sink tissues. These databases
Sugar Research Australia Final Report - Project 2015/016
21
together with detailed complementary information regarding the physical size of the sink culm
repository and growth rate would be essential to ascertain the sink strength status of YCS plants.
1.1.3. Crop stress and management
Initial reports from industry suggests there is a strong correlation between stress and YCS symptom
development. When plants are under environmental stress, the growth rate is the most sensitive
parameter and the first to decrease. The consequence of this is a reduction in demand for reduced
carbon and hence uncoupling of the photosynthetic electron transport systems occur. This leads to
increased production of reactive oxygen species (ROS). If left unchecked, photooxidation will cause
the degradation of chloroplasts and chlorosis will ensue. In response to oxidative stress, plants
initiate non-photochemical quenching to reduce the production of ROS, enabling a means of
photoprotection (Gill and Tuteja, 2010). Therefore, knowledge of the stress status in YCS
symptomatic plants and the identification of any stressors that may be contributing to reduced culm
growth could help in the development of a YCS management program.
1.1.4. Diagnostic
At any one time there is a significant portion of the mature leaves on a sugarcane plant that is
yellowing. This makes misdiagnosis of YCS common and creates problems for researchers, industry
support services and growers alike. It also creates confusion in industry which may impact on
productivity if an incorrect diagnosis is assigned to crops which otherwise could potentially have
been treated to remedy an unrelated problem. Hence the problem of misdiagnosis is two-fold.
Firstly, researchers may sample incorrect tissue which would compromise conclusions and research
outcomes. Secondly, incorrect advice may be given to growers (or self-determined), which may
impact on outputs. Therefore, development of a unique YCS biomarker or in-field diagnostic test
would be of benefit to industry.
2. PROJECT OBJECTIVES
The objectives of this project were to
• Describe YCS leaf symptom expression and development
• Describe changes to leaf metabolism prior to and after the onset of visible yellowing
• Assess changes to stomatal conductance, chlorophyll fluorescence, photosynthesis, carbon
turnover and partitioning, metabolome, transcriptome, and proteome
• Establish a baseline description of a healthy sugarcane leaf in terms of sucrose and starch
content
• Establish whether phloem loading, or phloem transport is compromised
• Determine if leaf sucrose accumulation is primarily driven by changes to source or sink
• Identify factors that may contribute to a source sink imbalance
• Identify the processes that control sugar levels in the source leaf
• Investigate feedback inhibition of photosynthesis and leaf metabolism
• Describe the upstream and downstream effects of changes to photosynthesis and leaf
metabolism

Sugar Research Australia Final Report - Project 2015/016
22
• Describe changes to sink metabolism
• Assess sink strength status
• Investigate the development of a YCS diagnostic test
• Investigate any correlation between YCS and stress
• Contribute to a potential YCS management program
• Establish where and when this physiological disorder starts and what is responsible for its
induction
3. OUTPUTS, OUTCOMES AND IMPLICATIONS
3.1. Outputs
i) The major outputs delivered by this project are:
• Solving YCS by identifying that the condition is a physiological disorder without a single cause;
any factor that reduces sink strength, respiration and accelerates photosynthesis could trigger
the event. Thus, YCS is a condition that is comparable to source sink related induced senescence
• PhD (Annelie Marquardt)
• Masters (Kate Wathen-Dunn)
• Increased knowledge of fundamental sugarcane physiology
• Sugarcane leaf and culm metabolome, transcriptome, and proteome databases
• Establishment of sucrose, starch, and soluble α-glucan levels in a healthy sugarcane leaf
• Quantification of the leaf sucrose tolerable upper threshold in Qld commercial sugarcane
genotypes before induction of photooxidation and chlorosis
• New discovery of major carbon partitioning to soluble α-glucan in sugarcane lamina, midrib, and
sheath
• New discovery that the PEPCK decarboxylation pathway activity is present in Qld commercial
sugarcane genotypes
• Characterisation of sugarcane feedback regulation of photosynthesis and leaf metabolism
• Identification of sucrose movement-related proteins including SWEETs, SUTs, H+-ATPases and
H+pyrophosphatases (H+-PPases) in Qld commercial genotypes
• Identification of the processes that control sugar levels in the source leaf of sugarcane
• Characterisation of changes to source sink balance leading to leaf sucrose accumulation in
sugarcane
• Knowledge of the changes to photosynthesis, carbohydrate metabolism and carbon partitioning
in sugarcane during YCS development
• Development of rapid leaf and internode sampling and microtitre assay protocol for sucrose and
α-glucan quantification
• Methodology for 13C labelling of sugarcane leaf in the field
• Methodology for building a sugarcane transcriptome reference database
• Sugarcane YCS identification kit (midrib stain)
Sugar Research Australia Final Report - Project 2015/016
23
ii) Adoption
• Sugarcane researchers in Australia and internationally
• SRA researchers, SRA adoption officers and sugar service providers have adopted the YCS
identification kit and trialling it in sugarcane regions throughout Qld
3.2. Outcomes and Implications
YCS is a condition that has caused concern for the industry since 2012. From the onset researchers
were perplexed as to what could suddenly cause yellowing of the mid canopy in one field and not
the next, in the current crop cycle but not in the following year, in one section of a field and not
another, in some culms of the same stool but not others, and express at varying levels of severity
and then grow out of the condition.
Progress in unravelling the YCS phenomenon was hampered by a limited understanding of the
metabolism of sugarcane, especially the interaction and control of leaf (source) and culm (sink)
metabolism. In contrast to other main crops there were limited ‘omics’ databases on the Australian
Q and SRA varieties and hence, no opportunity to immediately deploy the powerful new high
throughput technologies to characterise and understand the YCS phenomenon.
There were two major achievements in this project. Firstly, it allowed the development and
characterisation of comprehensive sugarcane leaf and culm metabolome, transcriptome, and
proteome databases of Q200A, Q240A, Q208A and KQ228A. Secondly, it has improved the
fundamental knowledge of sugarcane physiology enormously. Evidently, this knowledge and
databases will be an invaluable future resource to understand sink source relationships in sugarcane.
The work highlighted the importance of combining proper accurate field characterisation of a
phenotype with modern high throughput technologies.
The results from this research on sugarcane and YCS have been disseminated at national and
international events by using local forms of communication, formal conferences, and peer reviewed
publications. This has helped the Australian and international sugarcane industries and scientific
community to better understand YCS. It highlighted that mid-canopy yellowing is a phenomenon
driven by sink source imbalance and the crop’s response to rebalance the source sink ratio.
Identification of YCS as a physiological disorder without a single cause has significant implications for
the industry. We now know that any factor that reduces sink strength, respiration or accelerates
photosynthesis could trigger the event. Therefore, this condition can be described as a form of
source-sink regulated induced senescence. Management of YCS must focus on best practice farming
to maintain maximum growth rate and minimise crop stress to avoid initiation of a source sink
imbalance. It is paramount that the industry considers how it will maintain this balance in a rapidly
changing environment due to global warming and climate change at a local level. These events have
contributed to a significant impact on production in the past decade. Plant crop stress is an evolving
issue for growers and YCS may be the first of many such disorders that could develop without the
proper implementation of mitigation practices. Low world sugar prices and increasing costs of
production are major drivers of reduced capacity across the industry to prevent the ongoing
occurrence of YCS. Therefore, RD&A and government policy must focus on relieving these economic
pressures for growers so they may access all necessary resources to prevent the development and
impact of YCS within industry. Interestingly, successful implementation of these measures to

Sugar Research Australia Final Report - Project 2015/016
24
mitigate YCS should see an increase in yield. This is not because of the impact YCS has on yield after
symptom expression in the canopy, but because of preventative measures required before
expression.
From a professional perspective, formal qualifications were obtained through studies of YCS, Kate
Wathen-Dunn her Masters in Bioinformatics (2017) and Annelie Marquardt her PhD (2019).
4. INDUSTRY COMMUNICATION AND ENGAGEMENT
4.1. Industry engagement during course of project
Communication of objectives and results throughout the project
4.1.1. Presentations to industry and scientific research community
• Qld Minister for Agriculture onsite tour 2015, 2017
• YCS Scientific Reference Panel reviews and workshops
• Grower updates throughout Qld 2015 - 2020
• Webinar May 6th, 2020 (Appendix 3)
• Productivity and sugar services groups throughout Qld
• Grower delegates and industry representatives
• Canegrowers organisation
• International Plant & Animal Genome XXV Conference: PAG XXV San Diego, California, USA,
January 2017
• ISSCT conference in Chiang Mai, Thailand, Dec. 2016
• ISSCT conference in Tucumán, Argentina, September 2019
• Global Conference on Plant Science and Molecular Biology: GPMB II, Rome, Italy, 2018
(Appendix 3)
• ASSCT conference in Mackay, April 2017 (Appendix 3)
• TropAg 2015, 2017, 2019 (presentations and posters Appendix 3 & 4)
• COMBINE Student Symposium 2016/The Australian Bioinformatics and Computational Biology
Society (AB3ACBS) Conference 2016, 2019, F1000Research Poster/Speaker Prize Winner
(2016).
• UQ Bioinformatics Winter School, July 3rd, 2018 School F1000 Speaker Prize
• QAFFI lab talks
4.1.2. Industry conference papers
1) Frederik C Botha, Annelie Marquardt, Gerard Scalia and Kate Wathen-Dunn: “Yellow Canopy
Syndrome (YCS) is associated with disruption of sucrose metabolism in the leaf.” In:
Proceedings of the International Society of Sugar Cane Technologists, Volume 29, 2016 (in
press).
(presented by Frikkie Botha at ISSCT conference 2016). (See Appendix 1)

Sugar Research Australia Final Report - Project 2015/016
25
2) Annelie Marquardt, Kate Wathen-Dunn, Robert J Henry and Frederik C Botha: “There’s
yellow and then there’s yellow – which one is YCS?” In: Proceedings of the Australian Society
of Sugar Cane Technologists, Volume 39, p89-98, 3-5 May 2017.
(presented by Annelie Marquardt at ASSCT conference in 2017). (See Appendix 1)
4.1.2 Academic documents and other
1) Marquardt A (2019) 'The molecular analysis of yellow canopy syndrome-induced yellowing
in the sugarcane leaf', PhD thesis, The University of Queeensland, DOI 10.14264/
uql.2019.238. (See Appendix 2)
2) Wathen-Dunn K (2017). ‘Yellow Canopy Syndrome in sugarcane: Finding clues to the cause in
the leaf transcriptome’, Master’s thesis, The University of Queensland (See Appendix 2)
3) Botha FC (2019). A research model for carbon-partitioning in sugarcane. Research Outreach
Issue 106 https://issuu.com/researchoutreach/docs/ro_106_web_singlepages
4) Communication through SRA newsletters, flyers, emails, videos, and website
4.2. Industry communication messages
Key communication points:
• YCS is a physiological disorder expressing as yellowing of the mid canopy
• YCS is not a disease
• Research does not support a single cause
• YCS is always preceded by some form of stress
• The cause of YCS is any form of stress that significantly slows growth and reduces the sink
size or strength
• Growth rate drives YCS development, not vice versa
• Environmental or biological stress or both can be the trigger for YCS
• Use all available resources together with best practice farming to reduce plant stress and
ensure growth does not slow
• YCS usually expresses after good rain or irrigation in crops that have been previously
stressed
• An imbalance between supply from the leaf (source) and demand from the stalk (sink)
causes sucrose accumulation in the leaf
• YCS leaves always have high levels of sucrose and starch
• High leaf sucrose and high light intensity is required to initiate yellowing
• High leaf sucrose above an upper tolerable level initiates yellowing and accelerates
senescence (aging)
• There is no commercial cane sugar (CCS) penalty associated with YCS
• YCS severity does not predict yield penalty
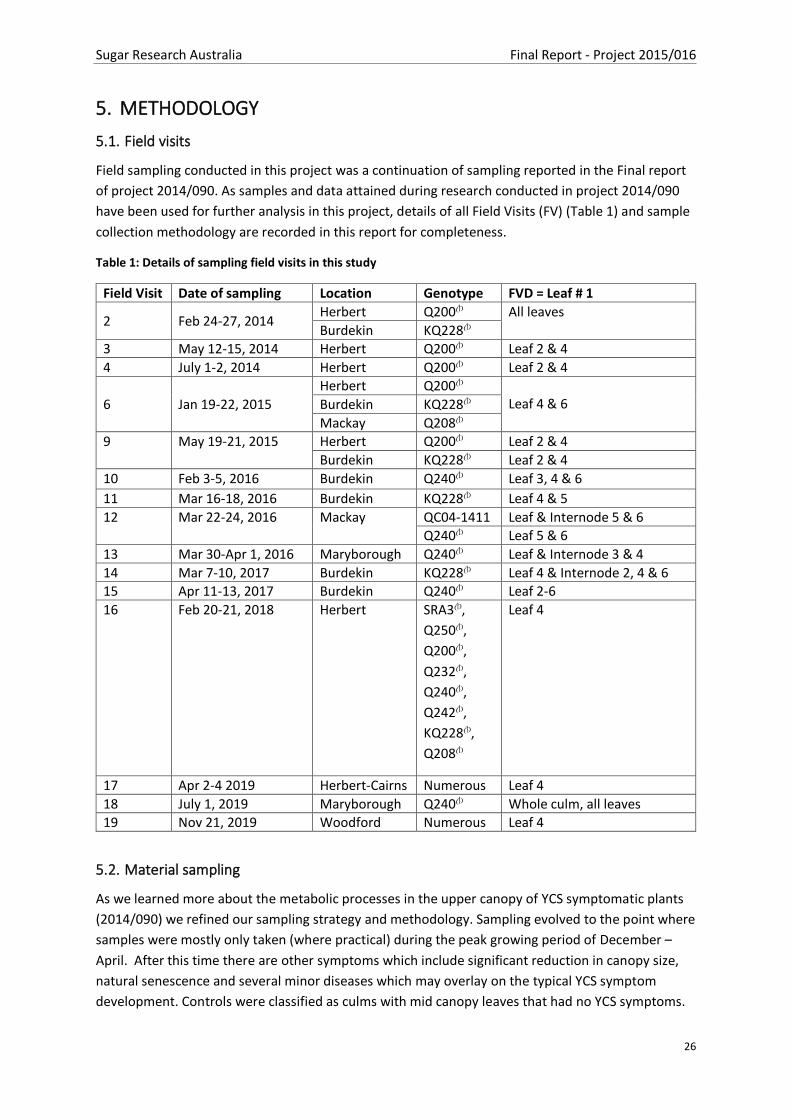
Sugar Research Australia Final Report - Project 2015/016
26
5. METHODOLOGY
5.1. Field visits
Field sampling conducted in this project was a continuation of sampling reported in the Final report
of project 2014/090. As samples and data attained during research conducted in project 2014/090
have been used for further analysis in this project, details of all Field Visits (FV) (Table 1) and sample
collection methodology are recorded in this report for completeness.
Table 1: Details of sampling field visits in this study
Field Visit Date of sampling Location Genotype FVD = Leaf # 1
2 Feb 24-27, 2014 Herbert Q200A All leaves
Burdekin KQ228A
3 May 12-15, 2014 Herbert Q200A Leaf 2 & 4
4 July 1-2, 2014 Herbert Q200A Leaf 2 & 4
6 Jan 19-22, 2015
Herbert Q200A Leaf 4 & 6 Burdekin KQ228A
Mackay Q208A
9 May 19-21, 2015 Herbert Q200A Leaf 2 & 4
Burdekin KQ228A Leaf 2 & 4
10 Feb 3-5, 2016 Burdekin Q240A Leaf 3, 4 & 6
11 Mar 16-18, 2016 Burdekin KQ228A Leaf 4 & 5
12 Mar 22-24, 2016 Mackay QC04-1411 Leaf & Internode 5 & 6
Q240A Leaf 5 & 6
13 Mar 30-Apr 1, 2016 Maryborough Q240A Leaf & Internode 3 & 4
14 Mar 7-10, 2017 Burdekin KQ228A Leaf 4 & Internode 2, 4 & 6
15 Apr 11-13, 2017 Burdekin Q240A Leaf 2-6
16 Feb 20-21, 2018 Herbert SRA3A,
Q250A,
Q200A,
Q232A,
Q240A,
Q242A,
KQ228A,
Q208A
Leaf 4
17 Apr 2-4 2019 Herbert-Cairns Numerous Leaf 4
18 July 1, 2019 Maryborough Q240A Whole culm, all leaves
19 Nov 21, 2019 Woodford Numerous Leaf 4
5.2. Material sampling
As we learned more about the metabolic processes in the upper canopy of YCS symptomatic plants
(2014/090) we refined our sampling strategy and methodology. Sampling evolved to the point where
samples were mostly only taken (where practical) during the peak growing period of December –
April. After this time there are other symptoms which include significant reduction in canopy size,
natural senescence and several minor diseases which may overlay on the typical YCS symptom
development. Controls were classified as culms with mid canopy leaves that had no YCS symptoms.

Sugar Research Australia Final Report - Project 2015/016
27
Sampling of control tissue may therefore be from either culms from the same or different stools to
culms with YCS symptomatic leaves. The investigatory directive at the time of sampling determined
the amount of sample biomass and type of tissue that was collected. Whatever the magnitude of the
sampling the following was adhered to whenever possible.
5.2.1 Leaf, internode and xylem sap
In all the work reported here, leaves on each culm were numbered wherein the leaf with the first
visible dewlap was deemed Leaf 1 (Figure 1A & B) (Bonnett, 2014). Unless otherwise specified, leaf
samples were taken from the middle section of the leaf either by leaf punch (Figure 1C & D), or 70
mm section. Leaf punches were placed in a 2 mL screw cap tube and snap frozen with dry ice or
liquid nitrogen; when these were unavailable then tubes were dropped into a Thermos filled with
boiling water for 15 mins and then transferred to a -20°C freezer. Figure 2 shows sampling of each
type of leaf tissue except for the 70 mm piece cut from the middle of the leaf which includes the
midrib and lamina on both sides. All tissue sampled was taken from material that had the exterior
surface first wiped with 70% ethanol. All instruments used for sampling were cleaned with 70%
ethanol between samples.
For internode samples, a section from the bottom of the internode approximately 30 mm long was
cut and a 8mm Ø cylindrical core was bored off-centre (avoiding the pith) and vertically down using
a 12 mm cordless drill and Sutton Diamond Drill Bit Core Blue Ceram 8mm Ø (Model
Number370400080) (Figure 1E). Cylindrical samples were placed in a labelled 2mL screw cap tube
and snap frozen in liquid nitrogen and stored at -80 °C. The drill bit borer was sprayed with 70%
ethanol and wiped between samples.
Xylem sap and internodes were sampled directly beneath leaf sheaths while maintaining correct
orientation. Cut ends of the internodes were then blotted with tissue paper for approximately 5
seconds to absorb remnants of ruptured cells. A pressure regulated sap extractor kit was used to
push sap (min 70 kPa - max 140 kPa) from the internode under constant and controlled pressure
(in the direction from bottom to top) into a plastic funnel above a labelled 2 mL screw cap tube
(Figure 1F). Sap was snap frozen in liquid nitrogen and stored at -80 °C. All equipment was sprayed
with 70% ethanol and wiped between samples.
All samples were transferred to dry ice and either lyophilised or stored at -80 °C awaiting further
processing.
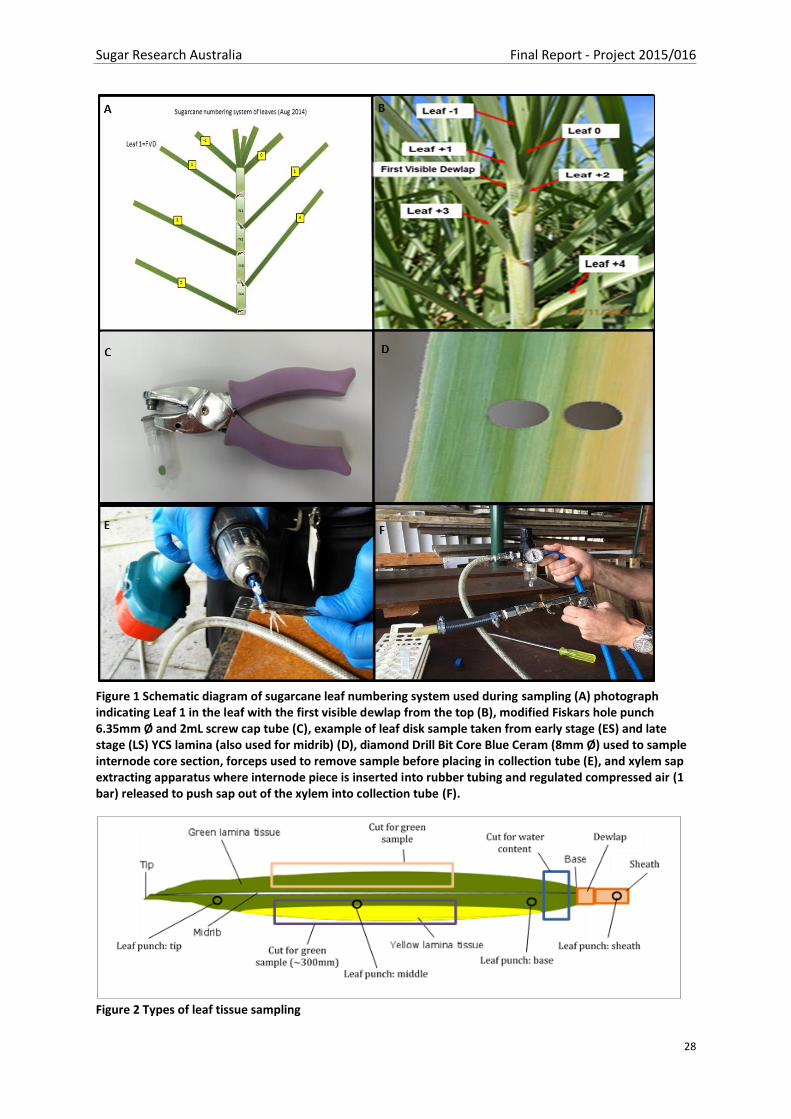
Sugar Research Australia Final Report - Project 2015/016
28
Figure 1 Schematic diagram of sugarcane leaf numbering system used during sampling (A) photograph indicating Leaf 1 in the leaf with the first visible dewlap from the top (B), modified Fiskars hole punch 6.35mm Ø and 2mL screw cap tube (C), example of leaf disk sample taken from early stage (ES) and late stage (LS) YCS lamina (also used for midrib) (D), diamond Drill Bit Core Blue Ceram (8mm Ø) used to sample internode core section, forceps used to remove sample before placing in collection tube (E), and xylem sap extracting apparatus where internode piece is inserted into rubber tubing and regulated compressed air (1 bar) released to push sap out of the xylem into collection tube (F).
Figure 2 Types of leaf tissue sampling

Sugar Research Australia Final Report - Project 2015/016
29
5.2.2 13C Labelling and sampling
A 13CO2 delivery bag chamber (Figure 3A) was attached to a region of the YCS symptomatic leaf
where one side of the mid-rib was yellow and the other side was mostly green (Figure 3A & B) and
preferably not in the lower 1/3 of the leaf. A similar leaf position was selected on the leaf directly
above and the same for 13C labelling of the two asymptomatic control leaves. Plastic bag chambers
were sealed onto the surface of the leaf with rubber butyl sealant and evacuated with a 60mL
syringe (Figure 3B). CO2 free air from a KOH (2.5M) CO2 sink was pushed into the chamber to inflate
the bag around the leaf. A pipette and 3mL syringe were used to deliver 500 µL NaH13CO3 (0.1299M)
solution and 500 µL of HCl (1M) to the absorbent pad inside the chamber where 13CO2 was released
to the leaf (Figure 3C-E). Approximately 16,000 ppm of 13CO2 was available for leaf photosynthesis.
Figure 3 13C labelling Q240A in field; 13C delivery chamber (volume: ≈ 100mL) plastic acetate sheet heat
sealed to form a chamber 124 x 80 mm with two 12 mm strips of Consolidated Alloys Butyl rubber sealant at
each end (Bunnings part # 10266). The chamber has an internal pocket 70 x 25 mm containing a strip of TOM
organic ultra-thin absorbent liner 70 x 20mm. Inserted on top of the liner is a 1.0mm Ø x 100mm clear
transmission tube attached to a BD blunt end plastic cannula (303345) and Terumo Terufusion 3-way
Stopcock Luer Lock (TE-TSWSR201) (A); evacuating chamber and filling with CO2 free air (B); addition of
NaH13CO3 + HCl and injection into chamber (C-E)
100 mm leaf sections, leaf sheaths and internode cores were harvested from labelled stalks at three
time points i) 3 hr ii) 8 hr and iii) 31 hr post labelling. Leaf samples were also collected from
unlabelled leaf material to determine the amount of background C12 in the atmosphere. All leaf and
sheath material were placed in porous plastic zip lock bags and snap frozen in liquid nitrogen.
Internode cores 8mm Ø were bored off-centre and vertically down using a cordless drill and

Sugar Research Australia Final Report - Project 2015/016
30
diamond drill core bit and placed in 2 mL screw cap tubes and snap frozen in liquid nitrogen. Three
leaf punches were also collected above and below the labelled leaf section and from the leaf sheath.
5.3. Sample processing
5.3.1. Lyophilisation of samples
All material that was not stored at -80°C was lyophilised in a CHRIST® Alpha 1-4 LSC Plus Freeze
dryer. After lyophilisation of mid leaf samples, the midrib was removed and leaves cut into
approximately 3 mm2 pieces with scissors or passed through a small shredding mill and then
transferred to reinforced 2 ml tubes containing two stainless steel grade 316, 5 mm Ø balls. The
sample was ground to a fine powder using a Retch MM300 bead mill (frequency 30 hz, 4 cycles of
2.5 minutes with 2 minutes pause between each cycle to allow any heat to dissipate) or 3 mg
(0.0030g) of lyophilised lamina, midrib, sheath/dewlap tissue was transferred to a 2 mL screw cap
Eppendorf tubes. Stainless steel ball bearings (3 x 2.8mm and 2 x 3 mm) were added plus two mini-
spatula scoops of sand and samples were ground at 1500 strokes/min in a Geno/Grinder® for 10 min
total (in 2 min bouts).
Powder from replicates was then equally combined and thoroughly mixed to make one stock
sample. Dry powder portions of 100 mg were sent to the laboratories outlined below for
metabolome and hormone analysis.
Metabolomics Australia
School of Botany
The University of Melbourne
Parkville
Victoria 3010
National Research Council of Canada
Plant Biotechnology Institute
110 Gymnasium Place
Saskatoon
Saskatchewan S7N 0W9
Canada
Approximately 250mg of ground lyophilised material was sent to APAF for protein analysis
Australian Proteome Analysis Facility (APAF)
Level 4 Building 4 Wallys Walk (formerley F7B, Research Park Drive)
Macquarie University
Sydney NSW 2109

Sugar Research Australia Final Report - Project 2015/016
31
5.3.2. Extraction method chlorophyll and carbohydrates from lyophilised material or a single fresh leaf disk
Finely ground lyophilised lamina (3.0 mg), midrib, sheath/dewlap tissue or one whole fresh leaf
punch was used for the extraction. Chlorophyll was extracted in 500 µL of 100% V/V acetone
(precooled to -20°C), and vortexed thoroughly, left overnight at -20°C, vortexed and then
centrifuged for 5min at 6000Xg at 4°C. Acetone solution containing chlorophyll was removed and
kept. A further 500 µL (V/V) acetone (precooled to -20°C) was added to the pellet and chlorophyll re-
extracted as above. Both supernatants were combined for chlorophyll determination.
The pellet was then left to air-dry before 200 µL deionised water was added and incubated at 70°C
for 30 minutes followed by centrifugation at 16000Xg for 10 minutes. Supernatant was removed and
retained, and the pellet re-extracted with water as before. The combined supernatant was filtered
through a 0.45 µm PVDF filter and used to determine sucrose, glucose, fructose, and soluble alpha-
glucan. Two small spatula scoops of sterile sand and 2 x 3mm and 2 x 2.38 mm stainless steel balls
were added to the residual pellet and the sample ground in a Geno/Grinder® for 12 min @1750
strokes/min. Potassium hydroxide (20 µL of 4.2M) and 400 µL deionised water was added to the
residual pellet and autoclaved for 2 hrs at 121° C (~210kPa), ground for a further 5 mins, then
cooled, neutralised with acetic acid (70 µL of 1M) and centrifuged at 16,000xg for 10 minutes.
Supernatant was removed and used for starch determination.
5.3.3. RNA extraction from fresh mid-leaf powder
The mid-rib was removed, and the lamina tissue was ground to a fine powder under liquid nitrogen
in a mortar and pestle. RNA was extracted from the laminar material using Qiagen RNeasy Plant Mini
Kit (QIAGEN N.V., The Netherlands) according to the manufacturer’s instructions with the addition of
2.5% (w/v) PVP-40, with the RNA eluted twice in the elution buffer. In brief, 600 µL of RLT buffer was
added to tissue powder and centrifuged at 15,000 rpm for 5 minutes before passing through the
QIAshredder column and eluting with 60µL RNase-free water passed through membrane twice. RNA
quantity was checked with the NanoDrop for yields > 100 ng/µL and A260/A230 > 1.0. RNA quality was
checked with 1.5% TBE agarose gel containing 1 % SybrSafe to visualize 18s and 28s ribosomal RNA
bands.
Internode RNA extraction: RNA from each internode sample was extracted and sequenced
individually. Internode tissue was ground to a fine powder with the Geno/Grinder® (Spex
SamplePrep, NJ USA) for 2 minutes at 1500 strokes/minute with liquid nitrogen, using 2x2mm plus
2x3mm stainless steel beads per tube, and the cryoplate in metal blocks. RNA was extracted from
100mg of powder per sample, using Spectrum Plant Total RNA kit (Sigma-Aldrich/Merck, Germany)
according to the manufacturer’s instructions with the addition of 2.5% (w/v) PVP-40
(polyvinylpyrrolidone, mw 40,000; Sigma-Aldrich/Merck), with the RNA eluted twice in the elution
buffer. RNA quality was checked by agarose gel electrophoresis and spectrophotometer (ND-1000
Spectrophotometer, NanoDrop Technologies, Wilmington, DE, USA).
Approximately 20µg of RNA per sample was prepared for despatch by suspending the RNA in
precipitation buffer (1/10 vol 3M sodium acetate pH 5.5 plus 3.0 x volume 100% ethanol) to:
LC Sciences
Sample Receiving

Sugar Research Australia Final Report - Project 2015/016
32
2575 West Bellfort St
Suite 270
Houston Texas 77054 USA
University of Western Sydney
Hawkesbury Institute for the Environment
University of Western Sydney
Locked Bag 1797
Penrith NSW 2751
NGS department of overseas sales
Macrogen Inc.
World Meridian Venture Center
10F, #1003, 254 Beotkkot-ro, Geumcheon-gu
Seoul, Rep, of Korea
08511 (153-781)
5.3.4. Protein extraction from lyophilised leaf material
SRA Indooroopilly
Freeze dried and crushed plant material to the weight of 125mg was denatured using 5% SDS,
25mM Tris PH8.0 and 0.07% β-mercaptoethanol (1.2 mL) at 90°C for 10 minutes. Samples were
centrifuged at 16,000G for 10 minutes and supernatant transferred to a 15 mL Falcon tube.
Approximately 6 times the supernatant volume of cold (kept at -20°C) 10% TCA, 0.07% β-
mercaptoethanol in acetone (approximately 5.4 mL) was added to the supernatant and left at 20°C
overnight to precipitate. Samples were centrifuged at 5,000G for 5 minutes and the supernatant
discarded. The pellet was washed three times with cold acetone (kept at -20°C) and then dried at
room temperature. The pellet was then dissolved in 100 µl of 25mM Tris PH8.0, 0.07% β-
mercaptoethanol. The protein concentration was measured and precipitated in 6 volumes of cold
acetone. The air-dried protein (125 µg per sample) was dispatched on dry ice to Proteomics
International for proteome analysis.
Proteomics International Pty Ltd
Harry Perkins Institute of Medical Research
QQ Block, QEII Medical Centre
6 Verdun Street, Nedlands WA 6009
Australia
Australian Proteome Analysis Facility (APAF)
Similar to description by Wu et al. (2016). Samples were washed with 10% TCA containing 0.07%
DTT in acetone and homogenised in 50 mM HEPES in 2% SDS buffer.
Supernatant was taken and buffer exchanged with 100 mM TEAB using 5KDa molecular weight cut-
off filter (VIVASPIN 6, 5 kDa spin filter, Product #VS0612, Sartorius Stedim).
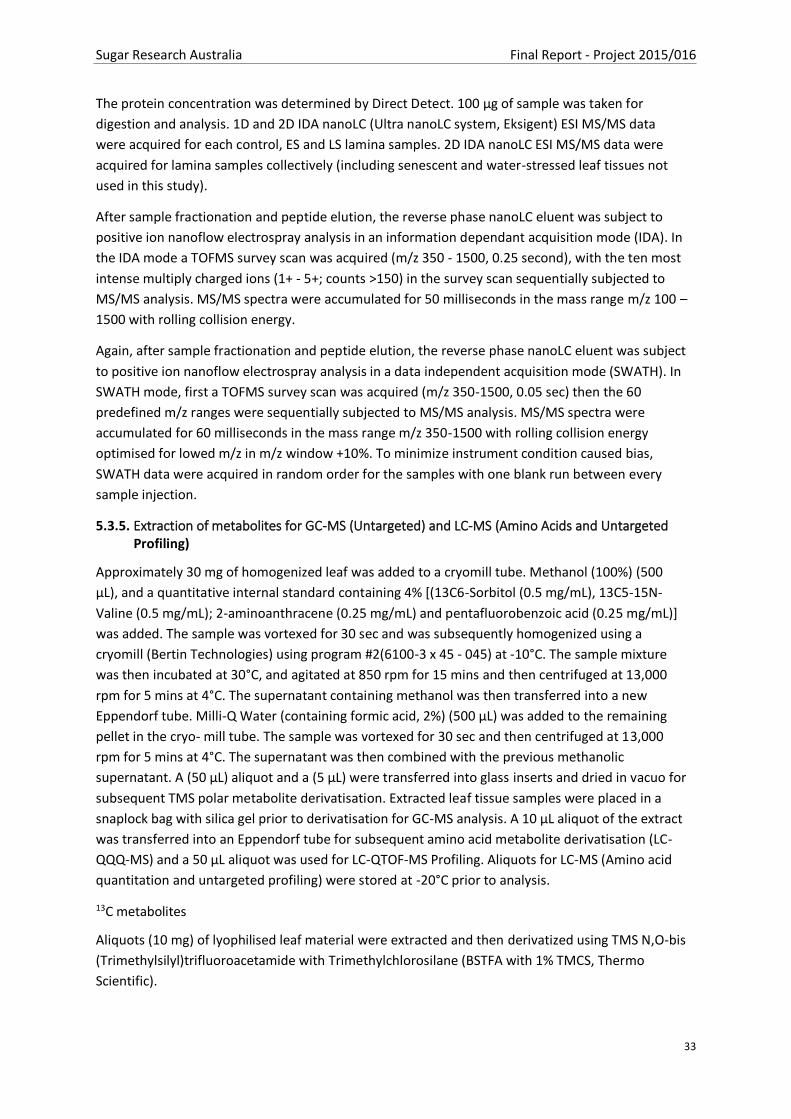
Sugar Research Australia Final Report - Project 2015/016
33
The protein concentration was determined by Direct Detect. 100 μg of sample was taken for
digestion and analysis. 1D and 2D IDA nanoLC (Ultra nanoLC system, Eksigent) ESI MS/MS data
were acquired for each control, ES and LS lamina samples. 2D IDA nanoLC ESI MS/MS data were
acquired for lamina samples collectively (including senescent and water-stressed leaf tissues not
used in this study).
After sample fractionation and peptide elution, the reverse phase nanoLC eluent was subject to
positive ion nanoflow electrospray analysis in an information dependant acquisition mode (IDA). In
the IDA mode a TOFMS survey scan was acquired (m/z 350 - 1500, 0.25 second), with the ten most
intense multiply charged ions (1+ - 5+; counts >150) in the survey scan sequentially subjected to
MS/MS analysis. MS/MS spectra were accumulated for 50 milliseconds in the mass range m/z 100 –
1500 with rolling collision energy.
Again, after sample fractionation and peptide elution, the reverse phase nanoLC eluent was subject
to positive ion nanoflow electrospray analysis in a data independent acquisition mode (SWATH). In
SWATH mode, first a TOFMS survey scan was acquired (m/z 350-1500, 0.05 sec) then the 60
predefined m/z ranges were sequentially subjected to MS/MS analysis. MS/MS spectra were
accumulated for 60 milliseconds in the mass range m/z 350-1500 with rolling collision energy
optimised for lowed m/z in m/z window +10%. To minimize instrument condition caused bias,
SWATH data were acquired in random order for the samples with one blank run between every
sample injection.
5.3.5. Extraction of metabolites for GC-MS (Untargeted) and LC-MS (Amino Acids and Untargeted Profiling)
Approximately 30 mg of homogenized leaf was added to a cryomill tube. Methanol (100%) (500
μL), and a quantitative internal standard containing 4% [(13C6-Sorbitol (0.5 mg/mL), 13C5-15N-
Valine (0.5 mg/mL); 2-aminoanthracene (0.25 mg/mL) and pentafluorobenzoic acid (0.25 mg/mL)]
was added. The sample was vortexed for 30 sec and was subsequently homogenized using a
cryomill (Bertin Technologies) using program #2(6100-3 x 45 - 045) at -10°C. The sample mixture
was then incubated at 30°C, and agitated at 850 rpm for 15 mins and then centrifuged at 13,000
rpm for 5 mins at 4°C. The supernatant containing methanol was then transferred into a new
Eppendorf tube. Milli-Q Water (containing formic acid, 2%) (500 μL) was added to the remaining
pellet in the cryo- mill tube. The sample was vortexed for 30 sec and then centrifuged at 13,000
rpm for 5 mins at 4°C. The supernatant was then combined with the previous methanolic
supernatant. A (50 μL) aliquot and a (5 µL) were transferred into glass inserts and dried in vacuo for
subsequent TMS polar metabolite derivatisation. Extracted leaf tissue samples were placed in a
snaplock bag with silica gel prior to derivatisation for GC-MS analysis. A 10 µL aliquot of the extract
was transferred into an Eppendorf tube for subsequent amino acid metabolite derivatisation (LC-
QQQ-MS) and a 50 µL aliquot was used for LC-QTOF-MS Profiling. Aliquots for LC-MS (Amino acid
quantitation and untargeted profiling) were stored at -20°C prior to analysis.
13C metabolites
Aliquots (10 mg) of lyophilised leaf material were extracted and then derivatized using TMS N,O-bis
(Trimethylsilyl)trifluoroacetamide with Trimethylchlorosilane (BSTFA with 1% TMCS, Thermo
Scientific).

Sugar Research Australia Final Report - Project 2015/016
34
5.3.6. Derivatisation of Polar metabolites
The dried samples were re-dissolved in 10 μL of 30 mg mL-1 methoxyamine hydrochloride in
pyridine and derivatised at 37°C for 120 min with mixing at 500 rpm. The samples were then
treated for 30 min with 20 μL N,O-bis-(trimethylsilyl)trifluoroacetamide (BSTFA) and 2.0 μL
retention time standard mixture [0.029% (v/v) n dodecane, n-pentadecane, n-nonadecane, n-
docosane, n-octacosane, n-dotriacontane, n-hexatriacontane dissolved in pyridine] with mixing at
500 rpm at 37°C. Each derivatised sample was allowed to rest for 60 min prior to injection.
5.3.7. Amino acids
Two different stock solutions were used, 1) Amino acids, containing a standard mix of 25 amino acids
in water 0.1% formic acid and 2) Sulphur containing compounds: a 2.5 mM stock solution containing
glutathione and s-adenosyl-homocysteine in water with 10 mM TCEP and 1 mM ascorbic acid. The
solutions were mixed and diluted using volumetric glassware with water containing 10 mM TCEP and
1 mM ascorbic acid, 0.1% formic acid to produce the following series of combined standards: 0.1,
0.5, 1, 5, 10, 20, 50, 100 and 150 µM
5.3.8. Preparation of xylem sap samples for analyses
Fifty microliters of xylem sap were transferred into an Eppendorf tube (2 mL). Cold methanol (100%)
(100 μL), and a quantitative internal standard containing 4% [(13C6-Sorbitol (0.5 mg/mL), 13C5-15N-
Valine (0.5 mg/mL); 2-aminoanthracene (0.25 mg/mL) and pentafluorobenzoic acid (0.25 mg/mL)
was added on ice. The sample was vortexed for 30 sec and then centrifuged at 13,000 rpm for 5 mins
at 4°C. Aliquots of 100 μL and 5 μL were transferred into glass inserts and dried in vacuo for
subsequent TMS polar metabolite derivatisation. Extracted xylem sap samples were placed in a snap
lock bag with silica gel prior to derivatisation for GC-MS analysis.
Twenty microliters of xylem sap were transferred into an Eppendorf tube (2 mL). Methanol (100%)
(50 μL), and a quantitative internal standard containing 4% [(13C6-Sorbitol (0.5 mg/mL), 13C5-15N-
Valine (0.5 mg/mL); 2-aminoanthracene (0.25 mg/mL) and pentafluorobenzoic acid (0.25 mg/mL)
was added. The sample was vortexed for 30 sec and then centrifuged at 13,000 rpm for 5 mins at
4°C. A 10 μL aliquot of the extract was transferred into an Eppendorf tube for subsequent amino
acid metabolite derivatisation (LC-QQQ-MS) and a 50 μL aliquot was used for LC-QTOF-MS profiling.
Aliquots for LC-MS (Amino acid quantitation and untargeted profiling) were stored at -20°C prior to
analysis.
5.3.9. Callose extraction
Finely ground lyophilised lamina (5.0 mg) was used for the extraction. To remove chlorophyll, 1.2 mL
of 70% ethanol was added, gently shaken for 5min @50˚C and centrifuged for 5min @ 400xg at
room temperature. The supernatant was removed, and the pellet washed twice in 600µL 70%
ethanol, vortexed and centrifuged for 5min @ 400g each time and supernatant discarded. The pellet
was solubilized by adding 200µL 1MNaOH and shaken for 15min @80˚C. centrifuged for 5min @ 400
g at room temperature and the supernatant removed for analysis.
5.3.10. Apoplastic fluid
Two 80 mm pieces of leaf sheath were cut from the sample leaf and weighed on an analytical
balance to 4 decimal places. Each sample sheath was cut longitudinally before being further cut into
Sugar Research Australia Final Report - Project 2015/016
35
10 mm lengths. All pieces were placed in a 50 mL syringe equipped with a three way stop cock and
covered with Milli-Q water. The syringe plunger was inserted into the syringe, inverted and air
displaced through the valve. With the valve closed the plunger was withdrawn to create a vacuum to
release the air from the apoplastic space, pulse 3x40s periods. The air was then ejected through the
valve in an inverted position and repeated three times as above. The valve was then opened, the
water expelled, and sheath pieces recovered, and the surface carefully blotted with tissue paper
avoiding the cut ends. Samples were reweighed and placed in a 15 mL Eppendorf tube and
centrifuged at 1350 RPM in a portable centrifuge for 15 minutes to recover the apoplastic fluid.
Samples were immediately snap frozen in liquid nitrogen and stored on dry ice until transfer to -80°C
freezer for storage.
5.4. Sample analyses
5.4.1. Quantification of carbohydrates
Sucrose content was determined using the standard enzymatic method (Bergmeyer and Bernt, 1974)
with a spectrophotometer (BMG-Labtech, FLUOstar Omega) and 96-well UV-clear plate (Thermo
Fisher, UV Microtiter).
Glucose composition was determined using Amplex® Red/glucose oxidase enzyme assay (Life
Technologies) in a 96-well plate (Thermo Fisher, Microtiter) with a spectrophotometer
(BMGLabtech, FLUOstar Omega).
Fructose content was determined using a BioVision Fructose Flurometric assay kit in a 96-well plate
(Thermo Fisher, Microtiter) with a spectrophotometer (BMG-Labtech, FLUOstar Omega). A 1/10
dilution of the OxiRed probe and a running temperature of 37°C was optimal for this assay.
Starch and soluble α-glucan were digested in a sodium acetate buffer (100mM, pH 5.5) containing
10 U amyloglucosidase per reaction for 2h at 37°C. After cooling down to room temperature,
glucose was measured in the resulting solution as described above (Bergmeyer and Bernt, 1974).
5.4.2. GC-MS analysis
Standard metabolites
Samples (1 μL) were injected in split less (lower and higher aliquots) into a GC-MS system comprised
of a Gerstel 252 autosampler, a 7890A Agilent gas chromatograph and a 5975C Agilent quadrupole
MS (Agilent, Santa Clara, USA). The MS was adjusted according to the manufacturer’s
recommendations using tris-(perfluorobutyl)-amine (CF43). The GC was performed on a 30 m VF-
5MS column with 0.2 μm film thickness and a 10 m Integra guard column (J & W, Agilent). The
injection temperature was set at 250°C, the MS transfer line at 280°C, the ion source adjusted to
250°C and the quadrupole at 150°C. Helium was used as the carrier gas at a flow rate of 1.0 mL min-
1. For the polar TMS metabolite analysis, the following temperature program was used; start at
injection 70°C, a hold for 1 min, followed by a 7°C min-1 oven temperature, ramp to 325°C and a final
6 min heating at 325°C. For the polar metabolite analysis, the following temperature program was
used; start at injection 70°C, a hold for 1 min, followed by a 7°C min-1 oven temperature, ramp to
325°C and a final 6 min heating at 325°C. Both chromatograms and mass spectra were evaluated
using either the Agilent MassHunter Workstation Software, Quantitative Analysis, Version
B.05.00/Build 5.0.291.0 for GC-MS. Mass spectra of eluting compounds were identified using the
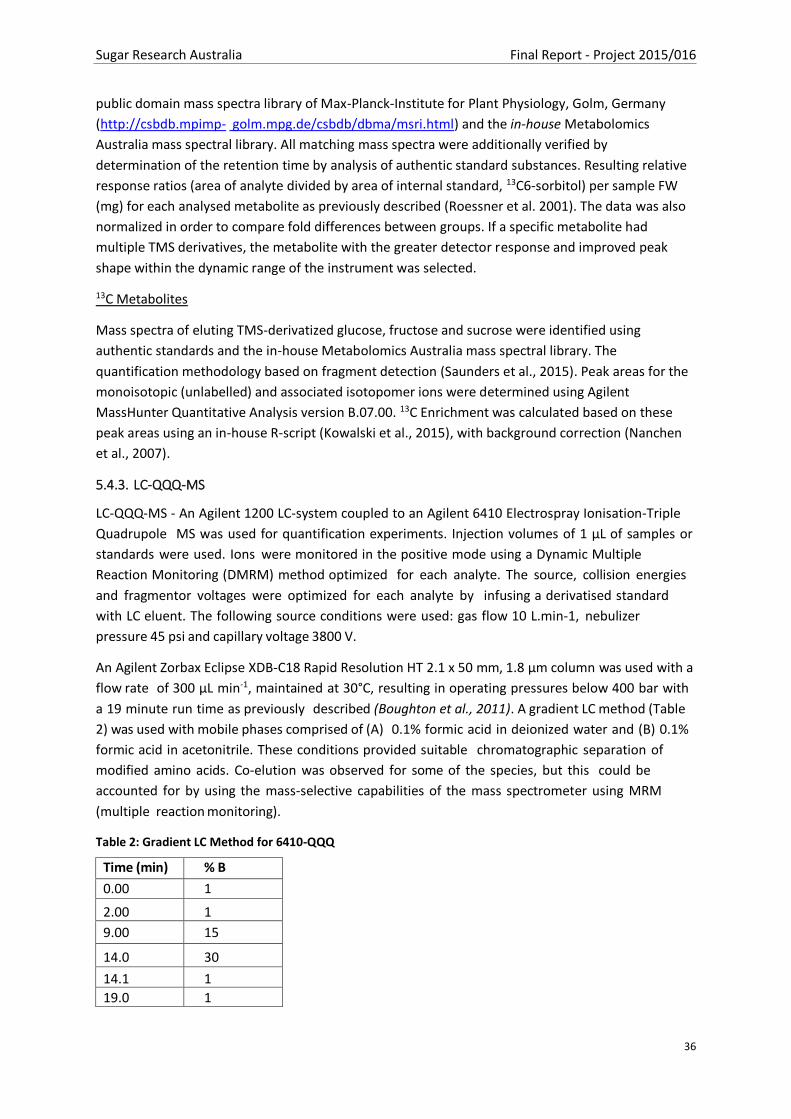
Sugar Research Australia Final Report - Project 2015/016
36
public domain mass spectra library of Max-Planck-Institute for Plant Physiology, Golm, Germany
(http://csbdb.mpimp- golm.mpg.de/csbdb/dbma/msri.html) and the in-house Metabolomics
Australia mass spectral library. All matching mass spectra were additionally verified by
determination of the retention time by analysis of authentic standard substances. Resulting relative
response ratios (area of analyte divided by area of internal standard, 13C6-sorbitol) per sample FW
(mg) for each analysed metabolite as previously described (Roessner et al. 2001). The data was also
normalized in order to compare fold differences between groups. If a specific metabolite had
multiple TMS derivatives, the metabolite with the greater detector response and improved peak
shape within the dynamic range of the instrument was selected.
13C Metabolites
Mass spectra of eluting TMS-derivatized glucose, fructose and sucrose were identified using
authentic standards and the in-house Metabolomics Australia mass spectral library. The
quantification methodology based on fragment detection (Saunders et al., 2015). Peak areas for the
monoisotopic (unlabelled) and associated isotopomer ions were determined using Agilent
MassHunter Quantitative Analysis version B.07.00. 13C Enrichment was calculated based on these
peak areas using an in-house R-script (Kowalski et al., 2015), with background correction (Nanchen
et al., 2007).
5.4.3. LC-QQQ-MS
LC-QQQ-MS - An Agilent 1200 LC-system coupled to an Agilent 6410 Electrospray Ionisation-Triple
Quadrupole MS was used for quantification experiments. Injection volumes of 1 µL of samples or
standards were used. Ions were monitored in the positive mode using a Dynamic Multiple
Reaction Monitoring (DMRM) method optimized for each analyte. The source, collision energies
and fragmentor voltages were optimized for each analyte by infusing a derivatised standard
with LC eluent. The following source conditions were used: gas flow 10 L.min-1, nebulizer
pressure 45 psi and capillary voltage 3800 V.
An Agilent Zorbax Eclipse XDB-C18 Rapid Resolution HT 2.1 x 50 mm, 1.8 µm column was used with a
flow rate of 300 µL min-1, maintained at 30°C, resulting in operating pressures below 400 bar with
a 19 minute run time as previously described (Boughton et al., 2011). A gradient LC method (Table
2) was used with mobile phases comprised of (A) 0.1% formic acid in deionized water and (B) 0.1%
formic acid in acetonitrile. These conditions provided suitable chromatographic separation of
modified amino acids. Co-elution was observed for some of the species, but this could be
accounted for by using the mass-selective capabilities of the mass spectrometer using MRM
(multiple reaction monitoring).
Table 2: Gradient LC Method for 6410-QQQ
Time (min) % B
0.00 1
2.00 1
9.00 15
14.0 30
14.1 1
19.0 1
Sugar Research Australia Final Report - Project 2015/016
37
5.4.4. Hormone analyses
An aliquot (100 μL) containing all the internal standards, each at a concentration of 0.2 ng μL-1, was
added to homogenized sample (approx. 50 mg). 3 mL of isopropanol:water:glacial acetic acid
(80:19:1, v/v/v) were further added, and then samples were shaken in the dark for 14-16 h at 4°C.
Samples were then centrifuged and the supernatant was isolated and dried on a Büchi Syncore
Polyvap (Büchi, Switzerland). Further, they were reconstituted in 100 μL acidified methanol,
adjusted to 1 mL with acidified water, and then partitioned against 2 mL hexane. After 30 min, the
aqueous layer was isolated and dried as above. Dry samples were reconstituted in 800 μL acidified
methanol and adjusted to 1 mL with acidified water. The reconstituted samples were passed
through equilibrated Sep-Pak C18 cartridges (Waters, Mississauga, ON, Canada), and then the final
eluate was split in 2 equal portions. One portion (#1) was dried completely (and stored) while the
second portion (#2) was dried down to the aqueous phase on a LABCONCO centrivap concentrator
(Labconco Corporation, Kansas City, MO, USA) and partitioned against ethyl acetate (2 mL) and
further purified using an Oasis WAX cartridge (Waters, Mississauga, ON, Canada). This GA enriched
fraction (#2) was eluted with 2 mL acetonitrile: water (80:20, v/v) and then dried on a centrivap as
described above. An internal standard blank was prepared with 100 μL of the deuterated internal
standards mixture. A quality control standard (QC) was prepared by adding 100 μL of a mixture
containing all the analytes of interest, each at a concentration of 0.2 ng μL-1, to 100 μL of the
internal standard mix. Finally, fractions #1 and #2, blanks, and QCs were reconstituted in a solution
of 40% methanol (v/v), containing 0.5% acetic acid and 0.1 ng μL-1 of each of the recovery
standards.
5.4.5. Xylem sap analyses
A 225 µL combined total of xylem sap from replicates was snap frozen in liquid nitrogen and
despatched on dry ice to Metabolomics Australia for GC-MS analysis.
5.4.6. HPLC-ESI-MS/MS
Analysis was performed on a UPLC/ESI-MS/MS utilizing a Waters ACQUITY UPLC system, equipped
with a binary solvent delivery manager and a sample manager coupled to a Waters Micromass
Quattro Premier XE quadrupole tandem mass spectrometer via a Z-spray interface. MassLynx™ and
QuanLynx™ (Micromass, Manchester, UK) were used for data acquisition and data analysis.
The procedure for quantification of ABA and ABA catabolites, cytokinin, auxin, and gibberellins in
plant tissue was performed as described (Lulsdorf et al. 2013). Samples were injected onto an
ACQUITY UPLC® HSS C18 SB column (2.1x100 mm, 1.8 μm) with an in-line filter and separated by a
gradient elution of water containing 0.02% formic acid against an increasing percentage of a
mixture of acetonitrile and methanol (50:50, v/v).
Briefly, the analysis utilized the Multiple Reaction Monitoring (MRM) function of the MassLynx v4.1
(Waters Inc) control software. The resulting chromatographic traces were quantified offline by the
QuanLynx v4.1 software (Waters Inc) wherein each trace was integrated and the resulting ratio of
signals (non-deuterated/internal standard) compared with a previously constructed calibration
curve to yield the amount of analyte present (ng per sample). Calibration curves were generated
from the MRM signals obtained from standard solutions based on the ratio of the chromatographic
peak area for each analyte to that of the corresponding internal standard, as described (Ross et al.

Sugar Research Australia Final Report - Project 2015/016
38
2004). The QC samples, internal standard blanks, and solvent blanks were also prepared and
analysed along each batch of tissue samples.
5.4.7. RNA-sequencing
Leaf RNA Sequencing
RNA from the May 2014 sample set was pooled from 32 leaf samples into 4 sequencing samples, as
was the July 2014 sample set, and the January 2015 sample set was all sequenced individually. Thus,
the 70 leaf RNA samples sequenced for the transcriptomics work represented 126 separate leaf
samples taken from 65 individual plants.
Total RNA underwent ribosomal RNA depletion prior to sequencing on the Illumina platforms using
the standard Illumina protocol; HiSeq 2000/2500 (LC Sciences, USA), HiSeq 4000 (Macrogen, South
Korea) and HiSeq 2500 (UWS, Australia). The leaf samples sent to LC Sciences and Macrogen were
rRNA-depleted using the TruSeq Stranded Total RNA Ribo-zero Plant library kit, multiplexed four
per lane, and gave between 49-116 million 2x100bp paired-end reads per sample, with an average
Q30 of 90%.
The leaf, midrib and dewlap samples sent to UWS were sequenced using an Illumina HiSeq2500
platform with TruSeq strand-specific chemistry to create 125bp sequence read length paired end
reads. Sequencing yielded 60-100 million reads per sample. Reads were trimmed using Trimmomatic
v0.36 (Bolger et al., 2014). Quality was checked before and after trimming with FastQC v0.11.5
(Babraham Institute, bioinformatics.babraham.ac.uk/projects/fastqc/). Paired-end reads were
imported into CLC Genomics Workbench version 11.01 (QIAGEN, Aarhus, Denmark) and mapped to
the sugarcane PacBio sugarcane transcriptome library described in Hoang et al. (2017), with length
fraction of 0.9 and similarity fraction of 0.9. These UWS samples were not used in the construction
of the sugarcane YCS transcriptome, but instead were used extensively in the investigation of the
molecular basis of the leaf yellowing.
Internode RNA Sequencing
Samples were collected from internodes 2, 4 and 6 of each plant replicate and sequenced
individually, thus the 36 samples represented 12 individual plants. Approximately 10 µg RNA per
sample was sent to Macrogen (Seoul, Republic of Korea) for total RNA 101bp paired-end sequencing
on an Illumina HiSeq4000 platform (Illumina Inc. CA). All internode samples were rRNA-depleted
using the TruSeq Stranded Total RNA Ribo-zero Plant library kit, multiplexed five per lane, and gave
between 52-136 million paired-end reads per sample with an average Q30 of 95%.
Except for the UWS-sequenced samples, the raw RNAseq reads were trimmed for quality using the
Trimmomatic (v 0.36) software tool (Bolger et al., 2014) and the quality was visualised before and
after trimming using the FastQC (v0.11.4) software tool (S. Andrews, 2010. Available online from
www.bioinformatics.babraham.ac.uk/projects/fastqc/ ). Trimmed reads were used in the
downstream mapping and assembly processes.
5.4.8. Amino acid quantification
Derivatisation was done by using 10 µL aliquots of each standard or sample. These were added to 70
µL of borate buffer (200 mM, pH 8.8 at 25°C) containing 10 mM TCEP, 1 mM ascorbic acid and 50
µM 2-aminobutyric acid. The resulting solution was vortexed, then 20 µL of AQC reagent (200 mM

Sugar Research Australia Final Report - Project 2015/016
39
dissolved in 100% ACN) was added and immediately vortexed. The samples were heated with
shaking at 55°C for 10 minutes then centrifuged and transferred to HPLC vials containing inserts.
5.4.9. Photosynthesis
Measurements on all available green leaves starting from one above the youngest fully expanded
leaf were taken throughout the day to encompass a range of vapour pressure deficit (VPD),
radiation, light, and other environmental stress conditions. Following standard settings
recommended for C4 plants, leaf gas exchange measurements were made twice a day on control
and YCS-symptomatic plants using two LiCOR 6400 instruments (Long et al., 1996). The stomatal
conductance, leaf level photosynthesis, internal CO2 (Ci) and intrinsic transpiration efficiency were
also measured during the day.
During gas exchange measurements, the sample CO2 concentration and airflow rate was
maintained at 400 µmolm-2s-1 and 500 mol m-2 s-1, respectively. The photosynthetically active
radiation (PAR) was maintained at 1500 mmol m-2 s-1 with the internal red, blue, and green light
sources. The intensity of blue light in the light source was 10%, while red was 80%. The standard
CO2 matching option was used after each set of measurements for greater accuracy.
5.4.10. Chlorophyll A fluorescence
Chlorophyll a O–J–I–P fluorescence transients (Strasser and Govindjee 1992) were recorded from
leaves 1 to 6. Measurements were performed on the broadest midsection of the leaves, of a
minimum of 10 plants for each group (with or without visual expression of YCS). Measurements
were conducted with a PEA fluorescence meter (Hansatech Instruments Ltd., King’s Lynn, Norfolk,
PE 30 4NE, UK). The transients were induced by a red light (peak at 650 nm) of 3,200 µmol m-2 s-1
provided by the PEA instrument through an array of six light-emitting diodes (van Heerden 2014).
The JIP-test (Strasser and R.J. 1995) was subsequently employed to analyse each recorded
transient. The following data from the original measurements were used: maximal fluorescence
intensity (FM); fluorescence intensity at 50 µs (considered as F0); fluorescence intensity at 300 µs
(F300 µs) required for calculation of the initial slope (M0) of the relative variable fluorescence (V)
kinetics; the fluorescence intensity at 2 ms (the J step) denoted as FJ. VJ was calculated as (FJ -
F0)/(FM - F0). The JIP-test (Strasser and R.J. 1995) was used to translate the original recorded data
to biophysical parameters that quantify the stepwise energy flow through Photosystem II. A multi-
parametric expression performance index (PABS), was also calculated (Strasser et al. 2000). The PABS
considers the three main steps that regulate photosynthetic activity by a Photosystem II reaction
center (RC) complex, namely absorption of light energy (ABS), trapping of excitation energy (TR)
and conversion of excitation energy to electron transport (ET). The formulae used to calculate
each of these biophysical parameters from the original fluorescence measurements are as
previously detailed (van Heerden et al. 2007b)
5.4.11. Callose quantification
A modified extraction protocol was used to quantify callose (1, 3-β-glucan) through micro-titre based
fluorescence spectroscopy (Kohle et al., 1984; Shedletzky et al., 1997; Ko and Lin, 2004) with
spectrophotometer (BMG-Labtech, FLUOstar Omega) and 96-well plate (Thermo Scientific, Black
Microtiter). The choice of flurochrome was Aniline Blue, together with Curdlan (CE) standard and
fluorescence parameters Excitation: 355nm, Emission: 460nm. (Aniline blue reaction mix 120µL (40
volume aniline blue 0.1% w/v , 59 volume 1M Glycine/NaOH (pH 9.5), 21 volume 1M HCl) was added
Sugar Research Australia Final Report - Project 2015/016
40
to 10µL sample extract, vortexed and incubated on a shaker @50˚C for 20 mins and then returned to
room temperature for 30 mins prior to reading in spectrophotometer.
5.4.12. Statistical analyses
Statistical analysis of the metabolite data was performed using MetaboAnalyst 3.0
http://Metabolanalyst.ca, (Xia et al., 2015). Fold change was calculated as the means ratios of each
treatment compared with the asymptomatic tissues and T-tests with unequal variances were
performed to compare data obtained between experimental groups. The false-positive rate
associated with multiple comparisons was calculated using the false discovery rate (FDR) or
Bonferroni-corrected P values were also calculated. All tests with significance of P < 0.05 were
considered in the analyses (Xia et al., 2015).
Statistical analysis of the transcriptome data was performed using CLC Genomics Workbench
Differential expression (DE) analysis was performed in the CLC Genomics Workbench v12.0 (QIAGEN,
Aarhus, Denmark) software environment (CLC-GWB), using the ‘Differential Expression for RNA-seq’
pipeline. The DE was run as a two group, unpaired, YCS vs Control experiment, while controlling for
tissue type, variety, and leaf/internode number. The results were subjected to statistical analysis,
then filtered to give only those transcripts with an FDR-corrected p-value ≤0.01.
Statistical analysis of inhouse carbohydrates was through Statistix10
Statistical software package Statistix 10 was used to analyse carbohydrate data. An Analysis of
Variance (ANOVA-completely randomised design) was used to compare starch, sucrose, glucose,
and fructose means from mid-leaf extracts to identify if there are differences between sample
groups. To identify which groups are significantly different a Tukey’s HSD AllPairwise Comparisons
Test was then applied to create confidence intervals for all pairwise differences (these are displayed
as homogeneous groups A, B, AB, C etc). Different groups indicate that their means are significantly
different from each another. A statistical check for normality was also performed using the Shapiro-
Wilk test and where necessary the data was transformed (normalised) prior to performing the
Tukey’s HSD test.
5.4.13. Transcriptome Assembly
In this project, we initially made use of existing genomic and transcriptomic resources. In particular,
the sugarcane transcriptome produced by Hoang et al. (2016) from multiple tissue types of healthy
Queensland commercial Q-varieties was very helpful in elucidating the molecular basis of changes to
leaf yellowing and sucrose metabolism in YCS-affected plants.
However, a dataset constructed from healthy samples cannot hold all the answers to YCS as it would
not contain any transcripts that may have been expressed uniquely and specifically during YCS. For
this reason, we undertook to assemble and annotate a ‘YCS transcriptome’ from our sequencing
reads and use this to interrogate our samples for any YCS-specific metabolic signatures.
This YCS transcriptome would also be an ideal dataset to discover a unique YCS biomarker. This
strategy was successful. Of the six YCS biomarker candidates described later in section 6.6.2, three of
these candidates were not found in any other sugarcane transcriptomic dataset, including our
preferred candidate YCS-2.

Sugar Research Australia Final Report - Project 2015/016
41
We assembled three YCS transcriptomes; leaf, internode and a combined leaf-and-internode one.
The combined version became our Reference transcriptome for our analyses.
Transcriptome Assembly from leaf and internode sequences
The 106 leaf and internode RNA samples sequenced represented 152 separate samples taken from
77 individual plants.
The reads from the leaf and internode tissue were assembled separately into leaf and internode
transcriptomes, and the two tissue-specific transcriptomes were combined to produce the final
reference transcriptome used in the analysis (Figure 4). The raw reads are available from NCBI’s
Sequence Read Archive, and together with the leaf transcriptome, internode transcriptome and final
combined leaf-and-internode transcriptome, are stored under BioProject PRJNA480179.
Figure 4 Bioinformatics process overview for the transcriptome assembly
Computational power
Computing resources used in this study include a Linux desktop with 256Gb of RAM running the
Ubuntu 18.04 operating system, and the Stampede cluster in the Texas Advanced Computing Center
(TACC), hosted by the University of Texas at Austin (https://www.tacc.utexas.edu/home). We also
used the Tinaroo and FlashLite clusters, hosted by the Research Computing Centre (RCC) at the
University of Queensland (https://rcc.uq.edu.au/hpc).

Sugar Research Australia Final Report - Project 2015/016
42
Leaf transcriptome
Raw RNAseq reads were trimmed for quality using the Trimmomatic (v 0.36) software tool[1] [2]
(Bolger et al, 2014) and the quality was visualised before and after trimming using the FastQC
(v0.11.4) software tool (S. Andrews, 2010. Available online from
www.bioinformatics.babraham.ac.uk/projects/fastqc/). The Trinity (v 2.4.0) Insilico Normalisation
tool was run as a stand-alone script on the trimmed reads to reduce duplication and coverage to
make the assembly process easier (Haas et al, 2013). The normalised reads from all samples were
concatenated into two fasta files of left and right reads, for assembly using the Velvet v1.2.10
(Zerbino and Birney, 2008), Trinity v2.4.0 (Grabherr et al. 2011), Soap2 v2.04 (Li et al. 2009) and
SoapTrans v1.03 (Xie et al. 2014) assembly software tools. All the scripts used to create and process
the assemblies are available online at https://github.com/k8hertweck/ycs and
https://github.com/katewd/SugarcaneYCS .
The Velvet assembly tool was run with kmers 43, 45, 47, 49, 51, 53, 55, 57, 59, 61 and 63, and these
were then combined into a single fasta file output using the Oases v0.2.8 tool (Schulz et al. 2012).
The Trinity assembly tool was run using a single kmer of 25. The Soap2 and SoapTrans tools were
both run with kmers of 17, 27, 37, 47, 57, 67, 77 and 87. For both Soap2 and SoapTrans, the multiple
assemblies were concatenated into a single fasta file per tool, for further processing using the
EvidentialGene RNA assemblies (EvigeneR) pipeline (D. Gilbert, 2013. Available online from
http://arthropods.eugenes.org/genes2/about/EvidentialGene_trassembly_pipe.html ). The output
from each assembly tool was sent separately through the EvigeneR pipeline to remove any of the
contigs that were unlikely to be coding for biologically functional proteins.
After the EvigeneR step, the ‘okay.fa’ contigs from the ‘okayset’ from each of the four assemblies
were merged into a single contig set using CD-HIT-EST v4.6.6 (Li and Godzik, 2006) at 100% similarity
to remove duplicate contigs. The contigs were then re-assembled using the Trinity assembly tool to
reduce the segmentation score as determined by the TransRate v1.0.3 tool (Smith-Unna et al. 2015).
The reassembled transcripts were again cleaned up through the EvigeneR pipeline to remove any
nonsense or misassembled contigs.
Annotations for the transcripts were obtained using the CloudBlast service of Blast2GO, which was
run with the Blast2GOPro plugin (BioBam, Spain) in the CLC-GWB software environment. Blastx-fast
was run using the non-redundant protein sequences updated on the 30/01/2017, with the e-value
cut off of 1.0E-3, the number of blast hits=20, word size=6, and a low-complexity filter on. Following
the blast step, the Mapping, Annotation, InterProScan and Merge InterProScan steps were done
subsequently in that order.
The table of blast hits was exported from the CLC-GWB environment, and the transcripts and their
annotations converted into a single-column csv file for further use in a python script to add the
annotations to the transcript fasta headers. The python script used was
‘add_header_annotations.py’ and is available from the project GitHub site
(https://github.com/katewd/SugarcaneYCS).
As Figure 4 shows, the final leaf transcriptome contained 115,628 contigs with an assembly N50 of
1271.

Sugar Research Australia Final Report - Project 2015/016
43
Internode transcriptome
Similar to the leaf transcriptome, the internode reads were trimmed for quality using Trimmomatic
(Bolger et al, 2014), the quality was visualised using FastQC (S. Andrews, 2010), and the reads
normalised using the Trinity Insilico Normalisation script. The normalised reads from all internode
samples were concatenated into two fasta files of left and right reads, for assembly using the Velvet
(Zerbino and Birney, 2008), Trinity (Grabherr et al. 2011), Soap2 (Li et al. 2009) and SoapTrans (Xie et
al. 2014) assembly software tools, using the same parameters as the leaf transcriptome assembly.
However, the post-assembly processing of the internode transcriptome was different from the leaf
transcriptome. Due to the smaller and more manageable dataset, the internode multiple assembly
outputs were concatenated into a single fasta file and reassembled using Trinity, without the prior
cluster, merge and cleanup filtering steps performed for the leaf set. The reassembled internode
contigs were processed through the EviGeneR pipeline. Annotations were done in the same way as
the leaf transcriptome, with the transcript Blast2GO hit annotations added to the fasta sequence
headers using the python script.
The result was the final internode transcriptome with 153,406 transcripts and an assembly N50 of
1739 (Figure 4).
Combined Leaf-and-Internode Reference Transcriptome
The leaf and internode transcriptomes were concatenated into a single file, with the transcript
headers retaining their tissue-specific identification and blast annotation, and were processed
through the EvigeneR pipeline to remove transcript fragments and coding duplicates.
Transcriptome completeness was assessed using the embryophyta plant dataset (version odb9) of
the Benchmarking Universal Single-Copy Orthologs (BUSCO) tool (Simão et al., 2015).
The combined leaf-and-internode reference transcriptome contained 245,672 transcripts, with an
N50 of 1415, and contained 97.8% of expected single-copy orthologs (Figure 4).
Table 3 shows the key metrics for the de novo transcriptomes created and used in this study.
Table 3 Assembly metrics for the reference transcriptome
Differential Expression
The de novo combined leaf-and-internode YCS Reference Transcriptome assembly was imported
into CLC Genomics Workbench v12.0 (QIAGEN, Aarhus, Denmark) software environment. The paired,

Sugar Research Australia Final Report - Project 2015/016
44
trimmed reads for each of the samples were mapped to the reference assembly using the following
mapping parameters:
mismatch cost=2, insertion cost=3, deletion cost=3, length fraction=0.9, similarity=0.8, maximum number of hits for a
read=10, with the distance between paired reads automatically detected, expression values as total counts, RPKM
calculated, EM estimation used, and unmapped reads discarded.
Differential expression (DE) analysis was performed in the CLC Genomics Workbench (CLC-GWB),
using the ‘Differential Expression for RNA-seq’ pipeline. The DE was run as a two group, unpaired,
YCS vs Control experiment, while controlling for tissue type, variety and leaf/internode number. Of
the 106 samples used to build the reference, a subset of the samples (12) was from a set of plants
that had undergone a chemical treatment. These were also not included in this analysis. The
remaining 94 samples had their sucrose content measured in-house (unpublished data), and the
sample sucrose content (nmol/g dry weight) was dimension-reduced to a binary of either ‘above’ or
‘below’ the median sucrose content. As high leaf sucrose content is a marker for YCS (Marquardt et
al., 2016), only YCS samples with above-median sucrose values, and Control samples with below-
median sucrose values, were included in the analysis. The YCS versus Control analysis was conducted
using 62 samples in total, of which 24 were from internode tissue and 38 were from leaf tissue, 29
were Controls and 33 were YCS.
5.5. Field trials
5.5.1. Growth regulator
An experiment was conducted on the grounds of Sugar Research Burdekin Station, Farm #6007 Block #3-1 in Burdekin, QLD (19°34'08.0"S 147°19'30.7"E). Following soil nutrient testing, the soil was fertilised according to Six Easy Steps nutrient recommendations (N kg/ha, P kg/ha, K kg/ha and S kg/ha) and sugarcane variety KQ228A was stick planted on 23-Aug-2016. The experimental area was within a furrow irrigated sugarcane block with a seven-day flood irrigation schedule. The trial was a completely randomised design including eight treatments with four replicate plots x 10m (1.5m spacing) per treatment. Treatments were; Aviglycine (Retain) (Ethylene inhibitor), Paclobutrazol (GA inhibitor-Moddus®), 6-Benzylaminopurine (Cytokinin), Gibberellic Acid, Ethyphon (Promote 900)(Ethylene), Trinexapac-Ethyl (Moddus)(GA inhibitor), Shade (50% shade cloth) and Untreated control. Rates of application varied monthly (Table 4).
Table 4 Insecticide treatments
Date Treatment/Rate
9/11/2016
▪ Paclobutrazol (50uM, 0.235036g/12L/plot= 4L/row watering can) ▪ Gibberelic Acid (300uM, 0.727g/7L/plot) ▪ 6-Benzylaminopurine (cytokinin) (250uM, 0.3941g/7L/plot) ▪ Aviglycine (Retain) (1/2 label rate, 415g/ha, 2.49g/7L/plot) ▪ Ethylene (Promote 900) (1/3 label rate, 333mL/ha, 2mL/7L/plot) ▪ Trinexapac-Ethyl (Moddus) (1/2 label rate, 400mL/ha, 2.4mL/7L/plot) ▪ Shade ▪ Untreated control
8/12/2016
▪ Paclobutrazol (75uM, 0.0.52884g/24L/plot= 6L/row watering can) ▪ Gibberelic Acid (150uM, 0.0.31173g/6L/plot) ▪ 6-Benzylaminopurine (cytokinin) (250uM, 0.337g/6L/plot) ▪ Aviglycine (Retain) (2/3 label, 622.5g/ha, 3.735g/6L/plot) ▪ Ethylene (Promote 900) (1/2 label rate, 450mL/ha, 2.736mL/6L/plot)

Sugar Research Australia Final Report - Project 2015/016
45
Date Treatment/Rate
▪ Trinexapac-Ethyl (Moddus) (1/4 label rate, 200mL/ha, 1.216mL/6L/plot) ▪ Shade ▪ Untreated control
10/01/2017
▪ Paclobutrazol (150uM, 1.05768g/24L/plot= 6L/row watering can) ▪ Gibberelic Acid (150uM, 0.31173g/9L/plot) ▪ 6-Benzylaminopurine (cytokinin) (1000uM, 2.027g/9L/plot) ▪ Aviglycine (Retain) (label, 830g/ha, 4.98g/9L/plot) ▪ Ethylene (Promote 900) (label, 900mL/ha, 5.4mL/9L/plot) ▪ Trinexapac-Ethyl (Moddus) (1/4 label rate, 200mL/ha, 1.216mL/9L/plot) ▪ Shade ▪ Untreated control
08/02/2017
▪ Paclobutrazol (150uM, 1.05768g/24L/plot= 6L/row watering can) ▪ Gibberelic Acid (150uM, 0.31173g/6L/plot) ▪ 6-Benzylaminopurine (cytokinin) (1500uM, 2.027g/6L/plot) ▪ Aviglycine (Retain) (2/3 label, 622.5g/ha, 3.735g/6L/plot) ▪ Ethylene (Promote 900) (label, 900mL/ha, 5.4mL/6L/plot) ▪ Trinexapac-Ethyl (Moddus) (1/4 label rate, 200mL/ha, 1.216mL/6L/plot) ▪ Shade ▪ Untreated control
6/03/2017
▪ Paclobutrazol (300uM, 2.1154g/24L/plot= 6L/row watering can) ▪ Gibberelic Acid (300uM, 0.6234g/6L/plot) ▪ 6-Benzylaminopurine (cytokinin) (1500uM, 2.027g/6L/plot) ▪ Aviglycine (Retain) (label, 830g/ha, 4.98g/6L/plot) ▪ Ethylene (Promote 900) (label, 900mL/ha, 5.4mL/6L/plot) ▪ Trinexapac-Ethyl (Moddus) (label rate, 800mL/ha, 4.8mL/6L/plot) ▪ Shade ▪ Untreated control
5.5.2. Insecticide Trial
The insecticide trial was established September 2017 in the same field as the growth regulator trial
on the grounds of Sugar Research Burdekin Station, Farm #6007 Block #3-1 in Burdekin, QLD
(19°34'08.0"S 47°19'30.7"E), KQ228A 1st ratoon. Following soil nutrient testing, the soil was fertilised
according to Six Easy Steps nutrient recommendations (N kg/ha, P kg/ha, K kg/ha and S kg/ha). All
other conditions were maintained except for new treatments. Treatments were November
bifenthrin - foliar applied weekly; December bifenthrin - foliar applied weekly; January bifenthrin -
foliar applied weekly; February bifenthrin - foliar applied weekly; March bifenthrin - foliar applied
weekly; Continuous bifenthrin - foliar applied weekly November to March; MgSO4 foliar applied
weekly; Untreated control. Bifenthrin was applied at 320 ml/ha and MgSO4 at 104 kg/ha (based on
9.6 % Mg to deliver 10 kg/ha Mg).

Sugar Research Australia Final Report - Project 2015/016
46
6. RESULTS AND DISCUSSION
The results displayed in this study continue the pilot study conducted in project 2014/090. Presented
here are the results of our research into the cause of high sucrose accumulation in YCS leaves, and
the metabolic disruption to the source and sink tissue prior to and after the onset of visible
yellowing. Detailed analyses of the perturbances to photosynthesis, carbon fixation, turnover and
partitioning, phloem transport, and sink strength are discussed. Identification of symptom
expression, diagnostics, and management options to mitigate YCS are also addressed.
6.1. YCS symptom expression
YCS symptom expression is more likely to occur during the summer months from December to
March. This is notably the time of highest photosynthetic carbon fixation (photoassimilation) and the
highest growth rate period for the crop. Any disruption to carbon export when sucrose synthesis is
highest increases the chance that sucrose accumulation in the source leaf will exceed upper
tolerance levels. Therefore, YCS symptom expression is more likely to occur during this time of year
than in the cooler shorter daylength months. However, YCS may occur at any time of the year if
sucrose synthesis exceeds the rate of export from the source leaf or demand from the sink tissue
(internodes).
The first leaf to show symptoms will the one with the highest rate of photoassimilate export and this
is typically Leaf 4 (Leaf #1 = FVD). Yellowing typically starts close to and on one side of the midrib,
approximately midway along the leaf blade (Figure 5A ).This section of the leaf is where the leaf
usually bends under its own weight, receives most of the light and has the highest photosynthetic
activity (Mattiello et al., 2015; Marquardt et al., 2016). However, yellowing can occur at any position
along the leaf depending on its orientation to the sun in the canopy. Expression of yellowing and
chlorosis is dependent on high light intensity in maize tie-dyed mutants (Braun and Slewinski, 2009).
Hence, it is common to see higher levels of YCS expression in the outer rows or on the ends of a field
and away from building and vegetation shading (Figure 5B). The midribs of afflicted leaves remain
white on the upper surface (Figure 5C) and green on the abaxial side of the leaf.

Sugar Research Australia Final Report - Project 2015/016
47
Figure 5 YCS symptom expression usually starts where light interception is highest in the middle of the leaf and on one side of the midrib A) YCS symptoms worse on field margin where exposure to sunlight is highest B) white midrib C)
Leaf yellowing occurs when leaf sucrose accumulation exceeds a tolerable upper threshold, after
which a cascade of events leads to metabolic disruption and the early onset of leaf senescence.
Yellowing is more golden in colour, can be solid or blotchy, spreading toward the tip, base, and outer
margin of the lamina, culminating in irreversible leaf senescence. Subsequent expression will
continue in the younger leaves above as they mature and become the predominant exporter of
sucrose. Yellowing will cease to develop in new leaves when sucrose accumulation fails to exceed
the tolerable threshold.
YCS is usually more prevalent after a period of slow growth followed by a period of increased
photoassimilation and rapid growth. Symptoms can develop in all commercially grown genotypes
and across all stages of the crop cycle. The typical YCS season is during the peak photosynthetic
period of December to March.
6.2. Leaf yellowing – disruption to source
Leaf chlorosis or yellowing is due to reduced chlorophyll content. To understand the development of
yellowing it is important to determine the pattern of chlorosis and the dependence of this on the
presence of light. To do this we investigated changes in the transcriptome and metabolome to
better understand chlorophyll turnover which drives YCS development. Chlorophyll turnover is
determined by the magnitude of:
1) Chlorophyll synthesis (biotic stress)
Sugar Research Australia Final Report - Project 2015/016
48
2) Chlorophyll breakdown (abiotic stress)
3) Photooxidation (uncoupling of electron transport from coenzyme reduction and carbon
fixation causing changes to carbon partitioning)
Source leaf health in C4 plants can be determined by the sucrose level in the photosynthetic
mesophyll and bundle sheath cells and the effect on photosynthesis. Previous studies have shown
that high carbohydrate accumulation in the leaf induces yellowing of the lamina (Tollenaar and
Daynard, 1982; Krapp and Stitt, 1995; Jensen, 1996; Russin et al., 1996; Rajcan and Tollenaar, 1999;
Graham and Martin, 2000; Braun et al., 2006). It is important to understand whether yellowing
occurs around the primary or secondary veins as this will reveal if YCS expression is associated with
disruption to phloem transport or phloem loading. Another consequence of chlorophyll loss from
the leaf in many species of the Poaceae family is the accumulation of pigments such as zeaxanthin
and anthocyanins, giving the leaf a golden-yellow colour (Allison and Weinmann, 1970; Tollenaar
and Daynard, 1982; Rajcan and Tollenaar, 1999). As golden-yellow colour is a discernible
characteristic of YCS, it is therefore important to understand the mechanisms causing chlorophyll
loss and the expression of other pigments.
6.2.1. Leaf sucrose
In a healthy leaf, sucrose and starch levels rise throughout the day as the photosynthetic rate
increases. As the sink calls for carbon, sucrose is loaded into the phloem and excess is sent to starch
storage to ensure sucrose concentrations never rise above a tolerable upper threshold. By mid-
afternoon, the photosynthetic rate peaks and sucrose levels start to decline while starch synthesis
continues in preparation for the dark period. Approximately 80% of the total fixed carbon is typically
exported during the day period. During the night, the remaining 20% is exported to meet the energy
needs of the plant and both sucrose and starch pools are depleted. Maintenance of this circadian
rhythm is the role of regulatory enzymes and metabolic precursors of sucrose and starch synthesis
and breakdown. Therefore, the diurnal change is dependent on the rate of carbon exchange, sucrose
content and feedback mechanisms (Stitt and Quick, 1989; Weise et al., 2011). In contrast, the level
of disruption to the diurnal rhythm in YCS plants is evident with high levels of both sucrose and
starch recorded in leaf tissue at first light (Marquardt et al., 2016). As starch synthesis is ultimately
controlled by sucrose synthesis (Stitt and Quick, 1989), it is the accumulation of sucrose that will be
the initial focus of this study in understanding YCS development and expression.
To gain insight into the distribution of sucrose along the leaf and to determine any correlation with
leaf yellowing, we quantified this key metabolite in different leaf sections of control and YCS
symptomatic (Leaf 4) and asymptomatic (Leaf 3) leaves. Figure 6 shows the sucrose content in
sectioned quarters between the leaf tip and sheath base. YCS asymptomatic (Leaf 3) and
symptomatic (Leaf 4) from the same culm have significantly higher sucrose levels compared to their
control counterparts. The pattern of sucrose accumulation along the lamina is similar between
controls and YCS, albeit much higher in YCS, and only deviates at the base of the YCS leaf.
Interestingly the rapid rise in sucrose content at the base of the YCS leaf does not correlate with
where the onset of yellowing is first visualised. The highest photosynthetic rates in sugarcane occurs
in the middle section of the leaf (Mattiello et al., 2015).This is not unexpected as most varieties
have leaves that naturally bend over at the mid-section and therefore this segment receives the
highest amount of solar radiation. Interestingly, this is also where yellowing usually commences in
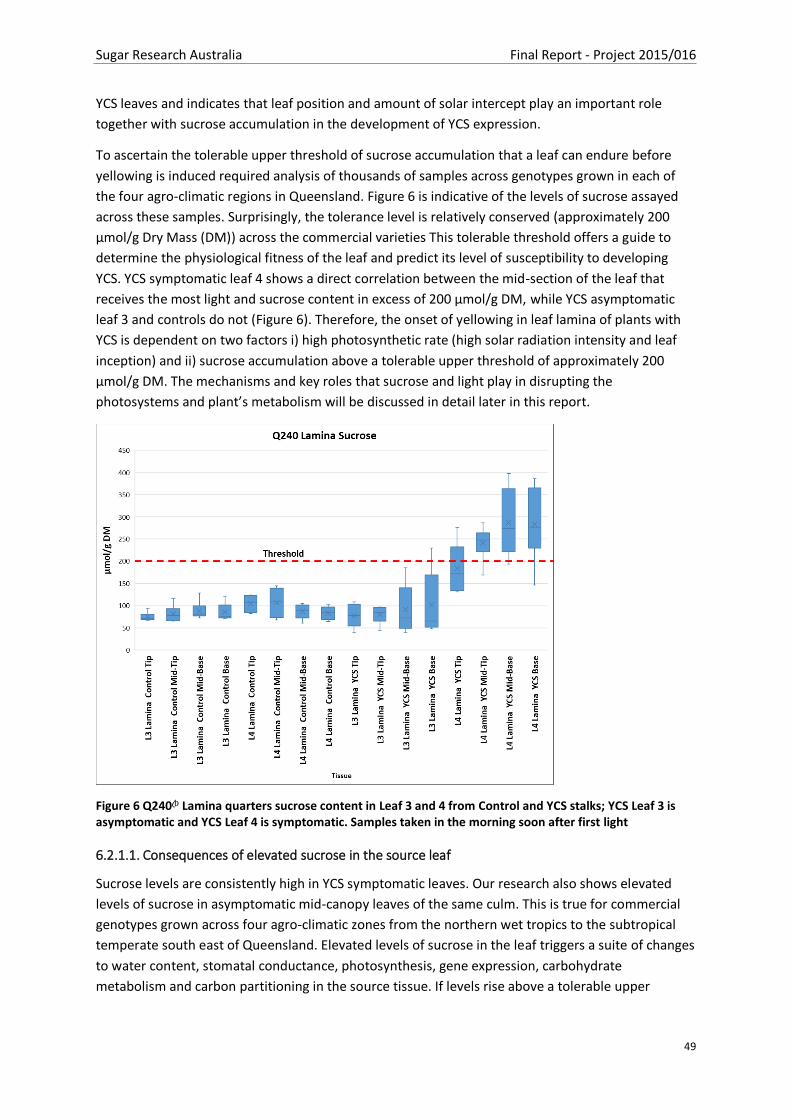
Sugar Research Australia Final Report - Project 2015/016
49
YCS leaves and indicates that leaf position and amount of solar intercept play an important role
together with sucrose accumulation in the development of YCS expression.
To ascertain the tolerable upper threshold of sucrose accumulation that a leaf can endure before
yellowing is induced required analysis of thousands of samples across genotypes grown in each of
the four agro-climatic regions in Queensland. Figure 6 is indicative of the levels of sucrose assayed
across these samples. Surprisingly, the tolerance level is relatively conserved (approximately 200
µmol/g Dry Mass (DM)) across the commercial varieties This tolerable threshold offers a guide to
determine the physiological fitness of the leaf and predict its level of susceptibility to developing
YCS. YCS symptomatic leaf 4 shows a direct correlation between the mid-section of the leaf that
receives the most light and sucrose content in excess of 200 µmol/g DM, while YCS asymptomatic
leaf 3 and controls do not (Figure 6). Therefore, the onset of yellowing in leaf lamina of plants with
YCS is dependent on two factors i) high photosynthetic rate (high solar radiation intensity and leaf
inception) and ii) sucrose accumulation above a tolerable upper threshold of approximately 200
µmol/g DM. The mechanisms and key roles that sucrose and light play in disrupting the
photosystems and plant’s metabolism will be discussed in detail later in this report.
Figure 6 Q240A Lamina quarters sucrose content in Leaf 3 and 4 from Control and YCS stalks; YCS Leaf 3 is asymptomatic and YCS Leaf 4 is symptomatic. Samples taken in the morning soon after first light
6.2.1.1. Consequences of elevated sucrose in the source leaf
Sucrose levels are consistently high in YCS symptomatic leaves. Our research also shows elevated
levels of sucrose in asymptomatic mid-canopy leaves of the same culm. This is true for commercial
genotypes grown across four agro-climatic zones from the northern wet tropics to the subtropical
temperate south east of Queensland. Elevated levels of sucrose in the leaf triggers a suite of changes
to water content, stomatal conductance, photosynthesis, gene expression, carbohydrate
metabolism and carbon partitioning in the source tissue. If levels rise above a tolerable upper
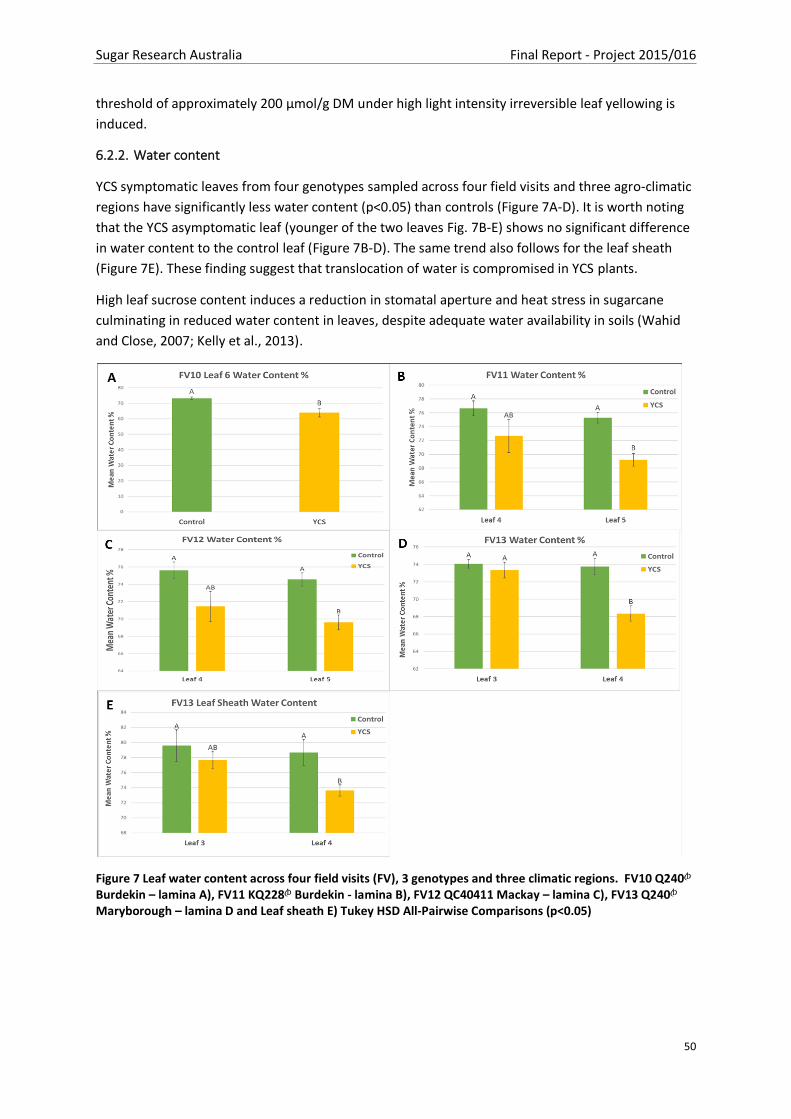
Sugar Research Australia Final Report - Project 2015/016
50
threshold of approximately 200 µmol/g DM under high light intensity irreversible leaf yellowing is
induced.
6.2.2. Water content
YCS symptomatic leaves from four genotypes sampled across four field visits and three agro-climatic
regions have significantly less water content (p<0.05) than controls (Figure 7A-D). It is worth noting
that the YCS asymptomatic leaf (younger of the two leaves Fig. 7B-E) shows no significant difference
in water content to the control leaf (Figure 7B-D). The same trend also follows for the leaf sheath
(Figure 7E). These finding suggest that translocation of water is compromised in YCS plants.
High leaf sucrose content induces a reduction in stomatal aperture and heat stress in sugarcane
culminating in reduced water content in leaves, despite adequate water availability in soils (Wahid
and Close, 2007; Kelly et al., 2013).
Figure 7 Leaf water content across four field visits (FV), 3 genotypes and three climatic regions. FV10 Q240A Burdekin – lamina A), FV11 KQ228A Burdekin - lamina B), FV12 QC40411 Mackay – lamina C), FV13 Q240A Maryborough – lamina D and Leaf sheath E) Tukey HSD All-Pairwise Comparisons (p<0.05)

Sugar Research Australia Final Report - Project 2015/016
51
6.2.3. Stomatal conductance and photosynthesis
To gain an understanding of the extent of photosynthetic disruption in YCS leaves we needed to
measure the levels of stomatal conductance, gas exchange, internal CO2, carbon fixation, light
harvesting, electron transport coupling and chlorophyll (chl) a fluorescence (photosynthetic energy
conversion) in healthy and YCS tissue.
In crops affected by YCS, photosynthesis and stomatal conductance is suppressed in the mid-canopy
leaves of both YCS asymptomatic and symptomatic leaves with older source leaves being most
effected. Studies by Marquardt (2016) found the carbon fixation and stomatal conductance penalty
rate due to YCS to be approximately 36% and 42% respectively in the source leaves of the mid-
canopy (Figure 8, Figure 9). The extent of stomatal closure can be directly attributed to high leaf
sucrose content. Our investigation of apoplastic fluid composition confirmed sucrose levels to be 3-
fold higher than controls (Figure 51). High apoplastic sucrose ultimately leads to some diffusion into
the transpiration stream. Here, abscisic acid (ABA) mediated sucrose induces increased hexokinase
expression in guard cells, accelerating stomatal closure (Kelly et al., 2013).
Figure 8 Photosynthesis rates in leaves of the canopy of KQ228A in the Burdekin (A) and Q200A in the
Herbert (B) yellow canopy syndrome (YCS) symptomatic and asymptomatic (control) sugarcane plants.
Values ± standard deviation (Marquardt, 2019)

Sugar Research Australia Final Report - Project 2015/016
52
Figure 9 Stomatal conductance in leaves of the canopy of KQ228A in the Burdekin (A) and Q200A in the Herbert (B) yellow canopy syndrome (YCS) symptomatic and asymptomatic (control) sugarcane plants., YCS. Values ± standard deviation (Marquardt, 2019)
Such a profound reduction in stomatal conductance causes significant decline in gas exchange.
Figure 10 shows the internal CO2 concentration in YCS symptomatic leaves to be approximately 20%
lower than controls. Studies show that healthy tissue should have relatively constant internal CO2
and a lineal relationship between photosynthesis and stomatal conductance. Sustained reduction in
gas exchange will also lead to a decrease in biomass production (Long et al., 1996; Chaves et al.,
2008; Ghannoum, 2009). YCS mid-canopy leaves clearly show complete disorder across these
parameters. Furthermore, stomatal closure will lead to a reduced transpiration rate and ultimately
increased internal leaf temperature. Chl a fluorescence studies show a distinct K-step in the O-K-J-I-P
transient which is indicative of elevated leaf temperature (Figure 13). In fact, when oxygenic plants
are under heat stress and the water splitting system (oxygen evolving complex) is inhibited, the K-

Sugar Research Australia Final Report - Project 2015/016
53
step is always present (Srivastava et al., 1997; Jiang et al., 2006)
Figure 10 Internal CO2 concentration in leaves of the canopy of KQ228A in the Burdekin (A) and Q200A in the Herbert (B) yellow canopy syndrome (YCS) symptomatic and asymptomatic (control) sugarcane plants., YCS. Values ± standard deviation (Marquardt, 2019).
The study of chl a fluorescence kinetics provides insight into the capacity of photosystems I and II
and physiological fitness of the photosynthetic tissue (Strasser et al., 2000). Figure 11 shows
changes in chl a O-J-I-P fluorescence transients at specific locations along the lamina of a YCS
symptomatic leaf. Interestingly the green side of the leaf is already showing signs of electron
uncoupling, trailing slightly behind in fluorescence intensity. There is also a notable
disruption to the electron transport system progressing from the green to less green or
yellow tissue within each side of the leaf.
Figure 12 shows a comparison in photosystem efficiencies between control leaf 5 & 6 and
YCS (asymptomatic) leaf 5 and symptomatic leaf 6. Analysis of the biphasic response in delta
fluorescent curves, indicates a first major peak around 500 µs to 1000 µs (Figure 12A). This is
reflective of a disruption of photosystem II. However, the second peak around 10,000 µs is
indicative of a disruption of electron flow between photosystem II and photosystem I.
Detailed analyses of the different components of the OJIP curve at the base, middle and tip
of the leaf (Figure 12B) indicates an overall suppression or decrease in the efficiency of
electron flow through the electron transport systems. Uncoupling of the ETC becomes
progressively worse from the leaf base (youngest tissue) to the tip (oldest tissue). PI abs is an
indicator of how well photosystems II and I are functioning and also gives a quantitative
measure of the plants physiological fitness under stress conditions (Strasser et al., 2000).
Figure 12C shows the electron transport system is seriously disrupted in YCS (symptomatic) leaf 6
and already compromised in YCS (asymptomatic) leaf 5 well before the onset of visible yellowing.
Evaluation of the efficiency of electron movement of trapped excitation into the transport chain is

Sugar Research Australia Final Report - Project 2015/016
54
one of the main parameters of PI abs. (Kruger et al., 1997; Tsimilli-Michael and Strasser, 2013). YCS
leaves clearly show an uncoupling of the electron transport chain and a huge decline in
photosynthetic efficiency.
Figure 11 Difference in variable fluorescence kinetics on different positions of the same leaf. OJIP fluorescence transients were normalised (O.P) and subtracted for the first clip on the greenside of the leaf.
Figure 12 Difference in variable fluorescence along the lamina constructed by subtraction of normalised (O–
P) fluorescence values for the asymptomatic leaves from that recorded for the same age symptomatic
leaves. The O–J–I–P fluorescence transients A) recorded in leaves 5 and 6 of asymptomatic (control) and
symptomatic (YCS) Q240A plants B) performance index (PIABS) control, YCS leaf 5 (asymptomatic) and YCS
leaf 6 (symptomatic) C)

Sugar Research Australia Final Report - Project 2015/016
55
Figure 13 shows a significant increase in O–J–I–P fluorescence transient intensity starting at
approximately 2 ms represented by the J-step. The calculated increase in ΔJ is associated with an
accumulation of the reduced primary quinone acceptor of PSII (QA) and plastoquinone (PQ) pools.
This disruption on the electron acceptor side of PSII is most likely due to a blockage of electron flow
further downstream (I-step) on the acceptor side of PSI (Schreiber and Neubauer, 1987; Strasser et
al., 2000; Schansker et al., 2005; van Heerden et al., 2007). Therefore, this disruption to the electron
transport system in YCS leaves would lead to a reduction in CO2 fixation.
Figure 13 Chlorophyll a fluorescence transients (A) recorded in leaves 1, 3 and 5 of asymptomatic (control) and symptomatic (YCS) KQ228A plants. The different stages in the fluorescence transient (OJIP) are indicated. Difference in variable fluorescence curves (B) constructed by subtraction of normalised (O-P) fluorescence values for the asymptomatic leaves from that recorded for the same age symptomatic leaves.
Fvʹ/Fmʹ is a good measure of the quantum efficiency of open PSII reaction centres. Studies by
Marquardt (2016) comparing two commercial genotypes (KQ228A & Q200A) showed this ratio
decreased significantly between leaf 3 and 5 in YCS symptomatic plants compared to controls. Also
noted was the decrease in maximal fluorescence intensity (Fm) without a corresponding reduction at
at 50 µs (F0). This anomaly is indicative of inactivation of the photosynthetic reaction centres and not
antenna quenching (Tsimilli-Michael and Strasser, 2008).
The inhibition of the oxygen evolving complex (OEC) due to heat stress and the subsequent
disruption to the electron acceptor side of PSII could lead to damage of D1 proteins and the
accumulation of reactive oxygen species (ROS) (Tsimilli-Michael and Strasser, 2008; Pokorska et al.,
2009; Tsimilli-Michael and Strasser, 2013).Therefore disruption to the electron transport system in
YCS leaves will result in significant production of free radicals and oxidants, unless buffered by
cellular metabolism.

Sugar Research Australia Final Report - Project 2015/016
56
6.2.4. Gene expression and protein
6.2.4.1. Light reactions
It is well established that an increase in leaf sucrose level represses photosynthetic gene expression
and chlorophyll abundance leading to chlorosis (Sheen, 1990; Goldschmidt and Huber, 1992; Sheen,
1994; Krapp and Stitt, 1995; Jeannette et al., 2000; Braun et al., 2006; Baker and Braun, 2008; Braun
and Slewinski, 2009; Slewinski and Braun, 2010). This disruption leads to an imbalance between the
production of ATP and NADPH and metabolic consumption. The resultant decrease in available
oxidised coenzyme NADP+ initiates an excess capacity of the light reactions, increased ROS
production and ultimately photo-oxidation of the photosynthetic apparatus, culminating in leaf
yellowing. (Ahmad, 2014; Schöttler and Tóth, 2014).
Major changes are evident in the levels of transcripts and the proteins associated with photosystem I
and II of the photosynthetic electron transport chain in YCS leaves (Figure 14). There is significant
downregulation of genes encoding light interception proteins (chlorophyll a/b binding), through to
ATP and NADPH production (ATP synthase subunit and ferredoxin-NADP+ reductase (FNR),
respectively). Major impacts are observed in the reaction centres of Photosystem I and II, with the
majority of changes occurring in PSII, as well as water-splitting (oxygen-evolving complex (OEC), and
D1 and D2 proteins (Figure 15). In early stage (ES) YCS there was already significant decreases in PSII
core protein D1 (Figure 16A), Psbo and PsbQ of the OEC (Figure 16B & C). However, disruption to PSI
is most evident in more advanced YCS yellow leaf tissue. This infers there is early disruption to both
nuclear and chloroplast gene expression during YCS expression (Marquardt, 2019). In summary,
electron flow is reduced, and the system required for light conversion to photochemical energy is
disrupted. Furthermore, this is supported by chl a fluorescence data
Figure 12, Figure 13).

Sugar Research Australia Final Report - Project 2015/016
57
Figure 14 Representation of photosynthetic electron transport chain proteins embedded in thylakoid membrane of chloroplast, populated with differential gene expression (DE) data corresponding to proteins of YCS leaves compared to control leaves. Embedded gene expression data is displayed as individual transcripts (squares) with a uniform annotation (block of squares). Each annotation contains four blocks of transcripts: top left shows DE results for green YCS leaf lamina, top right shows yellow YCS leaf lamina, middle shows YCS midrib results and bottom shows YCS dewlap results. Corresponding squares in each block are directly comparable (represent the same transcript). Red represents significant upregulation in YCS tissue compared to control, and blue represents downregulation. White represents no significant change in gene expression to control tissue. All DE results are significant to false-discovered rate-corrected P-value of < 0.01.
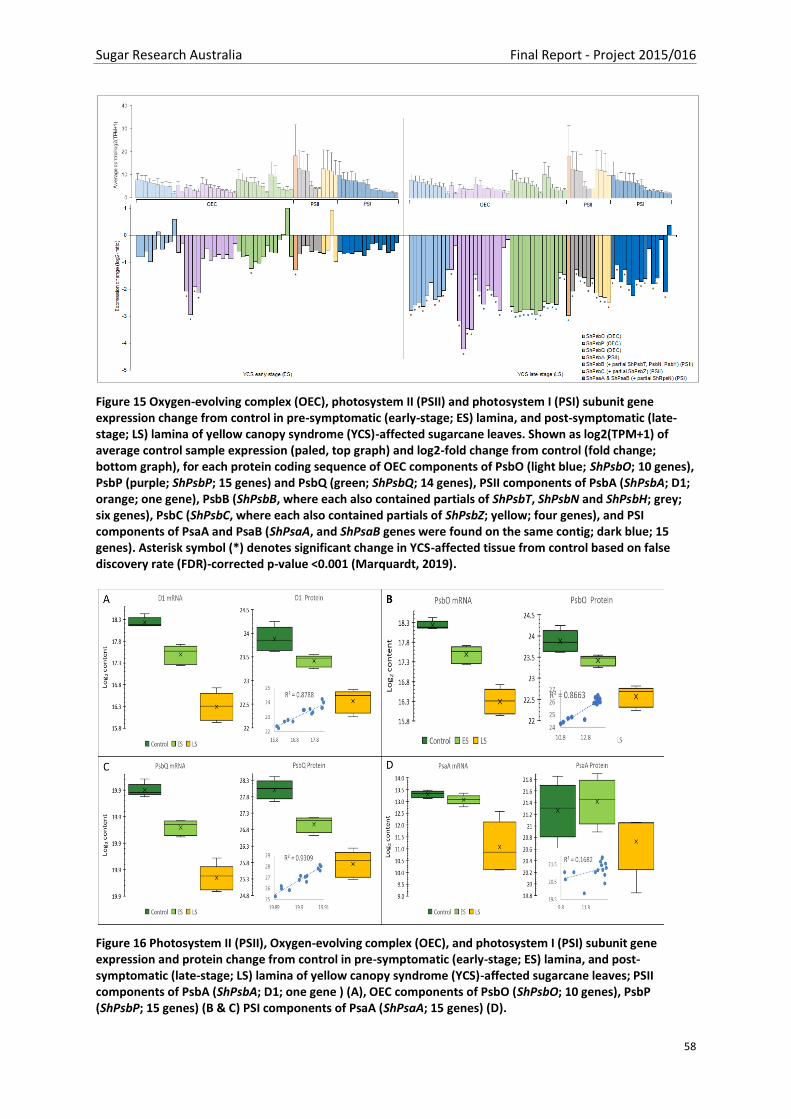
Sugar Research Australia Final Report - Project 2015/016
58
Figure 15 Oxygen-evolving complex (OEC), photosystem II (PSII) and photosystem I (PSI) subunit gene expression change from control in pre-symptomatic (early-stage; ES) lamina, and post-symptomatic (late-stage; LS) lamina of yellow canopy syndrome (YCS)-affected sugarcane leaves. Shown as log2(TPM+1) of average control sample expression (paled, top graph) and log2-fold change from control (fold change; bottom graph), for each protein coding sequence of OEC components of PsbO (light blue; ShPsbO; 10 genes), PsbP (purple; ShPsbP; 15 genes) and PsbQ (green; ShPsbQ; 14 genes), PSII components of PsbA (ShPsbA; D1; orange; one gene), PsbB (ShPsbB, where each also contained partials of ShPsbT, ShPsbN and ShPsbH; grey; six genes), PsbC (ShPsbC, where each also contained partials of ShPsbZ; yellow; four genes), and PSI components of PsaA and PsaB (ShPsaA, and ShPsaB genes were found on the same contig; dark blue; 15 genes). Asterisk symbol (*) denotes significant change in YCS-affected tissue from control based on false discovery rate (FDR)-corrected p-value <0.001 (Marquardt, 2019).
Figure 16 Photosystem II (PSII), Oxygen-evolving complex (OEC), and photosystem I (PSI) subunit gene expression and protein change from control in pre-symptomatic (early-stage; ES) lamina, and post-symptomatic (late-stage; LS) lamina of yellow canopy syndrome (YCS)-affected sugarcane leaves; PSII components of PsbA (ShPsbA; D1; one gene ) (A), OEC components of PsbO (ShPsbO; 10 genes), PsbP (ShPsbP; 15 genes) (B & C) PSI components of PsaA (ShPsaA; 15 genes) (D).

Sugar Research Australia Final Report - Project 2015/016
59
6.2.4.2. Primary Carbon fixation
In C4 plants carbon fixation occurs in the cytosol of the mesophyll cells where CO2 is trapped by
phosphoenolpyruvate carboxylase (PEPC) to form C4 acids. Gene expression analysis of not only
PEPC activity but all of the primary carbon fixation reactions of carbonic anhydrase,
phosphoenolpyruvate carboxylase, NADP malate dehydrogenase and pyruvate phosphate dikinase
shows downregulation in both early and late stage YCS (Figure 17) (Marquardt, 2019).
Figure 17 Initial carbon fixation in mesophyll cell gene expression change from control in pre-symptomatic (early-stage; ES) lamina, and post-symptomatic (late-stage; LS) lamina of yellow canopy syndrome (YCS)-affected sugarcane leaves. Shown as log2(TPM+1) of average control sample expression (paled, top graph) and log2-fold change from control (fold change; bottom graph), for each protein coding sequence of carbonic anhydrase (blue; ShCA; 27 genes), phosphoenolpyruvate carboxylase (purple; ShPPCA; 20 genes), NADP-dependent malate dehydrogenase (green; ShMDHP; 11 genes), C4-specific pyruvate phosphate dikinase (orange; ShPPDK-C4; 13 genes) and pyruvate phosphate dikinase regulatory protein (grey; ShPDRP; nine genes). Asterisk symbol (*) denotes significant change in YCS-affected tissue from control based on
false discovery rate (FDR)-corrected p-value <0.001 (Marquardt, 2019).
6.2.4.3. Decarboxylation
Carbon fixation in C4 plants is a complex process starting with PEPC as the primary enzyme of CO2
fixation and the formation of a C4 acid oxaloacetate (OAA). OAA is converted to malate or aspartate
and shuttled to the bundle sheath cell where decarboxylation takes place and CO2 is released for
refixation in the Calvin cycle. This decarboxylation may occur via one or more of three possible
pathways, i) NADP-malic enzyme (NADPME) - malate pathway, ii) NAD – aspartate pathway and iii)
PEP carboxy kinase (PEPCK)– aspartate pathway (Figure 18).It is thought that the main
decarboxylation pathway in the bundle sheath cells of sugarcane is through NADP-malic enzyme
(NADPME). In this pathway, OAA is first reduced to malate in the mesophyll chloroplasts by NADP-
malate dehydrogenase (NADPMD) before being shuttled. Whereas in the other two pathways OAA is
converted to aspartate in the cytosol of the mesophyll cell by aspartate aminotransferase before
being shuttled to the bundle sheath cell where it is once again converted back to OAA for
decarboxylation. In these two pathways decarboxylation takes place through either NAD-malic
enzyme or PEPCK as per their pathway name sake (Figure 18) (Furbank, 2011). Figure 19 shows all
three decarboxylation pathways are present in three main commercial sugarcane varieties. This is an

Sugar Research Australia Final Report - Project 2015/016
60
exciting discovery as evidence of PEPCK pathway activity had not been detected in sugarcane before.
This suggests that while NADPME is the dominant decarboxylation pathway in sugarcane there may
be flexibility to preference the other two pathway options depending on developmental or
environmental queues. Comparison of gene expression data of water stress, senescence and YCS
tissue shows that there is a preference for the PEPCK decarboxylation pathway in stressed plants
(Figure 20) (Botha 2017 Appendix 4). Further investigation into early and late stage YCS shows that in
contrast to NADPME, PEPCK was upregulated at a gene expression and protein level in both tissue
stages of expression (Figure 21) (Marquardt, 2019).
Figure 18 C4 photosynthetic mechanisms. There are two pathways for production and translocation of C4-acids to the bundle sheath. Three decarboxylation mechanisms exist, but there are doubts whether PEPCK (reaction 18) is present in the bundle sheath cells. (Botha 2017 Appendix 4)
Figure 19 Expression of the three decarboxylation mechanisms in three sugarcane varieties in three very different production environments (Botha 2017 Appendix 4)

Sugar Research Australia Final Report - Project 2015/016
61
Figure 20 Expression of mesophyll and bundle sheath carboxylation, and bundle sheath decarboxylation, genes during early (A) and late stage stress (B). Expression of NADP-ME, NAD-ME, PEPC, PEPCK and Rubisco LSU during YCS symptom development (C), water stress (D) and senescence (E). (Botha 2017 Appendix 4)

Sugar Research Australia Final Report - Project 2015/016
62
Figure 21 Decarboxylation pathways in bundle sheath cell gene expression change from control in pre-symptomatic (early-stage; ES) lamina, and post-symptomatic (late-stage; LS) lamina of yellow canopy syndrome (YCS)-affected sugarcane leaves. Shown as log2(TPM+1) of average control sample expression (paled, top graph) and log2-fold change from control (fold change; bottom graph), for each protein coding sequence of NADP-dependent malic enzyme (blue; ShNADPME; 26 genes), NAD-dependent malate dehydrogenase (purple; ShMMDH; seven genes), NAD-dependent malic enzyme (green; ShNADME; four genes) and phosphoenolpyruvate carboxykinase (orange; ShPEPCK; five genes). Asterisk symbol (*) denotes significant change in YCS-affected tissue from control based on false discovery rate (FDR)-corrected p-value <0.001. (Marquardt, 2019)
6.2.4.4. Refixation
The two components of Ribulose bisphosphate carboxylase/oxygenase (Rubisco) [the large subunit
(RbcL), encoded in the chloroplast DNA as a single-copy gene, the small subunit (RbcS) which is
nuclear-encoded with multiple copies] and the binding of Rubisco activase (RbcA)], were analysed at
a transcript abundance and protein level. Interestingly, the results do not follow the accepted model
that during leaf sucrose accumulation Rubisco is an early downregulation response of feedback
inhibition. Rather, they show it is a late-stage response in both gene expression and protein
abundance, indicating there is more disruption in bundle sheath fixation in late stage YCS tissue
(Figure 22) (Marquardt, 2019).

Sugar Research Australia Final Report - Project 2015/016
63
Figure 22 Ribulose bisphosphate carboxylase/oxygenase (Rubisco) components in bundle sheath cell gene expression change from control in pre-symptomatic (early-stage; ES) lamina, and post-symptomatic (late-stage; LS) lamina of yellow canopy syndrome (YCS)-affected sugarcane leaves. Shown as log2(TPM+1) of average control sample expression (paled, top graph) and log2-fold change from control (fold change; bottom graph), for each protein coding sequence of Rubisco large subunit (blue; ShRbcL; ten genes), Rubisco small subunit (purple; ShRbcS; 16 genes) and Rubisco activase (green; ShRbcA; 17 genes). Asterisk symbol (*) denotes significant change in YCS-affected tissue from control based on false discovery rate (FDR)-corrected
p-value <0.001 (Marquardt, 2019).
6.2.4.5. Calvin cycle
CP12 is an important protein which is linked to Calvin cycle activity through its bonds to
glyceraldehyde-3-phophate dehydrogenase (GAPDH), and phosphoribulokinase (PRK). Figure 23
shows reduced Calvin cycle activity in both early and late stage YCS expressing tissue (Marquardt,
2019).

Sugar Research Australia Final Report - Project 2015/016
64
Figure 23 Calvin cycle-related gene expression change from control in pre-symptomatic (early-stage; ES) lamina, and post-symptomatic (late-stage; LS) lamina of yellow canopy syndrome (YCS)-affected sugarcane leaves. Shown as log2(TPM+1) of average control sample expression (paled, top graph) and log2-fold change from control (fold change; bottom graph), for each protein coding sequence of CP12-1 (blue; ShCP12-1; three genes), CP12-2 (purple; ShCP12-2; three genes), glyceraldehyde-3-phosphate dehydrogenase (GAPDH) A, (green; ShGADA; seven genes, GAPDH B (orange; ShGAPB; eight genes), NADP-dependent GAPDH (grey; ShGAPN; seven genes), phosphoribulokinase (yellow; ShPRK; eight genes). Asterisk symbol (*) denotes significant change in YCS-affected tissue from control based on false discovery rate (FDR)-corrected p-value <0.001 (Marquardt, 2019).
6.2.4.6. Pigment biosynthesis & breakdown
Pigment metabolism is affected during YCS onset (Figure 24). Downregulation of chlorophyll
biosynthesis and upregulation of chlorophyll breakdown was found on the gene expression level.
This is consistent with a loss of chlorophyll observed during YCS symptoms. Carotenoids (carotenes
and xanthophylls) show a similar reduction in genes relating to biosynthesis; however, carotenoid
breakdown-associated genes are also downregulated. These results support the reduction in
chlorophyll and retention of carotenoid pigments observed during development of the YCS leaf
phenotype.
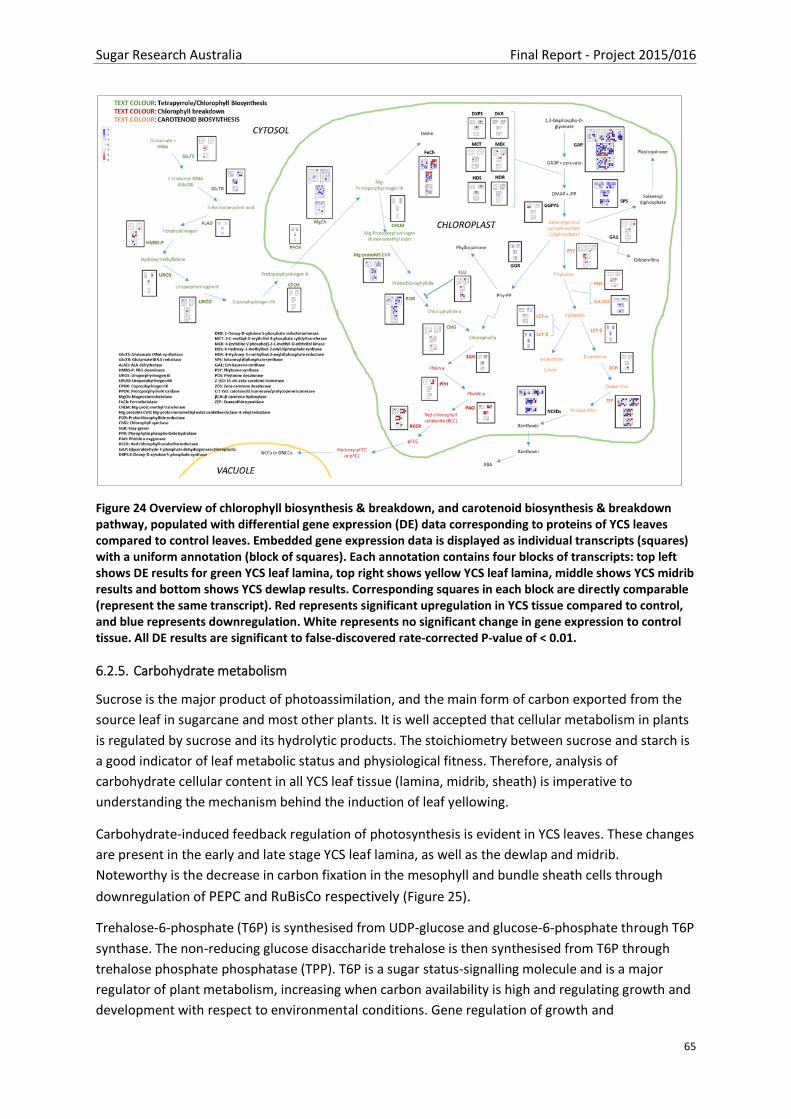
Sugar Research Australia Final Report - Project 2015/016
65
Figure 24 Overview of chlorophyll biosynthesis & breakdown, and carotenoid biosynthesis & breakdown pathway, populated with differential gene expression (DE) data corresponding to proteins of YCS leaves compared to control leaves. Embedded gene expression data is displayed as individual transcripts (squares) with a uniform annotation (block of squares). Each annotation contains four blocks of transcripts: top left shows DE results for green YCS leaf lamina, top right shows yellow YCS leaf lamina, middle shows YCS midrib results and bottom shows YCS dewlap results. Corresponding squares in each block are directly comparable (represent the same transcript). Red represents significant upregulation in YCS tissue compared to control, and blue represents downregulation. White represents no significant change in gene expression to control tissue. All DE results are significant to false-discovered rate-corrected P-value of < 0.01.
6.2.5. Carbohydrate metabolism
Sucrose is the major product of photoassimilation, and the main form of carbon exported from the
source leaf in sugarcane and most other plants. It is well accepted that cellular metabolism in plants
is regulated by sucrose and its hydrolytic products. The stoichiometry between sucrose and starch is
a good indicator of leaf metabolic status and physiological fitness. Therefore, analysis of
carbohydrate cellular content in all YCS leaf tissue (lamina, midrib, sheath) is imperative to
understanding the mechanism behind the induction of leaf yellowing.
Carbohydrate-induced feedback regulation of photosynthesis is evident in YCS leaves. These changes
are present in the early and late stage YCS leaf lamina, as well as the dewlap and midrib.
Noteworthy is the decrease in carbon fixation in the mesophyll and bundle sheath cells through
downregulation of PEPC and RuBisCo respectively (Figure 25).
Trehalose-6-phosphate (T6P) is synthesised from UDP-glucose and glucose-6-phosphate through T6P
synthase. The non-reducing glucose disaccharide trehalose is then synthesised from T6P through
trehalose phosphate phosphatase (TPP). T6P is a sugar status-signalling molecule and is a major
regulator of plant metabolism, increasing when carbon availability is high and regulating growth and
development with respect to environmental conditions. Gene regulation of growth and

Sugar Research Australia Final Report - Project 2015/016
66
development by T6P is through the protein kinase SnRK1. Together SnRK1 and T6P coordinate
metabolic regulation of growth in response to stress (Nuccio et al., 2015). T6P has been linked to
signalling the downregulation of photosynthesis during the presence of excess sucrose. Levels of T6P
change in parallel with sucrose synthesis and also influence the amount of starch accumulation and
degradation during the day and night, respectively. Therefore, this signalling molecule is very
important in maintaining balance between sucrose and starch levels to meet the plant’s sucrose
demands during the normal circadian rhythm (Gupta and Kaur, 2005; Lunn et al., 2014; Nuccio et al.,
2015; Figueroa and Lunn, 2016). Both starch synthase (starch synthesis) and breakdown (AGPase)
genes are upregulated in YCS plants This indicates starch turnover is occurring in the leaf lamina,
midrib, and dewlap. Furthermore, T6P is a precursor to trehalose synthesis through TPP and TPS
levels are upregulated in all three YCS leaf tissues (Figure 25). Trehalose metabolism strongly
correlates with sugar and anthocyanin levels in plants (Lunn et al., 2014). Figure 26 shows increased
levels of trehalose in symptomatic YCS leaves across three varieties and regions. Anthocyanin
synthesis is initiated by light and high sucrose content in leaves which is synonymous with YCS
symptom development and expression.

Sugar Research Australia Final Report - Project 2015/016
67
Figure 25 Differential gene expression (DE) data of genes associated with carbohydrate metabolism, feedback regulation of photosynthesis and sucrose transport in YCS leaves compared to control leaves. DE data is displayed as individual transcripts (squares) with a uniform annotation (block of squares). Each gene row shows four blocks of transcripts: DE results for YCS dewlap, midrib, and green and yellow leaf lamina. Corresponding squares in each block are directly comparable (represent the same transcript). Red represents significant upregulation in YCS tissue compared to control, and blue represents downregulation. White represents no significant change in gene expression to control tissue. All DE results are significant to false-discovered rate-corrected P-value of < 0.01.

Sugar Research Australia Final Report - Project 2015/016
68
Figure 26 Changes in the levels of sugars in YCS symptomatic sugarcane plants (Herbert - Q200A, Mackay - Q208A, Burdekin - KQ228A). Data is normalised against the control leaf four. All these values have a t-test value below P< 0.05 (Bonferroni-corrected P value). (Botha et al., 2015)
Analysis of leaf carbohydrate content across three commercial genotypes (Q200A, Q208A, KQ228A)
and three geographical regions showed seven distinct sugars and sugar phosphates to be
significantly higher in YCS leaves than asymptomatic controls (Figure 26). Increased levels of xylose
may be attributed to cell wall degradation in YCS-induced senescing tissue. Gentiobiose is a rare
disaccharide that has been shown to change concentrations in parallel with invertase in the
herbaceous perennial Gentiana and has been implicated as a signalling molecule. Research suggests
that gentiobiose is hydrolysed from gentianose and modulated by invertase (Takahashi et al., 2014).
It is tempting to speculate that high levels of gentiobiose in YCS leaves could be linked to neutral
invertase activity and sucrose hydrolysis to prevent high levels of sucrose accumulation in the
cytosol (Figure 25). Indeed, significantly higher levels of the reducing sugars glucose and fructose are
evident in YCS leaf tissue (Figure 26). Studies have linked high maltose concentrations to increased
plant stress and high transitory starch breakdown (Lu and Sharkey, 2006). Gene expression analysis
shows transcript abundance of β-amylase to be significantly higher in both water stressed and YCS
symptomatic plants than controls (Figure 27).
Figure 27 represents the changes in gene expression of the main enzymes surrounding sucrose and
starch synthesis and degradation. Sucrose synthesis to the right of the chloroplast membrane shows
that gene expression is mostly upregulated, but on examination of the transcript abundance for
Sucrose phosphate synthase (SPS) and UDP glucose pyrophosphorylase there is no significant
difference between controls and YCS. Since we know there is sucrose accumulation in YCS leaves this
would suggest that sucrose synthesis is mostly under metabolic control. The accumulation of sucrose
in the cytosol most likely downregulates the triose phosphate transporter through feedback
regulation which in turn results in a retention of carbon in the chloroplast. The result of this is clearly
seen with an increase in gene expression for starch synthesis and breakdown through an
upregulation of ADP GlcPPase and alpha & beta amylase, respectively. Therefore, starch synthesis
and breakdown are regulated by gene expression during YCS symptom development.

Sugar Research Australia Final Report - Project 2015/016
69
Figure 27 Regulation of sucrose and starch levels in asymptomatic control and early and late stages of YCS,
water stress and senescent leaf tissue.
It has been demonstrated that sucrose and its hydrolytic products (glucose and fructose) are heavily
involved in signalling and control of cellular metabolism through the SNF1- related protein family
(Gupta and Kaur, 2005). As high sucrose and YCS development are strongly correlated it is therefore
important to determine any relationship with the two reducing sugars. All three sugars are
significantly higher in YCS asymptomatic Leaf 3 and symptomatic Leaf 4 than controls (Figure 28A-C).
Quantities of both reducing sugars are of equal proportions within controls and YCS samples.
However, hydrolysis ratios in YCS symptomatic Leaf 4 are approximately three-fold higher than in
asymptomatic Leaf 3. This suggests that to curtail high sucrose accumulation, breakdown of sucrose
has been upregulated. This is supported by an upregulation in cytosolic neutral invertase (Figure 25).
Another insight to the status of leaf carbohydrate metabolism is through starch levels. Excess
sucrose is usually converted to starch and stored in the bundle sheath chloroplasts. This is a useful
mechanism that the plant deploys in preparation for energy needs during the night period or in
times of stress. Hence, quantities stored are highly dependent on daylength and environmental
conditions (Weise et al., 2011). Therefore, the true status of starch accumulation can only be
ascertained if sampling is conducted at first light. YCS leaf samples analysed under such conditions
show levels to be much higher than their control leaf counterpart (Figure 28D). The disruption to
cellular carbohydrate metabolism is also evident in asymptomatic Leaf 3 even before the onset of
visual yellowing. This correlates with the disruption to the photosystems of these leaves caused by
high sucrose accumulation (see section 6.2.3 of this report
Figure 12).

Sugar Research Australia Final Report - Project 2015/016
70
Figure 28 Changes in the levels of sucrose, glucose, fructose, and starch in control, YCS asymptomatic Leaf 3 and symptomatic Leaf 4 in genotype Q240A .
6.2.6. Carbon partitioning
The disruption to the diurnal rhythm evident by high sucrose and starch levels recorded in the
lamina of YCS plants at first light has serious repercussions for the health of the leaf if accumulation
is not maintained below a tolerable upper threshold. To ascertain whether elevated sucrose and
starch content was confined to the lamina, analysis of other types of leaf tissue was conducted.
Interestingly we not only discovered high levels of both sucrose and starch (insoluble α-glucan) in
midrib, dewlap and sheath but also extremely high levels of soluble α-glucan (Figure 29). This is an
exciting discovery that has not been reported in sugarcane leaf anywhere in the world literature.

Sugar Research Australia Final Report - Project 2015/016
71
Figure 29 Q240A Lamina sections tip to base (A-C), Midrib sections tip to base (D-F) and Sheath (G-I); sucrose, soluble and insoluble α-glucan content in Control, YCS asymptomatic Leaf 3 and symptomatic Leaf 4. Samples taken in the morning soon after first light.
Glucans can be classified as polysaccharides composed of glucose units. Starch, an insoluble form of
α-glucan is a mixture of water insoluble amylose (10-30%) and water-soluble amylopectin (70-90%).
Amylose is linear with α-1,4-glycosidic linkages which form a coil structure that can accommodate an

Sugar Research Australia Final Report - Project 2015/016
72
iodine molecule. This forms an amylose-iodine complex that gives a blue-violet colour. Amylopectin
has both α-1,4 and α-1,6 linkages. The α-1,6 bonds are responsible for branching of this molecule
and disrupts the helical shape. Due to this a less intense reddish-brown colour is produced when
iodine is added (Smith, 2007; Geigenberger, 2011). This is clearly visible in cross-section staining of
the midrib from YCS symptomatic tissue between the vascular and parenchymatous tissue (Figure
30).
Figure 30 Control and YCS symptomatic leaf midrib stained with 1% iodine solution.
Clearly, excess carbon in the YCS leaf is redirected to the soluble α-glucan and starch pools to
prevent further build-up of sucrose. Figure 29 shows the bulk of carbon is stored in the soluble pool
as C4 plants are not anatomically or physiologically capable of storing and synthesising large
quantities of starch like C3 plants. In C4 plants this is limited by the quantity of bundle sheath cells in
which the chloroplasts synthesise transitory starch during the day. Carbon partitioning in different
leaf tissue components (lamina, midrib and sheath) show that sucrose and soluble α-glucans are
highest in the sheath and base of the midrib and lamina (Figure 29). These two metabolites mirror
each other in all three tissue types (Figure 31A-C). However, insoluble α-glucan (starch) levels are
closely aligned to tissue anatomy with highest levels measured where bundle sheath chloroplasts
are more abundant. Starch content is highest in the lower half of the lamina, followed by uniform
distribution throughout the midrib and lowest levels recorded in the sheath (Figure 29C, F & I).
Interestingly, asymptomatic (control) Leaf 4 shows a similar pattern of sucrose and soluble α-glucan
accumulation to asymptomatic Leaf 3 on the YCS culm, in both the lamina and midrib (Figure 29A, B,
D, & E). This indicates that the crop is in a constant state of leaf carbohydrate flux. Therefore, the
plant’s physiological fitness will determine its tolerance threshold to metabolic perturbance and
whether it advances to YCS expression.
In C4 plants the starch-sucrose ratio never exceeds 1.0 and averages at approximately 0.5 (Kingston-
Smith et al., 1998). Unlike maize, sugarcane lacks the physiological ability to store starch in the
mesophyll cells and ratios vary between 0.1- 0.15 (Figure 31D-F). Comparable ratios are maintained
between sucrose, soluble α-glucan, and insoluble α-glucan in all three tissues for both asymptomatic
Leaf 3 and YCS symptomatic Leaf 4. This shows that as metabolic disruption develops to the point of
leaf yellowing a carbon balance between these three metabolites is maintained. Hence, the onset of
yellowing is the true start of YCS. Maintenance of this metabolic balance is upheld (even when a
source sink imbalance exists) until cell death and senescence occurs (Figure 32). Completely
senescent or dead leaves from the Burdekin 2018/19 insecticide trial (treated with bifenthrin –
project 2014/049) show that YCS symptomatic untreated controls (UTC) still contain significantly
higher levels of all three metabolites in the lamina, midrib, and sheath than the asymptomatic

Sugar Research Australia Final Report - Project 2015/016
73
leaves. The lamina and midribs retain the highest levels of metabolites after leaf death except for
sucrose which has almost been completely degraded, repartitioned or translocated from the lamina
(Figure 32).
Figure 31 Q240A Leaf 3 and 4, Sucrose: Soluble (A-C) and Insoluble α-Glucan (D-F) ratios in lamina, midrib and sheath
Figure 32 KQ228A Insecticide treated and Untreated Controls (UTC) senescent leaf Sucrose, Soluble & Insoluble α-Glucan content.
To curb sucrose synthesis transitioning from a healthful to a harmful state, a combination of
signalling and changes to metabolism is induced in the leaf to maintain homeostasis (source sink
balance). Feedback inhibition of photosynthesis is initiated together with carbon redirection and
partitioning to other pools (Braun et al., 2006; McCormick et al., 2008). Noteworthy changes to
carbon partitioning are to the shikimate and the phenylpropenoid pathways which are associated
with amino acid synthesis and protection against oxidative stress, respectively. Figure 33 shows
metabolism divided into seven clusters (Figure 33a–g) representing the major changes to carbon
partitioning. In addition to the expected changes to carbohydrate metabolism (Figure 33a) there is
significant upregulation of the phenylpropanoid (Figure 33e) and shikimate (Figure 33c) pathways
(Marquardt et al., 2017). It is well known that the phenylpropanoid pathway is associated with
protection against oxidative stress (Osmond et al., 2000) . Important to note is that metabolites in
this pathway serve as precursors in the yellow and orange carotenoid pigment biosynthesis (Figure

Sugar Research Australia Final Report - Project 2015/016
74
24) (Gray et al., 2012). The upregulation of amino acid synthesis in the shikimate pathway indicates
YCS has a significant impact on protein hydrolysis.
Figure 33 Overview of carbon partitioning pathways overlaid with metabolite data. Coloured circles display change in metabolite level compared to control. Results normalized where red indicates upregulation, blue indicates downregulation, on a scale between 1 and -1 (Marquardt et al., 2017)
While carbon repartitioning to other pools is useful in mitigating further accumulation of sucrose,
the bulk of the carbon is redirected to the soluble and insoluble α-glucan pools in the lamina
(source) and midrib (mostly sink-like) tissue. By the time leaf sucrose accumulation exceeds the
tolerable upper threshold (approx. 200 µmol/g DM), the lack of coenzyme and level of electron
transport disruption is sufficient to cause adequate free radical production to initiate photooxidation
and leaf yellowing (Figure 34). Therefore, it is not sucrose per se that directly causes the yellowing,
but rather the disruptions in energy flow which results in increased photooxidation. Hence the areas
of the leaf where maximum light capture occur are particularly vulnerable to photooxidation and
yellowing. However, sucrose is the critical metabolite triggering events which lead to irreversible
leaf yellowing. If sucrose reaches intermediate levels of accumulation or when the supply demand
imbalance passes a healthful state of stasis, carbon will likely be redirected to other main
carbohydrate pools in the following order:
1. Soluble α-glucan – levels higher than 200 µmolg-1 DM measured in asymptomatic leaves
2. Insoluble α-glucan (starch) – once stored as granules, this insoluble metabolite will represent
metabolically inactive reduced carbon
3. Sucrose – tolerable threshold breached after which photooxidation and leaf yellowing occur

Sugar Research Australia Final Report - Project 2015/016
75
Figure 34 Carbon partitioning and source sink model centres around sucrose levels of accumulation
It is evident from the data presented in section 6.2 of this report that sucrose accumulation in the
lamina above a tolerable upper threshold (approx. 200 µmol/g DM) is detrimental to leaf health. In
order to prevent further sucrose accumulation, excess carbon is repartitioned to other metabolic
pools. The bulk of the carbon is redirected to soluble α-glucan and starch. As alternative carbon
pools fill toward capacity, sucrose levels will continue to rise and reduced photosynthetic leaf
metabolism will be induced through feedback inhibition signalling (Marquardt et al., 2016;
Marquardt, 2019). Downregulation of the photosynthetic rate reduces stomatal conductance, CO2
intake, transpiration, and major components of photosystem II (PSII). Reduced water splitting and
CO2 supply to the Calvin-Benson cycle (light-independent reactions) creates an imbalance between
production and metabolic consumption of photosynthetic ATP and NADPH. This causes a disruption
to cellular redox homeostasis leading to a decrease in available oxidised coenzyme NADP+. Such a
limitation causes i) a reduction in available electrons for carbon fixation to carbohydrates, and ii)
reduced electron flow through photosystem I (PSI). This over-reduction of the photosynthetic
electron transport (PET) chain increases available energy for the production of reactive oxygen
species (ROS) (Schöttler and Tóth, 2014). It is worth noting that this is very common in plants under
environmental stress, particularly where there is high light intensity (Braun et al., 2006). The
increased production of free radicals together with an increase in internal leaf temperature due to
reduced transpiration causes photo-oxidation of the photosynthetic apparatus (Ahmad, 2014). This
initiates events leading to the destruction of cell membranes, chlorophyll, loss of cellular function
and leaf yellowing.
6.3. Is leaf sucrose accumulation primarily driven by changes to source or sink?
Determining that sucrose, soluble α-glucan, and starch are present in all leaf tissue, and identifying
where content is lowest and highest, gives us a significant insight into the internal distribution and
partitioning of excess carbon in the YCS leaf. It also shows whether there is more or less
accumulation of a particular metabolite at a specific location, leaf section or leaf tissue. This is
invaluable information to help understand the possible cause of sucrose accumulation. Is it a
physical blockage in the phloem within either the lamina, midrib or sheath or does it sit outside the
leaf in the culm tissue? Do the varying levels of sucrose accumulation correlate with the pattern of
chlorosis in the leaf and the kinetics of symptom development? This knowledge will be of great

Sugar Research Australia Final Report - Project 2015/016
76
benefit in ascertaining whether there is any likely disruption to phloem loading and translocation
from the site of photoassimilation, or whether the cause of leaf sucrose accumulation is some other
physiological disruption.
Sucrose accumulation in the source leaf may be caused by:
A) Increased synthesis exceeding export rates of sucrose to the sink
B) Disruption to phloem loading
C) Compromised phloem transport
i) physical blockage
ii) reduced sink strength
• diminished sink size (internode volume)
• metabolic disruption to carbon demand (feast or famine)
In this section of the report we will address these issues to determine whether leaf sucrose
accumulation is primarily driven by changes to source or sink tissue.
6.3.1. Phloem loading, transport, and carbon turnover
6.3.1.1. Sucrose synthesis and active phloem loading
The first known cause of stress in the leaf associated with YCS onset is sucrose accumulation
(Marquardt et al., 2016). This accumulation causes substantial downstream effects on leaf
metabolism (Marquardt et al., 2017). The ‘upstream’ metabolic processes of sucrose accumulation in
YCS leaves was investigated using omics data.
For sucrose to accumulate in the leaf, there must be an imbalance between how much sucrose is
synthesised and how much is exported. Either sucrose synthesis must be increased while export rate
is maintained/decreased, or export rate decreases while synthesis rate is maintained/increased. To
investigate whether an increase in sucrose synthesis is responsible for leaf sucrose accumulation, a
differential gene expression analysis for key enzymes of sucrose synthesis pathways in bundle
sheath cells was conducted. This is expressed as a series of heat maps comparing control tissue with
early (green tissue) and late stage (yellow tissue) YCS lamina (Figure 35). The regulation of enzymes
after triose phosphate production in the chloroplast is of particular interest as this provides a clear
insight to any metabolic regulatory preference towards the synthesis of either sucrose or starch. The
level of expression within early stage green YCS tissue shows no increase in sucrose synthesis driving
the continued sucrose accumulation past the tolerable upper threshold measured in YCS
symptomatic leaves. Similarly, there is no increase in starch synthesis. Therefore, an increase in
sucrose synthesis enzymes and related transcripts was not consistent in the data in YCS-affected
leaves.

Sugar Research Australia Final Report - Project 2015/016
77
Figure 35 Differential gene expression (DE) data of genes associated with sucrose and starch synthesis in YCS, senescent and water stress leaves compared to control leaves. DE data is displayed as individual transcripts (squares) with a uniform annotation (block of squares). DE results for early and late stage YCS, senescent and water stress lamina. Corresponding squares in each block are directly comparable (represent the same transcript). Red represents significant upregulation in YCS tissue compared to control, and blue represents downregulation. White represents no significant change in gene expression to control tissue. All DE results are significant to false-discovered rate-corrected P-value of < 0.01. (Marquardt 2017 Appendix 3).
Protein abundance and gene expression were analysed to establish whether down regulation of key
enzymes and transporters might be responsible for decreased sucrose export from the leaf
(Marquardt et al., 2019). The way in which sucrose moves from where it is made in leaf cells involves
crossing membranes facilitated by transport proteins. These are encoded by known genes, which
include sucrose transporters (SUTs and SWEETs), H+-ATPases and H+-Pyrophosphatases (H+-PPases).
For sucrose to move from the source photosynthetic cells to the phloem requires either symplastic
or apoplastic loading. Symplastic loading occurs by diffusion from high to low sucrose concentration,
whereas apoplastic loading requires active transport of sucrose from the apoplast into the phloem.
In active loading, SWEET proteins facilitate the diffusion of sucrose from the symplast (where it is
synthesised), into the apoplastic space (where it is loaded into the companion cells of phloem sieve
elements) (Chen et al., 2010). In this process ATP is used to generate a H+ gradient across the cell
membrane. Together with symporters (SUTs), sugars are transported from the apoplast into the
phloem (Figure 36) (Zhang et al., 2016). Reduced abundance (and activity) of SWEET proteins could
slow sucrose movement out of the leaf. The genes encoding for sucrose-transporting SWEET
proteins (Figure 37g, h & i) did not show downregulation before or after YCS-symptoms were visible.
Two SWEET proteins showed an upregulation during YCS symptoms (Marquardt et al., 2019) (Figure
37h & i) .

Sugar Research Australia Final Report - Project 2015/016
78
Figure 36 Sugarcane active phloem loading: sucrose transporters (SUTs and SWEETs), H+-ATPases and H+-Pyrophosphatases (H+-PPases) (Marquardt 2017 Appendix 3).
Figure 37 Transcript abundance of expressed SWEET transcripts in control, early-stage (ES)- and late-stage (LS)-yellow canopy syndrome (YCS)-affected Q240A sugarcane leaves. Data displayed as Log
2(TPM+1) value of reads mapping to reference transcript. (a) SWEET1a_1, (b)
SWEET1a_2, (c) SWEET2a, (d) SWEET_2b, (e) SWEET3, (f) SWEET4, (g) SWEET13_1, (h) SWEET13_2, (i) SWEET14. Letters above (or below) sample type within graphs represent significant difference-groupings between sample types (differential expression analysis result false-discovery rate (FDR)-corrected P-value<0.05; fold-change>1.5). If letters not displayed within graph - no significant difference between sample types was present.
A downregulation in SUT, H+-ATPase or H+-PPase proteins could lead to decreased sucrose leaf
export. SUTs actively transport sucrose from the apoplastic space into the companion cells of the
phloem (Figure 36). This process requires a proton gradient, which is generated by H+-ATPase. ATP
must be available for this to occur, which comes from the breakdown of a small fraction of sucrose
in the companion cells. The energy for this breakdown is provided by H+-PPases.
Of the three groups of sucrose-H+ symporter (SUT) genes ShSUT1 had the most transcript abundance
across the three leaf tissues and none showed differential expression in YCS (Figure 38). SUT1 is

Sugar Research Australia Final Report - Project 2015/016
79
implicated in phloem loading/reloading in maize, sugarcane and other plant species (Slewinski et al.,
2009; Glassop et al., 2017). The SUT1 transcript was upregulated in YCS-affected leaves, both before
and after visual yellowing.
Figure 38 Transcript abundance of expressed SUT transcripts in control, early-stage (ES)- and late-stage (LS)-yellow canopy syndrome (YCS)-affected Q240A sugarcane leaves. Data displayed as Log2(TPM+1) value of reads mapping to reference transcript. (a) SUT1, (b) SUT2_1, (c) SUT2_2, (d) SUT2_3, (e) SUT2_4, (f) SUT2_5, (g) SUT4. Letters above sample type within graphs represent significant difference-groupings between sample types (differential expression analysis result false-discovery rate (FDR)-corrected P-value<0.05; fold-change>1.5). If letters not displayed within graph - no significant difference between sample types was present.
Investigation into the functionality of the H+-pyrophosphatases (H+-PPases) showed significant
variation with both up and down regulation in YCS tissue (Figure 39). However, H+-ATPase gene
expression showed greatest differentiation in late stage YCS tissue (Figure 40) (Marquardt, 2019;
Marquardt et al., 2019). In the data, both H+-ATPases and H+-PPases had multiple transcripts with
the annotation, where currently available information in the literature did not allow the discerning
of which transcript(s) or protein(s) are involved in the phloem loading process (both are involved in
other cell membrane processes). However, wherever a transcript showed downregulation in YCS-
affected leaves – and hence could pinpoint a cause of reduced sucrose phloem loading – the
corresponding protein showed either no abundance change, or an increase in abundance.
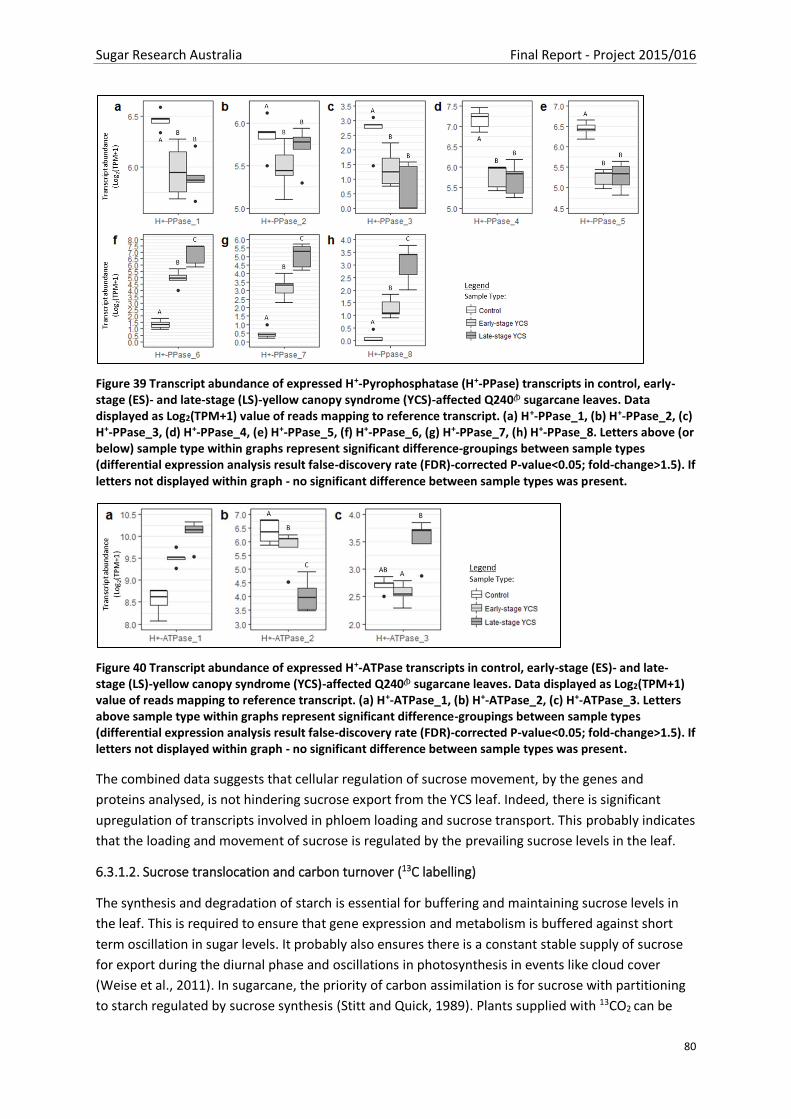
Sugar Research Australia Final Report - Project 2015/016
80
Figure 39 Transcript abundance of expressed H+-Pyrophosphatase (H+-PPase) transcripts in control, early-stage (ES)- and late-stage (LS)-yellow canopy syndrome (YCS)-affected Q240A sugarcane leaves. Data displayed as Log2(TPM+1) value of reads mapping to reference transcript. (a) H+-PPase_1, (b) H+-PPase_2, (c) H+-PPase_3, (d) H+-PPase_4, (e) H+-PPase_5, (f) H+-PPase_6, (g) H+-PPase_7, (h) H+-PPase_8. Letters above (or below) sample type within graphs represent significant difference-groupings between sample types (differential expression analysis result false-discovery rate (FDR)-corrected P-value<0.05; fold-change>1.5). If letters not displayed within graph - no significant difference between sample types was present.
Figure 40 Transcript abundance of expressed H+-ATPase transcripts in control, early-stage (ES)- and late-stage (LS)-yellow canopy syndrome (YCS)-affected Q240A sugarcane leaves. Data displayed as Log2(TPM+1) value of reads mapping to reference transcript. (a) H+-ATPase_1, (b) H+-ATPase_2, (c) H+-ATPase_3. Letters above sample type within graphs represent significant difference-groupings between sample types (differential expression analysis result false-discovery rate (FDR)-corrected P-value<0.05; fold-change>1.5). If letters not displayed within graph - no significant difference between sample types was present.
The combined data suggests that cellular regulation of sucrose movement, by the genes and
proteins analysed, is not hindering sucrose export from the YCS leaf. Indeed, there is significant
upregulation of transcripts involved in phloem loading and sucrose transport. This probably indicates
that the loading and movement of sucrose is regulated by the prevailing sucrose levels in the leaf.
6.3.1.2. Sucrose translocation and carbon turnover (13C labelling)
The synthesis and degradation of starch is essential for buffering and maintaining sucrose levels in
the leaf. This is required to ensure that gene expression and metabolism is buffered against short
term oscillation in sugar levels. It probably also ensures there is a constant stable supply of sucrose
for export during the diurnal phase and oscillations in photosynthesis in events like cloud cover
(Weise et al., 2011). In sugarcane, the priority of carbon assimilation is for sucrose with partitioning
to starch regulated by sucrose synthesis (Stitt and Quick, 1989). Plants supplied with 13CO2 can be

Sugar Research Australia Final Report - Project 2015/016
81
sampled at different time points to investigate carbon partitioning of photosynthates and carbon
turnover (Sasaki et al., 2007; Uehara et al., 2009). Our research in this area was critical for us to
understand the observed accumulation of sucrose and starch and carbon turnover within YCS
asymptomatic and symptomatic leaves. A 13CO2 pulse chase experiment in field grown sugarcane
was conducted from early morning to the following afternoon (30-hour period). Through this we
were able to measure the extent of disruption to carbon partitioning between starch and sucrose
and the rate of carbon turnover. 13C enrichment analysis across three sampling time points (AM &
PM1 day 1, PM2 day 2) gave us insight into how phloem loading, and transport is linked to YCS and
the effect it has on reduced carbon between the source leaves and the sink. In this section of the
report we show how 13C labelling enabled a better understanding of sucrose and starch
accumulation, phloem loading, translocation, and carbon turnover within YCS source leaves.
The turnover of sucrose and starch in YCS leaves determines photosynthate partitioning in the leaf
and other parts of the plant. The 13C study revealed how much labelled fixed carbon was partitioned
to sucrose and starch and how much remained in the leaf section after a period of 31 hours. We
used this data to calculate turnover. The amount of heavy carbon in these two cellular components
provides an insight to the diurnal changes that occur over the pulse chase period and disruption to
diurnal metabolism in YCS plants. Table 5 shows the diurnal rate of change based on 13C enrichment.
YCS symptomatic Leaf 4 sucrose turnover is 1.5-fold lower and 2.5-fold higher than controls during
the day and night period, respectively. Starch turnover is 5-fold lower in YCS than controls during the
day period and 17-fold lower at night.
Table 5 13C sucrose and starch turnover rates during the light and dark periods YCS and control Leaf 4
13C labelling shows that both metabolic pools fluctuate by varying amounts over the chase period.
The percentage change between the sucrose pools is similar for control and YCS whereas the change
in starch is much higher in controls (Table 5). More fixed carbon is allocated to starch in YCS leaf
tissue (Figure 41) as this is most likely linked to the high sucrose levels effecting a preferential
allocation of triose-phosphate (Triose-P) to starch (Figure 42). Sucrose and starch synthesis pathways
are both dependent on the triose-phosphate precursor exported from the chloroplasts (Du et al.,
2000; Weise et al., 2011) . During the 3-hour 13C pulse there is a preference to partition more carbon
as starch within YCS leaves than in the controls (Figure 41)

Sugar Research Australia Final Report - Project 2015/016
82
Figure 41 13C starch synthesis during pulse period
Figure 42 Carbon partitioning between sucrose and starch in the bundle sheath cell
There is approximately 2.5 times more 13C sucrose in YCS leaf 3 & 4 than in control counterparts
(Figure 43). Asymptomatic YCS leaf 3 (L3) has already started to accumulate sucrose and starch well
before the onset of yellowing (Figure 43 & Figure 45) In maize, studies also saw accumulation of
carbohydrates well before any visible yellowing. This suggests that yellowing is not the cause of
carbohydrate hyperaccumulation but rather a secondary consequence (Braun et al., 2006). Yellowing
in leaf 4 (L4) was clearly visible at the time of sampling and contains the highest sucrose content. YCS
L3 & L4 lamina show increased accumulation of sucrose immediately after 13C pulse as they contain
approximately 60% more 13C sucrose than the controls (Figure 44A). By end of chase YCS L3 & L4
show they have accumulated 40% & 60% more 13C sucrose respectively than controls (Figure 44B).
However, both the control and YCS leaf export (or convert to other metabolic products)
approximately 70 - 85% of their respective 13C sucrose pools by the end of the chase period (Figure
43). This is noteworthy considering the magnitude of the YCS 13C sucrose pool which has been drawn
down. The reduction in the 13C sucrose pool in YCS leaves by the end of the chase, could be due to
transport of sucrose out of the lamina, or the conversion to other metabolic products (Figure 44B).

Sugar Research Australia Final Report - Project 2015/016
83
Figure 43 13C sucrose synthesis and proportional change across the pulse chase period; AM1 (3 hours), PM1 (8 hours) and PM2 (31 hours) post labelling, control and YCS Leaf 3 and 4.
Figure 44 13C sucrose content L3 & 4 at the end of the pulse A) and chase end B) periods
Studies by Du (2000), observed synthesis and degradation of starch in sync with the diurnal rhythm.
This mechanism is essential for a balanced control of sucrose synthesis and export, while at the
same time ensuring a continuous supply of carbon throughout the 24-hour period (Weise et al.,
2011). Figure 45 shows that Control L3 has not synthesised any starch by the end of the 13C pulse.
However, by the afternoon it has partitioned carbon as starch in preparation for the night period
and by chase end all starch has been turned over. This oscillation is typical of the diurnal rhythm
exhibited in a healthy plant. Control L4 which is more mature and displays a higher photosynthetic
rate also displays a similar day night pattern. In contrast, asymptomatic YCS L3 had already begun to
synthesise starch by the end of the 13C pulse (similar quantity to control L4) and by the end of the
chase it has turned over 81% of its starch. Symptomatic L4 on the other hand, had synthesised 10-
fold more starch than its control counterpart by pulse end and only turned over 40% of its starch by
chase end (Figure 45). It is worth noting at this point that the YCS leaf had a significantly higher total

Sugar Research Australia Final Report - Project 2015/016
84
sucrose pool (Figure 46) at the point of 13C labelling (pulse) and this may have significantly influenced
the partitioning of carbon towards starch.
Figure 45 13C starch synthesis and proportional change across the pulse-chase period; AM1 (3 hours), PM1 (8 hours) and PM2 (31 hours) post labelling, control and YCS Leaf 3 and 4.
Figure 46 Sucrose total pool across the pulse-chase period. Tukey HSD All-Pairwise Comparisons (p<0.05)
In sugarcane, transitory starch is synthesised in the bundle sheath chloroplasts during the day to
provide a carbon store for use during the night in the absence of photosynthesis. Starch synthesis
also enables a higher rate of photosynthesis to be maintained during periods of high light and CO2
when carbon assimilation exceeds the rate of sucrose synthesis and export. On the other hand,
sucrose synthesis is favoured over starch when the photosynthesis rate is low (Baker and Braun,
2008; McCormick et al., 2008; Weise et al., 2011). Therefore, starch synthesis is an important
function that enables a peak photosynthetic rate to be maintained by assimilating carbon overflow
when photosynthesis is high, and also provides a means for carbon storage when photosynthesis is
low (Baker and Braun, 2008; Weise et al., 2011), However, Figure 45 also shows there is a preference
for starch synthesis in YCS leaves which have pre-existing elevated levels of sucrose (Figure 46). This

Sugar Research Australia Final Report - Project 2015/016
85
suggests that starch synthesis may have a third role, functioning as a safety net mechanism for
carbon partitioning over sucrose when the internal environment of the leaf is not conducive for
further sucrose synthesis. This is an extremely interesting finding, as unlike other crops the priority
of carbon assimilation in sugarcane is for sucrose with partitioning to starch regulated by sucrose
synthesis, not vice versa (Stitt and Quick, 1989).
The collective data of how YCS affects sucrose and starch metabolism strongly suggest that sucrose
accumulation in the leaf (source) is likely the result of an overflow problem where carbon fixation
and loading of sucrose in the source phloem exceeds the sink capacity. Such a system would result in
sucrose accumulation throughout the phloem and eventually in the primary cells of synthesis
(mesophyll and bundle sheath). Sucrose build up in the phloem and sites of production would also
result in accumulation of sucrose in the apoplastic space (leakage from the phloem and facilitated
diffusion out of the mesophyll and bundle sheath cells). Once sucrose levels exceed a threshold in
the mesophyll and bundle sheath cells, photosynthesis and chlorophyll synthesis is inhibited
resulting in yellowing. This mechanism seems to be universally present in the Poaceae (Braun et al.,
2006; Baker and Braun, 2008).
Analysis of the ‘total carbon pool’ in this 13C field study shows there is a significant difference in
sucrose and starch content in the leaf sheath between control and YCS in both the morning and
afternoon (Figure 47). This demonstrates that photosynthesis is still active in the YCS symptomatic
leaves and translocation is occurring. However, within both control and YCS sheath there is no
significant difference in sucrose or starch content between morning and afternoon (Figure 47). This
result is not unexpected as the leaf sheath lacks some of the more specialised cells present in the
lamina and no stomata to allow for gas exchange and carbon fixation. The sheath’s main role is one
of structural support and as a conduit to facilitate translocation of photosynthates between the
lamina and the culm (Rae et al., 2014).
Figure 47 Q240A Leaf 4 sheath sucrose and starch content, AM & PM
As expected for a healthy, green control leaf partitioning carbon in sync with the diurnal rhythm, the
lamina has significantly higher sucrose and starch levels in the afternoon than the morning.
However, YCS lamina exhibits a complete disruption in this mechanism as there is no significant
difference to both sucrose and starch content throughout the day (Figure 48). This pattern of
sucrose and starch accumulation is evident of a carbon partitioning imbalance resultant of impeded
translocation of sucrose out of the leaf.

Sugar Research Australia Final Report - Project 2015/016
86
Figure 48 Q240A Leaf 4 lamina sucrose and starch content, AM & PM
It is important to note that the cellular composition of both the lamina and sheath is proportionally
different. When studying the structure of the sheath it is apparent that this tissue contains large
pads of sclerenchymatous fibre and a larger proportion of vascular bundles per unit area than that of
the lamina (Rae et al., 2014). It would therefore be inappropriate to draw conclusions by comparing
sucrose and starch content on a one to one basis between sheath and lamina as a quantity per unit
mass fresh or dry mass. Hence, investigation of the sheath to lamina ratio for both sucrose and
starch is a more apposite method to gain an understanding of where these carbohydrates
accumulate in the leaf. Figure 49 shows that YCS symptomatic leaf 4 has significantly higher sucrose
content in the sheath than the lamina in the afternoon than that of the control (4:1 & 1.6:1
respectively). This is also evident in the morning, but to a lesser extent (YCS 2.5:1, control 1.8:1).
Noteworthy is the 1.6-fold increase in the sucrose sheath to lamina ratio of the YCS leaf between the
morning and afternoon. As there was no significant difference in YCS lamina sucrose content
between AM & PM this implies that the leaf lamina is continuing to synthesise and export sugars
throughout the day. However, sucrose is beginning to accumulate in the sheath during this period
(Figure 48). The reason for this accumulation may be due to a full or partial blockage of the phloem
or a decrease in sink strength. No such pattern is visible in the controls. This evidence also supports
the results obtained in the 13C labelling field experiment where 70-85% of the 13C sucrose pool had
been drawn down from the lamina across the pulse chase period of 31 hours (Figure 43).
Figure 49 Q240A Leaf 4 sucrose and starch sheath:lamina ratio, AM & PM
The sheath to lamina starch ratio is unremarkable for the morning period but interestingly there is a
1.5-fold difference in the ratio between YCS and control in the afternoon (Figure 49). This is
consistent with the world literature that states starch synthesis enables a higher rate of
photosynthesis to be maintained during periods of high light and CO2 when carbon assimilation
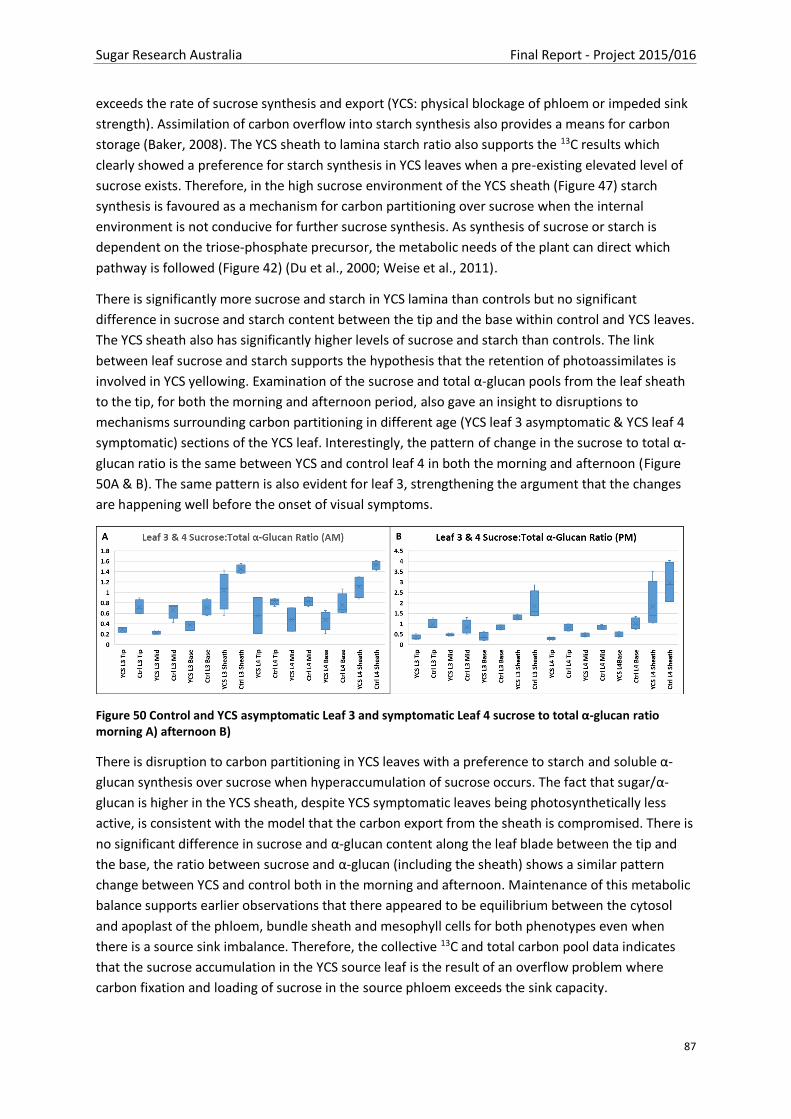
Sugar Research Australia Final Report - Project 2015/016
87
exceeds the rate of sucrose synthesis and export (YCS: physical blockage of phloem or impeded sink
strength). Assimilation of carbon overflow into starch synthesis also provides a means for carbon
storage (Baker, 2008). The YCS sheath to lamina starch ratio also supports the 13C results which
clearly showed a preference for starch synthesis in YCS leaves when a pre-existing elevated level of
sucrose exists. Therefore, in the high sucrose environment of the YCS sheath (Figure 47) starch
synthesis is favoured as a mechanism for carbon partitioning over sucrose when the internal
environment is not conducive for further sucrose synthesis. As synthesis of sucrose or starch is
dependent on the triose-phosphate precursor, the metabolic needs of the plant can direct which
pathway is followed (Figure 42) (Du et al., 2000; Weise et al., 2011).
There is significantly more sucrose and starch in YCS lamina than controls but no significant
difference in sucrose and starch content between the tip and the base within control and YCS leaves.
The YCS sheath also has significantly higher levels of sucrose and starch than controls. The link
between leaf sucrose and starch supports the hypothesis that the retention of photoassimilates is
involved in YCS yellowing. Examination of the sucrose and total α-glucan pools from the leaf sheath
to the tip, for both the morning and afternoon period, also gave an insight to disruptions to
mechanisms surrounding carbon partitioning in different age (YCS leaf 3 asymptomatic & YCS leaf 4
symptomatic) sections of the YCS leaf. Interestingly, the pattern of change in the sucrose to total α-
glucan ratio is the same between YCS and control leaf 4 in both the morning and afternoon (Figure
50A & B). The same pattern is also evident for leaf 3, strengthening the argument that the changes
are happening well before the onset of visual symptoms.
Figure 50 Control and YCS asymptomatic Leaf 3 and symptomatic Leaf 4 sucrose to total α-glucan ratio morning A) afternoon B)
There is disruption to carbon partitioning in YCS leaves with a preference to starch and soluble α-
glucan synthesis over sucrose when hyperaccumulation of sucrose occurs. The fact that sugar/α-
glucan is higher in the YCS sheath, despite YCS symptomatic leaves being photosynthetically less
active, is consistent with the model that the carbon export from the sheath is compromised. There is
no significant difference in sucrose and α-glucan content along the leaf blade between the tip and
the base, the ratio between sucrose and α-glucan (including the sheath) shows a similar pattern
change between YCS and control both in the morning and afternoon. Maintenance of this metabolic
balance supports earlier observations that there appeared to be equilibrium between the cytosol
and apoplast of the phloem, bundle sheath and mesophyll cells for both phenotypes even when
there is a source sink imbalance. Therefore, the collective 13C and total carbon pool data indicates
that the sucrose accumulation in the YCS source leaf is the result of an overflow problem where
carbon fixation and loading of sucrose in the source phloem exceeds the sink capacity.

Sugar Research Australia Final Report - Project 2015/016
88
In a leaf unable to export more carbon than is assimilated, sucrose will eventually push through the
tolerable upper threshold unless synthesis is curtailed. Therefore, an efficient regulatory mechanism
to reduce sucrose synthesis while protecting the photosystems from oxidation would be required.
Unless the plant possesses the means to reduce incoming solar energy at the same time this
mechanism will be limited, as excess energy leads to the production of ROS during photosynthetic
downregulation. Furthermore, as sugarcane has the physiological ability to produce a new leaf
approximately every seven days (approximately 150 °Cd) it is most likely more energy efficient to
sacrifice compromised leaves and redirect energy to the younger source and sink leaves. Obviously,
there is a cost benefit ceiling that would be determined by plant vigour. This model adds support to
observations pertaining to the lack of YCS severity in high yielding crops which have both vigour and
high sink strength (see section 6.7.1 of this report).
6.3.2. Leaf sucrose accumulation at a cellular level
Sucrose synthesised in the cytoplasm of the mesophyll and bundle sheath cells diffuses through the
plasmodesmata into the vascular parenchyma cell via the symplast. As discussed in section 6.3.1.1 of
this report, sugarcane is an active phloem loader and uses a combination of sweet proteins to move
sucrose from the symplast to the apoplast of companion cells, and sucrose symporters (SUTs) then
actively load the sieve elements against the concentration gradient. Analysis of apoplastic fluid
sugars allows further insight into the status of phloem loading and where sugar is accumulating at a
cellular level.
6.3.2.1. Apoplastic sugar levels
It is notoriously difficult to extract apoplastic fluid from sugarcane leaf but subsequent attempts to
do so from leaf sheath and midrib have proved successful (Husted and Schjoerring, 1995). An
optimized methodology consisting of pressure infiltration and low speed centrifugation was
implemented under field conditions to extract apoplastic fluid from KQ228A control and YCS leaf
sheath. The extract was analysed for sugars using standard enzymatic assays (Bergmeyer and Bernt,
1974).
Sucrose hydrolysis by cell wall acid invertase in the apoplast should liberate equal proportions of
glucose and fructose. However, Figure 51B shows the ratio of sucrose to glucose and fructose is not
equal for either control or YCS plants. However, the ratio in the controls is much closer to 1:1 than in
YCS. Glucose concentrations are also significantly lower than fructose in both controls and YCS
(Figure 51A). The disproportionate amounts of YCS sucrose to glucose and fructose may indicate that
an opportunistic organism is hydrolysing sucrose and consuming large quantities of both glucose and
fructose in this space. Sucrose levels in the YCS apoplast are significantly higher than controls
(approx. 3 fold), which is consistent with levels measured in total tissue assays of the lamina and
midrib (see section 6.2.6 of this report Figure 29A & D). This would suggest that there is equilibrium
between the cytosol and apoplast of the phloem, bundle sheath and mesophyll cells for both
phenotypes as previously noted in the lamina and midrib. High levels of sucrose accumulation in the
apoplast of YCS tissue implies that sweet proteins are functional in their transport of sucrose across
the parenchyma cell membrane. As our studies have shown there is significant upregulation of
transcripts involved in phloem loading and sucrose transport, it is therefore unlikely that an
apoplastic pathogen is the cause of high sucrose levels in the apoplastic space. Upregulation

Sugar Research Australia Final Report - Project 2015/016
89
suggests the cells are constantly trying to move excess sugars out of the source cells, implying that
both the cytosol and apoplast are saturated with sucrose.
Figure 51 Apoplastic sugar concentrations; sucrose and reducing sugars A) apoplastic sugar ratios B)
The apoplastic data supports 13C studies that sucrose accumulation in the YCS source leaf is likely an
overflow problem from the phloem into the surrounding tissue. This could result from a physical
blockage in the phloem.
6.3.3. Physical blockage of the phloem and plasmodesmata
The integrated YCS program initiated a directive to analyse our current leaf transcriptome and
proteome data for phytoplasma signatures in the search for a phloem blocker. This directive was
derived through consultation with Dr Owain Edwards (CSIRO).
6.3.3.1. Bioinformatic analyses of both the reference YCS transcriptomes (leaf and internode) and the
raw reads for sequences from phytoplasmas and other micro-organisms
Bioinformatic analyses of reference transcriptomes was done using Kraken software (Wood and
Salzberg, 2014) to identify any sequences that did not originate from sugarcane and may instead
have come from micro-organisms like phytoplasmas.
A search of the YCS Leaf transcriptome assembly failed to find any matches to phytoplasma
sequences (see Appendix 5), even when the search was expanded to include the broader ‘mollicute’
class. However, the analysis did reveal a high number of matches to the bacterium Ralstonia
pickettii. This organism is known to be a contaminant of common laboratory and hospital solutions
and has most likely been accidently sequenced and transcript assembled. Taking this information
into consideration and the lower abundance of this microorganism in YCS samples, we conclude that
Ralstonia pickettii is unrelated to YCS (see Appendix 5).
Similarly, a search was conducted for the broader ‘mollicute’ sequences, sourced from the NCBI
RefSeq database, in the internode transcriptome assembly. The best match was to an ‘ATP synthase
subunit’ from ‘Mycoplasma sp. HU2014’ with a 70 % (546/776) identity match on a contig that was
6771 bases long. However, taking that entire contig sequence and blasting it to the wider ‘nr’
database, the contig’s annotation comes up as ‘Saccharum officinarum mitochondrial chromosome 2
DNA, complete genome, cultivar: Khon Kaen 3’ with a 99 % (3860/3870) identity match. This showed
that the contig was not from mycoplasma, but instead was just mitochondrial transcript from
sugarcane. No phytoplasma sequences were found in the YCS Internode assembly.
Sugar Research Australia Final Report - Project 2015/016
90
Across the transcriptome assemblies, the analysis of non-sugarcane sequences showed no microbial
signature of any significance in association with YCS.
6.3.3.2. Phytoplasma proteins
Australian Proteome Analysis Facility (APAF) performed an initial analysis of leaf protein data to
identify potential phytoplasma protein sequences (1D). Signatures for 16 different phytoplasma
species were detected with reasonable confidence in the leaf tissue.
Further analyses were performed in an attempt to quantify the phytoplasma signatures between
samples using protein matches to gene expression data (a “rough” idea). Results indicated a
potentially greater abundance of phytoplasma in YCS leaf samples, however this was also the case in
senescent leaf tissue (Figure 52).
Similar 1D (i.e. lacking quantitation) analysis of internode proteome data was performed.
Approximately 20 different phytoplasma species (early-stage analysis) were detected and likely to be
in control (healthy), Moddus-treated and YCS-expressing internode samples. At this stage,
quantification between internode sample types has not been determined (requiring transcriptome
cross-referencing).

Sugar Research Australia Final Report - Project 2015/016
91
Figure 52 Heatmap of Q240A sugarcane leaf samples and phytoplasma peptide matches, quantification comparison through transcriptome contig expression levels. Blue indicates lower abundance; red indicates higher abundance. Sample replicates listed along base of heatmap (control = healthy, YCS = yellow canopy syndrome, Sen = senescence, WS = water-stress. Green = early-stage of stress, yellow = late-stage of stress)
6.3.3.3. Non-sugarcane organisms as potential causal agent of YCS
Bioinformatic analyses of the raw RNAseq reads was also done using Kraken software (Wood and
Salzberg, 2014) to identify any sequences that did not originate from sugarcane and may instead
have come from micro-organisms like phytoplasmas.
Analyses of leaf, midrib, dewlap, and culm tissue collected across five field visits and three regions
(Herbert, Burdekin, and Mackay) failed to identify the involvement of a micro-organism or
phytoplasma in YCS development or expression. While some species of type Candidatus,
mycoplasma and spiroplasma were detected, they were equally present, or more abundant, in the
Control samples rather than the YCS samples. While Curtobacterium does figure prominently as the
most identifiable microorganism, with YCS fold change differences to control in the number of reads
counted (Lamina: 1.46, Midrib: 3.3, Dewlap: 2.11, Internode: 0.61), the signature became

Sugar Research Australia Final Report - Project 2015/016
92
insignificant when a differential expression analysis was conducted. The same was true of the
bacterium Bacillus cereus m 1293 and Banana Streak CA virus.
Across the multiple RNAseq datasets produced in this project, the analysis of non-sugarcane
sequences showed no microbial signature of any significance in association with YCS.
6.3.3.4. Callose
Changes to gene expression associated with a physical blockage in vascular tissue
Callose is a β-1,3-glucan polysaccharide (1,3-β-linked glucose residues) that is transiently produced by
plants during development, and in response to both abiotic and biotic stress (Chen and Kim, 2009). It
occurs intrinsically within the sieve plates of the phloem, cell plates of dividing cells, plasmodesmata
canals, reproductive organs, and root hairs. Accumulation is usually transitory and bulk flow of phloem
sap can be regulated by callose deposition or degradation. Therefore, control of callose deposition is
a key mechanism of phloem sap transport. It can be synthesized rapidly with deposition localised in
response to wounding, abiotic stress, mechanical stress and pathogen infection (Kohle et al., 1984).
As a defence mechanism, callose deposition can be deployed by plants to limit access to nutrients by
restricting solute movement between plant cells (Varsani et al., 2019). This method is effective
against both pathogens (like viruses), and pests (like sap-sucking insects). Defensive callose
deposition occurs within the phloem and plasmodesmata, and contributes to sieve element and
plasmodesmata occlusion (Will and van Bel, 2006; Julius et al., 2018). In this way, plants can restrict
movement and feeding opportunities, and effect a measure of control over populations of phloem-
feeding insects (Will and van Bel, 2006).
Callose quantification
Quantification of lamina, midrib, and sheath callose through fluorescence spectroscopy indicates
uniform content between control and YCS plants within each of the three leaf tissues. Callose
content within lamina and midrib is comparable between leaf 3 and 4, whereas leaf 4 sheath levels
are approximately 2-fold that of leaf 3 in both control and YCS tissue (Figure 53A & D). A similar
pattern also holds for the gradient between the leaf tip and sheath within in all three tissue types
(Figure 53B & C). Interestingly the mid-tip region in both controls and YCS has less callose than any
other region in the lamina and midrib (Figure 53B & C). Further investigation of any correlation
between sucrose and callose is unremarkable (Figure 54A-D). This data suggests that callose
deposition in the lamina, midrib or sheath is unlikely to be responsible for reduced sucrose
translocation and leaf accumulation. However, it cannot accurately describe accumulation at a
specific site within the plasmodesmata or other vascular tissue. As each of these tissue types has a
different proportion of vascular tissue there may be differences at the micro level. Nonetheless, it
does suggest that on a µg/mg leaf dry mass basis there is no evidence of variation between the
vasculature of controls and YCS leaves.

Sugar Research Australia Final Report - Project 2015/016
93
Figure 53 Q240A Callose content-Curdlan (CE) equivalent, Control and YCS asymptomatic Leaf 3 and symptomatic Leaf 4, lamina, midrib and sheath A) Lamina gradient B) Midrib gradient C) Sheath D)
Figure 54 Lamina Sucrose callose correlation, Control and YCS asymptomatic Leaf 3 (A, C) and Control and YCS symptomatic Leaf 4 (B, D)

Sugar Research Australia Final Report - Project 2015/016
94
Callose is produced by callose synthase (CalS) enzymes (alternatively called glucan synthases,
although the isoform numbering is not transferable between the two), and degraded by β-1,3-
glucanases (Chen and Kim, 2009). There are twelve known isoforms of callose synthase, divided into
4 main sub-families (Chen and Kim, 2009). Loss-of-function analyses have identified the specific role
played by many of the isoforms (Chen and Kim, 2009).
From this work, we know that CalS-3 and CalS-8 are involved specifically in plasmodesmatal
deposition, and CalS-7 in phloem deposition (Barratt et al., 2011; Cui and Lee, 2016). Higher
expression and abundance of CalS-3, CalS-8 and CalS-7 would occlude the plasmodesmata and
phloem sieve elements, either partially or fully, and thus limit sucrose export from leaf.
Given that we know sucrose export is hindered in YCS, we looked for transcriptomic evidence of
these callose synthase isoforms expression in YCS. We found increased expression in YCS of all three
isoforms, plus another callose synthase without an isoform designation (Figure 55).
Figure 55 Increased expression of plasmodesmata- and phloem-specific callose deposition CalS isoforms in YCS (ES = early stage YCS lamina, LS = late stage YCS lamina)
While CalS-3 and CalS-8 (and the unidentified CalS isoform) were in higher abundance in YCS, the
biggest fold change is in the CalS-7 expression. Callose synthase 7 isoform was expressed only in the
phloem sieve elements (Barratt et al., 2011). The transcript, YCS-internode-contig_105736 'Callose
synthase 7‘, (2544 bases long), was the only callose-related transcript that was significantly
differentially expressed in YCS (Bonferroni < 0.0001) in each of leaf, midrib and dewlap tissue, and
internode tissue (Bonferroni = 0.03). Fold change in YCS of this transcript by tissue type is shown in
Figure 56.

Sugar Research Australia Final Report - Project 2015/016
95
Figure 56 Fold change in YCS expression of callose synthase 7, by tissue type
These results suggest that there is not a tight correlation between callose synthase gene expression
and callose levels (Figure 53).
Plasmodesmata-associated proteins involved in plasmodesmata permeability
There are many plasmodesmata-located and -associated proteins that regulate plasmodesmata
permeability. For example, beta-glucanase and plasmodesmata-associated protein complexes play a
role in callose turnover in plasmodesmata, as do proteins involved in plasmodemata callose binding
(Ueki and Citovsky, 2014). In addition, calreticulin, glycosyltransferase, reversibly glycosylated
polypeptides, receptor-like proteins, remorin, PDLP, HopW1, and Gpi-anchor plasmodesmal neck
proteins are all associated with plasmodesmata permeability (Ueki and Citovsky, 2014).
We looked for transcriptomic evidence of these proteins being upregulated in YCS. While the YCS
Reference transcriptome contained many of these transcripts, only one (YCS-internode-
contig_137580 ‘Remorin family’, size 5421 bases) was significantly differentially expressed in YCS
(Bonferroni 0.03) but was weakly expressed overall and only two fold in higher abundance in YCS. In
summary, plasmodesmata-associated permeability proteins are unlikely to play a role in restricting
sucrose export in YCS.
At the time of this report, extensive research conducted across the YCS Integrated Research Program
has failed to find conclusive evidence in support of a physical blockage in the leaf phloem or
plasmodesmata. This is aligned with the findings of this report. A more likely explanation would be
carbon fixation and loading of sucrose in the source phloem exceeding the sink demand.
6.3.4. Changes to the metabolome, transcriptome, and proteome
Although visual yellowing is usually only evident in the lower leaves of the canopy (older than leaf 5)
photosynthesis and stomatal conductance are reduced both in yellowing leaves and the leaves not
yet showing any visible yellowing. On a canopy basis, photosynthesis is reduced by 14% and 36% in
YCS symptomatic KQ228A and Q200A plants, respectively (Marquardt et al., 2016). Sucrose levels
increased significantly and reflects some of the earliest changes that are induced in the YCS
symptomatic plants. In addition, there are disruptions on both electron acceptor and donor side of
photosystem II (Marquardt et al., 2016). Some of these changes are characteristic of a degree of
disruption of the protein structure associated with the electron transport chain. Based on the

Sugar Research Australia Final Report - Project 2015/016
96
results, we proposed that the first change in metabolism in the YCS symptomatic plants is an
increase in sucrose and that all the other changes are secondary effects modulated by this increased
sugar levels.
To form a better understanding of the above, we studied the metabolic, gene expression and protein
changes that accompany the expression of YCS in sugarcane (Botha et al., 2016). This information
would be important to assist in developing management strategies as well as in the identification of
potential causal factors.
6.3.4.1. Metabolites
More than 200 metabolites were detected in the leaf samples and 84 of these could be identified.
The results revealed intrinsic differences (p <0.05) between the metabolomes of the YCS
symptomatic and asymptomatic plants. It was evident that significant metabolic changes occurred
well before the development of leaf yellowing. The major metabolic changes were associated with
sugar metabolism, the pentose phosphate cycle, and phenylpropanoid and α-ketoglutarate
metabolism. The diurnal changes of sucrose concentrations (low in the morning and high at the end
of the day) are absent in the YCS symptomatic plants even before symptom expression. Comparing
the leaf transcriptomes of the symptomatic and asymptomatic plants shows that a complex network
of changes in gene expression underpins the observed changes in the metabolome.
PCA analysis separates Control and YCS metabolite samples into distinct clusters (Figure 57).
However, the overlay of YCS AM and PM is indicative of disruption to the diurnal rhythm in YCS
plants. While there is overlap in control samples, clear separation between the morning and
afternoon metabolites is indicative of healthy transitioning in preparation for the night period. The
main metabolites driving the separation between controls and YCS are the soluble sugars reported in
section 6.2.5 (Figure 58).
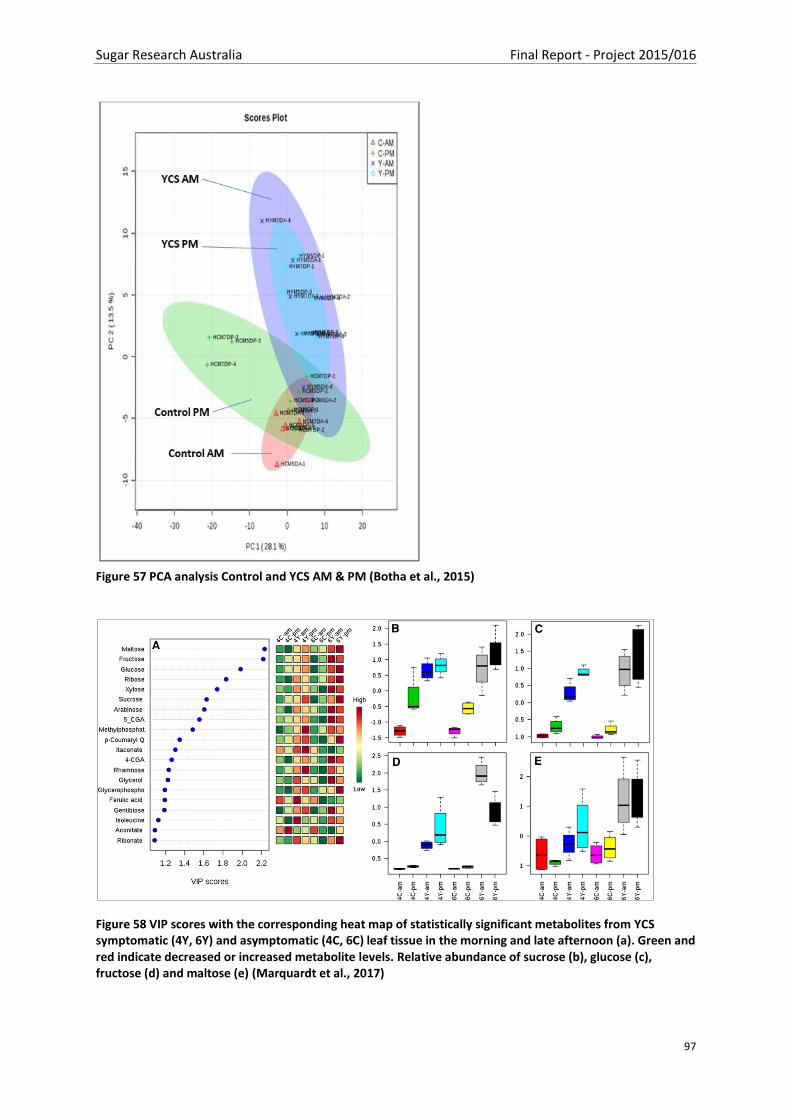
Sugar Research Australia Final Report - Project 2015/016
97
Figure 57 PCA analysis Control and YCS AM & PM (Botha et al., 2015)
Figure 58 VIP scores with the corresponding heat map of statistically significant metabolites from YCS symptomatic (4Y, 6Y) and asymptomatic (4C, 6C) leaf tissue in the morning and late afternoon (a). Green and red indicate decreased or increased metabolite levels. Relative abundance of sucrose (b), glucose (c), fructose (d) and maltose (e) (Marquardt et al., 2017)

Sugar Research Australia Final Report - Project 2015/016
98
Figure 59 shows changes to the metabolites derived from the pentose phosphate cycle and associate
phenylpropanoid pathway. No significant variation is noted in these metabolites between the
morning and afternoon of YCS asymptomatic Leaf 4 and symptomatic Leaf 6. This is evident of an
early response to oxidative stress in YCS leaves before the onset of yellowing (Marquardt et al.,
2017).
Figure 59 Relative changes in metabolites from YCS symptomatic (4Y, 6Y) and asymptomatic (4C, 6C) leaf tissue associated with the phenylpropanoid pathway (A–D), and the pentose phosphate cycle (E, F). Shikimate (A), caffeoyl quinate (B), coumaroyl quinate (C), quinate (D), rhamnose (E), xylose (F), arabinose (G) and ribose (H) (Marquardt et al., 2017)
6.3.4.2. Gene expression
For this analysis, the RNAseq reads were mapped to the PacBio (v1.02) sugarcane transcriptome
(Hoang et al., 2018). Analysis of upregulated genes for identification of metabolic pathways (GO
analysis; Blast2G0) unique to YCS yellowing showed carbohydrate metabolism and the
phenylpropanoid pathway were foremost impacted (Figure 60). Notable is the gluconeogenesis
category, containing the largest number of genes with altered expressed. Gluconeogenesis channels
triose phosphate into sucrose and starch (Sung et al., 1988). Importantly, sugar metabolism
pathways, including fructose, mannose and carbohydrate phosphorylation were also affected, as
was starch synthesis and breakdown (malate metabolism). These results are consistent with sugar
and starch accumulation found to be associated with YCS leaf symptoms, indicating these pathways
are affected in a unique way during YCS symptom development.

Sugar Research Australia Final Report - Project 2015/016
99
Figure 60 Pie chart of Biological Process, subgraph Metabolic Process GO ontology categorization of 808 upregulated genes unique to YCS leaf yellowing (FDR-corrected P-value < 0.001). Numbers in brackets represent number of genes within category. Category “Other” blankets categories containing < 0.5% of total number of genes.
RNA sequencing data from samples obtained across four genotypes and three geographical regions
were mapped against the sugarcane transcriptome reference database (Hoang et al., 2017; Hoang et
al., 2017; Hoang et al., 2018) using CLC Genomics Workbench v9.5.3 software. A two-group unpaired
differential expression analysis using Baggerley’s proportions was done, separating the samples into
Control versus YCS, including a statistical analysis of the results with Bonferroni-corrected p-values,
to find the statistically significant differentially expressed transcripts. Figure 61 shows the volcano
plot of fold change against p-values. From this analysis, a total of 109 transcripts were found to be
differentially expressed with a Bonferroni-corrected p-value of less than 0.05. Of the 109, only 9 had
a fold-change in expression greater +/- 1.4. Looking at those 9 and starting with the transcripts with
lower abundance in YCS samples, there are 4 which are expressed in the Control samples but not in
the YCS samples at all, which gives them a fold-change of minus infinity. These 4 include
• c110365f1p05811 U-box domain-containing 4
• c66641f1p0949 clathrin light chain
• c39217f2p01829 von Willebrand factor type A domain-containing protein
• c61736f1p0907 probable NAD(P)H dehydrogenase (quinone) FQR1-like 1.
The U-box domain-containing transcript is involved in the E3 ligase step of protein ubiquitination.
This process leads to the degradation of unwanted proteins within the cells and is a necessary part
of normal metabolism (Amm et al., 2014). Not having this transcript expressed in the YCS samples

Sugar Research Australia Final Report - Project 2015/016
100
was surprising, as stress conditions are known to require more of the protein ubiquitin process so
we would expect to see a higher abundance of this transcript in the YCS samples instead.
The clathrin light-chain transcript is involved in intracellular protein transport, particularly across
membranes, and regulation of the same (Wang et al., 2006; Wang et al., 2013). That this transcript
was not expressed in YCS implies a breakdown in the movement of proteins in the different cellular
compartments.
The FQR1-like transcript is involved in the transfer of electrons from NADH and NADPH to several
quinones in the electron transport chain (Laskowski et al., 2002). It also acts as an oxidoreductase in
stress response, so it was surprising to see this transcript not expressed in the YCS plants. It indicates
that the electron transport chain is not functioning properly in the YCS plants, and this supports our
previous findings on analysis of chlorophyll fluorescence (see Section 6.2.3. of this report)
Most interestingly in this group, the transcript c39217f2p01829 von Willebrand factor type A
domain-containing protein is from a gene called Lagging Growth and Development 1 (LGD1). LGD1
regulates developmental signals for growth. From studies in rice, (Thangasamy et al., 2012),
disruption in the expression of this gene negatively impacts the plant growth, morphology,
internode length and yield. While more work needs to be done to explore the role of this transcript
in YCS, it may provide some insight into the sugarcane reduced growth phenomenon.
The transcript c65847f1p11543 probable glutathione S-transferase GSTU6 is also in lower abundance
in YCS samples, with its expression 12-fold lower. This enzyme is involved in the glutathione
biosynthesis pathway, which in turn is involved in protecting the cell from oxidative stress (Foyer and
Noctor, 2005). Together, this suggests that the YCS plants have an impaired stress response
capability, which makes them more susceptible to stress conditions. In addition, each of these
biochemical reactions involve ATP and may point to a problem in YCS plants having insufficient
energy to drive their metabolism. This is likely due to the disruption to the electron transport chain.
The remaining significant transcripts with a fold change above 1.4 were in higher abundance in the
YCS samples. These included
• c97367f1p02843 serine threonine- kinase BLUS1
• c111113f1p03909 senescence-associated
• c106391f1p04490 O-linked-mannose beta-1,4-N-acetylglucosaminyltransferase 2-
like
• c17952f5p41542 GDSL esterase lipase At5g55050-like.
The BLUS1 transcript is involved in phototropin signalling and stomatal opening (Takemiya et al.,
2013). With the assumption that higher abundance of this transcript would lead to more stomatal
opening, this contrasts with the data we have previously obtained, which determined that YCS plants
had reduced stomatal conductance. However, upregulation may be an attempt to counter the
abscisic acid (ABA) mediated sucrose induction of guard cell closure and reduce internal heat stress
within the leaf.
The transcript c106391f1p04490 O-linked-mannose beta-1,4-N-acetylglucosaminyltransferase 2-like
is involved in protein post-translational modification through glycosylation (Yoshida-Moriguchi et al.,

Sugar Research Australia Final Report - Project 2015/016
101
2013). This points again to some disruption in the protein modification processes in the YCS
symptomatic plants.
The GDSL esterase lipase transcript is a lipolytic enzyme that is involved in plant immunity and
induced systemic resistance to infections and abiotic stress (Kwon et al., 2009; Chepyshko et al.,
2012). It is over 4-fold higher abundance in the YCS plants and is an indication of the stress the YCS
plants are under.
The transcript c111113f1p03909 is senescence-associated and being present in higher abundance
likely indicates that the YCS symptoms are terminal in the leaf and the leaf is entering an early-
senescence stage.
These 109 transcripts were subjected to Blast2GO analysis to identify any enrichment in the
biological processes represented within the group (Figure 62). From the Blast2GO analysis, more
than 40% of the transcripts (44/109) in the group were involved in DNA integration, recombination,
and biosynthesis. This group also includes 15 transposable elements, including three from the
retrotransposon Ty1-copia subclass, eight Retrovirus-related Pol poly from transposon TNT 1-94 and
four unclassified transposons. It is unclear what role these transposable elements play in YCS.
In addition, 6% of the transcripts (7/109) were methylation-related. Methylation status is a way of
regulating gene expression and is indicative of plant stress (Peng and Zhang, 2009).
The remaining processes identified include sugar metabolism, protein modification and movement,
carotenoid biosynthesis, oxidative stress metabolism and circadian rhythm processes.
Figure 61 Volcano plot of the expression data. The red dots show the 109 statistically-significant results.

Sugar Research Australia Final Report - Project 2015/016
102
Figure 62 Summary of the biological processes represented by the 109 statistically-significant contigs differentially expressed in the YCS vs Control analysis of data from (Field Visits 3, 4 and 6 combined) against sugarcane PacBio transcriptome (Hoang et al., 2018)
Combining this analysis with a further analysis across water stress and senescent samples identified
11 transcripts significantly expressed in YCS (Table 6).
Table 6 DE expressed transcripts in YCS samples from genotypes Q200A, Q208A, Q240A & KQ228A
c57334f1p01569 flagellar radial spoke 5 isoform X1 c111765f1p14596 phosphatase 1 regulatory subunit pprA c52126f1p12255 mitogen-activated kinase kinase kinase YODA-like isoform X2 c119406f1p45922 Retrovirus-related Pol poly LINE-1 c114609f1p04644 disease resistance RPP13 2 c28783f1p02310 hAT dimerisation domain-containing -like c107022f1p04513 clathrin assembly c88737f1p02730 Sugar transporter ERD6-like 6 c119233f1p06987 exportin-4 isoform-X2 c105044f1p24618 DUF1296 domain-containing family [Zea mays] c51679f1p11333 retrotransposon unclassified
The flagellar radial spoke 5 isoform X1 transcript is involved in the movement of proteins and
molecules within the cell (Vale, 2003). The phosphatase 1 regulatory subunit pprA transcript is
involved in DNA repair, particularly with double-stranded breaks
(http://string.embl.de/newstring_cgi/show_network_section.pl?identifier=pprA). The mitogen-
activated kinase kinase kinase YODA-like isoform X2 transcript regulates the formation and
architecture of stomatal cells (http://www.uniprot.org/uniprot/Q9CAD5). The retrovirus-related Pol
poly LINE-1 and retrotransposon unclassified transcripts are transposable elements, as is the hAT
dimerisation domain-containing -like transcript (https://www.ebi.ac.uk/interpro/entry/IPR008906).
The disease resistance RPP13 2 transcript is involved in resistance to fungal pathogens, particularly

Sugar Research Australia Final Report - Project 2015/016
103
downy mildew (https://www.wikigenes.org/e/gene/e/823806.html). The clathrin assembly
transcript is involved in intracellular protein movements across membranes as described above. The
sugar transporter ERD6-like 6 transcript is involved in transporting glucose across membranes
(http://www.uniprot.org/uniprot/Q9FRL3). The exportin-4 isoform-X2 transcript is involved in
transporting proteins out of the nucleus of the cell (Lipowsky et al., 2000). The DUF1296 domain-
containing family [Zea mays] transcript is involved in abiotic stress response (Shiriga et al., 2014).
Taking all these together, YCS plants have changes to protein and glucose movement within the
cells, and the formation of the stomata. They are dealing with biotic and abiotic stress, DNA damage
and are impacted in some way by transposable elements.
6.3.4.3. Proteins and amino acids
The protein reference database required for protein identification from samples was improved by
providing RNA-seq data to the Australian Proteome Analysis Facility (APAF) in Sydney to generate
protein sequences. Over 1,800 were identified, where previous protein identification samples had
yielded < 300 proteins. These results showed a large number of protein abundance differences
between YCS-symptomatic and healthy leaves. Over 600 proteins had significantly higher presence
in YCS leaves, particularly various heat-shock proteins and proteins involved in transcription,
translation, and carbon metabolism. Of the 190 proteins significantly reduced in abundance in YCS
leaves, the largest proportion were involved in photosynthesis in the chloroplast. Cellular locations
of the higher and lower abundance proteins can be seen in Figure 63 Cellular location of protein
proportional abundance in YCS leaf
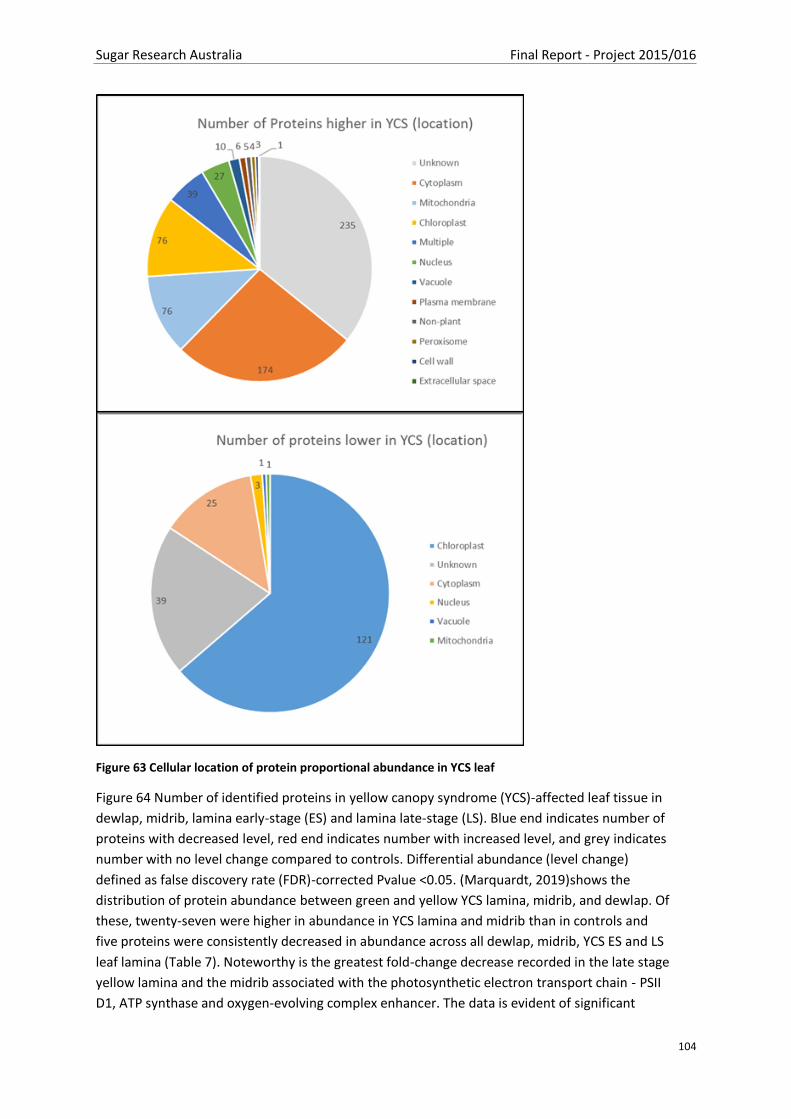
Sugar Research Australia Final Report - Project 2015/016
104
Figure 63 Cellular location of protein proportional abundance in YCS leaf
Figure 64 Number of identified proteins in yellow canopy syndrome (YCS)-affected leaf tissue in
dewlap, midrib, lamina early-stage (ES) and lamina late-stage (LS). Blue end indicates number of
proteins with decreased level, red end indicates number with increased level, and grey indicates
number with no level change compared to controls. Differential abundance (level change)
defined as false discovery rate (FDR)-corrected Pvalue <0.05. (Marquardt, 2019)shows the
distribution of protein abundance between green and yellow YCS lamina, midrib, and dewlap. Of
these, twenty-seven were higher in abundance in YCS lamina and midrib than in controls and
five proteins were consistently decreased in abundance across all dewlap, midrib, YCS ES and LS
leaf lamina (Table 7). Noteworthy is the greatest fold-change decrease recorded in the late stage
yellow lamina and the midrib associated with the photosynthetic electron transport chain - PSII
D1, ATP synthase and oxygen-evolving complex enhancer. The data is evident of significant

Sugar Research Australia Final Report - Project 2015/016
105
downregulation of the photosynthetic apparatus through feedback regulation (Marquardt,
2019).
Figure 64 Number of identified proteins in yellow canopy syndrome (YCS)-affected leaf tissue in dewlap, midrib, lamina early-stage (ES) and lamina late-stage (LS). Blue end indicates number of proteins with decreased level, red end indicates number with increased level, and grey indicates number with no level change compared to controls. Differential abundance (level change) defined as false discovery rate (FDR)-corrected Pvalue <0.05. (Marquardt, 2019)
Table 7 Proteins with lower abundance in yellow canopy syndrome (YCS)affected dewlap, midrib, early-stage (ES) lamina and late-stage (LS) lamina compared to controls including fold changes. (Marquardt, 2019)
Protein ID Description UniProt ID
Fold-change in YCS from control
Dewlap Midrib
Lamina
Early-stage (ES) Late-stage (LS)
gi|195628120
ATP synthase B chain, chloroplastic
C5WPC6 -36.13** -7.1** -2.63** -3.86**
gi|241915488 fructose-bisphosphate aldolase 5,
cytosolic C5Z5R1 -2.55** -3.88** -1.5** -5.63**
gi|241924815 oxygen-evolving enhancer protein,
chloroplastic C5X9F7 -1.93** -4.5** -1.73** -4.8**
gi|413939455 unknown (predicted on chloroplast
membrane) C5XVU8 -1.86** -3.51** -1.99** -3.58**
gi|893641155
Photosystem II protein D1
A0A109NDD5
-2.85**
-5.14**
-1.66**
-3.94**
**Differential abundance at significance value of false discovery rate (FDR)-corrected P-value <0.01.

Sugar Research Australia Final Report - Project 2015/016
106
There are nine amino acids which increase in abundance in YCS leaves normalised against control
Leaf 4 (Figure 65). This increase is asparagine and tryptophan as YCS symptoms develop is supported
by research showing a strong correlation of these two amino acids with increased chlorosis (Kenyon
and Turner, 1990). A strong correlation also exists between abiotic stress and high GABA and proline
levels in plants (Widodo et al., 2009; Witt et al., 2011; Rodziewicz et al., 2014). This adds weight to
the mounting evidence implicating abiotic stress as a precursor to YCS development and expression.
Figure 65 Changes in the levels of amino acids in YCS symptomatic sugarcane plants. Data is normalised against the control leaf two. All these values have a t-test value below P< 0.05 (Bonferroni-corrected P value).
The collective data presented in section 6.3 of the report indicates there is massive disruption to
source leaf metabolism as YCS develops. This metabolic perturbance is evident of a secondary effect
in direct response to sucrose accumulation in the leaf, or an induced response to reduce sucrose
synthesis through downregulation of the photosystems. As there is no evidence of reduced phloem
loading and transport, or a physical blockage of the vasculature, the cause of leaf sucrose
accumulation must primarily be driven by changes to the sink. While research conducted by the
CSIRO found no differences in root system structure between YCS plants and healthy controls (Rae
and Pierre, 2018), the roots should not be ruled out as a possible cause of sink source imbalance. It is
important to note that a more immediate source response is likely differentiated in changes to
internodes sink strength than at the root level due to the proximity of internode sink tissue to the
source. It is evident from our data that sucrose accumulation in the source leaf is driven primarily by
sink limitation within the culm. It should also be noted that xylem sap sucrose and its reducing
sugars extracted from internodes show no consistent difference between control and YCS (Figure
66A-C). This suggests that a xylem vessel microbial entity is not responsible for reducing water
movement that may limit sink size. Furthermore metabolite analysis of xylem sap (data not shown)
did not show a single compound across the regions and genotypes that changes in association with
YCS expression (Botha et al., 2015).

Sugar Research Australia Final Report - Project 2015/016
107
Figure 66 Internode 4 & 6 xylem sap sucrose A), glucose B) and fructose C), Q200A Herbert, KQ228A Burdekin, Q208A Mackay. Tukey HSD All-Pairwise Comparisons (p<0.05)
6.4. Source sink imbalance
13C studies showed that there was carbon overflow assimilation to starch (insoluble α-glucan) as a
means of carbon offset in asymptomatic leaves which had already started to accumulate sucrose.
Both sucrose and α-glucans synthesis are linked to the triose-phosphate produced from CO2 fixation
in the chloroplast (Myers et al., 2000). The carbon storage potential of starch will quickly reach
saturation as sugarcane lacks the machinery outside of the chloroplasts of bundle sheath cells to

Sugar Research Australia Final Report - Project 2015/016
108
synthesise this polysaccharide (Lunn and Furbank, 1997). Measurements of high leaf starch and
sucrose at first light indicate limited capacity to turnover starch. Studies have shown that this
mechanism is synchronised to the diurnal rhythm and any disruption to this will result in a change to
carbon partitioning in the leaf and whole plant (Du et al., 2000; Watt et al., 2005; Weise et al., 2011).
In sugarcane the priority of carbon assimilation is for sucrose with partitioning to starch regulated by
sucrose synthesis.
To gain a better understanding of the diurnal profile of the source leaf and any link to sink tissue,
YCS symptomatic and control Leaf 4 midribs were sampled 13 hours apart (dusk and dawn). Midrib
vascular bundle (VB) tissue was separated from parenchymatous tissue (PT) (Figure 67) and assayed
for sucrose, soluble and insoluble α-glucan content (Figure 68).
Figure 67 Separation of KQ228A Leaf 4 midrib vascular and parenchymatous tissue using a lino cutting chisel
Figure 68 KQ228A Leaf 4 midrib Vascular bundle (VB) and Parenchymatous tissue (PT) sucrose, soluble & insoluble α-glucan content (AM & PM). (note: sucrose units µmol/g DM; α-glucan units µmol glucose equivalent/g DM)

Sugar Research Australia Final Report - Project 2015/016
109
The flow rates of each soluble metabolite (sucrose and soluble α-glucan) and turnover of the
insoluble starch pool can be used as a proxy for sink strength. A strong gradient between the source
leaf and the sink (internode) is indicative of high sink strength or demand and vice versa for a weak
sink strength (Black et al., 1995; Koch, 2004; Morey et al., 2019). As carbon is only translocated in
the phloem as sucrose, calculating flow rates of soluble and insoluble α-glucans would be
misleading. These two polymers are converted to hexose units and then reused for sucrose
synthesis. Therefore, the change in total pool size of sucrose, soluble and insoluble α-glucans would
be an indication of carbon flux out of the source tissue and indicative of sink demand. It is important
to also note that the midrib parenchymatous tissue is devoid of bundle sheath cells and therefore
lacks the cellular machinery to synthesise starch. Figure 69 shows hexose unit rate of change,
represented by the total hexose equivalent pool from both PT and VB control tissue, is
approximately 2-fold higher than YCS tissue. This is a significant difference and gives a better
understanding of the variance in sink strength impacting sucrose and α-glucan export from the leaf.
Also of note are the large quantities of glucan and sucrose in vascular and non-vascular tissue of the
midrib. This is indicative of this tissue serving as an alternate sink to offset excess carbon
accumulation in the lamina (Marquardt et al., 2017).
Figure 69 KQ228A Leaf 4 midrib diurnal flow rate (Total hexose units/hour). Vascular bundle (VB) and Parenchymatous tissue (PT).
A reduction in sink strength can occur if i) the physical size or ii) the metabolic rate of the internode
is reduced. If the physical size of the internode is reduced, the capacity of the sink to accommodate
exported sucrose from the source leaf will obviously be diminished. The magnitude of internode
volume reduction will be one factor that contributes to the sink strength status, the other will be its
metabolic rate. Maintenance of a sucrose concentration gradient in the phloem between the source
and sink tissue is imperative for unencumbered export from the leaf. It is also true that a sluggish
metabolic rate in an internode of adequate physical capacity will have a diminished call for carbon,
as respiratory requirements are unable to maintain an adequate concentration gradient between
the source and sink tissue. In either scenario, sucrose accumulates in the leaf due to a source sink

Sugar Research Australia Final Report - Project 2015/016
110
imbalance. Therefore, if internode growth is slowed physically or metabolically, sink strength will be
diminished causing a source sink imbalance.
6.4.1. Manipulation of supply and demand
A growth regulator trial was conducted on the SRA Brandon station to investigate whether YCS could
be induced through manipulation of the supply and demand function using growth regulators to
alter the size of the source or sink. Of the 5 treatments investigated i) Benzylaminopurine (BAP), ii)
Gibberellic Acid (GA), iii) Gibberellic Acid inhibitor (Moddus®), iv) Shade, v) Ethylene, only GA
inhibitor Moddus® had sucrose and total α-glucan levels comparable to YCS and significantly higher
than controls in both the lamina and midrib (Figure 70A-D). It is therefore reasonable to assume that
the application of a GA inhibitor has induced sucrose and α-glucan accumulation in the source tissue.
It is also worth noting that only Moddus-treated plants displayed a similar phenotype to YCS in
symptomatic Leaf 4 in the field.
Figure 70 Growth regulator treatments KQ228A Leaf 4 sucrose and Total α-Glucan content lamina A & C), midrib B & D)
Sugarcane internodes of commercial varieties grown in Qld elongate for approximately 380-degree
days (°Cd) with most growth occurring in the first 150°Cd. Internode growth is highly dependent on
water and nutrient availability (Inman-Bamber, 1994; Moore and Botha, 2013). Internode length is
often used to measure growth rates, but this parameter alone is inadequate for estimating sink size.
Internode volume, which also considers the variations in girth, is a better measure of the plant’s sink
capacity. Figure 71 shows treatments Moddus, ethylene and YCS all have significantly smaller
internode volumes than controls above internode 6. These two treatments and YCS group together
at internode 4 and above; similarly, the remainder of treatments do so with the control. This is an
extremely interesting result as it indicates a strong correlation between leaf sucrose/α-glucan
content (Figure 70A-D) and sink size (Figure 71). However, ethylene, with notably the smallest sink
size (Figure 72A), is the exception to this with leaf sucrose and starch content comparable to that of
controls. This result is not surprising as ethylene is an early ripener, which slows the entire plant

Sugar Research Australia Final Report - Project 2015/016
111
growth. Ethylene is also the only treatment to have a significantly smaller leaf area (Figure 72B) than
controls and hence its photoassimilate production is not likely to exceed the sink capacity to cause
accumulation of sucrose above the upper tolerable threshold in the source tissue.
Figure 71 KQ228A growth regulator trial, internode (1-10) volume cm3. Internode # 1 directly beneath leaf sheath of true leaf #1 (FVD)
Figure 72 KQ228A internode 4 volume by treatment A) and leaf area B). GA inhibitor (Moddus) and YCS have
a larger supply to demand function than control. Tukey HSD All-Pairwise Comparisons (p<0.05)
There is a clear sucrose concentration gradient between Control, YCS and Moddus in internode 4
which sits directly beneath the YCS symptomatic leaf. Interestingly, Moddus has a significantly higher
internode 6 sucrose concentration than YCS and control (Figure 73). It is worth noting that YCS
internode 6 volume does not vary much to that of control, whereas Moddus internode 6 is
significantly smaller (Figure 71). Accordingly, YCS leaf 6 showed no sign of yellowing in any of the
reps (only leaf 4 was YCS symptomatic), which suggests source supply does not exceed the sink
capacity or demand.

Sugar Research Australia Final Report - Project 2015/016
112
Figure 73 KQ228A Internode 4 & 6 sucrose concentration; control, YCS and Moddus
The results from the growth regulator field trial show that limiting the internode size through
application of a GA inhibitor induced a YCS-like response. This culminates in sucrose and starch
accumulation levels comparable to that measured in YCS samples. The correlation between physical
sink size and photoassimilate accumulation was a major step forward in understanding potential
triggers that induce a YCS event. This also helped to explain why growers report a flush of yellow
across a field directly after a rainfall event that followed an extended dry period during the peak
photosynthetic months of December to March. If optimum conditions for photosynthesis occur
following a period in which internode elongation has been compromised, sugars rapidly build up in
the source leaves and trigger premature leaf senescence. Yellowing of the lamina will usually occur
when levels of sucrose exceed ≈200µmol/g DM. Once this tipping point is surpassed, the damage to
cells and tissue is irreversible.
YCS plants exhibit a major disruption to the supply and demand balance where supply is much
greater than sink demand or capacity.
6.4.2. Source sink imbalance & sink strength
As discussed in section 6.3.1.1 of this report, sugarcane loads the phloem through an apoplastic
step, requiring energy and specialised sucrose transporters to move sucrose against a concentration
gradient. Gene expression of sugar transporters and other required proton pumps in YCS leaves do
not indicate an issue with phloem loading. The 13C carbon turnover and hexose unit flow rates in the
midrib in YCS source leaves indicate there is reduced sap flow between the source and the sink
tissue. This implies reduced sink strength or a physical occlusion (see section 6.3.3. of this report) of
the phloem. In this section of the report we will address the issue of sink strength and the likelihood
of it being a cause of compromised sucrose transport between source and sink tissue.
Sucrose arrival in sink tissues (e.g. internodes) is determined by its movement along a pressure
gradient, created by the sucrose concentration and available water between the leaf and sink. This
gradient is maintained by adequate photoassimilation in the source, and a low sucrose
concentration in the parenchyma cytosol. Sucrose synthase and invertase are two critical enzymes
necessary for sucrose turnover and carbon repartitioning to take place and their activity is strongly
correlated with the import of sucrose by the sink tissue (Black et al., 1995; Morey et al., 2018). The
consumption and storage of sucrose along the transport path (metabolic rate and storage within the

Sugar Research Australia Final Report - Project 2015/016
113
sink tissue) together with the physical size of the sink organ determines sink strength (Bihmidine et
al., 2013).
In sugarcane, photoassimilates are initially used for growth and development but when the
internodes have ceased to elongate after approximately 380 ˚Cd (internode 8 & older) the culm
transitions to a storage organ. A reduction in sucrose usage by sinks occurs normally as internodes
mature. In mature internodes (internode 10 & older) sucrose hydrolysis slows to near zero and there
is a very much reduced metabolic rate (Botha et al., 1996; Moore and Botha, 2013). Sucrose
metabolism is therefore not a critical driver of sink strength in mature internodes. Where the
supplied sucrose is in excess of internode metabolic requirements and capability, it remains ‘unused’
by the internode and results in a disrupted concentration gradient between the leaf source and
internode sink. The disrupted sucrose gradient influences the sink strength signal. Maintenance of
sink strength is therefore highly dependent on a balance between storage and respiration (growth,
development, and maintenance). Sucrose levels at a given site is the net result of its import and use
at that point of ontogeny (Botha et al., 1996; Geiger et al., 1996; Bihmidine et al., 2013).
To gain an understanding of sink strength status at a molecular level in YCS plants, analysis of leaf
and internode gene expression data associated with changing levels (abundance and depletion) of
sugars is crucial. In order to understand if there is availability of sucrose to internode, or whether
sucrose is not reaching the internode, we investigated gene expression data of sucrose metabolism
genes.

Sugar Research Australia Final Report - Project 2015/016
114
Table 8 shows the main genes enhanced during either a feast or famine carbohydrate state in both
leaf and internode. The expression of photosynthetic genes and the remobilisation of reserves
(starch) is repressed by elevated levels of sucrose and glucose, while genes associated with sucrose
import and use are enhanced (initial sucrose cleavage, respiration, biosynthesis, and storage).
Differential expression analyses of carbohydrate regulated genes will also give an insight to the
important role played by these genes in maintaining a supply demand balance (photosynthesis Vs
utilisation) in response to environmental change (Geiger et al., 1996; Koch, 1996; Bihmidine et al.,
2013). Environmental factors can affect transport from the source to sink by influencing i) source:
e.g. photosynthetic rate, phloem loading ii) sink: e.g. internode and root growth, pathogens iii) path
between source and sink: e.g. callose, bacteria and viruses (Lemoine et al., 2013). It is worth noting
that the “omics” analyses across all samples analysed since the commencement of this research
project reveal a common thread of metabolic perturbance associated with abiotic stress.

Sugar Research Australia Final Report - Project 2015/016
115
Table 8 Feast & Famine genes
Plant sugar feast/famine genes
source 1: Koch, K.E. (1996) CARBOHYDRATE-MODULATED GENE EXPRESSION IN PLANTS Annu. Rev. Plant Physiol. Plant Mol. Biol. 1996. 47:509–40
“Famine” genes: enhanced by sugar depletion: “Feast” genes: enhanced by sugar abundance:
Genes enhanced under carbohydrate FAMINE conditions Genes enhanced by FEAST conditions
Photosynthesis: Polysaccharide biosynthesis (starch and other):
Rubisco S–subunit [rbcS] AGPase [Sh2] (starch)
Rubisco L–subunit [rbcL] starch phosphorylase
chl a/b–binding protein (cab, Lhcb) starch synth [GBSS]
atp-δ thylakoid ATPase branching enzyme [BE]
malic enzyme, C4 [Me1] Storage proteins:
PEP carboxylase, C4 [Pepc1] sporamin, A & B types
triose-phosphate translocator β-amylase (storage protein?)
pyruvate PPdikin [Ppdk1] patatin class I
C4-pyruvate phosphodikinase proteinase inhibitor II [Pin2]
Remobilization (starch, lipid, and protein breakdown): lipoxygenase (storage protein)
Amy3D, Amy3E α-amylase Pigments and defense:
α-amylase chalcone synth (pigment/path.)
plastid starch phosphorylase RT locus (pigment synth)
phosphoglucose mutase dihydroflavonol-reductase
isocitrate lyase [Icl] (glyox cycle) Mn-superoxide dismutase
malate synth (glyox cycle) hrp (pathology)
proteases chaperonin 60B (protein synth)
asparagine synthetase (N cycling Respiration:
Sucrose and mannitol metabolism (synthesis and breakdown): PGAL-dehydrog. (GapC) cyto
acid invertase β-isopropylmalate dehydrog.
S synth apocytochrome 6 (co6)
SPS PP-F-6-P phosphotransferase (cytosolic enzyme)
Mtol dehydrogenase Sucrose metabolism:
invertase
S synth
Abbreviations: 2dG, 2-deoxy-glucose; acet, acetate; cult, culture; endo, endosperm; F, fructose; G, glucose; SPS
Lhcb, light-harvesting chlorophyll-binding protein (also cab); lvs, leaves; M, mannose; Mal, maltose; Mtol, Other:
mannitol; PEP, phosphoenolpyruvate; PPdikin, phosphodikinase (cytosolic); rts, roots; scutel, scutellum; Sh1, nitrate reductase
Shrunken1; S, sucrose; SPS, sucrose phosphate synthase; trans expr, transient expression; synth, synthase. SAM synth
ro/C gene of Ri plamid
30-kD Rubisco-assoc. protein
Abbreviations: 6dG, 6-deoxy-glucose; AA, amino acids; cult plts, cultured plants; F, fructose; G, glucose;
GapC, PGAL-dehydrogenase (cytoplasmic); Gln, glutamine; Glu, glutamate; lvs, leaves; Mal, maltose; MeJA,
methyl jasmonate; Met, methionine; p-coumar, p-coumaric acid; PGAL, glyceraldehyde-3-phosphate
dehydrogenase; pgal a., polygalacturonic acid; PP-F-6-P phosphotransferase, pyrophosphate:fructose-6-
phosphate-phototransferase; S, sucrose; SPS, sucrose phosphate synthase
Table 9 shows a summary of the expected gene expression status for leaf and internode tissue
induced by feast and famine conditions compared to YCS tissue. Investigation of these two tissue
types (leaf 4 & internodes 2, 4 & 6) collected from the Growth Regulator Trial (FV14) unsurprisingly
showed YCS leaf tissue is in a feast status due to sucrose accumulation resultant of compromised
phloem transport. In a feast situation, photosynthetic activity and sucrose synthesis is inhibited by
feedback regulation (decrease in sucrose synthase) while excess carbon is directed to starch
synthesis (20-fold increase in starch phosphorylase). Investigation into the two main sucrose
cleavage enzymes associated with sink strength yields some interesting results. Firstly, soluble acid
invertase (vacuolar invertase) is approximately 15-fold down regulated in internodes 2, 4 and 6 of
YCS stalks. While vacuolar invertase gene expression is not a direct measure of enzyme activity, it
can be used as a proxy of sink strength and to also reflect the possible hexose-to-sucrose ratios
which are instrumental to the regulation of the sucrose gradient (Morey et al., 2018). In sugarcane,
soluble acid invertase activity reduces significantly as the culm transitions to storage of sucrose in
the vacuole. Secondly, the increase in expression of sucrose synthase is not surprising as its catalysis
of the reversible cleavage of sucrose to UDP-glucose and fructose in the cytosol is known not to be
inhibited by high substrate concentrations (Black et al., 1995). These results suggest that all three
YCS internodes (2, 4 & 6) have weak sink strength (sucrose is available, but not “used”), more
indicative of a mature culm.
It is therefore highly probable that reduced physiological capacity together with reduced physical
capacity is the cause of reduced sap flow between the source and sink tissue which culminates in
leaf sucrose accumulation. The underlying factors that cause a reduced physical and physiological
capacity may be many and varied and could explain the sporadic nature of YCS occurrence and
severity within and between fields and between sugarcane growing regions.

Sugar Research Australia Final Report - Project 2015/016
116
Table 9 YCS tissue specific feast and famine gene expression
Tissue Expected Plant
Transcriptional Response
Leaf Feast Famine YCS
Photosynthesis ATPase ↓ ↑ ↓
Pyruvate phosphodikinase ↓ ↑ ↓
Remobilisation (breakdown of starch, lipids & proteins)
Alpha amylase ↓ ↑ ↓
Lipase ↓ ↑ ↓
Proteinase ↓ ↑ ↓
Sucrose/Starch metabolism
Sucrose synthesis (sucrose synthase) ↓
↑ ↓
Starch synthesis (branching enzyme & starch phosphorylase)
↑ ↓ ↑ (20-fold)
Internode
Sucrose metabolism
Soluble acid invertase (vacuole) ↓ ↑ ↓ (15-fold)
Sucrose synthase ↓ ↑ ↑ (2-fold)
6.4.3. Supply & Demand Balance
The readily available carbon for export from the leaf is a good measure of supply function while the
internode dry biomass is indicative of sink strength. At the stage where the leaves are symptomatic,
the sucrose and total α-glucan levels in the leaf represent 80% of the dry mass of the internode
attached to that leaf (Figure 74B). In comparison, this would only be 10% in the control tissue (Figure
74A). Mass flow between the source leaf and the internode in a symptomatic plant would therefore
be significantly impeded.

Sugar Research Australia Final Report - Project 2015/016
117
Figure 74 Supply and demand balance, Control A) and YCS B)
Total leaf (lamina and midrib combined) sucrose and α-glucan is a good measure of readily available
carbon for export to the sink. Conversely, the internode biomass is a reliable estimate of sink
demand. Therefore, the ratio between available carbon in the leaf and internode biomass can be
used to evaluate the balance between supply and demand.
An asymptomatic control plant has a supply demand balance of approximately 0.1 between the
fourth source leaf (counted from the first visible dewlap) and the internode directly beneath it
(Figure 75). Therefore, it can be assumed that values close to or equivalent to this benchmark are
indicative of an equilibrium between source and sink. Both YCS and Moddus treated plants clearly
show that supply significantly exceeds demand with ratios respectively eight and five-fold higher
than control (Figure 75). This evidence supports the hypothesis that carbon fixation and loading of
sucrose in the source phloem exceeds the sink demand or capacity. Quantification of readily
available carbon in a YCS symptomatic Leaf 4 shows there is approximately one gram of both sucrose
and total α-glucan on hand for export (Figure 76). These results confirm there is a significant excess
of carbon accumulating in the YCS leaf (sucrose:3-fold & total α-glucan:5-fold greater than control).
Failure to mobilise adequate amounts of carbon from the source tissue to maintain an equilibrium
with the sink leads to disruption of the supply and demand balance.

Sugar Research Australia Final Report - Project 2015/016
118
Figure 75 KQ228A leaf & internode 4 supply demand balance
Figure 76 KQ228A Leaf 4 (lamina and midrib inclusive) total sucrose and α-glucan content
In plant physiology it is generally accepted that the ‘source’ refers to photosynthetic tissue that is
mainly responsible for carbon fixation and export, while the ‘sink’ refers to tissue which is the store
of photoassimilation. Application of this definition ‘loosely’ to the source leaf shows that the sucrose
and two α-glucan pools in samples collected from the growth regulator field trial have distinct
differences between the cellular compositions of source and sink tissues with respect to these
metabolites (Figure 77). Our studies have noted that sucrose accumulation is highest in the midrib
and sheath with starch levels greatest in the lamina of a YCS symptomatic leaf 4. The same
correlation is evident when considering soluble α-glucan and insoluble α-glucan (starch) pools
respectively (Figure 78A-C). Interestingly, both YCS and the GA inhibitor ‘Moddus’ have very similar
quantities and patterns of distribution between the three tissue types for all three metabolites
(Figure 78A-C). This suggests that the metabolic response (carbon redirection and partitioning) to
reduced phloem export within the lamina of these two treatments is closely linked. Metabolomic
studies support this finding with a significant (p<0.0001) difference of only 5 major metabolites
(ribitol, proline, 9-12-15-octadecatrienoic acid, benzioic acid and β-sitosterol), between the YCS and
Moddus treatment.

Sugar Research Australia Final Report - Project 2015/016
119
Figure 77 Source sink tissue, sucrose, and α-glucans
Figure 78 Leaf source (A) and sink (B & C) tissue sucrose & α-glucan content; treatments: control, YCS and Moddus (GA inhibitor)
The segregated portions within the total α-glucan pool show most of the carbon is partitioned as
soluble α-glucans rather than starch in the source tissue (lamina). This is not surprising given that C4
plants like sugarcane are not anatomically or physiologically capable of synthesising and storing large
quantities of starch like their C3 counterparts. One parameter that limits the synthesis and storage of
starch in C4 plants is the number of available bundle sheath cells in which the chloroplasts synthesise
transitory starch during the day. It is well documented that starch synthesis also enables a higher
rate of photosynthesis to be maintained during periods of high light and CO2 when carbon
assimilation exceeds the rate of sucrose synthesis and export. On the other hand, sucrose synthesis
is favoured over starch when the photosynthetic rate is low. This regulatory control maintains a
source sink balance to prevent the accumulation of sucrose in the source tissue (Baker and Braun,

Sugar Research Australia Final Report - Project 2015/016
120
2008; Weise et al., 2011). Interestingly, our 13C studies showed there was a preference for starch
synthesis in YCS leaves which have pre-existing elevated levels of sucrose. This also supports our
gene expression studies (transcript abundance) of Sucrose phosphate synthase (SPS) and UDP
glucose pyrophosphorylase that show sucrose synthesis is mainly under metabolic control. When
sucrose accumulates in the cytosol of YCS plants it triggers the downregulation of the triose
phosphate transporter through feedback regulation which results in carbon retention in the
chloroplast (Figure 79) (Du et al., 2000; Weise et al., 2011). This is supported by an upregulation of
both ADP GlcPPase (α-glucan synthesis) and α-amylase (α-glucan breakdown). An appreciation of the
extent of the soluble α-glucan pool provides a better understanding of the metabolic response in the
source tissue when sucrose export is compromised.
Figure 79 α-Glucan synthesis through CO2 fixation A) sucrose breakdown B)
In contrast, the midrib and sheath which are mostly composed of sink tissue have lower levels of
insoluble α-glucan (starch) and higher levels of soluble α-glucan than the lamina across all
treatments (Figure 80A-C). This is most likely due to anatomical differences between the tissue
types. Even though the midrib contains chloroplasts on its abaxial surface, it does not possess
stomata and therefore cannot fix carbon through photosynthesis. Therefore, in the sink tissue the
carbon required for synthesis of soluble and insoluble α-glucans is derived from sucrose breakdown,
whereas in the photosynthetically active tissue it is derived from CO2 fixation (Figure 79) (Myers et
al., 2000). Higher levels of soluble α-glucan in sink tissue than in lamina also supports previous
findings that phloem loading is not compromised. Also, the ability to partition excess carbon into
alternative pools such as the phenylpropenoid and shikimate pathways seen in the lamina does not
appear to be an option in the mostly sink tissue of the midrib and sheath. This may reflect reduced
cellular diversity and metabolic plasticity.
Another point of note is that the insoluble proportion of the total α-glucan pool is approximately the
same for all three tissue types (lamina, midrib and sheath) and treatments (control, YCS and
Moddus) (Figure 80A-C).

Sugar Research Australia Final Report - Project 2015/016
121
Figure 80 Starch proportion of total α-glucan pool Lamina A) Midrib B) Sheath C)
While this may seem unusual, it is consistent with uniform ratios of sucrose and starch reported
between the source and sink tissues as well as the apoplastic fluid in YCS and control plants. This
suggests that the cause of sucrose accumulation in YCS leaves and subsequent increases in the α-
glucan pools is not due to a major physical blockage of the phloem that would ultimately disrupt
these ratios. To prevent the accumulation of sucrose above the upper tolerable threshold, carbon is
uniformly redirected or repartitioned to other pools in order to maintain homeostasis. The
proportions within each pool is ultimately dictated by the cellular composition and available
metabolic machinery of the tissue affected.
The combined data shows that the cause of sucrose accumulation in the YCS leaf, and the ensuing
onset of yellowing, is the result of a physiological disorder triggered by reduced sink strength or
carbon fixation rates that exceed maximum possible translocation rates through the phloem.
Anything that can cause a source sink imbalance by significantly impeding mass flow of sucrose from
the source leaf to the culm will induce early senescence. Therefore, YCS does not have a single
cause; any factor that reduces sink strength, respiration and accelerates photosynthesis could trigger
the event. Thus, YCS is a condition that is comparable to source sink regulated induced senescence.
6.5. Crop stress & YCS
Many research programs focus on understanding the stress response of plants. The objective is to
improve productivity in existing fields and open up more marginal, higher stress environments to
agriculture to meet the ever-growing world population and needs of the consumer. A C4 crop like
sugarcane fills a specific niche as it has one of the highest biomasses of any crop in the world and
can tolerate a wide range of environmental conditions. The other attractive feature of C4
photosynthesis is the operation of a CO2-concentrating mechanism in the leaves, which serves to
saturate photosynthesis and suppress photorespiration in normal air. Unfortunately, less is known
about C4 photosynthesis than C3.
C4 photosynthesis is highly sensitive to stress, with three defined phases
i) an early stomatal phase which may or may not be detected as a decline in
assimilation (CO2 fixing capacity and refixing in bundle sheath)
ii) a mixed stomatal and non-stomatal phase (damage to ETC) and,
iii) a mainly non-stomatal phase (carbon partitioning and cell death).
The main non-stomatal factors include
A B C

Sugar Research Australia Final Report - Project 2015/016
122
iv) reduced activity of photosynthetic enzymes; inhibition of nitrate assimilation,
induction of early senescence,
v) sucrose and starch accumulation
vi) and changes to the leaf anatomy and ultrastructure
When plants are under environmental stress the photosynthetic light-dependent reactions are
downregulated. This results in an over-reduction of the PET chain and generates reactive oxygen
species (ROS). Non-photochemical quenching dissipates excess excitation energy (EEE), enabling
photoprotection through the reduction in ROS production (Gill and Tuteja, 2010). Alternatively, the
deleterious effects of ROS can be reduced through the activities of scavenging molecules such as
antioxidant enzymes and metabolites. In both YCS asymptomatic and symptomatic tissue we see an
increase in antioxidant enzymes such as the peroxidases, ascorbate peroxidases, superoxide
dismutase, glutathione reductase and catalase. Metabolites of note include carotenoids,
tocopherols, glutathione and ascorbate (Marquardt, 2019).
Cyclic electron flow is another mechanism that can reduce the effects of EEE in combination with
antioxidant enzymes and alternative electron sinks (Strand et al., 2015). The production of ROS and
redox molecules are thought to be involved in signalling between chloroplasts and the nucleus
during plant stress (Mueller and Berger, 2009). This mechanism would allow for the regulation of
nucleus-encoded genes for the chloroplast proteins. It is well documented that chloroplasts act as
excellent sensors of environmental stress, linking plant metabolism and carbon reactions (Ahmad,
2014).
Oxidative stress can be caused by both biotic (pests and pathogens) and by abiotic (photosynthesis,
metabolism, high light and temperature, water and nutrient limitations, high salt and heavy metal
soils and elevated ozone) means (Apel and Hirt, 2004; Cakmak and Kirkby, 2008; Nishizawa et al.,
2008; Keunen et al., 2013; Sham et al., 2014). It is worth noting here that our analyses have found no
evidence of any YCS-associated biotic factors like bacterial, viral, or archaeal microorganisms in our
sequencing data. It is far more likely that the oxidative stress response we see here in YCS-affected
plants is due to abiotic factors.
6.5.1. Transcriptome Results and Discussion
Our transcriptome data shows an overwhelming correlation between YCS and abiotic stress. YCS
shows similarity to abiotic stress responses on the protein level through chloroplast and
photosynthetic ETC process down-regulation, increased oxidative stress, chaperonins, and protease
upregulation. YCS also shows protein changes often associated with a leaf “feast” state, in addition
to general abiotic stress associated with disruptions to sugar and starch turnover, sugar transport,
carbohydrate/energy balance and organic acid metabolism. This is supported by transcriptome
analyses that consistently feature upregulation of cell membrane degradation and oxidative stress
(Figure 81, Figure 82). For this analysis, the RNAseq reads were mapped to the YCS reference
Transcriptome produced during this study.

Sugar Research Australia Final Report - Project 2015/016
123
Figure 81 Transcriptomic differential expression analysis showing the biological processes enriched in the
transcripts up-regulated in YCS-affected plants
Figure 82 Molecular functions enriched in the transcripts in higher abundance in YCS
The following differential expression analysis revealed 327 transcripts whose expression changed
directly in response to YCS. These transcripts, with a Bonferroni-corrected p-value of 0.0 and a log2
fold change of greater than the absolute value of 1, are highlighted in red in Figure 83. The link
between water or osmotic stress and reduced stomatal conductance, growth rate (stem
elongation)/sink strength, increased heat, cell membrane and mechanical damage, disruption to
metabolism, photosystems, and induced senescence is clearly evident.

Sugar Research Australia Final Report - Project 2015/016
124
Figure 83 Volcano plot (log fold change against log p-value) of YCS differential expression results, with the highly significant transcripts (Bonferroni-corrected p-value = 0.0 and log2 absolute fold change >1) shown in red.
A Bonferroni-corrected p-value of zero means that there is practically zero likelihood of these
expression changes occurring by chance. While the analysis could have been done using a less
stringent statistical threshold, we have chosen to focus on those transcript expression changes that
have occurred in direct response to YCS. This focus removes much of the noise and makes the results
clearer to interpret. Using this measure, 327 transcripts were found to be highly significant in YCS.
These highly significant transcript expression changes were split into those in higher abundance in
YCS (123 transcripts) and those in lower abundance in YCS (204 transcripts) as compared to the
healthy controls, for the next section.
6.5.2. Higher abundance transcripts in YCS
Small subsets of the full expression table are included below. The full expression table forms part of
the supplementary material.
Table 10 shows the transcripts with an over 50 times greater abundance in YCS, sorted by Fold
Change in descending order.

Sugar Research Australia Final Report - Project 2015/016
125
Table 10: Transcript abundance in YCS over 50-fold greater than in the healthy controls.
Transcript Name Transcript Annotation Description Fold change in YCS
YCS-internode-contig_66889 thioredoxin h2 557.0873
YCS-leaf-contig_51243 PREDICTED: uncharacterized protein LOC101760134 454.8396
YCS-internode-contig_117452 retrotransposon unclassified 225.4676
YCS-leaf-contig_72328 disease resistance RPM1-like 215.6185
YCS-internode-contig_61030 rRNA N-glycosidase 193.5763
YCS-leaf-contig_12893 Zinc knuckle family expressed 179.7022
YCS-internode-contig_123895 ricin-agglutinin family 130.0371
YCS-internode-contig_59004 hypothetical protein Ccrd_002160 121.9336
YCS-internode-contig_28969 disease resistance RPM1 108.4387
YCS-leaf-contig_22368 thioredoxin H2-like 100.9698
YCS-internode-contig_65157 receptor kinase At4g00960 92.40045
YCS-internode-contig_87450 retrotransposon unclassified 78.50381
YCS-internode-contig_58254 Disease resistance RPP13 76.08452
YCS-internode-contig_126434 no homology found during annotation 75.82117
YCS-internode-contig_148991 disease resistance TAO1-like isoform X1 73.36546
YCS-internode-contig_73083 probable LRR receptor-like serine threonine- kinase At3g47570 isoform X1 72.40314
YCS-leaf-contig_116952 poly 67.8532
YCS-internode-contig_84764 disease resistance RPP13 2 66.61418
YCS-internode-contig_31065 PREDICTED: uncharacterized protein LOC9269814 65.04132
YCS-internode-contig_136782 no homology found during annotation 60.82665
YCS-internode-contig_28044 disease resistance RPP13 2 59.78355
YCS-internode-contig_23999 no homology found during annotation 57.74354
YCS-internode-contig_17589 hypothetical protein SORBI_3001G311601 53.92115
YCS-internode-contig_33452 60 kDa jasmonate-induced -like 53.54455
YCS-internode-contig_55760 hypothetical protein SORBI_3005G003400 52.26274
YCS-internode-contig_32540 disease resistance RPM1-like 51.55303
These results show that oxidative stress and perturbed electron transport are key molecular features
of YCS. The transcript with the highest expression fold change in YCS was (YCS-internode-
contig_66889) annotated as ‘thioredoxin h2’, which was 557 times more abundant in YCS samples.
Another transcript (YCS-leaf-contig_22368) with a similar ‘thioredoxin H2-like’ annotation was also
100 times more abundant in YCS samples. Thioredoxin is involved in regulating photosynthesis
through electron transport, and functions in defence against oxidative stress (Arnér and Holmgren,
2000). As electron acceptors, thioredoxins play an important role in regulating carbon photo-
assimilation (Schürmann and Jacquot, 2000).
Drought water stress was revealed to be directly related to YCS expression. At 454-fold higher
abundance, the transcript (YCS-leaf-contig_51243) was the second-highest upregulated in YCS and is
annotated as ‘PREDICTED: uncharacterized protein LOC101760134’. The expression of this protein
has been shown to be highly induced in sugarcane cultivars subjected to prolonged water deficit
(Belesini et al., 2017).

Sugar Research Australia Final Report - Project 2015/016
126
Heat stress is also implicated in YCS. The transcript (YCS-internode-contig_59004) annotated as
‘hypothetical protein Ccrd_002160’ was 121-fold more abundant in YCS. The transcript was BLAST
matched to a similar Arabidopsis protein (AT4g17250/dl4660w,
https://www.uniprot.org/uniprot/Q93ZA8 , accessed 02/04/20). This protein has been shown to be
upregulated in Arabidopsis in response to heat stress (Lim et al., 2006). Our data show there is
reduced stomatal conductance and a distinct K-step in the O-K-J-I-P transient Chl a fluorescence
studies and inhibition of the OEC in YCS plants. These are all indicative of elevated leaf temperature
(see section 6.2.3 of this report).
Plant stress is further implicated in YCS with the two retrotransposon transcripts (YCS-internode-
contig_117452 and YCS-internode-contig_87450) that appeared in the list, at 225- and 78-fold higher
abundance in YCS respectively. Retrotransposons are known to be transcriptionally activated by
various biotic and abiotic plant stresses (Grandbastien, 1998; Kumar and Bennetzen, 1999). This
indicates the high levels of stress that YCS plants endure and underlines the importance of plant
stress in triggering expression of typical YCS symptoms in crops.
In addition to stress, disease resistance response appears to be important in YCS. Three types of
disease resistance (RPM1, TAO1 and RPP13) responses from seven separate transcripts were
upregulated more than 50-fold in YCS. These transcripts confer protection to the plants from
bacteria and fungi and are involved in triggering a hypersensitive response
(https://www.uniprot.org/uniprot/Q39214 /Q9FI14 and /Q9M667 , accessed 2/4/20). Given that
previous research (Hamonts et al., 2018) failed to find a consistent biotic signal in YCS plants, these
upregulated transcripts may be indicative of a secondary, opportunistic response of various
microorganisms feeding on the high sucrose levels retained in the leaf tissue of YCS-symptomatic
plants.
Plant defence is also implicated in YCS, by the three transcripts (YCS-internode-contig_61030, YCS-
internode-contig_123895 and YCS-internode-contig_33452) that were annotated with ‘rRNA N-
glycosidase’, ‘ricin-agglutinin family’ and ‘60 kDa jasmonate-induced -like’, which were 193-, 130-
and 53-fold more abundant in YCS respectively. These transcripts may play a role in protecting plants
from viruses or herbivorous insects (Dunaeva et al., 1999; Peumans and Damme, 2001).
Circadian rhythm disruption has been reported previously in YCS-symptomatic plants and is
supported in this study with the transcript (YCS-leaf-contig_12893) ‘Zinc knuckle family expressed’
having a 179 times higher abundance in YCS (Marquardt et al., 2016; Marquardt et al., 2017). Zinc
knuckle proteins have been shown to regulate growth-related genes in a circadian manner in
response to light, with experimental over-expression resulting in extended elongation phases for
growing plant organs (Loudet et al., 2008). Therefore, this transcript upregulation may serve to
counteract the source-sink imbalance linked to YCS development as postulated in this final report.
Protein modification is upregulated in YCS, with two transcripts (YCS-internode-contig_65157 and
YCS-internode-contig_73083 ) annotated as ‘receptor kinase At4g00960’ and ‘probable LRR
receptor-like serine threonine- kinase At3g47570 isoform X1’ being 92-fold and 72-fold more
abundant respectively in YCS than in the healthy controls. These transcripts are involved in protein
phosphorylation (https://www.uniprot.org/uniprot/O23082 and
https://www.uniprot.org/uniprot/C0LGP4 accessed 02/04/20). While it’s not clear which proteins

Sugar Research Australia Final Report - Project 2015/016
127
are being phosphorylated in this situation, such modifications serve to regulate enzyme activity and
form part of complex signalling pathways within the cell (Olsen et al., 2006).
While the remainder of the transcripts in the table were without functional annotation, we
submitted all of the upregulated transcripts to the MapMan4 webtool
(https://plabipd.de/portal/mercator4 accessed 28/03/20; (Schwacke et al., 2019) to investigate the
metabolic pathways upregulated in YCS. The results show that the pathways upregulated in YCS
include carbohydrate metabolism, amino acid metabolism, nucleotide metabolism, polyamine
metabolism, redox homeostasis, protein modification, solute transport and enzyme classification.
The sequence of events that lead to the disruption of leaf metabolism, the development and
expression of YCS are put forward in the following conceptual model (Figure 84).
Figure 84 Simplified conceptual model of YCS development. The symptoms of YCS (leaf yellowing) are the result of sucrose feedback regulatory effects upon photosynthesis in leaf lamina, due to inadequate sucrose movement out of the leaf whereby sucrose movement through the phloem (out of the leaf) is influenced at a point beyond the leaf sheath and linked to reduced sink strength.
6.5.3. Lower abundance transcripts in YCS
The 204 downregulated transcripts were similarly submitted to the MapMan4 webtool
(https://plabipd.de/portal/mercator4 accessed 28/03/20; (Schwacke et al., 2019) to investigate the
metabolic pathways downregulated in YCS. The results show that the pathways downregulated in
YCS include chromatin organisation, protein modification and enzyme classification. While two of
these pathways were also upregulated in YCS, the transcripts involved in each group were placed
into different bin sub-compartments. This is indicative of the complex signalling pathways involved
in YCS.
Table 11 shows the transcripts with an over 50 times lower abundance in YCS, sorted by Fold Change
in descending order.

Sugar Research Australia Final Report - Project 2015/016
128
Table 11 Transcripts abundance over 50 times lower in YCS than in the healthy controls.
Transcript Name Transcript Annotation Description Fold change in YCS
YCS-leaf-contig_17098 thiol protease SEN102-like -372.745
YCS-leaf-contig_12909 disease resistance RPP13 -365.571
YCS-leaf-contig_80039 inactive disease susceptibility LOV1 isoform X1 -333.769
YCS-internode-contig_54680 NC domain-containing -related -325.06
YCS-internode-contig_96292 disease resistance RPP13 3 -290.497
YCS-leaf-contig_12015 ERBB-3 BINDING PROTEIN 1 -279.421
YCS-internode-contig_147271 disease resistance RPP13 3 -269.705
YCS-internode-contig_40467 disease resistance RPP13 2 -268.712
YCS-internode-contig_152225 probable disease resistance At4g27220 -252.498
YCS-internode-contig_120597 no homology found during annotation -214.248
YCS-internode-contig_38877 1-aminocyclopropane-1-carboxylate oxidase homolog 1-like -189.846
YCS-leaf-contig_117596 Disease resistance RPP8 3 -158.031
YCS-internode-contig_107136 Tyrosine-sulfated glycopeptide receptor 1 -143.016
YCS-internode-contig_90793 disease resistance RPP13 3 -134.642
YCS-internode-contig_129275 disease resistance RPP13 1 -128.337
YCS-internode-contig_123845 disease resistance RPP13 3 isoform X1 -128.268
YCS-internode-contig_114126 disease resistance RPP13-like -109.382
YCS-leaf-contig_1275 receptor kinase At3g47110 isoform X1 -105.622
YCS-internode-contig_50228 serine threonine kinase -100.356
YCS-internode-contig_140218 no homology found during annotation -97.3528
YCS-internode-contig_47899 no homology found during annotation -92.1182
YCS-internode-contig_90491 hypothetical protein SORBIDRAFT_05g026310 -81.5799
YCS-internode-contig_88793 NC domain-containing family -79.7855
YCS-internode-contig_85963 cysteine-rich receptor kinase 12 isoform X1 -74.5204
YCS-internode-contig_94217 PREDICTED: uncharacterized protein LOC100836056 isoform X1 -74.1727
YCS-internode-contig_40527 ALTERED XYLOGLUCAN 4 -72.9392
YCS-leaf-contig_123249 very low-density lipo receptor isoform X1 -67.8642
YCS-leaf-contig_40936 disease resistance RPP13-like -67.1522
YCS-internode-contig_121112 disease resistance RGA1 -65.9965
YCS-internode-contig_77154 no homology found during annotation -63.6156
YCS-internode-contig_123374 hypothetical protein SORBIDRAFT_05g022610 -61.4649
YCS-leaf-contig_10567 proline-rich receptor kinase PERK4 isoform X1 -60.7898
YCS-internode-contig_50581 disease resistance RPM1-like -58.2054
YCS-internode-contig_67000 ubiquitin-like-specific protease 1B -54.2002
YCS-internode-contig_9130 Nitrate transporter -53.9854
YCS-internode-contig_135620 Retrovirus-related Pol poly LINE-1 -53.8903
YCS-leaf-contig_58531 condensin-2 complex subunit H2 -53.1811
YCS-internode-contig_64173 retrotransposon expressed -51.5089
YCS-leaf-contig_38936 hypothetical protein SORBI_3002G343901 -50.7295
YCS-internode-contig_51648 no homology found during annotation -50.5671

Sugar Research Australia Final Report - Project 2015/016
129
These results indicate that YCS-affected sugarcane may be in a developmental stage related to the
ripening off stage that normally occurs just prior to harvest. Here, the transcript (YCS-leaf-
contig_17098) annotated as ‘thiol protease SEN102-like’ was 372-fold less abundant in YCS than in
the healthy controls. This protein has been shown to be downregulated in plants, particularly fruits,
when ripening occurs (Drake et al., 1996). Alternatively, as the ripening process in sugarcane is
metabolically similar to mild water stress, affecting stalk elongation (Morgan et al., 2007), so this
highly down-regulated transcript may instead be indicative of plant stress caused by a water deficit.
Interestingly, like the higher abundance transcripts, many of the transcripts in lower abundance in
YCS were ones related to disease resistance. Five disease resistance annotations (RPP13, At4g27220,
RPP8 3, RGA1, RPM1-like) from thirteen different transcripts were significantly down-regulated in
YCS, with expression changes ranging from 58- to 365-fold lower abundance in YCS. This result
suggests that plant pathogens are not involved in YCS, and may instead reflect the complex,
multicomponent regulatory system involved in plant immunity (Andersen et al., 2018).
Leaf tissue abscission may be important in YCS. The transcript (YCS-leaf-contig_80039) annotated as
‘inactive disease susceptibility LOV1 isoform X1’ is 333-fold lower abundant in YCS. The transcript
annotation is a synonym for ‘LONG VEGETATIVE PHASE 1’, and this protein is a transcription factor
that has been shown to regulate leaf abscission through a decrease in expression as the abscission
process develops (Kim et al., 2016). In addition, LOV1 expression is thought to be controlled by the
photoperiod pathway and regulates abiotic stress response where a decrease in expression triggers
a hypersensitive response (Yoo et al., 2007). This suggests that YCS leaf yellowing is terminal for that
leaf and may result in the leaf being sacrificed by the plant. This would not have a serious impact as
sugarcane can grow a new leaf approximately every 150°Cd or about every 7-10 days in summer
(Inman-Bamber, 1994; Inman-Bamber et al., 2005)
Abiotic stress response is again highlighted in YCS, with the two transcripts annotated as ‘NC
domain-containing -related’ (YCS-internode-contig_54680 and YCS-internode-contig_88793)
expressed 325-fold and 79-fold lower abundance respectively in YCS. Low expression of this protein
under drought and salt stress regulates plant growth (Nounjan et al., 2018).
Reduced growth in YCS is also supported by the ‘ERBB-3 BINDING PROTEIN 1’ transcript (YCS-leaf-
contig_12015) having a 279-fold lower abundance in YCS. Expression of this protein regulates plant
growth and affects plant organ size, with low expression resulting in reduced growth (Horváth et al.,
2006).
Reduced cell elongation may contribute to the reduced growth phenomenon in YCS. The transcript
‘1-aminocyclopropane-1-carboxylate oxidase homolog 1-like’ (YCS-internode-contig_38877) was
down-regulated 189-fold in YCS. This protein is involved in ethylene biosynthesis and reduced
expression results in reduced stem elongation (Qin et al., 2007). In addition, the transcript (YCS-leaf-
contig_10567) annotated as ‘proline-rich receptor kinase PERK4 isoform X1’ was 60-fold less
abundant in YCS. This transcript codes for a protein that regulates the ABA-mediated growth
inhibition in response to water deficit stress, with particular effect on cell elongation (Sharp et al.,
1994; Davies et al., 2005; Bai et al., 2009). In section 6.2.5 of this report we showed upregulation of
trehalose synthesis through TPP and TPS in all YCS leaf tissue. This is dependent on the T6P
precursor (Figueroa and Lunn, 2016). T6P has been implicated in regulating growth and
development through the protein SnRK1 which suppresses photosynthesis, carbohydrate and amino

Sugar Research Australia Final Report - Project 2015/016
130
acid pathways (Nuccio et al., 2015). Furthermore, T6P has been linked to ABA-mediated stress
responses in plants (Li et al., 2014). ABA levels in YCS symptomatic leaf tissue are approximately 2 to
4-fold higher than asymptomatic controls (Figure 85).
Figure 85 Changes in ABA and ABA catabolites in YCS symptomatic and asymptomatic leaves. Q200A in the Herbert (A), KQ228A in the Burdekin (B) and Q208A in Mackay (C). Values ± standard deviation (Botha et al., 2015)
Reduced growth in YCS is further supported by the transcript (YCS-internode-contig_107136)
annotated as ‘Tyrosine-sulfated glycopeptide receptor 1’ which was 143-fold lower in abundance in
YCS. This protein mediates a signalling pathway that regulates plant growth, plant immunity and
energy production (https://www.uniprot.org/uniprot/Q9C7S5 accessed 03/04/20; (Amano et al.,
2007).
The two transcripts (YCS-leaf-contig_1275 and YCS-internode-contig_50228), annotated as ‘receptor
kinase At3g47110 isoform X1’ and ‘serine threonine kinase’ respectively, were 105- and 100-fold
down-regulated in YCS. Both these proteins play a role in the MAPK signalling pathway, specifically
with pathogen infection (https://www.genome.jp/kegg-bin/show_pathway?ko04016+K13420), and
their down-regulation in YCS is further support that plant pathogens are not involved in YCS and that
the underlying cause of YCS is most likely to be abiotic in origin.
Early senescence in YCS is indicated by the 74-fold down-regulation of the transcript (YCS-internode-
contig_85963) annotated as ‘cysteine-rich receptor kinase 12 isoform X1’. In transgenic studies, the
knockout model for this protein exhibited an early flowering and early leaf senescence phenotype
(Idänheimo, 2015), so presumably a significant down-regulation would have a similar effect. This
supports our research conclusion that YCS is a form of source sink related senescence
The transcript (YCS-internode-contig_40527) annotated as ‘ALTERED XYLOGLUCAN 4’ was 72-fold in
lower abundance in YCS. This protein is involved in O-acetylation of the hemicellulose xyloglucan in
the plant cell wall (Gille et al., 2011). In transgenic studies, non-functional mutant versions of this
protein had very little phenotypic effect, although it was hypothesised that the cell wall structure
may play a role in plant defence and xylem structure (Gille et al., 2011; Schultink et al., 2015). It is
unclear what the consequence of the reduced expression of this protein in YCS would be.

Sugar Research Australia Final Report - Project 2015/016
131
Equally unclear is the effect of the downregulation of the transcript (YCS-leaf-contig_123249)
annotated as ‘very low-density lipo receptor isoform X1’, which was 67-fold less abundant in YCS.
This protein is involved in molecular signalling, with the Sorghum homolog annotated as ‘G protein-
coupled receptor signalling pathway’ (https://www.ebi.ac.uk/QuickGO/term/GO:0007186 and
https://www.kegg.jp/ssdb-bin/ssdb_best?org_gene=ptr:455722 accessed 06/04/20). It is not known
which signal this protein is mediating in YCS.
Changes in signalling pathways and regulation are further supported by the 61-fold lower abundance
in YCS of the transcript (YCS-internode-contig_123374), annotated as ‘hypothetical protein
SORBIDRAFT_05g022610’. This protein was BLAST matched to a putative retrotransposable element
in rice (GenBank accession AAN04214.1). In addition, the transcript (YCS-internode-contig_64173)
annotated as ‘retrotransposon expressed‘ was also 51-fold less abundant in YCS. Transposons are
well known to modulate gene expression and plant response, particularly under stress conditions
(Negi et al., 2016; Dubin et al., 2018), and this result further illustrates the role of plant stress
underlying YCS.
Turnover of abnormal or short-lived proteins may be impacted in YCS. The transcript (YCS-internode-
contig_67000) annotated as ‘ubiquitin-like-specific protease 1B’ was 54-fold less abundant in YCS.
This transcript codes for a sumoylation protease involved in essential protein degradation and
turnover of abnormal and short-lived proteins (Yan et al., 2000; Schulz et al., 2012). Plant stress is
implicated here too, as the transcript is expressed in Cajal bodies, which are distinct sub-nuclear
structures. Cajal bodies are known to be functionally affected during a plant stress response and
indeed may play a role in regulating abiotic stress responses in the plant (Love et al., 2017) .
The transcript (YCS-internode-contig_9130) annotated as ‘Nitrate transporter’ was 53-fold less
abundant in YCS. Nitrate transporters have a multitude of functions within the plant, particularly in
mediating plant growth and stress response (Fan et al., 2017). Of relevance to YCS, the expression of
several nitrate transporters has been shown to be downregulated in plants undergoing osmotic or
drought stress (Fan et al., 2017).
The transcript (YCS-leaf-contig_58531) annotated as ’condensin-2 complex subunit H2’ was 53-fold
less abundant in YCS. This protein is involved in DNA replication and repair during mitosis, and it’s
lower abundance may be indicative of less cell replication occurring in YCS, resulting from a reduced
growth rate (Fujimoto et al., 2005); https://www.uniprot.org/uniprot/Q9LUR0 accessed 06/04.20.
6.5.4. Principle component analysis
To investigate the underlying structure of the data and the factors influencing YCS expression, the
samples were clustered by the principal components of the YCS Reference transcript expression data
and were visualised in the following figures.
In Figure 86, the two principal components 1 and 2 show that the biggest impacts on transcript
expression were firstly the sample batch (when and where the sample was taken, processed and/or
sequenced), with PC1 explaining 22.3% of the variation, and secondly the sample tissue type, with
PC2 explaining 7% of the variation.
Figure 87 show the same plot as Figure 86, this time with the sample’s cultivar (variety) labelled, to
demonstrate that while the cultivars could be separated out, the sample batch was a better
explanation for the data.

Sugar Research Australia Final Report - Project 2015/016
132
Figure 88 shows the principal components PC3 against PC5. It is only in this plot that the YCS and
Control samples start to cluster away from each other by treatment. Here, PC3 and PC5 explain 3.8%
and 2.6% of the expression data, respectively.
Together, these PCAS results show that the batch effect and tissue type were more influential than
the cultivar on the transcript expression, and that the treatment type (YCS or Control) explained only
a small proportion of the result.
Similarly, Figure 89 shows a heat map analysis of the 327 highly significant transcripts differentially
expressed in YCS. As the heatmap demonstrates, the batch, tissue and variety type all help explain
the clustering, and the transcripts cannot be clearly grouped only by treatment type.
This supports our conclusion that YCS is a physiological disorder and our samples display varying
degrees of metabolic disruption dependent on the degree of sink limitation or source sink
imbalance. This also supports our findings that YCS is not the result of a single cause.
Figure 86 PCA plot of YCS and Control expression data, showing PC1 against PC2.

Sugar Research Australia Final Report - Project 2015/016
133
Figure 87 Another PCA plot of YCS and Control expression data, showing PC1 against PC2, this time with the variety type labelled.

Sugar Research Australia Final Report - Project 2015/016
134
Figure 88 PCA plot of YCS and Control expression data, showing PC3 against PC5
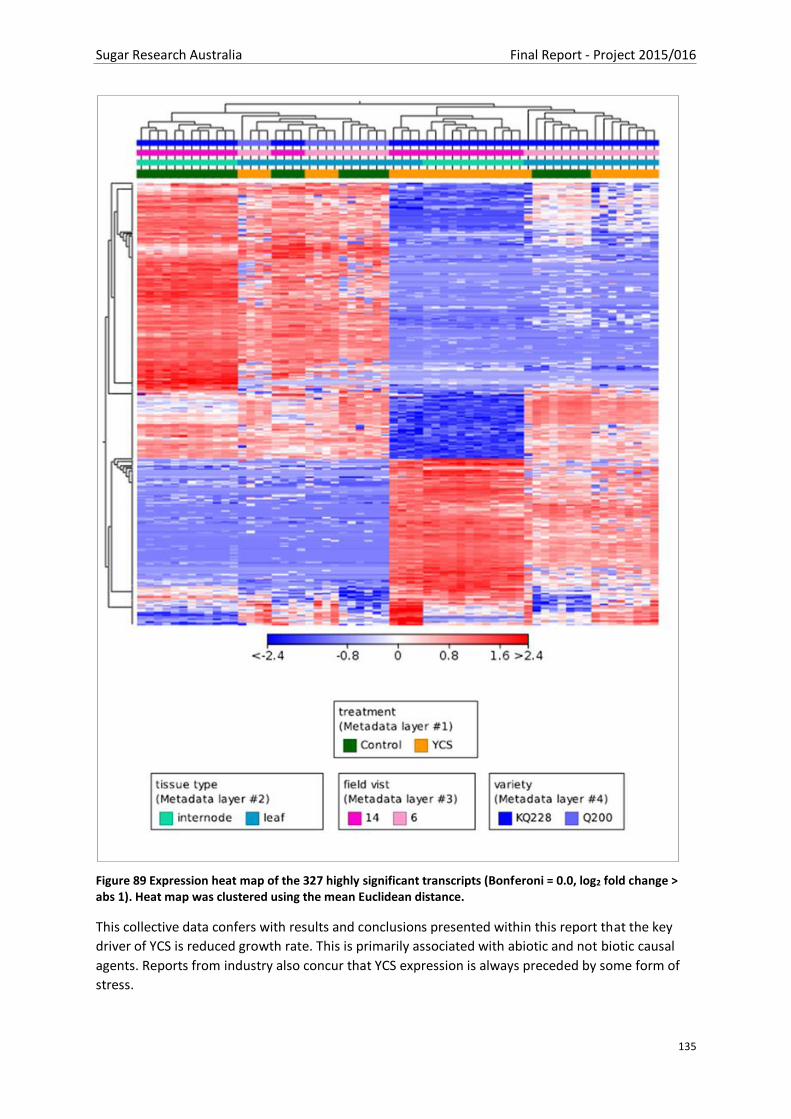
Sugar Research Australia Final Report - Project 2015/016
135
Figure 89 Expression heat map of the 327 highly significant transcripts (Bonferoni = 0.0, log2 fold change > abs 1). Heat map was clustered using the mean Euclidean distance.
This collective data confers with results and conclusions presented within this report that the key
driver of YCS is reduced growth rate. This is primarily associated with abiotic and not biotic causal
agents. Reports from industry also concur that YCS expression is always preceded by some form of
stress.

Sugar Research Australia Final Report - Project 2015/016
136
6.6. Diagnostics
6.6.1. Sucrose/ Starch YCS Diagnostic
It is notoriously difficult to identify YCS in sugarcane fields where a significant portion of the
sugarcane leaves are yellowing as a result of many other factors. However, our studies have shown
that YCS symptomatic and asymptomatic leaves from the same culm always have higher sucrose and
starch levels compared to their control counterparts. While YCS asymptomatic and symptomatic
leaves always have elevated levels of sucrose and starch, it is not only confined to the yellow
sections of the lamina. Sugars and starch also accumulate in the green parts of the leaf lamina,
midrib, dewlap, and sheath, with the highest content located in the leaf sheath and midrib (see
section 6.2.5 of this report). Therefore, early detection of either sucrose or starch accumulation in
asymptomatic leaves may inform growers of an impending development of YCS. If growers could
identify factors that may have contributed to a slowdown in crop growth (leading to a source sink
imbalance) and the subsequent sucrose and starch accumulation, then this will assist them to better
manage the crop to prevent or reduce further incidence of YCS.
6.6.1.1. Midrib stain test
It is difficult to measure leaf sucrose in the field without the assistance of expensive and
cumbersome equipment, which made starch the choice of metabolite to test for. Excessive starch
accumulation in the source leaves will occur when sucrose transport from the leaf to the culm is
impeded. As sucrose levels begin to build-up in the leaf, more carbon is redirected to starch in the
lamina, midrib, and sheath. This allows the leaf to store carbon in an inert form to slow down the
disruption to metabolism. Starch (insoluble α-glucan) is easily stained with iodine solution to
produce a blue-black colour (see section 6.2.5 of this report) which is clearly visible with the naked
eye or with the help of a simple inexpensive X10 magnifying hand lens. Using high starch content as
the criterion for tissue selection for the diagnostic, it was decided to use midrib over sheath as the
sample material. Also considered was the ease of accessing this tissue from the plant. The sheath,
while attainable, is tightly held to the culm in the mid-canopy and makes for a more time consuming
and arduous sampling task. Furthermore, the cross-sectional area of the midrib is much larger than
that of the sheath, or other leaf tissue for that matter, making visual diagnosis in the field easy and
fast. The use of 1% iodine solution (optimised in the lab - data not shown) also made this test very
safe for the user. Figure 90 shows the composition of the midrib stain kit.
Figure 90 Midrib stain kit contains 1% iodine solution dropper bottle, 10X magnifying hand lens and lanyard, safety data sheet

Sugar Research Australia Final Report - Project 2015/016
137
To investigate the accuracy of the midrib stain diagnostic, lamina and midrib tissue was collected at
first light from eight commercial varieties (SRA3A, Q240A, Q250A, Q242A, Q200A, KQ228A, Q232Aand
Q208A) cultivated in Ingham (HCPSL RVT Trial site - Reinaudo 0127A). Leaf 4 was selected for
sampling as it displayed strong YCS symptoms across the genotypes and the asymptomatic
counterpart was also attainable within the same four row plot. Figure 91 shows an example of YCS
leaf symptoms in genotype SRA3A. Sucrose and starch quantification analysis was conducted on the
leaf and midrib disks to validate the samples collected. Staining of midrib sections and starch
content in the lamina and midrib from these same leaves is represented in Figure 92. It is evident
from this experiment that there is a strong correlation between midrib staining and starch content.
Figure 91 SRA3A YCS symptomatic and asymptomatic Leaf 4 from the same plot (Herbert RVT trial)
Figure 92 SRA3A YCS symptomatic and asymptomatic Leaf 4 midrib staining and corresponding lamina and midrib starch content µmol/mg DM noted beside each section (Herbert RVT trial).

Sugar Research Australia Final Report - Project 2015/016
138
It is important to note that starch accumulation in the midrib of sugarcane is not unique to YCS.
Tests conducted on leaves from YCS and water deficit stress plants (Figure 93A, B) shows staining of
the starch in the bundle sheath cells surrounding the midrib vascular bundles/veins (Figure 94A-D).
Figure 93 Sugarcane symptoms – Yellow canopy syndrome A) water deficit stress B)
Figure 94 Leaf 4 midrib cross-section stains (1% iodine solution) YCS A) yellow water deficit B) control C) and green water deficit D)
Studies of plants testing positive to sugarcane yellow leaf virus (ScYLV) also show reduced sugar
export from the leaf. Sucrose accumulation in these plants is likely cause by mechanical plugging of
the sieve tubes through callose formation in response to the virus or a leak in turgor pressure from
viral movement protein expression of the companion cell-sieve tube complex (Esau, 1957; Herbers
et al., 1997). High sucrose accumulation leads to changes in chloroplast ultrastructure and
degradation of the chlorophyll resulting in yellowing of the midrib and lamina (Yan et al., 2008)
(Figure 95A, B). Like YCS, plants infected with ScYLV also have high starch content at first light which
is evident of a major disruption to the diurnal rhythm. While ScYLV midrib and lamina symptom
expression is different to YCS, staining of the midrib produces a similar response compared to the
control (Figure 95C, D).

Sugar Research Australia Final Report - Project 2015/016
139
Figure 95 Sugarcane yellow leaf virus (ScYLV) symptomatic Leaf 3 A) close-up showing yellow midrib and lamina B) ScYLV midrib cross section stained with 1% iodine solution C) and control Leaf 3 midrib cross section stained with 1% iodine solution D). ScYLV (Vietnam genotype) confirmed sample and control obtained from quarantine glasshouse SRA Indooroopilly, Brisbane Qld
Attainment of a positive midrib stain in plants afflicted by both abiotic (water deficit) and biotic
(ScYLV) stress indicates that the test is not unique to YCS, and at best, a good test for stress. To
improve the accuracy of the test and to reduce misdiagnosis of YCS or false positives, flash cards
were included in the diagnostic kit. These flash cards were designed to assist the user to identify key
characteristics that are common to YCS prior to performing the midrib stain. These include
identification of the YCS zone in the mid-canopy, the pattern of development and colour of
expression in the leaf, a decision key ‘to test or not’ and instructions on how to perform the test
(Figure 96A-D).

Sugar Research Australia Final Report - Project 2015/016
140
Figure 96 Midrib stain kit flash cards; YCS zone A) YCS symptom progression B) midrib stain determination key C) staining instructions and comparative vascular bundle cross section stains D)
The YCS in-field test kit was distributed to key SRA and sugar service personnel across the sugarcane
growing regions in Qld. The aim of the kit was to reduce misdiagnosis of YCS and to provide industry
and researchers with a tool to confidently predict the development and onset of the syndrome and
gather accurate information regarding its prevalence. Operators were requested to record the
variety, crop cycle, grower detail, GPS coordinates and to photograph the stool/field, leaf and midrib
cross section stain for each sample test conducted. Sampling and staining were always performed as
soon as possible after first light and always before 8AM. All data was uploaded to a central database
for review and comment. Leaf punch samples were also collected at the same time as midrib
staining in Bundaberg and despatched to the SRA Indooroopilly molecular laboratory for sucrose and
α-glucan analysis (Bergmeyer and Bernt, 1974; Beutler, 1984). Quantitative values were correlated
with the field results to determine the accuracy and reliability of the midrib stain in identifying YCS
correctly. Results from the 2018/19 season in the Bundaberg region indicate an 87% accuracy rate
(data not shown). The collation of all the data and results over the 2018-2020 period will be
presented in the Final Report for project 2014/049 in December 2020.
While the midrib starch stain per se is not a novel test for YCS, it is still a useful measure of plant/leaf
health at that point in time. If used in conjunction with flash cards included in the YCS identification
kit, it is an invaluable support tool which helps train industry service providers and researchers to
better identify YCS in the field and ultimately reduce misdiagnosis.
6.6.2. Novel biomarker
A biomarker for identifying YCS, as distinct from other conditions that cause leaf yellowing, is
important to enable early detection before any signs of visual yellowing, to inform YCS management
practices and to drive the research forward. Using an RNAseq and bioinformatic approach, we
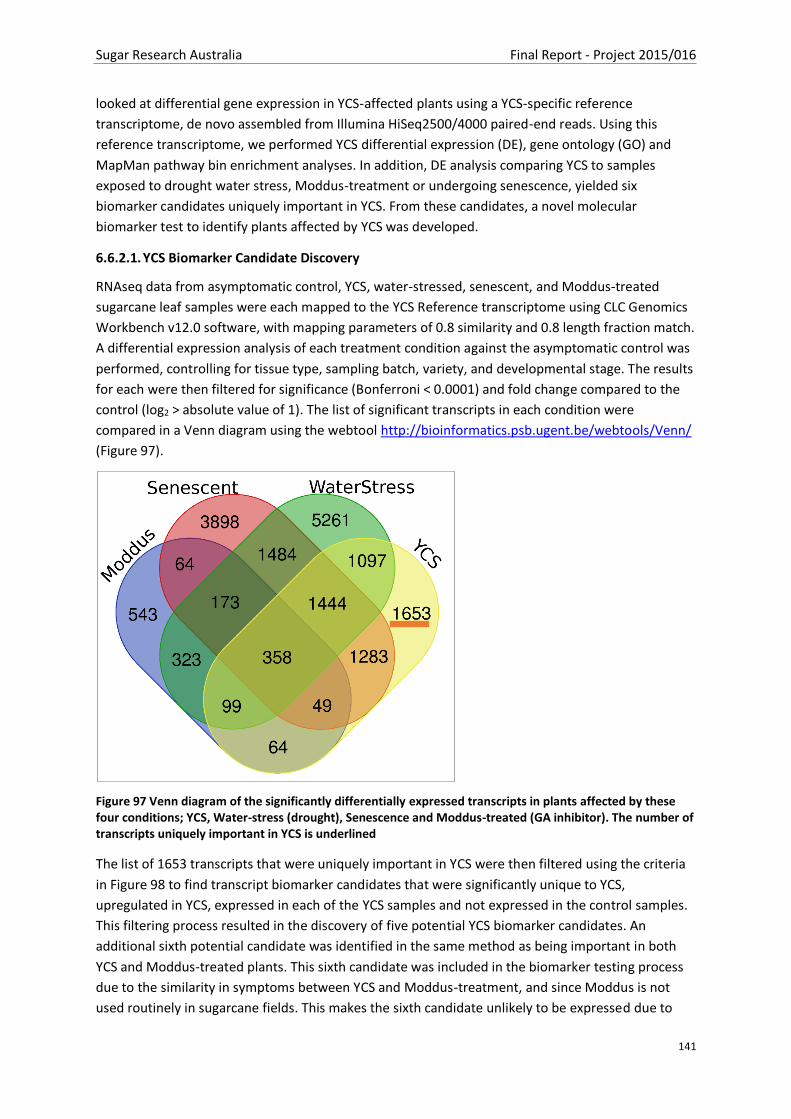
Sugar Research Australia Final Report - Project 2015/016
141
looked at differential gene expression in YCS-affected plants using a YCS-specific reference
transcriptome, de novo assembled from Illumina HiSeq2500/4000 paired-end reads. Using this
reference transcriptome, we performed YCS differential expression (DE), gene ontology (GO) and
MapMan pathway bin enrichment analyses. In addition, DE analysis comparing YCS to samples
exposed to drought water stress, Moddus-treatment or undergoing senescence, yielded six
biomarker candidates uniquely important in YCS. From these candidates, a novel molecular
biomarker test to identify plants affected by YCS was developed.
6.6.2.1. YCS Biomarker Candidate Discovery
RNAseq data from asymptomatic control, YCS, water-stressed, senescent, and Moddus-treated
sugarcane leaf samples were each mapped to the YCS Reference transcriptome using CLC Genomics
Workbench v12.0 software, with mapping parameters of 0.8 similarity and 0.8 length fraction match.
A differential expression analysis of each treatment condition against the asymptomatic control was
performed, controlling for tissue type, sampling batch, variety, and developmental stage. The results
for each were then filtered for significance (Bonferroni < 0.0001) and fold change compared to the
control (log2 > absolute value of 1). The list of significant transcripts in each condition were
compared in a Venn diagram using the webtool http://bioinformatics.psb.ugent.be/webtools/Venn/
(Figure 97).
Figure 97 Venn diagram of the significantly differentially expressed transcripts in plants affected by these four conditions; YCS, Water-stress (drought), Senescence and Moddus-treated (GA inhibitor). The number of transcripts uniquely important in YCS is underlined
The list of 1653 transcripts that were uniquely important in YCS were then filtered using the criteria
in Figure 98 to find transcript biomarker candidates that were significantly unique to YCS,
upregulated in YCS, expressed in each of the YCS samples and not expressed in the control samples.
This filtering process resulted in the discovery of five potential YCS biomarker candidates. An
additional sixth potential candidate was identified in the same method as being important in both
YCS and Moddus-treated plants. This sixth candidate was included in the biomarker testing process
due to the similarity in symptoms between YCS and Moddus-treatment, and since Moddus is not
used routinely in sugarcane fields. This makes the sixth candidate unlikely to be expressed due to

Sugar Research Australia Final Report - Project 2015/016
142
anything other than YCS under normal field conditions. This gives us a total of six potential YCS
biomarker candidates to test.
Figure 98 Bioinformatic filtering process to identify potential biomarker candidates unique to YCS
The six potential biomarker candidates were compared to the NCBI non-redundant proteins (nr) and
nucleotide (nt) databases using BLAST to find their functions and annotations (Table 12).
Table 12 Annotations of biomarker transcript BLAST matches, and biomarker transcript lengths in bases
It is important to note here that each of the six YCS biomarker candidates were all plant sequences,
and were transcripts expressed from plant genes. None of them were from non-sugarcane
microorganisms. These biomarker candidates were all sugarcane genes expressed in YCS plants.
Interestingly, the three annotated sequences are known to be expressed plant responses to
oxidative stress. This suggests that the identified biomarker candidates may not be unique to YCS if
this type of stress is also expressed sufficiently in other forms of sugarcane yellowing.
Oxidative stress can be caused by both biotic (pests and pathogens) and by abiotic (photosynthesis,
metabolism, high light and temperature, water and nutrient limitations, high salt and heavy metal
soils and elevated ozone) means (Apel and Hirt, 2004; Cakmak and Kirkby, 2008; Nishizawa et al.,
2008; Keunen et al., 2013; Sham et al., 2014). To reiterate, our analyses have found no consistent
evidence of any YCS-associated biotic factors such as bacterial, viral, or archaeal microorganisms in
our sequencing data. It is far more likely that the oxidative stress response we see here in YCS-
affected plants is due to abiotic factors.
To decide on a plant tissue type of choice for the biomarker sampling required analysis of the
RNAseq data. This in silico differential expression analysis was performed comparing the expression

Sugar Research Australia Final Report - Project 2015/016
143
levels across all tissue types in the database (Table 13). The analysis identified the leaf lamina and
midrib as the best tissue to test for the presence of the biomarker transcripts.
Table 13 YCS biomarker candidate expression in various tissue types
Of these candidates, YCS-2 had the highest TPM abundance and was unannotated. A series of
primers were designed and optimised for this transcript (Table 14). PCR testing of early and late
stage YCS and senescence, water stress, and asymptomatic controls yielded quite pleasing results
(Figure 99). However, there was evidence of expression of this biomarker candidate in three of the
late stage water-stress samples. It is possible that these water-stressed samples may have come
from plants with an underlying YCS status.
Figure 99 Gel image of YCS-2 biomarker candidate primer pair 24aF-161R (137bp region) (see Table 14) against asymptomatic controls, early and late-stage YCS leaf, YCS midrib, early and late-stage water stress and senescent samples
Table 14 YCS-2 biomarker candidate primers, forward (F) and (R) reverse sequences
Primer Name YCS-2 Primer Sequence
Y2_24a_F GCA ACA ACG AAG CAG AAG C
Y2_161_R CCC ATT GGA TTG CTG GAC CT
To test this biomarker candidate further against as many forms of yellow leaf expression in
sugarcane, samples were collected from positively identified (PCR molecular screening) diseased

Sugar Research Australia Final Report - Project 2015/016
144
plants from SRA Woodford station. During this field visit we used our optimised protocol for sample
preservation in RNAlater® to ensure the technique could be rolled out to industry should our
biomarker diagnostic be successful. Unfortunately, we saw a positive result in at least one replicate
from each of the diseased plant samples (Figure 100). There was no improvement on this result
when all potential biomarkers were assessed (data not shown). It is worth noting that at the time of
sampling, the Woodford plants were extremely water stressed due a prolonged dry period. This
result, while disappointing, confirmed that the biomarker candidates strongly expressed in YCS
samples were not novel and potentially have a strong association with water deficit and oxidative
stress.
Figure 100 Gel photo of the YCS biomarker validation test of the Woodford diseased samples. Gel was run as a 1.5% agarose gel with 0.5x SYBRsafe at 90V for 60 minutes, using 100bp molecular weight ladder (Promega) as a marker. RSD: Ratoon Stunting Disease, PP: cane infected with rust, Pokkah Boeng and affected by cold chlorosis, FJG: Fiji Leaf Gall disease, SMV: Sugarcane Striate Mosaic disease; bl: no template blank control; - : negative Control from FV14 leaf4 sample barcode 5361; + : positive YCS control from FV14 leaf4 sample barcode 5363 (1:10 dilution); MV: Sugarcane Mosaic Virus; LS: Leaf Scald disease; CS: Chlorotic Streak Disease
In summary, the results concur with our research findings of a strong correlation between YCS
yellowing and oxidative stress. As the cause of YCS is a source sink imbalance, there are many
stressors that may be causal agents capable of inducing this physiological disorder. Therefore, it is
highly unlikely, if not impossible, to discover a novel YCS biomarker of use to the industry.
6.7. Management
It is evident from the collective data presented within this report that the key driver of YCS is growth
rate. A reduction in sink strength during the peak growing season increases the risk of
photoassimilation exceeding the sink capacity. Therefore, any significant growth retardation
preceding a period of increased carbon export from the source will increase the probability of YCS
development and expression. An obvious remedy to this impending physiological disorder is to

Sugar Research Australia Final Report - Project 2015/016
145
mitigate or eliminate factors limiting culm growth or internode volume directly beneath the most
photosynthetically active source leaves.
6.7.1. Growth rate and vigour
We investigated this further through a study of source leaf sucrose and starch content in fields of
growers following best practice farming and consistently averaging >170t cane/ha. These growers
anecdotally report that they see very little to no YCS symptoms across their farms. Fields that were
mature and representing three widely grown genotypes (mostly 1st ratoon or plant crop cycle) were
selected for sampling from five locations within three sites prior to harvest in September 2017.
These fields were then monitored through the subsequent ratoon crop and further sampling
conducted over the growing season to May 2018. Sucrose and total α-glucan content in the mid-
upper canopy of three genotypes (KQ228A, Q208A, Q240A) in Burdekin irrigated fields was
established for spring (September), summer (February) & autumn (May).
The top six source leaves of the canopy are leaves 1-6 (leaf 1 = FVD) of which mid canopy leaves 3-6
is where YCS symptom expression typically exhibits. Analysis of the sucrose and starch content
within these canopy leaves, sampled between 8AM and 12:30PM, showed no excessive sucrose
accumulation (i.e. above the tolerable threshold of 200 µmol/g DM) or any major redirection of
carbon to α-glucan (Figure 101). Principle component analysis of leaf sucrose content for the three
genotypes and sites over the growing period shows a tight cluster (Figure 102). This lack of
separation between genotypes or sites shows these fields share a common parameter that
maintains healthy levels of source leaf sucrose. As all fields chosen for this study were high yielding
(>170 t cane/ha) it is highly likely that high sink strength is responsible for this maintenance.
Figure 101 Leaf sucrose and total α-glucan levels in the mid-upper canopy (Leaf 1, 2, 4 & 6) of high yielding crops for varieties KQ228A, Q240A & Q208A across a full growing season

Sugar Research Australia Final Report - Project 2015/016
146
Figure 102 PCA analysis Q208A, Q240A, KQ228A leaf sucrose, threes sites across a full growing season (Burdekin irrigated fields >170 t cane/ha)
The fact that levels of both metabolites are so low even though some sampling was as late as
12:30PM (when photosynthesis is approaching its peak), is indicative of a strong sugar gradient
between the source and sink. This suggests that the entire source canopy of a high yielding crop
maintains adequate sucrose export and carbon partitioning to α-glucan (soluble and starch) to
ensure levels do not surpass a critical threshold that would trigger the onset of YCS. Therefore,
maintenance of a healthy supply and demand balance is key to managing YCS. These results confirm
that the current SRA recommendation to follow best farming practice, to ensure crop growth does
not slow down during the peak growing season, remains one of the most important management
strategies to mitigate the risk of YCS development.
6.7.2. Insecticide, YCS development, carbon partitioning and sink strength
Insecticide trials conducted as part of project 2014/049 show that the pyrethroid insecticide
bifenthrin prevents the accumulation of sucrose and α-glucans (soluble and starch) in the source
leaves and offers a potential YCS management option. Within the scope of our studies, here we
present an evaluation of the collective data from the 2017/18 Burdekin trial.
The 2017/18 Burdekin insecticide trial investigated the effect of bifenthrin and the timing of
application on internode (sink) size, sucrose and α-glucan accumulation in the source leaves and the
development/expression of YCS. The trial consisted of untreated control (UTC) and weekly
applications of bifenthrin (320 mL/ha) for the months of November through March, with some
monthly treatments receiving five sprays while others received only three (Table 15). Included in this
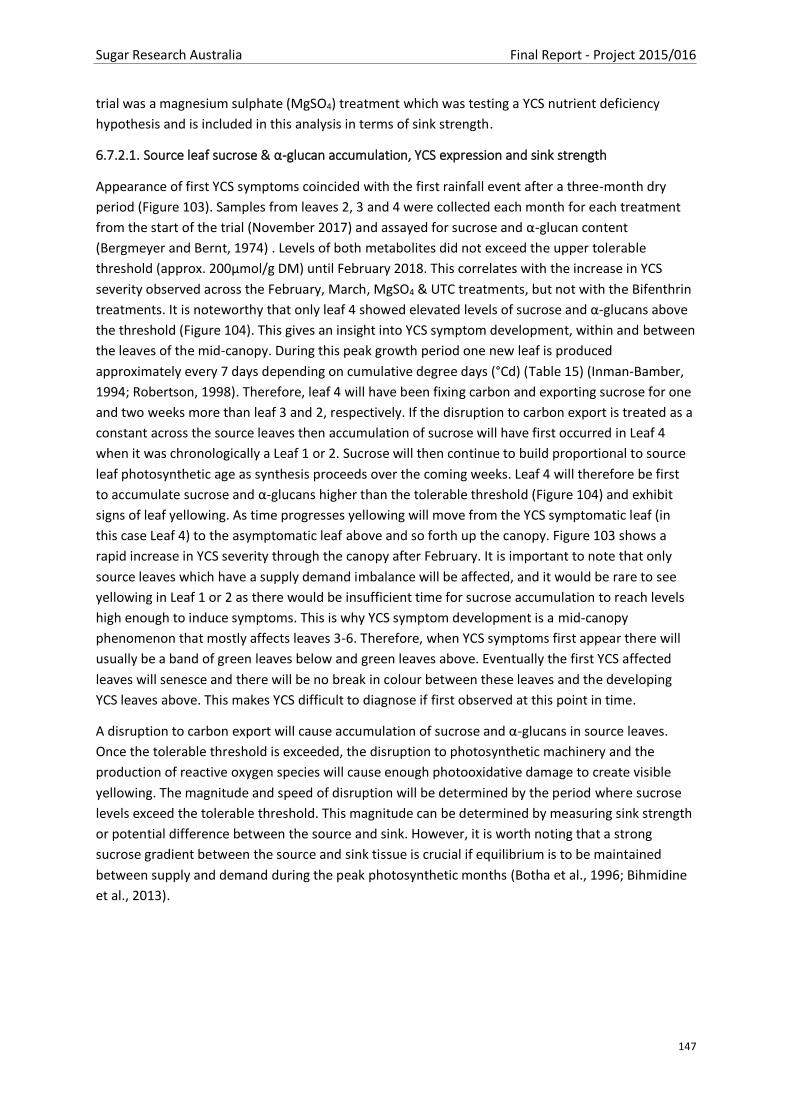
Sugar Research Australia Final Report - Project 2015/016
147
trial was a magnesium sulphate (MgSO4) treatment which was testing a YCS nutrient deficiency
hypothesis and is included in this analysis in terms of sink strength.
6.7.2.1. Source leaf sucrose & α-glucan accumulation, YCS expression and sink strength
Appearance of first YCS symptoms coincided with the first rainfall event after a three-month dry
period (Figure 103). Samples from leaves 2, 3 and 4 were collected each month for each treatment
from the start of the trial (November 2017) and assayed for sucrose and α-glucan content
(Bergmeyer and Bernt, 1974) . Levels of both metabolites did not exceed the upper tolerable
threshold (approx. 200µmol/g DM) until February 2018. This correlates with the increase in YCS
severity observed across the February, March, MgSO4 & UTC treatments, but not with the Bifenthrin
treatments. It is noteworthy that only leaf 4 showed elevated levels of sucrose and α-glucans above
the threshold (Figure 104). This gives an insight into YCS symptom development, within and between
the leaves of the mid-canopy. During this peak growth period one new leaf is produced
approximately every 7 days depending on cumulative degree days (°Cd) (Table 15) (Inman-Bamber,
1994; Robertson, 1998). Therefore, leaf 4 will have been fixing carbon and exporting sucrose for one
and two weeks more than leaf 3 and 2, respectively. If the disruption to carbon export is treated as a
constant across the source leaves then accumulation of sucrose will have first occurred in Leaf 4
when it was chronologically a Leaf 1 or 2. Sucrose will then continue to build proportional to source
leaf photosynthetic age as synthesis proceeds over the coming weeks. Leaf 4 will therefore be first
to accumulate sucrose and α-glucans higher than the tolerable threshold (Figure 104) and exhibit
signs of leaf yellowing. As time progresses yellowing will move from the YCS symptomatic leaf (in
this case Leaf 4) to the asymptomatic leaf above and so forth up the canopy. Figure 103 shows a
rapid increase in YCS severity through the canopy after February. It is important to note that only
source leaves which have a supply demand imbalance will be affected, and it would be rare to see
yellowing in Leaf 1 or 2 as there would be insufficient time for sucrose accumulation to reach levels
high enough to induce symptoms. This is why YCS symptom development is a mid-canopy
phenomenon that mostly affects leaves 3-6. Therefore, when YCS symptoms first appear there will
usually be a band of green leaves below and green leaves above. Eventually the first YCS affected
leaves will senesce and there will be no break in colour between these leaves and the developing
YCS leaves above. This makes YCS difficult to diagnose if first observed at this point in time.
A disruption to carbon export will cause accumulation of sucrose and α-glucans in source leaves.
Once the tolerable threshold is exceeded, the disruption to photosynthetic machinery and the
production of reactive oxygen species will cause enough photooxidative damage to create visible
yellowing. The magnitude and speed of disruption will be determined by the period where sucrose
levels exceed the tolerable threshold. This magnitude can be determined by measuring sink strength
or potential difference between the source and sink. However, it is worth noting that a strong
sucrose gradient between the source and sink tissue is crucial if equilibrium is to be maintained
between supply and demand during the peak photosynthetic months (Botha et al., 1996; Bihmidine
et al., 2013).
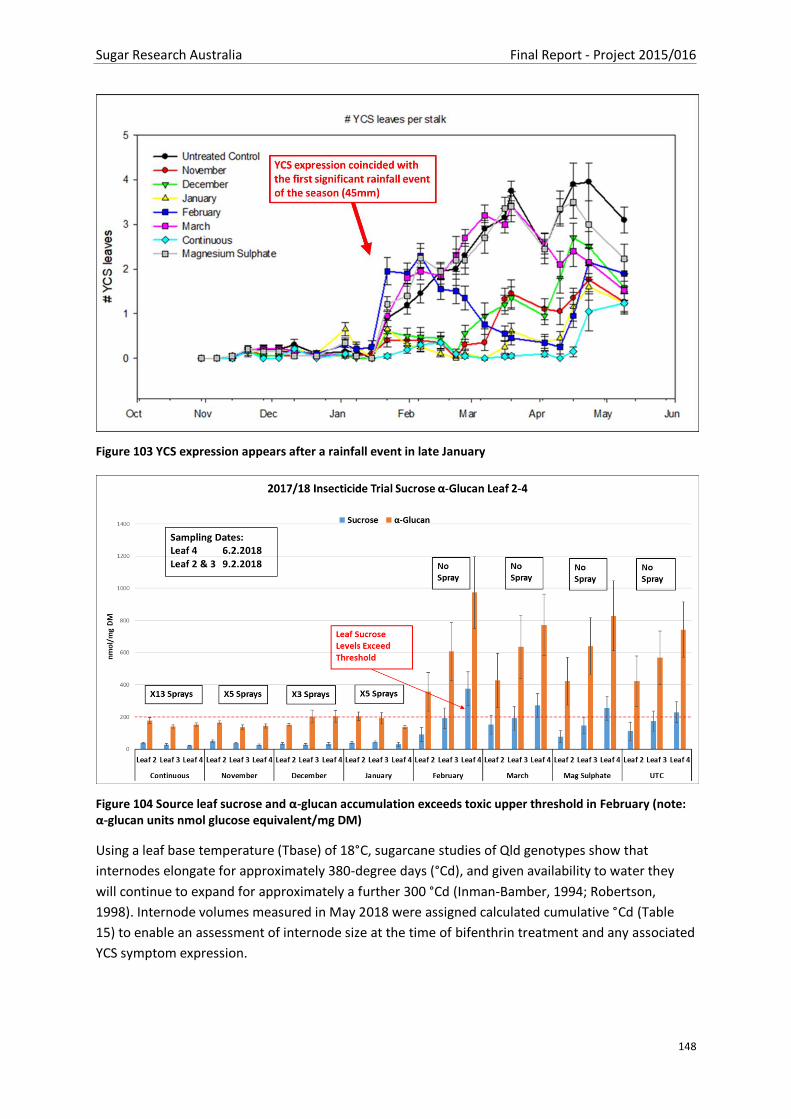
Sugar Research Australia Final Report - Project 2015/016
148
Figure 103 YCS expression appears after a rainfall event in late January
Figure 104 Source leaf sucrose and α-glucan accumulation exceeds toxic upper threshold in February (note: α-glucan units nmol glucose equivalent/mg DM)
Using a leaf base temperature (Tbase) of 18°C, sugarcane studies of Qld genotypes show that
internodes elongate for approximately 380-degree days (°Cd), and given availability to water they
will continue to expand for approximately a further 300 °Cd (Inman-Bamber, 1994; Robertson,
1998). Internode volumes measured in May 2018 were assigned calculated cumulative °Cd (Table
15) to enable an assessment of internode size at the time of bifenthrin treatment and any associated
YCS symptom expression.

Sugar Research Australia Final Report - Project 2015/016
149
Table 15 Treatments and time of application, Cumulative °Cd and internode volume (Leaf Tbase = 8°C)
YCS symptoms first appeared in the untreated plots in late January (Figure 103) which aligns with
Internode # 14 (Table 15). Figure 105 shows the proportional variation in internode volumes for each
treatment in order of YCS severity.
Figure 105 Bifenthrin treatment, YCS occurrence and internode size - internode numbering corresponds with true leaf number i.e. Internode #1 is the internode directly under the leaf sheath of true leaf # 1 = FVD).
The highest demand for sucrose from a source leaf is from the two internodes directly below it and
the root system, with lower demand from the young upper sink culm and leaves (Botha and
McDonald, 2010). Therefore, in terms of sink capacity or sink strength the size of internodes # 15 &
16 is of particular interest as they were sitting directly beneath the leaf first expressing YCS
symptoms in late January in the insecticide field trial (Figure 105, Table 15). Interestingly, Figure
106A shows all plots sprayed with bifenthrin prior to February had significantly larger internodes #
15 & 16 volumes than those of the untreated plots and this correlates well with the level of YCS
severity (Figure 106B). The period from when bifenthrin was first applied in the trial to the time of
sampling and internode measurements equates to the top 23 internodes of the culm. Using the
Date
Internode
Cummulative
°Cd Internode #
Internode
Volume cm3
Continuous Continuous
Internode
Volume cm3
UTC UTC
Internode
Volume cm3
November Nov
Internode
Volume cm3
December Dec
Internode
Volume cm3
Januarys Jan
Internode
Volume cm3
February Feb
Internode
Volume cm3
March March
Internode
Volume cm3
MgSO4
6/05/2018 20.99 1 23.48 13.09 14.70 13.18 22.78 19.46 13.88 13.82
28/04/2018 58.09 2 27.23 16.16 18.61 17.69 23.49 25.08 17.34 16.83
19/04/2018 108.19 3 31.96 12.80 24.43 21.60 26.52 22.82 20.00 14.88
10/04/2018 169.27 4 37.18 14.67 27.64 21.63 26.57 26.11 20.10 15.41
2/04/2018 232.58 Final Bifenthrin Spray 5 37.51 Spray 14.08 21.86 22.72 31.94 27.07 21.75 16.91
25/03/2018 297.01 6 37.82 Spray 16.20 26.07 25.05 34.70 27.82 25.28 No Spray 100mL Rain19.88
17/03/2018 366.76 Internode Elongation Stops 7 40.04 Spray 16.86 26.26 26.96 37.14 28.68 25.04 Spray 19.85
9/03/2018 428.89 8 40.45 Spray 18.54 29.40 29.22 39.24 29.46 20.27 Spray 20.10
2/03/2018 490.92 9 38.91 Spray 18.57 33.08 31.35 39.11 28.26 19.96 Spray 22.07
22/02/2018 549.72 10 36.30 Spray 19.50 34.45 34.77 39.29 30.69 Spray 20.72 25.59
15/02/2018 624.31 11 38.17 Spray 20.41 33.87 36.49 42.29 31.54 Spray 20.60 24.53
8/02/2018 683.80 Internode Expansion Stops 12 37.16 Spray 21.98 35.28 36.32 40.69 30.67 Spray 22.26 23.93
1/02/2018 750.71 13 37.40 Spray 22.37 35.55 34.85 39.32 29.01 Spray 21.73 28.25
25/01/2018 816.52 YCS Appears 14 38.61 Spray 22.33 36.89 33.80 37.09 Spray 28.68 21.66 28.83
17/01/2018 883.49 15 38.57 Spray 21.83 34.71 33.12 35.51 Spray 25.46 22.88 26.40
10/01/2018 953.51 16 36.27 Spray 21.81 31.67 29.67 33.36 Spray 23.49 22.85 25.05
3/01/2018 1025.81 17 35.49 Spray 23.30 33.09 28.58 32.82 Spray 22.40 23.33 25.06
27/12/2017 1095.98 18 34.28 No Spray 24.24 32.09 27.66 No Spray 31.08 21.91 23.57 25.16
20/12/2017 1158.96 19 33.91 Spray 23.91 30.13 26.45 Spray 31.44 20.74 22.43 26.19
13/12/2017 1220.08 20 31.71 Spray 24.10 28.14 24.43 Spray 29.66 19.30 21.20 23.00
6/12/2017 1286.47 21 28.82 Spray 22.52 27.62 25.39 Spray 28.67 19.32 22.58 19.81
29/11/2017 1349.29 22 27.77 Spray 26.30 25.20 Spray 25.59 25.01 18.73 22.03 20.70
21/11/2017 1412.36 23 28.41 Spray 31.24 23.29 Spray 24.52 31.91 12.62 16.67 24.81
13/11/2017 1468.28 24 27.67 Spray 29.07 21.93 Spray 11.50
5/11/2017 1528.23 25 26.07 Spray 23.14 Spray
30/10/2017 1593.18 Bifentrin Treatment Starts 26 27.01 Spray 23.05 Spray
20/10/2017 1644.27 27 27.08 19.62

Sugar Research Australia Final Report - Project 2015/016
150
average internode volume over this period as a proxy for plant vigour, plants treated with bifenthrin
prior to February had higher vigour than the untreated controls (Figure 106C). Increased plant vigour
correlates well with reduced YCS severity (Figure 106B & C). Independent of when bifenthrin was
applied, the volume of actively growing internodes above the spray zone is larger than that of the
untreated control (Table 15). Comparing the total volume of the top 23 internodes within each
treatment indicates that the later the treatment was applied, the smaller the culm volume (Figure
107). Figure 108 shows there is a very strong correlation between culm volume and cane yield. This
concurs with our study conducted in the Burdekin 2017/18 which found no YCS in several high
yielding commercial crops with a large active sink (>170 t cane/ha).

Sugar Research Australia Final Report - Project 2015/016
151
Figure 106 Untreated February, March, Mg SO4 and UTC plants have reduced sink size A) higher YCS severity, compared to bifenthrin treated plants (Continuous, January, November and December) B) and reduced plant vigour C)

Sugar Research Australia Final Report - Project 2015/016
152
Figure 107 Sink size of top 23 internode volumes and bifenthrin treatment period
Figure 108 Burdekin insecticide trial 2017/18 yield (TCH) and sink strength (top 23 internode total volume representing the period from the first Bifenthrin spray which staggers monthly for each treatment except Continuous)
Bifenthrin is a broad-spectrum non-systemic insecticide that can kill or suppress both beneficial and
non-beneficial insects. Complete removal or suppression of insects either i) prevents a plant defence
response to wounding that would otherwise cause a physical blockage in the transport system (our
data shows no callose accumulation in YCS symptomatic leaf tissue – see section 6.3.3.4 of this
report) or ii) disrupts molecular signalling from the insects that is involved in the physiological

Sugar Research Australia Final Report - Project 2015/016
153
disruption of sink metabolism which reduces sink strength or competition with insect feeding or iii)
prevents vectoring an agent that disrupts phloem transport (Note: phytoplasmas and other bacteria
are at best intermittently detectable and only measurable at very low concentration in YCS leaf
tissue), iv) prevents sink feeding that draws carbon away from sink growth or v) prevents a reduction
in plant growth that may otherwise occur through upregulation of plant defence jasmonates (JAs)
and reduced gibberellin (GA) synthesis in response to insect herbivory (Zhang et al., 2017; Yang et
al., 2019). In any case, it suggests that bifenthrin maintains a healthy balance between supply and
demand or growth and defence. This in turn prevents the accumulation of leaf sucrose to levels that
initiate downregulation of photosystems I & II, leading to photooxidation and leaf yellowing.
The role of insects and the mechanism by which bifenthrin prevents accumulation of sucrose and α-
glucans in the leaf is the subject of further investigation in the 2019/20 season. A possible insight to
this from bifenthrin residue analysis conducted on the leaf and culm will be tested in the current
season. Results showed that residue was found on the tops and culm at 2.4 and 4.6 months
respectively after the last application (data not shown). Studies show that exposure to rainfall and
sunlight increase the rate of degradation and reduce the efficacy of bifenthrin (Allan et al., 2009).
The habit of sugarcane will therefore impact on bifenthrin efficacy as, after canopy closure at
approximately 12 weeks, sunlight will be unable to penetrate and degrade insecticide applied under
it and on the lower portion of the culm. Application of the insecticide in the Burdekin trial was by
knapsack and to the point of saturation of the foliage and culm. When the plant is drenched like this
the insecticide can penetrate behind leaf sheaths of older leaves which are not as tightly held to the
culm. When this is considered it is not surprising that residue was detected on the culm 4.6 months
after application. While rainfall will also reduce any residue, the fact that it is measurable in the tops
2.4 months after application suggests it is somewhat protected by the tight arrangement of leaves in
this section of the plant. Therefore, bifenthrin residue may have a significant impact and needs to be
considered when investigating the type of insect and its possible role in disrupting sink strength
(internode volume) and phloem transport.
6.7.2.2. Plant response to insect attack
As illustrated in the previous section (6.7.2.1) and in previous publications (Olsen and Ward, 2019) it
is highly likely that insect pressure could be one of the factors that can lead to YCS expression.
Obviously, application of bifenthrin results in improved internode growth and at the same time
results in lower leaf sucrose and glucan levels (see section 6.7.2. of this report Figure 106 & Figure
104). The observations that YCS expression and severity can be controlled to some extend by
insecticide application does not come as a surprise. As highlighted throughout this report, YCS
expression is the result of a suppression of growth.
The ‘growth–defence trade off’ phenomenon is well described in literature and was first observed in
forestry studies of plant–insect interactions (for review Huot et al., 2014). Plant fitness is the balance
between growth and defence. When plants need to activate a defence response it imposes a
substantial demand for resources, which in turn reduces growth (Huot et al., 2014). However, recent
work highlighted that defence-related growth repression is not merely competition for resources but
involves complex hormone crosstalk and signalling pathways in balancing growth and defence in
plants. Changes in both abiotic and biotic stresses will induce a reaction in signal molecules to
facilitate appropriate plant responses (for review Ku et al., 2018). It would appear that salicylic acid
(SA) is important in pathogen, jasmonate (JA) in insect activation (Huot et al., 2014; Patil et al., 2019)

Sugar Research Australia Final Report - Project 2015/016
154
and ABA in abiotic activation of plant defence responses. Balancing of growth versus defence
involves the expression of these signalling pathways and the hormones auxin, brassinosteroids (BR),
and gibberellins (GA)(Huot et al., 2014; Ku et al., 2018).
Enhanced deactivation of the JA pathway or defective JA receptors are associated with increased
overall plant height and longer internodes (Yang et al., 2012; Kurotani et al., 2015; Patil et al., 2019).
Elevated JA leads to increased lignification and reduced growth (Sehr et al., 2010; Agusti et al., 2011;
Lin et al., 2016).
Not only changes in the JA-pathway but also the production of phenylpropanoids, flavonoids,
secondary metabolites, stress-responsive transcription factors, disease resistance, lipid metabolism,
cell wall metabolism, pathogen-related (PR) pathway and signal pathways, protein turnover and
various transporters are associated with insect defence responses (Ma and Yamaji, 2006; Głowacki
et al., 2011; Sham et al., 2014; Altmann et al., 2018; Miao et al., 2018; Chen et al., 2019; Du et al.,
2019; Varsani et al., 2019; Xin et al., 2019). However, all of these responses are also induced in a
multitude of other stress conditions, and their various signalling may overlap synergistically or
interact antagonistically (Suzuki et al., 2014). Transcripts associated with these functions are in
higher abundance in YCS.
Of all these responses, the JA pathway and DIMBOA benzoxazinoids have more often been
associated with plant defence against insect attack and give the clearest indication of insect
herbivory. We found 9 transcripts annotated as ‘60kDa jasmonate-induced –like’ that were
significantly differentially expressed in YCS (Bonferroni < 0.005). These transcripts ranged in size
from 959 to 4086 bases. The expression fold changes ranged from -23 to 53, so they were not
consistently upregulated, and all of them were weakly expressed.
For the DIMBOA expression in YCS, we found only two transcripts that were significantly
differentially expressed in YCS (Bonferroni < 0.005). However, expression was weak and varied
between samples, and these transcripts were not significantly differentially expressed in all datasets.
7. CONCLUSIONS
In this study we have established a link between sugar metabolism and YCS symptom development.
YCS symptom development is induced premature senescence through which the crop rebalances its
photosynthetic capacity with the demand for reduced carbon.
We have developed comprehensive metabolome, transcriptome and proteome databases and
referenced to changes associated with YCS development and expression. This has not only revealed
the level of disruption to source leaf metabolism in YCS plants but also established a metabolic
reference base for sugarcane in Australia. This study showed how important it is to have a good solid
understanding of the fundamentals of the physiology of the crop. As a result of the comprehensive
understanding of sugarcane physiology attained through this study, the industry should now be in a
better position to reach conclusions about any abnormal crop behaviour much faster than was the
case with YCS.
Our data highlights the fundamental issue that underpins leaf metabolism and function in plants,
and the differences between C3 and C4 crop species in dealing with it. Although the interception of

Sugar Research Australia Final Report - Project 2015/016
155
light is needed to drive photosynthesis and hence biomass production, it is also highly destructive if
the absorbed energy is not used to drive carbon dioxide fixation. The consequence of not efficiently
using the trapped light energy for photosynthesis is rapid destructive oxidation and yellowing of leaf
tissue. The key to ensure continued CO2 fixation is to maintain cellular sugars, especially sucrose
levels, low. There are only two mechanisms that can be used for this purpose: firstly, the export of
sugars to the non-photosynthetic actively growing tissues, or secondly, the conversion of sugars to
water insoluble polymers such as starch. Many plants, and especially the C3 species, have a huge
capacity to convert sugars to starch and other polymers in the leaf and thereby ensuring that
photooxidation and yellowing does not occur. When light interception exceeds the export and
polymer production capacity, all plants will exhibit leaf yellowing which is merely reflecting the only
option available to reduce light interception i.e. reduce the number of leaves that can capture light
energy.
This study demonstrates that sugarcane (a C4 species) has a very limited capacity to produce starch
and other polymers. Evidently it has some ability to produce soluble glucans which can offer a
limited ‘overflow’ for reduced carbon. The only real protective mechanism in sugarcane to prevent
photooxidation and yellowing is to ensure that sucrose export from the leaf is closely matching the
trapped light energy. Because of the limited buffering capacity in the leaf, sugarcane controls light
interception primarily through a reduction in green leaf area and number of source leaves. In sharp
contrast to the C3 species, yellowing and premature leaf death is evident throughout the crop cycle.
Previous studies have highlighted the rapid changes in green leaf numbers when sugarcane growth
(demand for reduced carbon and sugar utilisation) is imposed on the crop due to abiotic stress
conditions. This mechanism may be considered an evolutionary or adaptive response to minimise
the collateral damage due to an inability to counter excess trapped energy caused by sink strength
limitation. Sacrificing the light harvesting structures could well be a more energy efficient way to
restore metabolic stasis and plant health.
The number of green leaves in the sugarcane canopy is a direct reflection of the demand for reduced
carbon by the rest of the plant. Our data has clearly established that leaf sucrose is a very good
indicator of the general health of the sugarcane plant. The leaves will remain green and functional
when the leaf sucrose levels can be maintained at a level lower than 200 µmol/g DM. Starch in the
midrib of the leaf is a good surrogate for leaf sucrose and something that can be easily measured as
demonstrated by the simple starch stain we have developed.
Evidently, sucrose levels could exceed the acceptable threshold level as a result of (a) reduced
growth of the non-photosynthetic (sink) tissues while photosynthesis remains at a high level, (b)
accelerated photosynthesis while the demand from the sink tissues remain the same, or (c) a
differential disruption in the leaf and sink metabolism through which photosynthate production
exceeds the sucrose export rate. However, our data does not support either (a) or (b).
Based on our findings several scenarios can be predicted that will lead to mid canopy yellowing (YCS)
in sugarcane. For example:
Scenario 1: Dry conditions at the time of peak irradiance (December to March). Internode elongation
will slow up much faster than photosynthesis rates. Photosynthesis will be partially reduced due to
stomatal resistance (water stress). If the crop receives water (rainfall or irrigation) after such a stress
period photosynthesis will rapidly increase but sink demand will be slower to respond. The

Sugar Research Australia Final Report - Project 2015/016
156
consequence would be yellowing in the leaves that are primarily exporting carbon and have a high
photosynthetic rate (typically leaf 4).
Scenario 2: A poorly developed root system caused by compaction, or a portion of the root system,
especially new roots are taken out by predation, in the peak photosynthetic period. This will remove
a substantial portion of the sink demand and lead to sucrose accumulation in the mid-canopy.
Scenario 3: The crop is exposed to insect pressure and this leads to an induction of the JA pathway
and decrease in the GA, BR and auxin pathways which results in substantial reduction in internode
length. The effect of the insect pressure is the same as what is achieved with water stress but in this
scenario the cause is biotic– a reduction in sink demand and size and a source sink imbalance still
ensues.
Over the duration of this project we have seen many examples such as poor soil and nutrient
conditions, infrequent or no irrigation, shallow or severely compacted soil enhancing YCS (mid
canopy yellowing) expression. In contrast we never saw major YCS expression in an actively growing
crop and observed the crop growing out of YCS symptom expression under good growth conditions.
In an extreme case we observed a complete prevention of YCS symptom development in a patch
within a YCS symptomatic field where there was a continuous supply of grey water. This ensured
even strong culm growth during the December to March period.
It is very important to note that mid-canopy yellowing as evident during YCS expression is due to
reduced culm growth and not vice versa. The ‘feast’ status of internodes strongly correlates with
internode sucrose levels and confirms there is no association between YCS and commercial cane
sugar (CCS) penalty. The yellowing is the consequences of poor crop growth and merely a
mechanism through which the plant rebalances the supply and demand for photosynthate.
We want to emphasise that there are two major findings in this project that could have significant
implications for further crop improvement. Firstly, there is a significant induction of carbon
partitioning to metabolic processes that produce antioxidants and hence provide temporary
protection against photooxidation during YCS symptom development. Secondly, sugarcane produces
significant quantities of soluble glucans and the leaf midrib and sheath become new secondary
carbon sinks. This maintains carbon flow and energy utilisation in the leaf lamina during YCS
development. Exploitation of these two traits could provide protection and minimise or prevent mid-
canopy yellowing.
8. RECOMMENDATIONS FOR FURTHER RD&A
A rapidly changing environment over the past decade is likely to have contributed to increased crop
stress and the physiological disorder known as YCS. Therefore, any continued investment should
address i) how farm management practice will keep pace with climate change and ii) how genetic
targets will improve crop resistance or tolerance to abiotic stress?

Sugar Research Australia Final Report - Project 2015/016
157
9. PUBLICATIONS
9.1 Journal publications
1) Marquardt A, Scalia G, Joyce P, Basnayake J, Botha FC. (2016). Changes in photosynthesis
and carbohydrate metabolism in sugarcane during the development of Yellow Canopy
Syndrome (YCS). Functional Plant Biology (submitted and accepted). (See Appendix 1)
2) Marquardt A, Scalia G, Wathen-Dunn K & Botha FC (2017) 'Yellow Canopy Syndrome (YCS) in
Sugarcane is Associated with Altered Carbon Partitioning in the Leaf', Sugar Tech, vol. 19, no.
6, pp. 647-55. (See Appendix 1)
3) Marquardt A, Henry RJ & Botha FC (2019) 'Midrib Sucrose Accumulation and Sugar
Transporter Gene Expression in YCS-Affected Sugarcane Leaves', Tropical Plant Biology, vol.
12, no. 3, pp. 186-205. (See Appendix 1)
9.2 Industry conference papers
4) Botha FC, Marquardt A, Scalia G, Wathen-Dunn1 K. (2016). Yellow Canopy Syndrome (YCS) is
associated with disruption of sucrose metabolism in the leaf. Proceedings of International
Society of Sugarcane Technologists (submitted). (See Appendix 1)
(presented by Frikkie Botha at ISSCT conference 2016).
5) Annelie Marquardt, Kate Wathen-Dunn, Robert J Henry and Frederik C Botha: “There’s
yellow and then there’s yellow – which one is YCS?” In: Proceedings of the Australian Society
of Sugar Cane Technologists, Volume 39, p89-98, 3-5 May, 2017.
(presented by Annelie Marquardt at ASSCT conference in 2017). (See Appendix 1)
10. ACKNOWLEDGEMENTS
We wish to thank our funding providers SRA and QDAF, the SRA RFU, other members of the YCS
integrated project team who assisted directly with this research, Priya Joyce, Dave Olsen, Jaya
Basnayake, Leana Hawkins and productivity and sugar services and the many growers who allowed
access to their properties and assisted in sampling. We also thank the many technicians who assisted
in sample collection and analyses. The feedback and insights provided by the Scientific Reference
Panel for the SRA YCS Program and the other teams investigating YCS were also valuable in guiding
the research
11. REFERENCES
Agusti J, Herold S, Schwarz M, Sanchez P, Ljung K, Dun EA, Brewer PB, Beveridge CA, Sieberer T, Sehr EM, Greb T (2011) Strigolactone signaling is required for auxin-dependent stimulation of secondary growth in plants. Proceedings of the National Academy of Sciences
Ahmad A (2014) Oxidative Damage to Plants: Antioxidant Networks and Signaling, Ed 1st. Academic Press

Sugar Research Australia Final Report - Project 2015/016
158
Allan SA, Kline DL, Walker D (2009) Environmental Factors Affecting Efficacy of Bifenthrin-treated Vegetation for Mosquito Control. Journal of the American Mosquito Control Association 25: 338-346
Allison JCS, Weinmann H (1970) Effect of Absence of Developing Grain on Carbohydrate Content and Senescence of Maize Leaves. Plant Physiology 46: 435
Altmann S, Muino JM, Lortzing V, Brandt R (2018) Transcriptomic basis for reinforcement of elm antiherbivore defence mediated by insect egg deposition. Molecular Ecology 27: 4901-4915
Amano Y, Tsubouchi H, Shinohara H, Ogawa M, Matsubayashi Y (2007) Tyrosine-sulfated glycopeptide involved in cellular proliferation and expansion in Arabidopsis. Proc Natl Acad Sci U S A 104: 18333-18338
Amm I, Sommer T, Wolf DH (2014) Protein quality control and elimination of protein waste: The role of the ubiquitin–proteasome system. Biochimica et Biophysica Acta (BBA) - Molecular Cell Research 1843: 182-196
Andersen EJ, Ali S, Byamukama E, Yen Y, Nepal MP (2018) Disease Resistance Mechanisms in Plants. Genes 9: 339
Apel K, Hirt H (2004) Reactive oxygen species: metabolism, oxidative stress, and signal transduction. Annual Review of Plant Biology 55: 373-399
Arnér ESJ, Holmgren A (2000) Physiological functions of thioredoxin and thioredoxin reductase. European Journal of Biochemistry 267: 6102-6109
Bai L, Zhang G, Zhou Y, Zhang Z, Wang W, Du Y, Wu Z, Song CP (2009) Plasma membrane-associated proline-rich extensin-like receptor kinase 4, a novel regulator of Ca signalling, is required for abscisic acid responses in Arabidopsis thaliana. Plant J 60: 314-327
Baker NR (2008) Chlorophyll fluorescence: A probe of photosynthesis in vivo. In Annual Review of Plant Biology, Vol 59. Annual Reviews, Palo Alto, pp 89-113
Baker RF, Braun DM (2008) Tie-dyed2 functions with tie-dyed1 to promote carbohydrate export from maize leaves. Plant Physiology 146: 1085-1097
Barratt DHP, Kölling K, Graf A, Pike M, Calder G (2011) Callose Synthase GSL7 Is Necessary for Normal Phloem Transport and Inflorescence Growth in Arabidopsis. Plant Physiology and Biochemistry 155: 328-341
Bassi D, Menossi M, Mattiello L (2018) Nitrogen supply influences photosynthesis establishment along the sugarcane leaf. Scientific Reports 8: 2327
Belesini AA, Carvalho FMS, Telles BR, de Castro GM, Giachetto PF, Vantini JS, Carlin SD, Cazetta JO, Pinheiro DG, Ferro MIT (2017) De novo transcriptome assembly of sugarcane leaves submitted to prolonged water-deficit stress. Genet Mol Res 16
Bergmeyer H, Bernt E (1974) Sucrose. In: Bergmeyer HU (ed) Methods of enzymatic analysis, Vol 2. Verlag Chemie, , Weinheim, New York.
Beutler H (1984) Starch. In: Bergmeyer H (ed) Methods of enzymatic analysis., Vol 3, Verlag Chemie, Weinheim, New York
Bihmidine S, Hunter CT, Johns CE, Koch KE, Braun DM (2013) Regulation of assimilate import into sink organs: update on molecular drivers of sink strength. Front Plant Sci 4: 177
Black CC, Lobodia T, Chen JQ, Sung S-JS (1995) Can sucrose cleavage enzymes serve as markers for sink strength and is sucrose a signal molecule during plant sink development? International Symposium on Sucrose Metabolism, Amer. Soc. of Plant Physiologists: 49-64
Bolger AM, Lohse M, Usadel B (2014) Trimmomatic: a flexible trimmer for Illumina sequence data. Bioinformatics 30: 2114-2120
Bonnett GD (2014) Development stages (phenology) In PH Moore, FC Botha, eds, Sugarcane Physiology. Biochemistry & Functional Biology. John Wiley & sons, New Dehli, India, p 633
Botha FC, Marquardt A, Scalia G, Wathen-Dunn K (2016) Yellow Canopy Syndrome (YCS) is associated with disruption of sucrose metabolism in the leaf. Proceedings of the international Society of Sugar Cane Technologists 29: 1348-1357

Sugar Research Australia Final Report - Project 2015/016
159
Botha FC, Marquardt A, Wathen-Dunn K, Scalia G, Joyce P (2015) Biological factors driving YCS (Final report Sugar Research Australia).
Botha FC, McDonald ZA (2010) Carbon partitioning in the sugarcane stalk. Proceedings Australian Society of Sugar Cane Technologists 32: 486-496
Botha FC, Whittaker A, Vorster DJ, Black KG (1996) Sucrose accumulation rate, carbon partitioning and expression of key enzyme activities in sugarcane stem tissue. C S I R O, East Melbourne
Boughton BA, Damien L, Callahan CS, Jairus B, al. e (2011) Comprehensive profiling and quantitation of amine group containing metabolites. . Analytical Chemistry 83: 7523-7530
Braun DM, Ma Y, Inada N, Muszynski MG, Baker RF (2006) Tie-dyed1 Regulates carbohydrate accumulation in maize leaves. Plant Physiolgy 142: 1511-1522
Braun DM, Slewinski TL (2009) Genetic control of carbon partitioning in grasses: roles of sucrose transporters and tie-dyed loci in phloem loading. Plant Physiol 149: 71-81
Cakmak I, Kirkby EA (2008) Role of magnesium in carbon partitioning and alleviating photooxidative damage. Physiologia Plantarum 133: 692-704
Chaves MM, Flexas J, Pinheiro C (2008) Photosynthesis under drought and salt stress: regulation
mechanisms from whole plant to cell. Annals of Botany 103: 551-560 Chen L-Q, Hou B-H, Lalonde S, Takanaga H, Hartung ML, Qu X-Q, Guo W-J, Kim J-G, Underwood W,
Chaudhuri B, Chermak D, Antony G, White FF, Somerville SC, Mudgett MB, Frommer WB (2010) Sugar transporters for intercellular exchange and nutrition of pathogens. Nature 468: 527-U199
Chen S, Elzaki MEA, Ding C, Li Z, Wang J (2019) Plant allelochemicals affect tolerance of polyphagous lepidopteran pest Helicoverpa armigera (Hübner) against insecticides. Plant Signaling & Behavior 4: 489-492
Chen XY, Kim JY (2009) Callose synthesis in higher plants. Plant Signaling & Behavior 4: 489-492 Chepyshko H, Lai C-P, Huang L-M, Liu J-H, Shaw J-F (2012) Multifunctionality and diversity of GDSL
esterase/lipase gene family in rice (Oryza sativa L. japonica) genome: new insights from bioinformatics analysis. BMC Genomics 13: 309
Cui W, Lee JY (2016) Arabidopsis callose synthases CalS1/8 regulate plasmodesmal permeability during stress. Nature Plants 2: 16034
Davies WJ, Kudoyarova G, Hartung W (2005) Long-distance ABA Signaling and Its Relation to Other Signaling Pathways in the Detection of Soil Drying and the Mediation of the Plant’s Response to Drought. Journal of Plant Growth Regulation 24: 285
Drake R, John I, Farrell A, Cooper W, Schuch W, Grierson D (1996) Isolation and analysis of cDNAs encoding tomato cysteine proteases expressed during leaf senescence. Plant molecular biology 30: 755-767
Du H, Li X, Ning L, Qin R, Du Q, Wang Q (2019) RNA-Seq analysis reveals transcript diversity and active genes after common cutworm (Spodoptera litura Fabricius) attack in resistant and susceptible wild soybean lines. BMC Genomics 20: 237
Du Y, Nose A, Kondo A, Wasano K (2000) Diurnal changes in photosynthesis in sugarcane leaves: II. Enzyme activities and metabolite levels relating to sucrose and starch metabolism. Plant Production Science 3: 9-16
Dubin MJ, Mittelsten Scheid O, Becker C (2018) Transposons: a blessing curse. Current Opinion in Plant Biology 42: 23-29
Dunaeva M, Goebel C, Wasternack C, Parthier B, Goerschen E (1999) The jasmonate-induced 60 kDa protein of barley exhibits N-glycosidase activity in vivo. FEBS Letters 452: 263-266
Esau K (1957) Phloem Degeneration in Gramineae Affected by the Barley Yellow-Dwarf Virus. American Journal of Botany 44: 245-251
Fan X, Naz M, Fan X, Xuan W, Miller AJ, Xu G (2017) Plant nitrate transporters: from gene function to application. J Exp Bot 68: 2463-2475

Sugar Research Australia Final Report - Project 2015/016
160
Figueroa C, Lunn J (2016) A Tale of Two Sugars: Trehalose 6-Phosphate and Sucrose. Plant Physiology 172: 7-27
Fontaniella B, Vicente C, Legaz ME, de Armas R, Rodríguez CW, Martínez M, Piñón D, Acevedo R, Solas MT (2003) Yellow leaf syndrome modifies the composition of sugarcane juices in polysaccharides, phenols and polyamines. Plant Physiology and Biochemistry 41: 1027-1036
Foyer CH, Noctor G (2005) Oxidant and antioxidant signalling in plants: a re-evaluation of the concept of oxidative stress in a physiological context. Plant, Cell & Environment 28: 1056-1071
Fujimoto S, Yonemura M, Matsunaga S, Nakagawa T, Uchiyama S, Fukui K (2005) Characterization and dynamic analysis of Arabidopsis condensin subunits, AtCAP-H and AtCAP-H2. Planta 222: 293-300
Furbank RT (2011) Evolution of the C4 photosynthetic mechanism: are there really three C4 acid decarboxylation types? Journal of Experimental Botany 62: 3103-3108
Geigenberger P (2011) Regulation of starch biosynthesis in response to a fluctuating environment. Plant physiology 155: 1566-1577
Geiger DR, Koch KE, Shieh W (1996) Effect of environmental factors on whole plant assimilate partitioning and associated gene expression Journal of Experimental Botany 47: 1229-1238
Ghannoum O (2009) C4 photosynthesis and water stress. Ann Bot 103: 635-644 Gill SS, Tuteja N (2010) Reactive oxygen species and antioxidant machinery in abiotic stress
tolerance in crop plants. Plant Physiology and Biochemistry 48: 909-930 Gille S, de Souza A, Xiong G, Benz M, Cheng K, Schultink A, Reca I-B, Pauly M (2011) O-acetylation
of Arabidopsis hemicellulose xyloglucan requires AXY4 or AXY4L, proteins with a TBL and DUF231 domain. The Plant cell 23: 4041-4053
Glassop D, Stiller J, Bonnett GD, Grof CPL, Rae AL (2017) An analysis of the role of the ShSUT1 sucrose transporter in sugarcane using RNAi suppression. Functional Plant Biology 44: 795-808
Głowacki S, Macioszek VK, Kononowicz AK (2011) R proteins as fundamentals of plant innate immunity. Cellular & Molecular Biology Letters 16: 1-24
Goldschmidt EE, Huber SC (1992) REGULATION OF PHOTOSYNTHESIS BY END-PRODUCT ACCUMULATION IN LEAVES OF PLANTS STORING STARCH, SUCROSE, AND HEXOSE SUGARS. Plant Physiology 99: 1443-1448
Gomes MP, Le Manac'h SG, Maccario S, Labrecque M, Lucotte M, Juneau P (2016) Differential effects of glyphosate and aminomethylphosphonic acid (AMPA) on photosynthesis and chlorophyll metabolism in willow plants. Pesticide Biochemistry and Physiology 130: 65-70
Graham IA, Martin T (2000) Control of Photosynthesis, Allocation and Partitioning by Sugar Regulated Gene Expression. In RC Leegood, TD Sharkey, S von Caemmerer, eds, Photosynthesis: Physiology and Metabolism. Springer Netherlands, Dordrecht, pp 233-248
Grandbastien M-A (1998) Activation of plant retrotransposons under stress conditions. Trends in Plant Science 3: 181-187
Gray J, Caparrós-Ruiz D, Grotewold E (2012) Grass phenylpropanoids: Regulate before using! Plant Science 184: 112-120
Gupta AK, Kaur N (2005) Sugar signalling and gene expression in relation to carbohydrate metabolism under abiotic stresses in plants. Journal of Biosciences 30: 761-776
Hamonts K, Trivedi P, Grinyer J, Holford P, Drigo B, Anderson IA, Singh BK (2018) Yellow Canopy Syndrome in sugarcane is associated with shifts in the rhizosphere soil metagenome but not with overall soil microbial function. Soil Biology and Biochemistry 125: 275-285
Hatch MD, Glasziou KT (1964) Direct Evidence for Translocation of Sucrose in Sugarcane Leaves and Stems. Plant physiology 39: 180-184
Herbers K, Tacke E, Hazirezaei M, Krause KP, Melzer M, Rohde W, Sonnewald U (1997) Expression of a luteoviral movement protein in transgenic plants leads to carbohydrate accumulation and reduced photosynthetic capacity in source leaves. Plant J 12: 1045-1056

Sugar Research Australia Final Report - Project 2015/016
161
Hoang NV, Furtado A, Mason PJ, Marquardt A, Kasirajan L, Thirugnanasambandam PP, Botha FC, Henry RJ (2017) A survey of the complex transcriptome from the highly polyploid sugarcane genome using full-length isoform sequencing and de novo assembly from short read sequencing. BMC Genomics 18: 395
Hoang NV, Furtado A, O'Keeffe AJ, Botha FC, Henry RJ (2017) Association of gene expression with biomass content and composition in sugarcane. PLoS One 12: e0183417
Hoang NV, Furtado A, Thirugnanasambandam PP, Botha FC, Henry RJ (2018) De novo assembly and characterizing of the culm-derived meta-transcriptome from the polyploid sugarcane genome based on coding transcripts. In Heliyon, Vol 4, p e00583
Horváth BM, Magyar Z, Zhang Y, Hamburger AW, Bakó L, Visser RG, Bachem CW, Bögre L (2006) EBP1 regulates organ size through cell growth and proliferation in plants. The EMBO Journal 25: 4909-4920
Huot B, Yao J, Montgomery BL, He SY (2014) Growth-defense tradeoffs in plants: a balancing act to optimize fitness. Mol Plant 7: 1267-1287
Husted S, Schjoerring J (1995) Apoplastic pH and Ammonium Concentration in leaves of Brassica napus L. Plant Physiology 109: 1453-1460
Idänheimo N (2015) The Role of Cysteine-rich Receptor-like Protein Kinases in ROS Signaling in Arabidopsis thaliana.
Inman-Bamber NG (1994) Temperature and seasonal effects on canopy development and light interception of sugarcane. Field Crops Research 36: 41-51.
Inman-Bamber NG, Bonnett GD, Smith DM, Thorburn PJ (2005) Sugarcane physiology: Integrating from cell to crop to advance sugarcane production. Field Crops Research 92: 115-117
Jeannette E, Reyss A, Gregory N, Gantet P, Prioul JL (2000) Carbohydrate metabolism in a heat-girdled maize source leaf. Plant Cell and Environment 23: 61-69
Jensen SG (1996) Composition and metabolism of barley leaves infected with barley yellow dwarf virus. Phytopathology 59: 1694-1698
Jiang CD, Shi L, Gao HY, Schansker G, Toth SZ, Strasser RJ (2006) Development of photosystems 2 and 1 during leaf growth in grapevine seedlings probed by chlorophyll a fluorescence transient and 820 nm transmission in vivo. Photosynthetica 44: 454-463
Julius B, Slewinski TL, Baker RF, Tzin V, Braun DM (2018) Maize carbohydrate partitioning defective1 Impacts Carbohydrate Distribution, Callose Accumulation, and Phloem Function. Journal of Experimental Botany 69: 3917-3931
Kelly G, Moshelion M, David-Schwartz R, Halperin O, Wallach R, Attia Z, Belausov E, Granot D (2013) Hexokinase mediates stomatal closure. The Plant Journal 75: 977-988
Kenyon J, Turner JG (1990) Physiological changes in Nicotiana tabacum leaves during development of chlorosis caused by coronatine. Physiological and Molecular Plant Pathology 37: 463-477
Keunen E, Remans T, Opdenakker K, Jozefczak M, Gielen H (2013) A mutant of the Arabidopsis thaliana LIPOXYGENASE1 gene shows altered signalling and oxidative stress related responses after cadmium exposure. Plant Physiol Biochem 63: 272-280
Kim J, Yang J, Yang R, Sicher RC, Chang C, Tucker ML (2016) Transcriptome Analysis of Soybean Leaf Abscission Identifies Transcriptional Regulators of Organ Polarity and Cell Fate. Frontiers in Plant Science 7
Kingston-Smith AH, Galtier N, Pollock CJ, Foyer CH (1998) Soluble acid invertase activity in leaves is independent of species differences in leaf carbohydrates, diurnal sugar profiles and paths of phloem loading. New Phytologist 139: 283-292
Ko Y, Lin Y (2004) 1,3-beta-glucan quantification by a fluorescence microassay and analysis of its distribution in foods. Journal of Agriculture and Food Chemistry 52: 3313-3318
Koch KE (1996) CARBOHYDRATE-MODULATED GENE EXPRESSION IN PLANTS. Annu. Rev. Plant Physiol. Plant Mol. Biol. 47: 509-540
Koch KE (2004) Sucrose metabolism: regulatory mechanisms and pivotal roles in sugar sensing and plant development. Curr Opin Plant Biol 7: 235-246
Sugar Research Australia Final Report - Project 2015/016
162
Kohle H, Jeblick W, Proten F, BLASCHEK W, KAUSS H (1984) Chitosan-Elicited Callose Synthesis in Soybean Cells as a Ca2+-Dependent Process. Plant Physiology and Biochemistry 77: 544-551
Kowalski GM, De Souza DP, Burch ML, Hamley S, Kloehn J, Selathurai A, Tull D, O'Callaghan S, McConville MJ, Bruce CR (2015) Application of dynamic metabolomics to examine in vivo skeletal muscle glucose metabolism in the chronically high-fat fed mouse. Biochemical and Biophysical Research Communications 462: 27-32
Krapp A, Stitt M (1995) AN EVALUATION OF DIRECT AND INDIRECT MECHANISMS FOR THE SINK-REGULATION OF PHOTOSYNTHESIS IN SPINACH - CHANGES IN GAS-EXCHANGE, CARBOHYDRATES, METABOLITES, ENZYME-ACTIVITIES AND STEADY-STATE TRANSCRIPT LEVELS AFTER COLD-GIRDLING SOURCE LEAVES. Planta 195: 313-323
Kruger GHJ, Tsimilli-Michael M, Strasser RJ (1997) Light stress provokes plastic and elastic modifications in structure and function of photosystems II in camellia leaves. Physiologica Plantarum 101: 265-277
Ku Y-S, Sintaha M, Cheung M-Y, Lam H-M (2018) Plant Hormone Signaling Crosstalks between Biotic and Abiotic Stress Responses. International Journal of Molecular Sciences 19: 3206
Kumar A, Bennetzen JL (1999) Plant retrotransposons. Annu Rev Genet 33: 479-532 Kurotani KI, Hattori T, Takeda S (2015) Overexpression of a CYP94 family gene CYP94C2b increases
internode length and plant height in rice. Plant Signal Behav 10: e1046667 Kwon SJ, Jin HC, Lee S, Nam MH, Chung JH, Kwon SI, Ryu C-M, Park OK (2009) GDSL lipase-like 1
regulates systemic resistance associated with ethylene signaling in Arabidopsis. The Plant Journal 58: 235-245
Laskowski MJ, Dreher KA, Gehring MA, Abel S, Gensler AL, Sussex IM (2002) FQR1, a Novel Primary Auxin-Response Gene, Encodes a Flavin Mononucleotide-Binding Quinone Reductase. Plant Physiology 128: 578
Lehrer AT, Komor E (2008) Symptom expression of yellow leaf disease in sugarcane cultivars with different degrees of infection by Sugarcane yellow leaf virus. Plant Pathology 57: 178-189
Lemoine R, La Camera S, Atanassova R, Deedaldeechamp F, Allario T, Pourtau N, Bonnemain JL, Laloi M, Coutos-Theevenot P, Maurousset L, Faucher M, Girousse C, Lemonnier P, Parrilla J, Durand M (2013) Source-to-sink transport of sugar and regulation by environmental factors. Frontiers in Plant Science 4
Li P, Zhou H, Shi X, Yu B, Zhou Y, Chen S, Wang Y, Peng Y, Meyer RC, Smeekens SC, Teng S (2014) The ABI4-induced Arabidopsis ANAC060 transcription factor attenuates ABA signaling and renders seedlings sugar insensitive when present in the nucleus. PLoS Genet 10: e1004213
Lim CJ, Yang KA, Hong JK, Choi JS, Yun D-J, Hong JC, Chung WS, Lee SY, Cho MJ, Lim CO (2006) Gene expression profiles during heat acclimation in Arabidopsis thaliana suspension-culture cells. Journal of Plant Research 119: 373-383
Lin YT, Chen LJ, Herrfurth C, Feussner I, Li HM (2016) Reduced Biosynthesis of Digalactosyldiacylglycerol, a Major Chloroplast Membrane Lipid, Leads to Oxylipin Overproduction and Phloem Cap Lignification in Arabidopsis. Plant Cell 28: 219-232
Lipowsky G, Bischoff FR, Schwarzmaier P, Kraft R, Kostka S, Hartmann E, Kutay U, Görlich D (2000) Exportin 4: a mediator of a novel nuclear export pathway in higher eukaryotes. The EMBO journal 19: 4362-4371
Long SP, Farage PK, Garcia RL (1996) Measurement of leaf and canopy photosynthetic CO2 exchange in the field. Journal of Experimental Botany 47: 1629-1642
Loudet O, Michael TP, Burger BT, Le Metté C, Mockler TC, Weigel D, Chory J (2008) A zinc knuckle protein that negatively controls morning-specific growth in <em>Arabidopsis thaliana</em>. Proceedings of the National Academy of Sciences 105: 17193
Love AJ, Yu C, Petukhova NV, Kalinina NO, Chen J, Taliansky ME (2017) Cajal bodies and their role in plant stress and disease responses. RNA biology 14: 779-790
Lu Y, Sharkey TD (2006) The importance of maltose in transitory starch breakdown. Plant, Cell & Environment 29: 353-366

Sugar Research Australia Final Report - Project 2015/016
163
Lunn J, Delorge I, Figueroa C, Van Dijck P, Stitt M (2014) Trehalose metabolism in plants. The Plant Journal 79: 544-567
Lunn JE, Furbank RT (1997) Localisation of sucrose-phosphate synthase and starch in leaves of C4 plants. Planta 202: 106-111
Ma JF, Yamaji N (2006) Silicon uptake and accumulation in higher plants. Trends in Plant Science 11: 392-397
Marquardt A (2019) The molecular analysis of yellow canopy syndrome-induced yellowing in the sugarcane leaf. The University of Queeensland, The University of Queensland, Queensland Alliance for Agriculture and Food Innovation
Marquardt A, Henry RJ, Botha FC (2019) Midrib Sucrose Accumulation and Sugar Transporter Gene Expression in YCS-Affected Sugarcane Leaves. Tropical Plant Biology 12: 186-205
Marquardt A, Scalia G, Joyce P, Basnayake J, Botha FC (2016) Changes in photosynthesis and carbohydrate metabolism in sugarcane during the development of Yellow Canopy Syndrome. Functional Plant Biology 43: 523-533
Marquardt A, Scalia G, Wathen-Dunn K, Botha FC (2017) Yellow Canopy Syndrome (YCS) in Sugarcane is Associated with Altered Carbon Partitioning in the Leaf. Sugar Tech 19: 647-655
Mattiello L, Riaño-Pachón DM, Martins MCM, da Cruz LP, Bassi D, Marchiori PER, Ribeiro RV, Labate MTV, Labate CA, Menossi M (2015) Physiological and transcriptional analyses of developmental stages along sugarcane leaf. BMC plant biology 15: 300-300
McCormick AJ, Cramer MD, Watt DA (2008) Regulation of photosynthesis by sugars in sugarcane leaves. Journal of Plant Physiology 165: 1817-1829
Miao Y, Jia H, Li Z, Liu Y, Hou M (2018) Transcriptomic and Expression Analysis of the Salivary Glands in Brown Planthoppers, Nilaparvata lugens (Hemiptera: Delphacidae). Journal of Economic Entomology 111: 2884-2893
Moore PH, Botha FC (2013) Sugarcane Physiology, Biochemistry & Functional Biology. Hoboken : Wiley, Hoboken
Morey SR, Hirose T, Hashida Y, Miyao A, Hirochika H, Ohsugi R, Yamagishi J, Aoki N (2018) Genetic Evidence for the Role of a Rice Vacuolar Invertase as a Molecular Sink Strength Determinant. Rice (N Y) 11: 6
Morey SR, Hirose T, Hashida Y, Miyao A, Hirochika H, Ohsugi R, Yamagishi J, Aoki N (2019) Characterisation of a rice vacuolar invertase isoform, <i>OsINV2</i>, for growth and yield-related traits. Functional Plant Biology 46: 777-785
Morgan T, Jackson P, McDonald L, Holtum J (2007) Chemical ripeners increase early season sugar content in a range of sugarcane varieties. Australian Journal of Agricultural Research 58: 233-241
Mueller MJ, Berger S (2009) Reactive electrophilic oxylipins: Pattern recognition and signalling. Phytochemistry 70: 1511-1521
Myers AM, Morell MK, James MG, NBall SG (2000) Recent Progress toward Understanding Biosynthesis of the Amylopectin Crystal. Plant Physiology 122: 989-997
Nanchen A, Fuhrer T, Sauer U (2007) Determination of metabolic flux ratios from 13C-experiments and gas chromatography-mass spectrometry data: protocol and principles. Methods Mol Biol 358: 177-197
Negi P, Rai AN, Suprasanna P (2016) Moving through the Stressed Genome: Emerging Regulatory Roles for Transposons in Plant Stress Response. Frontiers in plant science 7: 1448-1448
Nishizawa A, Yabuta Y, Shigeoka S (2008) Galactinol and raffinose constitute a novel function to protect plants from oxidative damage. Plant Physiology 147: 1251-1263
Nounjan N, Chansongkrow P, Charoensawan V, Siangliw JL, Toojinda T, Chadchawan S, Theerakulpisut P (2018) High Performance of Photosynthesis and Osmotic Adjustment Are Associated With Salt Tolerance Ability in Rice Carrying Drought Tolerance QTL: Physiological and Co-expression Network Analysis. Frontiers in plant science 9: 1135-1135

Sugar Research Australia Final Report - Project 2015/016
164
Nuccio ML, Wu J, Mowers R, Zhou H-P, Meghji M, Primavesi LF, Paul MJ, Chen X, Gao Y, Haque E, Basu SS, Lagrimini LM (2015) Expression of trehalose-6-phosphate phosphatase in maize ears improves yield in well-watered and drought conditions. Nature Biotechnology 33: 862-869
Olsen DJ, Ward AL (2019) Effect of neonicotinoid, pyrethroid and spirotetramat insecticides and a miticide on incidence and severity of Yellow canopy syndrome. Proceedings Australian Society of Sugar Cane Technologists 41: 359-366
Olsen JV, Blagoev B, Gnad F, Macek B, Kumar C, Mortensen P, Mann M (2006) Global, In Vivo, and Site-Specific Phosphorylation Dynamics in Signaling Networks. Cell 127: 635-648
Osmond CB, Foyer CH, Bock G, Grace SC, Logan BA (2000) Energy dissipation and radical scavenging by the plant phenylpropanoid pathway. Philosophical Transactions of the Royal Society of London. Series B: Biological Sciences 355: 1499-1510
Patil V, McDermott HI, McAllister T, Cummins M, Silva JC, Mollison E, Meikle R, Morris J, Hedley PE, Waugh R, Dockter C, Hansson M, McKim SM (2019) APETALA2 control of barley internode elongation. Development 146: dev170373
Peng H, Zhang J (2009) Plant genomic DNA methylation in response to stresses: Potential applications and challenges in plant breeding. Progress in Natural Science 19: 1037-1045
Peumans WJ, Damme EJMV (2001) Ribosome-inactivating proteins from plants: more than RNA N-glycosidases? The FASEB Journal 15: 1493-1506
Pokorska B, Zienkiewicz M, Powikrowska M, Drozak A, Romanowska E (2009) Differential turnover of the photosystem II reaction centre D1 protein in mesophyll and bundle sheath chloroplasts of maize. Biochimica Et Biophysica Acta-Bioenergetics 1787: 1161-1169
Qin YM, Hu CY, Pang Y, Kastaniotis AJ, Hiltunen JK, Zhu YX (2007) Saturated very-long-chain fatty acids promote cotton fiber and Arabidopsis cell elongation by activating ethylene biosynthesis. Plant Cell 19: 3692-3704
Rae AL, Martinelli P, Dornelas MC (2014) Anatomy and Morphology. In PH Moore, FC Botha, eds, Sugarcane: Physiology, Biochemistry, and Functional Biology. John Wiley & Sons, Inc, UK
Rae AL, Pierre J (2018) Sugarcane root systems for increased productivity; development and application of a root health assay: Final report submitted Sugar Research Australia.
Rajcan I, Tollenaar M (1999) Source:sink ratio and leaf senescence in maize:: II. Nitrogen metabolism during grain filling. Field Crops Research 60: 255-265
Robertson MJ, Bonnett G. D., Hughes R. M., Muchow R. C. and Campbell J. A. (1998) (1998) Temperature and leaf area expansion of sugarcane: integration of controlled-environment, field and model studies. Australian Journal of Plant Physiology 25: 819-828
Rodziewicz P, Swarcewicz B, Chmielewska K, Wojakowska A, Stobiecki M (2014) Influence of abiotic stresses on plant proteome and metabolome changes. Acta Physiologiae Plantarum 36: 1-19
Russin WA, Evert RF, Vanderveer PJ, Sharkey TD, Briggs SP (1996) Modification of a Specific Class of Plasmodesmata and Loss of Sucrose Export Ability in the sucrose export defective1 Maize Mutant. The Plant Cell 8: 645
Sasaki H, Hara T, Ito S, Uehara N, Kim HY, Lieffering M, Okada M, Kobayashi K (2007) Effect of free-air CO₂ enrichment on the storage of carbohydrate fixed at different stages in rice (Oryza sativa L.). Field crops research 100: 24-31
Saunders EC, de Souza DP, Chambers JM, Ng M, Pyke J, McConville MJ (2015) Use of (13)C stable isotope labelling for pathway and metabolic flux analysis in Leishmania parasites. Methods Mol Biol 1201: 281-296
Schansker G, Tóth SZ, Strasser RJ (2005) Methylviologen and dibromothymoquinone treatments of pea leaves reveal the role of photosystem I in the Chl a fluorescence rise OJIP. Biochimica et Biophysica Acta (BBA) - Bioenergetics 1706: 250-261
Schöttler MA, Tóth SZ (2014) Photosynthetic complex stoichiometry dynamics in higher plants: environmental acclimation and photosynthetic flux control. Frontiers in Plant Science 5

Sugar Research Australia Final Report - Project 2015/016
165
Schreiber U, Neubauer C (1987) The Polyphasic Rise of Chlorophyll Fluorescence upon Onset of Strong Continuous Illumination: II. Partial Control by the Photosystem II Donor Side and Possible Ways of Interpretation. 42: 1255
Schultink A, Naylor D, Dama M, Pauly M (2015) The Role of the Plant-Specific ALTERED XYLOGLUCAN9 Protein in Arabidopsis Cell Wall Polysaccharide <em>O-</em>Acetylation. Plant Physiology 167: 1271-1283
Schulz S, Chachami G, Kozaczkiewicz L, Winter U, Stankovic-Valentin N, Haas P, Hofmann K, Urlaub H, Ovaa H, Wittbrodt J, Meulmeester E, Melchior F (2012) Ubiquitin-specific protease-like 1 (USPL1) is a SUMO isopeptidase with essential, non-catalytic functions. EMBO reports 13: 930-938
Schürmann P, Jacquot J-P (2000) PLANT THIOREDOXIN SYSTEMS REVISITED. Annual Review of Plant Physiology and Plant Molecular Biology 51: 371-400
Schwacke R, Ponce-Soto GY, Krause K, Bolger AM, Arsova B, Hallab A, Gruden K, Stitt M, Bolger ME, Usadel B (2019) MapMan4: A Refined Protein Classification and Annotation Framework Applicable to Multi-Omics Data Analysis. Molecular Plant 12: 879-892
Sehr EM, Agusti J, Lehner R, Farmer EE, Schwarz M, Greb T (2010) Analysis of secondary growth in the Arabidopsis shoot reveals a positive role of jasmonate signalling in cambium formation. Plant J 63: 811-822
Sham A, Al-Azzawi A, Al-Ameri S, Al-Mahmoud B, Awwad F (2014) Transcriptome Analysis Reveals Genes Commonly Induced by Botrytis cinerea Infection, Cold, Drought and Oxidative Stresses in Arabidopsis. PLoS ONE 9
Sharp RE, Wu Y, Voetberg GS, Saab IN, LeNoble ME (1994) Confirmation that abscisic acid accumulation is required for maize primary root elongation at low water potentials. Journal of Experimental Botany 45: 1743-1751
Shedletzky E, Unger C, Delmer DP (1997) A microtiter-based fluorescence assay for (1,3)-beta-glucan synthases. Analytical Biochemistry 249: 88-93
Sheen J (1990) Metabolic repression of transcription in higher plants. The Plant Cell 2: 1027 Sheen J (1994) Feedback control of gene expression. Photosynthesis Research 39: 427-438 Shiriga K, Sharma R, Kumar K, Yadav SK, Hossain F, Thirunavukkarasu N (2014) Genome-wide
identification and expression pattern of drought-responsive members of the NAC family in maize. Meta Gene 2: 407-417
Simão FA, Waterhouse RM, Ioannidis P, Kriventseva EV, Zdobnov EM (2015) BUSCO: assessing genome assembly and annotation completeness with single-copy orthologs. Bioinformatics 31: 3210-3212
Slewinski TL, Braun DM (2010) The psychedelic genes of maize redundantly promote carbohydrate export from leaves. Genetics 185: 221-232
Slewinski TL, Meeley R, Braun DM (2009) Sucrose transporter1 functions in phloem loading in maize leaves. J Exp Bot 60: 881-892
Smith GJ (2007) Starch and Cellulose In Organic Chemistry, Second Edition The McGraw-Hill Companies, Inc.
Srivastava A, Guissé B, Greppin H, Strasser RJ (1997) Regulation of antenna structure and electron transport in Photosystem II of Pisum sativum under elevated temperature probed by the fast polyphasic chlorophyll a fluorescence transient: OKJIP. Biochimica et Biophysica Acta (BBA) - Bioenergetics 1320: 95-106
Stitt M, Quick WP (1989) Photosynthetic carbon partitioning: its regulation and possibilities for manipulation. Physiologia Plantarum 77: 633-641
Strand DD, Livingston AK, Satoh-Cruz M, Froehlich JE, Maurino VG, Kramer DM (2015) Activation of cyclic electron flow by hydrogen peroxide in vivo. Proceedings of the National Academy of Sciences of the United States of America 112: 5539-5544
Strasser RJ, Srivastava A, Tsimili-Michael M (2000) The fluorescence transient as a tool to characterize and screen photosynthetic samples. In M Yunus, U Pathre, P Mohanty, eds,

Sugar Research Australia Final Report - Project 2015/016
166
Probing Photosynthesis: Mechanism, Regulation and Adaptation. Taylor and Francis, London, UK, pp 443-480
Sung SJS, Xu DP, Galloway CM, Black CC (1988) A REASSESSMENT OF GLYCOLYSIS AND GLUCONEOGENESIS IN HIGHER-PLANTS. Physiologia Plantarum 72: 650-654
Suzuki N, Rivero RM, Shulaev V, Blumwald E (2014) Abiotic and biotic stress combinations. New Phytologist 203: 32-43
Takahashi H, Imamura T, Konno N, Takeda T, Fujita K, Konishi T, Nishihara M, Uchimiya H (2014) The Gentio-Oligosaccharide Gentiobiose Functions in the Modulation of Bud Dormancy in the Herbaceous Perennial <em>Gentiana</em>. The Plant Cell 26: 3949-3963
Takemiya A, Sugiyama N, Fujimoto H, Tsutsumi T, Yamauchi S, Hiyama A, Tada Y, Christie J, Shimazaki K-i (2013) Phosphorylation of BLUS1 kinase by phototropins is a primary step in stomatal opening. Nature communications 4: 2094
Thangasamy S, Chen P-W, Lai M-H, Chen J, Jauh G-Y (2012) Rice LGD1 containing RNA binding activity affects growth and development through alternative promoters. The Plant Journal 71: 288-302
Tollenaar M, Daynard T (1982) Effect of source-sink ratio on dry matter accumulation and leaf senescence of maize. Canadian Journal of Plant Science - CAN J PLANT SCI 62: 855-860
Tsimilli-Michael M, Strasser RJ (2008) Experimental Resolution and Theoretical Complexity Determine the Amount of Information Extractable from the Chlorophyll Fluorescence Transient OJIP. In JF Allen, E Gantt, JH Golbeck, B Osmond, eds, Photosynthesis. Energy from the Sun. . Springer Netherlands Dordrecht
Tsimilli-Michael M, Strasser RJ (2013) The energy flux theory 35 years later: formulations and applications. Photosynth Res 117: 289-320
Uehara N, Sasaki H, Aoki N, Ohsugi R (2009) Effects of the Temperature Lowered in the Daytime and Night-time on Sugar Accumulation in Sugarcane. Plant Production Science 12: 420-427
Ueki S, Citovsky V (2014) Plasmodesmata-associated proteins: can we see the whole elephant? Plant Signaling & Behavior 9: e27899
van Heerden PDR, Swanepoel JW, Krüger GHJ (2007) Modulation of photosynthesis by drought in two desert scrub species exhibiting C3-mode CO2 assimilation. Environmental and Experimental Botany 61: 124-136
Varsani S, Grover S, Zhou S, Koch KG, Huang P (2019) 12-Oxo-Phytodienoic Acid Acts as a Regulator of Maize Defense against Corn Leaf Aphid. Plant Physiology and Biochemistry 179: 1402-1415
Wahid A, Close TJ (2007) Expression of dehydrins under heat stress and their relationship with water relations of sugarcane leaves. Biologia Plantarum 51: 104-109
Wang C, Yan X, Chen Q, Jiang N, Fu W, Ma B, Liu J, Li C, Bednarek SY, Pan J (2013) Clathrin Light Chains Regulate Clathrin-Mediated Trafficking, Auxin Signaling, and Development in <em>Arabidopsis</em>. The Plant Cell 25: 499
Wang J, Wang Y, O'Halloran TJ (2006) Clathrin Light Chain: Importance of the Conserved Carboxy Terminal Domain to Function in Living Cells. Traffic 7: 824-832
Watt DA, McCormick AJ, Govender C, Carson DL, Cramer MD, Huckett BI, Botha FC (2005) Increasing the utility of genomics in unravelling sucrose accumulation. Field Crops Research 92: 149-158
Weise SE, van Wijk KJ, Sharkey TD (2011) The role of transitory starch in C3, CAM, and C4 metabolism and opportunities for engineering leaf starch accumulation. Journal of Experimental Botany 62: 3109-3118
Widodo, Patterson JH, Newbigin E, Tester M, Bacic A, Roessner U (2009) Metabolic responses to salt stress of barley (Hordeum vulgare L.) cultivars, Sahara and Clipper, which differ in salinity tolerance. Journal of experimental botany 60: 4089-4103
Will T, van Bel AJ (2006) Physical and chemical interactions between aphids and plants. Journal of Experimental Botany 57: 729-737

Sugar Research Australia Final Report - Project 2015/016
167
Witt S, Galicia L, Lisec J, Cairns J, Tiessen A, Araus J, Palacios Rojas N, Fernie A (2011) Metabolic and Phenotypic Responses of Greenhouse-Grown Maize Hybrids to Experimentally Controlled Drought Stress. Molecular plant 5: 401-417
Wood DE, Salzberg SL (2014) Kraken: ultrafast metagenomic sequence classification using exact alignments. Genome Biology 15: R46
Xia J, Sinelnikov IV, Han B, Wishart DS (2015) MetaboAnalyst 3.0--making metabolomics more meaningful. Nucleic Acids Res 43: W251-257
Xin Z, Chen S, Ge L, Li X, Sun X (2019) The involvement of a herbivore-induced acyl-CoA oxidase gene, CsACX1, in the synthesis of jasmonic acid and its expression in flower opening in tea plant (Camellia sinensis). Plant Physiology and Biochemistry 135: 132-140
Yan N, Doelling JH, Falbel TG, Durski AM, Vierstra RD (2000) The Ubiquitin-Specific Protease Family from Arabidopsis.AtUBP1 and 2 Are Required for the Resistance to the Amino Acid Analog Canavanine. Plant Physiology 124: 1828-1843
Yan SL, Lehrer AT, Hajirezaei MR, Springer A, Komor E (2008) Modulation of carbohydrate metabolism and chloroplast structure in sugarcane leaves which were infected by Sugarcane Yellow Leaf Virus (SCYLV). Physiological and Molecular Plant Pathology 73: 78-87
Yang DL, Yao J, Mei CS, Tong XH, Zeng LJ, Li Q, Xiao LT, Sun TP, Li J, Deng XW, Lee CM, Thomashow MF, Yang Y, He Z, He SY (2012) Plant hormone jasmonate prioritizes defense over growth by interfering with gibberellin signaling cascade. Proc Natl Acad Sci U S A 109: E1192-1200
Yang J, Duan G, Li C, Liu L, Han G, Zhang Y, Wang C (2019) The Crosstalks Between Jasmonic Acid and Other Plant Hormone Signaling Highlight the Involvement of Jasmonic Acid as a Core Component in Plant Response to Biotic and Abiotic Stresses. Frontiers in Plant Science 10
Yoo SY, Kim Y, Kim SY, Lee JS, Ahn JH (2007) Control of flowering time and cold response by a NAC-domain protein in Arabidopsis. PLoS One 2: e642
Yoshida-Moriguchi T, Willer T, Anderson ME, Venzke D, Whyte T, Muntoni F, Lee H, Nelson SF, Yu L, Campbell KP (2013) SGK196 is a glycosylation-specific O-mannose kinase required for dystroglycan function. Science (New York, N.Y.) 341: 896-899
Zhang L, Zhang F, Melotto M, Yao J, He SY (2017) Jasmonate signaling and manipulation by pathogens and insects. Journal of experimental botany 68: 1371-1385
Zhang Q, Hu WC, Zhu F, Wang LM, Yu QY, Ming R, Zhang JS (2016) Structure, phylogeny, allelic haplotypes and expression of sucrose transporter gene families in Saccharum. Bmc Genomics 17

Sugar Research Australia Final Report - Project 2015/016
168
12. APPENDIX
12.1. Appendix 1 Publications
https://doi.org/10.1071/FP15335
https://doi.org/10.1007/s12355-017-0555-1
https://doi.org/10.1007/s12042-019-09221-7
Botha FC 2016
Yellow Canopy Syndrome (YCS) is associated with disruption of sucrose metabolism in the leaf.pdf
Marquardt_ASSCT.p
df
12.2. Appendix 2 Academic publications
Marquardt A
s4140264_phd_thesis.pdf
KateWD_UQ_June2
017.pdf
12.3. Appendix 3 Presentations
GPMB
congress_Botha.pdf
P2015016 Appendix
C AMarquardt_TropAg17_Final.pdf
Industry webinar https://www.youtube.com/watch?v=SDe4L00cBLI&t=7s
12.4. Appendix 4 Posters
P2015016 Appendix
C Kate-TropAg-Poster-final.pdf
P2015016 Appendix
C Trop Ag 13C Poster Print Proof.pdf
TropAg_BiomarkerTe
st_YCS_Poster_2019 F No trims_2.pdf
TropAg_YCS_Identific
ation_Poster_2019 F_notrims.pdf
Botha F 2017 Poster
PAG.pdf
Annelie Poster
PAG.pdf
12.5. Appendix 5 Data
2015016 Appendix
A Phytoplasmas and Ralstoni-pickettii-.docx

Sugar Research Australia Final Report - Project 2015/016
169
12.6. Appendix 6 METADATA DISCLOSURE
Table 16: Metadata disclosure 1
Data Raw and trimmed RNA sequencing data files, and de novo assembled sugarcane YCS transcriptomes (leaf/internode/combined)
Stored Location 1) Sugar Research Australia: portable hard drives, cloud storage account and Linux computer used by Kate Wathen-Dunn
2) NCBI Sequence Reads Archive, under BioProjects PRJNA480179 and PRJNA474042
Access
1) Sugar Research Australia staff only, or by request 2) Anyone with an internet connection
Contact
Gerard Scalia ([email protected] ) or Steve Comerford ([email protected]) for access
Table 17: Metadata disclosure 2
Data All data, scripts, images, analyses, files, reports and presentations associated with the project
Stored Location Sugar Research Australia "J:\2014090YCS\"
Access
Access is restricted
Contact
Gerard Scalia ([email protected] ) or SRA’s IT Department/Steve Comerford ([email protected]) for access
Related Documents