Final Recommendations on the Update Factors for FY 2018 Final Recommendations on the Update Factors for FY 2018 June 14, 2017 Health Services Cost Review Commission 4160 Patterson Avenue Baltimore, Maryland 21215 (410) 764-2605 FAX: (410) 358-6217 This document reflects the Final Recommendation on the Update Factors for FY 2018 as ultimately approved by the Commission on June 14, 2017.

Welcome message from author
This document is posted to help you gain knowledge. Please leave a comment to let me know what you think about it! Share it to your friends and learn new things together.
Transcript
Final Recommendations on the Update Factors for FY 2018
Final Recommendations on the Update Factors for FY 2018
June 14, 2017
Health Services Cost Review Commission 4160 Patterson Avenue
Baltimore, Maryland 21215 (410) 764-2605
FAX: (410) 358-6217
This document reflects the Final Recommendation on the Update Factors for FY 2018 as ultimately approved by the Commission on June 14, 2017.
Final Recommendations on the Update Factors for FY 2018
Table of Contents
List of Abbreviations .................................................................................................................... 1
Introduction and Background ....................................................................................................... 2
Assessment .................................................................................................................................... 3
Overview of Final Update Factors Recommendations ........................................................... 3
Calculation of the Inflation/Trend Adjustment for Global and Non-Global Revenues .......... 3
Summary of Other Policies Impacting RY 2018 Revenues .................................................... 4
Central Components of Revenue Change Linked to Hospital Cost Drivers/Performance
........................................................................................................................................... 6
Central Components of Revenue Offsets with Neutral Impact on Hospital Financial
Statements ......................................................................................................................... 7
Additional Revenue Variables .......................................................................................... 7
PAU Savings Adjustment ................................................................................................. 8
Consideration of All-Payer Model Agreement Requirements ................................................ 9
All-Payer Financial Test ................................................................................................... 9
Medicare Financial Test .................................................................................................... 10
Consideration of National Cost Figures .................................................................................. 11
Medicare’s Proposed National Rate Update for FFY 2018 .............................................. 11
Meeting Medicare Savings Requirements and Total Cost of Care Guardrails ................. 12
Stakeholder Input .................................................................................................................... 16
Recommendations ......................................................................................................................... 17
Appendix i. Differential statistic methodology – carefirst............................................................ 19
Appendix ii. Comment Letters ATTACHED ............................................................................... 28

Final Recommendations on the Update Factors for FY 2018
1
LIST OF ABBREVIATIONS
ACA Affordable Care Act
ACO Accountable Care Organization
CAGR Compound Annual Growth Rate
CMMI Center for Medicare & Medicaid Innovation
CMS Centers for Medicare & Medicaid Services
CY Calendar year
DBM Department of Budget Management
DSH Disproportionate Share Hospital
FFS Fee-for-service
FFY Federal fiscal year
FY Fiscal year
GBR Global budget revenue
HSCRC Health Services Cost Review Commission
MACRA Medicare Access and CHIP Reauthorization Act
MHA The Maryland Hospital Association
PAU Potentially avoidable utilization
RY Rate year
UCC Uncompensated care

Final Recommendations on the Update Factors for FY 2018
2
INTRODUCTION AND BACKGROUND
The Maryland Health Services Cost Review Commission (HSCRC or Commission) has been
setting hospital payment rates for all payers since 1977. As part of this process, the HSCRC
updates hospitals’ rates and approved revenues on July 1 of each year to account for factors such
as inflation, policy related adjustments, other adjustments related to performance, and
settlements from the prior year.
On January 1, 2014, the Centers for Medicare & Medicaid Services (CMS) approved the
implementation of a new All-Payer Model in Maryland. The All-Payer Model aims to promote
better care, better health, and lower costs for all Maryland patients. In contrast to Maryland’s
previous Medicare waiver that focused on controlling increases in Medicare inpatient payments
per case, the All-Payer Model (Model) focuses on controlling increases in total hospital revenue
per capita. The Model established a cumulative annual limit on per capita growth of 3.58 percent
and a Medicare savings target of $330 million over the initial five-year period of the Model.
In order to meet the requirements of the All-Payer Model and assure that the annual update will
not result in a revenue increase beyond the 3.58 percent limit, the update process needs to
account for all sources of hospital revenue that will contribute to the growth of total Maryland
hospital revenues for Maryland residents. In addition, the HSCRC needs to consider the effects
of the update on the Model’s $330 million Medicare savings requirement and the total hospital
revenue that is set at risk for quality-based programs. While rates and global budgets are
approved on a fiscal year basis, the All-Payer Model revenue limits and Medicare savings are
determined on a calendar year basis. Therefore, the HSCRC must account for both calendar year
and fiscal year revenues in establishing the updates for the fiscal year.
It is important to note that the proposed update incorporates both price and volume adjustments
for revenues under global budgets. Thus, the proposed update should not be compared to a rate
update that does not control for volume changes. It is also important to view the revenue updates
in the framework of gross and net revenue. Specially, during the past three years, the expansion
of Medicaid and other Affordable Care Act (ACA) enrollment has reduced uncompensated care
(UCC), resulting in the State reducing several revenue assessments. The rate reductions for UCC
and associated assessment reductions implemented by HSCRC decrease gross revenues, but they
do not decrease net revenues. Therefore, the net revenue increases are higher than gross revenue
increases during these periods.
For rate year (RY) 2017, there were three categories of hospital revenue. One category included
out-of-state revenues for several Johns Hopkins Health System hospitals. However, this revenue
was brought under the global budget during RY 2017. As a result, there are only two remaining
categories of hospital revenue under the All-Payer Model:
1. Hospitals under Global Budget Revenues, which are under the HSCRC’s full rate-setting
authority.
Final Recommendations on the Update Factors for FY 2018
3
2. Hospital revenues for which the HSCRC sets the rates paid by non-governmental payers
and purchasers, but where CMS has not waived Medicare's rate-setting authority to
Maryland and thus Medicare does not pay on the basis of those rates. This includes
psychiatric hospitals and Mount Washington Pediatric Hospital.
The purpose of this report is to present analyses and make recommendations for the update
factors for RY 2018 for global revenues and non-global revenues.
ASSESSMENT
Overview of Final Update Factors Recommendations
Since the initiation of the All Payer Model effective January 1, 2014, Maryland hospitals in the
aggregate have been provided revenue budgets that allow for investments in care coordination
and other infrastructure to implement care improvement and population health initiatives. During
the first two years of the Model, hospitals also experienced increased profitability from regulated
revenues. That improvement in financial condition can be credited, in large measure, to the
successes of hospitals in rapid adoption of global budget models, adoption of interventions that
have moderated or decreased potentially avoidable utilization, implementation of cost controls,
and increases in revenues provided by the HSCRC for care coordination and infrastructure.
Additionally, actual inflation estimates turned out to be lower than the amount provided for
inflation in rate updates for the initial two years of the Model. This higher inflation in rates
allowed for additional investments in care coordination and population health.
In RY 2017, there were large declines in the federal Medicare update factor for the federal fiscal
year (FFY) 2017 under the ACA and limited Maryland hospital savings in calendar year (CY)
2015 relative to the national Medicare growth. As a result, the HSCRC approved an update that
lowered approved revenues for PAU by an additional 0.45 percent. As a result of this reduction,
as well as higher inflation and other factors, hospital margins declined. Medicare hospital
savings have again increased in CY 2016.
As described in detail below, for RY 2018, HSCRC staff is proposing a preliminary update of
2.77 percent per capita for global revenues and a preliminary update of 2.28 percent for non-
global revenues.
Calculation of the Inflation/Trend Adjustment for Global and Non-Global Revenues
The calculation of the inflation/trend adjustment Global Revenues and Non-Global Revenues,
including psychiatric hospitals and Mt. Washington Pediatrics, starts by using the gross blended
statistic of 2.68 percent growth, which was derived from combining 91.2 percent of Global
Insight’s First Quarter 2017 market basket growth of 2.80 percent with 8.80 percent of the
capital growth estimate of 1.40 percent, which calculates to 2.68 percent. The proposed
inflation/trend adjustment would be as follows:

Final Recommendations on the Update Factors for FY 2018
4
Table 1. RY 2018 Proposed Inflation/Trend Adjustment
For psychiatric hospitals and Mt. Washington Pediatric Hospital, staff is proposing to use a
productivity adjustment of 0.40 percent. This results in a proposed update of 2.28 percent.
Additionally, these hospitals get a volume adjustment rather than a population adjustment.
HSCRC staff is currently working on implementing quality measures for future rate years.
Summary of Other Policies Impacting RY 2018 Revenues
The inflation/trend adjustment is just one component of the adjustments to hospital global
budgets for RY 2018. Therefore, in considering the system-wide update for the hospital global
budgets under the All-Payer Model, HSCRC staff sought to achieve balance among the
following conditions: 1) meeting the requirements of the All-Payer Model agreement; 2)
providing hospitals with the necessary resources to keep pace with changes in inflation and
demographic changes; 3) ensuring that hospitals have adequate resources to invest in the care
coordination and population health strategies necessary for long-term success under the All-
Payer Model; and 4) incorporating quality performance programs.
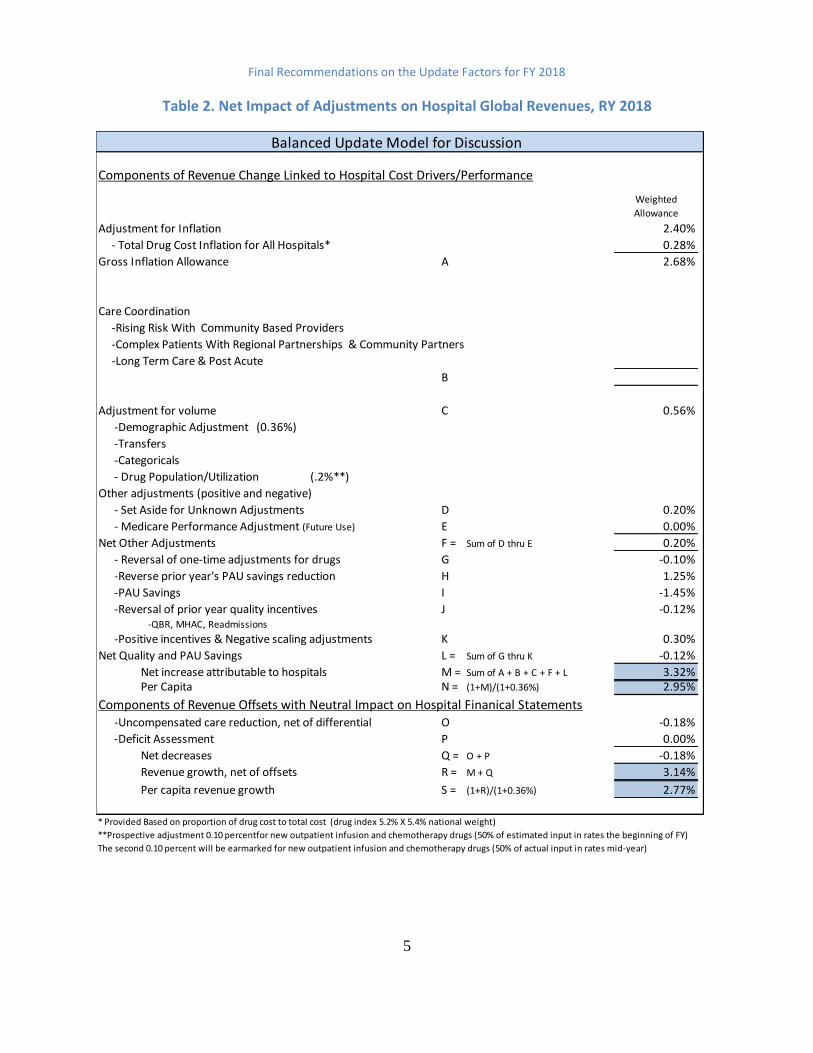
Table 2 summarizes the net impact of the HSCRC staff’s current proposals for inflation, volume,
PAU savings, UCC, and other adjustments on global revenues. The proposed adjustments
provide for an estimated net revenue growth of 3.32 percent and per capita growth of 2.95
percent for RY 2018, before accounting for reductions in UCC and assessments. After
accounting for those factors, the revenue growth is estimated at 3.14 percent with a
corresponding per capita growth of 2.77 percent for RY 2018. Descriptions of each step and the
associated policy considerations are explained in the text following the table:
Global
Revenues
Psych & Mt.
Washington
Proposed Base Update (Gross Inflation) 2.68% 2.68%
Productivity Adjustment -0.40%
Proposed Update 2.68% 2.28%
Final Recommendations on the Update Factors for FY 2018
5
Table 2. Net Impact of Adjustments on Hospital Global Revenues, RY 2018
Components of Revenue Change Linked to Hospital Cost Drivers/Performance
Weighted
Allowance
Adjustment for Inflation 2.40%
- Total Drug Cost Inflation for All Hospitals* 0.28%
Gross Inflation Allowance A 2.68%
Care Coordination
-Rising Risk With Community Based Providers
-Complex Patients With Regional Partnerships & Community Partners
-Long Term Care & Post Acute
B
Adjustment for volume C 0.56%
-Demographic Adjustment (0.36%)
-Transfers
-Categoricals
- Drug Population/Utilization (.2%**)
Other adjustments (positive and negative)
- Set Aside for Unknown Adjustments D 0.20%
- Medicare Performance Adjustment (Future Use) E 0.00%
Net Other Adjustments F = Sum of D thru E 0.20%
- Reversal of one-time adjustments for drugs G -0.10%
-Reverse prior year's PAU savings reduction H 1.25%
-PAU Savings I -1.45%
-Reversal of prior year quality incentives J -0.12% -QBR, MHAC, Readmissions
-Positive incentives & Negative scaling adjustments K 0.30%
Net Quality and PAU Savings L = Sum of G thru K -0.12%
Net increase attributable to hospitals M = Sum of A + B + C + F + L 3.32%Per Capita N = (1+M)/(1+0.36%) 2.95%
Components of Revenue Offsets with Neutral Impact on Hospital Finanical Statements -Uncompensated care reduction, net of differential O -0.18%
-Deficit Assessment P 0.00%
Net decreases Q = O + P -0.18%
Revenue growth, net of offsets R = M + Q 3.14%
Per capita revenue growth S = (1+R)/(1+0.36%) 2.77%
* Provided Based on proportion of drug cost to total cost (drug index 5.2% X 5.4% national weight)
**Prospective adjustment 0.10 percentfor new outpatient infusion and chemotherapy drugs (50% of estimated input in rates the beginning of FY)
The second 0.10 percent will be earmarked for new outpatient infusion and chemotherapy drugs (50% of actual input in rates mid-year)
Balanced Update Model for Discussion
Final Recommendations on the Update Factors for FY 2018
6
For RY 2017, the HSCRC split the approved revenue for the year into two targets, a mid-year
target and a year-end target. Through this process, the HSCRC deferred a portion of the update
from CY 2016 into CY 2017. This deferral was meant to address a particularly low federal
Medicare update for FFY 2017, and also better matched the historic volume patterns incurred by
hospitals, with higher volumes through the winter months of January through March. Because
this revenue split matched historical volumes better, the HSCRC staff plans to continue this split.
The staff will apply 49.73 percent of the Total Approved Revenue to determine the mid-year
target and the remainder of revenue will be applied to the year-end target. Of note, there are a
few hospitals that do not follow this seasonal pattern, particularly Atlantic General Hospital.
Thus, HSCRC staff will adjust the revenue split to accommodate their normal seasonality.
Also, in the first half of RY 2017, hospitals undercharged their global budgets by approximately
1.0 percent. To recover this undercharge, hospitals will need to increase revenues in the second
half of the RY 2017. This will contribute to an increase in the total cost of care for CY 2017.
HSCRC has made CMMI aware of this undercharge, and its implications for CY 2017 data.
Central Components of Revenue Change Linked to Hospital Cost Drivers/Performance
HSCRC staff accounted for a number of factors that are central provisions to the update process
and are linked to hospital costs and performance. These include:
Adjustments for Volume: Staff proposes a 0.36 percent adjustment that is equal to the
Maryland Department of Planning’s estimate of population growth for CY 20171. In the
previous year, staff used an estimate based on five-year population growth projections.
For the last two years (i.e., RYs 2016 and 2017), the actual growth estimate has been
lower than the forecast. Hospital-specific adjustments will vary based on changes in the
demographics of each hospital’s service area. In the past, a portion of the adjustment
was set aside to account for growth in highly specialized services. For RY 2018, the
staff proposes to provide the full value of the 0.36 percent growth for the demographic
adjustment to hospitals.
Rising Cost of New Drugs: The rising cost of drugs, particularly of new physician-
administered drugs in the outpatient setting, continues to be a growing concern among
hospitals, payers, and consumers. Not all hospitals provide these services, and some
hospitals have a much larger proportion of costs devoted to these services. To address
this situation, staff recommends earmarking 0.28 percent of the inflation allowance to
fund increases in the cost of drugs and to provide this allowance to the portion of total
hospital costs that were comprised of drug costs in FY 2016. Staff also proposes to
provide a prospective volume adjustment of 0.10 percent to fund a portion of the rising
cost of new outpatient physician-administered drugs, which will be provided on a
hospital-specific basis. Each hospital with regulated oncology drugs reported drug costs
for outpatient infusion, chemotherapy, and biological drugs that accounted for at least
1 See http://planning.maryland.gov/msdc/.

Final Recommendations on the Update Factors for FY 2018
7
80 percent of drugs billed for RY 2016. Staff will spread the 0.10 percent adjustment
among those hospitals based on their 2016 actual costs that were submitted for RY
2016. In addition, staff will collect similar data for RY 2017, and will provide an
update of an estimated 0.10 percent effective with the mid-year 2018 update. In doing
so, staff will provide a 0.20 percent volume adjustment for drugs, together with a 0.28
percent inflation allowance for drugs. During RY 2017, staff provided a retrospective
and prospective volume adjustment for drugs, each of approximately 0.10 percent. The
one-time adjustment portion will be reversed. The HSCRC staff expects to continue to
refine the policies as it receives additional cost and use information.
Set-Aside for Unforeseen Adjustments: Staff recommends a 0.20 percent set-aside to
fund unforeseen adjustments during the year. This amount was reduced from 0.50
percent in RY 2017 to provide funding for a drug adjustment in RY 2018.
Reversal of the Prior Year’s PAU Savings Reduction and Quality Incentives: The
total RY 2017 PAU savings and quality adjustments are restored to the base for RY
2018, with new adjustments to reflect the PAU savings reduction and quality incentives
for RY 2018.
PAU Savings Reduction and Scaling Adjustments: The RY 2018 PAU savings will
be continued, and an additional 0.20 percent savings is targeted for RY 2018. Staff have
provided preliminary estimates for both positive and negative quality incentive
programs, which have been changed so that they are no longer revenue neutral.
However, staff is still working on finalizing these figures.
Central Components of Revenue Offsets with Neutral Impact on Hospital Financial Statements
In addition to the central provisions that are linked to hospital costs and performance, HSCRC
staff also considered revenue offsets with neutral impact on hospital financial statements. These
include:
UCC Reductions: The proposed UCC reduction for FY 2018 will be -0.18 percent.
The amount in rates was 4.69 percent in RY 2017, and the proposed amount for RY
2018 is 4.51 percent.
Deficit Assessment: The legislature did not reduce the deficit assessment for FY 2018.
Therefore, this line item is set at 0 percent.
Additional Revenue Variables
In addition to these central provisions, there are additional variables that the HSCRC considers,
as mentioned in Table 2. These additional variables include one-time adjustments, as well as
revenue and rate compliance adjustments and price leveling of revenue adjustments to account
for annualization of rate and revenue changes made in the prior year. Notable factors include the
PAU savings adjustment and investments in care coordination, as described in additional detail
below.

Final Recommendations on the Update Factors for FY 2018
8
PAU Savings Adjustment
Maryland is now in its fourth performance year of the All-Payer Model. The Model is based on
the expectation that an All-Payer approach and global or population-based budgets will result in
more rapid changes in population health, care coordination, and other improvements, which in
turn will result in reductions in PAUs. To that end, the Commission approved budgets that did
not offset Medicare’s ACA and productivity adjustments, and provided infrastructure investment
funding to support care coordination and population health activities. For RYs 2015 and 2016,
the HSCRC applied a PAU savings adjustment with an incremental revenue reduction averaging
0.20 percent to allocate and ensure savings for purchasers of care. In RY 2017, there was an
incremental increase in the PAU adjustment of 0.45 percent. For RY 2018, staff is proposing an
increase in the PAU saving adjustment of 0.20 percent, similar to RYs 2015 and 2016.
Investments in Care Coordination and Implementation of Care Interventions
Investments
The HSCRC provided funding for some initial investments in care coordination resources. Staff
believes that several categories of investments for implementation are critical to the success of
the Model. Multiple workgroups have identified the need to focus on high needs patients,
complex patients, and patients with chronic conditions and other factors that place them at risk of
requiring extensive resources. Of particular concern are Medicare patients, who have more
extensive needs, but fewer system supports. Additionally, there are several major opportunities
with post-acute and long-term care that are important to address. There is significant variation in
post-acute care costs, and hospitals need to work with partners to address this variation. There
are also potentially avoidable admissions and readmissions from post-acute and long-term care
facilities. There are documented successes in reducing these avoidable admissions, both in
Maryland and nationally. These improvements require partnerships and coordination among
hospitals and long-term and post-acute care providers. As hospitals continue to implement these
approaches in FY 2017, declines in utilization may free up resources to make additional
investments (if there is not a corresponding increase in non-hospital costs). The HSCRC staff has
completed an amendment to the All-Payer Model to provide data and additional flexibility in
implementing care redesign together with physicians and community-based partners. Also, the
State has proposed a Maryland Comprehensive Primary Care Model (MCPCM) to CMS, which
it hopes to initiate in early 2018. The MCPCM will provide care management resources to
participating primary care practices.
Implementation of the care redesign and population health improvement will require additional
investments. It will be important to reinvest hospital resources and to identify aligned resources
outside of hospitals to make these efforts successful.
Additional resources could be beneficial for organizations that are prepared to implement:
Care management for complex patients, in collaboration with regional partnerships and
community partners
Final Recommendations on the Update Factors for FY 2018
9
Care coordination and chronic care improvement focused on rising risk patients as well
as population health improvement, in collaboration with community partners
Effective approaches to address post-acute and long-term care opportunities
Other care redesign programs that engage physicians and other non-hospital providers
in efforts aligned with the All-Payer Model
Interventions
As part of the FY 2017 update, each hospital in the State agreed to focus on total cost of care for
Medicare, implement increased interventions and care coordination for high needs and rising
needs patients, and to work with physicians relative to Medicare Access & CHIP Reauthorization
Act (MACRA) opportunities. As discussed in the following section entitled Medicare Financial
Test, for CY 2016, the State was successful in limiting the growth in Medicare total cost of care
relative to national growth. Hospitals have been working with CRISP to share information on
care coordination activities for high needs patients, and this information is being reviewed in the
aggregate each month. As mentioned, the State has worked with stakeholders to secure a Care
Redesign Amendment to the All-Payer Model. The clearance process for the Amendment took
longer than anticipated, and the Amendment was just signed with CMS at the end of April 2017.
Hospitals have also been participating in Accountable Care Organizations (ACOs). Additional
effort is still needed to implement increasing levels of interventions for high needs patients and
to engage physicians and other providers in aligned efforts. HSCRC staff is considering the
importance and implications of these efforts on the Model’s ongoing success. Staff is interested
in Commissioners’ and stakeholders’ views on how progress on these efforts should be taken
into account for the upcoming rate year.
Consideration of All-Payer Model Agreement Requirements
As described above, the staff proposal increases the resources available to hospitals to account
for rising inflation, population changes, and other factors, while providing adjustments for
performance under quality programs. Additionally, based on the staff calculations to date, the
proposed update falls within the financial parameters of the All-Payer Model agreement
requirements. However, staff does not yet have the updated cost per beneficiary estimates for CY
2017, and thus these calculations are subject to change. The staff’s considerations in regards to
the All-Payer Model agreement requirements are described in detail below.
All-Payer Financial Test
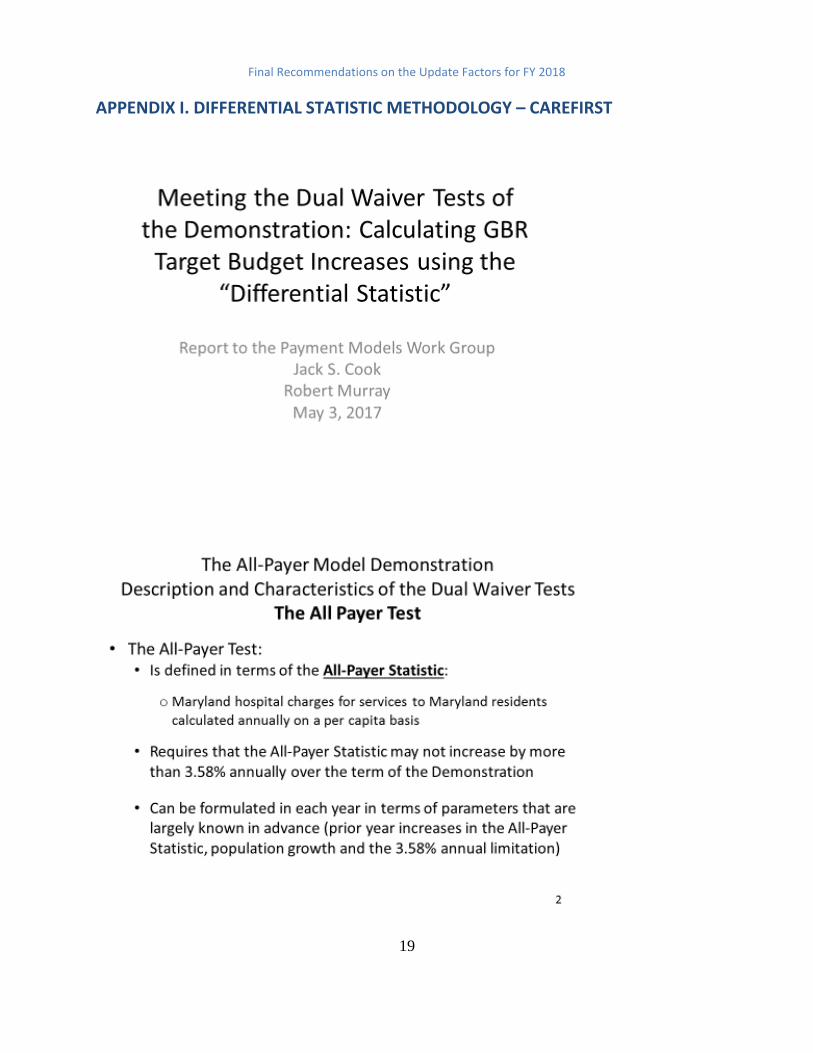
The proposed balanced update keeps Maryland within the constraints of the Model’s all-payer
revenue test. Maryland’s agreement with CMS limits the annual growth rate for all-payer per
capita revenues for Maryland residents at 3.58 percent. Compliance with this test is measured by
comparing the cumulative growth in revenues from the CY 2013 base period to a ceiling
calculated assuming an annual per capita growth of 3.58 percent. To evaluate the impact of the
recommended update factor on the State’s compliance with the all-payer revenue test, staff

Final Recommendations on the Update Factors for FY 2018
10
calculated the maximum cumulative growth that is allowable through the end of CY 2018. As
shown in Table 3, cumulative growth of 19.23 percent is permitted through CY 2018.
Table 3. Calculation of the Cumulative Allowable Growth in All-Payer per Capita Revenue for Maryland Residents
Table 4 below shows the allowed all-payer growth in gross revenues. Staff has removed
adjustments due to reductions in UCC and assessments that do not affect the hospitals’ bottom
lines. Staff projects that the actual cumulative growth, excluding changes in UCC and
assessments, through FY 2018 is 15.47 percent. The actual and proposed revenue growth is well
below the maximum levels.
Table 4. Evaluation of the Proposed Update’s Projected Growth and Compliance with the All-Payer Gross Revenue Test
“Maximum Gross Revenue Growth Allowance” includes the following population estimates: FY16/CY15 = 0.46%;
FY17/CY16 = 0.36%
Note: The figures in the table above are different than the net revenue figures reported at the beginning of this
section of the report. The figure above does not reflect actual UCC or include other adjustments between gross and
net revenues such as denials. They reflect adjustments to gross revenue budgets.
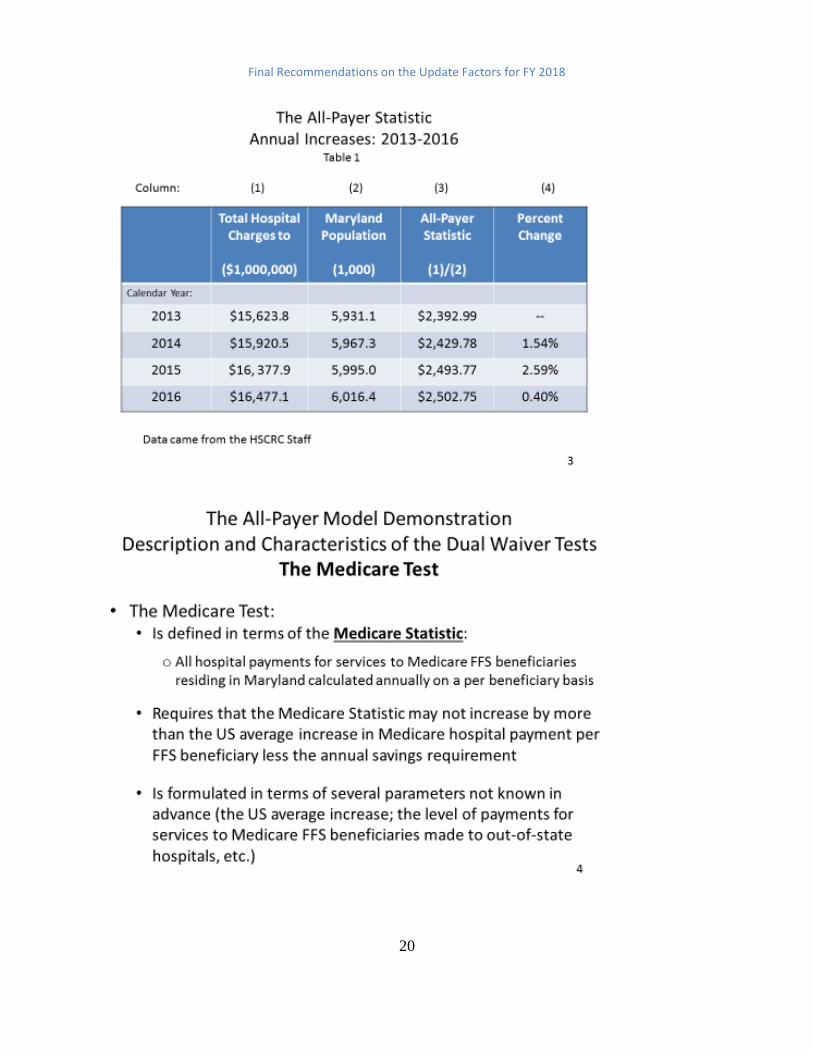
Medicare Financial Test
The proposed balanced update also keeps Maryland within the constraints of the Model’s
Medicare savings test. This second test requires the Model to generate $330 million in Medicare
fee-for-service (FFS) savings in hospital expenditures over five years. The savings for the five-
year period were calculated assuming that Medicare FFS hospital costs per Maryland beneficiary
would grow about 0.50 percent per year slower than the Medicare FFS costs per beneficiary
nationally after the first performance year (CY 2014).
Performance years one and two (CY 2014 and CY 2015) of the Model generated approximately
$251 million in Medicare savings. Performance year three (CY 2016) savings have not yet been
CY 2014 CY 2015 CY 2016 CY 2017 CY 2018 Cumulative Growth
A B C D E F = (1+A)*(1+B)*(1+C)*(1+D)*(1+E)
Calculation of Revenue Cap 3.58% 3.58% 3.58% 3.58% 3.58% 19.23%
A B C D E F = (1+A)*(1+B)*(1+C)*(1+D)*(1+E)
Actual Actual Actual Staff Est. Proposed Cumulative
Jan- June
2014 FY 2015 FY 2016 FY 2017 FY 2018 Through FY 2018
Maximum Gross Revenue Growth Allowance 2.13% 4.21% 4.06% 3.95% 3.95% 19.68%
Revenue Growth for Period 0.90% 2.51% 2.47% 2.23% 3.14% 11.76%
Savings from UCC & Assessment Declines that do
not Adversely Impact Hospital Bottom Line 1.09% 1.40% 0.69% 0.18% 3.40%
Revenue Growth with UCC & Assessment Savings
Removed 0.90% 3.60% 3.87% 2.92% 3.32% 15.47%
Revenue Difference from Growth Limit 4.21%

Final Recommendations on the Update Factors for FY 2018
11
audited, but current staff projections show an estimated savings of $287 million, bringing the
three-year cumulative savings to over $538 million. Under these calculations, the cumulative
savings are ahead of the required savings of $132 million.
However, there continues to be a shift toward greater utilization of non-hospital services in the
state relative to national rates of growth. When calculating savings relative to total cost of care,
the three-year cumulative savings estimate is $364 million, still well above the required savings
level. Maryland’s All-Payer Model Agreement with CMS contains requirements relative to the
total cost of care, which includes non-hospital cost increases. The purpose is to ensure that cost
increases outside of the hospital setting do not undermine the Medicare hospital savings that
result from the Model implementation. If Maryland exceeds the national total cost of care growth
rate by more than 1.00 percent in any year or exceeds the national total cost of care growth rate
in two consecutive years, Maryland is required to provide an explanation of the increase and
potentially provide steps for corrective action.
Staff has estimated that the total cost of care growth is below the national growth for CY 2016.
However, Maryland non-hospital cost growth exceeds the national growth rate for CY 2016.
This difference appears to be driven by increases in Maryland’s non-hospital Part B services,
which include clinic and professional fees. Staff determined that the growth is primarily in
professional fees and is conducting further assessments of the cause of these increases. A
commitment to continue the success of the first three year is critical to building long-term
support for Maryland’s Model. Therefore, staff recommends maintaining the goal used in the
RYs 2015, 2016 and 2017 updates of growing Maryland hospital costs per beneficiary about 0.50
percent slower than the nation for RY 2018. Attainment of this goal will maintain any ongoing
savings from prior periods and help achieve savings in the total cost of care, as well as provide
evidence of the model’s continued success.
Consideration of National Cost Figures
Medicare’s Proposed National Rate Update for FFY 2018
CMS published proposed updates to the federal Medicare inpatient rates for FFY 2018 in the
Federal Register in mid-April 2017.2 These updates are summarized in the table below. These
updates will not be finalized for several months and are subject to change. In the proposed rule,
CMS would increase rates by approximately 2.90 percent in FFY 2018 compared to FFY 2017,
after accounting for inflation, a disproportionate share increase, and other adjustments required
by law. The proposed rule includes an initial market basket update of 2.90 percent for those
hospitals that were meaningful users of electronic health records in FFY 2016 and for those
hospital that submitted data on quality measures, less a productivity cut of 0.40 percent and an
additional market basket cut of 0.75 percent, as mandated by the ACA. This proposed update
2 See https://www.cms.gov/Medicare/Medicare-Fee-for-Service-Payment/AcuteInpatientPPS/FY2018-IPPS-
Proposed-Rule-Home-Page-Items/FY2018-IPPS-Proposed-Rule-
Regulations.html?DLPage=1&DLEntries=10&DLSort=0&DLSortDir=ascending.
Final Recommendations on the Update Factors for FY 2018
12
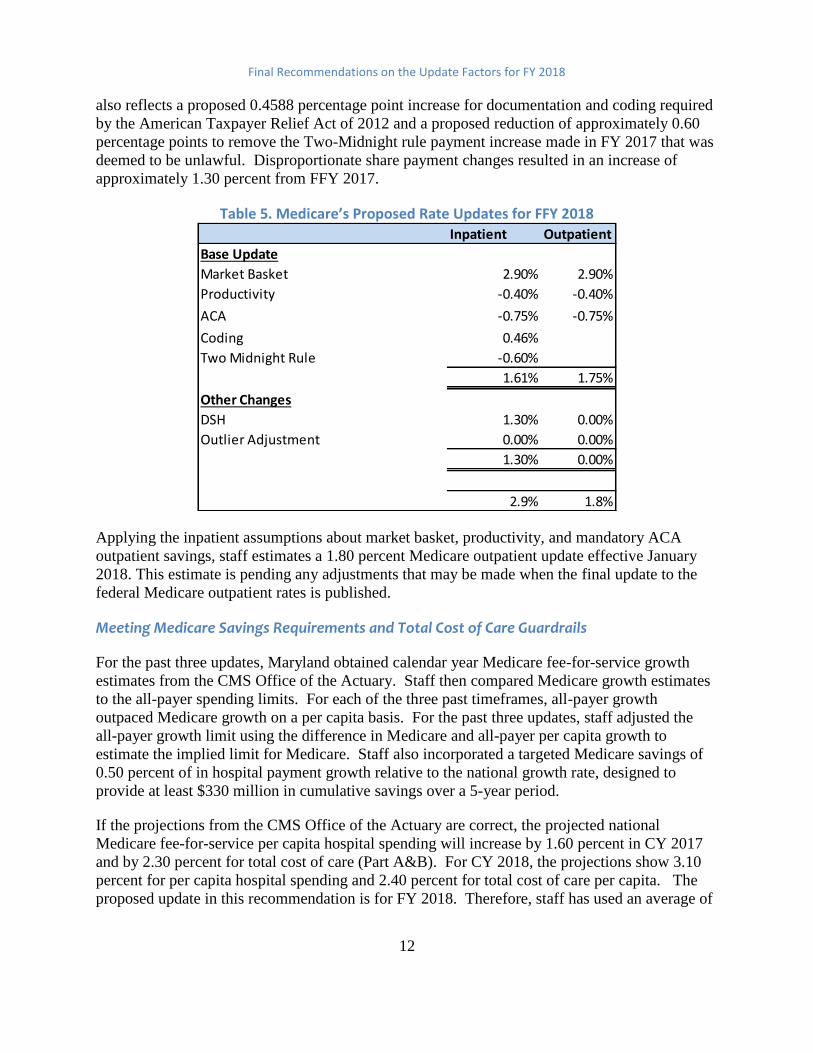
also reflects a proposed 0.4588 percentage point increase for documentation and coding required
by the American Taxpayer Relief Act of 2012 and a proposed reduction of approximately 0.60
percentage points to remove the Two-Midnight rule payment increase made in FY 2017 that was
deemed to be unlawful. Disproportionate share payment changes resulted in an increase of
approximately 1.30 percent from FFY 2017.
Table 5. Medicare’s Proposed Rate Updates for FFY 2018
Applying the inpatient assumptions about market basket, productivity, and mandatory ACA
outpatient savings, staff estimates a 1.80 percent Medicare outpatient update effective January
2018. This estimate is pending any adjustments that may be made when the final update to the
federal Medicare outpatient rates is published.
Meeting Medicare Savings Requirements and Total Cost of Care Guardrails
For the past three updates, Maryland obtained calendar year Medicare fee-for-service growth
estimates from the CMS Office of the Actuary. Staff then compared Medicare growth estimates
to the all-payer spending limits. For each of the three past timeframes, all-payer growth
outpaced Medicare growth on a per capita basis. For the past three updates, staff adjusted the
all-payer growth limit using the difference in Medicare and all-payer per capita growth to
estimate the implied limit for Medicare. Staff also incorporated a targeted Medicare savings of
0.50 percent of in hospital payment growth relative to the national growth rate, designed to
provide at least $330 million in cumulative savings over a 5-year period.
If the projections from the CMS Office of the Actuary are correct, the projected national
Medicare fee-for-service per capita hospital spending will increase by 1.60 percent in CY 2017
and by 2.30 percent for total cost of care (Part A&B). For CY 2018, the projections show 3.10
percent for per capita hospital spending and 2.40 percent for total cost of care per capita. The
proposed update in this recommendation is for FY 2018. Therefore, staff has used an average of
Inpatient Outpatient
Base Update
Market Basket 2.90% 2.90%
Productivity -0.40% -0.40%
ACA -0.75% -0.75%
Coding 0.46%
Two Midnight Rule -0.60%
1.61% 1.75%
Other Changes
DSH 1.30% 0.00%
Outlier Adjustment 0.00% 0.00%
1.30% 0.00%
2.9% 1.8%

Final Recommendations on the Update Factors for FY 2018
13
CY 2017 and CY 2018 projections from the President’s FY 2018 Budget to calculate Medicare
growth on line A in Table 6A and 6B below. In 2016, hospitals focused on Medicare spending
and avoidable utilization, and this proved to be successful in CY 2016. The staff recommends
that the Commission again focus hospitals on this imperative.
For the purposes of evaluating the maximum all-payer spending growth that will allow Maryland
to meet the per capita Medicare FFS target, the Medicare target must be translated to an all-payer
growth limit (Table 6A and 6B). There are several ways to calculate the difference between
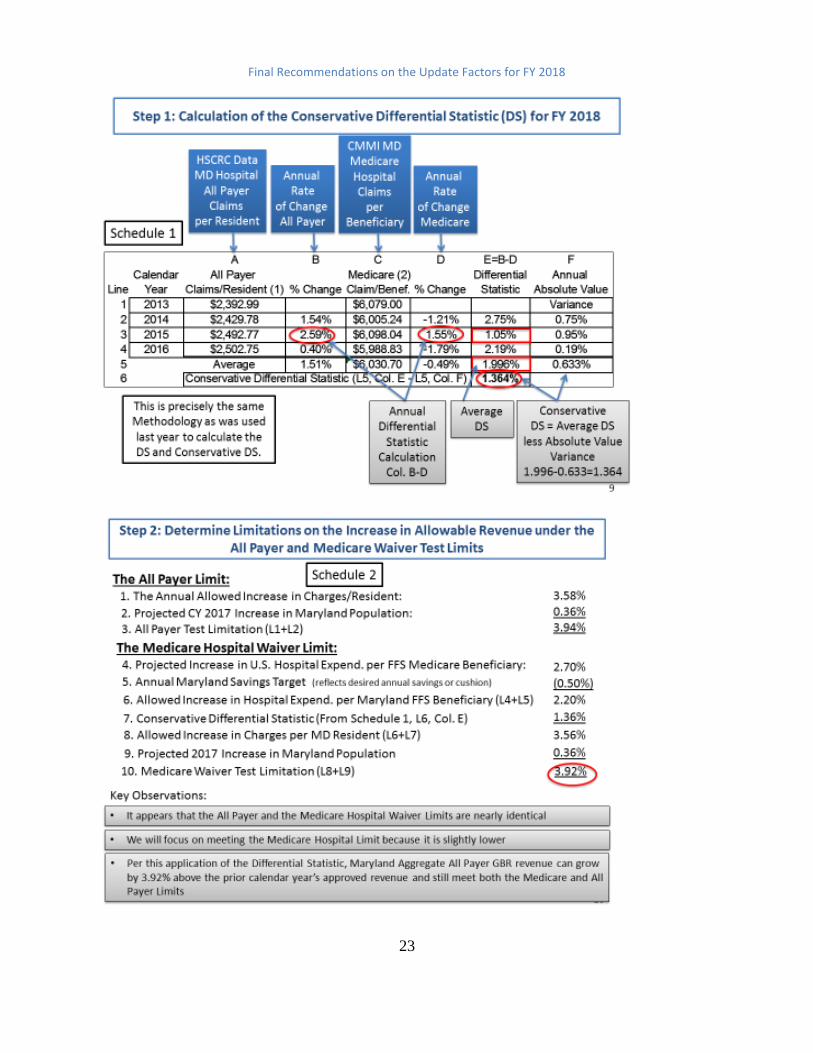
Medicare FFS and all-payer growth rates using recent data trends. A consultant to CareFirst
developed a “difference statistic’ that reflected the historical increase in Medicare per capita
spending in Maryland which was lower than all-payer per capita spending growth. CareFirst has
updated this statistic each year using data provided by HSCRC staff. For the FY 2018 update
CareFirst calculated a conservative difference of 1.36 percent, which used a 3-year average
difference reduced by the average absolute variance.
An alternative approach to calculating the difference statistic is to use the compounded annual
growth rate difference (CAGR) from RY 2013 to RY 2016, which like the conservative
difference statistic controls for volatility. Using CAGR, staff has calculated a difference statistic
of 1.50 percent.
Staff calculated two different scenarios using the difference statistic. Under the first scenario
(Table 6A), the maximum all-payer per capita growth rate that will allow the state to realize a
0.50 percent FY 2018 Medicare savings is 3.61 percent. Table 6A utilizes the difference statistic
developed by CareFirst. The second scenario (Table 6B) shows a maximum all-payer per capita
growth rate of 3.75 percent and utilizes the difference statistic based on CAGR. Both scenarios
are pictured below. The proposed update for FY 2018 produces a growth that is lower than
either of these figures
Table 6A. Scenario 1 Maximum All-Payer Increase that will still produce the Desired FY 2018 Medicare Savings
Maximum Increase that Can Produce Medicare Savings
Medicare
Medicare Growth (CY 2017 1.6%+ CY 2018 3.1%)/2 A 2.35%
Savings Goal for FY 2018 B -0.50%
Maximum growth rate that will achieve savings (A+B) C 1.85%
Conversion to All-Payer
Actual statistic between Medicare and All-Payer D 1.36%
Conversion to All-Payer growth per resident (1+C)*(1+D)-1 E 3.24%
Conversion to total All-Payer revenue growth (1+E)*(1+0.36%)-1 F 3.61%

Final Recommendations on the Update Factors for FY 2018
14
Table 6B. Scenario 2 Maximum All-Payer Increase that will still produce the Desired FY 2018 Medicare Savings
Additionally, staff has analyzed several revenue scenarios and how they impact the Medicare
growth for CY 2017. While HSCRC is approving a rate increase for RY 2018, it is focused on
the impact on CY 2017 as well as CY 2018. During CY 2016, hospitals undercharged the mid-
year GBR limit by approximately $79.7 million, or about 1.00 percent. While the savings
generated by this undercharge and the dis-savings that will generated through the recovery of this
undercharge in CY 2017 will wash out for the hospital savings requirement, this could affect the
total cost of care guardrail. Staff estimates that this could affect the total cost of care growth
year-over-year by more than 0.50 percent. Combined with other fluctuations, this could cause
Maryland to exceed the 1.00 percent total cost of care growth guardrail. HSCRC staff has
requested that CMMI consider this temporary timing difference before noticing a triggering
event. CMMI has accepted accounting for the undercharge in the proper calendar year.
Staff is also evaluating the growth in CY 2017 and its likely impact on guardrails. All scenarios
presented by staff in the following table adjust for the undercharge.
Maximum Increase that Can Produce Medicare Savings
Medicare
Medicare Growth (CY 2017 1.6%+ CY 2018 3.1%)/2 A 2.35%
Savings Goal for FY 2018 B -0.50%
Maximum Growth Rate that will Achieve Savings (A+B) C 1.85%
Conversion to All-Payer
Actual Statistic between Medicare and All-Payer (CAGR) D 1.50%
Conversion to All-Payer Growth per Resident (1+C)*(1+D)-1 E 3.38%
Conversion to Total All-Payer Revenue Growth (1+E)*(1+0.36%)-1 F 3.75%
Final Recommendations on the Update Factors for FY 2018
15
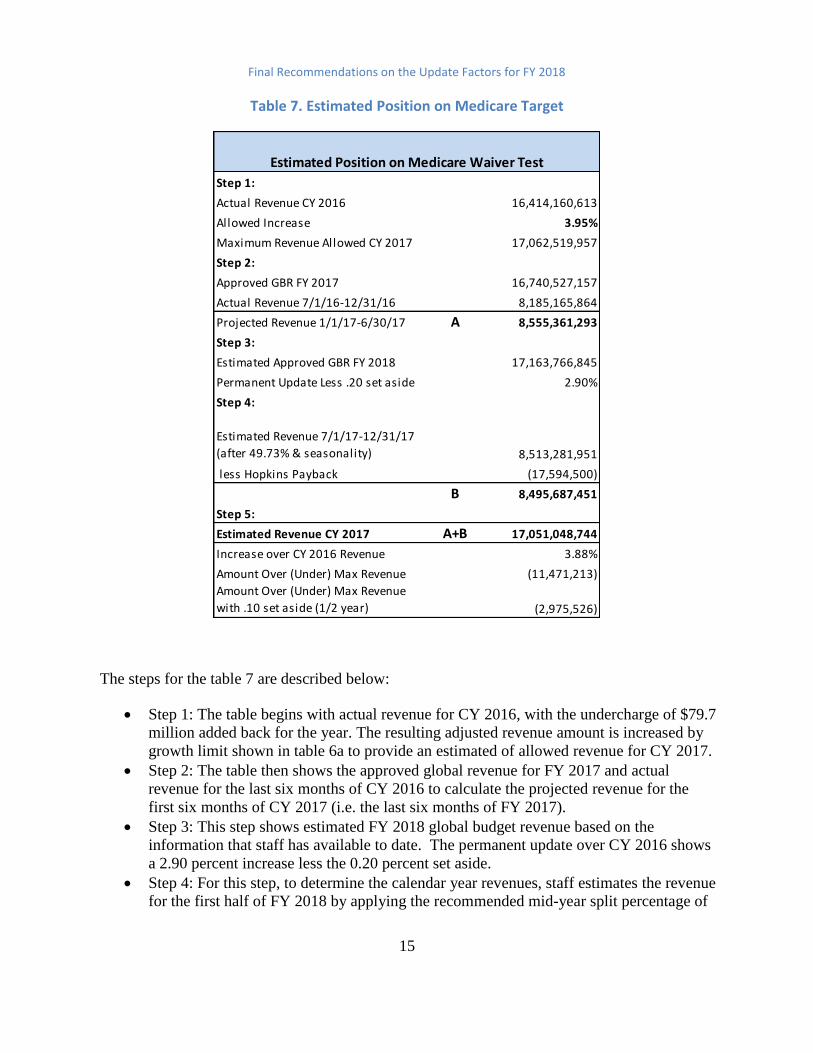
Table 7. Estimated Position on Medicare Target
The steps for the table 7 are described below:
Step 1: The table begins with actual revenue for CY 2016, with the undercharge of $79.7
million added back for the year. The resulting adjusted revenue amount is increased by
growth limit shown in table 6a to provide an estimated of allowed revenue for CY 2017.
Step 2: The table then shows the approved global revenue for FY 2017 and actual
revenue for the last six months of CY 2016 to calculate the projected revenue for the
first six months of CY 2017 (i.e. the last six months of FY 2017).
Step 3: This step shows estimated FY 2018 global budget revenue based on the
information that staff has available to date. The permanent update over CY 2016 shows
a 2.90 percent increase less the 0.20 percent set aside.
Step 4: For this step, to determine the calendar year revenues, staff estimates the revenue
for the first half of FY 2018 by applying the recommended mid-year split percentage of
Step 1:
Actual Revenue CY 2016 16,414,160,613
Allowed Increase 3.95%
Maximum Revenue Allowed CY 2017 17,062,519,957
Step 2:
Approved GBR FY 2017 16,740,527,157
Actual Revenue 7/1/16-12/31/16 8,185,165,864
Projected Revenue 1/1/17-6/30/17 A 8,555,361,293
Step 3:
Estimated Approved GBR FY 2018 17,163,766,845
Permanent Update Less .20 set aside 2.90%
Step 4:
Estimated Revenue 7/1/17-12/31/17
(after 49.73% & seasonality) 8,513,281,951
less Hopkins Payback (17,594,500)
B 8,495,687,451
Step 5:
Estimated Revenue CY 2017 A+B 17,051,048,744
Increase over CY 2016 Revenue 3.88%
Amount Over (Under) Max Revenue (11,471,213)
Amount Over (Under) Max Revenue
with .10 set aside (1/2 year) (2,975,526)
Estimated Position on Medicare Waiver Test
Final Recommendations on the Update Factors for FY 2018
16
49.73 percent to the estimated approved revenue for FY 2018 and hospital specific
seasonality adjustments. A reduction in revenues resulting from the temporary rate
adjustment for Johns Hopkins Hospital is subtracted from revenues.
Step 5: This step shows the resulting estimated revenue for CY 2017 and then calculates
the increase over CY 2016 Revenue. The final portion of step 5 shows the amount of
revenue under the maximum revenue (shown in step 1) with and without the use of the
0.20 percent set-aside.
With the hospital growth rate for Medicare estimated at 1.60 percent per capita for CY 2017 and
a difference statistic of 1.36 percent to 1.50 percent, the revenue growth for the calendar year
estimated at 3.88 percent will exceed the estimated Medicare growth for the calendar year.
Hospitals will need to continue efforts to decrease avoidable utilization and reach a higher
difference statistic as they did in CY 2016. Staff also continues to be concerned about the total
cost of care growth. While staff does not propose to further limit the increases based on these
calendar year tests, staff does recommend careful monitoring and ongoing updates of revenue
estimates. Staff also notes the Commission’s ability to address unfavorable performance during
the rate year.
Stakeholder Input
HSCRC staff worked with the Payment Models Workgroup to review and provide input on the
proposed FY 2018 updates. Staff has received and reviewed comments from CareFirst, the
Maryland Hospital Association, Medicaid and the Department of Budget Management, and
MedChi.
CareFirst expressed concern for the initial draft update and believes that, if the entire revenue
growth were to be implemented it would put the State at risk for meeting each of financial tests
that are under the All-Payer demonstration. Staff has laid out its careful analysis of the update
above, and recommends close monitoring of the situation, in light of higher expected growth in
CY 2017.
The Maryland Hospital Association (MHA) and its member hospitals support the staff
recommendations for the update to global revenue and non-global revenues for FY 2018. MHA
stated that Maryland’s hospitals are committed to reducing avoidable hospital utilization and
monitoring Medicare total cost of care in order to achieve the goals of the demonstration.
Medicaid and the Department of Budget Management (DBM) expressed concern for the staff’s
recommendation based on the impact the proposed revenue growth would have on rates as well
as the effect the advanced payment to Johns Hopkins Hospital will have on the Medicaid Budget.
In addition, Medicaid and DBM believe that the set-aside for unknown adjustments is unjustified
and not needed at this time. Staff will exclude the set-aside from the MCO update calculation it
makes for the first half of the year, and will work with Medicaid to determine if it is warranted
for the mid-year update. Staff recommends that Medicaid and HSCRC work together with
hospitals to identify opportunities for reduced utilization that could improve the budgetary
outcomes for Medicaid on an ongoing basis.
Final Recommendations on the Update Factors for FY 2018
17
MedChi, The Maryland State Medical Society, submitted a letter in support of the staff
recommendation. MedChi further supports an increase beyond the recommendation for hospitals
that participate in care redesign and gainsharing with physicians as an incentive, to help
accelerate uptake on the two new care redesign programs and initiatives. The Secretary of Health
is organizing an input group to accelerate discussions regarding initiatives that could be
implemented January 1 or before. Under the new Care Redesign Amendment, the State may
update and expand programs, many with a 30-day approval cycle.
See Appendix II for all written comments on the staff recommendation for the FY 2018 update
factors.
RECOMMENDATIONS
Based on the currently available data and the staff’s analyses to date, the HSCRC staff is
providing the following final recommendations for the FY 2018 update factors.
For Global Revenues:
a) Provide an overall increase of 3.14 percent for revenue (net of UCC offset) and 2.77
percent per capita for hospitals under Global Budgets, as shown in Table 2. In addition,
staff is proposing to split the approved revenue into two targets, a mid-year target and a
year-end target. Staff will apply 49.73 percent of the Total Approved Revenue to
determine the mid-year target and the remainder of revenue will be applied to the year-
end target. Staff is aware that there are a few hospitals that do not follow this pattern of
seasonality and will adjust the split accordingly.
b) Allocate 0.28 percent of the inflation allowance based on each hospital’s proportion of
drug cost to total cost. In addition to an adjustment for drug prices, staff is also
proposing a 0.20 percent adjustment for drug volume/utilization, 0.10 percent
prospectively allocated to hospitals using the FY 2016 outpatient oncology drug
utilization and standard costs filed by hospitals, and the other 0.10 percent based on
actual growth for FY 2017 over FY 2016. These adjustments will help fund the rising
cost of new outpatient, physician-administered drugs.
c) The Commission should continue to closely monitor performance targets for Medicare,
including Medicare’s growth in Total Cost of Care and Hospital Cost of Care per
beneficiary during the performance year. As always, the Commission has the authority to
adjust rates as it deems necessary.
d) Hospitals should renew the GBR amendment that was put into place for FY 2017 that
requires a focus on reducing Potentially Avoidable Utilization (PAU) and a continued
focus on total cost of care growth, ensuring that hospital savings are not swamped by
non-hospital cost growth. Continuing a focus on PAU will be important to meeting

Final Recommendations on the Update Factors for FY 2018
18
performance needs in the current year. Hospitals should continue to focus on care
improvements, working with physician partners in Care Redesign Programs and with
ACOs.
e) Continue to consider on an ongoing basis whether to differentiate hospital updates based
on progress relative to high needs patients and other aligned efforts with physicians and
other providers.
Non-Global Revenues including psychiatric hospitals and Mt. Washington Pediatric Hospital:
a) Provide an overall update of 2.28 percent by using a productivity adjustment of 0.40
percent from the inflation factor of 2.68 percent.
b) Continue to focus on implementation of quality measures and value based programs for
psychiatric facilities.
Final Recommendations on the Update Factors for FY 2018
19
APPENDIX I. DIFFERENTIAL STATISTIC METHODOLOGY – CAREFIRST
Final Recommendations on the Update Factors for FY 2018
20

Final Recommendations on the Update Factors for FY 2018
21

Final Recommendations on the Update Factors for FY 2018
22
Final Recommendations on the Update Factors for FY 2018
23

Final Recommendations on the Update Factors for FY 2018
24

Final Recommendations on the Update Factors for FY 2018
25

Final Recommendations on the Update Factors for FY 2018
26

Final Recommendations on the Update Factors for FY 2018
27
Final Recommendations on the Update Factors for FY 2018
28
APPENDIX II. COMMENT LETTERS ATTACHED
CareFirst – May 9, 2017
Maryland Hospital Association – June 2, 2017
Medicaid Program and Department of Budget and Management – June 2, 2017
MedChi – June 5, 2017
CareFirst – June 8, 2017

CareFirst BlueCross BlueShield is an independent licensee of the Blue Cross and Blue Shield Association. ® Registered trademark of the Blue Cross and Blue Shield Association. ®´ Registered trademark of CareFirst of Maryland, Inc.
Chet Burrell President and Chief Executive Officer
CareFirst BlueCross BlueShield 1501 S. Clinton Street, 17th Floor Baltimore, MD 21224-5744 Tel: 410-605-2558 Fax: 410-781-7606 [email protected]
May 9, 2017 Nelson J. Sabatini, Chairman Donna Kinzer, Executive Director Health Services Cost Review Commission 4160 Patterson Avenue Baltimore, Maryland 21215 Dear Mr. Sabatini and Ms. Kinzer: The purpose of this letter is to provide CareFirst’s comments on the HSCRC staff’s “Draft Recommendations on the Update Factors for FY 2018.” In short, we urge the Commission to reject the Staff’s recommendation of 3.39% and to develop a new recommendation for the Commission’s consideration. The reasons for this are outlined below. CareFirst believes that the recommended Update Factor—if implemented—would jeopardize the State’s prospects of meeting all three of the financial tests that are required under the Maryland Model Demonstration. Specifically, based on a forecasting methodology (the “Differential Statistic Methodology” or “DSM”) that was accepted by the HSCRC staff, we estimate that if the 3.39% Update Factor is implemented, the following would occur:
1) Maryland’s growth in all payer costs would (according to the DSM) rise to 5.4%, exceeding the 3.94% target. This percent is based on the fact that hospital revenues will dramatically increase in CY 2017—as detailed under the HSCRC’s own projections. The 5.4% increase in CY2017 over CY2016 is the result of a lower CY2016 charge base (denominator) due to the $70M undercharge and the higher CY2017 period (numerator) driven, in part, by hospitals’ upcharge to recover the previous year’s undercharge.
2) Medicare savings would decrease by $93 million relative to savings that would occur had
Maryland met the goal of growing at U.S. Medicare hospital per beneficiary growth less 0.5% in CY 2017. CareFirst projects that under the recommended Update Factor, Maryland Medicare Hospital Expenditures per Medicare Beneficiary would increase 3.75 percent, significantly greater than what CMS currently projects for the rest of the US. We estimate the US target to be 2.2 percent (after taking out 0.5 percent as is required). We ask how this estimate can be reconciled with the 3.75 percent presented for the State’s Update Factor and given its focus on meeting the targets under the Demonstration.
3) Maryland would likely exceed the Medicare Total Cost of Care (TCOC) Test if non-hospital
Medicare FFS expenditures continue to grow at a rate that exceeds the national U.S. non-hospital Medicare FFS increases per beneficiary by approximately 1.5%, as has been the average for the past two years. Under this assumption, we estimate that Medicare TCOC in Maryland would increase by 3.41—a level of 1.31 percentage points greater than the State’s target.
CareFirst BlueCross BlueShield is an independent licensee of the Blue Cross and Blue Shield Association. ® Registered trademark of the Blue Cross and Blue Shield Association. ®´ Registered trademark of CareFirst of Maryland, Inc.
Thus, it appears as though the staff recommendation has not taken into account the impact of the actual increases in hospital costs that will occur in CY 2017 on these three Demonstration targets, after a period of hospital undercharges in the second half of CY 2016.
At such a critical time when the State is negotiating the future of the Demonstration with the federal government, we believe it is imperative that the HSCRC consider an Update Factor that is more conservative. Considering that hospital revenue is projected to be 4.3% higher in the first half of 2017 than in 2016—due to deferrals and undercharges in the last half of 2016—a very low Update Factor is implied. We would also point out that Maryland hospitals have consistently generated total operating margins that have hovered around 3.0% and operating margins from rate-regulated activities that have exceeded 8.0% during the term of the Demonstration. We also note that hospitals received $239 million in FY 2015 and FY 2016 for Care Management Infrastructure funding, with $200 million added to rates for every subsequent FY. To date, neither we nor anyone else to our knowledge has been able to determine how these funds were spent to improve care coordination or outcomes. It concerns us that recent HSCRC reporting seems to indicate that these funds were largely spent to subsidize Part B physician activities. For these reasons we strongly urge the Commission to direct staff to develop a proposed Update Factor that better protects the State against failing to comply with the thresholds provided under the Demonstration and to make this proposal in time for the Commission to consider at its June meeting. Sincerely,
Chet Burrell President & CEO

June 2, 2017
Nelson J. Sabatini
Chairman, Health Services Cost Review Commission
4160 Patterson Avenue
Baltimore, MD 21215
Dear Chairman Sabatini:
On behalf of the Maryland Hospital Association’s 64 member hospitals and health systems, I am
writing to support the staff recommendation for the update to global budgets and non-global budget
revenues for fiscal year 2018. As the draft recommendation notes, significant progress has been
made in the past three years toward achieving the goals of the All-Payer Model demonstration, with
Medicare hospital savings far exceeding the requirements through calendar year 2016, and the
quality improvement goals of reductions in readmissions and hospital-acquired conditions well on
track. These accomplishments were accelerated by the commission and its staff, including the
infrastructure investments, recognition of high-cost drug growth, and other funding provided in the
model’s first three years. Together, we must continue to ensure future progress toward the Triple
Aim goals of the demonstration, and the funding recommended in the 2018 update will help make
that possible.
At the same time, Maryland’s hospitals also recognize the need to continue to reduce avoidable
hospital utilization. Maryland’s hospitals – individually and collectively – are committed to
transforming the delivery of care and to the challenge of further reducing avoidable hospital
utilization. Hospitals are keenly aware that the funding provided for next year demands that the
Medicare total cost of care be monitored closely, to ensure that growth in non-hospital spending is
more than offset by reductions in avoidable hospital utilization. We hope that the addition of the
two Care Redesign Programs for next year will also help accomplish the demonstration’s goals.
We look forward to discussing this update at the commission’s meeting on June 14, and to continue
to work together on behalf of the patients and communities we serve.
Sincerely,
Michael B. Robbins, Senior Vice President
cc: Herbert S. Wong, Ph.D., Vice Chairman Jack C. Keane
Joseph Antos, Ph.D. Donna Kinzer, Executive Director
Victoria W. Bayless Caitlin Grim, Health Services Rate Analyst
George H. Bone, M.D. Deon Joyce, Health Services Rate Analyst
John M. Colmers

201 W. Preston Street – Baltimore, Maryland 21201
Toll Free 1-877-4MD-DHMH – TTY/Maryland Relay Service 1-800-735-2258
Web Site: www.dhmh.maryland.gov
STATE OF MARYLAND
DHMH Maryland Department of Health and Mental Hygiene Larry Hogan, Governor - Boyd K. Rutherford, Lt. Governor - Dennis R. Schrader, Secretary
June 2, 2017
Nelson J. Sabatini
Chair
The Health Services Cost Review Commission
4160 Patterson Avenue
Baltimore, MD 21215
Dear Chairman Sabatini:
The Medicaid program and the Department of Budget and Management (DBM) have jointly reviewed
the draft recommendation of the Health Services Cost Review Commission’s (HSCRC) Staff for the
fiscal year (FY) 2018 Update Factor. We are writing to express our concern regarding the Staff’s draft
recommendation of 3.34 percent revenue growth (net of offsets; 2.97 percent revenue growth per
capita). For the reasons described below, we feel that the proposed Update Factor is not financially-
sustainable for the Medicaid program and for the state budget collectively.
Impact on the Medicaid Budget
First, and though not unusual, the proposed increase in rates was not entirely planned for in the FY
2018 Medicaid budget. When developing the FY 2018 budget, the Department of Health and Mental
Hygiene and DBM did include an assumption for a rate increase of 1.87 percent; however, the Staff
recommendation of 3.34 percent far exceeds this amount. We also assumed a utilization trend for
inpatient services that has not materialized. This places even greater pressure on the Medicaid budget,
which is already projecting a deficit in FY 2018. We would further note that the State is projecting a
General Fund deficit in the range of $700 million for FY 2019, and since Medicaid is the State’s second
largest expenditure, cost controls are needed.
Effect of Temporary Rate Adjustments
The HSCRC approved a temporary advanced payment in rates of $75 million to Johns Hopkins during
the first six months of calendar year (CY) 2018. The $75 million will be repaid via rate reductions over
the course of three years. Unscheduled advanced hospital payments of this magnitude have a significant
impact on the Medicaid budget and are contrary to the goals of requiring the hospitals to operate under
the global budget revenue (GBR) system.
Placeholder for Unknown Adjustments
Lastly, the FY 2018 Update Factor includes a placeholder for unknown adjustments. The amount
allocated—0.4 percent—is larger than other line items of significance, including drug cost inflation
(0.28 percent) and the demographic adjustment (0.36 percent). Unless additional detail is provided to
justify its inclusion, the Medicaid program contends that this item is unnecessary.
Both departments understand the value of the global budget revenue (GBR) approach to hospital
financing, which constitutes a powerful tool for transforming health care from volume to value-based
reimbursement and investing in improvements to support that transformation. We look forward to
working with the HSCRC and other stakeholders as the Update Factor is finalized for FY 2018. If you
have any questions, please contact Tricia Roddy, Director for the Medicaid Office of Planning at
[email protected] or Jennifer McIlvaine, Supervising Budget Analyst at DBM at
Sincerely,
Shannon M. McMahon Marc Nicole
Deputy Secretary, Health Care Financing Deputy Secretary
Department of Health and Mental Hygiene Department of Budget and Management

1
June 5, 2017 The Honorable Nelson Sabatini, Chair Health Services Cost Review Commission 4160 Patterson Avenue Baltimore, MD 21215 Sent via Email to [email protected] Re: FY2018 Hospital Update Factor Dear Chairman Sabatini: MedChi, The Maryland State Medical Society, on behalf of Maryland physicians, is writing to support the HSCRC Staff recommendation update of 3.12% in total revenues for FY2018. An update of 3.12% would cover any inflationary expenses of hospitals and ensure that employed physicians continue to be appropriately compensated for their services. Furthermore, MedChi suggests that an increase beyond the recommended 3.12% be made available to hospitals that participate in care redesign / gainsharing programs with physicians. Starting this year, physicians must report data to the Centers for Medicare and Medicaid Services (CMS), which will reward or penalize physicians financially, based on the submitted data. Physicians can receive a separate reward for participating in an advanced alternative payment model (APM.) However, Maryland physicians are at a disadvantage because some payment models cannot be implemented in Maryland due to Maryland’s unique All-Payer Model. CMS has corrected for this problem by allowing the creation of two new care redesign programs that are APM programs. Unfortunately, the uptake on the two new programs to date has been slow. We would recommend allowing additional funds to participating hospitals as an incentive on top of the update. While MedChi supports the two care redesign programs (Internal Cost Savings and Pay-for-Outcomes) that are already developed, MedChi believes that an additional increase for participating hospitals would help further (1) align hospitals with non-employed physicians and community providers; and (2) assist hospitals in meeting the objectives and global budget set in the All-Payer Model. Please let me know if I can provide any more insight on this matter. Thank you. Sincerely,
Gene M. Ransom, III Chief Executive Officer

Related Documents