The CATCH trial CAT heter Infections in CH ildren: a randomised controlled trial and economic evaluation comparing impregnated and standard central venous catheters in children K Harron 1 , Q Mok 2 , K Dwan 3 , CH Ridyard 4 , T Moitt 3 , M Millar 5 , P Ramnarayan 2 , SM Tibby 6 , DA Hughes 4 , C Gamble 3 and RE Gilbert 1 * *Corresponding author: [email protected] 1 Institute of Child Health, University College London, UK 2 Great Ormond Street Hospital, London, UK 3 Medicines for Children Research Network Clinical Trials Unit, University of Liverpool, UK 4 Centre for Health Economics & Medicines Evaluation, Bangor University, UK 5 Barts Health NHS Trust, London, UK 6 Evelina Children’s Hospital, London, UK Competing interests: M Millar was a member of the NIHR HTA Diagnostic Technologies and Screening Panel for the duration of the CATCH study. No other competing interests declared Final Draft Total word count 21144 1 1 2 3 4 5 6 7 8 9 10 11 12 13 14 15 16 17 18 19 20 21 22 23 24 25 26 27 28 29 30 31 32 33 34

Welcome message from author
This document is posted to help you gain knowledge. Please leave a comment to let me know what you think about it! Share it to your friends and learn new things together.
Transcript

The CATCH trialCAT heter Infections in CH ildren: a
randomised controlled trial and economic evaluation comparing impregnated and
standard central venous catheters in children
K Harron1, Q Mok2, K Dwan3, CH Ridyard4, T Moitt3, M Millar5, P Ramnarayan2, SM Tibby6, DA Hughes4, C Gamble3 and RE Gilbert1**Corresponding author: [email protected] 1 Institute of Child Health, University College London, UK2 Great Ormond Street Hospital, London, UK3 Medicines for Children Research Network Clinical Trials Unit, University of Liverpool, UK4 Centre for Health Economics & Medicines Evaluation, Bangor University, UK5 Barts Health NHS Trust, London, UK6 Evelina Children’s Hospital, London, UK
Competing interests: M Millar was a member of the NIHR HTA Diagnostic Technologies and Screening Panel for the duration of the CATCH study. No other competing interests declared
Final Draft
Total word count 21144
August 2015
1
1
2
3
4
5
6
78
9
10
11121314151617181920212223242526272829303132
333435363738
3940

2
41

CONTENTS
LIST OF FIGURES
LIST OF ABBREVIATIONS
ABSTRACT
SCIENTIFIC SUMMARY
Background
Objectives
1) RANDOMISED CONTROLLED TRIAL: CLINICAL EFFECTIVENESS
Methods
Results
2) COST-EFFECTIVENESS
Methods
Results
3) GENERALISABILITY AND COST-IMPACT
Methods
Results
Conclusions
PLAIN ENGLISH SUMMARY
CHAPTER 1 INTRODUCTION
Use in practice
Rationale
Risks and benefits
Overview of aims and research questions
CHAPTER 2 CLINICAL EFFECTIVENESS: METHODS
Trial design
Setting and participants
Interventions
Randomisation and consent
Blinding
Comparisons and outcomes
Sample size
Statistical methods
3
42
43
44
45
46
47
48
49
50
51
52
53
54
55
56
57
58
59
60
61
62
63
64
65
66
67
68
69
70
71
72
73
74

Study oversight and role of funders
CHAPTER 3 CLINICAL EFFECTIVENESS: RESULTS
Study population
Comparison of interventions
CHAPTER 4 COST-EFFECTIVENESS ANALYSIS
Introduction
Methods
Results
CHAPTER 5 GENERALISABILITY STUDY
Introduction
Methods
Results
CHAPTER 6 DISCUSSION
Introduction
Clinical effectiveness
Cost-effectiveness
Generalisability and cost-impact
Other conclusions
Implications for practice
Recommendations for future research
REFERENCES
4
75
76
77
78
79
80
81
82
83
84
85
86
87
88
89
90
91
92
93
94
95
96
97

LIST OF FIGURES
Figure 1: CONSORT flow diagram for all trial participants.....................................................................24Figure 2 Number of children included in the primary outcome, the rate of BSI and catheter related BSI
according to time since randomisation.........................................................................................25Figure 3: Kaplan-Meier curve for time to first BSI by CVC allocation.....................................................26Figure 4: Flow diagram of the methods employed for the economic evaluation..................................56Figure 5: Ranking of total, 6-month costs by intervention group, indicating patients who experienced a
bloodstream infection..................................................................................................................57Figure 6: Cost-effectiveness acceptability curve based on a 6 month time horizon presenting the probability of
antibiotic and standard CVCs being cost-effective for given values of ceiling ratio expressed as cost per bloodstream infection (BSI) averted.............................................................................................58
Figure 7: Relation between total costs (cumulative) and time since randomisation, according to intervention group............................................................................................................................................58
Figure 8: Relation between the ICER for antibiotic CVC versus standard CVC, and time since randomisation. Positive ICERs are cost-incurring, negative values represent incremental savings per BSI averted59
Figure 9: Risk-adjusted rates in bloodstream infection for children expected to have central venous catheters based on linked PICANet-Labbase2 data for 16 PICUs in England; symbols=observed rates; lines=smoothed adjusted rates (log-scale)...................................................................................68
Figure 10: Probability distribution for the value of resources made available by averting BSI using antibiotic CVC in all PICUs in England during 2012, 90% of the distribution represented costs greater than the additional cost of purchasing antibiotic CVCs................................................................................................69
Figure 11: Cost-impact: Number of BSI averted and value of resources made available using antibiotic in place of standard CVCs for a range of baseline rates, assuming each BSI is associated with a mean cost of £10,975.........................................................................................................................................70
5
9899
100101102103104105106107108109110111112113114115116117118119120121122123
124

LIST OF TABLES
Table 1: Baseline characteristics and clinical condition before randomisation (n=number of participants by randomised CVC)..........................................................................................................................28
Table 2: Details of the intervention and characteristics at 48 hours post randomisation (n=number of participants with CVC inserted)....................................................................................................29
Table 3: Samples taken in primary outcome time window (n=number of participants by randomised CVC) 30Table 4: Primary outcome (absolute measures) and type of organism isolated, according to CVC allocation
(values are n by randomised CVC (%) unless otherwise stated))..................................................31Table 5: Risk difference for first BSI and hazard ratio for time to first BSI according to CVC allocation (hazard
ratios p<0.05 are in bold)..............................................................................................................31Table 6: Regression results for primary outcome..................................................................................32Table 7: Competing risk analysis for primary outcome of time to first BSI............................................32Table 8: Secondary outcomes (absolute measures) by CVC allocation (n is number of participants by
randomised CVC who experienced the outcome)........................................................................33Table 9: Risk difference and/or hazard ratios for secondary outcomes according to CVC allocation (hazard ratios
p<0.05 are in bold)........................................................................................................................34Table 10: Safety analyses of CVC-related adverse events and mortality (n is number by type of received or if
not inserted, type attempted to be inserted)...............................................................................35Table 11: PCR results for bacteria in blood samples taken during the primary outcome time window by CVC
type (N is number by randomised CVC)........................................................................................36Table 12: Unit cost for intensive care and high dependency care, based on HRGs from the National Schedule
tariff (2012-13).............................................................................................................................47Table 13: Hospital ward bed-day rates as provided by hospital finance departments and adjusted for inflation
(£ sterling, 2013)...........................................................................................................................48Table 14: Patients' lengths of stay and count of dominant HRGs relating to inpatient stays, from randomisation
to 6 months (including readmissions), according to place and intensity of care and by intervention group......................................................................................................................................................49
Table 15: Disaggregated and total costs (£) by intervention group from randomisation to end of the six-month timeframe.....................................................................................................................................50
Table 16: Adjusted, total (6-month) costs: results of Ordinary Least Squares regression of total costs based on significant baseline variables........................................................................................................52
Table 17: Value of healthcare resource associated with managing a BSI: results of Ordinary Least Squares regression for estimating the cost of BSI, with total costs as the dependent variable and univariately significant baseline explanatory variables....................................................................................53
Table 18: Incremental Analysis of unadjusted costs (6 month timeframe and index hospitalisation)...54Table 19: Patients' length of stay for hospitalisation episode from randomisation by intervention group 54Table 20: Parameter estimates for cost-impact analysis and sensitivity analysis..................................66Table 21: Cost impacted analysis of managing BSIs occurring with standard versus antibiotic CVCs with best and
worst case scenarios* and hypothetical scenarios for a typical PICU with 350 admissions per year67
6
125
126127128129130131132133134135136137138139140141142143144145146147148149150151152153154155156157158159160161162163164
165
166

LIST OF ABBREVIATIONS AE Adverse Event IDSMC Independent Data and Safety
and Monitoring Committee
AI Adverse Incident Ln Natural logarithm
AIC Adverse Incident Centre MHRA Medicines and Healthcare products Regulatory Agency
BSI Blood Stream Infection MRSA Methicillin-resistant Staphylococcus aureus
Bundled HRG
HRG referring to patient pathway of care such as ward stay
NHS National Health Service
CATS Children’s Acute Transport Service
NRES National Research Ethics Service
CEAC Cost Effectiveness Acceptability Curve
ONS Office for National Statistics
CFU Colony Forming Units PAS Patient Admission System
CI Chief Investigator PCR Polymerase Chain Reaction
CPA Clinical Pathology Accreditations PI Principal Investigator
CRF Case Report Form PICANet Paediatric Intensive Care Audit Network
CTRC Clinical Trials Research Centre PICU Paediatric Intensive Care Unit
CTU Clinical Trials Unit QALY Quality Adjusted Life Year
CVC Central Venous Catheter RCT Randomised Controlled Trial
GP General Practitioner REC Research Ethics Committee
HDU High Dependency Unit RN Research Nurse
HES Hospital Episodes Statistics RR Relative Risk
HRGs Healthcare Resource Groups SAE Serious Adverse Event
HSCIC Health and Social Care Information Centre
SOP Standard Operating Procedure
HTA Health Technology Assessment TMG Trial Management Group
MCRNCTU
Medicines for Children Research Network Clinical Trials Unit
TSC Trial Steering Committee
ICER Incremental Cost Effectiveness Ratio
unbundled HRGs
High cost or specialist service HRG in addition to patient pathway of care
ICU Intensive Care Unit
7
167

ABSTRACT Background:
Impregnated central venous catheters (CVCs) are recommended for adults to reduce
bloodstream infection (BSI) but not for children due to a lack of evidence for their
effectiveness.
Objective:
To determine the effectiveness of impregnated versus standard CVCs for reducing BSI in
children admitted to intensive care.
Design:
1) Multicentre randomised controlled trial
2) Cost-effectiveness analysis from an NHS perspective
3) Generalisability analysis and cost-impact analysis
Setting:
14 English paediatric intensive care units (PICUs) in England.
Participants:
Children <16 years, weighing >=3kg admitted to PICU and expected to require a CVC for >=3
days.
Interventions:
Heparin-bonded, antibiotic-impregnated (rifampicin and minocycline) and standard
polyurethane CVCs, allocated randomly (1:1:1). The intervention was blinded to all but the
inserting clinician.
Main outcome measure:
Time to first BSI sampled between 48 hours after randomisation and 48 hours after CVC
removal.
8
168
169
170
171
172
173
174
175
176
177
178
179
180
181
182
183
184
185
186
187
188
189
190
191

Data:
Trial case report forms; hospital administrative data for 6 months pre- and post-
randomisation; national linked PICU audit and laboratory data.
Results:
Clinical effectiveness:
BSI occurred in 3.59% (18/502) children randomised to standard, 1.44% (7/486) to antibiotic
and 3.42% (17/497) to heparin CVCs. Primary analyses comparing impregnated (antibiotic
and heparin CVCs) with standard CVCs showed no effect (hazard ratio 0.71; 95% CI 0.37,
1.34). Secondary analyses showed antibiotic CVCs were superior to standard (HR 0.43; 0.20,
0.96) but heparin CVCs were not (HR 1.04; 0.53-2.03). Time to thrombosis, mortality by 30
days, and minocycline or rifampicin resistance did not differ by CVC.
Cost-effectiveness:
Heparin CVCs were not clinically effective and therefore not cost-effective. The incremental
cost of antibiotic CVCs over a 6-month time horizon was £1,160 (-£4,743, £6,962) compared
with standard CVCs, with an incremental cost-effectiveness ratio of £54,057 per BSI avoided.
There was considerable uncertainty in costs: antibiotic CVCs had a probability of 0.35 of
being dominant. Based on index hospital stay costs only, antibiotic CVCs were associated
with a saving of £97,543 per BSI averted. The estimated value of healthcare resources
associated with each BSI was £10,975 (£-2,801, £24,751).
Generalisability and cost-impact:
The baseline risk of BSI in 2012 for PICUs in England was 4.58 (95% CI 4.42, 4.74) per 1000
bed-days. An estimated 232 BSI could have been averted in 2012 using antibiotic CVCs. The
additional cost of purchasing antibiotic CVCs for all children who require them (£36 per CVC)
would be less than the value of resources associated with managing BSI in PICUs with
standard BSI rates >1.2 per 1000 CVC-days.
Conclusions:
The primary outcome, time to BSI, did not differ between impregnated and standard CVCs.
However, antibiotic-impregnated CVCs significantly reduced the risk of BSI compared with
standard and heparin CVCs. Adoption of antibiotic-impregnated CVCs could be beneficial
even for PICUs with low BSI rates, although uncertainty remains as to whether they
represent value for money to the NHS.
9
192
193
194
195
196
197
198
199
200
201
202
203
204
205
206
207
208
209
210
211
212
213
214
215
216
217
218
219
220
221
222

Future work:
Implementation strategies to promote adoption of impregnated CVCs in PICU should be
developed and could be monitored through linkage of electronic-healthcare data and clinical
data on CVC use.
Study registration:
ClinicalTrials.gov:NCT01029717
Funding:
National Institute for Health Research Health Technology Assessment (NIHR HTA)
programme (project number 08/13/47).
Abstract word count: 507
Key words:
randomised controlled trial, bloodstream, infection, central venous catheter, paediatric
intensive care, antibiotic, heparin, impregnated, CVC
10
223
224
225
226
227
228
229
230
231
232
233
234
235
236

SCIENTIFIC SUMMARY
Background
Bloodstream infection (BSI) is an important cause of adverse clinical outcome and cost to the
National Health Service (NHS) in the UK. Paediatric intensive care units (PICUs) have one of
the highest reported rates of hospital-acquired BSI of any clinical specialty.
Nine systematic reviews, two cost-effectiveness analyses, and at least 48 randomised
controlled trials (RCTS; 11,586 patients) demonstrate substantial benefits of impregnated
CVCs for reducing catheter-related BSI (CR-BSI) in adults. The best evidence to-date shows
that antibiotic-impregnated or heparin-bonded CVCs are most effective, with similar
reductions in risk of CR-BSI (70-80%).1 However, there is a lack of child-specific evidence for
impregnated CVCs and they are not recommended for children in UK or US guidance. We
compared both types of impregnated CVC (antibiotic and heparin) with standard CVCs to
determine their effectiveness in children. Secondary analyses were conducted to investigate
the effectiveness of each type of impregnation.
Objectives
1) To determine the clinical effectiveness of impregnated compared with standard
CVCs for reducing BSI in children admitted for intensive care
2) To determine the cost-effectiveness of impregnated CVCs from an NHS perspective
3) To inform purchasing by assessing the generalisability and the cost-impact of
adopting impregnated CVCs for all children who need them
11
237
238
239
240
241
242
243
244
245
246
247
248
249
250
251
252
253
254
255
256
257
258
259
260
261
262

1) RANDOMISED CONTROLLED TRIAL: CLINICAL EFFECTIVENESS
Methods
We conducted a three-arm RCT to compare the effect of heparin-bonded, antibiotic-
impregnated and standard polyurethane CVCs on BSI in children requiring intensive care.
Design, study population and intervention
Children admitted to 14 PICUs in England between December 2010 and November 2012
were randomised to heparin-bonded, antibiotic or standard CVCs manufactured by Cook
Medical Incorporated (IN 47404 USA).
Children <16 years were eligible if they were admitted or being prepared for admission to a
participating PICU and were expected to require a CVC for 3 or more days. For children
admitted to PICU following elective surgery, we sought prospective parental consent during
pre-operative assessment. For children who required a CVC as an emergency, we sought
parental consent after randomisation and stabilisation (deferred consent) to avoid delaying
treatment.
Randomisation and masking
Children were randomised at bedside or in theatre immediately prior to CVC insertion.
Randomisation sequences were computer generated in a 1:1:1 ratio, stratified by method of
consent, site and envelope storage location within the site.
CVC allocation was not blinded to the clinician responsible for inserting the CVC (due to
different colour strips for impregnated CVCs) but since CVCs looked identical whilst in situ,
allocation was concealed from patients, their parents and PICU personnel responsible for
their care.
Comparisons and end points
The primary analysis for the trial compared antibiotic or heparin CVCs with standard CVCs.
Secondary analyses comprised three-way comparisons of standard, antibiotic and heparin
CVCs.
The primary outcome was time to the first BSI based on blood cultures taken between 48
hours after randomisation and 48 hours after CVC removal (or prior to death). All blood
culture samples were clinically indicated, defined by recorded evidence of infection (one or
12
263
264
265
266
267
268
269
270
271
272
273
274
275
276
277
278
279
280
281
282
283
284
285
286
287
288
289
290
291
292

more of: temperature instability, change in inotrope requirements, haemodynamic
instability, or poor perfusion) or removal of the CVC due to suspected infection. Any positive
blood culture was accepted for a non-skin organism, but for skin organisms, two or more
positive cultures within 48 hours of each other were required.
Secondary BSI-related outcomes:
(1) CR-BSI: the same organisms cultured from blood and CVC tip between 48 hours after
randomisation and 48 hours after CVC removal; or differential positivity of cultures from
multiple CVC lumens on two or more occasions; or BSI and exit site infection or BSI and CVC
removed for infection.
(2) Rate of BSI per 1000 CVC-days: number of BSI between randomisation and CVC removal.
(3) Time to a composite measure of BSI comprising the primary outcome or a negative blood
culture combined with a positive 16S PCR result for bacterial DNA, removal of the CVC
because of suspected infection, or a start of antibiotics or change in type of antibiotics on
the same or next day.
We also compared time to CVC removal, CVC thrombosis, PICU discharge, hospital discharge,
and mortality within 30 days. Safety analyses compared CVC-related adverse events,
mortality, and antibiotic resistance to minocycline (>0.5 µg/ml) or rifampicin (>1.0 µg/ml).
Sample size
1200 children were required to achieve 80% power to detect a relative risk of 0.5 at a 5%
level of significance, based on an estimated BSI rate of 10% and allowing for 5% loss to
follow-up.
Statistical analysis
Outcome data were analysed according to the intention to treat principle. Safety analyses
included the subset of children for whom CVC insertion was attempted, grouped by CVC
actually received, or if insertion was not successful, the type used in the attempt.
The statistical analysis plan was developed prior to analysis and is available in Appendix D.
Time-to-event outcomes were analysed using Kaplan-Meier curves and the log-rank test. Cox
regression was used to adjust the primary analysis of time to BSI for the use of prospective
or deferred consent and suspected infection at baseline. Poisson regression was used to
analyse the rate of BSI. All analyses were conducted using SAS software.
13
293
294
295
296
297
298
299
300
301
302
303
304
305
306
307
308
309
310
311
312
313
314
315
316
317
318
319
320
321
322

Results
Study population
1859 children were randomised, of whom 501 children were randomised prospectively.
1358 were randomised as an emergency and 984 of these subsequently provided deferred
consent for follow-up.
Baseline characteristics
58% of children were aged <12 months at admission; 33% aged <3 months. One third of
children had surgery prior to admission to PICU and half had cardiovascular problems as
their primary diagnosis at admission. CVC insertion took place in theatre for 437/493 (89%)
in the prospective consent (elective) group, but in only 34/917 (4%) of the deferred consent
(emergency) group.
Endpoints
Primary outcome
BSI was recorded for 42 children: standard 18/502 (3.59%); antibiotic 7/486 (1.44%); heparin
17/497 (3.42%). There was no significant difference in the primary outcome of time to first
BSI comparing any impregnated CVC with standard (HR 0.71; 95% CI 0.37, 1.34, p=0.29). BSI
risk was reduced for antibiotic compared with standard CVCs (HR 0.43; 95% CI 0.20, 0.96,
p=0.04) and for antibiotic compared with heparin CVCs (HR 0.42; 95% CI 0.19, 0.93, p=0.03)
but not for heparin compared with standard (HR 1.04; 95% CI 0.53, 2.03, p=0.90). The risk
difference in BSI comparing any impregnated CVC versus standard CVCs was-1.14 (95% CI -
3.04, 0.75); heparin versus standard -0.17 (95% CI -2.45, 2.12); antibiotic versus standard -
2.15 (95% CI -4.09, -0.20) and antibiotic versus heparin -1.98 (95% CI -3.90, -0.06).
Secondary outcomes
For CR-BSI, there was no significant difference between any impregnated and standard CVCs
(p=0.13), but risk of CR-BSI was significantly lower for antibiotic versus standard CVC
(p=0.03). There was no significant difference between antibiotic and heparin CVCs (p=0.09)
or between heparin and standard CVCs (p=0.68). The BSI rate per 1000 CVC-days was lowest
in the antibiotic group. The composite measure of BSI or culture negative infection did not
differ by CVC. No other secondary outcomes were associated with type of CVC.
14
323
324
325
326
327
328
329
330
331
332
333
334
335
336
337
338
339
340
341
342
343
344
345
346
347
348
349
350
351
352

Safety
No CVC-related adverse events (31 events) or mortality (148 events) were attributed to type
of CVC. Only 12/42 children with the primary outcome BSI had minocycline and rifampicin
resistance reported using etest strips; 8/12 were resistant, in each case to both antibiotics
(3/5 standard; 2/2 antibiotic; 3/5 heparin).
15
353
354
355
356
357
358
359
2) COST-EFFECTIVENESS
We determined the cost-effectiveness of type of CVC per BSI averted using individual level data on hospital use captured on study participants.
Methods
Resource use and costs
We assumed that inpatient hospital costs would capture the main cost-drivers and the
greatest proportion of direct medical costs. The time horizon aimed to include costs
associated with managing BSI and was defined as 6 months post-randomisation (or death).
Resource use was evaluated using:
(i) Trial case report forms (CRFs) recording admission and transfer/discharge dates
for PICUs, high dependency units (HDUs) and paediatric wards within
participating hospitals.
(ii) Hospital Episode Statistics (HES) containing health resource groups (HRGs) for
admissions to NHS hospitals in England.
(iii) PICANet, containing length of stay and HRGs for HDU and PICU admissions.
(iv) Hospital Patient Administration Systems (PAS) of participating hospitals,
capturing length of stay and HRGs in PICUs and wards.
The primary cost analysis was based on CRF and PAS, with 6-month costs taken from HES,
supplemented with HDU and intensive care unit (ICU) data from PICANet. Total individual
patient costs were calculated from the sum of their bundled (ward) HRGs coded from the
National Tariff and their unbundled (ICU/HDU) codes taken from the National Schedule.
Incremental analysis
The cost-effectiveness of each type of CVC was evaluated by: i) ranking type of CVC
according to decreasing effectiveness; ii) eliminating ineffective or dominated interventions
(those which are less effective, but more costly than others). The incremental cost-
effectiveness ratio (ICER) for remaining CVCs was calculated as the difference in adjusted
total costs divided by the difference in BSI.
A cost-effectiveness acceptability curve (CEAC) was generated, using bootstrapping to
account for the joint uncertainty in costs and outcomes.
16
360
361362
363
364
365
366
367
368
369
370
371
372
373
374
375
376
377
378
379
380
381
382
383
384
385
386
387
388
389

Value of healthcare resources associated with BSI
The value of healthcare resources associated with BSI was estimated using generalised linear
regression to model total post-randomisation costs, adjusting for significant pre-specified
baseline variables.
All analyses were performed using STATA Version 10.
Results
The average post-randomisation stay in PICU was 10.5 days (95% CI 9.2, 11.9) for standard
CVCs, 10.8 days (95% CI 9.3, 12.5) for antibiotic and 9.9 days (95% CI 8.6, 11.4) for heparin.
There were no significant differences in length of stay by CVC, either in PICU (p=0.61), HDU
(p=0.73), or ward (p=0.54).
Mean 6-month unadjusted costs per patient were £44,503 (95% CI £40,554, £48,776) for
standard CVCs, £45,663 (95% CI £41,600, £49,994) for antibiotic and £42,065 (95% CI
£38,220, £46,246) for heparin, and were not significantly different by CVC type (p=0.46). Six-
month incremental costs were positive (£1,160; 95% CI -£4,743, £6,962) for antibiotic and
negative (-£2,439; 95% CI, -£8,164, £3,359) for heparin compared with standard CVCs.
As heparin CVCs were shown not to be clinically effective when compared to standard CVCs,
the incremental cost-effectiveness ratio was limited to antibiotic compared with standard
CVCs. The incremental cost-effectiveness ratio for the 6-month timeframe was £54,057 per
BSI averted with antibiotic versus standard CVCs, with a probability of 0.35 for antibiotic
CVCs being cost saving or dominant.
Costs were very sensitive to time horizon of analysis. Limiting the analysis to costs associated
with the index stay only, resulted in antibiotic CVCs dominating standard CVCs with a saving
of £97,543 per BSI averted. The break-even point for the costs of antibiotic and standard
CVCs was 122 days post randomisation.
The value of healthcare resources associated with managing each BSI, estimated from the
regression analysis, was £10,975 (95% CI -£-2801, £24,751).
17
390
391
392
393
394
395
396
397
398
399
400
401
402
403
404
405
406
407
408
409
410
411
412
413
414
415
416
417
418
419

3) GENERALISABILITY AND COST-IMPACT
The generalisability and cost-impact analysis aimed to inform adoption of antibiotic CVCs for
all children who need them during admission to PICUs in England.
Methods
Generalisability analysis
We determined the generalisability of the CATCH findings to the baseline risk of BSI in
children with a CVC across PICUs in England. Rates of BSI in all children requiring CVCs in
PICU were estimated from a data linkage study using detailed information from PICANet and
national laboratory surveillance data coordinated by Public Health England. Rates of BSI per
1000 bed-days were modelled using multi-level Poisson regression, adjusting for significant
patient risk-factors (p<0.05).
Cost-impact analysis
The baseline risk was defined as the number of BSI per 1000 bed-days in children using
standard CVCs in English PICUs during 2012. We estimated the BSI rate using antibiotic CVCs
by applying the rate-ratio from the trial to the baseline BSI rate, assuming that irrespective
of baseline risk, the relative effect of impregnated CVCs would be the same in all children.
The number of BSI averted using antibiotic CVCs was estimated by applying the respective
BSI rates to the total number of bed-days in 2012. We estimated the number of admissions
requiring CVCs from responses to a PICU survey on the percentage of emergency and
elective admissions receiving CVCs in 2012.
We determined the budget- and cost-impacts of adopting antibiotic-impregnated CVCs by
synthesising the following evidence: i) the estimated risk of BSI using standard CVCs (derived
from the data linkage study); ii) the number of BSI potentially averted by using antibiotic-
impregnated CVCs (based on the relative treatment effect in the trial); iii) the additional £36
associated with purchasing each impregnated CVC, for all children expected to require one
(numbers of CVCs based on PICU survey data); and iv) the value of the healthcare resources
associated with each averted BSI (from the trial economic analysis).
Results
The additional costs of purchasing antibiotic CVCs for all children in English PICUs in 2012
corresponded to an estimated budget impact of £317,916 (8831 CVCs). Based on 2012 BSI
rates, management of BSI in PICUs costs £2.5 million annually (95% uncertainty interval: -
18
420
421
422
423
424
425
426
427
428
429
430
431
432
433
434
435
436
437
438
439
440
441
442
443
444
445
446
447
448
449
450

£66,544 to £5,557,451). The BSI rate using standard CVCs was 4.58 (95% CI 4.42, 4.74) per
1000 estimated CVC-days in 2012. Applying the rate-ratio gave an estimated 232 BSI averted
using antibiotic CVCs. The additional costs of antibiotic CVCs would be less than the value of
resources associated with managing BSI in PICUs with standard BSI rates >1.2 per 1000 CVC-
days.
ConclusionsImplications for practice
The primary outcome, time to BSI, did not differ between impregnated and standard CVCs.
Secondary analyses showed that antibiotic CVCs reduced the risk of BSI compared with
standard or heparin CVCs. Therefore, use of impregnated CVCs for children admitted to
PICUs could result in clinically important reductions in BSI rates. The benefits of antibiotic-
impregnated CVCs apply even for PICUs with low BSI rates although uncertainty remains as
to whether they are cost-effective for the NHS.
Recommendations for research
Implementation strategies to promote adoption of antibiotic-impregnated CVCs
should be developed and could be monitored through continued linkage of infection
surveillance and electronic healthcare data. Such monitoring could allow feedback to
PICUs and could be enhanced by routine capture of CVC insertion and removal
dates.
Further trials comparing antibiotic-impregnated or heparin-bonded CVCs with
standard CVCs for children or adults in intensive care are not recommended.
The NHS should work with industry to evaluate different types of impregnation for
specific patient groups (e.g. neonates or patients requiring long-term CVCs).
Use of linked administrative data should be considered for future trials of
interventions where the event rate is likely to change substantially over the lifetime
of the trial, and to monitor implementation of effective interventions.
19
451
452
453
454
455
456
457
458
459
460
461
462
463
464
465
466
467
468
469
470
471
472
473
474
475
476
477
478

PLAIN ENGLISH SUMMARY
Children who are admitted to hospital for intensive care often need to have medicines given
directly into their veins, through a small plastic tube called a central venous catheter (CVC).
CVCs avoid the need for repeated injections, but their disadvantage is an increased risk of
bloodstream infection (BSI), which can result in prolonged treatment and time in hospital.
In adults, CVCs coated with medicine to kill bacteria (antibiotics) or prevent clots (heparin)
help reduce the risk of BSI. However, we do not know if these impregnated CVCs work the
same way in the much narrower CVCs used for children. The only way to find out which type
of CVC (standard non-coated, antibiotic, or heparin) works best was to carry out a
randomised controlled trial.
Children aged <16 years who needed a CVC for intensive care treatment participated within
14 hospitals in England. Consent was provided for all participants in the trial. Each child had
an equal chance of receiving one of the three CVC types.
BSI occurred in 4% of children with standard CVCs and 2% of those with impregnated CVCs.
Rates of BSI were lowest in the antibiotic CVC group (1%) but these children had slightly
higher healthcare costs for the 6-months after trial participation. Although doubt remains as
to whether antibiotic CVCs would results in cost savings for the NHS in England, our results
suggest that using antibiotic CVCs could help reduce BSI rates for children in intensive care.
20
479480
481
482
483
484
485
486
487
488
489
490
491
492
493
494
495
496
497

CHAPTER 1 INTRODUCTION
Use in practice
Central venous catheters (CVCs) are widely used for patients of all ages who need intensive
or high dependency care to provide venous access for resuscitation, drug delivery,
intravenous feeding, monitoring, and blood sampling. CVCs are associated with an increased
risk of bloodstream infection (BSI), which is hypothesised to be due to organisms tracking
along the CVC from the skin or from the external parts of the CVC to colonise the CVC tubing
and tip.2-6
Risk-factors for BSI include catheter dwell time, the frequency of ‘breaching’ the line for
medication or sampling, multiple compared with single lumen CVCs, and infusion of lipid
solution as part of parenteral nutrition.7-11 Risk of BSI is reduced by strict adherence to
aseptic procedures during CVC insertion and whenever the CVC is breached.12-14 To help
ensure staff follow aseptic procedures, audited check lists (called CVC bundles) have been
introduced in several countries.15-20
In this report, we focus on children who need a CVC as part of their intensive care treatment.
PICUs have one of the highest reported rates of hospital-acquired BSI of any clinical
specialty,21-24 and BSI is an important cause of adverse clinical outcome and healthcare costs
in critically ill children.22, 25-27 We estimate that approximately 60% of the 16,000 children
admitted to 23 PICUs each year in England require insertion of a CVC as part of their acute
care.28 We do not include CVCs used for very preterm babies in neonatal intensive care or
long-term CVCs, which are widely used to administer medication or parenteral nutrition for
children with conditions such as cancer, cystic fibrosis, renal failure, or short gut syndrome.
Rationale
CVC impregnation with anti-infective substances has been used for over 25 years.1 Recent
systematic review evidence from 48 randomised controlled trials (RCTs) and cost-
effectiveness analyses including 11,586 patients demonstrated substantial benefits of
impregnated compared with standard CVCs for catheter-related BSI (CR-BSI). 1, 3, 6, 29, 30 One of
the most recent systematic reviews included a meta-analysis of direct and indirect
comparisons of different types of impregnated and standard CVCs.1 Heparin-bonded or
21
498499
500
501
502
503
504
505
506
507
508
509
510
511
512
513
514
515
516
517
518
519
520
521
522
523
524
525
526
527

antibiotic-impregnated CVCs were found to be the most effective options, being associated
with similar reductions (70% to 80%) in the risk of CVC related BSI. Heparin-bonding acts by
reducing thrombus formation and bacterial adherence to thrombus, but the bonding agent,
benzalkonium chloride, also has anti-infective properties. Antibiotic-impregnated CVCs act
by preventing biofilm formation and thereby prevent bacterial colonisation.
Despite the large number of randomised controlled trials and the substantial reductions
seen in the risk of BSI in adults, impregnated CVCs have not been recommended for children
in US or UK guidelines and their use in UK practice has been limited.4, 16, 31, 32 A recent survey
showed that impregnated CVCs had been adopted for some or all children by less than half
of British PICUs surveyed.32 Lack of implementation in PICUs relates to i) gaps in the evidence
relating to children; ii) concerns about the quality of previous trials; and iii) uncertainty
about the generalisability of RCT findings to settings where improved infection control
strategies have been associated with steep declines in BSI rates.33, 34
In children, there is a lack of evidence on the most effective type of CVC and on the expected
effect size. According to the network meta-analysis by Wang et al, heparin-bonded and
antibiotic-impregnated CVCs are the most effective options, with similar effects compared
with standard CVCs.1 However, there is a lack of evidence on which type of CVCs would be
most effective as there have been no adequately powered, direct ‘head to head’
comparisons of these options.1 In the UK, the additional costs of heparin-bonded or
antibiotic-impregnated CVCs are similar, so the decision on which type to adopt depends on
their relative benefits and adverse effects. Only one of the eight RCTs comparing antibiotic-
impregnated with standard CVCs (n=2073 patients) included children and was terminated
early due to a lower than expected event rate.35-42 As CVCs for children are much narrower
than adult CVCs and the risk of thrombus formation, bacterial adhesion and infection is
much higher, it is hypothesised that the relative effect of antibiotic-impregnated versus
standard CVCs may differ in children and adults. Evidence is stronger for benefits of heparin-
bonded CVCs, as two of the three RCTs comparing heparin-bonded with standard CVCs (n=
472) included children.43-45
Several systematic reviews raise concerns that the poor quality of previous studies means
that the benefits of impregnated CVCs may have been overestimated.6, 29, 46, 47 Firstly, few
trials reported good concealment of treatment allocation or blinding of clinicians to the
intervention and many failed to account for losses or withdrawals, all factors that could lead
to overestimation of the effect.6, 29 Secondly, all previous trials relied on catheter-related BSI
22
528
529
530
531
532
533
534
535
536
537
538
539
540
541
542
543
544
545
546
547
548
549
550
551
552
553
554
555
556
557
558
559
560

(CR-BSI) as the primary outcome measure, which requires positive cultures from the blood
and catheter tip. This measure is highly susceptible to bias, as the tip can be easily
contaminated during removal, and residual antibiotic in the catheter tip may inhibit culture
in the laboratory. Aside from the potential biases in measuring CR-BSI, impregnated CVCs
may impact on all BSI after CVC insertion, not just on CR-BSI, and on the risks of mortality,
complications and increased length of stay associated with BSI.
Few trials have determined the effect of impregnated CVCs on all BSI in PICU, in the context
of ongoing reductions in BSI rates associated with the introduction of CVC care bundles.12, 14,
15, 33, 48 Neither of the two trials of heparin-bonded CVCs in children, and few of the trials of
antibiotic-impregnated CVCs in adults have been conducted in the context of these
strenuous efforts to reduce BSI. It is not known whether the relatively large reductions in
relative risk and absolute risk seen in trials predating CVC care bundles would be sustained in
PICUs where rates of infection have already been reduced by improved CVC care.34 Even
though a UK cost-effectiveness analysis estimated that impregnated CVCs would be cost
effective given baseline rates of CR-BSI as low as 0.2%,29 there remains a question as to
whether the relative effect of impregnation would be less given improved catheter care.
Risks and benefits
Prevention of BSI is undoubtedly a clinically important outcome. Although evidence on
attributable mortality varies, BSI is clearly associated with a longer stay in hospital and more
intensive support.21, 22, 25-27, 49 For children in intensive care, catheter-associated BSI have been
associated with an additional 9-21 days stay in hospital (6.5-15 days in PICU).25-27 In adults,
the additional acute healthcare costs attributable to a BSI are an estimated £9148 per
patient, and could range between £2500 and £71,000.29 The few studies of cost of BSI in
PICU patients have found a difference of $33,039 to $39,219 in PICU direct costs for infected
and uninfected patients.22, 26 However, quantifying the effects of BSI are complicated by the
time-dependent exposure: BSI increases hospital stay; increased length of stay is a risk-factor
for BSI.50 Estimates of attributable length of stay are subject to this time-dependent bias,
leading to potentially overestimated BSI costs in previous studies.51, 52 On the other hand, no
study has taken into account the long-term costs associated with a BSI in children.
Potential adverse effects of CVCs are rare. Heparin-bonding could theoretically trigger an
allergic response leading to heparin-induced thrombocytopenia, although no case has been
reported to the manufacturers. Antibiotic-impregnation could potentially lead to antibiotic
23
561
562
563
564
565
566
567
568
569
570
571
572
573
574
575
576
577
578
579
580
581
582
583
584
585
586
587
588
589
590
591
592

resistance, although a systematic review showed no increased risk of resistant organisms
isolated from blood cultures.2
Overview of aims and research questions
From a policy perspective, there could potentially be significant gains for children’s health
and healthcare costs across the NHS if impregnated CVCs could be confirmed to substantially
reduce rates of BSI. We compared both types of impregnated CVC previously shown to be
most effective (antibiotic and heparin) with standard CVCs to determine the effectiveness of
CVC impregnation in children. Secondary analyses were conducted to evaluate the
effectiveness of each type of CVC.
We aimed to inform NHS policy regarding impregnated CVCs for intensive care of children by
undertaking a large pragmatic randomised controlled trial to determine 1) clinical
effectiveness; 2) cost-effectiveness of impregnated versus standard CVCs; and 3) the
generalisability and cost-impact of adopting impregnated CVCs for all children who need
them.
The main objectives and data sources for the three parts of the study were:
1) Clinical effectiveness
To determine the effectiveness of impregnated versus standard CVCs for reducing
BSI in children admitted to intensive care
To determine which type of CVC is most effective, based on 3-way comparisons of
measures of BSI, mortality, and adverse events
Data source: Clinical outcomes captured on case report forms in the RCT.
2) Cost-effectiveness:
To determine the cost-effectiveness of impregnated versus standard CVCs for
reducing BSI, based on incremental acute healthcare costs per BSI avoided
Data source: Clinical outcomes captured on case report forms in the RCT and records of
healthcare use captured by linkage of RCT data with hospital administrative data.
3) Generalisability and cost-impact:
To estimate the net cost impact to NHS PICUs given a policy to adopt impregnated
CVCs for all children who need them
24
593
594
595
596
597
598
599
600
601
602
603
604
605
606
607
608
609
610
611
612
613
614
615
616
617
618
619
620
621
622
Data source: National data on PICU admissions (PICANet) linked with infection surveillance
data collated by Public Health England and costs from the economic evaluation.
The specific objectives, methods and results for each of the three phases of the study are
reported in separate sections. We discuss the implications of our findings for policy and
recommendations for future research in the final chapter.
25
623
624
625
626
627
628
629

CHAPTER 2 CLINICAL EFFECTIVENESS: METHODS
Trial design
We conducted a parallel, three-arm RCT. Children admitted to 14 PICUs in England between
December 2010 and November 2012 were randomised to CVCs impregnated with antibiotics
or heparin or to standard CVCs in a ratio of 1:1:1.
Setting and participants
Children <16 years were eligible if they were admitted to a participating PICU or being
prepared for PICU admission by an emergency retrieval team and were expected to require
a CVC for 3 or more days. Children who had already participated in the trial were ineligible.
Interventions
We used polyurethane CVCs manufactured by Cook Medical Incorporated (IN 47404 USA).
Sizes used were French gauge 4 (double lumen), 5 or 7 (triple lumen). Both types of
impregnation involve internal and external surfaces. Cook reports a concentration of 503
µg/cm minocycline and 480 µg/cm rifampicin for their antibiotic-impregnated CVC, which
reduces biofilm formation.53 Heparin-bonding reduces thrombus and thereby biofilm
formation and uses benzalkonium chloride as an anti-infective bonding agent.6, 54
Randomisation and consent
For children admitted to PICU following elective surgery, we sought prospective parental
consent during pre-operative assessment. Randomisation took place in theatre or in the
anaesthetic room prior to entry into theatre. For children who required a CVC as an
emergency, we sought parental consent after randomisation and stabilisation (deferred
consent) to avoid delaying treatment, and usually within 48 hours of randomisation.
Children who required a CVC as part of their emergency care or resuscitation were
randomised at the bedside in PICU or at another hospital where they were randomised by
the PICU retrieval team prior to transfer to PICU. Further details are given in the protocol
(http://www.nets.nihr.ac.uk/projects/hta/081347).
At randomisation, the clinician or research nurse opened a pressure sealed, sequentially
numbered, opaque envelope containing the CVC allocation. Randomisation sequences were
26
630631
632
633
634
635
636
637
638
639
640
641
642
643
644
645
646
647
648
649
650
651
652
653
654
655
656
657
658
computer generated by an independent statistician in random blocks of three and six,
stratified by method of consent (deferred or prospective), site and envelope storage location
within the site to facilitate easy access to envelopes (e.g. for insertion in theatre and in
PICU).
Parents consented to the use of their child’s data for the trial, to follow-up using routinely
recorded clinical data, and to 0.5ml of blood being collected whenever a blood culture was
clinically required.55 The sample was sent for PCR testing for 16S rRNA of bacterial ribosome
protein to detect bacterial infection.
We also sought consent to link data from the national Paediatric Intensive Care Audit
Network (PICANet)56 to the child’s study data to categorise the primary reason for admission
and the Paediatric Index of Mortality score on admission (PIM2) and to link to administrative
hospital data for the economic analyses and death registration data to determine mortality
after discharge from PICU.57
Blinding
CVC allocation was not blinded to the clinician responsible for inserting the CVC (due to
different colour strips for antibiotic and heparin CVCs) but since CVCs looked identical whilst
in situ, allocation was concealed from patients, their parents and PICU personnel responsible
for their care. Labels identifying the type of CVC were held securely in a locked drawer in
case unblinding was required. Participant inclusion in analyses and occurrence of outcome
events were established prior to release of the randomisation sequence for analysis.
Comparisons and outcomes
The primary analysis for the trial compared antibiotic or heparin CVCs with standard CVCs.
Secondary analyses compared antibiotic with standard CVCs, heparin with standard CVCs,
and antibiotic with heparin CVCs.
The primary outcome was time to the first BSI based on blood cultures taken between 48
hours after randomisation and 48 hours after CVC removal (or prior to death). This time
interval was intended to capture BSI related to the type of CVC. All blood culture samples
were clinically indicated, defined by removal of the CVC due to suspected infection or other
recorded evidence of infection (one or more of: temperature instability, change in inotrope
requirements, haemodynamic instability, or poor perfusion). Any positive blood culture was
accepted for a non-skin organism, but for skin organisms, two or more positive cultures of
27
659
660
661
662
663
664
665
666
667
668
669
670
671
672
673
674
675
676
677
678
679
680
681
682
683
684
685
686
687
688
689

the same organism were required within 48 hours of each other. A clinical committee
reviewed all primary outcomes involving positive cultures.
We conducted a sensitivity analysis for potentially missing microbiology data, by assuming
that children with a record of clinical indication but no sample taken in the primary outcome
time window did actually experience the primary outcome.
Secondary BSI outcomes were:
CR-BSI: based on same organisms cultured from blood and CVC tip between 48
hours after randomisation and 48 hours after CVC removal; or differential
positivity of cultures from multiple CVC lumens on two or more occasions; or BSI
and exit site infection or BSI and CVC removed for infection;
Rate of BSI per 1000 CVC-days: based on one or more BSI between
randomisation and CVC removal;
Time to a composite measure of BSI: comprising the primary outcome or a
negative blood culture, combined with: i) a positive 16S PCR result for bacterial
DNA; ii) removal of the CVC because of suspected infection; or iii) start of
antibiotics or change in type of antibiotics on the same or next day.
Other secondary outcomes were:
Time to CVC thrombosis (defined by two episodes within five days of each other
of difficulty flushing the CVC or drawing back blood from the CVC, one episode
of swollen limb, CVC removal due to thrombosis, or a positive ultrasound
indicating thrombosis)
Time to CVC removal
Mortality by 30 days
Length of PICU admission
Length of hospital stay (up to 6 months post-randomisation)
Type of bacteria or fungi isolated from BSI included in the primary outcome
CVC-related outcomes evaluated in the safety analyses were:
CVC-related adverse events (unexplained thrombocytopenia after insertion of CVC,
exit site infection, hypersensitivity, trauma from line insertion, line displacement,
line breakage/mechanical problem/manufacture complication)
Mortality recorded up till hospital discharge
28
690
691
692
693
694
695
696
697
698
699
700
701
702
703
704
705
706
707
708
709
710
711
712
713
714
715
716
717
718
719
720

Antibiotic resistance to minocycline (>0.5 µg/ml) or rifampicin (>1.0 µg/ml)
Antibiotic resistance outcomes were based on etest strips applied to organisms isolated
from BSI included in the primary outcome (www.biomerieux-diagnostics.com/etest).
Incomplete laboratory testing and reporting prevented analysis of resistance in cultures
from the CVC tip (as specified in the protocol).
Sample size
We based the sample size calculation for the primary analysis on a relative risk (RR). We
assumed detection of a RR of 0.5 in patients with a baseline risk of 10% would change policy.
We assumed the RR would remain relatively constant across baseline risks while the
absolute risk difference would be more variable. 1200 children were required in a 2:1 ratio
(impregnated:standard) to achieve 80% power to detect a RR of 0.5 at a 5% level of
significance, based on an estimated BSI rate of 10% and allowing for 5% loss to follow-up. A
lower than expected BSI rate of 5% would have 62% power to detect a RR of 0.5 or 80%
power for a RR of 0.32.
The Independent Data Monitoring Committee recommended continuation of the study after:
reviewing the first 209 children; an interim analysis of 650 children using the Peto-Haybittle
stopping rule for the primary outcome; recruitment had reached the original target of 1200
pre-schedule in June 2012, before exhausting available funding (see Trial Oversight
Committee and Table 22 at end of report).
Statistical methods
Outcome data were analysed according to the intention to treat principle meaning that
children who were consented and randomised were analysed according to type of CVC
randomised, regardless of whether CVC insertion was attempted or the type of CVC
received. Safety analyses included the subset of children for whom CVC insertion was
attempted, grouped by CVC actually received.
The statistical analysis plan was developed prior to analysis and is available in Appendix 4. A
5% level of statistical significance and 95% confidence intervals were used throughout.
Absolute risk differences were calculated for proportions. Time-to-event outcomes were
analysed using Kaplan-Meier curves and the log-rank test. Cox regression was used to adjust
the primary analysis of time to BSI for the use of prospective or deferred consent and
suspected infection at baseline. Poisson regression was used to analyse the secondary
29
721
722
723
724
725
726
727
728
729
730
731
732
733
734
735
736
737
738
739
740
741
742
743
744
745
746
747
748
749
750
751

outcome of rate of BSI (defined as the total number of BSI per 1000 CVC-days occurring
between randomisation and CVC removal). All analyses were conducted using SAS
software.58
Post hoc analyses evaluated competing risks from death or time to first bloodstream
infection, using cumulative incidence curves. We applied Gray’s test to detect whether there
was a difference between impregnated and standard CVCs for the primary outcome.59 This
analysis was conducted using R statistical software.60
Study oversight and role of funders
The Research Ethics Committee for South West England approved the study protocol. The
manufacturer Cook supplied CVCs to participating units at a 20% discounted price. Neither
the manufacturer nor the funder (the National Institute of Health Research) had any role in
the design of the study, collection or interpretation of data or reporting of results. The
CATCH trial is registered with ClinicalTrials.gov (Identifier: NCT01029717). The protocol is
available at http://www.nets.nihr.ac.uk/projects/hta/081347 and the statistical analysis plan
is provided in Appendix 4. .
30
752
753
754
755
756
757
758
759
760
761
762
763
764
765
766
767
768
769
770
771
772
773
774
775
776
777
778
779
780

CHAPTER 3 CLINICAL EFFECTIVENESS: RESULTS
Study population
1859 children were randomised, of whom 501 children were randomised prospectively.
1358 were randomised as an emergency and 984 of these subsequently provided deferred
consent for inclusion in analyses (Figure 1; see Appendix 1.1 and 1.2 for numbers by
emergency/elective randomisation). Reasons for non-consent in the deferred consent group
included: not approached (n=180; 48%, mainly due to transfer to a non-participating unit or
early discharge from PICU), no response (n=17; 4.5%), or consent refused (n=177; 47%).
Detailed reasons for non-consent are reported elsewhere.61 Numbers enrolled by site and by
month are provided in Appendix 1.3 and 1.4.
Comparison of interventions
The intention to treat sample comprised 1485 children; 1345 children received the allocated
CVC. Threats to validity due to protocol deviations are provided in Appendix 1.5. Very few
children had a clinical indication but no blood culture taken in the primary outcome time
window (Figure 1). Timings of samples for positive BSI included in the primary and secondary
outcomes are provided in Figure 2.
Baseline characteristics
Table 1 shows that baseline characteristics were similar according to randomised CVC. Over
half (58%) of children were aged under 12 months at admission, with one-third aged less
than 3 months. One third of children had surgery prior to admission to PICU and half of all
children randomised had cardiovascular problems as their primary diagnosis at admission.
During follow up
Table 2 provides details of the CVC insertion and characteristics at 48 hours post
randomisation. CVC insertion took place in the operating room for 437/493 (89%) in the
prospective consent (elective) group, but in only 34/917 (4%) of the deferred consent
(emergency) group.
Table 3 shows the number of arterial, peripheral and CVC samples taken by trial arm.
Overall, 3583 blood samples were taken, and 1216/1485 (81.9%) of children had a sample
taken. Sampling was similar by trial arm and site (see Appendix 1.6).
31
781782
783
784
785
786
787
788
789
790
791
792
793
794
795
796
797
798
799
800
801
802
803
804
805
806
807
808
809
810

Primary outcome
The number of blood samples contributing to the primary outcome is shown in Appendix
1.7. Blood cultures were taken between 48 hours of randomisation and CVC removal for 40%
of those randomised (593/1485; Figure 1). BSI was recorded for 42 children: standard
18/502 (3.59%); antibiotic 7/486 (1.44%); heparin 17/497 (3.42%). Gram-positive organisms
accounted for the majority of BSI (Table 4).
Figure 3 shows the Kaplan-Meier curve for the primary outcome of time to first BSI. There
was no significant difference in time to first BSI when comparing any impregnated (antibiotic
and heparin) with standard CVCs (Table 5). However, risk of BSI was significantly lower for
antibiotic versus standard CVCs (hazard ratio 0.43; 95% CI 0.20, 0.96) and for antibiotic
versus heparin CVCs (HR 0.42; 95% CI 0.19, 0.93). The direction of these results was robust
to the sensitivity analysis (see Appendix 1.8). Regression analysis showed no significant
effect of pre-specified variables (type of consent and suspected infection at randomisation)
and the effect of type of CVC was similar after adjusting for these variables (Table 6).
Competing risk analyses using Gray’s test indicated no difference between the treatments
for either competing risks (p-values of p=0.29 for bloodstream infection and p=0.89 for
death, Table 7).
Secondary outcomes
No children had more than one BSI whilst the trial CVC was in situ. The relationship between
BSI outcomes by time since randomisation is shown in Figure 2.
Overall, 25 (1.7%) children experienced CR-BSI. There was no significant difference between
any impregnated and standard CVCs (p=0.13, Table 8), but risk of CR-BSI was significantly
lower for antibiotic versus standard CVC (p=0.03). There was no significant difference
between antibiotic and heparin CVCs (p=0.09) or between heparin and standard CVCs
(p=0.68).
The rate of BSI per 1000 CVC-days did not differ in the primary comparison between any
impregnated and standard CVCs (Table 8). However, the rate of BSI was significantly lower
for antibiotic compared with standard (p=0.04) and heparin CVCs (p=0.03; Table 9). There
was no significant difference in rate of BSI between heparin and standard CVCs (p=0.85).
A change in antibiotics on the same day or the next day as a negative blood culture made the
largest contribution to the composite measure of BSI (see Appendix 1.9). Overall, 317 (21%)
32
811
812
813
814
815
816
817
818
819
820
821
822
823
824
825
826
827
828
829
830
831
832
833
834
835
836
837
838
839
840
841
children experienced the composite measure of BSI, and this outcome did not differ by CVC
type (Table 9).
There was no difference in any other secondary outcomes by CVC allocation (Table 9). The
types of bacteria and fungi isolated from positive blood cultures are provided in Appendix
1.10.
Safety analyses
The cohort for safety analyses comprised more children in the standard group (n=533) than
the antibiotic (n=451) or heparin groups (n=479). As standard CVCs were the default option
in the majority of PICUs, more children received the allocated CVC in the standard arm (93%)
compared with the antibiotic (90%) or heparin (89%) arms.
No serious adverse events (e.g. intervention causing death or prolonging hospitalisation)
were reported. CVC-related adverse events were reported for 31 children (21 mild, 8
moderate and 2 severe (i.e. unable to perform routine activity; see Table 10). No children
had more than one adverse event and no events were attributed to the type of CVC. .
Of the 1463 children whose CVC insertion was attempted, 148 (10%) died before discharge
from PICU after-randomisation (Table 10). The majority of deaths were due to reasons
related to co-morbidities at admission (see Appendix 1.11).
Testing for antibiotic resistance varied by centre. Only 12 of the 42 children with the primary
outcome had minocycline and rifampicin resistance reported using etest strips; 8/12 were
resistant, in each case to both antibiotics (3/5 standard; 2/2 antibiotic; 3/5 heparin).
Resistant organisms by trial arm are provided in Appendix 1.12.
Post-hoc analyses
A total of 1573 valid PCR samples were taken from 715 (48%) of children. Of these children,
11 (1.5%) had positive PCR results (12 samples). Positive PCR results were observed for 2
(8%) children with the primary outcome compared with 9 (1.3%) children without the
primary outcome (Table 10). Values of the positive PCR results are provided in Appendix
1.13.
33
842
843
844
845
846
847
848
849
850
851
852
853
854
855
856
857
858
859
860
861
862
863
864
865
866
867
868

Figure 1: CONSORT flow diagram for all trial participants
Randomised 1859
Randomised and consent obtained:
1485 Randomised and deferred consent not obtained: 374
Prospective consent 501 Not approached 180Deferred consent 984 No response 17
Consent refused 177Standard Antibiotic Heparin
Trial arm 122 126 126
Standard Antibiotic HeparinAllocated (ITT analysis) 502 Allocated (ITT analysis) 486 Allocated (ITT analysis) 497Received (per protocol) 468 Received (per protocol) 437 Received (per protocol) 440
Received other: 13 Received other: 28 Received other: 24Antibiotic 1 Standard 23 Standard 22Heparin 12 Heparin 5 Antibiotic 2
None received: 21 None received: 21 None received: 33
Insertion attempted 15 Insertion attempted 14 Insertion attempted 24
Not attempted 6 Not attempted 7 Not attempted 9
Unblinded 1 Unblinded 1 Unblinded 2 Primary outcome* Primary outcome* Primary outcome*Clinical indicators recorded and :- Clinical indicators recorded and :- Clinical indicators recorded and :- ≥ 1 blood culture sample taken: 213 ≥ 1 sample taken: 190 ≥ 1 sample taken: 190 No blood culture sample taken** 8 No blood culture sample taken** 6 No blood culture sample taken** 3
*based on clinically indicated blood culture sample taken >=48 hours after randomisation and <48 hours after CVC removal; ** used in sensitivity analysis
34
869
870

Figure 2 Number of children included in the primary outcome, the rate of BSI and catheter related BSI according to time since randomisation
Rand
omisa
tion
48 h
ours
afte
r ran
dom
isatio
n
CVC
rem
oval
48 h
afte
r CVC
rem
oval
Primary outcome of BSIn=40 n=2
Rate of BSI per 1000 CVC-daysn=10 n=40
Catheter-related BSI (CR-BSI)n=24 n=1
Figure 3: Kaplan-Meier curve for time to first BSI by CVC allocation
35
871
872
873
874
875
876
877
878
879

36
880

Table 1: Baseline characteristics and clinical condition before randomisation (n=number of participants by randomised CVC)
Standard Antibiotic Heparinn % n % n %
Patient characteristics 502 100 486 100 497 100Emergency (deferred consent) 333 66.3 320 65.8 331 66.6Elective (prospective consent) 169 33.7 166 34.2 166 33.4Male 285 56.8 291 59.9 277 55.7
Age
<3 months 159 31.7 159 32.7 175 35.23-12 months 129 25.7 123 25.3 116 23.31-10 years 174 34.7 154 31.7 174 35.011+ years 40 8.0 50 10.3 32 6.4
Weight at admission
< 3kg 41 8.2 38 7.8 56 11.33-10kg 278 55.4 280 57.6 273 54.9>10 kg 183 36.5 166 34.2 168 33.8Missing 0 0.0 2 0.4 0 0.0
Admitted for surgery 174 34.7 171 35.2 181 36.4PICU assessment (from linked PICANet data) 479 95.4 456 93.8 473 95.2
Primary reason for admission
Cardiovascular 235 49.1 233 51.1 250 52.9Endocrine/metabolic 30 6.3 34 7.5 30 6.3Infection 39 8.1 30 6.6 31 6.6Cancer 9 1.9 6 1.3 8 1.7Respiratory 102 21.3 86 18.9 84 17.8Neurological 22 4.6 31 6.8 29 6.1Trauma 18 3.8 10 2.2 18 3.8Other 24 5.0 26 5.7 22 4.7Unknown 0 0.0 0 0.0 1 0.2
Paediatric Index of Mortality (PIM2)
<1% 54 11.3 48 10.5 48 10.11-5% 264 55.1 236 51.8 247 52.25-<15% 116 24.2 123 27.0 119 25.215-<30% 34 7.1 31 6.8 39 8.230%+ 11 2.3 18 3.9 20 4.2
Clinical condition at randomisation 502 100.0 486 100.0 497 100.0
< 72h before randomised
Other CVC in situ 95 18.9 91 18.7 83 16.7Anticoagulants received 50 10.0 59 12.1 61 12.3Antibiotics received 286 57.0 276 56.8 284 57.1Positive blood culture 40 8.0 25 5.1 36 7.2
At randomisationInfection suspected 214 42.6 181 37.2 199 40.0Immune compromised 44 8.8 31 6.4 29 5.8
37
881882
883
884
885
886

Table 2: Details of the intervention and characteristics at 48 hours post randomisation (n=number of participants with CVC inserted)
Standard Antibiotic Heparinn % n % n %
CVC details (inserted CVCs) 481 95.8 465 95.7 464 93.4Deferred consent, CVC inserted 314 65.3 301 64.7 302 65.1
Inserted at same hospitalICU 276 57.4 264 56.8 259 55.8Theatre 5 1.0 4 0.9 7 1.5Other 2 0.4 3 0.6 1 0.2
Inserted at other hospital*ICU 5 1.0 6 1.3 3 0.6Theatre 3 0.6 8 1.7 7 1.5Other 23 4.8 16 3.4 23 5.0
Missing 0 0.0 0 0.0 2 0.4Prospective consent, CVC inserted 167 34.7 164 35.3 162 34.9
Inserted at same hospitalICU 15 3.1 23 4.9 16 3.4Theatre 152 31.6 141 30.3 144 31.0Other 0 0.0 0 0.0 1 0.2
Size of line
4 28 5.8 45 9.7 39 8.45 421 87.5 384 82.6 391 84.37 21 4.4 23 5.0 18 3.9Missing 11 2.3 13 2.8 16 3.5
Triple lumen CVC 450 93.6 421 90.5 422 90.9CVC inserted into femoral vein 253 52.6 217 46.7 235 50.648 hours post randomisation 502 100.0 486 100.0 497 100.0
Number of devices in situ<4 160 31.9 169 34.8 185 37.2>=4 340 67.7 311 64.0 311 62.6Missing 2 0.4 6 1.2 1 0.2
Presence of an intrabody cavity device**
Yes 404 80.5 381 78.4 380 76.5No 96 19.1 100 20.6 116 23.3Missing 2 0.4 5 1.03 1 0.2
*CVCs were inserted by the retrieval team prior to transfer to PICU** ET tube, tracheotomy tube, intracranial pressure monitor, chest drain, peritoneal dialysis catheter
38
887888
889890
Table 3: Samples taken in primary outcome time window (n=number of participants by randomised CVC)
Standard (n=502) Antibiotic (n=486) Heparin (n=497)
n randomisedn samples
% n randomisedn samples
% n randomisedn samples
%
Samples clinically indicated and in the primary outcome time window
213 42.4 190 39.1 190 38.2328 269 326
Type of sample
Arterial49 9.8 39 8.0 41 8.255 44 55
Peripheral19 3.8 32 6.6 35 7.022 33 39
CVC161 32.1 129 26.5 136 27.4226 167 208
39
891892

Table 4: Primary outcome (absolute measures) and type of organism isolated, according to CVC allocation (values are n by randomised CVC (%) unless otherwise stated))
Standard Antibiotic Heparin
Intention to treat analyses N=502 % N=486 % N=497 %Bloodstream infection 18 3.59 7 1.44 17 3.42Median time to first BSI in days (IQR) 7.5 (4.5, 11.2) 6.9 (6.0, 8.0) 4.2 (3.1, 8.4)
Organism typeNon-skin 15$ 2.99 6 1.23 16 3.22Skin 3 0.60 1 0.21 1 0.20
Organism group*Gram-positive$$ 10 0.02 3 0.01 10 0.02Gram-negative 6 0.01 4 0.01 5 0.01Candida 2 0.00 0 0.00 3 0.01
* = groups add to more than total due to multiple types of organisms isolated on same occasion in some patients$ = includes 1 mixed BSI pathogen and skin organism$$ = includes skin bacteria
Table 5: Risk difference for first BSI and hazard ratio for time to first BSI according to CVC allocation (hazard ratios p<0.05 are in bold)
Risk difference (95% CI) Hazard ratio (95% CI) p-value
Primary analysis Any impregnated (n=983)vs standard (n=502) -1.14 (-3.04, 0.75) 0.71 (0.37, 1.34) 0.29
Secondary analysis Antibiotic (n=486)vs standard (n=502) -2.15 (-4.09, -0.20) 0.43 (0.20, 0.96) 0.04
Heparin (n=497)vs standard (n=502) -0.17 (-2.45, 2.12) 1.04 (0.53, 2.03) 0.90
Antibiotic (n=486)vs heparin (n=497) -1.98 (-3.90, -0.06) 0.42 (0.19, 0.93) 0.03
40
893894
895896897898
899
900

Table 6: Regression results for primary outcome
Analysis Variable (n with outcome) Comparator (n with outcome) Hazard Ratio 95% CI p-value
PrimaryAntibiotic or heparin CVC (24) Standard (18) 0.71 0.38-1.33 0.29Deferred consent* (30) Prospective (12) 0.87 0.40-1.90 0.73Suspected infection (18) No suspected infection (24) 0.69 0.33-1.42 0.31
Secondary
Antibiotic CVC (7) Standard (18) 0.40 0.17-0.96 0.04Heparin CVC (17) Standard (18) 1.05 0.54-2.05 0.89Deferred consent (30) Prospective (12) 0.87 0.40-1.90 0.35Suspected infection (18) No suspected infection (24) 0.68 0.33-1.40 0.30
Secondary
Antibiotic CVC (7) Heparin (17) 0.39 0.16-0.95 0.04Deferred consent (30) Prospective (12) 0.85 0.30-2.45 0.76
Suspected infection (18) No suspected infection (24) 0.99 0.40-2.43 0.98Hazard ratios p<0.05 are in bold; * participants with prospective consent were admitted electively and participants with deferred consent were admitted as an emergency.
Table 7: Competing risk analysis for primary outcome of time to first BSI
Outcome Hazard ratio (95% CI) Gray’s test p-value
Time to first BSI (hours) 0.71 (0.39, 1.31) 0.29
Time to death (hours) 1.08 (0.63, 1.85) 0.89
41
901
902903904
905
906
907
908
909
910
911
912
913
914

Table 8: Secondary outcomes (absolute measures) by CVC allocation (n is number of participants by randomised CVC who experienced the outcome)
Standard (n=502)
Antibiotic (n=486)
Heparin (n=497)
Primary analyses n % n % n %
Catheter-related BSI (CR-BSI) 12 2.4 3 0.6 10 2.0Rate of BSI per 1000 CVC days (95% CI) BSI/1000 days
8.2421/2.5
47
(4.7, 11.8)
3.308/2.41
8
(1.0, 5.6)
8.7821/2.3
91
(5.0, 12.6)
Composite measure of BSI 112 22.3 103 21.2 102 20.5
CVC thrombosis 125 24.9 126 25.9 105 21.1Median time to CVC removal in days (IQR) 4.28 (2.3,
7.0) 4.3 (2.1, 7.0) 4.20 (2.2,
7.0)Mortality by 30 days 42 8.4 39 8.0 28 5.6Median time to PICU discharge in days (IQR) 5.1 (2.8,
10.0) 4.4 (2.2, 9.3) 4.9 (2.3,
8.9)Median time to hospital discharge in days (IQR) 12.0 (6.4,
25.6) 12.0 (6.7, 22.7) 12.1 (6.4,
22.5)
42
915916
917

Table 9: Risk difference and/or hazard ratios for secondary outcomes according to CVC allocation (hazard ratios p<0.05 are in bold)
Any impregnated vs standard (primary
analysis)
Antibiotic vs standard(secondary analysis)
Heparin vs standard(secondary analysis)
Antibiotic vs heparin(secondary analysis)
risk difference (95% CI)
hazard ratio (95%
CI)
pvalu
e
risk difference (95% CI)
hazard ratio (95%
CI)
pvalu
e
risk difference (95% CI)
hazard ratio (95%
CI)
pvalu
e
risk difference (95% CI)
hazard ratio
(95% CI)
pvalu
e
Catheter-related BSI (CR-BSI)
-1.07 0.55^ 0.13 -1.77 0.25^ 0.03 -0.38 0.84^ 0.68 -1.39 0.30^ 0.09
(-2.58, 0.45)
(0.25, 1.21)
(-3.28, -0.27)
(0.07, 0.90)
(-2.20, 1.44)
(0.36, 1.96)
(-2.81, 0.02)
(0.08, 1.11)
Rate of BSI per 1000 CVC days
-2.21 0.73* 0.31 -4.94 0.40* 0.04 0.55 1.07* 0.85 -5.49 0.38* 0.0
3(-6.36, 1.94)
(0.40, 1.34)
(-9.14, -0.73)
(0.17, 0.97)
(-4.60, 5.70)
(0.55, 2.06)
(-9.89, -1.08)
(0.16, 0.89)
Composite measure of BSI
-1.46 0.95 0.65 -1.12 0.94 0.67 -1.79 0.95 0.73 0.67 0.99 0.93(-5.90, 2.98)
(0.75, 1.20)
(-6.26, 4.03)
(0.72, 1.23)
(-6.87, 3.30)
(0.73, 1.25)
(-4.41, 5.75)
(0.75, 1.30)
CVC thrombosis-1.40 0.98 0.88 1.03 1.09 0.49 -3.77 0.88 0.34 4.80 1.24 0.11
(-6.02, 3.22)
(0.79, 1.22)
(-4.40, 6.46)
(0.85, 1.40)
(-8.99, 1.44)
(0.68, 1.14)
(-0.50, 10.10)
(0.96, 1.60)
CVC removal1.04 0.53 1.02 0.67 1.05 0.51 0.99 0.87
(0.93, 1.16)
(0.90, 1.17)
(0.92, 1.19)
(0.87, 1.13)
Mortality by 30 days
0.80(0.54, 1.20)
0.96(0.61, 1.51)
0.65(0.40, 1.07)
1.46(0.88, 2.42)
0.14
Time to PICU discharge
1.08 0.17 1.07 0.27 1.08 0.21 0.98 0.73(0.97, 1.20)
(0.95, 1.22)
(0.96, 1.23)
(0.86, 1.11)
Time to hospital discharge
1.04 0.47 1.03 0.68 1.05 0.42 0.98 0.77(0.93, 1.16)
(0.91, 1.16)
(0.93, 1.19)
(0.87, 1.11)
43
918

Primary analyses compared time to event for all secondary outcomes, except CR-BSI (^=risk ratio) and rate of BSI (*=rate ratio)
44
919920

Table 10: Safety analyses of CVC-related adverse events and mortality (n is number by type of received or if not inserted, type attempted to be inserted)
Standard (n=533) Antibiotic (n=451) Heparin (n=479) Total(n=1463)
n % n % n % n %
CVC-related adverse events
Unexplained thrombocytopenia 0 0.0 1 0.2 1 0.2 2 0.1
Exit site infection 1 0.2 0 0.0 0 0.0 1 0.1
Hypersensitivity 0 0.0 0 0.0 0 0.0 0 0.0
Trauma from line insertion 2 0.4 2 0.4 3 0.6 7 0.5
Line displacement 4 0.8 6 1.3 3 0.6 13* 0.9
Line breakage / mechanical problem / manufacture complication
2 0.4 3 0.7 2 0.4 7* 0.5
Unclassifiable 0 0.0 1 0.2 0 0.0 1 0.1
Total 9 1.7 13 2.9 9 1.9 31 2.1
Mortality
Deaths ** 66 12.4 44 9.8 38 7.9 148 10.1
Median time to death in days (IQR) 15.3 (6.0,
39.0) 9.0 (2.6, 25.6) 14.8 (5.3,32.6)
*One event reported as severe; ** measured on case report forms as an adverse event before discharge
45
921922
923
924925926927928929

Table 11: PCR results for bacteria in blood samples taken during the primary outcome time window by CVC type (N is number by randomised CVC)
Nrandomised
N (%)with PCR*
N (%)with PCR positive
Standard
Primary outcome =
No 484 239 (49.4) 4 (1.7)
Yes 18 12 (66.7) 1 (8.3)
Antibiotic
Primary outcome =
No 479 221 (46.1) 3 (1.4)
Yes 7 5 (71.4) 0 (0.0)
Heparin Primary outcome =
No 480 231 (48.1) 2 (0.9)
Yes 17 7 (41.2) 1 (14.3)
Total Primary outcome =
No 1443 691 (47.9) 9 (1.3)
Yes 42 24 (57.1) 2 (8.3)
1485 715 (48.1) 11 (1.5)
46
930931
932
933

CHAPTER 4 COST-EFFECTIVENESS ANALYSIS
IntroductionCentral venous catheter (CVC) infections are a substantial and preventable cause of iatrogenic
morbidity, mortality, excess length of stay and healthcare costs. In the setting of the paediatric
intensive care unit (PICU), bloodstream infections (BSI) related to CVCs have been reported to occur
in 3% to 8% of all CVC insertions. As approximately two-thirds of the 16,000 admissions to English
PICUs each year 56 require CVCs, the overall impact represents a major burden to patients and the
NHS. 21, 22
Impregnated CVCs are nearly twice as expensive as standard, requiring decisions on their use to be
informed by evidence of their cost-effectiveness. However, current economic evaluations are limited
in their transferability to the PICU setting in the UK as they all relate to adult populations and, with
one exception,29 apply to different healthcare systems (Australia,62 Germany 63 and the USA 64-66).
While care pathways and costs may differ in the UK setting, these studies consistently demonstrated
antibiotic-impregnated CVCs to be cost saving, while yielding improved outcomes.
Hockenhull et al. 29 modelled the cost-effectiveness of impregnated CVCs by comparison with
standard CVCs in adult patients. The cost of managing CR-BSIs, estimated as £9,148, was taken from
a systematic review of economic studies. Based on a systematic review of RCTs, impregnated CVCs
were estimated to reduce the incidence of CR-BSI from 3% to 1.4%. The ICER of £8,530 saved for
each CR-BSI averted, was calculated as the additional cost of the impregnated CVC less the expected
cost per patient of managing excess CR-BSI, divided by the absolute risk reduction. While intuitively
simple, the model did not consider mortality effects or discriminate between different types of
impregnated CVCs, and the authors recommended decision-makers to interpret the results with
caution.
Halton et al. 62 used a Markov decision model to compare the cost-effectiveness of a range of
antimicrobial-coated CVCs, including minocycline and rifampicin-coated catheters, relative to
uncoated catheters in adult intensive care unit patients. Simulations suggested antibiotic CVCs
prevented 15 CR-BSIs per 1000 CVCs placed, with a corresponding gain of 1.6 quality-adjusted life-
years (QALYs). The model predicted 32 ICU bed days and 95 general ward bed days would be
released, with cost savings of AUD $130,289 per 1,000 CVCs.
47
934
935
936
937
938
939
940
941
942
943
944
945
946
947
948
949
950
951
952
953
954
955
956
957
958
959
960
961
962
963

Frank et al. 63 performed a case-control analysis of resource use and costs among 30 adults who
developed CR-BSIs and 108 controls, each in an ICU setting. The marginal cost per infectious episode
was estimated as €231, but the calculation and meaning of the ICER presented for silver-
impregnated CVCs was unclear.
Marciante et al. 64-66 developed a series of decision models with patient-level clinical trial data to
determine whether minocycline and rifampin impregnated CVCs are cost-effective in adults. Cost-
effectiveness was indeterminable for CVCs inserted for a week or less, as no infections had occurred
during this time. Antibiotic CVCs were modelled to be cost-effective for longer periods of insertion,
with expected savings of US $67 and gains of 0.009 QALYs per patient.
Shorr et al. 64-66 presented another decision analytic model based on a hypothetical cohort of 1,000
adult patients requiring a CVC. Incidence of CR-BSI, excess lengths of ICU and ward stays and
associated costs were selected from published studies. Compared to standard CVCs, minocycline and
rifampin impregnated CVCs were estimated to reduce the incidence of CR-BSI from 3.3% to 1.4%,
resulting in a saving of US $9,605 for each CR-BSI averted.
Veenstra et al. 64-66 used data from RCTs, meta-analyses, and case-control studies within a decision
analytic modelling framework to estimate the incremental cost-effectiveness of antiseptic-
impregnated CVCs in a hypothetical cohort of hospitalised patients at high risk for catheter-related
infections. Modelling the use of chlorhexidine-silver sulfadiazine-impregnated compared with
standard CVCs and resulted in a 2.2% decrease in the incidence of CR-BSI, a 0.33% decrease in the
incidence of death, and a saving of US $196 per CVC used.
An important limitation of these studies was that each analysis modelled the costs and
consequences of BSI using data from disparate sources and as such relied heavily on assumptions
relating to attribution of hospital lengths of stay (the main cost driver) and mortality to BSI. The only
UK-based economic evaluation considered an adult population and assumed that a patient with a
catheter-related BSI spends 6 additional days in ICU and 5 additional days in a general medical
ward.29 A recent study of 1,339 cases of catheter-related BSI sampled from a US paediatric
population and matched to controls by propensity-score, revealed a higher mean attributable length
of stay of 19 days.67 While this is comparable with the 21 excess length of stay estimated for
paediatric haematology/oncology patients 68, these estimates are reliant on retrospective
observational data and are susceptible to bias.
48
964
965
966
967
968
969
970
971
972
973
974
975
976
977
978
979
980
981
982
983
984
985
986
987
988
989
990
991
992
993

Aim
We aimed to assess the cost-effectiveness of antibiotic, heparin and standard CVCs in an English
PICU setting using data from the CATCH randomised controlled trial. Although the primary
comparison showed no evidence that impregnated CVCs (antibiotic or heparin) were more effective
than standard CVCs, important differences in secondary comparisons among the three CVCs
warrants an economic evaluation to inform decisions on resource allocation. This is especially
relevant if one type of CVC were to reduce total costs, be associated with shorter periods in PICU or
reductions in the length of ward stays.
MethodsAlthough cost-utility analyses, based on the quality-adjusted life-year (QALY) are more appropriate
for informing decisions concerning allocative efficiency, there are practical and methodological
challenges in estimating utility values in children, especially for very young children in the PICU
setting. These include difficulty in responding to or understanding questions on health-related
quality of life – whether for reasons of age, illness or consciousness; limitations of using proxy
utilities, low event rate in the primary endpoint and the inclusion of a wide range of clinical
conditions. A cost-effectiveness analysis was therefore performed, which allowed for an assessment
of technical efficiency (i.e. determination of the most efficient CVC for reducing the incidence of BSI).
The study methods were consistent with other economic evaluations of CVCs.63
Resource use
The perspective of the analysis was that of the NHS in England, with the expectation that the main
cost driver of inpatient hospital care would represent the greatest proportion of direct medical
costs. The principal cost components were PICU, High Dependency Unit (HDU) and ward stays
(including readmissions), outpatient clinic visits, Accident and Emergency (A&E) admissions and the
costs of the CVCs. The time horizon of the base-case analysis was selected to include the costs
associated with managing bloodstream infections and any sequelae within the 6-month period from
randomisation. Shorter time horizons were examined in sensitivity analyses.
The measurement of resource use required complementary approaches using data collected as part
of the trial and as part of routine care. Patients’ use of hospital services were obtained from the
following (see also Figure 4):
(i) The trial case report forms (CRFs). Research nurses completed the relevant sections of the
CRF to record the dates during which patients were in neonatal or paediatric intensive care units,
high dependency units and paediatric wards within the hospitals participating in the CATCH trial.
49
994
995
996
997
998
999
1000
1001
1002
1003
1004
1005
1006
1007
1008
1009
1010
1011
1012
1013
1014
1015
1016
1017
1018
1019
1020
1021
1022
1023
1024
1025

Data recorded in CRFs were used for the dates of hospital discharge, transfer to another hospital and
date of CVC removal.
(ii) Hospital Episode Statistics (HES) data from the Health and Social Care Information Centre
(HSCIC).69 HES data contain details of all admissions to NHS hospitals in England and provide
Healthcare Resource Groups (HRGs) on the type of care patients receive at a ward-level, outpatient
visits and A&E admissions, but do not provide details on ICU and HDU stays. HES data were used for
estimating HRGs for ward stays, outpatient and A&E attendances.
(iii) The Paediatric Intensive Care Audit Network (PICANet) dataset 56 records all ICU length of
stays for paediatric patients in the UK and allows for the tracking over time of patients who have
been transferred between different hospital ICUs. PICANet was used for the National Schedule
Reference Cost HRGs for HDU and ICU stays 70, and for checking hospital admission, transfer and
discharge dates.70
(iv) Hospital Patient Administration Systems (PAS) of CATCH-participating hospitals were
accessed for patients’ lengths of stay in ICUs and wards, and for relevant HRGs. These were used to
supplement data that were missing from other sources.
Unit costs
HRGs were chosen as the main currency of the economic analysis as these most closely reflect
payments relating to patient stays. Cost codes based on the 2012-13 National Tariff were applied to
ward, outpatient and A&E codes.71 These are bundled care packages, that is, they are reimbursed at
a national level according to the NHS Payment by Results Scheme (see Appendix 2.1). The 2012-13
National Schedule of Reference Costs were applied to PICU, Neonatal Intensive Care Unit (NICU) and
HDU codes.70 These are unbundled care packages as they are locally-reimbursed services (Table 12).
Obsolete National Tariff and Schedule codes and hospital bed day rates used between 2010-2012
were inflated using the Consumer Price Index (4.3% for 2010-11 and 2.7% for 2011-12). The
preferred Hospital Price Index was only available for 2010-11, but is similar to the Consumer Price
Index, at 4.1%. The list prices of CVC devices were obtained from the supplier (Cook Medical,
Bloomington, IN, USA).
Cost analysis
Bundled National Tariff costs were based on the hospital spell and incorporated excess ward days,
market forces factor, and whether the case was elective or emergency. Tariff codes were obtained
primarily from HES data (see Appendix 2) but where unavailable, PAS data. If bundled HRGs were
missing from both of these sources, ward costs were assigned from the ward bed-day rate supplied
50
1026
1027
1028
1029
1030
1031
1032
1033
1034
1035
1036
1037
1038
1039
1040
1041
1042
1043
1044
1045
1046
1047
1048
1049
1050
1051
1052
1053
1054
1055
1056
1057

by hospital finance departments (Table 13). Similarly, bed-day rates were applied to days of stay
with unassignable National Tariff HRG codes (such as UZ01C and WA14Z) appearing in the HES and
PAS data. These bed-day rates were needed in <1% of admissions.
Unbundled, locally reimbursed costs were calculated from the National Schedule ‘per day’ codes
taken from PICANet (Table 12) or assigned as XA01C in the cases where Neonatal Critical Care was
indicated in CRF data. In the 10% of cases where unbundled codes were missing, CRF data were
consulted to determine whether the patient stay was in PICU or HDU. In addition, PICANet database
entries (such as patient note summaries) were examined for any evidence for advanced and /or
enhanced care. In the absence of any higher cost code indicators, a basic HDU code (XB07Z) or a
basic ICU code (XB05Z) was applied from the National Schedule of Reference Costs.70
Baseline costs, relating to the 6 months preceding randomisation, were calculated from HES and
PICANet data on ward, PICU and HDU costs.
For the 6 months subsequent to randomisation, an adjustment was necessary to apportion costs
given that ward, PICU and HDU costs relate to episodes of care which could start prior to
randomisation. Patients admitted to hospital n days before randomisation and spending N days in
hospital after randomisation had their total costs calculated as:
Total cost = (N/n+N) x (ward cost + PICU cost + HDU cost)
+ (outpatient costs + A&E costs + CVC costs)
Patients’ use of healthcare resources and total costs were calculated for the intention to treat
population, with summary statistics generated by intervention group.
Outcomes
The clinical outcome for the cost-effectiveness analysis was the presence of a first bloodstream
infection defined by a positive blood culture from a sample that was clinically indicated and taken
more than 48 hours after CVC insertion and up to 48 hours after CVC removal. The likelihood of a
bloodstream infection was estimated using a logistic regression analysis with intervention group as
the explanatory variable.
51
1058
1059
1060
1061
1062
1063
1064
1065
1066
1067
1068
1069
1070
1071
1072
1073
1074
1075
1076
1077
1078
1079
1080
1081
1082
1083

Incremental analysis
The cost-effectiveness of each CVC was evaluated by: i) ranking CVCs according to decreasing
effectiveness, ii) eliminating dominated interventions (those which are less effective or ineffective)
or any extendedly dominated interventions. The incremental cost-effectiveness ratio (ICER) for
remaining CVCs was consequently calculated according to:
Incremental cost-effectiveness ratio (ICER) = ΔCosts / ΔBSI
Where, ΔCosts is the difference in the means of total costs between interventions; and ΔBSI is the
difference in proportion of bloodstream infections between interventions.
Uncertainty analysis
Nonparametric bootstrapping (10,000 replicates) was used to calculate bias-adjusted 95% central
ranges for differences in costs and BSI, and their joint distributions. Uncertainty was represented
using a cost-effectiveness acceptability curve (CEAC) which presented the probability of CVCs being
cost effective for given ceiling thresholds of costs per BSI averted.72
Uncertainty in total costs was further explored by adjusting for the contribution of independent
baseline factors on overall variability.73
The following pre-defined explanatory variables were tested for independent associations with total
costs: age group, body weight, 6-month pre-randomisation costs (all log-transformed), gender, pre-
existing CVC 72 hours prior to randomisation, health status before PICU admission, reason for
admission (cardiovascular, endocrine or metabolic, infection, neurological, oncology, respiratory,
trauma, other), suspected infection at randomisation, immune compromised, positive blood culture
within 72 hours prior to randomisation, numbers of devices in situ, intervention group, and
admission type (elective or emergency). Assumptions were necessary to account for missing data
with respect to some variables; patients were assumed to be healthy (n=1), not
immunocompromised (n=19) and no positive blood culture (n=5). Missing data for weight (n=2) were
imputed with the mean (11.95 kg). Missing reason for admission (n=20) were cross-checked against
PICANet, PAS and available HES data. All were correctly assigned as cardiovascular patients.
Independent variables were tested in univariate analyses for their association with total costs with
risk factors that were significant at the 5% level selected for the multivariable regression using a
stepwise approach. Given the non-normality of cost data, generalised linear models (GLMs) were
specified using a range of families and links. Assessment of goodness of fit using Akaike Information
Criterion (AIC) and the Modified Park’s test was inconclusive; but the best fitting link function,
52
1084
1085
1086
1087
1088
1089
1090
1091
1092
1093
1094
1095
1096
1097
1098
1099
1100
1101
1102
1103
1104
1105
1106
1107
1108
1109
1110
1111
1112
1113
1114

determined from the Pearson Correlation, Pregibon Link and the Modified Hosmer and Lemeshow
tests, was the identity link. While the underlying true distributions of costs are not normal, the
analysis depends only on sample means and variances. Based on the comparatively large sample size
the Central Limit Theorem was assumed to guarantee near-normality of sample means, and an OLS
regression was considered appropriate 73.
Bias-corrected confidence intervals for costs and BSI were estimated from bootstrapped data
generated using the recycled predictions method.74
Sensitivity analysis
The pre-specified time horizon for the base-case analysis, of 6 months, was selected to capture
longer term costs resulting from potential complications of BSI but was somewhat arbitrary.. The
sensitivity of total costs and the ICERs to the time horizon of analysis was therefore considered by
limiting costs to those incurred during the index hospitalisation (that is, excluding any subsequent
re-admissions that may have occurred during the 6-months), and by analysing their relationship with
time, from 1 month (when all BSI had occurred) to 6 months.
Value of healthcare resources associated with BSI
In an exploratory analysis, a variable representing the presence of a BSI was included in the cost
regression to estimate the value of the healthcare resources associated with managing a
bloodstream infection. To avoid collinearity, the variable representing intervention group was
omitted from this regression.
All analyses were performed using STATA Version 10, and the economic evaluation reported
according to the Consolidated Health Economic Evaluation Reporting Standards (CHEERS)
statement.75
ResultsResource use and total costs
Complete cost data were available for all patients. In the 6 months preceding randomisation, the
total costs (length of stay) of ICU/HDU admission were £6,026 (3.19 days) for the standard CVC
group, £5,188 (2.76 days) for the antibiotic CVC group and £6,616 (3.47 days) for the heparin CVC
group. . Mean, total costs were £15,588, £16,933 and £16,722, respectively, and did not differ with
respect to ICU/HDU (p=0.46) or total cost (p=0.71).
53
1115
1116
1117
1118
1119
1120
1121
1122
1123
1124
1125
1126
1127
1128
1129
1130
1131
1132
1133
1134
1135
1136
1137
1138
1139
1140
1141
1142
1143
1144

Patients randomised to antibiotic-impregnated CVC spent 10.8 days (95% CI, 9.3, 12.4) in PICU in the
6 months following randomisation, compared with 9.9 days (95% CI 8.6, 11.4) for those in the
heparin-bonded CVC group and 10.5 days (95% CI 9.2, 11.9) for standard CVC (Table 14). There were
no significant differences in lengths of stay between groups, either in PICU (p=0.70), HDU (p=0.43),
or ward (p=0.52). The total days of hospital stay in the 6 months after randomisation were 34.8 days
(95% CI 31.2, 38.5) for antibiotic CVC, 31.4 days (95%CI 28.2, 34.7) for heparin-bonded CVC and 31.7
(95% CI 28.8, 34.8) for the standard CVCs group. The 6 most significant HRGs (of 349 in total)
accounted for 50% of ward costs. These related to congenital or other cardiac surgery and lower
respiratory tract disorders.
Total and disaggregated costs are presented in Table 15. The mean 6-month costs were £44,503
(median £28,952; range £1,786, £360,983; 95% CI £40,619, £48,666) for standard CVCs, £45,663
(median £29,793; range £2,189, £442,365; 95% CI £41,647, £50,009) for antibiotic-impregnated
CVCs and £42,065 (median £27,621; range £2,638, £382,431; 95% CI £38,322, £46,110) for heparin
CVCs (Figure 5). These costs were not statistically significantly different among intervention groups
(p=0.46); or when disaggregated according to bundled costs (p=0.43) and unbundled costs (p=0.73).
Incremental costs
Mean, unadjusted costs over the 6-month timeframe were not significantly different by CVC, but
tended to be higher (by £1,160; 95% CI -£4,743, £6,962) for antibiotic compared with standard CVCs,
and tended to be lower (-£2,439; 95% CI -£8,164, £3,359) for heparin compared with standard CVCs.
Randomisation ensured that all variables tested for the cost regression were well balanced between
intervention groups. Only a small proportion (<10%) of the residual variability in total cost could be
explained by the significant independent predictor variables: natural logarithm (ln) of age (in days),
natural logarithm of 6-month pre-randomisation costs, health status before PICU admission, reason
for admission, whether immune compromised, and admission type (elective or emergency; Table
16). The adjusted incremental costs associated with the antibiotic and heparin CVC groups, in
relation to standard CVCs, were £1,220 (95% CI -£4,332, £6,773) and -£2,399 (95% CI -£7,914,
£3,120), respectively, resulting in small improvements in precision.
Value of healthcare resources associated with BSI
Over 6 months, patients who had experienced a BSI (n=42) experienced 6.5 more days (95% CI 1.4 to
11.6) in PICU than those with no BSI (n=1,443), and 15.1 additional total days (95% CI 4.0 to 26.2) of
hospitalisation. Unadjusted mean 6-month cost for patients with a BSI was £60,481 (n=42, 95% CI
£47,873, £73,809) and without was £43,578 (n=1,443, 95% CI £41,185, £45,970), a difference of
54
1145
1146
1147
1148
1149
1150
1151
1152
1153
1154
1155
1156
1157
1158
1159
1160
1161
1162
1163
1164
1165
1166
1167
1168
1169
1170
1171
1172
1173
1174
1175
1176

£17,263 (95% CI -£3,076, £31,450). The regression-derived adjusted difference in cost, representing
the value of the resources used to manage BSI, was £10,975 (95% CI -£2,801, £24,751) (Table 17).
Outcomes
Seven of 486 children randomised to antibiotic CVCs experienced a BSI, compared with 17/497 in the
heparin CVC group and 18/502 in the standard CVC group. A statistically significant absolute risk
difference was found only for antibiotic versus standard CVCs (-2.15%; 95% CI -4.09, -0.20).
Compared with standard CVCs, the unadjusted odds of acquiring a BSI with an antibiotic CVC was
0.39 (95% CI 0.16, 0.95, p=0.04) and 0.95 (95% CI 0.49, 1.87, p=0.89) for heparin CVCs.
Incremental and uncertainty analysis
As heparin CVCs were shown not to be clinically effective when compared to standard CVCs there is
no case for an incremental analysis: a clinically ineffective intervention cannot be cost-effective by
the same measure of BSI. The calculation of the incremental cost-effectiveness ratio was therefore
limited to the comparison of antibiotic and standard CVCs which resulted in an ICER of £54,057 per
BSI averted (Table 18).
The cost-effectiveness acceptability curve yielded the probabilities of antibiotic CVCs being cost-
effective at (arbitrary) thresholds of £10,000, £50,000 and £100,000 per BSI averted, as 0.38, 0.49
and 0.62, respectively (Figure 6). The probability of antibiotic CVCs dominating standard CVCs was
estimated as 0.35.
Sensitivity analysis
The mean number of days in hospital during the index hospitalisation was substantially shorter (e.g.
22.1 days for antibiotic CVCs) than during the 6 months from randomisation (e.g. 34.8 days for
antibiotic CVCs; see Tables 19 and 14). Considering only the index hospitalisation, total costs tended
to be lower in the antibiotic CVC group (£33,073; 95% CI £30,047, £36,337) and in the heparin CVC
group (£32,245; 95% CI £29,013, £35,823) compared with the standard CVC group (£35,165; 95% CI
£31,864, £38,670). The unadjusted incremental cost saving for antibiotic versus standard CVCs was -
£2,093 (95% CI -£6,919, £2,583); and between heparin and standard CVCs -£2,920 (95% CI -£7,833,
£2,180).
Based only on the costs of the index stay, antibiotic CVCs dominated standard CVCs with a saving of
£97,543 per BSI averted (Table 18).
55
1177
1178
1179
1180
1181
1182
1183
1184
1185
1186
1187
1188
1189
1190
1191
1192
1193
1194
1195
1196
1197
1198
1199
1200
1201
1202
1203
1204
1205
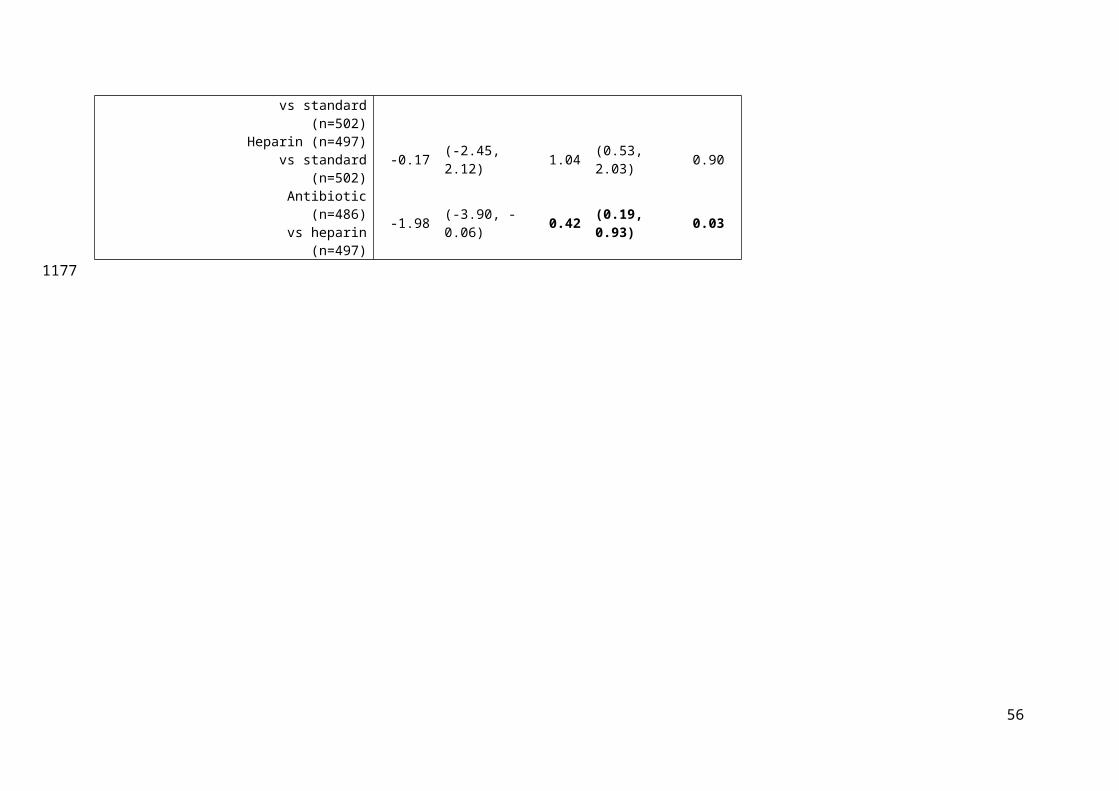
An analysis of the cumulative mean costs over the course of the 6 month (Figure 7), shows that costs
in the heparin CVC group were lower overall, while costs in the antibiotic CVC group were variably
cost-incurring and cost-saving in comparison to the standard CVC group.
The resulting ICER for antibiotic compared with standard CVCs fluctuated considerably (Figure 8),
ranging from a minimum of £82,204 saved per BSI averted by day 50 post-randomisation, being cost-
neutral by day 122 and to the base-case cost of £54,057 per BSI averted by 6 months.
56
1206
1207
1208
1209
1210
1211
1212

Table 12: Unit cost for intensive care and high dependency care, based on HRGs from the National Schedule tariff (2012-13) HRG code
HRG name Primary description
Secondary description Cost per day
XB01Z
Paediatric Critical Care, Intensive Care, ECMO/ECLS
Highly specialised intensive care treatment e.g. by extra-corporeal membrane oxygenation (ECMO)
ECMO, VAD and other highly complex procedures
£4,391
XB02Z
Paediatric Critical Care, Intensive Care, Advanced Enhanced
Unstable multi-system failure with other complications
£2,409
XB03Z
Paediatric Critical Care, Intensive Care, Advanced
Intensive nursing supervision at all times, undergoing complex monitoring and/or therapeutic procedures, including advanced respiratory support
Invasive ventilation with multi-system failure
£2,017
XB04Z
Paediatric Critical Care, Intensive Care, Basic Enhanced
Intensive ventilation with more than one system failure
£2,110
XB05Z Paediatric Critical
Care, Intensive Care, Basic
Continuous nursing supervision
Invasive ventilation with single system failure or non-invasive ventilation with more than one system failure
£1,743
XB06Z
Paediatric Critical Care, High Dependency, Advanced
Require closer observation and monitoring than is usually available on an ordinary children’s ward, with higher than usual staffing levels
Non-invasive ventilation (e.g. CPAP and BIPAP by mask with IV drugs)
£1,335
XB07Z
Paediatric Critical Care, High Dependency
Close monitoring, oxygen by mask, no invasive ventilation
£886
XB08Z Paediatric Critical
Care, Transportation
Since paediatric critical care facilities are centralised in a small number of hospitals providing expert specialist care, specialist transport teams are required to deliver clinical management during transfer of patients
£2,799
XA01Z
Neonatal Critical Care, Intensive Care
Care provided for babies who are the most unwell or unstable and have the greatest needs in relation to staff skills and staff to
Baby receives any form of mechanical respiratory support via a tracheal tube and/or parenteral nutrition.
£1,118
57
12131214

patient ratios
58
1215

Table 13: Hospital ward bed-day rates as provided by hospital finance departments and adjusted for inflation (£ sterling, 2013)
Hospital HES hospital ID
Market Forces Factora
Ward Rateb
Birmingham Children's Hospital
RQ3 1.05 £290
Bristol Hospital for Sick Children
RA7 1.08 £366
Evelina Children's Hospital RJ1 1.28 £595c
Freeman Hospital RTD 1.04 £595c
Alder Hey RBS 1.04 £364d
Glenfield Hospital RWE 1.04 £751
Great Ormond Street Hospital RP4 1.29 £2,157
Leeds General Infirmary RR8 1.05 £542
Leicester Royal Infirmary RWE 1.04 £751
Queens Medical Centre RX1 1.04 £374
Royal Brompton Hospital RT3 1.25 £370
Royal Victoria Infirmary RTD 1.25 £342
Southampton General Hospital
RHM 1.09 £212
St Mary's RYJ 1.24 £394
aused with HRGs only; b ward rate excludes ICU or HDU costs; c mean of series of wards provided by all hospitals except Alder Hey d mean of series wards provided by hospital
59
12161217
121812191220

Table 14: Patients' lengths of stay and count of dominant HRGs relating to inpatient stays, from randomisation to 6 months (including readmissions), according to place and intensity of care and by intervention group
Antibiotic Heparin Standard
Unit Mean (median) 95% CI Mean
(median) 95% CI Mean (median) 95% CI
Days on ICU 10.79 (5.00)9.28, 12.48 9.91 (5.00)
8.57, 11.44
10.50 (5.00)
9.17, 11.93
Paediatric Critical Care, Intensive Care, ECMO/ECLS (XB01Z) 0.31 (0.00) 0.07, 0.72 0.39 (0.00) 0.09, 0.80 0.41 (0.00) 0.17, 0.72Paediatric Critical Care, Intensive Care, Advanced Enhanced (XB02Z) 0.16 (0.00) 0.09, 0.26 0.12 (0.00) 0.09, 0.15 0.16 (0.00) 0.10, 0.26Paediatric Critical Care, Intensive Care, Advanced (XB03Z) 0.77 (0.00) 0.51, 1.05 0.62 (0.00) 0.43, 0.83 0.65 (0.00) 0.46, 0.87Paediatric Critical Care, Intensive Care, Basic Enhanced (XB04Z) 2.30 (0.49) 1.92, 2.72 2.69 (0.78) 2.09, 3.44 2.76 (0.00) 2.14, 3.54Paediatric Critical Care, Intensive Care, Basic (XB05Z) 6.96 (2.00) 5.65, 8.45 5.63 (2.00) 4.75, 6.59 6.40 (2.95) 5.42, 7.47Neonatal Critical Care, Intensive Care (XA01C) 0.29 (0.00) 0.10, 0.55 0.46 (0.00) 0.13. 1.03 0.11 (0.00) 0.04, 0.20
Days on HDU 2.00 (0.59) 1.48, 2.62 1.60 (0.59) 1.28, 1.99 1.73 (0.00) 1.44, 2.05Paediatric Critical Care, High Dependency, Advanced (XB06Z) 1.28 (0.00) 0.94, 1.70 1.09 (0.00) 0.80, 1.45 1.22 (0.00) 0.98, 1.49Paediatric Critical Care, High Dependency (XB07Z) 0.72 (0.00) 0.42, 1.16 0.51 (0.00) 0.40, 0.64 0.51 (0.00) 0.40, 0.64
Days on ward 22.01 (9.13)19.26, 24.80
19.85 (9.00)
17.40, 22.40
19.48 (8.57)
17.12, 21.94
Total days in hospital34.80
(20.00)31.21, 38.48
31.36 (17.00)
28.18, 34.65
31.72 (17.97)
28.75, 34.81
Count of non-PICU/HDU inpatient HRGsComplex Congenital Surgery (EA24Z) 100 103 109Intermediate Congenital Surgery (EA25Z) 68 70 72Major Complex Congenital Surgery (EA23Z) 45 39 37Cardiac Conditions with complication and comorbidity (PA23A) 109 102 74Lower Respiratory Tract Disorders without acute bronchiolitis with length of stay ≥1 day with complication and comorbidity (PA14C) 95 78 105
60
12211222

Implantation of Prosthetic Heart or Ventricular Assist Device (EA43Z) 2 2 4Other inpatient HRGs 1103 1055 964
61
1223

Table 15: Disaggregated and total costs (£) by intervention group from randomisation to end of the six-month timeframe
Antibiotic CVC Heparin CVC Standard CVC
Unit Mean (median) 95% CI Mean
(median) 95% CI Mean (median) 95% CI
Paediatric Critical Care, Intensive CareECMO/ECLS (XB01Z) 1358 (0) 310, 3159 1703 (0) 386, 3509 1796 (0) 723, 3156Advanced Enhanced (XB02Z) 388 (0) 207, 636 289 (0) 216, 371 395 (0) 228, 620Advanced (XB03Z) 1545 (0) 1031, 2124 1250 (0) 872, 1674 1318 (0) 933, 1752Basic Enhanced (XB04Z) 4861
(1023)4060, 5738 5675 (1646) 4418, 7260 5822 (0) 4512, 7460
Basic (XB05Z) 12,137 (3486)
9855, 14,730
9822 (3486) 8274, 11,489
11,159 (5133)
9440, 13,025
Neonatal Critical Care, Intensive Care (XA01C) 325 (0) 113, 613 517 (0) 142, 1150 125 (0) 42, 225Paediatric Critical Care, HDU
High Dependency, Advanced (XB06Z) 1709 (0) 1254, 2271 1450 (0) 1972, 1940 1629 (0) 1301, 1992High Dependency (XB07Z) 635 (0) 372, 1025 454 (0) 354, 567 456 (0) 356, 566Transportation (XB08Z) 1158 (0) 1022, 1293 1258 (0) 1109, 1413 1208 (0) 1068, 1353
Sub-total (PICU/HDU/NICU)a 24,115 (12,201)
20,824, 27,764
22,417 (11,903)
19,429, 25,771
23,907 (12,495)
20,989, 27,049
Inpatient stayb
Complex Congenital Surgery (EA24Z) 3011 (0) 2445, 3593 2908 (0) 2363, 3481 3144 (0) 2565, 3753Intermediate Congenital Surgery (EA25Z) 2166 (0) 1670, 2699 1934 (0) 1470, 2440 2044 (0) 1583, 2545Major Complex Congenital Surgery (EA23Z) 1865 (0) 1315, 2481 1915 (0) 1310, 2603 1466 (0) 1013, 1960Cardiac Conditions with complication and
comorbidity (PA23A) 1277 (0) 818, 1845 1173 (0) 831, 1558 739 (0) 495, 1025Lower Respiratory Tract Disorders without
acute bronchiolitis with length of stay ≥1 day with complication and comorbidity (PA14C) 858 (0) 593, 1157 668 (0) 454, 913 943 (0) 657, 1268
Implantation of Prosthetic Heart or Ventricular Assist Device (EA43Z) 273 (0) 0, 684 298 (0) 0, 762 548 (0) 103, 1155
Other inpatient HRG costs10,316 (4017)
8616, 12,231 8803 (3058)
7524, 10,106 9930 (3259)
7860, 12,409
62
1224

Sub-total (inpatient)19,766 (14122)
17,934, 21,755
17,700 (13,716)
16,308, 19,182
18,814 (13,748)
16,649, 21,327
OtherA&E costc 89 (0) 76, 104 85 (0) 73, 99 91 (0) 78, 104Outpatient costc 1615 (883) 1412, 1838 1784 (837) 1496, 2109 1648 (881) 1453, 1871CVC costd 78.28 78, 78 78.25 78, 78 42.91 43, 43
Total cost (full 6 months) 45,663 (29793)
41,647, 50,009
42,065 (27,621)
38,322, 46,110
44,503 (28,952)
40,619, 48,666
a National Schedule of Reference Costs 2012-2013; bTop 6 (of 349) HRGs ranked by cost, together contributing 50% of overall inpatient cost, c2012-2013 National Tariff HRGs <1% taken from bed day rates; dCosts supplied by CVC provider (Cook Medical).
63
122512261227

Table 16: Adjusted, total (6-month) costs: results of Ordinary Least Squares regression of total costs based on significant baseline variables
Variable Coefficient (£) 95%CI (£) p-
valueNatural logarithm of pre-randomisation cost
1444 602 2287 <0.001
Admission type 27,423 20,993 33,853 <0.001Intervention group (antibiotic) 1221 -4332 6773 0.67Intervention group (heparin) -2399 -7917 3120 0.39Prior health status (0=not healthy; 1=healthy)
-9974 -15,807 -4140 <0.001
Reason for admission (endocrine/metabolic)
-1921 -11,889 8048 0.71
Reason for admission (infection) -22,300 -32,609 -11,992 <0.001Reason for admission (neurological) -21,854 -32,780 -10,927 <0.001Reason for admission (oncology) 2641 -16,052 21,333 0.78Reason for admission (other) -3510 -14,355 7335 0.53Reason for admission (respiratory) -8289 -15,609 -968 0.03Reason for admission (trauma) -12,144 -26,764 2477 0.1Compromised immunity (yes/no) 8476 -1246 18,198 0.09Natural logarithm of age in days -236 -1300 828 0.66Constant 24,086 13,255 34,916 <0.001
AIC = 24.25; BIC = 2.89x10¹²; R2 = 0.092
64
1
12281229
1230
1231

Table 17: Value of healthcare resource associated with managing a BSI: results of Ordinary Least Squares regression for estimating the cost of BSI, with total costs as the dependent variable and univariately significant baseline explanatory variables
Variable Coefficient (£) 95% CI (£) p-value
Natural logarithm of pre-randomisation cost
1439 598 2281 0.001
Admission type 27,341 20,916 33,767 <0.001
Prior health status (0=not healthy; 1=healthy)
-9593 -15,440 -3745 0.001
Reason for admission (endocrine/metabolic)
-2005 -11,968 7959 0.693
Reason for admission (infection) -22,585 -32,896 -12,274 <0.001
Reason for admission (neurological) -21,648 -32,559 -10,736 <0.001
Reason for admission (oncology) 2335 -16,347 21,017 0.806
Reason for admission (other) -2948 -13,789 7894 0.594
Reason for admission (respiratory) -8170 -15,484 -856 0.029
Reason for admission (trauma) -12,412 -27,016 2192 0.096
Compromised immunity (yes/no) 7965 -1770 17,700 0.109
Natural logarithm of age (in days) -178 -1243 885 0.742
Bloodstream infection (0=no; 1=yes) 10,975 -2801 24,751 0.118
Constant 23,064 12,759 33,369 <0.001
R2 = 0.092
65
2
123212331234
1235
1236

Table 18: Incremental Analysis of unadjusted costs (mean values with 95% central range)
Antibiotic Heparin Standard
Base-case analysis(6-month time horizon)
Total costs £45,663(£41,647, £50,009)
£42,064(£38,322, £46,110)
£44,503(£40,619, £48,666)
Incremental cost (versus standard) £1,160(-£4,743, £6,692)
-£2,438(-£8,164, £3,359) -
BSI 1.44%(0.4, 2.5)
3.42%(1.8, 5.0)
3.59%(2.0, 5.2)
Incremental BSI (versus standard) -2.15%(-4.1, -0.2)
-0.17%(-2.5, 2.1) -
ICER (versus standard) £54,057per BSI averted -a -
Sensitivity analysis(index hospitalisation)
Total costs £33,073(£30,047, £36,337)
£32,245(£29,013, £35,823)
£35,165(£31,864, £38,670)
Incremental cost (versus standard) -£2,093(-£6,919, £2,583)
-£2,920(-£7,833, £2,180) -
BSI 1.44%(0.4, 2.5)
3.42%(1.8, 5.0)
3.59%(2.0, 5.2)
Incremental BSI (versus standard) -2.15%(-4.1, -0.2)
-0.17%(-2.5, 2.1) -
ICER (versus standard) -£95,473per BSI averted b -a -
aAs heparin CVC was not deemed to be clinically effective in reducing BSI rates, it cannot be cost-effective by the same outcome measureb Cost-saving
Table 19: Patients' length of stay for hospitalisation episode from randomisation by intervention group
Antibiotic Heparin Standard
Unit Mean 95% CI Mean 95% CI Mean 95% CIDays on ICU 9.31 8.09, 10.70 8.93 7.71, 10.32 9.79 8.60, 11.03
Days on HDU 1.70 1.25, 2.25 1.39 1.09, 1.76 1.51 1.24, 1.80
Days on ward 11.13 9.19, 13.18 10.32 8.59, 12.18 10.79 9.03, 12.70Total days in hospital 22.14 19.48, 24.89 20.65 18.27, 23.16 22.09 19.76, 24.51
66
3
1237
1238123912401241
12421243
1244
1245

Figure 4: Flow diagram of the methods employed for the economic evaluation.
67
4
1246
1247
12481249

Figure 5: Ranking of total, 6-month costs by intervention group, indicating patients who experienced a bloodstream infection.
68
5
12501251
1252
1253
1254

Figure 6: Cost-effectiveness acceptability curve based on a 6 month time horizon presenting the probability of antibiotic and standard CVCs being cost-effective for given values of ceiling ratio expressed as cost per bloodstream infection (BSI) averted
£0 £50,000 £100,000 £150,000 £200,000 £250,000 £300,000 £350,0000
0.1
0.2
0.3
0.4
0.5
0.6
0.7
0.8
0.9
1
StandardAn-tibitotic
Value of ceiling ratio (cost per BSI averted)
Prob
abili
ty (c
ost e
ffecti
ve)
Figure 7: Relation between total costs (cumulative) and time since randomisation, according to intervention group
69
6
125512561257
1258
12591260
1261
1262
Figure 8: Relation between the ICER for antibiotic CVC versus standard CVC, and time since randomisation. Positive ICERs are cost-incurring, negative values represent incremental savings per BSI averted
-100,000
-80,000
-60,000
-40,000
-20,000
0
20,000
40,000
60,000
80,000
0 20 40 60 80 100 120 140 160 180 200
Incr
emen
tal C
ost E
ffecti
vene
ss R
atio
(£ p
er B
SI a
vert
ed)
Time from Randomisation (Days)
70
7
126312641265
1266
1267
1268
1269
1270
1271
1272
1273
1274
1275
1276

CHAPTER 5 GENERALISABILITY STUDY
Introduction
CATCH was the largest trial in PICU to date, recruiting 1485 children within 14 PICUs in 12 NHS Trusts
in England, corresponding to 5% of children admitted to all PICUs in England and Wales during the
trial period (2010-2012). However, if antibiotic-impregnated CVCs were adopted, it is likely that
these CVCs would be bulk-purchased and used for all children requiring CVCs in PICU, not just
children like those in the trial. Decisions on whether to purchase antibiotic-impregnated CVCs
therefore need to take into account the generalisability of benefits to all children who need a CVC
and the cost-impact of purchasing the more expensive impregnated CVCs.
In terms of generalisability, trial populations may have different characteristics and outcomes from
those who receive the intervention in practice, for a variety of reasons.76 For CATCH, there were two
specific reasons why those recruited might differ from those likely to receive impregnated CVCs
outside the trial setting. Firstly, children recruited to CATCH were expected to require a CVC for
three or more days, and would therefore have a higher risk of BSI than those staying less than three
days. Secondly, the introduction of CVC care bundles and on-going improvements in infection
control in recent years have been associated with rapidly decreasing rates of BSI over the past
decade, meaning that the background BSI rate may be lower now than it was at the start of the
trial.33, 34
In terms of budget-impact, impregnated CVCs are approximately twice as expensive as standard
CVCs. However, additional costs might be outweighed by the number of BSIs averted through using
the more effective CVCs and the associated reduction in the use of healthcare resources.
We determined the generalisability of the CATCH trial findings by estimating risk-adjusted trends in
BSI for children expected to require CVCs in PICU, based on a data linkage study including children
not participating in CATCH.77 We determined the budget- and cost-impacts of adopting antibiotic-
impregnated CVCs for all children required CVCs in PICU by synthesising the following evidence: i)
the estimated risk of BSI using standard CVCs (derived from the data linkage study); ii) the number of
BSI potentially averted by using antibiotic-impregnated CVCs (based on the relative treatment effect
in the trial); iii) the additional costs associated with purchasing impregnated CVCs for all children
expected to require a CVC (numbers of CVCs based on PICU survey data); and iv) the value of the
healthcare resources associated with each BSI (from the CATCH cost-effectiveness analysis).
71
8
1277
1278
1279
1280
1281
1282
1283
1284
1285
1286
1287
1288
1289
1290
1291
1292
1293
1294
1295
1296
1297
1298
1299
1300
1301
1302
1303
1304
1305
1306

Methods
Rate of BSI using standard CVCs
Data sources
There is no single dataset from which the rate of BSI in PICUs across the NHS can be estimated for
children requiring standard CVCs. Linkage between the national laboratory surveillance system
coordinated by Public Health England (LabBase2) 78 and data from the Paediatric Intensive Care Audit
Network (PICANet) 56 has provided an enhanced dataset from which to estimate the baseline rate of
BSI.
Details of the data linkage study have been published elsewhere.77 Briefly, a combination of
deterministic linkage and a method called prior-informed imputation was used to identify PICANet
admission records that had a corresponding record of BSI in LabBase2.79, 80 A set of deterministic
rules based on agreement between NHS number, hospital number, first name, surname, date of
birth and postcode were used to identify unequivocal links. For the remaining records, match
probabilities were calculated based on date of birth, Soundex code for surname, sex and location
(laboratory and hospital). Match probabilities were used to inform imputation of values for
uncertain links using prior-informed imputation.79, 80 Five imputed datasets were produced and
analysed separately, with results combined using Rubin’s rules.81
The resulting linked dataset captured approximately 71% of all children aged <16 years, admitted to
20 of the 25 PICUs in England and Wales between March 2003 and December 2012 and is broadly
representative of the whole PICU population.82 As some PICUs used impregnated CVCs for some
patients, we restricted the linked dataset to children expected to require a standard CVC in PICUs in
England. Types of CVCs used for emergency and elective admissions at each PICU were derived from
responses to a PICU practice survey sent to a designated consultant at each PICU in 2009. Where no
response was obtained or the PICU was not included in the survey, we assumed that standard CVCs
were used.
Identifying children with CVCs
CVC use is not routinely captured for all admissions in PICANet, so we identified admissions likely to
have a CVC using a statistical model. We estimated the probability of CVC use for all admissions
based on a subset of individual-level audit data where CVC used was recorded. Presence of a CVC
was recorded for 2488 admissions as part of two audits: Great Ormond Street Hospital (January
2006 - December 2010) and Cambridge Addenbrooke’s Hospital (July 2009 - December 2009). We
72
9
1307
1308
1309
1310
1311
1312
1313
1314
1315
1316
1317
1318
1319
1320
1321
1322
1323
1324
1325
1326
1327
1328
1329
1330
1331
1332
1333
1334
1335
1336
1337

used a multivariable logistic regression model to predict the probability of CVC use for all
admissions, based on potentially predictive variables recorded in PICANet (e.g. use of vasoactive
agents, length of stay and other clinical factors). The best-fitting predictive model was chosen based
on Bayesian Information Criterion (BIC).
The internal validity of the model was assessed using bootstrapping, accounting for any model over-
fitting due to developing and testing the model in the same dataset.83-85 The external validity was
assessed using aggregate data from a further two PICUs. We identified the subset of admissions
most likely to have required a CVC using a probability cut-off based on the Youden index.86 Full
details of the predictive model are provided in Appendix 3.1.
Estimated BSI rates were based on the subset of admissions identified by the predictive model as
most likely to have received standard CVCs.
Case definition
We estimated CVC days at risk of BSI by assuming that for children expected to require a CVC, bed-
days in PICU were equivalent to CVC-days, i.e. that CVCs were inserted at admission and removed at
discharge from PICU. We defined an episode of BSI as any positive blood culture isolated from a
blood sample taken from two days after admission to two days after discharge from PICU. Repeated
samples with positive cultures of the same organism within 14 days were treated as the same
episode.
Statistical analysis
Rates of BSI per 1000 CVC-days were modelled using multi-level Poisson regression. We accounted
for clustering of admissions within PICUs by including a random effect for PICU. Appropriateness of
the Poisson model was verified using a goodness-of-fit test based on the deviance statistic. For
comparisons between units and over time, rates were adjusted for risk-factors identified as being
significant (p<0.05). Likelihood-ratio tests were used to identify significant interactions between risk-
factors.
We compared BSI rates using standard CVCs for CATCH participants and non-participating
admissions expected to require a CVC, and BSI rates for admissions in the same PICUs but not
expected to require a CVC. For non-participating PICUs, the trial period was defined as the period
between December 2010 (when the first PICU began recruiting) and December 2012 (when the last
PICU stopped recruiting).
73
10
1338
1339
1340
1341
1342
1343
1344
1345
1346
1347
1348
1349
1350
1351
1352
1353
1354
1355
1356
1357
1358
1359
1360
1361
1362
1363
1364
1365
1366
1367

Number of BSI averted using antibiotic CVCs
We estimated the difference in the number of BSI if antibiotic CVCs were used in place of standard
CVCs. We asked PICUs to provide the percentage of emergency and elective admissions receiving
CVCs within a second PICU practice survey conducted in 2012.32 The number of admissions requiring
CVCs in all 23 PICUs in England was then estimated by applying these percentages to the number of
emergency and elective admissions within each PICU. The total number of CVC-days was estimated
by multiplying the number of CVCs required by the mean CVC-days for children expected to require
CVCs in PICANet.
We estimated the BSI rate using antibiotic CVCs in place of standard CVCs by applying the relative
treatment effect (rate-ratio) from the trial to the BSI rate using standard CVCs.
We assumed that the relative treatment effect would be the same regardless of the baseline rate of
BSI, i.e. that the effect would be the same for children who would have been ineligible for the trial
because they were expected to stay <3 days in PICU. We reasoned that the biological mechanism
through which impregnated CVCs work is the same for low and high-risk patients (impregnated CVCs
reduce the chance that bacteria track internally or externally along the CVC from the insertion site).
Randomised controlled trials of impregnated CVCs show similar results for long- and short-term
CVCs, suggesting that effect is not modified in groups with different baseline risk or length of stay.3 In
reality, 72% of children recruited in CATCH required a CVC for 3 or more days.
Budget-impact: additional costs of antibiotic CVCs
Antibiotic CVCs are more expensive than standard CVCs: £73 versus £42 for double lumen CVCs; £79
versus £43 for triple lumen CVCs. Total additional costs with antibiotic CVCs were calculated by
multiplying the number of CVCs required by the maximum additional cost per CVC, i.e. £36. We
assumed, conservatively, that any change in PICU length of stay, nursing or other resources would
not impact on hospital budgets. The budget-impact was based on the additional costs of antibiotic
CVCs only.
Cost-impact: value of resources associated with managing BSI
Assuming that any differences in costs between arms were due to differences in the number of BSI,
the cost-impact analysis utilised the estimated difference in the 6-month risk-adjusted costs
between patients who had a BSI versus those who did not (£10,975 per BSI; 95% CI -£2801 to
£24,751) (cost-effectiveness analysis, Table 17).
The total number of BSI potentially averted was estimated by applying the BSI rate assuming all
children in 2012 had used either standard or antibiotic CVCs. The cost-impact (total value of
74
11
1368
1369
1370
1371
1372
1373
1374
1375
1376
1377
1378
1379
1380
1381
1382
1383
1384
1385
1386
1387
1388
1389
1390
1391
1392
1393
1394
1395
1396
1397
1398
1399
resources associated with managing BSI with standard CVCs) was calculated by multiplying the costs
per BSI by the estimated number of BSI averted if antibiotic CVCs were used instead of standard
CVCs.
Sensitivity analysis
We estimated the budget- and cost-impacts based on best and worst case scenarios for the total
number of CVCs required and the excess number of BSIs with standard versus antibiotic CVCs. We
also performed probabilistic sensitivity analysis using Monte Carlo simulation to reflect uncertainty
in both costs and BSI. Values for each parameter were sampled from probability distributions based
on observed data and 5000 iterations were performed to provide a 95% uncertainty interval for the
cost-impact.87
Results
Rate of BSI using standard CVCs
Of the 2488 admissions in the CVC audit data, 1431 (58%) required a CVC. The best fitting prediction
model included length of stay, vasoactive agent, admission from ward, renal support and invasive
ventilation (see Appendix 3.3). With a probability cut-off of 0.57, the sensitivity of the predictive
model for capturing admissions requiring a CVC was 61%; specificity was 82%; positive predictive
value was 82% and negative predictive value was 61%. The predictive model identified 80% of the
CATCH admissions as requiring a CVC.
Survey responses for the type of CVCs used prior to CATCH were obtained for 18 of the 23 PICUs in
England (see Appendix 3.2). Only two PICUs reported not using standard CVCs for any admissions
(both used heparin CVCs). BSI rates were estimated based on linked data from the remaining 16
English PICUs.
Applying the predictive model to the 16 PICUs in the linked dataset identified a subset of 21,381
admissions most likely to have received standard CVCs between 2003-2012. Characteristics of these
admissions (based on PICANet data) are provided in Appendix 3.4. Risk-adjusted rates of BSI using
standard CVCs decreased steadily between 2003 and 2012, and were greater for CATCH PICUs (5.27;
95% CI 5.06-5.49 per 1000 CVC-days in 2012) compared with non-participating PICUs (2.09; 95% CI
1.60-2.58 in 2012; Figure 9). Of the subset of admissions predicted to receive a CVC in 2012,
103/3021 (3.4%) experienced BSI, corresponding to an overall BSI rate using standard CVCs of 4.58
(95% CI 4.42, 4.74) per 1000 CVC-days (Table 20). This was non-significantly lower than the rate
observed during the trial (8.24; 95% CI 4.7-11.8 per 1000 CVC days; Table 8), partially due to the
75
12
1400
1401
1402
1403
1404
1405
1406
1407
1408
1409
1410
1411
1412
1413
1414
1415
1416
1417
1418
1419
1420
1421
1422
1423
1424
1425
1426
1427
1428
1429
1430

inclusion of all children with CVCs (not just those requiring CVCs for 3 or more days). Further
explanation for this difference are potentially incomplete reporting of BSI to the national infection
surveillance system, use of bed days instead of CVC days in the estimated rate, or increased
frequency of sampling in trial PICUs during CATCH.
Number of BSI averted using antibiotic CVCs
Survey responses indicated that on average, 60% of emergency admissions and 50% of elective
admissions require CVCs (see Appendix 3.2). The estimated number of children using CVCs in 2012
was 8831, corresponding to a total of 85,971 CVC-days. The rate-ratio of BSI for impregnated versus
standard CVCs was estimated as 0.40 (95% CI 0.17, 0.97; Table 9) in the trial. The point estimate of
the number of BSI averted switching from standard to antibiotic CVCs for all children requiring CVCs
in 2012 was therefore 232, with best and worst case scenarios of 338 and 11 respectively (Table 21).
Budget-impact: additional costs of antibiotic CVCs
Based only on a CVC cost difference of £36, the additional cost of purchasing antibiotic CVCs for all
children in 2012 was 8831 x £36 = £317,916.
Cost-impact: value of additional costs associated with managing BSI
Based on each BSI being associated with a mean cost of £10,975 (95% CI -£2,801, £24,751; Table 17).
over 6 months, the value of resources made available in 2012 through averting BSI with standard
CVCs (i.e. the total costs of managing these BSIs) would have been 232 x £10,975 = £2,541,397, with
best and worst case scenarios of -£925,583 and £8,205,414 based on confidence intervals for both
estimates. The probabilistic sensitivity analysis provided a 95% uncertainty interval of -£66,544 to
£5,557,451 for total resources made available through averting BSI in 2012. There was a probability
of 0.90 that the values of resources made available would be more than the additional costs of
purchasing antibiotic CVCs (Figure 10).
The estimated cost-impact for a typical PICU with 350 admissions per year is shown for a range of
BSI rates in Table 21. Figure 11 shows that costs of purchasing antibiotic CVCs for all children who
require them will be less than costs of managing BSI with standard CVCs for PICUs with BSI rates
above 1.2 per 1000 bed-days. This break-even value is substantially lower than the BSI rate observed
in the standard arm of the trial (8.24; 95% CI 4.7-11.8 per 1000 bed days), or the linked dataset for
PICUs in England (4.58; 95% CI 4.42, 4.74).
76
13
1431
1432
1433
1434
1435
1436
1437
1438
1439
1440
1441
1442
1443
1444
1445
1446
1447
1448
1449
1450
1451
1452
1453
1454
1455
1456
1457
1458
1459
1460

Table 20: Parameter estimates for cost-impact analysis and sensitivity analysis Variable Base case Source Sensitivity
analysis
BSI rate using standard CVCs in 2012
4.58(95% CI 4.42-4.74)
3021 admissions in 15 PICUs:Subset of admissions identified as most likely to have received standard CVCs by applying predictive model to linked dataset. Admissions identified by survey responses as receiving non-standard (heparin or antibiotic) CVCs were excluded.
Random sample taken with replacement from linked dataset, for the number of admissions expected to require CVCs.
Rate ratio 0.40(95% CI 0.17-0.97)
Trial clinical effectiveness analyses (Table 9)
Ln* N (-0.913, 0.415)
Estimated BSI rate using antibiotic CVCs in 2012
1.83worst case = 4.29best case = 0.81
Rate-ratio from the CATCH trial applied to estimated BSI rate using standard CVCs for PICUs in England
Derived from i) BSI rate using standard CVCs and ii) rate ratio
Number of admissions requiring CVCs in 2012
8831
Average survey estimates for the percentage of emergency (60%) and elective (50%) admissions requiring CVCs, applied to all admissions in PICANet in 2012 (15,739 admissions in 23 PICUs).
Emergency: Beta(60,40)Elective:Beta(50,50)
Number of CVC days in 2012 85,971
Average CVC-days per admission in subset of admissions identified as most likely to have received standard CVCs by applying predictive model to linked dataset, multiplied by number of admissions requiring CVCs in 2012.
Random sample taken with replacement from linked dataset, for admissions expected to require CVCs.
Number of BSI averted in 2012 232
BSI rates applied to CVC-days for admissions requiring CVCs in 2012
Derived from i) number of admissions requiring CVCs in 2012 and ii) estimated BSI rate using antibiotic CVCs
Additional cost of antibiotic CVCs £36
Difference in costs between standard (£43) and antibiotic (£79) CVCs (conservative case assuming triple lumen
Fixed at £36
77
14
1461

CVCs used for all children)
Costs associated with managing each BSI
£10,975 (95% CI -£-2801 to £24,751)
CATCH trial cost-effectiveness analysis (Table 17)
N(£10,975, £7,023)
*Ln Natural logarithm
Table 21: Cost impacted analysis of managing BSIs occurring with standard versus antibiotic CVCs with best and worst case scenarios* and hypothetical scenarios for a typical PICU with 350 admissions per year
BSI per 1000 CVC-days using
standard
CVCs
Rate ratio
BSI per 1000 CVC-days using
standard CVCs
N BSI with
standard
CVCs
N BSI with
antibiotic CVCs
BSI averted **
Cost-impact
Lower limit:
Cost per BSI: -£2801
Base case:Cost per
BSI: £10,975
Upper limit:
Cost per BSI:
£24,751Base case 4.58 0.40 1.83 385.9 154.4
231.6 231.6 231.6-
£648,606£2,541,39
7£5,731,40
1Worst case 4.42 0.97 4.29 372.5 361.3 11.2 11.2 11.2
-£31,297 £122,631 £276,559Best case 4.74 0.17 0.81 399.4 67.9
331.5 331.5 331.5-
£928,583 £3,638,415£8,205,41
4Hypothetical scenarios based on a typical PICU with 350 admissions per year
1.00 0.40 0.40 3.5 1.4 3.5 3.5 3.5-£9,677 £37,919 £85,515
2.00 0.40 0.80 171.9 68.8101.1 101.1 101.1
-£283,234 £1,109,780
£2,502,795
3.00 0.40 1.20 257.9 103.2151.7 151.7 151.7
-£424,851 £1,664,671
£3,754,193
4.00 0.40 1.60 343.9 137.6202.2 202.2 202.2
-£566,468 £2,219,561
£5,005,590
5.00 0.40 2.00 429.9 171.9252.8 252.8 252.8
-£708,085 £2,774,451
£6,256,988
6.00 0.40 2.40 515.8 206.3303.4 303.4 303.4
-£849,703 £3,329,341
£7,508,385
7.00 0.40 2.80 601.8 240.7 353.9 353.9 353.9
78
15
1462
1463
1464
1465
146614671468
-£991,320 £3,884,232
£8,759,783
8.00 0.40 3.20 687.8 275.1404.5 404.5 404.5
-£1,132,9
37 £4,439,122£10,011,1
81* Best and worst case scenarios assume a total of 8831 CVCs required in PICUs in England during 2012 (based on survey responses).
** Positive values indicate the value of resources made available through averting BSI
79
16
14691470
1471

Figure 9: Risk-adjusted rates in bloodstream infection for children expected to have central venous catheters based on linked PICANet-Labbase2 data for 16 PICUs in England; symbols=observed rates; lines=smoothed adjusted rates (log-scale)
34
510
15
Rat
e pe
r 100
0 be
d-da
ys
2003q12004q1
2005q12006q1
2007q12008q1
2009q12010q1
2011q12012q1
2013q1
Quarter-year of admission
CATCH PICUs Non-participating PICUs
80
CATCH recruitment
period
17
147214731474
1475
1476
1477
1478
1479
1480
1481
1482
1483
1484
1485
1486

Figure 10: Probability distribution for the value of resources made available by averting BSI using antibiotic CVC in all PICUs in England during 2012, 90% of the distribution represented costs greater than the additional cost of purchasing antibiotic CVCs
1.0e
-04
2.0e
-04
Den
sity
-5000 0 5000 10000
Value of resources made available by averting BSI using antibiotic CVCs(£ thousands)
81
Additional cost of antibiotic CVCs
=£317,916
18
148714881489
1490
1491
1492
1493
1494
1495
1496
1497
1498
1499
1500
1501
1502
1503
1504
1505

Figure 11: Cost-impact: Number of BSI averted and value of resources made available using antibiotic in place of standard CVCs for a range of baseline rates, assuming each BSI is associated with a mean cost of £10,975
82
BSI rate using standard CVCs in all PICUs 2012
Break-even BSI rate: 1.2
19
1506
150715081509
1510
1511
1512

CHAPTER 6 DISCUSSION
Introduction
We aimed to inform NHS policy regarding impregnated CVCs for intensive care of children. In order
to address the question of whether impregnated CVCs should be adopted by PICUs in England and
Wales, we undertook a large pragmatic randomised controlled trial to determine the clinical
effectiveness and cost-effectiveness of impregnated versus standard CVCs. To determine the
implications of adopting impregnated CVCs for all children who need them, we conducted a
generalisability and cost-impact study, using linked data from two national sources.
Clinical effectiveness
The primary analysis showed no evidence of a statistically significant difference between time to first
BSI for any impregnated CVCs (antibiotic-impregnated or heparin-bonded combined) versus
standard CVCs. However, secondary analyses showed that antibiotic-impregnation reduced the risk
of BSI by 57% compared with standard CVCs, and by 58% compared with heparin-bonded CVCs.
Antibiotic-impregnated CVCs were associated with an absolute risk reduction of 2.15% compared
with standard CVCs, meaning 47 children would need to be treated with an antibiotic-impregnated
CVC instead of a standard CVC to prevent one case of BSI.
Our choice of any BSI as a clinically important primary outcome and a recognised quality indicator is
an important strength of our study, avoiding the biases inherent in measuring CR-BSI.3, 46, 88, 89 CR-BSI
requires positive cultures from the blood and catheter tip and is highly susceptible to bias, as the tip
can be easily contaminated during removal and residual antibiotic in the catheter tip may inhibit
culture in the laboratory.54, 88
A further strength of the study is the restriction to positive blood cultures that were clinically
indicated. This increased the clinical relevance of the primary outcome, but diminished the
sensitivity of the study to detect bacteraemia, as only 40% of children had a blood culture taken in
the relevant time window. A third strength is the representativeness of the study population in
terms of children admitted to the 14 largest PICUs (of 23) across the country. We were able to enrol
a similar proportion of emergency patients (two-thirds) as seen in practice, enabled by the inclusion
of retrieved children and the use of deferred consent.90
Potential limitations are firstly, the fact that clinicians inserting the CVCs could not be blinded to
allocation. However, we found no evidence of differential sampling by trial arm (Figure 1). The
83
20
1513
1514
1515
1516
1517
1518
1519
1520
1521
1522
1523
1524
1525
1526
1527
1528
1529
1530
1531
1532
1533
1534
1535
1536
1537
1538
1539
1540
1541
1542
number of children who received their allocated CVC was slightly higher for those in the standard
arm, probably reflecting the fact that standard CVCs were the default CVC used in many units.32
Secondly, due to the lower than expected BSI rate in the standard arm of the trial, we had limited
power to detect differences in the primary outcome comparing impregnated versus standard CVCs.
This choice of primary outcome was justified by the best available evidence to date – a systematic
review and meta-analysis of direct and indirect comparisons of different types of impregnated and
standard CVCs – which showed that heparin-bonded and antibiotic-impregnated CVCs resulted in
similar reductions in the risk of CR-BSI (70-80%).1Thirdly, resistance testing was not standardised
across sites. This reflects local laboratory administration and processing, which centralised testing of
all positive cultures could have mitigated. Where reported, resistance occurred in all trial arms,
predominantly in gram negative isolates, as expected. The low rates are consistent with previous
lack of evidence for the emergence of resistance.2
Few previous trials have reported the effectiveness of impregnated CVCs for any BSI.45 However, the
superiority of antibiotic-impregnated CVCs in children was consistent with the most recent
systematic review reporting a pooled odds ratio for CR-BSI of 0.18 (95% CI 0.08-0.34).1 Although our
finding of a clinically important reduction in any BSI with antibiotic-impregnated CVCs (HR 0.25;
95%CI: 0.07, 0.09; p=0.04) was based on a secondary comparison and should be viewed as
exploratory, this result does add important evidence of the overall effectiveness of antibiotic-
impregnated CVCs.
The finding that heparin CVCs were not effective for BSI or CR-BSI contradicts past evidence showing
a pooled odds ratio for CR-BSI given heparin-bonded versus standard CVCs of 0.20 (95% CI 0.06-
0.44).1 The difference in findings may reflect poor data quality in previous trials, highlighted by
systematic reviews.43-45 Only one of the three trials comparing heparin with standard CVCs reported
adequate concealment of randomisation, and this trial did not state whether clinicians were blinded
to the intervention.3 A further explanation for the discrepancy may be the low baseline event rate
observed in CATCH, which was conducted after implementation of CVC care bundles in PICUs to
improve aseptic procedures during CVC insertion and maintenance.32 It is conceivable that heparin
CVCs are most effective in the context of high rates of surface colonisation, as they prevent
thrombosis which aids organism adherence to the CVC. Finally, the pair-wise comparisons used to
determine the most effective type of impregnation were not adequately powered to detect the
anticipated small differences between antibiotic and heparin CVCs. However, our results suggest
that antibiotic-impregnated CVCs can achieve further reductions in BSI rates, over and above that
achieved by CVC care bundles.33, 34
84
21
1543
1544
1545
1546
1547
1548
1549
1550
1551
1552
1553
1554
1555
1556
1557
1558
1559
1560
1561
1562
1563
1564
1565
1566
1567
1568
1569
1570
1571
1572
1573
1574
1575

Cost-effectiveness
The incremental cost-effectiveness ratio of antibiotic-impregnated CVCs versus standard CVCs was
£54,057 per BSI averted over the 6 months after randomisation. Assuming the health impact of a BSI
is no greater (on average) than a reduction of one year of full health (i.e. one QALY), then at the
cost-effectiveness threshold of £30,000 per QALY, antibiotic CVC may not represent a cost-effective
alternative to standard CVCs in a PICU setting. However, there is considerable uncertainty
surrounding this estimate, which is driven mainly by the time horizon of analysis.
The sensitivity analysis in which costs were restricted to the index hospital stay resulted in antibiotic
CVCs dominating standard CVCs, with £97,543 saved for each BSI averted. Antibiotic CVCs therefore
appear highly cost-effective when considering events and cost accruing over comparable periods.
A secondary analysis of the CATCH trial indicated that heparin CVCs were not clinically effective with
a risk difference for first BSI of -0.17 (95% CI, -2.45, 2.12) versus standard CVCs. It follows, therefore,
that heparin CVCs cannot be cost effective by the same measure. Theoretically, a cost minimisation
analysis might apply, to assess whether heparin CVCs are less costly overall than standard CVCs.
However, heparin CVCs are more expensive than standard CVCs (in terms of unit prices), and as the
only difference among CVCs can be in BSI rates, any difference in total cost (which was not
statistically significant) was due to random variation. A CMA might therefore lead to an erroneous
conclusion that heparin CVCs are more cost-effective than standard CVCs.
Our economic evaluation benefits from being conducted alongside a pragmatic clinical trial which is
representative of current practice in the UK PICU setting. The evaluation utilises data from a
definitive and unbiased comparison of impregnated and standard CVCs, which was conducted
robustly according to accepted methods of trial-based economic evaluations.74 We used patient-
level HES data to reflect the reimbursement costs for hospitals and multiple data source to measure
hospital use in order to ensure that cost data were complete.
However, there are limitations which affect the strength of our findings. First, the CATCH trial was
not powered to determine cost differences between each of the three CVCs. As a consequence,
results are susceptible to random variation in costs between trial arms. While hypothesis testing may
be considered less relevant to decision making in the context of net benefits, the non-statistically
significant differences in costs between groups translated to uncertainty in the joint distribution of
costs and benefits such that in the base-case analysis, antibiotic CVCs had a probability of 0.35 of
dominating standard CVCs.91 Mean total costs associated with heparin CVCs were lower than both
antibiotic and standard CVCs despite their ineffectiveness in avoiding BSI when compared with
85
22
1576
1577
1578
1579
1580
1581
1582
1583
1584
1585
1586
1587
1588
1589
1590
1591
1592
1593
1594
1595
1596
1597
1598
1599
1600
1601
1602
1603
1604
1605
1606
1607

standard CVCs. Being a rare event, BSI costs were diluted in overall costs relating to the intensive
care of patients.
Second, the economic evaluation did not consider quality-adjusted life-year (QALY), which is the
standard metric for informing decisions on resource allocation. This was because estimation of
utilities in paediatric ICU populations is empirically and conceptually challenging,92, 93 and the main
long-term consequence of BSI, the long-term impact on neurological outcomes, is poorly measured
in children and was not measured in the trial. Short-term outcomes not considered in our economic
analysis include mortality, antibiotic resistance and other adverse events. However, antibiotic
resistance to minocycline or rifampicin did not differ by CVC allocation. There were no differences in
30-day mortality for antibiotic versus standard (HR 0.96; 95% CI 0.61, 1.51) or for heparin versus
standard CVC (HR 0.65; 95% CI 0.40, 1.07) and no differences in adverse events (Table 10).
Assumptions regarding the time horizon of analysis represent a third limitation. The base-case, 6-
month analysis was selected to include the costs of hospital readmissions in addition to the index
hospitalisation and transfers that may have occurred subsequently. This was intended to capture the
costs of managing any longer-term complications from BSI, but as the economic outcome was
chosen to align with the primary clinical outcome, the health impacts of these complications were
not included in the ICER. Consequently, as costs accrue over time with no corresponding change to
the number of BSI (these all occurred within 30 days), the ICER continued to increase over time.
Our findings are consistent with other studies in the estimation of the costs associated with the
management of BSI, however our ICER differs considerably, and is inconclusive with regards to
determining the cost-effectiveness of antibiotic CVCs. Published economic evaluations, including
those which adopted a lifetime horizon of analysis, suggest dominance of antibiotic-impregnated
CVCs over standard CVCs. One explanation for this discrepancy is in the methods of analysis. A
decision analytic model, based on a synthesis of data from various sources is fundamentally different
from a prospective RCT in which differences between intervention groups are less evident,
particularly in the context of rare events such as BSI. In the evaluation by Hockenhull et al. for
instance, the incremental cost saving of £138.20 per patient receiving an impregnated CVC was
calculated as the additional cost of the antibiotic CVC less the expected cost per patient of managing
excess BSI.29 The equivalent calculation based on CATCH data for antibiotic CVCs results in a value of
£200.08 saved for each antibiotic CVC used {= (£78.28 – £42.91) - £10,975 x 2.15%}. Extending this
further, to calculate the ICER, gives a value of £9,326 saved per BSI averted {= £200.08 / 2.15%},
which differs appreciably from our base-case result. However, by analysing the data as a cohort
86
23
1608
1609
1610
1611
1612
1613
1614
1615
1616
1617
1618
1619
1620
1621
1622
1623
1624
1625
1626
1627
1628
1629
1630
1631
1632
1633
1634
1635
1636
1637
1638
1639

study, separating the apparent costs of BSI from the total costs relating to each intervention group,
biases are likely to arise from assuming that the cost of managing BSIs is independent of CVC type.
In conclusion, the results of the cost-effectiveness analysis indicate a policy of replacing standard
CVCs with antibiotic-impregnated CVCs in paediatric ICUs will be more beneficial in terms of fewer
patients developing BSI. Given the low BSI rate, the variation in costs between arms and the
sensitivity of analyses to the specified time-horizon, there remains considerable uncertainty as to
whether use of antibiotic CVCs represents a cost-effective use of NHS resources.
Generalisability and cost-impact
We explored the generalisability of CATCH trial results and the cost-impact of changing practice in
PICUs across England based on the trial results. In terms of generalisability, observed rates of BSI
using standard CVCs declined steadily over the past decade, including the period when children were
enrolled into the CATCH trial.34, 94 In addition, children participating in CATCH had a higher risk of BSI
than all children receiving CVCs in practice, as they were expected to require a CVC for 3 or more
days. This means that children currently receiving CVCs in PICU are likely to have a lower BSI risk
than those participating in the trial. This was reflected in the higher rate of BSI observed in the
standard arm of the trial (8.24 per 1000 bed days) compared with linked administrative data from 16
PICUs in England for 2012 (4.58 per 1000 bed days, Figure 9).
In terms of budget-impact, antibiotic CVCs are more expensive than standard CVCs. If adopted in
PICU, antibiotic CVCs would likely be bulk-purchased for all children (including those with a lower
risk of BSI than those participating in the trial). By estimating the number of BSI potentially averted
using antibiotic CVCs for all children (including those with low risk of BSI), we showed that the
additional cost of purchasing antibiotic CVCs is less than the value of resources associated with
managing excess BSIs associated with using standard CVCs.A limitation of this study was that
estimated BSI rates using standard CVCs relied on a predictive model for identifying children most
likely to have required CVCs. Another limitation was the possible error in estimating CVC-days: we
assumed that for children in the linked dataset likely to have required CVCs, CVCs would remain in
place for the entire PICU stay. There is no clear direction of bias as we may have over- or under-
estimated CVC-days, but our assumptions are reasonable based on the subset of CATCH participants.
Finally, we relied on survey responses to estimate the number of CVCs required in PICU, but we
addressed this and uncertainty in other parameter estimate by performing sensitivity analyses.95, 96
The generalisability of RCT results can be assessed by accounting for differences in subgroup
treatment effects, e.g. by re-weighting treatment effects based on population distributions.97, 98 In
87
24
1640
1641
1642
1643
1644
1645
1646
1647
1648
1649
1650
1651
1652
1653
1654
1655
1656
1657
1658
1659
1660
1661
1662
1663
1664
1665
1666
1667
1668
1669
1670
1671

CATCH, the event rate was low and there was limited power to assess variation in the treatment
effect according to the duration of CVC. However, due to the nature of the intervention, we assumed
that the treatment effect would be constant across groups and would be the same in children who
were not enrolled into the trial, as there was no a priori reason for an interaction.
Our results suggest that the benefits of using impregnated CVCs apply even for PICUs with BSI rates
as low as 1.2 per 1000 CVC-days. These finding are consistent with systematic review evidence on
the cost-effectiveness of impregnated CVCs in adults, which indicates that implementation of
impregnated CVCs would be cost-effective for a range of relative risks and for baseline incidence of
CR-BSI as low as 0.2%.29 CATCH is the first trial to assess the effectiveness of antibiotic-impregnated
versus standard CVCs in children, and our results adds to strong evidence of effectiveness in adults.
Furthermore, as our cost estimates only consider use of hospital resources, the true cost of BSI and
the benefits of antibiotic CVCs may be even greater when longer term outcomes of BSI are taken
into account.
Other conclusions
Deferred consent
There is a growing recognition of the need for better evidence in paediatric settings, as evidence in
adults cannot always be safely extrapolated to children.99, 100 However, achieving informed consent in
emergency paediatric settings is complicated by the stressful situation and the need to avoid any
delay in treatment.55, 101 As CATCH was one of the first UK studies to use deferred consent in children,
there was a lack of evidence on which to make decisions about the design and conduct of this aspect
of the trial.102, 103 Our experience of deferred consent in CATCH could help to inform future studies.
In CATCH, deferred consent was obtained from 84% of families who were approached.61 The use of
deferred consent allowed us to recruit emergency admissions, reach the target sample size within
the available funding, and provide results that are convincing to clinicians working in the emergency
setting. Participation in CATCH after the intervention had taken place represented minimal burden to
children (use of data already collected and follow-up data collection only). However, a proportion of
parents chose not to consent, due to a perceived burden on the child. Ongoing in-depth research as
part of the CONNECT study may help to explain further the experiences and choices of parents of
children involved in CATCH.55, 104
One of the main concerns relating to deferred consent in CATCH was whether the decision to
consent was related to the child’s outcome. The ethics committee recommended not approaching
families whose child had been discharged or transferred before the original approach for consent
88
25
1672
1673
1674
1675
1676
1677
1678
1679
1680
1681
1682
1683
1684
1685
1686
1687
1688
1689
1690
1691
1692
1693
1694
1695
1696
1697
1698
1699
1700
1701
1702
1703

could be made. Inclusion rates were also lower in the group of children who died. Although there
were no deaths related to the type of CVC in CATCH, the low rate of consent for children who died
could bias the validity of comparisons between treatment arm and outcomes, including adverse
events. We propose that in future, ethics committees allow use of linked administrative records
without consent, where reasonable efforts to obtain consent have been made or are not feasible or
considered to be harmful.61
There is still uncertainty about the most appropriate ways to approach bereaved parents of children
randomised in an emergency.105 Our experience with CATCH highlights that further in-depth research
should be incorporated into design of emergency trials involving populations with high mortality
rates.106, 107
Co-enrolment
Another challenge to improving evidence in paediatric settings is the limited population of children
who can be recruited into trials. CATCH was the largest RCT conducted in paediatric intensive care to
date, and overlapped with the second largest RCT (the CHiP trial), which recruited 1369 children in
13 centres.108 Allowing co-enrolment into several trials at the same time can potentially enable
efficient recruitment of children and has been successful in particular settings, e.g. for evaluating
AIDS treatments.88, 90, 109, 110 Aside from statistical concerns, perceived burden to the child, ethics
requirements and stress of recruiting into multiple trials are barriers to co-enrolment.111-114
Of five PICUs with the opportunity to recruit simultaneously to both CATCH and CHiP, only two units
decided to allow co-enrolment. Of the remaining three units, one delayed recruitment of elective
patients for CATCH until CHiP had closed, resulting in a loss of six recruiting weeks. Reasons provided
for not allowing co-enrolment related to concerns about jeopardising recruitment targets for the
earlier trial, asking too much of parents due to overwhelming amounts of information for two trials,
and the stressful situation of intensive care.112
On the other hand, we found that parents were accepting of co-enrolment: recruitment rates at the
same PICU were similar whether parents were approached for a single study (78% for CATCH; 51%
for CHiP) or both studies (82% for CATCH; 51% for CHiP). Concerns of the PICUs were therefore not
supported by evidence on parental decisions.115, 116
Our experience with CATCH highlighted that co-enrolment can be successful and acceptable, but
that barriers to co-enrolment remain. Decisions on the appropriateness of co-enrolment need to
take into account potential impact on results, interaction between therapies, safety, and internal
89
26
1704
1705
1706
1707
1708
1709
1710
1711
1712
1713
1714
1715
1716
1717
1718
1719
1720
1721
1722
1723
1724
1725
1726
1727
1728
1729
1730
1731
1732
1733
1734

and external validity. Strategies that allow increasing research capacity whilst minimising burden on
patients and parents should continue to be developed.
Administrative / electronic healthcare data to support RCTs
This study provides a convincing example of how administrative and electronic healthcare data can
be used to support and enhance RCTs.117 It would not have been possible to provide such
comprehensive information relating to the use of impregnated CVCs without the use of
administrative data, which contributed to all three aspects of the study:
1) Clinical effectiveness: trial participant data were linked with i) mortality data from the Office
for National Statistics to allow evaluation of deaths within 30 days of randomisation; ii)
PICANet data 56 to ascertain the primary diagnosis at admission and the Paediatric Index of
Mortality score (PIM2).
2) Cost-effectiveness: Hospital Episode Statistics (HES) and PICANet data were used to estimate
hospital, ICU and HDU costs up to 6 months after randomisation.
3) Generalisability and cost-impact: PICANet data linked with national laboratory surveillance
data were used to estimate rates of BSI outside of the trial setting.
There are other areas in which administrative and electronic healthcare data could be used to
enhance and support RCTs.117 Firstly, in terms of capturing outcomes, we used administrative data
up to six months post-randomisation. Ongoing linkage with administrative data could be useful to
many RCTs for capturing further long-term outcomes and safety measures.118
Secondly, the sample size calculation in CATCH was based upon audit data from several PICUs prior
to the trial. If PICANet and infection surveillance data had been linked prior to the study, even more
accurate event rates, taking into account the context of decreasing BSI rates, could have been made.
Using administrative data to identify variation in care across services and to aid site selection will
lead to more well-designed trials that are likely to meet targets and provide evidence more quickly.
Thirdly, we used administrative data collected during the trial period to assess the generalisability of
trial participants and to identify the population for whom impregnated CVCs may be purchased. This
could be extended post-trial, by monitoring the scaling-up of effective interventions and for
continued study of the safety and efficacy of new medicines and devices.
Barriers to realising the full potential for integrating administrative data into RCTs include concerns
about data quality, regulatory compliance, and ethical issues relating to consent for data linkage.
Decisions on the appropriateness of using administrative data should be made on a trial-to-trial
90
27
1735
1736
1737
1738
1739
1740
1741
1742
1743
1744
1745
1746
1747
1748
1749
1750
1751
1752
1753
1754
1755
1756
1757
1758
1759
1760
1761
1762
1763
1764
1765

basis. However, administrative data provides an opportunity to efficiently investigate short and long-
term effectiveness in real healthcare setting, to assess the broader impact of treatments across the
NHS, and to provide evidence on interventions to help implement improved treatments quickly for
those who would benefit most. The potential to improve quality and decrease the burden and cost
of RCTs is particularly important for the paediatric setting.99, 119, 120
Implications for practice
Our findings establish the effectiveness of antibiotic-impregnated CVCs compared with standard
CVCs for use in children. For the first time, we directly demonstrate that antibiotic-impregnated
CVCs are effective compared with heparin-bonded CVCs in this population. Use of impregnated CVCs
for children admitted to PICUs could result in clinically important reductions in BSI rates. The
benefits of antibiotic-impregnated CVCs apply even for low BSI rates and outweigh the current price
differential between impregnated and standard CVCs. However, uncertainty remains as to whether
antibiotic-impregnated CVCs represent a cost-effective use of NHS resources; careful monitoring of
implementation would help to build up further evidence.
Recommendations for future research
Implementation strategies to promote adoption of impregnated CVCs across the NHS should be
developed and could be monitored through continued linkage of electronic healthcare data and
information on PICU practice. Such monitoring could allow routine feedback to PICUs and could be
enhanced by routine capture of CVC insertion and removal dates in hospital records.
We do not recommend any further trials of antibiotic-impregnated or heparin-bonded CVCs versus
standard CVCs for children or adults in intensive care. However, further trials could be justified to
determine whether antibiotic CVCs would be similarly effective in preterm neonates (for whom
smaller line sizes are required, with potentially different mechanisms for BSI) or in those with long-
term CVCs (to determine whether the effect of impregnation remains for longer periods). The NHS
should work with industry to evaluate different types of impregnation for specific patient groups.
Use of linked administrative data should be considered for future trials of interventions in contexts
where outcomes are likely to change substantially over the lifetime of the trial, and to monitor
implementation of effective interventions.117
91
28
1766
1767
1768
1769
1770
1771
1772
1773
1774
1775
1776
1777
1778
1779
1780
1781
1782
1783
1784
1785
1786
1787
1788
1789
1790
1791
1792
1793
1794

REFERENCES1. Wang, H., et al., Effectiveness of different central venous catheters for catheter-related
infections: a network meta-analysis. J Hosp Infect, 2010. 76(1): p. 1-11.2. Falagas, M.E., et al., Rifampicin-impregnated central venous catheters: a meta-analysis of
randomized controlled trials. J Antimicrob Chemoth, 2007. 59(3): p. 359-369.3. Gilbert, R. and M. Harden, Effectiveness of impregnated central venous catheters for
catheter related blood stream infection: a systematic review. Curr Opin Infect Dis, 2008. 21(3): p. 235-245.
4. O'Grady, N., et al., Guidelines for the prevention of intravascular catheter-related infections. Am Acad Pediatr Policy, 2002. 110(5): p. e51-e74.
5. Pellowe, C., et al., The epic project. Updating the evidence-base for national evidence-based guidelines for preventing healthcare-associated infections in NHS hospitals in England: a report with recommendations. J Hosp Infect, 2005. 5(6): p. 10.
6. Raad, I., H. Hanna, and D. Maki, Intravascular catheter-related infections: advances in diagnosis, prevention, and management. Lancet Infect Dis, 2007. 7(10): p. 645-657.
7. Costello, J., et al., Risk factors for central line-associated bloodstream infection in a pediatric cardiac intensive care unit. Pediatr Crit Care Med, 2009. 10(4): p. 453-9.
8. Mello, M., et al., Risk factors for healthcare-associated infection in pediatric intensive care units: a systematic review. Cadernos de Saúde Pública, 2009. 25: p. 373-391.
9. Milstone, A.M. and A. Sengupta, Do prolonged peripherally inserted central venous catheter dwell times increase the risk of bloodstream infection? Infect Control Hosp Epidemiol, 2010. 31(11): p. 1184-1187.
10. Niedner, M.F., et al., Epidemiology of central line-associated bloodstream infections in the pediatric intensive care unit. Infect Control Hosp Epidemiol, 2011. 32(12): p. 1200.
11. Wylie, M.C., et al., Risk factors for central line–associated bloodstream infection in pediatric intensive care units. Infect Control Hosp Epidemiol, 2010. 31(10): p. 1049-1056.
12. Bhutta, A., et al., Reduction of bloodstream infections associated with catheters in paediatric intensive care unit: stepwise approach. BMJ, 2007. 334(7589): p. 362-365.
13. Miller, M.R., et al., Decreasing PICU catheter-associated bloodstream infections: NACHRI's quality transformation efforts. Pediatrics, 2010. 125(2): p. 206-213.
14. Pronovost, P., et al., Sustaining reductions in catheter related bloodstream infections in Michigan intensive care units: observational study. BMJ, 2010. 340(feb04 1): p. c309.
15. Bion, J., et al., ‘Matching Michigan’: a 2-year stepped interventional programme to minimise central venous catheter-blood stream infections in intensive care units in England. BMJ Qual Saf, 2012. 22(2): p. 110-23.
16. Department of Health, Saving Lives: reducing infection, delivering clean and safe care. 2007, Department of Health, London
17. Jeong, I.S., et al., Effect of central line bundle on central line-associated bloodstream infections in intensive care units. Am J Infec Control, 2013. 41(8): p. 710-716.
18. Pronovost, P., et al., An intervention to decrease catheter-related bloodstream infections in the ICU. New Engl J Med, 2006. 355(26): p. 2725-2732.
19. Reddy, K.K., et al., Reducing central line-associated bloodstream infections in three ICUs at a tertiary care hospital in the United Arab Emirates. Jt Comm J Qual Patient Saf, 2014. 40(12).
20. Zuschneid, I., et al., Reducing central venous catheter-associated primary bloodstream infections in intensive care units is possible: data from the German nosocomial infection surveillance system. Infect Control Hosp Epidemiol, 2003. 24(7): p. 501-505.
21. Abou Elella, R., et al., Impact of bloodstream infection on the outcome of children undergoing cardiac surgery. Pediatr Cardiol, 2010. 31(4): p. 483-489.
92
17951796179717981799180018011802180318041805180618071808180918101811181218131814181518161817181818191820182118221823182418251826182718281829183018311832183318341835183618371838183918401841184218431844

22. Elward AM, et al., Attributable cost of nosocomial primary bloodstream infection in pediatric intensive care unit patients. Pediatrics, 2005. 115(4): p. 868-872.
23. Lakshmi, K.S., et al., Study of nosocomial primary bloodstream infections in a Pediatric Intensive Care Unit. J Trop Pediatr, 2007. 53(2): p. 87-92.
24. Yogaraj JS, Elward AM, and Fraser VJ, Rate, risk factors, and outcomes of nosocomial primary bloodstream infection in pediatric intensive care unit patients. Pediatrics, 2002. 110(3): p. 481-485.
25. Dominguez, T.E., R. Chalom, and A.T.J. Costarino, The impact of adverse patient occurrences on hospital costs in the pediatric intensive care unit. Crit Care Med, 2001. 29(1): p. 169-174.
26. Nowak, J.E., et al., Reducing catheter-associated bloodstream infections in the pediatric intensive care unit: Business case for quality improvement. Pediatr Crit Care Med, 2010. 11(5): p. 579-587.
27. Slonim, A.D., et al., The costs associated with nosocomial bloodstream infections in the pediatric intensive care unit. Pediatr Crit Care Med, 2001. 2(2): p. 170-174.
28. Health Protection Agency, English national point prevalence survey on healthcare-associated infections and antimicrobial use, 2011. 2012, www.gov.uk/government/publications/healthcare-associated-infections-hcai-point-prevalence-survey-england (Accessed 06/10/14).
29. Hockenhull, J., et al., The clinical effectiveness and cost-effectiveness of central venous catheters treated with anti-infective agents in preventing bloodstream infections: a systematic review and economic evaluation. Health Technol Asses, 2008. 12(12): p. 1-154.
30. Lai, N.M., et al., Catheter impregnation, coating or bonding for reducing central venous catheter-related infections in adults. Cochrane Database Syst Rev, 2013. 6: p. CD007878.
31. Gilbert R, et al., Impregnated central venous catheters should be readily used to reduce risk of bloodstream infection. BMJ, 2013. 347.
32. Harron, K., et al., Consistency between guidelines and reported practice for reducing the risk of catheter-related infection in British paediatric intensive care units. Intens Care Med, 2011. 37(10): p. 1641-1647.
33. Harron K, et al., Risk-adjusted monitoring of blood-stream infection in paediatric intensive care: a data linkage study. Intens Care Med, 2013. 39(6): p. 1080-1087.
34. Harron, K., et al., Monitoring quality of care through linkage of administrative data: national trends in bloodstream infection in UK paediatric intensive care units 2003-2012. Crit Care Med, 2015. 43(5): p. 1070-78.
35. Chatzinikolaou, I., et al., Antibiotic-coated hemodialysis catheters for the prevention of vascular catheter–related infections: a prospective, randomized study. Am J Med, 2003. 115(5): p. 352-357.
36. Cox, E.G., et al., A randomized, controlled trial of catheter-related infectious event rates using antibiotic-impregnated catheters versus conventional catheters in pediatric cardiovascular surgery patients. Pediatr Infect Dis J, 2012.
37. Darouiche, R.O., et al., Comparison of antimicrobial impregnation with tunneling of long-term central venous catheters: a randomized controlled trial. Ann Surg, 2005. 242(2): p. 193.
38. Hanna, H., et al., Long-term silicone central venous catheters impregnated with minocycline and rifampin decrease rates of catheter-related bloodstream infection in cancer patients: a prospective randomized clinical trial. J Clin Oncol, 2004. 22(15): p. 3163-3171.
39. León, C., et al., Benefits of minocycline and rifampin-impregnated central venous catheters. Intens Care Med, 2004. 30(10): p. 1891-1899.
40. Marik, P.E., et al., The ex vivo antimicrobial activity and colonization rate of two antimicrobial-bonded central venous catheters. Critic Care Med, 1999. 27(6): p. 1128-1131.
93
18451846184718481849185018511852185318541855185618571858185918601861186218631864186518661867186818691870187118721873187418751876187718781879188018811882188318841885188618871888188918901891189218931894189518961897

41. Raad, I., et al., Central venous catheters coated with minocycline and rifampin for the prevention of catheter-related colonization and bloodstream infectionsa randomized, double-blind trial. Ann Intern Med, 1997. 127(4): p. 267-274.
42. Yücel, N., et al., Reduced colonization and infection with miconazole–rifampicin modified central venous catheters: a randomized controlled clinical trial. J Antimicrob Chemoth, 2004. 54(6): p. 1109-1115.
43. Abdelkefi, A., et al., Use of heparin-coated central venous lines to prevent catheter-related bloodstream infection. J Support Oncol, 2007. 5(6): p. 273-278.
44. Appelgren, P., et al., Surface heparinization of central venous catheters reduces microbial colonization in vitro and in vivo: results from a prospective, randomized trial. Crit Care Med, 1996. 24(9): p. 1482-1489.
45. Pierce, C.M., A. Wade, and Q. Mok, Heparin-bonded central venous lines reduce thrombotic and infective complications in critically ill children. Intens Care Med, 2000. 26(7): p. 967-972.
46. Geffers, C., et al., The relationship between methodological trial quality and the effects of impregnated central venous catheters. Intens Care Med, 2003. 29(3): p. 403-409.
47. Niel-Weise, B., T. Stijnen, and P. Van den Broek, Anti-infective-treated central venous catheters for total parenteral nutrition or chemotherapy: a systematic review. J Hosp Infect, 2008. 69(2): p. 114-123.
48. Mok, Q. and R. Gilbert, Interventions to reduce central venous catheter-associated infections in children: which ones are beneficial? Intens Care Med, 2011. 37(4): p. 566-568.
49. Mermel, L., Prevention of intravascular catheter–related infections. Ann Intern Med, 2000. 132(5): p. 391-402.
50. Barnett, A.G., et al., Using a longitudinal model to estimate the effect of Methicillin-resistant Staphylococcus aureus infection on length of stay in an intensive care unit. Am J Epidemiol, 2009. 170(9): p. 1186-1194.
51. Graves, N., et al., Estimating the cost of health care-associated infections: mind your p's and q's. Clin Infect Dis, 2010. 50(7): p. 1017-1021.
52. Halton, K. and N. Graves, Economic evaluation and catheter-related bloodstream infections. Emerging infectious diseases, 2007. 13(6): p. 815-823.
53. Cook Incorporated, Cook Spectrum® Central Venous Catheter Minocycline/Rifampin ANtibiotic Impregnated Power Injectable. 2013.
54. Mermel, L.A., S.M. Stolz, and D.G. Maki, Surface antimicrobial activity of heparin-bonded and antiseptic-impregnated vascular catheters. J Infect Dis, 1993. 167(4): p. 920-924.
55. Woolfall, K., et al., How experience makes a difference: practitioners' views on the use of deferred consent in paediatric and neonatal emergency care trials. BMC Med Ethics, 2013. 14(1): p. 45.
56. Paediatric Intensive Care Audit Network: A Decade of Data 2014, Universities of Leeds and Leicester.
57. Slater, A., F. Shann, and G. Pearson, PIM2: a revised version of the Paediatric Index of Mortality. Intens Care Med, 2003. 29(2): p. 278-285.
58. SAS software Version 9.3, SAS Institute Inc. 2002-2010: Cary, NC, USA 59. Gray, R.J., A class of K-sample tests for comparing the cumulative incidence of a competing
risk. Ann Stat, 1988. 16(3): p. 1141-1154.60. R Core Team, R: A language and environment for statistical computing. R Foundation for
Statistical Computing, Vienna, Austria. ISBN 3-900051-07-0. 2013.61. Harron, K., et al., Deferred consent for randomized controlled trials in emergency care
settings Pediatrics, 2015. in press.62. Halton, K.A., et al., Cost effectiveness of antimicrobial catheters in the intensive care unit:
addressing uncertainty in the decision. Crit Care, 2009. 13(2): p. R35.63. Frank, U., et al., Cost-effectiveness of an antiseptic-impregnated central venous catheter in
the ICU. Intens Care Med, 2003. 29(1): p. 139.
94
18981899190019011902190319041905190619071908190919101911191219131914191519161917191819191920192119221923192419251926192719281929193019311932193319341935193619371938193919401941194219431944194519461947194819491950

64. Marciante, K.D., et al., Which antimicrobial impregnated central venous catheter should we use? Modeling the costs and outcomes of antimicrobial catheter use. Am J Infect Control, 2003. 31(1): p. 1-8.
65. Shorr, A.F., C.W. Humphreys, and D.L. Helman, New choices for central venous catheters: potential financial implications. Chest, 2003. 124(1): p. 275-84.
66. Veenstra, D.L., S. Saint, and S.D. Sullivan, Cost-effectiveness of antiseptic-impregnated central venous catheters for the prevention of catheter-related bloodstream infection. JAMA, 1999. 282(6): p. 554-60.
67. Goudie, A., et al., Attributable cost and length of stay for central line-associated bloodstream infections. Pediatrics, 2014. 133(6): p. e1525-32.
68. Wilson, M.Z., et al., Attributable costs of central line-associated bloodstream infections in a pediatric hematology/oncology population. Am J Infect Control, 2014. 42(11): p. 1157-60.
69. Health & Social Care Information Centre. Data Linkage & Extract Service [cited 2014 8th June]; Available from: http://www.hscic.gov.uk/dles.
70. National Schedule of Reference Costs 2012-13. [cited 2014 8th June]; Available from: https://www.gov.uk/government/publications/nhs-reference-costs-2012-to-2013.
71. 2012-2013, N.T. [cited 2014 8th June]; Available from: https://www.gov.uk/government/publications/confirmation-of-payment-by-results-pbr-arrangements-for-2012-13
72. Fenwick, E., K. Claxton, and M. Sculpher, Representing uncertainty: the role of cost-effectiveness acceptability curves. Health Econ, 2001. 10(8): p. 779-87.
73. Mihaylova, B., et al., Review of statistical methods for analysing healthcare resources and costs. Health Econ, 2011. 20(8): p. 897-916.
74. Glick HA, D.J., Sonnad AA, Polsky D, Economic evaluaton in clinical trials. 2007, Oxford: Oxford University Press
75. Husereau, D., et al., Consolidated Health Economic Evaluation Reporting Standards (CHEERS) statement BMJ, 2013. 346: p. f1049.
76. Braunholtz, D.A., S.J. Edwards, and R.J. Lilford, Are randomized clinical trials good for us (in the short term)? Evidence for a “trial effect”. J Clin Epidemiol, 2001. 54(3): p. 217-224.
77. Harron, K., et al., Linkage, evaluation and analysis of national electronic healthcare data: application to providing enhanced blood-stream infection surveillance in paediatric intensive care. PLoS One, 2013. 8(12): p. e85278.
78. Wilson J, et al., Trends among pathogens reported as causing bacteraemia in England, 2004–2008. Clin Microbiol Infect, 2011. 17(3): p. 451-8.
79. Goldstein, H., K. Harron, and A. Wade, The analysis of record-linked data using multiple imputation with data value priors. Stat Med, 2012. 31(28): p. 3481-93.
80. Harron, K., et al., Evaluating bias due to data linkage error in electronic healthcare records. BMC Med Res Methodol, 2014. 14(1): p. 36.
81. Rubin, D., Multiple imputation for nonresponse in surveys. 1987, New York: Wiley.82. Harron, K., Evaluating data linkage techniques for the analysis of bloodstream infection in
paediatric intensive care. 2014, University College London.83. Steyerberg, E.W., et al., Internal validation of predictive models: efficiency of some
procedures for logistic regression analysis. J Clin Epidemiol, 2001. 54(8): p. 774-781.84. Steyerberg, E.W., et al., Prognostic modeling with logistic regression analysis: in search of
a sensible strategy in small data sets. Med Decis Making, 2001. 21(1): p. 45-56.85. Harrell, F., K.L. Lee, and D.B. Mark, Tutorial in biostatistics multivariable prognostic
models: issues in developing models, evaluating assumptions and adequacy, and measuring and reducing errors. Stat Med, 1996. 15: p. 361-387.
86. Fluss, R., D. Faraggi, and B. Reiser, Estimation of the Youden Index and its associated cutoff point. Biom J, 2005. 47(4): p. 458-472.
87. O’Hagan, A., et al., Incorporation of uncertainty in health economic modelling studies. Pharmacoeconomics, 2005. 23(6): p. 529-536.
95
19511952195319541955195619571958195919601961196219631964196519661967196819691970197119721973197419751976197719781979198019811982198319841985198619871988198919901991199219931994199519961997199819992000200120022003
88. Angus, D.C., J.P. Mira, and J.L. Vincent, Improving clinical trials in the critically ill. Crit Care Med, 2010. 38(2): p. 527.
89. Schierholz, J., et al., The antimicrobial efficacy of a new central venous catheter with long-term broad-spectrum activity. J Antimicrob Chemoth, 2000. 46(1): p. 45-50.
90. Dondorp, A.M., et al., Artesunate versus quinine in the treatment of severe falciparum malaria in African children (AQUAMAT): an open-label, randomised trial. Lancet, 2010. 376(9753): p. 1647-1657.
91. Claxton, K., The irrelevance of inference: a decision-making approach to the stochastic evaluation of health care technologies. J Health Econ, 1999. 18(3): p. 341-64.
92. Kerren, R., Pati S, Feudtner C., The generation gap; difference between children and adults pertinent to economic evaluations of health interventions. Pharmacoeconomics, 2004. 22: p. 71-81.
93. Tarride JE, B.N., Bischof M, Hopkins RB, Goeree L, Campbell K, Xie F, O'Reilly D, Goeree R, A review of health utilities across conditions common in paediatric and adult populations. Health and Quality of Life Outcomes 2010. 8.
94. Harron, K., et al., Risk of bloodstream infection in children admitted to paediatric intensive care units in England and Wales following emergency inter-hospital transfer. Intens Care Med, 2014. (in press).
95. Briggs, A., Probabilistic analysis of cost-effectiveness models: statistical representation of parameter uncertainty. Value Health, 2005. 8(1): p. 1-2.
96. Claxton, K., et al., Probabilistic sensitivity analysis for NICE technology assessment: not an optional extra. Health Econ, 2005. 14(4): p. 339-347.
97. Cole, S.R. and E.A. Stuart, Generalizing evidence from randomized clinical trials to target populations: The ACTG 320 Trial. Am J Epidemiol, 2010. 172(1): p. 107-115.
98. Stuart, E.A., et al., The use of propensity scores to assess the generalizability of results from randomized trials. J R Stat Soc Ser A Stat Soc, 2011. 174(2): p. 369-386.
99. Junker, A. and T. Klassen, Improving standards for paediatric clinical trials. Paed Child Healt - Can, 2011. 16(9): p. 539.
100. Hartling, L., et al., StaR Child Health: Developing evidence-based guidance for the design, conduct, and reporting of pediatric trials. Pediatrics, 2012. 129(Supplement 3): p. S112-S117.
101. Gamble, C., et al., What parents of children who have received emergency care think about deferring consent in randomised trials of emergency treatments: postal survey. PLoS One, 2012. 7(5): p. e35982.
102. Molyneux, S., et al., ‘The Words Will Pass with the Blowing Wind’: Staff and parent views of the deferred consent process, with prior assent, used in an emergency fluids trial in two african hospitals. PLoS One, 2013. 8(2): p. e54894.
103. Brierley, J. and V. Larcher, Emergency research in children: options for ethical recruitment. J Med Ethics, 2011. 37(7): p. 429-432.
104. Woolfall, K., et al., Doing challenging research studies in a patient-centred way: a qualitative study to inform a randomised controlled trial in the paediatric emergency care setting. BMJ Open, 2014. 4(5).
105. Jansen, T., et al., Deferred consent in emergency intensive care research: what if the patient dies early? Use the data or not? Intens Care Med, 2007. 33(5): p. 894-900.
106. Davies, H., et al., Guide to the design and review of emergency research when it is proposed that consent and consultation be waived. Emerg Med J, 2014. 0: p. 1-2.
107. Maitland, K., et al., Use of deferred consent for severely ill children in a multi-centre phase III trial. Trials, 2011. 12(1): p. 90.
108. Macrae, D., et al., A randomized trial of hyperglycemic control in pediatric intensive care. New Engl J Med, 2014. 370(2): p. 107-118.
109. Ellenberg, S.S., D.M. Finkelstein, and D.A. Schoenfeld, Statistical issues arising in AIDS clinical trials. JAMA, 1992: p. 562-569.
110. Maitland, K., et al., Mortality after fluid bolus in African children with severe infection. New Engl J Med, 2011.
96
200420052006200720082009201020112012201320142015201620172018201920202021202220232024202520262027202820292030203120322033203420352036203720382039204020412042204320442045204620472048204920502051205220532054205520562057

111. Cook, D.J., et al., Enrollment of intensive care unit patients into clinical studies: A trinational survey of researchers' experiences, beliefs, and practices*. Crit Care Med, 2008. 36(7): p. 2100.
112. Harron, K., et al., Making co-enrolment feasible for randomised controlled trials in Paediatric Intensive Care. PLoS One, 2012. 7(8): p. e41791.
113. Myles, P.S., et al., Ethical and scientific considerations for patient enrollment into concurrent clinical trials. Trials, 2014. 15(1): p. 470.
114. Shilling, V., et al., Communication about children's clinical trials as observed and experienced: qualitative study of parents and practitioners. PLoS One, 2011. 6(7): p. e21604.
115. Burgess, E., et al., Consent for clinical research in the neonatal intensive care unit: a retrospective survey and a prospective study. Arch Dis Child Fetal Neonatal Ed, 2003. 88(4): p. F280.
116. Morley, C., et al., What do parents think about enrolling their premature babies in several research studies? Arch Dis Child Fetal Neonatal Ed, 2005. 90(3): p. F225.
117. Harron K, Gamble C, and Gilbert R, E-health data to support and enhance randomised controlled trials in the UK. Clinical Trials, 2014. (online first).
118. Ford, I., et al., Long-term follow-up of the West of Scotland Coronary Prevention Study. New Engl J Med, 2007. 357(15): p. 1477-1486.
119. Rawlins, A new pathway for the regulation and governance of health research. The Academy of Medical Sciences, 2011. . Available: http://www.acmedsci.ac.uk/p47prid88.html. Accessed 15 June 2012.
120. Stephenson, T., The medicines for children agenda in the UK. Brit J Clin Pharmaco, 2006. 61(6): p. 716-719.
97
205820592060206120622063206420652066206720682069207020712072207320742075207620772078207920802081
2082
2083
2084
2085
Related Documents