GU‐HARD‐PL02 2012 1 Final Project Report Project Title: High Altitude Radiation Detector (GU‐HARD‐PL02) Institution: Gannon University Contact Author: Dr. Wookwon Lee Dept. of Electrical and Computer Engineering Gannon University 109 University Square, Erie, PA 16541 Email: [email protected] Project Duration: 01/01/2012 – 12/14/2012 Date submitted: 12/14/2012

Welcome message from author
This document is posted to help you gain knowledge. Please leave a comment to let me know what you think about it! Share it to your friends and learn new things together.
Transcript

GU‐HARD‐PL02 2012
1
Final Project Report
Project Title: High Altitude Radiation Detector (GU‐HARD‐PL02)
Institution: Gannon University
Contact Author: Dr. Wookwon Lee
Dept. of Electrical and Computer Engineering
Gannon University
109 University Square, Erie, PA 16541
Email: [email protected]
Project Duration: 01/01/2012 – 12/14/2012
Date submitted: 12/14/2012

GU‐HARD‐PL02 2012
2
Table of Contents 1. Highlights of the Project ....................................................................................................................... 4
2. Payload Subsystems .............................................................................................................................. 5
2.1. Detector Module ........................................................................................................................... 6
2.2. Comparator Module ..................................................................................................................... 7
2.3. Coincidence Detector .................................................................................................................... 7
2.4. Microprocessor/CPU ..................................................................................................................... 8
2.5. Power Module ............................................................................................................................... 9
3. Numerical Results and Discussions ....................................................................................................... 9
3.1. Lab Testing Data – Detector and Comparator Modules ............................................................... 9
3.2. In‐Flight Experimental Data ........................................................................................................ 10
4. Failure Mode and Effect Analysis ........................................................................................................ 13
5. Participants ......................................................................................................................................... 14
6. Presentations and Publications ........................................................................................................... 15
7. Concluding Remarks ............................................................................................................................ 15
References .................................................................................................................................................. 16
GU‐HARD‐PL02 2012
3
List of Figures Figure 1. Overall functional block diagram for cosmic ray measurement .................................................... 4
Figure 2. Completed, sealed GU‐HARD‐PL02 ................................................................................................ 5
Figure 3. Setup for lab testing ....................................................................................................................... 5
Figure 4. Interior view of GU‐HARD‐PL02 ..................................................................................................... 6
Figure 5. Detector module: (a) photo diode and scintillator (b) integration with a preamplifier ................ 6
Figure 6. Application circuit diagram of the pre‐amplifier for SSPM [3] ...................................................... 7
Figure 7. Fully assembled detector module with the rotator module .......................................................... 7
Figure 8. Output signals: (a) pre‐amplifier (b) OP amp (comparator) ........................................................ 10
Figure 9. Temperature inside the payload .................................................................................................. 11
Figure 10. Orientation angle [degrees] of the electronic compass referenced to the East‐West .............. 11
Figure 11. Number of coincidence events counted by the Coincidence Module ....................................... 12
Figure 12. Coincidence rate [Events per minute] in all directions .............................................................. 12
Figure 13. Coincidence rate [Events per minute] in East‐West direction ................................................... 13
List of Tables Table 1. Testing Data of the Detector Module ........................................................................................... 10

GU‐HARD‐PL02 2012
4
1. Highlights of the Project
Project Objectives – The Earth’s magnetic field deflects cosmic‐ray trajectories from a straight line.
Due to the fact that cosmic rays are predominantly positively charged, this results in more particles arriving
from the west than from the east. This “east‐west” asymmetry has been investigated in the past at ground
level. The goal of the proposed HASP2012 small payload was to investigate how the “east‐west” angular
asymmetry changes with altitude, as the cosmic ray flux transitions from mostly secondary particles near
the ground level to mostly primary cosmic rays near balloon‐float altitudes [1]. Additionally, this project
intended to study how the intensity of cosmic rays changes with altitude, based on measurements of
cosmic ray intensity from multiple arrival directions, providing a more complete picture of the high‐
altitude radiation environment caused by cosmic rays.
Payload Subsystems – To achieve the project goal, a payload integrating various subsystems for
cosmic‐ray detection and necessary processing has been designed in a top‐down design approach: initially
establishing engineering requirements of the payload for the experiment, carrying out functional
decomposition, and actual laboratory design of subsystems by student team members from the Electrical
Figure 1. Overall functional block diagram for cosmic ray measurement
GU‐HARD‐PL02 2012
5
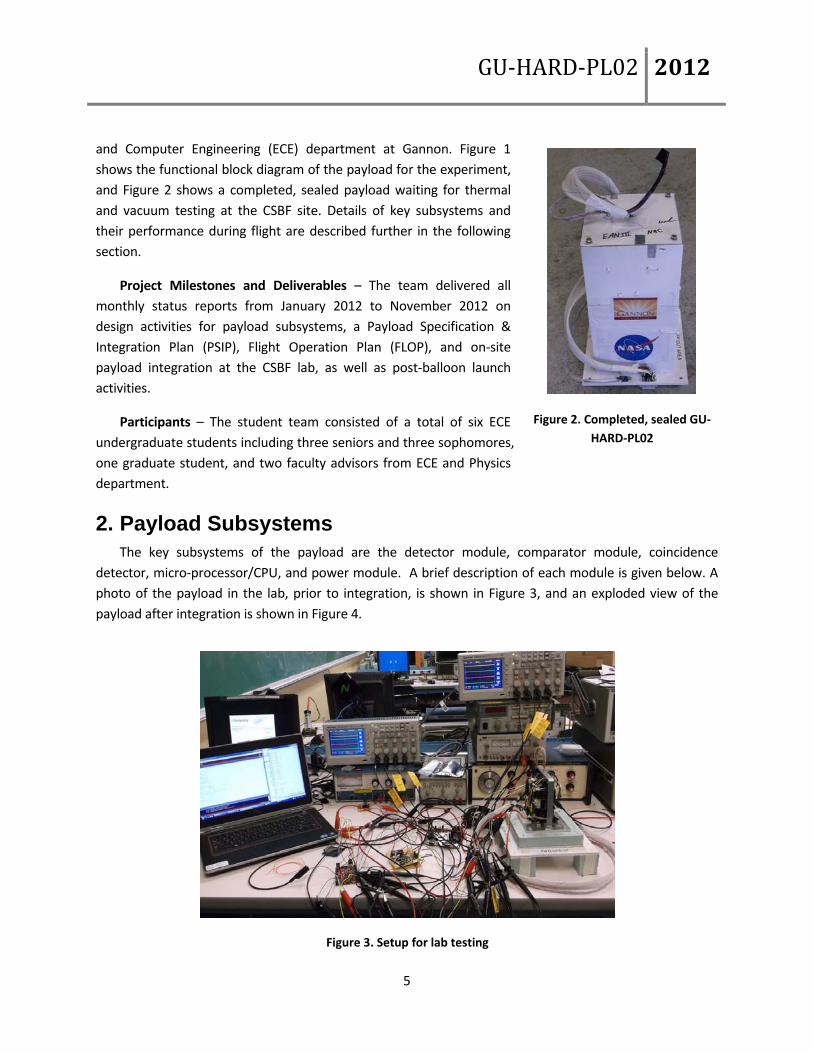
and Computer Engineering (ECE) department at Gannon. Figure 1
shows the functional block diagram of the payload for the experiment,
and Figure 2 shows a completed, sealed payload waiting for thermal
and vacuum testing at the CSBF site. Details of key subsystems and
their performance during flight are described further in the following
section.
Project Milestones and Deliverables – The team delivered all
monthly status reports from January 2012 to November 2012 on
design activities for payload subsystems, a Payload Specification &
Integration Plan (PSIP), Flight Operation Plan (FLOP), and on‐site
payload integration at the CSBF lab, as well as post‐balloon launch
activities.
Participants – The student team consisted of a total of six ECE
undergraduate students including three seniors and three sophomores,
one graduate student, and two faculty advisors from ECE and Physics
department.
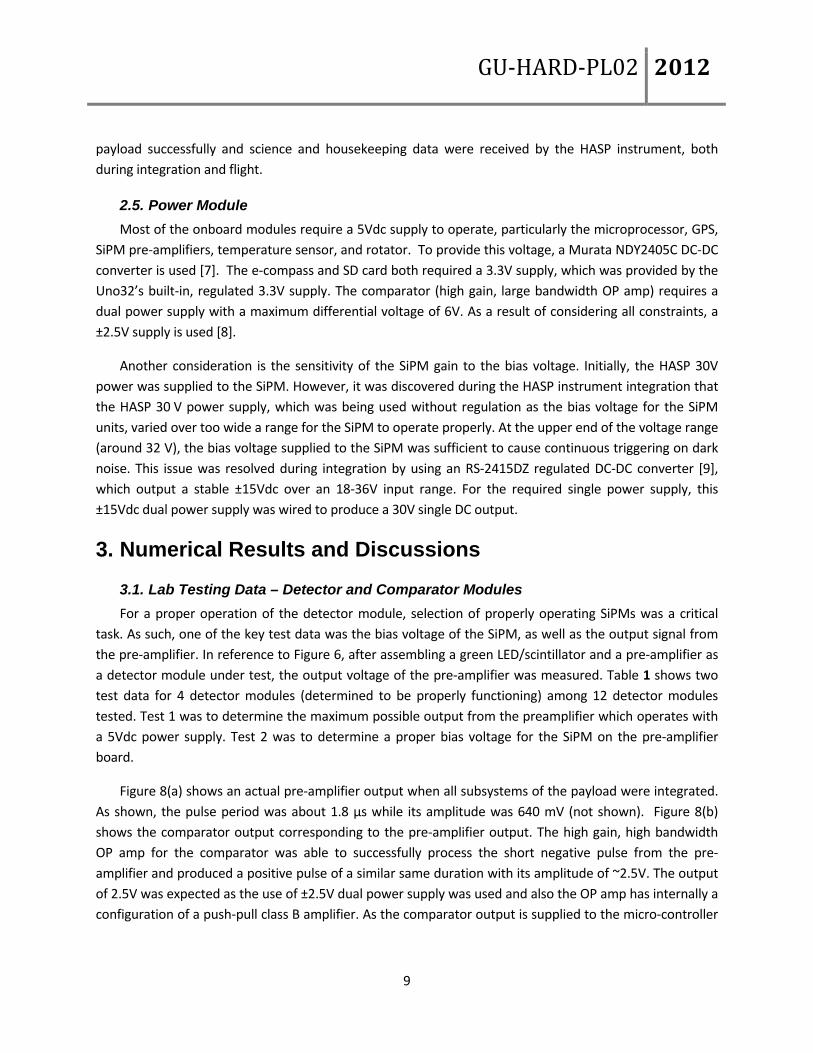
2. Payload Subsystems The key subsystems of the payload are the detector module, comparator module, coincidence
detector, micro‐processor/CPU, and power module. A brief description of each module is given below. A
photo of the payload in the lab, prior to integration, is shown in Figure 3, and an exploded view of the
payload after integration is shown in Figure 4.
Figure 2. Completed, sealed GU‐
HARD‐PL02
Figure 3. Setup for lab testing

GU‐HARD‐PL02 2012
6
2.1. Detector Module
Four active detector elements are arranged in a
square for detection of cosmic rays in the east‐west plane.
In this arrangement, two detector elements are expected
to simultaneously produce an electric pulse. Each active
detector element consists of a Photonique SSPM
0905V13MM silicon photomultiplier (SiPM) [2] attached
via optical epoxy to a 3 3 1 CsI(TI) scintillating
crystal, as shown in Figure 5(a). To artificially supply lights
to the scintillator for lab testing purposes, a green LED is
also attached to the scintillator. As a charged particle
traverses the scintillator, light is emitted. The SiPM then
converts this light into an electric pulse. The scintillators are wrapped in Teflon tape to reflect stray
photons back in, increasing the number of photons detected by the SiPM, and then in electrical tape to
block outside light. A wrapped scintillator is shown in Figure 5(b). Each SiPM is connected to a pre‐
amplifier, also visible in the photos. The pre‐amplifier generates a negative pulse with a magnitude ranging
from 0 to about ‐1.0V depending on the number of photons impinging on the SiPM. The advantage of
using SiPMs over traditional photomultiplier tubes (PMTs) is that they only require a very low (~30V) bias
voltage, as opposed to the ~1 kV require by PMTs. This eliminates the need to pot the electronics in a
dielectric, which is required with PMTs in near vacuum applications.
(a) (b)
Figure 5. Detector module: (a) photo diode and
scintillator (b) integration with a preamplifier
Figure 4. Interior view of GU‐HARD‐PL02

GU‐HARD‐PL02 2012
7
One challenge of working with
the SiPM units is that the signals
generated are very short, e.g.,
peak sensitivity wavelength = 680
nm [2]. The pre‐amplifiers had a
typical rise time of 5 ns, although
the long decay time of the CsI(TI)
crystal resulted in pulses with a
width on the scale of 1 µs. To
detect such short pulses requires
fast electronics. An application
circuit of the pre‐amplifier used for
the detector module is shown in
Figure 6 where capacitors C1 and
C2 have a typical value of 10 nF.
In order to detect the east‐
west asymmetry, the detector
must be oriented so that the scintillator lies in the east‐west plane.
Given that the HASP instrument rotates during the flight, an
HMC6352 electronic compass [4] is used to determine the
orientation of the detector module. When the orientation of the
payload drifts more than 10° from the desired orientation, a servo
motor is used to adjust the detector. The completed detector
module with the rotator module is shown in Figure 7.
2.2. Comparator Module
Each SiPM unit outputs a voltage proportional to the number of
detected photons. However, this voltage signal is small and negative.
This signal is inverted and amplified by an AD8616 inverting OP amp
with a high voltage gain and large bandwidth operating at a
frequency of up to 20 MHz [5]. Typical LM741 OP amp was first tried
but did not work due to the requirement of a high gain at high frequencies.
2.3. Coincidence Detector
The output of the comparator module is connected to the digital inputs of the microprocessor. To
monitor for a coincidence in two or more SiPM modules at a time, the microprocessor polls these inputs
approximately once each microsecond. When this condition is met, the SiPM modules that contributed to
the coincidence are identified and stored for later analysis by.
Figure 7. Fully assembled detector
module with the rotator module
Figure 6. Application circuit diagram of the pre‐amplifier for SSPM [3]

GU‐HARD‐PL02 2012
8
2.4. Microprocessor/CPU
A chipKIT Uno32 Prototyping Platform [6] is used as the main microprocessor module. This board
provides a number of functions, including poling the digital I/O pins to determine whether a coincidence
has been met; serial communication with HASP; monitoring temperature, detector orientation and GPS
time; controlling the servo to adjust detector orientation; and recording data to an SD card.
The following programming codes were implemented for the necessary functionality:
FlightCode.pde: Main program to integrate all subroutines and download the codes onto the microcontroller
M01_GPS.pde: for GPS‐related functions o void SetupGPS() o void GetOnboardGPSString() o void GetGPSTime(char *str, unsigned int size, char *time) o void ParseGPSString(unsigned char *str, unsigned int size)
M02_RadDet.pde: for radiation detection‐related functions o void SetupRadDet() o int GetHit()
M03_SDmemory.pde: for memory card‐related functions o void SetupSD() o int GetFilename() o void WriteEvent() o void Reboot()
M04_Servo.pde: for control of a servo motor o void SetupServo() o void PointNorth() o int ControlServo(float heading) o void ServoRotate(Servo *s, float angle) o inline float MicrosecondsToAngle(float micro) o inline float CheckAngle(float angle)
M05_eCompass.pde: for electronic compass‐related functions o void SetupECompass() o float GetHeading() o void CalibrateCompass()
M06_HASPSerial.pde: for serial communication‐related functions o void ReadHASPSerial() o void SendHASPSerial()
M07_TempSensor.pde: for temperature sensor‐related functions o float GetTemp()
All of these codes were thoroughly tested in the lab and implemented into the microcontroller. During
integration, however, it was discovered that the serial port on the Uno32 was using TTL logic levels,
whereas the HASP equipment required RS‐232 logic levels. In order to enable serial communication, a
MAX233 line driver/receiver was additionally installed. After installation, commands could be sent to the
GU‐HARD‐PL02 2012
9
payload successfully and science and housekeeping data were received by the HASP instrument, both
during integration and flight.
2.5. Power Module
Most of the onboard modules require a 5Vdc supply to operate, particularly the microprocessor, GPS,
SiPM pre‐amplifiers, temperature sensor, and rotator. To provide this voltage, a Murata NDY2405C DC‐DC
converter is used [7]. The e‐compass and SD card both required a 3.3V supply, which was provided by the
Uno32’s built‐in, regulated 3.3V supply. The comparator (high gain, large bandwidth OP amp) requires a
dual power supply with a maximum differential voltage of 6V. As a result of considering all constraints, a
±2.5V supply is used [8].
Another consideration is the sensitivity of the SiPM gain to the bias voltage. Initially, the HASP 30V
power was supplied to the SiPM. However, it was discovered during the HASP instrument integration that
the HASP 30 V power supply, which was being used without regulation as the bias voltage for the SiPM
units, varied over too wide a range for the SiPM to operate properly. At the upper end of the voltage range
(around 32 V), the bias voltage supplied to the SiPM was sufficient to cause continuous triggering on dark
noise. This issue was resolved during integration by using an RS‐2415DZ regulated DC‐DC converter [9],
which output a stable ±15Vdc over an 18‐36V input range. For the required single power supply, this
±15Vdc dual power supply was wired to produce a 30V single DC output.
3. Numerical Results and Discussions
3.1. Lab Testing Data – Detector and Comparator Modules
For a proper operation of the detector module, selection of properly operating SiPMs was a critical
task. As such, one of the key test data was the bias voltage of the SiPM, as well as the output signal from
the pre‐amplifier. In reference to Figure 6, after assembling a green LED/scintillator and a pre‐amplifier as
a detector module under test, the output voltage of the pre‐amplifier was measured. Table 1 shows two
test data for 4 detector modules (determined to be properly functioning) among 12 detector modules
tested. Test 1 was to determine the maximum possible output from the preamplifier which operates with
a 5Vdc power supply. Test 2 was to determine a proper bias voltage for the SiPM on the pre‐amplifier
board.
Figure 8(a) shows an actual pre‐amplifier output when all subsystems of the payload were integrated.
As shown, the pulse period was about 1.8 µs while its amplitude was 640 mV (not shown). Figure 8(b)
shows the comparator output corresponding to the pre‐amplifier output. The high gain, high bandwidth
OP amp for the comparator was able to successfully process the short negative pulse from the pre‐
amplifier and produced a positive pulse of a similar same duration with its amplitude of ~2.5V. The output
of 2.5V was expected as the use of ±2.5V dual power supply was used and also the OP amp has internally a
configuration of a push‐pull class B amplifier. As the comparator output is supplied to the micro‐controller

GU‐HARD‐PL02 2012
10
operating based on TTL logic (i.e., 0 ~ 3.3 Vdc) with a threshold voltage of 2.4 Vdc. The +2.5 V output was a
proper output level for the logical operation of the micro‐controller.
Table 1. Testing Data of the Detector Module
Pre‐amp board #
Test 1
Test 2
Preamp Max. Output Voltage [V]
SiPM Bias Voltage [V]
Test condition: Preamplifier input: a 100 kHz pulse signal coupled by C2 = 10 µF; SiPM is not powered (i.e., OFF)
Test condition: Preamplifier output: at negative peak voltage < ‐1V
#4 ‐2.56 28.2
#5 ‐2.56 26.2
#8 ‐2.40 27.6
#10 ‐2.72 28.0
3.2. In-Flight Experimental Data
GU‐HARD‐PL02 was flight‐certified after a 2nd attempt to pass the thermal vacuum testing at the CSBF
site. The in‐flight data shown in Figure 9~Figure 13 was gathered during the HASP 2012 flight through the
serial communication to the HASP data repository on the ground in real time.
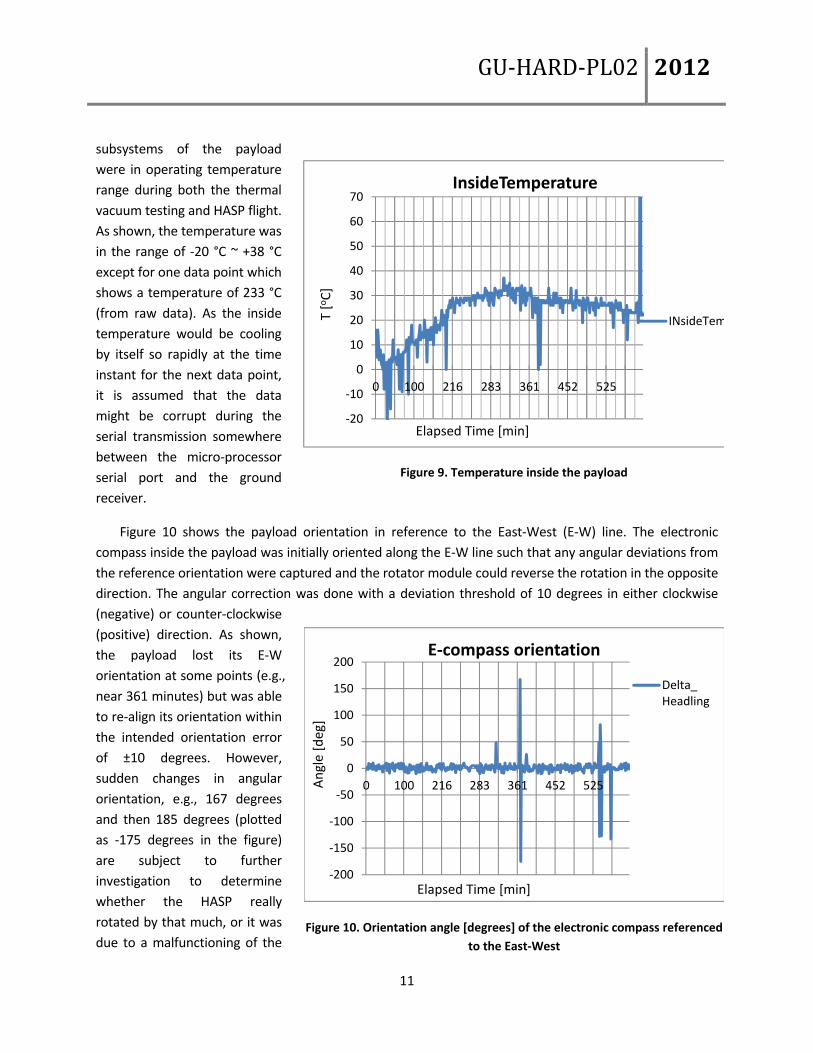
Figure 9 shows the temperature inside the payload. The temperature was monitored to ensure all
Figure 8. Output signals: (a) pre‐amplifier (b) OP amp (comparator)
GU‐HARD‐PL02 2012
11
subsystems of the payload
were in operating temperature
range during both the thermal
vacuum testing and HASP flight.
As shown, the temperature was
in the range of ‐20 °C ~ +38 °C
except for one data point which
shows a temperature of 233 °C
(from raw data). As the inside
temperature would be cooling
by itself so rapidly at the time
instant for the next data point,
it is assumed that the data
might be corrupt during the
serial transmission somewhere
between the micro‐processor
serial port and the ground
receiver.
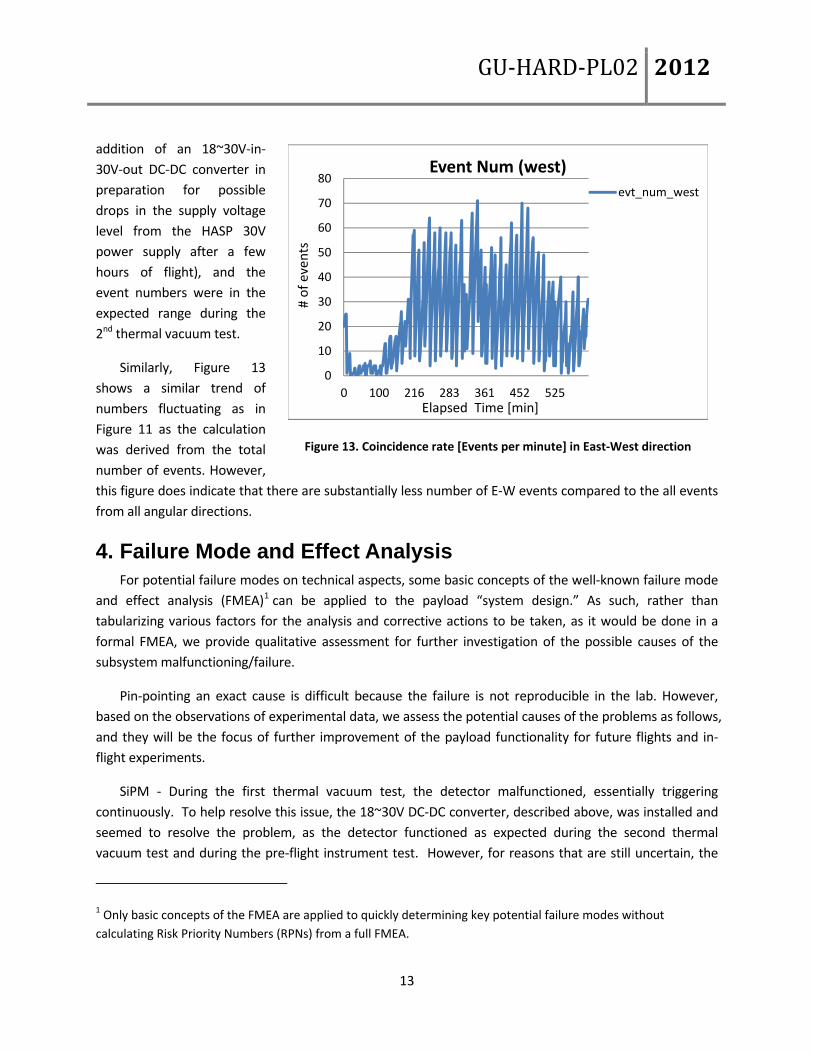
Figure 10 shows the payload orientation in reference to the East‐West (E‐W) line. The electronic
compass inside the payload was initially oriented along the E‐W line such that any angular deviations from
the reference orientation were captured and the rotator module could reverse the rotation in the opposite
direction. The angular correction was done with a deviation threshold of 10 degrees in either clockwise
(negative) or counter‐clockwise
(positive) direction. As shown,
the payload lost its E‐W
orientation at some points (e.g.,
near 361 minutes) but was able
to re‐align its orientation within
the intended orientation error
of ±10 degrees. However,
sudden changes in angular
orientation, e.g., 167 degrees
and then 185 degrees (plotted
as ‐175 degrees in the figure)
are subject to further
investigation to determine
whether the HASP really
rotated by that much, or it was
due to a malfunctioning of the
Figure 9. Temperature inside the payload
‐20
‐10
0
10
20
30
40
50
60
70
0 100 216 283 361 452 525
InsideTemperature
INsideTem
Elapsed Time [min]
T[oC]
Figure 10. Orientation angle [degrees] of the electronic compass referenced
to the East‐West
‐200
‐150
‐100
‐50
0
50
100
150
200
0 100 216 283 361 452 525
E‐compass orientation
Delta_Headling
Angle [deg]
Elapsed Time [min]

GU‐HARD‐PL02 2012
12
rotator module (e.g. over‐
correction).
Figure 11 shows the
cumulative event numbers
of coincidences. An event is
declared when the input
voltage to a designated pin
of the micro‐controller is
HIGH, which is ideally a
signal when an SiPM
produces a electric pulse due
to arrivals of cosmic rays in a
direction. As shown in the
figure, there are so many
events per minutes, ranging
from ~6,000 to ~86,000.
Furthermore, ideally, the event numbers would be monotonically increasing as the total number of events
is accumulating all events occurred in time. Obviously, something happened in the micro‐controller inside
the payload on the HASP as this fluctuation of numbers could only happen when the micro‐controller
regularly resets the event number. The most logical explanation is that the microcontroller rebooted itself
approximately every 7 minutes, a failure mode not observed in the lab.
Figure 12 shows the hit rates (or event rates), defined as the number of events of coincidence per
minute. An expected range
of events was somewhere
between 10~20 per minutes.
These event numbers were
in the expected range during
two preliminary integration
tests performed on the
integraton emulator in the
CSBF lab. This was also the
reason of declaring a failure
to pass the 1st thermal
vacuum test on the HASP.
The payload passed the
thermal vacuum test in the
2nd attempt after somewhat
unrelated improvement (i.e., Figure 12. Coincidence rate [Events per minute] in all directions
‐2000.0
0.0
2000.0
4000.0
6000.0
8000.0
10000.0
12000.0
0 100 216 283 361 452 525
Hit RateHit Rate
Elapsed Time [min]
Even
ts/m
in
Figure 11. Number of coincidence events counted by the Coincidence
Module
0
10000
20000
30000
40000
50000
60000
70000
80000
90000
100000
0 100 216 283 361 452 525
Event Num Event Num
Elapsed Time [ i ]
# of even
ts
GU‐HARD‐PL02 2012
13
addition of an 18~30V‐in‐
30V‐out DC‐DC converter in
preparation for possible
drops in the supply voltage
level from the HASP 30V
power supply after a few
hours of flight), and the
event numbers were in the
expected range during the
2nd thermal vacuum test.
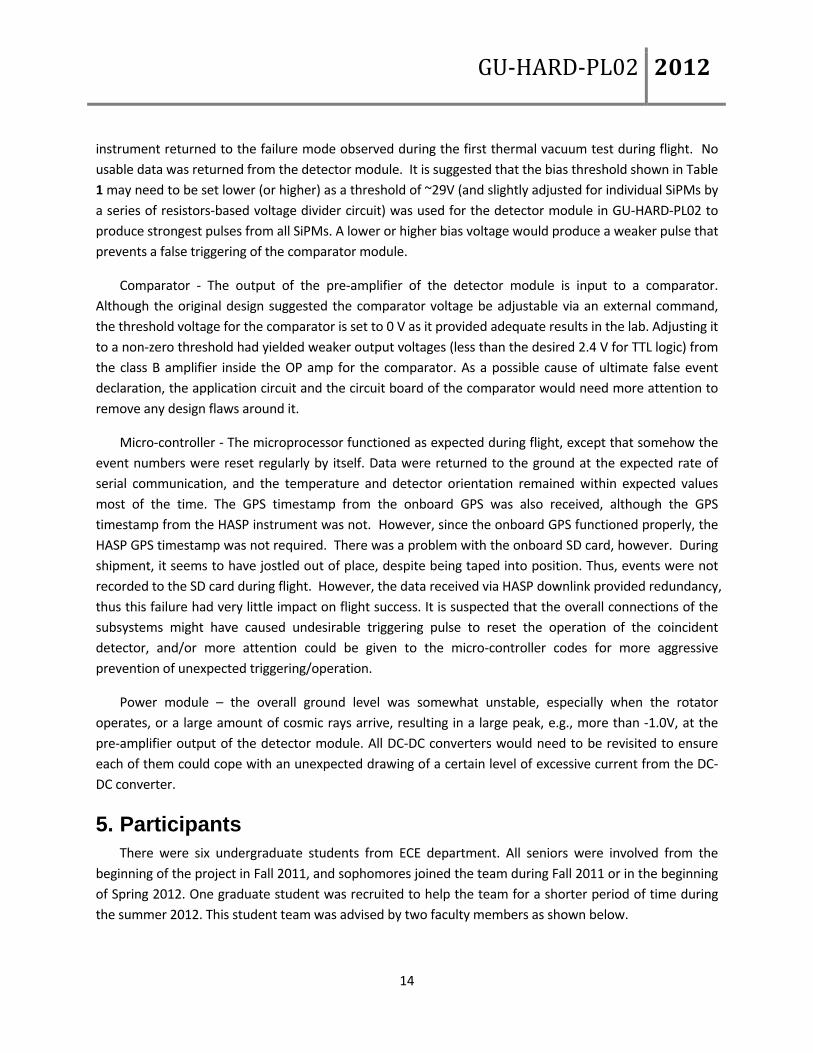
Similarly, Figure 13
shows a similar trend of
numbers fluctuating as in
Figure 11 as the calculation
was derived from the total
number of events. However,
this figure does indicate that there are substantially less number of E‐W events compared to the all events
from all angular directions.
4. Failure Mode and Effect Analysis For potential failure modes on technical aspects, some basic concepts of the well‐known failure mode
and effect analysis (FMEA)1 can be applied to the payload “system design.” As such, rather than
tabularizing various factors for the analysis and corrective actions to be taken, as it would be done in a
formal FMEA, we provide qualitative assessment for further investigation of the possible causes of the
subsystem malfunctioning/failure.
Pin‐pointing an exact cause is difficult because the failure is not reproducible in the lab. However,
based on the observations of experimental data, we assess the potential causes of the problems as follows,
and they will be the focus of further improvement of the payload functionality for future flights and in‐
flight experiments.
SiPM ‐ During the first thermal vacuum test, the detector malfunctioned, essentially triggering
continuously. To help resolve this issue, the 18~30V DC‐DC converter, described above, was installed and
seemed to resolve the problem, as the detector functioned as expected during the second thermal
vacuum test and during the pre‐flight instrument test. However, for reasons that are still uncertain, the
1 Only basic concepts of the FMEA are applied to quickly determining key potential failure modes without
calculating Risk Priority Numbers (RPNs) from a full FMEA.
Figure 13. Coincidence rate [Events per minute] in East‐West direction
0
10
20
30
40
50
60
70
80
0 100 216 283 361 452 525
Event Num (west)
evt_num_west
Elapsed Time [min]
# of even
ts
GU‐HARD‐PL02 2012
14
instrument returned to the failure mode observed during the first thermal vacuum test during flight. No
usable data was returned from the detector module. It is suggested that the bias threshold shown in Table
1 may need to be set lower (or higher) as a threshold of ~29V (and slightly adjusted for individual SiPMs by
a series of resistors‐based voltage divider circuit) was used for the detector module in GU‐HARD‐PL02 to
produce strongest pulses from all SiPMs. A lower or higher bias voltage would produce a weaker pulse that
prevents a false triggering of the comparator module.
Comparator ‐ The output of the pre‐amplifier of the detector module is input to a comparator.
Although the original design suggested the comparator voltage be adjustable via an external command,
the threshold voltage for the comparator is set to 0 V as it provided adequate results in the lab. Adjusting it
to a non‐zero threshold had yielded weaker output voltages (less than the desired 2.4 V for TTL logic) from
the class B amplifier inside the OP amp for the comparator. As a possible cause of ultimate false event
declaration, the application circuit and the circuit board of the comparator would need more attention to
remove any design flaws around it.
Micro‐controller ‐ The microprocessor functioned as expected during flight, except that somehow the
event numbers were reset regularly by itself. Data were returned to the ground at the expected rate of
serial communication, and the temperature and detector orientation remained within expected values
most of the time. The GPS timestamp from the onboard GPS was also received, although the GPS
timestamp from the HASP instrument was not. However, since the onboard GPS functioned properly, the
HASP GPS timestamp was not required. There was a problem with the onboard SD card, however. During
shipment, it seems to have jostled out of place, despite being taped into position. Thus, events were not
recorded to the SD card during flight. However, the data received via HASP downlink provided redundancy,
thus this failure had very little impact on flight success. It is suspected that the overall connections of the
subsystems might have caused undesirable triggering pulse to reset the operation of the coincident
detector, and/or more attention could be given to the micro‐controller codes for more aggressive
prevention of unexpected triggering/operation.
Power module – the overall ground level was somewhat unstable, especially when the rotator
operates, or a large amount of cosmic rays arrive, resulting in a large peak, e.g., more than ‐1.0V, at the
pre‐amplifier output of the detector module. All DC‐DC converters would need to be revisited to ensure
each of them could cope with an unexpected drawing of a certain level of excessive current from the DC‐
DC converter.
5. Participants There were six undergraduate students from ECE department. All seniors were involved from the
beginning of the project in Fall 2011, and sophomores joined the team during Fall 2011 or in the beginning
of Spring 2012. One graduate student was recruited to help the team for a shorter period of time during
the summer 2012. This student team was advised by two faculty members as shown below.

GU‐HARD‐PL02 2012
15
Student team members
Name Major/Concentration Year (as of
Spring ‘12)
Gender Ethnicity
Emily Wright Electrical & Electronics Senior Female White
Robert Frantz Electrical & Electronics Senior Male White
Daniel Grasinger Computer Engineering Senior Male White
Joe Veneri Electrical & Electronics Sophomore Male White
Nichole McGuire Electrical & Electronics Sophomore Female White
E. Aaron Neiman Computer Engineering Sophomore Male White
Sriharsha Kotte Electrical Engineering Graduate
student
Male Asian
Faculty advisors
Name Title Department Gender
Dr. Wookwon Lee Associate Professor Electrical & Computer Engineering
Male
Dr. Nicholas Conklin Assistant Professor Physics Male
6. Presentations and Publications Robert Frantz, Dan Grasinger, and Emily Wright, “High Altitude Radiation Detection”, presented
at IEEE Region 2 Student Activities Conference, Columbus, OH, April 2012.
W. Lee and N. Conklin, “High Altitude Radiation Detector (HARD): Integration of Undergraduate Research into Senior Design and Lessons Learned “, abstract accepted, 2013 ASEE Annual conference, June 2013.
7. Concluding Remarks Although the payload failed to collect the desired cosmic‐ray data, all other parts of the design,
including serial communications, payload orientation, and temperature monitoring, functioned as
expected. Additionally, this project provided student team members with an engineering opportunity that
requires technical and also non‐technical skills to solve real‐world problems. This project was adopted as a
senior design project for the 2011‐2012 academic year at Gannon with three of the design team members
GU‐HARD‐PL02 2012
16
participating as seniors in the ECE department. Therefore, despite the lack of science data, this project
was a considerable success from a student education standpoint.
The Gannon team plans to revise the payload design, fixing the potential sources of failure outlined
above, and launch its own small‐scale balloon system to carry this payload to the near space. Another
payload, so called GU‐HARD‐PL03, will also be developed during this period to try again (if accepted) on
the HASP 2013 flight.
References [1] Gannon University HARD project team, “High Altitude Radiation Detector (GU‐HARD‐PL02),” HASP
2012 proposal submitted to the HASP 2012 Program, 12/16/2011.
[2] Photoniques SA, 1.3mm2 active area, low noise solid state photomultiplier for visible and near‐IR
light applications, Data sheet, Doc. No.: SSPM_0905V13MM, Sept. 2009.
[3] Application circuit diagram for AMP‐0604 and AMP‐0611, Photoniques SA, available on line at
http://www.photonique.ch/Prod_AMP_0600.html.
[4] Honeywell, Digital Compass Solution HMC6352, data sheet, available on line at
https://www.sparkfun.com/products/7915.
[5] Analog Devices, AD8615/AD8616/AD8618: Precision, 20 MHz, CMOS, Rail‐to‐Rail Input/Output
Operational Amplifiers, data sheet, 2008.
[6] Digilent, chipKIT™ Uno32™ Board Reference Manual, Doc: 502‐209, October 25, 2011.
[7] Murata NDY2405C, NDY Series: Isolated 3W Wide Input DC/DC Converters, data sheet, Doc. No.:
KDC_NDY.F02, 2012.
[8] Emerson Network Power, ASA03G24‐L‐ND, 18‐36VDC to 2.5V@3A Converter, data sheet, rev.
01.30.08, Jan. 2008.
[9] Recom Power, RS‐2415DZ, ECONOLINE DC/DC‐Converter, REV: 0/2012.
Related Documents