FINAL PROJECT REPORT Integrated Farm and Livestock Management Demonstration Program Demonstration of Agronomic and Environmentally Sound Utilization of Nitrogen and Phosphorus in Poultry Manure September 2007 Reported by (Contact): Antonio Mallarino 515-294-6200, [email protected] Institution: Department of Agronomy, Iowa State University Project Leaders: Antonio P. Mallarino and John E. Sawyer Research/Extension Assistants or Associates: Daniel Kaiser, Dorivar Ruiz-Diaz, Brett Allen, Daniel Barker, and David Wittry INDEX BACKGROUND AND GOALS ................................................................................................................................. 2 SUMMARY OF PROCEDURES ............................................................................................................................... 2 HIGHLIGTS OF THE FIELD DEMONSTRATIONS ............................................................................................ 5 SUMMARY OF OUTREACH ACTIVITIES ......................................................................................................... 16 SUMMARY................................................................................................................................................................17 TABLES AND FIGURES ......................................................................................................................................... 19

Welcome message from author
This document is posted to help you gain knowledge. Please leave a comment to let me know what you think about it! Share it to your friends and learn new things together.
Transcript

FINAL PROJECT REPORT
Integrated Farm and Livestock Management Demonstration Program
Demonstration of Agronomic and Environmentally Sound Utilization of Nitrogen and Phosphorus in Poultry Manure
September 2007
Reported by (Contact): Antonio Mallarino
515-294-6200, [email protected] Institution: Department of Agronomy, Iowa State University Project Leaders: Antonio P. Mallarino and John E. Sawyer Research/Extension Assistants or Associates: Daniel Kaiser, Dorivar Ruiz-Diaz, Brett Allen, Daniel Barker, and David Wittry
INDEX BACKGROUND AND GOALS .................................................................................................................................2 SUMMARY OF PROCEDURES ...............................................................................................................................2 HIGHLIGTS OF THE FIELD DEMONSTRATIONS ............................................................................................5 SUMMARY OF OUTREACH ACTIVITIES .........................................................................................................16 SUMMARY................................................................................................................................................................17 TABLES AND FIGURES .........................................................................................................................................19

2
BACKGROUND AND GOALS This final report highlights work and results of an on-farm demonstration and outreach project conducted during the 2004, 2005, and 2006 growing seasons. The Integrated Farm and Livestock Management Demonstration Program (IFLM) of the Iowa Department of Agriculture Land Stewardship fully funded work for the first 2 years of the project, and work for last year of the project was made possible by contributions from the IFLM program and the Iowa Egg Council. The overall goal of the project was to advance producers’ and manure applicators’ knowledge of poultry manure nitrogen (N) and phosphorus (P) management to improve crop yields and farm profitability while minimizing nutrient loss from fields and water quality impairment. Poultry manure is an important resource for meeting the nutrient needs of crops, and its land application for crops is an economical and widely used way of utilizing manure. However, many producers do not appropriately account for the nutrients in manure mainly because of uncertainty about manure nutrient content and the crop availability of the nutrients. Because manure handling and application is more difficult and costly than for fertilizers, this uncertainty leads to producer's reservations about its value and often to unnecessary supplemental fertilization. Scientists also are uncertain about the availability of manure nutrients for crops under many production conditions and have questions about environmental impacts of manure N and P. Therefore, this on-farm demonstration project was developed to assess and demonstrate the value of N and P in poultry manure and potential N and P loss with surface runoff immediately after application to fields. Specific objectives were to implement field demonstrations to compare corn yield response to poultry manure and commercial fertilizer, estimate manure N and P availability, alleviate producers' uncertainty concerning supplemental fertilization need after manure application, measure soil nutrient responses to manure and fertilizer application, and evaluate potential impacts of manure application on N and P loss from fields through surface runoff shortly after application. The project also sought to provide educational opportunities for producers, manure brokers, as well as agency and agribusiness personnel through one-on-one contacts, meetings, and a variety of educational materials.
SUMMARY OF PROCEDURES The goals and objectives were achieved by cooperating with producers, custom manure applicators, nutrient management planners, and extension specialists to conduct field demonstrations, provide information to other producers at field days and other meetings, and collect data useful to make them aware of the importance of careful manure management for optimizing nutrient use, profitability, and water quality. The general strategy was to conduct on-farm field demonstrations and other outreach activities during three years across Iowa. A total of 18 demonstrations (six each year) were conducted across 16 counties with concurrent data collection to document poultry manure N and P availability to corn, grain yield, soil-test values, and nutrient loss with surface runoff shortly after manure application. Each year the project directly or indirectly involved about 30 producers,

3
manure applicators, manure brokers, or extension specialists from over 15 counties who participated in different ways. At the same time field days, workgroup discussions, and both small local or large regional meetings or conferences were developed during the three years of the project, often in coordination with Iowa State University Extension (ISUE) and other nutrient management, soil conservation, or water quality projects. The following points summarize the most relevant work conducted in the field demonstrations.
1. Contact producers, custom manure applicators, manure brokers, local extension specialists, and leaders of producer associations to explain the project and identify cooperators.
2. Locate appropriate fields for the demonstrations, compile recent field management history and previous soil test information, and take initial soil samples to measure nutrient levels.
3. Sample manure to guide application and demonstrate manure nutrient content and variability.
4. Calibrate producer and/or custom applicator manure application equipment, and apply no manure and two manure rates to long strips across fields with the producers or custom manure applicators using their own equipment.
5. In fields with significant slope, measure N and P loss with surface runoff immediate after manure application using a field rainfall simulation technique.
6. Apply various rates of N and P fertilizers to small sections of the strips to assess the need for supplemental fertilization after applying manure at different rates.
7. Collect soil samples when corn is 6 to 12 inches tall to evaluate soil nitrate and soil test P. 8. Collect in-season measurements corn leaves greenness with a chlorophyll meter (Minolta
SPAD meter) and cornstalk samples for the end-of-season stalk nitrate test. 9. Harvest corn grain yield from the strips by the producers using their combines, and
harvest by hand the small sections where supplemental fertilizer was applied. 10. Collect post-harvest soil samples to evaluate residual P and nitrate in the soil.
The project demonstrated application of no manure, a low rate of manure, or a high rate of manure at each field by applying them to long and narrow strips three times across each field. The strips were of similar size at each field but varied across fields from 500 to 1850 feet in length and 30 to 60 feet in width. The manure was supplied by local poultry producers and was applied either by the producers or custom applicators together with project personnel. Manure from broiler, pullets, egg layers, or turkey feeding operations was applied, but the same type and source of manure was used at each field. In addition, supplemental N and P fertilizer was applied to a small section of all strips. Four rates of N fertilizer (ammonium nitrate or calcium-ammonium nitrate) and four rates of P fertilizer (triple superphosphate) were applied by hand to small areas of the strips at each field. Nitrogen rates were 0, 50, 100, and 150 lb N/acre broadcast at or immediately after planting corn. Phosphorus rates 0, 50, and 100 lb P2O5/acre to all strips and, only in non-manured strips, also 150 lb P2O5/acre. The P fertilizer was broadcast and incorporated into the soil at the same time the manure was incorporated except at Site 1, where the manure was applied and incorporated in the fall and the fertilizer P was applied in spring. Uniform P and K fertilizer rates (100 lb P2O5/acre and 60 lb K2O/acre) were applied to all the small N plots in order to mask the effect on corn of these nutrients applied with the manure. Blanket N and K fertilizer rates (150 lb N/acre and 60 lb K2O/acre) was applied across

4
all small P plots to eliminate as much as possible manure N and K effects on corn. The manure was analyzed for commonly measured properties (such as moisture, total N, P, and K, pH, and ammonium-N) by standard methods used in many laboratories and also for properties usually measured in research such as total carbon (C), C to N ratio, calcium (Ca), water soluble P, and others. Soil and corn plant samples were collected in different ways and for different purposes. Soil samples were taken before manure application from a 6-inch depth from various zones of the strips according to soils present and landscape, and were analyzed for routine soil tests (P, K, organic matter, pH, etc.). In small plots where four N fertilizer rates were applied, we took 1-foot soil samples for the late-spring soil nitrate test when corn was about 6 to 12 inches tall, Minolta® 502 SPAD chlorophyll meter readings from corn ear leaves at the VT (tassel) growth stage to monitor N response through leaf greenness, end-of-season lower cornstalk samples for nitrate testing, and post-harvest profile soil samples (from a 0- to 4-foot depth in 1 foot increments) for nitrate. In small plots where P fertilizer rates were applied, we took the aboveground portion of corn plants when they were about 6 inches tall to evaluate early growth and P uptake, and also took post-harvest soil samples from a 6-inch depth to evaluate effect of manure and fertilizer P on soil P. Grain yield was determined for each manure strip by harvesting with producer combines and for each fertilizer small plot by hand harvest of measured areas. Corn yield was adjusted to 15.5% grain moisture. Much interest has focused over the past few years to improve the quality of surface waters in Iowa and the Corn Belt. Rainfall simulations can be used to assess the potential N and P losses with surface runoff and compare management practices. Questions remain on how effective simple management strategies can be used to reduce the risk for runoff losses. Therefore, N and P loss with surface runoff was demonstrated in 10 fields having enough slope (about 2.5% or steeper) for simulated runoff events shortly after manure application (generally within 2 days with only one exception) with or without manure incorporation into the soil. The field rainfall simulation equipment and the techniques used were based on protocols suggested by the National Runoff P Project that were adapted to assessments of runoff P immediately after applying manure. A pair of plots measuring 5 by 6.5 feet (manure incorporated with tillage or not incorporated) was setup approximately at the center of each strip (control with no manure applied and two manure rates, all replicated three times). A heavy pick-up truck, a support smaller truck, and a trailer were used to carry the project personnel, galvanized steel runoff boxes, the rainfall simulator frame, a 1,000-gallon water tank, water pumps, hoses, and miscellaneous supplies to each field. The producers helped as needed and often provided the water, but sometimes the water was brought to the field from another source. The runoff collection boxes were installed on areas without wheel tracks and were removed after the simulations were completed. The simulated rainfall was applied at an intensity of 3 inches/hour to get 30 minutes of continuous runoff. Surface runoff was collected and measured in the field, and samples were collected to measure dissolved reactive P (DRP), bioavailable P (BAP), total P, total N, ammonium-N, nitrate-N, and sediment. The DRP, ammonium-N, and nitrate-N fractions are readily available for algae growth in streams or lakes. The biovailable P is a laboratory test (based on P retained by paper impregnated with iron oxide) that estimates P available to algae immediately and over a weeks or a few months. Total N and P in runoff can become available to algae over a longer

5
period of time. Although rainfall simulations were conducted at 10 fields, runoff N data are summarized for nine fields and runoff P data for eight fields because an after the fact analysis of the water used showed significant contamination with both N and P at one site and P at another site.
HIGHLIGTS OF THE FIELD DEMONSTRATIONS Although all grain yield, soil, plant, and surface water runoff samples were collected from all demonstrations and most data have been analyzed and summarized, work continues at this time with database development and statistical analysis of the many numbers collected during the three years of the project. Therefore, data presented in this report concerning crop, soil, and runoff responses to manure application should be considered preliminary until careful analysis is completed in the future.
Demonstration Sites Table 1 lists the location of the 18 demonstrations as well as dominant soil series and selected initial soil analyses of representative areas of the strips. The fields were located across 13 counties, and most had been managed with a corn-soybean rotation and represented a wide range of soil series and soil-test P. The soil-test data shown in the table correspond to several nutrient analyses completed on soil samples collected before any manure or fertilizer application. Results were summarized for the small areas that later received manure and/or fertilizer application and also a more limited number of tests (soil-test P and K) for samples collected from three to five different zones in the strips having contrasting soil type or topography. As expected, there was high soil-test variation across the large strip areas. These results confirm the importance of a good sampling plan to assess nutrient availability in fields the best way possible with a reasonable cost. A zone sampling method was used for the strips in this study. This and other sampling methods are discussed in ISU Extension publication PM-287.
Manure Nutrient Analysis and Application Tables 2 and 3 show the manure type applied at the 18 demonstrations and selected nutrient analyses. To assess and demonstrate the variability in nutrient content of manure and the value of proper manure sampling and analysis, six manure samples were taken from different loads while the manure was being applied at each site. The manure test values in the tables are useful mainly for two objectives. One is to see how the average manure nutrient content compares with tabulated average values shown in publications in use (such as in the ISU Extension publication PM-1811). As expected, the average N, P, and K values of the manure used at each site sometimes departed significantly from the tabulated values and confirm the need for manure analysis. Manure N:P ratios ranged from 1.3:1 to 3.0:1 across manure types and sources, and the actual amounts of nutrient applied were not the same across sites. The data are also useful to see the manure analysis variability when samples were taken form six different loads (all from the same building or pile source) as manure was being applied. A very important result was that the variability among these samples at each site was almost as much as the variability across manure of the same type and different sources used at various sites. Figure 1 shows the variation of

6
manure total N, P, and K for the six samples taken at each site in relation to the average analysis at each site. The variation was higher as the average nutrient concentration increased and tended to be higher for N and P than for K. The variation for K probably was less because it is inorganic and practically all soluble in water and does not segregate as much as N or P with variation in manure solids. Overall, these results demonstrated that there is always some uncertainty concerning nutrient content of applied manure, even with manure analysis while the manure is being applied. Table 4 shows manure application dates, time to incorporation into the soil, and both manure and nutrient application rates. The manure was applied in the fall, winter, or spring and was incorporated with tillage within 3 days of application except for fields managed with no-tillage and in five fields where for reasons of weather or farmer equipment problems the incorporation was delayed. All spreaders were calibrated by project personnel together with the producer or custom applicator prior to manure application by weighing the application equipment using portable scales before and after spreading manure over a length of at least 100 feet. The actual manure applied was checked (shown in the table) by weighing again the wagon or truck or by collection manure that was applied with large tarps and weighing manure on the tarps. The high manure rate was applied by spreading the low rate twice over the same area. The manures usually were mixed with some bedding material, except for egg layer and pullet manure used at Sites 2, 6, 7, 8, 9, 14 and 15. The low and high manure rates applied in some fields were planned to approximately supply one-half or the full N needs of corn according to total N content of manure based on preliminary analysis with few exceptions. The low rate would apply less than an adequate amount of crop available-N, as defined by current recommendations for corn in Iowa, and appropriate or not excessive P rates. The high manure rate typically applied more P than needed for two years of corn or crops of a corn-soybean rotation because of the N:P ratio in poultry manure. The actual amount of manure and nutrients applied indicate that the total N applied (without corrections for assumed manure N plant availability) across fields and rates ranged from rates lower to slightly higher than those recommended in Iowa for corn after soybean. The manure total P applied ranged from the amount needed to maintain soil-test P to more than twice the P needed for the two crops of the corn-soybean rotation. Manure application rates that applied the range of total manure N rates recommended by corn after soybean (100 to 150 lb N/acre) usually applied two to four times the P needed by the two crops of the rotation, which indicated a large potential for soil P buildup and greater potential loss with runoff. At Site 13, the manure rates applied were about twice the planned amounts due an equipment problem after the initial equipment calibration. The problem was detected when manure already had been applied to significant portion of the area, so we decided to continue applying those rates to have uniformity across replications. This is a good example of practical difficulties with poultry manure application, even when commonly suggested guidelines are used. Even at the other sites, the manure and nutrient rate actually applied often departed from the target rates. These results clearly indicate the difficulty at applying manure nutrients at proper or desired rates, and the existence of significant uncertainty when using poultry manure, which may be higher than for fertilizer use.
7
Results from the Manure Strips without Fertilizer Application Corn Grain Yield Corn yield results from the long and narrow strips that received none, low, or high manure application rates are summarized in Fig. 2 for the 18 demonstrations. The grain yield increases due to manure application ranged from 7 to 68 bu/acre and averaged 40 bu/acre across fields and manure application rates. On average, the high manure rate increased yield by 14 bu/acre over the low rate. However, the difference between the two rates ranged from almost none (within 2 or 3 bu/acre) to 42 bu/acre. Statistical analyses indicated no significant grain yield increases due to manure application at two demonstrations (Sites 1 and 14), but there were small responsive trends. These strip yield responses clearly demonstrated to the producers the value of manure nutrients for corn, and also showed the large potential response variation depending on the field, season, and other soil conditions. These responses to the manure application cannot be explained by a specific manure nutrient with certainty because some areas of the strips tested low to very high in soil-test P or K. For example, soil-test P was Very Low or Low along strips at Sites 5 and 17 and soil-test K was Low at Sites 1 and 14, so corn responses to manure could be explained by manure N, P, or K. At other sites, however, soil-test P and K ranged from Optimum to Very High and corn responses to manure likely are explained by manure N. The soil-test P and K ranges for the strip areas of most fields demonstrated the high soil-test variability usually observed in most Iowa fields. Therefore, these responses could have been produced by one or more of these manure nutrients. The corn early growth (V5 to V6 stages) responses to manure are shown in Fig. 3 and the responses to early P uptake are shown in Fig. 4. It is clear that manure application, most often with either rate, increased both early growth and P uptake significantly at most sites. This is an important result because it indicates that a significant portion of the manure N and P, which usually determine early plant growth rates, were available for the corn even in fields where the manure was applied in spring. Figure 5 summarizes the effect of applying manure on average post-harvest soil-test P buildup (Mehlich-3 test) across the sampled zones of each strip. There was large variation within each site (not shown), and also across sites because application rates varied across sites (see Table 4). However, manure P increased soil-test P significantly at all sites. When data for when Site 13 are excluded (because manure rates applied were twice the planned rates and much higher than at other fields) the average soil P buildup was 15 ppm for the low rate and 30 ppm for the high rate. These increases correspond to average manure P application rates across sites of 109 and 214 lb P2O5/acre. Corn Leaf Greenness Corn leaf greenness measured at the VT (tassel) growth stage with the Minolta® SPAD 502 Leaf Chlorophyll Meter (CM) is an indication of crop available-N supply from the soil system, effect of manure and fertilizer N application on the corn plant N status, and reflection of eventual productivity (grain yield) response to applied N. The larger the reading, the less the plant is expressing N stress. The larger the reading increase the greater the N uptake response to applied

8
N. Corn plants reach a maximum greenness (or CM reading) at an adequate N supply, and do not increase greenness with additional or excess N. A significant increase in leaf CM readings across the field-length strips due to poultry manure application was observed for most sites (Table 5). Leaf CM readings did not increase at five sites, which included the two sites with small or no yield response to manure application. Leaf greenness is an indication of the corn N status, and increase in CM readings indicates corn N uptake response to N contained in the manure. The increases measured substantiate that response to manure N is an important component of strip yield increases from manure application. The CM readings by themselves do not give an indication of plant N adequacy, but changes do reflect corn response to the poultry manure N. Late-Spring Soil Nitrate Test Soil nitrate-N (1-foot soil samples taken in early June when corn was approximately 6 to 12 inch tall) within the strips was increased by the application of poultry manure (Table 6). Two sites with small or no yield response to manure (Sites 1 and 14) had high soil nitrate concentrations in the check strips, which were at or above a critical concentration range of approximately 25 to 30 ppm determined in previous research. Therefore, the soil nitrate levels indicate adequate soil inorganic N without manure application and unlikely response to manure N. Two of the sites having no increase in soil nitrate-N concentration with manure application also had no statistically significant increase in CM readings (Table 5). The reason for this is unknown, and those sites did have grain yield increases with manure application. Soil nitrate-N concentrations increased with larger manure applications, although the concentrations with the high rate were often below the critical level. This is another indication that the full manure rate did not always supply an adequate level of crop available N. Also, sites with no or small increase in soil nitrate-N concentration from the low to high manure rate also had small change in leaf CM readings. Nitrate in the Lower Portion of Cornstalks at Physiological Maturity A threshold value of 2000 ppm nitrate-N concentration in the lower corn stalk (8 inch segment from 6 to 14 inches above the soil surface) at plant maturity is considered an indication of excess supply of crop available N (ISU Extension publication PM-1583). At two sites (Site 1 and 14) the nitrate-N concentration in the lower corn stalk was above the 2000 ppm level considered to be an indication of excess N supply (Table 7). At those sites, stalk nitrate-N concentrations were high for both manure rates and also the no-manure check. At other sites the concentrations were below 2000 ppm, and even with the high manure rate often quite low. These results would suggest that even the higher rates of poultry manure rates applied in the project did not supply excess crop-available N. The results of the three plant tests and the soil nitrate test suggest that the low poultry manure rate (and often the high rate) applied to the field-length strips did not supply the full corn N fertilization requirement, and that often additional N would be needed.
Results From the Small-Plot Manure and Fertilizer Demonstrations The grain yield responses from small plots established in all strips that received different rates of N and P fertilizer (none, low, or high manure rates) were very useful to indicate what manure nutrient that was responsible for the observed yield responses observed in the strips. These small

9
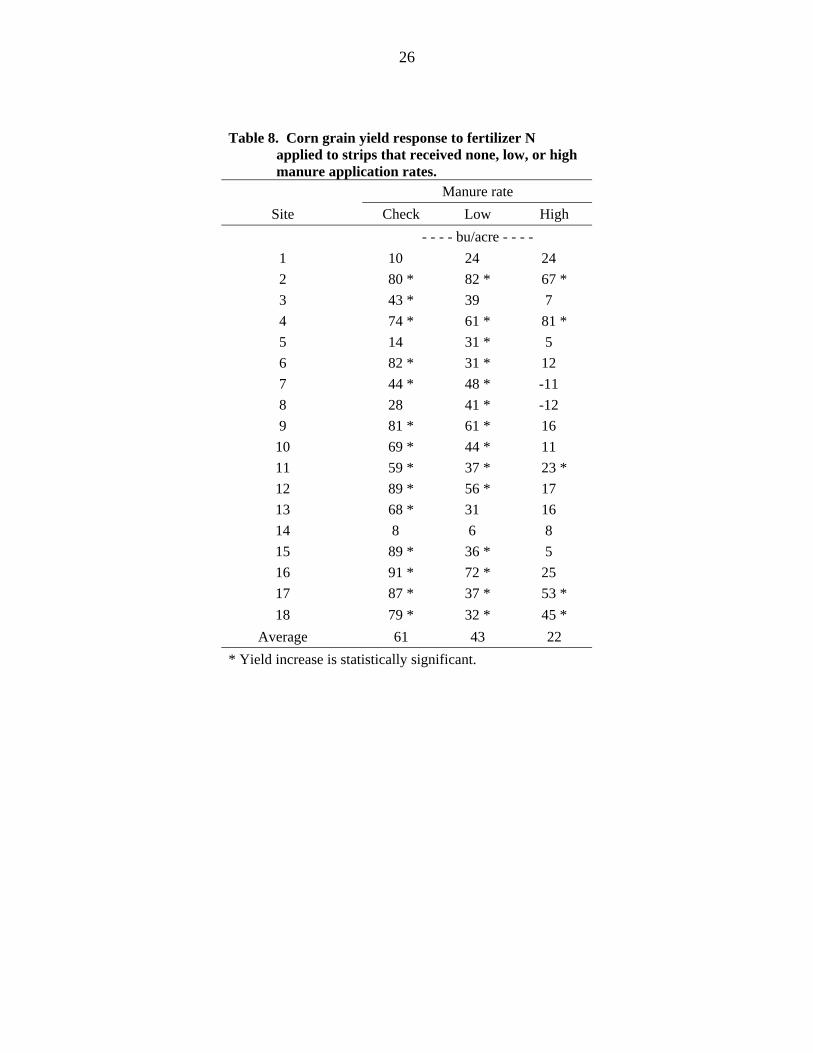
plots also were very useful to study effects of manure and fertilizer N or P on other crop and soil measurements. Therefore, the following sections summarize the results separately for the N and P plots. Corn and Soil Responses to Additional Fertilizer Nitrogen Corn Grain Yield Response Results for small sections of the strips where manure, fertilizer N, or both were applied indicated that grain yield was substantially increased by manure N (Fig. 6). Two sites (Sites 1 and 14) were not yield-responsive to manure or fertilizer N application and, therefore, were not included in the figure. The average yield increase across all responsive sites (with no fertilizer N applied) with the low manure rate was 23 bu/acre, and with the high manure rate was 47 bu/acre. The increases in grain yield clearly show that corn responds to poultry manure N. The results also showed that the low rate of poultry manure applied in the project did not supply the full corn N requirement and that additional fertilizer N was needed. This was expected as the low rate was intended to supply only a partial amount of corn N fertilization needs, and the rate was based on total manure N content. On average across all sites the same occurred with the high manure rate, that is, additional fertilizer N increased yield, but not as much as with the low manure rate. At some sites the high manure rate did supply adequate N. The poultry manure rates studied encompassed those used in production fields, so it would be expected that producers would need to apply additional N to meet corn fertilization requirements. This was also the case in this study, and as shown in Fig. 6 corn yield was increased with 50 and 100 lb fertilizer-N/acre in addition to the manure applications. The effect of fertilizer-N applied in addition to poultry manure on corn yield varied among sites (shown in Table 8), and produced a significant increased grain yield at all sites except at sites (Sites 1 and 14). The overall average yield increase from additional N (the 150 lb/acre fertilizer-N rate used for comparison) was 43 bu/acre for the low manure rate and 23 bu/acre for the high manure rate. The difference in average yield response to fertilizer N indicates the increase in manure-N supply with the high manure rate; however, the high rate did not supply adequate N at five sites. Despite being different manure sources, the corn grain yield increase was statistically the same for each of the poultry manure sources used in the project (broiler, layer and turkey) as shown in Table 4 and Fig. 7. This outcome was not expected, but can be explained by the relative similarity in the manure characteristics, especially the C:N ratio, ammonium-N, and total-N shown in Tables 2 and 3. Averages across all responsive sites in Fig. 6 and statistical analyses indicated that corn yields for the low and high manure rates with the highest supplemental N fertilizer rate were approximately similar to yield for the highest N fertilizer rate without manure. A similar result is observed in Fig. 7 for averages across sites where manure from egg layers or turkeys was applied. However, data for some individual sites (not shown) and for averages across sites where broiler manure was applied showed higher yield with manure and supplemental fertilizer N than for fertilizer N alone. The N response curve (without manure) for the broiler manure sites in Fig. 7 suggests that a higher fertilizer N rate might have increased yield further. However, the yield difference for the highest fertilizer N rate might also be indicative of manure effects on

10
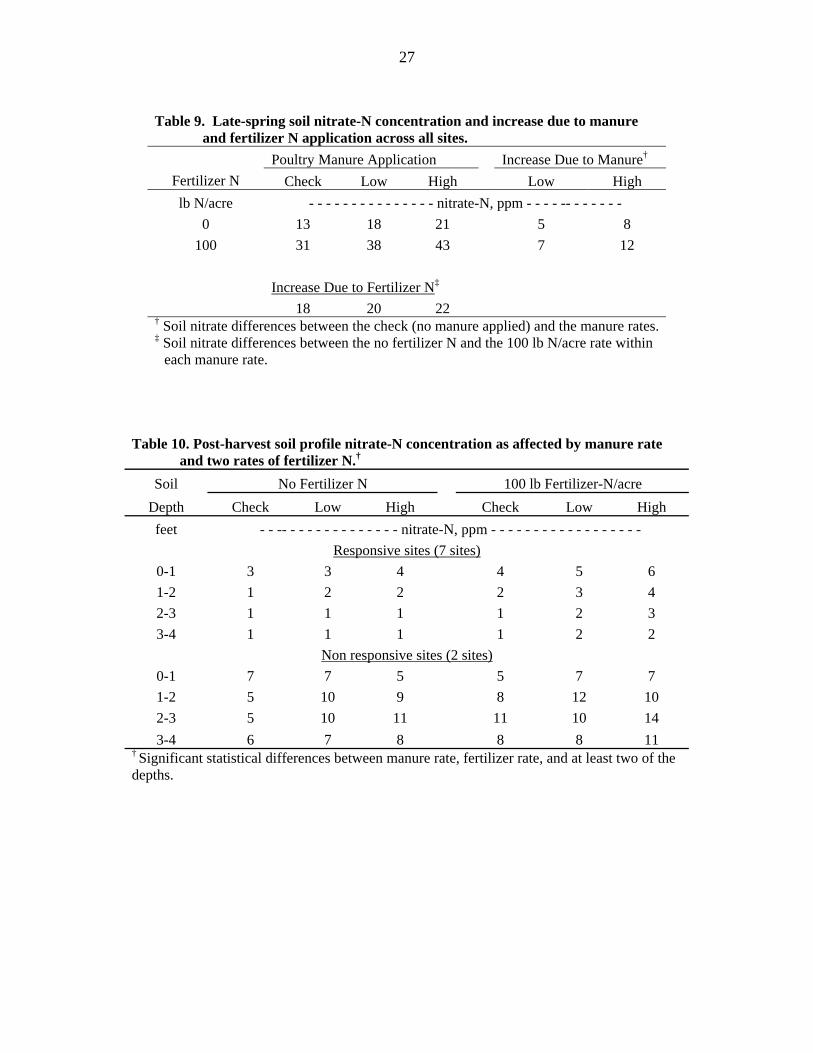
yield other than through the manure N applied. Manure P and K effects on yield are unlikely because high fertilizer rates of both nutrients were applied across all the N plots. Therefore, application of manure nutrients other than N, P, or K or manure effects on soil physical properties might explain the additional response to manure. Corn Leaf Greenness The measured increase in leaf CM readings for the small plot areas shown in Fig. 8 followed the same general trend as corn grain yield response to manure and fertilizer N. Figure 9 shows both relative yield and CM responses to manure and fertilizer N. Relative values expresses yield or CM values as a percentage of those with the highest N rate (non-N stressed plants). A of 97% relative CM value (a value that research in Iowa indicates economic optimal N fertilization is achieved) was reached with the high manure rate plus 50 lb fertilizer-N/acre, and with the low rate with the addition of 100 lb fertilizer-N/acre. Approximately the same percent results were observed for relative yield. Using the same 97% relative level, the low manure rate plus 100 lb fertilizer-N/acre and the high manure rate plus 50 lb fertilizer-N/acre achieved 97% relative yield. Late-Spring Soil Nitrate Test The average late-spring soil nitrate-N concentrations in early June across manure sources for each manure rate and the check show large increase with the 100-lb fertilizer N/acre (Table 9), but much less increase associated with poultry manure application. This result was consistent during the three years of the project and was the same for all three poultry manure sources. These differences in soil nitrate-N concentrations indicate a lower inorganic N supply early in the growing season from poultry manure compared to fertilizer N and only a partial release of poultry manure total N as inorganic nitrate-N. It is believed that the increase in soil nitrate measured in the early June sampling from manure application is coming mainly from the ammonium and easily hydrolyzed uric acid contained in the manure. The smaller and inconsistent differences observed in soil nitrate-N concentrations between manure rates also suggest that interpretation of additional rate need based on soil nitrate testing should not be the same with poultry manure as N fertilizer. Significant grain yield increases with addition of fertilizer N (application of 100 lb fertilizer-N/acre used for comparison) occurred primarily when late-spring soil nitrate-N concentrations were below 24 ppm (Fig. 10). This indicates a critical value of approximately 24 to 25 ppm nitrate-N in poultry manured soils. Variation in yield increase for values less than 24 ppm were quite large, and suggest that late-spring soil nitrate testing in poultry manured soils will not be effective in determining magnitude of response to additional fertilizer N and likely for determining rate of application. As has been observed in other studies with manured soils, some poultry manure applications had low soil nitrate-N concentrations, but yield response to fertilizer N application was small, thus indicating a need for more N when none was needed. High soil nitrate-N concentrations, above about 30 ppm, with no to only small yield increases from fertilizer application were observed with some of the manure applications (Fig. 10). This indicates that the test can be used to confirm when there may be excess supply of N in poultry manured soils, and little to no expectation of additional N need.

11
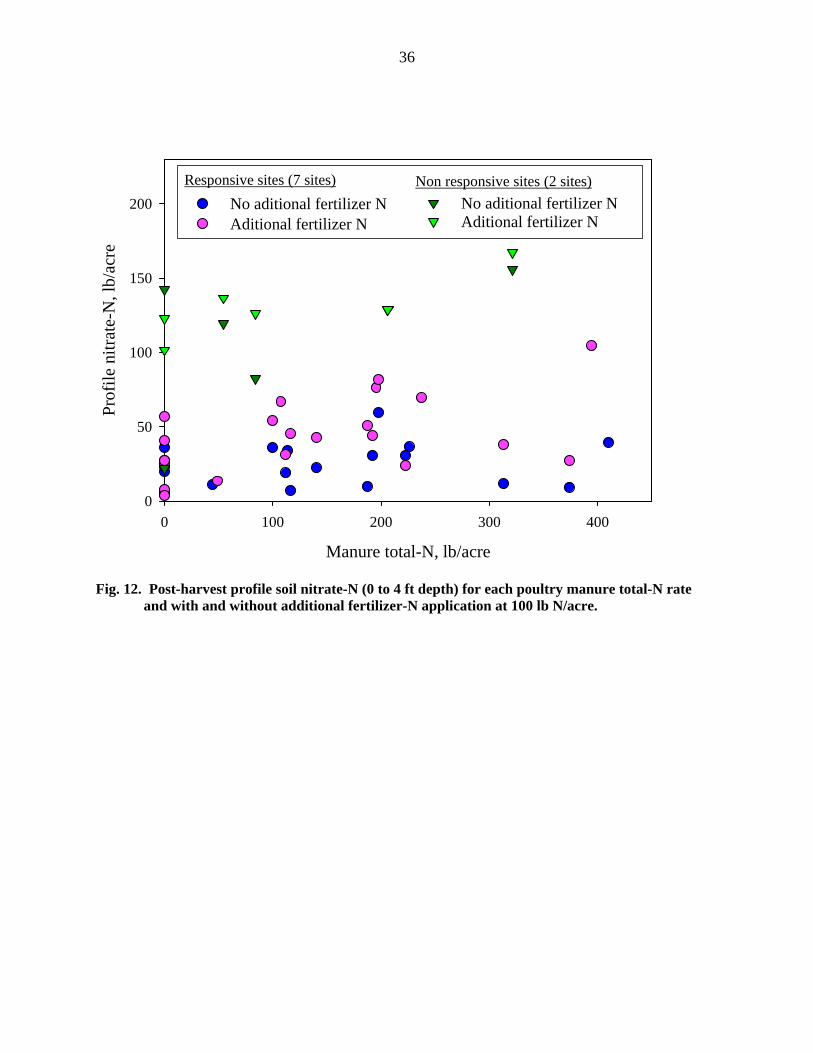
Nitrate in the Lower Portion of Cornstalks at Physiological Maturity Data in Fig. 11 show that average stalk nitrate concentrations across all yield responsive sites did not exceed 1000 ppm when either the low or high rates of poultry manure was applied (with no fertilizer N). Average concentrations were below 1500 ppm for all fertilizer-N rates (without manure applied). A threshold value of 2000 ppm nitrate-N concentration in the lower cornstalk is considered an indication of excess supply of crop available N. An excess concentration of nitrate-N was measured only when high rates of fertilizer N were applied in combination with the poultry manure. Stalk nitrate-N concentrations exceeded 2000 ppm with the application of more than approximately 110 lb N/acre of fertilizer N in addition to the low poultry manure rate, and with the application of approximately more than 60 lb N/acre of fertilizer N in addition to the high manure rate. As found for grain yield response to fertilizer N, stalk nitrate-N concentrations confirmed that the rates of the poultry manure applied in the project, including some instances with the high rate, did not supply the full corn N requirement and there was need for supplemental fertilizer N application. These results also confirm that not all of the poultry manure N was supplying crop available N within the year of application, as was also found with the change in soil nitrate concentrations with manure application. Post-Harvest Soil Profile Nitrate Soil profile samples (0- to 4-foot depth by 1-foot increments) were collected after harvest at three sites each year. Poultry manure and fertilizer N application increased profile nitrate-N concentrations slightly (Table 10). At the responsive sites, the highest concentrations were in the top foot of soil and decreased with depth. The 100-lb fertilizer N rate, especially in conjunction with the high manure rate, resulted in the overall highest profile nitrate-N concentrations. Considering the total amount of manure N applied at each rate, especially with the high rates, there was little to no accumulation of inorganic nitrate-N in the soil profile at the responsive sites (Fig. 12), and less than with additional fertilizer N application. For non-responsive sites nitrate-N concentrations in the soil profile were significantly higher, with greatest accumulation below the top foot of soil. This would be expected as no N addition was necessary to achieve full corn production, and N application would result in residual nitrate accumulation. Some increase in residual nitrate, compared to the zero N check, would be expected due to manure and fertilizer-N applications and due to the drawdown of residual soil nitrate with crop uptake when not N fertilized. Estimate of Poultry Manure N First-Year Availability Two measures of crop response to applied N, grain yield and CM readings, were used to estimate the first-year N availability to corn from the manure using the responsive sites. The yield and CM reading response to fertilizer N was modeled for each site when no manure was applied. Yield and CM readings for each manure rate were then evaluated against the response measured for fertilizer only. No differences were found between poultry manure sources (Table 11). This was not expected due to the varying animal species, production management, and manure

12
storage/handling. However, the relative similarity in the manure characteristics, especially for C:N ratio, total-N, and ammonium-N (Tables 2 and 3) do provide an explanation for this similarity. The range in manure first-year crop N availability (based on 95% statistical confidence limits) was 37 to 51% for the yield-based estimation and 31 to 41% for the CM based estimation across manure sources (Table 11). These values are lower than currently suggested for manure nutrient planning in Iowa. It is important to remember that some sites did not have immediate manure incorporation, and volatile losses could be included in the availability estimate. The same could hold for potential nitrate losses as several applications were made in the fall or winter. However, analysis of data by individual site does not confirm that the length of time to incorporation changes the estimate of crop availability. It may mean that volatile losses happen quickly at application due to the high manure pH and ammonium/uric acid characteristics, and along with the important sourcing of crop-available N from the ammonium/uric acid content, remaining available N is similar for immediate (within 24 hours) and many days until incorporation. This may mean that future guidelines for estimating N supply from poultry manure may not require an adjustment for volatile loss. Corn and Soil Responses to Manure and Fertilizer Phosphorus Corn Grain Yield Response The observed corn grain yield responses at the six demonstrations conducted each year are shown by three graphs in Fig. 13. To simplify the presentation of the results the figures show yields for six treatments: the control receiving neither manure nor fertilizer P, the average of plots receiving no manure and either 100 or 150 lb P2O5/acre (which did not differ at any field), the low and high manure rates without fertilizer P, and the low or high manure rates with additional fertilizer P (averages for fertilizer P rates of 50 and 100 lb P2O5/acre). The results showed very high yield variability among replications and treatment averages in several fields, which is common in manured fields and often is explained by small-scale soil-test P and manure application variability. Either manure or fertilizer P or both increased corn yield (statistically) at ten demonstrations (Sites 1, 3 through 7, 12, 14, 16, and 17). The statistical yield responses were as high as 30 bu/acre in some sites. The bars in Fig. 13 clearly show high variability at some sites, where moderate yield differences between treatments (sometimes as expected and other times not) often were not significant and should not be considered because likely resulted from high within-site variation. The results demonstrated three important P management issues. First, the demonstrations showed that corn yield responses are very likely in soils testing Very Low or Low in P, less likely in soils testing Optimum, and unlikely in soils testing High or Very High. The Iowa P management guidelines indicate a probability of yield response of 80%, 65%, and less than 25% for the interpretation classes Very Low, Low, and Optimum, respectively. Soil-test P by one or more of the three methods (the methods sometimes differed at classifying a site) was Optimum or less in the responsive fields except for Site 16, which tested above Optimum by the three methods. On the other hand, Site 10 was the only demonstration in which corn did not respond (statistically) to fertilizer or manure P when soil-test P was Optimum or less by the three

13
methods. This field had the highest yield among all sites and perhaps excellent growing conditions allowed for very efficient exploration of soil by the corn roots, although a lack of yield response may point to high variability in soil-test P. Second, statistical analyses indicated that P fertilization after manure application did not increase grain yield at any individual site. In some sites, however, P fertilization increased yield slightly when it was applied after applying the low manure rate and the 50-lb rate was enough. This was observed mainly at Sites 3, 6, and 12. Such a result is reasonable and can be explained for Site 12 because the manure P rate applied was the lowest among all sites, but cannot be explained for the other two sites and likely resulted from large variation in manure application and yield. There were not increasing trends due to supplemental fertilizer P application when the high manure rate was applied. When fertilizer P increased yield without manure the rate needed to maximize yield varied greatly across sites depending mainly on soil-test P and ranged from 50 to 100 lb P2O5/acre (the 150-lb rate never increased yield further than the 100-lb rate). Third, manure application sometimes increased corn yield further than fertilizer P and sometimes increased yield when fertilizer P did not. The bars in Fig. 13 and statistics showed that this was the case at Sites 1, 12, 16 (the only high-testing responsive site, and only to manure), and 17. Manure N and K effects on yield are unlikely because high fertilizer rates of both nutrients were applied across all the P plots but it is possible. Manure application effects on yield were also suggested (although less clearly) by results from the N small plots for some sites or manure sources (such as for broiler manure in Fig. 7). Perhaps application of manure nutrients other than N, P, and K or manure effects on soil physical properties could explain the additional response to manure P compared with fertilizer P. Figure 14 summarizes the grain yield responses to fertilizer P alone, manure alone, and manure plus additional P fertilization across all fields that showed a response to either P source. This figure again demonstrates three important points. One is that there was no yield response to P fertilizer after applying the low or high rates of poultry manure. Another is that yield for plots with manure but no P fertilizer were as high as or higher than yield with the highest fertilizer rate. Finally, although the differences do not reach statistically significance, the averages in this figure show that that high rate of manure increased yield slightly further than the low rate when no P fertilizer was applied and that supplemental P fertilizer increased yield more when the low manure rate was applied. The latter result was explained mainly by very low manure P application at one site and by very high manure application and yield variation at two other sites. This conclusion is supported by early corn growth responses to manure P discussed in the following section. Early Corn Growth Response Manure or fertilizer P increased early corn growth (V5 to V6 stage) statistically in about two-thirds of the demonstration sites. The growth responses occurred irrespective of initial soil-test P values or the grain yield response. Previous research with fertilizer and swine manure also observed early corn growth responded to P was unrelated to soil-test P and that an early corn growth did not necessarily result in increased grain yield. Early growth responses tended to occur or be larger at fields where soils remained wet early in the growing season and where

14
initial corn root growth may have been limited. Figure 15 illustrates the early plant growth response at each demonstration site. Early growth response to manure P was more common than for fertilizer P and often higher. This result agrees with observations of grain yield responses, and cannot be explained by the rates applied because fertilizer P rates were as high as 150 lb P2O5/acre. However, at Site 9 fertilizer P increased early growth but manure P did not. The layer manure applied at this field had the lowest total P concentration of all sites (Table 2), the lowest water soluble P concentration (together with Site 15, Table 3), and the spring application date was the second latest among all sites (Table 4). Averages across all 18 sites shown in Fig. 16 demonstrate an increase in early corn growth up to the 150-lb fertilizer P application rate, although the increase was largest for the 50-lb rate. Either the low or high manure rates increased early growth further than fertilizer P alone. The shape of the response curve for fertilizer P (almost flat at high P rates) confirms results discussed for data by site in that the reason for largest growth increase with manure was not only a higher total P application rate. Uptake of P in early corn tissues was very well related to early growth (data not shown) and responses tended to follow those of early growth. Therefore, the results provide evidence for frequent early growth and P uptake response to manure application due to its P content and also due to undetermined manure properties. Only in one of 18 sites did manure increase early growth less than fertilizer or did not increase it, and this result was explained by a low manure P analysis and a very late application date. Effects of Manure Application on Residual Soil-Test P Since poultry manure has N and P content at ratios that tend to over-apply P when N-based rates are applied, it is important to monitor soil P build-up by periodical soil sampling and soil P testing. Analysis of soil samples taken after corn harvest from the small P plots showed that P fertilization at various rates increased soil P in a linear manner across sites (Fig. 17). Application of 100 lb P2O5/acre, which is near the rate recommended to maintain soil-test P in the Optimum class for prevailing yield levels, increased soil P an average of 14 ppm. At the same time, an average application of manure at 119 lb P2O5/acre increased soil P by a slightly lower concentration (12 ppm). These results are approximately similar (within 2 or 3 ppm) to results shown for post-harvest soil samples taken form the long strips. The small difference between the soil-test P increases due to fertilizer or manure could be due to a slightly lower availability of P in poultry manure than for fertilizer. This should be expected since some of the P in manure can be organic and, although the manure water soluble P content is not a good index of manure P availability for a crop, data in Table 3 shows that only 7 to 44% of the total manure P is soluble in water. Therefore, these soil-test results show that a small portion of the manure P may not be available for the first year crop, and a smaller portion still remains unavailable as measured by soil testing after one crop harvest. Poultry Manure P First-Year Availability Detailed analyses of grain yield, early corn growth and P uptake, and post-harvest soil-test P responses still are being conducted at this time. The preliminary results shown and discussed above provide no strong evidence for differences between fertilizer and manure P effects on corn. Because of the availability of poultry manure-P itself or effects of manure application on

15
growth other than through increased N, P, or K supply (often both reasons), seldom did fertilizer P increase corn early growth or grain yield more than manure and often the manure increased both further. It is very clear that the current assumption of 60% first-year availability of poultry manure P grossly under-estimates the value of this P source. The only possible evidence for slightly lower availability of poultry manure P compared with fertilizer P was given by one demonstration, where the manure had the lowest P concentration of all sources used and was applied the latest, less than a week before planting corn. The other possible piece of evidence comes from post-harvest soil P testing, which showed a slightly lower soil P build-up for manure P than for fertilizer P. However, we believe this evidence is very weak and in most conditions poultry manure P was similar to or better than fertilizer P for the reasons mentioned. Moreover, even the low manure rate (which is commonly applied by Iowa farmers and applied insufficient N) often applied enough P to maximize both early growth and grain yield of corn. With the exception of only two demonstrations, the low manure application rates were similar to or higher than P rates recommended for low-testing soils and similar to or much higher than recommended removal-based P rates for corn.
Demonstration of Nitrogen and Phosphorus Loss with Surface Runoff Surface Runoff Nitrogen The concentration of total N and ammonium-N in surface runoff shortly after manure application was significantly affected by manure application rate and incorporation (Fig. 18A and 18B). Concentrations of total N and ammonium-N in runoff increased proportionally to manure application rate, and concentrations were greater when manure was not incorporated. Tillage did not increase runoff concentration of ammonium-N in the control that received no manure, but increased runoff total N concentration. This indicates greater soil loss (and soil N) with runoff after tillage. Ammonium-N losses with manure application were reduced to background levels (control treatment) when manure was incorporated (a decrease of approximately 90%). Trends for total and ammonium-N loss per unit area (loads) were similar to those for N concentrations and are not shown. Concentrations of nitrate-N in runoff water were below 2.5 ppm for all treatment combinations and no significant effect from manure application or incorporation was found (Fig. 18C). The nitrate-N concentration in the poultry manure was very low, thus one would not expect an increase in nitrate in runoff water shortly after manure application. Increase in soil nitrate–N concentration after manure application depends upon favorable nitrification conditions and time for nitrification to take place. With the simulated rainfall being applied shortly after manure application, significant nitrification of the manure ammonium-N would not have occurred. Also, with nitrate being highly soluble in water, it would be expected that rainfall would predominantly move nitrate into the soil with initial infiltration rather than with subsequent runoff water. Surface Runoff Phosphorus Manure application increased dissolved-reactive P (DRP), bio-available P (BAP), and total P

16
concentration in the runoff with or without manure incorporation into the soils. Figure 19 shows results for averages across the eight fields where rainfall simulations were conducted. However, the effect of manure application on runoff P was much larger when the manure was not incorporated. Incorporation of the manure into the soil with tillage significantly reduced P loss. Trends for total P loss per unit area (loads) were similar to those for P concentrations and are not shown. Therefore, these results demonstrated that incorporation of manure with tillage that does not significantly increase soil erosion can greatly reduce the risk of P loss with surface runoff immediately after manure application. Data in Fig. 19 also show that the DRP fraction accounted for the majority of the BAP in runoff and, in turn, BAP (the sum of these two forms) comprised a very large proportion of the total runoff P. The DRP and BAP fractions represent the most readily available runoff P for algae growth in surface water bodies. The manure and tillage effects on the proportion of these two runoff fractions across all sites can be better observed in Fig. 20. This figure clearly demonstrates that manure application increased the proportion of both DRP and BAP in runoff and that tillage reduced it to slightly more than one-half. Two other interesting results were that the proportion of DRP in BAP was not affected by manure application or tillage, and that the proportions of these fractions were statistically similar for the low and high manure application rates. Therefore, the results of these rainfall simulations demonstrated a very high risk for both total and algal-available runoff P for runoff events shortly after applying manure without incorporation into the soil.
SUMMARY OF OUTREACH ACTIVITIES The project was very successful at reaching producers, custom manure applicators, and manure brokers to demonstrate, discuss, and collect data relevant to utilization of nutrients in poultry manure. The project, its objectives, and both agronomic and environmental issues of poultry manure nutrients management were explained and discussed during the field season and off-season periods with the farmer cooperators. In addition to the farmers and custom manure applicators involved at six demonstration sites, about 30 persons were directly involved each year by receiving information about the project, providing input, and helping in a variety of ways. Presentations and workshops were conducted for small groups targeted to a small region or in open classic extension meetings developed in cooperation with other agencies and ongoing related projects targeting producers, crop consultants, custom manure applicators, and nutrient management planners. These agencies or projects included ISU Extension, producers’ associations, IDALS Learning Farms Project, the Egg Council, a DNR-funded on-farm runoff P project, and several poultry agribusiness. This collaboration augmented the impact of the project and allowed for efficient use of resources. Extension presentations, field days, and workshops began to be developed early in 2004 and continued until summer 2007. Initially the focus was on poultry manure nutrient management issues based on previous knowledge and current management guidelines. Over time we added shared specific project-related issues such as methodologies and preliminary results related to the value of poultry manure nutrients and environmental issues and poultry manure management effects on N and P loss through surface runoff. The small meetings and field days allowed for open discussions and exchange of ideas in an environment that encouraged as much participation as possible from the attendees. At several field days we also demonstrated the general field methods, the rainfall simulation technique, and

17
runoff collection procedures that were used in the demonstrations. The first year there were presentations at the Agriculture and the Environment Conference, a workshop for solid manure applicator certification, Manure Nutrient Management Clinic and Field Day, Clay County Growers Association field day, two ISU research and demonstration farms field days, South Fork Watershed Alliance field day, and four ISU Extension conferences/workshops in various locations where manure and nutrient management or environmental issues were discussed. During the second year, presentations were given again at the Agriculture and the Environment Conference, Manure Nutrient Management Clinic and Field Day, two field days at producers' fields, two field days organized by the ISU research and demonstration farms, Iowa Poultry Association Festival, four "round-table" meetings conducted with animal and crop producers, and five ISU Extension conferences/workshops at various locations. During the last year, presentations or issue discussion were at a meeting of the Nutrient Management Task Force that involved technical personnel from ISU, DNR, and NRCS, a conference organized by an inter-agency working Iowa-Illinois group in Illinois, a group of Iowa CCA crop consultants, the Agriculture and the Environment Conference, a tillage/nutrient management conference a manure nutrient management conference in cooperation with Rembrandt Enterprises, the Manure Nutrient Management Clinic and Field Day, the Conservation Systems and Manure Nutrient Management Field Day near Greenfield, the ISU Extension field-crop specialists In-Service Training in Ames; and the Iowa Egg Council Symposium in Ames, a Crop Advantage Series conference, five talks to custom manure applicators attending the DNR-ISU program for dry manure application certification in five counties, at a meeting with board members of the Iowa Soybean Association, and at a workshop at the Iowa Water Pollution Control Association’s annual biosolids conference. Another useful side product of the activities was that we introduced several agronomic and environmental issues and procedures related to manure nutrient management for both on-farm demonstration and outreach activities to three research or extension associates, two graduate students, and five undergraduate students who collaborated in different activities of the project over time. Results of the project are being used at this time to prepare an ISU Extension fact sheet focusing on availability of nutrients in manures and work already began to update the main ISU Extension manure nutrient management publication (Pm-1811). Although formally the project ended, we are already planning a series of extension talks to share project results for the 2007 late fall and winter seasons.
SUMMARY This project was very successful at reaching Iowa producers, custom manure applicators, and manure brokers to demonstrate, discuss, and collect new data relevant to utilization of nutrients in poultry manure. The reactions from cooperators and persons contacted confirmed the great need for this project. The education activities based on project results will continue into the future as summary and analysis of all data from the three years are completed. The results of the 18 demonstrations confirmed the significant value of the nutrients in poultry manure. Corn grain yield increases from manure application measured from long strips ranged from 7 to 68 bu/acre
18
and averaged 40 bu/acre across fields and manure application rates. The grain yield response to supplemental N fertilization after applying manure indicated that poultry manure N is not fully available in the year of application, and ranged from 37 to 51% of comparable N fertilizer rates. These values are lower than currently suggested for manure nutrient planning in Iowa, but do include any field losses that may have occurred, such as ammonia volatilization. Data continues to be analyzed and these figures are preliminary and subject to change. Both corn grain yield and early growth responses indicated that poultry manure P availability is much higher than the current 60% estimate used in Iowa but is not 100%, and data continue to be analyzed at this time. The project demonstrated that supplemental N fertilizer often is almost always needed when poultry manure having average nutrient analysis is applied at rates commonly used by farmers (about 2 tons/acre). However, supplemental P fertilizer seldom is needed when these manure rates are applied because of the total amounts of N and P applied and its availability as long the manure is applied uniformly and the total P applied is within current recommendations according to soil-test P. In fact, these poultry manure application rates often apply more P then needed for corn and enough for one additional crop. Results for both nutrients suggested that the reason for lower poultry manure nutrient availability compared with fertilizers is not solely due to the plant availability of N or P forms themselves. Use of manure nutrients involves a higher degree of error and uncertainty than for fertilizers due to heterogeneity of the manure material, nutrient content variation, manure sampling error, difficulties for uniform application, and (for manure N) probably high rates of N loss through volatilization while the manure is being applied and after application. Study of manure sources, manure nutrient analyses (such as total nutrient content, proportion of soluble N and P, carbon content, and others), and site conditions continue at this time and should help identify reasons and conditions in which a lower efficiency is most likely.

19
TABLES AND FIGURES Table 1. Locations, soils, and initial soil-test values before applying poultry manure at 18
demonstration sites from 2004 through 2006 (six each year). Ranges for Long Strips Small Plot Areas M3P† M3K†
Site County Soil Series M3P‡ OP M3K pH OM§ Min Max Min Max -------- ppm ------- % ------------- ppm -------------
1 Story Biscay 12 9 92 7.5 8.6 13 29 83 148 2 Clay Marcus 28 14 141 6.2 6.0 27 39 127 141 3 Bremer Readlyn 14 9 155 7.3 3.3 10 16 126 181 4 Union Sharpsburg 10 5 110 6.8 4.2 13 24 121 177 5 Union Sharpsburg 11 7 220 6.5 4.7 5 10 157 163 6 Palo Alto Clarion 17 10 102 6.4 5.0 10 31 80 115 7 Greene Clarion 31 12 115 6.4 2.9 21 42 88 139 8 Dallas Cylinder 25 10 178 6.5 5.2 16 31 94 114 9 Clay Marcus 50 23 149 6.3 6.2 22 41 127 144
10 Cherokee Galva 14 8 130 7.0 4.3 18 29 151 157 11 B. Vista Primghar 24 11 153 6.6 5.0 20 21 149 163 12 Cherokee Galva 17 9 161 6.2 4.2 17 28 162 234 13 Washington Nevin 32 21 151 6.6 3.6 20 25 138 157 14 Dallas Clarion 11 6 92 6.5 3.0 11 16 97 116 15 Wright Okoboji 36 10 172 7.7 8.0 28 45 137 170 16 Adams Sharpsburg 31 17 238 6.3 4.4 27 28 278 302 17 Union Sharpsburg 11 6 154 6.5 3.3 11 11 133 136 18 Taylor Nira 29 14 186 5.9 3.7 18 42 190 254
† M3P and M3K, soil P and K by the Mehlich-3 method. ‡ OP, soil P by the Olsen method. § OM, soil organic matter.

20
Table 2. Poultry manure type and results of manure analyses for six samples collected during at
each site (averages and ranges expressed on as-is basis). Moisture Total N Total P2O5 Total K2O
Field Type Avg Range Avg Range Avg Range Avg Range ------- % ------- ------------------------------- lb/ton --------------------------------
1 Turkey 52 47-56 51 44-61 51 47-54 30 25-34 2 Layer 51 46-59 54 40-75 43 40-49 22 19-25 3 Turkey 48 45-52 58 54-62 59 53-65 36 32-40 4 Broiler 49 38-60 56 41-69 68 50-83 50 32-64 5 Broiler 48 41-57 63 52-73 62 45-74 50 36-63 6 Layer 53 51-55 45 40-53 42 40-43 20 18-22 7 Layer 15 13-17 76 66-94 69 66-75 54 49-58 8 Layer 16 15-19 70 62-79 61 50-67 50 44-53 9 Layer 46 41-51 83 65-99 40 37-46 22 21-23
10 Turkey 35 32-40 66 56-75 60 50-75 35 32-37 11 Turkey 39 33-44 55 51-58 61 53-69 35 33-37 12 Turkey 36 28-49 54 37-65 53 46-60 31 24-36 13 Turkey 33 25-38 39 23-48 70 51-99 27 21-32 14 Pullet 27 23-32 79 69-91 83 72-90 55 46-63 15 Pullet 37 35-40 74 63-80 58 53-61 32 29-36 16 Broiler 36 31-43 61 56-68 76 62-86 66 59-74 17 Broiler 36 30-44 68 56-77 93 70-121 69 57-86 18 Broiler 25 23-29 78 70-87 76 67-85 56 50-60

21
Table 3. Additional poultry manure analyses.
Site pH C:N Ratio† NH4-N‡ WSP§
% of Total Nutrient 1 7.9 5.8 59 33 2 8.0 4.6 50 17 3 7.4 6.1 49 30 4 7.7 6.1 50 41 5 7.1 6.0 48 42 6 8.1 5.2 62 16 7 8.2 6.6 51 18 8 8.3 6.9 53 24 9 7.6 4.2 39 7
10 6.6 7.4 59 27 11 6.8 7.5 55 31 12 8.2 8.8 52 33 13 8.0 9.9 43 25 14 7.5 5.5 42 17 15 7.4 6.3 38 7 16 8.0 7.4 41 23 17 7.4 6.2 37 34 18 6.0 7.3 37 44
† Total carbon to total N ratio. ‡ Ammonium-N. § Water-soluble P.

22
Table 4. Poultry manure and manure nutrient application rates at 18 demonstration sites.
Application Days to Manure Total N Total P2O5 Total K2O Site Date Incorp. Low High Low High Low High Low High
- ton/acre - ---------------------------- lb/acre ----------------------------- 1 2/12/2003 150 1.1 2.0 56 102 55 102 33 60 2 4/16/2004 1 1.9 3.7 102 199 82 160 42 80 3 4/6/2004 20 1.9 3.8 111 221 112 223 68 135 4 4/30/2004 1 1.9 3.7 107 208 129 252 94 183 5 5/3/2004 1 1.9 3.7 121 235 119 231 94 184 6 4/16/2004 1 2.2 4.1 96 180 90 168 43 80 7 3/9/2005 NI 1.5 2.4 126 210 115 192 90 150 8 3/15/2005 25 1.7 4.1 89 212 78 182 63 149 9 4/28/2005 1 1.7 3.6 172 366 84 178 45 96
10 10/14/2004 1 1.2 2.0 68 113 61 104 35 60 11 4/15/2005 1 1.2 2.1 70 123 78 137 44 77 12 10/26/2004 180 1.1 2.7 44 104 43 102 26 60 13 11/2/2005 NI 5.5 9.3 218 370 382 650 149 253 14 11/4/2005 3 2.3 3.6 188 288 198 303 131 201 15 11/22/2005 1 2.0 4.1 148 307 117 243 63 131 16 4/10/2006 NI 2.1 4.6 125 280 155 346 134 299 17 4/21/2006 1 1.8 4.2 125 284 170 386 125 287 18 1/24/2006 120 2.1 4.3 168 335 164 327 120 240

23
Table 5. Chlorophyll meter reading at VT (tassel) corn
stage as affected by manure rate applied in the field-length strips.
Manure rate Site Check Low High Significance 1 62 62 63 ns 2 48 54 58 * 3 52 55 55 ns 4 42 47 48 * 5 51 48 53 ns 6 53 53 61 * 7 58 64 64 * 8 48 52 59 * 9 40 49 52 * 10 40 47 49 * 11 49 50 54 * 12 51 52 56 * 13 43 51 57 * 14 58 59 60 ns 15 47 58 62 * 16 40 47 51 * 17 50 51 52 ns 18 46 52 53 * Average 49 53 56 *

24
Table 6. Late spring soil nitrate-N concentration as
affected by manure rate applied in the field-length strips.
Manure rate Site Check Low High Significance
- - - - - - ppm - - - - - - 1 26 35 33 ns 2 10 19 25 * 3 15 18 19 ns 4 11 14 15 * 5 14 20 26 * 6 10 12 24 * 7 10 28 26 * 8 6 11 16 * 9 8 18 27 * 10 9 11 12 * 11 12 15 19 * 12 6 8 9 * 13 14 20 27 ns 14 24 34 42 ns 15 8 13 19 * 16 4 5 8 ns 17 16 34 38 ns 18 9 16 17 * Average 12 18 22 *

25
Table 7. Lower corn stalk nitrate-N concentration at plant
maturity as affected by manure rate applied in the field-length strips.
Manure rate Site Check Low High Significance
- - - - - - ppm - - - - - - - 1 2039 3757 3112 ns 2 2 0 83 * 3 72 392 892 * 4 0 0 0 † 5 0 250 631 * 6 0 0 280 * 7 27 608 18 * 8 79 11 1207 * 9 23 63 1567 * 10 2 13 13 * 11 17 41 231 * 12 17 56 206 * 13 19 13 590 * 14 1348 2316 5298 ns 15 20 160 1498 * 16 7 37 22 ns 17 29 1430 1000 * 18 7 6 800 * Average 190 433 687 * † All cornstalk nitrate levels were below detectable limits.
26
Table 8. Corn grain yield response to fertilizer N applied to strips that received none, low, or high manure application rates. Manure rate
Site Check Low High - - - - bu/acre - - - -
1 10 * 24 * 24 * 2 80 * 82 * 67 * 3 43 * 39 * 7 * 4 74 * 61 * 81 * 5 14 * 31 * 5 * 6 82 * 31 * 12 * 7 44 * 48 * -11 * 8 28 * 41 * -12 * 9 81 * 61 * 16 *
10 69 * 44 * 11 * 11 59 * 37 * 23 * 12 89 * 56 * 17 * 13 68 * 31 * 16 * 14 8 * 6 * 8 * 15 89 * 36 * 5 * 16 91 * 72 * 25 * 17 87 * 37 * 53 * 18 79 * 32 * 45 *
Average 61 43 22 * Yield increase is statistically significant.
27
Table 9. Late-spring soil nitrate-N concentration and increase due to manure
and fertilizer N application across all sites. Poultry Manure Application Increase Due to Manure†
Fertilizer N Check Low High Low High lb N/acre - - - - - - - - - - - - - - - nitrate-N, ppm - - - - -- - - - - - -
0 13 18 21 5 8 100 31 38 43 7 12
Increase Due to Fertilizer N‡ 18 20 22
† Soil nitrate differences between the check (no manure applied) and the manure rates. ‡ Soil nitrate differences between the no fertilizer N and the 100 lb N/acre rate within
each manure rate.
Table 10. Post-harvest soil profile nitrate-N concentration as affected by manure rate and two rates of fertilizer N.†
Soil No Fertilizer N 100 lb Fertilizer-N/acre Depth Check Low High Check Low High feet - - -- - - - - - - - - - - - - - nitrate-N, ppm - - - - - - - - - - - - - - - - - -
Responsive sites (7 sites)0-1 3 3 4 4 5 6 1-2 1 2 2 2 3 4 2-3 1 1 1 1 2 3 3-4 1 1 1 1 2 2
Non responsive sites (2 sites)0-1 7 7 5 5 7 7 1-2 5 10 9 8 12 10 2-3 5 10 11 11 10 14 3-4 6 7 8 8 8 11
† Significant statistical differences between manure rate, fertilizer rate, and at least two of the depths.

28
Table 11. Estimate of first year manure-N fertilizer equivalence and manure-N availability determined from grain yield and chlorophyll meter reading response.
Grain Yield Chlorophyll Meter Reading
Manure Fertilizer Equivalent N Availability† Fertilizer Equivalent N Availability
Type Average SE§ Average SE Average SE Average SE
- - - lb/acre - - - - - - % - - - - - - lb/acre - - - - - - - % - - - - Broiler 47 10.0 35 6.3 28 10.2 24 4.8 Layer 81 10.1 38 6.3 65 12.3 37 5.8 Turkey 76 8.6 56 5.4 66 7.7 44 3.6 Average 43 35 † N availability = 100×(fertilizer equivalent)/(applied total-N), calculated individually for each site. § SE, standard error of the mean.
-40
-30
-20
-10
0
10
20
30
40
0 10 20 30 40 50 60 70 80 90 100
Indi
vidu
al S
ampl
e D
iffer
ence
Fro
m S
ite A
vera
ge
(lb/to
n)
Average Site Analysis (lb N, P2O5, or K2O/ton)
Poultry Manure Sample Analyses (As-Is Basis)
Total-NTotal-PTotal-K
All Site AverageN: 63 lb N/tonP: 63 lb P2O5/tonK: 41 lb K2O/ton(18 sites, 108 samples)
Fig. 1. Variation of poultry manure total N, P, and K in six samples collected while manure was
being applied at each of 18 demonstrations in relation to the site average analysis.

29
1 2 3 4 5 6 7 8 9 10 11 12 13 14 15 16 17 18
Cor
n Yi
eld
(bu/
acre
)
60
80
100
120
140
160
180
200
220
2004 20062005
No manure Low manureHigh manure
Fig. 2. Corn grain yield from long field strips as affected by two rates of poultry manure (see Table
4 for rates applied).
1 2 3 4 5 6 7 8 9 10 11 12 13 14 15 16 17 18
Early
Cor
n G
row
th (g
/pla
nt)
0
2
4
6
8
10
12
2004 20062005
No manure Low manureHigh manure
Fig. 3. Corn early growth (V5 to V6 stage) from long field strips as affected by two rates of poultry
manure (see Table 4 for rates applied).

30
1 2 3 4 5 6 7 8 9 10 11 12 13 14 15 16 17 18
Early
Cor
n P
Upt
ake
(mg/
plan
t)
0
10
20
30
40
50
60
2004 20062005
No manure Low manureHigh manure
Fig. 4. Corn early (V5 to V6 stage) P uptake from long field strips as affected by two rates of
poultry manure (see Table 4 for rates).
1 2 3 4 5 6 7 8 9 10 11 12 13 14 15 16 17 18
Soil
P Af
ter H
arve
st (p
pm)
0
20
40
60
80
100
120
2004 20062005
No manure Low manureHigh manure
Fig. 5. Post-harvest soil-test P buildup (Mehlich-3 test) for long field strips as affected by two rates
of poultry manure (increases over the non-manure control, see Table 4 for rates applied).

31
Fertilizer N, lb N/acre
0 50 100 150
Yie
ld in
crea
se, b
u/ac
re
0
20
40
60
80
No manure
Manure high rateManure low rate
a
b
c
a
b
a
b
a
Fig. 6. Corn grain yield response to poultry manure and fertilizer N application across all
responsive sites. Different letters indicate statistical differences between manure rate at each fertilizer N rate.

32
Broiler
0 50 100 150
Yie
ld in
crea
se, b
u/ac
re
0
20
40
60
80 Layer
Fertilizer N, lb/acre
0 50 100 150
Turkey
0 50 100 150
No manure
Manure high rateManure low rate
Fig. 7. Corn grain yield response to poultry manure and fertilizer N application for each poultry manure source across all responsive
sites.

33
Fertilizer N, lb/acre
0 50 100 150
Incr
ease
in C
M re
adin
gs
0
2
4
6
8
10
12
14
a
b
c
a
b
aa
No manure
Manure high rateManure low rate
Fig. 8. Chlorophyll meter (CM) reading response to poultry manure and fertilizer N application at
the corn tassel growth stage across all responsive sites. Different letters indicate statistical differences between manure rates at each fertilizer N rate.

34
Rel
ativ
e yi
eld,
%
0
50
60
70
80
90
100
No manureManure low rateManure high rate
Fertilizer N, lb/acre
0 50 100 150
Rel
ativ
e C
M, %
0
50
60
70
80
90
100
97%
97%
Fig. 9. Relative corn grain yield and relative CM value for poultry manure and fertilizer N
application across all responsive sites.

35
Soil nitrate-N, ppm
0 10 20 30 40 50 60
Cor
n yi
eld
incr
ease
, bu/
acre
-20
0
20
40
60
80
100
No manure
High manure rateLow manure rate
Fig. 10. Corn yield response to 100 lb fertilizer-N/acre and late-spring soil nitrate test value with poultry manure application rates.
Fertilizer N, lb/acre
0 50 100 150
Low
er c
orn
stal
k ni
trate
-N, p
pm
0
1000
2000
3000
4000
No-manureManure low rateManure high rate
Fig. 11. Lower cornstalk nitrate-N concentration as affected by poultry manure and fertilizer N
rate, data from all yield responsive sites.
36
Manure total-N, lb/acre
0 100 200 300 400
Prof
ile n
itrat
e-N
, lb/
acre
0
50
100
150
200 No aditional fertilizer NAditional fertilizer N
No aditional fertilizer NAditional fertilizer N
Responsive sites (7 sites) Non responsive sites (2 sites)
Fig. 12. Post-harvest profile soil nitrate-N (0 to 4 ft depth) for each poultry manure total-N rate and with and without additional fertilizer-N application at 100 lb N/acre.

37
100
125
150
175
200
225
250Site 1 *
Site 4 *
Site 3 *Site 2
Site 5 *
Site 6 *C
orn
Gra
in Y
ield
(bu/
acre
)
100
125
150
175
200
225
250
Site 7 *
Site 10Site 9
Site 8
Site 11 Site 12 *
100
125
150
175
200
225
250Site 13
Site 16 *
Site 15
Site 14 *Site 17 *
Site 18
Check
Low Manu + Fert
FertilizerLow Manure
High ManureHigh Manu + Fert
Fig. 13. Fertilizer and manure P application effects on corn grain yield at 18 sites. Averages for
plots receiving neither manure nor fertilizer P, plots receiving no manure and either 100 or 150 lb P2O5/acre, the low and high manure rates without fertilizer P, and the low or high manure rates with supplemental fertilizer P rates of 50 and 100 lb P2O5/acre.

38
P Fertilizer Rate (lb P2O5/acre)0 50 100 150
Cor
n Yi
eld
(bu/
acre
)
170
175
180
185
190
195
200
No Manure
Low Manure
High Manure
Low - 119 lb P2O5/acreHigh - 231 lb P2O5/acre
Average Manure-P Rates
Fig. 14. Fertilizer and manure P application effects on corn grain yield across 10 sites where
fertilizer or manure P increased yield. The manure P rates shown are averages across the 10 responsive sites.

39
0
2
4
6
8
10
Site 1
Site 4
Site 3
Site 2 *
Site 5 *
Site 6
Early
Cor
n G
row
th (g
/pla
nt)
0
1
2
3
4
5
Site 7 *
Site 10 *
Site 9 *
Site 8 *
Site 11 *Site 12
0
2
4
6
8
10
Site 13 *
Site 16 *
Site 15
Site 14 *
Site 17 *
Site 18 *
Check
Low Manu + Fert
FertilizerLow Manure
High ManureHigh Manu + Fert
Fig. 15. Fertilizer and manure P application effects on early corn growth (V5 to V6 stage) at 18
sites. Averages for plots receiving neither manure nor fertilizer P, plots receiving no manure and either 100 or 150 lb P2O5/acre, the low and high manure rates without fertilizer P, and the low or high manure rates with supplemental fertilizer P rates of 50 and 100 lb P2O5/acre.

40
P Fertilizer Rate (lb P2O5/acre)0 50 100 150
Cor
n Ea
rly G
row
th (g
/pla
nt)
2.5
3.0
3.5
4.0
4.5
No Manure
Low Manure
High Manure
Low - 109 lb P2O5/acreHigh - 214 lb P2O5/acre
Average Manure-P Rates
Fig. 16. Fertilizer and manure P application effects on early corn growth (V5 to V6 stage) across all
18 sites. The manure P rates shown are averages across all sites except Site 13, where a manure rate much higher than desired was applied.
P Fertilizer Applied (lbs P2O5/ac)0 50 100 150
Meh
lich-
3 P
Leve
l (pp
m)
30
40
50
60
70
80ControlLow Manure (119 lb P2O5/ac)High Manure (236 lb P2O5/ac)
14 ppm12 ppm
12 ppm
Fig. 17. Soil-test P increases from manure and fertilizer application as measured on post-harvest
soil samples.

41
Non-incorporated
Nitr
ate-
N, p
pm
0
2
4
6
8
10
Am
mon
ium
-N, p
pm
0
5
10
15
20
25
30
B. Ammonium-N
Tota
l-N, p
pm
0
10
20
30
40
50
Control No Manure Low Manure RateHigh Manure Rate
A. Total-N
Incorporated
C. Nitrate-N
Fig 18. Total-N, ammonium-N, and nitrate-N concentration in surface runoff as affected by manure
application rate and incorporation with tillage. Vertical lines in the bars indicate 95% confidence limits.

42
Bioavailable P
0
5
10
15
20
25 ControlLow ManureHigh Manure
Total P
0
5
10
15
20
25
30
35
40 ControlLow ManureHigh Manure
Dissolved Reactive PP
Con
cent
ratio
n in
Run
off (
ppm
)
0
5
10
15
20
Tillage
No TillageControlLow ManureHigh Manure
Tillage
No Tillage
Tillage
No Tillage
Fig. 19. Effect of the manure application rate and incorporation into the soil with tillage on the
concentration of three P fractions for a runoff event shortly after application. The control was untilled or tilled but received no manure or fertilizer P.

43
Prop
ortio
n of
Tot
al P
(%)
0
10
20
30
40
50
60
70DRPBAP
No Tillage
With Tillage
Control
Manure Low
Manure High
Control
Manure Low
Manure High
Fig. 20. Percentage of dissolved and bio-available P in the total runoff P for rainfall events shortly
after applying poultry manure with or without incorporation into the soil with tillage.
Related Documents


