Final Year Report 2015 Darren Machen 12021396 1 | Page Microplastic Ingestion by Mytilus edulis Cultivated for Human Consumption Final Year Report Darren Machen 12021396

Welcome message from author
This document is posted to help you gain knowledge. Please leave a comment to let me know what you think about it! Share it to your friends and learn new things together.
Transcript

Final Year Report 2015 Darren Machen
12021396
1 | P a g e
Microplastic Ingestion by Mytilus edulis Cultivated for Human Consumption
Final Year Report
Darren Machen 12021396

Final Year Report 2015 Darren Machen
12021396
2 | P a g e
Contents Page
Title Page Number
Figures, Images and Tables 3 1. Abstract 4 2. Introduction 5 3. Method 10 4. Results 13
4.1. S.E.M Findings 13 4.2. Plastic Abundance 14 4.3. Table of Abundance results 14
5. Statistical Analysis 15 5.1. Homogeneity of Variance 15 5.2. Normal Distributed Residual Values 16
5.3. Is There a Higher Amount of MP in a Sample Based on
the Location? 18 5.4. Plastic Particles Found 19 5.5. Size of Particles 20 5.6. Controlled Blanks 22 5.7. Results Summary 23
6. Discussion 24 6.1. Initial Problems 24 6.2. Identification 26 6.3. Chemical Properties 26 6.4. Size 28 6.5. Depuration 30 6.6. Combined Sewage Overflow 32
6.7. Mussel Health 36 6.8. Human Health 38 6.9. Conclusion 40
7. Acknowledgements 41 8. References 42

Final Year Report 2015 Darren Machen
12021396
3 | P a g e
Figures, Images and Tables
Figure Page Number
1. Particles Per Gram Equation 14 2. Test of Homogeneity of Variance 15 3. Histogram of Residual Data 16 4. Histogram of Residual Data 16 5. Normality Plot 16 6. Normality Plot 16 7. ANOVA 18 8. Graph of Particles 19 9. Histogram of Particles 20 10. Statistical Read Out for Size 20 11. Particles in Size Groups 20 12. Size in Groups Report
Image Page Number
1. Spectrum From S.E.M 2015 13 2. Plastic Particle From S.E.M 2015 13 3. Spectrum From S.E.M 2015 27 4. Mass of Particles From S.E.M 2015 29 5. CSO Map of Brixham Area 2015 33 6. CSO Map of Stirling Area 2015 34
Table Page Number
1. Plastic Abundance 14

Final Year Report 2015 Darren Machen
12021396
4 | P a g e
1. Abstract
Plastic is now ubiquitously present in the world’s oceans, seas and rivers with pieces
of plastic becoming smaller before finally becoming microplastics (MP). The aim of
this project was to find out if there was MP present in the mussel species Mytilus
edulis and if there was a possibility that this was entering the human food chain. It
would also look to establish if there this would be damaging mussel or human health.
The presence of MP in the marine environment is of particular concern because of
this interaction with and ingestion by marine biota. Mussels that had been grown for
human consumption were purchased from supermarkets and restaurants that had be
cultivated in four different UK locations. The mussel flesh was removed from the
shell, weighed and recorded before being cut into small pieces and digested in nitric
acid. After digestion, the mixture was filtered so the remaining particles could be
examined via scanning electron microscope. All four sample groups showed strong
evidence of plastic particles based on visual and chemical analysis. The smallest
recorded particle was 54.40 µm and the largest was 2140 µm. The mean particle
size was 439.81 µm ± 383.99 µm, falling into the expected limits of what is widely
recognised as MP. The evidence from this report has confirmed the findings of other
studies showing ubiquitously present MP within all of the sample groups. This report
has proven with confidence that the MP is presenting degree of risk on some level,
although further investigation would be beneficial. Increasing the size of the sample
group and using some more in-depth analytical tools would strengthen the work
shown but in no way takes away from what has been achieved as a starting point.
Final Year Report 2015 Darren Machen
12021396
5 | P a g e
2. Introduction
Plastics are synthetic organic polymers, and though they have only been produced
for just over a century (Derraik, 2002), their versatility has led to a dramatic increase
in usage throughout the world since the development of the first modern plastic
‘Bakelite’ in 1907 (Cole et al. 2011). The second half of the 20th century has seen
plastic become one of the most universally used, multipurpose materials in the global
economy (Plastics Europe, 2013). Since its introduction, the plastics industry has
experienced continual growth through the last 50 years. Year on year industry
growth of 8.7% (Plastics Europe, 2013) has cemented plastic in the lives of
consumers with plastic in one form or another being present in most products. First
reports in the 1970’s of plastic marine debris drew minimal attention from the
scientific community (Andrady, 2011), however, It has been estimated that 10% of
plastic produced globally now enters the oceans (Cole et al. 2013) while recovery of
material remains low at around 5% (Moore, 2008); this could have drastic
consequences to the variety of marine organisms that inhabit them. Global plastic
production reached 288 million tonnes in 2012, which was a 2.8% increase on 2011
(Plastics Europe, 2013). Based on the 2012 figure from Plastics Europe and the
estimation from Mathew Coles et al. (2013), there could be 28 million 800 thousand
tonnes of plastic debris entering the ocean each year. The five highest production
plastics, which account for approximately 90% of the total demand, are polyethylene
(PE), polypropylene (PP), polyvinylchloride (PVC), polystyrene (PS) and
polyethylene terephthalate (PET) (Zarfl and Matthies, 2010) suggesting that these
varieties will make up the majority of plastic entering the water cycle.

Final Year Report 2015 Darren Machen
12021396
6 | P a g e
Plastic is now ubiquitously present in the world’s oceans (Cauwenberghe and
Janssen, 2014), seas and rivers. The impact of large plastic debris, known as
‘macroplastic’, has long been studied due to their aesthetic and economic
repercussions in the tourist industry and the injury, death or ingestion by marine
birds and mammals (Cole et al. 2011). The physical characteristics of plastics show
a high resistance to ageing and minimal biodegradation (Moore, 2008). In fact,
plastic can take decades if not centuries to fully degrade (Cole et al. 2014); meaning
the plastic that is affecting marine biota now could be some of the very first plastic
ever produced. When macroplastics are exposed to UVB radiation in sunlight, the
oxidative properties of the atmosphere and the hydrolytic properties of seawater
(Moore, 2008), plastic polymers become brittle and start to fracture or break apart.
This mechanism of degradation continues until the pieces of plastic become smaller
and smaller (Moore, 2008), finally becoming microplastics (MP). This breakdown
over time defines these particles as secondary microplastics (Cole et al. 2011).
Primary microplastics are made to be of small size and are present in facial-
cleansers and cosmetics (Cole et al. 2011). The impact of MP on marine organisms
will depend on where they are located in the water column (Cauwenberghe and
Janssen, 2014). Typically, high density MP, such as the primary MP in cleansers, will
sink (Cauwenberghe and Janssen, 2014) and lower density particles, such as
secondary MP from degradation, will float (Cauwenberghe and Janssen, 2014) or be
suspended in seawater.

Final Year Report 2015 Darren Machen
12021396
7 | P a g e
For the purpose of this paper, the term microplastics (MP) will used to describe
plastic particles that have been subject to degradation by exposure to UVB radiation,
the atmosphere and seawater. The term microplastic (MP) is defined differently by
various researchers (Andrady, 2011). Generally particles that are <5mm are
categorised as MP (Moos, Burkhardt-Holm and Köhler, 2012); as particles of plastics
ranging in dimensions from a few µm to 500 µm (5mm) are commonly present
(Andrady, 2011). MP are barely visible to the naked eye, passing through a 500 µm
sieve but retained by a 67 µm sieve (0.06– 0.5mm) (Andrady, 2011) although plastic
particles smaller than this can be found. Due to their small dimensions, MP have a
similar size to planktonic organisms and other suspended particles (Cauwenberghe
and Janssen, 2014) that can be mistaken for food sources by filter feeding
organisms of a higher trophic level. This makes MP available to an array of marine
invertebrates that would otherwise not be affected from not feeding on larger pieces
of marine debris (Cauwenberghe and Janssen, 2014).
Seawater already contains numerous natural micro- and nano- particles, most of
them <100 nm in size (Andrady, 2011) that have no ill effect. However, MP particles
have the potential to do damage as they differ in nature to other natural particles of
the same or similar dimensions. Flow or run off from land can contain both biogenic
organic matter such as high molecular weight aliphatic hydrocarbons and
anthropogenic pollutants including polychlorinated biphenyls (PCBs). (Kanzari et al.
2014) which are persistent organic pollutants (POP) that can be absorbed by MP.
Ingestion of MP debris has been demonstrated for a range of marine organisms,
including Mytilus edulis (Bakir, Rowland and Thompson, 2012) in laboratory settings.

Final Year Report 2015 Darren Machen
12021396
8 | P a g e
Similarly, other studies have been conducted to understand what the effect of this
ingestion may have on the feeding organism.
Studies have shown the MP adsorb PCBs from surrounding seawater, bound to the
plastic matrix POPs escape rapid degradation and are subject to long range
transportation (Zarlf and Matthies, 2010). There is evidence that some POPs show a
preference to sorption on plastic polymers, showing different affinity according to
polymer type (Bakir, Rowland and Thompson, 2012). When ingested by organisms
there is a possibility that this becomes a biomagnification route for organic chemicals
adsorbed to or contained within the plastics (Zarfl and Matthies, 2010). The
presence of MP in the marine environment is of particular concern because of this
interaction with and ingestion by marine biota (Hidalgo-Ruz et al. 2012). In a
population of Great Shearwaters (Puffinus gravis) the concentration of PCBs was
show to be directly correlated to the amount of plastic that had been consumed (Zarfl
and Matthies, 2010). While MP has been reported in a variety of marine organism,
including M. edulis, the extent of the toxicological hazard to these organisms are not
well known (Hidalgo-Ruz et al. 2012).
Final Year Report 2015 Darren Machen
12021396
9 | P a g e
M. edulis is commonly grown in the United Kingdom and Europe for human
consumption meaning that there is a possibility for the transportation of MPs and
POPs to the human food chain. The concentration of POPs may only be a small
amount for a large organism but could be more problematic for M. edulis. The aim of
this study is to discover if mussels cultivated for human consumption contain MP and
how these have come to be ingested. It will look at what environmental,
topographical and biological factors that have attributed to the amount of MP within
the samples and aim to investigate possible damage.

Final Year Report 2015 Darren Machen
12021396
10 | P a g e
3. Method
Mussels that had been grown for human consumption were purchased from
supermarkets and restaurants to give a broad range of locations in the United
Kingdom. The four UK locations were the South West coast (Brixham), Ireland,
Stirling and the Shetland isles. Due to the mussels being ready to enter the food
chain, they had likely already been subjected to a depuration period that cleared
their guts of any effluent or possible plastic particles. 5 replicates would be made for
each site; this included 1 blank to ensure what was being found was from inside the
mussel flesh and not outside contamination. The mussel flesh was removed from the
shell, weighed and recorded before being cut into small pieces. A previous batch
test, carried out by myself, had given an ideal mussel weight of between 9 and 12
grams for 20ml of acid. To eliminate the risk of contamination each instrument was
cleaned with deionised water before moving on to the next sample. The resulting
mussel flesh was transferred to warming tubes and capped with loose fitting foil. The
foil would aid the reflux when acid was added by causing condensation of the fumes.
To this, 20ml of 69% nitric acid (HNO3) was added and left for 24 hours to steep in
the fume cupboard. The acid flesh mixture was then slowly heated up to 80˚C and
left for three hours. An adapted version of Classons (2013) method was used to yield
similar digested results. To be sure to achieve the predicted 80% digestion
efficiency, the two hours began after refluxing. Once this was completed the contents
of the warming tube was diluted with 250ml of deionised water heated to 80˚C in a
500ml conical flask. The warming tube was then flushed with deionised water to
remove any residual material (this waste water was added to the beaker). After a

Final Year Report 2015 Darren Machen
12021396
11 | P a g e
short cooling period the weakened acid mix was filtered. Filtration was carried out
using a 300ml vaccuum flask, Buchner funnel and 0.65 µm cellulose nitrate
membrane filters (47mm with a capture diameter of 37mm) before flushing the 500ml
beaker. The filters were left to air dry and stored in petriei dishes before be examined
under a Scanning Electron Microscope.
For the S.E.M a Phillips XL30 ESEM was used. The height of the detector was
adjusted to give an acquisition rate of 2 KCPS. The chamber pressure was 0.5 Torr
with an accelerator voltage of 20,000 KV working with the back scatter electron
detector and a spot size of six. Five pencil spots at points relating to 12, 3, 6, and 9,
and in the centre were made on the filter to be used as a rough guide to the centre;
this would show in the S.E.M how close the machine was to centre from the
prediction eliminating any problem of being placed too far off centre in the S.E.M.
From the centre, at 100x magnification each frame was counted out towards the
edge equalling eighteen frames (frame size 133mm x 0.91 mm). On every third
frame, any fibrous material was recorded. This was decided as a fair and unbiased
method against a random frame selection approach. Each suspected plastic fibre
was measured and had a picture taken for reference later (Fig.1). From prior
research there was a good indication of what MP would look like in various forms
allowing assumptions to be made before measurements were taken. This was
carried out for each of the twenty samples, including their blanks, and lab coats were
worn all times to protect the samples from contamination of clothing fibres. Once the
samples had all been finished they were analysed using statistical software.
Differences between location were analysed using a one-way ANOVA, the number

Final Year Report 2015 Darren Machen
12021396
12 | P a g e
of particles were log+1 transformed to ensure that assumptions of homogeneity of
variance and normally-distributed residual were met.

Final Year Report 2015 Darren Machen
12021396
13 | P a g e
4. Results
4.1. Scanning Electron Microscope (S.E.M) Findings
When looking at the particles under the S.E.M, fibrous strands were discovered that
varied in length. Each of the particles had a very strong peak of carbon (C), with a
smaller peak of Oxygen (O), this suggested it was of organic origin and suggested
that we were looking at a hydrocarbon that was plastic (Image 1). There we also
other peaks within the spectrum, namely Silica (Si) and Chlorine (Cl). The silica was
most likely from the back ground of the filter. In the picture the pieces that glow bright
white are silica and these are organisms that use silica and calcium in their body
construction. The chorine was most likely in the MP particles themselves. This could
suggest that the plastic was polyvinyl chloride (PVC). Image.2 is an example of what
was being found when looking at the S.E.M.
Image 1. Spectrum from S.E.M 2015 Image 2. Picture of Plastic particle from S.E.M 2015
Final Year Report 2015 Darren Machen
12021396
14 | P a g e
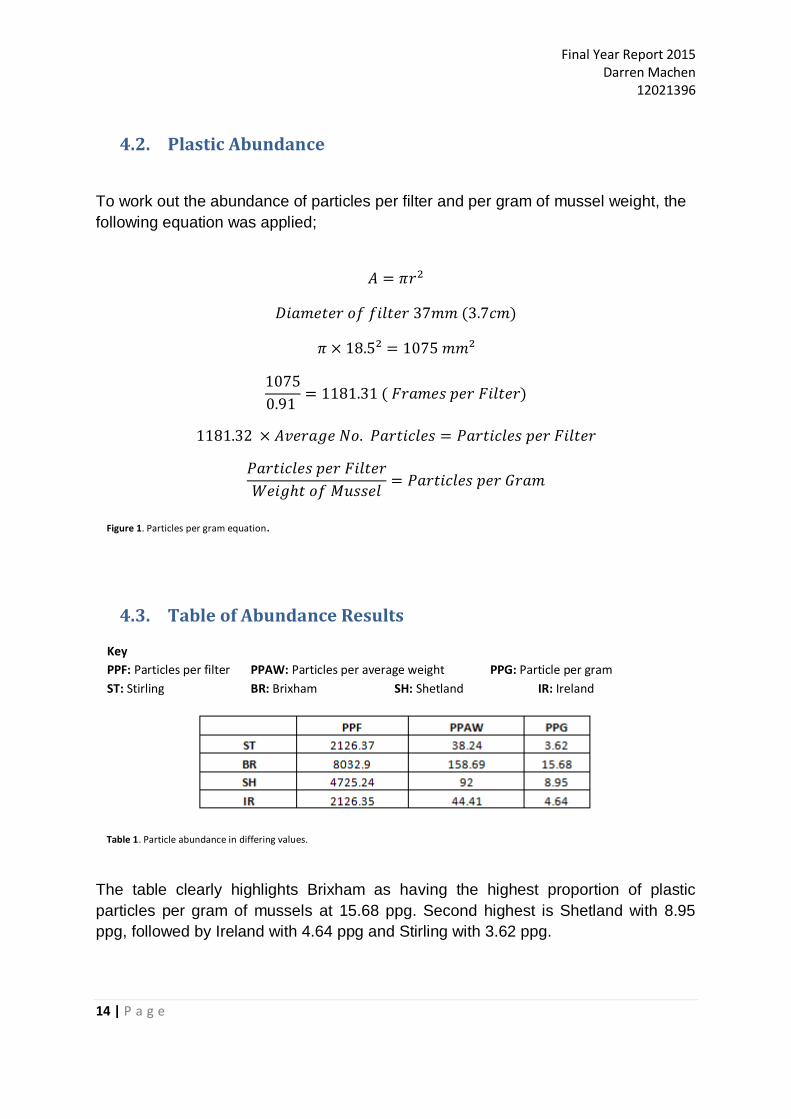
4.2. Plastic Abundance
To work out the abundance of particles per filter and per gram of mussel weight, the
following equation was applied;
𝐴 = 𝜋𝑟2
𝐷𝑖𝑎𝑚𝑒𝑡𝑒𝑟 𝑜𝑓 𝑓𝑖𝑙𝑡𝑒𝑟 37𝑚𝑚 (3.7𝑐𝑚)
𝜋 × 18.5² = 1075 𝑚𝑚²
1075
0.91 = 1181.31 ( 𝐹𝑟𝑎𝑚𝑒𝑠 𝑝𝑒𝑟 𝐹𝑖𝑙𝑡𝑒𝑟)
1181.32 × 𝐴𝑣𝑒𝑟𝑎𝑔𝑒 𝑁𝑜. 𝑃𝑎𝑟𝑡𝑖𝑐𝑙𝑒𝑠 = 𝑃𝑎𝑟𝑡𝑖𝑐𝑙𝑒𝑠 𝑝𝑒𝑟 𝐹𝑖𝑙𝑡𝑒𝑟
𝑃𝑎𝑟𝑡𝑖𝑐𝑙𝑒𝑠 𝑝𝑒𝑟 𝐹𝑖𝑙𝑡𝑒𝑟
𝑊𝑒𝑖𝑔ℎ𝑡 𝑜𝑓 𝑀𝑢𝑠𝑠𝑒𝑙= 𝑃𝑎𝑟𝑡𝑖𝑐𝑙𝑒𝑠 𝑝𝑒𝑟 𝐺𝑟𝑎𝑚
4.3. Table of Abundance Results
The table clearly highlights Brixham as having the highest proportion of plastic
particles per gram of mussels at 15.68 ppg. Second highest is Shetland with 8.95
ppg, followed by Ireland with 4.64 ppg and Stirling with 3.62 ppg.
Key
PPF: Particles per filter PPAW: Particles per average weight PPG: Particle per gram
ST: Stirling BR: Brixham SH: Shetland IR: Ireland
Table 1. Particle abundance in differing values.
Figure 1. Particles per gram equation.
Final Year Report 2015 Darren Machen
12021396
15 | P a g e
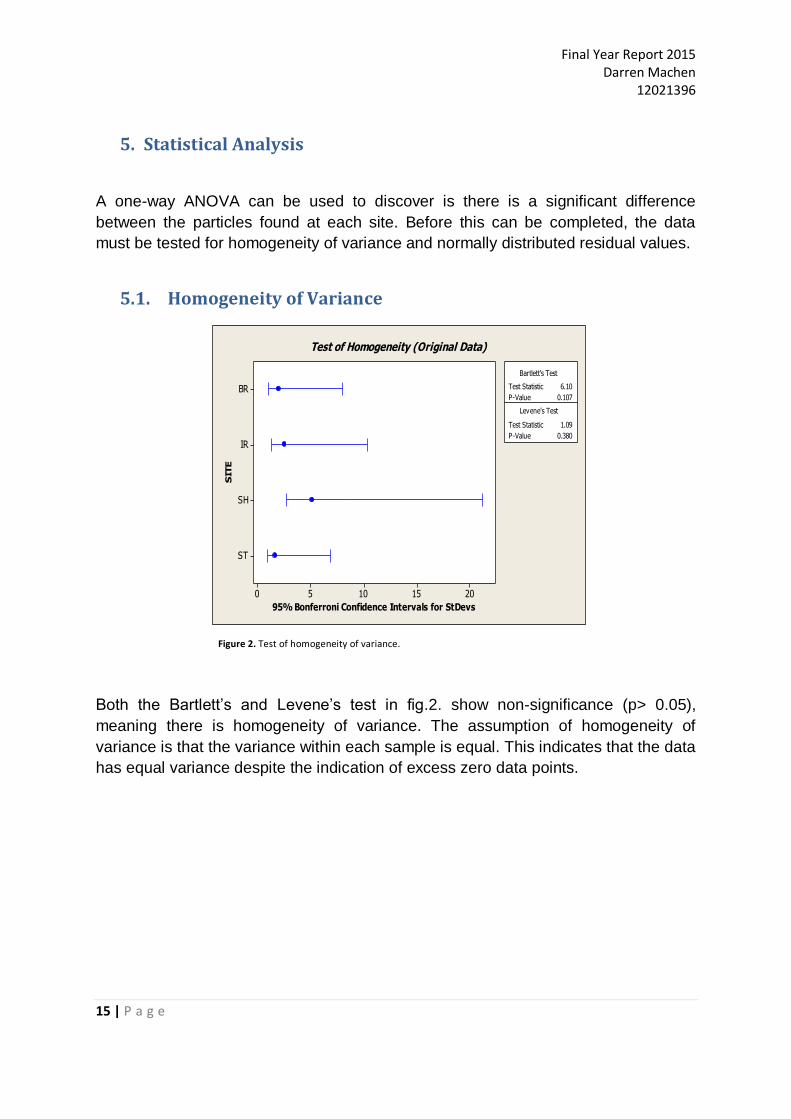
5. Statistical Analysis
A one-way ANOVA can be used to discover is there is a significant difference
between the particles found at each site. Before this can be completed, the data
must be tested for homogeneity of variance and normally distributed residual values.
5.1. Homogeneity of Variance
Both the Bartlett’s and Levene’s test in fig.2. show non-significance (p> 0.05),
meaning there is homogeneity of variance. The assumption of homogeneity of
variance is that the variance within each sample is equal. This indicates that the data
has equal variance despite the indication of excess zero data points.
ST
SH
IR
BR
20151050
SIT
E
95% Bonferroni Confidence Intervals for StDevs
Test Statistic 6.10
P-Value 0.107
Test Statistic 1.09
P-Value 0.380
Bartlett's Test
Levene's Test
Test of Homogeneity (Original Data)
Figure 2. Test of homogeneity of variance.

Final Year Report 2015 Darren Machen
12021396
16 | P a g e
5.2. Normally Distributed Residual Values
86420-2-4-6
6
5
4
3
2
1
0
Residual (Original Data)
Fre
qu
en
cy
Mean 2.220446E-17
StDev 2.851
N 20
Histogram(response is PARTICLES)
1.51.00.50.0-0.5-1.0-1.5
6
5
4
3
2
1
0
ResidualFr
eq
ue
ncy
Mean 6.661338E-17
StDev 0.7453
N 20
Histogram(response is Log +1)
1050-5
99
95
90
80
70
60
50
40
30
20
10
5
1
Residual
Pe
rce
nt
Normal Probability Plot(response is PARTICLES)
210-1-2
99
95
90
80
70
60
50
40
30
20
10
5
1
Residual
Pe
rce
nt
Normal Probability Plot(response is Log +1)
For an ANOVA to be a true representation of the data, the residual values need to
show normal distribution. Figure 3 shows a left skew with a distinct tail running off to
the right. The residual values of the original data are not normally distributed. This
can also be seen in the normal probability plot (fig.5); the two tails are clearly defined
at each end of the plot. Figure 4 shows distribution around zero with a good degree
of spread either side. To achieve this, using one-way ANOVA, the numbers of
particles were log+1 transformed to ensure that the need for normally distributed
Figure 5 and Figure 6. Normal probability plot comparison (Original and Log+1 residuals)
Figure 3 and Figure 4. Histogram of Residual Data comparison (Original and Log+1 residuals)

Final Year Report 2015 Darren Machen
12021396
17 | P a g e
residual values were met. In the log+1 normality probably plot (fig.5), the tail from the
top right has been significantly reduced and the values have a good correlation.

Final Year Report 2015 Darren Machen
12021396
18 | P a g e
5.3. Is there a higher amount of MP for each sample based on their
location?
Proposed hypothesis:
Н1 : There is a significant difference in particles based on location
Null hypothesis:
Н0 : There is not a significant difference in particles based on location
ANOVA
P_LOG_1
Sum of
Squares
df Mean
Square
F Sig.
Between
Groups 5.145 3 1.715 2.600 .088
Within
Groups 10.554 16 .660
Total 15.699 19
There was not a statistically significant difference between groups as determined by
one-way ANOVA (F (3, 16) = 2.600, 𝜌 = .088).
The 𝜌- value .088, so as 𝜌 = > 0.05 there is not enough evidence to support the
proposed hypothesis. There is a not statistically significant difference between the
particles found based on their location.
Figure 7. ANOVA statistical read out.

Final Year Report 2015 Darren Machen
12021396
19 | P a g e
5.4. Plastic particles found
Despite the findings of the One-way ANOVA, visually Brixham shows a higher
concentration of plastic particles. The statistics will test each individual value against
the other, showing that there is no significant difference. This is not to say that the
statistics have been incorrectly managed, it is more likely due to the small sample
size and lack of replicates to confidently shows a statistical difference. Fig 8 shows
all of the particles from one mussel group combined and the higher amount for
Brixham.
9
35
20
9
0
5
10
15
20
25
30
35
40
Stirling Brixham Shetland Ireland
Number of
Particles
Cultivation Site
Figure 8. Graph displaying grouped particles.

Final Year Report 2015 Darren Machen
12021396
20 | P a g e
5.5. Size of particles
The data from the size of particles has a distinct skew to the left hand side (fig.9)
suggesting that the majority of the articles were of a smaller size. The smallest
recorded particle was 54.40 µm and the largest was 2140 µm. The mean particle
size was 439.81 µm ± 383.99 µm.
Figure 9. Histogram of particle size in µm.
SPSS Statistics 2015
Figure 10. Statistical read out based on size in µm.
SPSS Statistics 2015
Figure 11. Particles in size groups.
Figure 12. Size in groups report.
Final Year Report 2015 Darren Machen
12021396
21 | P a g e
By separating the particles into ‘Bins’ it is easier to see the distribution. 30 of the 80
particles recorded were between 51-259 µm, whilst only 15 particles were close to or
larger than 1 mm in size. There was double the amount of smaller range particles
than higher range.

Final Year Report 2015 Darren Machen
12021396
22 | P a g e
5.6. Controlled Blanks
To ensure that the plastic that was being discover was not from an outside
contamination source such as clothing, lab coats were worn at all times. However,
on 1 of the blanks a single fiber was found that look very similar to the others; this
sample was part of the Brixham group. There were no other particles viewed on any
of the other blanks during this project

Final Year Report 2015 Darren Machen
12021396
23 | P a g e
5.7. Results Summary
The results have proven the existence of plastic particles within the mussels from the
sampled areas, using a combination of statistical and visual analysis. Brixham has
clearly demonstrated a higher amount of plastic in the mussel flesh, but all of the
samples yield large amounts of plastic. The use of SPSS did not show a statistical
difference between all the samples, but this is likely due to the small data set. If this
were to be carried out again more replicates of similar values would probably show a
statistical significance but that would have to be proven. All of the methods of
analysis are viable ways of counting plastic abundance, size and particles per gram.
This indicates that the results can be viewed with a strong degree of confidence to
their accuracy. The fact that 1 particle was viewed on a blank does not disrupt this
confidence in the results. Each filter viewed multiple particles outside the sampling
method that were not counted. This one particle was the only one viewed on the
filter, out of all the blanks, whether it was in the samples frame or not. This 1 particle
may have contaminated the filter during storage although the upmost care was used
throughout to stop this from happening.

Final Year Report 2015 Darren Machen
12021396
24 | P a g e
6. Discussion
6.1. Initial problems
It took approximately one hour for the reflux mechanism of the digestion to start in
comparison to the predicted two hour overall time scale. This meant during one of
the trail runs the heat was increased to speed up the digestion. However, this was a
mistake as it caused the samples to boil over and the samples were then not
salvageable and discarded. Due to incomplete digestion, some of the samples were
unable to be used for S.E.M analysis. During the initial set up, another method of
filtration was added to the final step. The use of glass wool was trialled to see if it
was able to filter out any of the lager fatty deposits in the less digested samples.
After these had be looked at under the S.E.M it was found to be unsuccessful as it
caused large amounts of glass fibres to be deposited on the filter paper and was in
fact worse the original. Because on some samples fatty deposits hindered the view
of the electron microscope these were left out. This resulted in 5 usable samples
from each site. This was a frustrating outcome as there was a possibility to make the
project more accurate with a larger data set. However, what has been shown is a
true representation of the samples that were used. More than 20 filters that were
used in the final analysis were made but it was decided to leave these out and keep
five per area. The mussels from Stirling and Brixham were the 2 that had the most
trouble in digestion. This is interesting as it would have been beneficial to see more
samples for these areas as they are the highest and lowest values recorder. To
analyse the approximate size of the fibres, all of the 80 that had been found were

Final Year Report 2015 Darren Machen
12021396
25 | P a g e
measured. This would give a better understanding of the size of the particles that
were discovered. There are quite a few zero data points, this made statistical
analysis more of a challenge. This is not to say that the sample contained no plastic,
this is because the method of sampling did not allow the plastic to be recorded. This
was deemed a fair way of sampling the filter and gave the best compromise between
usable results within the time available.

Final Year Report 2015 Darren Machen
12021396
26 | P a g e
6.2. Identification
6.3. Chemical properties
The characterisation of MP uses morphological descriptions, size, shape or colour,
with the most reliable technique being infrared spectroscopy which reveals the
chemical composition (Eerkes-Medrano, Thompson and Aldridge, 2015). However,
with the knowledge that plastic is not degraded by NHO3 during the digestion
process, it can be said with a good degree of certainty that what is left behind is
plastic. Using the S.E.M, the plastic can be scanned to reveal the chemical
composition. This is not as sensitive as infrared spectroscopy but it still shows what
elements are within that field of view. The basic structure of plastics is constructed
from monomer units by chemical reaction (Klein, 2011). The monomer units are
organic carbon-based molecules. Besides Carbon (C) and Hydrogen (H) atoms as
main components, plastics can also contain elements like Oxygen (O), Sulphur (S)
or Chlorine (Cl) in the monomer unit (Klein, 2011).

Final Year Report 2015 Darren Machen
12021396
27 | P a g e
In image 3, it can be seen that there is a very strong C peak with an O peak of
around 1 quarter of the size. There are also peaks within the Cl and S grouping. This
chemically supports what is known to be contained within plastic polymers and
shows with a good degree of certainty that the particles left after digestion were of
plastic origin. Although it can be confidentially confirmed that what was found is
plastic, it is harder to confirm what type of plastic is contained within the samples.
Image 3. Spectrum from S.E.M 2015

Final Year Report 2015 Darren Machen
12021396
28 | P a g e
6.4. Size
The term Microplastic (MP) was first used in 2004 and is a classification based on
the size of the particle (Hidalgo-Ruz et al. 2012). Generally particles that are <5mm
are categorised as MP (Moos, Burkhardt-Holm and Köhler, 2012); as particles of
plastics ranging in dimensions from a few µm to 500 µm (5mm) are commonly
present (Andrady, 2011). The smallest particle found was 54.40 µm and the largest
2140 µm. The largest of the particles was 2.14 mm, which is well within the specified
boundary for a MP. From a size point of view it can be confidently confirmed that
what was found is of MP origin. As M. edulis is a selective filter feeder, laboratory
test have been conducted to find a suggested limit for the size of particle retention
(10-30µm) (Cauwenberghe et al. 2015). The recorded sizes found in this research
have found particles that far exceed the size of this suggested limit. To select
particles of appropriate size, large particles elicit secretion of mucus; this mucus
entangles particles so that they can be excreted via pseudofaeces (Riisgard, Egede
and Saavedra, 2011).

Final Year Report 2015 Darren Machen
12021396
29 | P a g e
In image 4, a large mass of tangled fibres is shown from a sample of digested M.
edulis. The higher amount of larges particles recorder may be proof of pseudofaeces
in action and show that these tangled particles are unable to be readily excreted
though this normal process. Microplastic especially in fiber form can cause problems
to the organism that ingests them as they cause blockages in the intestinal tract and
undergo accumulation (Mathalon and Hill, 2014).Trapped inside the intestinal tract of
M. edulis, these particles may be able to untangle during the agitation involved with
digestion. This would explain the high amount of large particles outside of the
suggested limit in laboratory research or the higher amount despite depuration.
Image 4. Mass of Particles S.E.M 2015

Final Year Report 2015 Darren Machen
12021396
30 | P a g e
6.5. Depuration
Depuration is the process applied to M. edulis that involves them being placed in
clean sterilised sea water and allowed to continue filtration activities for a set period
of time (FAO, 2010). This ensures the risk of illness when eaten is lowered due to
lower concentrations of faecal contaminants contained within the bivalve (FAO,
2010). This process would also allow MP in M. edulis to be excreted. The decision to
depurate mussels is based on water cleanliness clarification carried out by sanitation
surveys centred on E. coli. If waters are of A grade quality (<230 E.coli/100g),
mussels can be directly consumed without the need for depuration (DEFRA, 2013); a
water rating of B or below indicates mussels have to be depurated. Whether or not a
sample in subjected to the depuration process will have an effect on the recorded
amount of MP. The shellfish waters Directive (2006/113/EEC) ensures that member
states designate water that is in need protection of improvement to support shellfish
growth directly intended from human consumption (HMG, 2012). It recognises that
protecting human health cannot be guaranteed by protecting water quality alone. For
this reason faecal coliforms standards are set for mussel flesh (HMG, 2012),
although as mussels are a bio-indicator, this level could be reflection of water quality.
Based on this idea, the lower recorded values for Ireland and Stirling may suggest
that the water quality is below B grade. The need for depuration has lowered the MP
content that is associated with poorer water quality. Similarly, mussels from Shetland
and Brixham showed the highest recorded levels of MP suggesting that the water
quality in this area may be high enough to warrant consumption without depuration
(A grade). After investigation, it was discovered that mussels that are grown in the

Final Year Report 2015 Darren Machen
12021396
31 | P a g e
region of Brixham go through a 42 hour depuration process (Brixham Sea Farms,
2014).The fact that mussels need to have this depuration period in Brixham reveals
that the water quality in that area must be of B grade or lower suggesting that the
high amount found may be due to other underlying factors. In Cauwenberghe’s et al
2014 paper, mussels used for lab based test are depurated. This would give a better
representation of the amount that a person may ingest whilst consuming mussels as
it simulates production practice. Although deputation is conducted for other means
(E.coli risk), the method is proven to result in a safer product for consumption,
however, it inadvertently reduces the concentration of MP. Even with depuration, MP
are present, this is due to ingested MP having the potential to be taken by epithelial
cell in the intestinal tract, even translocating into the circulatory system of the
mussels (Cauwenberghe and Janssen, 2014) and as mussels are eaten whole,
consumption will inevitability be linked to MP ingestion. Furthermore, there may be a
possibility that MPs are forming clumps within the intestines and cannot be readily
excreted as discussed in section 6.4.

Final Year Report 2015 Darren Machen
12021396
32 | P a g e
6.6. Combined Sewage Overflow
During periods of heavy rainfall, sewers can become overwhelmed by the volume of
water leading to discharge to the ocean via combined sewer overflow (CSO) (Kay,
2008). This water contains human waste (black water) and water from household
use such as a washing machine (grey water). These overflow events can lead to
bivalves such as M. edulis concentrating and retaining human pathogens (Kay,
2008) meaning they need depuration as previously discussed (section 6.5). At
present, the health effects attributed to the ingestion of and translocation of bacteria
via mussels is well documented; this is why the Shellfish Waters Directive
(2006/113/EC) was created. However, a study conducted by Browne, et al. (2011)
has found that there may be other less noticeable contaminants within CSO. It was
found that an important source of MP was found in sediments near sewage water
outlets (Browne et al. 2011). Further test revealed that a single garment of clothing
can produce >1900 fibres per wash (Browne et al. 2011). This water is then drained
into the combined sewer system and has the possibility to make it in to the marine
environment and suggests that a large proportion of fibrous material is a
consequence of washing clothing (Browne et al. 2011). Furthermore, a quarter of all
sewage sludge was dumped at sea, until a ban in 1998; this would have meant any
MP filtered from waste water would have entered the ocean (DEFRA, 2002). These
findings would explain the visual nature of what was viewed under the S.E.M. All of
the MP particles discovered were fibrous and could very well be clothing fibres,
although the exact origin cannot be confidently confirmed at this stage.

Final Year Report 2015 Darren Machen
12021396
33 | P a g e
The image above shows a high concentration of CSOs in the Brixham area, a total of
10 (SAS, 2014) when in fact there are around 19. Mussels are allowed to mature for
18-24 months (Seafish, 2011) which gives them a chance of having multiple
interactions with high rainfall events that lead to CSOs being used. Following the
introduction of the EU Bathing Water Regulations in the early 1990’s, schemes were
recommended to improve bathing waters (Torbay, 2010) that would aim to limit the
frequency of polluting events. The consent was set at 3 spills per bathing season
(Torbay, 2010) signalling that mussels grown in the Torbay area could, at the very
least, be subjected to 6 spills for a 24 months growing period. Furthermore, this does
not include the higher possibility of extreme weather events that happen at other
Image 5. CSO Map of Brixham Area. (SAS, 2015)

Final Year Report 2015 Darren Machen
12021396
34 | P a g e
times of the year, leading to the belief that this is a very minimal estimation. This is
reflected in the amount of MP found in the samples from Brixham.
The mussels from Brixam had 15.68 ppg, whilst Stirling had only 3.62 ppg, Brixham
showed around 5 times more MP particles per gram. In image 6, it can be seen that
there is a dramatic difference in the amount of CSOs for the Stirling area. Although it
is known that the Brixham image 5 is an underestimation, if used as a visual tool it
can still represent the clear difference. If you took the 4 CSOs from image 6 and
multiplied it by 5 you would have 20 CSOs, which is close to the real amount.
Although this is just a rough estimation, it is highly likely based on this evidence that
the MP values of these 2 extremes are linked to the concentration of CSOs in the
area of mussels sampled.
Image 6. CSO Map of Stirling Area. (SAS, 2015)

Final Year Report 2015 Darren Machen
12021396
35 | P a g e
This problem is only exacerbated by the practice of using sewage sludge that has
been treated as a soil improver. Sewage sludge is increasing added to soil as it is
deemed be economically or environmentally advantageous and is set to increase to
13 million tonnes by 2020 (Jones, 2014). There have been accounts of soils that
have had soil sludge spread being inadvertently contaminated with plastic as a result
of this practice (Thompson, 2009). It is perfectly plausible that like nutrient runoff,
sewage sludge used on land may leech MP that would otherwise have been
captured by the filtration process, allowing it to reach water courses and end up in
the sea.

Final Year Report 2015 Darren Machen
12021396
36 | P a g e
6.7. Mussel health
M. edulis have been used extensively as an indicator species for monitoring the
uptake and bioaccumulation of hydrophobic contaminants in the marine
environment, including polycyclic aromatic hydrocarbons (PAHs), chlor-obiphenyls
(CBs) and polybrominated diphenyl ethers (PBDEs) (Webster, et al. 2009). PAHs
and organochlorine pesticides (OCs) are present on the marine environment in the
form of complex mixtures. The ecotoxicological nature of contamination interactions
is poorly understood with most scientific studies formed from single contaminate
exposures (Richardson, et al. 2008), unlike real world interactions where organisms
are exposed to many at one time. Mato et al. (2001) found 100,00 - 1 million time
higher concentration of Polychlorinated byphenyls (PCBs) on polypropylene pieces
compared to the surrounding seawater (Mato, et al. 2001) meaning MP could
provide a route from transport into exposed organisms (Mathalon, et al. 2014). One
study has quantified concentrations from MP particles found from beaches showing
reported values of PAH = 39-1200 ng/g, PCB = 27-980 ng/g and DDT = 22-980 ng/g
(Andrady, 2011). As well as exposure to these potentially harmful chemicals, a
study on the effects of nanopolystyrene (30nm) on the feeding of M. edulis showed
significant increase in pseudofaeces production and decreased filter feeding activity,
reducing energy acquisition leading to possible starvation (Cauwenberghe, et al.
2015). In image 4 there is a mass of fibres which seems to show pseudofaeces and
possibly this natural process causing blockages within the intestines. These
blockages would not allow the natural excretion of larger MP particles and may lead
to excessive leaching of POPs or starvation. Either of these outcomes could have
Final Year Report 2015 Darren Machen
12021396
37 | P a g e
detrimental effect to the health of M. edulis or their reproductive activity. However, as
it cannot be confidentially confirmed what plastic has been found during this study, it
is hard to speculate as to which chemicals would be being ingested. A study by Bakir
et al. (2012), showed specific absorption behaviours of polymers PE and PVC, with
PE (Phenanthrene) and DDT (Bakir, et al. 2012) whilst Webster, et al. (2009)
showed interactions with PHs, CBs and PBDEs. Although Webster, et al. (2009) was
not showing this based on MP, it provides evidence that these chemicals are being
ingested purely through normal filtration. This means that MP with higher
concentrations of POPs are putting a further strain on these organisms.

Final Year Report 2015 Darren Machen
12021396
38 | P a g e
6.8. Human health
From all the evidence of the previous sections it can be said that there is a high
possibility that MPs are entering the human food chain and that there is a high
chance these will contain POPs in one form or another. The degree to which a
person is exposed to these chemicals will have influence the damage that is caused.
The most persistent PCB congeners (PCB 153/158) have a half-life of around a year
in the human blood, whereas lower chlorinated PCBs can be transformed within
days (Vetter, 2009). Despite any difference in residence time within the body,
contaminants may have effect on fetus health as they are more venerable to
chemical exposure than adults (Vizcaino, et al., 2013). Furthermore, POPs have
been linked to cardiovascular disease (CVD) or cancer and individuals with these
diseases had significantly higher concentrations of PCBs than that of healthy
individuals (Ljunggren et al. 2014). It is hard to fully understand the concentration of
POPs entering the food chain and this would ultimately depend on how much a
person would eat. Areas of the world where seafood is a primary food source would
expect to ingest higher concentrations if the main food source was contaminated
with POPs. To further the problems of POPs, there are also know chemicals within
plastic that are harmful to human health and could have potential risks (Thompson et
al. 2009). Chemicals within plastic and some POPs are classified as endocrine
disruptors meaning they interfere with and mimic hormones within the body and can
cause reproductive issues (Thompson et al. 2009). Whilst these chemicals could be
having a small effect on a large organism like a human there could be even more
detrimental effects to a small organism such as M. edulis. It may not have a large

Final Year Report 2015 Darren Machen
12021396
39 | P a g e
impact on the mussels that are cultivated but could pose a threat to natural beds that
will reproduce independently.
6.9. Conclusion
Final Year Report 2015 Darren Machen
12021396
40 | P a g e
MP are said to be ubiquitous in the marine environment and the fits very well with the
finding of this study. Every sample contained MP in amounts large and small.
Despite the fact that it cannot be confirmed what plastic is being ingested, there is
overwhelming evidence that suggests POPs are entering the food chain and the
probability that this is aided by MP ingestion is high. However, the use of other
analytical tool would give a better understanding and what type of plastic had been
found and therefore be able to see if it was likely to contain POPs. The size of the
particles that were found were in the right region despite some being larger or
smaller. Also the chemical scan of the particles showed the elements you would
expect with plastic particles. The background research and the finding in this report
show excellent similarities to support finding MP. One area that has not been fully
explored by wider literature but argues a strong case is CSOs. The evidence put
forward that shows there is a likely hood of the pieces of plastic may be coming from
CSO events looks to be the strongest explanation for the high amount for in the
sample in a combination with blockages in the intestinal tract. This would explain
how depuration could still yield high amounts of plastic. The efforts expressed during
this study have made an excellent start on a somewhat under studied field example
area of MP problem. This area would certainly benefit from a lengthy study in the
future that would allow other avenues to be explored in more detail.
7. Acknowledgments

Final Year Report 2015 Darren Machen
12021396
41 | P a g e
Dr Mark Steer for his continued support throughout the project. Paul Anstey for the
part he played in development of the method, his efforts in digestion and data
gathering.
8. References
Andrady, A.L. (2011) Microplastics in the marine environment. Marine Pollution
Bulletin [Online]. 62, pp. 1596-1605. [Accessed 04 March 2015].

Final Year Report 2015 Darren Machen
12021396
42 | P a g e
Association of Plastic Manufacturers, (2013) Plastics the Facts 2013
[Online].Europe: Plastics Europe. Available from:
http://www.plasticseurope.org/Document/plastics-the-facts-2013.aspx [Accessed 04
March 2015].
Bakir, A., Rowland, S.J. and Thompson, R.C. (2012) Competitive sorption of persistent organic pollutants onto microplastics in the marine environment. Marine Pollution Bulletin [Online]. 64, pp. 2782-2789. [Accessed 05 March 2015]. Bakir, A., Rowland, S.J., Thompson, R.C. (2012) Competitive sorption of persistent organic pollutants onto microplastics in the marine environment. Marine Pollution Bulletin [Online]. 64., pp. 2782-2789. [Accessed 1 April 2015]. Brixham Sea farms LTD (2014) brixhamseafarmsltd.co.uk. Available from:
http://www.brixhamseafarmsltd.co.uk/ [Accessed 19 March 2015].
Browne, M.A., Crump, P., Niven, S.J., Teuten, E., Tonkin, A., Galloway, T. and
Thompson, R. (2011) Accumulation of Microplastic on Shorelines Worldwide:
Sources and Sinks. Environmental Science and Technology [Online]. 45, pp. 9175-
9179. [Accessed 26 March 2015].
Cauwenberghe, L.V. and Janssen, C.R. (2014) Microplastics in bivalves cultured for
human consumption. Environmental Pollution [Online]. 193, pp. 65-70. [Accessed 04
March 2015].
Cauwenberghe, L.V., Claessens, M., Vandegehuchte, M.B. and Janssen, C.R. (2015) Microplastics are taken up by mussels (Mytilus edulis) and lugworms (Arenicola marina) living in natural habitats. Environmental Pollution [Online]. 199., pp. 10-17. [Accessed 31 March 2015]. Cole, M., Lindeque, P., Fileman, E., Halsband, C., Goodhead, R., Moger, J. and
Galloway, T.S. (2013) Microplastic Ingestion by Zooplankton. Environmental Science
and Technology [Online]. 47, pp. 6646-6655. [Accessed 04 March 2015].
Cole, M., Lindeque, P., Halsband, C. and Galloway, T.S. (2011) Microplastics as
contaminants in the marine environment: A review. Marine Pollution Bulletin [Online].
62, pp. 2588-2597. [Accessed 04 March 2015].
Cole, M., Webb, H., Lindeque, P.K., Fileman, E.S., Halsband, C. and Galloway, T.S. (2014) Isolation of microplastics in biota-rich seawater samples and marine organisms. Science Reports [Online]. 4 (4528), pp. 1-8. [Accessed 04 March 2015]. Department for Environment, Food and Rural Affairs (DEFRA), (2002) Sewage Treatment in the UK [Online]. United Kingdom: DEFRA. Available from: https://www.gov.uk/government/uploads/system/uploads/attachment_data/file/69582/pb6655-uk-sewage-treatment-020424.pdf [Accessed 26 March 2015].

Final Year Report 2015 Darren Machen
12021396
43 | P a g e
Derraik, J.G.B. (2002) The pollution of the marine environment by plastic debris: a
review. Marine Pollution Bulletin [Online]. 44, pp. 842-852. [Accessed 04 March
2015].
Eerkes-Medrano, D., Thompson, R.C. and Aldridge, D.C. (2015) Microplastics in
freshwater systems: A review of the emerging threats, identification of knowledge
gaps and prioritisation of research needs. Water Research [Online]. 75, pp. 63-82.
[Accessed 27 March 2015].
Food and Agricultural Organization of the United Nations (FAO) (2010) Bivalve
depuration: fundamental and practical aspects [Online]. Rome: Food and Agricultural
Organization of the United Nations (511). Available from:
ftp://ftp.fao.org/docrep/fao/011/i0201e/i0201e.pdf [Accessed 19 March 2015].
Hidalgo-Ruz, V., Gutow, L., Thompson, R.C. and Theil, M. (2012) Microplastics in
the Marine Environment: A Review of the Methods Used for Identification and
Quantification. Environmental Science and Technology [Online]. 46, pp. 3060-3075.
[Accessed 27 March 2015].
HM Government, (2012) Links between the Marine Strategy Framework Directive, the Shellfish Waters Directive and the EU Food Hygiene Regulations [Online]. United Kingdom: Marine Strategy Framework Directive Factsheet (6). Available from: http://archive.defra.gov.uk/environment/marine/documents/legislation/msfd-factsheet6-shellfish-food.pdf [Accessed 25 March 2015] Jones, V., Gardener, M. and Ellor, B. (2014) Concentrations of trace substances in
sewage sludge from 28 wastewater treatment works in the UK. Chemosphere
[Online]. 111, pp. 478-484. [Accessed 26 March 2015].
Kanzari, F., Syakti, A.D., Asia, L., Malleret, L., Piram, A., Mille, G. and Doumenq, P. (2014) Distributions and sources of persistent organic pollutants (aliphatic hydrocarbons, PAHs, PCBs and pesticides) in surface sediments of an industrialized urban river (Huveaune), France. Science of the Total Environment [Online]. 478, pp. 141-151. [Accessed 05 March 2015].
Kay, D., Kershaw, S., Lee, R., Wyer, M.D., Watkins, J. and Francis, C. (2008)
Results of field investigations into the impact of intermittent sewage discharges on
the microbiological quality of wild mussels (Mytilus edulis) in a tidal estuary. Water
Research [Online]. 42 (12), pp. 3033-3046. [Accessed 26 March 2015].
Final Year Report 2015 Darren Machen
12021396
44 | P a g e
Klein, R. (2011) Laser Welding of Plastics [Online]. Weinheim: Wiley. [Accessed 27
March 2015].
Ljunggren, S.A., Helmfrid, I., Salihovic, S., Bavel, B.V., Wingren, G., Lindahl, M. and Karlsson, H. (2014). Persistent organic pollutants distribution in lipoprotein fractions in relation to cardiovascular disease and cancer [Online]. Environment international. 65, pp. 93-99. [Accessed 10 April 2015].
Mathalon, A., Hill, P. (2014) Microplastic fibers in the intertidal ecosystem
surrounding Halifax Harbor, Nova Scotia. Marine Pollution Bulletin [Online]. 81. (1),
pp. 69-79. [Accessed 1 April 2015].
Mato, Y., Isobe, T., Takada, H., Kanehiro, H., Ohtake, C. and Kaminuma, T. (2001)
Plastic Resin Pellets as a Transport Medium for Toxic Chemicals in the Marine
Environment. Environmental Science and Technology [Online]. 35., pp. 318-324.
[Accessed 1 April 2015].
Moore, C.J. (2008) Synthetic polymers in the marine environment: A rapidly
increasing, long-term threat. Environmental Research [Online]. 108, pp. 131-139.
[Accessed 04 March 2015].
Moos, N.V., Burkhardt-Holm, P. and Köhler, A. (2012) Uptake and Effects of Microplastics on Cells and Tissue of the Blue Mussel Mytilus edulis L. after an Experimental Exposure. Environmental Science and Technology [Online]. 46, pp. 11327- 11335. [Accessed 04 March 2015]. Richardson, J.B., Mak, E., De Luca-Abbott, S.B, Michael, M., McClellan, K. and K.S. Lam, P. (2008) Antioxidant responses to polycyclic aromatic hydrocarbons and organochlorine pesticides in green-lipped mussels (Perna viridis): Do mussels “integrate” biomarker responses?. Marine Pollution Bulletin [Online]. 57. (6-12), pp. 503-514. [Accessed 1 April 2015]. Riisgård, H.U., Egede, P.P. and Saavedra, I.B. (2011) Feeding Behaviour of the Mussel, Mytilus edulis: New Observations, with a Minireview of Current Knowledge. Journal of Marine Boilogy [Online]. 2011, pp. 1-13. [Accessed 31 March 2015]. Seafish, The Authority on Seafood, (2011) Responsible Sourcing Guide: Mussels
[Online]. United Kingdom: Seafish (4). Available from:
http://www.seafish.org/media/publications/SeafishResponsibleSourcingGuide_muss
els_201109.pdf [Accessed 26 March 2015].
Surfers Against Sewage (2015) Interactive CSO Map. Available from:
http://www.sas.org.uk/map/ [Accessed 26 March 2015].

Final Year Report 2015 Darren Machen
12021396
45 | P a g e
The Centre for Environment, Fisheries and Aquaculture Science (CEFAS) (2013)
Protocol for the Classification of Shellfish Harvesting Areas –England and Wales
[Online]. United Kingdom: The Department for Environment, Food and Rural Affairs
(6). Available from:
http://www.cefas.defra.gov.uk/media/600448/201301%20classification%20protocol%
20revised%20version%206.pdf [Accessed 19 March 2015].
Thompson, C.R., Moore, C.J., Vom Saal, F.S. and Swan, S.H. (2009) Plastics, the environment and human health: current consensus and future trends. Philosophical Transition of the Royal Society B [Online]. 364, pp. 2153-2166. [Accessed 27 March 2015]. Torbay Council (Report 72) (2010) torbay.gov.uk. Available from:
http://www.google.co.uk/url?sa=t&rct=j&q=&esrc=s&source=web&cd=1&ved=0CCIQ
FjAA&url=http%3A%2F%2Fwww.torbay.gov.uk%2Fdl%2Ffile%3Ffile%3D%255CAge
ndas%2BReports%2B%2526%2BMinutes%255CPublic%2BMeetings%255C2009-
2010%255C104%2BOverview%2Band%2BScrutiny%2BBoard%2B14%2BApril%25
5CReport%2B10%2B072%2BBathing%2BWater.doc&ei=dfcTVaG5N7Lf7QaWn4DI
Bg&usg=AFQjCNGJmjlfyNFQIAUqlNDaqBI60YyxUw&sig2=e8JzUBbjk7cglufueaIze
Q&bvm=bv.89217033,d.ZGU&cad=rja [Accessed 26 March 2015].
Vetter, W. and Gribble, G., W. (2009) Anthropogenic Persistent Organic Pollutants –
Lessons to Learn from Halogenated Natural Products [Online]. Environmental
Toxicology and Chemistry. 26 (11), pp. 2249-2252. [Accessed 10 April 2015].
Vizcaino, E., Grimalt, O.J., Fernández-Somoano, A. and Tardon, A. (2013) Transport
of persistent organic pollutants across the human placenta [Online]. Environment
International. 65, pp. 107-115. [Accessed 10 April 2015].
Webster, L., Russell, M. P., Phillips, W.L. A., Packer, G., Hussy, I., Scurfield, J. A.,
Dalgarno, E. J. and Moffat, C. F. (2009) An assessment of persistent organic
pollutants (POPs) in wild and rope grown blue mussels (Mytilius edulis) from Scottish
coastal waters. Journal of Environmental Monitoring [Online]. 11., pp. 1169-1184.
[Accessed 1 April 2015].
Zarfl, C. and Matthies, M. (2010) Are marine plastic particles transport vectors for
organic pollutants to the Arctic?. Marine Pollution Bulletin [Online]. 60, pp. 1810-
1814. [Accessed 05 March 2015].

Final Year Report 2015 Darren Machen
12021396
46 | P a g e
Related Documents