FINAL 2010 PECONIC RIVER MONITORING REPORT Prepared for: Brookhaven Site Office Building 464, 53 Bell Avenue Upton, New York 11973 November 30, 2011 Prepared by: Brookhaven Science Associates, LLC Brookhaven National Laboratory Upton, New York 11973 Under Contract with the United States Department of Energy Contract No. DE-AC02-98CH10

Welcome message from author
This document is posted to help you gain knowledge. Please leave a comment to let me know what you think about it! Share it to your friends and learn new things together.
Transcript

FINAL
2010 PECONIC RIVER MONITORING
REPORT
Prepared for:
Brookhaven Site Office
Building 464, 53 Bell Avenue
Upton, New York 11973
November 30, 2011
Prepared by:
Brookhaven Science Associates, LLC
Brookhaven National Laboratory
Upton, New York 11973
Under Contract with the United States Department of Energy
Contract No. DE-AC02-98CH10

TABLE OF CONTENTS
LIST OF TABLES ............................................................................................................................ iii
LIST OF FIGURES .......................................................................................................................... iv
LIST OF APPENDICES AND ATTACHMENT............................................................................ v
EXECUTIVE SUMMARY .............................................................................................................. vi
SECTION 1 – INTRODUCTION..................................................................................................... 1
1.1 Introduction ................................................................................................................ 1 1.2 Report Organization .................................................................................................. 4
SECTION 2 - 2010 SEDIMENT MONITORING RESULTS ....................................................... 5
2.1 Introduction ................................................................................................................ 5 2.2 2010 Routine Sediment Monitoring Results ............................................................ 5 2.3 2010 PR-SS-33 Supplemental Sediment Monitoring Results................................. 7 2.4 PR-WC-06, PR-SS-15 and Sediment Trap Removal and Remedy
Optimization ............................................................................................................... 8 2.5 Sediment Summary and Recommendations ............................................................ 8
SECTION 3 - 2010 WATER COLUMN MONITORING RESULTS ........................................ 11
3.1 Introduction .............................................................................................................. 11 3.2 Data Collection Summary ....................................................................................... 12 3.3 Monitoring Results................................................................................................... 13 3.4 Total Mercury .......................................................................................................... 14 3.5 Total Suspended Solids ............................................................................................ 15 3.6 Methylmercury and Percent Methylmercury ....................................................... 15 3.7 Water Column Mercury Concentrations at Transect PR-SS-15-U1 .................. 16 3.8 Water Column Mercury Concentrations in PR-SS-10 Area ............................... 17 3.9 Water Column Summary and Recommendations ................................................ 18
SECTION 4 - 2010 FISH MONITORING RESULTS ................................................................. 21
4.1 Introduction .............................................................................................................. 21 4.2 2010 Fish Monitoring Results ................................................................................. 25 4.3 Mercury .................................................................................................................... 27 4.4 PCBs .......................................................................................................................... 29 4.5 Cesium-137 Results .................................................................................................. 31 4.6 Fish Summary and Recommendation .................................................................... 31
SECTION 5 - SEDIMENT TRAP AND ACCELERATED SEDIMENT REMOVAL ........... 33
SECTION 6 - REFERENCES ........................................................................................................ 35
iii
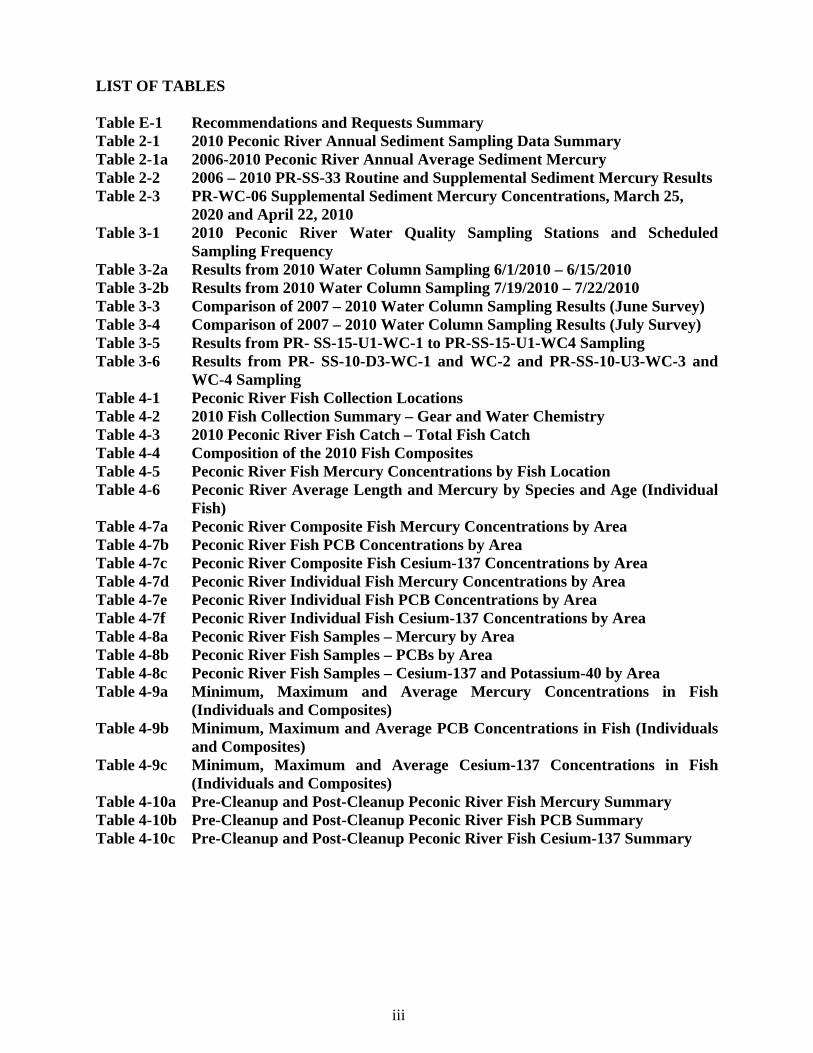
LIST OF TABLES Table E-1 Recommendations and Requests Summary Table 2-1 2010 Peconic River Annual Sediment Sampling Data Summary Table 2-1a 2006-2010 Peconic River Annual Average Sediment Mercury Table 2-2 2006 – 2010 PR-SS-33 Routine and Supplemental Sediment Mercury Results Table 2-3 PR-WC-06 Supplemental Sediment Mercury Concentrations, March 25,
2020 and April 22, 2010 Table 3-1 2010 Peconic River Water Quality Sampling Stations and Scheduled
Sampling Frequency Table 3-2a Results from 2010 Water Column Sampling 6/1/2010 – 6/15/2010 Table 3-2b Results from 2010 Water Column Sampling 7/19/2010 – 7/22/2010 Table 3-3 Comparison of 2007 – 2010 Water Column Sampling Results (June Survey) Table 3-4 Comparison of 2007 – 2010 Water Column Sampling Results (July Survey) Table 3-5 Results from PR- SS-15-U1-WC-1 to PR-SS-15-U1-WC4 Sampling Table 3-6 Results from PR- SS-10-D3-WC-1 and WC-2 and PR-SS-10-U3-WC-3 and
WC-4 Sampling Table 4-1 Peconic River Fish Collection Locations Table 4-2 2010 Fish Collection Summary – Gear and Water Chemistry Table 4-3 2010 Peconic River Fish Catch – Total Fish Catch Table 4-4 Composition of the 2010 Fish Composites Table 4-5 Peconic River Fish Mercury Concentrations by Fish Location Table 4-6 Peconic River Average Length and Mercury by Species and Age (Individual
Fish) Table 4-7a Peconic River Composite Fish Mercury Concentrations by Area Table 4-7b Peconic River Fish PCB Concentrations by Area Table 4-7c Peconic River Composite Fish Cesium-137 Concentrations by Area Table 4-7d Peconic River Individual Fish Mercury Concentrations by Area Table 4-7e Peconic River Individual Fish PCB Concentrations by Area Table 4-7f Peconic River Individual Fish Cesium-137 Concentrations by Area Table 4-8a Peconic River Fish Samples – Mercury by Area Table 4-8b Peconic River Fish Samples – PCBs by Area Table 4-8c Peconic River Fish Samples – Cesium-137 and Potassium-40 by Area Table 4-9a Minimum, Maximum and Average Mercury Concentrations in Fish
(Individuals and Composites) Table 4-9b Minimum, Maximum and Average PCB Concentrations in Fish (Individuals
and Composites) Table 4-9c Minimum, Maximum and Average Cesium-137 Concentrations in Fish
(Individuals and Composites) Table 4-10a Pre-Cleanup and Post-Cleanup Peconic River Fish Mercury Summary Table 4-10b Pre-Cleanup and Post-Cleanup Peconic River Fish PCB Summary Table 4-10c Pre-Cleanup and Post-Cleanup Peconic River Fish Cesium-137 Summary
iv
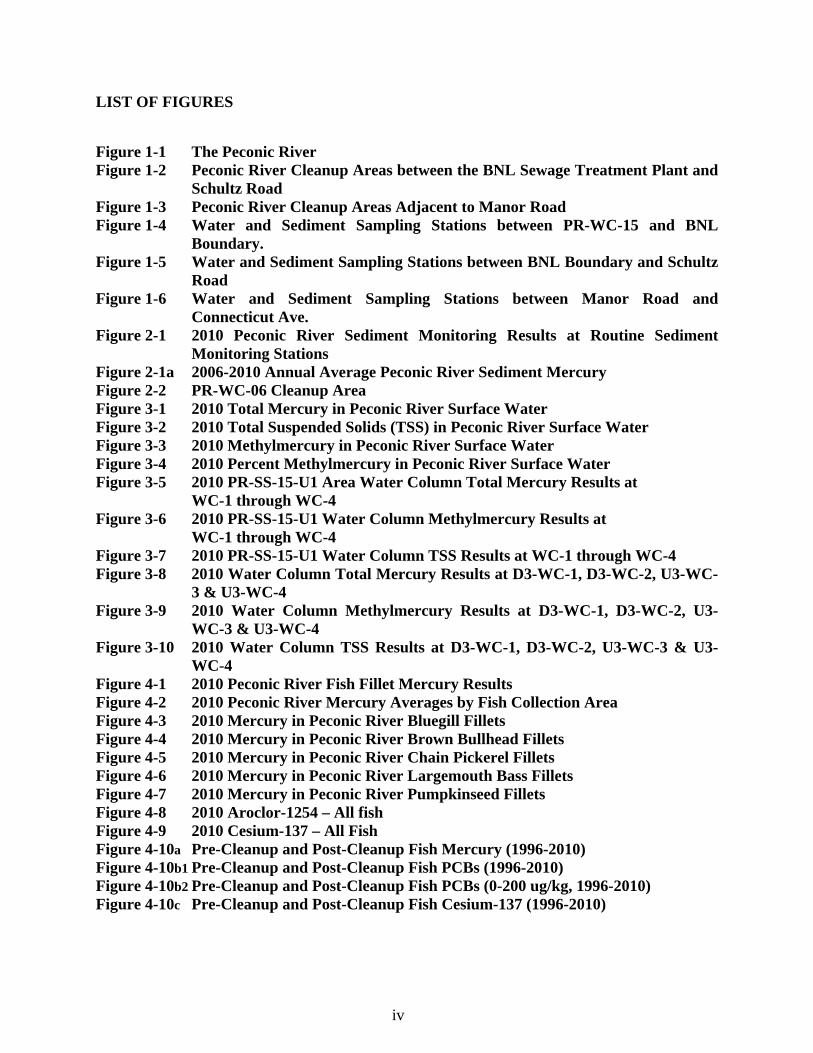
LIST OF FIGURES
Figure 1-1 The Peconic River Figure 1-2 Peconic River Cleanup Areas between the BNL Sewage Treatment Plant and
Schultz Road Figure 1-3 Peconic River Cleanup Areas Adjacent to Manor Road Figure 1-4 Water and Sediment Sampling Stations between PR-WC-15 and BNL
Boundary. Figure 1-5 Water and Sediment Sampling Stations between BNL Boundary and Schultz
Road Figure 1-6 Water and Sediment Sampling Stations between Manor Road and
Connecticut Ave. Figure 2-1 2010 Peconic River Sediment Monitoring Results at Routine Sediment
Monitoring Stations Figure 2-1a 2006-2010 Annual Average Peconic River Sediment Mercury Figure 2-2 PR-WC-06 Cleanup Area Figure 3-1 2010 Total Mercury in Peconic River Surface Water Figure 3-2 2010 Total Suspended Solids (TSS) in Peconic River Surface Water Figure 3-3 2010 Methylmercury in Peconic River Surface Water Figure 3-4 2010 Percent Methylmercury in Peconic River Surface Water Figure 3-5 2010 PR-SS-15-U1 Area Water Column Total Mercury Results at
WC-1 through WC-4 Figure 3-6 2010 PR-SS-15-U1 Water Column Methylmercury Results at
WC-1 through WC-4 Figure 3-7 2010 PR-SS-15-U1 Water Column TSS Results at WC-1 through WC-4 Figure 3-8 2010 Water Column Total Mercury Results at D3-WC-1, D3-WC-2, U3-WC-
3 & U3-WC-4 Figure 3-9 2010 Water Column Methylmercury Results at D3-WC-1, D3-WC-2, U3-
WC-3 & U3-WC-4 Figure 3-10 2010 Water Column TSS Results at D3-WC-1, D3-WC-2, U3-WC-3 & U3-
WC-4 Figure 4-1 2010 Peconic River Fish Fillet Mercury Results Figure 4-2 2010 Peconic River Mercury Averages by Fish Collection Area Figure 4-3 2010 Mercury in Peconic River Bluegill Fillets Figure 4-4 2010 Mercury in Peconic River Brown Bullhead Fillets Figure 4-5 2010 Mercury in Peconic River Chain Pickerel Fillets Figure 4-6 2010 Mercury in Peconic River Largemouth Bass Fillets Figure 4-7 2010 Mercury in Peconic River Pumpkinseed Fillets Figure 4-8 2010 Aroclor-1254 – All fish Figure 4-9 2010 Cesium-137 – All Fish Figure 4-10a Pre-Cleanup and Post-Cleanup Fish Mercury (1996-2010) Figure 4-10b1 Pre-Cleanup and Post-Cleanup Fish PCBs (1996-2010) Figure 4-10b2 Pre-Cleanup and Post-Cleanup Fish PCBs (0-200 ug/kg, 1996-2010) Figure 4-10c Pre-Cleanup and Post-Cleanup Fish Cesium-137 (1996-2010)

v
LIST OF ATTACHMENTS
Attachment 1 – Excerpts from 2010 Five-Year Review: Section 6.4.5 Operable Unit V and Section 7.5 (Opportunities for Monitoring Optimization subsection)
LIST OF APPENDICES
Appendix A – 2010 Peconic River Sediment Samples- Metals Appendix B – 2010 Peconic River Sediment Samples – PCBs Appendix C – 2010 Peconic River Sediment Samples - Radionuclides Appendix D – 2010 Total Mercury, Methylmercury and TSS Data Appendix E – 2010 Water Quality Analytical Data Appendix F – 2010 Peconic River Fish Scale and Otolith Age Interpretation Appendix G – 2010 Peconic River Fish Samples – Mercury Appendix H – 2010 Peconic River Fish Samples – PCBs Appendix I – 2010 Peconic River Fish Samples – Radionuclides

vi
EXECUTIVE SUMMARY
2010 PECONIC RIVER MONITORING REPORT
This section summarizes the major findings and recommendations relating to the 2010
Peconic River sediment, surface water, and fish monitoring. Section 2 through Section 4 of the
report discusses the details on which the recommendations are based. Figure 1-1 shows the
location of the Peconic River relative to Brookhaven National Laboratory (BNL, Laboratory),
the Long Island Expressway and Flanders Bay, into which the river flows.
This report includes recommendations for modifying the 2012-2014 sediment, surface
water and fish monitoring based on two documents:
1. The 2010 Peconic River Monitoring Report. Each recommendation is
abbreviated as Monitoring Report Recommendation. Supporting
documentation for each Monitoring Report Recommendation precedes the
recommendation in the main body of the text in chapters 2, 3 and 4.
2. The Five-Year Review Report1. Each recommendation is abbreviated as Five-
Year Review Recommendation. Supporting documentation for each Five-Year
Review Recommendation is included in Chapters 6 and 7 of the Five-Year
Review and attached to this document as Attachment 1.
All recommendations are summarized in Table E-1 on page xi of this document.
Sediment:
The 2010 Peconic River sediment monitoring values are substantially lower than the pre-
cleanup values (Tables 2-1 and 2-1a) and all mercury samples, except one sample (PR-SS-33,
4.7 mg/kg) were below the cleanup goal. Five supplemental samples collected within five feet of
PR-SS-33 failed to confirm the elevated mercury concentration (average of 0.61 mg/kg). One
sample, PR-SS-38, 2.0 mg/kg, equaled the cleanup goal and therefore no additional action is
recommended.
1 Five-Year Review Report for Brookhaven National Laboratory Superfund site, Town of Brookhaven, Hamlet of Upton, Suffolk County, New York, March 31, 2011.

vii
The 2010 Peconic River sediment monitoring had an average mercury concentration of
0.74 mg/kg on Brookhaven National Laboratory/U.S. Department of Energy) (BNL/DOE)
property, vs. a pre-cleanup average of 4.6 mg/kg. The average 2010 offsite mercury values were
0.19 mg/kg from the BNL boundary to Schultz Road, vs. a pre-cleanup 1.79 mg/kg average, and
an average 2010 Manor Road mercury concentration of 0.27 mg/kg, vs. a pre-cleanup 1.08
mg/kg average.
All onsite and offsite sediment PCB values were non-detect for all seven PCB aroclors.
The 2010 average cesium-137 activities both on (0.89 pCi/g) and outside laboratory property
(0.36 pCi/g between the BNL boundary and Schultz Road and 0.24 pCi/g for Manor Road area)
were substantially below the pre-cleanup averages (5.7 pCi/g, 5.4 pCi/g and 2.88 pCi/g,
respectively).
The Sediment Trap removal and the PR-WC-06, PR-SS-15 and Sediment Trap sediment
excavation and disposal were completed in February 2011. These activities have been described
in detail in the June 2011 Draft Peconic River Supplemental Sediment Removal Completion
Report.
Monitoring Report Recommendation: BSA2/DOE recommends no additional action at
the PR-SS-33 sediment sample station based on the 2010 supplemental sampling results for this
location.
Five-Year Review Recommendation: Sediment monitoring for 2012 to 2014 was
evaluated in the 2010 Five-Year Review, and is summarized below:
BSA/DOE recommends that the number of sampling stations be reduced from 30 to three
stations (PR-WC-06, PR-SS-15, Sediment Trap cleanup areas) per year.
Details, tables and figures supporting all of the Five-Year Review recommendations are
described in Section 6.4.5 and Section 7.5 of the 2010 Five-Year Review, and are included in
Attachment 1 of this document.
Surface Water:
BNL has collected routine water column samples from approximately 20 water column
stations, depending on water level, since 2003. The routine samples have been analyzed for total
2 Brookhaven Science Associates (BSA) was established for the sole purpose of managing and operating Brookhaven National Laboratory. BSA was formed as a 50-50 partnership between Battelle and The Research Foundation of State University of New York (SUNY) on behalf of Stony Brook University (SBU). The United States Department of Energy (DOE) owns the BNL property and funds science and operations at BNL.
viii
samples for water quality parameters (e.g. chlorophyll-a, nitrogen, TOC (Total Organic Carbon),
etc.).
The values of the 2010 Sewage Treatment Plant (STP) effluent concentrations of total
mercury were substantially lower than those measured in 2009. A general gradual downward
total mercury trend with increasing downstream distance from the STP was observed in 2010
(Figure 3-1). The total mercury values for the furthest downstream monitoring stations are
generally smaller, but occasionally slightly larger than the maximum historical Connetquot River
reference station mercury concentration (4.52 ng/L). The 2010 sample results for methylmercury
were also generally low (Table 3-2a and 3-2b, Figure 3-3).
Water column samples for total mercury, methylmercury and TSS were obtained four
times in 2010 both upstream and downstream of elevated sediment mercury locations on transect
PR-SS-15–U1 and station PR-SS-10 to evaluate potential downstream transport of mercury. The
2010 data did not confirm substantial downstream mercury transport from either the PR-SS-15-
U1 transect or the PR-SS-10 area. Refer to the 2010 Five-Year Review, sections 6.4.5 and 7.5
or Attachment 1 for details concerning the following recommendations.
Monitoring Report Recommendation: BSA/DOE recommends that routine water
column monitoring be discontinued for the PR-SS-15 and PR-SS-10 areas in 2011 and 2012,
respectively, based on the 2010 surface water data described above, the 2008 and 2009 Peconic
River Monitoring Report data and completion of the PR-SS-15 sediment removal in January
2011.
Five-Year Review Recommendation: The 2010 Five-Year Review water column
recommendations for 2012 to 2014 are summarized below:
BSA/DOE recommends that routine water-column monitoring for total mercury,
methylmercury and TSS continue two times per year at the 15 stations between PR-WC-
15 (upstream of STP-EFF-UVG) and PR-WC-02.
BSA/DOE recommends that routine water-column monitoring at stations between and
including PR-WC-01 and PR-WCS-07 be discontinued in 2012, with the exception of
PR-WCS-04 (west of the Cranberry Bogs) and PR-WCS-06 (Donahue’s Pond). PR-
WCS-04 is near the downstream extent of the Manor Road cleanup area and will continue
to be monitored through 2012 as part of the routine water column monitoring program.
The need for continued monitoring at this location will then be evaluated. PR-WCS-06 is
outside the cleanup area and will continue to be sampled as part of the routine
ix
environmental surveillance program. BSA/DOE also recommends that analysis for water
quality parameters (chlorophyll-a, N, P, TOC, and TSS) be discontinued in 2012.
Details, tables and figures supporting all of the Five-Year Review recommendations are
described in Section 6.4.5 and Section 7.5 of the 2010 Five-Year Review, and are included in
Attachment 1 of this document.
Fish:
Approximately 36 percent of the 164 fish caught were bottom feeders3 (59 brown
bullheads) and 64 percent of the catch (105 fish) were predators other than brown bullheads.
Pumpkinseeds and bluegills composed 36 percent (59 fish) and 13 percent (21 fish), respectively,
of the total catch. Chain pickerel (11 fish) and largemouth bass (14 fish) represented
approximately seven and nine percent, respectively, of the catch4.
Mercury, PCB and cesium-137 concentration values are substantially improved over pre-
cleanup limits (Tables 4-10a, 4-10b and 4-10c, respectively). The average concentration of
mercury for the 108 fish tissue samples (individual fish and composites) from fish which were
collected between the BNL STP and Donahue’s Pond was 0.28 mg/kg. PCB values were less
than or close to the detection limits. The average cesium-137 activity for all 62 fish samples was
0.11 pCi/g.
Monitoring Report Recommendation: The only fish recommendations are from the
Five-Year Review.
Five-Year Review Recommendations: The 2010 Five-Year Review recommends that fish
monitoring be modified in the following ways:
Frequency will be modified from one round annually to one round every other spring.
Thus, between 2011 and 2016 fish will be collected in the spring of 2011, 2013 and 2015.
Harvesting fish biennially will allow the fish population to grow in both number and
individual size.
3 Brown bullheads are the only bottom dwelling fish in the studied section of the Peconic River. Although brown bullheads represent bottom feeders they also are piscivorous (eat fish). 4 Data based on Appendix H. Table 4-3 shows 80 fish analyzed as individuals and 84 fish analyzed as composites.
x
Monitoring of fish from the Manor Road area should be discontinued after the 2011
collection, due to the typically low fish catch in that area. Every two years fish
monitoring would occur in Area A5 (downstream of the STP), Area D, Schultz Road, and
Donahue’s Pond, when water depths are favorable. Supplemental sampling in Area C
would be discontinued unless the catch was low in the two adjacent collection areas
(Areas A and D).
Continuing fish age determination via scale and otolith interpretation through 2015.
Details, tables and figures supporting all of the Five-Year Review recommendations are
described in Section 6.4.5 and Section 7.5 of the 2010 Five-Year Review, and are included in
Attachment 1 of this document.
PR-WC-06, Sediment Trap and PR-SS-15 Sediment Removal and Sediment Trap Removal
During January 2011 the Peconic River Sediment Trap, located adjacent to Z path and
upstream of stream gauging station HQ, was removed as required by the Peconic River ROD.
During December 2010 and January 2011 supplemental sediment was also removed from the
PR-WC-06, Sediment Trap and PR-SS-15 areas to optimize the remedy for these three areas.
The waste was transported to a Subtitle D landfill (Allied Waste Niagara Falls Landfill in
Niagara Falls, NY) in late February and early March 2011. These actions were recommended in
Recommendation 5 of the Final 2009 Peconic River Monitoring Report6. These activities have
been described in detail in the June 2011 Draft Peconic River Supplemental Sediment Removal
Completion Report.
5 Note that BSA/DOE expects to initiate discharge of treated STP effluent to the water table rather than to the Peconic River, in 2014. This may cause water levels in Area A (and possibly also Area D) to be too low for fish migration except during the spring. Fish collection locations may require revision following groundwater discharge of the STP effluent. 6 2009 Recommendation 5: BNL/DOE recommends that the sediment trap be removed in coordination with the
accelerated removal of sediment with elevated mercury concentrations. Both the sediment trap removal and the
accelerated sediment removal are scheduled to be conducted in 2010.

xi
Table E-1. Recommendations and Requests Summary
Sediment: 1 Monitoring Report Recommendation: BSA/DOE recommends no additional action at the PR-SS-
33 sediment sample station based on the 2010 supplemental sampling results for this location.
2 Five-Year Review Recommendation: Sediment monitoring for 2012 to 2014 was evaluated in the 2010 Five-Year Review, and is summarized below:
BSA/DOE recommends that the number of sampling stations be reduced from 30 to three stations (PR-WC-06, PR-SS-15, Sediment Trap cleanup areas) per year.
Details supporting all Five-Year Review recommendations in this table are discussed in Section 6.4.5 and Section 7.5 of the 2010 Five-Year Review, and are included in Attachment 1 of this document.
Surface Water: 3 Monitoring Report Recommendation: BSA/DOE recommends that routine water column
monitoring be discontinued for the PR-SS-15 and PR-SS-10 areas in 2011 and 2012, respectively, based on the 2010 surface water data described above, the 2008 and 2009 Peconic River Monitoring Report data and completion of the PR-SS-15 sediment removal in January 2011.
4 Five-Year Review Recommendation: The 2010 Five-Year Review water column recommendations for 2012 to 2014 are summarized below:
BSA/DOE recommends that routine water-column monitoring for total mercury, methylmercury and TSS continue two times per year at the 15 stations between PR-WC-15 (upstream of STP-EFF-UVG) and PR-WC-02.
BSA/DOE recommends that routine water-column monitoring at stations between and including PR-WC-01 and PR-WCS-07 be discontinued in 2012, with the exception of PR-WCS-04 (west of the Cranberry Bogs) and PR-WCS-06 (Donahue’s Pond). PR-WCS-04 is near the downstream extent of the Manor Road cleanup area and will continue to be monitored through 2012 as part of the routine water column monitoring program. The need for continued monitoring at this location will then be evaluated. PR-WCS-06 is outside the cleanup area and will continue to be sampled as part of the routine environmental surveillance program.
BSA/DOE also recommends that analysis for water quality parameters (chlorophyll-a, N, P, TOC, and TSS) be discontinued in 2012.
Fish:
5 Five-Year Review Recommendation: The 2010 Five-Year Review recommends that fish monitoring be modified in the following ways: Frequency will be modified from one round annually to one round every other spring. Thus,
between 2011 and 2016 fish will be collected in the spring of 2011, 2013 and 2015. Harvesting fish biennially will allow the fish population to grow in both number and individual size.
Monitoring of fish from the Manor Road area should be discontinued after the 2011 collection, due to the typically low fish catch in that area. Every two years fish monitoring would occur in Area A7 (downstream of the STP), Area D, Schultz Road, and Donahue’s Pond, when water depths are favorable. Supplemental sampling in Area C would be discontinued unless the catch was low in the two adjacent collection areas (Areas A and D).
Continuing fish age determination via scale and otolith interpretation through 2015.
7 Note that BSA/DOE expect to initiate discharge of treated STP effluent to the water table rather than to the Peconic River, in 2014. This may cause water levels in Area A (and possibly also Area D) to be too low for fish migration except during the spring. Fish collection locations may require revision following groundwater discharge of the STP effluent.

1
SECTION 1 – INTRODUCTION
1.1 Introduction
Brookhaven National Laboratory (BNL) is a multi-disciplinary research facility located
in Suffolk County, New York. Wastewaters at BNL are directed to the Sewage Treatment Plant
(STP), and are treated and discharged in accordance with State Pollutant Discharge Elimination
System (SPDES) limits into the western branch of the Peconic River. Historical discharges from
the STP have resulted in elevated concentrations of heavy metals, polychlorinated biphenyls
(PCBs) and radionuclides in the Peconic River sediments. The Final Operable Unit V Record of
Decision (ROD) for Area of Concern 30 (Peconic River) specifies the cleanup limits and long-
term monitoring requirements. Remediation of river sediments occurred in 2004 and 2005, and
consisted of two phases of sediment excavation and removal, and post-excavation sampling. The
sections of the river that were remediated are shown in Figures 1-1, 1-2 and 1-3. Supplemental
sediment removal for three small areas (PR-WC-06, PR-SS-15 and the sediment trap areas) was
completed in January 2011 and is described in the June 2011 Draft Peconic River Supplemental
Sediment Removal Completion Report.
The following three bullets excerpted from page iii of the ROD summarize the Peconic
River cleanup goals which provide the basis for the annual monitoring program discussed in this
report8.
The on-Laboratory cleanup areas are shown in Figure 1-2. On Laboratory property, this
alternative would focus on sediment in designated depositional areas. For the sections of
the river on Laboratory property, the average mercury concentration after remediation
will be less than 1 ppm9, with a goal that all mercury concentrations in the remediated
areas are less than 2 ppm following the cleanup. The 1 ppm limit is expected to protect
human health and the environment under current conditions.
The outside Laboratory cleanup areas are shown in Figures 1-2 and 1-3. This
remedy would focus on a more stringent cleanup target concentration outside
BNL property. This alternative would also allow the greatest flexibility in the
8 The cleanup goals are limited to the average and maximum sediment mercury concentrations specified for on and outside BNL property. The ROD does not include cleanup goals for the water column or fish. 9 The ROD states the cleanup requirements in terms of ppm (parts per million). This report states all concentrations in terms of the units of contaminant per unit of environmental matrix in which the contaminant is found, for example milligrams per kilogram (mg/kg). For mercury in sediment the concentration is expressed as mg of mercury per kg of sediment. The terms mg/kg and ppm are equivalent, hence one mg/kg equals one ppm.
2
uses of the area as County parkland or any potential future development.
Sediment would be removed from the ponded areas where methylation leading to
bioaccumulation is most likely to occur, as well as other areas containing higher
concentrations of contamination between the Laboratory property line and
Connecticut Avenue. The average mercury concentration within the sediment
outside Laboratory property will be less than 0.75 ppm, with a goal that all
mercury concentrations in the remediated areas are less than 2 ppm following the
cleanup.
A monitoring program has been implemented to demonstrate the effectiveness of
the cleanup. This includes near-term monitoring to establish the basis for the
long-term monitoring program. As part of this program, the Department of
Energy (DOE) will continue to evaluate all available data to determine if
additional remediation is required to ensure the protection of human health and
the environment. This program includes methylmercury water column sampling,
sediment sampling, and fish sampling, and covers areas of interest both on and off
BNL property.
In May 2004, BNL initiated a two-phased remediation effort to address contaminated
sediments in the Peconic River. Phase 1, conducted between May and September 2004, removed
approximately 13,000 cubic yards of river sediments from BNL property. Following the on-site
cleanup, 788 post-excavation sediment monitoring points (located both within and outside the
remediation areas) were sampled to evaluate the effectiveness of the Phase 1 activities. The
Phase 1 activities resulted in a 96% reduction in average mercury concentration in river
sediments on BNL property, from about 4.6 milligrams per kilogram (mg/kg) to 0.2 mg/kg
(Envirocon, 2005). Phase 2, conducted between September 2004 and May 2005, removed
approximately 8,200 cubic yards of river sediments situated outside of BNL property in Suffolk
County parklands. Following the off-site cleanup, 1,442 and 149 post-excavation confirmation
sediment sampling points were sampled (within and outside the cleanup areas) to evaluate the
effectiveness of the Phase 2 activities in the section of the river from the BNL property line to
Schultz Road, and within the Manor Road cleanup area, respectively. The Phase 2 activities
resulted in a 95% reduction in average mercury concentration in river sediments downstream of
the BNL property line, from 1.8 mg/kg to 0.09 mg/kg (excluding the Manor Road area). In the

3
Manor Road area, an 83% reduction in mercury sediment concentrations was realized (from 1.08
mg/kg to 0.19 mg/kg) (Envirocon, 2005).
The long-term effectiveness of the cleanup is monitored once annually for mercury,
PCBs and cesium-137 in Peconic River sediment, and mercury and radionuclides in fish tissue.
Fish collected on the laboratory property are additionally analyzed for PCBs. Fish are collected
from sections of the river located on BNL property when samples can be collected without
negatively impacting the well-being of the fish population. Surface water monitoring for total
mercury and methylmercury is performed twice annually (June and July or August, depending on
river-water depths at the water column monitoring stations). Details of the sampling plan are
described in the Operable Unit I Soils and Operable Unit V Long-Term Monitoring and
Maintenance Plan (LTMM Plan) (BNL 2006). The 2010 Peconic River sampling was conducted
in accordance with the long-term sampling requirements stated in the Peconic River Record of
Decision. This document summarizes the results of the 2010 Peconic River monitoring.
Sampling locations are shown on Figures 1-4, 1-5 and 1-6.
Peconic River post-cleanup monitoring began in 2006. Consequently, 2010 was the fifth
year of post-remediation sediment, surface water and fish monitoring.
Of the analytes for which the ROD requires monitoring (mercury, methylmercury, PCBs,
cesium-137), there are only cleanup goals for mercury in sediment. Analytes without ROD-
required cleanup goals (methylmercury, PCBs, and cesium-137) are compared to their respective
pre-cleanup concentrations to demonstrate the concentration trends of these contaminants since
the cleanup. Additional chemical parameters that are part of the water quality monitoring are
provided in the appendices. These parameters are only discussed in the text when they are
relevant as supporting data for the goals of the monitoring program. Examples in the 2010 report
include, but are not limited to: 1) chlorophyll-a and total organic carbon (TOC) concentrations
that may indicate biologically active sections of the river and may influence the rate of
conversion of total mercury to methylmercury and/or contribute to elevated Total Suspended
Solids (TSS) measurements; 2) TSS measurements that may indicate potential inclusion of
suspended sediment in the water column and a potential contribution to the mercury
concentration of specific surface water samples; and, 3) dissolved oxygen (DO) that may
influence the distribution and abundance of fish in various sections of the river.

4
1.2 Report Organization
Sediment monitoring results are discussed in Section 2, water column monitoring results
are discussed in Section 3, and fish monitoring results are discussed in Section 4. At the end of
each section, recommendations are provided for that environmental medium (e.g. sediment,
surface water, and fish).
The complete set of analytical data collected during the 2010 Peconic River Monitoring
is provided in the Appendices.
5
SECTION 2 - 2010 SEDIMENT MONITORING RESULTS
2.1 Introduction
The Peconic River ROD requires that the long-term effectiveness of the cleanup be
monitored once annually for mercury, PCBs and cesium-137 in sediment. The annual routine
post-cleanup sediment sampling began in June 2006 and was repeated in 2007, 2008, 2009 and
2010 according to the procedures discussed in Section 3.0 of Appendix C of the LTMM Plan
(BNL, 2006). The locations of the annual sediment and surface water stations, listed in order
from upstream of the STP to downstream of Connecticut Avenue, are shown in Figures 1-4, 1-5,
and 1-6. The station labels, e.g. PR-SS-38/0.36, indicate the station name (PR-SS-38) and the
distance of the station in miles upstream (negative number) or downstream (positive number)
from the STP (e.g., 0.36 miles downstream for PR-SS-38)10.
Ten percent of the samples were also analyzed for silver and copper. These analytes do
not have cleanup goals specified in the ROD, and are therefore compared to pre-cleanup
sediment concentrations to assess cleanup effectiveness.
The 2010 sediment samples were collected to: 1) evaluate potential changes in the annual
concentrations of mercury in the sediment at the 30 routine sediment monitoring stations
sampled each year; and, 2) collect supplemental mercury distribution data for routine sediment
station PR-SS-33, which had a slightly elevated sediment mercury concentration in the 2010
routine monitoring. The 2010 routine annual sediment sampling results are discussed in Section
2.2, and the 2010 supplemental sediment sampling results are discussed in Sections 2.3 and 2.4.
2.2 2010 Routine Sediment Monitoring Results
As part of the Peconic River annual long-term monitoring program, the 30 routine
sediment monitoring stations shown on Figures 1-4, 1-5 and 1-6 were sampled in 2010. Routine
sediment monitoring stations are monitored on an annual basis. Supplemental monitoring
stations are sampled to gain additional information about a specific routine monitoring station
10 Manor Road and Donahue’s Pond sediment sampling stations are identified with an “MR” or “DP” rather than with an “SS: The water column sampling stations are also identified on these maps, with “WC” replacing the “SS” to identify locations where surface water samples are collected (see Chapter 3). PR-WC-01 identifies the first water column sampling station upstream of Schultz Road, and PR-WCS-01 identifies the first water column sampling station downstream of Schultz Road.
6
sample result, or the extent of contamination in the area in which the routine monitoring station
is located.
The 2010 routine sediment monitoring results are summarized in Table 2-1 and plotted in
Figure 2-1. Also plotted are the pre-cleanup average mercury concentrations and the 2010
average mercury concentrations for the routine onsite sediment monitoring stations, the routine
offsite monitoring stations to Schultz Road and the routine offsite monitoring stations at Manor
Road. All 30 routine sediment monitoring stations are located downstream of the BNL STP and
therefore have positive distances. Each sediment sample was analyzed for mercury, PCBs and
cesium-137. BNL also routinely analyzes 10% of the samples for silver and copper.
Two of the 2010 mercury samples were at (PR-SS-38) or greater than 2.0 mg/kg. The
2010 mercury concentration at station PR-SS-38 was 2.0 mg/kg and no supplemental samples
were required or collected. The basis for the 2010 onsite average mercury concentration (0.74
mg/kg) being substantially higher than the 2009 average mercury onsite average concentration
(0.40 mg/kg) is principally because of the 2010 mercury concentration of 4.7 mg/kg at PR-SS-
33. Section 2.3 discusses the supplemental sediment samples collected at PR-SS-33.
Overall, in 2010 the 29 routine sediment monitoring stations within the cleanup area (all
samples except Donahue’s Pond) had an average mercury concentration of 0.477 mg/kg (Table
2-1). The 15 sediment sampling stations located on BNL property had a 2010 average mercury
concentration in the sediment of 0.74 mg/kg, and the 12 sediment sampling stations located
offsite between the BNL boundary and Schultz Road had a 2010 average of 0.19 mg/kg (Table
2-1). The 2010 average mercury concentration for the two stations at Manor Road was 0.27
mg/kg. The single routine station at Donahue’s Pond (PR-DP-01) had a 0.24 mg/kg sediment
mercury concentration, but was excluded from the averaging because it is located approximately
two miles downstream of the most downstream cleanup area (Manor Road). Note that the Table
2-1 data also supports very considerable percent reductions (75 % to 99.96 %) in the 2010
concentrations of each analyte relative to the pre-cleanup average11 concentrations for the onsite,
offsite to Schultz Road, and Manor Road areas.
Silver, copper, PCBs and cesium-137 are co-located with mercury in depositional areas.
These co-located contaminants do not have ROD-required cleanup goals, and were therefore
compared with their pre-cleanup averages (Table 2-1). The 2010 silver, copper, PCB and
11 The pre-cleanup averages were obtained from Tables 8, 10 and 12 of the Final Closeout Report, Peconic River Remediation, Phases 1 and 2, Brookhaven National Laboratory prepared for Brookhaven Science Associates by Envirocon, Inc. August 25, 2005.
7
cesium-137 concentrations were substantially lower than the pre-cleanup averages and most of
the 2010 PCB results were smaller than or close to the detection limits (See Table 2-1 for pre-
cleanup summary data.) Refer to Appendices A, B and C for detailed metal, PCB, and
radionuclide analytical results, respectively.
2.3 2010 PR-SS-33 Supplemental Sediment Monitoring Results
All 2006–2010 routine and supplemental PR-SS-33 sediment mercury data are shown in
Table 2-2. Comparison of the May 13, 2010 mercury sediment concentration at PR-SS-33 with
all previous post-cleanup mercury concentrations (2006–2009) for this station indicates that nine
of the 10 PR-SS-33 values have been substantially lower than 2.0 mg/kg and that the average
mercury concentration for all 10 samples is 0.91 mg/kg.
Per the protocols established in the Data Quality Objectives (DQOs) of the
Environmental Monitoring Plan Triennial Update, when the average mercury concentration of
the supplemental sediment sample collected at the original sample location (PR-SS-33-O) and
the four supplemental samples collected five feet upstream, downstream, to the left and to the
right of the original location is less than the 2.0 mg/kg maximum individual sample goal, no
additional action is required.
On July 22, 2010 BSA/DOE recommended and collected five (5) supplemental sediment
samples within five (5) feet of the PR-SS-33 sediment sample station to confirm that the May 13,
2010 4.7 mg/kg mercury concentration represented an anomalously high mercury concentration
within the 80-100 square foot area surrounding PR-SS-33. These July 22 samples had an
average mercury concentration of 0.61 mg/kg and a maximum mercury concentration of 1.5
mg/kg. Because the 0.61 mg/kg average mercury concentration is substantially lower than the
2.0 mg/kg threshold for taking additional action, no additional action is recommended at PR-SS-
33.
8
2.4 PR-WC-06, PR-SS-15 and Sediment Trap Removal and Remedy Optimization
Supplemental sediment sampling at station PR-WC-06 was recommended in the Final
2008 Peconic River Monitoring Report (2008 Recommendation 612) to evaluate the sediment as
a potential source of the elevated total mercury concentrations which were detected at water
column sampling station PR-WC-06 in August 2006 and June 2008. Supplemental sediment
samples were collected in 2009 and 2010 to define the extent of contamination. All data for PR-
WC-06 area sediment samples collected through January 28, 2010 were reported in Section 2.4
of the Final 2009 Peconic River Monitoring Report. Additional supplemental sediment samples
were collected on March 25, 2010 and April 22, 2010. These data are reported in Table 2-3 of
this 2010 report. Figure 2-3 plots all PR-WC-06 sediment data and defines the two PR-WC-06
sub-areas (Area 1 and Area 2) that were identified for supplemental sediment removal to
optimize the remedy.
Supplemental sediment removal at PR-WC-06, PR-SS-15 and the Sediment Trap areas
was completed in January 2011. These activities will be described in detail in the closeout report
which will be submitted in June 2011.
2.5 Sediment Summary and Recommendations
Table 2-1 shows the 2010 mercury, silver, copper, PCBs and cesium-137 values for each
2010 sampling station as well as the average 2010 and pre-cleanup concentrations for the onsite,
offsite to Schultz Road and offsite Manor Road sections of the Peconic River. Table 2-1a
shows the 2006-2010 mercury data for each individual sediment monitoring station. Mercury is
the only contaminant with ROD required cleanup goals. Figure 2-1 plots the 2010 mercury
concentration for each individual station relative to the pre-cleanup average and 2010 average
mercury concentration. Figure 2-1a plots the 2006-2010 annual average onsite and offsite
mercury concentrations relative to the pre-cleanup averages.
The 2010 Peconic River routine sediment monitoring values are substantially lower than
the pre-cleanup values (Table 2-1) and all mercury samples, except one sample (PR-SS-33, 4.7
mg/kg) were below the cleanup goal. One sample (PR-SS-38, 2.0 mg/kg) was equivalent to the
12 2008 Recommendation 6 – PR-WC-06 has shown markedly elevated total mercury and TSS concentrations on two occasions: June 2008 (876 ng/L total mercury, and 79.1 mg/L TSS) and August 2006 (1,360 ng/L total mercury and 116 mg/L TSS). These two sample results merit further investigation of a potential sediment source at the sample location. BNL/DOE recommends that a sediment sample be collected at water column sampling station PR-WC-06 as part of the June 2009 and July/August 2009 mercury, methylmercury and TSS water column monitoring rounds. The sediment sample at the PR-WC-06 station will be collected after the routine mercury, methylmercury and TSS water column and water quality samples and field data are collected.

9
cleanup goal and required no additional action. Five supplemental samples collected within five
feet of the single PR-SS-33 value (4.7 mg/kg) failed to confirm the elevated mercury
concentration, and had an average of 0.61 mg/kg and a maximum value of 1.5 mg/kg. No
additional action is recommended in the PR-SS-33 area.
The 2010 Peconic River routine sediment monitoring had an average mercury
concentration of 0.74 mg/kg on BNL/DOE property, vs. a pre-cleanup average of 4.6 mg/kg
(Table 2-1). The average 2010 offsite mercury concentrations were 0.19 mg/kg from the BNL
boundary to Schultz Road, vs. a pre-cleanup 1.79 mg/kg average, and an average 2010 Manor
Road mercury concentration of 0.27 mg/kg, vs. a pre-cleanup 1.08 mg/kg average.
All onsite and offsite sediment PCB values were less than the reporting limit for all seven
PCB aroclors. The 2010 average cesium-137 activity on laboratory property was 0.89 pCi/g, vs.
a 5.7 pCi/g pre-cleanup average. The offsite areas from the BNL boundary to Schultz Road and
within the Manor Road cleanup area had 2010 averages of 0.36 and 0.24 pCi/g, respectively, vs.
pre-cleanup averages of 5.4 and 2.88 pCi/g, respectively (Table 2-1).
The PR-WC-06, PR-SS-15 and the Sediment Trap area sediment removals were
completed in January 2011. The sediment trap was also removed in January, 2011. These
activities will be described in detail in the closeout report which will be submitted to EPA,
NYSDEC, NYSDOH and SCDHS13.
Monitoring Report Recommendation: BSA/DOE recommends no additional action at
the PR-SS-33 sediment sample station based on the 2010 supplemental sampling results for this
location.
Five-Year Review Recommendation: Sediment monitoring for 2012 to 2014 was
evaluated in the 2010 Five-Year Review, and is summarized below:
BSA/DOE recommends that the number of sampling stations be reduced from 30 to three
stations (PR-WC-06, PR-SS-15, Sediment Trap cleanup areas) per year.
13 Frequently used acronyms: EPA (United States Environmental Protection Agency), NYSDEC (New York State Department of Environmental Conservation), NYSDOH New York State department of Health), SCDHS (Suffolk County department of Health services).

10
Details, tables and figures supporting all of the Five-Year Review recommendations are
described in Section 6.4.5 and Section 7.5 of the 2010 Five-Year Review, and are included in
Attachment 1 of this document.
11
SECTION 3 - 2010 WATER COLUMN MONITORING RESULTS
3.1 Introduction
The LTMM Plan indicates that twice each year, 22 water column monitoring stations in
the Peconic River, including one reference station in the Connetquot River, are sampled for total
mercury, methylmercury and TSS. The reference sample from the Connetquot River was
collected to provide information on total mercury and methylmercury levels in a nearby system
that is not impacted by a known mercury source. It serves as a basis for comparison to data
collected from the Peconic River upstream of the STP, but because it is only a single sample
location, the Connetquot River reference station should not be considered to be representative of
“background”.
Mercury methylation is enhanced by a combination of environmental conditions that
include increased water temperatures, decreased dissolved oxygen and decreased pH, all of
which occur during the late summer. Spring and winter collections are not optimal because of
snow and ice cover, unsafe working conditions and during spring, dilution of the water column
constituents from snow and ice melt and precipitation. For these reasons June and August were
originally selected for water column sampling because they include the typical periods of highest
mercury methylation (July-August/September). Being a water table controlled river the Peconic
is at its lowest depths during the late summer and early fall and is sufficiently shallow to
preclude water column sampling at several stations during August and occasionally in mid to late
July.
During the collection of the June 2010 water column samples the field team noted the
low river depths and advised that an August collection may not be possible due to low water.
Collecting samples from stations with less than 12 inches of water is likely to suspend sediment
from the river bed and cause elevated results, because sediment mercury concentrations are
substantially higher (parts per million) than the concentration of water column mercury (parts per
trillion). Therefore, water column samples are not collected at locations with less than 12 inches
of water. Consequently the scheduled August water sampling was re-scheduled to the third week
in July and still resulted in river conditions that prevented collecting four samples.
Table 3-1 describes the water column locations, schedules and sampling frequencies.
Tables 3-2a and 3-2b provide the analytical results and the field data for the stations where
conditions permitted sampling. For stations that could not be sampled because of low water
levels, Table 3-2 provides only the river depth. Tables 3-3 and 3-4 provide historical data for the

12
post-cleanup period. Beginning with the 2009 Peconic River Monitoring Report, these two
tables report data for the current year and the previous three years. Refer to the Final 2008
Peconic River Monitoring Report for historical monitoring data prior to 2006. Tables 3-3 and 3-
4 in this report contain historic data for 2007–2009 in addition to the 2010 data.
3.2 Data Collection Summary
The Peconic River water column monitoring stations and the Connetquot River station
are sampled twice annually for mercury, methylmercury and TSS. Peconic River water column
sample locations are shown in Figures 1-4, 1-5 and 1-6 together with the sediment sample
locations. Stations whose identification number begins with a “PR-WC-” are water column
stations located upstream of Schultz Road. The “PR-WC” station numbers increase from PR-
WC-01 with increasing distance upstream of Schultz Road. The water column stations that are
downstream of Schultz Road begin with “PR-WCS-”. The “PR-WCS-” station numbers increase
from PR-WCS-01 with increasing distance downstream of Schultz Road.
In 2007, a minimum required water depth of one foot was established for the water
sampling program to minimize potential re-suspension and sampling of river sediment during
water column sampling. Sediment re-suspension may confound the interpretation of surface
water analytical results. During 2007, 2008, 2009, and 2010 attempts were made to relocate a
sampling point to deeper water within the general area scheduled for sampling, if the water depth
at a sample station was less than one foot. The stations that most frequently cannot be sampled
are located upstream of where the STP effluent enters the river. The STP effluent enters the river
approximately 50 feet upstream of station PR-WC-11DS (Figure 1-4).
Two rounds of post-remediation water column sampling have been conducted in June and
August of 2007 and June and July of 2008, 2009 and 2010. Field observations in 2008 and 2009
indicated that water levels in the river were decreasing sufficiently rapidly to jeopardize an
August collection. In response to these observations, the second round of the 2008 through 2010
routine annual mercury, methylmercury and TSS water column monitoring was accelerated to
begin in July.
Quality assurance and quality control (QA/QC) samples included collection of field
blanks, field replicates and pairs of matrix spike/matrix spike duplicates (MS/MSD). Equipment
blanks were not necessary, since disposable sampling equipment was used at each sampling
location.

13
The standard method for collecting Peconic River water column samples for total
mercury, methylmercury and TSS analysis consists of collecting a single, large (2-liter) volume
water sample at each sampling location. The collected sample is then analyzed at the analytical
laboratory for the three analytes. This methodology ensures that the analytical results for each
water sampling location represent the same water mass. This aids the interpretation of potentially
anomalous results.
In addition to the routine mercury, methylmercury and TSS sampling, routine water
quality sampling was also conducted to assist in the interpretation of the mercury and
methylmercury data. This program collects water quality samples from eight stations distributed
throughout the remediated sections of the river approximately two to three weeks prior to,
during, and after the June and July mercury, methylmercury and TSS sampling (Table 3-1). A
total of five water quality rounds were conducted in 2010. Three of the five rounds (the “short”
rounds) were stand-alone water quality surveys (i.e. mercury and methylmercury samples were
not collected). Eight stations, water level permitting, are sampled during the short rounds. Two
rounds (the “long” rounds) of water quality monitoring are performed concurrent with the
mercury, methylmercury and TSS water column sampling. Twenty three river stations14 and the
STP effluent are sampled, water levels permitting, during the long rounds.
3.3 Monitoring Results
Analytical results and field data for each mercury, methylmercury and TSS water sample
collected in June and July 2010 are summarized in Table 3-2a and 3-2b, and are detailed in
Appendix D. Comparisons of the 2010 results to those obtained in previous post-cleanup
sampling rounds (2007 through 2009) are presented on Table 3-3 (June) and Table 3-4 (July).
The locations of the sampling stations are shown in Figure 1-4 (PR-WC-15 to PR-WC-02),
Figure 1-5 (PR-WC-06 to PR-WCS-02) and Figure 1-6 (PR-WCS-03 to PR-WCS-07). Total
mercury, TSS, methylmercury, and percent methylmercury concentrations are plotted on Figures
3-1, 3-2, 3-3, and 3-4, respectively. During the June and July 2010 long round, water column
14 The 23 river stations include the 22 Peconic River stations and one Connetquot River station (Table 3-1). In addition to the river monitoring stations, a grab sample is also routinely collected from the STP effluent. This sample is collected from within the Ultra Violet (UV) chamber adjacent to the former chlorine house. The total number of routine water column stations thus equals 24.

14
samples were collected at 24 and 2015, respectively of the 24 routine water column monitoring
stations.
3.4 Total Mercury
Figure 3-1 shows the mercury concentrations at each sample station (Site ID) and the
distance of the sample station upstream (negative distance) or downstream (positive distance)
from the BNL STP. For the 20 stations that were sampled in both June and July, the June and
July total mercury concentrations were generally very similar, as shown in Figure 3-1.
The two most upstream sample stations, other than PR-WC-12D7, with sufficient water
depth to collect a sample in June and July were STP-EFF-UVG (June-75.1 ng/L, July-69.1 ng/L,
0.0 mi. downstream of the STP) and PR-WC-11-DS16 (June-19.9 ng/L, July-33.4 ng/L, 0.04 mi.).
The two 2010 total mercury concentrations for STP-EFF-UVG were substantially lower than the
2009 STP-EFF-UVG (June-127 ng/L, July-115 ng/L, 0.0 mi.) data. In the 2.2 mile section of the
river between the 2010 June PR-WC-10 (22.5 ng/L, 0.3 mi) station and the PR-WC-02 station
(20.7 ng/L, 2.52 mi) the total mercury concentration fluctuated between 23.4 ng/L and 35.3 ng/L.
In the 1.79 mile section of the river between Schultz Road PR-WC-01 (river mile 2.98) and PR-
WCS-04 (river mile 4.77), the June total mercury concentration stabilized between 13.8 ng/L and
16.5 ng/L. Finally, the June total mercury concentration dropped from 14.8 ng/L at PR-WCS-04
to 3.9 ng/L at PR-WCS-05 (6.04 mi.), 4.7 ng/L at PR-WCS-06 (6.75 mi.) and 4.2 ng/L at PR-
WCS-07 (7.23 mi.).
The July 2010 total mercury concentrations downstream of PR-WC-10 followed a
generally similar downward trend. Although the total mercury trend was generally downward,
individual stations had values which fluctuated both upward and downward with increasing
distance downstream of the STP. However, it is notable that the July total mercury concentration
from PR-WC-04 (14 ng/L, 1.7 mi.) downstream to PR-WCS-07 (3.6 ng/L, 7.23 mi.) was
generally lower to substantially lower than the corresponding June total mercury values (PR-
15 Four (PR-WC-15, PR-WC-14, PR-WC-13, and PR-WC-02) of the 24 stations were not sampled in July due to water levels less than 12 inches. 16 The STP EFF-UVG sample is collected from a vault in the Ultraviolet (UV) chamber through which the effluent passes for UV sterilization prior to being discharged to the river. The decrease in total mercury concentration at PR-WC-11DS relative to STP-EFF-UVG is most likely caused by dilution of the STP effluent by mixing with the lower mercury concentration flow from upstream (PR-WC-12-D7, June-15.3 ng/L, July-13.3 ng/L, -0.01mi.) of the STP.

15
WC-04 - 23.4 ng/L, 1.7 mi. and PR-WCS-07 - 4.2 ng/L, 7.23 mi.). Refer to Tables 3-2a and 3-
2b and Figure 3-1.
A potential explanation of the lower water column total mercury concentrations in July
than in June is an increased river water volume in July which could have caused dilution.
However, review of corresponding river depth and flow rate data does not support the potential
role of dilution in causing lower July mercury concentration17.
3.5 Total Suspended Solids (TSS)
A total of 29 of the TSS samples collected with the 2010 total mercury and
methylmercury water column samples were less than the reporting limit of 2 mg/L. The average
TSS concentration for all mercury, methylmercury, TSS stations sampled in June and July 2010
was 3.97 mg/l18.
The importance of the low 2010 TSS concentrations is related to the relationship between
elevated mercury concentrations in the surface water and elevated TSS concentrations at stations
with elevated concentrations of mercury in the sediment. Historically, the maximum total
mercury concentrations in the water column have been associated with high TSS measurements,
however, this historical association was not observed in the 2010 data.
3.6 Methylmercury and Percent Methylmercury
Methylmercury is the biologically toxic form of mercury that is created by conversion of
inorganic mercury to methylmercury by bacteria.19 The June and July 2010 methylmercury data
are shown on Tables 3-2a and 3-2 b, respectively, and are plotted on Figure 3-3. Figure 3-3
shows that the June methylmercury trend had little variation and values generally fluctuated
between 3.18 and 6.74 ng/L for the 20 stations located in the 4.94 mile section of the river
between PR-WC-15 and PR-WCS-04. Two stations in this section of the river had substantially
17 The average of the sample depth for all Peconic River stations that were sampled in both the June and the July sampling events was approximately 3.8 inches deeper in June than in July, suggesting that river volume was greater in June than in July. Also, flow rate in July was approximately 0.11 feet per second faster in June than in July. These two field measurement do not support dilution as an explanation for July total mercury concentrations being lower than the June measurements. 18 The 2010 average TSS concentration was calculated using the reporting limit value of 2.0 mg/l as the value for samples that were reported as being non-detect, i.e. less than the reporting limit. 19 Because methylmercury is in a dissolved form, the mass of mercury contained in methylmercury is included in the total mercury measurement.

16
lower methylmercury values than the trend, STP-EFF-UVG (non-detect at 0.02 ng/L) and PR-
WC-01 (1.25 ng/L). The June methylmercury values for the three most downstream stations
varied between 0.655 ng/L and 1.37 ng/L. Most of the July methylmercury values for all stations
had similarly low variation between 0.5 ng/L and 4.3 ng/L with values relatively close to 2 ng/L.
As in June, the methylmercury concentration for the Sewage Treatment Plant effluent was quite
low (0.0573 ng/L). Both the June and the July STP effluent concentrations were lower than the
Connetquot River reference station values (0.22 ng/l and 0.12 ng/L, respectively). These June
and July 2010 methylmercury data do not support the occurrence of substantial net increases in
the rate of mercury methylation between the stations upstream of the BNL STP and the stations
downstream of the 2004/2005 Peconic River cleanup area (between stations PR-WC-11DS and
PR-MR-02).
The percent methylmercury20 is an indication of the suitability of the environment to
convert inorganic mercury to methylmercury. Percent methylmercury was calculated by
dividing the methylmercury concentration by the total mercury concentration, then multiplying
the resulting ratio by 100. Percent methylmercury data are plotted on Figure 3-4.
3.7 Water Column Mercury Concentrations at Transect PR-SS-15-U1
In 2006 routine sediment sampling station PR-SS-15 had a mercury concentration of 14.2
mg/kg. Subsequent supplemental sampling in 2007-2009 indicated an area of elevated mercury
in the sediment along transect PR-SS-15-U1 located 50 feet upstream of routine sediment
sampling station PR-SS-15. In 2008 BNL/DOE started monitoring the water column to evaluate
the potential for substantial downstream transport of mercury from the section of the PR-SS-15-
U1 transect with elevated mercury in the sediment. To make the water column sampling more
representative of annual flow conditions, Recommendation 521 of the Final 2008 Peconic River
Monitoring Report increased the frequency of surface water monitoring upstream and
20. The magnitude of the percent methylmercury value represents the percent of the total mercury that is in the methyl form. Large percent methylmercury values indicate areas in which the conditions are more appropriate for converting inorganic mercury to methylmercury than locations with low percent methylmercury. Large percent methylmercury values do not necessarily represent large masses of methylmercury unless the total mercury concentrations are also large. 21 2008 Recommendation 5 – 2008 Final Peconic River Monitoring Report , page 11“BNL/DOE recommends that monitoring the upstream and downstream concentration of total mercury, methylmercury and TSS at water column monitoring stations PR-SS-15-U1-WC-1, PR-SS-15-U1-WC-2, PR-SS-15-U1- WC-3, and PR-SS-15-U1-WC-4 occur four times annually, as flow permits, through 2010 to evaluate potential downstream transport of mercury and methylmercury from sediment in the PR-SS-15-U1 area.”

17
downstream of the PR-SS-15-U1 transect from two times per year to four times per year through
2010, as water levels permitted. The 2008 and 2009 water column data did not substantiate
substantial downstream transport.
Figures 3-5 to 3-7 and Table 3-5, show the spatial relationships of each of the four water
column stations PR-SS-15-U1-WC-1, PR-SS-15-U1-WC-2, PR-SS-15-U1-WC-3 and PR-SS-15-
U1-WC-4 and their data. For brevity these stations IDs are abbreviated as WC-1, WC-2, WC-3
and WC-4, respectively. Note that WC-4 and WC-3 are each 30 feet upstream of stations WC-1
and WC-2, respectively and that WC-1 and WC-2 are each 15 feet downstream of sediment
sampling stations PR-SS-15-U1-L40 and PR-SS-15-U1-L65. The initial (2007) elevated
mercury concentrations in the sediment at transect PR-SS-15-U1 were 9.8 mg/kg and 34.5
mg/kg, and are plotted on Figure 3-5.
The data in Figures 3-5, 3-6 and 3-7 do not support substantial downstream transport of
mercury from the PR-SS-15-U1 transect area. BSA/DOE recommends that water column
monitoring for total mercury, methylmercury and TSS be discontinued upstream and
downstream of transect PR-SS-15-U1. This is based on two factors: 1) the 2008, 2009 and 2010
mercury, methylmercury and TSS data do not substantiate substantial downstream transport of
contaminants from the PR-SS-15 area; and 2) the water column monitoring of the PR-SS-15 area
was intended to be temporary until the remediation of the PR-SS-15 area was completed. The
remediation was completed in January 2011.
3.8 Water Column Mercury Concentrations in PR-SS-10 Area
Recommendation 422 in the Final 2009 Peconic River Monitoring Report recommended
monitoring of total mercury, methylmercury and TSS four times annually at stations located
downstream of transect PR-SS-10-U1 and transect and PR-SS-10-D2. Re-evaluation of the
distribution of mercury in the PR-SS-10 area indicated that positioning these water column
monitoring stations upstream of transect PR-SS-10-U3 and on transect PR-SS-10-D3 would
22 2009 Recommendation 4: BNL/DOE recommends that total mercury, methylmercury and TSS in the water column be monitored at two supplemental stations upstream and two supplemental stations downstream of transects PR-SS-10-U1 and PR-SS-10-D2 at the locations with mercury concentrations greater than 2.0 mg/kg. The stations will be monitored four times annually, as water levels permit, to evaluate the water column concentration of mercury and methylmercury in this area, to evaluate the potential exposure of fish in this area to potentially elevated methylmercury concentrations and to evaluate the potential downstream transport of total mercury and methylmercury from this area.

18
allow the monitoring of the potential impact of an additional slightly elevated mercury location
on transect PR-SS-10-U3 (Figures 3-8, 3-9 and 3-10). Note that the river flows from the
upstream stations at the bottom of the page to the downstream stations at the top of the page.
Figures 3-8, 3-9 and 3-10 abbreviate the two downstream water column monitoring stations as
D3-WC1 and D3-WC-2 and abbreviate the two upstream water column monitoring stations as
U3-WC-3 and U3-WC-4. D3-WC-1 is downstream of U3-WC-4 and D3-WC-2 is downstream
of U3-WC-3. These locations monitor the potential impacts of the entire PR-SS-10 area on
downstream transport of mercury from the PR-SS-10 area.
Total mercury, methylmercury and TSS were collected four times during 2010 to
evaluate the potential transport of mercury downstream from sample locations within the PR-SS-
10 area with mercury concentrations greater than 2.0 mg/kg. The total mercury, methylmercury
and TSS data in Table 3-6 and Figures 3-8, 3-9 and 3-10 do not support substantial downstream
transport of mercury from the PR-SS-10 area.
3.9 Water Column Summary and Recommendations
The June and July 2010 STP effluent (STP-EFF-UVG) total mercury concentrations
(75.1 ng/L and 69.1 ng/L, respectively, Tables 3-2a and 3-2b, Figure 3-1) were substantially
lower than the corresponding 2009 concentrations at this station (127 and 115 ng/l, respectively)
for June 2009 and July 2009. The 2010 June and July total mercury concentrations then dropped
to 19.9 and 33.4 ng/L, respectively, at the next station (PR-WC-11DS) and then rose to 29.3 and
55.2 ng/L at PR-WC-09. The June and July total mercury concentrations then trended gradually
downward (with fluctuations) to PR-WCS-04 (14.8 and 7.6 ng/L, respectively) before reaching
mercury concentrations of 3.1 to 4.7 ng/L for the three most downstream monitoring stations.
The total mercury concentrations for these three stations (PR-WCS-05, PR-WCS-06 and PT-
WCS-07) are generally similar to the Connetquot River reference station historical maximum
mercury concentration (4.52 ng/L).
The 2010 sample results for methylmercury were also generally low (Tables 3-2a and 3-
2b, Figure3-3). The lowest methylmercury concentrations were a June non-detect at 0.02 ng/L
and a July 0.0573 ng/L at the BNL STP effluent station (STP-EFF-UVG). The June
methylmercury concentrations were slightly higher than the July concentrations. Other than the
STP, the rest of the June Peconic River stations had a 2010 range of 0.655 at PR-WCS-07, the

19
most downstream station, to 6.74 ng/L (PR-WC-05). Other than the STP, the rest of the July
Peconic River stations had a 2010 range of 0.5 (PR-WCS-05) to 4.3 ng/L (PR-WC-03) and a
mean of 2.07 ng/L.
Water column monitoring stations were also sampled for total mercury, methylmercury
and TSS four times annually both upstream and downstream of elevated sediment mercury
locations on transect PR-SS-15–U1 and transects at PR-SS-10 to evaluate potential downstream
transport of mercury from these locations. The 2010 data did not confirm substantial
downstream mercury transport from either the PR-SS-15-U1 transect or the PR-SS-10 area.
Monitoring Report Recommendation: BSA/DOE recommends that routine water
column monitoring be discontinued for the PR-SS-15 and PR-SS-10 areas in 2011 and 2012,
respectively, based on the 2010 surface water data described above, the 2008 and 2009 Peconic
River Monitoring Report data and completion of the PR-SS-15 sediment removal in January
2011.
Five-Year Review Recommendation: The 2010 Five-Year Review water column
recommendations for 2012 to 2014 are summarized below:
BSA/DOE recommends that routine water-column monitoring for total mercury,
methylmercury and TSS continue two times per year at the 15 stations between PR-WC-
15 (upstream of STP-EFF-UVG) and PR-WC-02.
BSA/DOE recommends that routine water-column monitoring at stations between and
including PR-WC-01 and PR-WCS-07 be discontinued in 2012, with the exception of
PR-WCS-04 (west of the Cranberry Bogs) and PR-WCS-06 (Donahue’s Pond). PR-
WCS-04 is near the downstream extent of the Manor Road cleanup area and will continue
to be monitored through 2012 as part of the routine water column monitoring program.
The need for continued monitoring at this location will then be evaluated. PR-WCS-06 is
outside the cleanup area and will continue to be sampled as part of the routine
environmental surveillance program.
BSA/DOE also recommends that analysis for water quality parameters (chlorophyll-a, N,
P, TOC, and TSS) be discontinued in 2012.

20
Details, tables and figures supporting all of the Five-Year Review recommendations are
described in Section 6.4.5 and Section 7.5 of the 2010 Five-Year Review, and are included in
Attachment 1 of this document.

21
SECTION 4 - 2010 FISH MONITORING RESULTS
4.1 Introduction
The purpose of the Peconic River fish sampling program is to monitor the effectiveness
of the Peconic River cleanup and to ensure that contaminants related to BNL operations do not
create a potential human health or environmental risk from fish consumption. Per the Peconic
River ROD, fish must be monitored once annually for mercury and cesium-137. Fish caught on
BNL property must also be monitored once annually for PCBs. Fish will be sampled in sections
of the river on laboratory property when samples can be collected without negatively impacting
the well-being of the fish population. The LTMM Plan states that to the extent possible, five
individual fish of sufficient size to obtain an edible fillet will be collected from each of two
feeding guilds within each of the five collection areas (Area A, Area D [North Street], Area P
[Schultz Road], Manor Road, and Donahue’s Pond) indicated on Table 4-1 and Figures 1-4, 1-5
and 1-6. The two feeding guilds are the top carnivore guild (e.g. chain pickerel and largemouth
bass) and the bottom feeder (e.g. brown bullheads and creek chubsuckers). The LTMM Plan
specifies alternate locations when conditions do not allow sampling the five indicated areas.
Area C, an alternate location for Area D, was also sampled in 2007, 2008, 2009, and 2010 to
supplement the on-site fish data. BNL also routinely samples fish at other locations as part of the
BNL environmental surveillance monitoring program. The environmental surveillance
monitoring data are reported each year in the BNL Site Environmental Report.
Fish Collection:
Fish were collected in the following areas between May 25 and August 13, 2010 (Table
4-2): Area A (downstream of the BNL STP), Area C, Area D at North Street, Manor Road, and
Donahue’s Pond. Fishery biologists from the Cold Spring Harbor Fish Hatchery collected fish
samples from Schultz Road, Manor Road, and Donahue’s Pond. The BNL field team collected
fish from Area A, Area C and Area D, assisted the Cold Spring Harbor fishery biologists with
their collections, and prepared all of the fish collected for off-site laboratory analysis.
The gear used and the water chemistry results are shown on Table 4-2. The 2010 water
temperatures at all five fish collections stations were between 22.03 degrees Celsius (Area A)

22
and 25.68 degrees Celsius (Area C). The dissolved oxygen concentrations were between 2.09
mg/L at Area D and 9.1 mg/L at Donahue’s Pond. The Area D (2.09 mg/L) and Manor Road
(3.04 mg/L) dissolved oxygen concentrations are low for supporting robust fish populations.
Approximately 36 percent of the 164 fish caught were bottom feeders (59 brown
bullheads) and 64 percent of the catch (105 fish) was predators other than brown bullheads.
Pumpkinseeds and bluegills composed 36 percent (59 fish) and 13 percent (21 fish), respectively,
of the total catch. Chain pickerel (11 fish) and largemouth bass (14 fish) represented
approximately seven and nine percent, respectively, of the catch.
Overall, the number of fish collected was larger than the number of analytical fish
samples due to the need to composite some of the fish in order to achieve the required fish tissue
sample mass specified by the analytical laboratory (see below).
Fish Preparation:
The BNL sample team measured the total length and weight of each individual fish,
filleted each fish and weighed the fillets of each fish, labeled and bagged each fillet and then
froze the fillets. As necessary to meet the analytical laboratory’s (GEL Inc.) mass requirements
for the requested analyses, the sampling team then grouped appropriate fillets of the same
species into composites and sent the frozen individual and composite samples via overnight
delivery to the analytical laboratory for processing and analysis.
Fish Tissue Compositing:
The Peconic River ROD requires that mercury, PCBs and radionuclides be evaluated for
fish collected on BNL property, and that mercury and radionuclides be evaluated for fish
collected outside BNL property. All fish samples consist only of edible tissue that was removed
from the fish (filleted) by the BNL field team. The required wet weight tissue mass for mercury,
PCB and radionuclide analysis are 5 g, 120 g, and 50 g, respectively. Because the proportion of
edible fish tissue to total body weight is highly variable depending on fish size and other factors,
the filleted tissue from two or more fish may need to be composited together to obtain sufficient
sample mass to obtain mercury, PCB and radionuclide analyses across the size range of Peconic
River fish. Table 4-4 shows the composition of the 84 composites analyzed in 2010.

23
BNL/DOE followed EPA guidance23 in limiting composites to fish of the same species,
fish of similar lengths, and fish collected within a week of each other. To the extent practicable,
the total length of the smallest fish was also generally equal to or greater than 75 percent of the
total length of the largest fish in that composite.
For each area from which fish were collected, Table 4-4 identifies the Chain of Custody
(COC) for each fish collected and each composite from that area. The Composite ID consists of
the respective COC number (for example “30239”) followed by a unique identifier (for example
“–bc1”) for each composite. Table 4-4, for example on page 3 of 5, also identifies the Fish ID
(for example, 10-212) for each fish that was included in each of the 84 fish composites, as well
as the species, the total length, and the age of each fish. The Fish ID consists of the collection
year (“10”) followed by a hyphen (“-”) and the sequential order in which the fish was collected,
e.g. “212”). Hence “10-212” represents the 212th fish collected in 201024, a 305 mm age 5+
brown bullhead collected from Area D. Finally, the average age of all fish within each
composite is calculated as the average of the numeric ages of each fish within the composite.
The two brown bullheads that were grouped into composite 30239-bc1 had total lengths of 283
and 305 mm and an average age of 4.5 years.
Fish Ageing:
BNL initiated the ageing of fish in 2008 to help explain potential age-related
relationships between fish contaminant concentrations and the completion of the cleanup. In
September 2004, the onsite river cleanup was completed, and in April 2005 the off-site river
cleanup was completed. Fish of age five or younger could have been born in a cleaned up area.
However, there are no year-round barriers to migration between the various sections of the river
located upstream of Donahue’s Pond (approximately river mile seven). None of the seasonal
barriers to fish migration (e.g. the sediment trap, which was removed in January 2011) are
sufficient to prevent fish migration during periods of high water. Therefore, it is safer to assume
23 U.S. EPA 2000. Guidance for Assessing Chemical Contaminant Data for Use in Fish Advisories. Volume 1 Fish Sampling and Analysis, Third Edition, EPA-823-B-00-007, November 2007. 24 The BNL Fish ID is a cumulative count of all fish collected by the BNL field team and includes fish collected for other purposes and bodies of water than the Peconic river post-cleanup monitoring program for which 164 fish were collected. Analytical results for these latter fish are routinely reported in the annual Environmental Monitoring Report.

24
that five-year-old fish were born during the year that remediation was completed, and six-year-
old fish were born prior to remediation being completed.
As fish grow, growth rings (similar to tree growth rings) called “annuli” are left on the
fish scales and otoliths. Counting the annuli provides an estimate of fish age, similarly to
counting rings on a tree. Otoliths are calcified sensory organs that function in hearing and
balance. Because otolith removal and preparation for ageing are very labor intensive, fish ageing
is typically done on scales for scale-bearing fish (e.g. bass and sunfish). Otolith aging is
typically done for fish that do not have scales, such as catfish. For the 2010 Peconic River fish,
all species except brown bullheads (a type of catfish) were aged based on scale interpretation.
Brown bullheads were aged by otolith interpretation.
Under contract to BNL, an independent experienced fish biologist performed the otolith
removal. The brown bullheads were transferred to the fish biologist via COC. The contractor
removed the otoliths and returned the otoliths and brown bullheads to BNL custody. The otoliths
and the scales were then transferred to a second independent contractor (EcoLogic, LLC) under
separate COCs to prepare the scales and otoliths and interpret the fish ages. Scales were first
cleaned and then pressed into a clear cellulose acetate plastic slide material to make a lasting
impression. The slides were then placed into scale envelopes labeled with the BNL Fish ID.
Otoliths were cleaned and embedded in epoxy, sectioned into thin slices, then fixed onto
a glass slide with clear epoxy and labeled. The ageing was conducted using a double blind
QA/QC process in which two Ecologic, LLC fishery biologists independently interpreted the
ages of each of the fish scales and otoliths. After completing the ageing, the two biologists met
to resolve any differences.
The protocol for age interpretation is described below25:
For fish with no scale growth beyond the outermost annulus, ages were interpreted to be
equal to the number of annuli. For example, if there were two annuli and no discernible
scale growth between the outermost annulus and the outer margin of the scale, the
assigned age would be two years.
25 BNL/DOE thanks Charles Guthrie, NYSDEC Region 1 Regional Fishery Manager for explanation of the following age interpretation convention.
25
For fish with discernible growth beyond the outermost annulus, the interpreted age was
based on the number of annuli with a plus sign (+) to indicate growth beyond the
outermost annulus, for example 2+.
If the scale growth from the outermost annulus to the scale margin (“M”) was roughly
equivalent to the scale growth shown in the previous year between the two previous
annuli, then the age was based on the number of annuli plus one year, followed by an
“M.” For example, the age of a fish whose scale had two discernible annuli plus scale
growth beyond the second annulus that was roughly equal to the growth between annulus
1 and annulus 2, would be expressed as 3M. An example of this would be a fish that was
born in the late spring and had completed three years of growth, but the formation of the
third annulus had not yet been completed.
Appendix F shows the age interpretation data for each of the two fishery biologists, the
notes they recorded for a given set of scales or otoliths, and the final agreed-upon age. The
analytical data in Appendices G, H, and I, can be cross referenced with the age data in Appendix
F by Fish ID or composite ID (Table 4-4). Whenever the assigned ages were used in
calculations (such as when calculating the average age of the fish within a composite), the ages
that had been assigned by the age interpreters were converted from the alpha numeric ageing
code described above to a whole number. When the age of a composite sample was calculated,
the result of the calculation was expressed with one decimal place. For example, if a composite
consisted of fish with interpreted ages of 3M, 3, 3+ and 4M, the ages used in the calculation
would be 3, 3, 3 and 4, respectively, and the average age of fish in the composite would be
expressed as 3.3.
26
4.2 2010 Fish Monitoring Results
The detailed analytical results for each of the fish or composites in the 2010 collection
are shown in Tables 4-.4 to 4-9c, and Appendix G (mercury), Appendix H (PCBs) and Appendix
I (cesium-137 and potassium-4026). The analytical data are discussed in two formats.
In the first format, the analytical values for each fish sample collected between the BNL
STP and Donahue’s Pond are discussed without regard to species or age (Figures 4-1a, 4-1b)
The mean concentration across the entire sampled population is indicative of the average for the
entire population within this stretch of the river. The data are representative of the general
population in the river between the BNL STP and Donahue’s Pond, subject to the selectivity of
the collection equipment and techniques. In a similar manner, but to a lesser extent, the average
ages, sizes and contaminant concentrations of the fish in each of the areas represent the
respective ages, sizes and contaminant concentrations for the subpopulations inhabiting those
sections of the river at the times of the respective collections. Figure 4-2 shows the mean
mercury concentrations for each section of the river from which fish were collected. However,
because movement can occur between the various sections, depending on the water level in the
river, it cannot be confidently inferred that the derived subpopulation statistics permanently
apply to a given subsection of the river (for example, Area A, Area C, Area D, Schultz Road,
etc.) at times other than during the collection period.
In the second format, concentration statistics and age and length data are compared on a
species-specific basis for the entire sampled population. From these data, species-specific, age-
specific and size-specific trends can be derived (Figures 4-3 through 4-9).
26 BNL/DOE routinely reports radiological results for fauna (fish, deer, etc.) as pCi/g wet-weight. To confirm that the analytical laboratory has reported the radiological data for fish on a wet-weight basis, BNL/DOE also analyzes fish and select other fauna for potassium-40, a naturally occurring radionuclide. The potassium-40 activity in fish is typically in the 1 pCi/g to 4 pCi/g range. Potassium-40 analytical results greater than 10 pCi/g indicate that the results have been reported on a dry-weight basis.

27
4.3 Mercury
The 2010 mercury analyses (Appendix G) were performed on 108 fish samples. Table 4-
4 details the fish included in each fish composite. These 108 fish samples included 28 composite
samples composed of the fillets from 84 fish (Table 4-7a) and 80 individual single fish fillet
samples (Table 4- 7d). Thus the 108 fish mercury samples represent 164 fish.
The mean mercury concentration for all individual and composite fish samples and
species among the 108 mercury fish samples is 0.28 mg/kg. The 2010 mercury concentration is
not substantially different from any of the other post-cleanup (2006-2010) fish mercury
concentrations (Table 4-10a). However, the pre-cleanup (1996, 1997, 2001) mercury
concentration of 0.5227 mg/kg is higher than each year of the post-cleanup mercury
concentrations, as indicated by the non-overlap of the pre-cleanup 95 percent confidence
intervals with any of the post-cleanup confidence intervals (Figure 4-10a).
BNL/DOE does not have a specific cleanup goal associated with mercury concentrations
in fish tissue, but for reference purposes BNL has included the EPA water quality criterion for
mercury (0.3 mg of methylmercury per kg of fish tissue, U.S. EPA, 2001) on each of the species-
specific fish mercury figures. The total body burden of mercury within fish tissue, for which
BNL/DOE analyzes, is routinely assumed to be equal to the concentration of methylmercury in
the tissue. All analyses are reported on a wet weight basis.
Population and Subpopulation Mercury Trends:
Figures 4-1a and 4-1b show the mercury concentrations in edible fish tissue for the entire
2010 set of 108 fish mercury samples, sorted by species-age-area and by species-area-age,
27 The pre-cleanup mercury concentrations used in this report consist of fish samples reported in Appendices F3 (1996) and F4 (1997) of the 1998 Operable Unit V Remedial Investigation Report. The 1996 Appendix F3 fish were prepared as head and viscera removed samples. The 2001 fish samples were prepared as standard fillet samples. The data sources for the 2001 fish and for an additional ten 1996 fish was the NYSDEC HUD_MET electronic data base.. The 10 NYSDEC 1996 fish samples were prepared as standard fillet samples . The mean mercury concentration for the combined 1996 and 2001 fish was 0.58 mg/kg. These fish results were discussed extensively in the 2009 Peconic River Monitoring Report. The 1996 fish were collected on BNL/DOE property and the 1997, 2001 and 2006-2010 fish were collected between the BNL STP and Donahue’s Pond. The pre-cleanup mercury concentrations discussed in this report include the 1997 fish that were analyzed as whole body samples intended for ecological risk assessment. Whole body samples generally have slightly lower mercury concentration than fillet samples or head and viscera removed samples due to dilution of the mercury by the mass of the head, skin, scales and viscera that have not been removed. The average mercury concentration for the complete set of combined 1996, 1997 and 2001 fish is 0.52 mg/kg.

28
respectively. The average (or mean) mercury concentration for all 2010 mercury fish samples is
0.28 mg/kg. The figure shows much variation associated with the various species, ages, sizes
and locations. Species-specific relationships are discussed in the next section, and are plotted in
Figures 4-3 to 4-7.
Figure 4-2 summarizes the data shown in Figures 4-1a and 4-1b by plotting the mean
mercury concentration for all fish within each of the six collection areas. The six mean
concentrations are plotted as vertical blue bars in Figure 4-2. The six black error bars show the
95 percent confidence intervals for the mean mercury concentrations for each of the six
collection areas. Note that the lower part of the black error bars for the mean fish mercury
concentrations for all areas do not overlap the Donahue’s Pond black upper part of the black
error bar for the mean fish mercury concentration for Donahue’s Pond. This indicates that the
Donahue’s Pond fish are statistically lower in mercury concentration than fish from the other
areas, at p=0.05. This supports the appearance of a downward trend28 in mercury concentration
for fish collected from the stations downstream of Manor Road.
The white error bars show the 95 percent confidence interval for the mean of all 108
mercury samples. The 95 percent confidence interval for all six of the area-specific means
overlaps the confidence interval for the all-fish mean mercury concentration, indicating that the
area-specific fish mercury mean concentrations are not significantly different than the mean for
the entire 2010 collection, at p=0.05.
Species-Specific Mercury Trends:
Tables 4-7a and 4-7d (mercury), 4-7b and 4-7e (PCBs) and 4-7c and 4-7f (cesium-137)
for composites and individual fish samples, respectively, provide detailed summaries of the
relationships between species, age and fish tissue contaminant concentrations. Total length is
provided as an indicator of the overlap in size for fish of different ages. These data are plotted
on a species-specific basis on Figures 4-3a and b through 4-7a and b (mercury), 4-8 (PCBs) and
4-9 (cesium-137). Table 4-8a groups the mercury analytical results for composite and individual
samples by collection area and Table 4-9c lists the minimum, maximum and average mercury
concentration for each species within each area.
28 Note that the Schultz Road area has only one sample which is a composite of two brown bullheads and may not accurately represent the mean mercury concentration of the Schultz Road sub-population at the time of collection.

29
The mercury concentrations for each of the 2010 fish samples are also plotted in the
species-specific Figure 4-3a to Figure 4-7a (sorted within species by age, area and length) and
also in the species-specific Figures 4-3b to Figure4-7b (sorted within species by area, age and
length)29. Each of these figures identifies the fish sample with the area from which it was
collected, the total length (in millimeters (mm)), and the average age of the fish in the sample.
All samples with fractional lengths (e.g., L=300.5) are composites. The fish samples are
identified by a BNL Fish ID, e.g. 09-141 or a Composite ID in Tables 4-4, 4-7a – 4-7f and 4-8a –
4-8c. Composite samples are identified by a composite ID containing the COC number and a “-
bc” followed by a unique number, e.g. 27022-bc1. Fifteen bluegill samples, consisting of 13
individual bluegill samples and two composite samples, were analyzed for mercury in 2010.
Figures 4-3a and 4-3b plot the mercury concentrations for each of the bluegills. Bluegill average
ages ranged between 1 year and 6 years. The average mercury concentration of bluegills was
0.21 mg/kg, and 14 of the 15 samples were less than the 0.3 mg/kg EPA mercury criterion.
Forty-eight brown bullhead samples were analyzed for mercury in 2010 (Figures 4-4a
and 4-4b). The average mercury concentration of the 48 samples was 0.25 mg/kg. The samples
consisted of 38 individual fish samples and 10 composite samples. The bullhead samples with
the ten lowest mercury concentrations (0.0242 mg/kg – 0.109 mg/kg) were between two and
eleven years old and from Area D (two samples) and Donahue’s Pond (8 samples). In contrast
the bullhead samples with the ten highest mercury concentrations (0.317 mg/kg – 1.2 mg/kg)
were between one and four years old and from all collection areas except Donahue’s Pond.
Figures 4-5a and 4-5b show the mercury concentrations of the 6 chain pickerel samples
that were analyzed for mercury in 2010. The mean mercury concentration for the six samples
was 0.37 mg/kg and the samples ranged between 0.131 mg/kg and 0.569 mg/kg. The fish ages
range from less than a year old to three years old.
Figures 4-6a and 4-6b show the mercury concentrations for the 11 largemouth bass
samples that were analyzed for mercury in 2010. Mercury concentrations ranged from 0.276
mg/kg for an age 1, Area A largemouth bass to 0.96 mg/kg for an age 8 Donahue’s Pond fish.
The average mercury concentration of the 2010 largemouth bass collection was 0.50 mg/kg.
29 The mercury fish plots were sorted by both age-area- length and area-age-length to evaluate whether either age-specific or area-specific trends in mercury concentration were apparent. The plots do not support clear trends. This may be caused by mixing of population when fish can migrate through several of the sample areas during periods of high water, the true absence of an area-specific mercury trend, the absence of a trend in the 2010 fish samples, or a combination of each.

30
Figures 4-7a and 4-7b show the mercury concentrations for the 28 pumpkinseed samples
that were analyzed for mercury in 2010. The average mercury concentration for all 28
pumpkinseeds was 0.27 mg/kg and the concentrations ranged between 0.0638 mg/kg and 0.709
mg/kg. The pumpkinseed samples with the ten lowest mercury concentrations ranged between
0.0638 and 0.163 mg/kg and were collected from Manor Road (2) and Donahue’s Pond (8). The
fish ranged in age from two to six years old. The pumpkinseed samples with the ten highest
mercury concentrations ranged between 0.293 and 0.709 mg/kg and were collected from all areas
except Donahue’s Pond and Schultz Road. The fish ranged in age from one to three years old.
4.4 PCBs
The Peconic River ROD requires PCBs as an analyte for fish collected on BNL property.
Fish PCB are plotted in Figure 4-8. The large mass (120 g) of tissue required for PCB analysis
limits the number of samples that can be analyzed and mercury samples were given preferential
treatment. Each sample was analyzed for the seven aroclors (Aroclor-1016, Aroclor-1021,
Aroclor-1232, Aroclor-1242, Aroclor-1248, Aroclor-1254, and Aroclor-1260); hence 28 PCB
analyses were performed (4 samples times seven (7) aroclors). Table 4-7b and 4-7e show the
detailed analytical results for the two composite and the two individual samples, respectively
(see footnote 24).
Composite sample 30148-bc10 consisted of six Area A pumpkinseeds with an average
length of 152 mm and an average age of 2.2 years. This sample had values of non-detect for six
of the seven aroclors. Aroclor-1254 was detected in 30148-bc10 at an estimated value of 22.5
ug/kg (Table 4-7b30). All other aroclors had values less than the reporting limit. Composite
sample 30239-bc1 consisted of two Area D brown bullheads with an average length of 294 mm
and an average age of 4.5 years. Aroclor-1260 had an estimated value in 30239-bc1 of 5.22
ug/kg, with a reporting limit of 9.9 ug/kg. All other aroclors had values less than the reporting
limit.
The two individual fish samples that were analyzed for PCBs had no detections for any of
the seven aroclors (Table 4-7e). Individual Area D largemouth bass sample 10-217 collected
from upstream of stream gauging station HQ was 320 mm long and 4.0 years in age. Individual
Area C brown bullhead sample 10-125 was 341 mm long and 5 years in age.
30 Note that the Method Detection Limit and Practical Quantification Limit are unusually high for this sample and that although the Matrix Spike met acceptance limits, the Matrix Spike Duplicate and Relative Percent Different did not meet acceptance limits, possibly due to matrix interference.
31
Of the two PCB estimated detections in 2010, Aroclor-1254 had the highest
concentration at an estimated 22.5 ug/kg, with a reporting limit of 50 ug/kg, and was selected as
the principal aroclor for historical analysis. The mean Aroclor-1254 concentration for the 4 2010
individual and composite fish samples was 13.09 ug/kg (Table 4-10b, Figure 4-10b1 and b2).
This mean concentration is not substantially different from the other post-cleanup (2006-2010)
fish Aroclor-1254 concentrations other than the 2006 and 2009 means. However, the pre-
cleanup31 (1996/1997) mean Aroclor-1254 concentration of 1205.21 ug/kg is substantially higher
than each of the post-cleanup mercury concentrations, as indicated by the non-overlap of the pre-
cleanup confidence intervals with any of the post-cleanup confidence intervals (Figures 4-10b1
and b2).
4.5 Cesium-137 Results
A total of 62 fish samples were analyzed for cesium-137 in 2010. Cesium-137 analytical
results are provided on Table 4-7c and Table 4-7f for the 19 composite samples (consisting of 59
fish) and 43 individual fish samples. Table 4-4 details the fish included in each fish composite.
Table 4-8c groups the cesium-137 analytical results for composite and individual samples by
collection area and Table 4-9c lists the minimum, maximum and average cesium-137 activity for
each species within each area. Figure 4-9 shows the distribution of the 2010 cesium-137
analytical results, sorted by species, area, and age. In 2010 the average cesium-137 activity for
all fish was 0.11 pCi/g. Onsite fish (Areas A, C, D) had a 0.17 pCi/g average and offsite fish
(Schultz Road, Manor Road, Donahue’s Pond) had a 0.08 pCi/g average.
The mean cesium-137 activity for all individuals and species among the 62 fish analyzed
in 2010 for cesium-137 is 0.11 pCi/g (Table 4-10c). The 2010 mean is substantially lower than
the pre-cleanup mean (1.37 pCi/g) and also less than the 2006 (0.24 pCi/g) and 2009 cesium -137
values (0.17 pCi/g)). The pre-cleanup (1996 and 1997) mean cesium-137 activity is substantially
higher than each of the post-cleanup means, as indicated by the non-overlap of the pre-cleanup
confidence intervals with any of the post-cleanup confidence intervals (Figure 4-10c).
31 To avoid confounding Aroclor-1254 and Aroclor-1260, the NYSDEC PCB data was not used. NYSDEC reports these two aroclors as a composite value consisting of both Aroclor-1254 and Aroclor-1260.
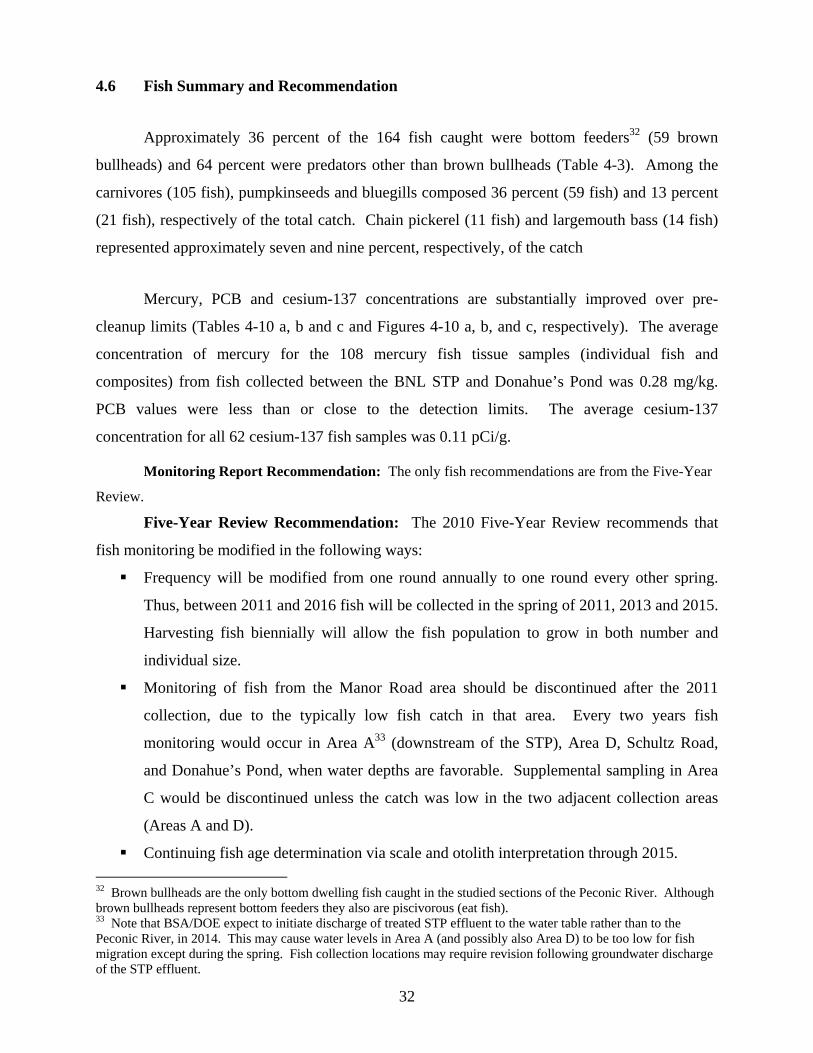
32
4.6 Fish Summary and Recommendation
Approximately 36 percent of the 164 fish caught were bottom feeders32 (59 brown
bullheads) and 64 percent were predators other than brown bullheads (Table 4-3). Among the
carnivores (105 fish), pumpkinseeds and bluegills composed 36 percent (59 fish) and 13 percent
(21 fish), respectively of the total catch. Chain pickerel (11 fish) and largemouth bass (14 fish)
represented approximately seven and nine percent, respectively, of the catch
Mercury, PCB and cesium-137 concentrations are substantially improved over pre-
cleanup limits (Tables 4-10 a, b and c and Figures 4-10 a, b, and c, respectively). The average
concentration of mercury for the 108 mercury fish tissue samples (individual fish and
composites) from fish collected between the BNL STP and Donahue’s Pond was 0.28 mg/kg.
PCB values were less than or close to the detection limits. The average cesium-137
concentration for all 62 cesium-137 fish samples was 0.11 pCi/g.
Monitoring Report Recommendation: The only fish recommendations are from the Five-Year
Review.
Five-Year Review Recommendation: The 2010 Five-Year Review recommends that
fish monitoring be modified in the following ways:
Frequency will be modified from one round annually to one round every other spring.
Thus, between 2011 and 2016 fish will be collected in the spring of 2011, 2013 and 2015.
Harvesting fish biennially will allow the fish population to grow in both number and
individual size.
Monitoring of fish from the Manor Road area should be discontinued after the 2011
collection, due to the typically low fish catch in that area. Every two years fish
monitoring would occur in Area A33 (downstream of the STP), Area D, Schultz Road,
and Donahue’s Pond, when water depths are favorable. Supplemental sampling in Area
C would be discontinued unless the catch was low in the two adjacent collection areas
(Areas A and D).
Continuing fish age determination via scale and otolith interpretation through 2015.
32 Brown bullheads are the only bottom dwelling fish caught in the studied sections of the Peconic River. Although brown bullheads represent bottom feeders they also are piscivorous (eat fish). 33 Note that BSA/DOE expect to initiate discharge of treated STP effluent to the water table rather than to the Peconic River, in 2014. This may cause water levels in Area A (and possibly also Area D) to be too low for fish migration except during the spring. Fish collection locations may require revision following groundwater discharge of the STP effluent.

33
Details, tables and figures supporting all of the Five-Year Review recommendations are
described in Section 6.4.5 and Section 7.5 of the 2010 Five-Year Review, and are included in
Attachment 1 of this document.

34
SECTION 5 - PR-WC-06, SEDIMENT TRAP AND PR-SS-15 REMEDY
OPTIMIZATION AND SEDIMENT TRAP REMOVAL
During January 2011 the Peconic River Sediment Trap, located adjacent to Z path and
upstream of stream gauging station HQ, was removed as required by the Peconic River ROD.
During December 2010 and January 2011 supplemental sediment was also removed from the
PR-WC-06, Sediment Trap, and PR-SS-15 areas to optimize the remedy for these three areas.
The waste was transported to a Subtitle D landfill (Allied Waste Niagara Falls Landfill in
Niagara Falls, NY) in late February and early March 2011. These actions were recommended in
Recommendation 5 of the 2009 Peconic River Monitoring Report34. These activities have been
described in detail in the June 2011 Draft Peconic River Supplemental Sediment Removal
Completion Report.
34 2009 Recommendation 5: BNL/DOE recommends that the sediment trap be removed in coordination with the accelerated removal of sediment with elevated mercury concentrations. Both the sediment trap removal and the accelerated sediment removal are scheduled to be conducted in 2010.
35
SECTION 6 - REFERENCES
BNL, 1998. Final Operable Unit V Remedial Investigation report, Volume V of V, Appendix F3 and Appendix F4, May 27, 1998, Brookhaven Science Associates, Upton, NY.
BNL, 2004. Final Operable Unit V Record of Decision for Area of Concern 30 (Peconic
River), November 3, 2004, Brookhaven Science Associates, Upton, NY. BNL, 2006. Operable Unit I Soils and Operable Unit V Long Term Monitoring and
Maintenance Plan, May 2006, Brookhaven Science Associates, Upton, NY. BNL, 2007. Final 2006 Peconic River Monitoring Report, July 2007, Brookhaven Science
Associates, Upton, NY. BNL, 2008. Final 2007 Peconic River Monitoring Report, July 2008, Brookhaven Science
Associates, Upton, NY. BNL, 2009. Final 2008 Peconic River Monitoring Report, September 2009, Brookhaven
Science Associates, Upton, NY. BNL, 2010. Final 2009 Peconic River Monitoring Report, June 2010, Brookhaven Science
Associates, Upton, NY. Envirocon, Inc., 2005. Final Closure Report, Peconic River Remediation, Phases 1 and 2.
Prepared for Brookhaven National Laboratory, Upton, New York. August 2005. Quantitative Environmental Analysis, LLC (QEA), 2003. Sampling Plan for Mercury and
Methylmercury in the Water Column of the Peconic River. Prepared for Brookhaven National Laboratory, Upton, New York. February 2003.
QEA, 2004a. 2004 Sampling Plan for Mercury and Methylmercury in the Water Column of the
Peconic River between Schultz Road and Connecticut Avenue. Prepared for Brookhaven National Laboratory, Upton, New York. February 2004.
QEA, 2004b. Peconic River 2003 Data Summary Report. Prepared for Brookhaven National
Laboratory, Upton, New York. April 2004. QEA, 2004c. 2004 Methylmercury Sampling Program Results: Addendum to the Peconic River
2003 Data Summary Report. Prepared for Brookhaven National Laboratory, Upton, New York. September 2004.
QEA, 2006. 2005 Peconic River Water Column Sampling Data Summary Report. Prepared
for Brookhaven National Laboratory, Upton, New York. December 2006. U.S. EPA, 1996. Method 1669, Sampling Ambient Water for Trace Metals at EPA Water
Quality Criteria Levels, July 1996, Office of Science and Technology, Office of Water, Engineering and Analysis Division (4303) U.S. Environmental Protection Agency, Washington DC 20460.
36
U.S. EPA, 2001. Final Water Quality Criterion for the Protection of Human Health: Methylmercury, EPA-823-R-01-001, January 2001, Office of Science and Technology, Office of Water, U.S. Environmental Protection Agency, Washington DC 20460.
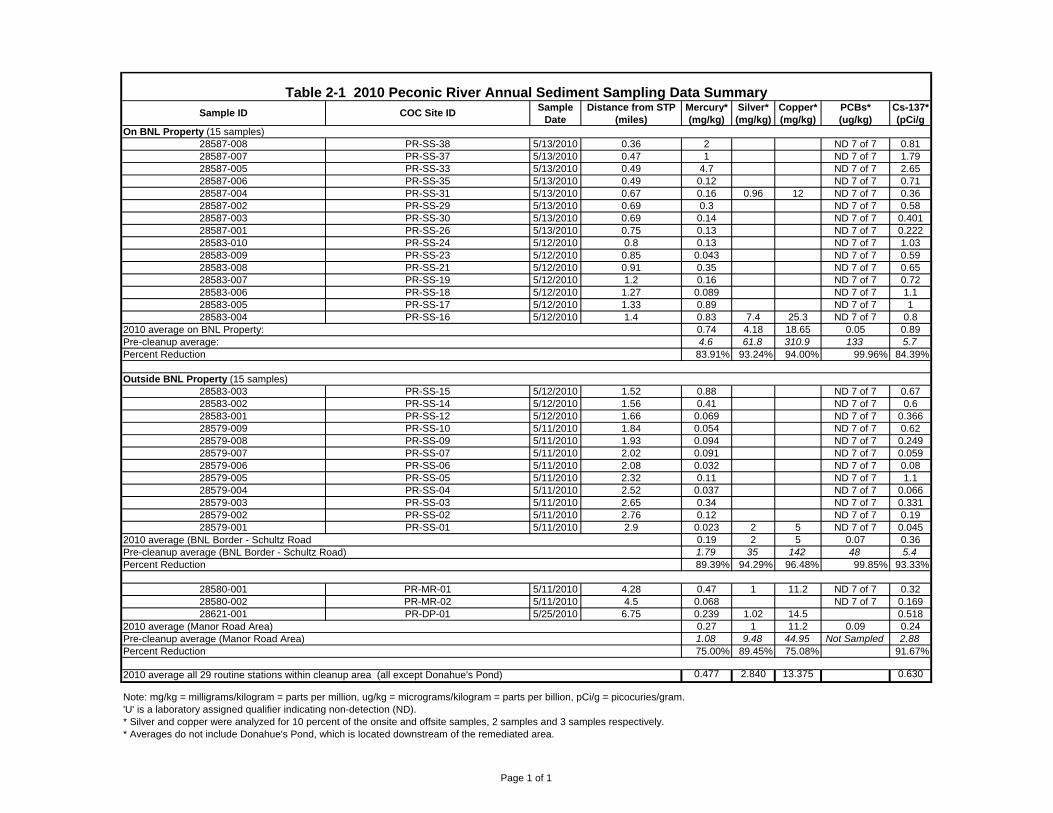
Sample Distance from STP Mercury* Silver* Copper* PCBs* Cs-137*Date (miles) (mg/kg) (mg/kg) (mg/kg) (ug/kg) (pCi/g
28587-008 PR-SS-38 5/13/2010 0.36 2 ND 7 of 7 0.8128587-007 PR-SS-37 5/13/2010 0.47 1 ND 7 of 7 1.7928587-005 PR-SS-33 5/13/2010 0.49 4.7 ND 7 of 7 2.6528587-006 PR-SS-35 5/13/2010 0.49 0.12 ND 7 of 7 0.7128587-004 PR-SS-31 5/13/2010 0.67 0.16 0.96 12 ND 7 of 7 0.3628587-002 PR-SS-29 5/13/2010 0.69 0.3 ND 7 of 7 0.5828587-003 PR-SS-30 5/13/2010 0.69 0.14 ND 7 of 7 0.40128587-001 PR-SS-26 5/13/2010 0.75 0.13 ND 7 of 7 0.22228583-010 PR-SS-24 5/12/2010 0.8 0.13 ND 7 of 7 1.0328583-009 PR-SS-23 5/12/2010 0.85 0.043 ND 7 of 7 0.5928583-008 PR-SS-21 5/12/2010 0.91 0.35 ND 7 of 7 0.6528583-007 PR-SS-19 5/12/2010 1.2 0.16 ND 7 of 7 0.7228583-006 PR-SS-18 5/12/2010 1.27 0.089 ND 7 of 7 1.128583-005 PR-SS-17 5/12/2010 1.33 0.89 ND 7 of 7 128583-004 PR-SS-16 5/12/2010 1.4 0.83 7.4 25.3 ND 7 of 7 0.8
0.74 4.18 18.65 0.05 0.894.6 61.8 310.9 133 5.7
Percent Reduction 83.91% 93.24% 94.00% 99.96% 84.39%
28583-003 PR-SS-15 5/12/2010 1.52 0.88 ND 7 of 7 0.6728583-002 PR-SS-14 5/12/2010 1.56 0.41 ND 7 of 7 0.628583-001 PR-SS-12 5/12/2010 1.66 0.069 ND 7 of 7 0.36628579-009 PR-SS-10 5/11/2010 1.84 0.054 ND 7 of 7 0.6228579-008 PR-SS-09 5/11/2010 1.93 0.094 ND 7 of 7 0.24928579-007 PR-SS-07 5/11/2010 2.02 0.091 ND 7 of 7 0.05928579-006 PR-SS-06 5/11/2010 2.08 0.032 ND 7 of 7 0.0828579-005 PR-SS-05 5/11/2010 2.32 0.11 ND 7 of 7 1.128579-004 PR-SS-04 5/11/2010 2.52 0.037 ND 7 of 7 0.06628579-003 PR-SS-03 5/11/2010 2.65 0.34 ND 7 of 7 0.33128579-002 PR-SS-02 5/11/2010 2.76 0.12 ND 7 of 7 0.1928579-001 PR-SS-01 5/11/2010 2.9 0.023 2 5 ND 7 of 7 0.045
0.19 2 5 0.07 0.361.79 35 142 48 5.4
Percent Reduction 89.39% 94.29% 96.48% 99.85% 93.33%
28580-001 PR-MR-01 5/11/2010 4.28 0.47 1 11.2 ND 7 of 7 0.3228580-002 PR-MR-02 5/11/2010 4.5 0.068 ND 7 of 7 0.16928621-001 PR-DP-01 5/25/2010 6.75 0.239 1.02 14.5 0.518
0.27 1 11.2 0.09 0.241.08 9.48 44.95 Not Sampled 2.88
Percent Reduction 75.00% 89.45% 75.08% 91.67%
0.477 2.840 13.375 0.630
Pre-cleanup average:
Table 2-1 2010 Peconic River Annual Sediment Sampling Data SummarySample ID COC Site ID
On BNL Property (15 samples)
2010 average on BNL Property:
Outside BNL Property (15 samples)
2010 average (BNL Border - Schultz RoadPre-cleanup average (BNL Border - Schultz Road)
2010 average (Manor Road Area)Pre-cleanup average (Manor Road Area)
Note: mg/kg = milligrams/kilogram = parts per million, ug/kg = micrograms/kilogram = parts per billion, pCi/g = picocuries/gram.'U' is a laboratory assigned qualifier indicating non-detection (ND).* Silver and copper were analyzed for 10 percent of the onsite and offsite samples, 2 samples and 3 samples respectively.* Averages do not include Donahue's Pond, which is located downstream of the remediated area.
2010 average all 29 routine stations within cleanup area (all except Donahue's Pond)
Page 1 of 1
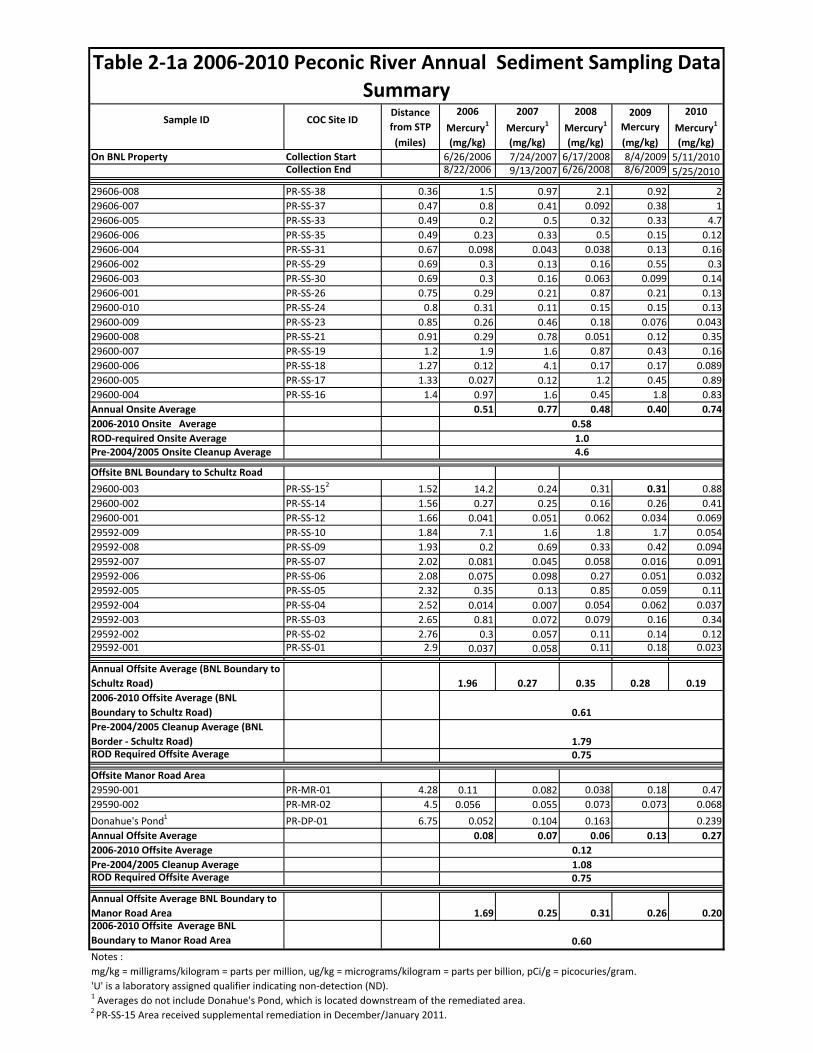
Sample ID COC Site IDDistance
from STP
2006
Mercury12007
Mercury12008
Mercury12009
Mercury
2010
Mercury1
(miles) (mg/kg) (mg/kg) (mg/kg) (mg/kg) (mg/kg)
On BNL Property Collection Start 6/26/2006 7/24/2007 6/17/2008 8/4/2009 5/11/2010Collection End 8/22/2006 9/13/2007 6/26/2008 8/6/2009 5/25/2010
29606‐008 PR‐SS‐38 0.36 1.5 0.97 2.1 0.92 2
29606‐007 PR‐SS‐37 0.47 0.8 0.41 0.092 0.38 1
29606‐005 PR‐SS‐33 0.49 0.2 0.5 0.32 0.33 4.7
29606‐006 PR‐SS‐35 0.49 0.23 0.33 0.5 0.15 0.12
29606‐004 PR‐SS‐31 0.67 0.098 0.043 0.038 0.13 0.16
29606‐002 PR‐SS‐29 0.69 0.3 0.13 0.16 0.55 0.3
29606‐003 PR‐SS‐30 0.69 0.3 0.16 0.063 0.099 0.14
29606‐001 PR‐SS‐26 0.75 0.29 0.21 0.87 0.21 0.13
29600‐010 PR‐SS‐24 0.8 0.31 0.11 0.15 0.15 0.13
29600‐009 PR‐SS‐23 0.85 0.26 0.46 0.18 0.076 0.043
29600‐008 PR‐SS‐21 0.91 0.29 0.78 0.051 0.12 0.35
29600‐007 PR‐SS‐19 1.2 1.9 1.6 0.87 0.43 0.16
29600‐006 PR‐SS‐18 1.27 0.12 4.1 0.17 0.17 0.089
29600‐005 PR‐SS‐17 1.33 0.027 0.12 1.2 0.45 0.89
29600‐004 PR‐SS‐16 1.4 0.97 1.6 0.45 1.8 0.83
Annual Onsite Average 0.51 0.77 0.48 0.40 0.74
2006‐2010 Onsite Average
ROD‐required Onsite AveragePre‐2004/2005 Onsite Cleanup Average
Offsite BNL Boundary to Schultz Road
29600‐003 PR‐SS‐152 1.52 14.2 0.24 0.31 0.31 0.88
29600‐002 PR‐SS‐14 1.56 0.27 0.25 0.16 0.26 0.41
29600‐001 PR‐SS‐12 1.66 0.041 0.051 0.062 0.034 0.069
29592‐009 PR‐SS‐10 1.84 7.1 1.6 1.8 1.7 0.054
29592‐008 PR‐SS‐09 1.93 0.2 0.69 0.33 0.42 0.094
29592‐007 PR‐SS‐07 2.02 0.081 0.045 0.058 0.016 0.091
29592‐006 PR‐SS‐06 2.08 0.075 0.098 0.27 0.051 0.032
29592‐005 PR‐SS‐05 2.32 0.35 0.13 0.85 0.059 0.11
29592‐004 PR‐SS‐04 2.52 0.014 0.007 0.054 0.062 0.037
29592‐003 PR‐SS‐03 2.65 0.81 0.072 0.079 0.16 0.34
29592‐002 PR‐SS‐02 2.76 0.3 0.057 0.11 0.14 0.1229592‐001 PR‐SS‐01 2.9 0.037 0.058 0.11 0.18 0.023
Annual Offsite Average (BNL Boundary to
Schultz Road) 1.96 0.27 0.35 0.28 0.19
2006‐2010 Offsite Average (BNL
Boundary to Schultz Road)
Pre‐2004/2005 Cleanup Average (BNL
Border ‐ Schultz Road)ROD Required Offsite Average
Offsite Manor Road Area
29590‐001 PR‐MR‐01 4.28 0.11 0.082 0.038 0.18 0.47
29590‐002 PR‐MR‐02 4.5 0.056 0.055 0.073 0.073 0.068
Donahue's Pond1 PR‐DP‐01 6.75 0.052 0.104 0.163 0.239
Annual Offsite Average 0.08 0.07 0.06 0.13 0.27
2006‐2010 Offsite Average
Pre‐2004/2005 Cleanup Average ROD Required Offsite Average
Annual Offsite Average BNL Boundary to
Manor Road Area 1.69 0.25 0.31 0.26 0.202006‐2010 Offsite Average BNL
Boundary to Manor Road Area
Notes :
2 PR‐SS‐15 Area received supplemental remediation in December/January 2011.
1 Averages do not include Donahue's Pond, which is located downstream of the remediated area.
'U' is a laboratory assigned qualifier indicating non‐detection (ND).
mg/kg = milligrams/kilogram = parts per million, ug/kg = micrograms/kilogram = parts per billion, pCi/g = picocuries/gram.
0.60
Table 2‐1a 2006‐2010 Peconic River Annual Sediment Sampling Data
Summary
0.75
0.61
0.58
1.04.6
0.75
1.79
1.08
0.12
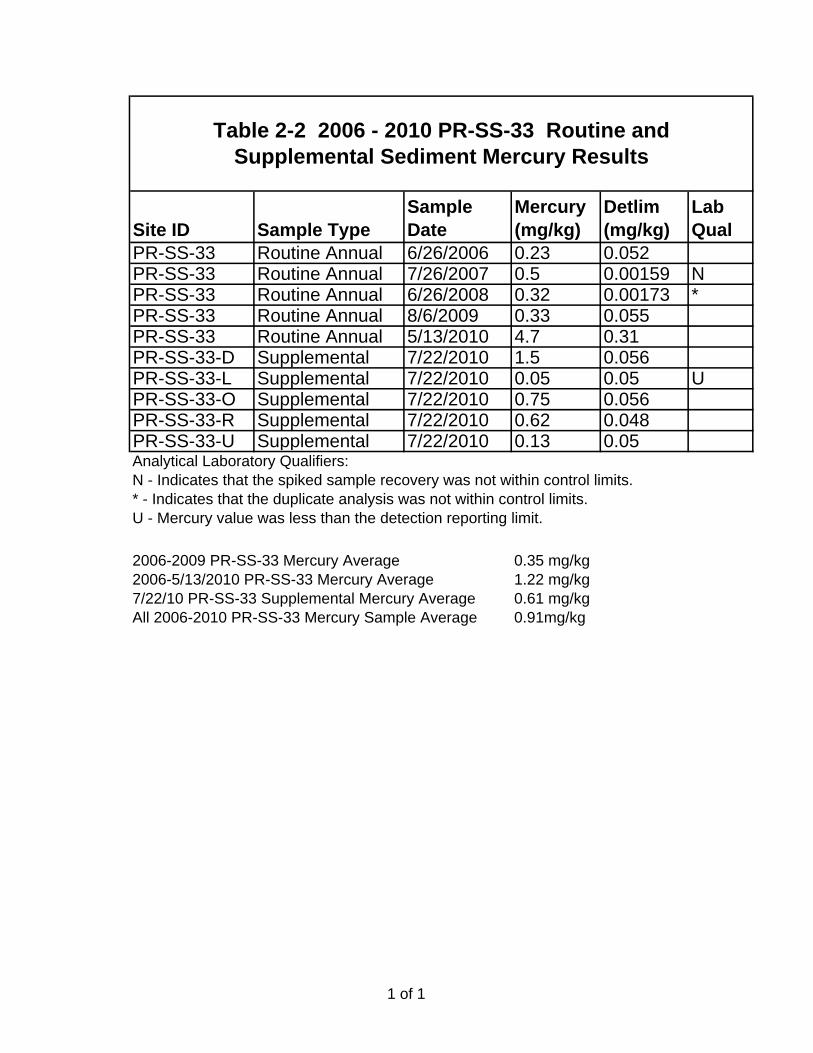
Site ID Sample TypeSample Date
Mercury (mg/kg)
Detlim (mg/kg)
Lab Qual
PR-SS-33 Routine Annual 6/26/2006 0.23 0.052PR-SS-33 Routine Annual 7/26/2007 0.5 0.00159 NPR-SS-33 Routine Annual 6/26/2008 0.32 0.00173 *PR-SS-33 Routine Annual 8/6/2009 0.33 0.055PR-SS-33 Routine Annual 5/13/2010 4.7 0.31PR-SS-33-D Supplemental 7/22/2010 1.5 0.056PR-SS-33-L Supplemental 7/22/2010 0.05 0.05 UPR-SS-33-O Supplemental 7/22/2010 0.75 0.056PR-SS-33-R Supplemental 7/22/2010 0.62 0.048PR-SS-33-U Supplemental 7/22/2010 0.13 0.05Analytical Laboratory Qualifiers:N - Indicates that the spiked sample recovery was not within control limits.* - Indicates that the duplicate analysis was not within control limits.U - Mercury value was less than the detection reporting limit.
0.35 mg/kg1.22 mg/kg0.61 mg/kg
All 2006-2010 PR-SS-33 Mercury Sample Average 0.91mg/kg
2006-2009 PR-SS-33 Mercury Average2006-5/13/2010 PR-SS-33 Mercury Average7/22/10 PR-SS-33 Supplemental Mercury Average
Table 2-2 2006 - 2010 PR-SS-33 Routine and Supplemental Sediment Mercury Results
1 of 1
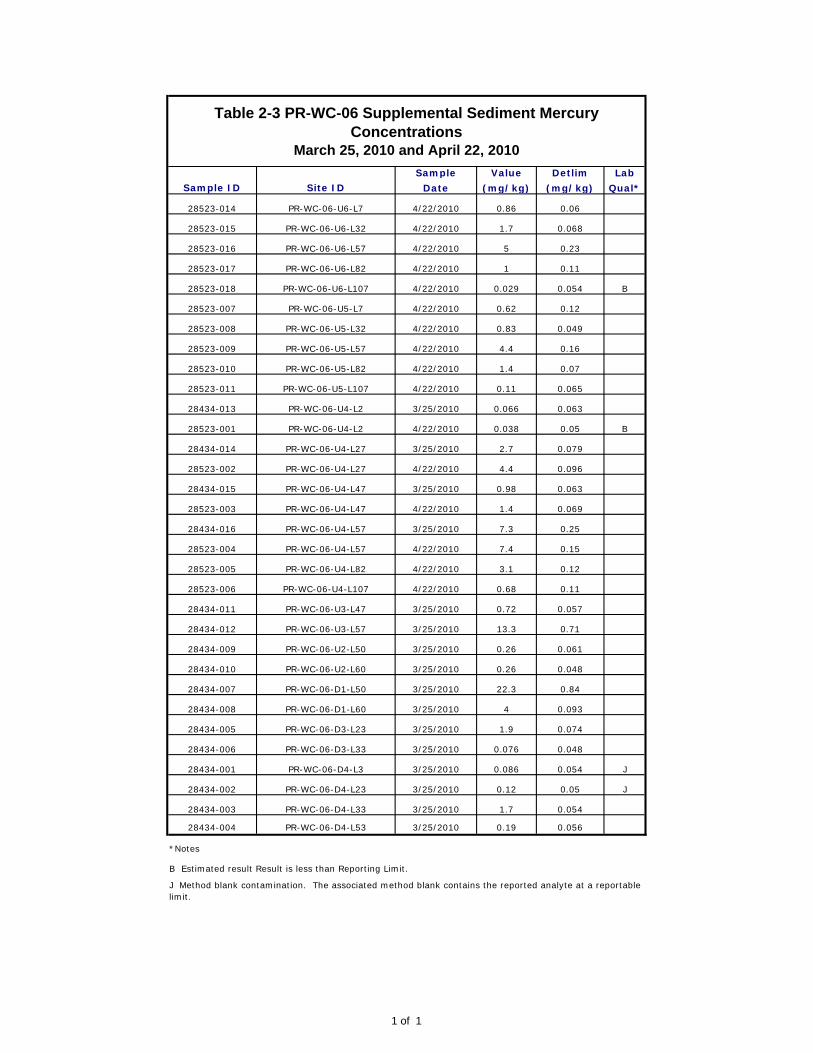
Sample Value Detlim Lab
Date (mg/kg) (mg/kg) Qual*
28523-014 PR-WC-06-U6-L7 4/22/2010 0.86 0.06
28523-015 PR-WC-06-U6-L32 4/22/2010 1.7 0.068
28523-016 PR-WC-06-U6-L57 4/22/2010 5 0.23
28523-017 PR-WC-06-U6-L82 4/22/2010 1 0.11
28523-018 PR-WC-06-U6-L107 4/22/2010 0.029 0.054 B
28523-007 PR-WC-06-U5-L7 4/22/2010 0.62 0.12
28523-008 PR-WC-06-U5-L32 4/22/2010 0.83 0.049
28523-009 PR-WC-06-U5-L57 4/22/2010 4.4 0.16
28523-010 PR-WC-06-U5-L82 4/22/2010 1.4 0.07
28523-011 PR-WC-06-U5-L107 4/22/2010 0.11 0.065
28434-013 PR-WC-06-U4-L2 3/25/2010 0.066 0.063
28523-001 PR-WC-06-U4-L2 4/22/2010 0.038 0.05 B
28434-014 PR-WC-06-U4-L27 3/25/2010 2.7 0.079
28523-002 PR-WC-06-U4-L27 4/22/2010 4.4 0.096
28434-015 PR-WC-06-U4-L47 3/25/2010 0.98 0.063
28523-003 PR-WC-06-U4-L47 4/22/2010 1.4 0.069
28434-016 PR-WC-06-U4-L57 3/25/2010 7.3 0.25
28523-004 PR-WC-06-U4-L57 4/22/2010 7.4 0.15
28523-005 PR-WC-06-U4-L82 4/22/2010 3.1 0.12
28523-006 PR-WC-06-U4-L107 4/22/2010 0.68 0.11
28434-011 PR-WC-06-U3-L47 3/25/2010 0.72 0.057
28434-012 PR-WC-06-U3-L57 3/25/2010 13.3 0.71
28434-009 PR-WC-06-U2-L50 3/25/2010 0.26 0.061
28434-010 PR-WC-06-U2-L60 3/25/2010 0.26 0.048
28434-007 PR-WC-06-D1-L50 3/25/2010 22.3 0.84
28434-008 PR-WC-06-D1-L60 3/25/2010 4 0.093
28434-005 PR-WC-06-D3-L23 3/25/2010 1.9 0.074
28434-006 PR-WC-06-D3-L33 3/25/2010 0.076 0.048
28434-001 PR-WC-06-D4-L3 3/25/2010 0.086 0.054 J
28434-002 PR-WC-06-D4-L23 3/25/2010 0.12 0.05 J
28434-003 PR-WC-06-D4-L33 3/25/2010 1.7 0.054
28434-004 PR-WC-06-D4-L53 3/25/2010 0.19 0.056
Table 2-3 PR-WC-06 Supplemental Sediment Mercury Concentrations
March 25, 2010 and April 22, 2010
*Notes
B Estimated result Result is less than Reporting Limit.
J Method blank contamination. The associated method blank contains the reported analyte at a reportable limit.
Sample ID Site ID
1 of 1
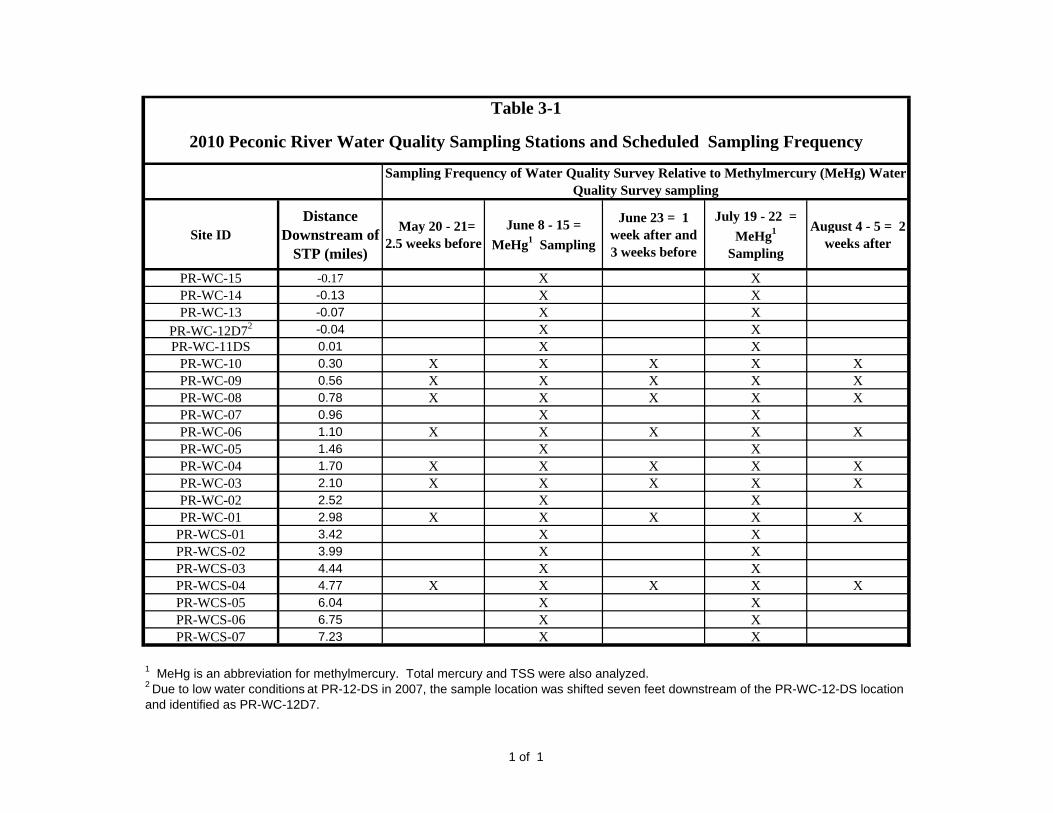
Site IDDistance
Downstream of STP (miles)
May 20 - 21= 2.5 weeks before
June 8 - 15 =
MeHg1 Sampling
June 23 = 1 week after and 3 weeks before
July 19 - 22 =
MeHg1
Sampling
August 4 - 5 = 2 weeks after
PR-WC-15 -0.17 X XPR-WC-14 -0.13 X XPR-WC-13 -0.07 X X
PR-WC-12D72 -0.04 X XPR-WC-11DS 0.01 X X
PR-WC-10 0.30 X X X X XPR-WC-09 0.56 X X X X XPR-WC-08 0.78 X X X X XPR-WC-07 0.96 X XPR-WC-06 1.10 X X X X XPR-WC-05 1.46 X XPR-WC-04 1.70 X X X X XPR-WC-03 2.10 X X X X XPR-WC-02 2.52 X XPR-WC-01 2.98 X X X X X
PR-WCS-01 3.42 X XPR-WCS-02 3.99 X XPR-WCS-03 4.44 X XPR-WCS-04 4.77 X X X X XPR-WCS-05 6.04 X XPR-WCS-06 6.75 X XPR-WCS-07 7.23 X X
2 Due to low water conditions at PR-12-DS in 2007, the sample location was shifted seven feet downstream of the PR-WC-12-DS location and identified as PR-WC-12D7.
Table 3-1
2010 Peconic River Water Quality Sampling Stations and Scheduled Sampling Frequency
Sampling Frequency of Water Quality Survey Relative to Methylmercury (MeHg) Water Quality Survey sampling
1 MeHg is an abbreviation for methylmercury. Total mercury and TSS were also analyzed.
1 of 1

Dist from Mercury Methyl Mercury TSS River Flow Water Dissolved TurbiditySTP (miles) (ng/L) (ng/L) (mg/L) Depth at (feet per Temp Oxygen (NTU)
Sample (feet) second) (deg C) (mg/L)
CONNETQUOT 6/15/2010 Connetquot 1.4 0.222 2 U 2.6 0.24 18.62 10.03 6.6 0PR-WC-15 6/10/2010 Upstream of Forest Path -0.17 12.9 3.76 2 U 1.6 0.54 16.43 6.22 5.71 1.6PR-WC-14 6/10/2010 Upstream of STP -0.13 14.5 4.25 2 U 1.2 0.6 15.76 5.48 5.68 5.1PR-WC-13 6/10/2010 Upstream of STP -0.07 15.1 4.4 2 U 1.3 0.6 16.04 6.6 5.69 0.2PR-WC-12-D7 6/10/2010 Downstream of Sump -0.04 15.3 4.54 3 2.8 0.35 15.88 5.95 5.69 2.6STP-EFF-UVG 6/10/2010 Grab Sample 0 75.1 0.02 U 2 U N/S N/S 19.8 8.6 9.6 1.9PR-WC-11DS 6/10/2010 50' downstream of outfall 0.01 19.9 4.09 2 U 1.4 0.9 17.47 6.64 5.8 0.6PR-WC-10 6/10/2010 West of HMN 0.3 22.5 4.4 2 U 1.7 0.25 16.5 7.39 6.01 7.7PR-WC-09 6/10/2010 Downstream of HMN 0.56 29.3 4.28 2 U 1.5 0.4 16.29 7.6 6.13 0.8PR-WC-08 6/10/2010 South of Area B 0.78 29 3.76 2 U 2.9 0 17.73 8.74 6.21 1.5PR-WC-07 6/10/2010 South of Area C 0.96 23.6 5.25 2 U 1.7 0.54 17.15 7.2 6.23 7.8PR-WC-06 6/10/2010 South of Area D 1.1 23.6 4.67 2 U 2.1 0.01 18.57 8.6 6.2 1.5PR-WC-05 6/9/2010 Downstream of HQ 1.46 35.3 6.74 28 1.6 0.15 18.3 5.1 6.2 4.1PR-WC-04 6/9/2010 2nd downstream of HQ 1.7 23.4 3.75 2 U 1.1 1.12 18.36 5.32 6.23 4.9PR-WC-03 6/9/2010 3rd west of Schultz Rd. 2.1 25.3 3.9 2 U 2.7 0.09 19.78 6.87 6.28 6.5PR-WC-02 6/9/2010 2nd west of Schultz Rd. 2.52 20.7 3.18 2 1.5 0.03 18.28 6.11 6.81 6.6PR-WC-01 6/8/2010 Schultz Rd. (West) 2.98 15.9 1.25 2 U 2.4 0.65 20.18 2.2 5.1 10.9PR-WCS-01 6/8/2010 East of Schultz Rd. 3.42 16.5 4.46 5 2.5 0.4 20.33 1.68 5.9 13.8PR-WCS-02 6/8/2010 West of Manor Rd. 3.99 15.4 4.68 9 3.4 0.55 19.44 3.44 6.05 16.9PR-WCS-03 6/8/2010 Manor Rd. 4.44 13.8 4.56 5 2.8 0.59 20.11 2.2 6.2 16.3PR-WCS-04 6/8/2010 West of Cranberry Bogs 4.77 14.8 4.44 7 2.8 0.98 19.11 2.31 6.13 15PR-WCS-05 6/15/2010 East of Cranberry Bogs 6.04 3.9 0.832 2 3 1.68 19.68 2.59 5.95 5.4PR-WCS-06 6/15/2010 Middle of Donahue"s Pond 6.75 4.7 1.37 2 U 3.8 0.01 20.86 4.22 6.22 1.8PR-WCS-07 6/15/2010 Downstream of Connecticut Ave. 7.23 4.2 0.655 2 1.5 1.37 20.59 6.28 6.33 1.7
Site ID Date Station Description pH
Table 3-2a: Results from 2010 Water Column Sampling6/1/2010 - 6/15/2010 Laboratory Results Field Data
1 of 1

Dist from Mercury Methyl Mercury TSS River Flow Water Dissolved TurbiditySTP (miles) (ng/L) (ng/L) (mg/L) Depth at (feet per Temp Oxygen (NTU)
Sample second) (deg C) (mg/L)(feet)
CONNETQUOT 7/20/2010 Connetquot 0.83 0.12 2 U 1.9 0.2 21.89 8.21 6.73 0.1PR-WC-15 Upstream of Forest Path -0.17 Not sampled due to depth < 1.0 feet 0.7 Not sampled due to depth < 1.0 footPR-WC-14 Upstream of STP -0.13 Not sampled due to depth < 1.0 feet 0.7 Not sampled due to depth < 1.0 footPR-WC-13 Upstream of STP -0.07 Not sampled due to depth < 1.0 feet 0.7 Not sampled due to depth < 1.0 footPR-WC-12-D7 7/21/2010 Downstream of Sump -0.04 13.3 4.27 6 2.5 0.01 22.39 5.53 6.27 7STP-EFF-UVG 7/21/2010 Grab Sample 0 69.1 0.0573 2 U N/S N/S 25.81 7.76 6.85 0.1PR-WC-11DS 7/21/2010 50" downstream of outfall 0.01 33.4 2.31 2 U 1.1 0.66 23.56 6.2 6.5 5.5PR-WC-10 7/21/2010 West of HMN 0.3 36.8 1.92 2 U 1.4 0.21 23.23 6.51 6.61 8PR-WC-09 7/20/2010 Downstream of HMN 0.56 55.2 1.95 2 U 1.2 0.5 25.99 1.18 6.79 3.1PR-WC-08 7/20/2010 South of Area B 0.78 48 2.18 2 U 2.5 0.08 24.66 2.38 6.68 12.8PR-WC-07 7/20/2010 South of Area C 0.96 20 2.28 2 U 1.8 0.3 25.75 2.93 6.72 1.5PR-WC-06 7/20/2010 South of Area D 1.1 17.2 1.84 2 U 1.8 0.07 26.24 3.63 6.77 1.5PR-WC-05 7/20/2010 Downstream of HQ 1.46 26.6 2.61 3 1.6 0.1 28.8 3.96 6.59 13PR-WC-04 7/20/2010 2nd downstream of HQ 1.7 14 1.7 2 U 1 0.7 26.74 6.74 6.25 1.5PR-WC-03 7/20/2010 3rd west of Schultz Rd. 2.1 12 4.3 2 U 2.3 0.01 28.69 5.88 6.5 1.1PR-WC-02 2nd west of Schultz Rd. 2.52 0.5 Not sampled due to depth < 1.0 footPR-WC-01 7/20/2010 Schultz Rd. (West) 2.98 4.6 0.829 2 U 2 0.25 25.96 3.05 6.22 4.4PR-WCS-01 7/19/2010 East of Schultz Rd. 3.42 9 2.45 13 2 0.53 25.27 2.4 6.17 15.1PR-WCS-02 7/19/2010 West of Manor Rd. 3.99 7.9 2.69 2 2.7 0.35 25.67 2.28 6.19 12.4PR-WCS-03 7/19/2010 Manor Rd. 4.44 6.9 2.05 2 U 1.7 0.4 23.87 1.8 6.12 12.8PR-WCS-04 7/19/2010 West of Cranberry Bogs 4.77 7.6 1.89 4 2.3 0.68 24.58 1.77 6.08 15PR-WCS-05 7/22/2010 East of Cranberry Bogs 6.04 3.1 0.5 2 U N/S N/S N/S N/S N/S N/SPR-WCS-06 7/22/2010 Middle of Donahue"s Pond 6.75 3.2 0.565 3 N/S N/S N/S N/S N/S N/SPR-WCS-07 7/22/2010 Downstream of Connecticut Ave. 7.23 3.6 0.687 2 U 1.9 1.75 25.34 5.79 6.5 31
Site ID Date Station Description Ph
Table 3-2b: Results from 2010 Water Column Sampling7/19/2010 - 7/23/2010 Laboratory Results Field Data
1 of 1
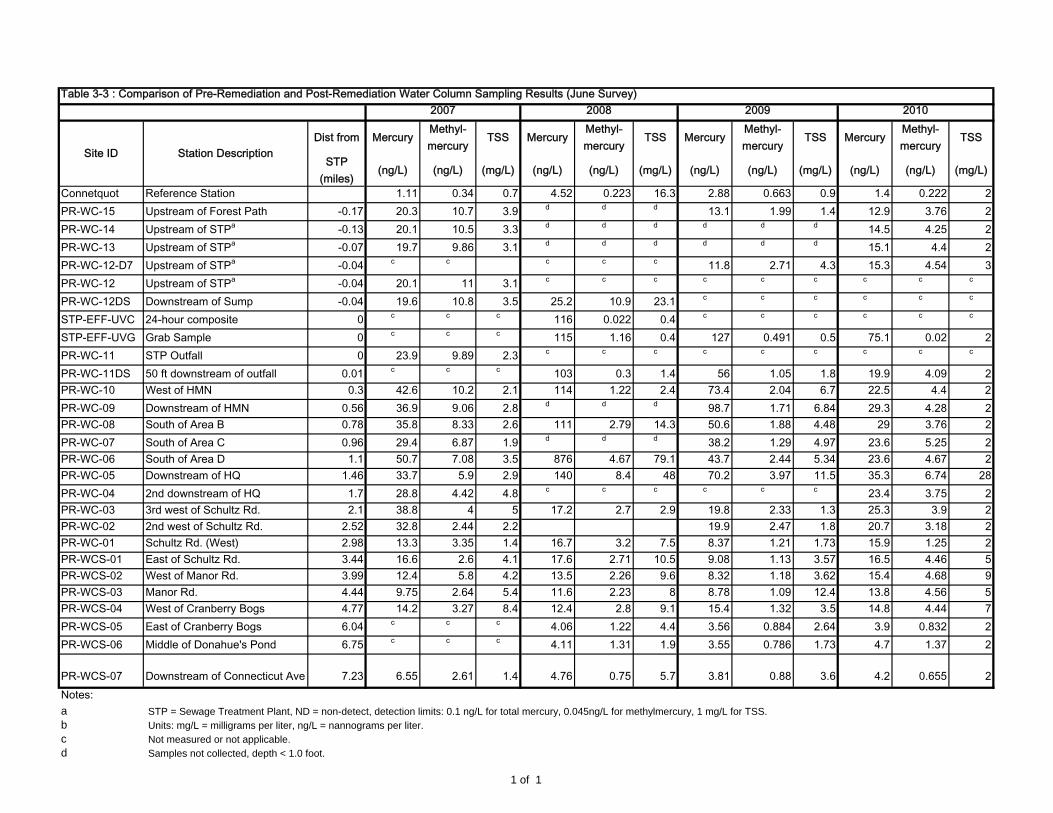
Dist from MercuryMethyl-mercury
TSS MercuryMethyl-mercury
TSS MercuryMethyl-mercury
TSS MercuryMethyl-mercury
TSS
STP (miles)
(ng/L) (ng/L) (mg/L) (ng/L) (ng/L) (mg/L) (ng/L) (ng/L) (mg/L) (ng/L) (ng/L) (mg/L)
Connetquot Reference Station 1.11 0.34 0.7 4.52 0.223 16.3 2.88 0.663 0.9 1.4 0.222 2PR-WC-15 Upstream of Forest Path -0.17 20.3 10.7 3.9 d d d 13.1 1.99 1.4 12.9 3.76 2PR-WC-14 Upstream of STPa -0.13 20.1 10.5 3.3 d d d d d d 14.5 4.25 2PR-WC-13 Upstream of STPa -0.07 19.7 9.86 3.1 d d d d d d 15.1 4.4 2PR-WC-12-D7 Upstream of STPa -0.04 c c c c c 11.8 2.71 4.3 15.3 4.54 3PR-WC-12 Upstream of STPa -0.04 20.1 11 3.1 c c c c c c c c c
PR-WC-12DS Downstream of Sump -0.04 19.6 10.8 3.5 25.2 10.9 23.1 c c c c c c
STP-EFF-UVC 24-hour composite 0 c c c 116 0.022 0.4 c c c c c c
STP-EFF-UVG Grab Sample 0 c c c 115 1.16 0.4 127 0.491 0.5 75.1 0.02 2PR-WC-11 STP Outfall 0 23.9 9.89 2.3 c c c c c c c c c
PR-WC-11DS 50 ft downstream of outfall 0.01 c c c 103 0.3 1.4 56 1.05 1.8 19.9 4.09 2PR-WC-10 West of HMN 0.3 42.6 10.2 2.1 114 1.22 2.4 73.4 2.04 6.7 22.5 4.4 2PR-WC-09 Downstream of HMN 0.56 36.9 9.06 2.8 d d d 98.7 1.71 6.84 29.3 4.28 2PR-WC-08 South of Area B 0.78 35.8 8.33 2.6 111 2.79 14.3 50.6 1.88 4.48 29 3.76 2PR-WC-07 South of Area C 0.96 29.4 6.87 1.9 d d d 38.2 1.29 4.97 23.6 5.25 2PR-WC-06 South of Area D 1.1 50.7 7.08 3.5 876 4.67 79.1 43.7 2.44 5.34 23.6 4.67 2PR-WC-05 Downstream of HQ 1.46 33.7 5.9 2.9 140 8.4 48 70.2 3.97 11.5 35.3 6.74 28PR-WC-04 2nd downstream of HQ 1.7 28.8 4.42 4.8 c c c c c c 23.4 3.75 2PR-WC-03 3rd west of Schultz Rd. 2.1 38.8 4 5 17.2 2.7 2.9 19.8 2.33 1.3 25.3 3.9 2PR-WC-02 2nd west of Schultz Rd. 2.52 32.8 2.44 2.2 19.9 2.47 1.8 20.7 3.18 2PR-WC-01 Schultz Rd. (West) 2.98 13.3 3.35 1.4 16.7 3.2 7.5 8.37 1.21 1.73 15.9 1.25 2PR-WCS-01 East of Schultz Rd. 3.44 16.6 2.6 4.1 17.6 2.71 10.5 9.08 1.13 3.57 16.5 4.46 5PR-WCS-02 West of Manor Rd. 3.99 12.4 5.8 4.2 13.5 2.26 9.6 8.32 1.18 3.62 15.4 4.68 9PR-WCS-03 Manor Rd. 4.44 9.75 2.64 5.4 11.6 2.23 8 8.78 1.09 12.4 13.8 4.56 5PR-WCS-04 West of Cranberry Bogs 4.77 14.2 3.27 8.4 12.4 2.8 9.1 15.4 1.32 3.5 14.8 4.44 7PR-WCS-05 East of Cranberry Bogs 6.04 c c c 4.06 1.22 4.4 3.56 0.884 2.64 3.9 0.832 2PR-WCS-06 Middle of Donahue's Pond 6.75 c c c 4.11 1.31 1.9 3.55 0.786 1.73 4.7 1.37 2
PR-WCS-07 Downstream of Connecticut Ave 7.23 6.55 2.61 1.4 4.76 0.75 5.7 3.81 0.88 3.6 4.2 0.655 2Notes:a STP = Sewage Treatment Plant, ND = non-detect, detection limits: 0.1 ng/L for total mercury, 0.045ng/L for methylmercury, 1 mg/L for TSS.b Units: mg/L = milligrams per liter, ng/L = nannograms per liter.c Not measured or not applicable.d Samples not collected, depth < 1.0 foot.
Table 3-3 : Comparison of Pre-Remediation and Post-Remediation Water Column Sampling Results (June Survey)
Site ID Station Description
2007 2008 2009 2010
1 of 1

Dist from MercuryMethyl-mercury
TSS MercuryMethyl-mercury
TSS MercuryMethyl-mercury
TSS MercuryMethyl-mercury
TSS
STP (miles) (ng/L) (ng/L) (mg/L) (ng/L) (ng/L) (mg/L) (ng/L) (ng/L) (mg/L) (ng/L) (ng/L) (mg/L)Connetquot Connetquot River Reference Station 1.06 0.1 1.2 1.16 0.152 5.3 2.09 0.104 1.8 0.83 0.12 2PR-WC-15 Upstream of Forest Path - Unfiltered -0.17 9.18 2.33 5.7 d d d d d d d d d
PR-WC-15 Upstream of Forest Path - Filtered -0.17 1.97 0.41 127 d d d d d d c c c
PR-WC-14 Upstream of STPa -0.13 c c c d d d d d d c c c
PR-WC-13 Upstream of STPa -0.07 c c c c c c d d d c c c
PR-WC-12-D7 Upstream of STPa -0.04 c c c d d d 8.92 2.63 2.7 13.3 4.27 6PR-WC-12 Upstream of STPa -0.04 9.92 2.42 3.7 d d d c c c d d d
PR-WC-12DS Downstream of Sump -0.04 10.2 2.52 5.5 d d d c c c d d d
STP-EFF-UVC 24-hour composite 0 96.4 0.02 0.9 86.7 0.02 U 0.3 U c c c d d d
STP-EFF-UVG Grab Sample 0 94.8 0.02 0.3 94.1 0.02 U 0.6 115 0.024 0.4 69.1 0.0573 2PR-WC-11 STP outfall1 0 102 1.41 10.6 c c c c c c d d d
PR-WC-11DS 50 ft. downstream of STP Outfall 0.01 c c c d d d d d d 33.4 2.31 2PR-WC-10 West of HMN 0.3 73.3 1.23 2.8 94.4 0.61 1.4 110 0.965 1.2 36.8 1.92 2PR-WC-09 Downstream of HMN 0.56 84.6 1.4 4.9 d d d 100 1.27 1.3 55.2 1.95 2PR-WC-08 South of Area B 0.78 111 2.9 7.8 68.3 3.48 29 44.4 0.853 2.1 48 2.18 2PR-WC-07 South of Area C 0.96 36.4 1.49 4 d d d 44.7 1.24 4.6 20 2.28 2PR-WC-06 North of Area D 1.1 47.4 2.61 7.6 d d d 93.6 1.79 4 17.2 1.84 2PR-WC-05 Downstream of HQ 1.46 41.7 6.03 19 d d d 22.9 8.08 3.4 26.6 2.61 3PR-WC-04 2nd Downstream of HQ 1.7 d d d d d d d d d 14 1.7 2PR-WC-03 3rd west of Schultz Rd. 2.1 53.6 3.41 24.9 374 4.18 165 18.7 1.66 3.5 12 4.3 2PR-WC-02 2nd west of Schultz Rd. 2.52 21.3 3.73 10.3 d d d d d d c c c
PR-WC-01 Schultz Rd. (West) 2.98 16.1 6.62 16 d d d 7.59 1.31 2.6 4.6 0.829 2PR-WCS-01 East of Schultz Rd. 3.44 11.7 2.39 7.5 d d d 6.51 1.2 5.3 9 2.45 13PR-WCS-02 West of Manor Rd. 3.99 8.56 2.39 5.4 4.3 0.55 8 5.97 1.05 7.3 7.9 2.69 2PR-WCS-03 Manor Rd. 4.44 15.7 3.81 30 3.1 0.57 4.4 6.87 1.04 5.6 6.9 2.05 2PR-WCS-04 West of Cranberry Bogs 4.77 24.7 3.87 39 4.99 0.77 5.6 8.81 1.01 7.1 7.6 1.89 4PR-WCS-05 East of Cranberry Bogs 6.04 2.57 0.23 6.22 0.39 9.7 3.84 0.778 5.5 3.1 0.5 2PR-WCS-06 Middle of Donahue's Pond 6.75 3.23 0.5 2.43 0.4 3.3 3.17 0.663 4.7 3.2 0.565 3PR-WCS-07 Downstream of Connecticut Ave 7.23 4.65 1.28 10.1 c c c 3.53 0.654 3.6 3.6 0.687 2
Notes: a STP = Sewage Treatment Plant, ND = non-detect, detection limits: 0.1 ng/L for total mercury, 0.045ng/L for methylmercury, 1 mg/L for TSS.
b Units: mg/L = milligrams per liter, ng/L = nannograms per liter.
c Not measured or not applicable.
d Samples not collected, depth < 1.0 foot.
Site ID Station Description
Table 3-4 : Comparison of Pre-Remediation and Post-Remediation Water Column Sampling Results (July Survey)2007 2008 2009 2010
1 of 1

Sample Filtered / Sample Sample Total Methyl TSS1 Sample Sample Total Methyl TSS1
Date Unfiltered Station Time Mercury Mercury (mg/L) Station Time Mercury Mercury (mg/L)(ng/L) (ng/L) (ng/L) (ng/L)
3/9/2010 Unfiltered BROOKS U1-WC-4 1155 19.8 0.594 0.8U U1-WC-3 1150 21.6 0.651 1.4U1-WC-1 1140 21.2 0.571 1.2 U1-WC-2 1145 21.3 0.64 0.9B
4/21/2010 Unfiltered CAL U1-WC-4 1105 17 0.959 2U U1-WC-3 1100 21 1.01 2UU1-WC-1 1050 18 0.951 2U U1-WC-2 1055 17 0.638 2U
6/9/2010 Unfiltered CAL U1-WC-4 1450 26.4 4.63 2U U1-WC-3 1445 27.1 5.26 2UU1-WC-1 1435 26 4.94 2U U1-WC-2 1440 28 5.86 7
7/21/2010 Unfiltered CAL U1-WC-4 1105 15.6 1.72 2U U1-WC-3 1050 23.6 1.88 2UU1-WC-1 1030 9.9 1.47 2U U1-WC-2 1040 9.9 1.46 2U
1 Qualifiers
B -
U - Indicates that the analyte was analyzed for but not detected at the indicated detection limit, e.g. 2U.
Table 3-5 : Results from PR-SS-15-U1-W1 through PR-SS-15-U1- W4 Sampling
Laboratory
Indicates that the reported value was obtained from a reading that was less than the Contract Required Detection Limit (CRDL), but greater than or equal to the Instrument Detection Limit (IDL).
J -Indicates an estimated value. This flag is used either when estimating a concentration for tentatively identified compounds (TICs) where a 1:1 response is assumed, or when the mass spectral data indicates the presenceof a compound that meets the identification criteria but the result is less than the sample quantitation limit but greater than zero.
1 of 1

Sample Filtered / Sample Sample Total Methyl TSS1 Sample Sample Total Methyl TSS1
Date Unfiltered Station Time Mercury Mercury (mg/L) Station Time Mercury Mercury (mg/L)(ng/L) (ng/L) (ng/L) (ng/L)
3/9/2010 Unfiltered BROOKS U3-WC-4 1120 21.1 0.684 1.5 U3-WC-3 1110 20.7 0.636 0.9BD3-WC-1 1040 21.2 0.869 1.7 D3-WC-2 1050 21.3 0.85 1.3
4/21/2010 Unfiltered CAL U3-WC-4 1040 17 1.05 2U U3-WC-3 1030 16 0.987 2UD3-WC-1 1000 16 0.692 2U D3-WC-2 1015 15 0.228 2U
6/9/2010 Unfiltered CAL U3-WC-4 1235 32.8 4.62 2JB U3-WC-3 1230 28.1 4.53 2UD3-WC-1 1220 26 3.92 2JB D3-WC-2 1225 27.3 4.07 2U
7/21/2010 Unfiltered CAL U3-WC-4 1015 14 2.55 5 U3-WC-3 1000 16.9 2.15 3D3-WC-1 925 12.3 3.15 2U D3-WC-2 935 12.2 2.96 2U
1 Qualifiers
B -
U -
Table 3-6 Results from PR-SS-10-D3-WC-1 & WC-2 and PR-SS-10-U3-WC-3 & WC-4 Sampling
Laboratory
Indicates that the reported value was obtained from a reading that was less than the Contract Required Detection Limit (CRDL), but greater than or equal to the Instrument Detection Limit (IDL).
J -Indicates an estimated value. This flag is used either when estimating a concentration for tentatively identified compounds (TICs) where a 1:1 response is assumed, or when the mass spectral data indicates the presenceof a compound that meets the identification criteria but the result is less than the sample quantitation limit but greater than zero.
Indicates that the analyte was analyzed for but not detected at the indicated detection limit, e.g. 2U.

Remediation Area
Approximate Distance
Downstream of BNL STP (miles)*
Location Description
Area A 0.3 Between stream gauging stations HE and HMN.
Area C 0.8From approximately 260 feet downstream of PR-WC-07 to approximately 225 feet upstream of PR-SS-29. This is an alternate location for Area D that may be sampled when fish population size allows.
Area D (North Street)
1.6Along North Street in the ponded sections of the river upstream and downstream of stream gauging station HQ. If water level or fish population size is not sufficient for fish collection the ponded section of the river in remediation Area C may be substituted.
Area P (Schultz Road.)
2.9Upstream of Schultz Road. If water level or fish population size is not sufficient for fish collection Ice Pond, in remediation Area P may be substituted.
Manor Road 4.4Within the section of the Peconic River between approximately 100 yards upstream and downstream of Manor Road.
Donahue’s Pond 7.0Donahue’s Pond is an impounded section of the Peconic River at the Peconic River Sportsman’s Club. Donahue’s Pond is approximately 2 miles downstream of the Manor Road cleanup area.
Table 4-1. Peconic River Fish Collection Locations
* Distance is from BNL STP to the approximate mid-point of the respective fish collection area.
1 of 1
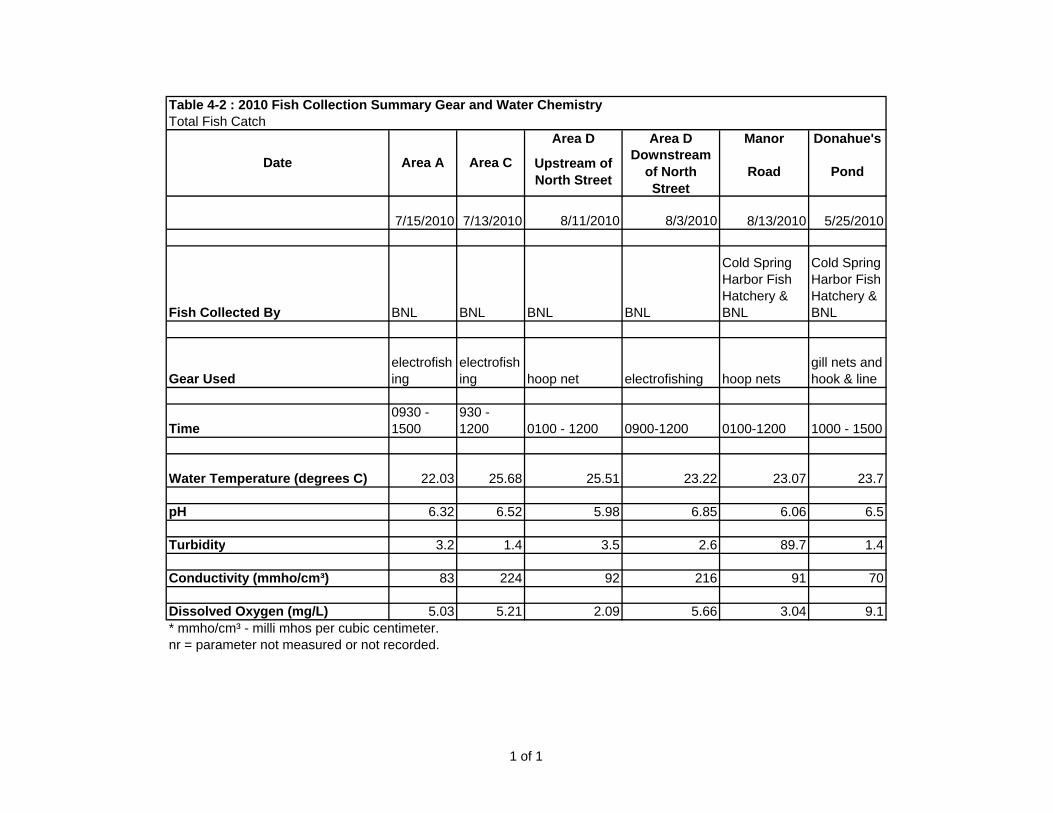
Area D Area D Manor Donahue's
Upstream of North Street
Downstream of North Street
Road Pond
8/11/2010 8/3/2010
Fish Collected By BNL BNL BNL BNL
Cold Spring Harbor Fish Hatchery & BNL
Cold Spring Harbor Fish Hatchery & BNL
Gear Usedelectrofishing
electrofishing hoop net electrofishing hoop nets
gill nets and hook & line
Time0930 - 1500
930 - 1200 0100 - 1200 0900-1200 0100-1200 1000 - 1500
Water Temperature (degrees C) 22.03 25.68 25.51 23.22 23.07 23.7
pH 6.32 6.52 5.98 6.85 6.06 6.5
Turbidity 3.2 1.4 3.5 2.6 89.7 1.4
Conductivity (mmho/cm³) 83 224 92 216 91 70
Dissolved Oxygen (mg/L) 5.03 5.21 2.09 5.66 3.04 9.1* mmho/cm³ - milli mhos per cubic centimeter.nr = parameter not measured or not recorded.
Table 4-2 : 2010 Fish Collection Summary Gear and Water ChemistryTotal Fish Catch
Date Area A Area C
7/15/2010 7/13/2010 8/13/2010 5/25/2010
1 of 1

DEC Area D Area P Manor Donahue'sSpecies (North Street) (Schultz Rd.) Road Pond
Code
Bluegill 598 1 1 11Brown Bullhead 444 1 5 14 8 10Chain Pickerel 349 1 1Largemouth Bass 601 1 2 3 1 3Pumpkinseed 596 6 3 3 5
Total Catch Per Area 4 13 20 13 30Total Catch (Single Fish) 80
Bluegill 598 4 4Brown Bullhead 444 4 4 2 11Chain Pickerel 349 3 6Largemouth Bass 601 4Pumpkinseed 596 24 4 6 8
Total Catch Per Area 39 10 14 2 11 8Total Catch (Composites) 84
Single Fish
Table 4-3 : 2010 Peconic River Fish CatchTotal Fish Catch
Species Area A Area C
Composites
1 of 1

Individual Individual Total Length
Fish Age Fish species (mm)
AREA A 30148 256637 30148‐bc2 Brown Bullhead 225 10‐153 30148‐002
2+ Brown Bullhead 186 10‐154 30148‐002
AREA A 30148 256637 30148‐bc3 2M Brown Bullhead 124 10‐155 30148‐003
1+ Brown Bullhead 104 10‐156 30148‐003
AREA A 30148 256637 30148‐bc5 1+ Chain Pickerel 292 10‐158 30148‐005
1+ Chain Pickerel 276 10‐159 30148‐005
1+ Chain Pickerel 265 10‐160 30148‐005
AREA A 30148 256637 30148‐bc6 1+ Largemouth Bass 145 10‐161 30148‐006
1+ Largemouth Bass 132 10‐162 30148‐006
1+ Largemouth Bass 125 10‐163 30148‐006
Largemouth Bass 122 10‐164 30148‐006
AREA A 30148 256637 30148‐bc9 1+ Bluegill 95 10‐167 30148‐009
1+ Bluegill 86 10‐168 30148‐009
1+ Bluegill 85 10‐169 30148‐009
1+ Bluegill 71 10‐170 30148‐009
AREA A 30148 256637 30148‐bc10 3+ Pumpkinseed 168 10‐171 30148‐010
2+ Pumpkinseed 158 10‐172 30148‐010
2+ Pumpkinseed 153 10‐173 30148‐010
2+ Pumpkinseed 147 10‐174 30148‐010
2+ Pumpkinseed 139 10‐175 30148‐010
2+ Pumpkinseed 149 10‐176 30148‐010
Table 4‐4 : Composition of the 2010 Fish Composites
Area COC SDG* Composite ID Fish ID UIDs*
Average Age of fish : 1.0
Average Length of fish : 206
Average Age of fish : 1.5
Average Length of fish : 114
Average Age of fish : 1.0
Average Length of fish : 278
Average Age of fish : 0.8
Average Length of fish : 131
Average Age of fish : 1.0
Average Length of fish : 84
Average Age of fish : 2.2
Average Length of fish : 152
1 of 5

Individual Individual Total Length
Fish Age Fish species (mm)
Table 4‐4 : Composition of the 2010 Fish Composites
Area COC SDG* Composite ID Fish ID UIDs*
AREA A 30148 256637 30148‐bc11 2+ Pumpkinseed 136 10‐177 30148‐011
2+ Pumpkinseed 136 10‐178 30148‐011
2+ Pumpkinseed 131 10‐179 30148‐011
2+ Pumpkinseed 130 10‐180 30148‐011
2+ Pumpkinseed 130 10‐181 30148‐011
2+ Pumpkinseed 128 10‐182 30148‐011
AREA A 30148 256637 30148‐bc12 2+ Pumpkinseed 125 10‐183 30148‐012
2+ Pumpkinseed 124 10‐184 30148‐012
2+ Pumpkinseed 122 10‐185 30148‐012
2+ Pumpkinseed 121 10‐186 30148‐012
2+ Pumpkinseed 117 10‐187 30148‐012
1+ Pumpkinseed 115 10‐188 30148‐012
AREA A 30148 256637 30148‐bc13 1+ Pumpkinseed 109 10‐189 30148‐013
1+ Pumpkinseed 107 10‐190 30148‐013
1+ Pumpkinseed 102 10‐191 30148‐013
1+ Pumpkinseed 100 10‐192 30148‐013
1+ Pumpkinseed 91 10‐193 30148‐013
1+ Pumpkinseed 89 10‐194 30148‐013
AREA C 28834 256552 28834‐bc13 1+ Pumpkinseed 81 10‐137 28834‐013
1+ Pumpkinseed 80 10‐138 28834‐013
AREA C 28834 256552 28834‐bc14 1+ Pumpkinseed 79 10‐139 28834‐014
1+ Pumpkinseed 75 10‐141 28834‐014
Average Age of fish : 2.0
Average Length of fish : 132
Average Age of fish : 1.8
Average Length of fish : 121
Average Age of fish : 1.0
Average Length of fish : 100
Average Age of fish : 1.0
Average Length of fish : 80
Average Age of fish : 1.0
Average Length of fish : 77
2 of 5
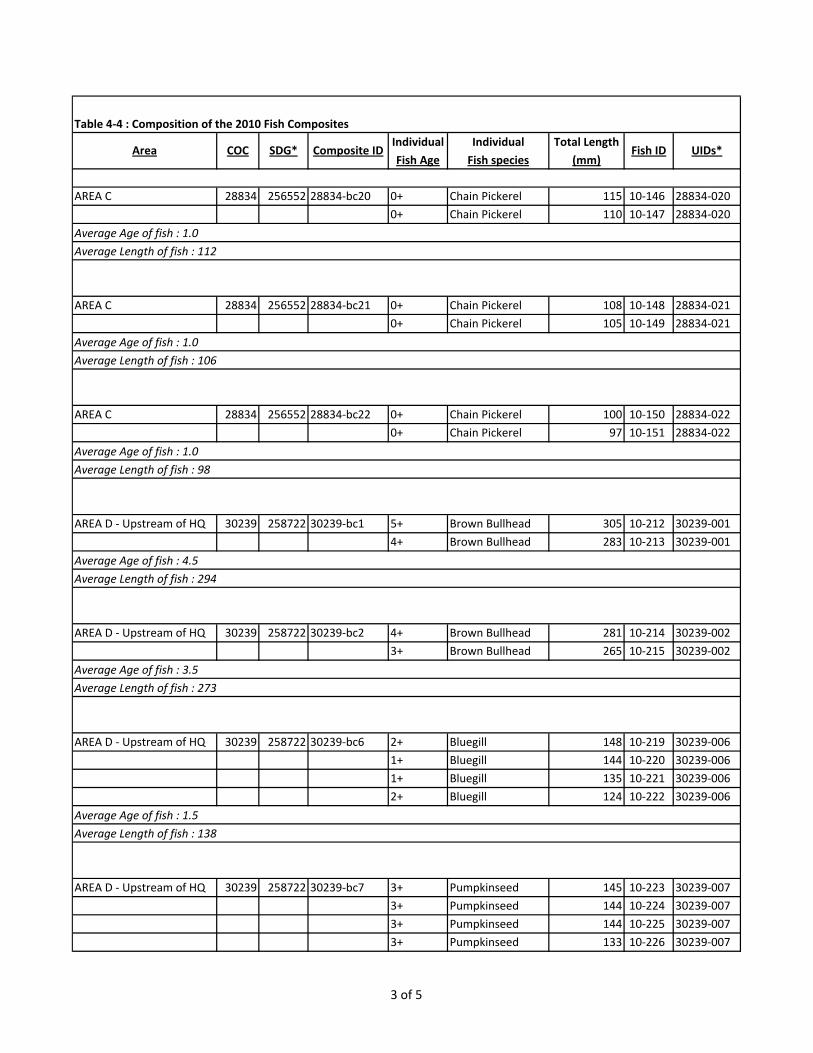
Individual Individual Total Length
Fish Age Fish species (mm)
Table 4‐4 : Composition of the 2010 Fish Composites
Area COC SDG* Composite ID Fish ID UIDs*
AREA C 28834 256552 28834‐bc20 0+ Chain Pickerel 115 10‐146 28834‐020
0+ Chain Pickerel 110 10‐147 28834‐020
AREA C 28834 256552 28834‐bc21 0+ Chain Pickerel 108 10‐148 28834‐021
0+ Chain Pickerel 105 10‐149 28834‐021
AREA C 28834 256552 28834‐bc22 0+ Chain Pickerel 100 10‐150 28834‐022
0+ Chain Pickerel 97 10‐151 28834‐022
AREA D ‐ Upstream of HQ 30239 258722 30239‐bc1 5+ Brown Bullhead 305 10‐212 30239‐001
4+ Brown Bullhead 283 10‐213 30239‐001
AREA D ‐ Upstream of HQ 30239 258722 30239‐bc2 4+ Brown Bullhead 281 10‐214 30239‐002
3+ Brown Bullhead 265 10‐215 30239‐002
AREA D ‐ Upstream of HQ 30239 258722 30239‐bc6 2+ Bluegill 148 10‐219 30239‐006
1+ Bluegill 144 10‐220 30239‐006
1+ Bluegill 135 10‐221 30239‐006
2+ Bluegill 124 10‐222 30239‐006
AREA D ‐ Upstream of HQ 30239 258722 30239‐bc7 3+ Pumpkinseed 145 10‐223 30239‐007
3+ Pumpkinseed 144 10‐224 30239‐007
3+ Pumpkinseed 144 10‐225 30239‐007
3+ Pumpkinseed 133 10‐226 30239‐007
Average Age of fish : 1.0
Average Length of fish : 112
Average Age of fish : 1.0
Average Length of fish : 106
Average Age of fish : 1.0
Average Length of fish : 98
Average Age of fish : 4.5
Average Length of fish : 294
Average Age of fish : 3.5
Average Length of fish : 273
Average Age of fish : 1.5
Average Length of fish : 138
3 of 5

Individual Individual Total Length
Fish Age Fish species (mm)
Table 4‐4 : Composition of the 2010 Fish Composites
Area COC SDG* Composite ID Fish ID UIDs*
2+ Pumpkinseed 130 10‐227 30239‐007
1+ Pumpkinseed 121 10‐228 30239‐007
SCHULTZ ROAD 30244 258848 30244‐bc1 4+ Brown Bullhead 260 10‐253 30244‐001
4+ Brown Bullhead 242 10‐254 30244‐001
MANOR ROAD 30236 258846 30236‐bc4 4+ Brown Bullhead 261 10‐232 30236‐004
4+ Brown Bullhead 251 10‐233 30236‐004
MANOR ROAD 30236 258846 30236‐bc6 4+ Brown Bullhead 244 10‐235 30236‐006
4+ Brown Bullhead 242 10‐236 30236‐006
MANOR ROAD 30236 258846 30236‐bc7 4+ Brown Bullhead 237 10‐237 30236‐007
4+ Brown Bullhead 236 10‐238 30236‐007
MANOR ROAD 30236 258846 30236‐bc8 4+ Brown Bullhead 230 10‐239 30236‐008
4+ Brown Bullhead 215 10‐240 30236‐008
MANOR ROAD 30236 258846 30236‐bc9 2+ Brown Bullhead 195 10‐241 30236‐009
2+ Brown Bullhead 190 10‐242 30236‐009
2+ Brown Bullhead 171 10‐243 30236‐009
Average Age of fish : 2.5
Average Length of fish : 136
Average Age of fish : 4.0
Average Length of fish : 251
Average Age of fish : 4.0
Average Length of fish : 256
Average Age of fish : 4.0
Average Length of fish : 243
Average Age of fish : 4.0
Average Length of fish : 236
Average Age of fish : 4.0
Average Length of fish : 222
Average Age of fish : 2.0
Average Length of fish : 185
4 of 5

Individual Individual Total Length
Fish Age Fish species (mm)
Table 4‐4 : Composition of the 2010 Fish Composites
Area COC SDG* Composite ID Fish ID UIDs*
DONAHUE'S POND 28623 253786 28623‐bc1 5+ Pumpkinseed 175 10‐021 28623‐001
3+ Pumpkinseed 175 10‐022 28623‐001
DONAHUE'S POND 28623 253786 28623‐bc2 6+ Pumpkinseed 180 10‐023 28623‐002
6+ Pumpkinseed 180 10‐026 28623‐002
DONAHUE'S POND 28623 253786 28623‐bc5 5+ Pumpkinseed 170 10‐027 28623‐005
5+ Pumpkinseed 180 10‐028 28623‐005
DONAHUE'S POND 28623 253786 28623‐bc6 6+ Pumpkinseed 190 10‐029 28623‐006
5+ Pumpkinseed 190 10‐030 28623‐006
Average Age of fish : 4.0
Average Length of fish : 175
Average Age of fish : 6.0
Average Length of fish : 180
Average Age of fish : 5.0
Average Length of fish : 175
Average Age of fish : 5.5
Average Length of fish : 190
5 of 5
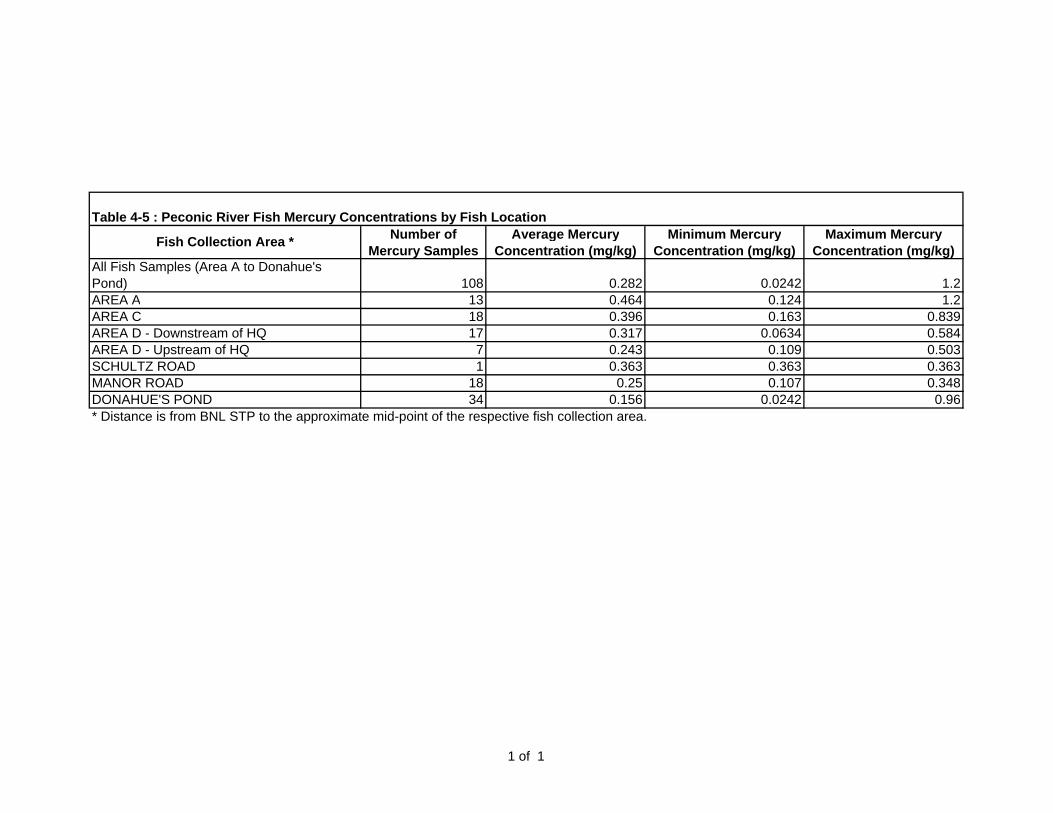
Number of Average Mercury Minimum Mercury Maximum MercuryMercury Samples Concentration (mg/kg) Concentration (mg/kg) Concentration (mg/kg)
All Fish Samples (Area A to Donahue's Pond) 108 0.282 0.0242 1.2AREA A 13 0.464 0.124 1.2AREA C 18 0.396 0.163 0.839AREA D - Downstream of HQ 17 0.317 0.0634 0.584AREA D - Upstream of HQ 7 0.243 0.109 0.503SCHULTZ ROAD 1 0.363 0.363 0.363MANOR ROAD 18 0.25 0.107 0.348DONAHUE'S POND 34 0.156 0.0242 0.96
Table 4-5 : Peconic River Fish Mercury Concentrations by Fish Location
Fish Collection Area *
* Distance is from BNL STP to the approximate mid-point of the respective fish collection area.
1 of 1
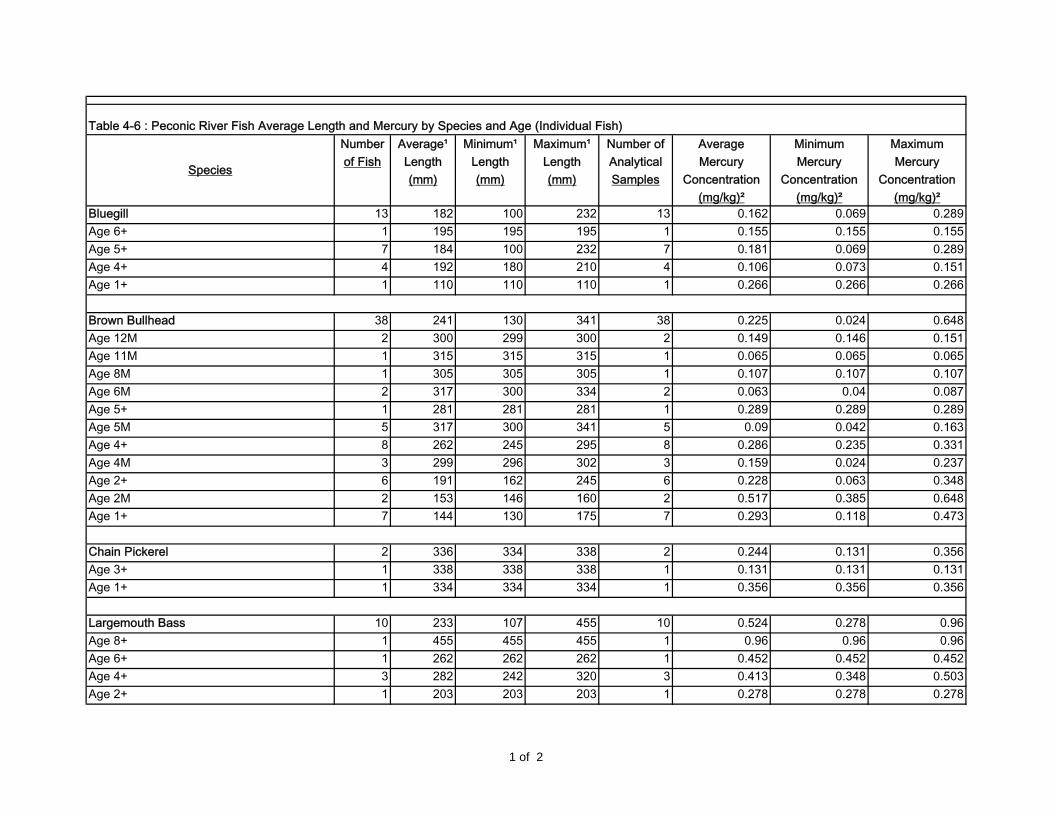
Number Average¹ Minimum¹ Maximum¹ Number of Average Minimum Maximumof Fish Length Length Length Analytical Mercury Mercury Mercury
(mm) (mm) (mm) Samples Concentration Concentration Concentration(mg/kg)² (mg/kg)² (mg/kg)²
Bluegill 13 182 100 232 13 0.162 0.069 0.289Age 6+ 1 195 195 195 1 0.155 0.155 0.155Age 5+ 7 184 100 232 7 0.181 0.069 0.289Age 4+ 4 192 180 210 4 0.106 0.073 0.151Age 1+ 1 110 110 110 1 0.266 0.266 0.266
Brown Bullhead 38 241 130 341 38 0.225 0.024 0.648Age 12M 2 300 299 300 2 0.149 0.146 0.151Age 11M 1 315 315 315 1 0.065 0.065 0.065Age 8M 1 305 305 305 1 0.107 0.107 0.107Age 6M 2 317 300 334 2 0.063 0.04 0.087Age 5+ 1 281 281 281 1 0.289 0.289 0.289Age 5M 5 317 300 341 5 0.09 0.042 0.163Age 4+ 8 262 245 295 8 0.286 0.235 0.331Age 4M 3 299 296 302 3 0.159 0.024 0.237Age 2+ 6 191 162 245 6 0.228 0.063 0.348Age 2M 2 153 146 160 2 0.517 0.385 0.648Age 1+ 7 144 130 175 7 0.293 0.118 0.473
Chain Pickerel 2 336 334 338 2 0.244 0.131 0.356Age 3+ 1 338 338 338 1 0.131 0.131 0.131Age 1+ 1 334 334 334 1 0.356 0.356 0.356
Largemouth Bass 10 233 107 455 10 0.524 0.278 0.96Age 8+ 1 455 455 455 1 0.96 0.96 0.96Age 6+ 1 262 262 262 1 0.452 0.452 0.452Age 4+ 3 282 242 320 3 0.413 0.348 0.503Age 2+ 1 203 203 203 1 0.278 0.278 0.278
Table 4-6 : Peconic River Fish Average Length and Mercury by Species and Age (Individual Fish)
Species
1 of 2

Number Average¹ Minimum¹ Maximum¹ Number of Average Minimum Maximumof Fish Length Length Length Analytical Mercury Mercury Mercury
(mm) (mm) (mm) Samples Concentration Concentration Concentration(mg/kg)² (mg/kg)² (mg/kg)²
Table 4-6 : Peconic River Fish Average Length and Mercury by Species and Age (Individual Fish)
Species
Age 1+ 4 142 107 201 4 0.577 0.362 0.839
Pumpkinseed 17 149 79 200 17 0.233 0.073 0.584Age 6+ 1 195 195 195 1 0.161 0.161 0.161Age 5+ 2 185 179 190 2 0.106 0.073 0.138Age 4+ 2 188 175 200 2 0.084 0.079 0.089Age 3+ 2 136 121 151 2 0.291 0.289 0.293Age 2+ 7 144 136 150 7 0.21 0.107 0.301Age 1+ 3 104 79 124 3 0.457 0.212 0.584
² The average, minimum and maximum concentrations and the average ages in this table represent only the fish that were analyzed for mercury.¹ Average length, minimum length and maximum length were calculated for all aged fish.
2 of 2

Number Average¹ Minimum1 Maximum1 Number of Conc.1 MDL
of Fish Length Length Length Analytical (mg/kg) (mg/kg)(mm) (mm) (mm) Samples
DONAHUE'S POND - PumpkinseedComposite : 28623-bc1 2 175 175 175 1 Mercury 0.129 0.0034Age of Fish : 4.0 years
DONAHUE'S POND - PumpkinseedComposite : 28623-bc2 2 180 180 180 1 Mercury 0.163 0.0036Age of Fish : 6.0 years
DONAHUE'S POND - PumpkinseedComposite : 28623-bc5 2 175 170 180 1 Mercury 0.0638 0.0041Age of Fish : 5.0 years
DONAHUE'S POND - PumpkinseedComposite : 28623-bc6 2 190 190 190 1 Mercury 0.17 0.004Age of Fish : 5.5 years
AREA C - PumpkinseedComposite : 28834-bc13 2 81 80 81 1 Mercury 0.709 0.0401 *ENAge of Fish : 1.0 years
AREA C - Pumpkinseed
Table 4-7a : Peconic River Composite Fish Mercury Concentrations by Area
Species Lab Qual
1 of 6

Number Average¹ Minimum1 Maximum1 Number of Conc.1 MDL
of Fish Length Length Length Analytical (mg/kg) (mg/kg)(mm) (mm) (mm) Samples
Table 4-7a : Peconic River Composite Fish Mercury Concentrations by Area
Species Lab Qual
Composite : 28834-bc14 2 77 75 79 1 Mercury 0.323 0.0038 *ENAge of Fish : 1.0 years
AREA C - Chain PickerelComposite : 28834-bc20 2 113 110 115 1 Mercury 0.315 0.0038 *ENAge of Fish : 0.0 years
AREA C - Chain PickerelComposite : 28834-bc21 2 107 105 108 1 Mercury 0.503 0.0038 *ENAge of Fish : 0.0 years
AREA C - Chain PickerelComposite : 28834-bc22 2 99 97 100 1 Mercury 0.569 0.0041 *ENAge of Fish : 0.0 years
AREA A - Brown BullheadComposite : 30148-bc2 2 186 186 186 1 Mercury 0.383 0.0036Age of Fish : 2.0 years
AREA A - Brown BullheadComposite : 30148-bc3 2 114 104 124 1
2 of 6

Number Average¹ Minimum1 Maximum1 Number of Conc.1 MDL
of Fish Length Length Length Analytical (mg/kg) (mg/kg)(mm) (mm) (mm) Samples
Table 4-7a : Peconic River Composite Fish Mercury Concentrations by Area
Species Lab Qual
Mercury 1.2 0.0348Age of Fish : 1.5 years
AREA A - Chain PickerelComposite : 30148-bc5 3 278 265 292 1 Mercury 0.351 0.0035Age of Fish : 1.0 years
AREA A - Largemouth BassComposite : 30148-bc6 4 134 125 145 1 Mercury 0.276 0.0038Age of Fish : 1.0 years
AREA A - BluegillComposite : 30148-bc9 4 84 71 95 1 Mercury 0.854 0.0398Age of Fish : 1.0 years
AREA A - PumpkinseedComposite : 30148-bc10 6 152 139 168 1 Mercury 0.427 0.0038Age of Fish : 2.2 years
AREA A - PumpkinseedComposite : 30148-bc11 6 132 128 136 1 Mercury 0.489 0.0038
3 of 6

Number Average¹ Minimum1 Maximum1 Number of Conc.1 MDL
of Fish Length Length Length Analytical (mg/kg) (mg/kg)(mm) (mm) (mm) Samples
Table 4-7a : Peconic River Composite Fish Mercury Concentrations by Area
Species Lab Qual
Age of Fish : 2.0 years
AREA A - PumpkinseedComposite : 30148-bc12 6 121 115 125 1 Mercury 0.5 0.0036Age of Fish : 1.8 years
AREA A - PumpkinseedComposite : 30148-bc13 6 100 89 109 1 Mercury 0.367 0.0038Age of Fish : 1.0 years
MANOR ROAD - Brown BullheadComposite : 30236-bc4 2 256 251 261 1 Mercury 0.241 0.0041Age of Fish : 4.0 years
MANOR ROAD - Brown BullheadComposite : 30236-bc6 2 243 242 244 1 Mercury 0.202 0.0034Age of Fish : 4.0 years
MANOR ROAD - Brown BullheadComposite : 30236-bc7 2 237 236 237 1 Mercury 0.317 0.004Age of Fish : 4.0 years
4 of 6

Number Average¹ Minimum1 Maximum1 Number of Conc.1 MDL
of Fish Length Length Length Analytical (mg/kg) (mg/kg)(mm) (mm) (mm) Samples
Table 4-7a : Peconic River Composite Fish Mercury Concentrations by Area
Species Lab Qual
MANOR ROAD - Brown BullheadComposite : 30236-bc8 2 223 215 230 1 Mercury 0.235 0.0039Age of Fish : 4.0 years
MANOR ROAD - Brown BullheadComposite : 30236-bc9 3 185 171 195 1 Mercury 0.202 0.0041Age of Fish : 2.0 years
AREA D - Upstream of HQ - Brown BullheadComposite : 30239-bc1 2 294 283 305 1 Mercury 0.156 0.0037 *ENAge of Fish : 4.5 years
AREA D - Upstream of HQ - Brown BullheadComposite : 30239-bc2 2 273 265 281 1 Mercury 0.109 0.0034 *ENAge of Fish : 3.5 years
AREA D - Upstream of HQ - BluegillComposite : 30239-bc6 4 138 124 148 1 Mercury 0.243 0.0039 *EN
5 of 6
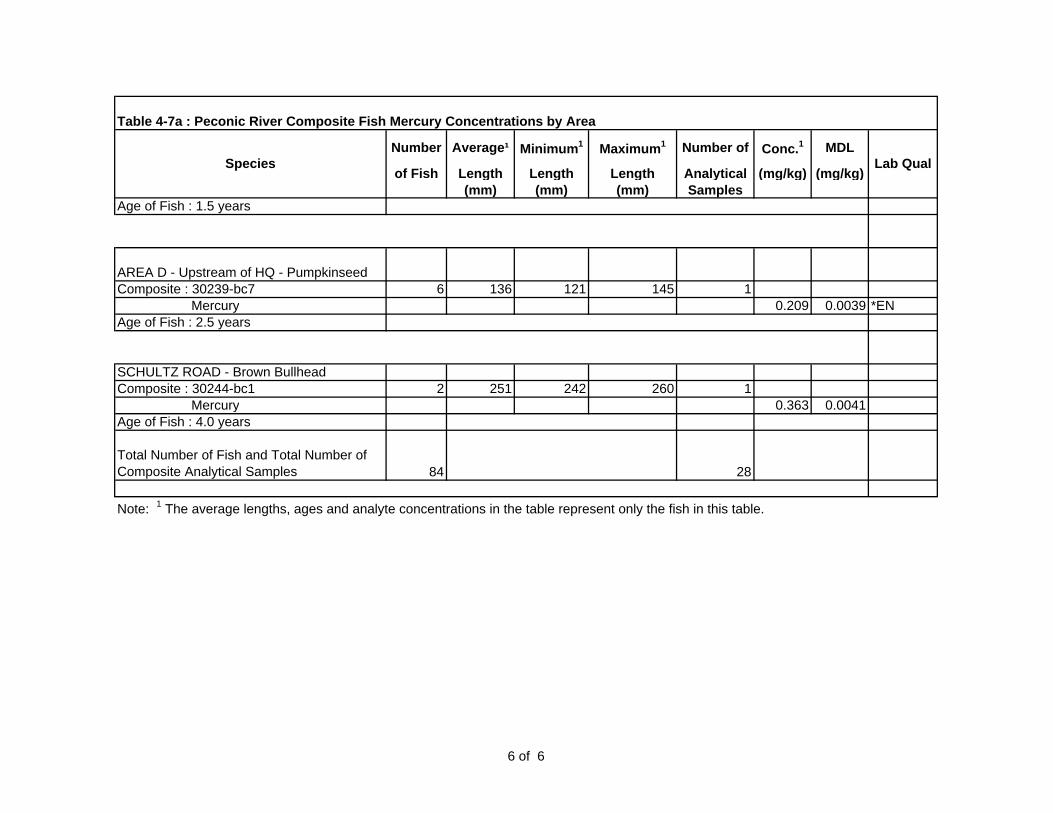
Number Average¹ Minimum1 Maximum1 Number of Conc.1 MDL
of Fish Length Length Length Analytical (mg/kg) (mg/kg)(mm) (mm) (mm) Samples
Table 4-7a : Peconic River Composite Fish Mercury Concentrations by Area
Species Lab Qual
Age of Fish : 1.5 years
AREA D - Upstream of HQ - PumpkinseedComposite : 30239-bc7 6 136 121 145 1 Mercury 0.209 0.0039 *ENAge of Fish : 2.5 years
SCHULTZ ROAD - Brown BullheadComposite : 30244-bc1 2 251 242 260 1 Mercury 0.363 0.0041Age of Fish : 4.0 years
Total Number of Fish and Total Number of Composite Analytical Samples 84 28
Note: 1 The average lengths, ages and analyte concentrations in the table represent only the fish in this table.
6 of 6
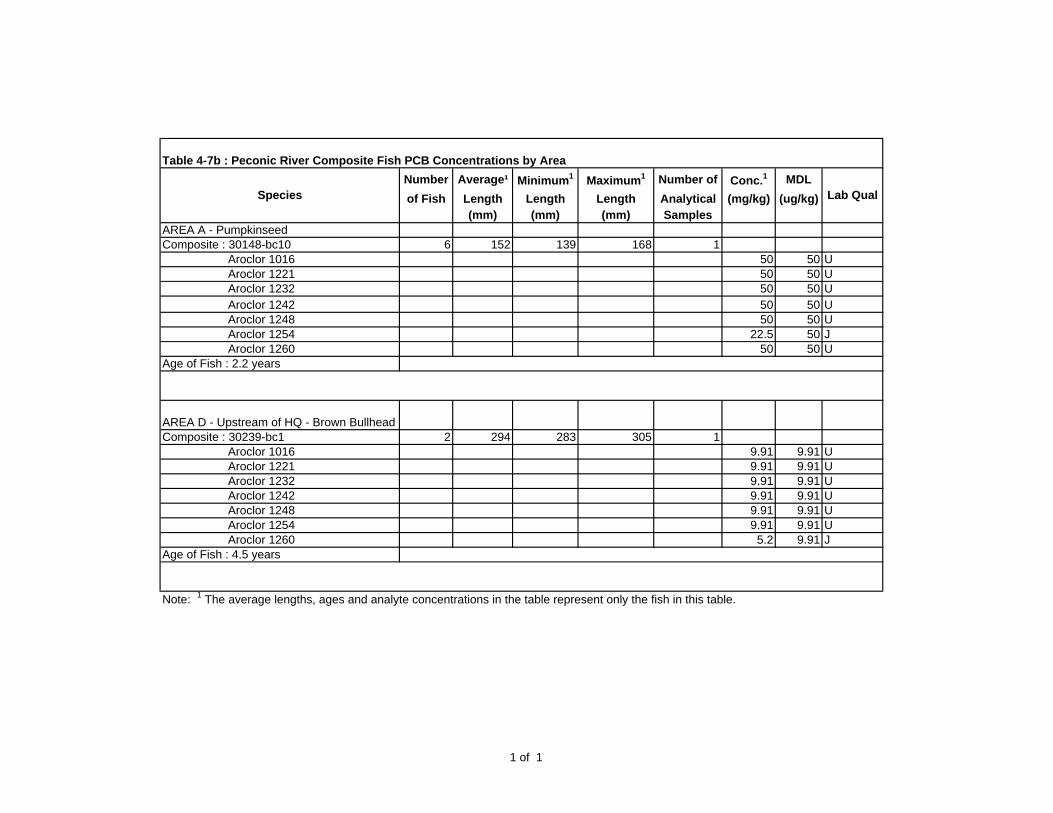
Number Average¹ Minimum1 Maximum1 Number of Conc.1 MDLof Fish Length Length Length Analytical (mg/kg) (ug/kg)
(mm) (mm) (mm) SamplesAREA A - PumpkinseedComposite : 30148-bc10 6 152 139 168 1 Aroclor 1016 50 50 U Aroclor 1221 50 50 U Aroclor 1232 50 50 U Aroclor 1242 50 50 U Aroclor 1248 50 50 U Aroclor 1254 22.5 50 J Aroclor 1260 50 50 UAge of Fish : 2.2 years
AREA D - Upstream of HQ - Brown BullheadComposite : 30239-bc1 2 294 283 305 1 Aroclor 1016 9.91 9.91 U Aroclor 1221 9.91 9.91 U Aroclor 1232 9.91 9.91 U Aroclor 1242 9.91 9.91 U Aroclor 1248 9.91 9.91 U Aroclor 1254 9.91 9.91 U Aroclor 1260 5.2 9.91 JAge of Fish : 4.5 years
Table 4-7b : Peconic River Composite Fish PCB Concentrations by Area
Species Lab Qual
Note: 1 The average lengths, ages and analyte concentrations in the table represent only the fish in this table.
1 of 1

Number Average¹ Minimum1 Maximum1 Number of Conc.1 Error MDL
of Fish Length Length Length Analytical (pCi/g) (pCi/g) (pCi/g)(mm) (mm) (mm) Samples
AREA A - Brown BullheadComposite : 30148-bc2 2 186 186 186 1 Cesium-137 0.241 0.0576 0.0411
Average Age of Composited Fish : 2.0 years
AREA A - Chain PickerelComposite : 30148-bc5 3 278 265 292 1 Cesium-137 0.119 0.0685 0.0407
Average Age of Composited Fish : 1.0 years
AREA A - PumpkinseedComposite : 30148-bc10 6 152 139 168 1 Cesium-137 0.235 0.0892 0.0782
Average Age of Composited Fish : 2.2 years
AREA A - PumpkinseedComposite : 30148-bc11 6 132 128 136 1 Cesium-137 0.237 0.0508 0.0376
Average Age of Composited Fish : 2.0 years
AREA A - PumpkinseedComposite : 30148-bc12 6 121 115 125 1 Cesium-137 0.223 0.0651 0.0555
Table 4-7c : Peconic River Composite Fish Cs-137 Concentrations by Area
Species Lab Qual
1 of 5
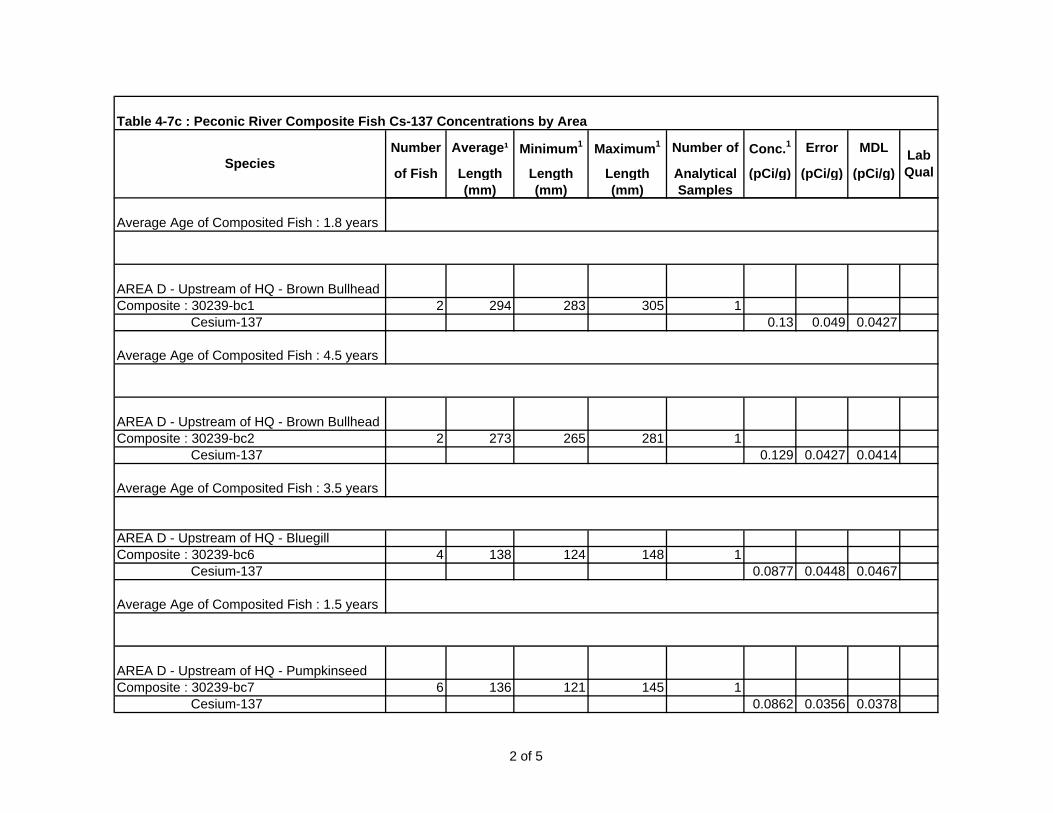
Number Average¹ Minimum1 Maximum1 Number of Conc.1 Error MDL
of Fish Length Length Length Analytical (pCi/g) (pCi/g) (pCi/g)(mm) (mm) (mm) Samples
Table 4-7c : Peconic River Composite Fish Cs-137 Concentrations by Area
Species Lab Qual
Average Age of Composited Fish : 1.8 years
AREA D - Upstream of HQ - Brown BullheadComposite : 30239-bc1 2 294 283 305 1 Cesium-137 0.13 0.049 0.0427
Average Age of Composited Fish : 4.5 years
AREA D - Upstream of HQ - Brown BullheadComposite : 30239-bc2 2 273 265 281 1 Cesium-137 0.129 0.0427 0.0414
Average Age of Composited Fish : 3.5 years
AREA D - Upstream of HQ - BluegillComposite : 30239-bc6 4 138 124 148 1 Cesium-137 0.0877 0.0448 0.0467
Average Age of Composited Fish : 1.5 years
AREA D - Upstream of HQ - PumpkinseedComposite : 30239-bc7 6 136 121 145 1 Cesium-137 0.0862 0.0356 0.0378
2 of 5
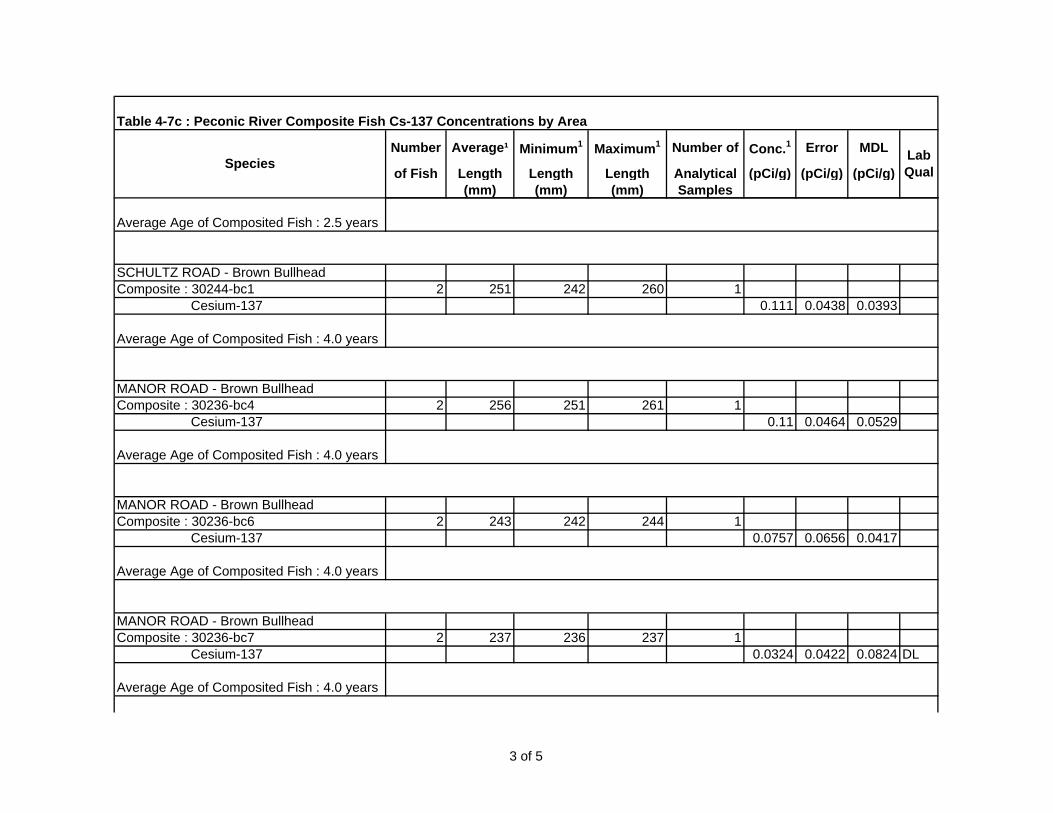
Number Average¹ Minimum1 Maximum1 Number of Conc.1 Error MDL
of Fish Length Length Length Analytical (pCi/g) (pCi/g) (pCi/g)(mm) (mm) (mm) Samples
Table 4-7c : Peconic River Composite Fish Cs-137 Concentrations by Area
Species Lab Qual
Average Age of Composited Fish : 2.5 years
SCHULTZ ROAD - Brown BullheadComposite : 30244-bc1 2 251 242 260 1 Cesium-137 0.111 0.0438 0.0393
Average Age of Composited Fish : 4.0 years
MANOR ROAD - Brown BullheadComposite : 30236-bc4 2 256 251 261 1 Cesium-137 0.11 0.0464 0.0529
Average Age of Composited Fish : 4.0 years
MANOR ROAD - Brown BullheadComposite : 30236-bc6 2 243 242 244 1 Cesium-137 0.0757 0.0656 0.0417
Average Age of Composited Fish : 4.0 years
MANOR ROAD - Brown BullheadComposite : 30236-bc7 2 237 236 237 1 Cesium-137 0.0324 0.0422 0.0824 DL
Average Age of Composited Fish : 4.0 years
3 of 5

Number Average¹ Minimum1 Maximum1 Number of Conc.1 Error MDL
of Fish Length Length Length Analytical (pCi/g) (pCi/g) (pCi/g)(mm) (mm) (mm) Samples
Table 4-7c : Peconic River Composite Fish Cs-137 Concentrations by Area
Species Lab Qual
MANOR ROAD - Brown BullheadComposite : 30236-bc8 2 223 215 230 1 Cesium-137 0.12 0.045 0.0407
Average Age of Composited Fish : 4.0 years
MANOR ROAD - Brown BullheadComposite : 30236-bc9 3 185 171 195 1 Cesium-137 0.0709 0.0503 0.0518
Average Age of Composited Fish : 2.0 years
DONAHUE'S POND - PumpkinseedComposite : 28623-bc1 2 175 175 175 1 Cesium-137 0.0461 0.0377 0.0359
Average Age of Composited Fish : 4.0 years
DONAHUE'S POND - PumpkinseedComposite : 28623-bc2 2 180 180 180 1 Cesium-137 0.0311 0.029 0.0529 DL
Average Age of Composited Fish : 6.0 years
DONAHUE'S POND - PumpkinseedComposite : 28623-bc5 2 175 170 180 1
4 of 5

Number Average¹ Minimum1 Maximum1 Number of Conc.1 Error MDL
of Fish Length Length Length Analytical (pCi/g) (pCi/g) (pCi/g)(mm) (mm) (mm) Samples
Table 4-7c : Peconic River Composite Fish Cs-137 Concentrations by Area
Species Lab Qual
Cesium-137 0.0758 0.046 0.0361
Average Age of Composited Fish : 5.0 years
DONAHUE'S POND - PumpkinseedComposite : 28623-bc6 2 190 190 190 1 Cesium-137 0.0618 0.0495 0.0922 DL
Average Age of Composited Fish : 5.5 years
Note: 1 The average lenths, ages and analyte concentrations in the table represent only the fish in this table.
5 of 5

Number Average¹ Minimum² Maximum³ Number of Conc. MDL
of Fish Length Length Length Analytical (mg/kg) (mg/kg)
(mm) (mm) (mm) Samples
AREA A ‐ Brown Bullhead
Fish ID : '10‐152 1 318 318 318 1
Mercury 0.124 0.00342
Age of Fish : 5.0 years
AREA A ‐ Chain Pickerel
Fish ID : '10‐157 1 334 334 334 1
Mercury 0.356 0.00399
Age of Fish : 1.0 years
AREA A ‐ Largemouth Bass
Fish ID : '10‐165 1 107 107 107 1
Mercury 0.41 0.00381
Age of Fish : 1.0 years
AREA A ‐ Bluegill
Fish ID : '10‐166 1 187 187 187 1
Mercury 0.289 0.00386
Age of Fish : 5.0 years
AREA C ‐ Brown Bullhead
Fish ID : '10‐125 1 341 341 341 1
Mercury 0.163 0.00403 *EN
Age of Fish : 5.0 years
AREA C ‐ Brown Bullhead
Fish ID : '10‐126 1 302 302 302 1
Mercury 0.237 0.0034 *EN
Age of Fish : 4.0 years
AREA C ‐ Brown Bullhead
Fish ID : '10‐127 1 296 296 296 1
Mercury 0.215 0.00398 *EN
Age of Fish : 4.0 years
Species Lab Qual
Table 4‐7d : Peconic River Fish Mercury Concentrations by Species and Age (Individual)
1 of 12

Number Average¹ Minimum² Maximum³ Number of Conc. MDL
of Fish Length Length Length Analytical (mg/kg) (mg/kg)
(mm) (mm) (mm) Samples
Species Lab Qual
Table 4‐7d : Peconic River Fish Mercury Concentrations by Species and Age (Individual)
AREA C ‐ Brown Bullhead
Fish ID : '10‐128 1 160 160 160 1
Mercury 0.385 0.004 *EN
Age of Fish : 2.0 years
AREA C ‐ Brown Bullhead
Fish ID : '10‐129 1 146 146 146 1
Mercury 0.648 0.034 *EN
Age of Fish : 2.0 years
AREA C ‐ Pumpkinseed
Fish ID : '10‐132 1 145 145 145 1
Mercury 0.301 0.00361 *EN
Age of Fish : 2.0 years
AREA C ‐ Pumpkinseed
Fish ID : '10‐133 1 143 143 143 1
Mercury 0.252 0.0034 *EN
Age of Fish : 2.0 years
AREA C ‐ Pumpkinseed
Fish ID : '10‐134 1 142 142 142 1
Mercury 0.234 0.00393 *EN
Age of Fish : 2.0 years
AREA C ‐ Pumpkinseed
Fish ID : '10‐135 1 136 136 136 1
Mercury 0.234 0.00389 *EN
Age of Fish : 2.0 years
AREA C ‐ Pumpkinseed
Fish ID : '10‐136 1 121 121 121 1
Mercury 0.289 0.00366 *EN
Age of Fish : 3.0 years
2 of 12

Number Average¹ Minimum² Maximum³ Number of Conc. MDL
of Fish Length Length Length Analytical (mg/kg) (mg/kg)
(mm) (mm) (mm) Samples
Species Lab Qual
Table 4‐7d : Peconic River Fish Mercury Concentrations by Species and Age (Individual)
AREA C ‐ Pumpkinseed
Fish ID : '10‐140 1 79 79 79 1
Mercury 0.212 0.00378 *EN
Age of Fish : 1.0 years
AREA C ‐ Largemouth Bass
Fish ID : '10‐142 1 145 145 145 1
Mercury 0.696 0.034 *EN
Age of Fish : 1.0 years
AREA C ‐ Largemouth Bass
Fish ID : '10‐143 1 115 115 115 1
Mercury 0.839 0.0347 *EN
Age of Fish : 1.0 years
AREA D ‐ Upstream of HQ ‐ Brown Bullhead
Fish ID : '10‐216 1 175 175 175 1
Mercury 0.118 0.00403 *EN
Age of Fish : 1.0 years
AREA D ‐ Upstream of HQ ‐ Largemouth Bass
Fish ID : '10‐217 1 320 320 320 1
Mercury 0.503 0.00391 *EN
Age of Fish : 4.0 years
AREA D ‐ Upstream of HQ ‐ Largemouth Bass
Fish ID : '10‐218 1 201 201 201 1
Mercury 0.362 0.0036 *EN
Age of Fish : 1.0 years
AREA D ‐ Downstream of HQ ‐ Brown
Bullhead
Fish ID : '10‐195 1 295 295 295 1
3 of 12

Number Average¹ Minimum² Maximum³ Number of Conc. MDL
of Fish Length Length Length Analytical (mg/kg) (mg/kg)
(mm) (mm) (mm) Samples
Species Lab Qual
Table 4‐7d : Peconic River Fish Mercury Concentrations by Species and Age (Individual)
Mercury 0.312 0.00408 N
Age of Fish : 4.0 years
AREA D ‐ Downstream of HQ ‐ Brown
Bullhead
Fish ID : '10‐196 1 255 255 255 1
Mercury 0.315 0.00343 N
Age of Fish : 4.0 years
AREA D ‐ Downstream of HQ ‐ Brown
Bullhead
Fish ID : '10‐197 1 252 252 252 1
Mercury 0.283 0.00402 N
Age of Fish : 4.0 years
AREA D ‐ Downstream of HQ ‐ Brown
Bullhead
Fish ID : '10‐198 1 248 248 248 1
Mercury 0.259 0.00368 N
Age of Fish : 4.0 years
AREA D ‐ Downstream of HQ ‐ Brown
Bullhead
Fish ID : '10‐199 1 245 245 245 1
Mercury 0.331 0.00381 N
Age of Fish : 4.0 years
AREA D ‐ Downstream of HQ ‐ Brown
Bullhead
Fish ID : '10‐200 1 245 245 245 1
Mercury 0.0634 0.0034 N
Age of Fish : 2.0 years
AREA D ‐ Downstream of HQ ‐ Brown
Bullhead
Fish ID : '10‐201 1 240 240 240 1
4 of 12

Number Average¹ Minimum² Maximum³ Number of Conc. MDL
of Fish Length Length Length Analytical (mg/kg) (mg/kg)
(mm) (mm) (mm) Samples
Species Lab Qual
Table 4‐7d : Peconic River Fish Mercury Concentrations by Species and Age (Individual)
Mercury 0.168 0.00392 N
Age of Fish : 2.0 years
AREA D ‐ Downstream of HQ ‐ Brown
Bullhead
Fish ID : '10‐202 1 147 147 147 1
Mercury 0.371 0.00361 N
Age of Fish : 1.0 years
AREA D ‐ Downstream of HQ ‐ Brown
Bullhead
Fish ID : '10‐203 1 146 146 146 1
Mercury 0.242 0.00392 N
Age of Fish : 1.0 years
AREA D ‐ Downstream of HQ ‐ Brown
Bullhead
Fish ID : '10‐204 1 139 139 139 1
Mercury 0.473 0.00378 N
Age of Fish : 1.0 years
AREA D ‐ Downstream of HQ ‐ Brown
Bullhead
Fish ID : '10‐205 1 134 134 134 1
Mercury 0.296 0.00378 N
Age of Fish : 1.0 years
AREA D ‐ Downstream of HQ ‐ Brown
Bullhead
Fish ID : '10‐206 1 134 134 134 1
Mercury 0.236 0.00384 N
Age of Fish : 1.0 years
AREA D ‐ Downstream of HQ ‐ Brown
Bullhead
Fish ID : '10‐207 1 130 130 130 1
5 of 12

Number Average¹ Minimum² Maximum³ Number of Conc. MDL
of Fish Length Length Length Analytical (mg/kg) (mg/kg)
(mm) (mm) (mm) Samples
Species Lab Qual
Table 4‐7d : Peconic River Fish Mercury Concentrations by Species and Age (Individual)
Mercury 0.312 0.00392 N
Age of Fish : 1.0 years
AREA D ‐ Downstream of HQ ‐ Pumpkinseed
Fish ID : '10‐208 1 150 150 150 1
Mercury 0.182 0.00353 N
Age of Fish : 2.0 years
AREA D ‐ Downstream of HQ ‐ Pumpkinseed
Fish ID : '10‐209 1 124 124 124 1
Mercury 0.584 0.00788 N
Age of Fish : 1.0 years
AREA D ‐ Downstream of HQ ‐ Pumpkinseed
Fish ID : '10‐210 1 110 110 110 1
Mercury 0.574 0.0073 N
Age of Fish : 1.0 years
AREA D ‐ Downstream of HQ ‐ Largemouth
Bass
Fish ID : '10‐211 1 284 284 284 1
Mercury 0.387 0.0034 N
Age of Fish : 4.0 years
MANOR ROAD ‐ Brown Bullhead
Fish ID : '10‐229 1 290 290 290 1
Mercury 0.235 0.00388
Age of Fish : 4.0 years
MANOR ROAD ‐ Brown Bullhead
Fish ID : '10‐230 1 281 281 281 1
Mercury 0.289 0.004
Age of Fish : 5.0 years
6 of 12

Number Average¹ Minimum² Maximum³ Number of Conc. MDL
of Fish Length Length Length Analytical (mg/kg) (mg/kg)
(mm) (mm) (mm) Samples
Species Lab Qual
Table 4‐7d : Peconic River Fish Mercury Concentrations by Species and Age (Individual)
MANOR ROAD ‐ Brown Bullhead
Fish ID : '10‐231 1 268 268 268 1
Mercury 0.299 0.00343
Age of Fish : 4.0 years
MANOR ROAD ‐ Brown Bullhead
Fish ID : '10‐234 1 245 245 245 1
Mercury 0.25 0.00351
Age of Fish : 4.0 years
MANOR ROAD ‐ Brown Bullhead
Fish ID : '10‐244 1 169 169 169 1
Mercury 0.282 0.00386
Age of Fish : 2.0 years
MANOR ROAD ‐ Brown Bullhead
Fish ID : '10‐245 1 167 167 167 1
Mercury 0.348 0.00386
Age of Fish : 2.0 years
MANOR ROAD ‐ Brown Bullhead
Fish ID : '10‐246 1 163 163 163 1
Mercury 0.223 0.00376
Age of Fish : 2.0 years
MANOR ROAD ‐ Brown Bullhead
Fish ID : '10‐247 1 162 162 162 1
Mercury 0.283 0.00384
Age of Fish : 2.0 years
MANOR ROAD ‐ Largemouth Bass
Fish ID : '10‐248 1 203 203 203 1
Mercury 0.278 0.00355
Age of Fish : 2.0 years
7 of 12
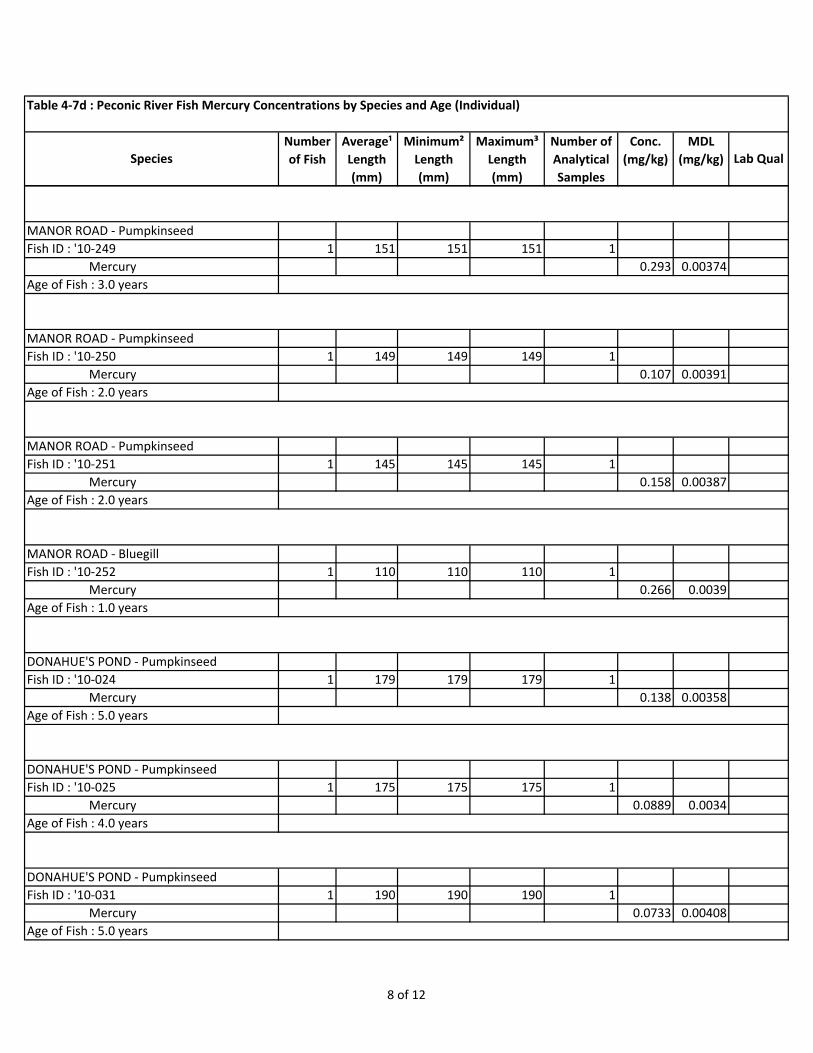
Number Average¹ Minimum² Maximum³ Number of Conc. MDL
of Fish Length Length Length Analytical (mg/kg) (mg/kg)
(mm) (mm) (mm) Samples
Species Lab Qual
Table 4‐7d : Peconic River Fish Mercury Concentrations by Species and Age (Individual)
MANOR ROAD ‐ Pumpkinseed
Fish ID : '10‐249 1 151 151 151 1
Mercury 0.293 0.00374
Age of Fish : 3.0 years
MANOR ROAD ‐ Pumpkinseed
Fish ID : '10‐250 1 149 149 149 1
Mercury 0.107 0.00391
Age of Fish : 2.0 years
MANOR ROAD ‐ Pumpkinseed
Fish ID : '10‐251 1 145 145 145 1
Mercury 0.158 0.00387
Age of Fish : 2.0 years
MANOR ROAD ‐ Bluegill
Fish ID : '10‐252 1 110 110 110 1
Mercury 0.266 0.0039
Age of Fish : 1.0 years
DONAHUE'S POND ‐ Pumpkinseed
Fish ID : '10‐024 1 179 179 179 1
Mercury 0.138 0.00358
Age of Fish : 5.0 years
DONAHUE'S POND ‐ Pumpkinseed
Fish ID : '10‐025 1 175 175 175 1
Mercury 0.0889 0.0034
Age of Fish : 4.0 years
DONAHUE'S POND ‐ Pumpkinseed
Fish ID : '10‐031 1 190 190 190 1
Mercury 0.0733 0.00408
Age of Fish : 5.0 years
8 of 12

Number Average¹ Minimum² Maximum³ Number of Conc. MDL
of Fish Length Length Length Analytical (mg/kg) (mg/kg)
(mm) (mm) (mm) Samples
Species Lab Qual
Table 4‐7d : Peconic River Fish Mercury Concentrations by Species and Age (Individual)
DONAHUE'S POND ‐ Pumpkinseed
Fish ID : '10‐032 1 195 195 195 1
Mercury 0.161 0.004
Age of Fish : 6.0 years
DONAHUE'S POND ‐ Pumpkinseed
Fish ID : '10‐033 1 200 200 200 1
Mercury 0.0788 0.00388
Age of Fish : 4.0 years
DONAHUE'S POND ‐ Bluegill
Fish ID : '10‐034 1 181 181 181 1
Mercury 0.0797 0.00393
Age of Fish : 4.0 years
DONAHUE'S POND ‐ Bluegill
Fish ID : '10‐035 1 180 180 180 1
Mercury 0.256 0.00402
Age of Fish : 5.0 years
DONAHUE'S POND ‐ Bluegill
Fish ID : '10‐036 1 180 180 180 1
Mercury 0.0728 0.0037
Age of Fish : 4.0 years
DONAHUE'S POND ‐ Bluegill
Fish ID : '10‐037 1 195 195 195 1
Mercury 0.155 0.00365
Age of Fish : 6.0 years
DONAHUE'S POND ‐ Bluegill
Fish ID : '10‐038 1 195 195 195 1
Mercury 0.151 0.00379
Age of Fish : 4.0 years
9 of 12

Number Average¹ Minimum² Maximum³ Number of Conc. MDL
of Fish Length Length Length Analytical (mg/kg) (mg/kg)
(mm) (mm) (mm) Samples
Species Lab Qual
Table 4‐7d : Peconic River Fish Mercury Concentrations by Species and Age (Individual)
DONAHUE'S POND ‐ Bluegill
Fish ID : '10‐039 1 210 210 210 1
Mercury 0.121 0.00352
Age of Fish : 4.0 years
DONAHUE'S POND ‐ Bluegill
Fish ID : '10‐040 1 198 198 198 1
Mercury 0.122 0.0035
Age of Fish : 5.0 years
DONAHUE'S POND ‐ Bluegill
Fish ID : '10‐041 1 189 189 189 1
Mercury 0.0686 0.00372
Age of Fish : 5.0 years
DONAHUE'S POND ‐ Bluegill
Fish ID : '10‐042 1 100 100 100 1
Mercury 0.188 0.00408
Age of Fish : 5.0 years
DONAHUE'S POND ‐ Bluegill
Fish ID : '10‐043 1 203 203 203 1
Mercury 0.149 0.00389
Age of Fish : 5.0 years
DONAHUE'S POND ‐ Bluegill
Fish ID : '10‐044 1 232 232 232 1
Mercury 0.192 0.00404
Age of Fish : 5.0 years
DONAHUE'S POND ‐ Largemouth Bass
Fish ID : '10‐045 1 242 242 242 1
Mercury 0.348 0.0034
Age of Fish : 4.0 years
10 of 12

Number Average¹ Minimum² Maximum³ Number of Conc. MDL
of Fish Length Length Length Analytical (mg/kg) (mg/kg)
(mm) (mm) (mm) Samples
Species Lab Qual
Table 4‐7d : Peconic River Fish Mercury Concentrations by Species and Age (Individual)
DONAHUE'S POND ‐ Largemouth Bass
Fish ID : '10‐046 1 262 262 262 1
Mercury 0.452 0.00394
Age of Fish : 6.0 years
DONAHUE'S POND ‐ Largemouth Bass
Fish ID : '10‐047 1 455 455 455 1
Mercury 0.96 0.0402
Age of Fish : 8.0 years
DONAHUE'S POND ‐ Chain Pickerel
Fish ID : '10‐048 1 338 338 338 1
Mercury 0.131 0.00392
Age of Fish : 3.0 years
DONAHUE'S POND ‐ Brown Bullhead
Fish ID : '10‐049 1 299 299 299 1
Mercury 0.146 0.00408
Age of Fish : 12.0 years
DONAHUE'S POND ‐ Brown Bullhead
Fish ID : '10‐050 1 300 300 300 1
Mercury 0.0865 0.00407
Age of Fish : 6.0 years
DONAHUE'S POND ‐ Brown Bullhead
Fish ID : '10‐051 1 300 300 300 1
Mercury 0.0242 0.0034
Age of Fish : 4.0 years
DONAHUE'S POND ‐ Brown Bullhead
Fish ID : '10‐052 1 300 300 300 1
Mercury 0.0724 0.0038
Age of Fish : 5.0 years
11 of 12

Number Average¹ Minimum² Maximum³ Number of Conc. MDL
of Fish Length Length Length Analytical (mg/kg) (mg/kg)
(mm) (mm) (mm) Samples
Species Lab Qual
Table 4‐7d : Peconic River Fish Mercury Concentrations by Species and Age (Individual)
DONAHUE'S POND ‐ Brown Bullhead
Fish ID : '10‐053 1 310 310 310 1
Mercury 0.0478 0.00402
Age of Fish : 5.0 years
DONAHUE'S POND ‐ Brown Bullhead
Fish ID : '10‐054 1 300 300 300 1
Mercury 0.151 0.00408
Age of Fish : 12.0 years
DONAHUE'S POND ‐ Brown Bullhead
Fish ID : '10‐055 1 317 317 317 1
Mercury 0.0415 0.00372
Age of Fish : 5.0 years
DONAHUE'S POND ‐ Brown Bullhead
Fish ID : '10‐056 1 305 305 305 1
Mercury 0.107 0.00355
Age of Fish : 8.0 years
DONAHUE'S POND ‐ Brown Bullhead
Fish ID : '10‐057 1 315 315 315 1
Mercury 0.0646 0.00354
Age of Fish : 11.0 years
DONAHUE'S POND ‐ Brown Bullhead
Fish ID : '10‐058 1 334 334 334 1
Mercury 0.0401 0.00349
Age of Fish : 6.0 years
12 of 12

Number Average¹ Minimum1 Maximum1 Number of Conc.1 MDL
of Fish Length Length Length Analytical (ug/kg) (ug/kg)(mm) (mm) (mm) Samples
AREA C - Brown BullheadFish ID : '10-125 1 341 341 341 1 Aroclor 1016 9.95 9.95 U Aroclor 1221 9.95 9.95 U Aroclor 1232 9.95 9.95 U Aroclor 1242 9.95 9.95 U Aroclor 1248 9.95 9.95 U Aroclor 1254 9.95 9.95 U Aroclor 1260 9.95 9.95 UAge of Fish : 5.0 years
AREA D - Upstream of HQ - Largemouth BassFish ID : '10-217 1 320 320 320 1 Aroclor 1016 10 10 U Aroclor 1221 10 10 U Aroclor 1232 10 10 U Aroclor 1242 10 10 U Aroclor 1248 10 10 U Aroclor 1254 10 10 U Aroclor 1260 10 10 UAge of Fish : 4.0 years
Table 4-7e : Peconic River Fish PCB Concentrations by Species and Age (Individual)
Species Lab Qual
Note: 1 The average lenths, ages and analyte concentrations in the table represent only the fish in this table.
1 of 1

Number Average¹ Minimum1 Maximum1 Number of Conc.1 Error MDL
of Fish Length Length Length Analytical (pCi/g) (pCi/g) (pCi/g)(mm) (mm) (mm) Samples
AREA A - Brown BullheadFish ID : 10-152 1 318 318 318 1 Cesium-137 0.249 0.0702 0.045Age of Fish : 5.0 years
AREA A - Chain PickerelFish ID : 10-157 1 334 334 334 1 Cesium-137 0.172 0.0581 0.049Age of Fish : 1.0 years
AREA A - BluegillFish ID : 10-166 1 187 187 187 1 Cesium-137 0.132 0.0513 0.0375Age of Fish : 5.0 years
AREA C - Brown BullheadFish ID : 10-125 1 341 341 341 1 Cesium-137 0.219 0.0691 0.0379Age of Fish : 5.0 years
AREA C - Brown BullheadFish ID : 10-126 1 302 302 302 1 Cesium-137 0.324 0.0822 0.06Age of Fish : 4.0 years
AREA C - Brown Bullhead
Table 4-7f : Peconic River Individual Fish Cs-137 Concentrations by Area
Species Lab Qual
1 of 9

Number Average¹ Minimum1 Maximum1 Number of Conc.1 Error MDL
of Fish Length Length Length Analytical (pCi/g) (pCi/g) (pCi/g)(mm) (mm) (mm) Samples
Table 4-7f : Peconic River Individual Fish Cs-137 Concentrations by Area
Species Lab Qual
Fish ID : 10-127 1 296 296 296 1 Cesium-137 0.178 0.0676 0.0441Age of Fish : 4.0 years
AREA D - Upstream of HQ - Largemouth BassFish ID : 10-217 1 320 320 320 1 Cesium-137 0.131 0.0806 0.0544Age of Fish : 4.0 years
AREA D - Downstream of HQ - Brown BullheadFish ID : 10-195 1 295 295 295 1 Cesium-137 0.201 0.0479 0.0362Age of Fish : 4.0 years
AREA D - Downstream of HQ - Brown BullheadFish ID : 10-196 1 255 255 255 1 Cesium-137 0.178 0.0554 0.0538Age of Fish : 4.0 years
AREA D - Downstream of HQ - Brown BullheadFish ID : 10-197 1 252 252 252 1 Cesium-137 0.0745 0.0619 0.11 DLAge of Fish : 4.0 years
2 of 9
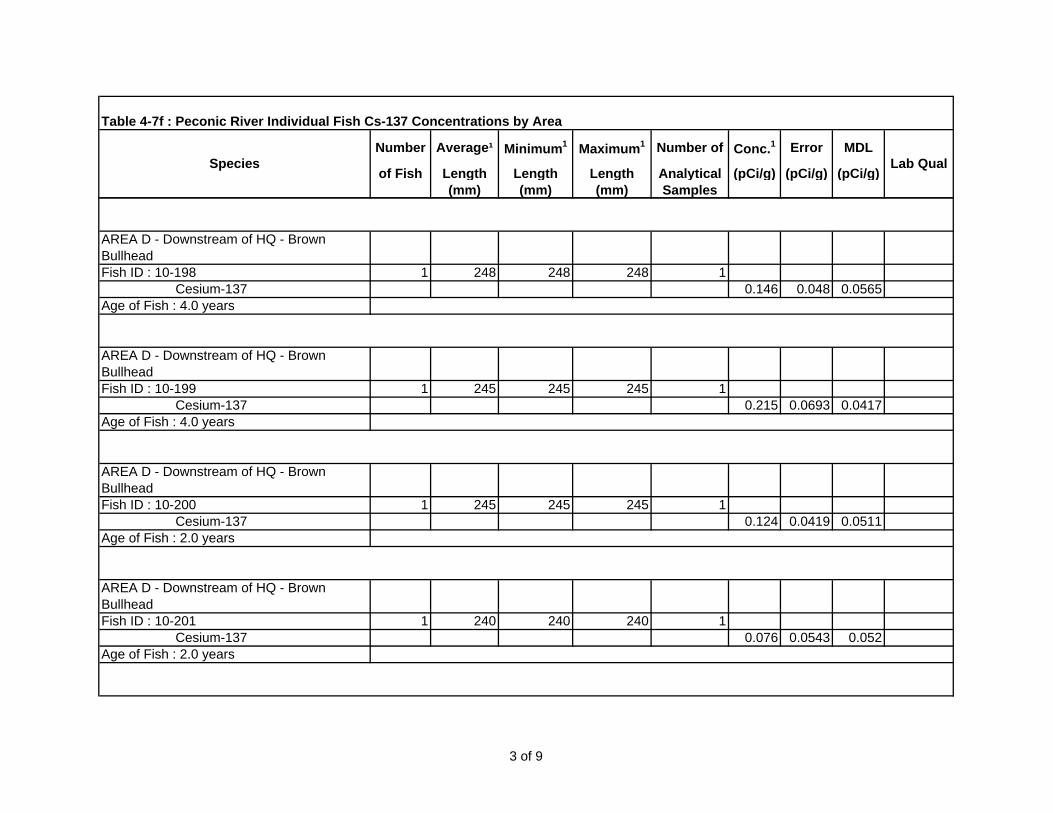
Number Average¹ Minimum1 Maximum1 Number of Conc.1 Error MDL
of Fish Length Length Length Analytical (pCi/g) (pCi/g) (pCi/g)(mm) (mm) (mm) Samples
Table 4-7f : Peconic River Individual Fish Cs-137 Concentrations by Area
Species Lab Qual
AREA D - Downstream of HQ - Brown BullheadFish ID : 10-198 1 248 248 248 1 Cesium-137 0.146 0.048 0.0565Age of Fish : 4.0 years
AREA D - Downstream of HQ - Brown BullheadFish ID : 10-199 1 245 245 245 1 Cesium-137 0.215 0.0693 0.0417Age of Fish : 4.0 years
AREA D - Downstream of HQ - Brown BullheadFish ID : 10-200 1 245 245 245 1 Cesium-137 0.124 0.0419 0.0511Age of Fish : 2.0 years
AREA D - Downstream of HQ - Brown BullheadFish ID : 10-201 1 240 240 240 1 Cesium-137 0.076 0.0543 0.052Age of Fish : 2.0 years
3 of 9
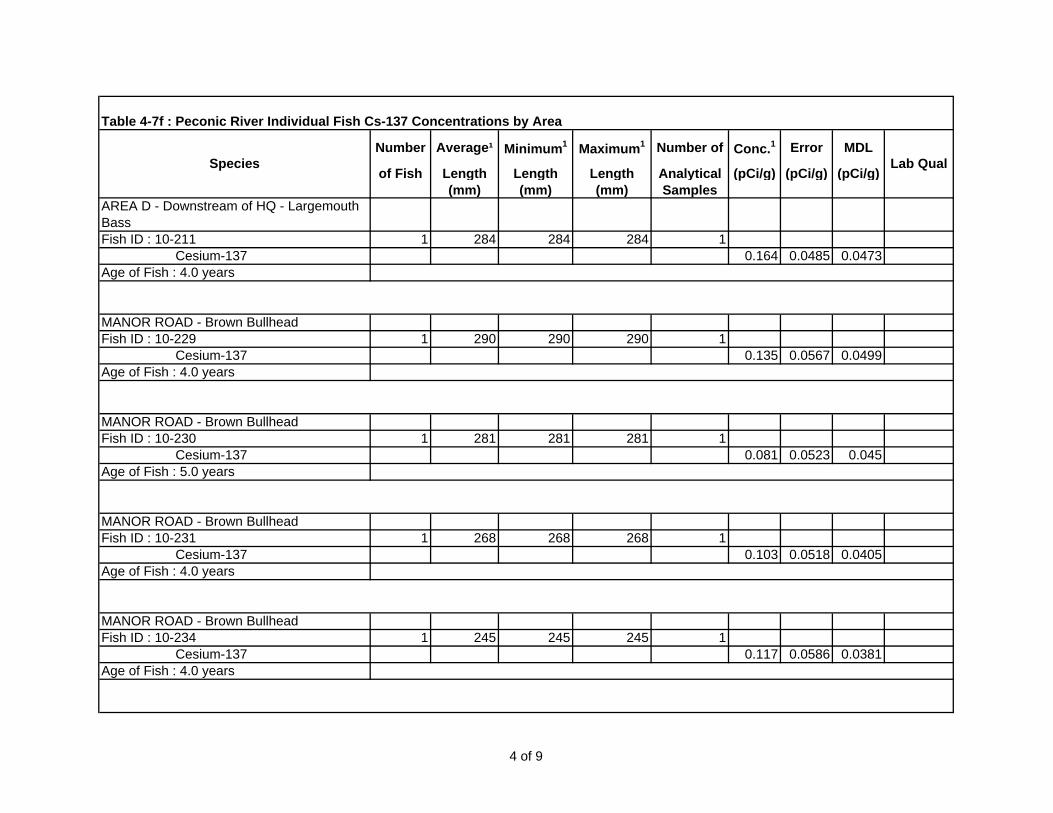
Number Average¹ Minimum1 Maximum1 Number of Conc.1 Error MDL
of Fish Length Length Length Analytical (pCi/g) (pCi/g) (pCi/g)(mm) (mm) (mm) Samples
Table 4-7f : Peconic River Individual Fish Cs-137 Concentrations by Area
Species Lab Qual
AREA D - Downstream of HQ - Largemouth BassFish ID : 10-211 1 284 284 284 1 Cesium-137 0.164 0.0485 0.0473Age of Fish : 4.0 years
MANOR ROAD - Brown BullheadFish ID : 10-229 1 290 290 290 1 Cesium-137 0.135 0.0567 0.0499Age of Fish : 4.0 years
MANOR ROAD - Brown BullheadFish ID : 10-230 1 281 281 281 1 Cesium-137 0.081 0.0523 0.045Age of Fish : 5.0 years
MANOR ROAD - Brown BullheadFish ID : 10-231 1 268 268 268 1 Cesium-137 0.103 0.0518 0.0405Age of Fish : 4.0 years
MANOR ROAD - Brown BullheadFish ID : 10-234 1 245 245 245 1 Cesium-137 0.117 0.0586 0.0381Age of Fish : 4.0 years
4 of 9
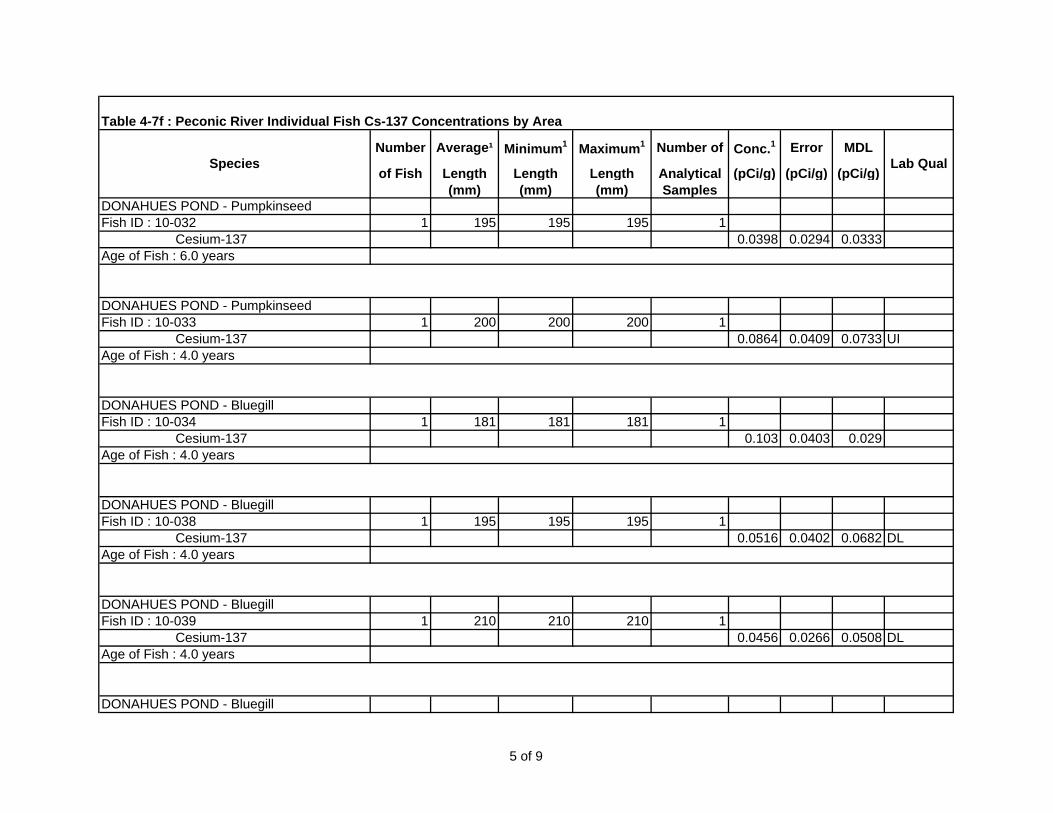
Number Average¹ Minimum1 Maximum1 Number of Conc.1 Error MDL
of Fish Length Length Length Analytical (pCi/g) (pCi/g) (pCi/g)(mm) (mm) (mm) Samples
Table 4-7f : Peconic River Individual Fish Cs-137 Concentrations by Area
Species Lab Qual
DONAHUES POND - PumpkinseedFish ID : 10-032 1 195 195 195 1 Cesium-137 0.0398 0.0294 0.0333Age of Fish : 6.0 years
DONAHUES POND - PumpkinseedFish ID : 10-033 1 200 200 200 1 Cesium-137 0.0864 0.0409 0.0733 UIAge of Fish : 4.0 years
DONAHUES POND - BluegillFish ID : 10-034 1 181 181 181 1 Cesium-137 0.103 0.0403 0.029Age of Fish : 4.0 years
DONAHUES POND - BluegillFish ID : 10-038 1 195 195 195 1 Cesium-137 0.0516 0.0402 0.0682 DLAge of Fish : 4.0 years
DONAHUES POND - BluegillFish ID : 10-039 1 210 210 210 1 Cesium-137 0.0456 0.0266 0.0508 DLAge of Fish : 4.0 years
DONAHUES POND - Bluegill
5 of 9

Number Average¹ Minimum1 Maximum1 Number of Conc.1 Error MDL
of Fish Length Length Length Analytical (pCi/g) (pCi/g) (pCi/g)(mm) (mm) (mm) Samples
Table 4-7f : Peconic River Individual Fish Cs-137 Concentrations by Area
Species Lab Qual
Fish ID : 10-040 1 198 198 198 1 Cesium-137 0.0501 0.0407 0.0682 DLAge of Fish : 5.0 years
DONAHUES POND - BluegillFish ID : 10-041 1 189 189 189 1 Cesium-137 0.0177 0.0249 0.0442 DLAge of Fish : 5.0 years
DONAHUES POND - BluegillFish ID : 10-042 1 100 100 100 1 Cesium-137 0.121 0.0503 0.0484Age of Fish : 5.0 years
DONAHUES POND - BluegillFish ID : 10-043 1 203 203 203 1 Cesium-137 0.0757 0.051 0.0365Age of Fish : 5.0 years
DONAHUES POND - BluegillFish ID : 10-044 1 232 232 232 1 Cesium-137 0.0645 0.0423 0.0356Age of Fish : 5.0 years
DONAHUES POND - Largemouth BassFish ID : 10-045 1 242 242 242 1
6 of 9

Number Average¹ Minimum1 Maximum1 Number of Conc.1 Error MDL
of Fish Length Length Length Analytical (pCi/g) (pCi/g) (pCi/g)(mm) (mm) (mm) Samples
Table 4-7f : Peconic River Individual Fish Cs-137 Concentrations by Area
Species Lab Qual
Cesium-137 0.0402 0.0299 0.056 DLAge of Fish : 4.0 years
DONAHUES POND - Largemouth BassFish ID : 10-046 1 262 262 262 1 Cesium-137 0.132 0.0497 0.0368Age of Fish : 6.0 years
DONAHUES POND - Largemouth BassFish ID : 10-047 1 455 455 455 1 Cesium-137 0.106 0.0417 0.0336Age of Fish : 8.0 years
DONAHUES POND - Chain PickerelFish ID : 10-048 1 338 338 338 1 Cesium-137 0.1 0.0352 0.0308Age of Fish : 3.0 years
DONAHUES POND - Brown BullheadFish ID : 10-049 1 299 299 299 1 Cesium-137 0.0627 0.0406 0.0429Age of Fish : 12.0 years
DONAHUES POND - Brown BullheadFish ID : 10-050 1 300 300 300 1 Cesium-137 0.0469 0.0353 0.0364
7 of 9

Number Average¹ Minimum1 Maximum1 Number of Conc.1 Error MDL
of Fish Length Length Length Analytical (pCi/g) (pCi/g) (pCi/g)(mm) (mm) (mm) Samples
Table 4-7f : Peconic River Individual Fish Cs-137 Concentrations by Area
Species Lab Qual
Age of Fish : 6.0 years
DONAHUES POND - Brown BullheadFish ID : 10-051 1 300 300 300 1 Cesium-137 0.0647 0.0361 0.0389Age of Fish : 4.0 years
DONAHUES POND - Brown BullheadFish ID : 10-052 1 300 300 300 1 Cesium-137 0.0606 0.0276 0.0275Age of Fish : 5.0 years
DONAHUES POND - Brown BullheadFish ID : 10-053 1 310 310 310 1 Cesium-137 0.0772 0.0335 0.0317Age of Fish : 5.0 years
DONAHUES POND - Brown BullheadFish ID : 10-054 1 300 300 300 1 Cesium-137 0.0986 0.0486 0.0338Age of Fish : 12.0 years
DONAHUES POND - Brown BullheadFish ID : 10-055 1 317 317 317 1 Cesium-137 0.0561 0.0316 0.033Age of Fish : 5.0 years
8 of 9

Number Average¹ Minimum1 Maximum1 Number of Conc.1 Error MDL
of Fish Length Length Length Analytical (pCi/g) (pCi/g) (pCi/g)(mm) (mm) (mm) Samples
Table 4-7f : Peconic River Individual Fish Cs-137 Concentrations by Area
Species Lab Qual
DONAHUES POND - Brown BullheadFish ID : 10-056 1 305 305 305 1 Cesium-137 0.0832 0.0379 0.0342Age of Fish : 8.0 years
DONAHUES POND - Brown BullheadFish ID : 10-057 1 315 315 315 1 Cesium-137 0.0671 0.0476 0.0335Age of Fish : 11.0 years
DONAHUES POND - Brown BullheadFish ID : 10-058 1 334 334 334 1 Cesium-137 0.0688 0.0388 0.0378Age of Fish : 6.0 years
Note: 1 The average lenths, ages and analyte concentrations in the table represent only the fish in this table.
9 of 9

Table 4-8a Peconic River Fish Samples - Mercury by areaBNL Fish ID or Value MDL Lab Rev Avg Length Individual or Individual or Avg
Compsite ID (mg/kg) (mg/kg) Qual Qual (mm) Composite Composite Age
Avg Weight Avg Weight
Whole(g) Fillet(g)30148-001 A 10-152 Mercury 0.124 0.003 Brown Bullhead 318 426 123.3 530148-002 A 30148-bc2 Mercury 0.383 0.004 Brown Bullhead 205.5 148 45.4 230148-003 A 30148-bc3 Mercury 1.2 0.035 Brown Bullhead 114 23 5 130148-004 A 10-157 Mercury 0.356 0.004 Chain Pickerel 334 224 100.3 130148-005 A 30148-bc5 Mercury 0.351 0.003 Chain Pickerel 277.67 142 57.43 130148-006 A 30148-bc6 Mercury 0.276 0.004 Largemouth Bass 131 36.5 11.97 130148-007 A 10-165 Mercury 0.41 0.004 Largemouth Bass 107 20 7.3 130148-008 A 10-166 Mercury 0.289 0.004 Bluegill 187 154 54.1 530148-009 A 30148-bc9 Mercury 0.854 0.04 Bluegill 84.25 16 4.88 130148-010 A 30148-bc10 Mercury 0.427 0.004 Pumpkinseed 152.33 110.5 32.07 230148-011 A 30148-bc11 Mercury 0.489 0.004 Pumpkinseed 131.83 58.33 18.78 230148-012 A 30148-bc12 Mercury 0.5 0.004 Pumpkinseed 120.67 43.67 13.98 130148-013 A 30148-bc13 Mercury 0.367 0.004 Pumpkinseed 99.67 24.67 7.62 128834-001 C 10-125 Mercury 0.163 0.004 *EN Brown Bullhead 341 616 192 528834-002 C 10-126 Mercury 0.237 0.003 *EN Brown Bullhead 302 394 101 428834-003 C 10-127 Mercury 0.215 0.004 *EN Brown Bullhead 296 386 110.1 428834-004 C 10-128 Mercury 0.385 0.004 *EN Brown Bullhead 160 54 13.2 228834-005 C 10-129 Mercury 0.648 0.034 *EN Brown Bullhead 146 42 12.6 228834-008 C 10-132 Mercury 0.301 0.004 *EN Pumpkinseed 145 74 25 228834-009 C 10-133 Mercury 0.252 0.003 *EN Pumpkinseed 143 68 27.3 228834-010 C 10-134 Mercury 0.234 0.004 *EN Pumpkinseed 142 66 21.1 228834-011 C 10-135 Mercury 0.234 0.004 *EN Pumpkinseed 136 58 22.3 228834-012 C 10-136 Mercury 0.289 0.004 *EN Pumpkinseed 121 40 14.2 328834-013 C 28834-bc13 Mercury 0.709 0.04 *EN Pumpkinseed 80.5 10 4.05 128834-014 C 28834-bc14 Mercury 0.323 0.004 *EN Pumpkinseed 77 9 4.1 128834-015 C 10-140 Mercury 0.212 0.004 *EN Pumpkinseed 79 10 5.8 128834-016 C 10-142 Mercury 0.696 0.034 *EN Largemouth Bass 145 42 15.8 128834-017 C 10-143 Mercury 0.839 0.035 *EN Largemouth Bass 115 26 11.1 128834-020 C 28834-bc20 Mercury 0.315 0.004 *EN Chain Pickerel 112.5 8 4.1 028834-021 C 28834-bc21 Mercury 0.503 0.004 *EN Chain Pickerel 106.5 7 3.5 028834-022 C 28834-bc22 Mercury 0.569 0.004 *EN Chain Pickerel 98.5 6 3.4 030239-001 D 30239-bc1 Mercury 0.156 0.004 *EN Brown Bullhead 294 353 116.05 430239-002 D 30239-bc2 Mercury 0.109 0.003 *EN Brown Bullhead 273 265 79.65 330239-003 D 10-216 Mercury 0.118 0.004 *EN Brown Bullhead 175 68 21.4 1
Sample ID Area Analyte Species
1 of 4
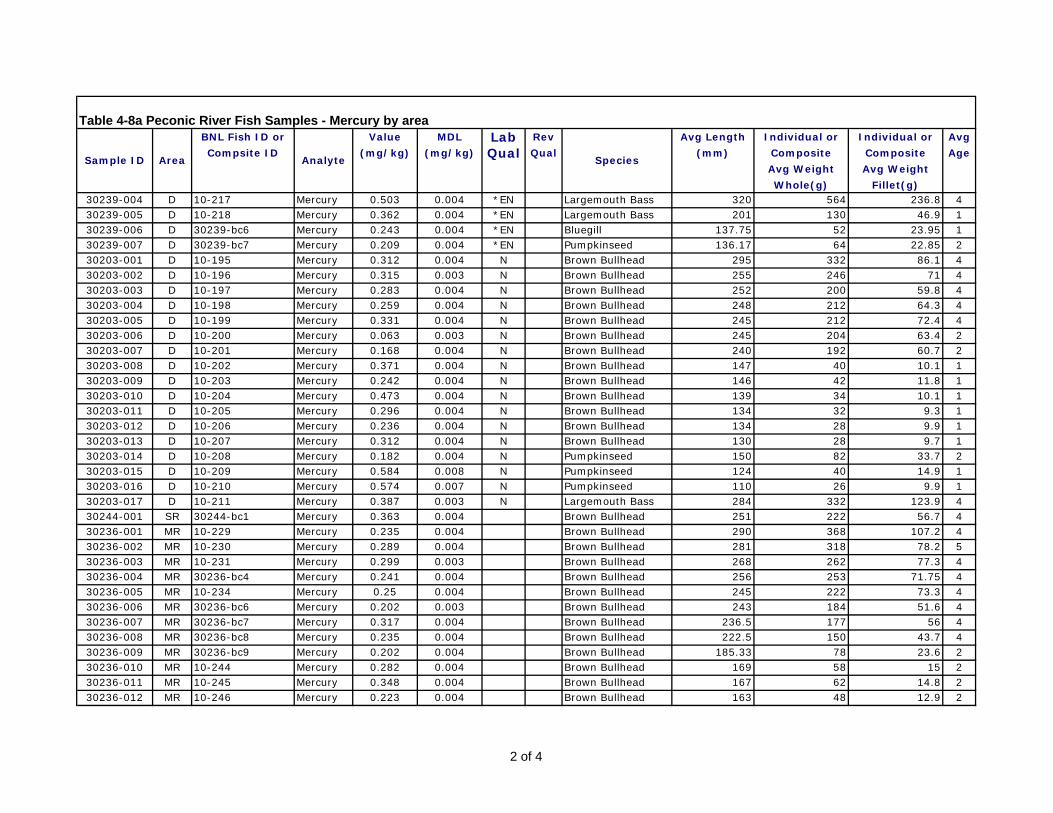
Table 4-8a Peconic River Fish Samples - Mercury by areaBNL Fish ID or Value MDL Lab Rev Avg Length Individual or Individual or Avg
Compsite ID (mg/kg) (mg/kg) Qual Qual (mm) Composite Composite Age
Avg Weight Avg Weight
Whole(g) Fillet(g)
Sample ID Area Analyte Species
30239-004 D 10-217 Mercury 0.503 0.004 *EN Largemouth Bass 320 564 236.8 430239-005 D 10-218 Mercury 0.362 0.004 *EN Largemouth Bass 201 130 46.9 130239-006 D 30239-bc6 Mercury 0.243 0.004 *EN Bluegill 137.75 52 23.95 130239-007 D 30239-bc7 Mercury 0.209 0.004 *EN Pumpkinseed 136.17 64 22.85 230203-001 D 10-195 Mercury 0.312 0.004 N Brown Bullhead 295 332 86.1 430203-002 D 10-196 Mercury 0.315 0.003 N Brown Bullhead 255 246 71 430203-003 D 10-197 Mercury 0.283 0.004 N Brown Bullhead 252 200 59.8 430203-004 D 10-198 Mercury 0.259 0.004 N Brown Bullhead 248 212 64.3 430203-005 D 10-199 Mercury 0.331 0.004 N Brown Bullhead 245 212 72.4 430203-006 D 10-200 Mercury 0.063 0.003 N Brown Bullhead 245 204 63.4 230203-007 D 10-201 Mercury 0.168 0.004 N Brown Bullhead 240 192 60.7 230203-008 D 10-202 Mercury 0.371 0.004 N Brown Bullhead 147 40 10.1 130203-009 D 10-203 Mercury 0.242 0.004 N Brown Bullhead 146 42 11.8 130203-010 D 10-204 Mercury 0.473 0.004 N Brown Bullhead 139 34 10.1 130203-011 D 10-205 Mercury 0.296 0.004 N Brown Bullhead 134 32 9.3 130203-012 D 10-206 Mercury 0.236 0.004 N Brown Bullhead 134 28 9.9 130203-013 D 10-207 Mercury 0.312 0.004 N Brown Bullhead 130 28 9.7 130203-014 D 10-208 Mercury 0.182 0.004 N Pumpkinseed 150 82 33.7 230203-015 D 10-209 Mercury 0.584 0.008 N Pumpkinseed 124 40 14.9 130203-016 D 10-210 Mercury 0.574 0.007 N Pumpkinseed 110 26 9.9 130203-017 D 10-211 Mercury 0.387 0.003 N Largemouth Bass 284 332 123.9 430244-001 SR 30244-bc1 Mercury 0.363 0.004 Brown Bullhead 251 222 56.7 430236-001 MR 10-229 Mercury 0.235 0.004 Brown Bullhead 290 368 107.2 430236-002 MR 10-230 Mercury 0.289 0.004 Brown Bullhead 281 318 78.2 530236-003 MR 10-231 Mercury 0.299 0.003 Brown Bullhead 268 262 77.3 430236-004 MR 30236-bc4 Mercury 0.241 0.004 Brown Bullhead 256 253 71.75 430236-005 MR 10-234 Mercury 0.25 0.004 Brown Bullhead 245 222 73.3 430236-006 MR 30236-bc6 Mercury 0.202 0.003 Brown Bullhead 243 184 51.6 430236-007 MR 30236-bc7 Mercury 0.317 0.004 Brown Bullhead 236.5 177 56 430236-008 MR 30236-bc8 Mercury 0.235 0.004 Brown Bullhead 222.5 150 43.7 430236-009 MR 30236-bc9 Mercury 0.202 0.004 Brown Bullhead 185.33 78 23.6 230236-010 MR 10-244 Mercury 0.282 0.004 Brown Bullhead 169 58 15 230236-011 MR 10-245 Mercury 0.348 0.004 Brown Bullhead 167 62 14.8 230236-012 MR 10-246 Mercury 0.223 0.004 Brown Bullhead 163 48 12.9 2
2 of 4

Table 4-8a Peconic River Fish Samples - Mercury by areaBNL Fish ID or Value MDL Lab Rev Avg Length Individual or Individual or Avg
Compsite ID (mg/kg) (mg/kg) Qual Qual (mm) Composite Composite Age
Avg Weight Avg Weight
Whole(g) Fillet(g)
Sample ID Area Analyte Species
30236-013 MR 10-247 Mercury 0.283 0.004 Brown Bullhead 162 52 12.9 230236-014 MR 10-248 Mercury 0.278 0.004 Largemouth Bass 203 114 34.6 230236-015 MR 10-249 Mercury 0.293 0.004 Pumpkinseed 151 78 21.9 330236-016 MR 10-250 Mercury 0.107 0.004 Pumpkinseed 149 82 26 230236-017 MR 10-251 Mercury 0.158 0.004 Pumpkinseed 145 64 17.5 230236-018 MR 10-252 Mercury 0.266 0.004 Bluegill 110 28 8.8 128623-001 DP 28623-bc1 Mercury 0.129 0.003 Pumpkinseed 175 121 43.3 428623-002 DP 28623-bc2 Mercury 0.163 0.004 Pumpkinseed 180 141 48.95 628623-003 DP 10-024 Mercury 0.138 0.004 Pumpkinseed 179 138 55.6 528623-004 DP 10-025 Mercury 0.089 0.003 Pumpkinseed 175 148 56.6 428623-005 DP 28623-bc5 Mercury 0.064 0.004 Pumpkinseed 175 145 48.5 528623-006 DP 28623-bc6 Mercury 0.17 0.004 Pumpkinseed 190 163 46.7 528623-007 DP 10-031 Mercury 0.073 0.004 Pumpkinseed 190 168 53.6 528623-008 DP 10-032 Mercury 0.161 0.004 Pumpkinseed 195 192 62.3 628623-009 DP 10-033 Mercury 0.079 0.004 Pumpkinseed 200 212 63 428623-010 DP 10-034 Mercury 0.08 0.004 Bluegill 181 160 60.1 428623-011 DP 10-035 Mercury 0.256 0.004 Bluegill 180 162 49.2 528623-012 DP 10-036 Mercury 0.073 0.004 Bluegill 180 162 59.3 428623-013 DP 10-037 Mercury 0.155 0.004 Bluegill 195 168 55.1 628623-014 DP 10-038 Mercury 0.151 0.004 Bluegill 195 192 63.6 428623-015 DP 10-039 Mercury 0.121 0.004 Bluegill 210 192 62.8 428623-016 DP 10-040 Mercury 0.122 0.004 Bluegill 198 196 60.7 528623-017 DP 10-041 Mercury 0.069 0.004 Bluegill 189 196 61.9 528623-018 DP 10-042 Mercury 0.188 0.004 Bluegill 100 202 70.6 528623-019 DP 10-043 Mercury 0.149 0.004 Bluegill 203 220 78 528623-020 DP 10-044 Mercury 0.192 0.004 Bluegill 232 232 80 528624-001 DP 10-045 Mercury 0.348 0.003 Largemouth Bass 242 208 70.1 428624-002 DP 10-046 Mercury 0.452 0.004 Largemouth Bass 262 274 88.7 628624-003 DP 10-047 Mercury 0.96 0.04 Largemouth Bass 455 1304 340.2 828624-004 DP 10-048 Mercury 0.131 0.004 Chain Pickerel 338 212 78.7 328624-005 DP 10-049 Mercury 0.146 0.004 Brown Bullhead 299 424 112.9 128624-006 DP 10-050 Mercury 0.087 0.004 Brown Bullhead 300 482 134.5 628624-007 DP 10-051 Mercury 0.024 0.003 Brown Bullhead 300 488 135 428624-008 DP 10-052 Mercury 0.072 0.004 Brown Bullhead 300 492 144.2 5
3 of 4

Table 4-8a Peconic River Fish Samples - Mercury by areaBNL Fish ID or Value MDL Lab Rev Avg Length Individual or Individual or Avg
Compsite ID (mg/kg) (mg/kg) Qual Qual (mm) Composite Composite Age
Avg Weight Avg Weight
Whole(g) Fillet(g)
Sample ID Area Analyte Species
28624-009 DP 10-053 Mercury 0.048 0.004 Brown Bullhead 310 518 161.3 528624-010 DP 10-054 Mercury 0.151 0.004 Brown Bullhead 300 504 107.1 128624-011 DP 10-055 Mercury 0.042 0.004 Brown Bullhead 317 544 160.6 528624-012 DP 10-056 Mercury 0.107 0.004 Brown Bullhead 305 548 132.7 828624-013 DP 10-057 Mercury 0.065 0.004 Brown Bullhead 315 592 122.7 128624-014 DP 10-058 Mercury 0.04 0.003 Brown Bullhead 334 696 195.6 6
4 of 4
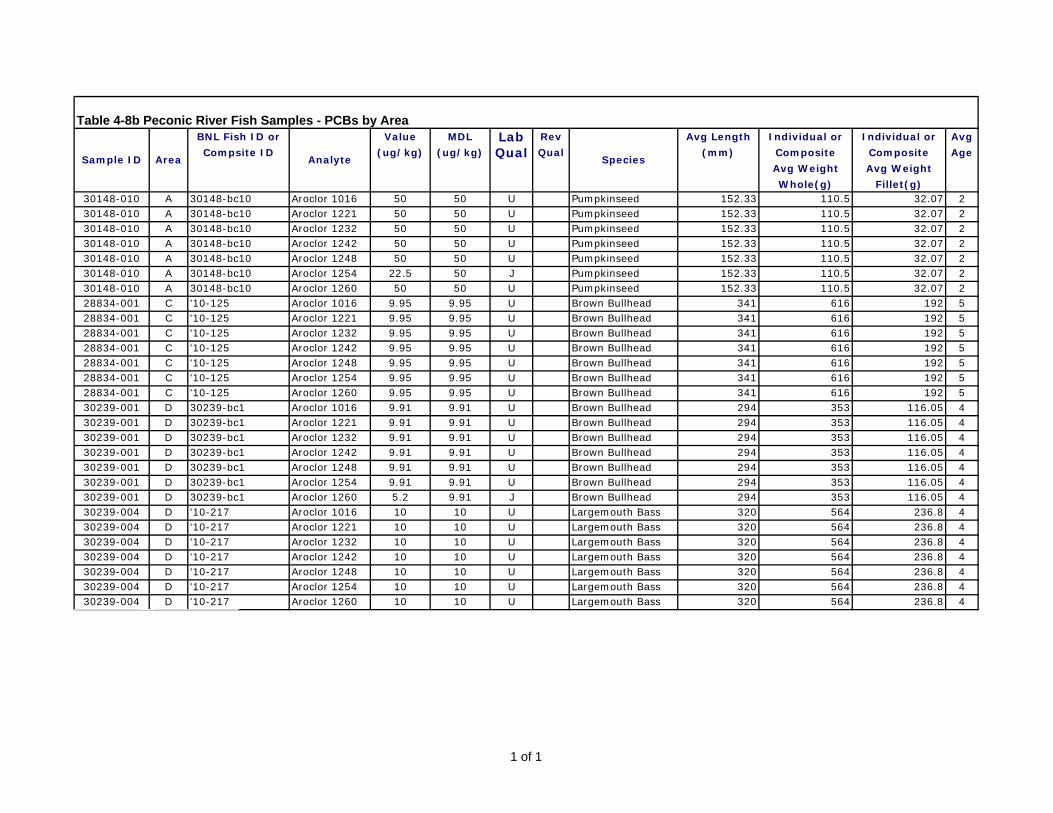
Table 4-8b Peconic River Fish Samples - PCBs by Area BNL Fish ID or Value MDL Lab Rev Avg Length Individual or Individual or Avg
Compsite ID (ug/kg) (ug/kg) Qual Qual (mm) Composite Composite Age
Avg Weight Avg Weight
Whole(g) Fillet(g)30148-010 A 30148-bc10 Aroclor 1016 50 50 U Pumpkinseed 152.33 110.5 32.07 230148-010 A 30148-bc10 Aroclor 1221 50 50 U Pumpkinseed 152.33 110.5 32.07 230148-010 A 30148-bc10 Aroclor 1232 50 50 U Pumpkinseed 152.33 110.5 32.07 230148-010 A 30148-bc10 Aroclor 1242 50 50 U Pumpkinseed 152.33 110.5 32.07 230148-010 A 30148-bc10 Aroclor 1248 50 50 U Pumpkinseed 152.33 110.5 32.07 230148-010 A 30148-bc10 Aroclor 1254 22.5 50 J Pumpkinseed 152.33 110.5 32.07 230148-010 A 30148-bc10 Aroclor 1260 50 50 U Pumpkinseed 152.33 110.5 32.07 228834-001 C '10-125 Aroclor 1016 9.95 9.95 U Brown Bullhead 341 616 192 528834-001 C '10-125 Aroclor 1221 9.95 9.95 U Brown Bullhead 341 616 192 528834-001 C '10-125 Aroclor 1232 9.95 9.95 U Brown Bullhead 341 616 192 528834-001 C '10-125 Aroclor 1242 9.95 9.95 U Brown Bullhead 341 616 192 528834-001 C '10-125 Aroclor 1248 9.95 9.95 U Brown Bullhead 341 616 192 528834-001 C '10-125 Aroclor 1254 9.95 9.95 U Brown Bullhead 341 616 192 528834-001 C '10-125 Aroclor 1260 9.95 9.95 U Brown Bullhead 341 616 192 530239-001 D 30239-bc1 Aroclor 1016 9.91 9.91 U Brown Bullhead 294 353 116.05 430239-001 D 30239-bc1 Aroclor 1221 9.91 9.91 U Brown Bullhead 294 353 116.05 430239-001 D 30239-bc1 Aroclor 1232 9.91 9.91 U Brown Bullhead 294 353 116.05 430239-001 D 30239-bc1 Aroclor 1242 9.91 9.91 U Brown Bullhead 294 353 116.05 430239-001 D 30239-bc1 Aroclor 1248 9.91 9.91 U Brown Bullhead 294 353 116.05 430239-001 D 30239-bc1 Aroclor 1254 9.91 9.91 U Brown Bullhead 294 353 116.05 430239-001 D 30239-bc1 Aroclor 1260 5.2 9.91 J Brown Bullhead 294 353 116.05 430239-004 D '10-217 Aroclor 1016 10 10 U Largemouth Bass 320 564 236.8 430239-004 D '10-217 Aroclor 1221 10 10 U Largemouth Bass 320 564 236.8 430239-004 D '10-217 Aroclor 1232 10 10 U Largemouth Bass 320 564 236.8 430239-004 D '10-217 Aroclor 1242 10 10 U Largemouth Bass 320 564 236.8 430239-004 D '10-217 Aroclor 1248 10 10 U Largemouth Bass 320 564 236.8 430239-004 D '10-217 Aroclor 1254 10 10 U Largemouth Bass 320 564 236.8 430239-004 D '10-217 Aroclor 1260 10 10 U Largemouth Bass 320 564 236.8 4
Sample ID Area Analyte Species
1 of 1
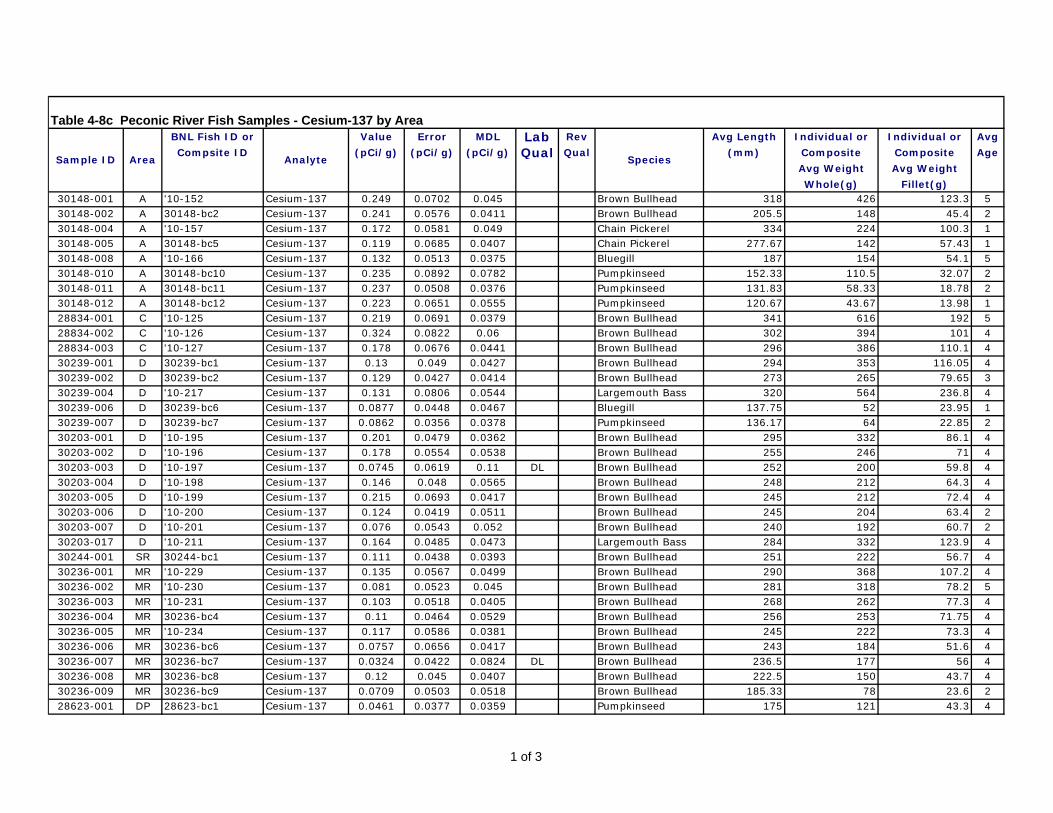
Table 4-8c Peconic River Fish Samples - Cesium-137 by AreaBNL Fish ID or Value Error MDL Lab Rev Avg Length Individual or Individual or Avg
Compsite ID (pCi/g) (pCi/g) (pCi/g) Qual Qual (mm) Composite Composite Age
Avg Weight Avg Weight
Whole(g) Fillet(g)30148-001 A '10-152 Cesium-137 0.249 0.0702 0.045 Brown Bullhead 318 426 123.3 530148-002 A 30148-bc2 Cesium-137 0.241 0.0576 0.0411 Brown Bullhead 205.5 148 45.4 230148-004 A '10-157 Cesium-137 0.172 0.0581 0.049 Chain Pickerel 334 224 100.3 130148-005 A 30148-bc5 Cesium-137 0.119 0.0685 0.0407 Chain Pickerel 277.67 142 57.43 130148-008 A '10-166 Cesium-137 0.132 0.0513 0.0375 Bluegill 187 154 54.1 530148-010 A 30148-bc10 Cesium-137 0.235 0.0892 0.0782 Pumpkinseed 152.33 110.5 32.07 230148-011 A 30148-bc11 Cesium-137 0.237 0.0508 0.0376 Pumpkinseed 131.83 58.33 18.78 230148-012 A 30148-bc12 Cesium-137 0.223 0.0651 0.0555 Pumpkinseed 120.67 43.67 13.98 128834-001 C '10-125 Cesium-137 0.219 0.0691 0.0379 Brown Bullhead 341 616 192 528834-002 C '10-126 Cesium-137 0.324 0.0822 0.06 Brown Bullhead 302 394 101 428834-003 C '10-127 Cesium-137 0.178 0.0676 0.0441 Brown Bullhead 296 386 110.1 430239-001 D 30239-bc1 Cesium-137 0.13 0.049 0.0427 Brown Bullhead 294 353 116.05 430239-002 D 30239-bc2 Cesium-137 0.129 0.0427 0.0414 Brown Bullhead 273 265 79.65 330239-004 D '10-217 Cesium-137 0.131 0.0806 0.0544 Largemouth Bass 320 564 236.8 430239-006 D 30239-bc6 Cesium-137 0.0877 0.0448 0.0467 Bluegill 137.75 52 23.95 130239-007 D 30239-bc7 Cesium-137 0.0862 0.0356 0.0378 Pumpkinseed 136.17 64 22.85 230203-001 D '10-195 Cesium-137 0.201 0.0479 0.0362 Brown Bullhead 295 332 86.1 430203-002 D '10-196 Cesium-137 0.178 0.0554 0.0538 Brown Bullhead 255 246 71 430203-003 D '10-197 Cesium-137 0.0745 0.0619 0.11 DL Brown Bullhead 252 200 59.8 430203-004 D '10-198 Cesium-137 0.146 0.048 0.0565 Brown Bullhead 248 212 64.3 430203-005 D '10-199 Cesium-137 0.215 0.0693 0.0417 Brown Bullhead 245 212 72.4 430203-006 D '10-200 Cesium-137 0.124 0.0419 0.0511 Brown Bullhead 245 204 63.4 230203-007 D '10-201 Cesium-137 0.076 0.0543 0.052 Brown Bullhead 240 192 60.7 230203-017 D '10-211 Cesium-137 0.164 0.0485 0.0473 Largemouth Bass 284 332 123.9 430244-001 SR 30244-bc1 Cesium-137 0.111 0.0438 0.0393 Brown Bullhead 251 222 56.7 430236-001 MR '10-229 Cesium-137 0.135 0.0567 0.0499 Brown Bullhead 290 368 107.2 430236-002 MR '10-230 Cesium-137 0.081 0.0523 0.045 Brown Bullhead 281 318 78.2 530236-003 MR '10-231 Cesium-137 0.103 0.0518 0.0405 Brown Bullhead 268 262 77.3 430236-004 MR 30236-bc4 Cesium-137 0.11 0.0464 0.0529 Brown Bullhead 256 253 71.75 430236-005 MR '10-234 Cesium-137 0.117 0.0586 0.0381 Brown Bullhead 245 222 73.3 430236-006 MR 30236-bc6 Cesium-137 0.0757 0.0656 0.0417 Brown Bullhead 243 184 51.6 430236-007 MR 30236-bc7 Cesium-137 0.0324 0.0422 0.0824 DL Brown Bullhead 236.5 177 56 430236-008 MR 30236-bc8 Cesium-137 0.12 0.045 0.0407 Brown Bullhead 222.5 150 43.7 430236-009 MR 30236-bc9 Cesium-137 0.0709 0.0503 0.0518 Brown Bullhead 185.33 78 23.6 228623-001 DP 28623-bc1 Cesium-137 0.0461 0.0377 0.0359 Pumpkinseed 175 121 43.3 4
Sample ID Area Analyte Species
1 of 3

Table 4-8c Peconic River Fish Samples - Cesium-137 by AreaBNL Fish ID or Value Error MDL Lab Rev Avg Length Individual or Individual or Avg
Compsite ID (pCi/g) (pCi/g) (pCi/g) Qual Qual (mm) Composite Composite Age
Avg Weight Avg Weight
Whole(g) Fillet(g)
Sample ID Area Analyte Species
28623-001 DP 28623-bc1 Potassium-40 2.86 0.835 0.4 Pumpkinseed 175 121 43.3 428623-002 DP 28623-bc2 Cesium-137 0.0311 0.029 0.0529 DL Pumpkinseed 180 141 48.95 628623-002 DP 28623-bc2 Potassium-40 2.27 0.707 0.3 Pumpkinseed 180 141 48.95 628623-005 DP 28623-bc5 Cesium-137 0.0758 0.046 0.0361 Pumpkinseed 175 145 48.5 528623-005 DP 28623-bc5 Potassium-40 2.68 0.718 0.381 Pumpkinseed 175 145 48.5 528623-006 DP 28623-bc6 Cesium-137 0.0618 0.0495 0.0922 DL Pumpkinseed 190 163 46.7 528623-006 DP 28623-bc6 Potassium-40 3.4 1.14 0.796 Pumpkinseed 190 163 46.7 528623-008 DP '10-032 Cesium-137 0.0398 0.0294 0.0333 Pumpkinseed 195 192 62.3 628623-008 DP '10-032 Potassium-40 3.08 0.663 0.348 Pumpkinseed 195 192 62.3 628623-009 DP '10-033 Cesium-137 0.0864 0.0409 0.0733 UI Pumpkinseed 200 212 63 428623-009 DP '10-033 Potassium-40 3.46 1.07 0.699 Pumpkinseed 200 212 63 428623-010 DP '10-034 Cesium-137 0.103 0.0403 0.029 Bluegill 181 160 60.1 428623-010 DP '10-034 Potassium-40 2.74 0.69 0.32 Bluegill 181 160 60.1 428623-014 DP '10-038 Cesium-137 0.0516 0.0402 0.0682 DL Bluegill 195 192 63.6 428623-014 DP '10-038 Potassium-40 3.23 0.875 0.55 Bluegill 195 192 63.6 428623-015 DP '10-039 Cesium-137 0.0456 0.0266 0.0508 DL Bluegill 210 192 62.8 428623-015 DP '10-039 Potassium-40 2.65 0.658 0.54 Bluegill 210 192 62.8 428623-016 DP '10-040 Cesium-137 0.0501 0.0407 0.0682 DL Bluegill 198 196 60.7 528623-016 DP '10-040 Potassium-40 3.43 1.04 0.546 Bluegill 198 196 60.7 528623-017 DP '10-041 Cesium-137 0.0177 0.0249 0.0442 DL Bluegill 189 196 61.9 528623-017 DP '10-041 Potassium-40 2.99 0.76 0.403 Bluegill 189 196 61.9 528623-018 DP '10-042 Cesium-137 0.121 0.0503 0.0484 Bluegill 100 202 70.6 528623-018 DP '10-042 Potassium-40 2.62 0.819 0.45 Bluegill 100 202 70.6 528623-019 DP '10-043 Cesium-137 0.0757 0.051 0.0365 Bluegill 203 220 78 528623-019 DP '10-043 Potassium-40 2.78 0.723 0.511 Bluegill 203 220 78 528623-020 DP '10-044 Cesium-137 0.0645 0.0423 0.0356 Bluegill 232 232 80 528623-020 DP '10-044 Potassium-40 2.1 0.72 0.406 Bluegill 232 232 80 528624-001 DP '10-045 Cesium-137 0.0402 0.0299 0.056 DL Largemouth Bass 242 208 70.1 428624-001 DP '10-045 Potassium-40 3.83 0.841 0.495 Largemouth Bass 242 208 70.1 428624-002 DP '10-046 Cesium-137 0.132 0.0497 0.0368 Largemouth Bass 262 274 88.7 628624-002 DP '10-046 Potassium-40 3.33 0.732 0.385 Largemouth Bass 262 274 88.7 628624-003 DP '10-047 Cesium-137 0.106 0.0417 0.0336 Largemouth Bass 455 1304 340.2 828624-003 DP '10-047 Potassium-40 2.89 0.756 0.527 Largemouth Bass 455 1304 340.2 828624-004 DP '10-048 Cesium-137 0.1 0.0352 0.0308 Chain Pickerel 338 212 78.7 328624-004 DP '10-048 Potassium-40 3.71 0.706 0.29 Chain Pickerel 338 212 78.7 3
2 of 3

Table 4-8c Peconic River Fish Samples - Cesium-137 by AreaBNL Fish ID or Value Error MDL Lab Rev Avg Length Individual or Individual or Avg
Compsite ID (pCi/g) (pCi/g) (pCi/g) Qual Qual (mm) Composite Composite Age
Avg Weight Avg Weight
Whole(g) Fillet(g)
Sample ID Area Analyte Species
28624-005 DP '10-049 Cesium-137 0.0627 0.0406 0.0429 Brown Bullhead 299 424 112.9 128624-005 DP '10-049 Potassium-40 3.56 0.852 0.555 Brown Bullhead 299 424 112.9 128624-006 DP '10-050 Cesium-137 0.0469 0.0353 0.0364 Brown Bullhead 300 482 134.5 628624-006 DP '10-050 Potassium-40 4.29 0.759 0.382 Brown Bullhead 300 482 134.5 628624-007 DP '10-051 Cesium-137 0.0647 0.0361 0.0389 Brown Bullhead 300 488 135 428624-007 DP '10-051 Potassium-40 3.96 0.762 0.389 Brown Bullhead 300 488 135 428624-008 DP '10-052 Cesium-137 0.0606 0.0276 0.0275 Brown Bullhead 300 492 144.2 528624-008 DP '10-052 Potassium-40 3.49 0.696 0.349 Brown Bullhead 300 492 144.2 528624-009 DP '10-053 Cesium-137 0.0772 0.0335 0.0317 Brown Bullhead 310 518 161.3 528624-009 DP '10-053 Potassium-40 4.1 0.712 0.375 Brown Bullhead 310 518 161.3 528624-010 DP '10-054 Cesium-137 0.0986 0.0486 0.0338 Brown Bullhead 300 504 107.1 128624-010 DP '10-054 Potassium-40 3.79 0.741 0.258 Brown Bullhead 300 504 107.1 128624-011 DP '10-055 Cesium-137 0.0561 0.0316 0.033 Brown Bullhead 317 544 160.6 528624-011 DP '10-055 Potassium-40 3.91 0.693 0.42 Brown Bullhead 317 544 160.6 528624-012 DP '10-056 Cesium-137 0.0832 0.0379 0.0342 Brown Bullhead 305 548 132.7 828624-012 DP '10-056 Potassium-40 3.35 0.787 0.351 Brown Bullhead 305 548 132.7 828624-013 DP '10-057 Cesium-137 0.0671 0.0476 0.0335 Brown Bullhead 315 592 122.7 128624-013 DP '10-057 Potassium-40 4.18 0.713 0.29 Brown Bullhead 315 592 122.7 128624-014 DP '10-058 Cesium-137 0.0688 0.0388 0.0378 Brown Bullhead 334 696 195.6 628624-014 DP '10-058 Potassium-40 4.89 0.742 0.387 Brown Bullhead 334 696 195.6 6
3 of 3
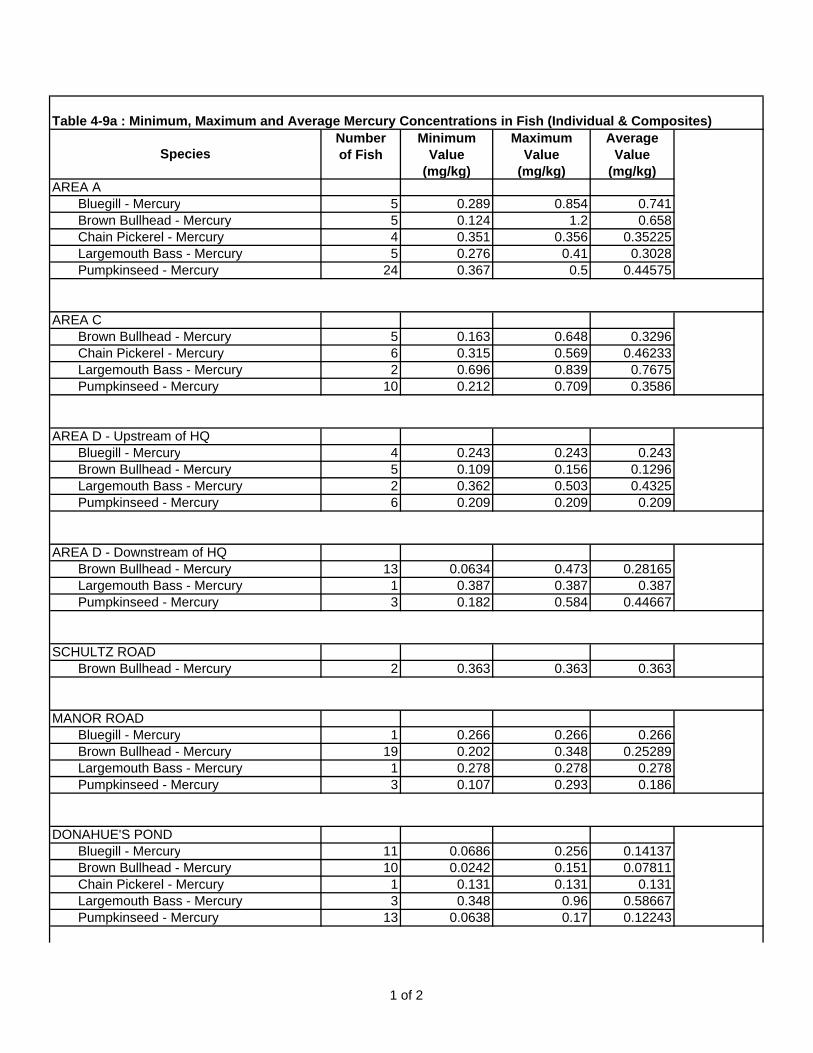
Number Minimum Maximum Averageof Fish Value Value Value
(mg/kg) (mg/kg) (mg/kg)AREA A Bluegill - Mercury 5 0.289 0.854 0.741 Brown Bullhead - Mercury 5 0.124 1.2 0.658 Chain Pickerel - Mercury 4 0.351 0.356 0.35225 Largemouth Bass - Mercury 5 0.276 0.41 0.3028 Pumpkinseed - Mercury 24 0.367 0.5 0.44575
AREA C Brown Bullhead - Mercury 5 0.163 0.648 0.3296 Chain Pickerel - Mercury 6 0.315 0.569 0.46233 Largemouth Bass - Mercury 2 0.696 0.839 0.7675 Pumpkinseed - Mercury 10 0.212 0.709 0.3586
AREA D - Upstream of HQ Bluegill - Mercury 4 0.243 0.243 0.243 Brown Bullhead - Mercury 5 0.109 0.156 0.1296 Largemouth Bass - Mercury 2 0.362 0.503 0.4325 Pumpkinseed - Mercury 6 0.209 0.209 0.209
AREA D - Downstream of HQ Brown Bullhead - Mercury 13 0.0634 0.473 0.28165 Largemouth Bass - Mercury 1 0.387 0.387 0.387 Pumpkinseed - Mercury 3 0.182 0.584 0.44667
SCHULTZ ROAD Brown Bullhead - Mercury 2 0.363 0.363 0.363
MANOR ROAD Bluegill - Mercury 1 0.266 0.266 0.266 Brown Bullhead - Mercury 19 0.202 0.348 0.25289 Largemouth Bass - Mercury 1 0.278 0.278 0.278 Pumpkinseed - Mercury 3 0.107 0.293 0.186
DONAHUE'S POND Bluegill - Mercury 11 0.0686 0.256 0.14137 Brown Bullhead - Mercury 10 0.0242 0.151 0.07811 Chain Pickerel - Mercury 1 0.131 0.131 0.131 Largemouth Bass - Mercury 3 0.348 0.96 0.58667 Pumpkinseed - Mercury 13 0.0638 0.17 0.12243
Table 4-9a : Minimum, Maximum and Average Mercury Concentrations in Fish (Individual & Composites)
Species
1 of 2

Number Minimum Maximum Averageof Fish Value Value Value
(mg/kg) (mg/kg) (mg/kg)
Table 4-9a : Minimum, Maximum and Average Mercury Concentrations in Fish (Individual & Composites)
Species
SWAN POND Bluegill - Mercury 12 0.0493 0.0575 0.0535 Brown Bullhead - Mercury 8 0.0017 0.157 0.03224 Chain Pickerel - Mercury 1 0.0729 0.0729 0.0729 Largemouth Bass - Mercury 4 0.0794 0.544 0.22733 Pumpkinseed - Mercury 12 0.0072 0.04 0.0238 Yellow Perch - Mercury 5 0.0286 0.111 0.06962
FORGE POND Bluegill - Mercury 6 0.0428 0.0568 0.0498 Brown Bullhead - Mercury 1 0.0699 0.0699 0.0699 Chain Pickerel - Mercury 1 0.292 0.292 0.292 Largemouth Bass - Mercury 5 0.147 0.22 0.1674 Pumpkinseed - Mercury 7 0.116 0.133 0.12571 Yellow Perch - Mercury 4 0.0652 0.108 0.0797
2 of 2

Number Minimum Maximum Average
of Fish Value Value Value
(ug/kg) (ug/kg) (ug/kg)
AREA A
Pumpkinseed ‐ Aroclor 1016 6 50 50 50
Pumpkinseed ‐ Aroclor 1221 6 50 50 50
Pumpkinseed ‐ Aroclor 1232 6 50 50 50
Pumpkinseed ‐ Aroclor 1242 6 50 50 50
Pumpkinseed ‐ Aroclor 1248 6 50 50 50
Pumpkinseed ‐ Aroclor 1254 6 22.5 22.5 22.5
Pumpkinseed ‐ Aroclor 1260 6 50 50 50
AREA C
Brown Bullhead ‐ Aroclor 1016 1 9.95 9.95 9.95
Brown Bullhead ‐ Aroclor 1221 1 9.95 9.95 9.95
Brown Bullhead ‐ Aroclor 1232 1 9.95 9.95 9.95
Brown Bullhead ‐ Aroclor 1242 1 9.95 9.95 9.95
Brown Bullhead ‐ Aroclor 1248 1 9.95 9.95 9.95
Brown Bullhead ‐ Aroclor 1254 1 9.95 9.95 9.95
Brown Bullhead ‐ Aroclor 1260 1 9.95 9.95 9.95
AREA D ‐ Upstream of HQ
Brown Bullhead ‐ Aroclor 1016 2 9.91 9.91 9.91
Brown Bullhead ‐ Aroclor 1221 2 9.91 9.91 9.91
Brown Bullhead ‐ Aroclor 1232 2 9.91 9.91 9.91
Brown Bullhead ‐ Aroclor 1242 2 9.91 9.91 9.91
Brown Bullhead ‐ Aroclor 1248 2 9.91 9.91 9.91
Brown Bullhead ‐ Aroclor 1254 2 9.91 9.91 9.91
Brown Bullhead ‐ Aroclor 1260 2 5.2 5.2 5.2
Largemouth Bass ‐ Aroclor 1016 1 10 10 10
Largemouth Bass ‐ Aroclor 1221 1 10 10 10
Largemouth Bass ‐ Aroclor 1232 1 10 10 10
Largemouth Bass ‐ Aroclor 1242 1 10 10 10
Largemouth Bass ‐ Aroclor 1248 1 10 10 10
Largemouth Bass ‐ Aroclor 1254 1 10 10 10
Largemouth Bass ‐ Aroclor 1260 1 10 10 10
Species
Table 4‐9b : Minimum, Maximum and Average PCB Concentrations in Fish (Individual &
Composites)

Number Minimum Maximum Average Averageof Fish Value Value Value Error
(pCi/g) (pCi/g) (pCi/g) (pCi/g)AREA A Bluegill - Cesium-137 1 0.132 0.132 0.132 0.0513 Brown Bullhead - Cesium-137 3 0.241 0.249 0.24367 0.0618 Chain Pickerel - Cesium-137 4 0.119 0.172 0.13225 0.0659 Pumpkinseed - Cesium-137 18 0.223 0.237 0.23167 0.0684
AREA C Brown Bullhead - Cesium-137 3 0.178 0.324 0.24033 0.073
AREA D - Upstream of HQ Bluegill - Cesium-137 4 0.0877 0.0877 0.0877 0.0448 Brown Bullhead - Cesium-137 4 0.129 0.13 0.1295 0.0459 Largemouth Bass - Cesium-137 1 0.131 0.131 0.131 0.0806 Pumpkinseed - Cesium-137 6 0.0862 0.0862 0.0862 0.0356
AREA D - Downstream of HQ Brown Bullhead - Cesium-137 7 0.0745 0.215 0.14493 0.0541 Largemouth Bass - Cesium-137 1 0.164 0.164 0.164 0.0485
SCHULTZ ROAD Brown Bullhead - Cesium-137 2 0.111 0.111 0.111 0.0438
MANOR ROAD Brown Bullhead - Cesium-137 15 0.0324 0.135 0.08833 0.0512
DONAHUE'S POND Bluegill - Cesium-137 8 0.0177 0.121 0.06615 0.0395 Brown Bullhead - Cesium-137 10 0.0469 0.0986 0.06859 0.0378 Chain Pickerel - Cesium-137 1 0.1 0.1 0.1 0.0352 Largemouth Bass - Cesium-137 3 0.0402 0.132 0.09273 0.0404 Pumpkinseed - Cesium-137 10 0.0311 0.0864 0.05558 0.0395
Table 4-9c : Minimum, Maximum and Average Cs-137 Concentrations in Fish (Individual & Composites)
Species
1 of 1
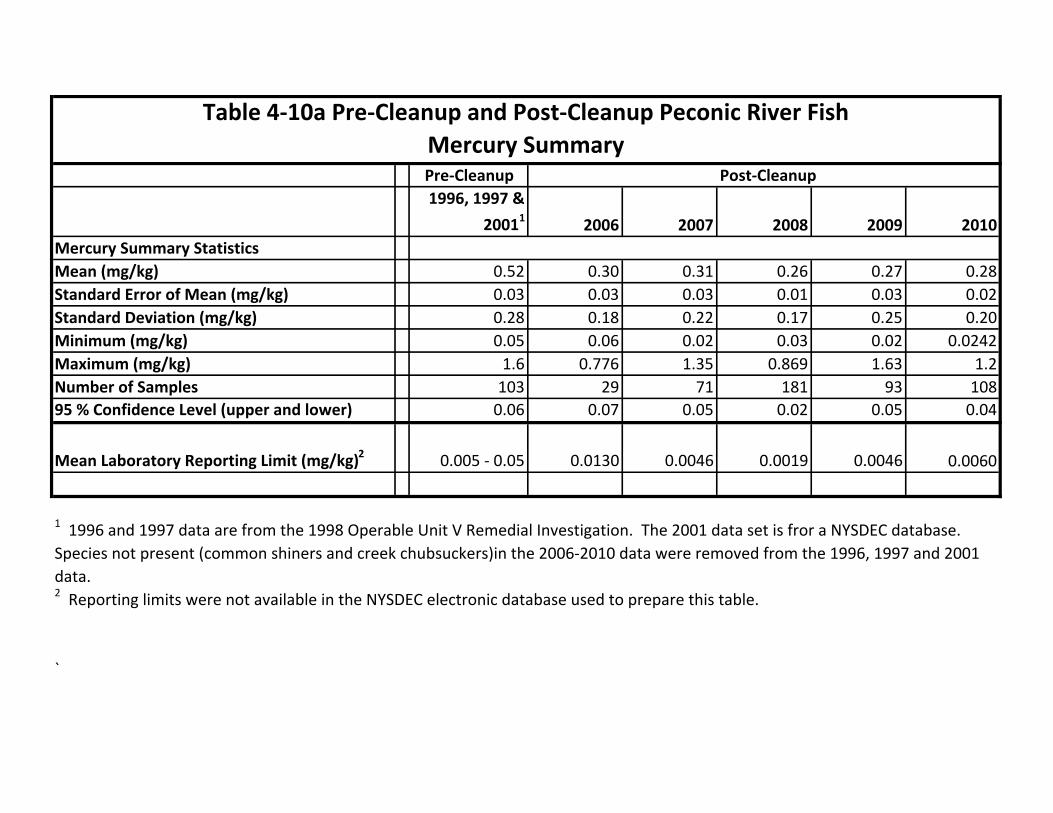
Pre‐Cleanup Post‐Cleanup
1996, 1997 &
20011
2006 2007 2008 2009 2010
Mercury Summary Statistics
Mean (mg/kg) 0.52 0.30 0.31 0.26 0.27 0.28
Standard Error of Mean (mg/kg) 0.03 0.03 0.03 0.01 0.03 0.02
Standard Deviation (mg/kg) 0.28 0.18 0.22 0.17 0.25 0.20
Minimum (mg/kg) 0.05 0.06 0.02 0.03 0.02 0.0242
Maximum (mg/kg) 1.6 0.776 1.35 0.869 1.63 1.2
Number of Samples 103 29 71 181 93 108
95 % Confidence Level (upper and lower) 0.06 0.07 0.05 0.02 0.05 0.04
Mean Laboratory Reporting Limit (mg/kg)2 0.005 ‐ 0.05 0.0130 0.0046 0.0019 0.0046 0.0060
`
1 1996 and 1997 data are from the 1998 Operable Unit V Remedial Investigation. The 2001 data set is fror a NYSDEC database.
Species not present (common shiners and creek chubsuckers)in the 2006‐2010 data were removed from the 1996, 1997 and 2001
data.
Table 4‐10a Pre‐Cleanup and Post‐Cleanup Peconic River Fish
Mercury Summary
2 Reporting limits were not available in the NYSDEC electronic database used to prepare this table.

Pre‐Cleanup Post‐Cleanup
1996 & 1997 2006 2007 2008 2009 2010
Aroclor‐1254 Summary Statistics
Mean (ug/kg) 1205.21 21.96 16.92 16.16 9.66 13.09
Standard Error of Mean (ug/kg) 173.97 1.26 2.71 6.24 0.28 3.14
Standard Deviation (ug/kg) 1476.15 6.79 25.87 8.83 2.01 6.27
Minimum (ug/kg) 100 20 3.33 9.91 3.5 9.91
Maximum (ug/kg) 6010 52.4 252 22.4 18.9 22.5
Number of Samples 72 29 91 2 52 4
95% Confidence Level (upper and lower) 346.88 2.58 5.39 79.35 0.56 9.98
Mean Laboratory Reporting Limit (ug/kg)
1996‐200,
1997‐100 20 14.3 9.94 9.81 9.98
Table 4‐10b Pre‐Cleanup and Post‐Cleanup Peconic River Fish
PCB Summary1
1 The majority of post‐cleanup PCB analyses were less than the reporting limit. Aroclor‐1254 was selected as the indicator
Aroclor because the post‐cleanup Aroclor‐1254 concentrations were the highest among the seven Aroclors analyzed. Also, only
Aroclor‐1254 was analyzed for in the pre‐cleanup Remedial Investigation. See the 2006‐2009 Peconic River Monitoring Reports
for detailed Aroclor‐1016, Aroclor‐1221, Aroclor‐1232, Aroclor‐1242, Aroclor‐1248, Aroclor‐1254, Aroclor‐1260 data.
1 of 1

Pre‐Cleanup Post‐Cleanup
1996, 19971 2006 2007 2008 2009 2010
Cesium‐137 Summary Statistics
Mean (pCi/g) 1.37 0.24 0.14 0.11 0.17 0.11
Standard Error of Mean (pCi/g) 0.16 0.03 0.01 0.01 0.01 0.01
Standard Deviation (pCi/g) 0.45 0.10 0.05 0.06 0.09 0.06
Minimum (pCi/g) 0.49 0.121 0.0549 0.0328 0.0212 0.0177
Maximum (pCi/g) 1.88 0.381 0.243 0.287 0.511 0.324
Number of Samples 8 9 29 41 61 62
Mean Error (pCi/g) 0.265 0.076 0.030 0.031 0.029 0.048Mean Reporting Limit (pCi/g) 0.202 0.059 0.021 0.025 0.020 0.047
Table 4‐10c Pre‐Cleanup and Post‐Cleanup Peconic River Fish
Cesium‐137 Summary
1 1996 and 1997 data are from Appendices F3 and F4 of the 1998 Operable Unit V Remedial Investigation Report. Creek chubsuckers were not encountered during the 2006-2010 sampling so were removed from the 1996 and 1997 data to facilitate data comparability. 2006-2010 data are from the respective Peconic River Monitoring Reports.
1 of 1
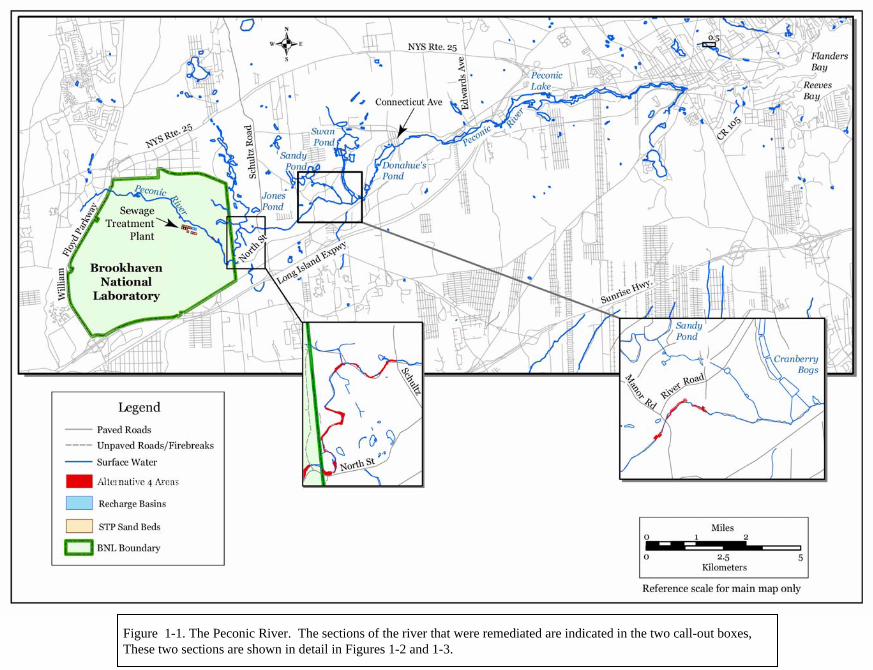
Figure 1-1. The Peconic River. The sections of the river that were remediated are indicated in the two call-out boxes, These two sections are shown in detail in Figures 1-2 and 1-3.
2004-2005 Cleanup Areas
Administrator
Text Box
2004-2005 Cleanup Areas

i
BNL Property Line
Figure 1-2. Peconic River Cleanup Areas between the BNL Sewage Treatment Plant and Schultz Road.
Administrator
Text Box
2004-2005 Cleanup Areas

Figure 1-3. Peconic River Cleanup Areas Adjacent to Manor Road
Administrator
Text Box
2004-2005 Cleanup Areas
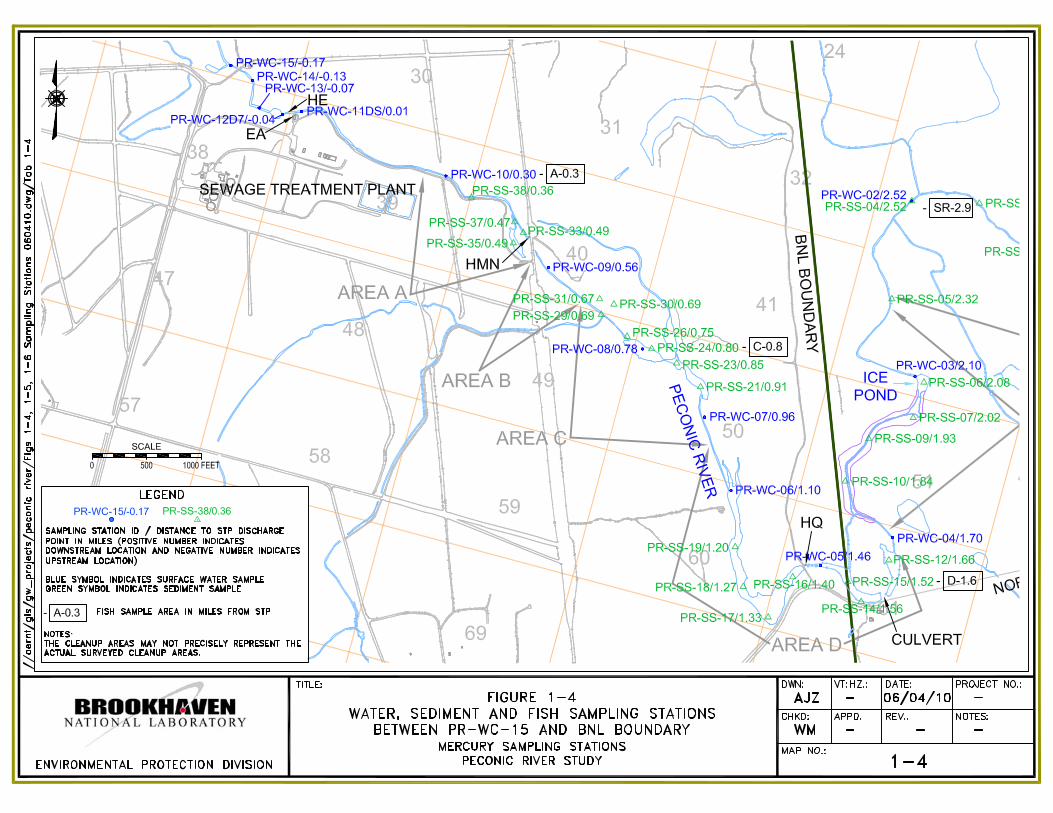


Figure 2-1 2010 Peconic River Sediment Mercury ResultsRoutine Sedment Monitoring Stations
0.0
0.5
1.0
1.5
2.0
2.5
3.0
3.5
4.0
4.5
5.0
PR
-SS
-38-
O-0
.36
mi.
PR
-SS
-37-
0.47
mi.
PR
-SS
-33-
0.49
mi.
PR
-SS
-35-
0.49
mi.
PR
-SS
-31-
0.67
mi.
PR
-SS
-29-
0.69
mi.
PR
-SS
-30-
0.69
mi.
PR
-SS
-26-
0.75
mi.
PR
-SS
-24-
0.8
mi.
PR
-SS
-23-
0.85
mi.
PR
-SS
-21-
0.91
mi.
PR
-SS
-19-
1.2
mi.
PR
-SS
-18-
1.27
mi.
PR
-SS
-17-
1.33
mi.
PR
-SS
-16-
1.4
mi.
PR
-SS
-15-
1.52
mi.
PR
-SS
-14-
1.56
mi.
PR
-SS
-12-
1.66
mi.
PR
-SS
-10-
1.84
mi.
PR
-SS
-09-
1.93
mi.
PR
-SS
-07-
2.02
mi.
PR
-SS
-06-
2.08
mi.
PR
-SS
-05-
2.32
mi.
PR
-SS
-04-
2.52
mi.
PR
-SS
-03-
2.65
mi.
PR
-SS
-02-
2.76
mi.
PR
-SS
-01-
2.9
mi.
PR
-MR
-01-
4.28
mi.
PR
-MR
-02-
4.5
mi.
PR
-DP
-01-
6.75
mi.
Site ID and Distance downstream of STP (miles)
Mer
cury
(mg/
kg)
2010 Onsite Mercury(mg/kg)
2010 OffsiteMercury(mg/kg)
2010 OnsiteAverageMercury (0.74mg/kg)
2010 Offsite AverageMercury (0.20mg/kg) andManor RoadAverageMercury(0.27mg/kg)
Onsite Pre-cleanupAverage Mercury(4.60 mg/kg)
Offsite (1.79mg/kg) andManor Rd(1.08 mg/kg)Pre-cleanupAverageMercury

0.0
1.0
2.0
3.0
4.0
5.0
6.0
2006 2007 2008 2009 2010
Mercury (mg/kg)
Figure 2‐1a 2006‐2010 Peconic River Annual Average Sediment Mercury
Annual Onsite Average Annual Offsite Average
Pre‐Cleanup Onsite Average (4.6 mg/kg) Pre‐Cleanup Offsite Average (1.3 mg/kg)
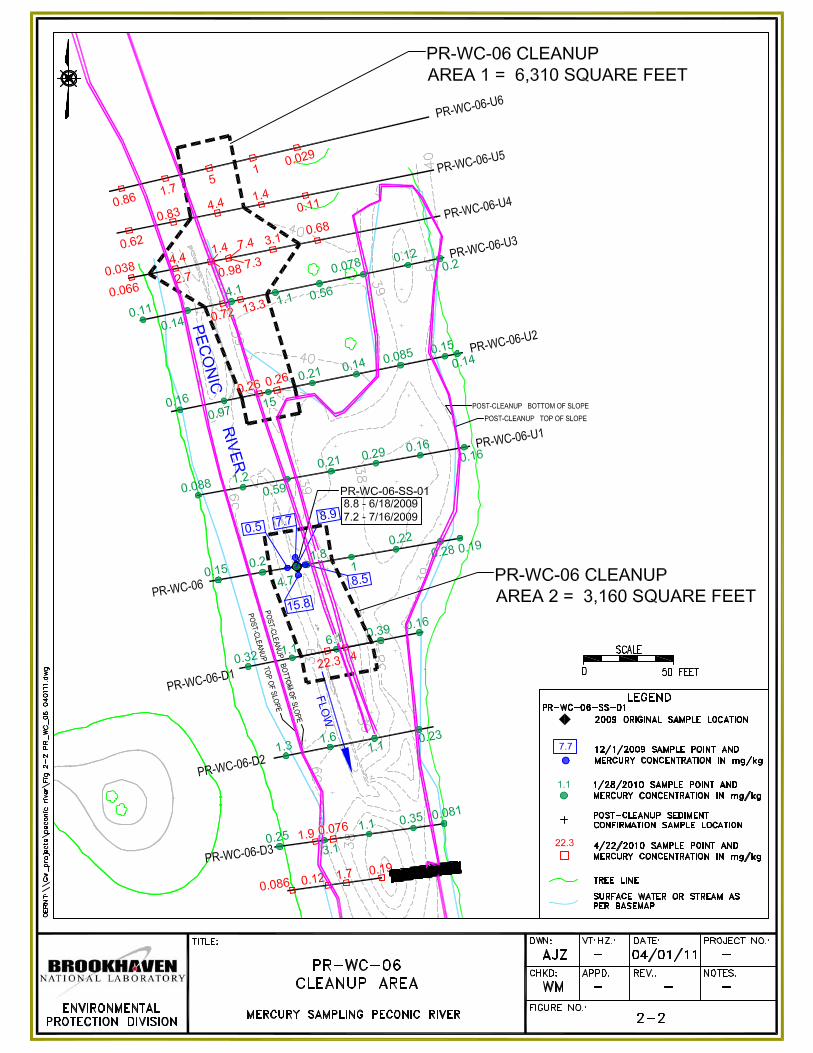
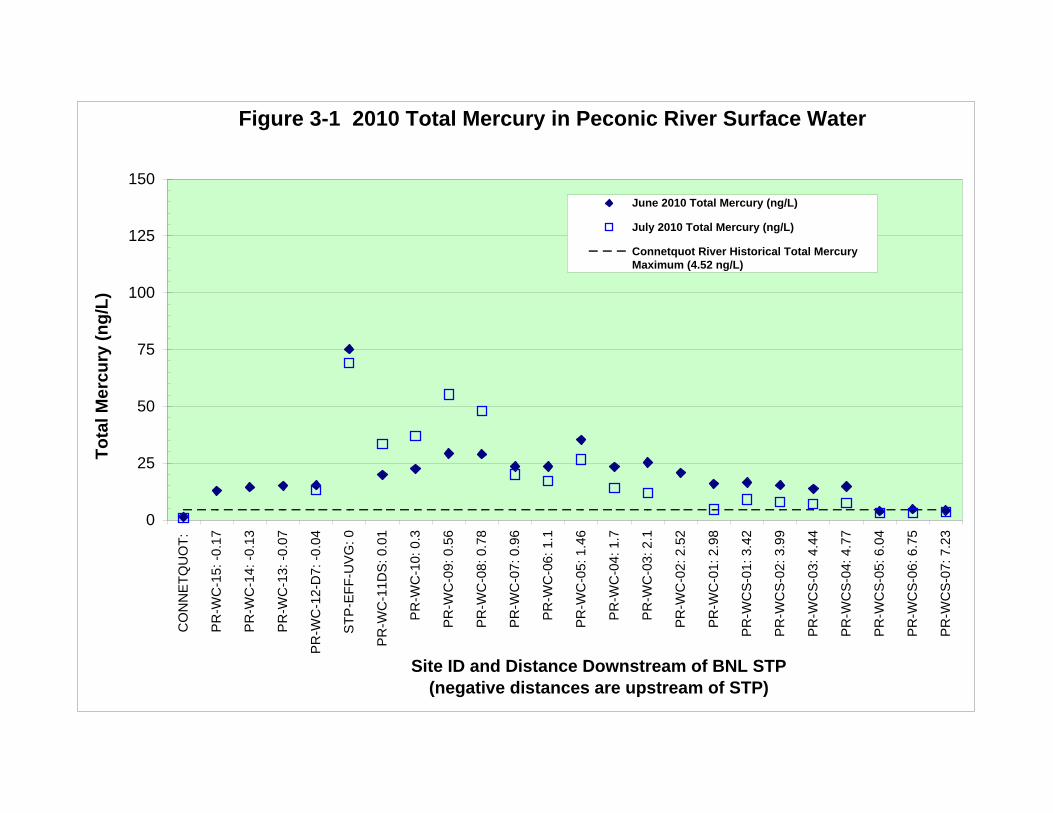
Figure 3-1 2010 Total Mercury in Peconic River Surface Water
0
25
50
75
100
125
150C
ON
NE
TQ
UO
T:
PR
-WC
-15:
-0.
17
PR
-WC
-14:
-0.
13
PR
-WC
-13:
-0.
07
PR
-WC
-12-
D7:
-0.
04
ST
P-E
FF
-UV
G: 0
PR
-WC
-11D
S: 0
.01
PR
-WC
-10:
0.3
PR
-WC
-09:
0.5
6
PR
-WC
-08:
0.7
8
PR
-WC
-07:
0.9
6
PR
-WC
-06:
1.1
PR
-WC
-05:
1.4
6
PR
-WC
-04:
1.7
PR
-WC
-03:
2.1
PR
-WC
-02:
2.5
2
PR
-WC
-01:
2.9
8
PR
-WC
S-0
1: 3
.42
PR
-WC
S-0
2: 3
.99
PR
-WC
S-0
3: 4
.44
PR
-WC
S-0
4: 4
.77
PR
-WC
S-0
5: 6
.04
PR
-WC
S-0
6: 6
.75
PR
-WC
S-0
7: 7
.23
Site ID and Distance Downstream of BNL STP (negative distances are upstream of STP)
Tota
l Mer
cury
(ng/
L)
June 2010 Total Mercury (ng/L)
July 2010 Total Mercury (ng/L)
Connetquot River Historical Total MercuryMaximum (4.52 ng/L)

Figure 3-2 2010 Total Suspended Solids (TSS) in Peconic River Surface Water
0
5
10
15
20
25
30
35
CONNETQUOT:
PR-WC-1
5: -0
.17
PR-WC-1
4: -0
.13
PR-WC-1
3: -0
.07
PR-WC-1
2-D7:
-0.0
4
STP-EFF-U
VG: 0
PR-WC-1
1DS: 0
.01
PR-WC-1
0: 0
.3
PR-WC-0
9: 0
.56
PR-WC-0
8: 0
.78
PR-WC-0
7: 0
.96
PR-WC-0
6: 1
.1
PR-WC-0
5: 1
.46
PR-WC-0
4: 1
.7
PR-WC-0
3: 2
.1
PR-WC-0
2: 2
.52
PR-WC-0
1: 2
.98
PR-WCS-0
1: 3
.42
PR-WCS-0
2: 3
.99
PR-WCS-0
3: 4
.44
PR-WCS-0
4: 4
.77
PR-WCS-0
5: 6
.04
PR-WCS-0
6: 6
.75
PR-WCS-0
7: 7
.23
Site ID and Distance Downstream of BNL STP (Negative distances are upstream of STP.
TSS non-detects are plotted as one half the detection limit. )
TSS
(mg/
L)
June TSS (mg/L)
July TSS (mg/L)
Connetquot River Historical Maximum TSS (24.3 mg/L)

Figure 3-3 2010 Methylmercury in Peconic River Surface Water
0
2
4
6
8
10
12
14C
ON
NE
TQ
UO
T:
PR
-WC
-15:
-0.
17
PR
-WC
-14:
-0.
13
PR
-WC
-13:
-0.
07
PR
-WC
-12-
D7:
-0.
04
ST
P-E
FF
-UV
G: 0
PR
-WC
-11D
S: 0
.01
PR
-WC
-10:
0.3
PR
-WC
-09:
0.5
6
PR
-WC
-08:
0.7
8
PR
-WC
-07:
0.9
6
PR
-WC
-06:
1.1
PR
-WC
-05:
1.4
6
PR
-WC
-04:
1.7
PR
-WC
-03:
2.1
PR
-WC
-02:
2.5
2
PR
-WC
-01:
2.9
8
PR
-WC
S-0
1: 3
.42
PR
-WC
S-0
2: 3
.99
PR
-WC
S-0
3: 4
.44
PR
-WC
S-0
4: 4
.77
PR
-WC
S-0
5: 6
.04
PR
-WC
S-0
6: 6
.75
PR
-WC
S-0
7: 7
.23
Site ID and Distance Downstream of BNL STP (negative distances are upstream of STP)
Met
hylm
ercu
ry (n
g/L)
June 2010 Methylmercury (ng/L)
July 2010 Methylmercury (ng/L)
Connetquot River Historical Maximum Methylmercury (0.89ng/L)
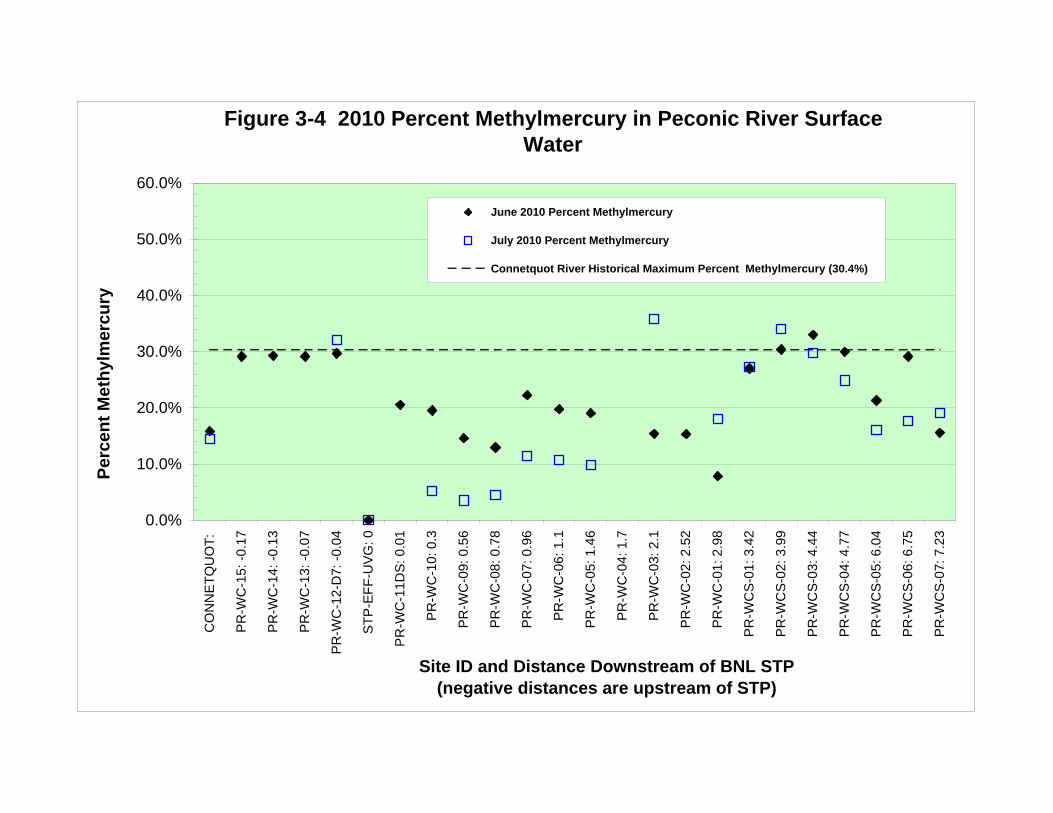
Figure 3-4 2010 Percent Methylmercury in Peconic River Surface Water
0.0%
10.0%
20.0%
30.0%
40.0%
50.0%
60.0%
CO
NN
ET
QU
OT
:
PR
-WC
-15:
-0.
17
PR
-WC
-14:
-0.
13
PR
-WC
-13:
-0.
07
PR
-WC
-12-
D7:
-0.
04
ST
P-E
FF
-UV
G: 0
PR
-WC
-11D
S: 0
.01
PR
-WC
-10:
0.3
PR
-WC
-09:
0.5
6
PR
-WC
-08:
0.7
8
PR
-WC
-07:
0.9
6
PR
-WC
-06:
1.1
PR
-WC
-05:
1.4
6
PR
-WC
-04:
1.7
PR
-WC
-03:
2.1
PR
-WC
-02:
2.5
2
PR
-WC
-01:
2.9
8
PR
-WC
S-0
1: 3
.42
PR
-WC
S-0
2: 3
.99
PR
-WC
S-0
3: 4
.44
PR
-WC
S-0
4: 4
.77
PR
-WC
S-0
5: 6
.04
PR
-WC
S-0
6: 6
.75
PR
-WC
S-0
7: 7
.23
Site ID and Distance Downstream of BNL STP (negative distances are upstream of STP)
Perc
ent M
ethy
lmer
cury
June 2010 Percent Methylmercury
July 2010 Percent Methylmercury
Connetquot River Historical Maximum Percent Methylmercury (30.4%)


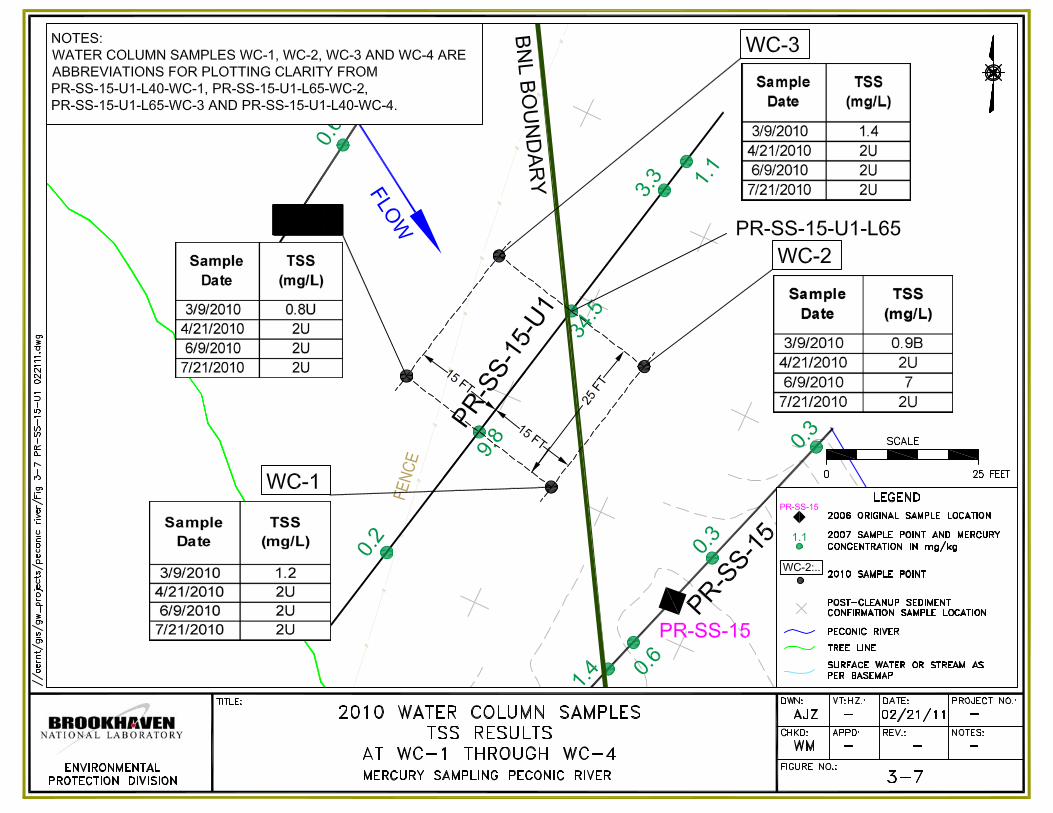

PR-SS-10 2006 7.1PR-SS-10 2007 1.6PR-SS-10 2008 1.8PR-SS-10 2009 1.7
PR-SS-10-O 2006 2.4
PR-SS-10-U 2006 2.7
PR-SS-10-D 2006 1.3
PR-SS-10-L 2006 0.9
PR-SS-10-R 2006 2
Sample Date
Total Mercury (ng/L)
3/9/2010 21.24/21/2010 166/9/2010 267/21/2010 12.3
Sample Date
Total Mercury (ng/L)
3/9/2010 21.34/21/2010 156/9/2010 27.37/21/2010 12.2
Sample Date
Total Mercury (ng/L)
3/9/2010 20.74/21/2010 166/9/2010 28.17/21/2010 16.9
Sample Date
Total Mercury (ng/L)
3/9/2010 21.14/21/2010 176/9/2010 32.87/21/2010 14

PR-SS-10 2006 7.1PR-SS-10 2007 1.6PR-SS-10 2008 1.8PR-SS-10 2009 1.7
PR-SS-10-O 2006 2.4
PR-SS-10-U 2006 2.7
PR-SS-10-D 2006 1.3
PR-SS-10-L 2006 0.9
PR-SS-10-R 2006 2
Sample Date
Methyl Mercury
(ng/L)3/9/2010 0.869
4/21/2010 0.6926/9/2010 3.92
7/21/2010 3.15
Sample Date
Methyl Mercury
(ng/L)3/9/2010 0.85
4/21/2010 0.2286/9/2010 4.076/9/2010 2.96
Sample Date
Methyl Mercury
(ng/L)3/9/2010 0.636
4/21/2010 0.9876/9/2010 4.536/9/2010 2.15
Sample Date
Methyl Mercury
(ng/L)3/9/2010 0.684
4/21/2010 1.056/9/2010 4.62
7/21/2010 2.55
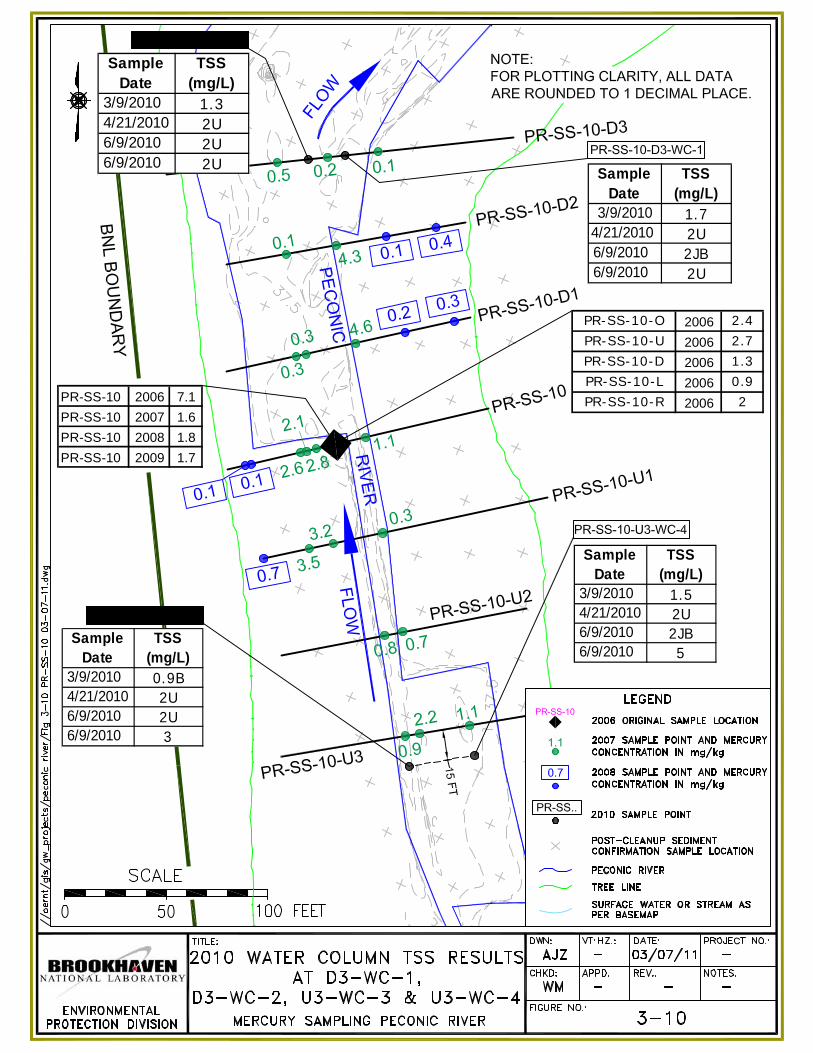
PR-SS-10 2006 7.1PR-SS-10 2007 1.6PR-SS-10 2008 1.8PR-SS-10 2009 1.7
PR-SS-10-O 2006 2.4
PR-SS-10-U 2006 2.7
PR-SS-10-D 2006 1.3
PR-SS-10-L 2006 0.9
PR-SS-10-R 2006 2
Sample Date
TSS (mg/L)
3/9/2010 1.74/21/2010 2U6/9/2010 2JB6/9/2010 2U
Sample Date
TSS (mg/L)
3/9/2010 1.34/21/2010 2U6/9/2010 2U6/9/2010 2U
Sample Date
TSS (mg/L)
3/9/2010 0.9B4/21/2010 2U6/9/2010 2U6/9/2010 3
Sample Date
TSS (mg/L)
3/9/2010 1.54/21/2010 2U6/9/2010 2JB6/9/2010 5
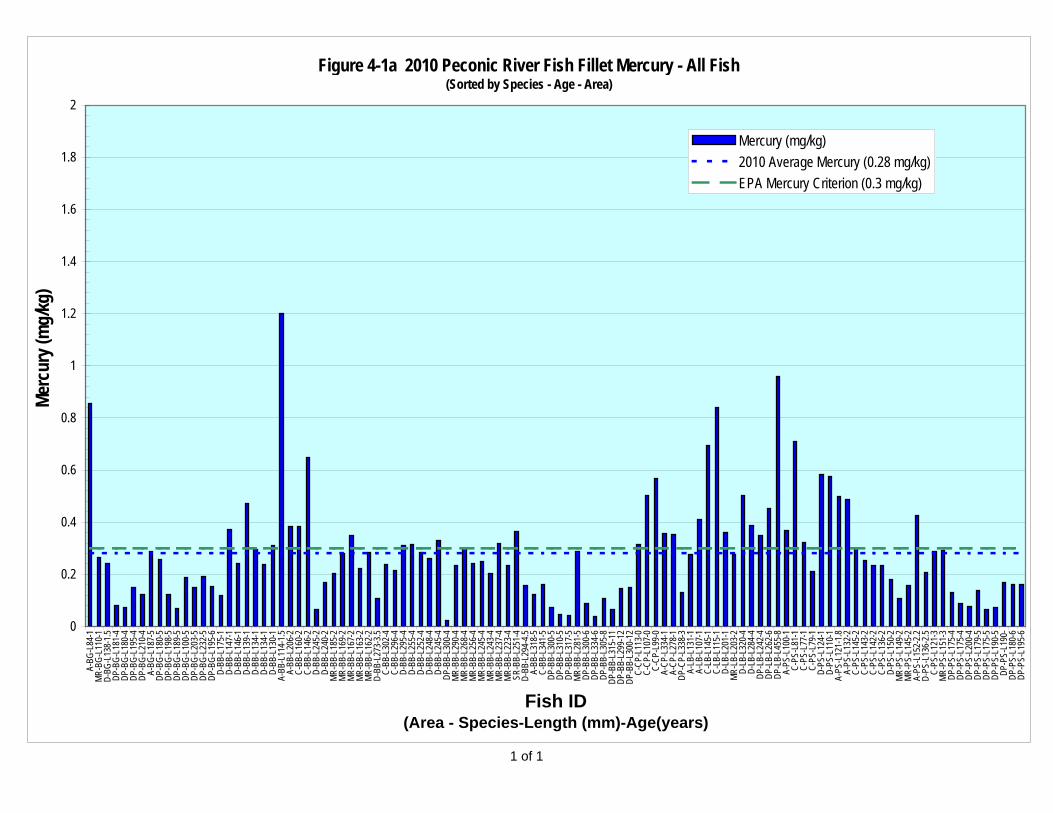
1 of 1
Figure 4-1a 2010 Peconic River Fish Fillet Mercury - All Fish (Sorted by Species - Age - Area)
0
0.2
0.4
0.6
0.8
1
1.2
1.4
1.6
1.8
2A-
BG-L
84-1
MR-B
G-L1
10-1
D-BG
-L13
8-1.5
DP-B
G-L1
81-4
DP-B
G-L1
80-4
DP-B
G-L1
95-4
DP-B
G-L2
10-4
A-BG
-L18
7-5
DP-B
G-L1
80-5
DP-B
G-L1
98-5
DP-B
G-L1
89-5
DP-B
G-L1
00-5
DP-B
G-L2
03-5
DP-B
G-L2
32-5
DP-B
G-L1
95-6
D-BB
-L17
5-1
D-BB
-L14
7-1
D-BB
-L14
6-1
D-BB
-L13
9-1
D-BB
-L13
4-1
D-BB
-L13
4-1
D-BB
-L13
0-1
A-BB
-L11
4-1.5
A-BB
-L20
6-2
C-BB
-L16
0-2
C-BB
-L14
6-2
D-BB
-L24
5-2
D-BB
-L24
0-2
MR-B
B-L1
85-2
MR-B
B-L1
69-2
MR-B
B-L1
67-2
MR-B
B-L1
63-2
MR-B
B-L1
62-2
D-BB
-L27
3-3.5
C-BB
-L30
2-4
C-BB
-L29
6-4
D-BB
-L29
5-4
D-BB
-L25
5-4
D-BB
-L25
2-4
D-BB
-L24
8-4
D-BB
-L24
5-4
DP-B
B-L3
00-4
MR-B
B-L2
90-4
MR-B
B-L2
68-4
MR-B
B-L2
56-4
MR-B
B-L2
45-4
MR-B
B-L2
43-4
MR-B
B-L2
37-4
MR-B
B-L2
23-4
SR-B
B-L2
51-4
D-BB
-L29
4-4.5
A-BB
-L31
8-5
C-BB
-L34
1-5
DP-B
B-L3
00-5
DP-B
B-L3
10-5
DP-B
B-L3
17-5
MR-B
B-L2
81-5
DP-B
B-L3
00-6
DP-B
B-L3
34-6
DP-B
B-L3
05-8
DP-B
B-L3
15-1
1DP
-BB-
L299
-12
DP-B
B-L3
00-1
2C-
CP-L
113-
0C-
CP-L
107-
0C-
CP-L
99-0
A-CP
-L33
4-1
A-CP
-L27
8-1
DP-C
P-L3
38-3
A-LB
-L13
1-1
A-LB
-L10
7-1
C-LB
-L14
5-1
C-LB
-L11
5-1
D-LB
-L20
1-1
MR-L
B-L2
03-2
D-LB
-L32
0-4
D-LB
-L28
4-4
DP-L
B-L2
42-4
DP-L
B-L2
62-6
DP-L
B-L4
55-8
A-PS
-L10
0-1
C-PS
-L81
-1C-
PS-L
77-1
C-PS
-L79
-1D-
PS-L
124-
1D-
PS-L
110-
1A-
PS-L
121-
1.8A-
PS-L
132-
2C-
PS-L
145-
2C-
PS-L
143-
2C-
PS-L
142-
2C-
PS-L
136-
2D-
PS-L
150-
2MR
-PS-
L149
-2MR
-PS-
L145
-2A-
PS-L
152-
2.2D-
PS-L
136-
2.5C-
PS-L
121-
3MR
-PS-
L151
-3DP
-PS-
L175
-4DP
-PS-
L175
-4DP
-PS-
L200
-4DP
-PS-
L179
-5DP
-PS-
L175
-5DP
-PS-
L190
-5DP
-PS-
L190
-DP
-PS-
L180
-6DP
-PS-
L195
-6
Fish ID (Area - Species-Length (mm)-Age(years)
Merc
ury (
mg/
kg)
Mercury (mg/kg)2010 Average Mercury (0.28 mg/kg)EPA Mercury Criterion (0.3 mg/kg)

1 of 1
Figure 4-1b 2010 Peconic River Fish Fillet Mercury - All Fish (Sorted by Species - Area - Age)
0
0.2
0.4
0.6
0.8
1
1.2
1.4
1.6
1.8
2A-
BG-L
84-1
A-BG
-L18
7-5
D-BG
-L13
8-1.5
DP-B
G-L1
81-4
DP-B
G-L1
80-4
DP-B
G-L1
95-4
DP-B
G-L2
10-4
DP-B
G-L1
80-5
DP-B
G-L1
98-5
DP-B
G-L1
89-5
DP-B
G-L1
00-5
DP-B
G-L2
03-5
DP-B
G-L2
32-5
DP-B
G-L1
95-6
MR-B
G-L1
10-1
A-BB
-L11
4-1.5
A-BB
-L20
6-2
A-BB
-L31
8-5
C-BB
-L16
0-2
C-BB
-L14
6-2
C-BB
-L30
2-4
C-BB
-L29
6-4
C-BB
-L34
1-5
D-BB
-L17
5-1
D-BB
-L14
7-1
D-BB
-L14
6-1
D-BB
-L13
9-1
D-BB
-L13
4-1
D-BB
-L13
4-1
D-BB
-L13
0-1
D-BB
-L24
5-2
D-BB
-L24
0-2
D-BB
-L27
3-3.5
D-BB
-L29
5-4
D-BB
-L25
5-4
D-BB
-L25
2-4
D-BB
-L24
8-4
D-BB
-L24
5-4
D-BB
-L29
4-4.5
DP-B
B-L3
00-4
DP-B
B-L3
00-5
DP-B
B-L3
10-5
DP-B
B-L3
17-5
DP-B
B-L3
00-6
DP-B
B-L3
34-6
DP-B
B-L3
05-8
DP-B
B-L3
15-1
1DP
-BB-
L299
-12
DP-B
B-L3
00-1
2MR
-BB-
L185
-2MR
-BB-
L169
-2MR
-BB-
L167
-2MR
-BB-
L163
-2MR
-BB-
L162
-2MR
-BB-
L290
-4MR
-BB-
L268
-4MR
-BB-
L256
-4MR
-BB-
L245
-4MR
-BB-
L243
-4MR
-BB-
L237
-4MR
-BB-
L223
-4MR
-BB-
L281
-5SR
-BB-
L251
-4A-
CP-L
334-
1A-
CP-L
278-
1C-
CP-L
113-
0C-
CP-L
107-
0C-
CP-L
99-0
DP-C
P-L3
38-3
A-LB
-L13
1-1
A-LB
-L10
7-1
C-LB
-L14
5-1
C-LB
-L11
5-1
D-LB
-L20
1-1
D-LB
-L32
0-4
D-LB
-L28
4-4
DP-L
B-L2
42-4
DP-L
B-L2
62-6
DP-L
B-L4
55-8
MR-L
B-L2
03-2
A-PS
-L10
0-1
A-PS
-L12
1-1.8
A-PS
-L13
2-2
A-PS
-L15
2-2.2
C-PS
-L81
-1C-
PS-L
77-1
C-PS
-L79
-1C-
PS-L
145-
2C-
PS-L
143-
2C-
PS-L
142-
2C-
PS-L
136-
2C-
PS-L
121-
3D-
PS-L
124-
1D-
PS-L
110-
1D-
PS-L
150-
2D-
PS-L
136-
2.5DP
-PS-
L175
-4DP
-PS-
L175
-4DP
-PS-
L200
-4DP
-PS-
L179
-5DP
-PS-
L175
-5DP
-PS-
L190
-5DP
-PS-
L190
-5.5
DP-P
S-L1
80-6
DP-P
S-L1
95-6
MR-P
S-L1
49-2
MR-P
S-L1
45-2
MR-P
S-L1
51-3
Fish ID (Area - Species-Length (mm)-Age(years)
Merc
ury (
mg/
kg)
Mercury (mg/kg)2010 Average Mercury (0.28 mg/kg)EPA Mercury Criterion (0.3 mg/kg)
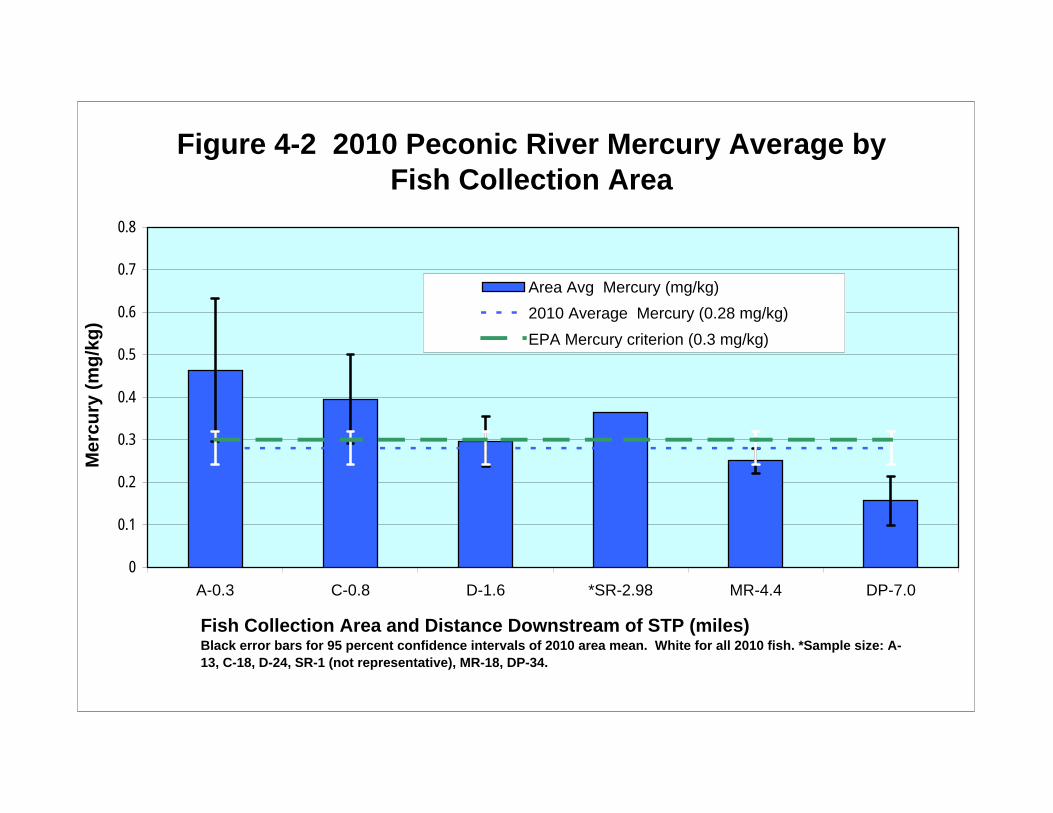
Figure 4-2 2010 Peconic River Mercury Average by Fish Collection Area
0
0.1
0.2
0.3
0.4
0.5
0.6
0.7
0.8
A-0.3 C-0.8 D-1.6 *SR-2.98 MR-4.4 DP-7.0
Fish Collection Area and Distance Downstream of STP (miles)Black error bars for 95 percent confidence intervals of 2010 area mean. White for all 2010 fish. *Sample size: A-13, C-18, D-24, SR-1 (not representative), MR-18, DP-34.
Mer
cury
(mg/
kg)
Area Avg Mercury (mg/kg)
2010 Average Mercury (0.28 mg/kg)
EPA Mercury criterion (0.3 mg/kg)

Figure 4-3a Mercury in Peconic River Bluegill Fillets
(Sorted by Age-Area-Length)
0
0.2
0.4
0.6
0.8
1
1.2
1.4
1.6
1.8
2
A-L=187-Age=5
A-L=84-Age=1
D-L=138-Age=1.5
MR-L=110-Age=1
DP-L=181-Age=4
DP-L=180-Age=5
DP-L=180-Age=4
DP-L=195-Age=6
DP-L=195-Age=4
DP-L=210-Age=4
DP-L=198-Age=5
DP-L=189-Age=5
DP-L=100-Age=5
DP-L=203-Age=5
DP-L=232-Age=5
Collection Area - Length (mm) - Age (years)
Merc
ury (
mg/
kg)
Mercury (mg/kg)2010 Species average (0.21 mg/kg)EPA Mercury Criterion (0.3 mg/kg)
Error bars represent the average mercury concentrataion plus and minus the 95% confidence limit. Sample size = 15.

Figure 4-4a Mercury in Peconic River Brown Bullhead Fillets
(Sorted by Age-Area-Length)
0
0.2
0.4
0.6
0.8
1
1.2
1.4
1.6
1.8
2
A-L=318
-Age=5
A-L=114
-Age=1.5
C-L=302
-Age=4
C-L=160
-Age=2
D-L=294
-Age=4.5
D-L=175
-Age=1
D-L=255
-Age=4
D-L=248
-Age=4
D-L=245
-Age=2
D-L=147
-Age=1
D-L=139
-Age=1
D-L=134
-Age=1
SR-L=251
-Age=4
MR-L=281
-Age=5
MR-L=256
-Age=4
MR-L=243
-Age=4
MR-L=223
-Age=4
MR-L=169
-Age=2
MR-L=163
-Age=2
DP-L=299
-Age=12
DP-L=300
-Age=4
DP-L=310
-Age=5
DP-L=317
-Age=5
DP-L=315
-Age=11
Collection Area - Length (mm) - Age (years)
Merc
ury (
mg/
kg)
Mercury (mg/kg)2010 species sverage (0.25 mg/kg)EPA Mercury Criterion (0.3 mg/kg)
Error bars represent the average mercury concentrataion plus and minus the 95% confidence limit. Sample size = 48.

Figure 4-5a Mercury in Peconic River Chain Pickerel Fillets
(Sorted by Age-Area-Length)
0
0.2
0.4
0.6
0.8
1
1.2
1.4
1.6
1.8
2
A-L=334-Age=1 A-L=278-Age=1 C-L=113-Age=0 C-L=107-Age=0 C-L=99-Age=0 DP-L=338-Age=3
Collection Area - Length (mm) - Age (years)
Merc
ury (
mg/
kg)
Mercury (mg/kg)2010 Species Average (0.37 mg/kg)EPA Mercury Criterion (0.3 mg/kg)
Error bars represent the average mercury concentrataion plus and minus the 95% confidence limit. Sample size = 6.

Figure 4-6a Mercury in Peconic River Largemouth Bass Fillets
(Sorted by Age-Area-Length)
0
0.2
0.4
0.6
0.8
1
1.2
1.4
1.6
1.8
2
A-L=131-Age=1
A-L=107-Age=1
C-L=145-Age=1
C-L=115-Age=1
D-L=320-Age=4
D-L=201-Age=1
D-L=284-Age=4
MR-L=203-Age=2
DP-L=242-Age=4
DP-L=262-Age=6
DP-L=455-Age=8
Collection Area - Length (mm) - Age (years)
Merc
ury (
mg/
kg)
Mercury (mg/kg)2010 Species Average (0.50 mg/kg)EPA Mercury Criterion (0.3 mg/kg)
Error bars represent the average mercury concentrataion plus and minus the 95% confidence limit. Sample size = 10.

Figure 4-7a Mercury in Peconic River Pumpkinseed Fillets
(Sorted by Age-Area-Length)
0
0.2
0.4
0.6
0.8
1
1.2
1.4
1.6
1.8
2
A-L=152
-Age=2.2
A-L=132
-Age=2
A-L=121
-Age=1.8
A-L=100
-Age=1
C-L=145
-Age=2
C-L=143
-Age=2
C-L=142
-Age=2
C-L=136
-Age=2
C-L=121
-Age=3
C-L=81-
Age=1
C-L=77-
Age=1
C-L=79-
Age=1
D-L=136
-Age=2.5
D-L=150
-Age=2
D-L=124
-Age=1
D-L=110
-Age=1
MR-L=151
-Age=3
MR-L=149
-Age=2
MR-L=145
-Age=2
DP-L=175
-Age=4
DP-L=180
-Age=6
DP-L=179
-Age=5
DP-L=175
-Age=4
DP-L=175
-Age=5
DP-L=190
-Age=5.5
DP-L=190
-Age=5
DP-L=195
-Age=6
DP-L=200
-Age=4
Collection Area - Length (mm) - Age (years)
Merc
ury (
mg/
kg)
Mercury (mg/kg)2010 Species Average (0.27 mg/kg)EPA Mercury Criterion (0.3 mg/kg)
Error bars represent the average mercury concentrataion plus and minus the 95% confidence limit. Sample size = 28.
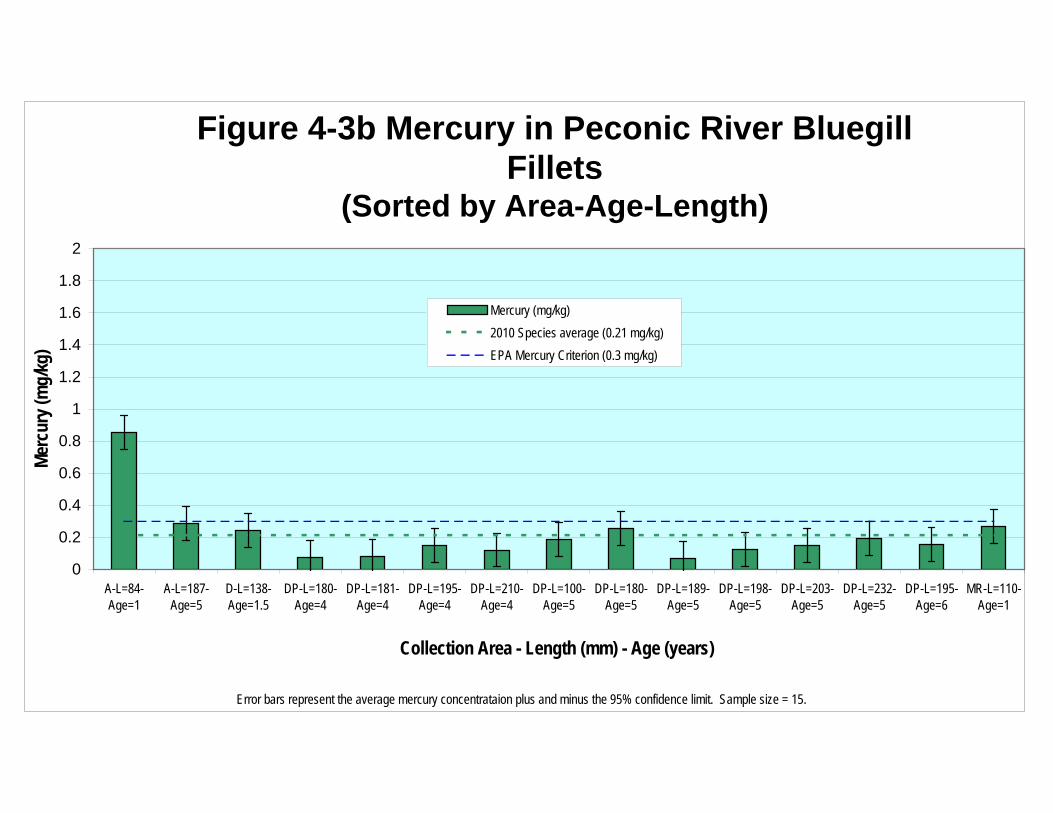
Figure 4-3b Mercury in Peconic River Bluegill Fillets
(Sorted by Area-Age-Length)
0
0.2
0.4
0.6
0.8
1
1.2
1.4
1.6
1.8
2
A-L=84-Age=1
A-L=187-Age=5
D-L=138-Age=1.5
DP-L=180-Age=4
DP-L=181-Age=4
DP-L=195-Age=4
DP-L=210-Age=4
DP-L=100-Age=5
DP-L=180-Age=5
DP-L=189-Age=5
DP-L=198-Age=5
DP-L=203-Age=5
DP-L=232-Age=5
DP-L=195-Age=6
MR-L=110-Age=1
Collection Area - Length (mm) - Age (years)
Merc
ury (
mg/
kg)
Mercury (mg/kg)2010 Species average (0.21 mg/kg)EPA Mercury Criterion (0.3 mg/kg)
Error bars represent the average mercury concentrataion plus and minus the 95% confidence limit. Sample size = 15.
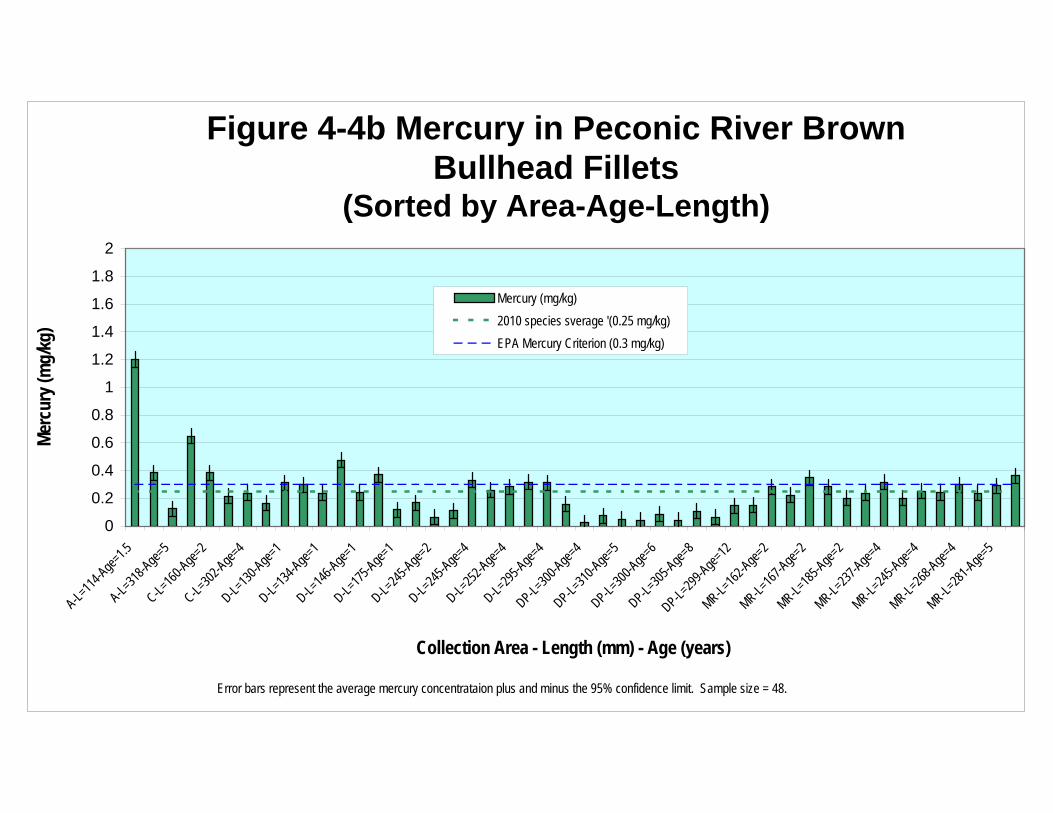
Figure 4-4b Mercury in Peconic River Brown Bullhead Fillets
(Sorted by Area-Age-Length)
0
0.2
0.4
0.6
0.8
1
1.2
1.4
1.6
1.8
2
A-L=114
-Age=1.5
A-L=318
-Age=5
C-L=160
-Age=2
C-L=302
-Age=4
D-L=130
-Age=1
D-L=134
-Age=1
D-L=146
-Age=1
D-L=175
-Age=1
D-L=245
-Age=2
D-L=245
-Age=4
D-L=252
-Age=4
D-L=295
-Age=4
DP-L=300
-Age=4
DP-L=310
-Age=5
DP-L=300
-Age=6
DP-L=305
-Age=8
DP-L=299
-Age=12
MR-L=162
-Age=2
MR-L=167
-Age=2
MR-L=185
-Age=2
MR-L=237
-Age=4
MR-L=245
-Age=4
MR-L=268
-Age=4
MR-L=281
-Age=5
Collection Area - Length (mm) - Age (years)
Merc
ury (
mg/
kg)
Mercury (mg/kg)2010 species sverage '(0.25 mg/kg)EPA Mercury Criterion (0.3 mg/kg)
Error bars represent the average mercury concentrataion plus and minus the 95% confidence limit. Sample size = 48.

Figure 4-5b Mercury in Peconic River Chain Pickerel Fillets
(Sorted by Area-Age-Length)
0
0.2
0.4
0.6
0.8
1
1.2
1.4
1.6
1.8
2
A-L=278-Age=1 A-L=334-Age=1 C-L=99-Age=0 C-L=107-Age=0 C-L=113-Age=0 DP-L=338-Age=3
Collection Area - Length (mm) - Age (years)
Merc
ury (
mg/
kg)
Mercury (mg/kg)2010 Species Average (0.37 mg/kg)EPA Mercury Criterion (0.3 mg/kg)
Error bars represent the average mercury concentrataion plus and minus the 95% confidence limit. Sample size = 6.
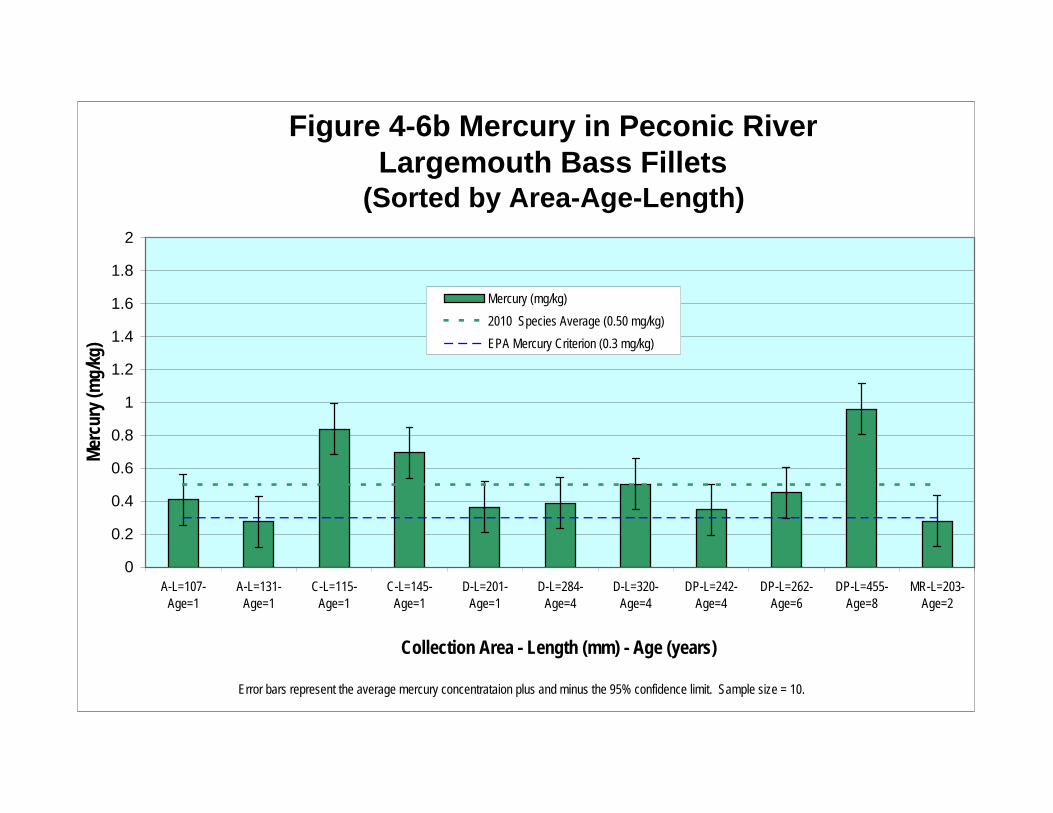
Figure 4-6b Mercury in Peconic River Largemouth Bass Fillets
(Sorted by Area-Age-Length)
0
0.2
0.4
0.6
0.8
1
1.2
1.4
1.6
1.8
2
A-L=107-Age=1
A-L=131-Age=1
C-L=115-Age=1
C-L=145-Age=1
D-L=201-Age=1
D-L=284-Age=4
D-L=320-Age=4
DP-L=242-Age=4
DP-L=262-Age=6
DP-L=455-Age=8
MR-L=203-Age=2
Collection Area - Length (mm) - Age (years)
Merc
ury (
mg/
kg)
Mercury (mg/kg)2010 Species Average (0.50 mg/kg)EPA Mercury Criterion (0.3 mg/kg)
Error bars represent the average mercury concentrataion plus and minus the 95% confidence limit. Sample size = 10.
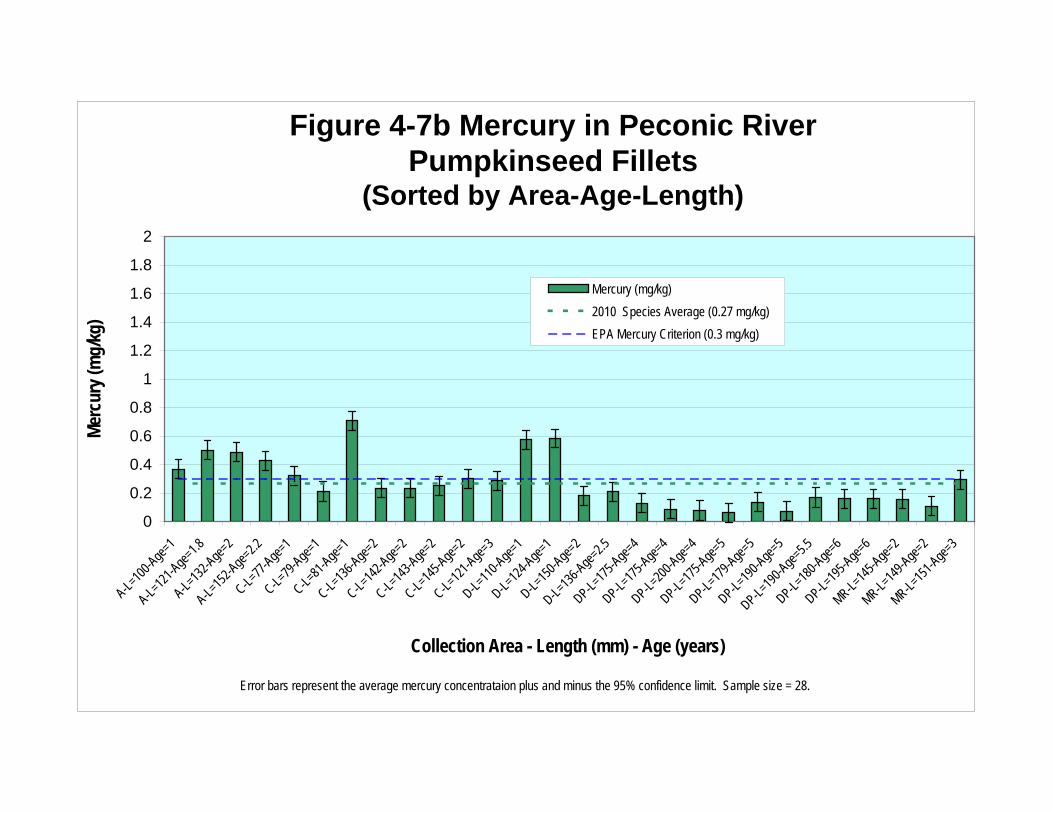
Figure 4-7b Mercury in Peconic River Pumpkinseed Fillets
(Sorted by Area-Age-Length)
0
0.2
0.4
0.6
0.8
1
1.2
1.4
1.6
1.8
2
A-L=100
-Age=1
A-L=121
-Age=1.8
A-L=132
-Age=2
A-L=152
-Age=2.2
C-L=77-
Age=1
C-L=79-
Age=1
C-L=81-
Age=1
C-L=136
-Age=2
C-L=142
-Age=2
C-L=143
-Age=2
C-L=145
-Age=2
C-L=121
-Age=3
D-L=110
-Age=1
D-L=124
-Age=1
D-L=150
-Age=2
D-L=136
-Age=2.5
DP-L=175
-Age=4
DP-L=175
-Age=4
DP-L=200
-Age=4
DP-L=175
-Age=5
DP-L=179
-Age=5
DP-L=190
-Age=5
DP-L=190
-Age=5.5
DP-L=180
-Age=6
DP-L=195
-Age=6
MR-L=145
-Age=2
MR-L=149
-Age=2
MR-L=151
-Age=3
Collection Area - Length (mm) - Age (years)
Merc
ury (
mg/
kg)
Mercury (mg/kg)2010 Species Average (0.27 mg/kg)EPA Mercury Criterion (0.3 mg/kg)
Error bars represent the average mercury concentrataion plus and minus the 95% confidence limit. Sample size = 28.

0
20
40
60
80
100
12010
16-D
-BB
-Age
=4.5
1016
-C-B
B-A
ge=5
1016
-D-L
B-A
ge=4
1016
-A-P
S-A
ge=2
.212
21-D
-BB
-Age
=4.5
1221
-C-B
B-A
ge=5
1221
-D-L
B-A
ge=4
1221
-A-P
S-A
ge=2
.212
32-D
-BB
-Age
=4.5
1232
-C-B
B-A
ge=5
1232
-D-L
B-A
ge=4
1232
-A-P
S-A
ge=2
.212
42-D
-BB
-Age
=4.5
1242
-C-B
B-A
ge=5
1242
-D-L
B-A
ge=4
1242
-A-P
S-A
ge=2
.212
48-D
-BB
-Age
=4.5
1248
-C-B
B-A
ge=5
1248
-D-L
B-A
ge=4
1248
-A-P
S-A
ge=2
.212
54-D
-BB
-Age
=4.5
1254
-C-B
B-A
ge=5
1254
-D-L
B-A
ge=4
1254
-A-P
S-A
ge=2
.212
60-D
-BB
-Age
=4.5
1260
-C-B
B-A
ge=5
1260
-D-L
B-A
ge=4
1260
-A-P
S-A
ge=2
.2
Con
cent
ratio
n (u
g/kg
)
Aroclor - Area - Species - Age (years)
Figure 4-8 2010 PCBs in Fish (Sorted by Aroclor-Species - Age)
Conc. (ug/kg)
Method Detection Limit (ug/kg)
(First four digits identify specific Aroclor Congener, eg 1016 =Aroclor 1016)J indicates an estimated value less than the Method detection Limit (MDL).
J

Figure 4-9 Cesium-137 Activity in Fish (Sorted by Species - Area - Age)
0.0
0.1
0.2
0.3
0.4
0.5
0.6
0.7
0.8
0.9
1.0A
-BB
-Age
=5
A-B
B-A
ge=
2C
-BB
-Age
=5
C-B
B-A
ge=
4C
-BB
-Age
=4
D-B
B-A
ge=
4.5
D-B
B-A
ge=
3.5
D-B
B-A
ge=
4D
-BB
-Age
=4
D-B
B-A
ge=
4D
-BB
-Age
=4
D-B
B-A
ge=
4D
-BB
-Age
=2
D-B
B-A
ge=
2S
R-B
B-A
ge=
4M
R-B
B-A
ge=
4M
R-B
B-A
ge=
5M
R-B
B-A
ge=
4M
R-B
B-A
ge=
4M
R-B
B-A
ge=
4M
R-B
B-A
ge=
4M
R-B
B-A
ge=
4M
R-B
B-A
ge=
4M
R-B
B-A
ge=
2D
P-B
B-A
ge=
12D
P-B
B-A
ge=
6D
P-B
B-A
ge=
4D
P-B
B-A
ge=
5D
P-B
B-A
ge=
5D
P-B
B-A
ge=
12D
P-B
B-A
ge=
5D
P-B
B-A
ge=
8D
P-B
B-A
ge=
11D
P-B
B-A
ge=
6A
-CP
-Age
=1
A-C
P-A
ge=
1D
P-C
P-A
ge=
3D
-LB
-Age
=4
D-L
B-A
ge=
4D
P-L
B-A
ge=
4D
P-L
B-A
ge=
6D
P-L
B-A
ge=
8A
-PS
-Age
=2.
2A
-PS
-Age
=2
A-P
S-A
ge=
1.8
D-P
S-A
ge=
2.5
DP
-PS
-Age
=4
DP
-PS
-Age
=6
DP
-PS
-Age
=5
DP
-PS
-Age
=5 .
5D
P-P
S-A
ge=
6D
P-P
S-A
ge=
4A
-BG
-Age
=5
D-B
G-A
ge=
1.5
DP
-BG
-Age
=4
DP
-BG
-Age
=4
DP
-BG
-Age
=4
DP
-BG
-Age
=5
DP
-BG
-Age
=5
DP
-BG
-Age
=5
DP
-BG
-Age
=5
DP
-BG
-Age
=5
Area - Species - Age (years) (Error bars represent analytical uncertainty)
Ces
ium
-137
act
ivity
(pC
i/g)
Cesium-137 Activity (pCi/g)
Cesium-137 Reporting Limit (pCi/g)
2010 Average Cesium-137 Activity (0.11(pCi/g)

0.0
0.1
0.2
0.3
0.4
0.5
0.6
0.7
1996 1997 2001 2006 2007 2008 2009 2010
Mean M
ercury (mg/kg)
Pre‐Cleanup (1996, 1997, 2001) and Post ‐Cleanup (2006‐2010 ) Mercury Concentration MeansError bars represent the 95 percent confidence intervals
Figure 4‐10a Pre‐Cleanup and Post‐Cleanup Fish Mercury (1996‐2010)
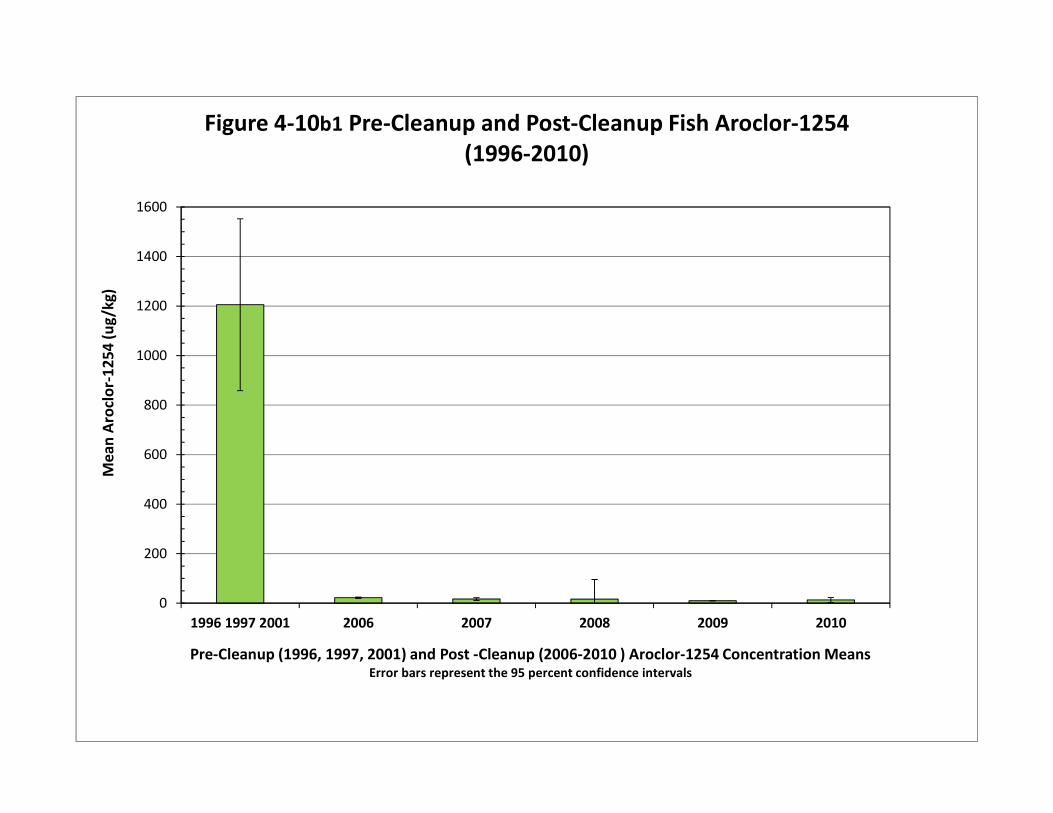
0
200
400
600
800
1000
1200
1400
1600
1996 1997 2001 2006 2007 2008 2009 2010
Mean Aroclor‐1254
(ug/kg)
Pre‐Cleanup (1996, 1997, 2001) and Post ‐Cleanup (2006‐2010 ) Aroclor‐1254 Concentration MeansError bars represent the 95 percent confidence intervals
Figure 4‐10b1 Pre‐Cleanup and Post‐Cleanup Fish Aroclor‐1254 (1996‐2010)
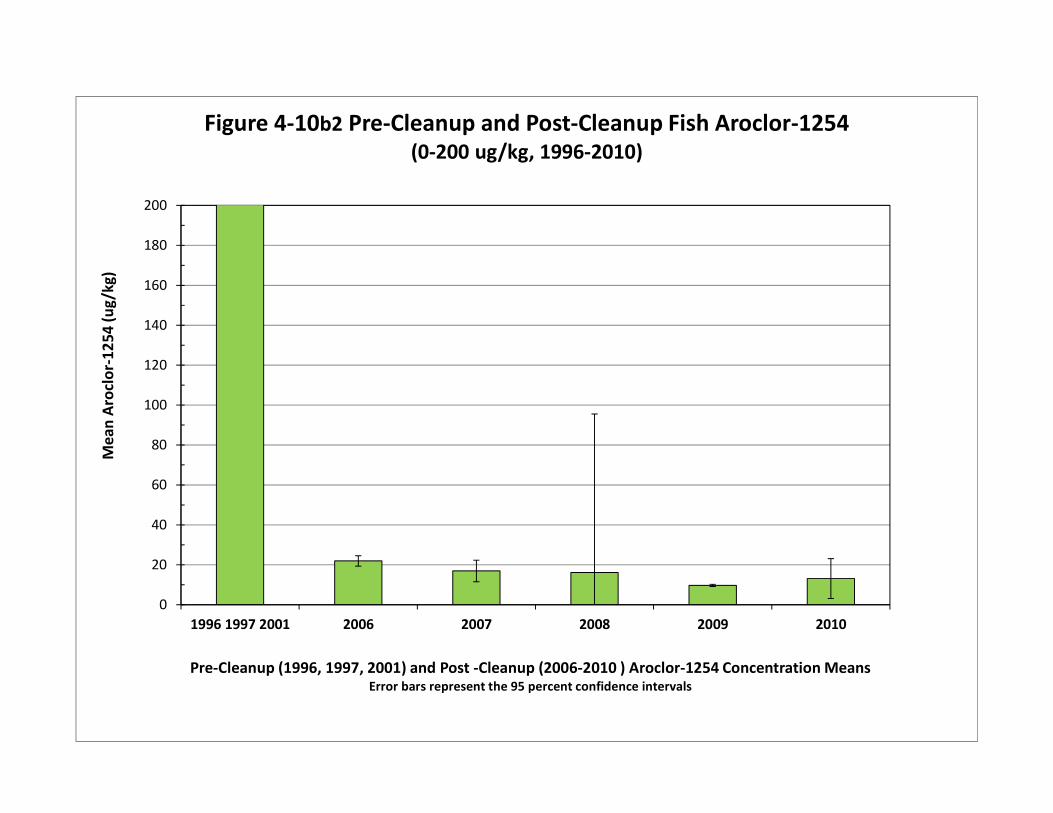
0
20
40
60
80
100
120
140
160
180
200
1996 1997 2001 2006 2007 2008 2009 2010
Mean Aroclor‐1254
(ug/kg)
Pre‐Cleanup (1996, 1997, 2001) and Post ‐Cleanup (2006‐2010 ) Aroclor‐1254 Concentration MeansError bars represent the 95 percent confidence intervals
Figure 4‐10b2 Pre‐Cleanup and Post‐Cleanup Fish Aroclor‐1254 (0‐200 ug/kg, 1996‐2010)

0.00
0.25
0.50
0.75
1.00
1.25
1.50
1.75
2.00
1996 1997 2006 2007 2008 2009 2010
Mean Cesium‐137 pCi/g)
Pre‐Cleanup (1996, 1997, 2001) and Post ‐Cleanup (2006‐2010 ) Cesium‐137 Activity MeansError bars represent the 95 percent confidence intervals
Figure 4‐10c Pre‐Cleanup and Post‐Cleanup Fish Cesium‐137 (1996‐2010)

Attachment 1 contains the following excerpts from the Five-Year Review Report for Brookhaven National Laboratory Superfund Site, Hamlet of Upton, Suffolk County, New York, March 31, 2011.
Excerpt from Section 6.4, Sub-Section 6.4.5 Operable Unit V, 2006-2010 Peconic River data summary, pages 44-46, including Table 6-3.
o Figure 6-12, the locations of the PR-WC-06, Sediment Trap and PR-SS-15 sediment removal areas
o Figure 6-13, 2006-2010 Peconic River and Connetquot River and 2007-2010 STP Mercury Concentrations (0-200ng/L)
o Figure 6-14, 2006-2010 Peconic River Average Fish Mercury Concentrations
Excerpt from Section 7.5 Operable Unit V Opportunities for Monitoring Optimization, pages 67-72, including Tables 7-1, 7-2 and 7-3.
o Figure 7-1 2006-2010 Sediment Mercury Data at or Within Five Feet of PR-SS-10


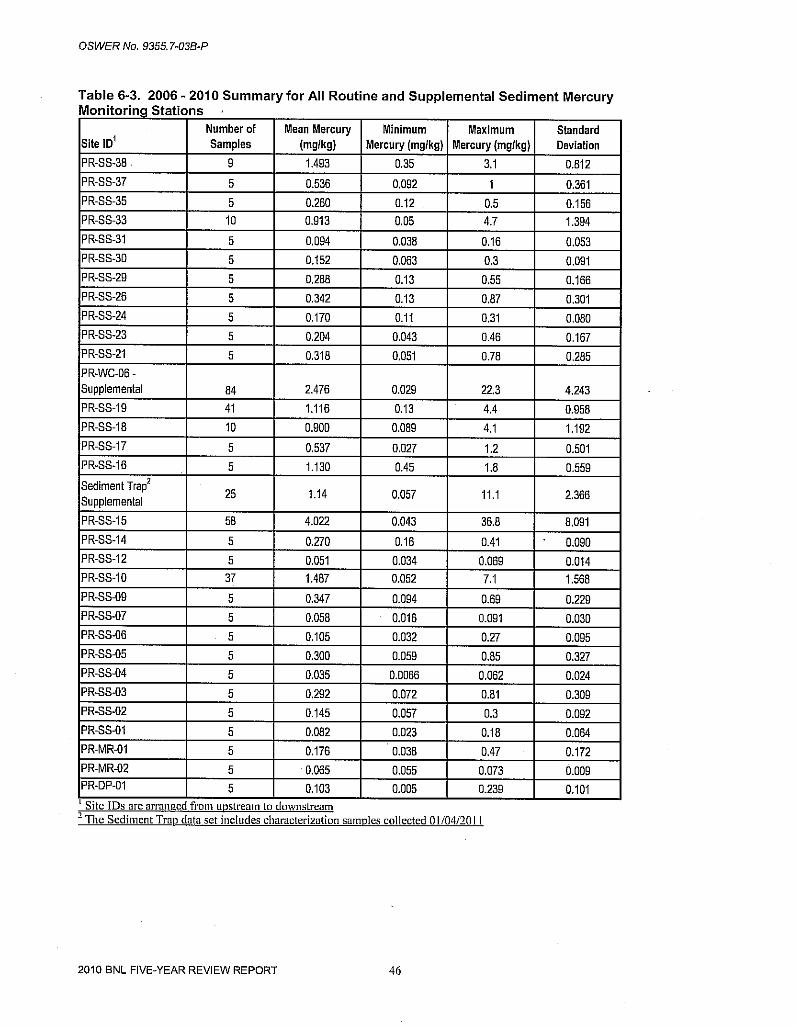


0
20
40
60
80
100
120
140
160
180
200
CO
NN
ET
QU
OT
CO
NN
ET
QU
OT
PR
-WC
-15
PR
-WC
-14
PR
-WC
-12D
S
PR
-WC
-12
ST
P-E
FF
-UV
G
PR
-WC
-11D
S
PR
-WC
-10P
PR
-WC
-10
PR
-WC
-09
PR
-WC
-08
PR
-WC
-08
PR
-WC
-07
PR
-WC
-07
PR
-WC
-06
PR
-WC
-05
PR
-WC
-05
PR
-WC
-03P
PR
-WC
-03
PR
-WC
-02
PR
-WC
-01
PR
-WC
-01
PR
-WC
S-0
1
PR
-WC
S-0
2
PR
-WC
S-0
2
PR
-WC
S-0
3
PR
-WC
S-0
3
PR
-WC
S-0
4
PR
-WC
S-0
4
PR
-WC
S-0
5
PR
-WC
S-0
6
PR
-WC
S-0
6
PR
-WC
S-0
7
Tota
l Mer
cury
(ng/
L)
StationTwo values at PR-WC-06 and one value at PR-WC-03 are beyond the scale of this figure,
876 ng/L, 1,360 ng/L and 374 ng/L, respectively.
Figure 6-13 2006 - 2010 Peconic River and Connetquot River and 2007 - 2010 STP Mercury
Concentrations (0 - 200 ng/L)
Maximum Connetquot River Mercury (4.52 ng/L)
STP 2007-2010 Mercury (ng/L)
Peconic River 2006-2010 Mercury (ng/L)
Connetquot River 2006-2010 Mercury (ng/L)

Figure 6-14 2006 - 2010 Peconic River Average Fish Mercury Concentrations
0.280.270.270.260.310.30
0
0.2
0.4
0.6
0.8
1
2006 2007 2008 2009 2010 All 2006-2010Year
Mer
cury
(mg/
kg)
Annual Mean Fish Mercury (mg/kg)EPA Mercury Criterion (0.3 mg/kg)Pre-cleanup 1996 and 2001 Mean Fish Mercury (0.58 mg/kg)
Error bars represent the mean plus and minus the 95 percent confidence limits


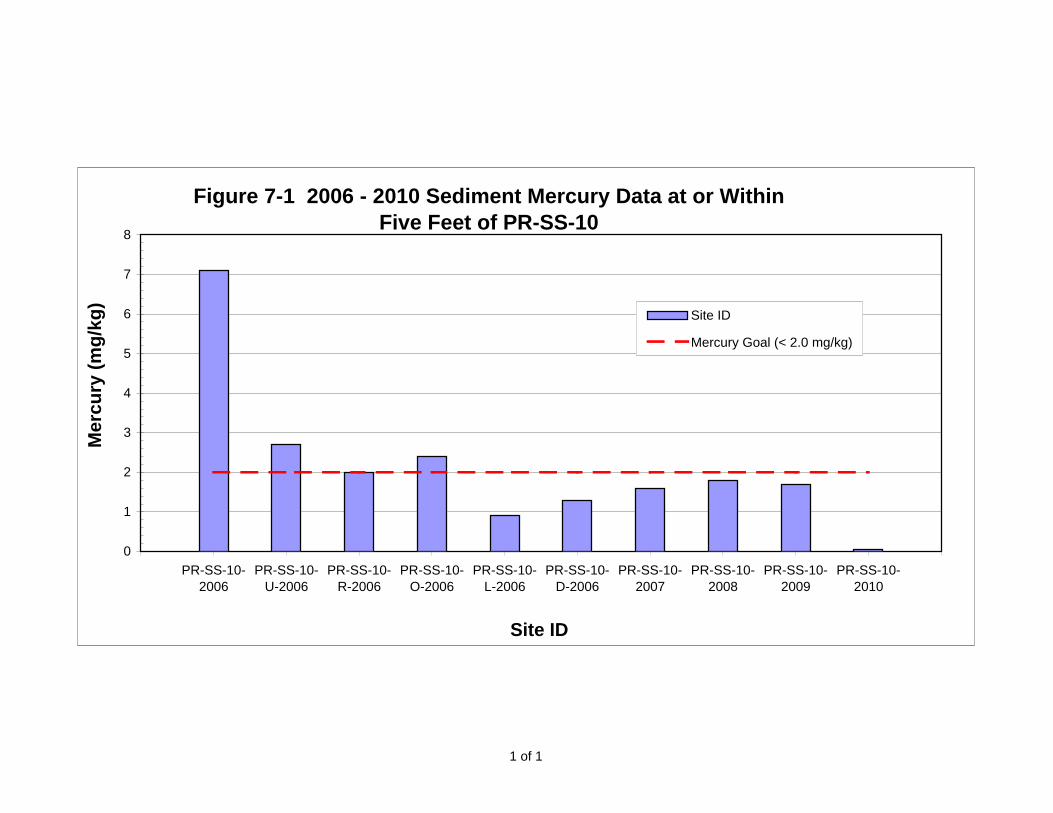
1 of 1
Figure 7-1 2006 - 2010 Sediment Mercury Data at or WithinFive Feet of PR-SS-10
0
1
2
3
4
5
6
7
8
PR-SS-10-2006
PR-SS-10-U-2006
PR-SS-10-R-2006
PR-SS-10-O-2006
PR-SS-10-L-2006
PR-SS-10-D-2006
PR-SS-10-2007
PR-SS-10-2008
PR-SS-10-2009
PR-SS-10-2010
Site ID
Mer
cury
(mg/
kg)
Site ID
Mercury Goal (< 2.0 mg/kg)
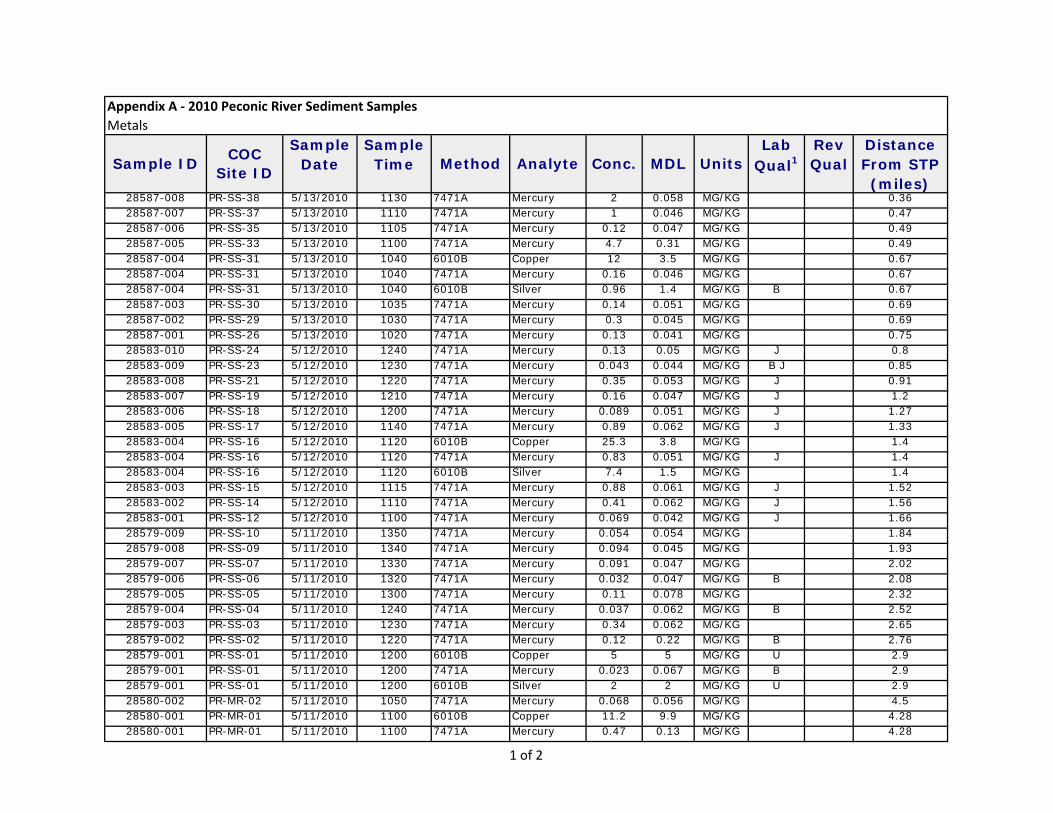
Sample Sample Lab Rev DistanceDate Time Qual1 Qual From STP
(miles)28587-008 PR-SS-38 5/13/2010 1130 7471A Mercury 2 0.058 MG/KG 0.3628587-007 PR-SS-37 5/13/2010 1110 7471A Mercury 1 0.046 MG/KG 0.4728587-006 PR-SS-35 5/13/2010 1105 7471A Mercury 0.12 0.047 MG/KG 0.4928587-005 PR-SS-33 5/13/2010 1100 7471A Mercury 4.7 0.31 MG/KG 0.4928587-004 PR-SS-31 5/13/2010 1040 6010B Copper 12 3.5 MG/KG 0.6728587-004 PR-SS-31 5/13/2010 1040 7471A Mercury 0.16 0.046 MG/KG 0.6728587-004 PR-SS-31 5/13/2010 1040 6010B Silver 0.96 1.4 MG/KG B 0.6728587-003 PR-SS-30 5/13/2010 1035 7471A Mercury 0.14 0.051 MG/KG 0.6928587-002 PR-SS-29 5/13/2010 1030 7471A Mercury 0.3 0.045 MG/KG 0.6928587-001 PR-SS-26 5/13/2010 1020 7471A Mercury 0.13 0.041 MG/KG 0.7528583-010 PR-SS-24 5/12/2010 1240 7471A Mercury 0.13 0.05 MG/KG J 0.828583-009 PR-SS-23 5/12/2010 1230 7471A Mercury 0.043 0.044 MG/KG B J 0.8528583-008 PR-SS-21 5/12/2010 1220 7471A Mercury 0.35 0.053 MG/KG J 0.9128583-007 PR-SS-19 5/12/2010 1210 7471A Mercury 0.16 0.047 MG/KG J 1.228583-006 PR-SS-18 5/12/2010 1200 7471A Mercury 0.089 0.051 MG/KG J 1.2728583-005 PR-SS-17 5/12/2010 1140 7471A Mercury 0.89 0.062 MG/KG J 1.3328583-004 PR-SS-16 5/12/2010 1120 6010B Copper 25.3 3.8 MG/KG 1.428583-004 PR-SS-16 5/12/2010 1120 7471A Mercury 0.83 0.051 MG/KG J 1.428583-004 PR-SS-16 5/12/2010 1120 6010B Silver 7.4 1.5 MG/KG 1.428583-003 PR-SS-15 5/12/2010 1115 7471A Mercury 0.88 0.061 MG/KG J 1.5228583-002 PR-SS-14 5/12/2010 1110 7471A Mercury 0.41 0.062 MG/KG J 1.5628583-001 PR-SS-12 5/12/2010 1100 7471A Mercury 0.069 0.042 MG/KG J 1.6628579-009 PR-SS-10 5/11/2010 1350 7471A Mercury 0.054 0.054 MG/KG 1.8428579-008 PR-SS-09 5/11/2010 1340 7471A Mercury 0.094 0.045 MG/KG 1.9328579-007 PR-SS-07 5/11/2010 1330 7471A Mercury 0.091 0.047 MG/KG 2.0228579-006 PR-SS-06 5/11/2010 1320 7471A Mercury 0.032 0.047 MG/KG B 2.0828579-005 PR-SS-05 5/11/2010 1300 7471A Mercury 0.11 0.078 MG/KG 2.3228579-004 PR-SS-04 5/11/2010 1240 7471A Mercury 0.037 0.062 MG/KG B 2.5228579-003 PR-SS-03 5/11/2010 1230 7471A Mercury 0.34 0.062 MG/KG 2.6528579-002 PR-SS-02 5/11/2010 1220 7471A Mercury 0.12 0.22 MG/KG B 2.7628579-001 PR-SS-01 5/11/2010 1200 6010B Copper 5 5 MG/KG U 2.928579-001 PR-SS-01 5/11/2010 1200 7471A Mercury 0.023 0.067 MG/KG B 2.928579-001 PR-SS-01 5/11/2010 1200 6010B Silver 2 2 MG/KG U 2.928580-002 PR-MR-02 5/11/2010 1050 7471A Mercury 0.068 0.056 MG/KG 4.528580-001 PR-MR-01 5/11/2010 1100 6010B Copper 11.2 9.9 MG/KG 4.2828580-001 PR-MR-01 5/11/2010 1100 7471A Mercury 0.47 0.13 MG/KG 4.28
Appendix A ‐ 2010 Peconic River Sediment Samples
Metals
Sample IDCOC
Site IDMethod Analyte Conc. MDL Units
1 of 2

Sample Sample Lab Rev DistanceDate Time Qual1 Qual From STP
(miles)
Appendix A ‐ 2010 Peconic River Sediment Samples
Metals
Sample IDCOC
Site IDMethod Analyte Conc. MDL Units
28580-001 PR-MR-01 5/11/2010 1100 6010B Silver 1 4 MG/KG B 4.2828621-001 PR-DP-01 5/25/2010 1030 3050B/6010B Aluminum 3250 53.8 MG/KG * 6.7528621-001 PR-DP-01 5/25/2010 1030 3050B/6010B Antimony 2.61 2.61 MG/KG U 6.7528621-001 PR-DP-01 5/25/2010 1030 3050B/6020 Arsenic 7.48 1.67 MG/KG B 6.7528621-001 PR-DP-01 5/25/2010 1030 3050B/6010B Barium 57.7 0.792 MG/KG * 6.7528621-001 PR-DP-01 5/25/2010 1030 3050B/6010B Beryllium 0.816 0.792 MG/KG B 6.7528621-001 PR-DP-01 5/25/2010 1030 3050B/6010B Cadmium 1.27 0.792 MG/KG B 6.7528621-001 PR-DP-01 5/25/2010 1030 3050B/6010B Calcium 2090 63.3 MG/KG *B 6.7528621-001 PR-DP-01 5/25/2010 1030 3050B/6010B Chromium 10.3 1.19 MG/KG 6.7528621-001 PR-DP-01 5/25/2010 1030 3050B/6010B Cobalt 7.06 1.19 MG/KG 6.7528621-001 PR-DP-01 5/25/2010 1030 3050B/6010B Copper 14.5 2.38 MG/KG 6.7528621-001 PR-DP-01 5/25/2010 1030 3050B/6010B Iron 8460 63.3 MG/KG *N 6.7528621-001 PR-DP-01 5/25/2010 1030 3050B/6020 Lead 35.6 0.835 MG/KG *N 6.7528621-001 PR-DP-01 5/25/2010 1030 3050B/6010B Magnesium 394 67.3 MG/KG 6.7528621-001 PR-DP-01 5/25/2010 1030 3050B/6010B Manganese 153 1.58 MG/KG * 6.7528621-001 PR-DP-01 5/25/2010 1030 EPA 7471A Mercury 0.239 0.0349 MG/KG B 6.7528621-001 PR-DP-01 5/25/2010 1030 3050B/6010B Nickel 6.68 1.19 MG/KG 6.7528621-001 PR-DP-01 5/25/2010 1030 3050B/6010B Potassium 63.3 50.7 MG/KG B 6.7528621-001 PR-DP-01 5/25/2010 1030 3050B/6020 Selenium 4.18 4.18 MG/KG U 6.7528621-001 PR-DP-01 5/25/2010 1030 3050B/6010B Silver 1.02 0.792 MG/KG B 6.7528621-001 PR-DP-01 5/25/2010 1030 3050B/6010B Sodium 215 55.4 MG/KG B 6.7528621-001 PR-DP-01 5/25/2010 1030 3050B/6020 Thallium 0.501 0.501 MG/KG U 6.7528621-001 PR-DP-01 5/25/2010 1030 3050B/6010B Vanadium 30.3 0.792 MG/KG 6.7528621-001 PR-DP-01 5/25/2010 1030 3050B/6010B Zinc 120 2.61 MG/KG * 6.75
1 Qualifiers
B ‐
N ‐
U ‐ Indicates that the analyte was analyzed for but not detected.
* ‐
Indicates that the reported value was obtained from a reading that was less than the Contract Required Detection Limit
Indicates that the spiked sample recovery is not within control limits.
J ‐
Indicates an estimated value. This flag is used either when estimating a concentration for tentatively identified compounds
(TICs) where a 1:1 response is assumed, or when the mass spectral data indicates the presenceof a compound that meets the identification criteria but the result is less than the sample quantitation limit but greater
than zero.
2 of 2

Sample Sample Lab Rev DistanceDate Time Qual1 Qual From STP
(miles)28587-008 PR-SS-38 5/13/2010 1130 8082 Aroclor 1016 58 58 UG/KG U 0.3628587-008 PR-SS-38 5/13/2010 1130 8082 Aroclor 1221 58 58 UG/KG U 0.3628587-008 PR-SS-38 5/13/2010 1130 8082 Aroclor 1232 58 58 UG/KG U 0.3628587-008 PR-SS-38 5/13/2010 1130 8082 Aroclor 1242 58 58 UG/KG U 0.3628587-008 PR-SS-38 5/13/2010 1130 8082 Aroclor 1248 58 58 UG/KG U 0.3628587-008 PR-SS-38 5/13/2010 1130 8082 Aroclor 1254 58 58 UG/KG U 0.3628587-008 PR-SS-38 5/13/2010 1130 8082 Aroclor 1260 58 58 UG/KG U 0.3628587-007 PR-SS-37 5/13/2010 1110 8082 Aroclor 1016 46 46 UG/KG U 0.4728587-007 PR-SS-37 5/13/2010 1110 8082 Aroclor 1221 46 46 UG/KG U 0.4728587-007 PR-SS-37 5/13/2010 1110 8082 Aroclor 1232 46 46 UG/KG U 0.4728587-007 PR-SS-37 5/13/2010 1110 8082 Aroclor 1242 46 46 UG/KG U 0.4728587-007 PR-SS-37 5/13/2010 1110 8082 Aroclor 1248 46 46 UG/KG U 0.4728587-007 PR-SS-37 5/13/2010 1110 8082 Aroclor 1254 46 46 UG/KG U 0.4728587-007 PR-SS-37 5/13/2010 1110 8082 Aroclor 1260 46 46 UG/KG U 0.4728587-006 PR-SS-35 5/13/2010 1105 8082 Aroclor 1016 46 46 UG/KG U 0.4928587-006 PR-SS-35 5/13/2010 1105 8082 Aroclor 1221 46 46 UG/KG U 0.4928587-006 PR-SS-35 5/13/2010 1105 8082 Aroclor 1232 46 46 UG/KG U 0.4928587-006 PR-SS-35 5/13/2010 1105 8082 Aroclor 1242 46 46 UG/KG U 0.4928587-006 PR-SS-35 5/13/2010 1105 8082 Aroclor 1248 46 46 UG/KG U 0.4928587-006 PR-SS-35 5/13/2010 1105 8082 Aroclor 1254 46 46 UG/KG U 0.4928587-006 PR-SS-35 5/13/2010 1105 8082 Aroclor 1260 46 46 UG/KG U 0.4928587-005 PR-SS-33 5/13/2010 1100 8082 Aroclor 1016 61 61 UG/KG U 0.4928587-005 PR-SS-33 5/13/2010 1100 8082 Aroclor 1221 61 61 UG/KG U 0.4928587-005 PR-SS-33 5/13/2010 1100 8082 Aroclor 1232 61 61 UG/KG U 0.4928587-005 PR-SS-33 5/13/2010 1100 8082 Aroclor 1242 61 61 UG/KG U 0.4928587-005 PR-SS-33 5/13/2010 1100 8082 Aroclor 1248 61 61 UG/KG U 0.4928587-005 PR-SS-33 5/13/2010 1100 8082 Aroclor 1254 61 61 UG/KG U 0.4928587-005 PR-SS-33 5/13/2010 1100 8082 Aroclor 1260 61 61 UG/KG U 0.4928587-004 PR-SS-31 5/13/2010 1040 8082 Aroclor 1016 46 46 UG/KG U 0.6728587-004 PR-SS-31 5/13/2010 1040 8082 Aroclor 1221 46 46 UG/KG U 0.6728587-004 PR-SS-31 5/13/2010 1040 8082 Aroclor 1232 46 46 UG/KG U 0.6728587-004 PR-SS-31 5/13/2010 1040 8082 Aroclor 1242 46 46 UG/KG U 0.6728587-004 PR-SS-31 5/13/2010 1040 8082 Aroclor 1248 46 46 UG/KG U 0.6728587-004 PR-SS-31 5/13/2010 1040 8082 Aroclor 1254 46 46 UG/KG U 0.6728587-004 PR-SS-31 5/13/2010 1040 8082 Aroclor 1260 46 46 UG/KG U 0.6728587-003 PR-SS-30 5/13/2010 1035 8082 Aroclor 1016 50 50 UG/KG U 0.69
Units
Appendix B ‐ 2010 Peconic River Sediment Samples
PCBs
Sample IDCOC Site
IDMethod Analyte Conc. MDL
1 of 6

Sample Sample Lab Rev DistanceDate Time Qual1 Qual From STP
(miles)Units
Appendix B ‐ 2010 Peconic River Sediment Samples
PCBs
Sample IDCOC Site
IDMethod Analyte Conc. MDL
28587-003 PR-SS-30 5/13/2010 1035 8082 Aroclor 1221 50 50 UG/KG U 0.6928587-003 PR-SS-30 5/13/2010 1035 8082 Aroclor 1232 50 50 UG/KG U 0.6928587-003 PR-SS-30 5/13/2010 1035 8082 Aroclor 1242 50 50 UG/KG U 0.6928587-003 PR-SS-30 5/13/2010 1035 8082 Aroclor 1248 50 50 UG/KG U 0.6928587-003 PR-SS-30 5/13/2010 1035 8082 Aroclor 1254 50 50 UG/KG U 0.6928587-003 PR-SS-30 5/13/2010 1035 8082 Aroclor 1260 50 50 UG/KG U 0.6928587-002 PR-SS-29 5/13/2010 1030 8082 Aroclor 1016 44 44 UG/KG U 0.6928587-002 PR-SS-29 5/13/2010 1030 8082 Aroclor 1221 44 44 UG/KG U 0.6928587-002 PR-SS-29 5/13/2010 1030 8082 Aroclor 1232 44 44 UG/KG U 0.6928587-002 PR-SS-29 5/13/2010 1030 8082 Aroclor 1242 44 44 UG/KG U 0.6928587-002 PR-SS-29 5/13/2010 1030 8082 Aroclor 1248 44 44 UG/KG U 0.6928587-002 PR-SS-29 5/13/2010 1030 8082 Aroclor 1254 44 44 UG/KG U 0.6928587-002 PR-SS-29 5/13/2010 1030 8082 Aroclor 1260 44 44 UG/KG U 0.6928587-001 PR-SS-26 5/13/2010 1020 8082 Aroclor 1016 40 40 UG/KG U 0.7528587-001 PR-SS-26 5/13/2010 1020 8082 Aroclor 1221 40 40 UG/KG U 0.7528587-001 PR-SS-26 5/13/2010 1020 8082 Aroclor 1232 40 40 UG/KG U 0.7528587-001 PR-SS-26 5/13/2010 1020 8082 Aroclor 1242 40 40 UG/KG U 0.7528587-001 PR-SS-26 5/13/2010 1020 8082 Aroclor 1248 40 40 UG/KG U 0.7528587-001 PR-SS-26 5/13/2010 1020 8082 Aroclor 1254 40 40 UG/KG U 0.7528587-001 PR-SS-26 5/13/2010 1020 8082 Aroclor 1260 40 40 UG/KG U 0.7528583-010 PR-SS-24 5/12/2010 1240 8082 Aroclor 1016 49 49 UG/KG U 0.828583-010 PR-SS-24 5/12/2010 1240 8082 Aroclor 1221 49 49 UG/KG U 0.828583-010 PR-SS-24 5/12/2010 1240 8082 Aroclor 1232 49 49 UG/KG U 0.828583-010 PR-SS-24 5/12/2010 1240 8082 Aroclor 1242 49 49 UG/KG U 0.828583-010 PR-SS-24 5/12/2010 1240 8082 Aroclor 1248 49 49 UG/KG U 0.828583-010 PR-SS-24 5/12/2010 1240 8082 Aroclor 1254 49 49 UG/KG U 0.828583-010 PR-SS-24 5/12/2010 1240 8082 Aroclor 1260 49 49 UG/KG U 0.828583-009 PR-SS-23 5/12/2010 1230 8082 Aroclor 1016 44 44 UG/KG U 0.8528583-009 PR-SS-23 5/12/2010 1230 8082 Aroclor 1221 44 44 UG/KG U 0.8528583-009 PR-SS-23 5/12/2010 1230 8082 Aroclor 1232 44 44 UG/KG U 0.8528583-009 PR-SS-23 5/12/2010 1230 8082 Aroclor 1242 44 44 UG/KG U 0.8528583-009 PR-SS-23 5/12/2010 1230 8082 Aroclor 1248 44 44 UG/KG U 0.8528583-009 PR-SS-23 5/12/2010 1230 8082 Aroclor 1254 44 44 UG/KG U 0.8528583-009 PR-SS-23 5/12/2010 1230 8082 Aroclor 1260 44 44 UG/KG U 0.8528583-008 PR-SS-21 5/12/2010 1220 8082 Aroclor 1016 53 53 UG/KG U 0.9128583-008 PR-SS-21 5/12/2010 1220 8082 Aroclor 1221 53 53 UG/KG U 0.91
2 of 6

Sample Sample Lab Rev DistanceDate Time Qual1 Qual From STP
(miles)Units
Appendix B ‐ 2010 Peconic River Sediment Samples
PCBs
Sample IDCOC Site
IDMethod Analyte Conc. MDL
28583-008 PR-SS-21 5/12/2010 1220 8082 Aroclor 1232 53 53 UG/KG U 0.9128583-008 PR-SS-21 5/12/2010 1220 8082 Aroclor 1242 53 53 UG/KG U 0.9128583-008 PR-SS-21 5/12/2010 1220 8082 Aroclor 1248 53 53 UG/KG U 0.9128583-008 PR-SS-21 5/12/2010 1220 8082 Aroclor 1254 53 53 UG/KG U 0.9128583-008 PR-SS-21 5/12/2010 1220 8082 Aroclor 1260 53 53 UG/KG U 0.9128583-007 PR-SS-19 5/12/2010 1210 8082 Aroclor 1016 47 47 UG/KG U 1.228583-007 PR-SS-19 5/12/2010 1210 8082 Aroclor 1221 47 47 UG/KG U 1.228583-007 PR-SS-19 5/12/2010 1210 8082 Aroclor 1232 47 47 UG/KG U 1.228583-007 PR-SS-19 5/12/2010 1210 8082 Aroclor 1242 47 47 UG/KG U 1.228583-007 PR-SS-19 5/12/2010 1210 8082 Aroclor 1248 47 47 UG/KG U 1.228583-007 PR-SS-19 5/12/2010 1210 8082 Aroclor 1254 47 47 UG/KG U 1.228583-007 PR-SS-19 5/12/2010 1210 8082 Aroclor 1260 47 47 UG/KG U 1.228583-006 PR-SS-18 5/12/2010 1200 8082 Aroclor 1016 51 51 UG/KG U 1.2728583-006 PR-SS-18 5/12/2010 1200 8082 Aroclor 1221 51 51 UG/KG U 1.2728583-006 PR-SS-18 5/12/2010 1200 8082 Aroclor 1232 51 51 UG/KG U 1.2728583-006 PR-SS-18 5/12/2010 1200 8082 Aroclor 1242 51 51 UG/KG U 1.2728583-006 PR-SS-18 5/12/2010 1200 8082 Aroclor 1248 51 51 UG/KG U 1.2728583-006 PR-SS-18 5/12/2010 1200 8082 Aroclor 1254 51 51 UG/KG U 1.2728583-006 PR-SS-18 5/12/2010 1200 8082 Aroclor 1260 51 51 UG/KG U 1.2728583-005 PR-SS-17 5/12/2010 1140 8082 Aroclor 1016 62 62 UG/KG U 1.3328583-005 PR-SS-17 5/12/2010 1140 8082 Aroclor 1221 62 62 UG/KG U 1.3328583-005 PR-SS-17 5/12/2010 1140 8082 Aroclor 1232 62 62 UG/KG U 1.3328583-005 PR-SS-17 5/12/2010 1140 8082 Aroclor 1242 62 62 UG/KG U 1.3328583-005 PR-SS-17 5/12/2010 1140 8082 Aroclor 1248 62 62 UG/KG U 1.3328583-005 PR-SS-17 5/12/2010 1140 8082 Aroclor 1254 62 62 UG/KG U 1.3328583-005 PR-SS-17 5/12/2010 1140 8082 Aroclor 1260 62 62 UG/KG U 1.3328583-004 PR-SS-16 5/12/2010 1120 8082 Aroclor 1016 51 51 UG/KG U 1.428583-004 PR-SS-16 5/12/2010 1120 8082 Aroclor 1221 51 51 UG/KG U 1.428583-004 PR-SS-16 5/12/2010 1120 8082 Aroclor 1232 51 51 UG/KG U 1.428583-004 PR-SS-16 5/12/2010 1120 8082 Aroclor 1242 51 51 UG/KG U 1.428583-004 PR-SS-16 5/12/2010 1120 8082 Aroclor 1248 51 51 UG/KG U 1.428583-004 PR-SS-16 5/12/2010 1120 8082 Aroclor 1254 51 51 UG/KG U 1.428583-004 PR-SS-16 5/12/2010 1120 8082 Aroclor 1260 51 51 UG/KG U 1.428583-003 PR-SS-15 5/12/2010 1115 8082 Aroclor 1016 61 61 UG/KG U 1.5228583-003 PR-SS-15 5/12/2010 1115 8082 Aroclor 1221 61 61 UG/KG U 1.5228583-003 PR-SS-15 5/12/2010 1115 8082 Aroclor 1232 61 61 UG/KG U 1.52
3 of 6

Sample Sample Lab Rev DistanceDate Time Qual1 Qual From STP
(miles)Units
Appendix B ‐ 2010 Peconic River Sediment Samples
PCBs
Sample IDCOC Site
IDMethod Analyte Conc. MDL
28583-003 PR-SS-15 5/12/2010 1115 8082 Aroclor 1242 61 61 UG/KG U 1.5228583-003 PR-SS-15 5/12/2010 1115 8082 Aroclor 1248 61 61 UG/KG U 1.5228583-003 PR-SS-15 5/12/2010 1115 8082 Aroclor 1254 61 61 UG/KG U 1.5228583-003 PR-SS-15 5/12/2010 1115 8082 Aroclor 1260 61 61 UG/KG U 1.5228583-002 PR-SS-14 5/12/2010 1110 8082 Aroclor 1016 61 61 UG/KG U 1.5628583-002 PR-SS-14 5/12/2010 1110 8082 Aroclor 1221 61 61 UG/KG U 1.5628583-002 PR-SS-14 5/12/2010 1110 8082 Aroclor 1232 61 61 UG/KG U 1.5628583-002 PR-SS-14 5/12/2010 1110 8082 Aroclor 1242 61 61 UG/KG U 1.5628583-002 PR-SS-14 5/12/2010 1110 8082 Aroclor 1248 61 61 UG/KG U 1.5628583-002 PR-SS-14 5/12/2010 1110 8082 Aroclor 1254 61 61 UG/KG U 1.5628583-002 PR-SS-14 5/12/2010 1110 8082 Aroclor 1260 61 61 UG/KG U 1.5628583-001 PR-SS-12 5/12/2010 1100 8082 Aroclor 1016 42 42 UG/KG U 1.6628583-001 PR-SS-12 5/12/2010 1100 8082 Aroclor 1221 42 42 UG/KG U 1.6628583-001 PR-SS-12 5/12/2010 1100 8082 Aroclor 1232 42 42 UG/KG U 1.6628583-001 PR-SS-12 5/12/2010 1100 8082 Aroclor 1242 42 42 UG/KG U 1.6628583-001 PR-SS-12 5/12/2010 1100 8082 Aroclor 1248 42 42 UG/KG U 1.6628583-001 PR-SS-12 5/12/2010 1100 8082 Aroclor 1254 42 42 UG/KG U 1.6628583-001 PR-SS-12 5/12/2010 1100 8082 Aroclor 1260 42 42 UG/KG U 1.6628579-009 PR-SS-10 5/11/2010 1350 8082 Aroclor 1016 54 54 UG/KG U 1.8428579-009 PR-SS-10 5/11/2010 1350 8082 Aroclor 1221 54 54 UG/KG U 1.8428579-009 PR-SS-10 5/11/2010 1350 8082 Aroclor 1232 54 54 UG/KG U 1.8428579-009 PR-SS-10 5/11/2010 1350 8082 Aroclor 1242 54 54 UG/KG U 1.8428579-009 PR-SS-10 5/11/2010 1350 8082 Aroclor 1248 54 54 UG/KG U 1.8428579-009 PR-SS-10 5/11/2010 1350 8082 Aroclor 1254 54 54 UG/KG U 1.8428579-009 PR-SS-10 5/11/2010 1350 8082 Aroclor 1260 54 54 UG/KG U 1.8428579-008 PR-SS-09 5/11/2010 1340 8082 Aroclor 1016 45 45 UG/KG U 1.9328579-008 PR-SS-09 5/11/2010 1340 8082 Aroclor 1221 45 45 UG/KG U 1.9328579-008 PR-SS-09 5/11/2010 1340 8082 Aroclor 1232 45 45 UG/KG U 1.9328579-008 PR-SS-09 5/11/2010 1340 8082 Aroclor 1242 45 45 UG/KG U 1.9328579-008 PR-SS-09 5/11/2010 1340 8082 Aroclor 1248 45 45 UG/KG U 1.9328579-008 PR-SS-09 5/11/2010 1340 8082 Aroclor 1254 45 45 UG/KG U 1.9328579-008 PR-SS-09 5/11/2010 1340 8082 Aroclor 1260 45 45 UG/KG U 1.9328579-007 PR-SS-07 5/11/2010 1330 8082 Aroclor 1016 46 46 UG/KG U 2.0228579-007 PR-SS-07 5/11/2010 1330 8082 Aroclor 1221 46 46 UG/KG U 2.0228579-007 PR-SS-07 5/11/2010 1330 8082 Aroclor 1232 46 46 UG/KG U 2.0228579-007 PR-SS-07 5/11/2010 1330 8082 Aroclor 1242 46 46 UG/KG U 2.02
4 of 6
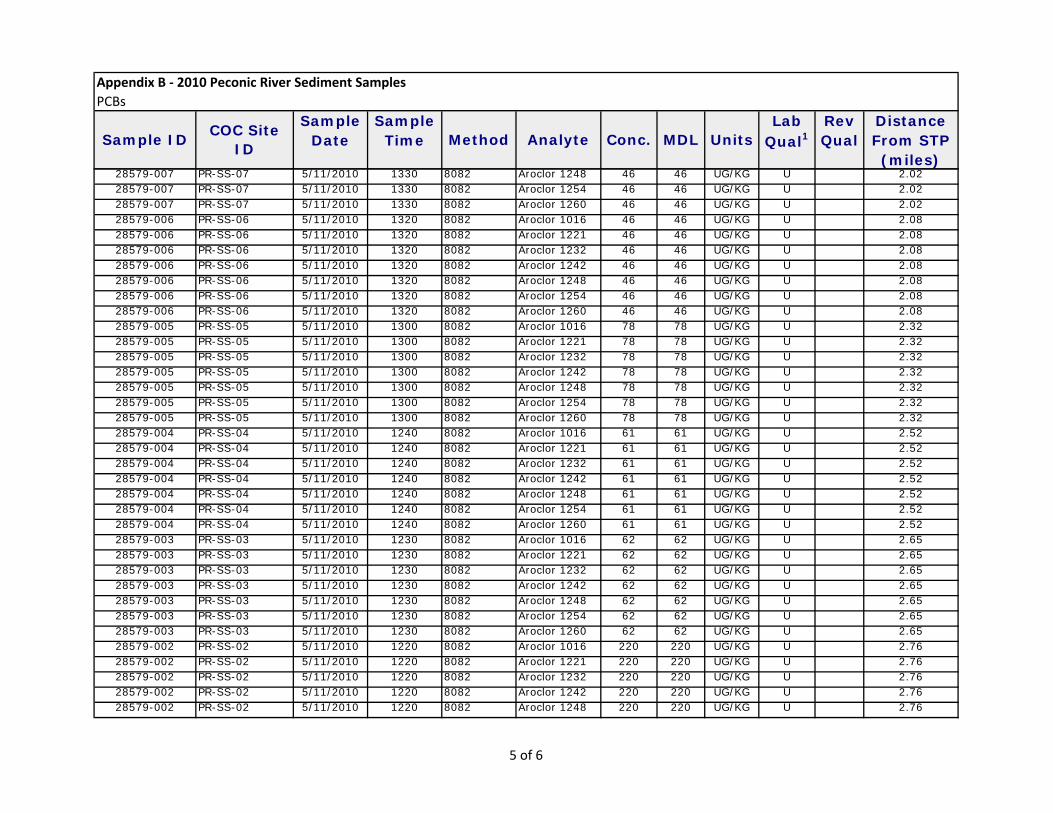
Sample Sample Lab Rev DistanceDate Time Qual1 Qual From STP
(miles)Units
Appendix B ‐ 2010 Peconic River Sediment Samples
PCBs
Sample IDCOC Site
IDMethod Analyte Conc. MDL
28579-007 PR-SS-07 5/11/2010 1330 8082 Aroclor 1248 46 46 UG/KG U 2.0228579-007 PR-SS-07 5/11/2010 1330 8082 Aroclor 1254 46 46 UG/KG U 2.0228579-007 PR-SS-07 5/11/2010 1330 8082 Aroclor 1260 46 46 UG/KG U 2.0228579-006 PR-SS-06 5/11/2010 1320 8082 Aroclor 1016 46 46 UG/KG U 2.0828579-006 PR-SS-06 5/11/2010 1320 8082 Aroclor 1221 46 46 UG/KG U 2.0828579-006 PR-SS-06 5/11/2010 1320 8082 Aroclor 1232 46 46 UG/KG U 2.0828579-006 PR-SS-06 5/11/2010 1320 8082 Aroclor 1242 46 46 UG/KG U 2.0828579-006 PR-SS-06 5/11/2010 1320 8082 Aroclor 1248 46 46 UG/KG U 2.0828579-006 PR-SS-06 5/11/2010 1320 8082 Aroclor 1254 46 46 UG/KG U 2.0828579-006 PR-SS-06 5/11/2010 1320 8082 Aroclor 1260 46 46 UG/KG U 2.0828579-005 PR-SS-05 5/11/2010 1300 8082 Aroclor 1016 78 78 UG/KG U 2.3228579-005 PR-SS-05 5/11/2010 1300 8082 Aroclor 1221 78 78 UG/KG U 2.3228579-005 PR-SS-05 5/11/2010 1300 8082 Aroclor 1232 78 78 UG/KG U 2.3228579-005 PR-SS-05 5/11/2010 1300 8082 Aroclor 1242 78 78 UG/KG U 2.3228579-005 PR-SS-05 5/11/2010 1300 8082 Aroclor 1248 78 78 UG/KG U 2.3228579-005 PR-SS-05 5/11/2010 1300 8082 Aroclor 1254 78 78 UG/KG U 2.3228579-005 PR-SS-05 5/11/2010 1300 8082 Aroclor 1260 78 78 UG/KG U 2.3228579-004 PR-SS-04 5/11/2010 1240 8082 Aroclor 1016 61 61 UG/KG U 2.5228579-004 PR-SS-04 5/11/2010 1240 8082 Aroclor 1221 61 61 UG/KG U 2.5228579-004 PR-SS-04 5/11/2010 1240 8082 Aroclor 1232 61 61 UG/KG U 2.5228579-004 PR-SS-04 5/11/2010 1240 8082 Aroclor 1242 61 61 UG/KG U 2.5228579-004 PR-SS-04 5/11/2010 1240 8082 Aroclor 1248 61 61 UG/KG U 2.5228579-004 PR-SS-04 5/11/2010 1240 8082 Aroclor 1254 61 61 UG/KG U 2.5228579-004 PR-SS-04 5/11/2010 1240 8082 Aroclor 1260 61 61 UG/KG U 2.5228579-003 PR-SS-03 5/11/2010 1230 8082 Aroclor 1016 62 62 UG/KG U 2.6528579-003 PR-SS-03 5/11/2010 1230 8082 Aroclor 1221 62 62 UG/KG U 2.6528579-003 PR-SS-03 5/11/2010 1230 8082 Aroclor 1232 62 62 UG/KG U 2.6528579-003 PR-SS-03 5/11/2010 1230 8082 Aroclor 1242 62 62 UG/KG U 2.6528579-003 PR-SS-03 5/11/2010 1230 8082 Aroclor 1248 62 62 UG/KG U 2.6528579-003 PR-SS-03 5/11/2010 1230 8082 Aroclor 1254 62 62 UG/KG U 2.6528579-003 PR-SS-03 5/11/2010 1230 8082 Aroclor 1260 62 62 UG/KG U 2.6528579-002 PR-SS-02 5/11/2010 1220 8082 Aroclor 1016 220 220 UG/KG U 2.7628579-002 PR-SS-02 5/11/2010 1220 8082 Aroclor 1221 220 220 UG/KG U 2.7628579-002 PR-SS-02 5/11/2010 1220 8082 Aroclor 1232 220 220 UG/KG U 2.7628579-002 PR-SS-02 5/11/2010 1220 8082 Aroclor 1242 220 220 UG/KG U 2.7628579-002 PR-SS-02 5/11/2010 1220 8082 Aroclor 1248 220 220 UG/KG U 2.76
5 of 6

Sample Sample Lab Rev DistanceDate Time Qual1 Qual From STP
(miles)Units
Appendix B ‐ 2010 Peconic River Sediment Samples
PCBs
Sample IDCOC Site
IDMethod Analyte Conc. MDL
28579-002 PR-SS-02 5/11/2010 1220 8082 Aroclor 1254 220 220 UG/KG U 2.7628579-002 PR-SS-02 5/11/2010 1220 8082 Aroclor 1260 220 220 UG/KG U 2.7628579-001 PR-SS-01 5/11/2010 1200 8082 Aroclor 1016 67 67 UG/KG U 2.928579-001 PR-SS-01 5/11/2010 1200 8082 Aroclor 1221 67 67 UG/KG U 2.928579-001 PR-SS-01 5/11/2010 1200 8082 Aroclor 1232 67 67 UG/KG U 2.928579-001 PR-SS-01 5/11/2010 1200 8082 Aroclor 1242 67 67 UG/KG U 2.928579-001 PR-SS-01 5/11/2010 1200 8082 Aroclor 1248 67 67 UG/KG U 2.928579-001 PR-SS-01 5/11/2010 1200 8082 Aroclor 1254 67 67 UG/KG U 2.928579-001 PR-SS-01 5/11/2010 1200 8082 Aroclor 1260 67 67 UG/KG U 2.928580-002 PR-MR-02 5/11/2010 1050 8082 Aroclor 1016 55 55 UG/KG U 4.528580-002 PR-MR-02 5/11/2010 1050 8082 Aroclor 1221 55 55 UG/KG U 4.528580-002 PR-MR-02 5/11/2010 1050 8082 Aroclor 1232 55 55 UG/KG U 4.528580-002 PR-MR-02 5/11/2010 1050 8082 Aroclor 1242 55 55 UG/KG U 4.528580-002 PR-MR-02 5/11/2010 1050 8082 Aroclor 1248 55 55 UG/KG U 4.528580-002 PR-MR-02 5/11/2010 1050 8082 Aroclor 1254 55 55 UG/KG U 4.528580-002 PR-MR-02 5/11/2010 1050 8082 Aroclor 1260 55 55 UG/KG U 4.528580-001 PR-MR-01 5/11/2010 1100 8082 Aroclor 1016 130 130 UG/KG U 4.2828580-001 PR-MR-01 5/11/2010 1100 8082 Aroclor 1221 130 130 UG/KG U 4.2828580-001 PR-MR-01 5/11/2010 1100 8082 Aroclor 1232 130 130 UG/KG U 4.2828580-001 PR-MR-01 5/11/2010 1100 8082 Aroclor 1242 130 130 UG/KG U 4.2828580-001 PR-MR-01 5/11/2010 1100 8082 Aroclor 1248 130 130 UG/KG U 4.2828580-001 PR-MR-01 5/11/2010 1100 8082 Aroclor 1254 130 130 UG/KG U 4.2828580-001 PR-MR-01 5/11/2010 1100 8082 Aroclor 1260 130 130 UG/KG U 4.28
1 Qualifiers
U ‐ Indicates that the analyte was analyzed for but not detected.
6 of 6

Sample Sample Lab Rev DistanceDate Time Qual1 Qual From STP
(miles)28587-008 PR-SS-38 5/13/2010 1130 901.1 MOD Cesium-137 0.81 0.14 0.05 PCI/G 0.36
28587-007 PR-SS-37 5/13/2010 1110 901.1 MOD Cesium-137 1.79 0.2 0.05 PCI/G 0.47
28587-006 PR-SS-35 5/13/2010 1105 901.1 MOD Cesium-137 0.71 0.1 0.03 PCI/G 0.49
28587-005 PR-SS-33 5/13/2010 1100 901.1 MOD Cesium-137 2.65 0.3 0.12 PCI/G 0.49
28587-004 PR-SS-31 5/13/2010 1040 901.1 MOD Cesium-137 0.36 0.12 0.1 PCI/G 0.67
28587-003 PR-SS-30 5/13/2010 1035 901.1 MOD Cesium-137 0.401 0.079 0.042 PCI/G 0.69
28587-002 PR-SS-29 5/13/2010 1030 901.1 MOD Cesium-137 0.58 0.11 0.05 PCI/G 0.69
28587-001 PR-SS-26 5/13/2010 1020 901.1 MOD Cesium-137 0.222 0.055 0.023 PCI/G 0.75
28583-010 PR-SS-24 5/12/2010 1240 901.1 MOD Cesium-137 1.03 0.19 0.12 PCI/G 0.8
28583-009 PR-SS-23 5/12/2010 1230 901.1 MOD Cesium-137 0.59 0.11 0.03 PCI/G 0.85
28583-008 PR-SS-21 5/12/2010 1220 901.1 MOD Cesium-137 0.65 0.11 0.06 PCI/G 0.91
28583-007 PR-SS-19 5/12/2010 1210 901.1 MOD Cesium-137 0.72 0.12 0.05 PCI/G 1.2
28583-006 PR-SS-18 5/12/2010 1200 901.1 MOD Cesium-137 1.1 0.15 0.05 PCI/G 1.27
28583-005 PR-SS-17 5/12/2010 1140 901.1 MOD Cesium-137 1 0.16 0.05 PCI/G 1.33
28583-004 PR-SS-16 5/12/2010 1120 901.1 MOD Cesium-137 0.8 0.1 0.03 PCI/G 1.4
28583-003 PR-SS-15 5/12/2010 1115 901.1 MOD Cesium-137 0.67 0.16 0.13 PCI/G 1.52
28583-002 PR-SS-14 5/12/2010 1110 901.1 MOD Cesium-137 0.6 0.13 0.07 PCI/G 1.56
28583-001 PR-SS-12 5/12/2010 1100 901.1 MOD Cesium-137 0.366 0.073 0.025 PCI/G 1.66
28579-009 PR-SS-10 5/11/2010 1350 901.1 MOD Cesium-137 0.62 0.11 0.05 PCI/G 1.84
28579-008 PR-SS-09 5/11/2010 1340 901.1 MOD Cesium-137 0.249 0.076 0.06 PCI/G 1.93
28579-007 PR-SS-07 5/11/2010 1330 901.1 MOD Cesium-137 0.059 0.057 0.09 PCI/G U 2.02
28579-006 PR-SS-06 5/11/2010 1320 901.1 MOD Cesium-137 0.08 0.051 0.075 PCI/G J 2.08
28579-005 PR-SS-05 5/11/2010 1300 901.1 MOD Cesium-137 1.1 0.14 0.05 PCI/G 2.32
28579-004 PR-SS-04 5/11/2010 1240 901.1 MOD Cesium-137 0.066 0.058 0.089 PCI/G U 2.52
28579-003 PR-SS-03 5/11/2010 1230 901.1 MOD Cesium-137 0.331 0.068 0.024 PCI/G 2.65
28579-002 PR-SS-02 5/11/2010 1220 901.1 MOD Cesium-137 0.19 0.17 0.27 PCI/G U 2.76
28579-001 PR-SS-01 5/11/2010 1200 901.1 MOD Cesium-137 0.045 0.055 0.09 PCI/G U 2.9
28580-002 PR-MR-02 5/11/2010 1050 901.1 MOD Cesium-137 0.169 0.061 0.051 PCI/G J 4.5
28580-001 PR-MR-01 5/11/2010 1100 901.1 MOD Cesium-137 0.32 0.1 0.12 PCI/G 4.28
28621-001 PR-DP-01 5/25/2010 1030 DOE HASL 300 Actinium-227 -0.0157 0.231 0.354 PCI/G U 6.75
28621-001 PR-DP-01 5/25/2010 1030 DOE HASL 300 Actinium-228 0.666 0.271 0.205 PCI/G J 6.75
28621-001 PR-DP-01 5/25/2010 1030 DOE HASL 300 Americium-241 0.0312 0.0428 0.0595 PCI/G U 6.75
28621-001 PR-DP-01 5/25/2010 1030 DOE HASL 300 Antimony-124 0.0327 0.109 0.19 PCI/G DL 6.75
28621-001 PR-DP-01 5/25/2010 1030 DOE HASL 300 Antimony-125 0.00586 0.0928 0.15 PCI/G U 6.75
Method Analyte Conc. Error MDL Units
Appendix C ‐ 2010 Peconic River Sediment Samples
Radionuclides
Sample IDCOC Site
ID
1 of 4
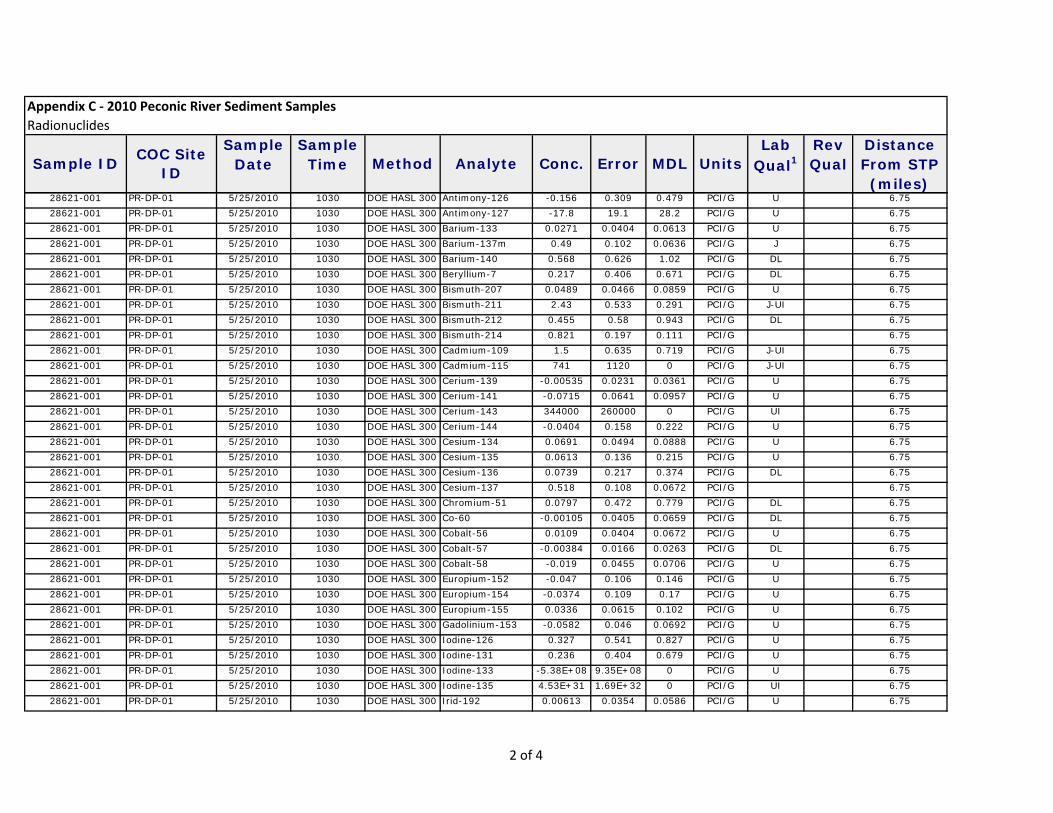
Sample Sample Lab Rev DistanceDate Time Qual1 Qual From STP
(miles)Method Analyte Conc. Error MDL Units
Appendix C ‐ 2010 Peconic River Sediment Samples
Radionuclides
Sample IDCOC Site
ID
28621-001 PR-DP-01 5/25/2010 1030 DOE HASL 300 Antimony-126 -0.156 0.309 0.479 PCI/G U 6.75
28621-001 PR-DP-01 5/25/2010 1030 DOE HASL 300 Antimony-127 -17.8 19.1 28.2 PCI/G U 6.75
28621-001 PR-DP-01 5/25/2010 1030 DOE HASL 300 Barium-133 0.0271 0.0404 0.0613 PCI/G U 6.75
28621-001 PR-DP-01 5/25/2010 1030 DOE HASL 300 Barium-137m 0.49 0.102 0.0636 PCI/G J 6.75
28621-001 PR-DP-01 5/25/2010 1030 DOE HASL 300 Barium-140 0.568 0.626 1.02 PCI/G DL 6.75
28621-001 PR-DP-01 5/25/2010 1030 DOE HASL 300 Beryllium-7 0.217 0.406 0.671 PCI/G DL 6.75
28621-001 PR-DP-01 5/25/2010 1030 DOE HASL 300 Bismuth-207 0.0489 0.0466 0.0859 PCI/G U 6.75
28621-001 PR-DP-01 5/25/2010 1030 DOE HASL 300 Bismuth-211 2.43 0.533 0.291 PCI/G J-UI 6.75
28621-001 PR-DP-01 5/25/2010 1030 DOE HASL 300 Bismuth-212 0.455 0.58 0.943 PCI/G DL 6.75
28621-001 PR-DP-01 5/25/2010 1030 DOE HASL 300 Bismuth-214 0.821 0.197 0.111 PCI/G 6.75
28621-001 PR-DP-01 5/25/2010 1030 DOE HASL 300 Cadmium-109 1.5 0.635 0.719 PCI/G J-UI 6.75
28621-001 PR-DP-01 5/25/2010 1030 DOE HASL 300 Cadmium-115 741 1120 0 PCI/G J-UI 6.75
28621-001 PR-DP-01 5/25/2010 1030 DOE HASL 300 Cerium-139 -0.00535 0.0231 0.0361 PCI/G U 6.75
28621-001 PR-DP-01 5/25/2010 1030 DOE HASL 300 Cerium-141 -0.0715 0.0641 0.0957 PCI/G U 6.75
28621-001 PR-DP-01 5/25/2010 1030 DOE HASL 300 Cerium-143 344000 260000 0 PCI/G UI 6.75
28621-001 PR-DP-01 5/25/2010 1030 DOE HASL 300 Cerium-144 -0.0404 0.158 0.222 PCI/G U 6.75
28621-001 PR-DP-01 5/25/2010 1030 DOE HASL 300 Cesium-134 0.0691 0.0494 0.0888 PCI/G U 6.75
28621-001 PR-DP-01 5/25/2010 1030 DOE HASL 300 Cesium-135 0.0613 0.136 0.215 PCI/G U 6.75
28621-001 PR-DP-01 5/25/2010 1030 DOE HASL 300 Cesium-136 0.0739 0.217 0.374 PCI/G DL 6.75
28621-001 PR-DP-01 5/25/2010 1030 DOE HASL 300 Cesium-137 0.518 0.108 0.0672 PCI/G 6.75
28621-001 PR-DP-01 5/25/2010 1030 DOE HASL 300 Chromium-51 0.0797 0.472 0.779 PCI/G DL 6.75
28621-001 PR-DP-01 5/25/2010 1030 DOE HASL 300 Co-60 -0.00105 0.0405 0.0659 PCI/G DL 6.75
28621-001 PR-DP-01 5/25/2010 1030 DOE HASL 300 Cobalt-56 0.0109 0.0404 0.0672 PCI/G U 6.75
28621-001 PR-DP-01 5/25/2010 1030 DOE HASL 300 Cobalt-57 -0.00384 0.0166 0.0263 PCI/G DL 6.75
28621-001 PR-DP-01 5/25/2010 1030 DOE HASL 300 Cobalt-58 -0.019 0.0455 0.0706 PCI/G U 6.75
28621-001 PR-DP-01 5/25/2010 1030 DOE HASL 300 Europium-152 -0.047 0.106 0.146 PCI/G U 6.75
28621-001 PR-DP-01 5/25/2010 1030 DOE HASL 300 Europium-154 -0.0374 0.109 0.17 PCI/G U 6.75
28621-001 PR-DP-01 5/25/2010 1030 DOE HASL 300 Europium-155 0.0336 0.0615 0.102 PCI/G U 6.75
28621-001 PR-DP-01 5/25/2010 1030 DOE HASL 300 Gadolinium-153 -0.0582 0.046 0.0692 PCI/G U 6.75
28621-001 PR-DP-01 5/25/2010 1030 DOE HASL 300 Iodine-126 0.327 0.541 0.827 PCI/G U 6.75
28621-001 PR-DP-01 5/25/2010 1030 DOE HASL 300 Iodine-131 0.236 0.404 0.679 PCI/G U 6.75
28621-001 PR-DP-01 5/25/2010 1030 DOE HASL 300 Iodine-133 -5.38E+08 9.35E+08 0 PCI/G U 6.75
28621-001 PR-DP-01 5/25/2010 1030 DOE HASL 300 Iodine-135 4.53E+31 1.69E+32 0 PCI/G UI 6.75
28621-001 PR-DP-01 5/25/2010 1030 DOE HASL 300 Irid-192 0.00613 0.0354 0.0586 PCI/G U 6.75
2 of 4

Sample Sample Lab Rev DistanceDate Time Qual1 Qual From STP
(miles)Method Analyte Conc. Error MDL Units
Appendix C ‐ 2010 Peconic River Sediment Samples
Radionuclides
Sample IDCOC Site
ID
28621-001 PR-DP-01 5/25/2010 1030 DOE HASL 300 Iron-59 0.025 0.109 0.185 PCI/G U 6.75
28621-001 PR-DP-01 5/25/2010 1030 DOE HASL 300 Lanthanum-140 -0.0631 0.222 0.355 PCI/G U 6.75
28621-001 PR-DP-01 5/25/2010 1030 DOE HASL 300 Lead-210 3.39 0.642 0.436 PCI/G J 6.75
28621-001 PR-DP-01 5/25/2010 1030 DOE HASL 300 Lead-211 -0.401 0.689 1.02 PCI/G U 6.75
28621-001 PR-DP-01 5/25/2010 1030 DOE HASL 300 Lead-212 0.599 0.11 0.07 PCI/G 6.75
28621-001 PR-DP-01 5/25/2010 1030 DOE HASL 300 Lead-214 0.88 0.199 0.106 PCI/G 6.75
28621-001 PR-DP-01 5/25/2010 1030 DOE HASL 300 Manganese-54 -0.00521 0.0405 0.0647 PCI/G DL 6.75
28621-001 PR-DP-01 5/25/2010 1030 DOE HASL 300 Mercury-203 0.0144 0.042 0.0658 PCI/G U 6.75
28621-001 PR-DP-01 5/25/2010 1030 DOE HASL 300 Molybdenum-99 319 519 0 PCI/G J-UI 6.75
28621-001 PR-DP-01 5/25/2010 1030 DOE HASL 300 Neodymium-147 -0.522 1.33 2.01 PCI/G U 6.75
28621-001 PR-DP-01 5/25/2010 1030 DOE HASL 300 Neptunium-239 -0.0875 0.252 0.398 PCI/G U 6.75
28621-001 PR-DP-01 5/25/2010 1030 DOE HASL 300 Niobium-94 -0.000228 0.0364 0.0595 PCI/G U 6.75
28621-001 PR-DP-01 5/25/2010 1030 DOE HASL 300 Niobium-95 0.00399 0.0485 0.0794 PCI/G DL 6.75
28621-001 PR-DP-01 5/25/2010 1030 DOE HASL 300 Potassium-40 2.97 0.81 0.532 PCI/G 6.75
28621-001 PR-DP-01 5/25/2010 1030 DOE HASL 300 Promethium-144 -0.0295 0.0403 0.0622 PCI/G U 6.75
28621-001 PR-DP-01 5/25/2010 1030 DOE HASL 300 Promethium-146 -0.00333 0.0487 0.0702 PCI/G U 6.75
28621-001 PR-DP-01 5/25/2010 1030 DOE HASL 300 Promethium-149 -2420 9110 0 PCI/G U 6.75
28621-001 PR-DP-01 5/25/2010 1030 DOE HASL 300 Protactinium-231 -0.2 1.25 1.89 PCI/G U 6.75
28621-001 PR-DP-01 5/25/2010 1030 DOE HASL 300 Protactinium-233 -0.0382 0.0565 0.0884 PCI/G U 6.75
28621-001 PR-DP-01 5/25/2010 1030 DOE HASL 300 Protactinium-234 0.245 0.313 0.537 PCI/G U 6.75
28621-001 PR-DP-01 5/25/2010 1030 DOE HASL 300 234m -4.02 5.62 7.22 PCI/G U 6.75
28621-001 PR-DP-01 5/25/2010 1030 DOE HASL 300 Radium-223 -0.623 0.577 0.862 PCI/G U 6.75
28621-001 PR-DP-01 5/25/2010 1030 DOE HASL 300 Radium-224 2.01 0.756 0.752 PCI/G J-UI 6.75
28621-001 PR-DP-01 5/25/2010 1030 DOE HASL 300 Radium-226 0.821 0.197 0.111 PCI/G 6.75
28621-001 PR-DP-01 5/25/2010 1030 DOE HASL 300 Radium-228 0.666 0.271 0.205 PCI/G 6.75
28621-001 PR-DP-01 5/25/2010 1030 DOE HASL 300 Radon-219 0.0777 0.392 0.64 PCI/G U 6.75
28621-001 PR-DP-01 5/25/2010 1030 DOE HASL 300 Rhodium-106 0.143 0.313 0.535 PCI/G U 6.75
28621-001 PR-DP-01 5/25/2010 1030 DOE HASL 300 Ruthenium-103 0.0124 0.0519 0.084 PCI/G U 6.75
28621-001 PR-DP-01 5/25/2010 1030 DOE HASL 300 Ruthenium-106 0.143 0.313 0.535 PCI/G U 6.75
28621-001 PR-DP-01 5/25/2010 1030 DOE HASL 300 Scandium-46 -0.0268 0.0434 0.0647 PCI/G U 6.75
28621-001 PR-DP-01 5/25/2010 1030 DOE HASL 300 Selenium-75 -0.0284 0.0447 0.0657 PCI/G U 6.75
28621-001 PR-DP-01 5/25/2010 1030 DOE HASL 300 Silver-108m -0.000769 0.0301 0.0481 PCI/G U 6.75
28621-001 PR-DP-01 5/25/2010 1030 DOE HASL 300 Silver-110m 0.0183 0.0421 0.0633 PCI/G U 6.75
28621-001 PR-DP-01 5/25/2010 1030 DOE HASL 300 Sodium-22 -0.0157 0.0391 0.0605 PCI/G DL 6.75
3 of 4

Sample Sample Lab Rev DistanceDate Time Qual1 Qual From STP
(miles)Method Analyte Conc. Error MDL Units
Appendix C ‐ 2010 Peconic River Sediment Samples
Radionuclides
Sample IDCOC Site
ID
28621-001 PR-DP-01 5/25/2010 1030 DOE HASL 300 Sodium-24 -3.97E+12 1.08E+13 0 PCI/G U 6.75
28621-001 PR-DP-01 5/25/2010 1030 DOE HASL 300 Strontium-85 -0.239 0.0723 0.0869 PCI/G U 6.75
28621-001 PR-DP-01 5/25/2010 1030 DOE HASL 300 Tantalum-182 0.03 0.163 0.273 PCI/G U 6.75
28621-001 PR-DP-01 5/25/2010 1030 DOE HASL 300 Technetium-99m 6.02E+33 3.21E+34 0 PCI/G UI 6.75
28621-001 PR-DP-01 5/25/2010 1030 DOE HASL 300 Tellurium-123m 0.0163 0.0226 0.0371 PCI/G U 6.75
28621-001 PR-DP-01 5/25/2010 1030 DOE HASL 300 Tellurium-125m 2.95 6.76 11.1 PCI/G U 6.75
28621-001 PR-DP-01 5/25/2010 1030 DOE HASL 300 Tellurium-132 -7.35 15.9 0 PCI/G U 6.75
28621-001 PR-DP-01 5/25/2010 1030 DOE HASL 300 Thallium-208 0.104 0.0761 0.0536 PCI/G 6.75
28621-001 PR-DP-01 5/25/2010 1030 DOE HASL 300 Thorium-227 -0.0157 0.231 0.354 PCI/G U 6.75
28621-001 PR-DP-01 5/25/2010 1030 DOE HASL 300 Thorium-228 0.599 0.11 0.07 PCI/G 6.75
28621-001 PR-DP-01 5/25/2010 1030 DOE HASL 300 Thorium-229 0.171 0.412 0.661 PCI/G U 6.75
28621-001 PR-DP-01 5/25/2010 1030 DOE HASL 300 Thorium-230 0.821 0.192 0.111 PCI/G J 6.75
28621-001 PR-DP-01 5/25/2010 1030 DOE HASL 300 Thorium-231 -0.623 0.577 0.862 PCI/G U 6.75
28621-001 PR-DP-01 5/25/2010 1030 DOE HASL 300 Thorium-232 0.666 0.271 0.205 PCI/G J 6.75
28621-001 PR-DP-01 5/25/2010 1030 DOE HASL 300 Thorium-234 0.0741 0.51 0.78 PCI/G U 6.75
28621-001 PR-DP-01 5/25/2010 1030 DOE HASL 300 Tin-113 0.0446 0.0464 0.0793 PCI/G U 6.75
28621-001 PR-DP-01 5/25/2010 1030 DOE HASL 300 Tin-117m 0.0314 0.0858 0.139 PCI/G U 6.75
28621-001 PR-DP-01 5/25/2010 1030 DOE HASL 300 Tin-126 0.143 0.0607 0.0642 PCI/G J-UI 6.75
28621-001 PR-DP-01 5/25/2010 1030 DOE HASL 300 Uranium-234 0.821 0.192 0.111 PCI/G J 6.75
28621-001 PR-DP-01 5/25/2010 1030 DOE HASL 300 Uranium-235 0.125 0.167 0.251 PCI/G U 6.75
28621-001 PR-DP-01 5/25/2010 1030 DOE HASL 300 Uranium-238 0.0741 0.51 0.78 PCI/G U 6.75
28621-001 PR-DP-01 5/25/2010 1030 DOE HASL 300 Vanadium-48 0.0688 0.118 0.202 PCI/G U 6.75
28621-001 PR-DP-01 5/25/2010 1030 DOE HASL 300 Yttrium-88 0.00791 0.0417 0.0714 PCI/G U 6.75
28621-001 PR-DP-01 5/25/2010 1030 DOE HASL 300 Zinc-65 0.0332 0.0846 0.129 PCI/G U 6.75
28621-001 PR-DP-01 5/25/2010 1030 DOE HASL 300 Zirconium-95 0.0517 0.086 0.147 PCI/G U 6.75
1 Qualifiers
U ‐ Indicates that the analyte was analyzed for but not detected.
J ‐Indicates an estimated value. This flag is used either when estimating a concentration for tentatively identified compounds (TICs) where a
of a compound that meets the identification criteria but the result is less than the sample quantitation limit but greater than zero.
4 of 4

Sample Depth Lab Rev DistanceDate (ft.) Qual1 Qual From STP
28746-001 PR-WCS-07 6/15/2010 0 U CAL EPA 1631E Mercury 4.2 0.2 NG/L 7.2330170-001 PR-WCS-07 7/22/2010 0 U CAL EPA 1631E Mercury 3.6 0.2 NG/L 7.2328746-001 PR-WCS-07 6/15/2010 0 U CAL DRAFT EPA 1630 Methyl Mercury 0.655 0.02 NG/L 7.2330170-001 PR-WCS-07 7/22/2010 0 U CAL DRAFT EPA 1630 Methyl Mercury 0.687 0.02 NG/L 7.2330171-001 PR-WCS-07 7/22/2010 0 U STL-MO 160.2 TSS 3 1 MG/L 7.2330170-001 PR-WCS-07 7/22/2010 0 U CAL SM20-2540 D TSS 2 2 MG/L U 7.2328746-001 PR-WCS-07 6/15/2010 0 U CAL SM20-2540 D TSS 2 2 MG/L JB 7.2328745-001 PR-WCS-07 6/15/2010 0 U STL-MO 160.2 TSS 3 1 MG/L 7.2330170-002 PR-WCS-06 7/22/2010 0 U CAL EPA 1631E Mercury 3.2 0.2 NG/L 6.7528746-002 PR-WCS-06 6/15/2010 0 U CAL EPA 1631E Mercury 4.7 0.2 NG/L 6.7528746-002 PR-WCS-06 6/15/2010 0 U CAL DRAFT EPA 1630 Methyl Mercury 1.37 0.02 NG/L 6.7530170-002 PR-WCS-06 7/22/2010 0 U CAL DRAFT EPA 1630 Methyl Mercury 0.565 0.02 NG/L 6.7530170-002 PR-WCS-06 7/22/2010 0 U CAL SM20-2540 D TSS 3 2 MG/L 6.7530171-002 PR-WCS-06 7/22/2010 0 U STL-MO 160.2 TSS 3 1 MG/L 6.7528745-002 PR-WCS-06 6/15/2010 0 U STL-MO 160.2 TSS 3 1 MG/L 6.7528746-002 PR-WCS-06 6/15/2010 0 U CAL SM20-2540 D TSS 2 2 MG/L U 6.7530170-003 PR-WCS-05 7/22/2010 0 U CAL EPA 1631E Mercury 3.1 0.2 NG/L 6.0428746-003 PR-WCS-05 6/15/2010 0 U CAL EPA 1631E Mercury 3.9 0.2 NG/L 6.0428746-003 PR-WCS-05 6/15/2010 0 U CAL DRAFT EPA 1630 Methyl Mercury 0.832 0.02 NG/L 6.0430170-003 PR-WCS-05 7/22/2010 0 U CAL DRAFT EPA 1630 Methyl Mercury 0.5 0.02 NG/L 6.0430171-003 PR-WCS-05 7/22/2010 0 U STL-MO 160.2 TSS 3 1 MG/L 6.0430170-003 PR-WCS-05 7/22/2010 0 U CAL SM20-2540 D TSS 2 2 MG/L U 6.0428745-003 PR-WCS-05 6/15/2010 0 U STL-MO 160.2 TSS 2 1 MG/L 6.0428746-003 PR-WCS-05 6/15/2010 0 U CAL SM20-2540 D TSS 2 2 MG/L JB 6.0430156-001 PR-WCS-04 7/19/2010 0 U CAL EPA 1631E Mercury 7.6 0.2 NG/L 4.7730090-001 PR-WCS-04 6/8/2010 0 U CAL EPA 1631E Mercury 14.8 0.2 NG/L 4.7730090-001 PR-WCS-04 6/8/2010 0 U CAL DRAFT EPA 1630 Methyl Mercury 4.44 0.02 NG/L 4.7730156-001 PR-WCS-04 7/19/2010 0 U CAL DRAFT EPA 1630 Methyl Mercury 1.89 0.02 NG/L 4.7730206-001 PR-WCS-04 8/4/2010 0 U STL-MO 160.2 TSS 3 1 MG/L 4.7728774-001 PR-WCS-04 6/23/2010 0 U STL-MO 160.2 TSS 9 1 MG/L 4.7730157-001 PR-WCS-04 7/19/2010 0 U STL-MO 160.2 TSS 14 1 MG/L 4.7730156-001 PR-WCS-04 7/19/2010 0 U CAL SM20-2540 D TSS 4 2 MG/L 4.7730091-001 PR-WCS-04 6/8/2010 0 U STL-MO 160.2 TSS 16 1 MG/L 4.7730090-001 PR-WCS-04 6/8/2010 0 U CAL SM20-2540 D TSS 7 2 MG/L 4.7728609-001 PR-WCS-04 5/20/2010 0 U STL-MO 160.2 TSS 1 1 MG/L U 4.7730090-002 PR-WCS-03 6/8/2010 0 U CAL EPA 1631E Mercury 13.8 0.2 NG/L 4.4430156-002 PR-WCS-03 7/19/2010 0 U CAL EPA 1631E Mercury 6.9 0.2 NG/L 4.4430090-002 PR-WCS-03 6/8/2010 0 U CAL DRAFT EPA 1630 Methyl Mercury 4.56 0.02 NG/L 4.44
Sample IDCOC Site
IDFilt. Lab Code Method Analyte Conc. MDL Units
Appendix D
2010 Water Column Total Mercury, Methyl Mercury and TSS Data
1 of 7
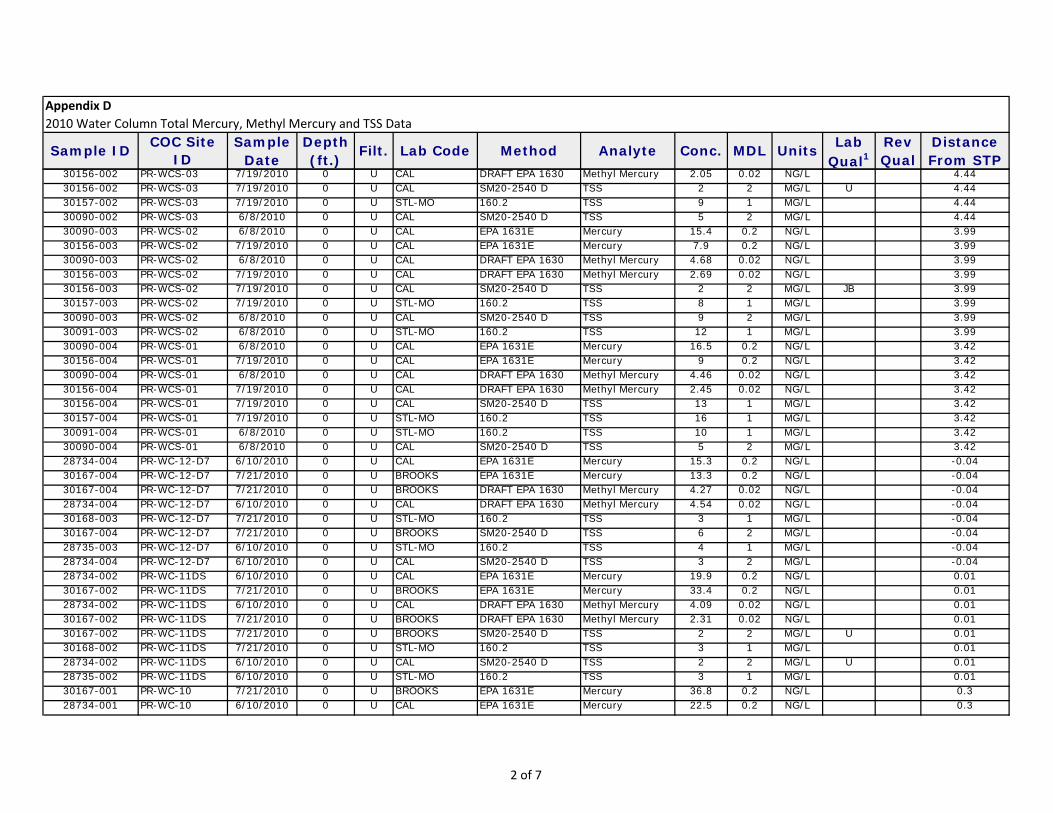
Sample Depth Lab Rev DistanceDate (ft.) Qual1 Qual From STP
Sample IDCOC Site
IDFilt. Lab Code Method Analyte Conc. MDL Units
Appendix D
2010 Water Column Total Mercury, Methyl Mercury and TSS Data
30156-002 PR-WCS-03 7/19/2010 0 U CAL DRAFT EPA 1630 Methyl Mercury 2.05 0.02 NG/L 4.4430156-002 PR-WCS-03 7/19/2010 0 U CAL SM20-2540 D TSS 2 2 MG/L U 4.4430157-002 PR-WCS-03 7/19/2010 0 U STL-MO 160.2 TSS 9 1 MG/L 4.4430090-002 PR-WCS-03 6/8/2010 0 U CAL SM20-2540 D TSS 5 2 MG/L 4.4430090-003 PR-WCS-02 6/8/2010 0 U CAL EPA 1631E Mercury 15.4 0.2 NG/L 3.9930156-003 PR-WCS-02 7/19/2010 0 U CAL EPA 1631E Mercury 7.9 0.2 NG/L 3.9930090-003 PR-WCS-02 6/8/2010 0 U CAL DRAFT EPA 1630 Methyl Mercury 4.68 0.02 NG/L 3.9930156-003 PR-WCS-02 7/19/2010 0 U CAL DRAFT EPA 1630 Methyl Mercury 2.69 0.02 NG/L 3.9930156-003 PR-WCS-02 7/19/2010 0 U CAL SM20-2540 D TSS 2 2 MG/L JB 3.9930157-003 PR-WCS-02 7/19/2010 0 U STL-MO 160.2 TSS 8 1 MG/L 3.9930090-003 PR-WCS-02 6/8/2010 0 U CAL SM20-2540 D TSS 9 2 MG/L 3.9930091-003 PR-WCS-02 6/8/2010 0 U STL-MO 160.2 TSS 12 1 MG/L 3.9930090-004 PR-WCS-01 6/8/2010 0 U CAL EPA 1631E Mercury 16.5 0.2 NG/L 3.4230156-004 PR-WCS-01 7/19/2010 0 U CAL EPA 1631E Mercury 9 0.2 NG/L 3.4230090-004 PR-WCS-01 6/8/2010 0 U CAL DRAFT EPA 1630 Methyl Mercury 4.46 0.02 NG/L 3.4230156-004 PR-WCS-01 7/19/2010 0 U CAL DRAFT EPA 1630 Methyl Mercury 2.45 0.02 NG/L 3.4230156-004 PR-WCS-01 7/19/2010 0 U CAL SM20-2540 D TSS 13 1 MG/L 3.4230157-004 PR-WCS-01 7/19/2010 0 U STL-MO 160.2 TSS 16 1 MG/L 3.4230091-004 PR-WCS-01 6/8/2010 0 U STL-MO 160.2 TSS 10 1 MG/L 3.4230090-004 PR-WCS-01 6/8/2010 0 U CAL SM20-2540 D TSS 5 2 MG/L 3.4228734-004 PR-WC-12-D7 6/10/2010 0 U CAL EPA 1631E Mercury 15.3 0.2 NG/L -0.0430167-004 PR-WC-12-D7 7/21/2010 0 U BROOKS EPA 1631E Mercury 13.3 0.2 NG/L -0.0430167-004 PR-WC-12-D7 7/21/2010 0 U BROOKS DRAFT EPA 1630 Methyl Mercury 4.27 0.02 NG/L -0.0428734-004 PR-WC-12-D7 6/10/2010 0 U CAL DRAFT EPA 1630 Methyl Mercury 4.54 0.02 NG/L -0.0430168-003 PR-WC-12-D7 7/21/2010 0 U STL-MO 160.2 TSS 3 1 MG/L -0.0430167-004 PR-WC-12-D7 7/21/2010 0 U BROOKS SM20-2540 D TSS 6 2 MG/L -0.0428735-003 PR-WC-12-D7 6/10/2010 0 U STL-MO 160.2 TSS 4 1 MG/L -0.0428734-004 PR-WC-12-D7 6/10/2010 0 U CAL SM20-2540 D TSS 3 2 MG/L -0.0428734-002 PR-WC-11DS 6/10/2010 0 U CAL EPA 1631E Mercury 19.9 0.2 NG/L 0.0130167-002 PR-WC-11DS 7/21/2010 0 U BROOKS EPA 1631E Mercury 33.4 0.2 NG/L 0.0128734-002 PR-WC-11DS 6/10/2010 0 U CAL DRAFT EPA 1630 Methyl Mercury 4.09 0.02 NG/L 0.0130167-002 PR-WC-11DS 7/21/2010 0 U BROOKS DRAFT EPA 1630 Methyl Mercury 2.31 0.02 NG/L 0.0130167-002 PR-WC-11DS 7/21/2010 0 U BROOKS SM20-2540 D TSS 2 2 MG/L U 0.0130168-002 PR-WC-11DS 7/21/2010 0 U STL-MO 160.2 TSS 3 1 MG/L 0.0128734-002 PR-WC-11DS 6/10/2010 0 U CAL SM20-2540 D TSS 2 2 MG/L U 0.0128735-002 PR-WC-11DS 6/10/2010 0 U STL-MO 160.2 TSS 3 1 MG/L 0.0130167-001 PR-WC-10 7/21/2010 0 U BROOKS EPA 1631E Mercury 36.8 0.2 NG/L 0.328734-001 PR-WC-10 6/10/2010 0 U CAL EPA 1631E Mercury 22.5 0.2 NG/L 0.3
2 of 7

Sample Depth Lab Rev DistanceDate (ft.) Qual1 Qual From STP
Sample IDCOC Site
IDFilt. Lab Code Method Analyte Conc. MDL Units
Appendix D
2010 Water Column Total Mercury, Methyl Mercury and TSS Data
28734-001 PR-WC-10 6/10/2010 0 U CAL DRAFT EPA 1630 Methyl Mercury 4.4 0.02 NG/L 0.330167-001 PR-WC-10 7/21/2010 0 U BROOKS DRAFT EPA 1630 Methyl Mercury 1.92 0.02 NG/L 0.330210-004 PR-WC-10 8/5/2010 0 U STL-MO 160.2 TSS 1 1 MG/L 0.330168-001 PR-WC-10 7/21/2010 0 U STL-MO 160.2 TSS 1 1 MG/L U 0.330167-001 PR-WC-10 7/21/2010 0 U BROOKS SM20-2540 D TSS 2 2 MG/L U 0.328776-004 PR-WC-10 6/23/2010 0 U STL-MO 160.2 TSS 3 1 MG/L 0.328734-001 PR-WC-10 6/10/2010 0 U CAL SM20-2540 D TSS 2 2 MG/L U 0.328735-001 PR-WC-10 6/10/2010 0 U STL-MO 160.2 TSS 2 1 MG/L 0.328610-004 PR-WC-10 5/21/2010 0 U STL-MO 160.2 TSS 1 1 MG/L U 0.328732-003 PR-WC-08 6/10/2010 0 U CAL EPA 1631E Mercury 29 0.2 NG/L 0.7830161-003 PR-WC-08 7/20/2010 0 U CAL EPA 1631E Mercury 48 0.2 NG/L 0.7828732-003 PR-WC-08 6/10/2010 0 U CAL DRAFT EPA 1630 Methyl Mercury 3.76 0.02 NG/L 0.7830161-003 PR-WC-08 7/20/2010 0 U CAL DRAFT EPA 1630 Methyl Mercury 2.18 0.02 NG/L 0.7830210-002 PR-WC-08 8/5/2010 0 U STL-MO 160.2 TSS 1 1 MG/L 0.7828610-002 PR-WC-08 5/21/2010 0 U STL-MO 160.2 TSS 1 1 MG/L U 0.7828776-002 PR-WC-08 6/23/2010 0 U STL-MO 160.2 TSS 3 1 MG/L 0.7830162-003 PR-WC-08 7/20/2010 0 U STL-MO 160.2 TSS 3 1 MG/L 0.7830161-003 PR-WC-08 7/20/2010 0 U CAL SM20-2540 D TSS 2 2 MG/L U 0.7828733-003 PR-WC-08 6/10/2010 0 U STL-MO 160.2 TSS 3 1 MG/L 0.7828732-003 PR-WC-08 6/10/2010 0 U CAL SM20-2540 D TSS 2 2 MG/L U 0.7828732-001 PR-WC-06 6/10/2010 0 U CAL EPA 1631E Mercury 23.6 0.2 NG/L 1.130161-001 PR-WC-06 7/20/2010 0 U CAL EPA 1631E Mercury 17.2 0.2 NG/L 1.128732-001 PR-WC-06 6/10/2010 0 U CAL DRAFT EPA 1630 Methyl Mercury 4.67 0.02 NG/L 1.130161-001 PR-WC-06 7/20/2010 0 U CAL DRAFT EPA 1630 Methyl Mercury 1.84 0.02 NG/L 1.130210-001 PR-WC-06 8/5/2010 0 U STL-MO 160.2 TSS 2 1 MG/L 1.128776-001 PR-WC-06 6/23/2010 0 U STL-MO 160.2 TSS 1 1 MG/L 1.130161-001 PR-WC-06 7/20/2010 0 U CAL SM20-2540 D TSS 2 2 MG/L U 1.130162-001 PR-WC-06 7/20/2010 0 U STL-MO 160.2 TSS 6 1 MG/L 1.128732-001 PR-WC-06 6/10/2010 0 U CAL SM20-2540 D TSS 2 2 MG/L U 1.128733-001 PR-WC-06 6/10/2010 0 U STL-MO 160.2 TSS 3 1 MG/L 1.128610-001 PR-WC-06 5/21/2010 0 U STL-MO 160.2 TSS 1 1 MG/L U 1.128727-004 PR-WC-05 6/9/2010 0 U CAL EPA 1631E Mercury 35.3 0.2 NG/L 1.4630159-004 PR-WC-05 7/20/2010 0 U CAL EPA 1631E Mercury 26.6 0.2 NG/L 1.4628727-004 PR-WC-05 6/9/2010 0 U CAL DRAFT EPA 1630 Methyl Mercury 6.74 0.02 NG/L 1.4630159-004 PR-WC-05 7/20/2010 0 U CAL DRAFT EPA 1630 Methyl Mercury 2.61 0.02 NG/L 1.4630160-004 PR-WC-05 7/20/2010 0 U STL-MO 160.2 TSS 1 1 MG/L 1.4630159-004 PR-WC-05 7/20/2010 0 U CAL SM20-2540 D TSS 3 2 MG/L 1.4628727-004 PR-WC-05 6/9/2010 0 U CAL SM20-2540 D TSS 28 2 MG/L 1.46
3 of 7

Sample Depth Lab Rev DistanceDate (ft.) Qual1 Qual From STP
Sample IDCOC Site
IDFilt. Lab Code Method Analyte Conc. MDL Units
Appendix D
2010 Water Column Total Mercury, Methyl Mercury and TSS Data
28728-004 PR-WC-05 6/9/2010 0 U STL-MO 160.2 TSS 7 1 MG/L 1.4628727-002 PR-WC-03 6/9/2010 0 U CAL EPA 1631E Mercury 25.3 0.2 NG/L 2.130159-002 PR-WC-03 7/20/2010 0 U CAL EPA 1631E Mercury 12 0.2 NG/L 2.128727-002 PR-WC-03 6/9/2010 0 U CAL DRAFT EPA 1630 Methyl Mercury 3.9 0.02 NG/L 2.130159-002 PR-WC-03 7/20/2010 0 U CAL DRAFT EPA 1630 Methyl Mercury 4.3 0.02 NG/L 2.130206-003 PR-WC-03 8/4/2010 0 U STL-MO 160.2 TSS 5 1 MG/L 2.128774-003 PR-WC-03 6/23/2010 0 U STL-MO 160.2 TSS 1 1 MG/L 2.130159-002 PR-WC-03 7/20/2010 0 U CAL SM20-2540 D TSS 2 2 MG/L U 2.130160-002 PR-WC-03 7/20/2010 0 U STL-MO 160.2 TSS 4 1 MG/L 2.128728-002 PR-WC-03 6/9/2010 0 U STL-MO 160.2 TSS 2 1 MG/L 2.128727-002 PR-WC-03 6/9/2010 0 U CAL SM20-2540 D TSS 2 2 MG/L U 2.128609-003 PR-WC-03 5/20/2010 0 U STL-MO 160.2 TSS 1 1 MG/L U 2.130091-002 PR-WC-03 6/8/2010 0 U STL-MO 160.2 TSS 13 1 MG/L 2.130090-005 PR-WC-01 6/8/2010 0 U CAL EPA 1631E Mercury 15.9 0.2 NG/L 2.9830159-001 PR-WC-01 7/20/2010 0 U CAL EPA 1631E Mercury 4.6 0.2 NG/L 2.9830159-001 PR-WC-01 7/20/2010 0 U CAL DRAFT EPA 1630 Methyl Mercury 0.829 0.02 NG/L 2.9830090-005 PR-WC-01 6/8/2010 0 U CAL DRAFT EPA 1630 Methyl Mercury 1.25 0.02 NG/L 2.9828774-002 PR-WC-01 6/23/2010 0 U STL-MO 160.2 TSS 8 1 MG/L 2.9830091-005 PR-WC-01 6/8/2010 0 U STL-MO 160.2 TSS 7 1 MG/L 2.9830090-005 PR-WC-01 6/8/2010 0 U CAL SM20-2540 D TSS 2 2 MG/L U 2.9830206-002 PR-WC-01 8/4/2010 0 U STL-MO 160.2 TSS 5 1 MG/L 2.9830160-001 PR-WC-01 7/20/2010 0 U STL-MO 160.2 TSS 1 1 MG/L 2.9830159-001 PR-WC-01 7/20/2010 0 U CAL SM20-2540 D TSS 2 2 MG/L U 2.9828609-002 PR-WC-01 5/20/2010 0 U STL-MO 160.2 TSS 1 1 MG/L U 2.9828398-004 WC-4 3/9/2010 0 U BROOKS EPA 1631 Mercury 19.8 0.59 ng/L28520-004 WC-4 4/21/2010 0 U CAL EPA 1631E Mercury 17 0.2 NG/L28729-004 WC-4 6/9/2010 0 U CAL EPA 1631E Mercury 26.4 0.2 NG/L30166-004 WC-4 7/21/2010 0 U CAL EPA 1631E Mercury 15.6 0.2 NG/L28729-004 WC-4 6/9/2010 0 U CAL DRAFT EPA 1630 Methyl Mercury 4.63 0.02 NG/L30166-004 WC-4 7/21/2010 0 U CAL DRAFT EPA 1630 Methyl Mercury 1.72 0.02 NG/L28398-004 WC-4 3/9/2010 0 U BROOKS EPA 1630 Methyl Mercury 0.594 0.039 ng/L28520-004 WC-4 4/21/2010 0 U CAL DRAFT EPA 1630 Methyl Mercury 0.959 0.02 NG/L28729-004 WC-4 6/9/2010 0 U CAL SM20-2540 D TSS 2 2 MG/L U28730-004 WC-4 6/9/2010 0 U STL-MO 160.2 TSS 1 1 MG/L U30166-004 WC-4 7/21/2010 0 U CAL SM20-2540 D TSS 2 2 MG/L U30165-004 WC-4 7/21/2010 0 U STL-MO 160.2 TSS 1 1 MG/L28520-004 WC-4 4/21/2010 0 U CAL SM20-2540 D TSS 2 2 MG/L U28398-004 WC-4 3/9/2010 0 U BROOKS EPA 160.2 TSS 0.8 0.8 mg/L U
4 of 7
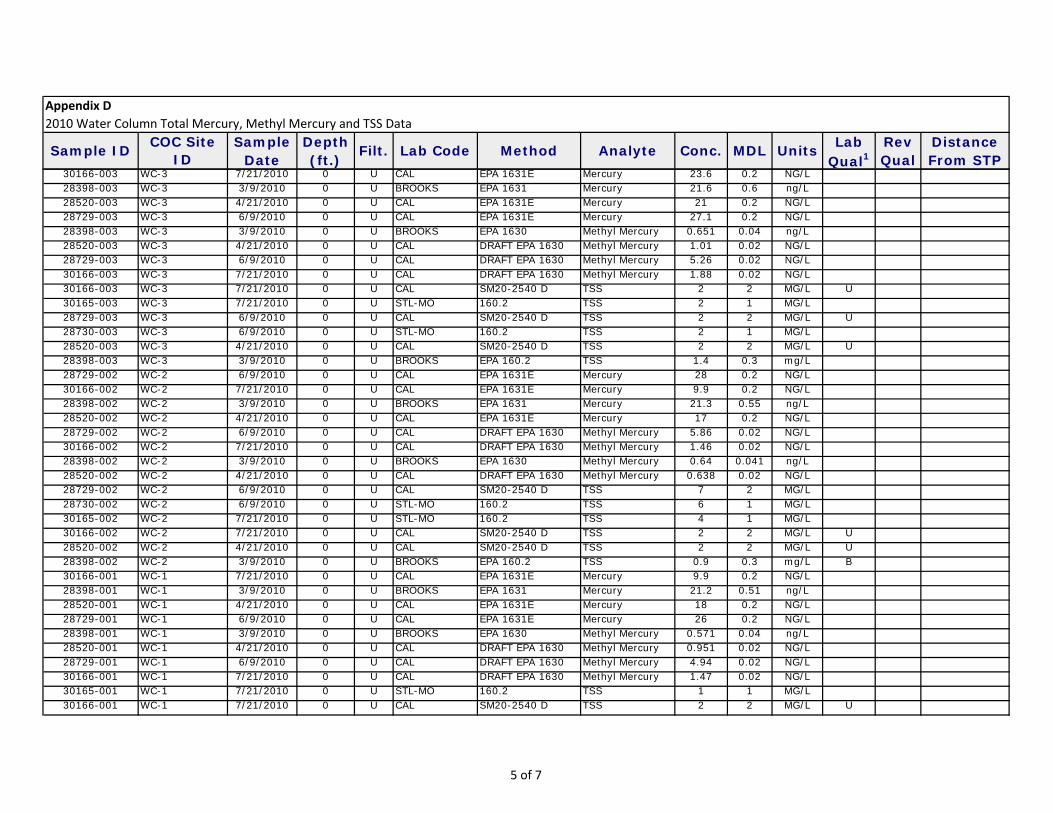
Sample Depth Lab Rev DistanceDate (ft.) Qual1 Qual From STP
Sample IDCOC Site
IDFilt. Lab Code Method Analyte Conc. MDL Units
Appendix D
2010 Water Column Total Mercury, Methyl Mercury and TSS Data
30166-003 WC-3 7/21/2010 0 U CAL EPA 1631E Mercury 23.6 0.2 NG/L28398-003 WC-3 3/9/2010 0 U BROOKS EPA 1631 Mercury 21.6 0.6 ng/L28520-003 WC-3 4/21/2010 0 U CAL EPA 1631E Mercury 21 0.2 NG/L28729-003 WC-3 6/9/2010 0 U CAL EPA 1631E Mercury 27.1 0.2 NG/L28398-003 WC-3 3/9/2010 0 U BROOKS EPA 1630 Methyl Mercury 0.651 0.04 ng/L28520-003 WC-3 4/21/2010 0 U CAL DRAFT EPA 1630 Methyl Mercury 1.01 0.02 NG/L28729-003 WC-3 6/9/2010 0 U CAL DRAFT EPA 1630 Methyl Mercury 5.26 0.02 NG/L30166-003 WC-3 7/21/2010 0 U CAL DRAFT EPA 1630 Methyl Mercury 1.88 0.02 NG/L30166-003 WC-3 7/21/2010 0 U CAL SM20-2540 D TSS 2 2 MG/L U30165-003 WC-3 7/21/2010 0 U STL-MO 160.2 TSS 2 1 MG/L28729-003 WC-3 6/9/2010 0 U CAL SM20-2540 D TSS 2 2 MG/L U28730-003 WC-3 6/9/2010 0 U STL-MO 160.2 TSS 2 1 MG/L28520-003 WC-3 4/21/2010 0 U CAL SM20-2540 D TSS 2 2 MG/L U28398-003 WC-3 3/9/2010 0 U BROOKS EPA 160.2 TSS 1.4 0.3 mg/L28729-002 WC-2 6/9/2010 0 U CAL EPA 1631E Mercury 28 0.2 NG/L30166-002 WC-2 7/21/2010 0 U CAL EPA 1631E Mercury 9.9 0.2 NG/L28398-002 WC-2 3/9/2010 0 U BROOKS EPA 1631 Mercury 21.3 0.55 ng/L28520-002 WC-2 4/21/2010 0 U CAL EPA 1631E Mercury 17 0.2 NG/L28729-002 WC-2 6/9/2010 0 U CAL DRAFT EPA 1630 Methyl Mercury 5.86 0.02 NG/L30166-002 WC-2 7/21/2010 0 U CAL DRAFT EPA 1630 Methyl Mercury 1.46 0.02 NG/L28398-002 WC-2 3/9/2010 0 U BROOKS EPA 1630 Methyl Mercury 0.64 0.041 ng/L28520-002 WC-2 4/21/2010 0 U CAL DRAFT EPA 1630 Methyl Mercury 0.638 0.02 NG/L28729-002 WC-2 6/9/2010 0 U CAL SM20-2540 D TSS 7 2 MG/L28730-002 WC-2 6/9/2010 0 U STL-MO 160.2 TSS 6 1 MG/L30165-002 WC-2 7/21/2010 0 U STL-MO 160.2 TSS 4 1 MG/L30166-002 WC-2 7/21/2010 0 U CAL SM20-2540 D TSS 2 2 MG/L U28520-002 WC-2 4/21/2010 0 U CAL SM20-2540 D TSS 2 2 MG/L U28398-002 WC-2 3/9/2010 0 U BROOKS EPA 160.2 TSS 0.9 0.3 mg/L B30166-001 WC-1 7/21/2010 0 U CAL EPA 1631E Mercury 9.9 0.2 NG/L28398-001 WC-1 3/9/2010 0 U BROOKS EPA 1631 Mercury 21.2 0.51 ng/L28520-001 WC-1 4/21/2010 0 U CAL EPA 1631E Mercury 18 0.2 NG/L28729-001 WC-1 6/9/2010 0 U CAL EPA 1631E Mercury 26 0.2 NG/L28398-001 WC-1 3/9/2010 0 U BROOKS EPA 1630 Methyl Mercury 0.571 0.04 ng/L28520-001 WC-1 4/21/2010 0 U CAL DRAFT EPA 1630 Methyl Mercury 0.951 0.02 NG/L28729-001 WC-1 6/9/2010 0 U CAL DRAFT EPA 1630 Methyl Mercury 4.94 0.02 NG/L30166-001 WC-1 7/21/2010 0 U CAL DRAFT EPA 1630 Methyl Mercury 1.47 0.02 NG/L30165-001 WC-1 7/21/2010 0 U STL-MO 160.2 TSS 1 1 MG/L30166-001 WC-1 7/21/2010 0 U CAL SM20-2540 D TSS 2 2 MG/L U
5 of 7

Sample Depth Lab Rev DistanceDate (ft.) Qual1 Qual From STP
Sample IDCOC Site
IDFilt. Lab Code Method Analyte Conc. MDL Units
Appendix D
2010 Water Column Total Mercury, Methyl Mercury and TSS Data
28729-001 WC-1 6/9/2010 0 U CAL SM20-2540 D TSS 2 2 MG/L U28730-001 WC-1 6/9/2010 0 U STL-MO 160.2 TSS 1 1 MG/L28520-001 WC-1 4/21/2010 0 U CAL SM20-2540 D TSS 2 2 MG/L U28398-001 WC-1 3/9/2010 0 U BROOKS EPA 160.2 TSS 1.2 0.3 mg/L28398-008 WC4 3/9/2010 0 U BROOKS EPA 1631 Mercury 21.1 0.56 ng/L28520-008 WC4 4/21/2010 0 U CAL EPA 1631E Mercury 17 0.2 NG/L28729-008 WC4 6/9/2010 0 U CAL EPA 1631E Mercury 32.8 0.2 NG/L30166-008 WC4 7/21/2010 0 U CAL EPA 1631E Mercury 14 0.2 NG/L30166-008 WC4 7/21/2010 0 U CAL DRAFT EPA 1630 Methyl Mercury 2.55 0.02 NG/L28520-008 WC4 4/21/2010 0 U CAL DRAFT EPA 1630 Methyl Mercury 1.05 0.02 NG/L28729-008 WC4 6/9/2010 0 U CAL DRAFT EPA 1630 Methyl Mercury 4.62 0.02 NG/L28398-008 WC4 3/9/2010 0 U BROOKS EPA 1630 Methyl Mercury 0.684 0.04 ng/L28520-008 WC4 4/21/2010 0 U CAL SM20-2540 D TSS 2 2 MG/L U28729-008 WC4 6/9/2010 0 U CAL SM20-2540 D TSS 2 2 MG/L JB30165-008 WC4 7/21/2010 0 U STL-MO 160.2 TSS 5 1 MG/L30166-008 WC4 7/21/2010 0 U CAL SM20-2540 D TSS 5 2 MG/L28398-008 WC4 3/9/2010 0 U BROOKS EPA 160.2 TSS 1.5 0.3 mg/L30166-007 WC3 7/21/2010 0 U CAL EPA 1631E Mercury 16.9 0.2 NG/L28729-007 WC3 6/9/2010 0 U CAL EPA 1631E Mercury 28.1 0.2 NG/L28398-007 WC3 3/9/2010 0 U BROOKS EPA 1631 Mercury 20.7 0.59 ng/L28520-007 WC3 4/21/2010 0 U CAL EPA 1631E Mercury 16 0.2 NG/L28398-007 WC3 3/9/2010 0 U BROOKS EPA 1630 Methyl Mercury 0.636 0.04 ng/L28520-007 WC3 4/21/2010 0 U CAL DRAFT EPA 1630 Methyl Mercury 0.987 0.02 NG/L28729-007 WC3 6/9/2010 0 U CAL DRAFT EPA 1630 Methyl Mercury 4.53 0.02 NG/L30166-007 WC3 7/21/2010 0 U CAL DRAFT EPA 1630 Methyl Mercury 2.15 0.02 NG/L28729-007 WC3 6/9/2010 0 U CAL SM20-2540 D TSS 2 2 MG/L U30166-007 WC3 7/21/2010 0 U CAL SM20-2540 D TSS 3 2 MG/L30165-007 WC3 7/21/2010 0 U STL-MO 160.2 TSS 7 1 MG/L28520-007 WC3 4/21/2010 0 U CAL SM20-2540 D TSS 2 2 MG/L U28398-007 WC3 3/9/2010 0 U BROOKS EPA 160.2 TSS 0.9 0.3 mg/L B30166-006 WC2 7/21/2010 0 U CAL EPA 1631E Mercury 12.2 0.2 NG/L28398-006 WC2 3/9/2010 0 U BROOKS EPA 1631 Mercury 21.3 0.58 ng/L28520-006 WC2 4/21/2010 0 U CAL EPA 1631E Mercury 15 0.2 NG/L28729-006 WC2 6/9/2010 0 U CAL EPA 1631E Mercury 27.3 0.2 NG/L28520-006 WC2 4/21/2010 0 U CAL DRAFT EPA 1630 Methyl Mercury 0.228 0.02 NG/L28729-006 WC2 6/9/2010 0 U CAL DRAFT EPA 1630 Methyl Mercury 4.07 0.02 NG/L28398-006 WC2 3/9/2010 0 U BROOKS EPA 1630 Methyl Mercury 0.85 0.04 ng/L30166-006 WC2 7/21/2010 0 U CAL DRAFT EPA 1630 Methyl Mercury 2.96 0.02 NG/L
6 of 7

Sample Depth Lab Rev DistanceDate (ft.) Qual1 Qual From STP
Sample IDCOC Site
IDFilt. Lab Code Method Analyte Conc. MDL Units
Appendix D
2010 Water Column Total Mercury, Methyl Mercury and TSS Data
30165-006 WC2 7/21/2010 0 U STL-MO 160.2 TSS 5 1 MG/L30166-006 WC2 7/21/2010 0 U CAL SM20-2540 D TSS 2 2 MG/L U28520-006 WC2 4/21/2010 0 U CAL SM20-2540 D TSS 2 2 MG/L U28729-006 WC2 6/9/2010 0 U CAL SM20-2540 D TSS 2 2 MG/L U28730-006 WC2 6/9/2010 0 U STL-MO 160.2 TSS 3 1 MG/L28398-006 WC2 3/9/2010 0 U BROOKS EPA 160.2 TSS 1.3 0.3 mg/L30166-005 WC1 7/21/2010 0 U CAL EPA 1631E Mercury 12.3 0.2 NG/L28729-005 WC1 6/9/2010 0 U CAL EPA 1631E Mercury 26 0.2 NG/L28398-005 WC1 3/9/2010 0 U BROOKS EPA 1631 Mercury 21.2 0.46 ng/L28520-005 WC1 4/21/2010 0 U CAL EPA 1631E Mercury 16 0.2 NG/L28398-005 WC1 3/9/2010 0 U BROOKS EPA 1630 Methyl Mercury 0.869 0.039 ng/L28520-005 WC1 4/21/2010 0 U CAL DRAFT EPA 1630 Methyl Mercury 0.692 0.02 NG/L28729-005 WC1 6/9/2010 0 U CAL DRAFT EPA 1630 Methyl Mercury 3.92 0.02 NG/L30166-005 WC1 7/21/2010 0 U CAL DRAFT EPA 1630 Methyl Mercury 3.15 0.02 NG/L28729-005 WC1 6/9/2010 0 U CAL SM20-2540 D TSS 2 2 MG/L JB28730-005 WC1 6/9/2010 0 U STL-MO 160.2 TSS 2 1 MG/L30165-005 WC1 7/21/2010 0 U STL-MO 160.2 TSS 3 1 MG/L30166-005 WC1 7/21/2010 0 U CAL SM20-2540 D TSS 2 2 MG/L U28520-005 WC1 4/21/2010 0 U CAL SM20-2540 D TSS 2 2 MG/L U28398-005 WC1 3/9/2010 0 U BROOKS EPA 160.2 TSS 1.7 0.3 mg/L
1 Qualifiers
B ‐
U ‐ Indicates that the analyte was analyzed for but not detected.
J ‐
Indicates that the reported value was obtained from a reading that was less than the Contract Required Detection Limit (CRDL), but greater than or equal
Indicates an estimated value. This flag is used either when estimating a concentration for tentatively identified compounds (TICs) where a 1:1 response is
of a compound that meets the identification criteria but the result is less than the sample quantitation limit but greater than zero.
7 of 7
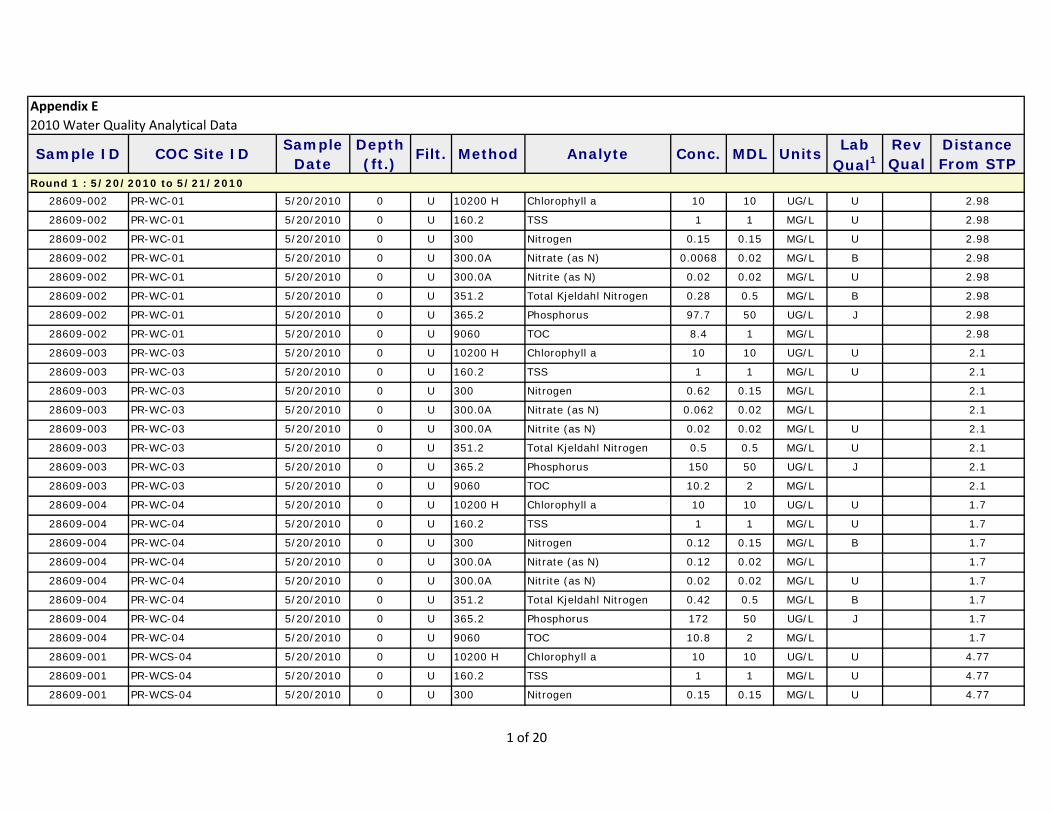
Sample Depth Lab Rev DistanceDate (ft.) Qual1 Qual From STP
28609-002 PR-WC-01 5/20/2010 0 U 10200 H Chlorophyll a 10 10 UG/L U 2.98
28609-002 PR-WC-01 5/20/2010 0 U 160.2 TSS 1 1 MG/L U 2.98
28609-002 PR-WC-01 5/20/2010 0 U 300 Nitrogen 0.15 0.15 MG/L U 2.98
28609-002 PR-WC-01 5/20/2010 0 U 300.0A Nitrate (as N) 0.0068 0.02 MG/L B 2.98
28609-002 PR-WC-01 5/20/2010 0 U 300.0A Nitrite (as N) 0.02 0.02 MG/L U 2.98
28609-002 PR-WC-01 5/20/2010 0 U 351.2 Total Kjeldahl Nitrogen 0.28 0.5 MG/L B 2.98
28609-002 PR-WC-01 5/20/2010 0 U 365.2 Phosphorus 97.7 50 UG/L J 2.98
28609-002 PR-WC-01 5/20/2010 0 U 9060 TOC 8.4 1 MG/L 2.98
28609-003 PR-WC-03 5/20/2010 0 U 10200 H Chlorophyll a 10 10 UG/L U 2.1
28609-003 PR-WC-03 5/20/2010 0 U 160.2 TSS 1 1 MG/L U 2.1
28609-003 PR-WC-03 5/20/2010 0 U 300 Nitrogen 0.62 0.15 MG/L 2.1
28609-003 PR-WC-03 5/20/2010 0 U 300.0A Nitrate (as N) 0.062 0.02 MG/L 2.1
28609-003 PR-WC-03 5/20/2010 0 U 300.0A Nitrite (as N) 0.02 0.02 MG/L U 2.1
28609-003 PR-WC-03 5/20/2010 0 U 351.2 Total Kjeldahl Nitrogen 0.5 0.5 MG/L U 2.1
28609-003 PR-WC-03 5/20/2010 0 U 365.2 Phosphorus 150 50 UG/L J 2.1
28609-003 PR-WC-03 5/20/2010 0 U 9060 TOC 10.2 2 MG/L 2.1
28609-004 PR-WC-04 5/20/2010 0 U 10200 H Chlorophyll a 10 10 UG/L U 1.7
28609-004 PR-WC-04 5/20/2010 0 U 160.2 TSS 1 1 MG/L U 1.7
28609-004 PR-WC-04 5/20/2010 0 U 300 Nitrogen 0.12 0.15 MG/L B 1.7
28609-004 PR-WC-04 5/20/2010 0 U 300.0A Nitrate (as N) 0.12 0.02 MG/L 1.7
28609-004 PR-WC-04 5/20/2010 0 U 300.0A Nitrite (as N) 0.02 0.02 MG/L U 1.7
28609-004 PR-WC-04 5/20/2010 0 U 351.2 Total Kjeldahl Nitrogen 0.42 0.5 MG/L B 1.7
28609-004 PR-WC-04 5/20/2010 0 U 365.2 Phosphorus 172 50 UG/L J 1.7
28609-004 PR-WC-04 5/20/2010 0 U 9060 TOC 10.8 2 MG/L 1.7
28609-001 PR-WCS-04 5/20/2010 0 U 10200 H Chlorophyll a 10 10 UG/L U 4.77
28609-001 PR-WCS-04 5/20/2010 0 U 160.2 TSS 1 1 MG/L U 4.77
28609-001 PR-WCS-04 5/20/2010 0 U 300 Nitrogen 0.15 0.15 MG/L U 4.77
Appendix E
2010 Water Quality Analytical Data
MDL Units
Round 1 : 5/20/2010 to 5/21/2010
Sample ID COC Site ID Filt. Method Analyte Conc.
1 of 20
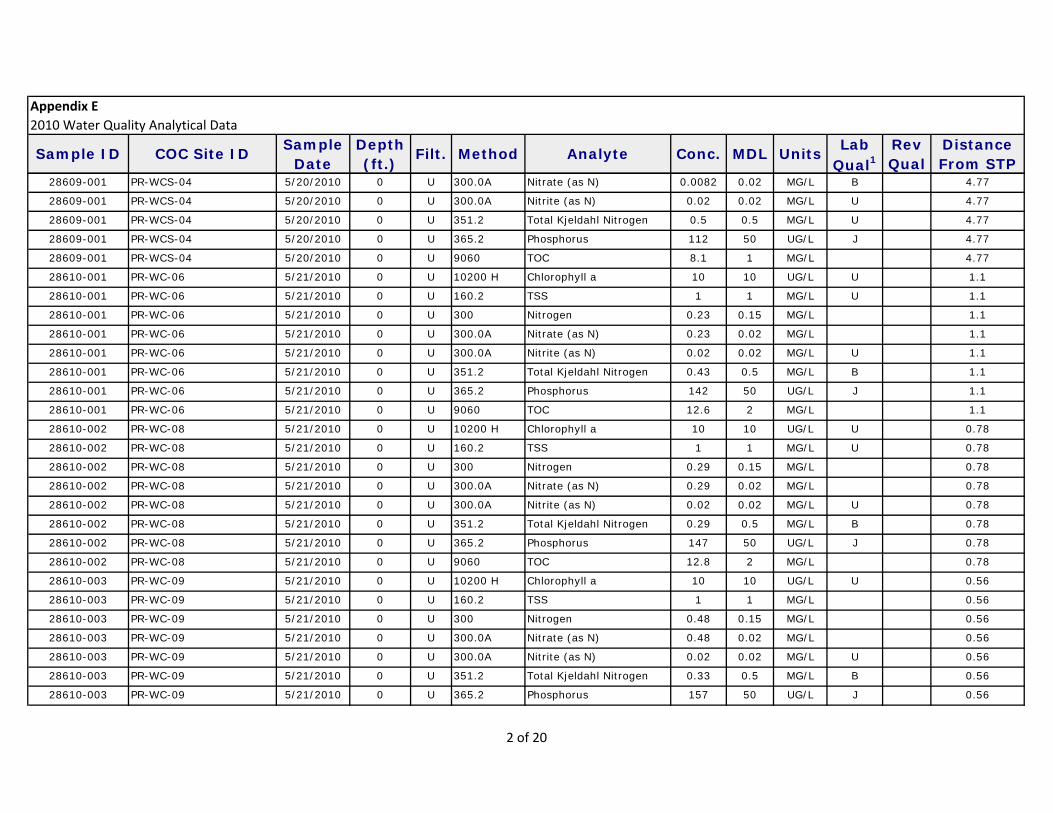
Sample Depth Lab Rev DistanceDate (ft.) Qual1 Qual From STP
Appendix E
2010 Water Quality Analytical Data
MDL UnitsSample ID COC Site ID Filt. Method Analyte Conc.
28609-001 PR-WCS-04 5/20/2010 0 U 300.0A Nitrate (as N) 0.0082 0.02 MG/L B 4.77
28609-001 PR-WCS-04 5/20/2010 0 U 300.0A Nitrite (as N) 0.02 0.02 MG/L U 4.77
28609-001 PR-WCS-04 5/20/2010 0 U 351.2 Total Kjeldahl Nitrogen 0.5 0.5 MG/L U 4.77
28609-001 PR-WCS-04 5/20/2010 0 U 365.2 Phosphorus 112 50 UG/L J 4.77
28609-001 PR-WCS-04 5/20/2010 0 U 9060 TOC 8.1 1 MG/L 4.77
28610-001 PR-WC-06 5/21/2010 0 U 10200 H Chlorophyll a 10 10 UG/L U 1.1
28610-001 PR-WC-06 5/21/2010 0 U 160.2 TSS 1 1 MG/L U 1.1
28610-001 PR-WC-06 5/21/2010 0 U 300 Nitrogen 0.23 0.15 MG/L 1.1
28610-001 PR-WC-06 5/21/2010 0 U 300.0A Nitrate (as N) 0.23 0.02 MG/L 1.1
28610-001 PR-WC-06 5/21/2010 0 U 300.0A Nitrite (as N) 0.02 0.02 MG/L U 1.1
28610-001 PR-WC-06 5/21/2010 0 U 351.2 Total Kjeldahl Nitrogen 0.43 0.5 MG/L B 1.1
28610-001 PR-WC-06 5/21/2010 0 U 365.2 Phosphorus 142 50 UG/L J 1.1
28610-001 PR-WC-06 5/21/2010 0 U 9060 TOC 12.6 2 MG/L 1.1
28610-002 PR-WC-08 5/21/2010 0 U 10200 H Chlorophyll a 10 10 UG/L U 0.78
28610-002 PR-WC-08 5/21/2010 0 U 160.2 TSS 1 1 MG/L U 0.78
28610-002 PR-WC-08 5/21/2010 0 U 300 Nitrogen 0.29 0.15 MG/L 0.78
28610-002 PR-WC-08 5/21/2010 0 U 300.0A Nitrate (as N) 0.29 0.02 MG/L 0.78
28610-002 PR-WC-08 5/21/2010 0 U 300.0A Nitrite (as N) 0.02 0.02 MG/L U 0.78
28610-002 PR-WC-08 5/21/2010 0 U 351.2 Total Kjeldahl Nitrogen 0.29 0.5 MG/L B 0.78
28610-002 PR-WC-08 5/21/2010 0 U 365.2 Phosphorus 147 50 UG/L J 0.78
28610-002 PR-WC-08 5/21/2010 0 U 9060 TOC 12.8 2 MG/L 0.78
28610-003 PR-WC-09 5/21/2010 0 U 10200 H Chlorophyll a 10 10 UG/L U 0.56
28610-003 PR-WC-09 5/21/2010 0 U 160.2 TSS 1 1 MG/L 0.56
28610-003 PR-WC-09 5/21/2010 0 U 300 Nitrogen 0.48 0.15 MG/L 0.56
28610-003 PR-WC-09 5/21/2010 0 U 300.0A Nitrate (as N) 0.48 0.02 MG/L 0.56
28610-003 PR-WC-09 5/21/2010 0 U 300.0A Nitrite (as N) 0.02 0.02 MG/L U 0.56
28610-003 PR-WC-09 5/21/2010 0 U 351.2 Total Kjeldahl Nitrogen 0.33 0.5 MG/L B 0.56
28610-003 PR-WC-09 5/21/2010 0 U 365.2 Phosphorus 157 50 UG/L J 0.56
2 of 20
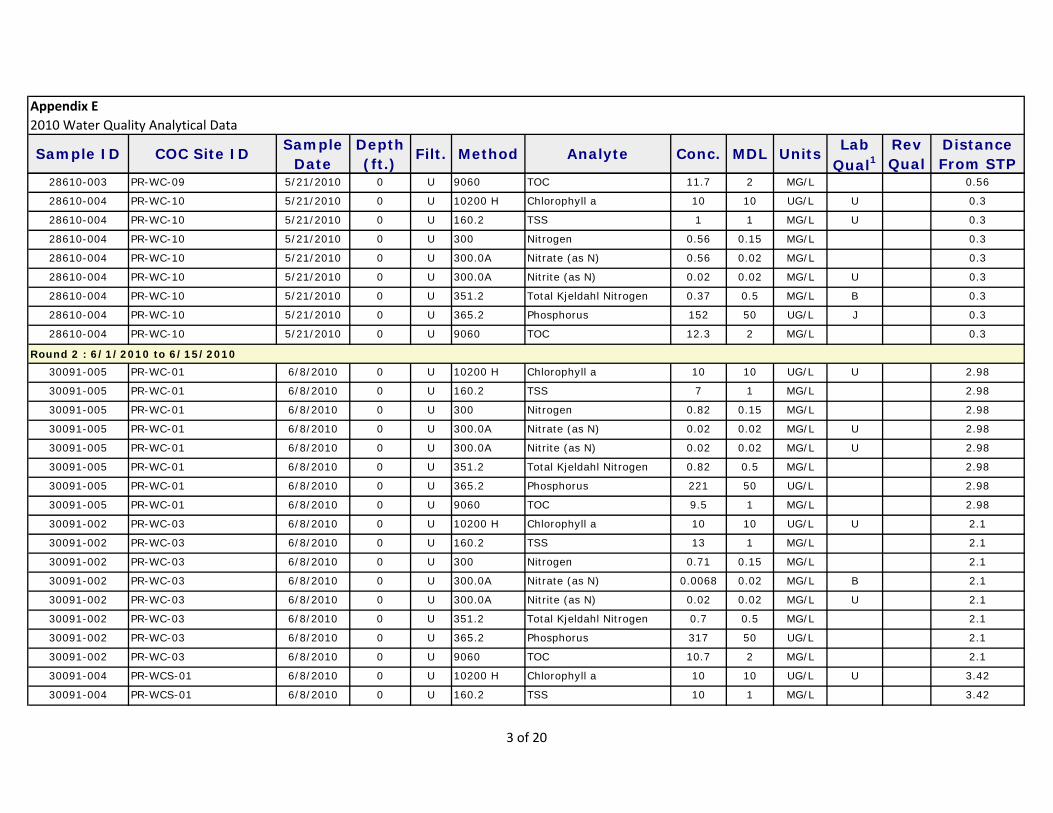
Sample Depth Lab Rev DistanceDate (ft.) Qual1 Qual From STP
Appendix E
2010 Water Quality Analytical Data
MDL UnitsSample ID COC Site ID Filt. Method Analyte Conc.
28610-003 PR-WC-09 5/21/2010 0 U 9060 TOC 11.7 2 MG/L 0.56
28610-004 PR-WC-10 5/21/2010 0 U 10200 H Chlorophyll a 10 10 UG/L U 0.3
28610-004 PR-WC-10 5/21/2010 0 U 160.2 TSS 1 1 MG/L U 0.3
28610-004 PR-WC-10 5/21/2010 0 U 300 Nitrogen 0.56 0.15 MG/L 0.3
28610-004 PR-WC-10 5/21/2010 0 U 300.0A Nitrate (as N) 0.56 0.02 MG/L 0.3
28610-004 PR-WC-10 5/21/2010 0 U 300.0A Nitrite (as N) 0.02 0.02 MG/L U 0.3
28610-004 PR-WC-10 5/21/2010 0 U 351.2 Total Kjeldahl Nitrogen 0.37 0.5 MG/L B 0.3
28610-004 PR-WC-10 5/21/2010 0 U 365.2 Phosphorus 152 50 UG/L J 0.3
28610-004 PR-WC-10 5/21/2010 0 U 9060 TOC 12.3 2 MG/L 0.3
30091-005 PR-WC-01 6/8/2010 0 U 10200 H Chlorophyll a 10 10 UG/L U 2.98
30091-005 PR-WC-01 6/8/2010 0 U 160.2 TSS 7 1 MG/L 2.98
30091-005 PR-WC-01 6/8/2010 0 U 300 Nitrogen 0.82 0.15 MG/L 2.98
30091-005 PR-WC-01 6/8/2010 0 U 300.0A Nitrate (as N) 0.02 0.02 MG/L U 2.98
30091-005 PR-WC-01 6/8/2010 0 U 300.0A Nitrite (as N) 0.02 0.02 MG/L U 2.98
30091-005 PR-WC-01 6/8/2010 0 U 351.2 Total Kjeldahl Nitrogen 0.82 0.5 MG/L 2.98
30091-005 PR-WC-01 6/8/2010 0 U 365.2 Phosphorus 221 50 UG/L 2.98
30091-005 PR-WC-01 6/8/2010 0 U 9060 TOC 9.5 1 MG/L 2.98
30091-002 PR-WC-03 6/8/2010 0 U 10200 H Chlorophyll a 10 10 UG/L U 2.1
30091-002 PR-WC-03 6/8/2010 0 U 160.2 TSS 13 1 MG/L 2.1
30091-002 PR-WC-03 6/8/2010 0 U 300 Nitrogen 0.71 0.15 MG/L 2.1
30091-002 PR-WC-03 6/8/2010 0 U 300.0A Nitrate (as N) 0.0068 0.02 MG/L B 2.1
30091-002 PR-WC-03 6/8/2010 0 U 300.0A Nitrite (as N) 0.02 0.02 MG/L U 2.1
30091-002 PR-WC-03 6/8/2010 0 U 351.2 Total Kjeldahl Nitrogen 0.7 0.5 MG/L 2.1
30091-002 PR-WC-03 6/8/2010 0 U 365.2 Phosphorus 317 50 UG/L 2.1
30091-002 PR-WC-03 6/8/2010 0 U 9060 TOC 10.7 2 MG/L 2.1
30091-004 PR-WCS-01 6/8/2010 0 U 10200 H Chlorophyll a 10 10 UG/L U 3.42
30091-004 PR-WCS-01 6/8/2010 0 U 160.2 TSS 10 1 MG/L 3.42
Round 2 : 6/1/2010 to 6/15/2010
3 of 20

Sample Depth Lab Rev DistanceDate (ft.) Qual1 Qual From STP
Appendix E
2010 Water Quality Analytical Data
MDL UnitsSample ID COC Site ID Filt. Method Analyte Conc.
30091-004 PR-WCS-01 6/8/2010 0 U 300 Nitrogen 0.88 0.15 MG/L 3.42
30091-004 PR-WCS-01 6/8/2010 0 U 300.0A Nitrate (as N) 0.02 0.02 MG/L U 3.42
30091-004 PR-WCS-01 6/8/2010 0 U 300.0A Nitrite (as N) 0.02 0.02 MG/L U 3.42
30091-004 PR-WCS-01 6/8/2010 0 U 351.2 Total Kjeldahl Nitrogen 0.88 0.5 MG/L 3.42
30091-004 PR-WCS-01 6/8/2010 0 U 365.2 Phosphorus 251 50 UG/L 3.42
30091-004 PR-WCS-01 6/8/2010 0 U 9060 TOC 10.2 2 MG/L 3.42
30091-003 PR-WCS-02 6/8/2010 0 U 10200 H Chlorophyll a 10 10 UG/L U 3.99
30091-003 PR-WCS-02 6/8/2010 0 U 160.2 TSS 12 1 MG/L 3.99
30091-003 PR-WCS-02 6/8/2010 0 U 300 Nitrogen 0.98 0.15 MG/L 3.99
30091-003 PR-WCS-02 6/8/2010 0 U 300.0A Nitrate (as N) 0.02 0.02 MG/L U 3.99
30091-003 PR-WCS-02 6/8/2010 0 U 300.0A Nitrite (as N) 0.02 0.02 MG/L U 3.99
30091-003 PR-WCS-02 6/8/2010 0 U 351.2 Total Kjeldahl Nitrogen 0.98 0.5 MG/L 3.99
30091-003 PR-WCS-02 6/8/2010 0 U 365.2 Phosphorus 347 50 UG/L 3.99
30091-003 PR-WCS-02 6/8/2010 0 U 9060 TOC 9.8 2 MG/L 3.99
30091-001 PR-WCS-04 6/8/2010 0 U 10200 H Chlorophyll a 10 10 UG/L U 4.77
30091-001 PR-WCS-04 6/8/2010 0 U 160.2 TSS 16 1 MG/L 4.77
30091-001 PR-WCS-04 6/8/2010 0 U 300 Nitrogen 0.7 0.15 MG/L 4.77
30091-001 PR-WCS-04 6/8/2010 0 U 300.0A Nitrate (as N) 0.02 0.02 MG/L U 4.77
30091-001 PR-WCS-04 6/8/2010 0 U 300.0A Nitrite (as N) 0.02 0.02 MG/L U 4.77
30091-001 PR-WCS-04 6/8/2010 0 U 351.2 Total Kjeldahl Nitrogen 0.72 0.5 MG/L 4.77
30091-001 PR-WCS-04 6/8/2010 0 U 365.2 Phosphorus 326 50 UG/L 4.77
30091-001 PR-WCS-04 6/8/2010 0 U 9060 TOC 10.5 2 MG/L 4.77
28728-001 PR-WC-02 6/9/2010 0 U 10200 H Chlorophyll a 10 10 UG/L U 2.52
28728-001 PR-WC-02 6/9/2010 0 U 160.2 TSS 2 1 MG/L 2.52
28728-001 PR-WC-02 6/9/2010 0 U 300 Nitrogen 1.2 0.15 MG/L 2.52
28728-001 PR-WC-02 6/9/2010 0 U 300.0A Nitrate (as N) 0.02 0.02 MG/L U 2.52
28728-001 PR-WC-02 6/9/2010 0 U 300.0A Nitrite (as N) 0.02 0.02 MG/L U 2.52
28728-001 PR-WC-02 6/9/2010 0 U 351.2 Total Kjeldahl Nitrogen 1.2 0.5 MG/L 2.52
4 of 20

Sample Depth Lab Rev DistanceDate (ft.) Qual1 Qual From STP
Appendix E
2010 Water Quality Analytical Data
MDL UnitsSample ID COC Site ID Filt. Method Analyte Conc.
28728-001 PR-WC-02 6/9/2010 0 U 365.2 Phosphorus 209 50 UG/L 2.52
28728-001 PR-WC-02 6/9/2010 0 U 9060 TOC 9.5 1 MG/L 2.52
28728-002 PR-WC-03 6/9/2010 0 U 10200 H Chlorophyll a 10 10 UG/L U 2.1
28728-002 PR-WC-03 6/9/2010 0 U 160.2 TSS 2 1 MG/L 2.1
28728-002 PR-WC-03 6/9/2010 0 U 300 Nitrogen 1.3 0.15 MG/L 2.1
28728-002 PR-WC-03 6/9/2010 0 U 300.0A Nitrate (as N) 0.023 0.02 MG/L 2.1
28728-002 PR-WC-03 6/9/2010 0 U 300.0A Nitrite (as N) 0.02 0.02 MG/L U 2.1
28728-002 PR-WC-03 6/9/2010 0 U 351.2 Total Kjeldahl Nitrogen 1.3 0.5 MG/L 2.1
28728-002 PR-WC-03 6/9/2010 0 U 365.2 Phosphorus 239 50 UG/L 2.1
28728-002 PR-WC-03 6/9/2010 0 U 9060 TOC 9 1 MG/L 2.1
28728-003 PR-WC-04 6/9/2010 0 U 10200 H Chlorophyll a 10 10 UG/L U 1.7
28728-003 PR-WC-04 6/9/2010 0 U 160.2 TSS 2 1 MG/L 1.7
28728-003 PR-WC-04 6/9/2010 0 U 300 Nitrogen 1.2 0.15 MG/L 1.7
28728-003 PR-WC-04 6/9/2010 0 U 300.0A Nitrate (as N) 0.045 0.02 MG/L 1.7
28728-003 PR-WC-04 6/9/2010 0 U 300.0A Nitrite (as N) 0.02 0.02 MG/L U 1.7
28728-003 PR-WC-04 6/9/2010 0 U 351.2 Total Kjeldahl Nitrogen 1.2 0.5 MG/L 1.7
28728-003 PR-WC-04 6/9/2010 0 U 365.2 Phosphorus 253 50 UG/L 1.7
28728-003 PR-WC-04 6/9/2010 0 U 9060 TOC 9.5 1 MG/L 1.7
28728-004 PR-WC-05 6/9/2010 0 U 10200 H Chlorophyll a 31.3 10 UG/L 1.46
28728-004 PR-WC-05 6/9/2010 0 U 160.2 TSS 7 1 MG/L 1.46
28728-004 PR-WC-05 6/9/2010 0 U 300 Nitrogen 0.89 0.15 MG/L 1.46
28728-004 PR-WC-05 6/9/2010 0 U 300.0A Nitrate (as N) 0.062 0.02 MG/L 1.46
28728-004 PR-WC-05 6/9/2010 0 U 300.0A Nitrite (as N) 0.02 0.02 MG/L U 1.46
28728-004 PR-WC-05 6/9/2010 0 U 351.2 Total Kjeldahl Nitrogen 0.83 0.5 MG/L 1.46
28728-004 PR-WC-05 6/9/2010 0 U 365.2 Phosphorus 266 50 UG/L 1.46
28728-004 PR-WC-05 6/9/2010 0 U 9060 TOC 9.1 1 MG/L 1.46
28733-001 PR-WC-06 6/10/2010 0 U 10200 H Chlorophyll a 10 10 UG/L U 1.1
28733-001 PR-WC-06 6/10/2010 0 U 160.2 TSS 3 1 MG/L 1.1
5 of 20

Sample Depth Lab Rev DistanceDate (ft.) Qual1 Qual From STP
Appendix E
2010 Water Quality Analytical Data
MDL UnitsSample ID COC Site ID Filt. Method Analyte Conc.
28733-001 PR-WC-06 6/10/2010 0 U 300 Nitrogen 0.97 0.15 MG/L 1.1
28733-001 PR-WC-06 6/10/2010 0 U 300.0A Nitrate (as N) 0.38 0.02 MG/L 1.1
28733-001 PR-WC-06 6/10/2010 0 U 300.0A Nitrite (as N) 0.02 0.02 MG/L U 1.1
28733-001 PR-WC-06 6/10/2010 0 U 351.2 Total Kjeldahl Nitrogen 0.59 0.5 MG/L 1.1
28733-001 PR-WC-06 6/10/2010 0 U 365.2 Phosphorus 252 50 UG/L 1.1
28733-001 PR-WC-06 6/10/2010 0 U 9060 TOC 7.3 1 MG/L 1.1
28733-002 PR-WC-07 6/10/2010 0 U 10200 H Chlorophyll a 10 10 UG/L U 0.96
28733-002 PR-WC-07 6/10/2010 0 U 160.2 TSS 1 1 MG/L 0.96
28733-002 PR-WC-07 6/10/2010 0 U 300 Nitrogen 1.1 0.15 MG/L 0.96
28733-002 PR-WC-07 6/10/2010 0 U 300.0A Nitrate (as N) 0.5 0.02 MG/L 0.96
28733-002 PR-WC-07 6/10/2010 0 U 300.0A Nitrite (as N) 0.02 0.02 MG/L U 0.96
28733-002 PR-WC-07 6/10/2010 0 U 351.2 Total Kjeldahl Nitrogen 0.61 0.5 MG/L 0.96
28733-002 PR-WC-07 6/10/2010 0 U 365.2 Phosphorus 242 50 UG/L 0.96
28733-002 PR-WC-07 6/10/2010 0 U 9060 TOC 7.2 1 MG/L 0.96
28733-003 PR-WC-08 6/10/2010 0 U 10200 H Chlorophyll a 10 10 UG/L U 0.78
28733-003 PR-WC-08 6/10/2010 0 U 160.2 TSS 3 1 MG/L 0.78
28733-003 PR-WC-08 6/10/2010 0 U 300 Nitrogen 1.6 0.15 MG/L 0.78
28733-003 PR-WC-08 6/10/2010 0 U 300.0A Nitrate (as N) 1 0.1 MG/L 0.78
28733-003 PR-WC-08 6/10/2010 0 U 300.0A Nitrite (as N) 0.02 0.02 MG/L U 0.78
28733-003 PR-WC-08 6/10/2010 0 U 351.2 Total Kjeldahl Nitrogen 0.62 0.5 MG/L 0.78
28733-003 PR-WC-08 6/10/2010 0 U 365.2 Phosphorus 262 50 UG/L 0.78
28733-003 PR-WC-08 6/10/2010 0 U 9060 TOC 7.4 1 MG/L 0.78
28733-004 PR-WC-09 6/10/2010 0 U 10200 H Chlorophyll a 10 10 UG/L U 0.56
28733-004 PR-WC-09 6/10/2010 0 U 160.2 TSS 2 1 MG/L 0.56
28733-004 PR-WC-09 6/10/2010 0 U 300 Nitrogen 1.6 0.15 MG/L 0.56
28733-004 PR-WC-09 6/10/2010 0 U 300.0A Nitrate (as N) 0.89 0.02 MG/L 0.56
28733-004 PR-WC-09 6/10/2010 0 U 300.0A Nitrite (as N) 0.02 0.02 MG/L U 0.56
28733-004 PR-WC-09 6/10/2010 0 U 351.2 Total Kjeldahl Nitrogen 0.67 0.5 MG/L 0.56
6 of 20

Sample Depth Lab Rev DistanceDate (ft.) Qual1 Qual From STP
Appendix E
2010 Water Quality Analytical Data
MDL UnitsSample ID COC Site ID Filt. Method Analyte Conc.
28733-004 PR-WC-09 6/10/2010 0 U 365.2 Phosphorus 234 50 UG/L 0.56
28733-004 PR-WC-09 6/10/2010 0 U 9060 TOC 8.5 1 MG/L 0.56
28735-001 PR-WC-10 6/10/2010 0 U 10200 H Chlorophyll a 10 10 UG/L U 0.3
28735-001 PR-WC-10 6/10/2010 0 U 160.2 TSS 2 1 MG/L 0.3
28735-001 PR-WC-10 6/10/2010 0 U 300 Nitrogen 1.5 0.15 MG/L 0.3
28735-001 PR-WC-10 6/10/2010 0 U 300.0A Nitrate (as N) 0.8 0.02 MG/L 0.3
28735-001 PR-WC-10 6/10/2010 0 U 300.0A Nitrite (as N) 0.02 0.02 MG/L U 0.3
28735-001 PR-WC-10 6/10/2010 0 U 351.2 Total Kjeldahl Nitrogen 0.69 0.5 MG/L 0.3
28735-001 PR-WC-10 6/10/2010 0 U 365.2 Phosphorus 209 50 UG/L 0.3
28735-001 PR-WC-10 6/10/2010 0 U 9060 TOC 9.1 1 MG/L 0.3
28735-002 PR-WC-11DS 6/10/2010 0 U 10200 H Chlorophyll a 10 10 UG/L U 0.01
28735-002 PR-WC-11DS 6/10/2010 0 U 160.2 TSS 3 1 MG/L 0.01
28735-002 PR-WC-11DS 6/10/2010 0 U 300 Nitrogen 1.6 0.15 MG/L 0.01
28735-002 PR-WC-11DS 6/10/2010 0 U 300.0A Nitrate (as N) 0.96 0.02 MG/L 0.01
28735-002 PR-WC-11DS 6/10/2010 0 U 300.0A Nitrite (as N) 0.02 0.02 MG/L U 0.01
28735-002 PR-WC-11DS 6/10/2010 0 U 351.2 Total Kjeldahl Nitrogen 0.67 0.5 MG/L 0.01
28735-002 PR-WC-11DS 6/10/2010 0 U 365.2 Phosphorus 169 50 UG/L 0.01
28735-002 PR-WC-11DS 6/10/2010 0 U 9060 TOC 8.8 1 MG/L 0.01
28735-003 PR-WC-12-D7 6/10/2010 0 U 10200 H Chlorophyll a 10 10 UG/L U -0.04
28735-003 PR-WC-12-D7 6/10/2010 0 U 160.2 TSS 4 1 MG/L -0.04
28735-003 PR-WC-12-D7 6/10/2010 0 U 300 Nitrogen 0.59 0.15 MG/L -0.04
28735-003 PR-WC-12-D7 6/10/2010 0 U 300.0A Nitrate (as N) 0.027 0.02 MG/L -0.04
28735-003 PR-WC-12-D7 6/10/2010 0 U 300.0A Nitrite (as N) 0.02 0.02 MG/L U -0.04
28735-003 PR-WC-12-D7 6/10/2010 0 U 351.2 Total Kjeldahl Nitrogen 0.56 0.5 MG/L -0.04
28735-003 PR-WC-12-D7 6/10/2010 0 U 365.2 Phosphorus 46.1 50 UG/L B -0.04
28735-003 PR-WC-12-D7 6/10/2010 0 U 9060 TOC 9.5 1 MG/L -0.04
28735-004 PR-WC-13 6/10/2010 0 U 10200 H Chlorophyll a 10 10 UG/L U -0.07
28735-004 PR-WC-13 6/10/2010 0 U 160.2 TSS 7 1 MG/L -0.07
7 of 20
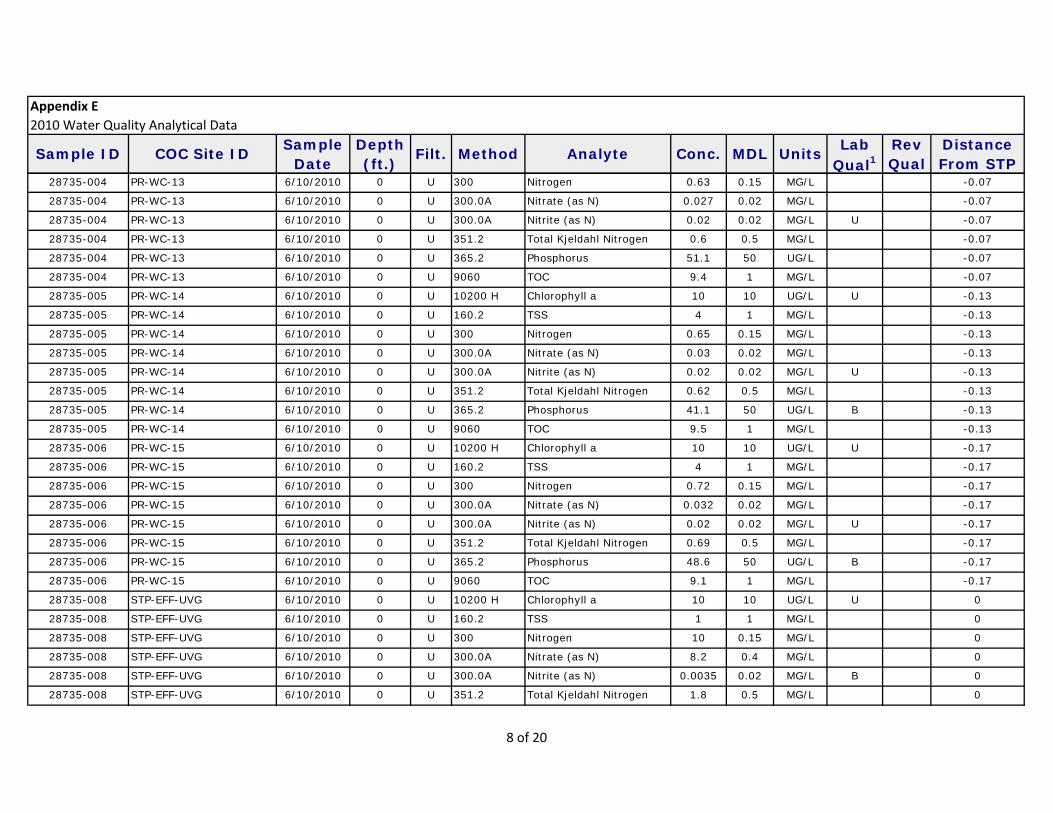
Sample Depth Lab Rev DistanceDate (ft.) Qual1 Qual From STP
Appendix E
2010 Water Quality Analytical Data
MDL UnitsSample ID COC Site ID Filt. Method Analyte Conc.
28735-004 PR-WC-13 6/10/2010 0 U 300 Nitrogen 0.63 0.15 MG/L -0.07
28735-004 PR-WC-13 6/10/2010 0 U 300.0A Nitrate (as N) 0.027 0.02 MG/L -0.07
28735-004 PR-WC-13 6/10/2010 0 U 300.0A Nitrite (as N) 0.02 0.02 MG/L U -0.07
28735-004 PR-WC-13 6/10/2010 0 U 351.2 Total Kjeldahl Nitrogen 0.6 0.5 MG/L -0.07
28735-004 PR-WC-13 6/10/2010 0 U 365.2 Phosphorus 51.1 50 UG/L -0.07
28735-004 PR-WC-13 6/10/2010 0 U 9060 TOC 9.4 1 MG/L -0.07
28735-005 PR-WC-14 6/10/2010 0 U 10200 H Chlorophyll a 10 10 UG/L U -0.13
28735-005 PR-WC-14 6/10/2010 0 U 160.2 TSS 4 1 MG/L -0.13
28735-005 PR-WC-14 6/10/2010 0 U 300 Nitrogen 0.65 0.15 MG/L -0.13
28735-005 PR-WC-14 6/10/2010 0 U 300.0A Nitrate (as N) 0.03 0.02 MG/L -0.13
28735-005 PR-WC-14 6/10/2010 0 U 300.0A Nitrite (as N) 0.02 0.02 MG/L U -0.13
28735-005 PR-WC-14 6/10/2010 0 U 351.2 Total Kjeldahl Nitrogen 0.62 0.5 MG/L -0.13
28735-005 PR-WC-14 6/10/2010 0 U 365.2 Phosphorus 41.1 50 UG/L B -0.13
28735-005 PR-WC-14 6/10/2010 0 U 9060 TOC 9.5 1 MG/L -0.13
28735-006 PR-WC-15 6/10/2010 0 U 10200 H Chlorophyll a 10 10 UG/L U -0.17
28735-006 PR-WC-15 6/10/2010 0 U 160.2 TSS 4 1 MG/L -0.17
28735-006 PR-WC-15 6/10/2010 0 U 300 Nitrogen 0.72 0.15 MG/L -0.17
28735-006 PR-WC-15 6/10/2010 0 U 300.0A Nitrate (as N) 0.032 0.02 MG/L -0.17
28735-006 PR-WC-15 6/10/2010 0 U 300.0A Nitrite (as N) 0.02 0.02 MG/L U -0.17
28735-006 PR-WC-15 6/10/2010 0 U 351.2 Total Kjeldahl Nitrogen 0.69 0.5 MG/L -0.17
28735-006 PR-WC-15 6/10/2010 0 U 365.2 Phosphorus 48.6 50 UG/L B -0.17
28735-006 PR-WC-15 6/10/2010 0 U 9060 TOC 9.1 1 MG/L -0.17
28735-008 STP-EFF-UVG 6/10/2010 0 U 10200 H Chlorophyll a 10 10 UG/L U 0
28735-008 STP-EFF-UVG 6/10/2010 0 U 160.2 TSS 1 1 MG/L 0
28735-008 STP-EFF-UVG 6/10/2010 0 U 300 Nitrogen 10 0.15 MG/L 0
28735-008 STP-EFF-UVG 6/10/2010 0 U 300.0A Nitrate (as N) 8.2 0.4 MG/L 0
28735-008 STP-EFF-UVG 6/10/2010 0 U 300.0A Nitrite (as N) 0.0035 0.02 MG/L B 0
28735-008 STP-EFF-UVG 6/10/2010 0 U 351.2 Total Kjeldahl Nitrogen 1.8 0.5 MG/L 0
8 of 20
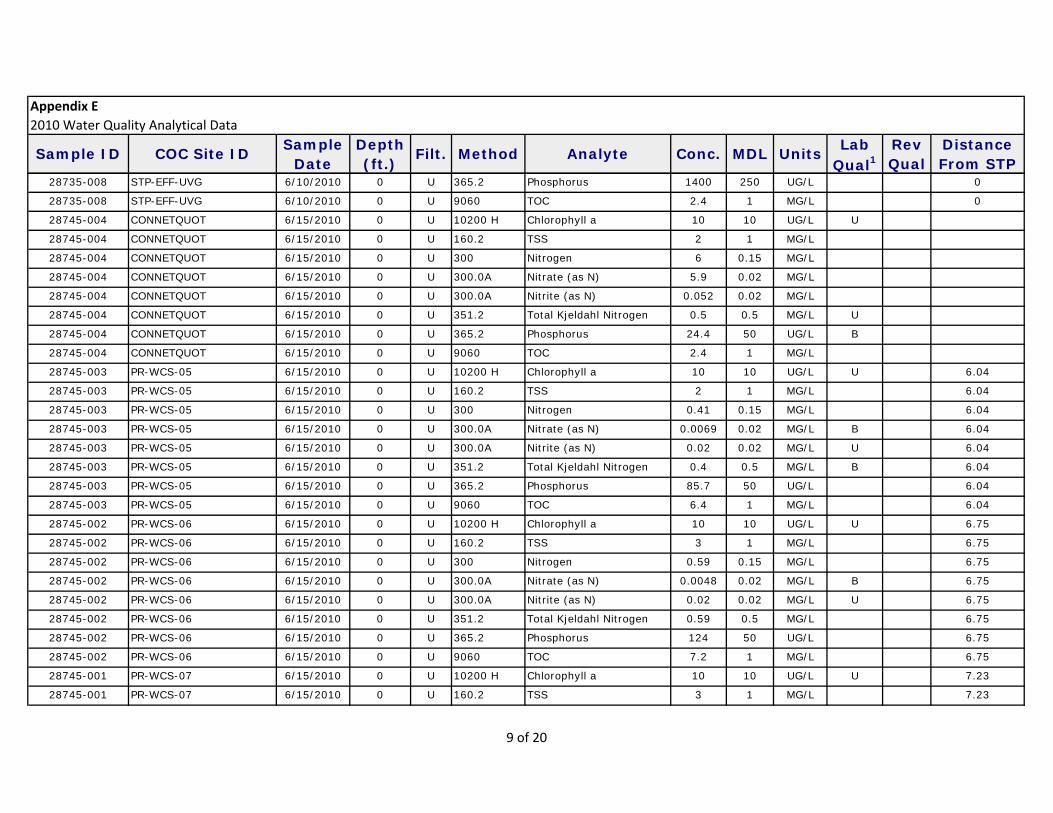
Sample Depth Lab Rev DistanceDate (ft.) Qual1 Qual From STP
Appendix E
2010 Water Quality Analytical Data
MDL UnitsSample ID COC Site ID Filt. Method Analyte Conc.
28735-008 STP-EFF-UVG 6/10/2010 0 U 365.2 Phosphorus 1400 250 UG/L 0
28735-008 STP-EFF-UVG 6/10/2010 0 U 9060 TOC 2.4 1 MG/L 0
28745-004 CONNETQUOT 6/15/2010 0 U 10200 H Chlorophyll a 10 10 UG/L U
28745-004 CONNETQUOT 6/15/2010 0 U 160.2 TSS 2 1 MG/L
28745-004 CONNETQUOT 6/15/2010 0 U 300 Nitrogen 6 0.15 MG/L
28745-004 CONNETQUOT 6/15/2010 0 U 300.0A Nitrate (as N) 5.9 0.02 MG/L
28745-004 CONNETQUOT 6/15/2010 0 U 300.0A Nitrite (as N) 0.052 0.02 MG/L
28745-004 CONNETQUOT 6/15/2010 0 U 351.2 Total Kjeldahl Nitrogen 0.5 0.5 MG/L U
28745-004 CONNETQUOT 6/15/2010 0 U 365.2 Phosphorus 24.4 50 UG/L B
28745-004 CONNETQUOT 6/15/2010 0 U 9060 TOC 2.4 1 MG/L
28745-003 PR-WCS-05 6/15/2010 0 U 10200 H Chlorophyll a 10 10 UG/L U 6.04
28745-003 PR-WCS-05 6/15/2010 0 U 160.2 TSS 2 1 MG/L 6.04
28745-003 PR-WCS-05 6/15/2010 0 U 300 Nitrogen 0.41 0.15 MG/L 6.04
28745-003 PR-WCS-05 6/15/2010 0 U 300.0A Nitrate (as N) 0.0069 0.02 MG/L B 6.04
28745-003 PR-WCS-05 6/15/2010 0 U 300.0A Nitrite (as N) 0.02 0.02 MG/L U 6.04
28745-003 PR-WCS-05 6/15/2010 0 U 351.2 Total Kjeldahl Nitrogen 0.4 0.5 MG/L B 6.04
28745-003 PR-WCS-05 6/15/2010 0 U 365.2 Phosphorus 85.7 50 UG/L 6.04
28745-003 PR-WCS-05 6/15/2010 0 U 9060 TOC 6.4 1 MG/L 6.04
28745-002 PR-WCS-06 6/15/2010 0 U 10200 H Chlorophyll a 10 10 UG/L U 6.75
28745-002 PR-WCS-06 6/15/2010 0 U 160.2 TSS 3 1 MG/L 6.75
28745-002 PR-WCS-06 6/15/2010 0 U 300 Nitrogen 0.59 0.15 MG/L 6.75
28745-002 PR-WCS-06 6/15/2010 0 U 300.0A Nitrate (as N) 0.0048 0.02 MG/L B 6.75
28745-002 PR-WCS-06 6/15/2010 0 U 300.0A Nitrite (as N) 0.02 0.02 MG/L U 6.75
28745-002 PR-WCS-06 6/15/2010 0 U 351.2 Total Kjeldahl Nitrogen 0.59 0.5 MG/L 6.75
28745-002 PR-WCS-06 6/15/2010 0 U 365.2 Phosphorus 124 50 UG/L 6.75
28745-002 PR-WCS-06 6/15/2010 0 U 9060 TOC 7.2 1 MG/L 6.75
28745-001 PR-WCS-07 6/15/2010 0 U 10200 H Chlorophyll a 10 10 UG/L U 7.23
28745-001 PR-WCS-07 6/15/2010 0 U 160.2 TSS 3 1 MG/L 7.23
9 of 20
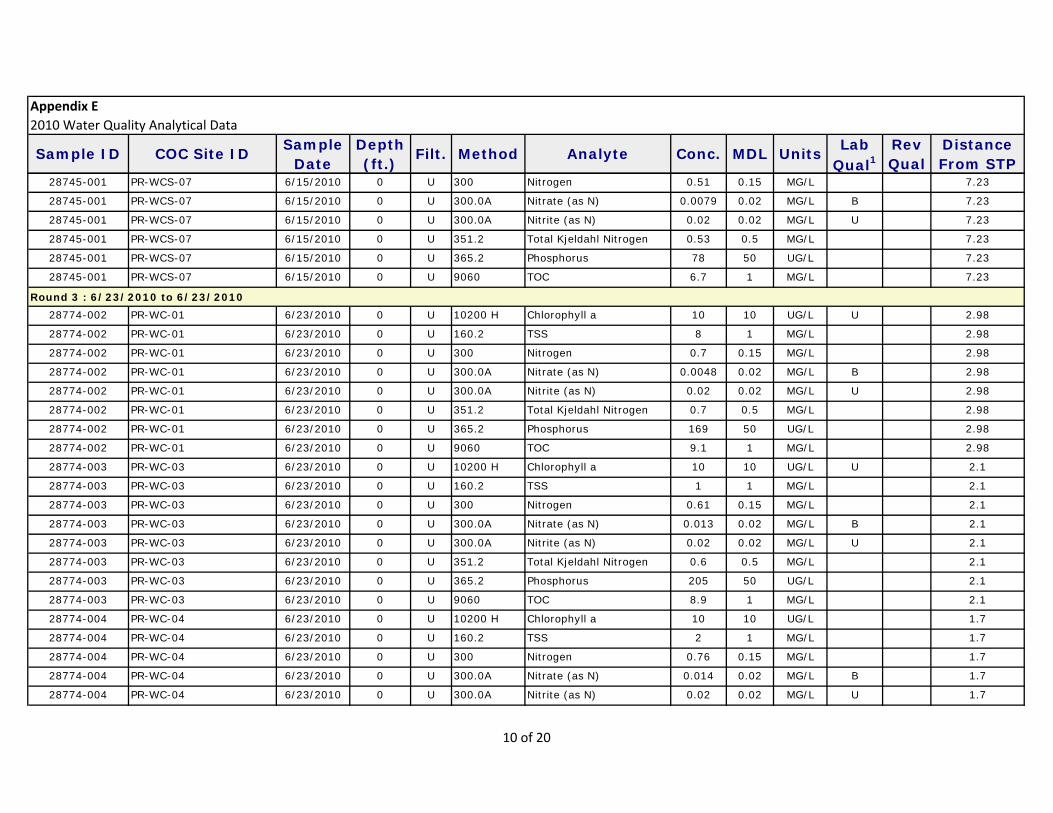
Sample Depth Lab Rev DistanceDate (ft.) Qual1 Qual From STP
Appendix E
2010 Water Quality Analytical Data
MDL UnitsSample ID COC Site ID Filt. Method Analyte Conc.
28745-001 PR-WCS-07 6/15/2010 0 U 300 Nitrogen 0.51 0.15 MG/L 7.23
28745-001 PR-WCS-07 6/15/2010 0 U 300.0A Nitrate (as N) 0.0079 0.02 MG/L B 7.23
28745-001 PR-WCS-07 6/15/2010 0 U 300.0A Nitrite (as N) 0.02 0.02 MG/L U 7.23
28745-001 PR-WCS-07 6/15/2010 0 U 351.2 Total Kjeldahl Nitrogen 0.53 0.5 MG/L 7.23
28745-001 PR-WCS-07 6/15/2010 0 U 365.2 Phosphorus 78 50 UG/L 7.23
28745-001 PR-WCS-07 6/15/2010 0 U 9060 TOC 6.7 1 MG/L 7.23
28774-002 PR-WC-01 6/23/2010 0 U 10200 H Chlorophyll a 10 10 UG/L U 2.98
28774-002 PR-WC-01 6/23/2010 0 U 160.2 TSS 8 1 MG/L 2.98
28774-002 PR-WC-01 6/23/2010 0 U 300 Nitrogen 0.7 0.15 MG/L 2.98
28774-002 PR-WC-01 6/23/2010 0 U 300.0A Nitrate (as N) 0.0048 0.02 MG/L B 2.98
28774-002 PR-WC-01 6/23/2010 0 U 300.0A Nitrite (as N) 0.02 0.02 MG/L U 2.98
28774-002 PR-WC-01 6/23/2010 0 U 351.2 Total Kjeldahl Nitrogen 0.7 0.5 MG/L 2.98
28774-002 PR-WC-01 6/23/2010 0 U 365.2 Phosphorus 169 50 UG/L 2.98
28774-002 PR-WC-01 6/23/2010 0 U 9060 TOC 9.1 1 MG/L 2.98
28774-003 PR-WC-03 6/23/2010 0 U 10200 H Chlorophyll a 10 10 UG/L U 2.1
28774-003 PR-WC-03 6/23/2010 0 U 160.2 TSS 1 1 MG/L 2.1
28774-003 PR-WC-03 6/23/2010 0 U 300 Nitrogen 0.61 0.15 MG/L 2.1
28774-003 PR-WC-03 6/23/2010 0 U 300.0A Nitrate (as N) 0.013 0.02 MG/L B 2.1
28774-003 PR-WC-03 6/23/2010 0 U 300.0A Nitrite (as N) 0.02 0.02 MG/L U 2.1
28774-003 PR-WC-03 6/23/2010 0 U 351.2 Total Kjeldahl Nitrogen 0.6 0.5 MG/L 2.1
28774-003 PR-WC-03 6/23/2010 0 U 365.2 Phosphorus 205 50 UG/L 2.1
28774-003 PR-WC-03 6/23/2010 0 U 9060 TOC 8.9 1 MG/L 2.1
28774-004 PR-WC-04 6/23/2010 0 U 10200 H Chlorophyll a 10 10 UG/L 1.7
28774-004 PR-WC-04 6/23/2010 0 U 160.2 TSS 2 1 MG/L 1.7
28774-004 PR-WC-04 6/23/2010 0 U 300 Nitrogen 0.76 0.15 MG/L 1.7
28774-004 PR-WC-04 6/23/2010 0 U 300.0A Nitrate (as N) 0.014 0.02 MG/L B 1.7
28774-004 PR-WC-04 6/23/2010 0 U 300.0A Nitrite (as N) 0.02 0.02 MG/L U 1.7
Round 3 : 6/23/2010 to 6/23/2010
10 of 20

Sample Depth Lab Rev DistanceDate (ft.) Qual1 Qual From STP
Appendix E
2010 Water Quality Analytical Data
MDL UnitsSample ID COC Site ID Filt. Method Analyte Conc.
28774-004 PR-WC-04 6/23/2010 0 U 351.2 Total Kjeldahl Nitrogen 0.75 0.5 MG/L 1.7
28774-004 PR-WC-04 6/23/2010 0 U 365.2 Phosphorus 242 50 UG/L 1.7
28774-004 PR-WC-04 6/23/2010 0 U 9060 TOC 8.2 1 MG/L 1.7
28776-001 PR-WC-06 6/23/2010 0 U 10200 H Chlorophyll a 10 10 UG/L U 1.1
28776-001 PR-WC-06 6/23/2010 0 U 160.2 TSS 1 1 MG/L 1.1
28776-001 PR-WC-06 6/23/2010 0 U 300 Nitrogen 0.89 0.15 MG/L 1.1
28776-001 PR-WC-06 6/23/2010 0 U 300.0A Nitrate (as N) 0.17 0.02 MG/L 1.1
28776-001 PR-WC-06 6/23/2010 0 U 300.0A Nitrite (as N) 0.02 0.02 MG/L U 1.1
28776-001 PR-WC-06 6/23/2010 0 U 351.2 Total Kjeldahl Nitrogen 0.72 0.5 MG/L 1.1
28776-001 PR-WC-06 6/23/2010 0 U 365.2 Phosphorus 280 50 UG/L 1.1
28776-001 PR-WC-06 6/23/2010 0 U 9060 TOC 7.8 1 MG/L 1.1
28776-002 PR-WC-08 6/23/2010 0 U 10200 H Chlorophyll a 10 10 UG/L U 0.78
28776-002 PR-WC-08 6/23/2010 0 U 160.2 TSS 3 1 MG/L 0.78
28776-002 PR-WC-08 6/23/2010 0 U 300 Nitrogen 1.6 0.15 MG/L 0.78
28776-002 PR-WC-08 6/23/2010 0 U 300.0A Nitrate (as N) 0.95 0.4 MG/L 0.78
28776-002 PR-WC-08 6/23/2010 0 U 300.0A Nitrite (as N) 0.02 0.02 MG/L U 0.78
28776-002 PR-WC-08 6/23/2010 0 U 351.2 Total Kjeldahl Nitrogen 0.64 0.5 MG/L 0.78
28776-002 PR-WC-08 6/23/2010 0 U 365.2 Phosphorus 357 50 UG/L 0.78
28776-002 PR-WC-08 6/23/2010 0 U 9060 TOC 8.5 1 MG/L 0.78
28776-003 PR-WC-09 6/23/2010 0 U 10200 H Chlorophyll a 10 10 UG/L U 0.56
28776-003 PR-WC-09 6/23/2010 0 U 160.2 TSS 3 1 MG/L 0.56
28776-003 PR-WC-09 6/23/2010 0 U 300 Nitrogen 1.9 0.15 MG/L 0.56
28776-003 PR-WC-09 6/23/2010 0 U 300.0A Nitrate (as N) 1 0.4 MG/L 0.56
28776-003 PR-WC-09 6/23/2010 0 U 300.0A Nitrite (as N) 0.02 0.02 MG/L U 0.56
28776-003 PR-WC-09 6/23/2010 0 U 351.2 Total Kjeldahl Nitrogen 0.86 0.5 MG/L 0.56
28776-003 PR-WC-09 6/23/2010 0 U 365.2 Phosphorus 350 50 UG/L 0.56
28776-003 PR-WC-09 6/23/2010 0 U 9060 TOC 8 1 MG/L 0.56
28776-004 PR-WC-10 6/23/2010 0 U 10200 H Chlorophyll a 10 10 UG/L U 0.3
11 of 20

Sample Depth Lab Rev DistanceDate (ft.) Qual1 Qual From STP
Appendix E
2010 Water Quality Analytical Data
MDL UnitsSample ID COC Site ID Filt. Method Analyte Conc.
28776-004 PR-WC-10 6/23/2010 0 U 160.2 TSS 3 1 MG/L 0.3
28776-004 PR-WC-10 6/23/2010 0 U 300 Nitrogen 2.1 0.15 MG/L 0.3
28776-004 PR-WC-10 6/23/2010 0 U 300.0A Nitrate (as N) 1.3 0.4 MG/L 0.3
28776-004 PR-WC-10 6/23/2010 0 U 300.0A Nitrite (as N) 0.02 0.02 MG/L U 0.3
28776-004 PR-WC-10 6/23/2010 0 U 351.2 Total Kjeldahl Nitrogen 0.82 0.5 MG/L 0.3
28776-004 PR-WC-10 6/23/2010 0 U 365.2 Phosphorus 357 50 UG/L 0.3
28776-004 PR-WC-10 6/23/2010 0 U 9060 TOC 8.4 1 MG/L 0.3
28774-001 PR-WCS-04 6/23/2010 0 U 10200 H Chlorophyll a 10 10 UG/L U 4.77
28774-001 PR-WCS-04 6/23/2010 0 U 160.2 TSS 9 1 MG/L 4.77
28774-001 PR-WCS-04 6/23/2010 0 U 300 Nitrogen 0.81 0.15 MG/L 4.77
28774-001 PR-WCS-04 6/23/2010 0 U 300.0A Nitrate (as N) 0.0073 0.02 MG/L B 4.77
28774-001 PR-WCS-04 6/23/2010 0 U 300.0A Nitrite (as N) 0.02 0.02 MG/L U 4.77
28774-001 PR-WCS-04 6/23/2010 0 U 351.2 Total Kjeldahl Nitrogen 0.79 0.5 MG/L 4.77
28774-001 PR-WCS-04 6/23/2010 0 U 365.2 Phosphorus 177 50 UG/L 4.77
28774-001 PR-WCS-04 6/23/2010 0 U 9060 TOC 7.8 1 MG/L 4.77
30157-004 PR-WCS-01 7/19/2010 0 U 10200 H Chlorophyll a 10 10 UG/L U 3.42
30157-004 PR-WCS-01 7/19/2010 0 U 160.2 TSS 16 1 MG/L 3.42
30157-004 PR-WCS-01 7/19/2010 0 U 300 Nitrogen 1 0.15 MG/L 3.42
30157-004 PR-WCS-01 7/19/2010 0 U 300.0A Nitrate (as N) 0.009 0.02 MG/L B 3.42
30157-004 PR-WCS-01 7/19/2010 0 U 300.0A Nitrite (as N) 0.02 0.02 MG/L U 3.42
30157-004 PR-WCS-01 7/19/2010 0 U 351.2 Total Kjeldahl Nitrogen 1 0.5 MG/L 3.42
30157-004 PR-WCS-01 7/19/2010 0 U 365.2 Phosphorus 265 50 UG/L 3.42
30157-004 PR-WCS-01 7/19/2010 0 U 9060 TOC 9.1 1 MG/L 3.42
30157-003 PR-WCS-02 7/19/2010 0 U 10200 H Chlorophyll a 10 10 UG/L U 3.99
30157-003 PR-WCS-02 7/19/2010 0 U 160.2 TSS 8 1 MG/L 3.99
30157-003 PR-WCS-02 7/19/2010 0 U 300 Nitrogen 0.74 0.15 MG/L 3.99
30157-003 PR-WCS-02 7/19/2010 0 U 300.0A Nitrate (as N) 0.0087 0.02 MG/L B 3.99
Round 4 : 7/19/2010 to 7/23/2010
12 of 20
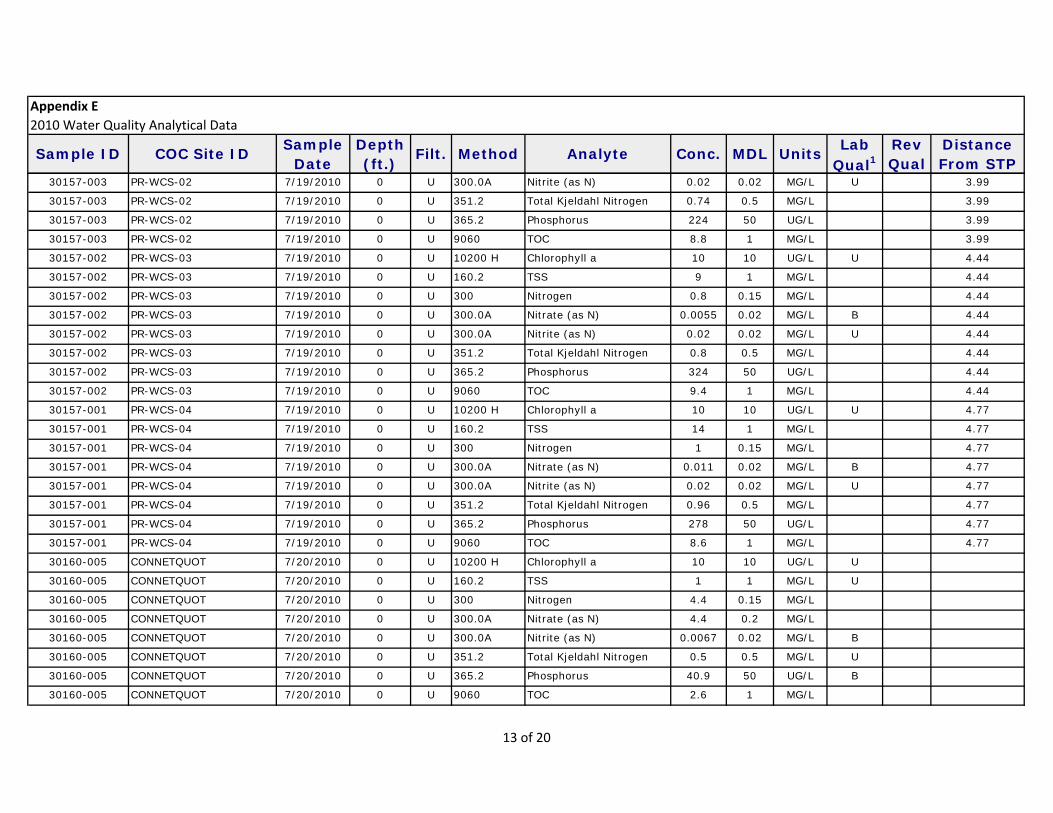
Sample Depth Lab Rev DistanceDate (ft.) Qual1 Qual From STP
Appendix E
2010 Water Quality Analytical Data
MDL UnitsSample ID COC Site ID Filt. Method Analyte Conc.
30157-003 PR-WCS-02 7/19/2010 0 U 300.0A Nitrite (as N) 0.02 0.02 MG/L U 3.99
30157-003 PR-WCS-02 7/19/2010 0 U 351.2 Total Kjeldahl Nitrogen 0.74 0.5 MG/L 3.99
30157-003 PR-WCS-02 7/19/2010 0 U 365.2 Phosphorus 224 50 UG/L 3.99
30157-003 PR-WCS-02 7/19/2010 0 U 9060 TOC 8.8 1 MG/L 3.99
30157-002 PR-WCS-03 7/19/2010 0 U 10200 H Chlorophyll a 10 10 UG/L U 4.44
30157-002 PR-WCS-03 7/19/2010 0 U 160.2 TSS 9 1 MG/L 4.44
30157-002 PR-WCS-03 7/19/2010 0 U 300 Nitrogen 0.8 0.15 MG/L 4.44
30157-002 PR-WCS-03 7/19/2010 0 U 300.0A Nitrate (as N) 0.0055 0.02 MG/L B 4.44
30157-002 PR-WCS-03 7/19/2010 0 U 300.0A Nitrite (as N) 0.02 0.02 MG/L U 4.44
30157-002 PR-WCS-03 7/19/2010 0 U 351.2 Total Kjeldahl Nitrogen 0.8 0.5 MG/L 4.44
30157-002 PR-WCS-03 7/19/2010 0 U 365.2 Phosphorus 324 50 UG/L 4.44
30157-002 PR-WCS-03 7/19/2010 0 U 9060 TOC 9.4 1 MG/L 4.44
30157-001 PR-WCS-04 7/19/2010 0 U 10200 H Chlorophyll a 10 10 UG/L U 4.77
30157-001 PR-WCS-04 7/19/2010 0 U 160.2 TSS 14 1 MG/L 4.77
30157-001 PR-WCS-04 7/19/2010 0 U 300 Nitrogen 1 0.15 MG/L 4.77
30157-001 PR-WCS-04 7/19/2010 0 U 300.0A Nitrate (as N) 0.011 0.02 MG/L B 4.77
30157-001 PR-WCS-04 7/19/2010 0 U 300.0A Nitrite (as N) 0.02 0.02 MG/L U 4.77
30157-001 PR-WCS-04 7/19/2010 0 U 351.2 Total Kjeldahl Nitrogen 0.96 0.5 MG/L 4.77
30157-001 PR-WCS-04 7/19/2010 0 U 365.2 Phosphorus 278 50 UG/L 4.77
30157-001 PR-WCS-04 7/19/2010 0 U 9060 TOC 8.6 1 MG/L 4.77
30160-005 CONNETQUOT 7/20/2010 0 U 10200 H Chlorophyll a 10 10 UG/L U
30160-005 CONNETQUOT 7/20/2010 0 U 160.2 TSS 1 1 MG/L U
30160-005 CONNETQUOT 7/20/2010 0 U 300 Nitrogen 4.4 0.15 MG/L
30160-005 CONNETQUOT 7/20/2010 0 U 300.0A Nitrate (as N) 4.4 0.2 MG/L
30160-005 CONNETQUOT 7/20/2010 0 U 300.0A Nitrite (as N) 0.0067 0.02 MG/L B
30160-005 CONNETQUOT 7/20/2010 0 U 351.2 Total Kjeldahl Nitrogen 0.5 0.5 MG/L U
30160-005 CONNETQUOT 7/20/2010 0 U 365.2 Phosphorus 40.9 50 UG/L B
30160-005 CONNETQUOT 7/20/2010 0 U 9060 TOC 2.6 1 MG/L
13 of 20

Sample Depth Lab Rev DistanceDate (ft.) Qual1 Qual From STP
Appendix E
2010 Water Quality Analytical Data
MDL UnitsSample ID COC Site ID Filt. Method Analyte Conc.
30160-001 PR-WC-01 7/20/2010 0 U 10200 H Chlorophyll a 10 10 UG/L U 2.98
30160-001 PR-WC-01 7/20/2010 0 U 160.2 TSS 1 1 MG/L 2.98
30160-001 PR-WC-01 7/20/2010 0 U 300 Nitrogen 0.6 0.15 MG/L 2.98
30160-001 PR-WC-01 7/20/2010 0 U 300.0A Nitrate (as N) 0.0055 0.02 MG/L B 2.98
30160-001 PR-WC-01 7/20/2010 0 U 300.0A Nitrite (as N) 0.02 0.02 MG/L U 2.98
30160-001 PR-WC-01 7/20/2010 0 U 351.2 Total Kjeldahl Nitrogen 0.6 0.5 MG/L 2.98
30160-001 PR-WC-01 7/20/2010 0 U 365.2 Phosphorus 126 50 UG/L 2.98
30160-001 PR-WC-01 7/20/2010 0 U 9060 TOC 7.1 1 MG/L 2.98
30160-002 PR-WC-03 7/20/2010 0 U 10200 H Chlorophyll a 10 10 UG/L U 2.1
30160-002 PR-WC-03 7/20/2010 0 U 160.2 TSS 4 1 MG/L 2.1
30160-002 PR-WC-03 7/20/2010 0 U 300 Nitrogen 0.72 0.15 MG/L 2.1
30160-002 PR-WC-03 7/20/2010 0 U 300.0A Nitrate (as N) 0.0049 0.02 MG/L B 2.1
30160-002 PR-WC-03 7/20/2010 0 U 300.0A Nitrite (as N) 0.02 0.02 MG/L U 2.1
30160-002 PR-WC-03 7/20/2010 0 U 351.2 Total Kjeldahl Nitrogen 0.72 0.5 MG/L 2.1
30160-002 PR-WC-03 7/20/2010 0 U 365.2 Phosphorus 345 50 UG/L 2.1
30160-002 PR-WC-03 7/20/2010 0 U 9060 TOC 7 1 MG/L 2.1
30160-003 PR-WC-04 7/20/2010 0 U 10200 H Chlorophyll a 10 10 UG/L U 1.7
30160-003 PR-WC-04 7/20/2010 0 U 160.2 TSS 5 1 MG/L 1.7
30160-003 PR-WC-04 7/20/2010 0 U 300 Nitrogen 0.76 0.15 MG/L 1.7
30160-003 PR-WC-04 7/20/2010 0 U 300.0A Nitrate (as N) 0.01 0.02 MG/L B 1.7
30160-003 PR-WC-04 7/20/2010 0 U 300.0A Nitrite (as N) 0.02 0.02 MG/L U 1.7
30160-003 PR-WC-04 7/20/2010 0 U 351.2 Total Kjeldahl Nitrogen 0.76 0.5 MG/L 1.7
30160-003 PR-WC-04 7/20/2010 0 U 365.2 Phosphorus 375 50 UG/L 1.7
30160-003 PR-WC-04 7/20/2010 0 U 9060 TOC 7.3 1 MG/L 1.7
30160-004 PR-WC-05 7/20/2010 0 U 10200 H Chlorophyll a 10 10 UG/L U 1.46
30160-004 PR-WC-05 7/20/2010 0 U 160.2 TSS 1 1 MG/L 1.46
30160-004 PR-WC-05 7/20/2010 0 U 300 Nitrogen 1.1 0.15 MG/L 1.46
30160-004 PR-WC-05 7/20/2010 0 U 300.0A Nitrate (as N) 0.11 0.02 MG/L 1.46
14 of 20

Sample Depth Lab Rev DistanceDate (ft.) Qual1 Qual From STP
Appendix E
2010 Water Quality Analytical Data
MDL UnitsSample ID COC Site ID Filt. Method Analyte Conc.
30160-004 PR-WC-05 7/20/2010 0 U 300.0A Nitrite (as N) 0.02 0.02 MG/L U 1.46
30160-004 PR-WC-05 7/20/2010 0 U 351.2 Total Kjeldahl Nitrogen 1 0.5 MG/L 1.46
30160-004 PR-WC-05 7/20/2010 0 U 365.2 Phosphorus 438 50 UG/L 1.46
30160-004 PR-WC-05 7/20/2010 0 U 9060 TOC 7.3 1 MG/L 1.46
30162-001 PR-WC-06 7/20/2010 0 U 10200 H Chlorophyll a 10 10 UG/L U 1.1
30162-001 PR-WC-06 7/20/2010 0 U 160.2 TSS 6 1 MG/L 1.1
30162-001 PR-WC-06 7/20/2010 0 U 300 Nitrogen 1.3 0.15 MG/L 1.1
30162-001 PR-WC-06 7/20/2010 0 U 300.0A Nitrate (as N) 0.47 0.02 MG/L 1.1
30162-001 PR-WC-06 7/20/2010 0 U 300.0A Nitrite (as N) 0.0061 0.02 MG/L B 1.1
30162-001 PR-WC-06 7/20/2010 0 U 351.2 Total Kjeldahl Nitrogen 0.87 0.5 MG/L 1.1
30162-001 PR-WC-06 7/20/2010 0 U 365.2 Phosphorus 496 100 UG/L 1.1
30162-001 PR-WC-06 7/20/2010 0 U 9060 TOC 6.7 1 MG/L 1.1
30162-002 PR-WC-07 7/20/2010 0 U 10200 H Chlorophyll a 10 10 UG/L U 0.96
30162-002 PR-WC-07 7/20/2010 0 U 160.2 TSS 1 1 MG/L 0.96
30162-002 PR-WC-07 7/20/2010 0 U 300 Nitrogen 1.5 0.15 MG/L 0.96
30162-002 PR-WC-07 7/20/2010 0 U 300.0A Nitrate (as N) 0.53 0.02 MG/L 0.96
30162-002 PR-WC-07 7/20/2010 0 U 300.0A Nitrite (as N) 0.0042 0.02 MG/L B 0.96
30162-002 PR-WC-07 7/20/2010 0 U 351.2 Total Kjeldahl Nitrogen 0.96 0.5 MG/L 0.96
30162-002 PR-WC-07 7/20/2010 0 U 365.2 Phosphorus 475 50 UG/L 0.96
30162-002 PR-WC-07 7/20/2010 0 U 9060 TOC 6.3 1 MG/L 0.96
30162-003 PR-WC-08 7/20/2010 0 U 10200 H Chlorophyll a 10 10 UG/L U 0.78
30162-003 PR-WC-08 7/20/2010 0 U 160.2 TSS 3 1 MG/L 0.78
30162-003 PR-WC-08 7/20/2010 0 U 300 Nitrogen 2.2 0.15 MG/L 0.78
30162-003 PR-WC-08 7/20/2010 0 U 300.0A Nitrate (as N) 1.4 0.04 MG/L 0.78
30162-003 PR-WC-08 7/20/2010 0 U 300.0A Nitrite (as N) 0.02 0.02 MG/L U 0.78
30162-003 PR-WC-08 7/20/2010 0 U 351.2 Total Kjeldahl Nitrogen 0.85 0.5 MG/L 0.78
30162-003 PR-WC-08 7/20/2010 0 U 365.2 Phosphorus 613 100 UG/L 0.78
30162-003 PR-WC-08 7/20/2010 0 U 9060 TOC 5.6 1 MG/L 0.78
15 of 20

Sample Depth Lab Rev DistanceDate (ft.) Qual1 Qual From STP
Appendix E
2010 Water Quality Analytical Data
MDL UnitsSample ID COC Site ID Filt. Method Analyte Conc.
30162-004 PR-WC-09 7/20/2010 0 U 10200 H Chlorophyll a 10 10 UG/L U 0.56
30162-004 PR-WC-09 7/20/2010 0 U 160.2 TSS 3 1 MG/L 0.56
30162-004 PR-WC-09 7/20/2010 0 U 300 Nitrogen 3.1 0.15 MG/L 0.56
30162-004 PR-WC-09 7/20/2010 0 U 300.0A Nitrate (as N) 1.6 0.04 MG/L 0.56
30162-004 PR-WC-09 7/20/2010 0 U 300.0A Nitrite (as N) 0.02 0.02 MG/L U 0.56
30162-004 PR-WC-09 7/20/2010 0 U 351.2 Total Kjeldahl Nitrogen 1.5 0.5 MG/L 0.56
30162-004 PR-WC-09 7/20/2010 0 U 365.2 Phosphorus 608 100 UG/L 0.56
30162-004 PR-WC-09 7/20/2010 0 U 9060 TOC 5.7 1 MG/L 0.56
30168-001 PR-WC-10 7/21/2010 0 U 10200 H Chlorophyll a 10 10 UG/L U 0.3
30168-001 PR-WC-10 7/21/2010 0 U 160.2 TSS 1 1 MG/L U 0.3
30168-001 PR-WC-10 7/21/2010 0 U 300 Nitrogen 2.9 0.15 MG/L 0.3
30168-001 PR-WC-10 7/21/2010 0 U 300.0A Nitrate (as N) 2 0.2 MG/L 0.3
30168-001 PR-WC-10 7/21/2010 0 U 300.0A Nitrite (as N) 0.02 0.02 MG/L U 0.3
30168-001 PR-WC-10 7/21/2010 0 U 351.2 Total Kjeldahl Nitrogen 0.9 0.5 MG/L 0.3
30168-001 PR-WC-10 7/21/2010 0 U 365.2 Phosphorus 496 100 UG/L 0.3
30168-001 PR-WC-10 7/21/2010 0 U 9060 TOC 6.3 1 MG/L 0.3
30168-002 PR-WC-11DS 7/21/2010 0 U 10200 H Chlorophyll a 10 10 UG/L U 0.01
30168-002 PR-WC-11DS 7/21/2010 0 U 160.2 TSS 3 1 MG/L 0.01
30168-002 PR-WC-11DS 7/21/2010 0 U 300 Nitrogen 2.8 0.15 MG/L 0.01
30168-002 PR-WC-11DS 7/21/2010 0 U 300.0A Nitrate (as N) 2 0.2 MG/L 0.01
30168-002 PR-WC-11DS 7/21/2010 0 U 300.0A Nitrite (as N) 0.02 0.02 MG/L U 0.01
30168-002 PR-WC-11DS 7/21/2010 0 U 351.2 Total Kjeldahl Nitrogen 0.81 0.5 MG/L 0.01
30168-002 PR-WC-11DS 7/21/2010 0 U 365.2 Phosphorus 431 50 UG/L 0.01
30168-002 PR-WC-11DS 7/21/2010 0 U 9060 TOC 6.9 1 MG/L 0.01
30168-003 PR-WC-12-D7 7/21/2010 0 U 10200 H Chlorophyll a 10 10 UG/L U -0.04
30168-003 PR-WC-12-D7 7/21/2010 0 U 160.2 TSS 3 1 MG/L -0.04
30168-003 PR-WC-12-D7 7/21/2010 0 U 300 Nitrogen 0.61 0.15 MG/L -0.04
30168-003 PR-WC-12-D7 7/21/2010 0 U 300.0A Nitrate (as N) 0.011 0.02 MG/L B -0.04
16 of 20
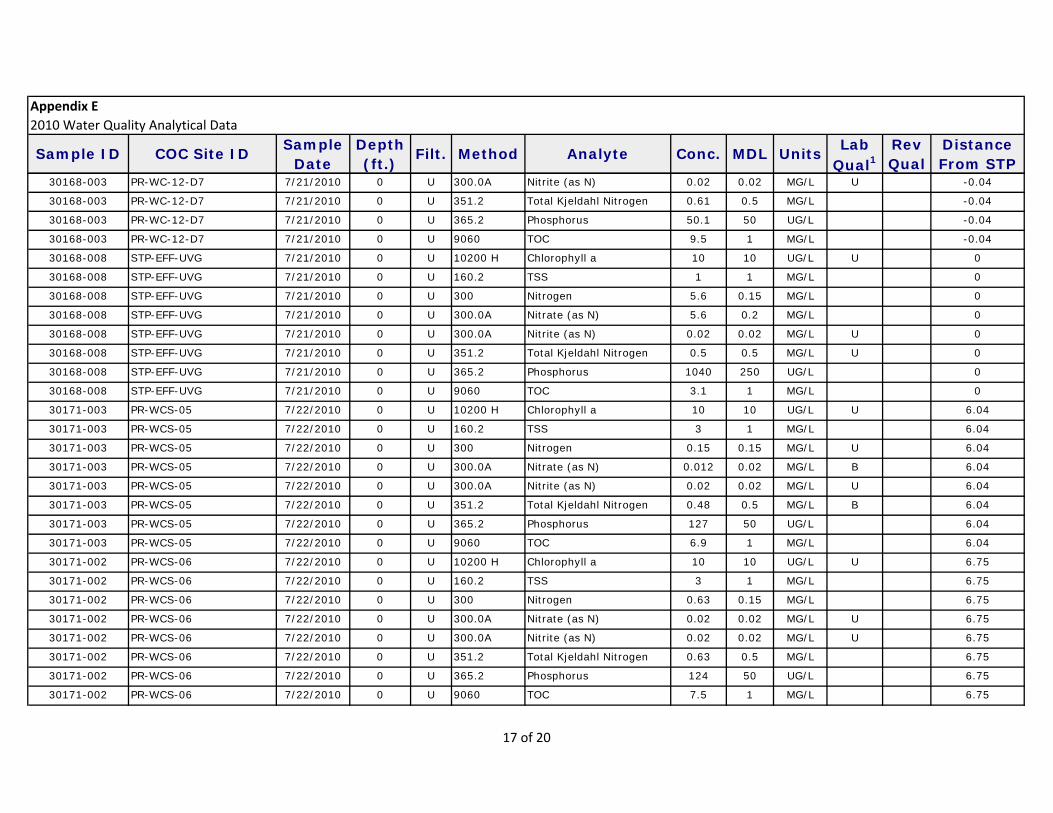
Sample Depth Lab Rev DistanceDate (ft.) Qual1 Qual From STP
Appendix E
2010 Water Quality Analytical Data
MDL UnitsSample ID COC Site ID Filt. Method Analyte Conc.
30168-003 PR-WC-12-D7 7/21/2010 0 U 300.0A Nitrite (as N) 0.02 0.02 MG/L U -0.04
30168-003 PR-WC-12-D7 7/21/2010 0 U 351.2 Total Kjeldahl Nitrogen 0.61 0.5 MG/L -0.04
30168-003 PR-WC-12-D7 7/21/2010 0 U 365.2 Phosphorus 50.1 50 UG/L -0.04
30168-003 PR-WC-12-D7 7/21/2010 0 U 9060 TOC 9.5 1 MG/L -0.04
30168-008 STP-EFF-UVG 7/21/2010 0 U 10200 H Chlorophyll a 10 10 UG/L U 0
30168-008 STP-EFF-UVG 7/21/2010 0 U 160.2 TSS 1 1 MG/L 0
30168-008 STP-EFF-UVG 7/21/2010 0 U 300 Nitrogen 5.6 0.15 MG/L 0
30168-008 STP-EFF-UVG 7/21/2010 0 U 300.0A Nitrate (as N) 5.6 0.2 MG/L 0
30168-008 STP-EFF-UVG 7/21/2010 0 U 300.0A Nitrite (as N) 0.02 0.02 MG/L U 0
30168-008 STP-EFF-UVG 7/21/2010 0 U 351.2 Total Kjeldahl Nitrogen 0.5 0.5 MG/L U 0
30168-008 STP-EFF-UVG 7/21/2010 0 U 365.2 Phosphorus 1040 250 UG/L 0
30168-008 STP-EFF-UVG 7/21/2010 0 U 9060 TOC 3.1 1 MG/L 0
30171-003 PR-WCS-05 7/22/2010 0 U 10200 H Chlorophyll a 10 10 UG/L U 6.04
30171-003 PR-WCS-05 7/22/2010 0 U 160.2 TSS 3 1 MG/L 6.04
30171-003 PR-WCS-05 7/22/2010 0 U 300 Nitrogen 0.15 0.15 MG/L U 6.04
30171-003 PR-WCS-05 7/22/2010 0 U 300.0A Nitrate (as N) 0.012 0.02 MG/L B 6.04
30171-003 PR-WCS-05 7/22/2010 0 U 300.0A Nitrite (as N) 0.02 0.02 MG/L U 6.04
30171-003 PR-WCS-05 7/22/2010 0 U 351.2 Total Kjeldahl Nitrogen 0.48 0.5 MG/L B 6.04
30171-003 PR-WCS-05 7/22/2010 0 U 365.2 Phosphorus 127 50 UG/L 6.04
30171-003 PR-WCS-05 7/22/2010 0 U 9060 TOC 6.9 1 MG/L 6.04
30171-002 PR-WCS-06 7/22/2010 0 U 10200 H Chlorophyll a 10 10 UG/L U 6.75
30171-002 PR-WCS-06 7/22/2010 0 U 160.2 TSS 3 1 MG/L 6.75
30171-002 PR-WCS-06 7/22/2010 0 U 300 Nitrogen 0.63 0.15 MG/L 6.75
30171-002 PR-WCS-06 7/22/2010 0 U 300.0A Nitrate (as N) 0.02 0.02 MG/L U 6.75
30171-002 PR-WCS-06 7/22/2010 0 U 300.0A Nitrite (as N) 0.02 0.02 MG/L U 6.75
30171-002 PR-WCS-06 7/22/2010 0 U 351.2 Total Kjeldahl Nitrogen 0.63 0.5 MG/L 6.75
30171-002 PR-WCS-06 7/22/2010 0 U 365.2 Phosphorus 124 50 UG/L 6.75
30171-002 PR-WCS-06 7/22/2010 0 U 9060 TOC 7.5 1 MG/L 6.75
17 of 20

Sample Depth Lab Rev DistanceDate (ft.) Qual1 Qual From STP
Appendix E
2010 Water Quality Analytical Data
MDL UnitsSample ID COC Site ID Filt. Method Analyte Conc.
30171-001 PR-WCS-07 7/22/2010 0 U 10200 H Chlorophyll a 10 10 UG/L U 7.23
30171-001 PR-WCS-07 7/22/2010 0 U 160.2 TSS 3 1 MG/L 7.23
30171-001 PR-WCS-07 7/22/2010 0 U 300 Nitrogen 0.65 0.15 MG/L 7.23
30171-001 PR-WCS-07 7/22/2010 0 U 300.0A Nitrate (as N) 0.017 0.02 MG/L B 7.23
30171-001 PR-WCS-07 7/22/2010 0 U 300.0A Nitrite (as N) 0.02 0.02 MG/L U 7.23
30171-001 PR-WCS-07 7/22/2010 0 U 351.2 Total Kjeldahl Nitrogen 0.65 0.5 MG/L 7.23
30171-001 PR-WCS-07 7/22/2010 0 U 365.2 Phosphorus 121 50 UG/L 7.23
30171-001 PR-WCS-07 7/22/2010 0 U 9060 TOC 7.8 1 MG/L 7.23
30206-002 PR-WC-01 8/4/2010 0 U 10200 H Chlorophyll a 10 10 UG/L U 2.98
30206-002 PR-WC-01 8/4/2010 0 U 160.2 TSS 5 1 MG/L 2.98
30206-002 PR-WC-01 8/4/2010 0 U 300 Nitrogen 0.72 0.15 MG/L 2.98
30206-002 PR-WC-01 8/4/2010 0 U 300.0A Nitrate (as N) 0.0051 0.02 MG/L B 2.98
30206-002 PR-WC-01 8/4/2010 0 U 300.0A Nitrite (as N) 0.02 0.02 MG/L U 2.98
30206-002 PR-WC-01 8/4/2010 0 U 351.2 Total Kjeldahl Nitrogen 0.72 0.5 MG/L 2.98
30206-002 PR-WC-01 8/4/2010 0 U 365.2 Phosphorus 145 50 UG/L J 2.98
30206-002 PR-WC-01 8/4/2010 0 U 9060 TOC 8.2 1 MG/L 2.98
30206-003 PR-WC-03 8/4/2010 0 U 10200 H Chlorophyll a 10 10 UG/L U 2.1
30206-003 PR-WC-03 8/4/2010 0 U 160.2 TSS 5 1 MG/L 2.1
30206-003 PR-WC-03 8/4/2010 0 U 300 Nitrogen 0.87 0.15 MG/L 2.1
30206-003 PR-WC-03 8/4/2010 0 U 300.0A Nitrate (as N) 0.0054 0.02 MG/L B 2.1
30206-003 PR-WC-03 8/4/2010 0 U 300.0A Nitrite (as N) 0.02 0.02 MG/L U 2.1
30206-003 PR-WC-03 8/4/2010 0 U 351.2 Total Kjeldahl Nitrogen 0.87 0.5 MG/L 2.1
30206-003 PR-WC-03 8/4/2010 0 U 365.2 Phosphorus 260 50 UG/L J 2.1
30206-003 PR-WC-03 8/4/2010 0 U 9060 TOC 6.8 1 MG/L 2.1
30206-004 PR-WC-04 8/4/2010 0 U 10200 H Chlorophyll a 10 10 UG/L U 1.7
30206-004 PR-WC-04 8/4/2010 0 U 160.2 TSS 2 1 MG/L 1.7
30206-004 PR-WC-04 8/4/2010 0 U 300 Nitrogen 0.72 0.15 MG/L 1.7
Round 5 : 8/4/2010 to 8/5/2010
18 of 20

Sample Depth Lab Rev DistanceDate (ft.) Qual1 Qual From STP
Appendix E
2010 Water Quality Analytical Data
MDL UnitsSample ID COC Site ID Filt. Method Analyte Conc.
30206-004 PR-WC-04 8/4/2010 0 U 300.0A Nitrate (as N) 0.02 0.02 MG/L U 1.7
30206-004 PR-WC-04 8/4/2010 0 U 300.0A Nitrite (as N) 0.02 0.02 MG/L U 1.7
30206-004 PR-WC-04 8/4/2010 0 U 351.2 Total Kjeldahl Nitrogen 0.72 0.5 MG/L 1.7
30206-004 PR-WC-04 8/4/2010 0 U 365.2 Phosphorus 289 50 UG/L J 1.7
30206-004 PR-WC-04 8/4/2010 0 U 9060 TOC 7.3 1 MG/L 1.7
30206-001 PR-WCS-04 8/4/2010 0 U 10200 H Chlorophyll a 10 10 UG/L U 4.77
30206-001 PR-WCS-04 8/4/2010 0 U 160.2 TSS 3 1 MG/L 4.77
30206-001 PR-WCS-04 8/4/2010 0 U 300 Nitrogen 1.1 0.15 MG/L 4.77
30206-001 PR-WCS-04 8/4/2010 0 U 300.0A Nitrate (as N) 0.0061 0.02 MG/L B 4.77
30206-001 PR-WCS-04 8/4/2010 0 U 300.0A Nitrite (as N) 0.02 0.02 MG/L U 4.77
30206-001 PR-WCS-04 8/4/2010 0 U 351.2 Total Kjeldahl Nitrogen 1.1 0.5 MG/L 4.77
30206-001 PR-WCS-04 8/4/2010 0 U 365.2 Phosphorus 188 50 UG/L J 4.77
30206-001 PR-WCS-04 8/4/2010 0 U 9060 TOC 6.8 1 MG/L 4.77
30210-001 PR-WC-06 8/5/2010 0 U 10200 H Chlorophyll a 10 10 UG/L U 1.1
30210-001 PR-WC-06 8/5/2010 0 U 160.2 TSS 2 1 MG/L 1.1
30210-001 PR-WC-06 8/5/2010 0 U 300 Nitrogen 1.1 0.15 MG/L 1.1
30210-001 PR-WC-06 8/5/2010 0 U 300.0A Nitrate (as N) 0.25 0.02 MG/L 1.1
30210-001 PR-WC-06 8/5/2010 0 U 300.0A Nitrite (as N) 0.041 0.02 MG/L 1.1
30210-001 PR-WC-06 8/5/2010 0 U 351.2 Total Kjeldahl Nitrogen 0.82 0.5 MG/L 1.1
30210-001 PR-WC-06 8/5/2010 0 U 365.2 Phosphorus 346 50 UG/L J 1.1
30210-001 PR-WC-06 8/5/2010 0 U 9060 TOC 5.1 1 MG/L 1.1
30210-002 PR-WC-08 8/5/2010 0 U 10200 H Chlorophyll a 10 10 UG/L U 0.78
30210-002 PR-WC-08 8/5/2010 0 U 160.2 TSS 1 1 MG/L 0.78
30210-002 PR-WC-08 8/5/2010 0 U 300 Nitrogen 2.8 0.15 MG/L 0.78
30210-002 PR-WC-08 8/5/2010 0 U 300.0A Nitrate (as N) 2 0.2 MG/L 0.78
30210-002 PR-WC-08 8/5/2010 0 U 300.0A Nitrite (as N) 0.04 0.02 MG/L 0.78
30210-002 PR-WC-08 8/5/2010 0 U 351.2 Total Kjeldahl Nitrogen 0.76 0.5 MG/L 0.78
30210-002 PR-WC-08 8/5/2010 0 U 365.2 Phosphorus 478 50 UG/L J 0.78
19 of 20

Sample Depth Lab Rev DistanceDate (ft.) Qual1 Qual From STP
Appendix E
2010 Water Quality Analytical Data
MDL UnitsSample ID COC Site ID Filt. Method Analyte Conc.
30210-002 PR-WC-08 8/5/2010 0 U 9060 TOC 4.1 1 MG/L 0.78
30210-003 PR-WC-09 8/5/2010 0 U 10200 H Chlorophyll a 10 10 UG/L U 0.56
30210-003 PR-WC-09 8/5/2010 0 U 160.2 TSS 1 1 MG/L 0.56
30210-003 PR-WC-09 8/5/2010 0 U 300 Nitrogen 4.2 0.15 MG/L 0.56
30210-003 PR-WC-09 8/5/2010 0 U 300.0A Nitrate (as N) 3.3 0.2 MG/L 0.56
30210-003 PR-WC-09 8/5/2010 0 U 300.0A Nitrite (as N) 0.033 0.02 MG/L 0.56
30210-003 PR-WC-09 8/5/2010 0 U 351.2 Total Kjeldahl Nitrogen 0.87 0.5 MG/L 0.56
30210-003 PR-WC-09 8/5/2010 0 U 365.2 Phosphorus 880 100 UG/L J 0.56
30210-003 PR-WC-09 8/5/2010 0 U 9060 TOC 4 1 MG/L 0.56
30210-004 PR-WC-10 8/5/2010 0 U 10200 H Chlorophyll a 10 10 UG/L U 0.3
30210-004 PR-WC-10 8/5/2010 0 U 160.2 TSS 1 1 MG/L 0.3
30210-004 PR-WC-10 8/5/2010 0 U 300 Nitrogen 3.3 0.15 MG/L 0.3
30210-004 PR-WC-10 8/5/2010 0 U 300.0A Nitrate (as N) 3.3 0.2 MG/L 0.3
30210-004 PR-WC-10 8/5/2010 0 U 300.0A Nitrite (as N) 0.031 0.02 MG/L 0.3
30210-004 PR-WC-10 8/5/2010 0 U 351.2 Total Kjeldahl Nitrogen 0.41 0.5 MG/L B 0.3
30210-004 PR-WC-10 8/5/2010 0 U 365.2 Phosphorus 846 100 UG/L J 0.3
30210-004 PR-WC-10 8/5/2010 0 U 9060 TOC 4.4 1 MG/L 0.3
1 Qualifiers
B ‐
J ‐
U ‐ Indicates that the analyte was analyzed for but not detected.
Indicates that the reported value was obtained from a reading that was less than the Contract Required Detection Limit (CRDL), but greater than or
equal to the Instrument Detection Limit (IDL).
Indicates an estimated value. This flag is used either when estimating a concentration for tentatively identified compounds (TICs) where a 1:1
response is assumed, or when the mass spectral data indicates the presence of a compound that meets the identification criteria but the result is less
than the sample quantitation limit but greater than zero.
20 of 20
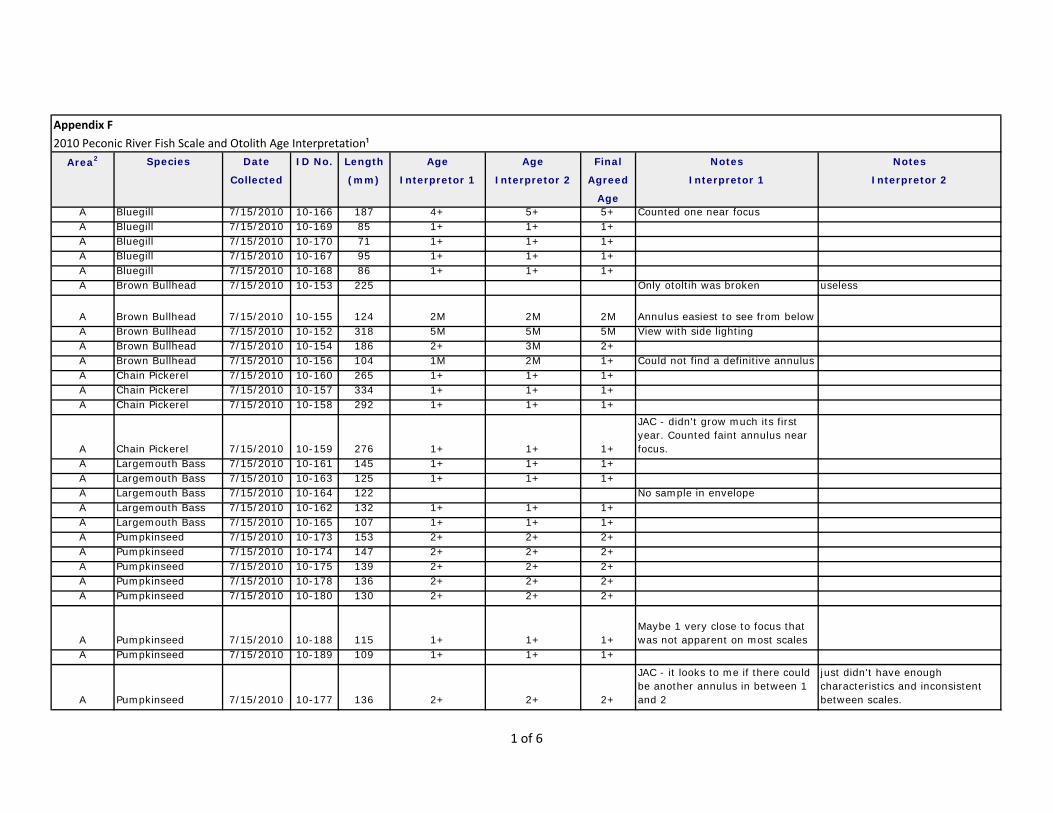
Area2 Species Date ID No. Length Age Age Final Notes Notes
Collected (mm) Interpretor 1 Interpretor 2 Agreed Interpretor 1 Interpretor 2
AgeA Bluegill 7/15/2010 10-166 187 4+ 5+ 5+ Counted one near focusA Bluegill 7/15/2010 10-169 85 1+ 1+ 1+A Bluegill 7/15/2010 10-170 71 1+ 1+ 1+A Bluegill 7/15/2010 10-167 95 1+ 1+ 1+A Bluegill 7/15/2010 10-168 86 1+ 1+ 1+A Brown Bullhead 7/15/2010 10-153 225 Only otoltih was broken useless
A Brown Bullhead 7/15/2010 10-155 124 2M 2M 2M Annulus easiest to see from belowA Brown Bullhead 7/15/2010 10-152 318 5M 5M 5M View with side lightingA Brown Bullhead 7/15/2010 10-154 186 2+ 3M 2+A Brown Bullhead 7/15/2010 10-156 104 1M 2M 1+ Could not find a definitive annulusA Chain Pickerel 7/15/2010 10-160 265 1+ 1+ 1+A Chain Pickerel 7/15/2010 10-157 334 1+ 1+ 1+A Chain Pickerel 7/15/2010 10-158 292 1+ 1+ 1+
A Chain Pickerel 7/15/2010 10-159 276 1+ 1+ 1+
JAC - didn't grow much its first year. Counted faint annulus near focus.
A Largemouth Bass 7/15/2010 10-161 145 1+ 1+ 1+A Largemouth Bass 7/15/2010 10-163 125 1+ 1+ 1+A Largemouth Bass 7/15/2010 10-164 122 No sample in envelopeA Largemouth Bass 7/15/2010 10-162 132 1+ 1+ 1+A Largemouth Bass 7/15/2010 10-165 107 1+ 1+ 1+A Pumpkinseed 7/15/2010 10-173 153 2+ 2+ 2+A Pumpkinseed 7/15/2010 10-174 147 2+ 2+ 2+A Pumpkinseed 7/15/2010 10-175 139 2+ 2+ 2+A Pumpkinseed 7/15/2010 10-178 136 2+ 2+ 2+A Pumpkinseed 7/15/2010 10-180 130 2+ 2+ 2+
A Pumpkinseed 7/15/2010 10-188 115 1+ 1+ 1+Maybe 1 very close to focus that was not apparent on most scales
A Pumpkinseed 7/15/2010 10-189 109 1+ 1+ 1+
A Pumpkinseed 7/15/2010 10-177 136 2+ 2+ 2+
JAC - it looks to me if there could be another annulus in between 1 and 2
just didn't have enough characteristics and inconsistent between scales.
2010 Peconic River Fish Scale and Otolith Age Interpretation¹
Appendix F
1 of 6

Area2 Species Date ID No. Length Age Age Final Notes Notes
Collected (mm) Interpretor 1 Interpretor 2 Agreed Interpretor 1 Interpretor 2
Age
2010 Peconic River Fish Scale and Otolith Age Interpretation¹
Appendix F
A Pumpkinseed 7/15/2010 10-183 125 2+ 2+ 2+
A Pumpkinseed 7/15/2010 10-185 122 2+ 2+ 2+
JAC - 2nd annulus has all of the characteristics of the other two? Crossing over and consistent
2 and 3 may be a little close together I guess…
A Pumpkinseed 7/15/2010 10-190 107 1+ 1+ 1+A Pumpkinseed 7/15/2010 10-192 100 1+ 1+ 1+A Pumpkinseed 7/15/2010 10-193 91 1+ 1+ 1+A Pumpkinseed 7/15/2010 10-171 168 2+ 3+ 3+A Pumpkinseed 7/15/2010 10-172 158 2+ 3+ 2+A Pumpkinseed 7/15/2010 10-181 130 2+ 2+ 2+A Pumpkinseed 7/15/2010 10-184 124 2+ 2+ 2+A Pumpkinseed 7/15/2010 10-186 121 2+ 2+ 2+A Pumpkinseed 7/15/2010 10-176 149 2+ 2+ 2+A Pumpkinseed 7/15/2010 10-179 131 2+ 2+ 2+A Pumpkinseed 7/15/2010 10-182 128 2+ 2+ 2+A Pumpkinseed 7/15/2010 10-187 117 2+ 2+ 2+A Pumpkinseed 7/15/2010 10-191 102 1+ 1+ 1+A Pumpkinseed 7/15/2010 10-194 89 1+ 1+ 1+C Brown Bullhead 7/13/2010 10-129 146 2M 2M 2MC Brown Bullhead 7/13/2010 10-125 341 5M 5M 5MC Brown Bullhead 7/13/2010 10-126 302 4M 4M 4MC Brown Bullhead 7/13/2010 10-127 296 4M 4M 4MC Brown Bullhead 7/13/2010 10-128 160 2M 2M 2M Annulus easiest to see from belowC Chain Pickerel 7/13/2010 10-150 100 0+ 0+ 0+C Chain Pickerel 7/13/2010 10-149 105 0+ 0+ 0+C Chain Pickerel 7/13/2010 10-151 97 0+ 0+ 0+C Chain Pickerel 7/13/2010 10-147 110 0+ 0+ 0+C Chain Pickerel 7/13/2010 10-146 115 0+ 0+ 0+C Chain Pickerel 7/13/2010 10-148 108 0+ 0+ 0+C Largemouth Bass 7/13/2010 10-143 115 1+ 1+ 1+C Largemouth Bass 7/13/2010 10-142 145 1+ 1+ 1+C Pumpkinseed 7/13/2010 10-132 145 2+ 2+ 2+C Pumpkinseed 7/13/2010 10-138 80 1+ 1+ 1+
2 of 6

Area2 Species Date ID No. Length Age Age Final Notes Notes
Collected (mm) Interpretor 1 Interpretor 2 Agreed Interpretor 1 Interpretor 2
Age
2010 Peconic River Fish Scale and Otolith Age Interpretation¹
Appendix F
C Pumpkinseed 7/13/2010 10-139 79 1+ 1+ 1+C Pumpkinseed 7/13/2010 10-135 136 2+ 2+ 2+
C Pumpkinseed 7/13/2010 10-136 121 3+ 2+ 3+
JAC - I aged three of the scales on this slide three years old and the others age-2 I went w/ two because of length and distance from last annulus to margin of scale.
C Pumpkinseed 7/13/2010 10-140 79 1+ 1+ 1+C Pumpkinseed 7/13/2010 10-134 142 2+ 2+ 2+
C Pumpkinseed 7/13/2010 10-141 75 1+ 1+ 1+
Not much growth as YOY; JAC - I agree hard to even find an annulus
C Pumpkinseed 7/13/2010 10-133 143 2+ 2+ 2+C Pumpkinseed 7/13/2010 10-137 81 1+ 1+ 1+D Bluegill 8/11/2010 10-222 124 2+ 1+ 2+ One right at edgeD Bluegill 8/11/2010 10-221 135 2+ 2+ 1+D Bluegill 8/11/2010 10-219 148 2+ 1+ 2+ One close to edge?D Bluegill 8/11/2010 10-220 144 1+ 1+ 1+D Brown Bullhead 8/11/2010 10-212 305 5+ 5+ 5+D Brown Bullhead 8/11/2010 10-214 281 4+ 4+ 4+D Brown Bullhead 8/11/2010 10-213 283 4+ 4+ 4+ Counted 1 very near focusD Brown Bullhead 8/11/2010 10-215 265 3+ 3+ 3+D Brown Bullhead 8/11/2010 10-216 175 1+ 1+ 1+D Largemouth Bass 8/11/2010 10-217 320 4+ 4+ 4+D Largemouth Bass 8/11/2010 10-218 201 1+ 1+ 1+D Pumpkinseed 8/11/2010 10-225 144 3+ 3+ 3+D Pumpkinseed 8/11/2010 10-224 144 3+ 2+ 3+ One right at edgeD Pumpkinseed 8/11/2010 10-227 130 2+ 1+ 2+ One right at edge
D Pumpkinseed 8/11/2010 10-228 121 1+ 1+ 1+Possibly one right at edge on some?
3 of 6

Area2 Species Date ID No. Length Age Age Final Notes Notes
Collected (mm) Interpretor 1 Interpretor 2 Agreed Interpretor 1 Interpretor 2
Age
2010 Peconic River Fish Scale and Otolith Age Interpretation¹
Appendix F
D Pumpkinseed 8/11/2010 10-223 145 3+ 2+ 3+
One right at edge; JAC - Maybe the ones near the edge are spawning checks?? Otherwise I think too little growth for the entire growing season to be considered an annulus.
D Pumpkinseed 8/11/2010 10-226 133 3+ 2+ 3+ One right at edgeD Brown Bullhead 8/3/2010 10-198 248 4+ 4+ 4+D Brown Bullhead 8/3/2010 10-202 147 1+ 1+ 1+D Brown Bullhead 8/3/2010 10-203 146 1+ 1+ 1+D Brown Bullhead 8/3/2010 10-206 134 1+ 1+ 1+D Brown Bullhead 8/3/2010 10-196 255 4+ 4+ 4+D Brown Bullhead 8/3/2010 10-199 245 4+ 4+ 4+ 1st is hard to see use side lightingD Brown Bullhead 8/3/2010 10-204 139 1+ 1+ 1+D Brown Bullhead 8/3/2010 10-195 295 4+ 4+ 4+D Brown Bullhead 8/3/2010 10-197 252 4+ 4+ 4+D Brown Bullhead 8/3/2010 10-200 245 2+ 2+ 2+
D Brown Bullhead 8/3/2010 10-207 130 1+ 1+ 1+ View upside down for best imageD Brown Bullhead 8/3/2010 10-201 240 2+ 2+ 2+D Brown Bullhead 8/3/2010 10-205 134 1+ 1+ 1+D Largemouth Bass 8/3/2010 10-211 284 4+ 4+ 4+D Pumpkinseed 8/3/2010 10-208 150 2+ 2+ 2+D Pumpkinseed 8/3/2010 10-210 110 1+ 1+ 1+D Pumpkinseed 8/3/2010 10-209 124 1+ 1+ 1+SR Brown Bullhead 8/13/2010 10-254 242 4+ 4+ 4+ View upside down for best imageSR Brown Bullhead 8/13/2010 10-253 260 4+ 4+ 4+MR Bluegill 8/13/2010 10-252 110 2+ 1+ 1+ annulus near focusMR Brown Bullhead 8/13/2010 10-237 237 4+ 4+ 4+MR Brown Bullhead 8/13/2010 10-238 236 4+ 4+ 4+MR Brown Bullhead 8/13/2010 10-240 215 4+ 4+ 4+MR Brown Bullhead 8/13/2010 10-241 195 2+ 2+ 2+
4 of 6

Area2 Species Date ID No. Length Age Age Final Notes Notes
Collected (mm) Interpretor 1 Interpretor 2 Agreed Interpretor 1 Interpretor 2
Age
2010 Peconic River Fish Scale and Otolith Age Interpretation¹
Appendix F
MR Brown Bullhead 8/13/2010 10-244 169 2+ 2+ 2+ View upside down for best imageMR Brown Bullhead 8/13/2010 10-245 167 2+ 2+ 2+MR Brown Bullhead 8/13/2010 10-229 290 4+ 4+ 4+MR Brown Bullhead 8/13/2010 10-233 251 4+ 4+ 4+MR Brown Bullhead 8/13/2010 10-234 245 4+ 4+ 4+MR Brown Bullhead 8/13/2010 10-239 230 4+ 4+ 4+ Counted 1 near focusMR Brown Bullhead 8/13/2010 10-247 162 2+ 2+ 2+MR Brown Bullhead 8/13/2010 10-236 242 4+ 4+ 4+MR Brown Bullhead 8/13/2010 10-230 281 5+ 5+ 5+MR Brown Bullhead 8/13/2010 10-231 268 4+ 4+ 4+MR Brown Bullhead 8/13/2010 10-232 261 4+ 4+ 4+MR Brown Bullhead 8/13/2010 10-235 244 4+ 4+ 4+MR Brown Bullhead 8/13/2010 10-242 190 2+ 2+ 2+MR Brown Bullhead 8/13/2010 10-243 171 2+ 2+ 2+MR Brown Bullhead 8/13/2010 10-246 163 2+ 2+ 2+MR Largemouth Bass 8/13/2010 10-248 203 2+ 2+ 2+MR Pumpkinseed 8/13/2010 10-250 149 2+ 2+ 2+MR Pumpkinseed 8/13/2010 10-251 145 2+ 2+ 2+MR Pumpkinseed 8/13/2010 10-249 151 3+ 3+ 3+DP Bluegill 5/25/2010 10-038 195 4+ 4+ 4+DP Bluegill 5/25/2010 10-043 203 5+ 5+ 5+DP Bluegill 5/25/2010 10-036 180 4+ 4+ 4+DP Bluegill 5/25/2010 10-039 210 4+ 4+ 4+DP Bluegill 5/25/2010 10-034 181 4+ 4+ 4+DP Bluegill 5/25/2010 10-040 198 5+ 5+ 5+DP Bluegill 5/25/2010 10-042 100 5+ 5+ 5+DP Bluegill 5/25/2010 10-035 180 5+ 5+ 5+DP Bluegill 5/25/2010 10-037 195 7+ 5+ 6+DP Bluegill 5/25/2010 10-041 189 5+ 4+ 5+DP Bluegill 5/25/2010 10-044 232 5+ 4+ 5+
DP Brown Bullhead 5/25/2010 10-054 300 11M 12M 12M JAC - Counted one near the focusDP Brown Bullhead 5/25/2010 10-055 317 5M 5M 5M
5 of 6

Area2 Species Date ID No. Length Age Age Final Notes Notes
Collected (mm) Interpretor 1 Interpretor 2 Agreed Interpretor 1 Interpretor 2
Age
2010 Peconic River Fish Scale and Otolith Age Interpretation¹
Appendix F
DP Brown Bullhead 5/25/2010 10-050 300 6M 6M 6MDP Brown Bullhead 5/25/2010 10-057 315 11M 11M 11MDP Brown Bullhead 5/25/2010 10-058 334 6M 6M 6M
DP Brown Bullhead 5/25/2010 10-049 299 12M 12M 12M View upside-down for best imageDP Brown Bullhead 5/25/2010 10-051 300 4M 4M 4MDP Brown Bullhead 5/25/2010 10-052 300 5M 5M 5MDP Brown Bullhead 5/25/2010 10-056 305 8M 8M 8M
DP Brown Bullhead 5/25/2010 10-053 310 5M 5M 5MGave it my best shot; not totally confident could be a 4M
DP Chain Pickerel 5/25/2010 10-048 338 3+ 3+ 3+DP Largemouth Bass 5/25/2010 10-046 262 5+ 6+ 6+
DP Largemouth Bass 5/25/2010 10-045 242 4M 4+ 4+ Counted margin as 4th annulusDP Largemouth Bass 5/25/2010 10-047 455 10+ 9 + 8+DP Pumpkinseed 5/25/2010 10-029 190 6+ 5+ 6+DP Pumpkinseed 5/25/2010 10-032 195 6+ 6+ 6+DP Pumpkinseed 5/25/2010 10-021 175 6+ 5+ 5+DP Pumpkinseed 5/25/2010 10-023 180 6+ 6+ 6+DP Pumpkinseed 5/25/2010 10-026 180 7+ 6+ 6+DP Pumpkinseed 5/25/2010 10-025 175 3+ 3+ 4+ Difficult; should check againDP Pumpkinseed 5/25/2010 10-027 170 6+ 5+ 5+DP Pumpkinseed 5/25/2010 10-031 190 6+ 5+ 5+DP Pumpkinseed 5/25/2010 10-033 200 4+ 4+ 4+DP Pumpkinseed 5/25/2010 10-022 175 4+ 3+ 3+DP Pumpkinseed 5/25/2010 10-024 179 5+ 5+ 5+DP Pumpkinseed 5/25/2010 10-028 180 5+ 5+ 5+DP Pumpkinseed 5/25/2010 10-030 190 6+ 5+ 5+
* Length from COC
2 Key SR=Schultz Road, MR=Manor Road, DP=Donoahue's Pond
1 Scale and Odolith age interpretation performed by Ecologic, LLC, Cazenovia, New York.
6 of 6

Fish ID or Length Wet Wet Age Sample Sample Conc. MDL Lab RevComposite ID (mm) Weight Weight (yrs) Date Time (mg/kg) (mg/kg) Qual1 Qual
Whole Fillet(grams) (grams)
A 30148-001 10-152 Brown Bullhead 318 426 123.3 5 256637 7/15/2010 1500 EPA 7471A 0.124 0.00342A 30148-002 30148-bc2 Brown Bullhead 206 296 90.8 2 256637 7/15/2010 1500 EPA 7471A 0.383 0.00355A 30148-003 30148-bc3 Brown Bullhead 114 46 10 1.5 256637 7/15/2010 1500 EPA 7471A 1.2 0.0348A 30148-004 10-157 Chain Pickerel 334 224 100.3 1 256637 7/15/2010 1500 EPA 7471A 0.356 0.00399A 30148-005 30148-bc5 Chain Pickerel 278 426 172.3 1 256637 7/15/2010 1500 EPA 7471A 0.351 0.00346A 30148-006 30148-bc6 Largemouth Bass 131 146 47.9 1 256637 7/15/2010 1500 EPA 7471A 0.276 0.00379A 30148-007 10-165 Largemouth Bass 107 20 7.3 1 256637 7/15/2010 1500 EPA 7471A 0.41 0.00381A 30148-008 10-166 Bluegill 187 154 54.1 5 256637 7/15/2010 1500 EPA 7471A 0.289 0.00386A 30148-009 30148-bc9 Bluegill 84 64 19.5 1 256637 7/15/2010 1500 EPA 7471A 0.854 0.0398A 30148-010 30148-bc10 Pumpkinseed 152 663 192.4 2.2 256637 7/15/2010 1500 EPA 7471A 0.427 0.00382A 30148-011 30148-bc11 Pumpkinseed 132 350 112.7 2 256637 7/15/2010 1500 EPA 7471A 0.489 0.00382A 30148-012 30148-bc12 Pumpkinseed 121 262 83.9 1.8 256637 7/15/2010 1500 EPA 7471A 0.5 0.00362A 30148-013 30148-bc13 Pumpkinseed 100 148 45.7 1 256637 7/15/2010 1500 EPA 7471A 0.367 0.00378C 28834-001 10-125 Brown Bullhead 341 616 192 5 256552 7/13/2010 1200 EPA 7471A 0.163 0.00403 *ENC 28834-002 10-126 Brown Bullhead 302 394 101 4 256552 7/13/2010 1200 EPA 7471A 0.237 0.0034 *ENC 28834-003 10-127 Brown Bullhead 296 386 110.1 4 256552 7/13/2010 1200 EPA 7471A 0.215 0.00398 *ENC 28834-004 10-128 Brown Bullhead 160 54 13.2 2 256552 7/13/2010 1200 EPA 7471A 0.385 0.004 *ENC 28834-005 10-129 Brown Bullhead 146 42 12.6 2 256552 7/13/2010 1200 EPA 7471A 0.648 0.034 *ENC 28834-008 10-132 Pumpkinseed 145 74 25 2 256552 7/13/2010 1200 EPA 7471A 0.301 0.00361 *ENC 28834-009 10-133 Pumpkinseed 143 68 27.3 2 256552 7/13/2010 1200 EPA 7471A 0.252 0.0034 *ENC 28834-010 10-134 Pumpkinseed 142 66 21.1 2 256552 7/13/2010 1200 EPA 7471A 0.234 0.00393 *ENC 28834-011 10-135 Pumpkinseed 136 58 22.3 2 256552 7/13/2010 1200 EPA 7471A 0.234 0.00389 *ENC 28834-012 10-136 Pumpkinseed 121 40 14.2 3 256552 7/13/2010 1200 EPA 7471A 0.289 0.00366 *ENC 28834-013 28834-bc13 Pumpkinseed 81 20 8.1 1 256552 7/13/2010 1200 EPA 7471A 0.709 0.0401 *ENC 28834-014 28834-bc14 Pumpkinseed 77 18 8.2 1 256552 7/13/2010 1200 EPA 7471A 0.323 0.00376 *ENC 28834-015 10-140 Pumpkinseed 79 10 5.8 1 256552 7/13/2010 1200 EPA 7471A 0.212 0.00378 *ENC 28834-016 10-142 Largemouth Bass 145 42 15.8 1 256552 7/13/2010 1200 EPA 7471A 0.696 0.034 *ENC 28834-017 10-143 Largemouth Bass 115 26 11.1 1 256552 7/13/2010 1200 EPA 7471A 0.839 0.0347 *ENC 28834-020 28834-bc20 Chain Pickerel 113 16 8.2 0 256552 7/13/2010 1200 EPA 7471A 0.315 0.00382 *ENC 28834-021 28834-bc21 Chain Pickerel 107 14 7 0 256552 7/13/2010 1200 EPA 7471A 0.503 0.00384 *ENC 28834-022 28834-bc22 Chain Pickerel 99 12 6.8 0 256552 7/13/2010 1200 EPA 7471A 0.569 0.00405 *END 30239-001 30239-bc1 Brown Bullhead 294 706 232.1 4.5 258722 8/11/2010 1200 EPA 7471A 0.156 0.00366 *END 30239-002 30239-bc2 Brown Bullhead 273 530 159.3 3.5 258722 8/11/2010 1200 EPA 7471A 0.109 0.00342 *END 30239-003 10-216 Brown Bullhead 175 68 21.4 1 258722 8/11/2010 1200 EPA 7471A 0.118 0.00403 *END 30239-004 10-217 Largemouth Bass 320 564 236.8 4 258722 8/11/2010 1200 EPA 7471A 0.503 0.00391 *END 30239-005 10-218 Largemouth Bass 201 130 46.9 1 258722 8/11/2010 1200 EPA 7471A 0.362 0.0036 *END 30239-006 30239-bc6 Bluegill 138 208 95.8 1.5 258722 8/11/2010 1200 EPA 7471A 0.243 0.00389 *END 30239-007 30239-bc7 Pumpkinseed 136 384 137.1 2.5 258722 8/11/2010 1200 EPA 7471A 0.209 0.00389 *END 30203-001 10-195 Brown Bullhead 295 332 86.1 4 257938 8/3/2010 1200 EPA 7471A 0.312 0.00408 ND 30203-002 10-196 Brown Bullhead 255 246 71 4 257938 8/3/2010 1200 EPA 7471A 0.315 0.00343 ND 30203-003 10-197 Brown Bullhead 252 200 59.8 4 257938 8/3/2010 1200 EPA 7471A 0.283 0.00402 ND 30203-004 10-198 Brown Bullhead 248 212 64.3 4 257938 8/3/2010 1200 EPA 7471A 0.259 0.00368 ND 30203-005 10-199 Brown Bullhead 245 212 72.4 4 257938 8/3/2010 1200 EPA 7471A 0.331 0.00381 ND 30203-006 10-200 Brown Bullhead 245 204 63.4 2 257938 8/3/2010 1200 EPA 7471A 0.0634 0.0034 ND 30203-007 10-201 Brown Bullhead 240 192 60.7 2 257938 8/3/2010 1200 EPA 7471A 0.168 0.00392 ND 30203-008 10-202 Brown Bullhead 147 40 10.1 1 257938 8/3/2010 1200 EPA 7471A 0.371 0.00361 ND 30203-009 10-203 Brown Bullhead 146 42 11.8 1 257938 8/3/2010 1200 EPA 7471A 0.242 0.00392 ND 30203-010 10-204 Brown Bullhead 139 34 10.1 1 257938 8/3/2010 1200 EPA 7471A 0.473 0.00378 N
Appendix G ‐ 2010 Peconic River Fish Samples
Mercury
Area Sample ID Species SDG Method
1 of 3

Fish ID or Length Wet Wet Age Sample Sample Conc. MDL Lab RevComposite ID (mm) Weight Weight (yrs) Date Time (mg/kg) (mg/kg) Qual1 Qual
Whole Fillet(grams) (grams)
Appendix G ‐ 2010 Peconic River Fish Samples
Mercury
Area Sample ID Species SDG Method
D 30203-011 10-205 Brown Bullhead 134 32 9.3 1 257938 8/3/2010 1200 EPA 7471A 0.296 0.00378 ND 30203-012 10-206 Brown Bullhead 134 28 9.9 1 257938 8/3/2010 1200 EPA 7471A 0.236 0.00384 ND 30203-013 10-207 Brown Bullhead 130 28 9.7 1 257938 8/3/2010 1200 EPA 7471A 0.312 0.00392 ND 30203-014 10-208 Pumpkinseed 150 82 33.7 2 257938 8/3/2010 1200 EPA 7471A 0.182 0.00353 ND 30203-015 10-209 Pumpkinseed 124 40 14.9 1 257938 8/3/2010 1200 EPA 7471A 0.584 0.00788 ND 30203-016 10-210 Pumpkinseed 110 26 9.9 1 257938 8/3/2010 1200 EPA 7471A 0.574 0.0073 ND 30203-017 10-211 Largemouth Bass 284 332 123.9 4 257938 8/3/2010 1200 EPA 7471A 0.387 0.0034 NSR 30244-001 30244-bc1 Brown Bullhead 251 444 113.4 4 258848 8/13/2010 1200 EPA 7471A 0.363 0.00408MR 30236-001 10-229 Brown Bullhead 290 368 107.2 4 258846 8/13/2010 1200 EPA 7471A 0.235 0.00388MR 30236-002 10-230 Brown Bullhead 281 318 78.2 5 258846 8/13/2010 1200 EPA 7471A 0.289 0.004MR 30236-003 10-231 Brown Bullhead 268 262 77.3 4 258846 8/13/2010 1200 EPA 7471A 0.299 0.00343MR 30236-004 30236-bc4 Brown Bullhead 256 506 143.5 4 258846 8/13/2010 1200 EPA 7471A 0.241 0.00407MR 30236-005 10-234 Brown Bullhead 245 222 73.3 4 258846 8/13/2010 1200 EPA 7471A 0.25 0.00351MR 30236-006 30236-bc6 Brown Bullhead 243 368 103.2 4 258846 8/13/2010 1200 EPA 7471A 0.202 0.00342MR 30236-007 30236-bc7 Brown Bullhead 237 354 112 4 258846 8/13/2010 1200 EPA 7471A 0.317 0.00396MR 30236-008 30236-bc8 Brown Bullhead 223 300 87.4 4 258846 8/13/2010 1200 EPA 7471A 0.235 0.0039MR 30236-009 30236-bc9 Brown Bullhead 185 234 70.8 2 258846 8/13/2010 1200 EPA 7471A 0.202 0.00408MR 30236-010 10-244 Brown Bullhead 169 58 15 2 258846 8/13/2010 1200 EPA 7471A 0.282 0.00386MR 30236-011 10-245 Brown Bullhead 167 62 14.8 2 258846 8/13/2010 1200 EPA 7471A 0.348 0.00386MR 30236-012 10-246 Brown Bullhead 163 48 12.9 2 258846 8/13/2010 1200 EPA 7471A 0.223 0.00376MR 30236-013 10-247 Brown Bullhead 162 52 12.9 2 258846 8/13/2010 1200 EPA 7471A 0.283 0.00384MR 30236-014 10-248 Largemouth Bass 203 114 34.6 2 258846 8/13/2010 1200 EPA 7471A 0.278 0.00355MR 30236-015 10-249 Pumpkinseed 151 78 21.9 3 258846 8/13/2010 1200 EPA 7471A 0.293 0.00374MR 30236-016 10-250 Pumpkinseed 149 82 26 2 258846 8/13/2010 1200 EPA 7471A 0.107 0.00391MR 30236-017 10-251 Pumpkinseed 145 64 17.5 2 258846 8/13/2010 1200 EPA 7471A 0.158 0.00387MR 30236-018 10-252 Bluegill 110 28 8.8 1 258846 8/13/2010 1200 EPA 7471A 0.266 0.0039DP 28623-001 28623-bc1 Pumpkinseed 175 242 86.6 4 253786 5/25/2010 1500 EPA 7471A 0.129 0.0034DP 28623-002 28623-bc2 Pumpkinseed 180 282 97.9 6 253786 5/25/2010 1500 EPA 7471A 0.163 0.00359DP 28623-003 10-024 Pumpkinseed 179 138 55.6 5 253786 5/25/2010 1500 EPA 7471A 0.138 0.00358DP 28623-004 10-025 Pumpkinseed 175 148 56.6 4 253786 5/25/2010 1500 EPA 7471A 0.0889 0.0034DP 28623-005 28623-bc5 Pumpkinseed 175 290 97 5 253786 5/25/2010 1500 EPA 7471A 0.0638 0.00407DP 28623-006 28623-bc6 Pumpkinseed 190 326 93.4 5.5 253786 5/25/2010 1500 EPA 7471A 0.17 0.00396DP 28623-007 10-031 Pumpkinseed 190 168 53.6 5 253786 5/25/2010 1500 EPA 7471A 0.0733 0.00408DP 28623-008 10-032 Pumpkinseed 195 192 62.3 6 253786 5/25/2010 1500 EPA 7471A 0.161 0.004DP 28623-009 10-033 Pumpkinseed 200 212 63 4 253786 5/25/2010 1500 EPA 7471A 0.0788 0.00388DP 28623-010 10-034 Bluegill 181 160 60.1 4 253786 5/25/2010 1500 EPA 7471A 0.0797 0.00393DP 28623-011 10-035 Bluegill 180 162 49.2 5 253786 5/25/2010 1500 EPA 7471A 0.256 0.00402DP 28623-012 10-036 Bluegill 180 162 59.3 4 253786 5/25/2010 1500 EPA 7471A 0.0728 0.0037DP 28623-013 10-037 Bluegill 195 168 55.1 6 253786 5/25/2010 1500 EPA 7471A 0.155 0.00365DP 28623-014 10-038 Bluegill 195 192 63.6 4 253786 5/25/2010 1500 EPA 7471A 0.151 0.00379DP 28623-015 10-039 Bluegill 210 192 62.8 4 253786 5/25/2010 1500 EPA 7471A 0.121 0.00352DP 28623-016 10-040 Bluegill 198 196 60.7 5 253786 5/25/2010 1500 EPA 7471A 0.122 0.0035DP 28623-017 10-041 Bluegill 189 196 61.9 5 253786 5/25/2010 1500 EPA 7471A 0.0686 0.00372DP 28623-018 10-042 Bluegill 100 202 70.6 5 253786 5/25/2010 1500 EPA 7471A 0.188 0.00408DP 28623-019 10-043 Bluegill 203 220 78 5 253786 5/25/2010 1500 EPA 7471A 0.149 0.00389DP 28623-020 10-044 Bluegill 232 232 80 5 253786 5/25/2010 1500 EPA 7471A 0.192 0.00404DP 28624-001 10-045 Largemouth Bass 242 208 70.1 4 253785 5/25/2010 1500 EPA 7471A 0.348 0.0034DP 28624-002 10-046 Largemouth Bass 262 274 88.7 6 253785 5/25/2010 1500 EPA 7471A 0.452 0.00394
2 of 3
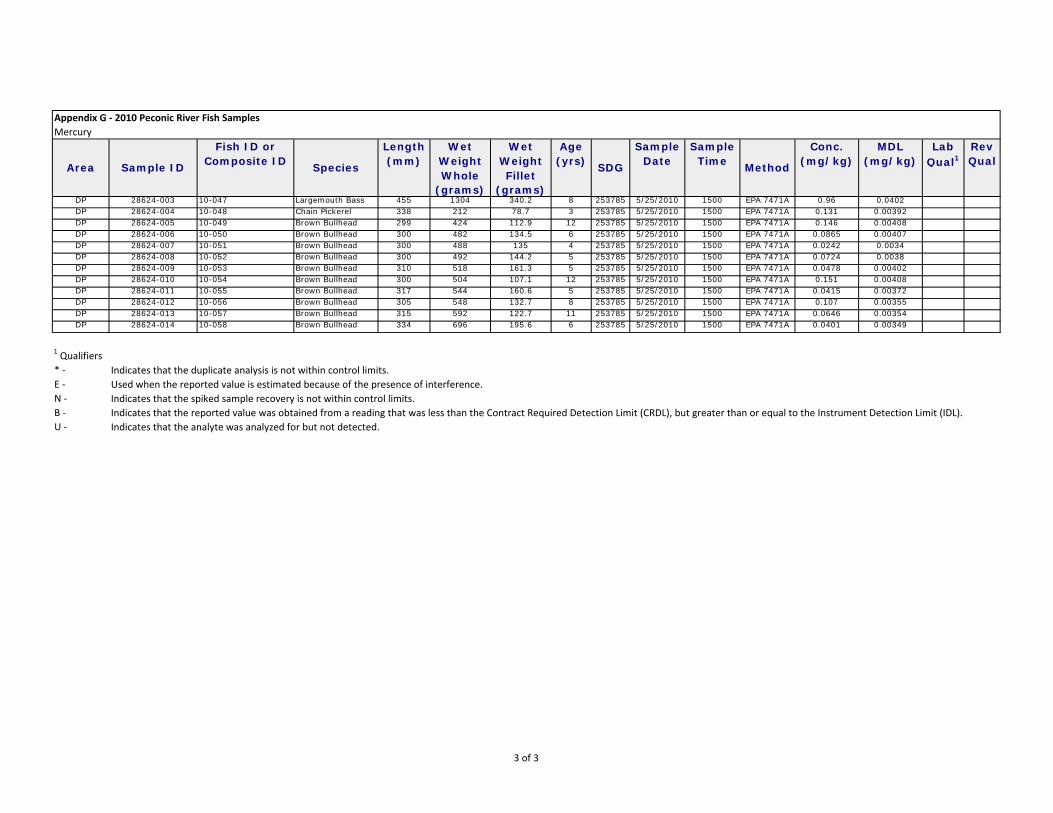
Fish ID or Length Wet Wet Age Sample Sample Conc. MDL Lab RevComposite ID (mm) Weight Weight (yrs) Date Time (mg/kg) (mg/kg) Qual1 Qual
Whole Fillet(grams) (grams)
Appendix G ‐ 2010 Peconic River Fish Samples
Mercury
Area Sample ID Species SDG Method
DP 28624-003 10-047 Largemouth Bass 455 1304 340.2 8 253785 5/25/2010 1500 EPA 7471A 0.96 0.0402DP 28624-004 10-048 Chain Pickerel 338 212 78.7 3 253785 5/25/2010 1500 EPA 7471A 0.131 0.00392DP 28624-005 10-049 Brown Bullhead 299 424 112.9 12 253785 5/25/2010 1500 EPA 7471A 0.146 0.00408DP 28624-006 10-050 Brown Bullhead 300 482 134.5 6 253785 5/25/2010 1500 EPA 7471A 0.0865 0.00407DP 28624-007 10-051 Brown Bullhead 300 488 135 4 253785 5/25/2010 1500 EPA 7471A 0.0242 0.0034DP 28624-008 10-052 Brown Bullhead 300 492 144.2 5 253785 5/25/2010 1500 EPA 7471A 0.0724 0.0038DP 28624-009 10-053 Brown Bullhead 310 518 161.3 5 253785 5/25/2010 1500 EPA 7471A 0.0478 0.00402DP 28624-010 10-054 Brown Bullhead 300 504 107.1 12 253785 5/25/2010 1500 EPA 7471A 0.151 0.00408DP 28624-011 10-055 Brown Bullhead 317 544 160.6 5 253785 5/25/2010 1500 EPA 7471A 0.0415 0.00372DP 28624-012 10-056 Brown Bullhead 305 548 132.7 8 253785 5/25/2010 1500 EPA 7471A 0.107 0.00355DP 28624-013 10-057 Brown Bullhead 315 592 122.7 11 253785 5/25/2010 1500 EPA 7471A 0.0646 0.00354DP 28624-014 10-058 Brown Bullhead 334 696 195.6 6 253785 5/25/2010 1500 EPA 7471A 0.0401 0.00349
1 Qualifiers
* ‐
E ‐
N ‐
B ‐
U ‐ Indicates that the analyte was analyzed for but not detected.
Indicates that the duplicate analysis is not within control limits.
Used when the reported value is estimated because of the presence of interference.
Indicates that the spiked sample recovery is not within control limits.
Indicates that the reported value was obtained from a reading that was less than the Contract Required Detection Limit (CRDL), but greater than or equal to the Instrument Detection Limit (IDL).
3 of 3

Fish ID or Length Wet Wet Age Sample Sample Conc. MDL Lab RevComposite ID (mm) Weight Weight (years) Date Time (ug/kg) (ug/kg) Qual1 Qual
Whole Fillet(grams) (grams)
A 30148-010 30148-bc10 Pumpkinseed 152 663 192.4 2.2 256637 7/15/2010 1500 EPA 8082 Aroclor 1016 50 50 UA 30148-010 30148-bc10 Pumpkinseed 152 663 192.4 2.2 256637 7/15/2010 1500 EPA 8082 Aroclor 1221 50 50 UA 30148-010 30148-bc10 Pumpkinseed 152 663 192.4 2.2 256637 7/15/2010 1500 EPA 8082 Aroclor 1232 50 50 UA 30148-010 30148-bc10 Pumpkinseed 152 663 192.4 2.2 256637 7/15/2010 1500 EPA 8082 Aroclor 1242 50 50 UA 30148-010 30148-bc10 Pumpkinseed 152 663 192.4 2.2 256637 7/15/2010 1500 EPA 8082 Aroclor 1248 50 50 UA 30148-010 30148-bc10 Pumpkinseed 152 663 192.4 2.2 256637 7/15/2010 1500 EPA 8082 Aroclor 1254 22.5 50 JA 30148-010 30148-bc10 Pumpkinseed 152 663 192.4 2.2 256637 7/15/2010 1500 EPA 8082 Aroclor 1260 50 50 UC 28834-001 10-125 Brown Bullhead 341 616 192 5 256552 7/13/2010 1200 EPA 8082 Aroclor 1016 9.95 9.95 UC 28834-001 10-125 Brown Bullhead 341 616 192 5 256552 7/13/2010 1200 EPA 8082 Aroclor 1221 9.95 9.95 UC 28834-001 10-125 Brown Bullhead 341 616 192 5 256552 7/13/2010 1200 EPA 8082 Aroclor 1232 9.95 9.95 UC 28834-001 10-125 Brown Bullhead 341 616 192 5 256552 7/13/2010 1200 EPA 8082 Aroclor 1242 9.95 9.95 UC 28834-001 10-125 Brown Bullhead 341 616 192 5 256552 7/13/2010 1200 EPA 8082 Aroclor 1248 9.95 9.95 UC 28834-001 10-125 Brown Bullhead 341 616 192 5 256552 7/13/2010 1200 EPA 8082 Aroclor 1254 9.95 9.95 UC 28834-001 10-125 Brown Bullhead 341 616 192 5 256552 7/13/2010 1200 EPA 8082 Aroclor 1260 9.95 9.95 UD 30239-001 30239-bc1 Brown Bullhead 294 706 232.1 4.5 258722 8/11/2010 1200 EPA 8082 Aroclor 1016 9.91 9.91 UD 30239-001 30239-bc1 Brown Bullhead 294 706 232.1 4.5 258722 8/11/2010 1200 EPA 8082 Aroclor 1221 9.91 9.91 UD 30239-001 30239-bc1 Brown Bullhead 294 706 232.1 4.5 258722 8/11/2010 1200 EPA 8082 Aroclor 1232 9.91 9.91 UD 30239-001 30239-bc1 Brown Bullhead 294 706 232.1 4.5 258722 8/11/2010 1200 EPA 8082 Aroclor 1242 9.91 9.91 UD 30239-001 30239-bc1 Brown Bullhead 294 706 232.1 4.5 258722 8/11/2010 1200 EPA 8082 Aroclor 1248 9.91 9.91 UD 30239-001 30239-bc1 Brown Bullhead 294 706 232.1 4.5 258722 8/11/2010 1200 EPA 8082 Aroclor 1254 9.91 9.91 UD 30239-001 30239-bc1 Brown Bullhead 294 706 232.1 4.5 258722 8/11/2010 1200 EPA 8082 Aroclor 1260 5.2 9.91 JD 30239-004 10-217 Largemouth Bass 320 564 236.8 4 258722 8/11/2010 1200 EPA 8082 Aroclor 1016 10 10 UD 30239-004 10-217 Largemouth Bass 320 564 236.8 4 258722 8/11/2010 1200 EPA 8082 Aroclor 1221 10 10 UD 30239-004 10-217 Largemouth Bass 320 564 236.8 4 258722 8/11/2010 1200 EPA 8082 Aroclor 1232 10 10 UD 30239-004 10-217 Largemouth Bass 320 564 236.8 4 258722 8/11/2010 1200 EPA 8082 Aroclor 1242 10 10 UD 30239-004 10-217 Largemouth Bass 320 564 236.8 4 258722 8/11/2010 1200 EPA 8082 Aroclor 1248 10 10 UD 30239-004 10-217 Largemouth Bass 320 564 236.8 4 258722 8/11/2010 1200 EPA 8082 Aroclor 1254 10 10 UD 30239-004 10-217 Largemouth Bass 320 564 236.8 4 258722 8/11/2010 1200 EPA 8082 Aroclor 1260 10 10 U
1 Qualifiers
U ‐
Method Analyte
Appendix H ‐ 2010 Peconic River Fish Samples
PCBs
J ‐Indicates an estimated value. This flag is used either when estimating a concentration for tentatively identified compounds (TICs) where a 1:1 response is assumed, or when the mass spectral data indicates the presence
of a compound that meets the identification criteria but the result is less than the sample quantitation limit but greater than zero.
Indicates that the analyte was analyzed for but not detected.
Area Sample ID Species SDG
1 of 1

Fish ID or Length Wet Wet Age Sample Conc. Error MDL Lab Rev(mm) Weight Weight (yrs) Date (pCi/g) (pCi/g) (pCi/g) Qual1 Qual
Whole Fillet(grams) (grams)
A 30148-001 10-152 Brown Bullhead 318 426 123.3 5 7/15/2010 DOE HASL 300 Cesium-137 0.249 0.0702 0.045A 30148-002 30148-bc2 Brown Bullhead 206 296 90.8 2 7/15/2010 DOE HASL 300 Cesium-137 0.241 0.0576 0.0411A 30148-004 10-157 Chain Pickerel 334 224 100.3 1 7/15/2010 DOE HASL 300 Cesium-137 0.172 0.0581 0.049A 30148-005 30148-bc5 Chain Pickerel 278 426 172.3 1 7/15/2010 DOE HASL 300 Cesium-137 0.119 0.0685 0.0407A 30148-008 10-166 Bluegill 187 154 54.1 5 7/15/2010 DOE HASL 300 Cesium-137 0.132 0.0513 0.0375A 30148-010 30148-bc10 Pumpkinseed 152 663 192.4 2.2 7/15/2010 DOE HASL 300 Cesium-137 0.235 0.0892 0.0782A 30148-011 30148-bc11 Pumpkinseed 132 350 112.7 2 7/15/2010 DOE HASL 300 Cesium-137 0.237 0.0508 0.0376A 30148-012 30148-bc12 Pumpkinseed 121 262 83.9 1.8 7/15/2010 DOE HASL 300 Cesium-137 0.223 0.0651 0.0555C 28834-001 10-125 Brown Bullhead 341 616 192 5 7/13/2010 DOE HASL 300 Cesium-137 0.219 0.0691 0.0379C 28834-002 10-126 Brown Bullhead 302 394 101 4 7/13/2010 DOE HASL 300 Cesium-137 0.324 0.0822 0.06C 28834-003 10-127 Brown Bullhead 296 386 110.1 4 7/13/2010 DOE HASL 300 Cesium-137 0.178 0.0676 0.0441D 30239-001 30239-bc1 Brown Bullhead 294 706 232.1 4.5 8/11/2010 DOE HASL 300 Cesium-137 0.13 0.049 0.0427D 30239-002 30239-bc2 Brown Bullhead 273 530 159.3 3.5 8/11/2010 DOE HASL 300 Cesium-137 0.129 0.0427 0.0414D 30239-004 10-217 Largemouth Bass 320 564 236.8 4 8/11/2010 DOE HASL 300 Cesium-137 0.131 0.0806 0.0544D 30239-006 30239-bc6 Bluegill 138 208 95.8 1.5 8/11/2010 DOE HASL 300 Cesium-137 0.0877 0.0448 0.0467D 30239-007 30239-bc7 Pumpkinseed 136 384 137.1 2.5 8/11/2010 DOE HASL 300 Cesium-137 0.0862 0.0356 0.0378D 30203-001 10-195 Brown Bullhead 295 332 86.1 4 8/3/2010 DOE HASL 300 Cesium-137 0.201 0.0479 0.0362D 30203-002 10-196 Brown Bullhead 255 246 71 4 8/3/2010 DOE HASL 300 Cesium-137 0.178 0.0554 0.0538D 30203-003 10-197 Brown Bullhead 252 200 59.8 4 8/3/2010 DOE HASL 300 Cesium-137 0.0745 0.0619 0.11 DL U-DLD 30203-004 10-198 Brown Bullhead 248 212 64.3 4 8/3/2010 DOE HASL 300 Cesium-137 0.146 0.048 0.0565D 30203-005 10-199 Brown Bullhead 245 212 72.4 4 8/3/2010 DOE HASL 300 Cesium-137 0.215 0.0693 0.0417D 30203-006 10-200 Brown Bullhead 245 204 63.4 2 8/3/2010 DOE HASL 300 Cesium-137 0.124 0.0419 0.0511D 30203-007 10-201 Brown Bullhead 240 192 60.7 2 8/3/2010 DOE HASL 300 Cesium-137 0.076 0.0543 0.052D 30203-017 10-211 Largemouth Bass 284 332 123.9 4 8/3/2010 DOE HASL 300 Cesium-137 0.164 0.0485 0.0473SR 30244-001 30244-bc1 Brown Bullhead 251 444 113.4 4 8/13/2010 DOE HASL 300 Cesium-137 0.111 0.0438 0.0393MR 30236-001 10-229 Brown Bullhead 290 368 107.2 4 8/13/2010 DOE HASL 300 Cesium-137 0.135 0.0567 0.0499MR 30236-002 10-230 Brown Bullhead 281 318 78.2 5 8/13/2010 DOE HASL 300 Cesium-137 0.081 0.0523 0.045MR 30236-003 10-231 Brown Bullhead 268 262 77.3 4 8/13/2010 DOE HASL 300 Cesium-137 0.103 0.0518 0.0405MR 30236-004 30236-bc4 Brown Bullhead 256 506 143.5 4 8/13/2010 DOE HASL 300 Cesium-137 0.11 0.0464 0.0529MR 30236-005 10-234 Brown Bullhead 245 222 73.3 4 8/13/2010 DOE HASL 300 Cesium-137 0.117 0.0586 0.0381MR 30236-006 30236-bc6 Brown Bullhead 243 368 103.2 4 8/13/2010 DOE HASL 300 Cesium-137 0.0757 0.0656 0.0417MR 30236-007 30236-bc7 Brown Bullhead 237 354 112 4 8/13/2010 DOE HASL 300 Cesium-137 0.0324 0.0422 0.0824 DL U-DLMR 30236-008 30236-bc8 Brown Bullhead 223 300 87.4 4 8/13/2010 DOE HASL 300 Cesium-137 0.12 0.045 0.0407MR 30236-009 30236-bc9 Brown Bullhead 185 234 70.8 2 8/13/2010 DOE HASL 300 Cesium-137 0.0709 0.0503 0.0518DP 28623-001 28623-bc1 Pumpkinseed 175 242 86.6 4 5/25/2010 DOE HASL 300 Cesium-137 0.0461 0.0377 0.0359DP 28623-001 28623-bc1 Pumpkinseed 175 242 86.6 4 5/25/2010 DOE HASL 300 Potassium-40 2.86 0.835 0.4DP 28623-002 28623-bc2 Pumpkinseed 180 282 97.9 6 5/25/2010 DOE HASL 300 Cesium-137 0.0311 0.029 0.0529 DL U-DLDP 28623-002 28623-bc2 Pumpkinseed 180 282 97.9 6 5/25/2010 DOE HASL 300 Potassium-40 2.27 0.707 0.3DP 28623-005 28623-bc5 Pumpkinseed 175 290 97 5 5/25/2010 DOE HASL 300 Cesium-137 0.0758 0.046 0.0361DP 28623-005 28623-bc5 Pumpkinseed 175 290 97 5 5/25/2010 DOE HASL 300 Potassium-40 2.68 0.718 0.381DP 28623-006 28623-bc6 Pumpkinseed 190 326 93.4 5.5 5/25/2010 DOE HASL 300 Cesium-137 0.0618 0.0495 0.0922 DL U-DLDP 28623-006 28623-bc6 Pumpkinseed 190 326 93.4 5.5 5/25/2010 DOE HASL 300 Potassium-40 3.4 1.14 0.796DP 28623-008 10-032 Pumpkinseed 195 192 62.3 6 5/25/2010 DOE HASL 300 Cesium-137 0.0398 0.0294 0.0333DP 28623-008 10-032 Pumpkinseed 195 192 62.3 6 5/25/2010 DOE HASL 300 Potassium-40 3.08 0.663 0.348DP 28623-009 10-033 Pumpkinseed 200 212 63 4 5/25/2010 DOE HASL 300 Cesium-137 0.0864 0.0409 0.0733 UIDP 28623-009 10-033 Pumpkinseed 200 212 63 4 5/25/2010 DOE HASL 300 Potassium-40 3.46 1.07 0.699DP 28623-010 10-034 Bluegill 181 160 60.1 4 5/25/2010 DOE HASL 300 Cesium-137 0.103 0.0403 0.029DP 28623-010 10-034 Bluegill 181 160 60.1 4 5/25/2010 DOE HASL 300 Potassium-40 2.74 0.69 0.32DP 28623-014 10-038 Bluegill 195 192 63.6 4 5/25/2010 DOE HASL 300 Cesium-137 0.0516 0.0402 0.0682 DL U-DLDP 28623-014 10-038 Bluegill 195 192 63.6 4 5/25/2010 DOE HASL 300 Potassium-40 3.23 0.875 0.55
Area Sample ID Species Method AnalyteComposite
ID
Appendix I ‐ 2010 Peconic River Fish Samples
Radionuclides
1 of 2

Fish ID or Length Wet Wet Age Sample Conc. Error MDL Lab Rev(mm) Weight Weight (yrs) Date (pCi/g) (pCi/g) (pCi/g) Qual1 Qual
Whole Fillet(grams) (grams)
Area Sample ID Species Method AnalyteComposite
ID
Appendix I ‐ 2010 Peconic River Fish Samples
Radionuclides
DP 28623-015 10-039 Bluegill 210 192 62.8 4 5/25/2010 DOE HASL 300 Cesium-137 0.0456 0.0266 0.0508 DL U-DLDP 28623-015 10-039 Bluegill 210 192 62.8 4 5/25/2010 DOE HASL 300 Potassium-40 2.65 0.658 0.54DP 28623-016 10-040 Bluegill 198 196 60.7 5 5/25/2010 DOE HASL 300 Cesium-137 0.0501 0.0407 0.0682 DL U-DLDP 28623-016 10-040 Bluegill 198 196 60.7 5 5/25/2010 DOE HASL 300 Potassium-40 3.43 1.04 0.546DP 28623-017 10-041 Bluegill 189 196 61.9 5 5/25/2010 DOE HASL 300 Cesium-137 0.0177 0.0249 0.0442 DL U-DLDP 28623-017 10-041 Bluegill 189 196 61.9 5 5/25/2010 DOE HASL 300 Potassium-40 2.99 0.76 0.403DP 28623-018 10-042 Bluegill 100 202 70.6 5 5/25/2010 DOE HASL 300 Cesium-137 0.121 0.0503 0.0484DP 28623-018 10-042 Bluegill 100 202 70.6 5 5/25/2010 DOE HASL 300 Potassium-40 2.62 0.819 0.45DP 28623-019 10-043 Bluegill 203 220 78 5 5/25/2010 DOE HASL 300 Cesium-137 0.0757 0.051 0.0365DP 28623-019 10-043 Bluegill 203 220 78 5 5/25/2010 DOE HASL 300 Potassium-40 2.78 0.723 0.511DP 28623-020 10-044 Bluegill 232 232 80 5 5/25/2010 DOE HASL 300 Cesium-137 0.0645 0.0423 0.0356DP 28623-020 10-044 Bluegill 232 232 80 5 5/25/2010 DOE HASL 300 Potassium-40 2.1 0.72 0.406DP 28624-001 10-045 Largemouth Bass 242 208 70.1 4 5/25/2010 DOE HASL 300 Cesium-137 0.0402 0.0299 0.056 DL U-DLDP 28624-001 10-045 Largemouth Bass 242 208 70.1 4 5/25/2010 DOE HASL 300 Potassium-40 3.83 0.841 0.495DP 28624-002 10-046 Largemouth Bass 262 274 88.7 6 5/25/2010 DOE HASL 300 Cesium-137 0.132 0.0497 0.0368DP 28624-002 10-046 Largemouth Bass 262 274 88.7 6 5/25/2010 DOE HASL 300 Potassium-40 3.33 0.732 0.385DP 28624-003 10-047 Largemouth Bass 455 1304 340.2 8 5/25/2010 DOE HASL 300 Cesium-137 0.106 0.0417 0.0336DP 28624-003 10-047 Largemouth Bass 455 1304 340.2 8 5/25/2010 DOE HASL 300 Potassium-40 2.89 0.756 0.527DP 28624-004 10-048 Chain Pickerel 338 212 78.7 3 5/25/2010 DOE HASL 300 Cesium-137 0.1 0.0352 0.0308DP 28624-004 10-048 Chain Pickerel 338 212 78.7 3 5/25/2010 DOE HASL 300 Potassium-40 3.71 0.706 0.29DP 28624-005 10-049 Brown Bullhead 299 424 112.9 12 5/25/2010 DOE HASL 300 Cesium-137 0.0627 0.0406 0.0429DP 28624-005 10-049 Brown Bullhead 299 424 112.9 12 5/25/2010 DOE HASL 300 Potassium-40 3.56 0.852 0.555DP 28624-006 10-050 Brown Bullhead 300 482 134.5 6 5/25/2010 DOE HASL 300 Cesium-137 0.0469 0.0353 0.0364DP 28624-006 10-050 Brown Bullhead 300 482 134.5 6 5/25/2010 DOE HASL 300 Potassium-40 4.29 0.759 0.382DP 28624-007 10-051 Brown Bullhead 300 488 135 4 5/25/2010 DOE HASL 300 Cesium-137 0.0647 0.0361 0.0389DP 28624-007 10-051 Brown Bullhead 300 488 135 4 5/25/2010 DOE HASL 300 Potassium-40 3.96 0.762 0.389DP 28624-008 10-052 Brown Bullhead 300 492 144.2 5 5/25/2010 DOE HASL 300 Cesium-137 0.0606 0.0276 0.0275DP 28624-008 10-052 Brown Bullhead 300 492 144.2 5 5/25/2010 DOE HASL 300 Potassium-40 3.49 0.696 0.349DP 28624-009 10-053 Brown Bullhead 310 518 161.3 5 5/25/2010 DOE HASL 300 Cesium-137 0.0772 0.0335 0.0317DP 28624-009 10-053 Brown Bullhead 310 518 161.3 5 5/25/2010 DOE HASL 300 Potassium-40 4.1 0.712 0.375DP 28624-010 10-054 Brown Bullhead 300 504 107.1 12 5/25/2010 DOE HASL 300 Cesium-137 0.0986 0.0486 0.0338DP 28624-010 10-054 Brown Bullhead 300 504 107.1 12 5/25/2010 DOE HASL 300 Potassium-40 3.79 0.741 0.258DP 28624-011 10-055 Brown Bullhead 317 544 160.6 5 5/25/2010 DOE HASL 300 Cesium-137 0.0561 0.0316 0.033DP 28624-011 10-055 Brown Bullhead 317 544 160.6 5 5/25/2010 DOE HASL 300 Potassium-40 3.91 0.693 0.42DP 28624-012 10-056 Brown Bullhead 305 548 132.7 8 5/25/2010 DOE HASL 300 Cesium-137 0.0832 0.0379 0.0342DP 28624-012 10-056 Brown Bullhead 305 548 132.7 8 5/25/2010 DOE HASL 300 Potassium-40 3.35 0.787 0.351DP 28624-013 10-057 Brown Bullhead 315 592 122.7 11 5/25/2010 DOE HASL 300 Cesium-137 0.0671 0.0476 0.0335DP 28624-013 10-057 Brown Bullhead 315 592 122.7 11 5/25/2010 DOE HASL 300 Potassium-40 4.18 0.713 0.29DP 28624-014 10-058 Brown Bullhead 334 696 195.6 6 5/25/2010 DOE HASL 300 Cesium-137 0.0688 0.0388 0.0378DP 28624-014 10-058 Brown Bullhead 334 696 195.6 6 5/25/2010 DOE HASL 300 Potassium-40 4.89 0.742 0.387
DL ‐
J ‐
J ‐
UI ‐
The associated numerical value is an estimated quantity.
(Uncertain identification for gamma spectroscopy) ‐ Radionuclide peaks that are detected but fail to meet the positive identification criteria.
1 Qualifiers
Detection limit requirements not met. Data quality objectives may not be met.
The associated numerical value is an estimated quantity.
2 of 2
Related Documents