Obtaining Environmental Clearance and CFE for Nakkapalli Industrial Park ANDHRA PRADESH INDUSTRIAL INFRASTRUCTURE CORPORATION LIMITED L&T Infrastructure Engineering Limited C1181301 RP005, Rev.A Final EIA Report March 2022

Welcome message from author
This document is posted to help you gain knowledge. Please leave a comment to let me know what you think about it! Share it to your friends and learn new things together.
Transcript
Obtaining Environmental Clearance and CFE
for Nakkapalli Industrial Park
ANDHRA PRADESH INDUSTRIAL INFRASTRUCTURE CORPORATION LIMITED
L&T Infrastructure Engineering Limited C1181301 RP005, Rev.A
Final EIA Report March 2022

AAPIIC
Andhra Pradeshlndustrial lnfrastructure Corporation Ltd.,
(Govt. of Andhra Pradesh Undertaking)
Undertakinq bv the Proiect Proponent
Andhra Pradesh lndustrial lnfrastructure corporation Limited (APllc) has
carried out an Environmental lmpact Assessment (EIA/EMP) study for the
Proposed lndustrial Park at Nakkapalli, Visakhapatnam District, Andhra
Pradesh State
As per MoEF Office Memorandum No.J-1 101314112006-lA.ll (l) dated october
05,2011, APllc herewith declares the ownership of contents (information and
data) of this EIA/EMP RePo(.
Regd. Office :
PARISRAMA BHAVAN,6th floor,5-9-58/8, Fateh Maidan Road,Basheerbagh, Hyderabad-500 0M.
Corporate Orfice :
APIIC TOWERS, lT Park,Mangalagiri, Guntur Dist.,Andhra Pradesh-522503.
0863-238'1850www.apiic.in
CIN No. U99999TG1973SGC001630

L&T Infrastructure Engineering Ltd.
Client: Andhra Pradesh Industrial Infrastructure Corporation Limited APIIC, Mangalagiri
Project: Obtaining Environmental Clearance and CFE for Nakkapalli Industrial Park
Project No.:
C1181301 Title:
Final EIA/EMP Report Document No.:
RP005 Rev.: A
This document is the property of L&T Infrastructure Engineering Ltd. and must not be passed on to any person or body not authorised by us to receive it nor be copied or otherwise made use of either in full or in part by such person or body without our prior permission in writing.
File path: l:\ports\2018\c1181301 - ec & cfe for nakkapalli ip\working\reports\05 final eia\07.03.2022\rp-005-final eia report.docx
Notes:
Revision Details:
A 13.03.2022 Second Submission SNV BRT TKSS
0 03.08.2021 First Submission -Sd- -Sd- -Sd-
Rev. Date Details Init. Sign. Init. Sign. Init. Sign.
Prepared Checked Approved

l:\ports\2018\c1181301 - ec & cfe for nakkapalli ip\working\reports\05 final eia\14.03.2022\certificate of plagiarsim check.docx Page 1
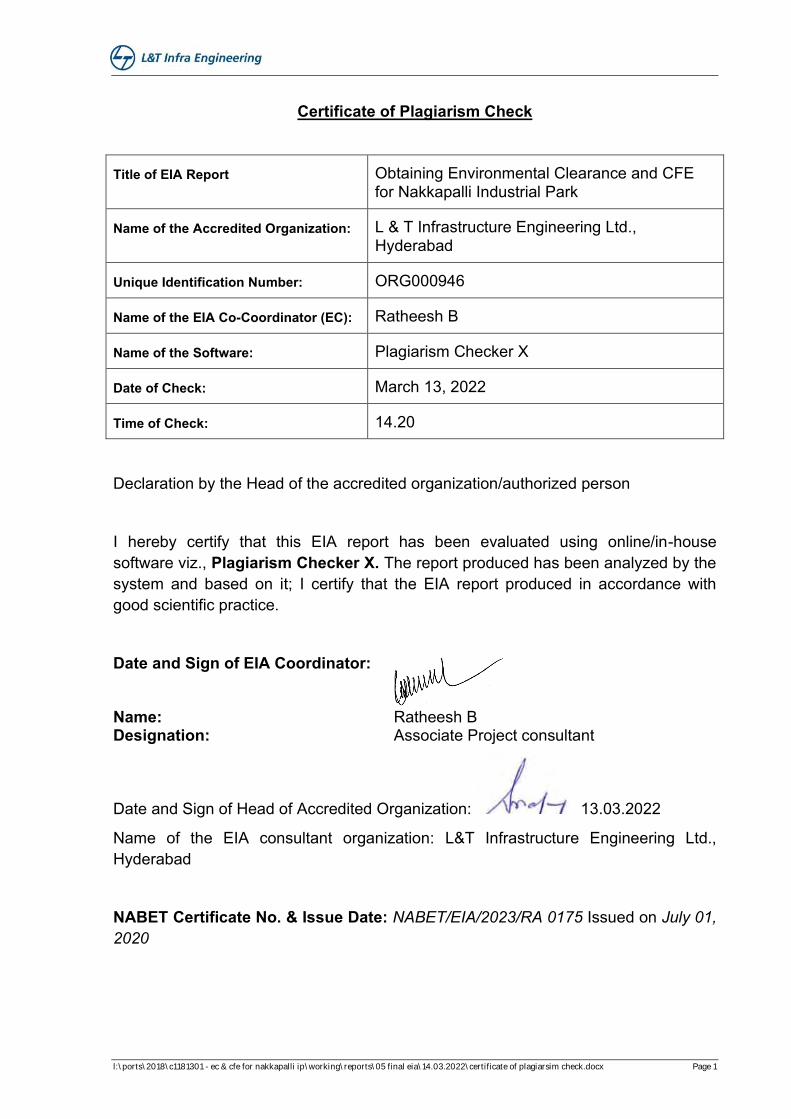
Certificate of Plagiarism Check
Title of EIA Report Obtaining Environmental Clearance and CFE for Nakkapalli Industrial Park
Name of the Accredited Organization: L & T Infrastructure Engineering Ltd., Hyderabad
Unique Identification Number: ORG000946
Name of the EIA Co-Coordinator (EC): Ratheesh B
Name of the Software: Plagiarism Checker X
Date of Check: March 13, 2022
Time of Check: 14.20
Declaration by the Head of the accredited organization/authorized person
I hereby certify that this EIA report has been evaluated using online/in-house software viz., Plagiarism Checker X. The report produced has been analyzed by the system and based on it; I certify that the EIA report produced in accordance with good scientific practice.
Date and Sign of EIA Coordinator:
Name: Ratheesh B Designation: Associate Project consultant
Date and Sign of Head of Accredited Organization: 13.03.2022
Name of the EIA consultant organization: L&T Infrastructure Engineering Ltd., Hyderabad
NABET Certificate No. & Issue Date: NABET/EIA/2023/RA 0175 Issued on July 01, 2020
15%
Obtaining Environmental Clearance and CFE for Nakkapalli Industrial Park C1181301 Final EIA/EMP Report RP005 rev. A
Declaration of Experts Page i
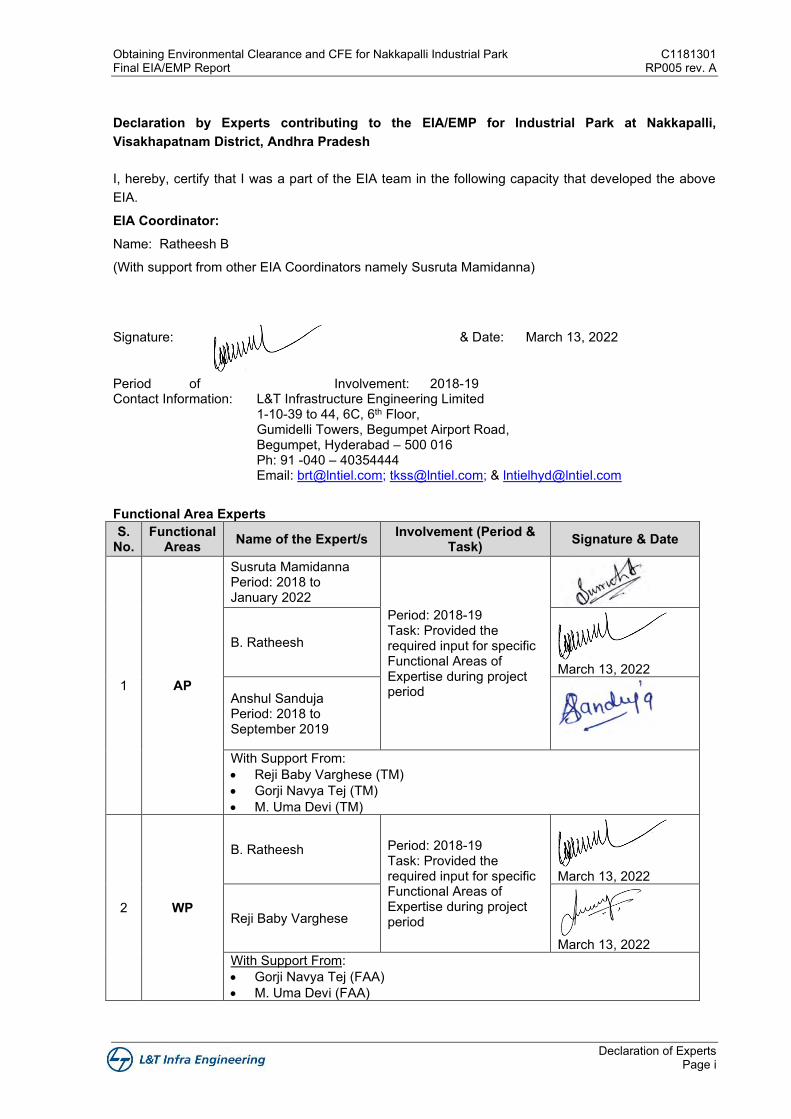
Declaration by Experts contributing to the EIA/EMP for Industrial Park at Nakkapalli, Visakhapatnam District, Andhra Pradesh I, hereby, certify that I was a part of the EIA team in the following capacity that developed the above EIA.
EIA Coordinator: Name: Ratheesh B
(With support from other EIA Coordinators namely Susruta Mamidanna)
Signature: & Date: March 13, 2022
Period of Involvement: 2018-19 Contact Information: L&T Infrastructure Engineering Limited
1-10-39 to 44, 6C, 6th Floor, Gumidelli Towers, Begumpet Airport Road, Begumpet, Hyderabad – 500 016 Ph: 91 -040 – 40354444 Email: [email protected]; [email protected]; & [email protected]
Functional Area Experts S.
No. Functional
Areas Name of the Expert/s Involvement (Period & Task) Signature & Date
1 AP
Susruta Mamidanna Period: 2018 to January 2022
Period: 2018-19 Task: Provided the required input for specific Functional Areas of Expertise during project period
B. Ratheesh
March 13, 2022
Anshul Sanduja Period: 2018 to September 2019
With Support From: • Reji Baby Varghese (TM) • Gorji Navya Tej (TM) • M. Uma Devi (TM)
2 WP
B. Ratheesh Period: 2018-19 Task: Provided the required input for specific Functional Areas of Expertise during project period
March 13, 2022
Reji Baby Varghese
March 13, 2022 With Support From: • Gorji Navya Tej (FAA) • M. Uma Devi (FAA)
Obtaining Environmental Clearance and CFE for Nakkapalli Industrial Park C1181301 Final EIA/EMP Report RP005 rev. A
Declaration of Experts Page ii
S. No.
Functional Areas Name of the Expert/s Involvement (Period &
Task) Signature & Date
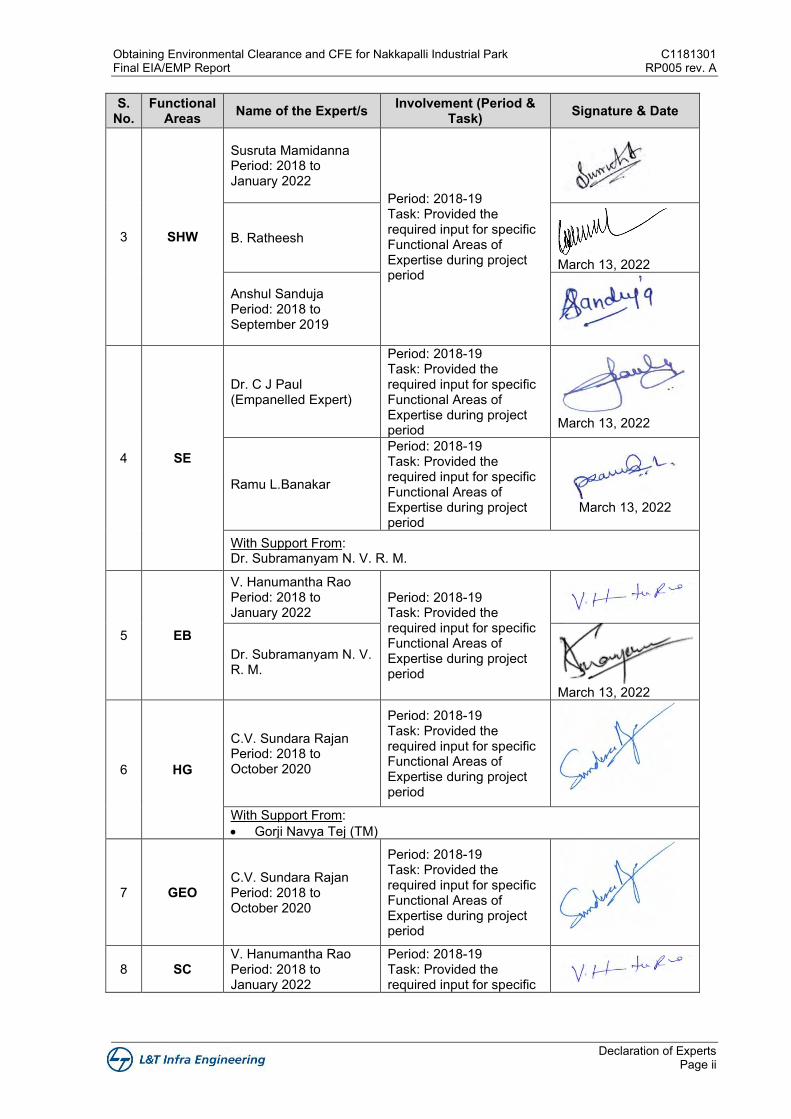
3 SHW
Susruta Mamidanna Period: 2018 to January 2022
Period: 2018-19 Task: Provided the required input for specific Functional Areas of Expertise during project period
B. Ratheesh
March 13, 2022
Anshul Sanduja Period: 2018 to September 2019
4 SE
Dr. C J Paul (Empanelled Expert)
Period: 2018-19 Task: Provided the required input for specific Functional Areas of Expertise during project period
March 13, 2022
Ramu L.Banakar
Period: 2018-19 Task: Provided the required input for specific Functional Areas of Expertise during project period
March 13, 2022
With Support From: Dr. Subramanyam N. V. R. M.
5 EB
V. Hanumantha Rao Period: 2018 to January 2022
Period: 2018-19 Task: Provided the required input for specific Functional Areas of Expertise during project period
Dr. Subramanyam N. V. R. M.
March 13, 2022
6 HG
C.V. Sundara Rajan Period: 2018 to October 2020
Period: 2018-19 Task: Provided the required input for specific Functional Areas of Expertise during project period
With Support From: • Gorji Navya Tej (TM)
7 GEO C.V. Sundara Rajan Period: 2018 to October 2020
Period: 2018-19 Task: Provided the required input for specific Functional Areas of Expertise during project period
8 SC V. Hanumantha Rao Period: 2018 to January 2022
Period: 2018-19 Task: Provided the required input for specific
Obtaining Environmental Clearance and CFE for Nakkapalli Industrial Park C1181301 Final EIA/EMP Report RP005 rev. A
Declaration of Experts Page iii
S. No.
Functional Areas Name of the Expert/s Involvement (Period &
Task) Signature & Date
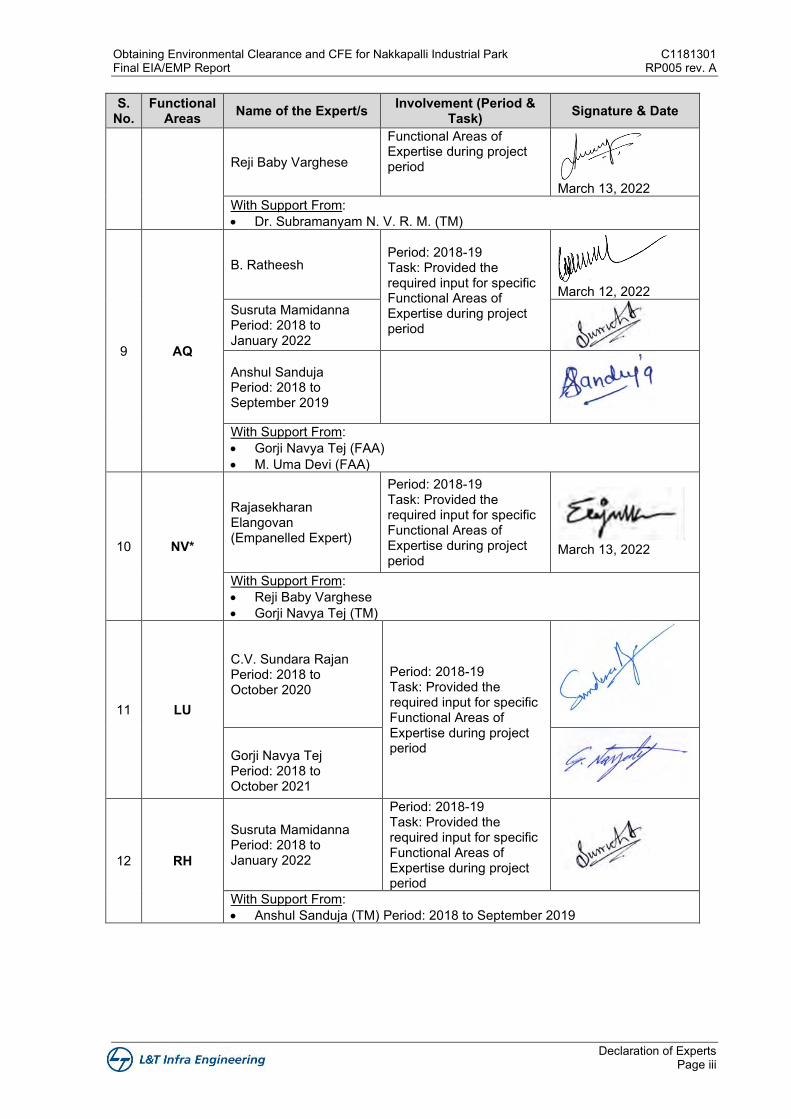
Reji Baby Varghese
Functional Areas of Expertise during project period
March 13, 2022
With Support From: • Dr. Subramanyam N. V. R. M. (TM)
9 AQ
B. Ratheesh Period: 2018-19 Task: Provided the required input for specific Functional Areas of Expertise during project period
March 12, 2022
Susruta Mamidanna Period: 2018 to January 2022
Anshul Sanduja Period: 2018 to September 2019
With Support From: • Gorji Navya Tej (FAA) • M. Uma Devi (FAA)
10 NV*
Rajasekharan Elangovan (Empanelled Expert)
Period: 2018-19 Task: Provided the required input for specific Functional Areas of Expertise during project period
March 13, 2022
With Support From: • Reji Baby Varghese • Gorji Navya Tej (TM)
11 LU
C.V. Sundara Rajan Period: 2018 to October 2020
Period: 2018-19 Task: Provided the required input for specific Functional Areas of Expertise during project period
Gorji Navya Tej Period: 2018 to October 2021
12 RH
Susruta Mamidanna Period: 2018 to January 2022
Period: 2018-19 Task: Provided the required input for specific Functional Areas of Expertise during project period
With Support From: • Anshul Sanduja (TM) Period: 2018 to September 2019
Obtaining Environmental Clearance and CFE for Nakkapalli Industrial Park C1181301 Final EIA/EMP Report RP005 rev. A
Declaration of Experts Page iv
Declaration by the Head of the Accredited Consultant Organization
I, T. K. S. Sridhar Rajagopalachari, hereby, confirm that the above-mentioned experts prepared the EIA/EMP for Industrial Park at Nakkapalli, Visakhapatnam District, Andhra Pradesh. I also confirm that the Consultant Organization shall be fully accountable for any misleading information mentioned in this statement.
Signature:
Name: T. K. S. Sridhar Rajagopalachari
Designation: City Office Manager & Head – Area, Urban Planning and Environment Section Name of the EIA Consultant Organization: L&T Infrastructure Engineering Limited NABET Certificate Number & Issue Date: NABET/EIA//2023/RA 0175 Dated July 1, 2020.

Table of Contents

Obtaining Environmental Clearance and CFE for Nakkapalli Industrial Park C1181301 Final EIA/EMP Report RP005 rev. A
Table of Contents Page i
TABLE OF CONTENTS Chapter 1 Introduction ............................................................................................................... 1-1
1.1 Preamble ............................................................................................................................... 1-1 1.2 Nakkapalli IP ......................................................................................................................... 1-1 1.3 Applicable Legal and Policy Framework ............................................................................... 1-2 1.4 Project Developer ................................................................................................................. 1-3 1.5 Project Site ............................................................................................................................ 1-3
1.5.1 Salient Features of Project Site .................................................................................. 1-5 1.6 Need for the Project .............................................................................................................. 1-6 1.7 Brief Description of Nature of Project ................................................................................... 1-8 1.8 Economic Impact of the Project ............................................................................................ 1-8 1.9 Location Advantage/Justification .......................................................................................... 1-9 1.10 Environment Impact Assessment ......................................................................................... 1-9 1.11 Approach and Methodology ................................................................................................ 1-10
1.11.1 Project Influence Area (PIA)/Study Area .................................................................. 1-10 1.11.2 Study Period ............................................................................................................. 1-10 1.11.3 Methodology ............................................................................................................. 1-10
1.12 Structure of EIA Report ....................................................................................................... 1-12
Chapter 2 Project Description ................................................................................................... 2-1
2.1 General ................................................................................................................................. 2-1 2.2 Land for the Project ............................................................................................................... 2-1 2.3 Surveys and Investigations ................................................................................................... 2-1
2.3.1 Topography ................................................................................................................. 2-1 2.3.2 Bathymetry .................................................................................................................. 2-1
2.4 Details of Master Plan – Planning Brief ................................................................................ 2-1 2.4.1 Planning Considerations ............................................................................................. 2-2 2.4.2 Master Plan of Nakkapalli I.P ..................................................................................... 2-2 2.4.3 Industrial Sectors and Sub-sectors ............................................................................. 2-3 2.4.4 Industrial Zoning ......................................................................................................... 2-8 2.4.5 Entry/Exit .................................................................................................................. 2-12 2.4.6 Circulation and Road Hierarchy ................................................................................ 2-13 2.4.7 Green Area/Green Belt ............................................................................................. 2-13 2.4.8 Logistics Zone ........................................................................................................... 2-14 2.4.9 Flatted Factory Building and Office and Welfare Services Buildings ....................... 2-14 2.4.10 Common Amenities/Industry Related Facilities ........................................................ 2-14
2.5 Infrastructure Services and Facilities .................................................................................. 2-14 2.5.1 Water Supply System ............................................................................................... 2-15 2.5.2 Wastewater Management ......................................................................................... 2-18 2.5.3 Marine Outfall System .............................................................................................. 2-34 2.5.4 Storm Water Management........................................................................................ 2-34 2.5.5 Solid Waste Management......................................................................................... 2-35 2.5.6 Power Supply ............................................................................................................ 2-37 2.5.7 Street Lighting ........................................................................................................... 2-37
2.6 CRZ Compatibility ............................................................................................................... 2-37 2.7 Project Cost and Implementation Schedule ........................................................................ 2-40
Chapter 3 Description of Environment .................................................................................... 3-1
3.1 Preamble ............................................................................................................................... 3-1 3.2 Study Area ............................................................................................................................ 3-1 3.3 Study Period.......................................................................................................................... 3-2 3.4 Environmentally/Ecologically Sensitive areas ....................................................................... 3-2 3.5 Physical Conditions ............................................................................................................... 3-3
3.5.1 Climatic Conditions ..................................................................................................... 3-3 3.5.2 Winds .......................................................................................................................... 3-3 3.5.3 Rainfall ........................................................................................................................ 3-3 3.5.4 Land Use and Land Cover .......................................................................................... 3-4 3.5.5 Forest Resources ....................................................................................................... 3-6 3.5.6 Agricultural Resources ................................................................................................ 3-7
C1181301 Obtaining Environmental Clearance and CFE for Nakkapalli Industrial Park RP005 rev. A Final EIA/EMP Report
Table of Contents Page ii
3.5.7 Animal Husbandry ....................................................................................................... 3-7 3.5.8 Fishing ......................................................................................................................... 3-8 3.5.9 Geology and Mineral Resources................................................................................. 3-8 3.5.10 Geomorphology........................................................................................................... 3-8 3.5.11 Irrigation Resources .................................................................................................... 3-9 3.5.12 Hydrogeology ............................................................................................................ 3-11 3.5.13 Soils .......................................................................................................................... 3-12 3.5.14 Drainage and Irrigation ............................................................................................. 3-14 3.5.15 Natural Hazards ........................................................................................................ 3-15 3.5.16 Marine Environment .................................................................................................. 3-18 3.5.17 Coastal Hydrology/Geomorphology .......................................................................... 3-18 3.5.1 Wind .......................................................................................................................... 3-19 3.5.2 Bed Sediment Quality ............................................................................................... 3-19 3.5.3 Sea/Harbour Water Quality ....................................................................................... 3-26 3.5.4 Biological Environment ............................................................................................. 3-35
3.6 Air Environment ................................................................................................................... 3-38 3.6.1 Meteorological Data from Nearest Meteorological Station ....................................... 3-38 3.6.2 Meteorological Scenario during Study Period and for the Year 2018....................... 3-39 3.6.3 Ambient Air Quality ................................................................................................... 3-41
3.7 Ambient Noise Levels.......................................................................................................... 3-44 3.7.1 Results and Discussions ........................................................................................... 3-44
3.8 Inland Surface and Ground Water Quality .......................................................................... 3-46 3.8.1 Groundwater Quality ................................................................................................. 3-46 3.8.2 Surface Water Quality ............................................................................................... 3-47
3.9 Soil Quality .......................................................................................................................... 3-48 3.9.1 Results and Discussions ........................................................................................... 3-49
3.10 Biological Environment (Flora and Fauna) .......................................................................... 3-50 3.10.1 General Description of the Study Area ..................................................................... 3-50 3.10.2 Methodology for Ecological Survey .......................................................................... 3-50 3.10.3 Status of Flora ........................................................................................................... 3-51 3.10.4 Status of Fauna ......................................................................................................... 3-55 3.10.5 Note on the distribution of olive ridley (sea turtle) ..................................................... 3-56
3.11 Endangered/Threatened species ........................................................................................ 3-56 3.12 Socio-Economic Profile (Geography and Demography) of the Project Influence Area ...... 3-57
3.12.1 Demographic profile of Vishakhapatnam District ...................................................... 3-57 3.12.2 Census Summary of Vishakhapatnam District ......................................................... 3-58 3.12.3 Economy Profile of Vishakhapatnam District ............................................................ 3-58 3.12.4 Demographic Profile of the Study Area .................................................................... 3-58 3.12.5 Mandals in the study area ......................................................................................... 3-59 3.12.6 Villages Falling in the Study Area ............................................................................. 3-59 3.12.7 Secondary Census Data of the Project Study Area .................................................. 3-60 3.12.8 Primary Census Survey of the Project Study Area ................................................... 3-71 3.12.9 Public Health Institution ............................................................................................ 3-79 3.12.10 Educational Institution ......................................................................................... 3-80
Chapter 4 Anticipated Environmental Impacts and Mitigation Measures .......................... 4-81
4.1 General ................................................................................................................................ 4-81 4.2 Land Environment ............................................................................................................... 4-81
4.2.1 Potential Impact due to Location............................................................................... 4-81 4.2.2 Potential Impact due to Construction ........................................................................ 4-82 4.2.3 Potential Impact due to Operation ............................................................................ 4-83
4.3 Water Environment .............................................................................................................. 4-84 4.3.1 Potential impact due to Location ............................................................................... 4-84 4.3.2 Potential Impact during Construction ........................................................................ 4-85 4.3.3 Potential Impact during Operation ............................................................................ 4-87
4.4 Marine Environment (Costal Hydrology/Bottom Contamination, Sea/Harbour Water Quality) 4-88
4.4.1 Potential Impact due to Location............................................................................... 4-88 4.4.2 Potential Impact during Construction ........................................................................ 4-88 4.4.3 Potential Impact during Operation ............................................................................ 4-90
Obtaining Environmental Clearance and CFE for Nakkapalli Industrial Park C1181301 Final EIA/EMP Report RP005 rev. A
Table of Contents Page iii
4.5 Air Environment ................................................................................................................ 4-109 4.5.2 Potential Impact due to Operation .......................................................................... 4-111
4.6 Noise Environment ............................................................................................................ 4-127 4.6.1 Potential Impact during Construction ...................................................................... 4-127 4.6.2 Potential Impact during Operation .......................................................................... 4-129
4.7 Solid Waste Management ................................................................................................. 4-130 4.7.1 Potential Impact due to Construction ...................................................................... 4-130 4.7.2 Potential Impact during Operation .......................................................................... 4-131
4.8 Biological Environment ..................................................................................................... 4-135 4.8.1 Potential Impact due to Location ............................................................................ 4-135 4.8.2 Potential Impact due to Construction ...................................................................... 4-135 4.8.3 Potential Impact due to Operation .......................................................................... 4-138
Chapter 5 Analysis of Alternatives ........................................................................................... 5-1
5.1 Criteria for Site Selection ...................................................................................................... 5-1
Chapter 6 Environmental Monitoring Programme .................................................................. 6-1
6.1 Environmental Monitoring Programme ................................................................................. 6-2 6.2 Wastewater Treatment and Disposal - Monitoring Mechanism ............................................ 6-5 6.3 Environmental Monitoring by Member Industries ................................................................. 6-6 6.4 Compliance Reports ............................................................................................................. 6-7 6.5 Plantation Monitoring Programme ........................................................................................ 6-7 6.6 On-site Mock Drills Requirements ........................................................................................ 6-7
Chapter 7 Additional Studies .................................................................................................... 7-1
7.1 Public Consultation ............................................................................................................... 7-1 7.1.1 Public Hearing Arrangements ..................................................................................... 7-1 7.1.2 Draft EIA/EMP Report Distribution and Paper Advertisement ................................... 7-1 7.1.3 Date of Public Hearing ................................................................................................ 7-1 7.1.4 Representations .......................................................................................................... 7-2 7.1.5 Public Hearing ............................................................................................................ 7-2
7.2 Risk Analysis ....................................................................................................................... 7-52 7.2.1 Hazard Identification ................................................................................................. 7-53 7.2.2 Damage Criteria ........................................................................................................ 7-58 7.2.3 Typical Failure Frequencies ..................................................................................... 7-60 7.2.4 Risk Mitigation Measures.......................................................................................... 7-60
7.3 Disaster Management Plan ................................................................................................. 7-62 7.3.1 Causes of Disaster ................................................................................................... 7-62 7.3.2 Categorisation of Emergency ................................................................................... 7-63 7.3.3 Onsite Emergency Plan ............................................................................................ 7-64 7.3.4 Management Plan for Natural Hazards .................................................................... 7-70 7.3.5 Fire Protection Facilities ........................................................................................... 7-73 7.3.6 Offsite Emergency Plan ............................................................................................ 7-75 7.3.7 Conclusion ................................................................................................................ 7-76
7.4 Traffic and Transportation Management ............................................................................. 7-76 7.4.1 External Road Network Analysis .............................................................................. 7-76 7.4.2 Traffic Surveys Analysis ........................................................................................... 7-78 7.4.3 Estimation of Traffic Growth Rates ........................................................................... 7-81 7.4.4 Additional Traffic to Immediate External Road ......................................................... 7-81 7.4.5 Traffic Forecast ......................................................................................................... 7-82 7.4.6 Findings of the External Traffic Analysis .................................................................. 7-82 7.4.7 Internal Traffic Analysis ............................................................................................ 7-84 7.4.8 External Road Capacity Assessment ....................................................................... 7-89
7.5 Social Impact Assessment .................................................................................................. 7-90 7.5.1 Impact due to Land Acquisition ................................................................................ 7-90 7.5.2 Loss of livelihood ...................................................................................................... 7-91 7.5.3 Impact due to change in land use ............................................................................. 7-91 7.5.4 Impact on Nearby Settlements ................................................................................. 7-92 7.5.5 Construction Workers Camp..................................................................................... 7-92 7.5.6 Employment Potential ............................................................................................... 7-92
C1181301 Obtaining Environmental Clearance and CFE for Nakkapalli Industrial Park RP005 rev. A Final EIA/EMP Report
Table of Contents Page iv
7.5.7 Impact on Fisheries/Fishing Activity.......................................................................... 7-92 7.5.8 Public Health and Safety ........................................................................................... 7-93
7.6 Consultation, Participation and Disclosure.......................................................................... 7-94 7.6.1 Stakeholder Identification and Methodology ............................................................. 7-94 7.6.2 Outcome of Consultations ......................................................................................... 7-96
Chapter 8 Project Benefits ......................................................................................................... 8-1
8.1 Infrastructure Facilities .......................................................................................................... 8-1 8.1.1 Physical and Social Infrastructure............................................................................... 8-1
8.2 Induced Development ........................................................................................................... 8-1 8.2.1 National Overview ....................................................................................................... 8-1 8.2.2 Regional & Local Overview ......................................................................................... 8-2
8.3 Economic Impact of the Industrial Park................................................................................. 8-3 8.4 Generation of Employment ................................................................................................... 8-3 8.5 Enhanced Local Infrastructure .............................................................................................. 8-3 8.6 Enhanced Social Infrastructure ............................................................................................. 8-3 8.7 Training Facility ..................................................................................................................... 8-3 8.8 Women Empowerment .......................................................................................................... 8-4 8.9 Enhanced Socio-Economic Conditions ................................................................................. 8-4 8.10 Corporate Environment Responsibility (CER) ....................................................................... 8-4
8.10.1 Need based Assessment ............................................................................................ 8-5 8.10.2 CER activities vs Budget allocation ............................................................................ 8-6
8.11 Corporate Social Responsibility ............................................................................................ 8-6 8.12 CSR Regulations ................................................................................................................... 8-7
Chapter 9 Environment Management Plan .............................................................................. 9-1
9.1 Components of EMP ............................................................................................................. 9-1 9.1.1 Summary of Impacts and Mitigation Measures ........................................................... 9-1 9.1.2 Administrative and Technical Setup for Environmental Management ...................... 9-12 9.1.3 Institutional Mechanism for Implementation of Mitigation Measures ........................ 9-12
9.2 Environmental Management Cell (EMC)............................................................................. 9-13 9.2.1 Roles and Responsibilities for Environmental Management .................................... 9-14
9.3 Greenbelt Development Plan .............................................................................................. 9-16 9.3.1 Objectives of Greenbelt Development Plan .............................................................. 9-16 9.3.2 Greenbelt Development - Master Plan ..................................................................... 9-17
9.4 Rainwater Harvesting .......................................................................................................... 9-19 9.4.1 Estimation of Rainwater Harvesting Potential ........................................................... 9-20 9.4.2 Harvesting Plan ......................................................................................................... 9-20 9.4.3 Monitoring wells for Impact Assessment .................................................................. 9-22
9.5 Solar Power Harnessing ..................................................................................................... 9-23 9.6 APIIC Measures towards India’s Commitment for Climate Change ................................... 9-23 9.7 Occupational Health and Safety .......................................................................................... 9-24
9.7.1 Occupational Hazards ............................................................................................... 9-24 9.7.2 Personal Protective Equipment ................................................................................. 9-26 9.7.3 Occupational Health and Safety Improvement Measures ........................................ 9-26 9.7.4 Health Monitoring ...................................................................................................... 9-27 9.7.5 Safety ........................................................................................................................ 9-27
9.8 Budgetary Estimates ........................................................................................................... 9-27 9.8.1 Budgetary Estimate for Environmental Management ............................................... 9-27
Chapter 10 Summary and Conclusion ...................................................................................... 10-1
10.1 Introduction .......................................................................................................................... 10-1 10.1.1 Project Location ........................................................................................................ 10-1 10.1.2 Need and Justification of Project Development ........................................................ 10-1 10.1.3 Sectors Recommended for Proposed Industry Park ................................................ 10-2
10.2 Project Description .............................................................................................................. 10-2 10.2.1 Proposed Project....................................................................................................... 10-2 10.2.2 Site Master Plan ........................................................................................................ 10-3 10.2.3 Economic Impact of the Industrial Park .................................................................... 10-3
10.3 Project Cost ......................................................................................................................... 10-3
Obtaining Environmental Clearance and CFE for Nakkapalli Industrial Park C1181301 Final EIA/EMP Report RP005 rev. A
Table of Contents Page v
10.4 Description of Environment ................................................................................................. 10-4 10.4.1 Environment .............................................................................................................. 10-4
10.5 Marine Environment ............................................................................................................ 10-5 10.5.1 Socio-economic Conditions ...................................................................................... 10-6 10.5.2 Archaeological Places .............................................................................................. 10-6
10.6 Anticipated Environmental Impacts with Mitigation Measures ............................................ 10-6 10.7 Environmental Monitoring Programme ............................................................................... 10-7 10.8 Additional studies ................................................................................................................ 10-7
10.8.1 Public Consultation ................................................................................................... 10-7 10.8.2 Risk Analysis ............................................................................................................ 10-7 10.8.3 Disaster Management Plan ...................................................................................... 10-7 10.8.4 Traffic and Transportation Management Plan .......................................................... 10-8 10.8.5 Social Impact Assessment........................................................................................ 10-8
10.9 Project Benefits ................................................................................................................... 10-8 10.10 Corporate Environment Responsibility (CER) .......................................................... 10-9 10.11 Environment Management Plan ............................................................................. 10-10 10.12 Budgetary Estimate for Environmental Management ............................................. 10-10 10.13 Conclusion .............................................................................................................. 10-10
Chapter 11 Disclosure of Consultants Engaged ..................................................................... 11-1
11.1 Brief Profile of L&T Infrastructure Engineering Limited ...................................................... 11-1 11.2 Other Consultants Engaged ................................................................................................ 11-3
11.2.1 Kiwi Labs .................................................................................................................. 11-3 11.2.2 CCMR ....................................................................................................................... 11-3 11.2.3 HTL/LTL, CRZ Demarcation Surveys ....................................................................... 11-3
LIST OF FIGURES
Figure 1-1: List of Industries for Evaluation as per Existing Scenario .................................................. 1-6 Figure 1-2: List of new Industries for Evaluation based on Govt. Focus and Growth .......................... 1-7 Figure 2-1: 50m Green Buffer around Settlement .............................................................................. 2-10 Figure 2-2: Industries proposed within 50m - 250m from Settlement ................................................ 2-10 Figure 2-3: Industries proposed within 250m - 500m from Settlement .............................................. 2-11 Figure 2-4: Industries proposed outside of 500m from Settlement .................................................... 2-11 Figure 2-5: Industries proposed between CRZ Area.......................................................................... 2-12 Figure 2-6: Nakkapalli IP Entry/Exit.................................................................................................... 2-12 Figure 2-7: Broad Road Hierarchy of Nakkapalli IP ........................................................................... 2-13 Figure 2-8: Water Balance ................................................................................................................. 2-15 Figure 2-9: Schematic Flow Diagram for Water Supply ..................................................................... 2-17 Figure 2-10: Proposed Scheme of Treatment for Alkaline & Cyanide Bearing Wastewater.............. 2-23 Figure 2-11: Proposed Scheme of Treatment for Acidic & Chrome Bearing Wastewater ................. 2-24 Figure 2-12: Proposed Scheme of Treatment High TDiS Wastewater .............................................. 2-26 Figure 2-13: Proposed Scheme of Treatment Low TDiS Wastewater ............................................... 2-28 Figure 2-14: Proposed Scheme of Treatment Low TDiS Wastewater of CETP 2 ............................. 2-31 Figure 2-15: STP Process Flow Diagram (SBR Technology) ............................................................ 2-34 Figure 2-16: Steps in the operation cycle of SBR .............................................................................. 2-34 Figure 2-17: Schematic diagram for power distribution ..................................................................... 2-37 Figure 2-18: CRZ Area and Facilities falling in CRZ .......................................................................... 2-39 Figure 3-1: LU/LC pattern for the 10 km study area............................................................................. 3-4 Figure 3-2: Land Use/Land Cover Statistics of Study Area ................................................................. 3-5 Figure 3-3: LULC Map for Project Site ................................................................................................. 3-6 Figure 3-4: Forest Cover Map of the 10km Study Area ....................................................................... 3-7 Figure 3-5: Geomorphology Map of Visakhapatnam district ................................................................ 3-9 Figure 3-6: Geomorphology Map of Study Area ................................................................................ 3-10 Figure 3-7: Lineament Map of Study Area ......................................................................................... 3-10 Figure 3-8: Hydrology Map of Study Area .......................................................................................... 3-12 Figure 3-9: Groundwater Potential Map of Study Area ...................................................................... 3-12 Figure 3-10: Soil map of Visakhapatnam District ............................................................................... 3-13 Figure 3-11: Soil Map of the Study Area ............................................................................................ 3-13 Figure 3-12: Drainage pattern in Study area ...................................................................................... 3-14
C1181301 Obtaining Environmental Clearance and CFE for Nakkapalli Industrial Park RP005 rev. A Final EIA/EMP Report
Table of Contents Page vi
Figure 3-13: Visakhapatnam District Drought Index Map ................................................................... 3-16 Figure 3-14: Earthquake Hazard Map of Andhra Pradesh ................................................................. 3-16 Figure 3-15: Flood hazard Map of Andhra Pradesh ........................................................................... 3-17 Figure 3-16 Heatwave Temperatures in Visakhapatnam District (2010-18) ...................................... 3-17 Figure 3-17: Wind Hazard Map of Andhra Pradesh ........................................................................... 3-18 Figure 3-18: Variations in Percentage of Sand .................................................................................. 3-20 Figure 3-19: Variations in Percentage of Silt ...................................................................................... 3-20 Figure 3-20: Variations in Percentage of Clay .................................................................................... 3-21 Figure 3-21: Variations in pH concentration ....................................................................................... 3-21 Figure 3-22: Variations in Oil and Grease Concentration ................................................................... 3-21 Figure 3-23: Variation of Cadmium Concentration ............................................................................. 3-23 Figure 3-24: Variation of Copper Concentration ................................................................................. 3-23 Figure 3-25: Variation of Iron Concentration ...................................................................................... 3-23 Figure 3-26: Variation of Lead Concentration .................................................................................... 3-24 Figure 3-27: Variation of Zinc Concentration ...................................................................................... 3-24 Figure 3-28: Variation of Nickel Concentration ................................................................................... 3-24 Figure 3-29: Variations in Population Density of Macrobenthos ........................................................ 3-26 Figure 3-30: Variations in Population Density of Meiofauna .............................................................. 3-26 Figure 3-31: Variations in Temperature .............................................................................................. 3-28 Figure 3-32: Variations in Salinity ....................................................................................................... 3-28 Figure 3-33: Variations in pH .............................................................................................................. 3-28 Figure 3-34: Variations in Total Suspended Solids ............................................................................ 3-29 Figure 3-35: Variations in Turbidity ..................................................................................................... 3-29 Figure 3-36: Variations in Dissolved Oxygen ..................................................................................... 3-29 Figure 3-37: Variations in Biological Oxygen Demand ....................................................................... 3-30 Figure 3-38: Variations in Chemical Oxygen Demand ....................................................................... 3-30 Figure 3-39: Variation of Nitrite Concentration ................................................................................... 3-31 Figure 3-40: Variation of Nitrate Concentration .................................................................................. 3-31 Figure 3-41: Variation of Ammoniacal Nitrogen Concentration .......................................................... 3-32 Figure 3-42: Variation of Total Phosphorous Concentration .............................................................. 3-32 Figure 3-43: Variation of Silicate Concentration ................................................................................. 3-32 Figure 3-44: Variation of Cadmium Concentration ............................................................................. 3-33 Figure 3-45: Variation of Copper Concentration ................................................................................. 3-34 Figure 3-46: Variation of Iron Concentration ...................................................................................... 3-34 Figure 3-47: Variation of Zinc Concentration ...................................................................................... 3-34 Figure 3-48: Variation in Primary Productivity .................................................................................... 3-35 Figure 3-49: Variation in Chlorophyll ‘a’ .............................................................................................. 3-36 Figure 3-50: Variation in Chlorophyll-b ............................................................................................... 3-36 Figure 3-51: Variation in Phytoplankton Density ................................................................................ 3-37 Figure 3-52: Variation in Zooplankton Density ................................................................................... 3-37 Figure 3-53: Wind Rose Diagram for Summer Season ...................................................................... 3-40 Figure 3-54: Annual Wind Rose (January – December 2018) ........................................................... 3-40 Figure 3-55: Ambient PM10 Levels ...................................................................................................... 3-42 Figure 3-56: Ambient PM2.5 Levels ..................................................................................................... 3-42 Figure 3-57: Ambient SO2 Levels ....................................................................................................... 3-43 Figure 3-58: Ambient NO2 Levels ....................................................................................................... 3-43 Figure 3-59: Ambient Day time Noise levels ...................................................................................... 3-45 Figure 3-60: Ambient Night equivalent Noise levels ........................................................................... 3-45 Figure 3-61 Zone Wise Number of Plant Species Recorded in the Study Area................................. 3-54 Figure 3-62 Zone Wise Plant Species Diversity in the Study Area .................................................... 3-54 Figure 3-63: Turtle Nesting areas ....................................................................................................... 3-56 Figure 3-64: Total Population graph of study area ............................................................................. 3-61 Figure 3-65: Population of <6 Years Children .................................................................................... 3-61 Figure 3-66: Population of Schedule Caste ........................................................................................ 3-62 Figure 3-67: Population of Schedule Tribe ......................................................................................... 3-63 Figure 3-68: Population of Literate in the Study Area ........................................................................ 3-64 Figure 3-69: Population of Illiterate in the Study Area ........................................................................ 3-64 Figure 3-70: Working & Non-Working Population Profile ................................................................... 3-65 Figure 3-71: Working & Non-Working (Male and Female) Population Profile .................................... 3-66 Figure 3-72: Main & Marginal Working Population Profile .................................................................. 3-67
Obtaining Environmental Clearance and CFE for Nakkapalli Industrial Park C1181301 Final EIA/EMP Report RP005 rev. A
Table of Contents Page vii
Figure 3-73: Main Working (Male & Female) Population Profile ........................................................ 3-68 Figure 3-74: Marginal Working (Male & Female) Population Profile .................................................. 3-68 Figure 3-75: Primary Census and Site Visit Photos ........................................................................... 3-79 Figure 4-1: Drainage pattern in the Project site ................................................................................. 4-86 Figure 4-2: Mesh near project vicinity (in UTM Zone-44, WGS84) .................................................... 4-93 Figure 4-3: Comparison of Observed and Simulated Water Level .................................................... 4-93 Figure 4-4: Typical flow for North-easterly wind during flooding ........................................................ 4-94 Figure 4-5: Typical flow for North-easterly wind during ebbing .......................................................... 4-94 Figure 4-6: Typical flow for South-westerly wind during flooding ....................................................... 4-95 Figure 4-7: Typical flow for South-westerly wind during ebbing ......................................................... 4-95 Figure 4-8: Excess temporal maximum of Oil and grease for North easterly season ........................ 4-97 Figure 4-9: Excess temporal maximum of Total suspended solids for North easterly season .......... 4-97 Figure 4-10: Excess temporal maximum of Copper for North easterly season ................................. 4-98 Figure 4-11: Excess temporal maximum of Iron for North easterly season ....................................... 4-98 Figure 4-12: Excess temporal maximum of COD for North easterly season ..................................... 4-99 Figure 4-13: Excess temporal maximum of BOD for North easterly season ..................................... 4-99 Figure 4-14: Excess temporal maximum of Total Kjeldajl Nitrogen for North easterly season ........ 4-100 Figure 4-15: Excess temporal maximum of Nitrate -Nitrogen for North easterly season ................. 4-100 Figure 4-16: Excess temporal maximum of Oil and grease for South westerly season .................. 4-101 Figure 4-17: Excess temporal maximum of Total suspended solids for South westerly season ..... 4-101 Figure 4-18: Excess temporal maximum of Copper for South westerly season .............................. 4-102 Figure 4-19: Excess temporal maximum of Iron for South westerly season .................................... 4-102 Figure 4-20: Excess temporal maximum of COD for South westerly season .................................. 4-103 Figure 4-21: Excess temporal maximum of BOD for South westerly season .................................. 4-103 Figure 4-22: Excess temporal maximum of Total Kjeldajl Nitrogen for South westerly season....... 4-104 Figure 4-23: Excess temporal maximum of Nitrate -Nitrogen for South westerly season ............... 4-104 Figure 4-24: Time Series for Excess Oil & grease at 100m from outfall location for North easterly season .............................................................................................................................................. 4-105 Figure 4-25: Time Series for Excess Total Suspended solids at 100m from outfall location for North easterly season ................................................................................................................................ 4-105 Figure 4-26: Time Series for Excess Copper at 100m from outfall location for North easterly season . 4-105 Figure 4-27: Time Series for Excess Iron at 100m from outfall location for North easterly season . 4-105 Figure 4-28: Time Series for Excess COD at 100m from outfall location for North easterly season4-106 Figure 4-29: Time Series for Excess BOD at 100m from outfall location for North easterly season 4-106 Figure 4-30: Time Series for Excess Total Kjeldajl Nitrogen at 100m from outfall location for North easterly season ................................................................................................................................ 4-106 Figure 4-31: Time Series for Excess Nitrate –Nitrogen at 100m from outfall location for North easterly season .............................................................................................................................................. 4-106 Figure 4-32: Time Series for Excess Oil & grease at 100m from outfall location for South westerly season .............................................................................................................................................. 4-107 Figure 4-33: Time Series for Excess Total Suspended solids at 100m from outfall location for South westerly season ................................................................................................................................ 4-107 Figure 4-34: Time Series for Excess Copper at 100m from outfall location for South westerly season 4-107 Figure 4-35: Time Series for Excess Iron at 100m from outfall location for South westerly season 4-107 Figure 4-36: Time Series for Excess COD at 100m from outfall location for South westerly season .... 4-108 Figure 4-37: Time Series for Excess BOD at 100m from outfall location for South westerly season .... 4-108 Figure 4-38: Time Series for Excess Total Kjeldajl Nitrogen at 100m from outfall location for South westerly season ................................................................................................................................ 4-108 Figure 4-39: Time Series for Excess Nitrate –Nitrogen at 100m from outfall location for South westerly season .............................................................................................................................................. 4-108 Figure 4-40: Zoning Plan for Nakkapalli IP ...................................................................................... 4-112 Figure 4-41: Annual Wind Rose Diagram (January – December, 2018) ......................................... 4-122 Figure 4-42: Isopleth for 1st 24-Hr Average Incremental Concentration of PM10 ............................. 4-125 Figure 4-43: Isopleth for 1st 24-Hr Average Incremental Concentration of PM2.5............................. 4-125 Figure 4-44: Isopleth for 1st 24-Hr Average Incremental Concentration of SO2 ............................... 4-126 Figure 4-45: Isopleth for 1st 24-Hr Average Incremental Concentration of NO2 .............................. 4-126
C1181301 Obtaining Environmental Clearance and CFE for Nakkapalli Industrial Park RP005 rev. A Final EIA/EMP Report
Table of Contents Page viii
Figure 4-46: Flow Sheet for Municipal Solid Waste Management ................................................... 4-132 Figure 4-47: Flow Sheet for Industrial Hazardous and Non-hazardous Waste Management .......... 4-135 Figure 6-1: Wastewater Monitoring Mechanism ................................................................................... 6-5 Figure 7-1: Steps involved in Fire and Explosion Index Calculation .................................................. 7-57 Figure 7-2: Sequence of probable events .......................................................................................... 7-58 Figure 7-3: Emergency Evacuation Plan and Assembly & Emergency Exit Points ........................... 7-69 Figure 7-4: Regional road network map of proposed project site ...................................................... 7-77 Figure 7-5: Traffic Survey Locations ................................................................................................... 7-78 Figure 7-6: Turning Movement at Vempadu Junction ........................................................................ 7-80 Figure 7-7: Vehicle Composition at Vempadu Junction ..................................................................... 7-80 Figure 7-8: Sections considered for checking Lane Adequacy of Internal Road Network ................. 7-88 Figure 7-9: Stakeholder Methodology ................................................................................................ 7-94 Figure 8-1: Triple Bottom Line Approach.............................................................................................. 8-7 Figure 9-1: Institutional Mechanism for Implementing Mitigation Measures ...................................... 9-13 Figure 9-2: Organizational Setup for Environmental Management Cell ............................................. 9-14 Figure 9-3: A Typical Rainwater Harvesting System .......................................................................... 9-21 Figure FD0101: Location Map Figure FD0102: Study Area Map Figure FD0201: Master Plan Figure FD0202: Zoning Plan Figure FD0203: Greenbelt Area and Water Bodies Figure FD0301: Marine Baseline Environment Monitoring/Sampling Locations Map Figure FD0302: Air, Noise, SW, GW and Soil Monitoring/Sampling Locations Map Figure FD0303: Flora and Fauna Monitoring/Sampling Locations Map Figure FD0401: Stormwater/ Drainage Pattern Map
LIST OF TABLES Table 1-1: Project Categorisation as per EIA Notification, 2006 (As amended) .................................. 1-2 Table 1-2: Applicable Environmental Regulations ................................................................................ 1-2 Table 1-3: Salient Features of Project Site ........................................................................................... 1-5 Table 1-4: Focus Sectors for Investment Envisaged in the proposed Industrial Park.......................... 1-8 Table 2-1: Proposed Land Use Break-up for Project Area ................................................................... 2-3 Table 2-2: Type of Industries along with Categorisation ...................................................................... 2-3 Table 2-3: Zoning of Industries (as vide approved ToR) ...................................................................... 2-9 Table 2-4: Water Demand .................................................................................................................. 2-15 Table 2-5: Wastewater Quantity ......................................................................................................... 2-18 Table 2-6: CETP Inlet characteristics for Low TDiS Wastewaters ..................................................... 2-21 Table 2-7: Expected Characteristics of High TDiS Wastewater reaching CETP from API and Chemical Units (223 KLD) .................................................................................................................................. 2-21 Table 2-8: Expected Characteristics of Combined Low TDiS Wastewater from Pharma & Chemical Industries (300 KLD) ........................................................................................................................... 2-22 Table 2-9: Design characteristics of LTDiS wastewater from Non Chemical & Pharma Industries ... 2-22 Table2-10: Expected Characteristics of Alkaline and Cyanide Bearing Wastewater ......................... 2-23 Table2-11: Expected Characteristics of Acidic and Chrome Bearing Wastewater ............................ 2-23 Table2-12: Expected Characteristics of Treated Alkaline and Cyanide Bearing Wastewater ........... 2-24 Table2-13: Expected Characteristics of Treated Acidic and Chrome Bearing Wastewater ............... 2-25 Table 2-14: Characteristics of Condensate Water from MEE, ATFD and Utilities ............................. 2-27 Table 2-15: Characteristics of Primary Treated Low TDiS Wastewater ............................................. 2-29 Table2-16: Characteristics of Combined Wastewater – Low TDiS + Condensate from High TDiS + Centrifuge Centrate and PSF Back wash water - Feed to Secondary Treatment.............................. 2-29 Table2-17: Expected Characteristics of Secondary Treated Wastewater .......................................... 2-30 Table2-18: Characteristics of Tertiary treated wastewater ................................................................. 2-30 Table 2-19 : Characteristics of Final Treated Wastewater for Reuse ................................................ 2-30 Table 2-20: Expected Characteristics of Secondary Treated Wastewater ......................................... 2-32 Table 2-21: Characteristics of tertiary treated wastewater ................................................................. 2-32 Table 2-22: Quality parameters of domestic sewage ......................................................................... 2-33 Table 2-23: Industrial Solid Waste Generation ................................................................................... 2-35 Table 2-24: Municipal Solid Waste Generation .................................................................................. 2-35 Table 2-25: CRZ Compatibility of the proposed facilities as per CRZ Notification, 2011 and 2019 ... 2-39
Obtaining Environmental Clearance and CFE for Nakkapalli Industrial Park C1181301 Final EIA/EMP Report RP005 rev. A
Table of Contents Page ix
Table 2-26: Summary of Project Cost ................................................................................................ 2-40 Table 3-1: Environmentally Sensitive Areas within 15 km from Project Boundary .............................. 3-2 Table 3-2: Land Use/Land Cover Statistics of Study Area ................................................................... 3-4 Table 3-3: Land Use Land Cover Pattern of Project Site ..................................................................... 3-5 Table 3-4: Status of Groundwater Resources of mandals falling in the study area (As on March 2009) ............................................................................................................................................................ 3-11 Table 3-5: Groundwater Levels in Mandal’s falling in study area of Visakhapatnam District ............ 3-11 Table 3-6: Drainage system with description of main rivers .............................................................. 3-15 Table 3-7: Hazard Risk Mapping of mandals falling in the study area ............................................... 3-15 Table 3-8: Tide Levels ........................................................................................................................ 3-18 Table 3-9: Marine Sampling Locations ............................................................................................... 3-19 Table 3-10: Variations in marine sediment physico-chemical parameters......................................... 3-20 Table 3-11: Variations in marine sediment heavy metals .................................................................. 3-22 Table 3-12: Seasonal Variations in sediment microbial populations (CFU/g) .................................... 3-25 Table 3-13: Seasonal Variations in Benthic Density .......................................................................... 3-25 Table 3-14: Marine Water Physico-chemical parameters .................................................................. 3-27 Table 3-15: Seasonal Variations in Marine Water Nutrient parameters............................................. 3-30 Table 3-16: Seasonal Variations in Marine Water Heavy Metals ....................................................... 3-33 Table 3-17: Seasonal Variations in Marine Biological Parameters .................................................... 3-35 Table 3-18: Climatological Data Summary – Vishakhapatnam Region (1981-2010) ........................ 3-38 Table 3-19: Details of Ambient Air Quality Monitoring Locations ....................................................... 3-41 Table 3-20: Day and Night Equivalent Noise Levels .......................................................................... 3-44 Table 3-21: Details of Ground water Quality Monitoring Locations .................................................... 3-46 Table 3-22: Details of Surface water Quality Monitoring Location ..................................................... 3-47 Table 3-23: Details of Soil Quality Monitoring Locations ................................................................... 3-48 Table 3-24: IUCN Listed Floral species ............................................................................................. 3-57 Table 3-25 IUCN Listed Fauna species ............................................................................................. 3-57 Table 3-26: Visakhapatnam District Census Summary (Population and Household Details)............ 3-58 Table 3-27: Mandal Census Summary ............................................................................................... 3-59 Table 3-28: Village and settlements falling in the Study Area as per SoI Topo-sheet ....................... 3-59 Table 3-29: Households and Population of Study Area ..................................................................... 3-60 Table 3-30: Population of <6 Years Children ..................................................................................... 3-61 Table 3-31: Population of Schedule Caste ......................................................................................... 3-62 Table 3-32: Population of Schedule Tribe .......................................................................................... 3-62 Table 3-33: Population of Literate in the Study Area ......................................................................... 3-63 Table 3-34: Population of Illiterate in the Study Area ......................................................................... 3-64 Table 3-35: Working & Non-Working Population Profile .................................................................... 3-65 Table 3-36: Working & Non-Working (Male and Female) Population Profile ..................................... 3-66 Table 3-37 Main & Marginal Working Population Profile.................................................................... 3-66 Table 3-38: Main & Marginal (Male & Female) Working Population Profile ....................................... 3-67 Table 3-39: List of Marine Fishing Villages and Landing Centres ...................................................... 3-69 Table 3-40: Fishermen Household Details ......................................................................................... 3-69 Table 3-41: Fishermen Population Details ......................................................................................... 3-69 Table 3-42: Fishermen Education Profile ........................................................................................... 3-70 Table 3-43: Fishermen Activity Profile................................................................................................ 3-70 Table 3-44: Fishermen Occupation Profile ......................................................................................... 3-71 Table 3-45: Fishermen Craft owned and Fishing Profile .................................................................... 3-71 Table 3-46: Affected persons by Sex ................................................................................................. 3-72 Table 3-47: Households by Religion .................................................................................................. 3-72 Table 3-48: Household by Social Groups .......................................................................................... 3-72 Table 3-49: Household by Family Member Size ................................................................................ 3-72 Table 3-50: Educational Status .......................................................................................................... 3-73 Table 3-51: Occupational Level.......................................................................................................... 3-73 Table 3-52: Income of the Household Yearly ..................................................................................... 3-74 Table 3-53: Indebtedness of Households .......................................................................................... 3-74 Table 3-54: Household Vulnerable ..................................................................................................... 3-74 Table 3-55: Assets Owned ................................................................................................................. 3-75 Table 3-56: Institutional Deliveries ..................................................................................................... 3-75 Table 3-57: Treatment of Illness......................................................................................................... 3-75 Table 3-58: Type of House Construction ........................................................................................... 3-76
C1181301 Obtaining Environmental Clearance and CFE for Nakkapalli Industrial Park RP005 rev. A Final EIA/EMP Report
Table of Contents Page x
Table 3-59: House Possession ........................................................................................................... 3-76 Table 3-60: Separate Kitchen ............................................................................................................. 3-76 Table 3-61: Separate Latrine Facility .................................................................................................. 3-76 Table 3-62: Separate Bath Facility ..................................................................................................... 3-77 Table 3-63: Household Electrified ...................................................................................................... 3-77 Table 3-64: Water Supply ................................................................................................................... 3-77 Table 3-65: Fuel for Cooking .............................................................................................................. 3-77 Table 3-66: Resettlement Preferences ............................................................................................... 3-78 Table 3-67: Financial Decision ........................................................................................................... 3-78 Table 3-68: Water Fetching Activity .................................................................................................... 3-78 Table 3-69: Skill Development for Women ......................................................................................... 3-78 Table 3-70: Income Generation Activity ............................................................................................. 3-79 Table 3-71: List of Medical Facilities .................................................................................................. 3-79 Table 3-72: List of Educational Institutes............................................................................................ 3-80 Table 4-1 Expected Pollutant Characteristics .................................................................................... 4-91 Table 4-2 Temporal maximum for effluent pollutants ......................................................................... 4-96 Table 4-3: Orange category Point Sources Emission Details .......................................................... 4-114 Table 4-4: Red category Point Sources Emission Details ................................................................ 4-117 Table 4-5: Red category Point Sources Emission Details ................................................................ 4-118 Table 4-6: DG Set Emissions from Nakkapalli IP ............................................................................. 4-119 Table 4-7: Emission Details of Vehicles on NH 16 (Towards Visakhapatnam) ................................ 4-120 Table 4-8: Emission Details of Vehicles on NH16 (Towards Tuni)................................................... 4-120 Table 4-9: Emission Details of Vehicles on Proposed Greenfield Road .......................................... 4-120 Table 4-10: Emission Details of Vehicles on Existing road .............................................................. 4-121 Table 4-11: Receptor Details ............................................................................................................ 4-123 Table 4-12: 1st 24-hour Average Incremental and Resultant Concentration of PM10 ....................... 4-123 Table 4-13: 1st 24-hour Average Incremental and Resultant Concentration of PM2.5 ...................... 4-123 Table 4-14: 1st 24-hour Average Incremental and Resultant Concentration of SO2 ........................ 4-123 Table 4-15: 1st 24-hour Average Incremental and Resultant Concentration of NO2 ........................ 4-124 Table 4-16: Annual Average Incremental concentrations of PM10, PM2.5, SO2, and NO2 ................ 4-124 Table 6-1: Environmental Monitoring Programme for Construction and Operation Phase .................. 6-2 Table 6-2: CETPs of I.P ........................................................................................................................ 6-5 Table 7-1: Response for Public Hearing Minutes of Meeting and Representations ............................ 7-4 Table 7-2: Details of Indicative Major Plant/Industrial Hazards .......................................................... 7-56 Table 7-3: Degree of Hazard with respect to F & E Index .................................................................. 7-57 Table 7-4: Degree of Hazard with respect to Toxicity Index ............................................................... 7-58 Table 7-5: Damage due to Incident Radiation .................................................................................... 7-59 Table 7-6: Effect of Over Pressure ..................................................................................................... 7-59 Table 7-7: General failure frequencies ............................................................................................... 7-60 Table 7-8: Fire Extinguishing Agents – Forms and Ranges of Application ........................................ 7-74 Table 7-9: Disaster Management Authority – District Level ............................................................... 7-76 Table 7-10: Details of Traffic Surveys ................................................................................................ 7-77 Table 7-11 Recommended PCU Factors as per IRC: 64-1990 .......................................................... 7-78 Table 7-12: Average Daily Traffic (ADT) and Annual Average Daily Traffic (AADT) on NH-16 ......... 7-79 Table 7-13: Details of Turning Movement Counts .............................................................................. 7-79 Table 7-14: Peak Hour Traffic ............................................................................................................ 7-80 Table 7-15: Traffic Growth Rates for the Existing Traffic ................................................................... 7-81 Table 7-16: Estimated traffic on Greenfield access road connecting the project site and NH-16 ...... 7-82 Table 7-17: Estimated Traffic on existing village road connecting the project site and NH16 ........... 7-82 Table 7-18: Traffic Forecast on NH-16 for Nakkapalli Site ................................................................. 7-83 Table 7-19: Commercial Trip Generation Rate for Various Sectors ................................................... 7-84 Table 7-20: Modal Share of Commercial Vehicles ............................................................................. 7-84 Table 7-21: PCU Factors for Commercial Vehicles ............................................................................ 7-85 Table 7-22: Mode Share of Passenger Vehicles ................................................................................ 7-85 Table 7-23: Estimated Commercial Vehicle Trips per day for the Nakkapalli IP ................................ 7-86 Table 7-24: Estimated Passenger Trips per day for Nakkapalli IP ..................................................... 7-86 Table 7-25: Total Generated Traffic for Nakkapalli IP ........................................................................ 7-87 Table 7-26: Lane Adequacy Check for the Proposed Nakkapalli IP .................................................. 7-87 Table 7-27: Parking Categories .......................................................................................................... 7-88 Table 7-28: Sector wise Truck Parking Demand ................................................................................ 7-89
Obtaining Environmental Clearance and CFE for Nakkapalli Industrial Park C1181301 Final EIA/EMP Report RP005 rev. A
Table of Contents Page xi
Table 7-29: Required Lane Configuration as per LOS B Criteria ....................................................... 7-90 Table 7-30: Required Lane Configuration as per LOS C Criteria ...................................................... 7-90 Table 7-31: Land Details of Visakhapatnam Node (in acres) ............................................................ 7-90 Table 7-32: Stakeholder Consultations .............................................................................................. 7-94 Table 7-33: Summary of Consultations Outcome .............................................................................. 7-96 Table 8-1: CER Cost Budgetary format as per OM dated May 01, 2018 ............................................ 8-4 Table 8-2: CER Budget as per OM dated May 01, 2018 ..................................................................... 8-4 Table 8-3: Identified CER activities along with Budgetary Provision ................................................... 8-6 Table 8-4: CSR Activities ..................................................................................................................... 8-8 Table 9-1: Project Activities, Associated Impacts and Mitigation Measures ........................................ 9-2 Table 9-2: Roles and Responsibilities of Developer and Member Industry ....................................... 9-14 Table 9-3: Recommended Plants for Greenbelt Development .......................................................... 9-18 Table 9-4: Estimated Volume of run-off can be Harvested ................................................................ 9-20 Table 9-5: Estimated Installation Capacity and Cost for Solar Power Harness ................................. 9-23 Table 9-6: Occupational Health Hazards and Proposed Mitigation Measures .................................. 9-25 Table 9-7: List of Personnel Protective Equipment ............................................................................ 9-26 Table 9-8: Environmental Management - Capital Cost ...................................................................... 9-28 Table 9-9: Environmental Management - Annual Recurring Cost ..................................................... 9-28 Table 10-1: Focus Sectors for Investment Envisaged in the proposed Industrial Park ..................... 10-2 Table 10-2: Salient Features of IP...................................................................................................... 10-2 Table 10-3: Proposed Land use Break up for Project Site ................................................................. 10-3
LIST OF EXHIBITS
Exhibit 1-1: Existing Approach Road near Upamaka Village ................................................................................ 1-4 Exhibit 1-2: Hillock on the North western part of the site ..................................................................................... 1-4 Exhibit 1-3: Tammayyapeta Settlement .......................................................................................................... 1-4 Exhibit 1-4: Patimeeda Settlement ................................................................................................................. 1-4 Exhibit 1-5: Mulapara Settlement ................................................................................................................... 1-4 Exhibit 1-6: Coconut Plantation in Project area ................................................................................................. 1-4 Exhibit 1-7: Backwater Creek in Project area ................................................................................................... 1-4 Exhibit 1-8: Vegetation in Project area ............................................................................................................ 1-4 Exhibit 3-1: Open, back water low-lying area in core area ................................................................................. 3-51 Exhibit 3-2: Scrub vegetation in core area ..................................................................................................... 3-51 Exhibit 3-3: Coconut plantation in the core area .............................................................................................. 3-52 Exhibit 3-4: Cashew plantation in the core area .............................................................................................. 3-52 Exhibit 3-5: Waterbody, Hillock near Upamaka ............................................................................................... 3-53 Exhibit 3-6: Rocky outcrops at Vempadu R.F ................................................................................................. 3-53 Exhibit 3-7: Dense scrub vegetation at Payakaraopeta R.F ............................................................................... 3-53 Exhibit 3-8: Costal vegetation at Pentakota R.F (Shelterbelt plantation) ............................................................... 3-53 Exhibit 3-9: Consultation with Local communities ............................................................................................ 3-56 Exhibit 3-10: Consultations with Division Forest Officer .................................................................................... 3-56 Exhibit 7-1: Public Hearing Meeting Photos ......................................................................................... 7-3 Exhibit 7-2: Stakeholder Consultation ................................................................................................ 7-95 Exhibit 8-1: Consultation at Peddagummuluru .................................................................................................. 8-5 Exhibit 8-2: Consultation at Chinnagummuluru ................................................................................................. 8-5 Exhibit 8-3: Consultation at Adda Road Junction ............................................................................................... 8-5 Exhibit 8-4: Consultation at Peddagummuluru .................................................................................................. 8-5 Exhibit 8-5: Consultation at Nakkapalli ............................................................................................................ 8-6 Exhibit 8-6: Consultation at Nakkapalli ............................................................................................................ 8-6 Exhibit 9-1: A Model Storage Pond/Tank ........................................................................................... 9-22
LIST OF ENCLOSURES
Attachment 1: NABET Certificate of L&T Infrastructure Engineering Limited Attachment 2: NABL Certificate of Kiwis Laboratories Appendix A: Approved Additional ToR and Standard ToR Letter issued by MoEF&CC Appendix B: Compliance to Additional and Standard ToR
C1181301 Obtaining Environmental Clearance and CFE for Nakkapalli Industrial Park RP005 rev. A Final EIA/EMP Report
Table of Contents Page xii
Appendix C: Baseline Monitoring Results Appendix D: Letter from Water Resources Department, GoAP Appendix E: National Ambient Air Quality Standards, November, 2009 Appendix F: National Ambient Noise Standards Appendix G: Noise Limit for Generator Sets Appendix H: IS10500:2012 drinking water standards Appendix I: ISI-IS2296-1982 standards for use based classification of surface water Appendix J: Primary water quality standards for coastal water (SW–IV) Appendix K: Emission limits for new diesel engine more than 800 kW for generator set Appendix L: Draft EIA/EMP Report Distribution, Public Hearing Notification, Proceedings and
Representations Received Appendix M: Industrial Park Survey Numbers. Appendix N: NoC for Marine outfall from APPCB Appendix O: APCZMA Recommendation Letter Annexure A: 1:4000 CRZ Demarcation Map by NCSCM Annexure B: Compliance to CAG recommendations Annexure C: Details of Construction Materials Required and its Source
LIST OF ACRONYMS AAC Autoclaved Aerated Concrete AAQ Ambient Air Quality AAR Annual Average Rainfall ADB Asian Development Bank AP Andhra Pradesh APC Air Pollution Control APHA American Public Health Association APIIC Andhra Pradesh Industrial Infrastructure Corporation Limited APPCB Andhra Pradesh Pollution Control Board APRDC Andhra Pradesh Road Development Corporation BaP Benzo Alpha Pyrene BIS Bureau of Indian Standards BMO British Met Office BMTPC Building Materials and Technology Promotion Council BOD Biological Oxygen Demand CAGR Compound Annual Growth Rate C&D Construction and Demolition CER Corporate Environmental Responsibility CETP Common Effluent Treatment Plant CFE Consent for Establishment CFU Colony Forming Unit CGWB Central Ground Water Board CMSWMF Common Municipal Solid Waste Management Facility CO Carbon Monoxide COD Chemical Oxygen Demand COMAPS Coastal Ocean Monitoring and Prediction System CPCB Central Pollution control Board CSR Corporate Social Responsibility CRZ Coastal Regulation Zone DCB Dug Cum Bore well DG Diesel Generator DIN Dissolved Inorganic Nitrogen DIP Dissolved Inorganic Phosphate DMP Disaster Management Plan DPR Detailed Project Report DRDO Defence Research and Development Organisation E East
Obtaining Environmental Clearance and CFE for Nakkapalli Industrial Park C1181301 Final EIA/EMP Report RP005 rev. A
Table of Contents Page xiii
EC Electrical Conductivity EC Environmental Clearance ECEC East Coast Economic Corridor EIA Environmental Impact Assessment EHS Environment Health & Safety EMC Environmental Management Cell EMP Environmental Management Plan EMS Environmental Management System EP Environmental Protection EPZ Export processing zones ETP Effluent Treatment Plants EU European Union GDP Gross Domestic Product GoAP Government of Andhra Pradesh GoI Government of India GPH General Process Hazard GVMC Greater Visakhapatnam Municipal Corporation HAP Hazardous Air Pollutant HAZOP Hazard and Operability study HDPE High-Density Polyethylene HTL High Tide Line IMD Indian Meteorological Department IP Industrial Park IS Indian Standard IVI Importance Value Index IWPA Indian Wildlife Protection Act KLD Kilo Litres per Day KV Kilo Volts LID Low Impact Development LLDPE Linear Low-Density Polyethylene LNTIEL L&T Infrastructure Engineering Limited LDPE Low-density polyethylene LPG Liquefied Petroleum Gas LTL Low Tide Line LULC Land Use Land Cover MAC Maximum Allowable Concentration MEE Multiple Effect Evaporator MLD Million Litres per Day MoEF&CC Ministry of Environment, Forest & Climate Change MSDS Materials Safety Data Sheet MSIHC Manufacture, Storage and Import Of Hazardous Chemical MSL Mean Sea Level MSME Micro, Small and Medium Enterprises MSW Municipal Solid Waste MSWM Municipal Solid Waste Management MRT Mass Rapid Transport MVA Mega Volt Ampere N North NAAQS National Ambient Air Quality Standards NABET National Accreditation Board for Education & Training NABL National Accreditation Board for Testing and Calibration Laboratories NAPCC National Action Plan on Climate Change NFPA National Fire Protection Association NH National Highway NIOSH National Institute for Occupational Safety and Health NRSC National Remote Sensing Centre NSTL Naval Science & Technology Laboratory NO2 Nitrogen Dioxide
C1181301 Obtaining Environmental Clearance and CFE for Nakkapalli Industrial Park RP005 rev. A Final EIA/EMP Report
Table of Contents Page xiv
NOAA National Oceanographic and Atmospheric Administration OHS Occupational Health & safety PA Protected Areas PIA Project Influence Area PM10 Particulate matter <10-micron size PM2.5 Particulate matter <2.5-micron size PPE Personal Protective Equipment ppm Parts Per Million PPP Public Private Partnership PUC Pollution Under Control PV Photo Voltaic PVC Poly Vinyl Chloride QCI Quality Council of India R&D Research and Development R&R Resettlement and Rehabilitation RF Reserved Forest ROW Right of Way RTO Regenerative Thermal Oxidiser RWH Rainwater Harvesting S South SBM Swachh Bharat Mission SC Scheduled Caste SH State Highway SO2 Sulphur Dioxide SOP Standard Operating Procedure SPCB State Pollution Control Board SPM Suspended Particulate Matter ST Scheduled Tribe STP Sewage Treatment Plant SS Suspended Solids SSC Suspended sediment concentration SWQM Sea Water Quality Monitoring TDS Total Dissolved Solids TDiS Total Dissolved Inorganic Solids TPD Tonnes Per Day ToR Terms of Reference TSDF Treatment, Storage and Disposal Facilities TN Total Nitrogen TP Total Phosphorous VCIC Vizag – Chennai Industrial Corridor VOC Volatile Organic Carbon VRO Village Revenue Officer W West WTP Water Treatment Plant WW Wastewater YLMC Yeleru Left Main Canal

Chapter 1
Introduction

Obtaining Environmental Clearance and CFE for Nakkapalli Industrial Park C1181301 Final EIA/EMP Report RP005 rev. A
Chapter 1 Introduction Page 1-1
Chapter 1 Introduction
1.1 Preamble
Government of Andhra Pradesh (GoAP) with the financial support of Asian Development Bank (ADB) has intended to develop Vizag – Chennai Industrial Corridor (VCIC). VCIC is one of the key segment of the East Coast Economic Corridor (ECEC), India’s first coastal economic corridor proposed between Tuticorin and Kolkata. VCIC is aimed to fulfil the objectives of “Make in India“ Policy and “Act East“ Policy promoted by Government of India by providing connectivity and integration with global production and value chains in emerging East Asian and South East Asian markets along with other global markets. VCIC, with a long coastline of 800 km dotted with existing ports such as Vizag Port, Gangavaram Port, Kakinada Port, Krishnapatnam port and the proposed ports at Bhavanapadu, Machilipatnam poised to play a vital role in expanding the industrial output, creating employment opportunities, increasing labour productivity and skill set and raising the living standards along the East Coast of India.
Visakhapatnam district is within the immediate influence of VCIC has all the potential to become an industrial hub. Government of Andhra Pradesh (GoAP) in an endeavour to attract investments from National and International Players across the globe embarked a major initiative by positioning Visakhapatnam District as the central hub for various sunrise sectors.
Andhra Pradesh Industrial Infrastructure Corporation Limited (APIIC) with a mandate to develop industrial areas across Andhra Pradesh is a wholly owned subsidiary of Government of Andhra Pradesh (GoAP) as part of objective, APIIC has thus identified and acquired large land parcel for the development of industrial park (IP) at Nakkapalli which will be a part of VCIC.
Andhra Pradesh Industrial Infrastructure Corporation Limited (APIIC) is a wholly owned subsidiary of Government of Andhra Pradesh (GoAP) has a mandate to develop industrial areas across Andhra Pradesh. To achieve the above objective, APIIC has thus identified and acquired large land parcel for the development of industrial park (IP) at Nakkapalli which will be a part of VCIC.
1.2 Nakkapalli IP
In the state of Andhra Pradesh, Visakhapatnam district is the centre for industry and education. industrialisation at Nakkapalli Mandal was promoted by APIIC. In this regard, APIIC has identified around 1578 Ha (3899 acres) of Land parcels at Nakkapalli Mandal within Visakhapatnam district for the purpose of industrialisation.
APIIC proposes to provide world-class ecosystem for manufacturing industries and intends to establish infrastructure facilities for the proposed Industrial Park. Based on the market and demand assessment study undertaken manufacturing zone for different manufacturing industries & service industry selected included in the processing area.
The infrastructure development being planned includes internal roads, electrical distribution network, internal street lighting, water supply, water distribution, storm water drains, , wastewater and waste management facilities, other utilities such as technical & support buildings, housing along with related facilities. Apart from industrial area there will be technical infrastructure facilities, conveniences and utilities, , township and logistics facilities/strategies offices.
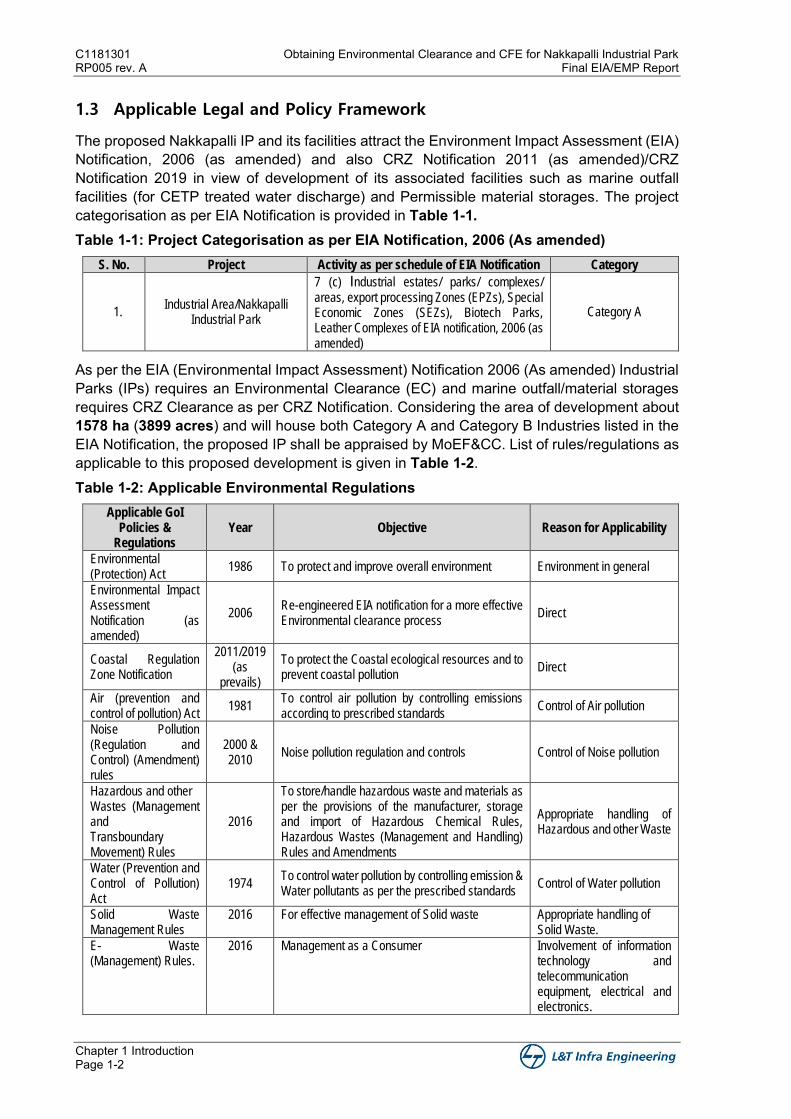
C1181301 Obtaining Environmental Clearance and CFE for Nakkapalli Industrial Park RP005 rev. A Final EIA/EMP Report
Chapter 1 Introduction Page 1-2
1.3 Applicable Legal and Policy Framework
The proposed Nakkapalli IP and its facilities attract the Environment Impact Assessment (EIA) Notification, 2006 (as amended) and also CRZ Notification 2011 (as amended)/CRZ Notification 2019 in view of development of its associated facilities such as marine outfall facilities (for CETP treated water discharge) and Permissible material storages. The project categorisation as per EIA Notification is provided in Table 1-1. Table 1-1: Project Categorisation as per EIA Notification, 2006 (As amended)
S. No. Project Activity as per schedule of EIA Notification Category
1. Industrial Area/Nakkapalli Industrial Park
7 (c) Industrial estates/ parks/ complexes/ areas, export processing Zones (EPZs), Special Economic Zones (SEZs), Biotech Parks, Leather Complexes of EIA notification, 2006 (as amended)
Category A
As per the EIA (Environmental Impact Assessment) Notification 2006 (As amended) Industrial Parks (IPs) requires an Environmental Clearance (EC) and marine outfall/material storages requires CRZ Clearance as per CRZ Notification. Considering the area of development about 1578 ha (3899 acres) and will house both Category A and Category B Industries listed in the EIA Notification, the proposed IP shall be appraised by MoEF&CC. List of rules/regulations as applicable to this proposed development is given in Table 1-2. Table 1-2: Applicable Environmental Regulations
Applicable GoI Policies &
Regulations Year Objective Reason for Applicability
Environmental (Protection) Act
1986 To protect and improve overall environment Environment in general
Environmental Impact Assessment Notification (as amended)
2006 Re-engineered EIA notification for a more effective Environmental clearance process
Direct
Coastal Regulation Zone Notification
2011/2019 (as
prevails)
To protect the Coastal ecological resources and to prevent coastal pollution
Direct
Air (prevention and control of pollution) Act
1981 To control air pollution by controlling emissions according to prescribed standards
Control of Air pollution
Noise Pollution (Regulation and Control) (Amendment) rules
2000 & 2010
Noise pollution regulation and controls Control of Noise pollution
Hazardous and other Wastes (Management and Transboundary Movement) Rules
2016
To store/handle hazardous waste and materials as per the provisions of the manufacturer, storage and import of Hazardous Chemical Rules, Hazardous Wastes (Management and Handling) Rules and Amendments
Appropriate handling of Hazardous and other Waste
Water (Prevention and Control of Pollution) Act
1974 To control water pollution by controlling emission & Water pollutants as per the prescribed standards
Control of Water pollution
Solid Waste Management Rules
2016 For effective management of Solid waste Appropriate handling of Solid Waste.
E- Waste (Management) Rules.
2016 Management as a Consumer Involvement of information technology and telecommunication equipment, electrical and electronics.
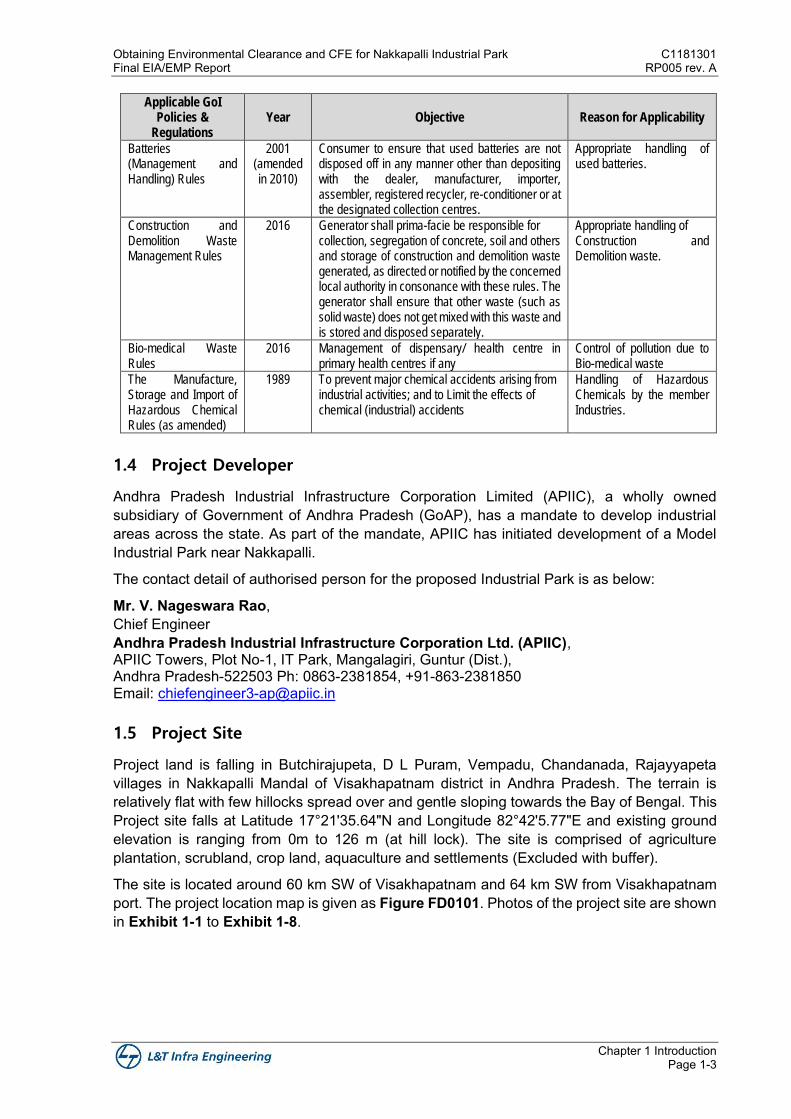
Obtaining Environmental Clearance and CFE for Nakkapalli Industrial Park C1181301 Final EIA/EMP Report RP005 rev. A
Chapter 1 Introduction Page 1-3
Applicable GoI Policies &
Regulations Year Objective Reason for Applicability
Batteries (Management and Handling) Rules
2001 (amended in 2010)
Consumer to ensure that used batteries are not disposed off in any manner other than depositing with the dealer, manufacturer, importer, assembler, registered recycler, re-conditioner or at the designated collection centres.
Appropriate handling of used batteries.
Construction and Demolition Waste Management Rules
2016 Generator shall prima-facie be responsible for collection, segregation of concrete, soil and others and storage of construction and demolition waste generated, as directed or notified by the concerned local authority in consonance with these rules. The generator shall ensure that other waste (such as solid waste) does not get mixed with this waste and is stored and disposed separately.
Appropriate handling of Construction and Demolition waste.
Bio-medical Waste Rules
2016 Management of dispensary/ health centre in primary health centres if any
Control of pollution due to Bio-medical waste
The Manufacture, Storage and Import of Hazardous Chemical Rules (as amended)
1989 To prevent major chemical accidents arising from industrial activities; and to Limit the effects of chemical (industrial) accidents
Handling of Hazardous Chemicals by the member Industries.
1.4 Project Developer
Andhra Pradesh Industrial Infrastructure Corporation Limited (APIIC), a wholly owned subsidiary of Government of Andhra Pradesh (GoAP), has a mandate to develop industrial areas across the state. As part of the mandate, APIIC has initiated development of a Model Industrial Park near Nakkapalli.
The contact detail of authorised person for the proposed Industrial Park is as below:
Mr. V. Nageswara Rao, Chief Engineer Andhra Pradesh Industrial Infrastructure Corporation Ltd. (APIIC), APIIC Towers, Plot No-1, IT Park, Mangalagiri, Guntur (Dist.), Andhra Pradesh-522503 Ph: 0863-2381854, +91-863-2381850 Email: [email protected]
1.5 Project Site
Project land is falling in Butchirajupeta, D L Puram, Vempadu, Chandanada, Rajayyapeta villages in Nakkapalli Mandal of Visakhapatnam district in Andhra Pradesh. The terrain is relatively flat with few hillocks spread over and gentle sloping towards the Bay of Bengal. This Project site falls at Latitude 17°21'35.64"N and Longitude 82°42'5.77"E and existing ground elevation is ranging from 0m to 126 m (at hill lock). The site is comprised of agriculture plantation, scrubland, crop land, aquaculture and settlements (Excluded with buffer).
The site is located around 60 km SW of Visakhapatnam and 64 km SW from Visakhapatnam port. The project location map is given as Figure FD0101. Photos of the project site are shown in Exhibit 1-1 to Exhibit 1-8.
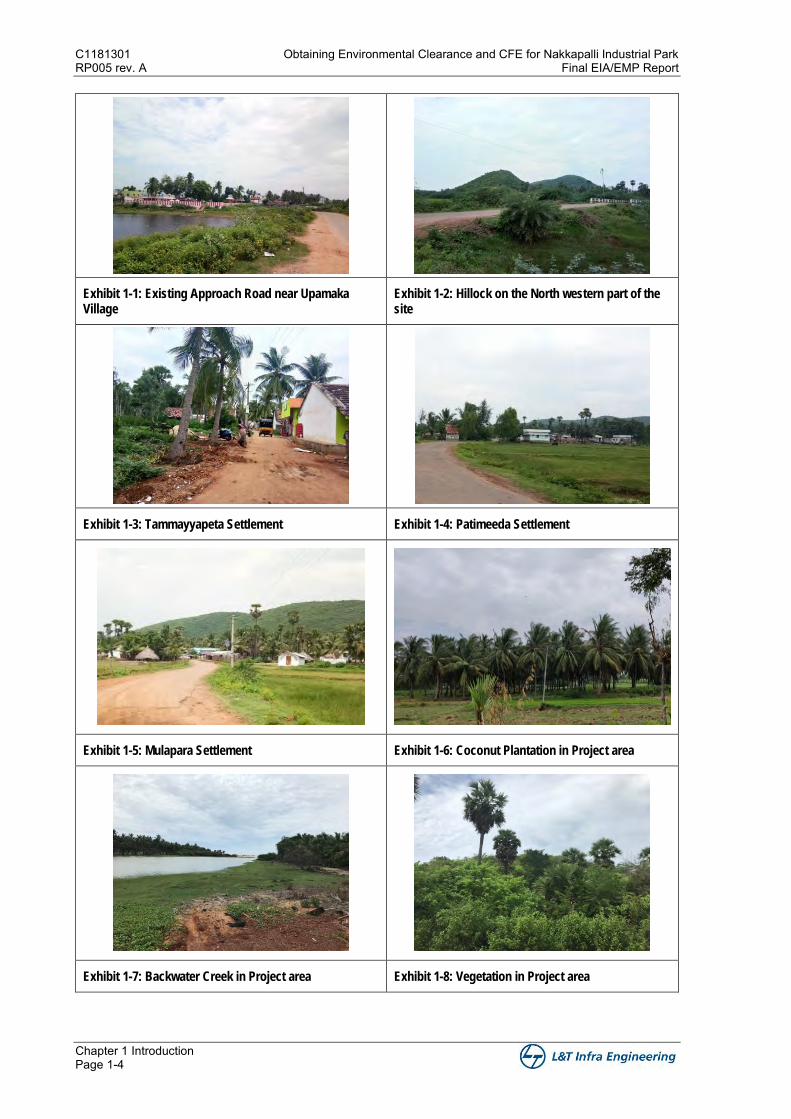
C1181301 Obtaining Environmental Clearance and CFE for Nakkapalli Industrial Park RP005 rev. A Final EIA/EMP Report
Chapter 1 Introduction Page 1-4
Exhibit 1-1: Existing Approach Road near Upamaka Village
Exhibit 1-2: Hillock on the North western part of the site
Exhibit 1-3: Tammayyapeta Settlement Exhibit 1-4: Patimeeda Settlement
Exhibit 1-5: Mulapara Settlement Exhibit 1-6: Coconut Plantation in Project area
Exhibit 1-7: Backwater Creek in Project area Exhibit 1-8: Vegetation in Project area
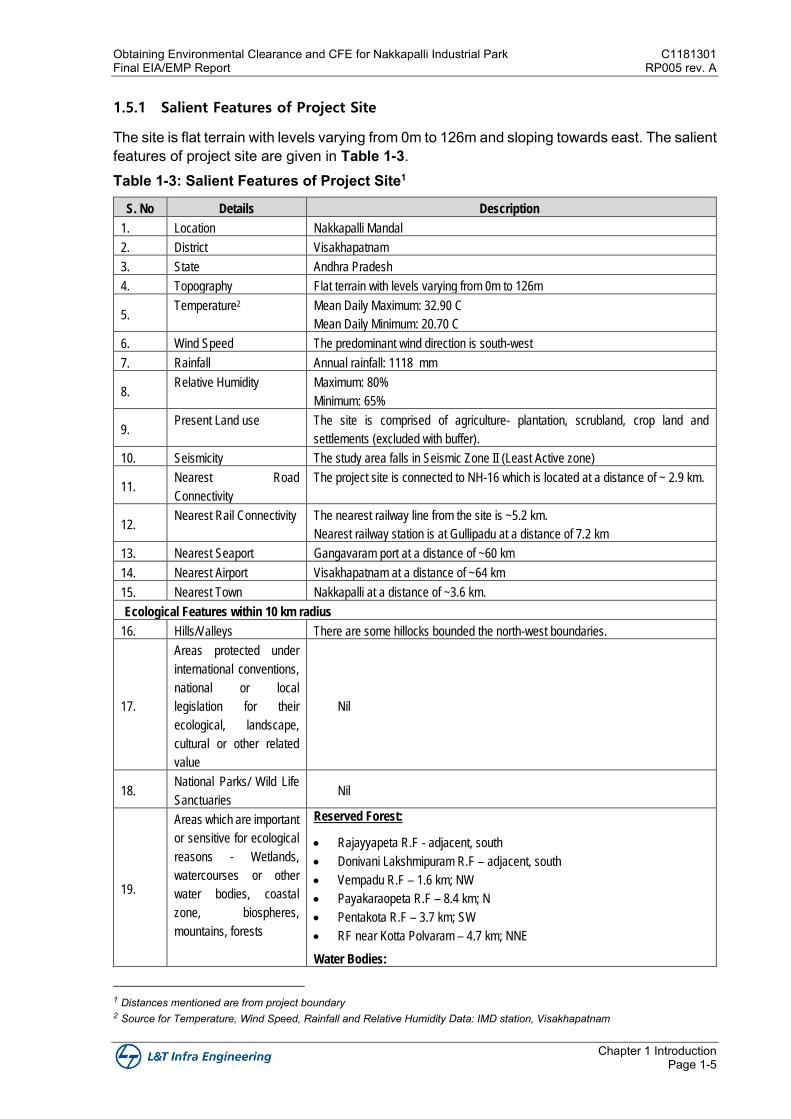
Obtaining Environmental Clearance and CFE for Nakkapalli Industrial Park C1181301 Final EIA/EMP Report RP005 rev. A
Chapter 1 Introduction Page 1-5
1.5.1 Salient Features of Project Site
The site is flat terrain with levels varying from 0m to 126m and sloping towards east. The salient features of project site are given in Table 1-3. Table 1-3: Salient Features of Project Site1
S. No Details Description
1. Location Nakkapalli Mandal
2. District Visakhapatnam
3. State Andhra Pradesh
4. Topography Flat terrain with levels varying from 0m to 126m
5. Temperature2 Mean Daily Maximum: 32.90 C
Mean Daily Minimum: 20.70 C
6. Wind Speed The predominant wind direction is south-west
7. Rainfall Annual rainfall: 1118 mm
8. Relative Humidity Maximum: 80%
Minimum: 65%
9. Present Land use The site is comprised of agriculture- plantation, scrubland, crop land and
settlements (excluded with buffer).
10. Seismicity The study area falls in Seismic Zone II (Least Active zone)
11. Nearest Road
Connectivity
The project site is connected to NH-16 which is located at a distance of ~ 2.9 km.
12. Nearest Rail Connectivity The nearest railway line from the site is ~5.2 km.
Nearest railway station is at Gullipadu at a distance of 7.2 km
13. Nearest Seaport Gangavaram port at a distance of ~60 km
14. Nearest Airport Visakhapatnam at a distance of ~64 km
15. Nearest Town Nakkapalli at a distance of ~3.6 km.
Ecological Features within 10 km radius
16. Hills/Valleys There are some hillocks bounded the north-west boundaries.
17.
Areas protected under
international conventions,
national or local
legislation for their
ecological, landscape,
cultural or other related
value
Nil
18. National Parks/ Wild Life
Sanctuaries Nil
19.
Areas which are important
or sensitive for ecological
reasons - Wetlands,
watercourses or other
water bodies, coastal
zone, biospheres,
mountains, forests
Reserved Forest:
• Rajayyapeta R.F - adjacent, south
• Donivani Lakshmipuram R.F – adjacent, south
• Vempadu R.F – 1.6 km; NW
• Payakaraopeta R.F – 8.4 km; N
• Pentakota R.F – 3.7 km; SW
• RF near Kotta Polvaram – 4.7 km; NNE
Water Bodies:
1 Distances mentioned are from project boundary 2 Source for Temperature, Wind Speed, Rainfall and Relative Humidity Data: IMD station, Visakhapatnam
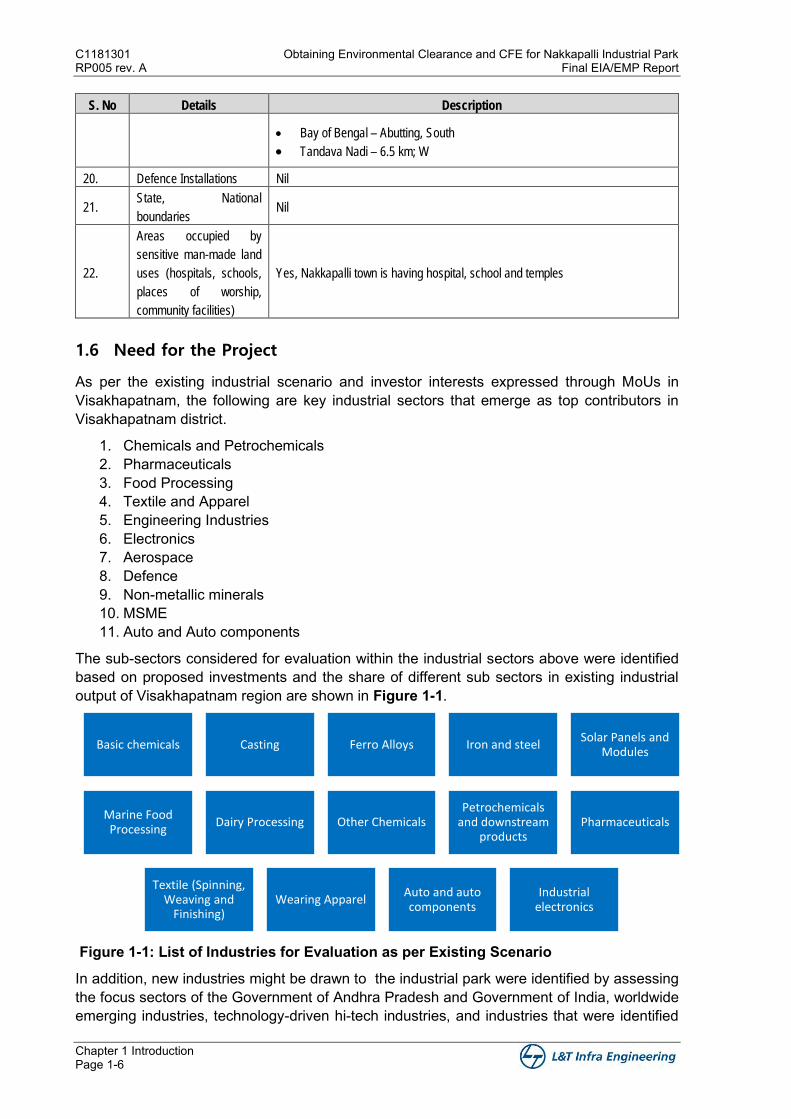
C1181301 Obtaining Environmental Clearance and CFE for Nakkapalli Industrial Park RP005 rev. A Final EIA/EMP Report
Chapter 1 Introduction Page 1-6
S. No Details Description
• Bay of Bengal – Abutting, South
• Tandava Nadi – 6.5 km; W
20. Defence Installations Nil
21. State, National
boundaries Nil
22.
Areas occupied by
sensitive man-made land
uses (hospitals, schools,
places of worship,
community facilities)
Yes, Nakkapalli town is having hospital, school and temples
1.6 Need for the Project
As per the existing industrial scenario and investor interests expressed through MoUs in Visakhapatnam, the following are key industrial sectors that emerge as top contributors in Visakhapatnam district.
1. Chemicals and Petrochemicals 2. Pharmaceuticals 3. Food Processing 4. Textile and Apparel 5. Engineering Industries 6. Electronics 7. Aerospace 8. Defence 9. Non-metallic minerals 10. MSME 11. Auto and Auto components
The sub-sectors considered for evaluation within the industrial sectors above were identified based on proposed investments and the share of different sub sectors in existing industrial output of Visakhapatnam region are shown in Figure 1-1.
Figure 1-1: List of Industries for Evaluation as per Existing Scenario
In addition, new industries might be drawn to the industrial park were identified by assessing the focus sectors of the Government of Andhra Pradesh and Government of India, worldwide emerging industries, technology-driven hi-tech industries, and industries that were identified
Basic chemicals Casting Ferro Alloys Iron and steelSolar Panels and
Modules
Marine Food Processing
Dairy Processing Other ChemicalsPetrochemicals
and downstream products
Pharmaceuticals
Textile (Spinning, Weaving and
Finishing)Wearing Apparel
Auto and auto components
Industrial electronics
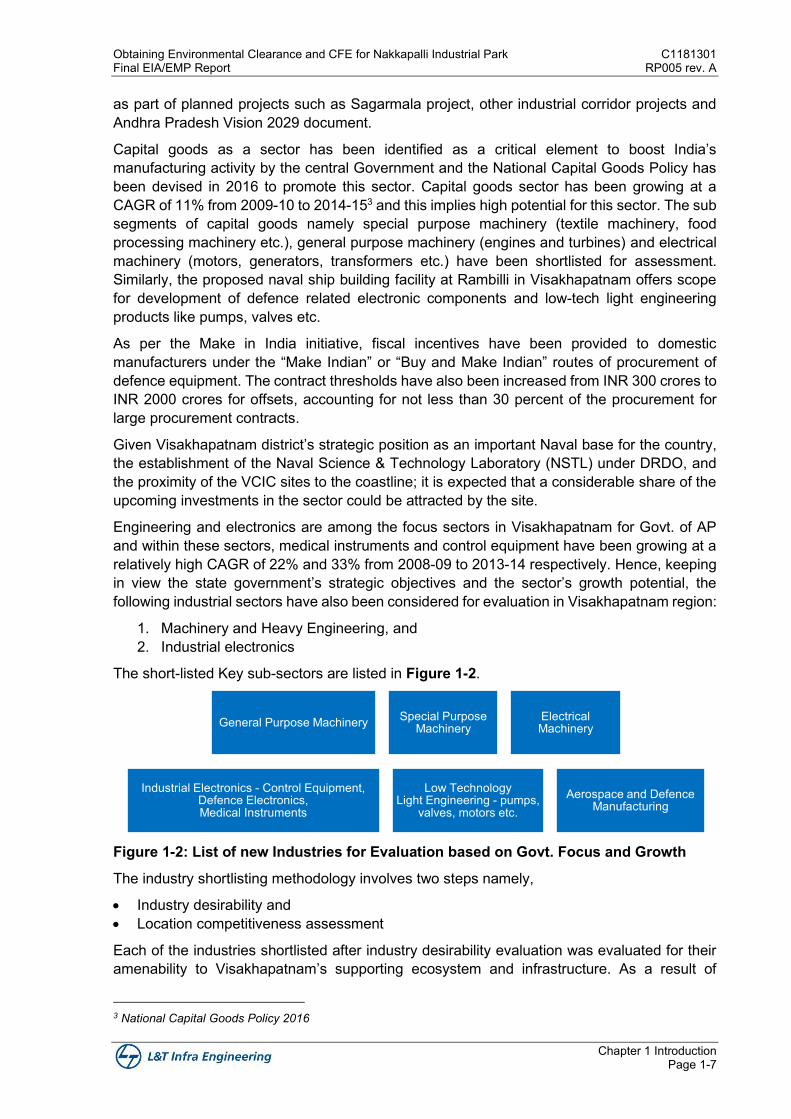
Obtaining Environmental Clearance and CFE for Nakkapalli Industrial Park C1181301 Final EIA/EMP Report RP005 rev. A
Chapter 1 Introduction Page 1-7
as part of planned projects such as Sagarmala project, other industrial corridor projects and Andhra Pradesh Vision 2029 document.
Capital goods as a sector has been identified as a critical element to boost India’s manufacturing activity by the central Government and the National Capital Goods Policy has been devised in 2016 to promote this sector. Capital goods sector has been growing at a CAGR of 11% from 2009-10 to 2014-153 and this implies high potential for this sector. The sub segments of capital goods namely special purpose machinery (textile machinery, food processing machinery etc.), general purpose machinery (engines and turbines) and electrical machinery (motors, generators, transformers etc.) have been shortlisted for assessment. Similarly, the proposed naval ship building facility at Rambilli in Visakhapatnam offers scope for development of defence related electronic components and low-tech light engineering products like pumps, valves etc.
As per the Make in India initiative, fiscal incentives have been provided to domestic manufacturers under the “Make Indian” or “Buy and Make Indian” routes of procurement of defence equipment. The contract thresholds have also been increased from INR 300 crores to INR 2000 crores for offsets, accounting for not less than 30 percent of the procurement for large procurement contracts.
Given Visakhapatnam district’s strategic position as an important Naval base for the country, the establishment of the Naval Science & Technology Laboratory (NSTL) under DRDO, and the proximity of the VCIC sites to the coastline; it is expected that a considerable share of the upcoming investments in the sector could be attracted by the site.
Engineering and electronics are among the focus sectors in Visakhapatnam for Govt. of AP and within these sectors, medical instruments and control equipment have been growing at a relatively high CAGR of 22% and 33% from 2008-09 to 2013-14 respectively. Hence, keeping in view the state government’s strategic objectives and the sector’s growth potential, the following industrial sectors have also been considered for evaluation in Visakhapatnam region:
1. Machinery and Heavy Engineering, and 2. Industrial electronics
The short-listed Key sub-sectors are listed in Figure 1-2.
Figure 1-2: List of new Industries for Evaluation based on Govt. Focus and Growth
The industry shortlisting methodology involves two steps namely,
• Industry desirability and • Location competitiveness assessment
Each of the industries shortlisted after industry desirability evaluation was evaluated for their amenability to Visakhapatnam’s supporting ecosystem and infrastructure. As a result of
3 National Capital Goods Policy 2016
General Purpose Machinery Special Purpose Machinery
Electrical Machinery
Industrial Electronics - Control Equipment, Defence Electronics, Medical Instruments
Low Technology Light Engineering - pumps,
valves, motors etc.Aerospace and Defence
Manufacturing
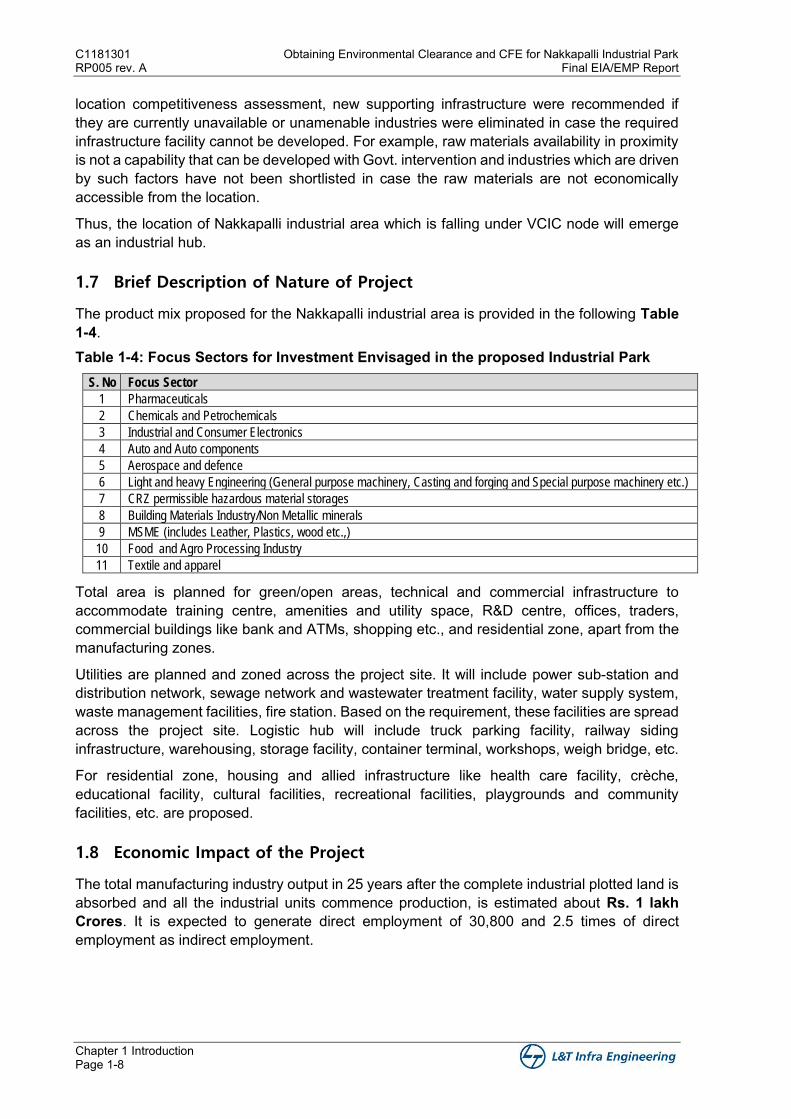
C1181301 Obtaining Environmental Clearance and CFE for Nakkapalli Industrial Park RP005 rev. A Final EIA/EMP Report
Chapter 1 Introduction Page 1-8
location competitiveness assessment, new supporting infrastructure were recommended if they are currently unavailable or unamenable industries were eliminated in case the required infrastructure facility cannot be developed. For example, raw materials availability in proximity is not a capability that can be developed with Govt. intervention and industries which are driven by such factors have not been shortlisted in case the raw materials are not economically accessible from the location.
Thus, the location of Nakkapalli industrial area which is falling under VCIC node will emerge as an industrial hub.
1.7 Brief Description of Nature of Project
The product mix proposed for the Nakkapalli industrial area is provided in the following Table 1-4. Table 1-4: Focus Sectors for Investment Envisaged in the proposed Industrial Park
S. No Focus Sector
1 Pharmaceuticals
2 Chemicals and Petrochemicals
3 Industrial and Consumer Electronics
4 Auto and Auto components
5 Aerospace and defence
6 Light and heavy Engineering (General purpose machinery, Casting and forging and Special purpose machinery etc.)
7 CRZ permissible hazardous material storages
8 Building Materials Industry/Non Metallic minerals
9 MSME (includes Leather, Plastics, wood etc.,)
10 Food and Agro Processing Industry
11 Textile and apparel
Total area is planned for green/open areas, technical and commercial infrastructure to accommodate training centre, amenities and utility space, R&D centre, offices, traders, commercial buildings like bank and ATMs, shopping etc., and residential zone, apart from the manufacturing zones.
Utilities are planned and zoned across the project site. It will include power sub-station and distribution network, sewage network and wastewater treatment facility, water supply system, waste management facilities, fire station. Based on the requirement, these facilities are spread across the project site. Logistic hub will include truck parking facility, railway siding infrastructure, warehousing, storage facility, container terminal, workshops, weigh bridge, etc.
For residential zone, housing and allied infrastructure like health care facility, crèche, educational facility, cultural facilities, recreational facilities, playgrounds and community facilities, etc. are proposed.
1.8 Economic Impact of the Project
The total manufacturing industry output in 25 years after the complete industrial plotted land is absorbed and all the industrial units commence production, is estimated about Rs. 1 lakh Crores. It is expected to generate direct employment of 30,800 and 2.5 times of direct employment as indirect employment.
Obtaining Environmental Clearance and CFE for Nakkapalli Industrial Park C1181301 Final EIA/EMP Report RP005 rev. A
Chapter 1 Introduction Page 1-9
1.9 Location Advantage/Justification
Andhra Pradesh is strategically located on the south-eastern coast of India and is considered as one of the largest producer of marine products in the country. The major industries in the state include Agro & Food–based, pharmaceuticals, textile, petroleum products, basic metals, non–metallic mineral products, etc. Further, the state in the country has pioneered and enacted the concept of industrial single–window clearance. The policy seeks to create an investor–friendly climate by ensuring highest ease of doing business and would provide all the clearances within 21 working days. Further, the state also promises for 24 hours of uninterrupted power supply to investors setting up units.
Some of the key investments in the state are mentioned below:
• Pepsi Co. beverage plant at Sri City with an investment of approximately INR 1,200 crores • MOU with Asian Paints to set up manufacturing plant in Visakhapatnam with an investment
of INR 1,750 crores • Hero Motors expected to set up its motorcycle manufacturing plant in Andhra Pradesh • KIA motors is establishing Automobile Manufacturing facility with an investment of ~10,000
crores
With the help of a new industrial policy for 2015–2020 and sector–specific policies for various industries such as automotive, textiles, etc., the chief minister of Andhra Pradesh is making aggressive pitch for new industries in the state. Further, offering various tax incentives and benefits to industrial units along with a Single Window Clearance System, the state is expected to put itself on the path of industrialization, going forward.
1.10 Environment Impact Assessment
APIIC submitted the proposal (Form-1, Draft ToR and Prefeasibility Report) for consideration by Expert Appraisal Committee (EAC), Ministry of Environment, Forest and Climate Change (MoEF&CC).
The EIA study has been carried out based on the approved ToR covering standard ToR accorded vide letter no. F. No. 21-140/2018-IA.III dated June 12, 2019 for Industrial estates/ parks/ complexes/ areas, export processing zones (EPZs). Special Economic Zones (SEZs), Biotech Parks, Leather Complexes as mentioned in the letter issued by MoEF&CC. ToR obtained is enclosed as Appendix A and compliance to Standard and Additional ToR is provided as Appendix B.
The draft EIA report prepared has been submitted to APPCB in December 2019 and Public Consultation couldn’t takes place due to onset of COVID. The same was held on November 25, 2020. The Public Hearing minutes of the meeting was received from APPCB on January 30, 2021. As the project involves disposal of treated wastewater into sea, an application was made to APPCB and the NoC for the same was obtained in August 17, 2021 and the same is given as APPENDIX N. Necessary documents were submitted to APCZMA on August 25, 2021 and the CRZ Recommendations were received in January 18, 2022 and the same is given as APPENDIX O.
C1181301 Obtaining Environmental Clearance and CFE for Nakkapalli Industrial Park RP005 rev. A Final EIA/EMP Report
Chapter 1 Introduction Page 1-10
1.11 Approach and Methodology
1.11.1 Project Influence Area (PIA)/Study Area
An area covering 10 km radius from Nakkapalli IP boundary has been earmarked as study area for baseline environmental surveys and Impact Assessment respectively. The study area map is given as Figure FD0102.
1.11.2 Study Period
The baseline environmental survey was carried out during summer season (April to June), 2018.
1.11.3 Methodology
The EIA study has been carried out considering construction as well as operational phases. In each phase, anticipated impacts due to proposed development on environment and social components have been addressed. The methodology adopted for the study is discussed in the following sections.
1.11.3.1 Project Description
The project development plan covering proposed industrial and infrastructure facilities, development schedule and project cost is discussed in Chapter 2.
HTL/LTL and CRZ Demarcation Survey: The physical demarcation of HTL and LTL was carried out by National Centre for Sustainable Coastal Management (NCSCM), Chennai which is an authorised agency by MoEF&CC. Based on the survey, the CRZ set back lines were demarcated. The project layout was superimposed on the CRZ set back lines and details are discussed in Chapter 2.
1.11.3.2 Baseline Environmental Surveys
The baseline environmental status of the study area was established by carrying out the field surveys. In addition, authenticated secondary data was also collected, reviewed and presented. The baseline environmental data was collected within the study area for following attributes.
• Meteorology, Ambient Air Quality, Noise Levels, Water Quality and Soil • Ecology (Flora and Fauna) • Land use and Land Cover Mapping
Site specific hourly meteorological data was generated during the study period. In addition, hourly meteorological data (pre-processed from MM5) of the year of 2018 was obtained from Lakes Environment. Ambient air quality monitoring at the identified monitoring locations in the study area was carried out with twice samples a week frequency. Hourly noise levels were recorded at identified monitoring locations once during the study period. Inland water quality (surface and groundwater) and soil quality sampling was carried out once during the study period at the identified sampling locations in the study area. The baseline environmental surveys were carried out by NABL and MoEF&CC accredited laboratory, M/s. Kiwi Labs, Hyderabad.
Obtaining Environmental Clearance and CFE for Nakkapalli Industrial Park C1181301 Final EIA/EMP Report RP005 rev. A
Chapter 1 Introduction Page 1-11
Marine Environment: Centre for Coastal and Marine Research (CCMR) was engaged to survey the marine environmental attributes. Sampling was carried out once during the study period at the identified sampling locations within the project region. The marine environment was monitored in terms of:
• Seawater quality • Sediment quality • Marine biology (plankton and benthos)
Socio-Economic Aspects: Comprehensive socio-economic baseline and social impact assessment was carried out by primary sample survey among project affected people and secondary data collected from Census of India, 2011.
The baseline environmental conditions are described in Chapter 3.
1.11.3.3 Anticipated Environmental Impacts and Mitigation Measures
The environmental impacts which are likely to arise due to the proposed development during the construction as well as operational phases have been studied in detail with respect to the facilities/activities being proposed. Further, the impacts have been assessed taking into consideration the existing baseline status of the terrestrial and marine environments. The mitigation measures proposed to minimise/avoid each of the likely impacts are presented in Chapter 4.
1.11.3.4 Analysis of Alternatives
APIIC has identified land parcel in Visakhapatnam node at Nakkapalli. About 1578 Ha (3899 acres) of land was identified at Butchirajupeta, D.L. Puram, Vempadu, Chandanada, Rajayyapeta villages in Nakkapalli Mandal, Visakhapatnam District for development of industrial park. Some of the important site features making it suitable for Industrial Park have been discussed in detail and presented in Chapter 5.
1.11.3.5 Environmental Monitoring Programme
Environmental Monitoring Programme for construction and operation phases of project has been addressed and presented in Chapter 6 of this report. The Environmental Monitoring Programme covers the technical and network design of monitoring including measurement methodologies, frequency, location, etc.
1.11.3.6 Additional Studies
Public Consultation
In line with the requirements of EIA Notification, 2006 (as amended) for Category A Industries listed in the EIA Notification, public hearing for proposed “Development of Industrial Park” at Butchirajupeta, D.L. Puram, Vempadu, Chandanada, Rajayyapeta villages in Nakkapalli Mandal, Visakhapatnam District, Andhra Pradesh was conducted on November 25, 2020 by APPCB. For conducting Public Hearing, the Draft EIA Report was prepared in accordance to MoEF& CC approved ToR and Executive summaries in English and Local (Telugu) languages were submitted to Andhra Pradesh Pollution Control Board (APPCB). The meeting was conducted by the panel consisting of Joint Collector & Additional District Magistrate, Visakhapatnam District, Andhra Pradesh and Environmental Engineer, Andhra Pradesh Pollution Control Board (APPCB), Regional Office, Visakhapatnam. It was attended by the
C1181301 Obtaining Environmental Clearance and CFE for Nakkapalli Industrial Park RP005 rev. A Final EIA/EMP Report
Chapter 1 Introduction Page 1-12
local public and public representatives. The details of public consultation proceedings and responses of APIIC for observations raised by the public are presented in Chapter 7.
Risk Analysis and Broad Disaster Management Plan: Preliminary risk analysis covering hazard identification and mitigation measures during handling of hazardous materials were described. Broad Disaster Management Plan was prepared outlining various measures to combat accidents and natural disasters. Also measures to guard against fire hazards have been addressed in Chapter 7.
Traffic Studies: The traffic survey and forecast carried out for Nakkapalli IP to understand the current traffic pattern and forecast projected in future. The traffic thus estimated is assigned on to the road network and adequacy of the same is evaluated and appropriate transport infrastructure to cater to IP near Nakkapalli is suggested and presented in Chapter 7.
Social Impact Assessment: The likely social impacts associated with the project development during construction and operational phases are detailed out in Chapter 7.
1.11.3.7 Project Benefits
The project benefits in terms of improvements in the physical and social infrastructure, employment potential and other tangible benefits including Corporate Environment Responsibility (CER) are presented in Chapter 8.
1.11.3.8 Environmental Management Plan (EMP)
An Environmental Management Plan (EMP) was prepared based on the mitigation measures for the impacts during construction and operation phases and an environmental monitoring programme is proposed. The mitigation measures have been discussed in Chapter 4 under the respective sections. The Environmental Monitoring Programme has been discussed in Chapter 6. The institutional mechanism responsible for the implementation of the mitigation measures, Greenbelt development and budgetary estimates are presented in Chapter 9.
1.12 Structure of EIA Report
The report is structured as per Appendix III of EIA Notification, 2006 (as amended) and also EIA Guidance Manual for Industrial Estates, 2010 released by MoEF&CC.
• Chapter 1 : Introduction • Chapter 2 : Project Description • Chapter 3 : Description of Environment • Chapter 4 : Anticipated Environmental Impacts and Mitigation Measures • Chapter 5 : Analysis of Alternatives • Chapter 6 : Environmental Monitoring Programme • Chapter 7 : Additional Studies • Chapter 8 : Project Benefits • Chapter 9 : Environment Management Plan (EMP) • Chapter 10 : Summary and Conclusion • Chapter 11 : Disclosure of Consultants Engaged

Figures


Chapter 2
Project Description

Obtaining Environmental Clearance and CFE for Nakkapalli Industrial Park C1181301 Final EIA/EMP Report RP005 rev. A
Chapter 2 Project Description Page 2-1
Chapter 2 Project Description
2.1 General
This chapter describes the salient features of proposed Industrial Park, target sectors, master planning, infrastructure facilities, utilities & amenities and wastewater management & solid waste collection; based on the Master Plan and Detailed Project Report prepared by L&T Infrastructure Engineering Limited. This chapter also covers project land, estimated cost of project and project implementation schedule.
2.2 Land for the Project
APIIC has identified land parcel to promote the industrial development in the state of Andhra Pradesh. About an area of 1578 Ha (3899 acres) at Butchirajupeta, D L Puram, Vempadu, Chandanada, Rajayyapeta villages of Nakkapalli Mandal of Visakhapatnam district in Andhra Pradesh was identified for the development of Nakkapalli IP. The geographical co-ordinates of the site are 17°20'34.32" to 17°22'31.77" North Latitude and 82°39'59.95" to 82°43'57.03" East Longitude. There is no forest land involved in the proposed project development. There are settlements in the project site and Resettlement or Rehabilitation (R&R) is not envisaged as the planning of IP has been done by integrating the settlements and zoning of industries in the industrial park. APIIC is in the possession of 2849.83 acres out of which private land is 2001.99 acres and government land is 847.84 acres and requisition for land acquisition has been filed for remaining government land of 1049.98 acres.
2.3 Surveys and Investigations
2.3.1 Topography
The terrain is relatively flat and gentle. There are some hillocks on the north and north-west boundaries. The general slope is trending from NW towards East and elevation is varying from 0m to 126m.
2.3.2 Bathymetry
The bathymetric data information (seabed contours and depths) was taken from the data published in the hydro graphic charts No.3009 and from ETOPO1 global relief model of National Oceanographic and Atmospheric Administration (NOAA).
2.4 Details of Master Plan – Planning Brief
A state-of-the-art Master Planning incorporating holistic and sustainable industrial development concepts shall include:
• Long term vision with focus on international competence • Focus on integrated infrastructure • Optimal utilisation of available land and flexibility in plot division • Optimal utilisation of natural resources including energy conservation measures • Traffic management • No relocation - An adequate buffer and access roads will be provided to the existing
settlements which are falling within the project site
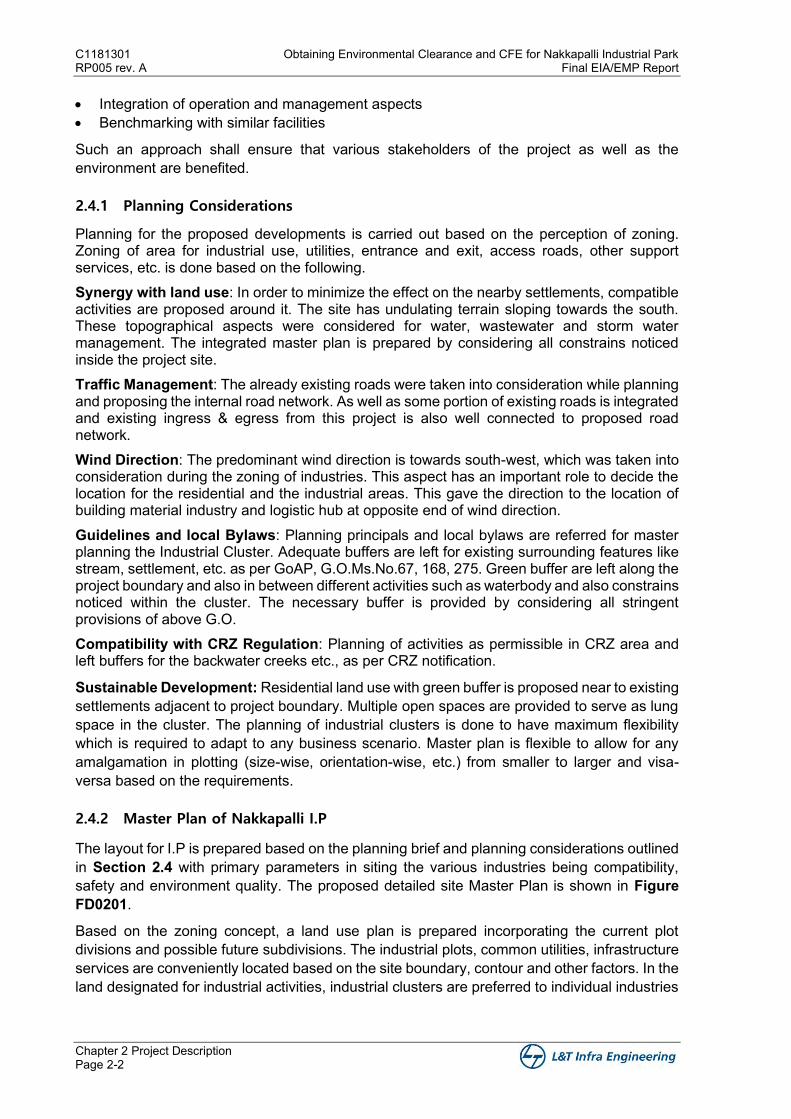
C1181301 Obtaining Environmental Clearance and CFE for Nakkapalli Industrial Park RP005 rev. A Final EIA/EMP Report
Chapter 2 Project Description Page 2-2
• Integration of operation and management aspects • Benchmarking with similar facilities
Such an approach shall ensure that various stakeholders of the project as well as the environment are benefited.
2.4.1 Planning Considerations
Planning for the proposed developments is carried out based on the perception of zoning. Zoning of area for industrial use, utilities, entrance and exit, access roads, other support services, etc. is done based on the following. Synergy with land use: In order to minimize the effect on the nearby settlements, compatible activities are proposed around it. The site has undulating terrain sloping towards the south. These topographical aspects were considered for water, wastewater and storm water management. The integrated master plan is prepared by considering all constrains noticed inside the project site. Traffic Management: The already existing roads were taken into consideration while planning and proposing the internal road network. As well as some portion of existing roads is integrated and existing ingress & egress from this project is also well connected to proposed road network. Wind Direction: The predominant wind direction is towards south-west, which was taken into consideration during the zoning of industries. This aspect has an important role to decide the location for the residential and the industrial areas. This gave the direction to the location of building material industry and logistic hub at opposite end of wind direction. Guidelines and local Bylaws: Planning principals and local bylaws are referred for master planning the Industrial Cluster. Adequate buffers are left for existing surrounding features like stream, settlement, etc. as per GoAP, G.O.Ms.No.67, 168, 275. Green buffer are left along the project boundary and also in between different activities such as waterbody and also constrains noticed within the cluster. The necessary buffer is provided by considering all stringent provisions of above G.O. Compatibility with CRZ Regulation: Planning of activities as permissible in CRZ area and left buffers for the backwater creeks etc., as per CRZ notification.
Sustainable Development: Residential land use with green buffer is proposed near to existing settlements adjacent to project boundary. Multiple open spaces are provided to serve as lung space in the cluster. The planning of industrial clusters is done to have maximum flexibility which is required to adapt to any business scenario. Master plan is flexible to allow for any amalgamation in plotting (size-wise, orientation-wise, etc.) from smaller to larger and visa-versa based on the requirements.
2.4.2 Master Plan of Nakkapalli I.P
The layout for I.P is prepared based on the planning brief and planning considerations outlined in Section 2.4 with primary parameters in siting the various industries being compatibility, safety and environment quality. The proposed detailed site Master Plan is shown in Figure FD0201.
Based on the zoning concept, a land use plan is prepared incorporating the current plot divisions and possible future subdivisions. The industrial plots, common utilities, infrastructure services are conveniently located based on the site boundary, contour and other factors. In the land designated for industrial activities, industrial clusters are preferred to individual industries
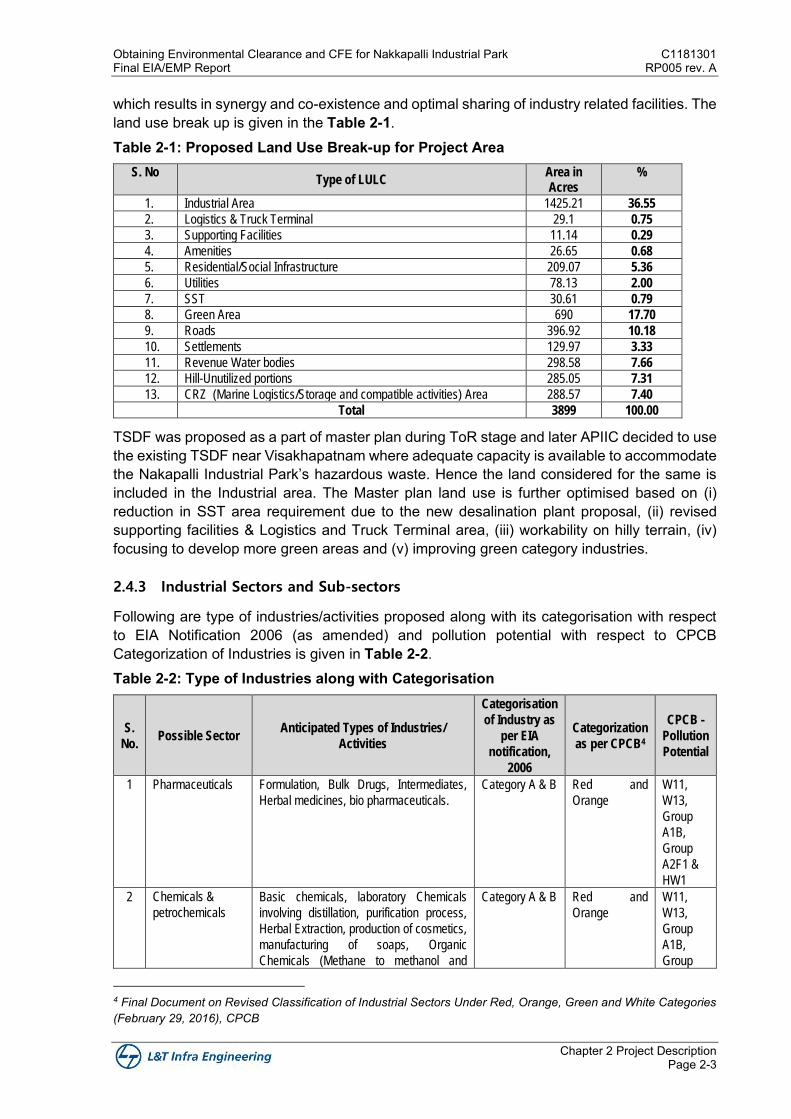
Obtaining Environmental Clearance and CFE for Nakkapalli Industrial Park C1181301 Final EIA/EMP Report RP005 rev. A
Chapter 2 Project Description Page 2-3
which results in synergy and co-existence and optimal sharing of industry related facilities. The land use break up is given in the Table 2-1. Table 2-1: Proposed Land Use Break-up for Project Area
S. No Type of LULC
Area in Acres
%
1. Industrial Area 1425.21 36.55
2. Logistics & Truck Terminal 29.1 0.75
3. Supporting Facilities 11.14 0.29
4. Amenities 26.65 0.68
5. Residential/Social Infrastructure 209.07 5.36
6. Utilities 78.13 2.00
7. SST 30.61 0.79
8. Green Area 690 17.70
9. Roads 396.92 10.18
10. Settlements 129.97 3.33
11. Revenue Water bodies 298.58 7.66
12. Hill-Unutilized portions 285.05 7.31
13. CRZ (Marine Logistics/Storage and compatible activities) Area 288.57 7.40
Total 3899 100.00
TSDF was proposed as a part of master plan during ToR stage and later APIIC decided to use the existing TSDF near Visakhapatnam where adequate capacity is available to accommodate the Nakapalli Industrial Park’s hazardous waste. Hence the land considered for the same is included in the Industrial area. The Master plan land use is further optimised based on (i) reduction in SST area requirement due to the new desalination plant proposal, (ii) revised supporting facilities & Logistics and Truck Terminal area, (iii) workability on hilly terrain, (iv) focusing to develop more green areas and (v) improving green category industries.
2.4.3 Industrial Sectors and Sub-sectors
Following are type of industries/activities proposed along with its categorisation with respect to EIA Notification 2006 (as amended) and pollution potential with respect to CPCB Categorization of Industries is given in Table 2-2. Table 2-2: Type of Industries along with Categorisation
S.
No. Possible Sector
Anticipated Types of Industries/
Activities
Categorisation
of Industry as
per EIA
notification,
2006
Categorization
as per CPCB4
CPCB -
Pollution
Potential
1 Pharmaceuticals Formulation, Bulk Drugs, Intermediates,
Herbal medicines, bio pharmaceuticals.
Category A & B
Red and
Orange
W11,
W13,
Group
A1B,
Group
A2F1 &
HW1
2 Chemicals &
petrochemicals
Basic chemicals, laboratory Chemicals
involving distillation, purification process,
Herbal Extraction, production of cosmetics,
manufacturing of soaps, Organic
Chemicals (Methane to methanol and
Category A & B
Red and
Orange
W11,
W13,
Group
A1B,
Group
4 Final Document on Revised Classification of Industrial Sectors Under Red, Orange, Green and White Categories (February 29, 2016), CPCB
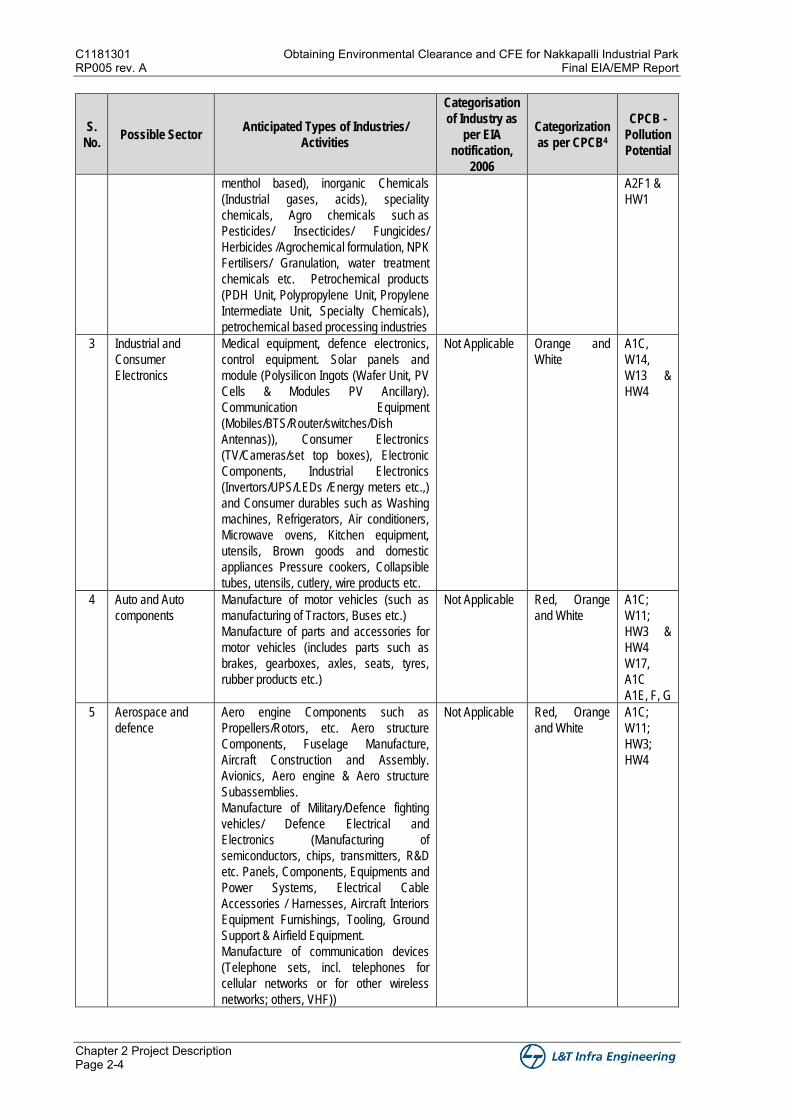
C1181301 Obtaining Environmental Clearance and CFE for Nakkapalli Industrial Park RP005 rev. A Final EIA/EMP Report
Chapter 2 Project Description Page 2-4
S.
No. Possible Sector
Anticipated Types of Industries/
Activities
Categorisation
of Industry as
per EIA
notification,
2006
Categorization
as per CPCB4
CPCB -
Pollution
Potential
menthol based), inorganic Chemicals
(Industrial gases, acids), speciality
chemicals, Agro chemicals such as
Pesticides/ Insecticides/ Fungicides/
Herbicides /Agrochemical formulation, NPK
Fertilisers/ Granulation, water treatment
chemicals etc. Petrochemical products
(PDH Unit, Polypropylene Unit, Propylene
Intermediate Unit, Specialty Chemicals),
petrochemical based processing industries
A2F1 &
HW1
3 Industrial and
Consumer
Electronics
Medical equipment, defence electronics,
control equipment. Solar panels and
module (Polysilicon Ingots (Wafer Unit, PV
Cells & Modules PV Ancillary).
Communication Equipment
(Mobiles/BTS/Router/switches/Dish
Antennas)), Consumer Electronics
(TV/Cameras/set top boxes), Electronic
Components, Industrial Electronics
(Invertors/UPS/LEDs /Energy meters etc.,)
and Consumer durables such as Washing
machines, Refrigerators, Air conditioners,
Microwave ovens, Kitchen equipment,
utensils, Brown goods and domestic
appliances Pressure cookers, Collapsible
tubes, utensils, cutlery, wire products etc.
Not Applicable Orange and
White
A1C,
W14,
W13 &
HW4
4 Auto and Auto
components
Manufacture of motor vehicles (such as
manufacturing of Tractors, Buses etc.)
Manufacture of parts and accessories for
motor vehicles (includes parts such as
brakes, gearboxes, axles, seats, tyres,
rubber products etc.)
Not Applicable Red, Orange
and White
A1C;
W11;
HW3 &
HW4
W17,
A1C
A1E, F, G
5 Aerospace and
defence
Aero engine Components such as
Propellers/Rotors, etc. Aero structure
Components, Fuselage Manufacture,
Aircraft Construction and Assembly.
Avionics, Aero engine & Aero structure
Subassemblies.
Manufacture of Military/Defence fighting
vehicles/ Defence Electrical and
Electronics (Manufacturing of
semiconductors, chips, transmitters, R&D
etc. Panels, Components, Equipments and
Power Systems, Electrical Cable
Accessories / Harnesses, Aircraft Interiors
Equipment Furnishings, Tooling, Ground
Support & Airfield Equipment.
Manufacture of communication devices
(Telephone sets, incl. telephones for
cellular networks or for other wireless
networks; others, VHF))
Not Applicable Red, Orange
and White
A1C;
W11;
HW3;
HW4
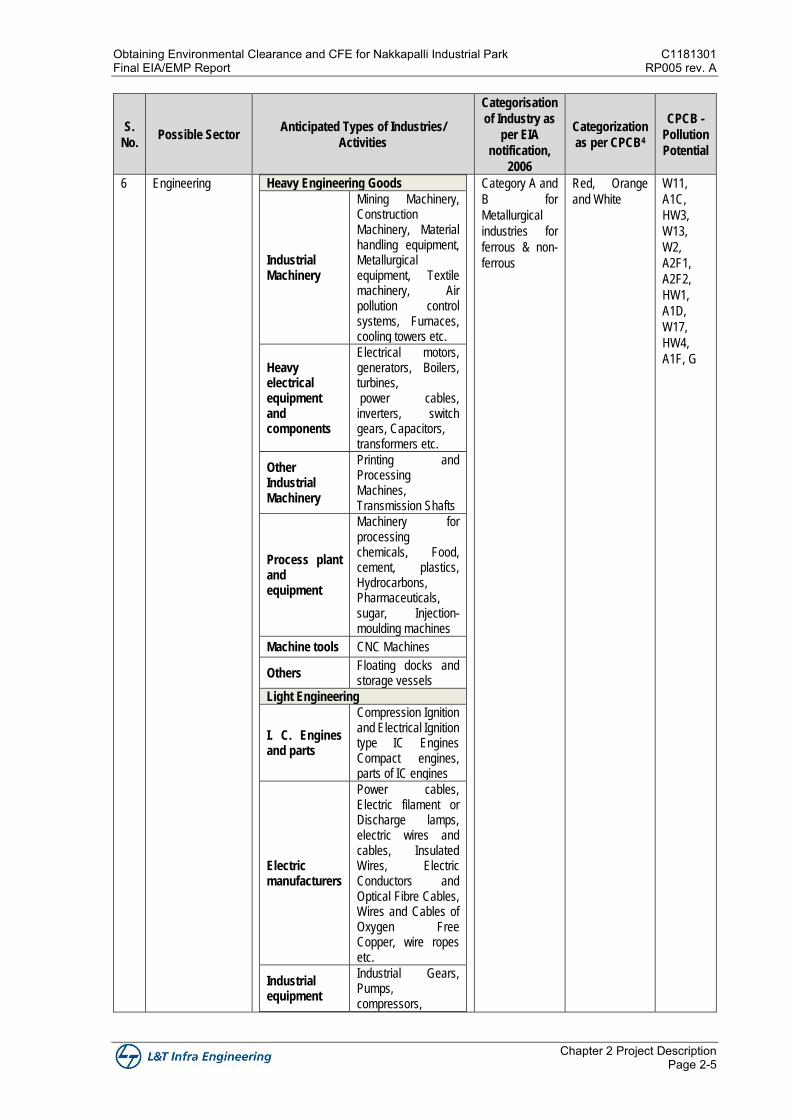
Obtaining Environmental Clearance and CFE for Nakkapalli Industrial Park C1181301 Final EIA/EMP Report RP005 rev. A
Chapter 2 Project Description Page 2-5
S.
No. Possible Sector
Anticipated Types of Industries/
Activities
Categorisation
of Industry as
per EIA
notification,
2006
Categorization
as per CPCB4
CPCB -
Pollution
Potential
6 Engineering Heavy Engineering Goods
Industrial Machinery
Mining Machinery, Construction Machinery, Material handling equipment, Metallurgical equipment, Textile machinery, Air pollution control systems, Furnaces, cooling towers etc.
Heavy electrical equipment and components
Electrical motors, generators, Boilers, turbines, power cables, inverters, switch gears, Capacitors, transformers etc.
Other Industrial Machinery
Printing and Processing Machines, Transmission Shafts
Process plant and equipment
Machinery for processing chemicals, Food, cement, plastics, Hydrocarbons, Pharmaceuticals, sugar, Injection- moulding machines
Machine tools CNC Machines
Others Floating docks and storage vessels
Light Engineering
I. C. Engines and parts
Compression Ignition and Electrical Ignition type IC Engines Compact engines, parts of IC engines
Electric manufacturers
Power cables, Electric filament or Discharge lamps, electric wires and cables, Insulated Wires, Electric Conductors and Optical Fibre Cables, Wires and Cables of Oxygen Free Copper, wire ropes etc.
Industrial equipment
Industrial Gears, Pumps, compressors,
Category A and
B for
Metallurgical
industries for
ferrous & non-
ferrous
Red, Orange
and White
W11,
A1C,
HW3,
W13,
W2,
A2F1,
A2F2,
HW1,
A1D,
W17,
HW4,
A1F, G
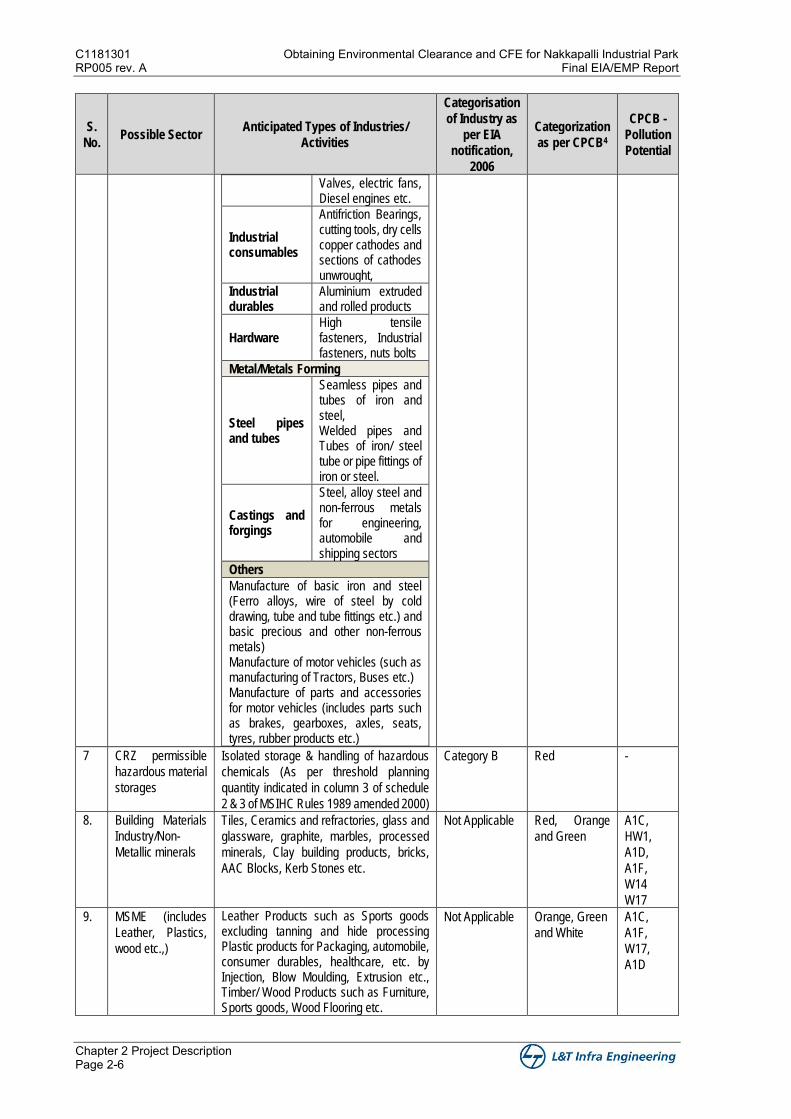
C1181301 Obtaining Environmental Clearance and CFE for Nakkapalli Industrial Park RP005 rev. A Final EIA/EMP Report
Chapter 2 Project Description Page 2-6
S.
No. Possible Sector
Anticipated Types of Industries/
Activities
Categorisation
of Industry as
per EIA
notification,
2006
Categorization
as per CPCB4
CPCB -
Pollution
Potential
Valves, electric fans, Diesel engines etc.
Industrial consumables
Antifriction Bearings, cutting tools, dry cells copper cathodes and sections of cathodes unwrought,
Industrial durables
Aluminium extruded and rolled products
Hardware High tensile fasteners, Industrial fasteners, nuts bolts
Metal/Metals Forming
Steel pipes and tubes
Seamless pipes and tubes of iron and steel, Welded pipes and Tubes of iron/ steel tube or pipe fittings of iron or steel.
Castings and forgings
Steel, alloy steel and non-ferrous metals for engineering, automobile and shipping sectors
Others
Manufacture of basic iron and steel (Ferro alloys, wire of steel by cold drawing, tube and tube fittings etc.) and basic precious and other non-ferrous metals) Manufacture of motor vehicles (such as manufacturing of Tractors, Buses etc.) Manufacture of parts and accessories for motor vehicles (includes parts such as brakes, gearboxes, axles, seats, tyres, rubber products etc.)
7 CRZ permissible
hazardous material
storages
Isolated storage & handling of hazardous
chemicals (As per threshold planning
quantity indicated in column 3 of schedule
2 & 3 of MSIHC Rules 1989 amended 2000)
Category B Red -
8. Building Materials
Industry/Non-
Metallic minerals
Tiles, Ceramics and refractories, glass and
glassware, graphite, marbles, processed
minerals, Clay building products, bricks,
AAC Blocks, Kerb Stones etc.
Not Applicable Red, Orange
and Green
A1C,
HW1,
A1D,
A1F,
W14
W17
9. MSME (includes
Leather, Plastics,
wood etc.,)
Leather Products such as Sports goods excluding tanning and hide processing Plastic products for Packaging, automobile, consumer durables, healthcare, etc. by Injection, Blow Moulding, Extrusion etc., Timber/ Wood Products such as Furniture, Sports goods, Wood Flooring etc.
Not Applicable Orange, Green
and White
A1C,
A1F,
W17,
A1D
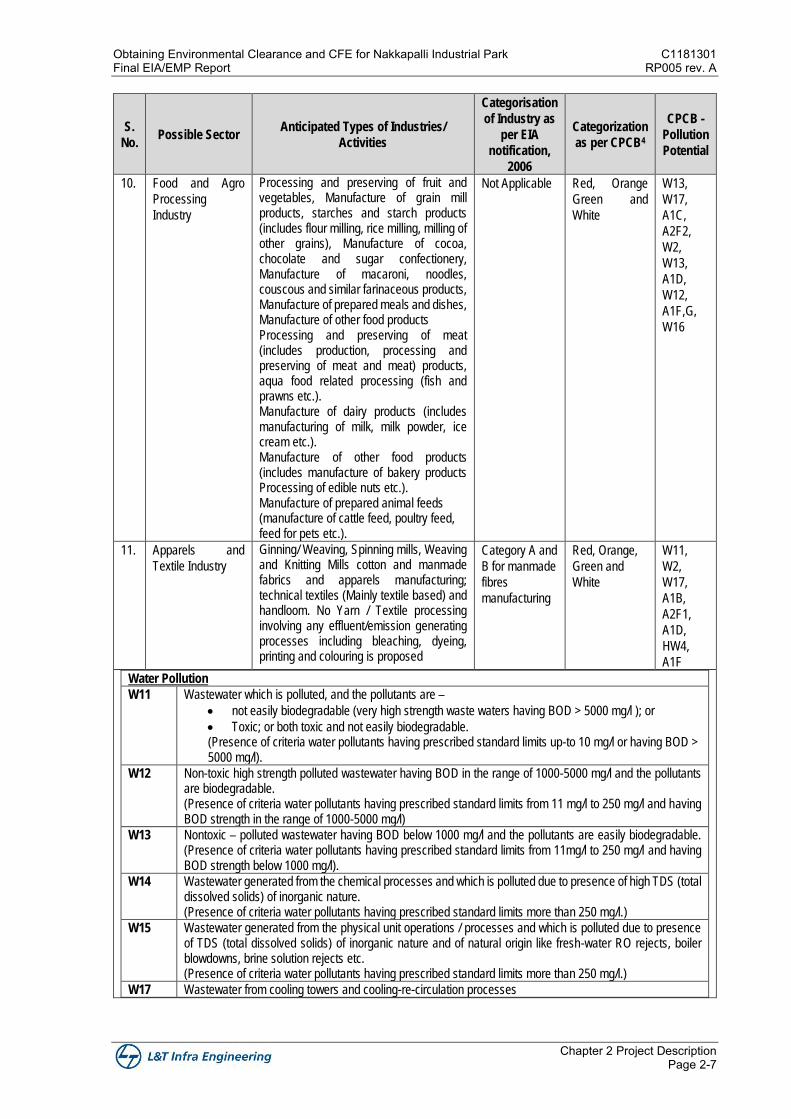
Obtaining Environmental Clearance and CFE for Nakkapalli Industrial Park C1181301 Final EIA/EMP Report RP005 rev. A
Chapter 2 Project Description Page 2-7
S.
No. Possible Sector
Anticipated Types of Industries/
Activities
Categorisation
of Industry as
per EIA
notification,
2006
Categorization
as per CPCB4
CPCB -
Pollution
Potential
10. Food and Agro
Processing
Industry
Processing and preserving of fruit and vegetables, Manufacture of grain mill products, starches and starch products (includes flour milling, rice milling, milling of other grains), Manufacture of cocoa, chocolate and sugar confectionery, Manufacture of macaroni, noodles, couscous and similar farinaceous products, Manufacture of prepared meals and dishes, Manufacture of other food products Processing and preserving of meat (includes production, processing and preserving of meat and meat) products, aqua food related processing (fish and prawns etc.). Manufacture of dairy products (includes manufacturing of milk, milk powder, ice cream etc.). Manufacture of other food products (includes manufacture of bakery products Processing of edible nuts etc.). Manufacture of prepared animal feeds (manufacture of cattle feed, poultry feed, feed for pets etc.).
Not Applicable Red, Orange
Green and
White
W13,
W17,
A1C,
A2F2,
W2,
W13,
A1D,
W12,
A1F,G,
W16
11. Apparels and
Textile Industry
Ginning/ Weaving, Spinning mills, Weaving and Knitting Mills cotton and manmade fabrics and apparels manufacturing; technical textiles (Mainly textile based) and handloom. No Yarn / Textile processing involving any effluent/emission generating processes including bleaching, dyeing, printing and colouring is proposed
Category A and
B for manmade
fibres
manufacturing
Red, Orange,
Green and
White
W11,
W2,
W17,
A1B,
A2F1,
A1D,
HW4,
A1F
Water Pollution
W11 Wastewater which is polluted, and the pollutants are –
• not easily biodegradable (very high strength waste waters having BOD > 5000 mg/l ); or
• Toxic; or both toxic and not easily biodegradable. (Presence of criteria water pollutants having prescribed standard limits up-to 10 mg/l or having BOD > 5000 mg/l).
W12 Non-toxic high strength polluted wastewater having BOD in the range of 1000-5000 mg/l and the pollutants are biodegradable. (Presence of criteria water pollutants having prescribed standard limits from 11 mg/l to 250 mg/l and having BOD strength in the range of 1000-5000 mg/l)
W13 Nontoxic – polluted wastewater having BOD below 1000 mg/l and the pollutants are easily biodegradable. (Presence of criteria water pollutants having prescribed standard limits from 11mg/l to 250 mg/l and having BOD strength below 1000 mg/l).
W14 Wastewater generated from the chemical processes and which is polluted due to presence of high TDS (total dissolved solids) of inorganic nature. (Presence of criteria water pollutants having prescribed standard limits more than 250 mg/l.)
W15 Wastewater generated from the physical unit operations / processes and which is polluted due to presence of TDS (total dissolved solids) of inorganic nature and of natural origin like fresh-water RO rejects, boiler blowdowns, brine solution rejects etc. (Presence of criteria water pollutants having prescribed standard limits more than 250 mg/l.)
W17 Wastewater from cooling towers and cooling-re-circulation processes
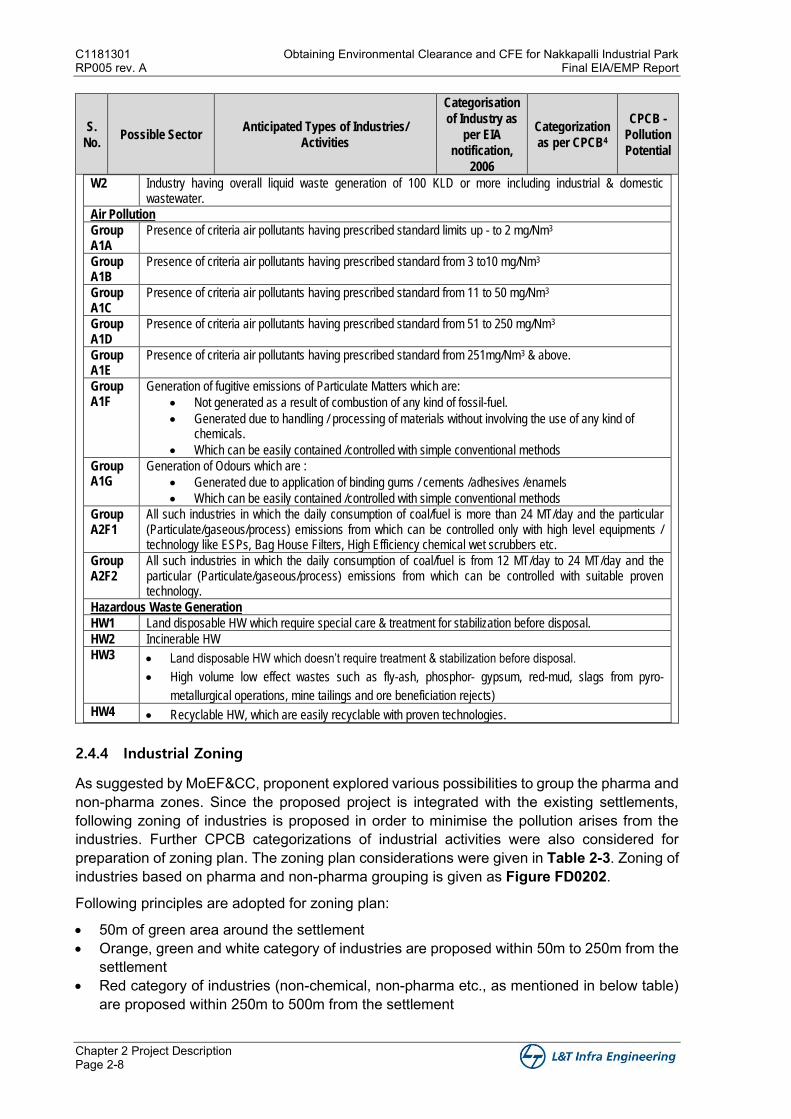
C1181301 Obtaining Environmental Clearance and CFE for Nakkapalli Industrial Park RP005 rev. A Final EIA/EMP Report
Chapter 2 Project Description Page 2-8
S.
No. Possible Sector
Anticipated Types of Industries/
Activities
Categorisation
of Industry as
per EIA
notification,
2006
Categorization
as per CPCB4
CPCB -
Pollution
Potential
W2 Industry having overall liquid waste generation of 100 KLD or more including industrial & domestic wastewater.
Air Pollution
Group A1A
Presence of criteria air pollutants having prescribed standard limits up - to 2 mg/Nm3
Group A1B
Presence of criteria air pollutants having prescribed standard from 3 to10 mg/Nm3
Group A1C
Presence of criteria air pollutants having prescribed standard from 11 to 50 mg/Nm3
Group A1D
Presence of criteria air pollutants having prescribed standard from 51 to 250 mg/Nm3
Group A1E
Presence of criteria air pollutants having prescribed standard from 251mg/Nm3 & above.
Group A1F
Generation of fugitive emissions of Particulate Matters which are:
• Not generated as a result of combustion of any kind of fossil-fuel.
• Generated due to handling / processing of materials without involving the use of any kind of chemicals.
• Which can be easily contained /controlled with simple conventional methods
Group A1G
Generation of Odours which are :
• Generated due to application of binding gums / cements /adhesives /enamels
• Which can be easily contained /controlled with simple conventional methods
Group A2F1
All such industries in which the daily consumption of coal/fuel is more than 24 MT/day and the particular (Particulate/gaseous/process) emissions from which can be controlled only with high level equipments / technology like ESPs, Bag House Filters, High Efficiency chemical wet scrubbers etc.
Group A2F2
All such industries in which the daily consumption of coal/fuel is from 12 MT/day to 24 MT/day and the particular (Particulate/gaseous/process) emissions from which can be controlled with suitable proven technology.
Hazardous Waste Generation
HW1 Land disposable HW which require special care & treatment for stabilization before disposal.
HW2 Incinerable HW
HW3 • Land disposable HW which doesn’t require treatment & stabilization before disposal.
• High volume low effect wastes such as fly-ash, phosphor- gypsum, red-mud, slags from pyro-
metallurgical operations, mine tailings and ore beneficiation rejects)
HW4 • Recyclable HW, which are easily recyclable with proven technologies.
2.4.4 Industrial Zoning
As suggested by MoEF&CC, proponent explored various possibilities to group the pharma and non-pharma zones. Since the proposed project is integrated with the existing settlements, following zoning of industries is proposed in order to minimise the pollution arises from the industries. Further CPCB categorizations of industrial activities were also considered for preparation of zoning plan. The zoning plan considerations were given in Table 2-3. Zoning of industries based on pharma and non-pharma grouping is given as Figure FD0202.
Following principles are adopted for zoning plan:
• 50m of green area around the settlement • Orange, green and white category of industries are proposed within 50m to 250m from the
settlement • Red category of industries (non-chemical, non-pharma etc., as mentioned in below table)
are proposed within 250m to 500m from the settlement
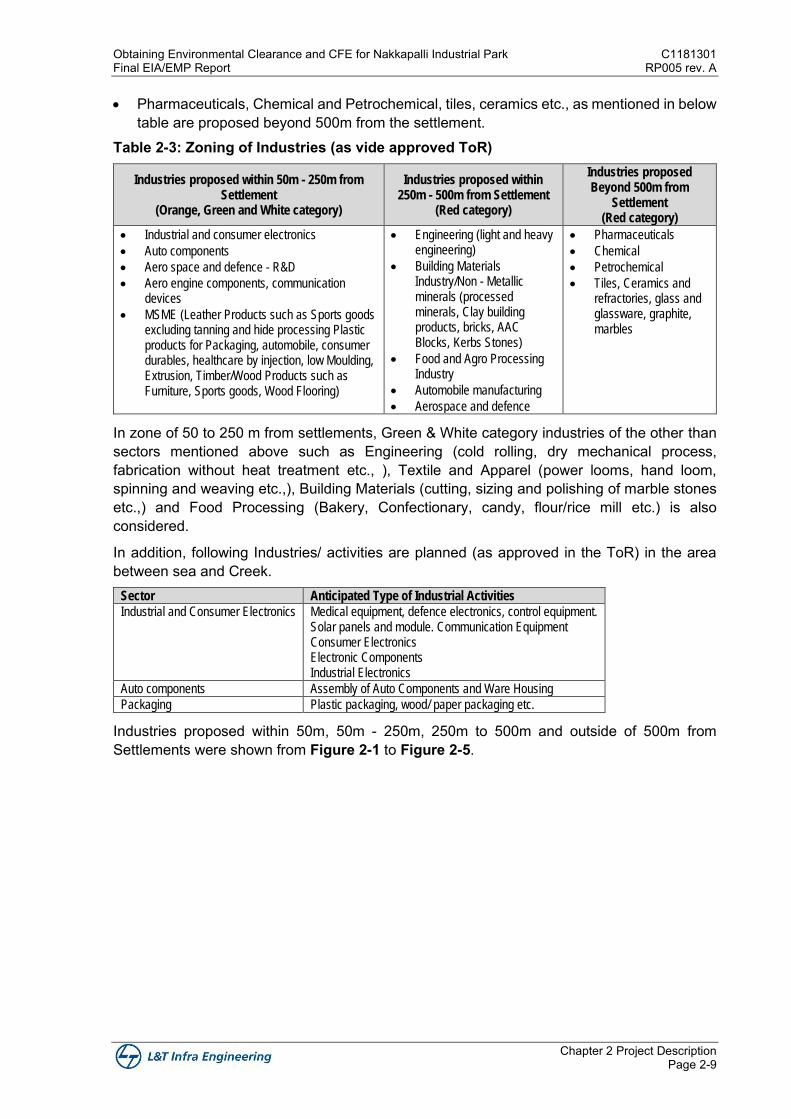
Obtaining Environmental Clearance and CFE for Nakkapalli Industrial Park C1181301 Final EIA/EMP Report RP005 rev. A
Chapter 2 Project Description Page 2-9
• Pharmaceuticals, Chemical and Petrochemical, tiles, ceramics etc., as mentioned in below table are proposed beyond 500m from the settlement.
Table 2-3: Zoning of Industries (as vide approved ToR)
Industries proposed within 50m - 250m from Settlement
(Orange, Green and White category)
Industries proposed within 250m - 500m from Settlement
(Red category)
Industries proposed Beyond 500m from
Settlement (Red category)
• Industrial and consumer electronics
• Auto components
• Aero space and defence - R&D
• Aero engine components, communication devices
• MSME (Leather Products such as Sports goods excluding tanning and hide processing Plastic products for Packaging, automobile, consumer durables, healthcare by injection, low Moulding, Extrusion, Timber/Wood Products such as Furniture, Sports goods, Wood Flooring)
• Engineering (light and heavy engineering)
• Building Materials Industry/Non - Metallic minerals (processed minerals, Clay building products, bricks, AAC Blocks, Kerbs Stones)
• Food and Agro Processing Industry
• Automobile manufacturing
• Aerospace and defence
• Pharmaceuticals
• Chemical
• Petrochemical
• Tiles, Ceramics and refractories, glass and glassware, graphite, marbles
In zone of 50 to 250 m from settlements, Green & White category industries of the other than sectors mentioned above such as Engineering (cold rolling, dry mechanical process, fabrication without heat treatment etc., ), Textile and Apparel (power looms, hand loom, spinning and weaving etc.,), Building Materials (cutting, sizing and polishing of marble stones etc.,) and Food Processing (Bakery, Confectionary, candy, flour/rice mill etc.) is also considered.
In addition, following Industries/ activities are planned (as approved in the ToR) in the area between sea and Creek.
Sector Anticipated Type of Industrial Activities
Industrial and Consumer Electronics Medical equipment, defence electronics, control equipment. Solar panels and module. Communication Equipment Consumer Electronics Electronic Components Industrial Electronics
Auto components Assembly of Auto Components and Ware Housing
Packaging Plastic packaging, wood/ paper packaging etc.
Industries proposed within 50m, 50m - 250m, 250m to 500m and outside of 500m from Settlements were shown from Figure 2-1 to Figure 2-5.
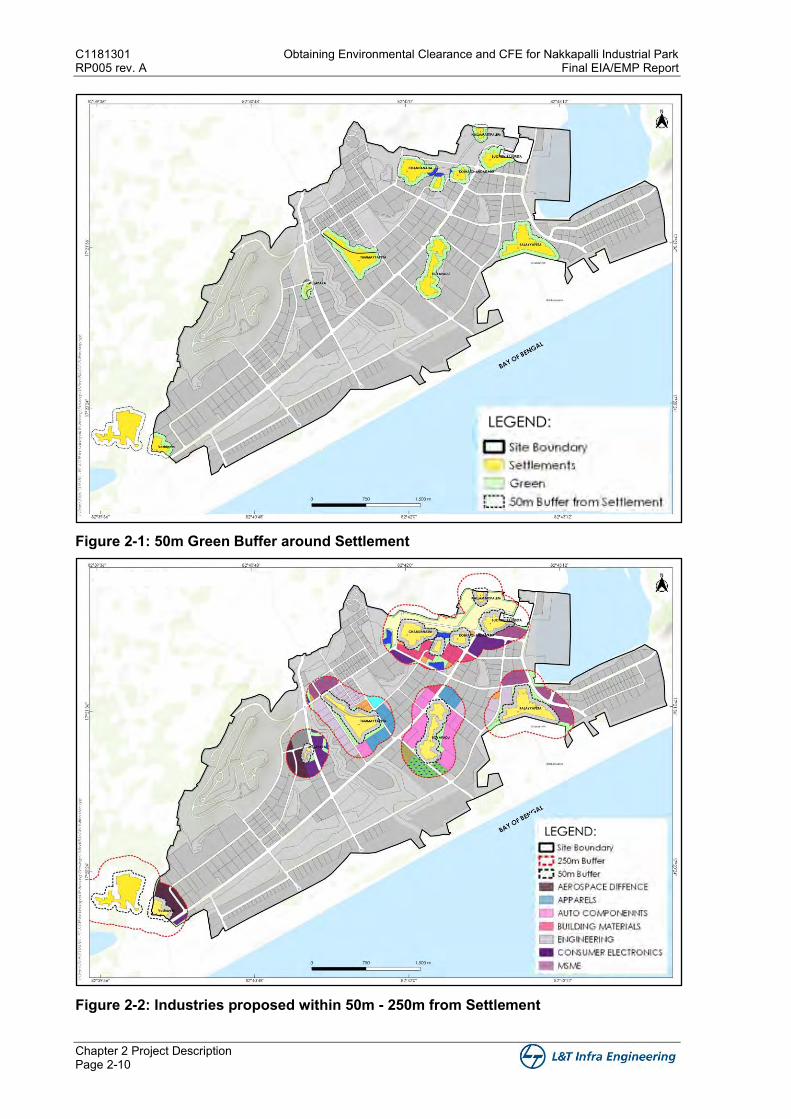
C1181301 Obtaining Environmental Clearance and CFE for Nakkapalli Industrial Park RP005 rev. A Final EIA/EMP Report
Chapter 2 Project Description Page 2-10
Figure 2-1: 50m Green Buffer around Settlement
Figure 2-2: Industries proposed within 50m - 250m from Settlement
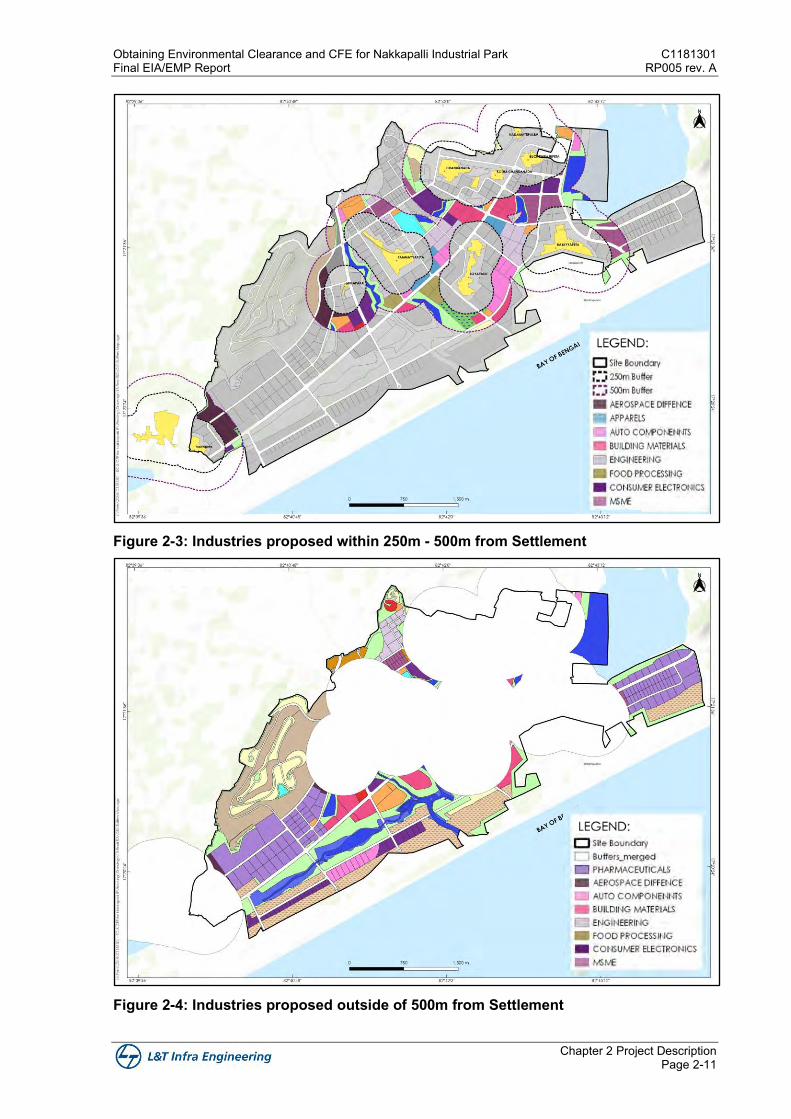
Obtaining Environmental Clearance and CFE for Nakkapalli Industrial Park C1181301 Final EIA/EMP Report RP005 rev. A
Chapter 2 Project Description Page 2-11
Figure 2-3: Industries proposed within 250m - 500m from Settlement
Figure 2-4: Industries proposed outside of 500m from Settlement
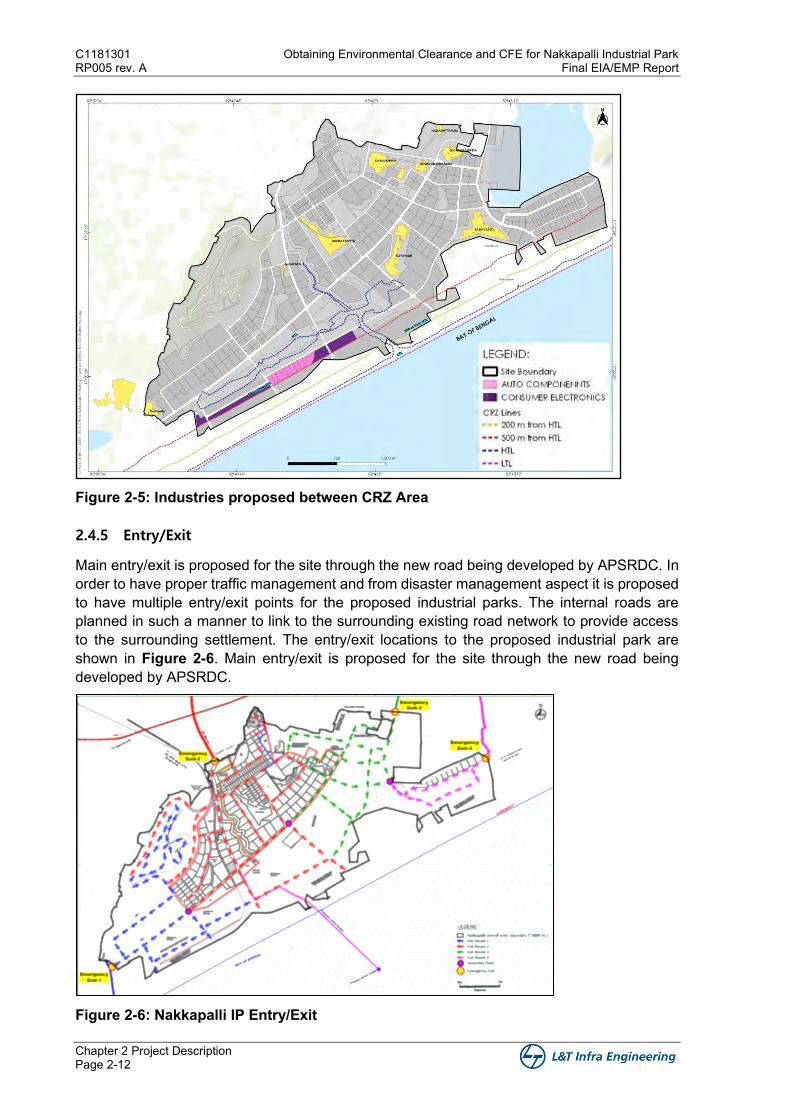
C1181301 Obtaining Environmental Clearance and CFE for Nakkapalli Industrial Park RP005 rev. A Final EIA/EMP Report
Chapter 2 Project Description Page 2-12
Figure 2-5: Industries proposed between CRZ Area
2.4.5 Entry/Exit
Main entry/exit is proposed for the site through the new road being developed by APSRDC. In order to have proper traffic management and from disaster management aspect it is proposed to have multiple entry/exit points for the proposed industrial parks. The internal roads are planned in such a manner to link to the surrounding existing road network to provide access to the surrounding settlement. The entry/exit locations to the proposed industrial park are shown in Figure 2-6. Main entry/exit is proposed for the site through the new road being developed by APSRDC.
Figure 2-6: Nakkapalli IP Entry/Exit
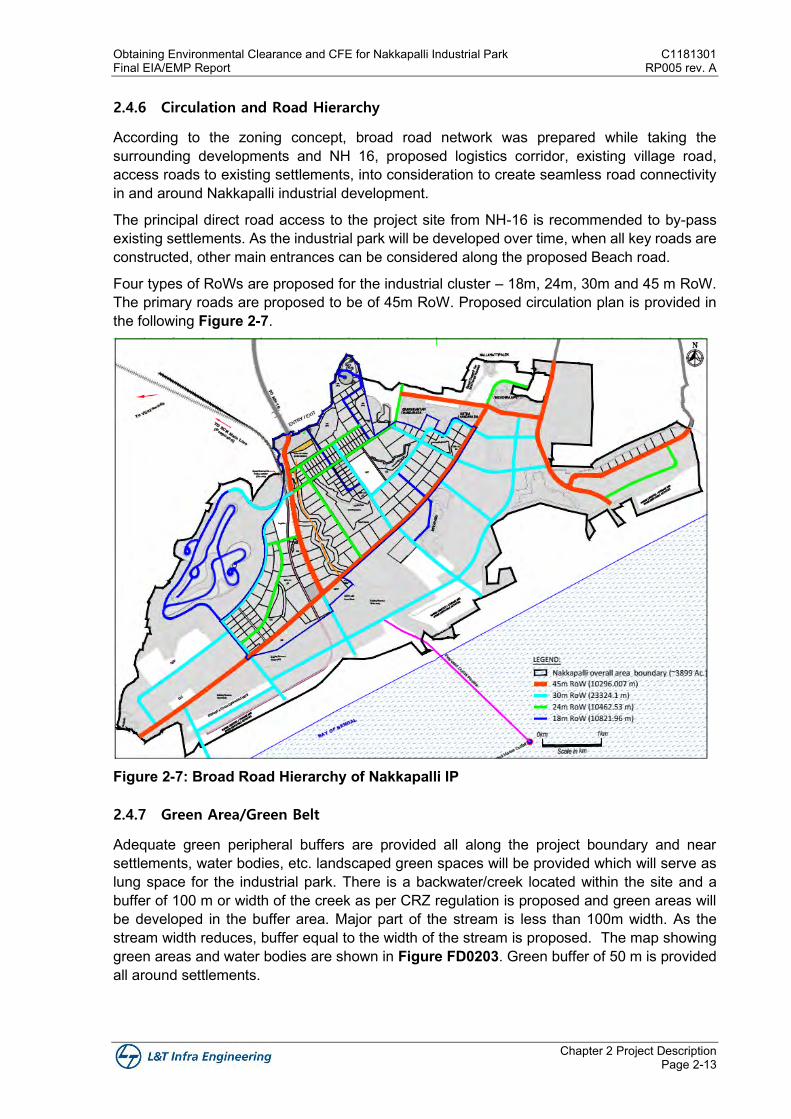
Obtaining Environmental Clearance and CFE for Nakkapalli Industrial Park C1181301 Final EIA/EMP Report RP005 rev. A
Chapter 2 Project Description Page 2-13
2.4.6 Circulation and Road Hierarchy
According to the zoning concept, broad road network was prepared while taking the surrounding developments and NH 16, proposed logistics corridor, existing village road, access roads to existing settlements, into consideration to create seamless road connectivity in and around Nakkapalli industrial development.
The principal direct road access to the project site from NH-16 is recommended to by-pass existing settlements. As the industrial park will be developed over time, when all key roads are constructed, other main entrances can be considered along the proposed Beach road.
Four types of RoWs are proposed for the industrial cluster – 18m, 24m, 30m and 45 m RoW. The primary roads are proposed to be of 45m RoW. Proposed circulation plan is provided in the following Figure 2-7.
Figure 2-7: Broad Road Hierarchy of Nakkapalli IP
2.4.7 Green Area/Green Belt
Adequate green peripheral buffers are provided all along the project boundary and near settlements, water bodies, etc. landscaped green spaces will be provided which will serve as lung space for the industrial park. There is a backwater/creek located within the site and a buffer of 100 m or width of the creek as per CRZ regulation is proposed and green areas will be developed in the buffer area. Major part of the stream is less than 100m width. As the stream width reduces, buffer equal to the width of the stream is proposed. The map showing green areas and water bodies are shown in Figure FD0203. Green buffer of 50 m is provided all around settlements.
C1181301 Obtaining Environmental Clearance and CFE for Nakkapalli Industrial Park RP005 rev. A Final EIA/EMP Report
Chapter 2 Project Description Page 2-14
Park level allotted Green buffer/area of 690 (17.7%) and 15.3% of green area will be maintained at various proposed land uses totalling green area of 33% (1286.67 Ac) for overall proposed industrial park areas as per standard ToR and APPCB guidelines while obtaining Consent for Establishment (CFE) and Consent for Operation (CFO).
2.4.8 Logistics Zone
An area of 29.1 acres is proposed for logistics zone. Predominant activities in the zone are related to transport, logistics, goods distribution and storage for regional, national and international transit. Generally, these developments consist of loading & unloading bays, warehouses, open storage facilities and supporting ancillary services with effective internal vehicular circulation and external multi-modal transport links.
2.4.9 Flatted Factory Building and Office and Welfare Services Buildings
The flatted factory building will be an industrial building admeasuring and will spread over three floors. The building will accommodate workshop areas ranging from 590 sq. ft to over 1000 sq, ft.
Office and Welfare Services Building will be a commercial and office building admeasuring will spread over three floors. The building will accommodate shops, cafeteria, bank, courier office, crèche, offices, business centre, meeting room, training centre, conference hall and guestrooms. Apart from the OWS Building, a building housing a police station and a fire station is proposed in the site. Additionally, the site will have open parking area in the rear side of the building. The OWS building will be surrounded by lush green landscape.
2.4.10 Common Amenities/Industry Related Facilities
Following amenities are proposed in the Nakkapalli IP. Figure FD0201 shows location of amenities.
• Customs and security check facilities at entry/exit location. • Administrative building along with Emergency Control Room (ECR) • Fire station at prominent locations near the entrances • Community hall, recreational spaces, commercial areas, banks and ATMs, post office,
restaurants, cafeterias, fuel filling station, hotel, convention centre, etc. at convenient locations distributed along the processing area for easy access.
• Wastewater treatment plant (CETPs and STP) • Storm water recycling • Solid waste management and disposal • Hospital/Clinic at convenient locations • Social, institutional and recreational area along with commercial spaces is proposed in
residential zone for betterment of the people residing.
Apart from the above common amenities, IP area will also include industry related facilities like R&D centres, material testing centres, Quality Control (QC) laboratories, raw material banks, training centres, weigh bridge, exhibition cum business centre, etc.
2.5 Infrastructure Services and Facilities
This section describes the details of infrastructure facilities proposed in the IP. These include the following:
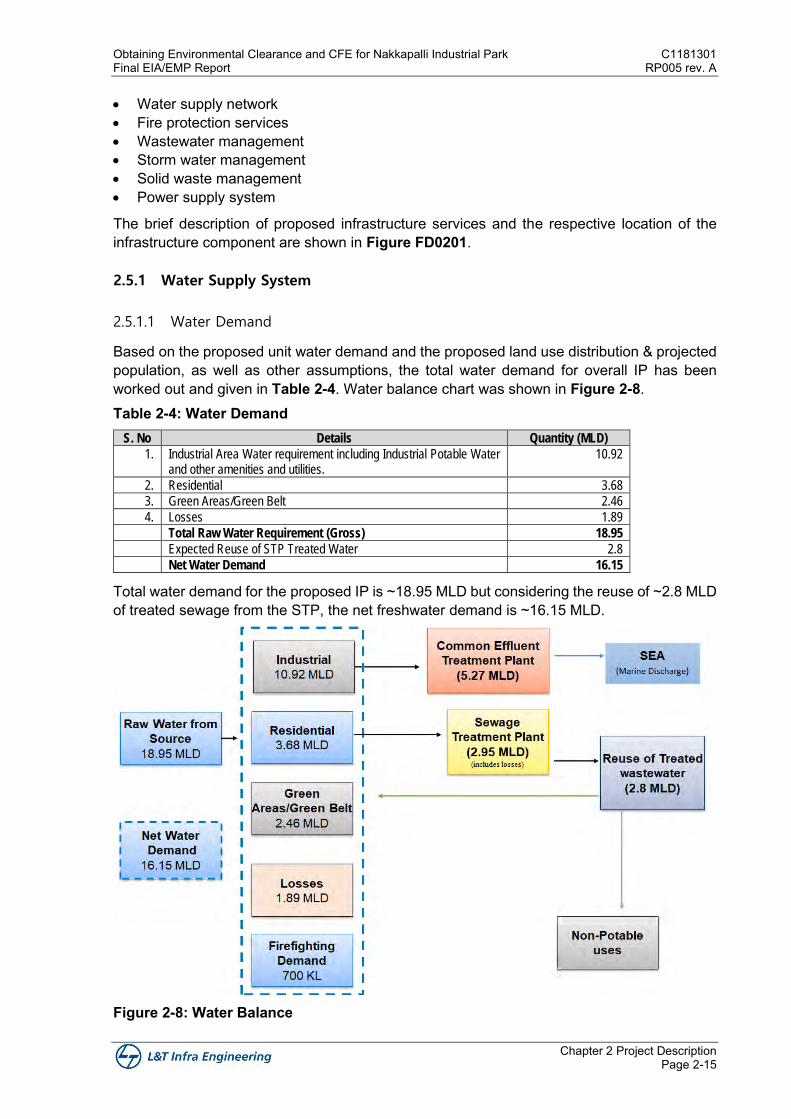
Obtaining Environmental Clearance and CFE for Nakkapalli Industrial Park C1181301 Final EIA/EMP Report RP005 rev. A
Chapter 2 Project Description Page 2-15
• Water supply network • Fire protection services • Wastewater management • Storm water management • Solid waste management • Power supply system
The brief description of proposed infrastructure services and the respective location of the infrastructure component are shown in Figure FD0201.
2.5.1 Water Supply System
2.5.1.1 Water Demand
Based on the proposed unit water demand and the proposed land use distribution & projected population, as well as other assumptions, the total water demand for overall IP has been worked out and given in Table 2-4. Water balance chart was shown in Figure 2-8. Table 2-4: Water Demand
S. No Details Quantity (MLD)
1. Industrial Area Water requirement including Industrial Potable Water and other amenities and utilities.
10.92
2. Residential 3.68
3. Green Areas/Green Belt 2.46
4. Losses 1.89
Total Raw Water Requirement (Gross) 18.95
Expected Reuse of STP Treated Water 2.8
Net Water Demand 16.15
Total water demand for the proposed IP is ~18.95 MLD but considering the reuse of ~2.8 MLD of treated sewage from the STP, the net freshwater demand is ~16.15 MLD.
Figure 2-8: Water Balance
C1181301 Obtaining Environmental Clearance and CFE for Nakkapalli Industrial Park RP005 rev. A Final EIA/EMP Report
Chapter 2 Project Description Page 2-16
2.5.1.2 Water Source
The water demand for the proposed industrial park will be met from the Yeleru Left Main Canal (YLMC) located north to site is the main source of raw water. YLMC is at a distance of ~38.5 km north of the site. This shall be conveyed to water treatment plant proposed in the project site.
It is proposed to use the RoW of existing road network for accommodating the pumping main from Yendapalli to the project site. The pumping main alignment runs along the SH158 (between Yendapalli and Adda Road Junction on NH 16), NH 16 (from Adda Road Jn. to Kagitha) and along the Greenfield Road from Kagitha to IP Nakkapalli. In addition the desalination plant is being conceptualized by GoAP in Near future will also serve as a source.
2.5.1.3 Water Supply System
The schematic flow diagram for developing the water supply system is represented below in Figure 2-9.
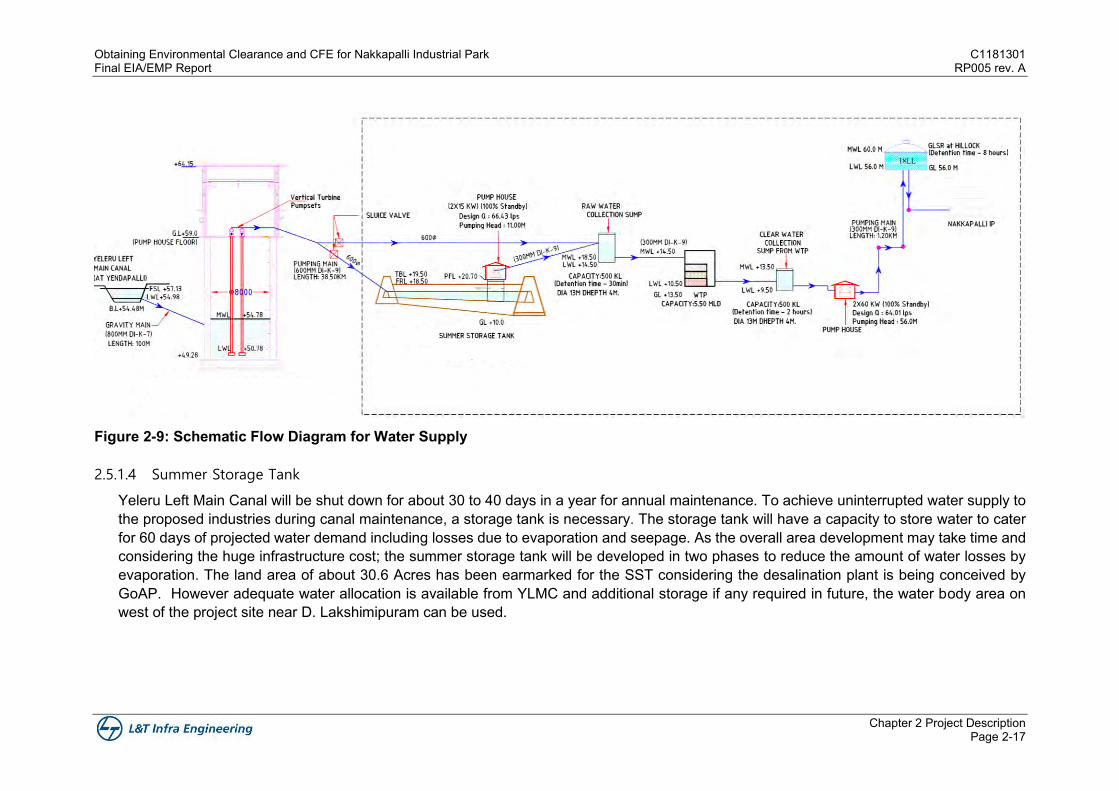
Obtaining Environmental Clearance and CFE for Nakkapalli Industrial Park C1181301 Final EIA/EMP Report RP005 rev. A
Chapter 2 Project Description Page 2-17
Figure 2-9: Schematic Flow Diagram for Water Supply
2.5.1.4 Summer Storage Tank
Yeleru Left Main Canal will be shut down for about 30 to 40 days in a year for annual maintenance. To achieve uninterrupted water supply to the proposed industries during canal maintenance, a storage tank is necessary. The storage tank will have a capacity to store water to cater for 60 days of projected water demand including losses due to evaporation and seepage. As the overall area development may take time and considering the huge infrastructure cost; the summer storage tank will be developed in two phases to reduce the amount of water losses by evaporation. The land area of about 30.6 Acres has been earmarked for the SST considering the desalination plant is being conceived by GoAP. However adequate water allocation is available from YLMC and additional storage if any required in future, the water body area on west of the project site near D. Lakshimipuram can be used.
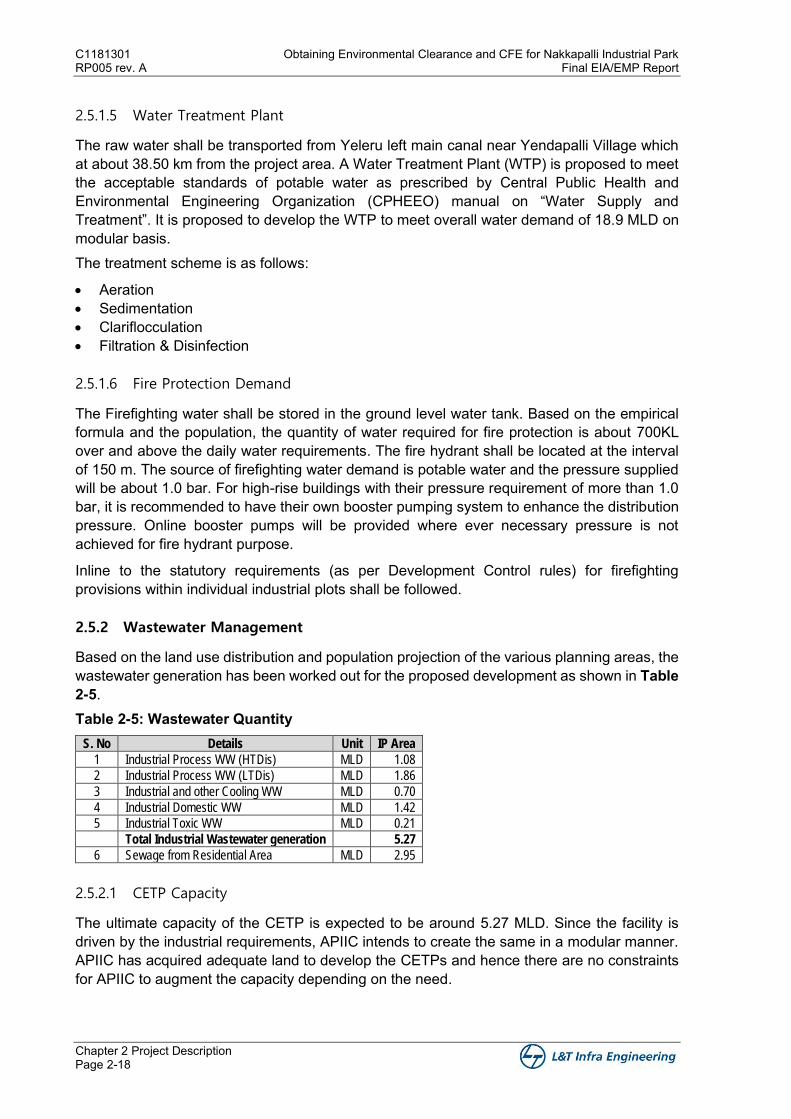
C1181301 Obtaining Environmental Clearance and CFE for Nakkapalli Industrial Park RP005 rev. A Final EIA/EMP Report
Chapter 2 Project Description Page 2-18
2.5.1.5 Water Treatment Plant
The raw water shall be transported from Yeleru left main canal near Yendapalli Village which at about 38.50 km from the project area. A Water Treatment Plant (WTP) is proposed to meet the acceptable standards of potable water as prescribed by Central Public Health and Environmental Engineering Organization (CPHEEO) manual on “Water Supply and Treatment”. It is proposed to develop the WTP to meet overall water demand of 18.9 MLD on modular basis. The treatment scheme is as follows:
• Aeration • Sedimentation • Clariflocculation • Filtration & Disinfection
2.5.1.6 Fire Protection Demand
The Firefighting water shall be stored in the ground level water tank. Based on the empirical formula and the population, the quantity of water required for fire protection is about 700KL over and above the daily water requirements. The fire hydrant shall be located at the interval of 150 m. The source of firefighting water demand is potable water and the pressure supplied will be about 1.0 bar. For high-rise buildings with their pressure requirement of more than 1.0 bar, it is recommended to have their own booster pumping system to enhance the distribution pressure. Online booster pumps will be provided where ever necessary pressure is not achieved for fire hydrant purpose.
Inline to the statutory requirements (as per Development Control rules) for firefighting provisions within individual industrial plots shall be followed.
2.5.2 Wastewater Management
Based on the land use distribution and population projection of the various planning areas, the wastewater generation has been worked out for the proposed development as shown in Table 2-5. Table 2-5: Wastewater Quantity
S. No Details Unit IP Area
1 Industrial Process WW (HTDis) MLD 1.08
2 Industrial Process WW (LTDis) MLD 1.86
3 Industrial and other Cooling WW MLD 0.70
4 Industrial Domestic WW MLD 1.42
5 Industrial Toxic WW MLD 0.21
Total Industrial Wastewater generation 5.27
6 Sewage from Residential Area MLD 2.95
2.5.2.1 CETP Capacity
The ultimate capacity of the CETP is expected to be around 5.27 MLD. Since the facility is driven by the industrial requirements, APIIC intends to create the same in a modular manner. APIIC has acquired adequate land to develop the CETPs and hence there are no constraints for APIIC to augment the capacity depending on the need.
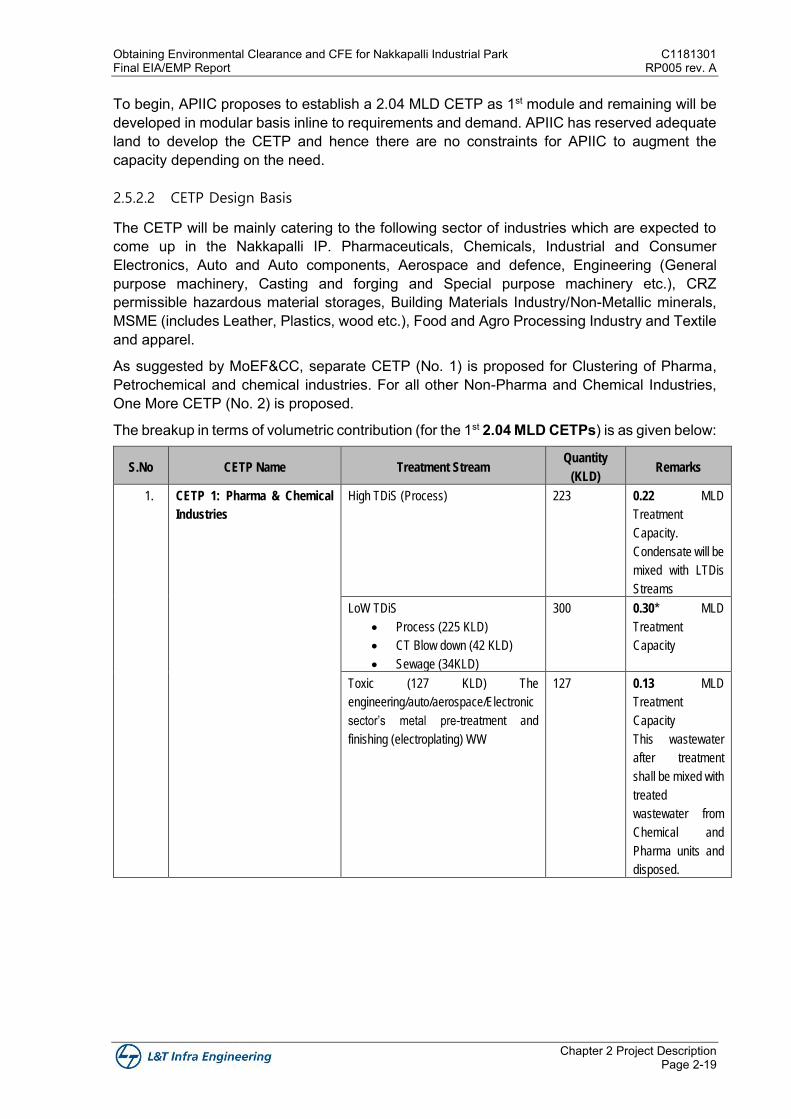
Obtaining Environmental Clearance and CFE for Nakkapalli Industrial Park C1181301 Final EIA/EMP Report RP005 rev. A
Chapter 2 Project Description Page 2-19
To begin, APIIC proposes to establish a 2.04 MLD CETP as 1st module and remaining will be developed in modular basis inline to requirements and demand. APIIC has reserved adequate land to develop the CETP and hence there are no constraints for APIIC to augment the capacity depending on the need.
2.5.2.2 CETP Design Basis
The CETP will be mainly catering to the following sector of industries which are expected to come up in the Nakkapalli IP. Pharmaceuticals, Chemicals, Industrial and Consumer Electronics, Auto and Auto components, Aerospace and defence, Engineering (General purpose machinery, Casting and forging and Special purpose machinery etc.), CRZ permissible hazardous material storages, Building Materials Industry/Non-Metallic minerals, MSME (includes Leather, Plastics, wood etc.), Food and Agro Processing Industry and Textile and apparel.
As suggested by MoEF&CC, separate CETP (No. 1) is proposed for Clustering of Pharma, Petrochemical and chemical industries. For all other Non-Pharma and Chemical Industries, One More CETP (No. 2) is proposed.
The breakup in terms of volumetric contribution (for the 1st 2.04 MLD CETPs) is as given below:
S.No CETP Name Treatment Stream Quantity
(KLD) Remarks
1. CETP 1: Pharma & Chemical
Industries
High TDiS (Process) 223 0.22 MLD
Treatment
Capacity.
Condensate will be
mixed with LTDis
Streams
LoW TDiS
• Process (225 KLD)
• CT Blow down (42 KLD)
• Sewage (34KLD)
300 0.30* MLD
Treatment
Capacity
Toxic (127 KLD) The
engineering/auto/aerospace/Electronic
sector’s metal pre-treatment and
finishing (electroplating) WW
127 0.13 MLD
Treatment
Capacity
This wastewater
after treatment
shall be mixed with
treated
wastewater from
Chemical and
Pharma units and
disposed.
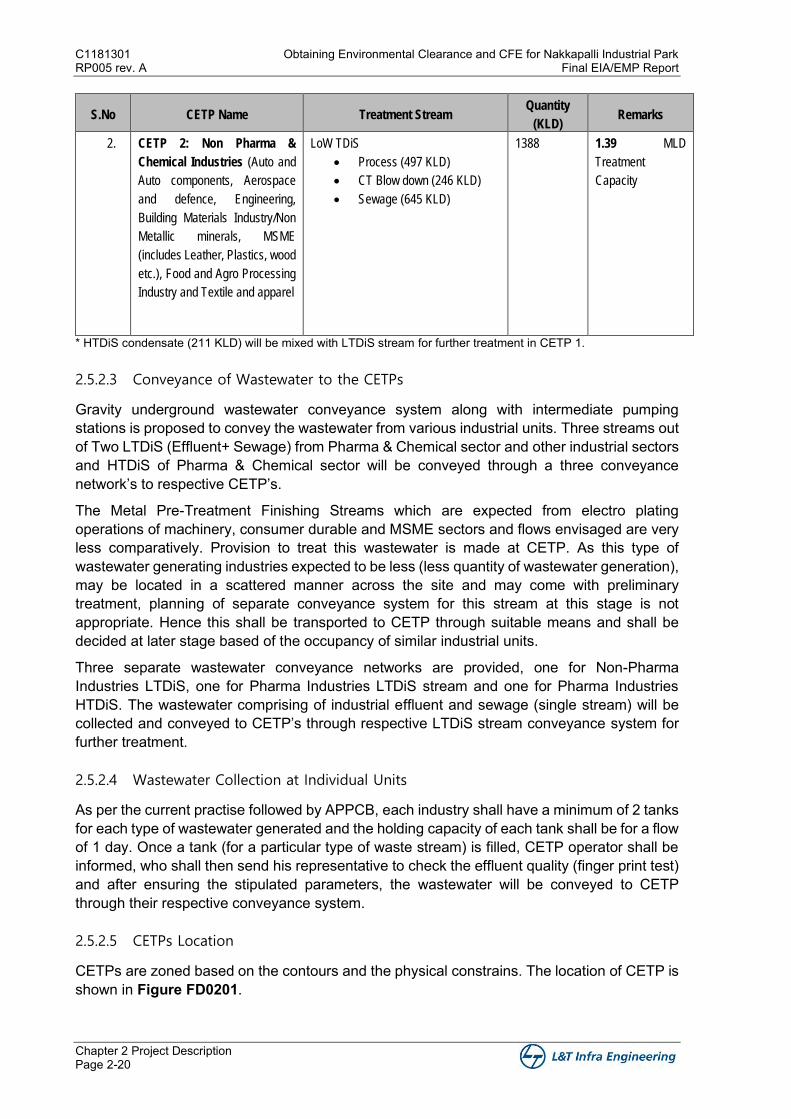
C1181301 Obtaining Environmental Clearance and CFE for Nakkapalli Industrial Park RP005 rev. A Final EIA/EMP Report
Chapter 2 Project Description Page 2-20
S.No CETP Name Treatment Stream Quantity
(KLD) Remarks
2. CETP 2: Non Pharma &
Chemical Industries (Auto and
Auto components, Aerospace
and defence, Engineering,
Building Materials Industry/Non
Metallic minerals, MSME
(includes Leather, Plastics, wood
etc.), Food and Agro Processing
Industry and Textile and apparel
LoW TDiS
• Process (497 KLD)
• CT Blow down (246 KLD)
• Sewage (645 KLD)
1388 1.39 MLD
Treatment
Capacity
* HTDiS condensate (211 KLD) will be mixed with LTDiS stream for further treatment in CETP 1.
2.5.2.3 Conveyance of Wastewater to the CETPs
Gravity underground wastewater conveyance system along with intermediate pumping stations is proposed to convey the wastewater from various industrial units. Three streams out of Two LTDiS (Effluent+ Sewage) from Pharma & Chemical sector and other industrial sectors and HTDiS of Pharma & Chemical sector will be conveyed through a three conveyance network’s to respective CETP’s.
The Metal Pre-Treatment Finishing Streams which are expected from electro plating operations of machinery, consumer durable and MSME sectors and flows envisaged are very less comparatively. Provision to treat this wastewater is made at CETP. As this type of wastewater generating industries expected to be less (less quantity of wastewater generation), may be located in a scattered manner across the site and may come with preliminary treatment, planning of separate conveyance system for this stream at this stage is not appropriate. Hence this shall be transported to CETP through suitable means and shall be decided at later stage based of the occupancy of similar industrial units.
Three separate wastewater conveyance networks are provided, one for Non-Pharma Industries LTDiS, one for Pharma Industries LTDiS stream and one for Pharma Industries HTDiS. The wastewater comprising of industrial effluent and sewage (single stream) will be collected and conveyed to CETP’s through respective LTDiS stream conveyance system for further treatment.
2.5.2.4 Wastewater Collection at Individual Units
As per the current practise followed by APPCB, each industry shall have a minimum of 2 tanks for each type of wastewater generated and the holding capacity of each tank shall be for a flow of 1 day. Once a tank (for a particular type of waste stream) is filled, CETP operator shall be informed, who shall then send his representative to check the effluent quality (finger print test) and after ensuring the stipulated parameters, the wastewater will be conveyed to CETP through their respective conveyance system.
2.5.2.5 CETPs Location
CETPs are zoned based on the contours and the physical constrains. The location of CETP is shown in Figure FD0201.
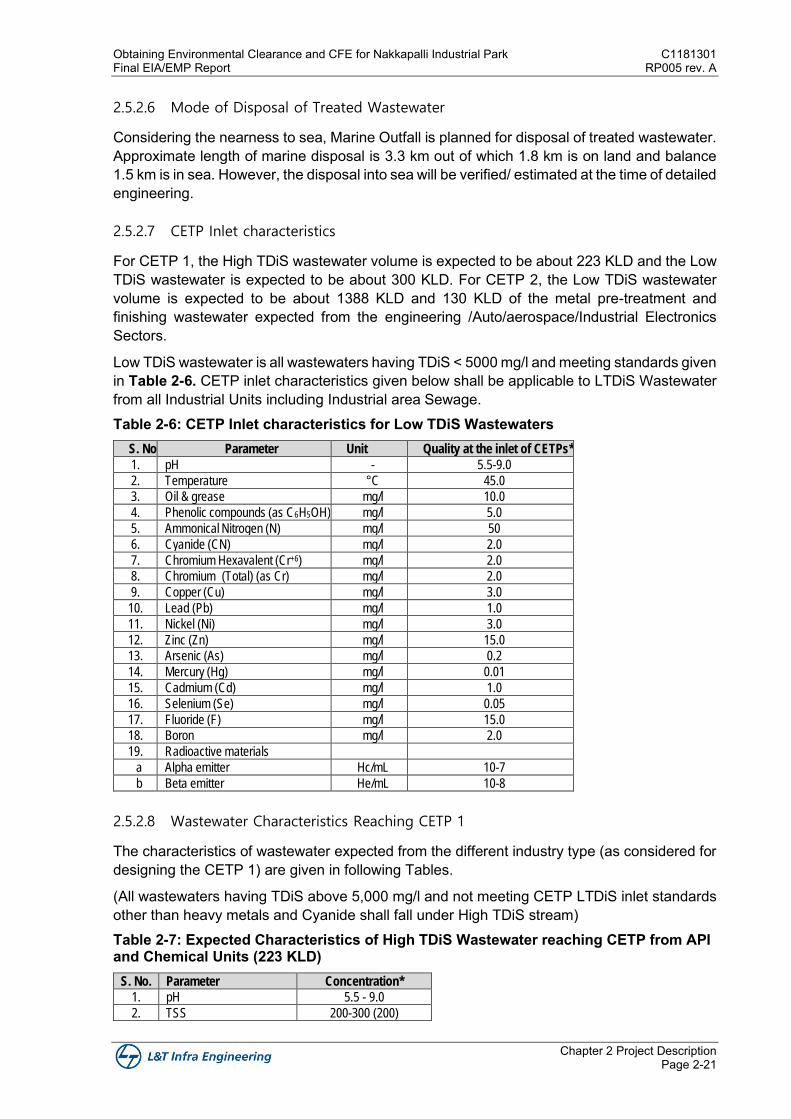
Obtaining Environmental Clearance and CFE for Nakkapalli Industrial Park C1181301 Final EIA/EMP Report RP005 rev. A
Chapter 2 Project Description Page 2-21
2.5.2.6 Mode of Disposal of Treated Wastewater
Considering the nearness to sea, Marine Outfall is planned for disposal of treated wastewater. Approximate length of marine disposal is 3.3 km out of which 1.8 km is on land and balance 1.5 km is in sea. However, the disposal into sea will be verified/ estimated at the time of detailed engineering.
2.5.2.7 CETP Inlet characteristics
For CETP 1, the High TDiS wastewater volume is expected to be about 223 KLD and the Low TDiS wastewater is expected to be about 300 KLD. For CETP 2, the Low TDiS wastewater volume is expected to be about 1388 KLD and 130 KLD of the metal pre-treatment and finishing wastewater expected from the engineering /Auto/aerospace/Industrial Electronics Sectors.
Low TDiS wastewater is all wastewaters having TDiS < 5000 mg/l and meeting standards given in Table 2-6. CETP inlet characteristics given below shall be applicable to LTDiS Wastewater from all Industrial Units including Industrial area Sewage. Table 2-6: CETP Inlet characteristics for Low TDiS Wastewaters
S. No Parameter Unit Quality at the inlet of CETPs*
1. pH - 5.5-9.0
2. Temperature °C 45.0
3. Oil & grease mg/l 10.0
4. Phenolic compounds (as C6H5OH) mg/l 5.0
5. Ammonical Nitrogen (N) mg/l 50
6. Cyanide (CN) mg/l 2.0
7. Chromium Hexavalent (Cr+6) mg/l 2.0
8. Chromium (Total) (as Cr) mg/l 2.0
9. Copper (Cu) mg/l 3.0
10. Lead (Pb) mg/l 1.0
11. Nickel (Ni) mg/l 3.0
12. Zinc (Zn) mg/l 15.0
13. Arsenic (As) mg/l 0.2
14. Mercury (Hg) mg/l 0.01
15. Cadmium (Cd) mg/l 1.0
16. Selenium (Se) mg/l 0.05
17. Fluoride (F) mg/l 15.0
18. Boron mg/l 2.0
19. Radioactive materials
a Alpha emitter Hc/mL 10-7
b Beta emitter He/mL 10-8
2.5.2.8 Wastewater Characteristics Reaching CETP 1
The characteristics of wastewater expected from the different industry type (as considered for designing the CETP 1) are given in following Tables.
(All wastewaters having TDiS above 5,000 mg/l and not meeting CETP LTDiS inlet standards other than heavy metals and Cyanide shall fall under High TDiS stream) Table 2-7: Expected Characteristics of High TDiS Wastewater reaching CETP from API and Chemical Units (223 KLD)
S. No. Parameter Concentration*
1. pH 5.5 - 9.0
2. TSS 200-300 (200)
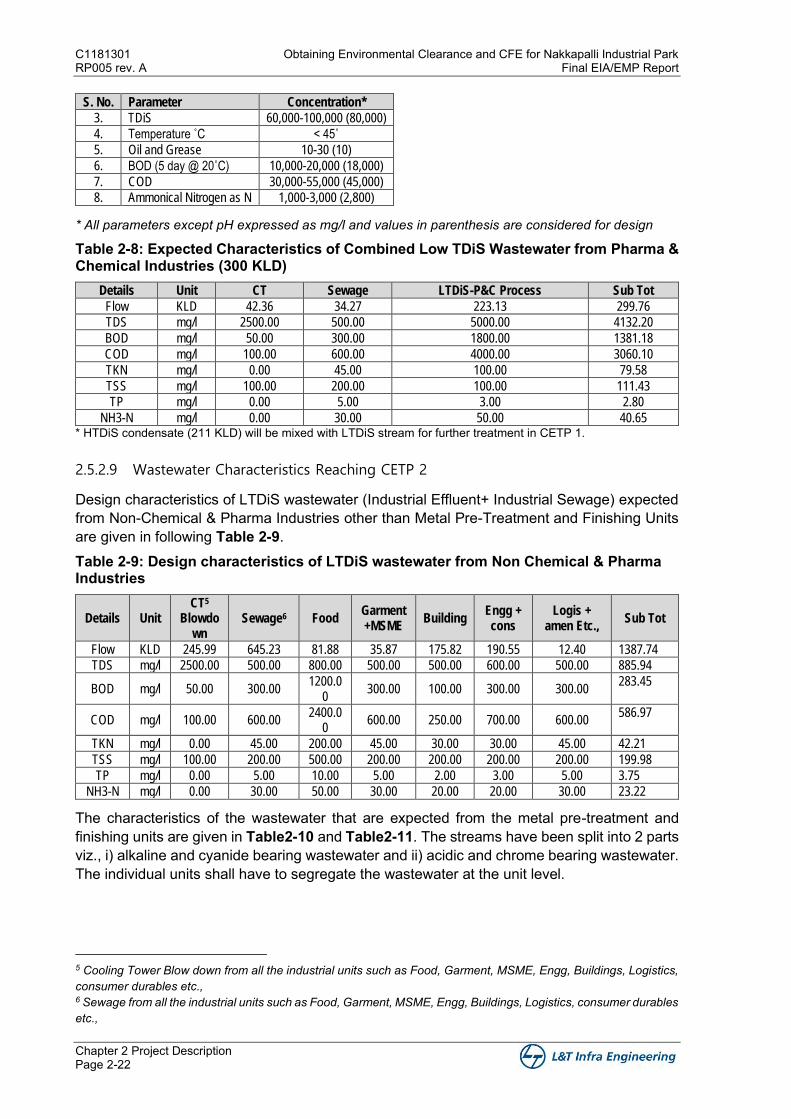
C1181301 Obtaining Environmental Clearance and CFE for Nakkapalli Industrial Park RP005 rev. A Final EIA/EMP Report
Chapter 2 Project Description Page 2-22
S. No. Parameter Concentration*
3. TDiS 60,000-100,000 (80,000)
4. Temperature ˚C < 45˚
5. Oil and Grease 10-30 (10)
6. BOD (5 day @ 20˚C) 10,000-20,000 (18,000)
7. COD 30,000-55,000 (45,000)
8. Ammonical Nitrogen as N 1,000-3,000 (2,800)
* All parameters except pH expressed as mg/l and values in parenthesis are considered for design
Table 2-8: Expected Characteristics of Combined Low TDiS Wastewater from Pharma & Chemical Industries (300 KLD)
Details Unit CT Sewage LTDiS-P&C Process Sub Tot
Flow KLD 42.36 34.27 223.13 299.76
TDS mg/l 2500.00 500.00 5000.00 4132.20
BOD mg/l 50.00 300.00 1800.00 1381.18
COD mg/l 100.00 600.00 4000.00 3060.10
TKN mg/l 0.00 45.00 100.00 79.58
TSS mg/l 100.00 200.00 100.00 111.43
TP mg/l 0.00 5.00 3.00 2.80
NH3-N mg/l 0.00 30.00 50.00 40.65 * HTDiS condensate (211 KLD) will be mixed with LTDiS stream for further treatment in CETP 1.
2.5.2.9 Wastewater Characteristics Reaching CETP 2
Design characteristics of LTDiS wastewater (Industrial Effluent+ Industrial Sewage) expected from Non-Chemical & Pharma Industries other than Metal Pre-Treatment and Finishing Units are given in following Table 2-9. Table 2-9: Design characteristics of LTDiS wastewater from Non Chemical & Pharma Industries
Details Unit CT5
Blowdown
Sewage6 Food Garment +MSME
Building Engg + cons
Logis + amen Etc.,
Sub Tot
Flow KLD 245.99 645.23 81.88 35.87 175.82 190.55 12.40 1387.74
TDS mg/l 2500.00 500.00 800.00 500.00 500.00 600.00 500.00 885.94
BOD mg/l 50.00 300.00 1200.0
0 300.00 100.00 300.00 300.00
283.45
COD mg/l 100.00 600.00 2400.0
0 600.00 250.00 700.00 600.00
586.97
TKN mg/l 0.00 45.00 200.00 45.00 30.00 30.00 45.00 42.21
TSS mg/l 100.00 200.00 500.00 200.00 200.00 200.00 200.00 199.98
TP mg/l 0.00 5.00 10.00 5.00 2.00 3.00 5.00 3.75
NH3-N mg/l 0.00 30.00 50.00 30.00 20.00 20.00 30.00 23.22
The characteristics of the wastewater that are expected from the metal pre-treatment and finishing units are given in Table2-10 and Table2-11. The streams have been split into 2 parts viz., i) alkaline and cyanide bearing wastewater and ii) acidic and chrome bearing wastewater. The individual units shall have to segregate the wastewater at the unit level.
5 Cooling Tower Blow down from all the industrial units such as Food, Garment, MSME, Engg, Buildings, Logistics, consumer durables etc., 6 Sewage from all the industrial units such as Food, Garment, MSME, Engg, Buildings, Logistics, consumer durables etc.,
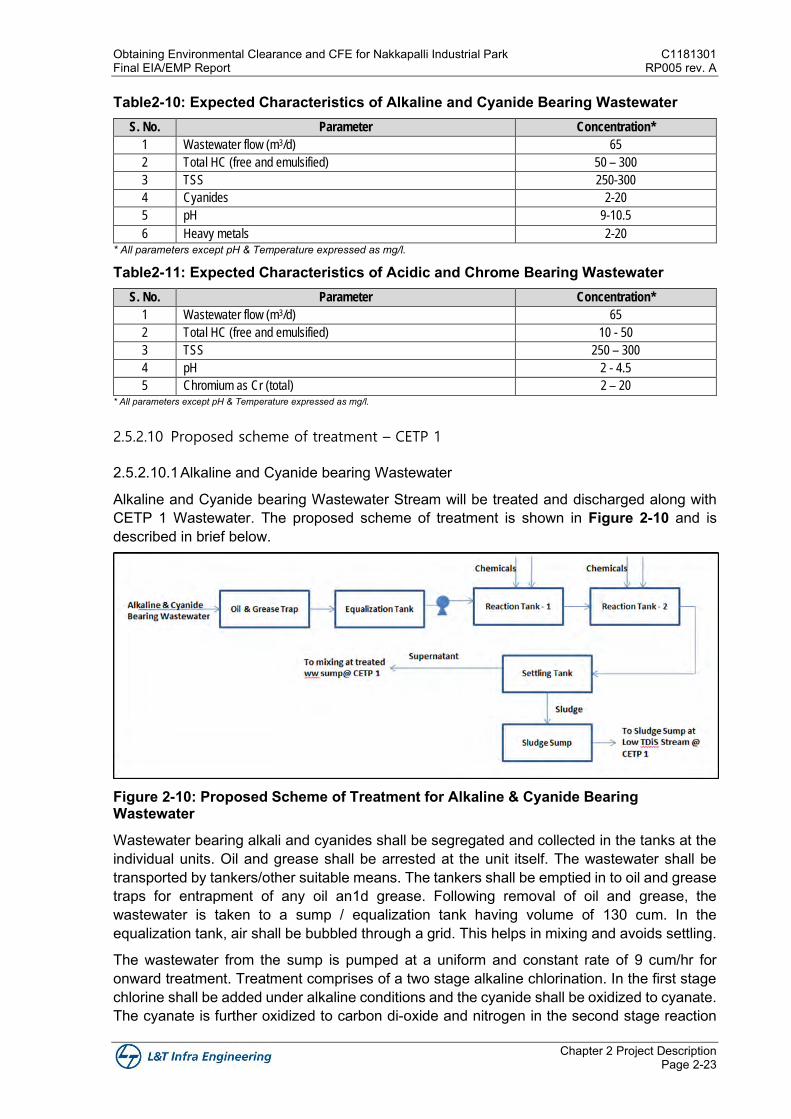
Obtaining Environmental Clearance and CFE for Nakkapalli Industrial Park C1181301 Final EIA/EMP Report RP005 rev. A
Chapter 2 Project Description Page 2-23
Table2-10: Expected Characteristics of Alkaline and Cyanide Bearing Wastewater S. No. Parameter Concentration*
1 Wastewater flow (m3/d) 65
2 Total HC (free and emulsified) 50 – 300
3 TSS 250-300
4 Cyanides 2-20
5 pH 9-10.5
6 Heavy metals 2-20 * All parameters except pH & Temperature expressed as mg/l.
Table2-11: Expected Characteristics of Acidic and Chrome Bearing Wastewater S. No. Parameter Concentration*
1 Wastewater flow (m3/d) 65
2 Total HC (free and emulsified) 10 - 50
3 TSS 250 – 300
4 pH 2 - 4.5
5 Chromium as Cr (total) 2 – 20 * All parameters except pH & Temperature expressed as mg/l.
2.5.2.10 Proposed scheme of treatment – CETP 1
2.5.2.10.1 Alkaline and Cyanide bearing Wastewater
Alkaline and Cyanide bearing Wastewater Stream will be treated and discharged along with CETP 1 Wastewater. The proposed scheme of treatment is shown in Figure 2-10 and is described in brief below.
Figure 2-10: Proposed Scheme of Treatment for Alkaline & Cyanide Bearing Wastewater
Wastewater bearing alkali and cyanides shall be segregated and collected in the tanks at the individual units. Oil and grease shall be arrested at the unit itself. The wastewater shall be transported by tankers/other suitable means. The tankers shall be emptied in to oil and grease traps for entrapment of any oil an1d grease. Following removal of oil and grease, the wastewater is taken to a sump / equalization tank having volume of 130 cum. In the equalization tank, air shall be bubbled through a grid. This helps in mixing and avoids settling.
The wastewater from the sump is pumped at a uniform and constant rate of 9 cum/hr for onward treatment. Treatment comprises of a two stage alkaline chlorination. In the first stage chlorine shall be added under alkaline conditions and the cyanide shall be oxidized to cyanate. The cyanate is further oxidized to carbon di-oxide and nitrogen in the second stage reaction
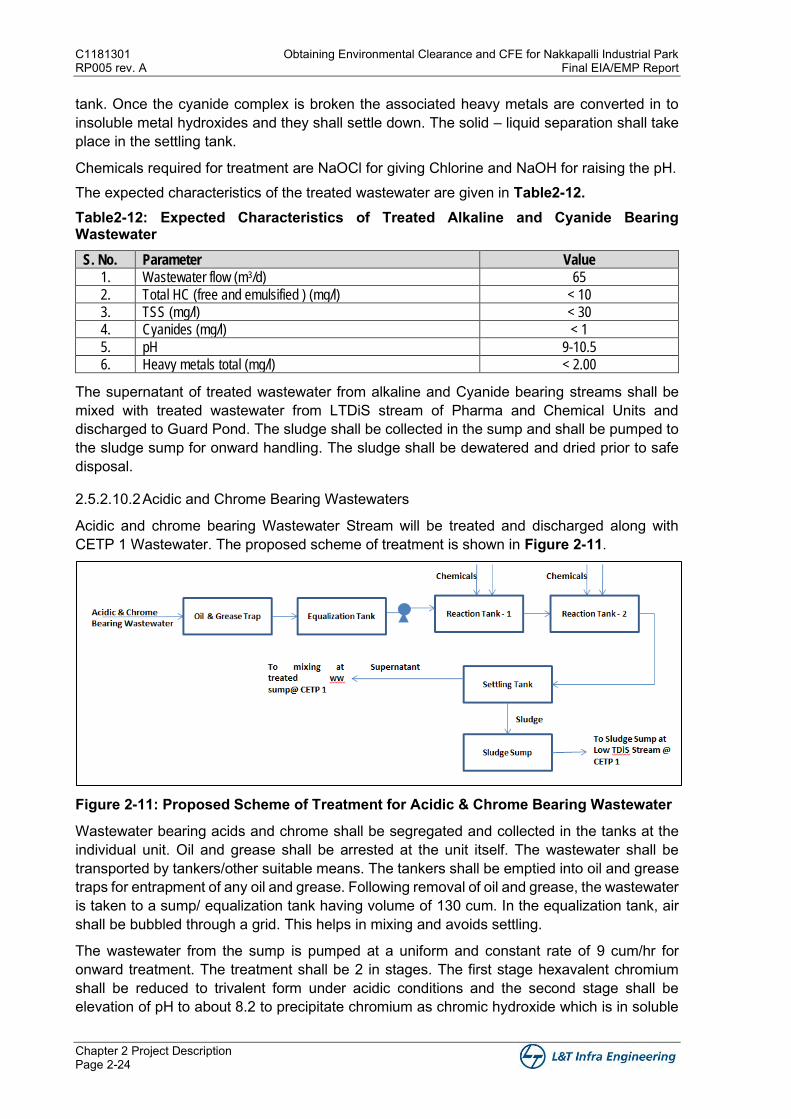
C1181301 Obtaining Environmental Clearance and CFE for Nakkapalli Industrial Park RP005 rev. A Final EIA/EMP Report
Chapter 2 Project Description Page 2-24
tank. Once the cyanide complex is broken the associated heavy metals are converted in to insoluble metal hydroxides and they shall settle down. The solid – liquid separation shall take place in the settling tank.
Chemicals required for treatment are NaOCl for giving Chlorine and NaOH for raising the pH. The expected characteristics of the treated wastewater are given in Table2-12. Table2-12: Expected Characteristics of Treated Alkaline and Cyanide Bearing Wastewater
S. No. Parameter Value
1. Wastewater flow (m3/d) 65
2. Total HC (free and emulsified ) (mg/l) < 10
3. TSS (mg/l) < 30
4. Cyanides (mg/l) < 1
5. pH 9-10.5
6. Heavy metals total (mg/l) < 2.00
The supernatant of treated wastewater from alkaline and Cyanide bearing streams shall be mixed with treated wastewater from LTDiS stream of Pharma and Chemical Units and discharged to Guard Pond. The sludge shall be collected in the sump and shall be pumped to the sludge sump for onward handling. The sludge shall be dewatered and dried prior to safe disposal.
2.5.2.10.2 Acidic and Chrome Bearing Wastewaters
Acidic and chrome bearing Wastewater Stream will be treated and discharged along with CETP 1 Wastewater. The proposed scheme of treatment is shown in Figure 2-11.
Figure 2-11: Proposed Scheme of Treatment for Acidic & Chrome Bearing Wastewater
Wastewater bearing acids and chrome shall be segregated and collected in the tanks at the individual unit. Oil and grease shall be arrested at the unit itself. The wastewater shall be transported by tankers/other suitable means. The tankers shall be emptied into oil and grease traps for entrapment of any oil and grease. Following removal of oil and grease, the wastewater is taken to a sump/ equalization tank having volume of 130 cum. In the equalization tank, air shall be bubbled through a grid. This helps in mixing and avoids settling.
The wastewater from the sump is pumped at a uniform and constant rate of 9 cum/hr for onward treatment. The treatment shall be 2 in stages. The first stage hexavalent chromium shall be reduced to trivalent form under acidic conditions and the second stage shall be elevation of pH to about 8.2 to precipitate chromium as chromic hydroxide which is in soluble
Obtaining Environmental Clearance and CFE for Nakkapalli Industrial Park C1181301 Final EIA/EMP Report RP005 rev. A
Chapter 2 Project Description Page 2-25
and shall settle down. The solid – liquid separation shall take place in the settling tank. The expected characteristics of the treated wastewater are given in Table2-13.
Chemicals required are H2SO4, Sodium Meta bisulphite for Chromium reduction and lime for elevating pH.
The supernatant of treated wastewater from Acidic & Chrome Bearing streams shall be mixed with treated wastewater from LTDiS stream of Pharma and Chemical Units and discharged to Guard Pond. The sludge shall be collected in the sump and shall be pumped to the sludge sump for onward handling. The sludge shall be dewatered and dried prior to safe disposal to nearby TSDF located at Vishakhapatnam (M/s.Coastal Waste Management Project, JNPC, Parawada, Vishakapatnam, A.P) which is around 60 km from Nakkapalli. Table2-13: Expected Characteristics of Treated Acidic and Chrome Bearing Wastewater
S. No. Parameter Value
1. Wastewater flow ( m3/d) 65
2. Total HC ( free and emulsified ) (mg/l) < 10
3. TSS (mg/l) < 30
4. Chromium as Cr (total) (mg/l) < 1
5. pH 8-8.5
2.5.2.10.3 High TDiS Wastewaters Stream of CETP 1
The proposed scheme of treatment for the high TDiS wastewater is depicted in Figure 2-12. The total waste flow (high TDIS) shall be about 223 KLD. Initially, the HTDiS wastewater generated from the industries shall be transported to the CETP by tankers. The tankers shall empty the HTDiS wastewater into the screen chamber where the screens shall retain the coarse matter. The screens are manual type and are to be cleaned at regular intervals. Screens provided in this case are coarse screen followed by fine screens. The screened wastewater shall be taken to a sump. From the sump the wastewater shall be pumped to grit trap followed by an oil and grease trap for retaining floatables. The wastewater is then led to an equalization tank for balancing the waste flow rate and characteristics. Two numbers of equalization tanks are proposed. In the equalization tanks mixers shall be provided to obtain uniform characteristics of the wastewater.
Neutralization of the wastewater shall be done in the equalization tank itself by adding caustic lye or sulphuric acid as the case may be. The HTDiS wastewaters shall be pumped from the equalization tank at a constant and uniform rate of 12 m3/hr for onward treatment. For primary treatment of the HTDiS wastewater there shall be one stream operating @ 12.0 m3/hr.
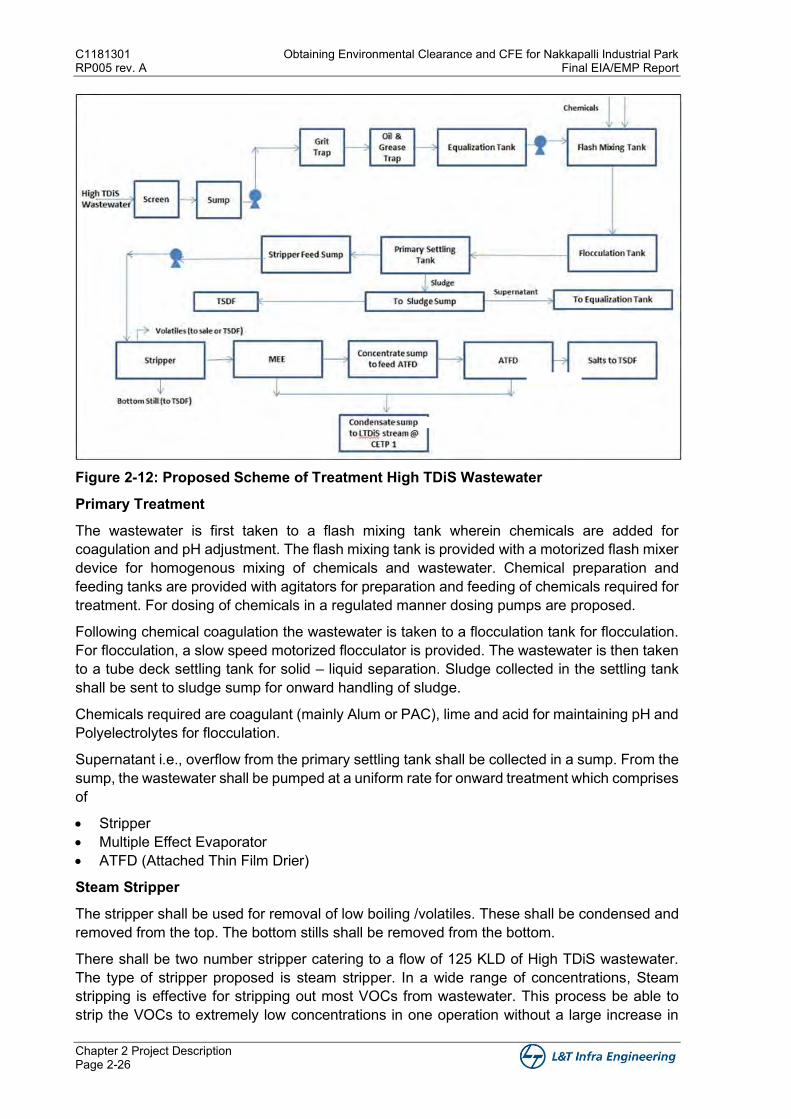
C1181301 Obtaining Environmental Clearance and CFE for Nakkapalli Industrial Park RP005 rev. A Final EIA/EMP Report
Chapter 2 Project Description Page 2-26
Figure 2-12: Proposed Scheme of Treatment High TDiS Wastewater
Primary Treatment
The wastewater is first taken to a flash mixing tank wherein chemicals are added for coagulation and pH adjustment. The flash mixing tank is provided with a motorized flash mixer device for homogenous mixing of chemicals and wastewater. Chemical preparation and feeding tanks are provided with agitators for preparation and feeding of chemicals required for treatment. For dosing of chemicals in a regulated manner dosing pumps are proposed.
Following chemical coagulation the wastewater is taken to a flocculation tank for flocculation. For flocculation, a slow speed motorized flocculator is provided. The wastewater is then taken to a tube deck settling tank for solid – liquid separation. Sludge collected in the settling tank shall be sent to sludge sump for onward handling of sludge.
Chemicals required are coagulant (mainly Alum or PAC), lime and acid for maintaining pH and Polyelectrolytes for flocculation.
Supernatant i.e., overflow from the primary settling tank shall be collected in a sump. From the sump, the wastewater shall be pumped at a uniform rate for onward treatment which comprises of
• Stripper • Multiple Effect Evaporator • ATFD (Attached Thin Film Drier)
Steam Stripper
The stripper shall be used for removal of low boiling /volatiles. These shall be condensed and removed from the top. The bottom stills shall be removed from the bottom.
There shall be two number stripper catering to a flow of 125 KLD of High TDiS wastewater. The type of stripper proposed is steam stripper. In a wide range of concentrations, Steam stripping is effective for stripping out most VOCs from wastewater. This process be able to strip the VOCs to extremely low concentrations in one operation without a large increase in
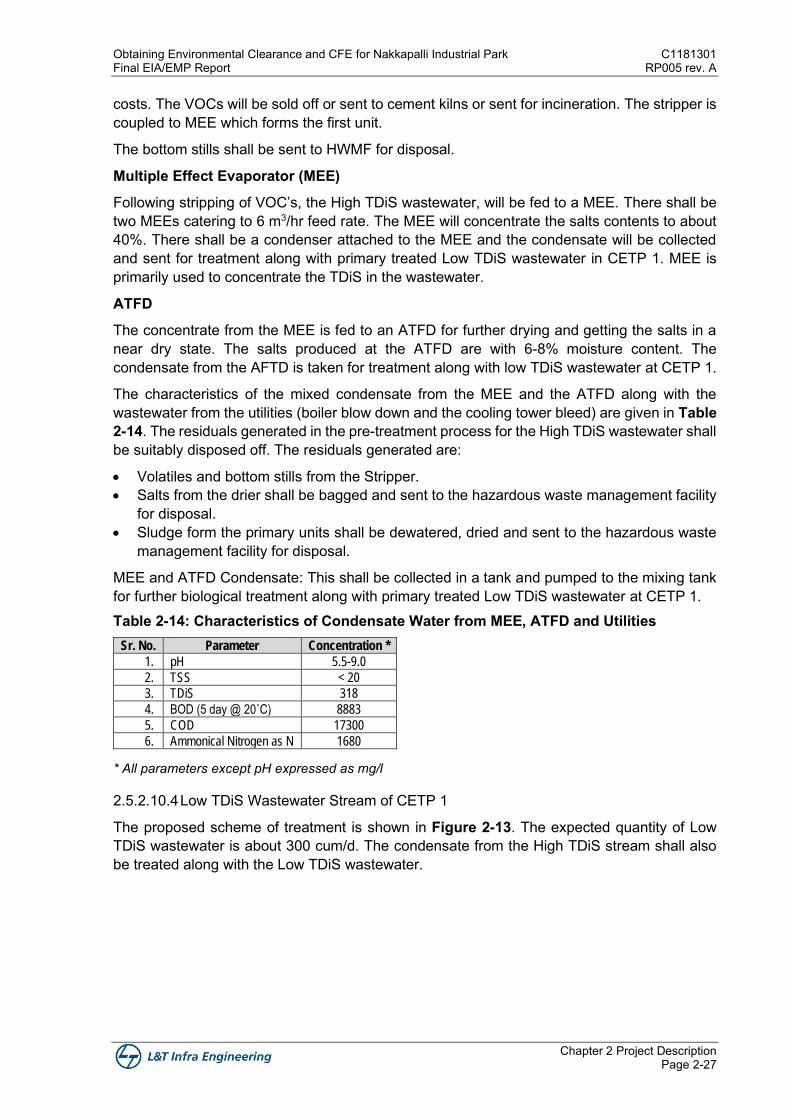
Obtaining Environmental Clearance and CFE for Nakkapalli Industrial Park C1181301 Final EIA/EMP Report RP005 rev. A
Chapter 2 Project Description Page 2-27
costs. The VOCs will be sold off or sent to cement kilns or sent for incineration. The stripper is coupled to MEE which forms the first unit.
The bottom stills shall be sent to HWMF for disposal.
Multiple Effect Evaporator (MEE)
Following stripping of VOC’s, the High TDiS wastewater, will be fed to a MEE. There shall be two MEEs catering to 6 m3/hr feed rate. The MEE will concentrate the salts contents to about 40%. There shall be a condenser attached to the MEE and the condensate will be collected and sent for treatment along with primary treated Low TDiS wastewater in CETP 1. MEE is primarily used to concentrate the TDiS in the wastewater.
ATFD
The concentrate from the MEE is fed to an ATFD for further drying and getting the salts in a near dry state. The salts produced at the ATFD are with 6-8% moisture content. The condensate from the AFTD is taken for treatment along with low TDiS wastewater at CETP 1.
The characteristics of the mixed condensate from the MEE and the ATFD along with the wastewater from the utilities (boiler blow down and the cooling tower bleed) are given in Table 2-14. The residuals generated in the pre-treatment process for the High TDiS wastewater shall be suitably disposed off. The residuals generated are:
• Volatiles and bottom stills from the Stripper. • Salts from the drier shall be bagged and sent to the hazardous waste management facility
for disposal. • Sludge form the primary units shall be dewatered, dried and sent to the hazardous waste
management facility for disposal.
MEE and ATFD Condensate: This shall be collected in a tank and pumped to the mixing tank for further biological treatment along with primary treated Low TDiS wastewater at CETP 1. Table 2-14: Characteristics of Condensate Water from MEE, ATFD and Utilities
Sr. No. Parameter Concentration *
1. pH 5.5-9.0
2. TSS < 20
3. TDiS 318
4. BOD (5 day @ 20˚C) 8883
5. COD 17300
6. Ammonical Nitrogen as N 1680
* All parameters except pH expressed as mg/l
2.5.2.10.4 Low TDiS Wastewater Stream of CETP 1
The proposed scheme of treatment is shown in Figure 2-13. The expected quantity of Low TDiS wastewater is about 300 cum/d. The condensate from the High TDiS stream shall also be treated along with the Low TDiS wastewater.
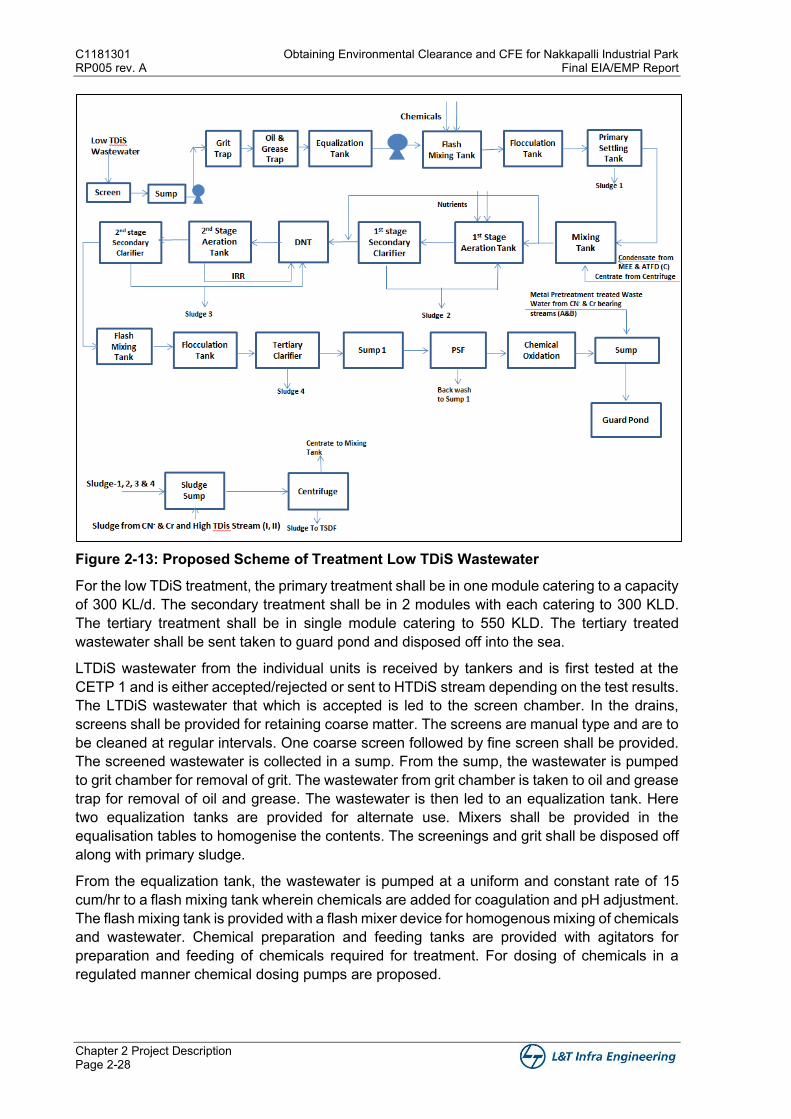
C1181301 Obtaining Environmental Clearance and CFE for Nakkapalli Industrial Park RP005 rev. A Final EIA/EMP Report
Chapter 2 Project Description Page 2-28
Figure 2-13: Proposed Scheme of Treatment Low TDiS Wastewater
For the low TDiS treatment, the primary treatment shall be in one module catering to a capacity of 300 KL/d. The secondary treatment shall be in 2 modules with each catering to 300 KLD. The tertiary treatment shall be in single module catering to 550 KLD. The tertiary treated wastewater shall be sent taken to guard pond and disposed off into the sea.
LTDiS wastewater from the individual units is received by tankers and is first tested at the CETP 1 and is either accepted/rejected or sent to HTDiS stream depending on the test results. The LTDiS wastewater that which is accepted is led to the screen chamber. In the drains, screens shall be provided for retaining coarse matter. The screens are manual type and are to be cleaned at regular intervals. One coarse screen followed by fine screen shall be provided. The screened wastewater is collected in a sump. From the sump, the wastewater is pumped to grit chamber for removal of grit. The wastewater from grit chamber is taken to oil and grease trap for removal of oil and grease. The wastewater is then led to an equalization tank. Here two equalization tanks are provided for alternate use. Mixers shall be provided in the equalisation tables to homogenise the contents. The screenings and grit shall be disposed off along with primary sludge.
From the equalization tank, the wastewater is pumped at a uniform and constant rate of 15 cum/hr to a flash mixing tank wherein chemicals are added for coagulation and pH adjustment. The flash mixing tank is provided with a flash mixer device for homogenous mixing of chemicals and wastewater. Chemical preparation and feeding tanks are provided with agitators for preparation and feeding of chemicals required for treatment. For dosing of chemicals in a regulated manner chemical dosing pumps are proposed.
Obtaining Environmental Clearance and CFE for Nakkapalli Industrial Park C1181301 Final EIA/EMP Report RP005 rev. A
Chapter 2 Project Description Page 2-29
Chemicals required are coagulant (mainly Alum or PAC), lime and acid for maintaining pH and Polyelectrolytes for flocculation.
Following mixing of chemicals and wastewater, the wastewater is taken to a flocculation chamber for flocculation. A mechanical flocculator shall be provided in the flocculation chamber. The wastewater is then subjected to solid – liquid separation in a primary clarifier tank. The sludge gets collected in the hopper bottom and shall be periodically with drain to sludge sump. The clarified water shall overflow from the tank and shall be taken to mixing tank before being subjected to secondary treatment. The expected characteristics of Low TDiS wastewater after primary treatment are given in Table 2-15. Table 2-15: Characteristics of Primary Treated Low TDiS Wastewater
Sr. No. Parameter Concentration *
1 pH 8-8.5
2 TSS 50
3 TDiS 4100
4 BOD (5 day @20˚C) 960
5 COD 1960
6 NH-3 N (mg/l) 40
(* All parameters except pH expressed as mg/l)
The condensate from high TDiS stream (about 210 KLD) from the MEE and ATFD condensate tank will be pumped to the mixing tank where it gets mixed with primary treated LTDiS wastewater. In addition, the metal pre- treated water, PSF back wash water and centrate from centrifuge will be mixed in the mixing tank. For mixing of LTDiS wastewater with others mixer shall be provided. The wastewater with mixed characteristics shall be fed to biological treatment are given in Table2-16. Table2-16: Characteristics of Combined Wastewater – Low TDiS + Condensate from High TDiS + Centrifuge Centrate and PSF Back wash water - Feed to Secondary Treatment
S. No. Parameter Concentration*
1 pH 5.5-9.0
2 TSS 30
3 TDiS 2390
4 Temperature ˚C Ambient
5 BOD (5 day @ 20˚C) 3700
6 COD 7310
7 NH3-N 630
(* All parameters except pH expressed as mg/l)
The combined wastewater shall be subjected to 2 stage biochemical oxidation and shall include Nitrification and De nitrification.
A part of the flow (about 198 m3) is fed to the 1st stage aeration tank. The aeration tank is designed to be operated as an extended aeration system. For aeration sub surface aeration is proposed. If required, phosphorus shall be supplemented to maintain BOD: P ratio of 100:1. Following aeration, the aerated liquor is taken to 1st stage secondary clarifier for Solid – Liquid separation. The sludge collected shall be recycled to aeration tank to maintain the desired MLSS concentration. Excess sludge shall be pumped to sludge sump for onward handling and disposal.
Overflow from the 1st stage secondary clarifier, 390 cum from the mixing tank, internal recirculation liquor from the second stage aeration tank and sludge from second stage
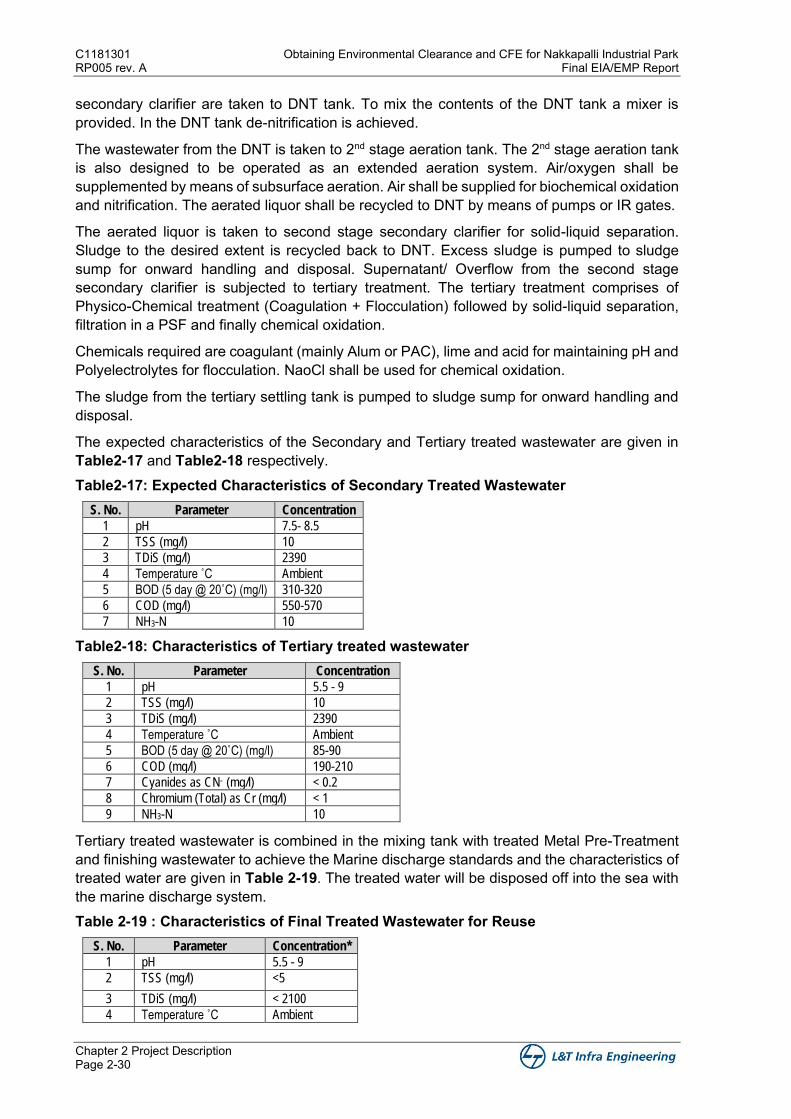
C1181301 Obtaining Environmental Clearance and CFE for Nakkapalli Industrial Park RP005 rev. A Final EIA/EMP Report
Chapter 2 Project Description Page 2-30
secondary clarifier are taken to DNT tank. To mix the contents of the DNT tank a mixer is provided. In the DNT tank de-nitrification is achieved.
The wastewater from the DNT is taken to 2nd stage aeration tank. The 2nd stage aeration tank is also designed to be operated as an extended aeration system. Air/oxygen shall be supplemented by means of subsurface aeration. Air shall be supplied for biochemical oxidation and nitrification. The aerated liquor shall be recycled to DNT by means of pumps or IR gates.
The aerated liquor is taken to second stage secondary clarifier for solid-liquid separation. Sludge to the desired extent is recycled back to DNT. Excess sludge is pumped to sludge sump for onward handling and disposal. Supernatant/ Overflow from the second stage secondary clarifier is subjected to tertiary treatment. The tertiary treatment comprises of Physico-Chemical treatment (Coagulation + Flocculation) followed by solid-liquid separation, filtration in a PSF and finally chemical oxidation.
Chemicals required are coagulant (mainly Alum or PAC), lime and acid for maintaining pH and Polyelectrolytes for flocculation. NaoCl shall be used for chemical oxidation.
The sludge from the tertiary settling tank is pumped to sludge sump for onward handling and disposal.
The expected characteristics of the Secondary and Tertiary treated wastewater are given in Table2-17 and Table2-18 respectively. Table2-17: Expected Characteristics of Secondary Treated Wastewater
S. No. Parameter Concentration
1 pH 7.5- 8.5
2 TSS (mg/l) 10
3 TDiS (mg/l) 2390
4 Temperature ˚C Ambient
5 BOD (5 day @ 20˚C) (mg/l) 310-320
6 COD (mg/l) 550-570
7 NH3-N 10
Table2-18: Characteristics of Tertiary treated wastewater S. No. Parameter Concentration
1 pH 5.5 - 9
2 TSS (mg/l) 10
3 TDiS (mg/l) 2390
4 Temperature ˚C Ambient
5 BOD (5 day @ 20˚C) (mg/l) 85-90
6 COD (mg/l) 190-210
7 Cyanides as CN- (mg/l) < 0.2
8 Chromium (Total) as Cr (mg/l) < 1
9 NH3-N 10
Tertiary treated wastewater is combined in the mixing tank with treated Metal Pre-Treatment and finishing wastewater to achieve the Marine discharge standards and the characteristics of treated water are given in Table 2-19. The treated water will be disposed off into the sea with the marine discharge system. Table 2-19 : Characteristics of Final Treated Wastewater for Reuse
S. No. Parameter Concentration*
1 pH 5.5 - 9
2 TSS (mg/l) <5
3 TDiS (mg/l) < 2100
4 Temperature ˚C Ambient
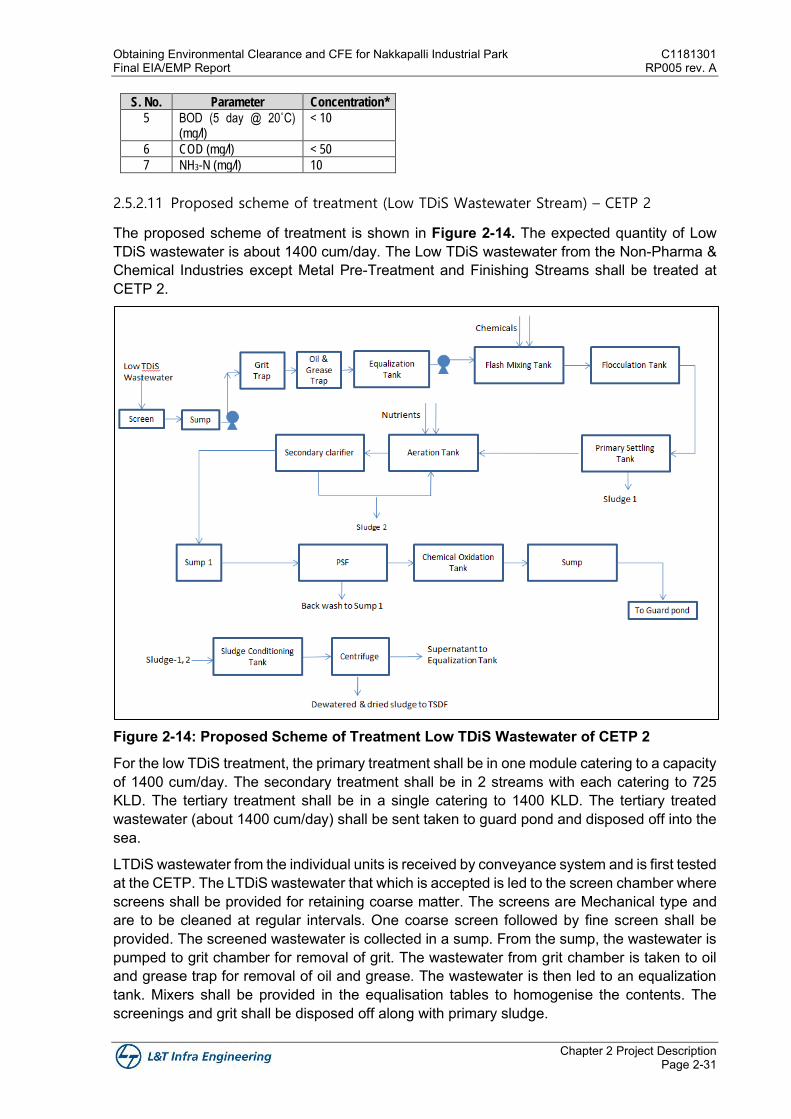
Obtaining Environmental Clearance and CFE for Nakkapalli Industrial Park C1181301 Final EIA/EMP Report RP005 rev. A
Chapter 2 Project Description Page 2-31
S. No. Parameter Concentration*
5 BOD (5 day @ 20˚C) (mg/l)
< 10
6 COD (mg/l) < 50
7 NH3-N (mg/l) 10
2.5.2.11 Proposed scheme of treatment (Low TDiS Wastewater Stream) – CETP 2
The proposed scheme of treatment is shown in Figure 2-14. The expected quantity of Low TDiS wastewater is about 1400 cum/day. The Low TDiS wastewater from the Non-Pharma & Chemical Industries except Metal Pre-Treatment and Finishing Streams shall be treated at CETP 2.
Figure 2-14: Proposed Scheme of Treatment Low TDiS Wastewater of CETP 2
For the low TDiS treatment, the primary treatment shall be in one module catering to a capacity of 1400 cum/day. The secondary treatment shall be in 2 streams with each catering to 725 KLD. The tertiary treatment shall be in a single catering to 1400 KLD. The tertiary treated wastewater (about 1400 cum/day) shall be sent taken to guard pond and disposed off into the sea.
LTDiS wastewater from the individual units is received by conveyance system and is first tested at the CETP. The LTDiS wastewater that which is accepted is led to the screen chamber where screens shall be provided for retaining coarse matter. The screens are Mechanical type and are to be cleaned at regular intervals. One coarse screen followed by fine screen shall be provided. The screened wastewater is collected in a sump. From the sump, the wastewater is pumped to grit chamber for removal of grit. The wastewater from grit chamber is taken to oil and grease trap for removal of oil and grease. The wastewater is then led to an equalization tank. Mixers shall be provided in the equalisation tables to homogenise the contents. The screenings and grit shall be disposed off along with primary sludge.
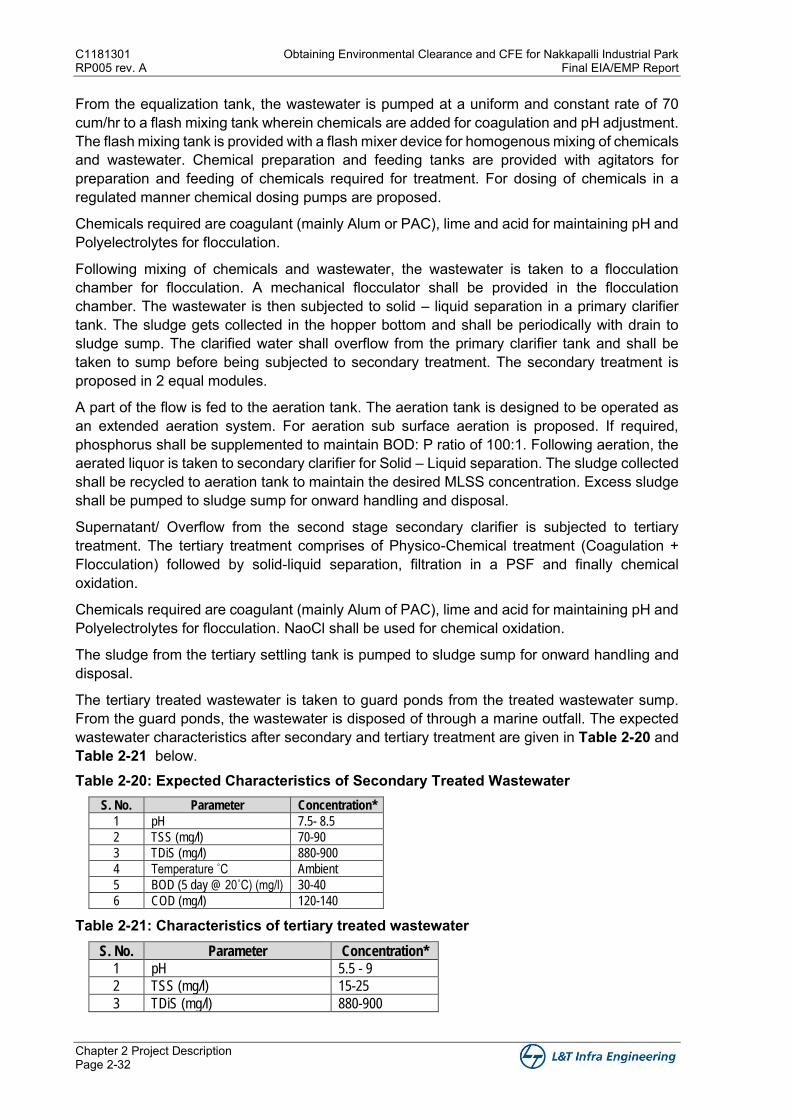
C1181301 Obtaining Environmental Clearance and CFE for Nakkapalli Industrial Park RP005 rev. A Final EIA/EMP Report
Chapter 2 Project Description Page 2-32
From the equalization tank, the wastewater is pumped at a uniform and constant rate of 70 cum/hr to a flash mixing tank wherein chemicals are added for coagulation and pH adjustment. The flash mixing tank is provided with a flash mixer device for homogenous mixing of chemicals and wastewater. Chemical preparation and feeding tanks are provided with agitators for preparation and feeding of chemicals required for treatment. For dosing of chemicals in a regulated manner chemical dosing pumps are proposed.
Chemicals required are coagulant (mainly Alum or PAC), lime and acid for maintaining pH and Polyelectrolytes for flocculation.
Following mixing of chemicals and wastewater, the wastewater is taken to a flocculation chamber for flocculation. A mechanical flocculator shall be provided in the flocculation chamber. The wastewater is then subjected to solid – liquid separation in a primary clarifier tank. The sludge gets collected in the hopper bottom and shall be periodically with drain to sludge sump. The clarified water shall overflow from the primary clarifier tank and shall be taken to sump before being subjected to secondary treatment. The secondary treatment is proposed in 2 equal modules.
A part of the flow is fed to the aeration tank. The aeration tank is designed to be operated as an extended aeration system. For aeration sub surface aeration is proposed. If required, phosphorus shall be supplemented to maintain BOD: P ratio of 100:1. Following aeration, the aerated liquor is taken to secondary clarifier for Solid – Liquid separation. The sludge collected shall be recycled to aeration tank to maintain the desired MLSS concentration. Excess sludge shall be pumped to sludge sump for onward handling and disposal.
Supernatant/ Overflow from the second stage secondary clarifier is subjected to tertiary treatment. The tertiary treatment comprises of Physico-Chemical treatment (Coagulation + Flocculation) followed by solid-liquid separation, filtration in a PSF and finally chemical oxidation.
Chemicals required are coagulant (mainly Alum of PAC), lime and acid for maintaining pH and Polyelectrolytes for flocculation. NaoCl shall be used for chemical oxidation.
The sludge from the tertiary settling tank is pumped to sludge sump for onward handling and disposal.
The tertiary treated wastewater is taken to guard ponds from the treated wastewater sump. From the guard ponds, the wastewater is disposed of through a marine outfall. The expected wastewater characteristics after secondary and tertiary treatment are given in Table 2-20 and Table 2-21 below. Table 2-20: Expected Characteristics of Secondary Treated Wastewater
S. No. Parameter Concentration*
1 pH 7.5- 8.5
2 TSS (mg/l) 70-90
3 TDiS (mg/l) 880-900
4 Temperature ˚C Ambient
5 BOD (5 day @ 20˚C) (mg/l) 30-40
6 COD (mg/l) 120-140
Table 2-21: Characteristics of tertiary treated wastewater S. No. Parameter Concentration*
1 pH 5.5 - 9
2 TSS (mg/l) 15-25
3 TDiS (mg/l) 880-900
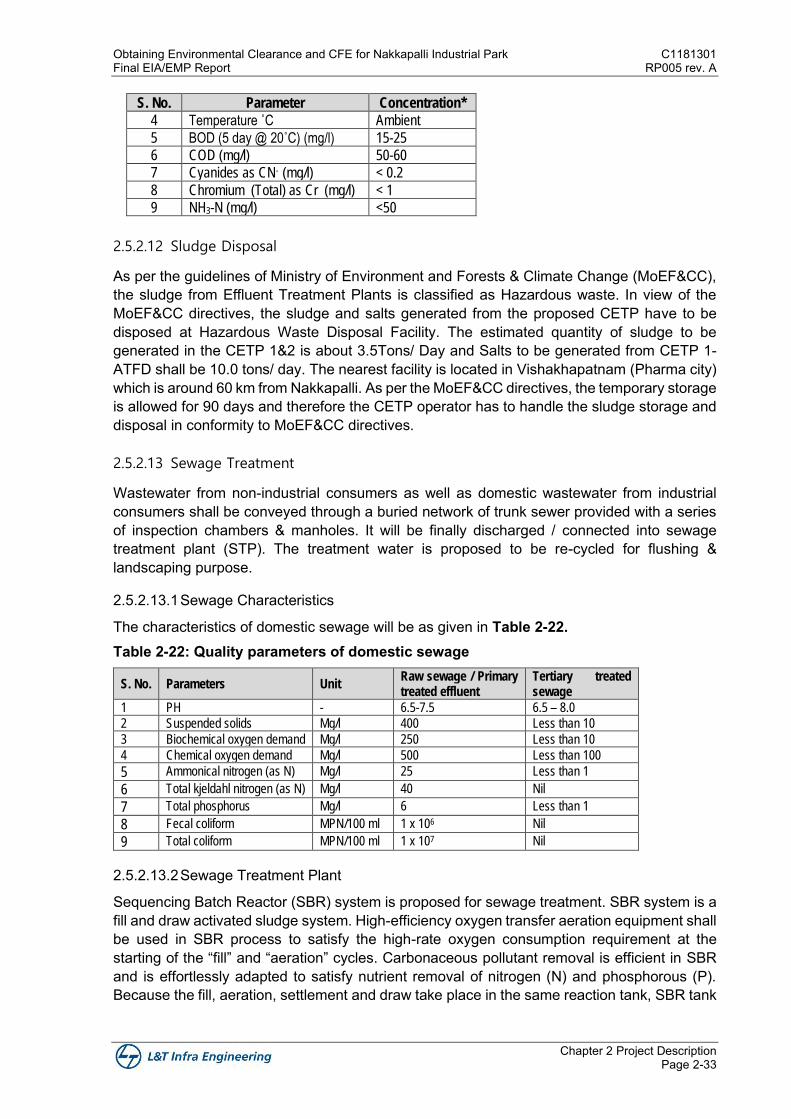
Obtaining Environmental Clearance and CFE for Nakkapalli Industrial Park C1181301 Final EIA/EMP Report RP005 rev. A
Chapter 2 Project Description Page 2-33
S. No. Parameter Concentration*
4 Temperature ˚C Ambient
5 BOD (5 day @ 20˚C) (mg/l) 15-25
6 COD (mg/l) 50-60
7 Cyanides as CN- (mg/l) < 0.2
8 Chromium (Total) as Cr (mg/l) < 1
9 NH3-N (mg/l) <50
2.5.2.12 Sludge Disposal
As per the guidelines of Ministry of Environment and Forests & Climate Change (MoEF&CC), the sludge from Effluent Treatment Plants is classified as Hazardous waste. In view of the MoEF&CC directives, the sludge and salts generated from the proposed CETP have to be disposed at Hazardous Waste Disposal Facility. The estimated quantity of sludge to be generated in the CETP 1&2 is about 3.5Tons/ Day and Salts to be generated from CETP 1-ATFD shall be 10.0 tons/ day. The nearest facility is located in Vishakhapatnam (Pharma city) which is around 60 km from Nakkapalli. As per the MoEF&CC directives, the temporary storage is allowed for 90 days and therefore the CETP operator has to handle the sludge storage and disposal in conformity to MoEF&CC directives.
2.5.2.13 Sewage Treatment
Wastewater from non-industrial consumers as well as domestic wastewater from industrial consumers shall be conveyed through a buried network of trunk sewer provided with a series of inspection chambers & manholes. It will be finally discharged / connected into sewage treatment plant (STP). The treatment water is proposed to be re-cycled for flushing & landscaping purpose.
2.5.2.13.1 Sewage Characteristics
The characteristics of domestic sewage will be as given in Table 2-22. Table 2-22: Quality parameters of domestic sewage
S. No. Parameters Unit Raw sewage / Primary treated effluent
Tertiary treated sewage
1 PH - 6.5-7.5 6.5 – 8.0
2 Suspended solids Mg/l 400 Less than 10
3 Biochemical oxygen demand Mg/l 250 Less than 10
4 Chemical oxygen demand Mg/l 500 Less than 100
5 Ammonical nitrogen (as N) Mg/l 25 Less than 1
6 Total kjeldahl nitrogen (as N) Mg/l 40 Nil
7 Total phosphorus Mg/l 6 Less than 1
8 Fecal coliform MPN/100 ml 1 x 10⁶ Nil
9 Total coliform MPN/100 ml 1 x 10⁷ Nil
2.5.2.13.2 Sewage Treatment Plant
Sequencing Batch Reactor (SBR) system is proposed for sewage treatment. SBR system is a fill and draw activated sludge system. High-efficiency oxygen transfer aeration equipment shall be used in SBR process to satisfy the high-rate oxygen consumption requirement at the starting of the “fill” and “aeration” cycles. Carbonaceous pollutant removal is efficient in SBR and is effortlessly adapted to satisfy nutrient removal of nitrogen (N) and phosphorous (P). Because the fill, aeration, settlement and draw take place in the same reaction tank, SBR tank
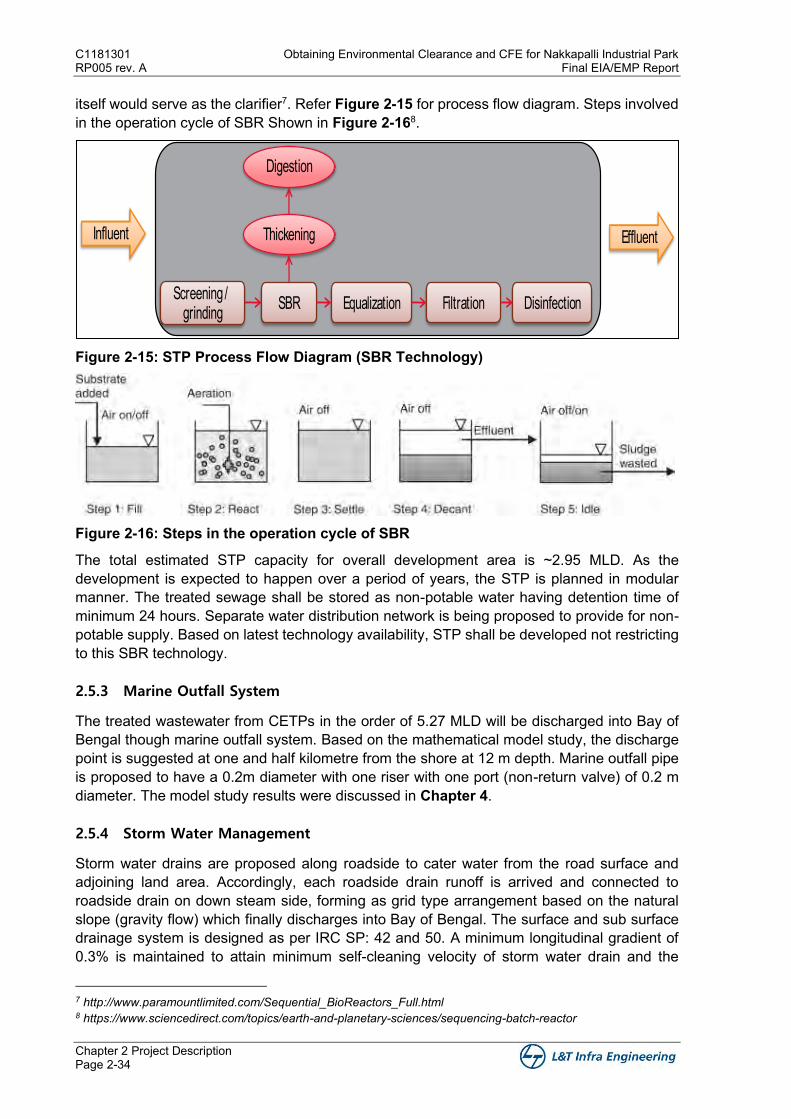
C1181301 Obtaining Environmental Clearance and CFE for Nakkapalli Industrial Park RP005 rev. A Final EIA/EMP Report
Chapter 2 Project Description Page 2-34
itself would serve as the clarifier7. Refer Figure 2-15 for process flow diagram. Steps involved in the operation cycle of SBR Shown in Figure 2-168.
Figure 2-15: STP Process Flow Diagram (SBR Technology)
Figure 2-16: Steps in the operation cycle of SBR
The total estimated STP capacity for overall development area is ~2.95 MLD. As the development is expected to happen over a period of years, the STP is planned in modular manner. The treated sewage shall be stored as non-potable water having detention time of minimum 24 hours. Separate water distribution network is being proposed to provide for non-potable supply. Based on latest technology availability, STP shall be developed not restricting to this SBR technology.
2.5.3 Marine Outfall System
The treated wastewater from CETPs in the order of 5.27 MLD will be discharged into Bay of Bengal though marine outfall system. Based on the mathematical model study, the discharge point is suggested at one and half kilometre from the shore at 12 m depth. Marine outfall pipe is proposed to have a 0.2m diameter with one riser with one port (non-return valve) of 0.2 m diameter. The model study results were discussed in Chapter 4.
2.5.4 Storm Water Management
Storm water drains are proposed along roadside to cater water from the road surface and adjoining land area. Accordingly, each roadside drain runoff is arrived and connected to roadside drain on down steam side, forming as grid type arrangement based on the natural slope (gravity flow) which finally discharges into Bay of Bengal. The surface and sub surface drainage system is designed as per IRC SP: 42 and 50. A minimum longitudinal gradient of 0.3% is maintained to attain minimum self-cleaning velocity of storm water drain and the
7 http://www.paramountlimited.com/Sequential_BioReactors_Full.html 8 https://www.sciencedirect.com/topics/earth-and-planetary-sciences/sequencing-batch-reactor
Influent
Screening / grinding SBR Equalization Filtration Disinfection
Thickening
Digestion
Effluent
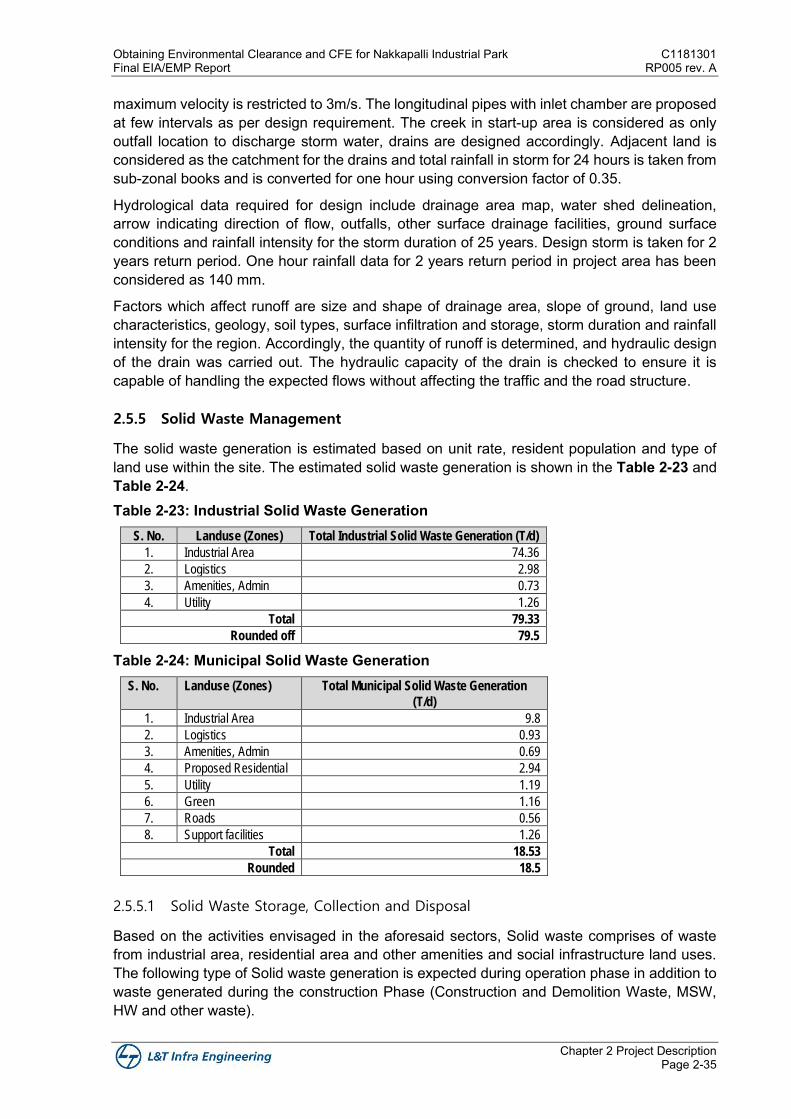
Obtaining Environmental Clearance and CFE for Nakkapalli Industrial Park C1181301 Final EIA/EMP Report RP005 rev. A
Chapter 2 Project Description Page 2-35
maximum velocity is restricted to 3m/s. The longitudinal pipes with inlet chamber are proposed at few intervals as per design requirement. The creek in start-up area is considered as only outfall location to discharge storm water, drains are designed accordingly. Adjacent land is considered as the catchment for the drains and total rainfall in storm for 24 hours is taken from sub-zonal books and is converted for one hour using conversion factor of 0.35.
Hydrological data required for design include drainage area map, water shed delineation, arrow indicating direction of flow, outfalls, other surface drainage facilities, ground surface conditions and rainfall intensity for the storm duration of 25 years. Design storm is taken for 2 years return period. One hour rainfall data for 2 years return period in project area has been considered as 140 mm.
Factors which affect runoff are size and shape of drainage area, slope of ground, land use characteristics, geology, soil types, surface infiltration and storage, storm duration and rainfall intensity for the region. Accordingly, the quantity of runoff is determined, and hydraulic design of the drain was carried out. The hydraulic capacity of the drain is checked to ensure it is capable of handling the expected flows without affecting the traffic and the road structure.
2.5.5 Solid Waste Management
The solid waste generation is estimated based on unit rate, resident population and type of land use within the site. The estimated solid waste generation is shown in the Table 2-23 and Table 2-24. Table 2-23: Industrial Solid Waste Generation
S. No. Landuse (Zones) Total Industrial Solid Waste Generation (T/d)
1. Industrial Area 74.36
2. Logistics 2.98
3. Amenities, Admin 0.73
4. Utility 1.26
Total 79.33
Rounded off 79.5
Table 2-24: Municipal Solid Waste Generation S. No. Landuse (Zones) Total Municipal Solid Waste Generation
(T/d)
1. Industrial Area 9.8
2. Logistics 0.93
3. Amenities, Admin 0.69
4. Proposed Residential 2.94
5. Utility 1.19
6. Green 1.16
7. Roads 0.56
8. Support facilities 1.26
Total 18.53
Rounded 18.5
2.5.5.1 Solid Waste Storage, Collection and Disposal
Based on the activities envisaged in the aforesaid sectors, Solid waste comprises of waste from industrial area, residential area and other amenities and social infrastructure land uses. The following type of Solid waste generation is expected during operation phase in addition to waste generated during the construction Phase (Construction and Demolition Waste, MSW, HW and other waste).
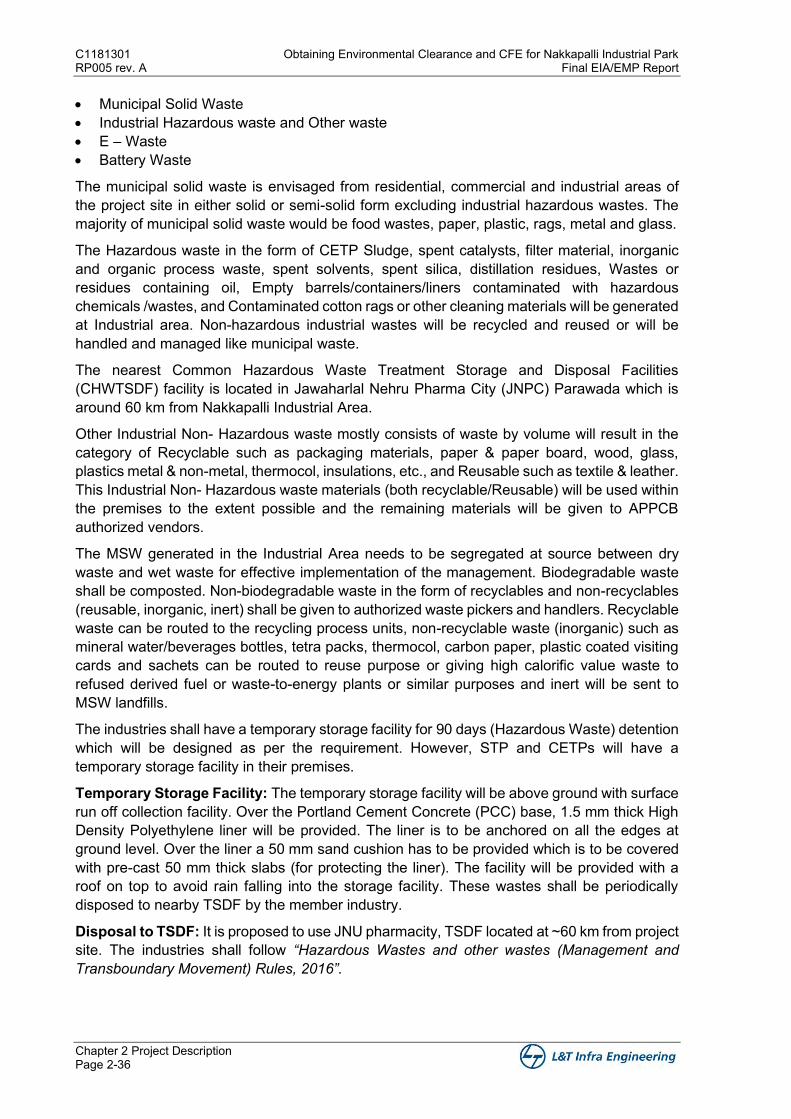
C1181301 Obtaining Environmental Clearance and CFE for Nakkapalli Industrial Park RP005 rev. A Final EIA/EMP Report
Chapter 2 Project Description Page 2-36
• Municipal Solid Waste • Industrial Hazardous waste and Other waste • E – Waste • Battery Waste
The municipal solid waste is envisaged from residential, commercial and industrial areas of the project site in either solid or semi-solid form excluding industrial hazardous wastes. The majority of municipal solid waste would be food wastes, paper, plastic, rags, metal and glass.
The Hazardous waste in the form of CETP Sludge, spent catalysts, filter material, inorganic and organic process waste, spent solvents, spent silica, distillation residues, Wastes or residues containing oil, Empty barrels/containers/liners contaminated with hazardous chemicals /wastes, and Contaminated cotton rags or other cleaning materials will be generated at Industrial area. Non-hazardous industrial wastes will be recycled and reused or will be handled and managed like municipal waste.
The nearest Common Hazardous Waste Treatment Storage and Disposal Facilities (CHWTSDF) facility is located in Jawaharlal Nehru Pharma City (JNPC) Parawada which is around 60 km from Nakkapalli Industrial Area.
Other Industrial Non- Hazardous waste mostly consists of waste by volume will result in the category of Recyclable such as packaging materials, paper & paper board, wood, glass, plastics metal & non-metal, thermocol, insulations, etc., and Reusable such as textile & leather. This Industrial Non- Hazardous waste materials (both recyclable/Reusable) will be used within the premises to the extent possible and the remaining materials will be given to APPCB authorized vendors.
The MSW generated in the Industrial Area needs to be segregated at source between dry waste and wet waste for effective implementation of the management. Biodegradable waste shall be composted. Non-biodegradable waste in the form of recyclables and non-recyclables (reusable, inorganic, inert) shall be given to authorized waste pickers and handlers. Recyclable waste can be routed to the recycling process units, non-recyclable waste (inorganic) such as mineral water/beverages bottles, tetra packs, thermocol, carbon paper, plastic coated visiting cards and sachets can be routed to reuse purpose or giving high calorific value waste to refused derived fuel or waste-to-energy plants or similar purposes and inert will be sent to MSW landfills.
The industries shall have a temporary storage facility for 90 days (Hazardous Waste) detention which will be designed as per the requirement. However, STP and CETPs will have a temporary storage facility in their premises.
Temporary Storage Facility: The temporary storage facility will be above ground with surface run off collection facility. Over the Portland Cement Concrete (PCC) base, 1.5 mm thick High Density Polyethylene liner will be provided. The liner is to be anchored on all the edges at ground level. Over the liner a 50 mm sand cushion has to be provided which is to be covered with pre-cast 50 mm thick slabs (for protecting the liner). The facility will be provided with a roof on top to avoid rain falling into the storage facility. These wastes shall be periodically disposed to nearby TSDF by the member industry.
Disposal to TSDF: It is proposed to use JNU pharmacity, TSDF located at ~60 km from project site. The industries shall follow “Hazardous Wastes and other wastes (Management and Transboundary Movement) Rules, 2016”.
Obtaining Environmental Clearance and CFE for Nakkapalli Industrial Park C1181301 Final EIA/EMP Report RP005 rev. A
Chapter 2 Project Description Page 2-37
2.5.6 Power Supply
Construction phase requirement is 5 MW Sourced from APTRANSCO and partly will be sourced through DG sets. Whereas Operation phase power requirement is 300 MW Sourced from APTRANSCO. The incoming power supply will be drawn from the nearest 220/132/33 kV substation through a 33 kV underground (UG) XLPE cable upto 33/11kV substations proposed within the I.P area. It is proposed to supply the power through three 33/11kV substations to users/ industrial plots. The locations of these substations are shown in the figure based on the load Centre.
33 KV feeders from 220/132/33 kV as incoming source will be connected to each 33/11kV substations through 33KV 300 sq.mm UG cable which will be laid in cable trenches running by the side of the road. It is proposed to provide 11kV supply, for the estimated load shown in Figure 2-7 to plots connected through 11kV 300 sq.mm UG cable through 5 way Ring Main Units (RMU) with looping connected to a feeder system.
The RMUs are numbered as R1, R2, R3, etc. and 11kV feeders are numbered as F1, F2, F3, etc. and Sections as Sec 1, Sec 2, Sec 3, etc. for each 33/11kV SS. The system has also provision of interlinking with other sections in case of failure of respective section feeders this will enable uninterrupted power supply to the end users. The power distribution network schematic is shown in Figure below.
Figure 2-17: Schematic diagram for power distribution
2.5.7 Street Lighting
It is proposed to illuminate the area with Solar Power LED Lights with a facility of change over to APSPDCL power in case of inadequate solar energy. For the Internal area, 120 W streetlights at 30m interval for achieving 30lux as per IS1944, double arm for wider RoWs and single arm for narrower RoWs are proposed.
2.6 CRZ Compatibility
National Centre for Sustainable Coastal Management (NCSCM) was engaged for demarcation of HTL, LTL and CRZ area. The project development area does not fall or contain any environmentally sensitive areas as specified in CRZ Notification and that the project area meets the regulations of CRZ Notification, 2011/2019. CRZ area of 288.57 acres (7.4%) will be utilised storage of chemicals/petroleum products as permissible under CRZ notification,
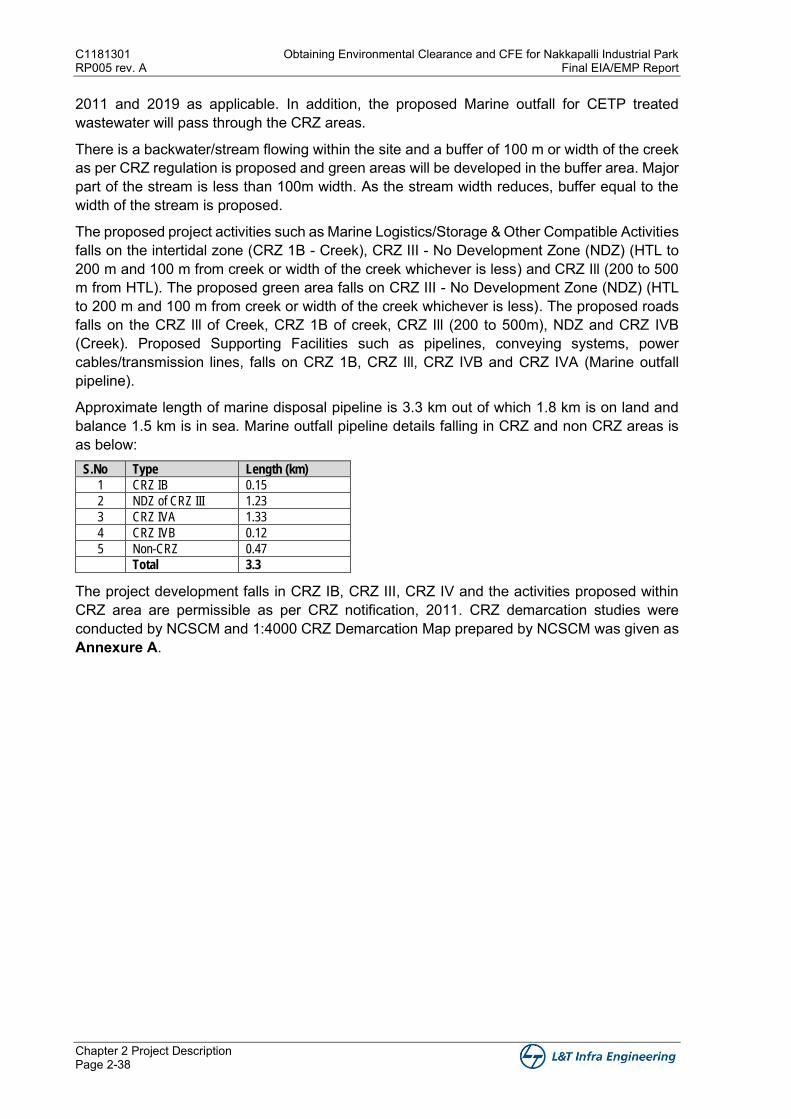
C1181301 Obtaining Environmental Clearance and CFE for Nakkapalli Industrial Park RP005 rev. A Final EIA/EMP Report
Chapter 2 Project Description Page 2-38
2011 and 2019 as applicable. In addition, the proposed Marine outfall for CETP treated wastewater will pass through the CRZ areas.
There is a backwater/stream flowing within the site and a buffer of 100 m or width of the creek as per CRZ regulation is proposed and green areas will be developed in the buffer area. Major part of the stream is less than 100m width. As the stream width reduces, buffer equal to the width of the stream is proposed.
The proposed project activities such as Marine Logistics/Storage & Other Compatible Activities falls on the intertidal zone (CRZ 1B - Creek), CRZ III - No Development Zone (NDZ) (HTL to 200 m and 100 m from creek or width of the creek whichever is less) and CRZ Ill (200 to 500 m from HTL). The proposed green area falls on CRZ III - No Development Zone (NDZ) (HTL to 200 m and 100 m from creek or width of the creek whichever is less). The proposed roads falls on the CRZ Ill of Creek, CRZ 1B of creek, CRZ Ill (200 to 500m), NDZ and CRZ IVB (Creek). Proposed Supporting Facilities such as pipelines, conveying systems, power cables/transmission lines, falls on CRZ 1B, CRZ Ill, CRZ IVB and CRZ IVA (Marine outfall pipeline).
Approximate length of marine disposal pipeline is 3.3 km out of which 1.8 km is on land and balance 1.5 km is in sea. Marine outfall pipeline details falling in CRZ and non CRZ areas is as below:
S.No Type Length (km)
1 CRZ IB 0.15
2 NDZ of CRZ III 1.23
3 CRZ IVA 1.33
4 CRZ IVB 0.12
5 Non-CRZ 0.47
Total 3.3
The project development falls in CRZ IB, CRZ III, CRZ IV and the activities proposed within CRZ area are permissible as per CRZ notification, 2011. CRZ demarcation studies were conducted by NCSCM and 1:4000 CRZ Demarcation Map prepared by NCSCM was given as Annexure A.
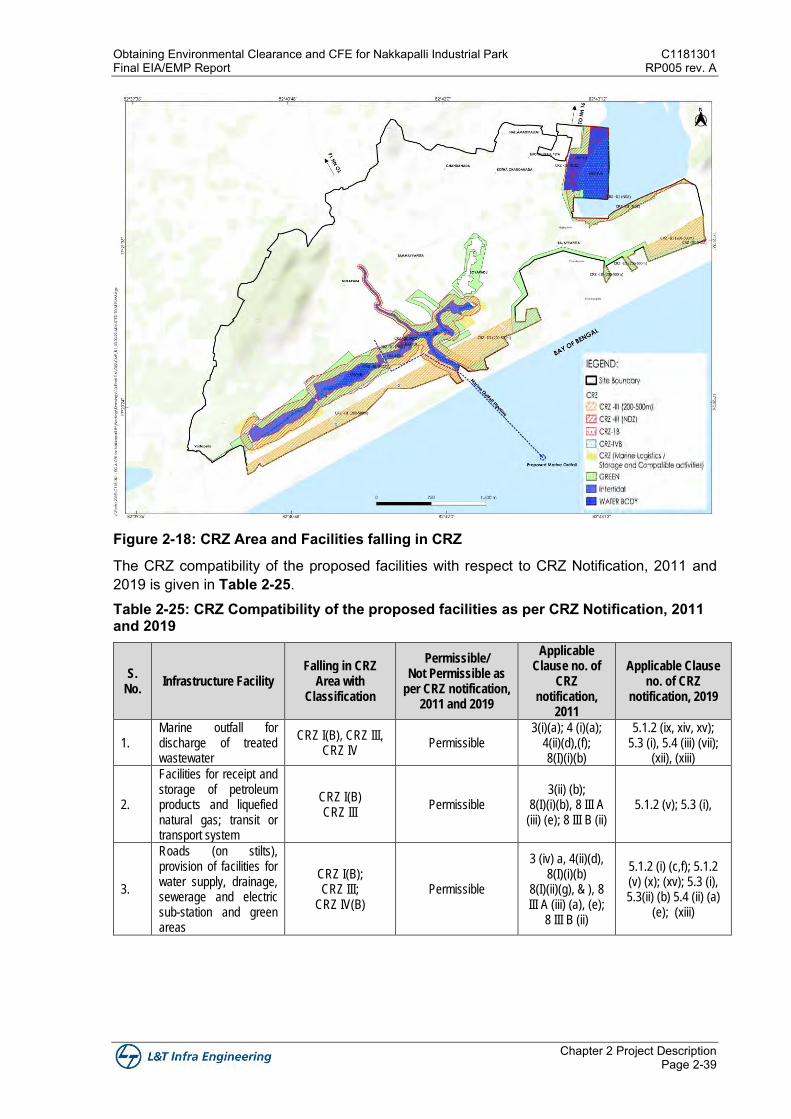
Obtaining Environmental Clearance and CFE for Nakkapalli Industrial Park C1181301 Final EIA/EMP Report RP005 rev. A
Chapter 2 Project Description Page 2-39
Figure 2-18: CRZ Area and Facilities falling in CRZ
The CRZ compatibility of the proposed facilities with respect to CRZ Notification, 2011 and 2019 is given in Table 2-25. Table 2-25: CRZ Compatibility of the proposed facilities as per CRZ Notification, 2011 and 2019
S. No.
Infrastructure Facility Falling in CRZ
Area with Classification
Permissible/ Not Permissible as
per CRZ notification, 2011 and 2019
Applicable Clause no. of
CRZ notification,
2011
Applicable Clause no. of CRZ
notification, 2019
1. Marine outfall for discharge of treated wastewater
CRZ I(B), CRZ III, CRZ IV
Permissible 3(i)(a); 4 (i)(a);
4(ii)(d),(f); 8(I)(i)(b)
5.1.2 (ix, xiv, xv); 5.3 (i), 5.4 (iii) (vii);
(xii), (xiii)
2.
Facilities for receipt and storage of petroleum products and liquefied natural gas; transit or transport system
CRZ I(B) CRZ III
Permissible 3(ii) (b);
8(I)(i)(b), 8 III A (iii) (e); 8 III B (ii)
5.1.2 (v); 5.3 (i),
3.
Roads (on stilts), provision of facilities for water supply, drainage, sewerage and electric sub-station and green areas
CRZ I(B); CRZ III;
CRZ IV(B) Permissible
3 (iv) a, 4(ii)(d), 8(I)(i)(b)
8(I)(ii)(g), & ), 8 III A (iii) (a), (e);
8 III B (ii)
5.1.2 (i) (c,f); 5.1.2 (v) (x); (xv); 5.3 (i), 5.3(ii) (b) 5.4 (ii) (a)
(e); (xiii)
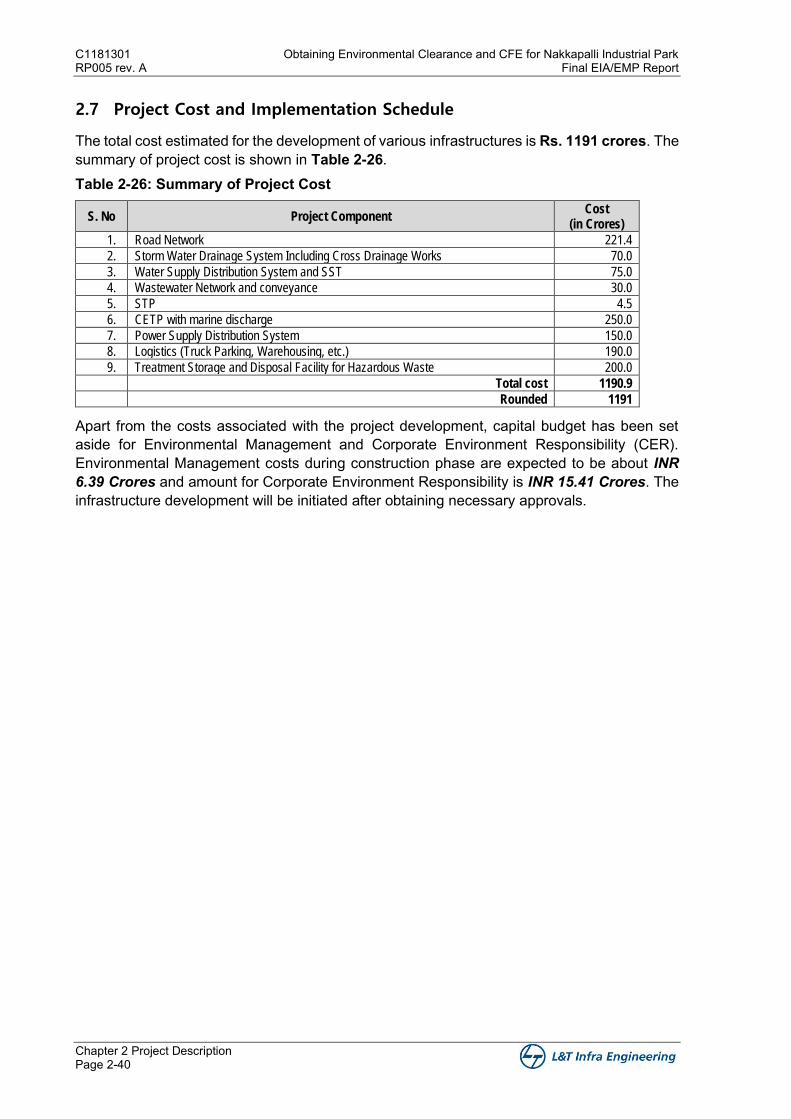
C1181301 Obtaining Environmental Clearance and CFE for Nakkapalli Industrial Park RP005 rev. A Final EIA/EMP Report
Chapter 2 Project Description Page 2-40
2.7 Project Cost and Implementation Schedule
The total cost estimated for the development of various infrastructures is Rs. 1191 crores. The summary of project cost is shown in Table 2-26. Table 2-26: Summary of Project Cost
S. No Project Component Cost
(in Crores)
1. Road Network 221.4
2. Storm Water Drainage System Including Cross Drainage Works 70.0
3. Water Supply Distribution System and SST 75.0
4. Wastewater Network and conveyance 30.0
5. STP 4.5
6. CETP with marine discharge 250.0
7. Power Supply Distribution System 150.0
8. Logistics (Truck Parking, Warehousing, etc.) 190.0
9. Treatment Storage and Disposal Facility for Hazardous Waste 200.0
Total cost 1190.9
Rounded 1191
Apart from the costs associated with the project development, capital budget has been set aside for Environmental Management and Corporate Environment Responsibility (CER). Environmental Management costs during construction phase are expected to be about INR 6.39 Crores and amount for Corporate Environment Responsibility is INR 15.41 Crores. The infrastructure development will be initiated after obtaining necessary approvals.

Figures


Chapter 3
Description of Environment

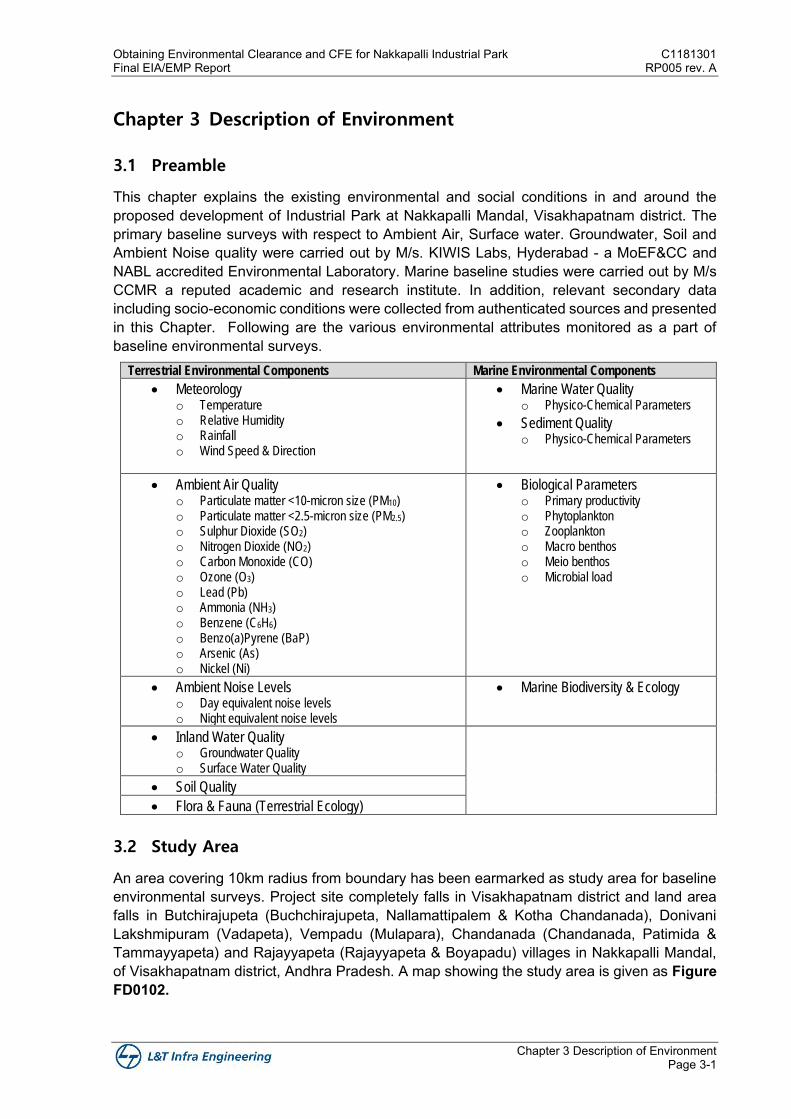
Obtaining Environmental Clearance and CFE for Nakkapalli Industrial Park C1181301 Final EIA/EMP Report RP005 rev. A
Chapter 3 Description of Environment Page 3-1
Chapter 3 Description of Environment
3.1 Preamble
This chapter explains the existing environmental and social conditions in and around the proposed development of Industrial Park at Nakkapalli Mandal, Visakhapatnam district. The primary baseline surveys with respect to Ambient Air, Surface water. Groundwater, Soil and Ambient Noise quality were carried out by M/s. KIWIS Labs, Hyderabad - a MoEF&CC and NABL accredited Environmental Laboratory. Marine baseline studies were carried out by M/s CCMR a reputed academic and research institute. In addition, relevant secondary data including socio-economic conditions were collected from authenticated sources and presented in this Chapter. Following are the various environmental attributes monitored as a part of baseline environmental surveys.
Terrestrial Environmental Components Marine Environmental Components
• Meteorology o Temperature o Relative Humidity o Rainfall o Wind Speed & Direction
• Marine Water Quality o Physico-Chemical Parameters
• Sediment Quality o Physico-Chemical Parameters
• Ambient Air Quality o Particulate matter <10-micron size (PM10) o Particulate matter <2.5-micron size (PM2.5) o Sulphur Dioxide (SO2) o Nitrogen Dioxide (NO2) o Carbon Monoxide (CO) o Ozone (O3) o Lead (Pb) o Ammonia (NH3) o Benzene (C6H6) o Benzo(a)Pyrene (BaP) o Arsenic (As) o Nickel (Ni)
• Biological Parameters o Primary productivity o Phytoplankton o Zooplankton o Macro benthos o Meio benthos o Microbial load
• Ambient Noise Levels o Day equivalent noise levels o Night equivalent noise levels
• Marine Biodiversity & Ecology
• Inland Water Quality o Groundwater Quality o Surface Water Quality
• Soil Quality
• Flora & Fauna (Terrestrial Ecology)
3.2 Study Area
An area covering 10km radius from boundary has been earmarked as study area for baseline environmental surveys. Project site completely falls in Visakhapatnam district and land area falls in Butchirajupeta (Buchchirajupeta, Nallamattipalem & Kotha Chandanada), Donivani Lakshmipuram (Vadapeta), Vempadu (Mulapara), Chandanada (Chandanada, Patimida & Tammayyapeta) and Rajayyapeta (Rajayyapeta & Boyapadu) villages in Nakkapalli Mandal, of Visakhapatnam district, Andhra Pradesh. A map showing the study area is given as Figure FD0102.
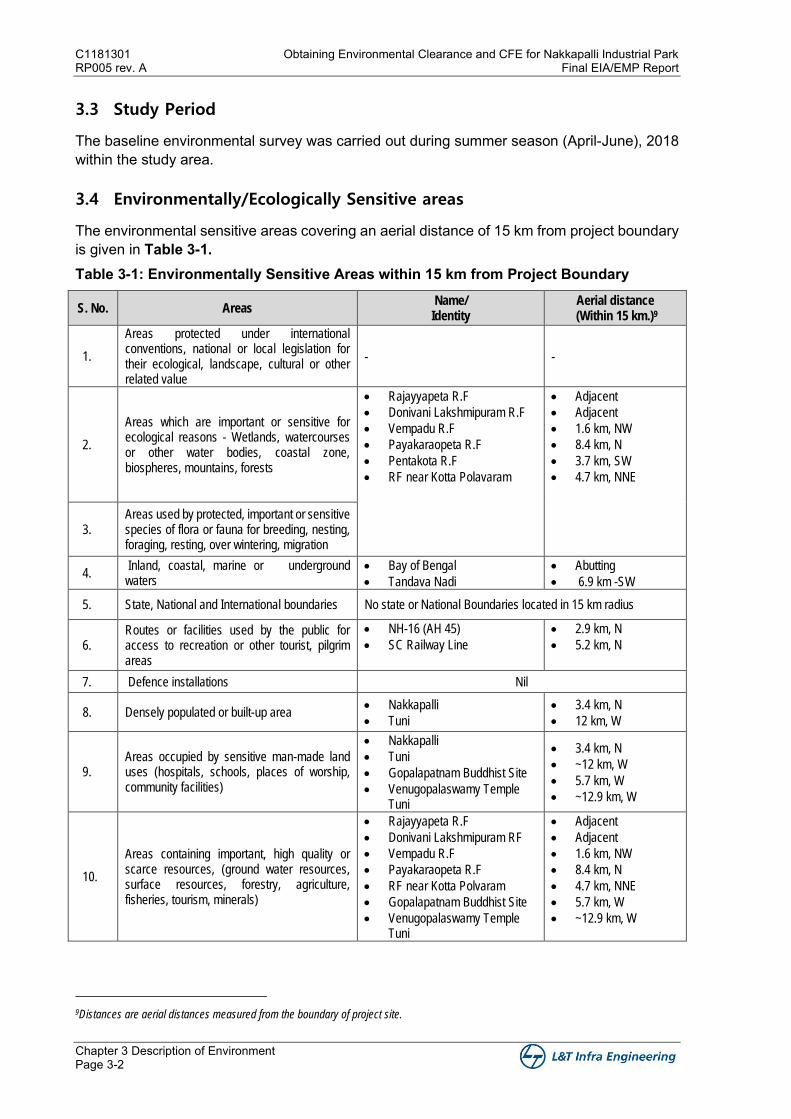
C1181301 Obtaining Environmental Clearance and CFE for Nakkapalli Industrial Park RP005 rev. A Final EIA/EMP Report
Chapter 3 Description of Environment Page 3-2
3.3 Study Period
The baseline environmental survey was carried out during summer season (April-June), 2018 within the study area.
3.4 Environmentally/Ecologically Sensitive areas
The environmental sensitive areas covering an aerial distance of 15 km from project boundary is given in Table 3-1. Table 3-1: Environmentally Sensitive Areas within 15 km from Project Boundary
S. No. Areas Name/
Identity Aerial distance
(Within 15 km.)9
1.
Areas protected under international conventions, national or local legislation for their ecological, landscape, cultural or other related value
- -
2.
Areas which are important or sensitive for ecological reasons - Wetlands, watercourses or other water bodies, coastal zone, biospheres, mountains, forests
• Rajayyapeta R.F
• Donivani Lakshmipuram R.F
• Vempadu R.F
• Payakaraopeta R.F
• Pentakota R.F
• RF near Kotta Polavaram
• Adjacent
• Adjacent
• 1.6 km, NW
• 8.4 km, N
• 3.7 km, SW
• 4.7 km, NNE
3. Areas used by protected, important or sensitive species of flora or fauna for breeding, nesting, foraging, resting, over wintering, migration
4. Inland, coastal, marine or underground waters
• Bay of Bengal
• Tandava Nadi
• Abutting
• 6.9 km -SW
5. State, National and International boundaries No state or National Boundaries located in 15 km radius
6. Routes or facilities used by the public for access to recreation or other tourist, pilgrim areas
• NH-16 (AH 45)
• SC Railway Line
• 2.9 km, N
• 5.2 km, N
7. Defence installations Nil
8. Densely populated or built-up area • Nakkapalli
• Tuni
• 3.4 km, N
• 12 km, W
9. Areas occupied by sensitive man-made land uses (hospitals, schools, places of worship, community facilities)
• Nakkapalli
• Tuni
• Gopalapatnam Buddhist Site
• Venugopalaswamy Temple Tuni
• 3.4 km, N
• ~12 km, W
• 5.7 km, W
• ~12.9 km, W
10.
Areas containing important, high quality or scarce resources, (ground water resources, surface resources, forestry, agriculture, fisheries, tourism, minerals)
• Rajayyapeta R.F
• Donivani Lakshmipuram RF
• Vempadu R.F
• Payakaraopeta R.F
• RF near Kotta Polvaram
• Gopalapatnam Buddhist Site
• Venugopalaswamy Temple Tuni
• Adjacent
• Adjacent
• 1.6 km, NW
• 8.4 km, N
• 4.7 km, NNE
• 5.7 km, W
• ~12.9 km, W
9Distances are aerial distances measured from the boundary of project site.
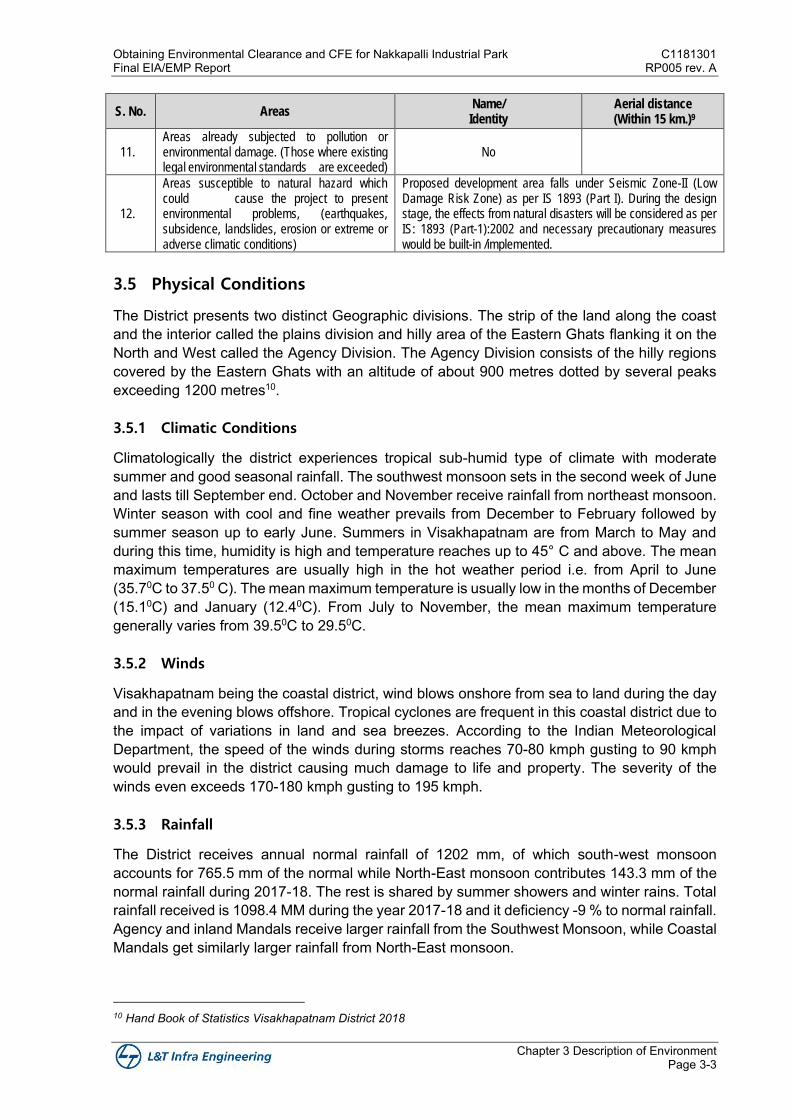
Obtaining Environmental Clearance and CFE for Nakkapalli Industrial Park C1181301 Final EIA/EMP Report RP005 rev. A
Chapter 3 Description of Environment Page 3-3
S. No. Areas Name/
Identity Aerial distance
(Within 15 km.)9
11. Areas already subjected to pollution or environmental damage. (Those where existing legal environmental standards are exceeded)
No
12.
Areas susceptible to natural hazard which could cause the project to present environmental problems, (earthquakes, subsidence, landslides, erosion or extreme or adverse climatic conditions)
Proposed development area falls under Seismic Zone-II (Low Damage Risk Zone) as per IS 1893 (Part I). During the design stage, the effects from natural disasters will be considered as per IS: 1893 (Part-1):2002 and necessary precautionary measures would be built-in /implemented.
3.5 Physical Conditions
The District presents two distinct Geographic divisions. The strip of the land along the coast and the interior called the plains division and hilly area of the Eastern Ghats flanking it on the North and West called the Agency Division. The Agency Division consists of the hilly regions covered by the Eastern Ghats with an altitude of about 900 metres dotted by several peaks exceeding 1200 metres10.
3.5.1 Climatic Conditions
Climatologically the district experiences tropical sub-humid type of climate with moderate summer and good seasonal rainfall. The southwest monsoon sets in the second week of June and lasts till September end. October and November receive rainfall from northeast monsoon. Winter season with cool and fine weather prevails from December to February followed by summer season up to early June. Summers in Visakhapatnam are from March to May and during this time, humidity is high and temperature reaches up to 45° C and above. The mean maximum temperatures are usually high in the hot weather period i.e. from April to June (35.70C to 37.50 C). The mean maximum temperature is usually low in the months of December (15.10C) and January (12.40C). From July to November, the mean maximum temperature generally varies from 39.50C to 29.50C.
3.5.2 Winds
Visakhapatnam being the coastal district, wind blows onshore from sea to land during the day and in the evening blows offshore. Tropical cyclones are frequent in this coastal district due to the impact of variations in land and sea breezes. According to the Indian Meteorological Department, the speed of the winds during storms reaches 70-80 kmph gusting to 90 kmph would prevail in the district causing much damage to life and property. The severity of the winds even exceeds 170-180 kmph gusting to 195 kmph.
3.5.3 Rainfall
The District receives annual normal rainfall of 1202 mm, of which south-west monsoon accounts for 765.5 mm of the normal while North-East monsoon contributes 143.3 mm of the normal rainfall during 2017-18. The rest is shared by summer showers and winter rains. Total rainfall received is 1098.4 MM during the year 2017-18 and it deficiency -9 % to normal rainfall. Agency and inland Mandals receive larger rainfall from the Southwest Monsoon, while Coastal Mandals get similarly larger rainfall from North-East monsoon.
10 Hand Book of Statistics Visakhapatnam District 2018
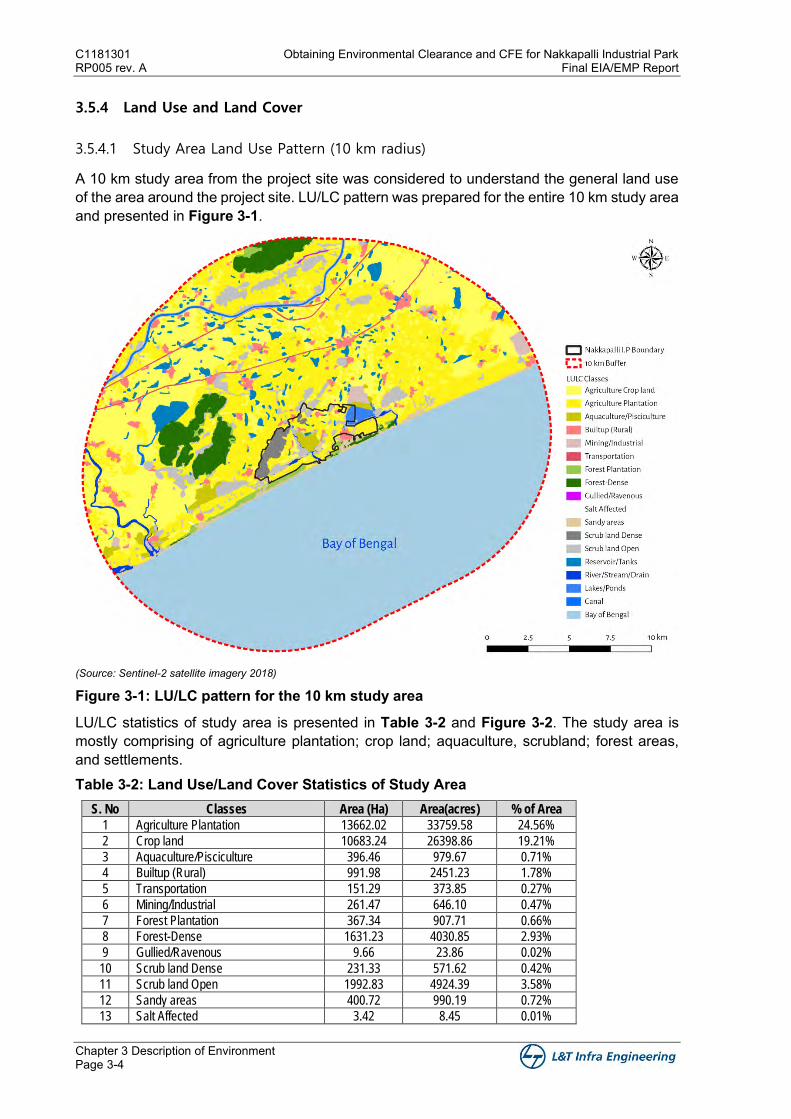
C1181301 Obtaining Environmental Clearance and CFE for Nakkapalli Industrial Park RP005 rev. A Final EIA/EMP Report
Chapter 3 Description of Environment Page 3-4
3.5.4 Land Use and Land Cover
3.5.4.1 Study Area Land Use Pattern (10 km radius)
A 10 km study area from the project site was considered to understand the general land use of the area around the project site. LU/LC pattern was prepared for the entire 10 km study area and presented in Figure 3-1.
(Source: Sentinel-2 satellite imagery 2018)
Figure 3-1: LU/LC pattern for the 10 km study area
LU/LC statistics of study area is presented in Table 3-2 and Figure 3-2. The study area is mostly comprising of agriculture plantation; crop land; aquaculture, scrubland; forest areas, and settlements. Table 3-2: Land Use/Land Cover Statistics of Study Area
S. No Classes Area (Ha) Area(acres) % of Area
1 Agriculture Plantation 13662.02 33759.58 24.56%
2 Crop land 10683.24 26398.86 19.21%
3 Aquaculture/Pisciculture 396.46 979.67 0.71%
4 Builtup (Rural) 991.98 2451.23 1.78%
5 Transportation 151.29 373.85 0.27%
6 Mining/Industrial 261.47 646.10 0.47%
7 Forest Plantation 367.34 907.71 0.66%
8 Forest-Dense 1631.23 4030.85 2.93%
9 Gullied/Ravenous 9.66 23.86 0.02%
10 Scrub land Dense 231.33 571.62 0.42%
11 Scrub land Open 1992.83 4924.39 3.58%
12 Sandy areas 400.72 990.19 0.72%
13 Salt Affected 3.42 8.45 0.01%
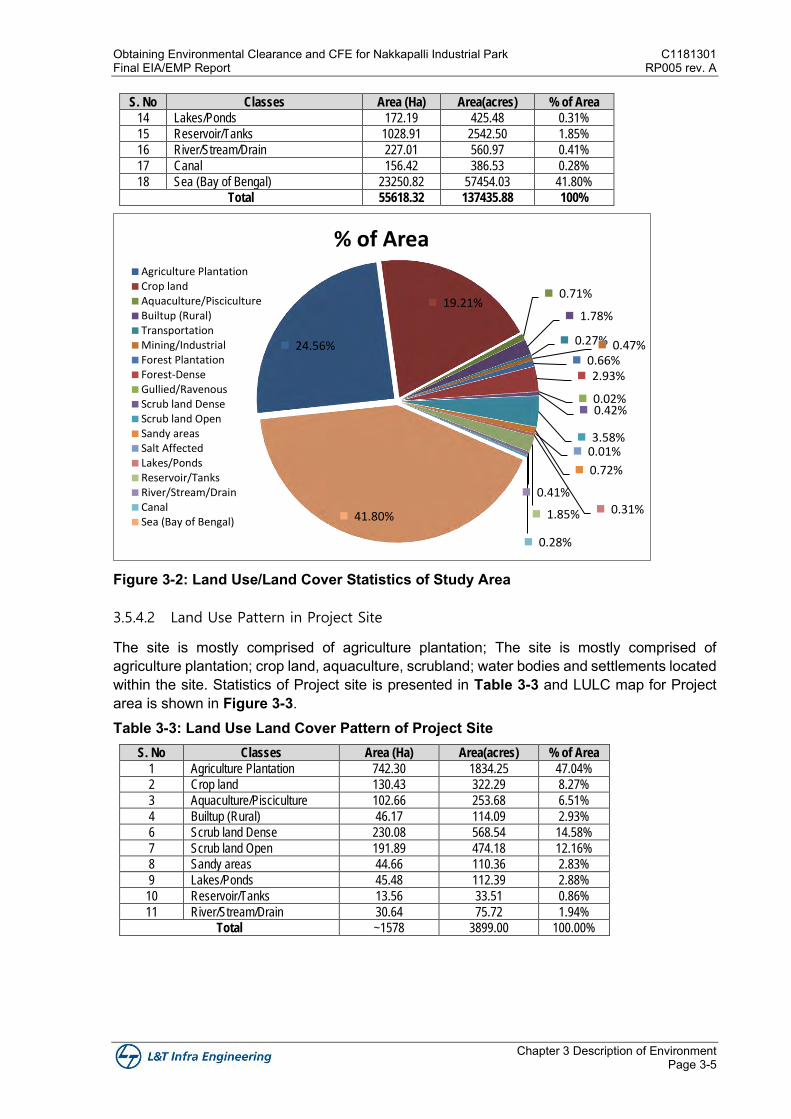
Obtaining Environmental Clearance and CFE for Nakkapalli Industrial Park C1181301 Final EIA/EMP Report RP005 rev. A
Chapter 3 Description of Environment Page 3-5
S. No Classes Area (Ha) Area(acres) % of Area
14 Lakes/Ponds 172.19 425.48 0.31%
15 Reservoir/Tanks 1028.91 2542.50 1.85%
16 River/Stream/Drain 227.01 560.97 0.41%
17 Canal 156.42 386.53 0.28%
18 Sea (Bay of Bengal) 23250.82 57454.03 41.80%
Total 55618.32 137435.88 100%
Figure 3-2: Land Use/Land Cover Statistics of Study Area
3.5.4.2 Land Use Pattern in Project Site
The site is mostly comprised of agriculture plantation; The site is mostly comprised of agriculture plantation; crop land, aquaculture, scrubland; water bodies and settlements located within the site. Statistics of Project site is presented in Table 3-3 and LULC map for Project area is shown in Figure 3-3. Table 3-3: Land Use Land Cover Pattern of Project Site
S. No Classes Area (Ha) Area(acres) % of Area
1 Agriculture Plantation 742.30 1834.25 47.04%
2 Crop land 130.43 322.29 8.27%
3 Aquaculture/Pisciculture 102.66 253.68 6.51%
4 Builtup (Rural) 46.17 114.09 2.93%
6 Scrub land Dense 230.08 568.54 14.58%
7 Scrub land Open 191.89 474.18 12.16%
8 Sandy areas 44.66 110.36 2.83%
9 Lakes/Ponds 45.48 112.39 2.88%
10 Reservoir/Tanks 13.56 33.51 0.86%
11 River/Stream/Drain 30.64 75.72 1.94%
Total ~1578 3899.00 100.00%
24.56%
19.21%0.71%
1.78%
0.27% 0.47%0.66%2.93%
0.02%0.42%
3.58%
0.72%
0.01%
0.31%1.85%
0.41%
0.28%
41.80%
% of AreaAgriculture PlantationCrop landAquaculture/PiscicultureBuiltup (Rural)TransportationMining/IndustrialForest PlantationForest-DenseGullied/RavenousScrub land DenseScrub land OpenSandy areasSalt AffectedLakes/PondsReservoir/TanksRiver/Stream/DrainCanalSea (Bay of Bengal)
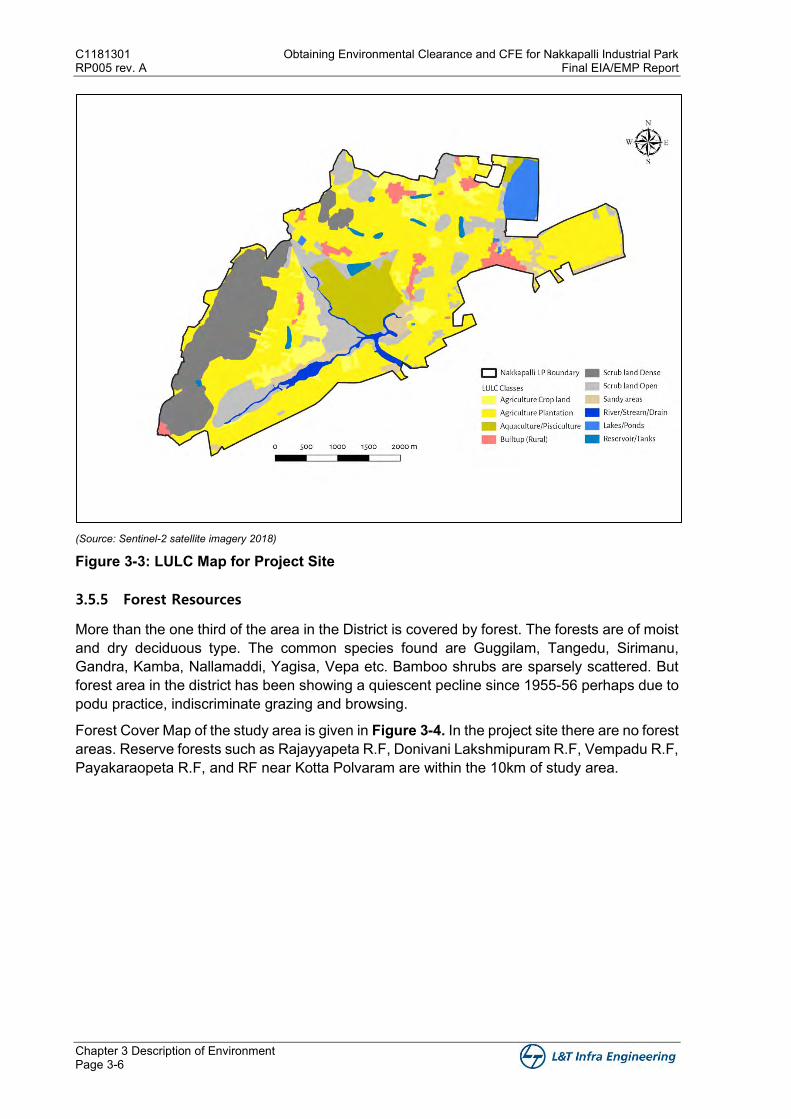
C1181301 Obtaining Environmental Clearance and CFE for Nakkapalli Industrial Park RP005 rev. A Final EIA/EMP Report
Chapter 3 Description of Environment Page 3-6
(Source: Sentinel-2 satellite imagery 2018)
Figure 3-3: LULC Map for Project Site
3.5.5 Forest Resources
More than the one third of the area in the District is covered by forest. The forests are of moist and dry deciduous type. The common species found are Guggilam, Tangedu, Sirimanu, Gandra, Kamba, Nallamaddi, Yagisa, Vepa etc. Bamboo shrubs are sparsely scattered. But forest area in the district has been showing a quiescent pecline since 1955-56 perhaps due to podu practice, indiscriminate grazing and browsing.
Forest Cover Map of the study area is given in Figure 3-4. In the project site there are no forest areas. Reserve forests such as Rajayyapeta R.F, Donivani Lakshmipuram R.F, Vempadu R.F, Payakaraopeta R.F, and RF near Kotta Polvaram are within the 10km of study area.
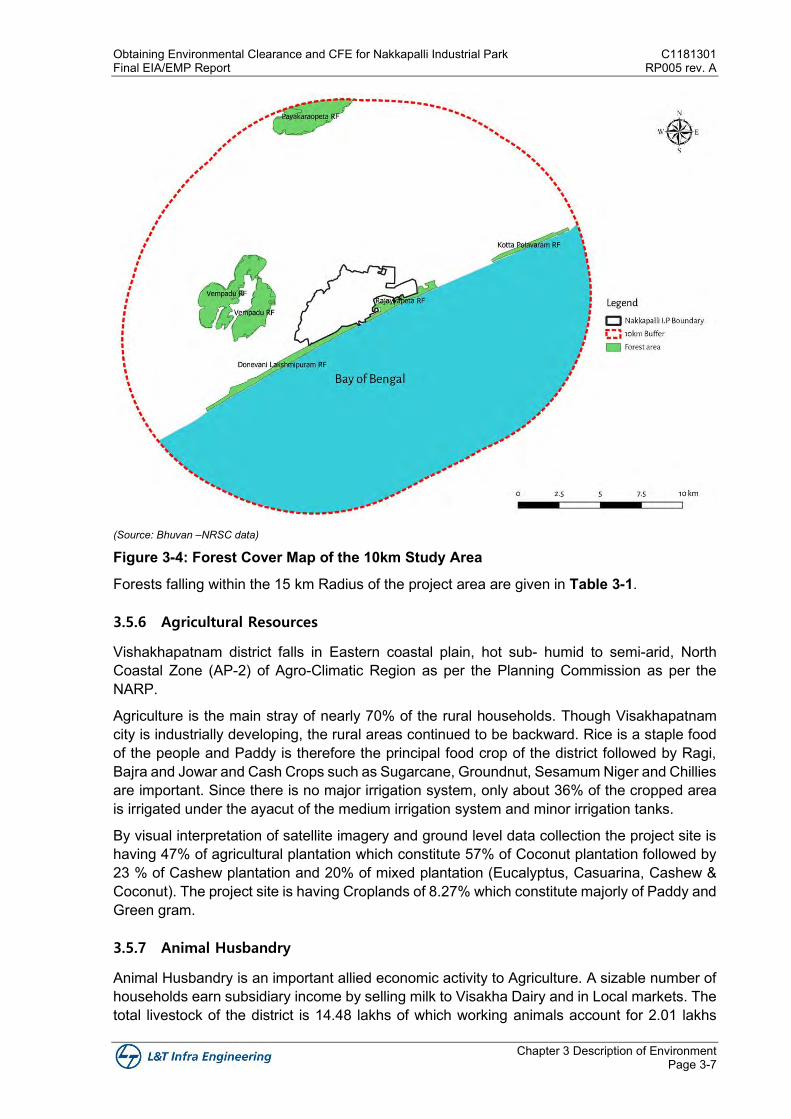
Obtaining Environmental Clearance and CFE for Nakkapalli Industrial Park C1181301 Final EIA/EMP Report RP005 rev. A
Chapter 3 Description of Environment Page 3-7
(Source: Bhuvan –NRSC data)
Figure 3-4: Forest Cover Map of the 10km Study Area
Forests falling within the 15 km Radius of the project area are given in Table 3-1.
3.5.6 Agricultural Resources
Vishakhapatnam district falls in Eastern coastal plain, hot sub- humid to semi-arid, North Coastal Zone (AP-2) of Agro-Climatic Region as per the Planning Commission as per the NARP.
Agriculture is the main stray of nearly 70% of the rural households. Though Visakhapatnam city is industrially developing, the rural areas continued to be backward. Rice is a staple food of the people and Paddy is therefore the principal food crop of the district followed by Ragi, Bajra and Jowar and Cash Crops such as Sugarcane, Groundnut, Sesamum Niger and Chillies are important. Since there is no major irrigation system, only about 36% of the cropped area is irrigated under the ayacut of the medium irrigation system and minor irrigation tanks.
By visual interpretation of satellite imagery and ground level data collection the project site is having 47% of agricultural plantation which constitute 57% of Coconut plantation followed by 23 % of Cashew plantation and 20% of mixed plantation (Eucalyptus, Casuarina, Cashew & Coconut). The project site is having Croplands of 8.27% which constitute majorly of Paddy and Green gram.
3.5.7 Animal Husbandry
Animal Husbandry is an important allied economic activity to Agriculture. A sizable number of households earn subsidiary income by selling milk to Visakha Dairy and in Local markets. The total livestock of the district is 14.48 lakhs of which working animals account for 2.01 lakhs
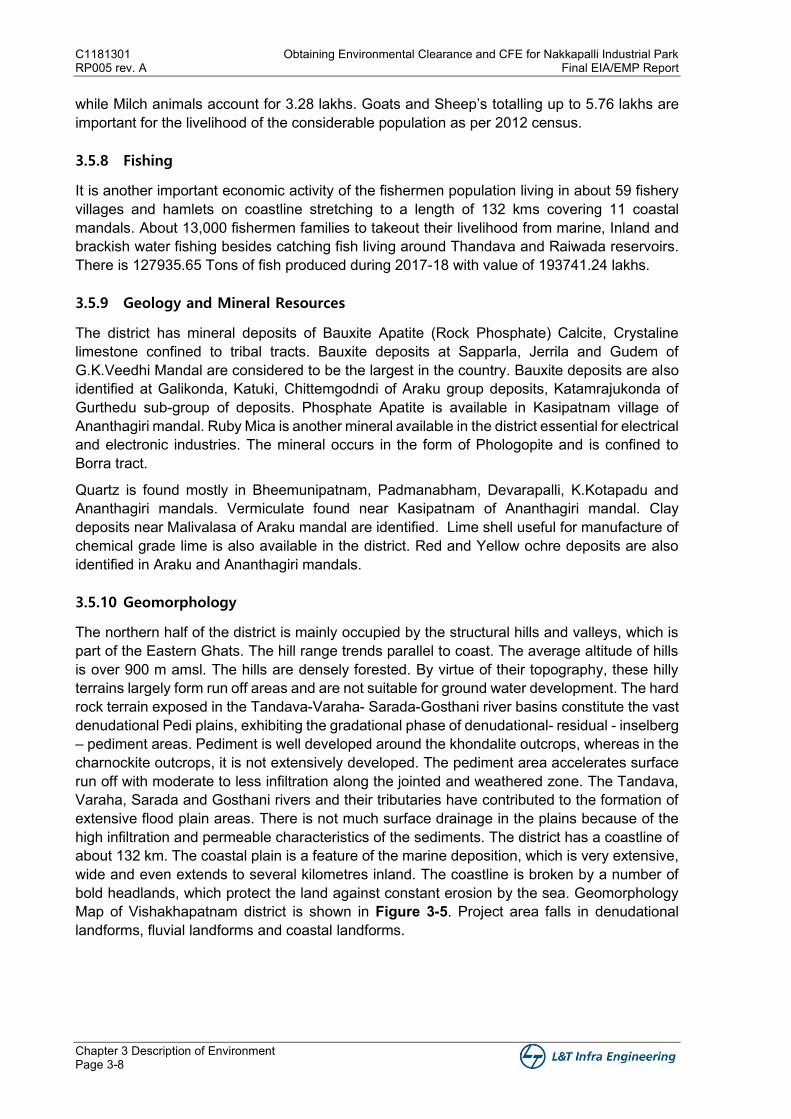
C1181301 Obtaining Environmental Clearance and CFE for Nakkapalli Industrial Park RP005 rev. A Final EIA/EMP Report
Chapter 3 Description of Environment Page 3-8
while Milch animals account for 3.28 lakhs. Goats and Sheep’s totalling up to 5.76 lakhs are important for the livelihood of the considerable population as per 2012 census.
3.5.8 Fishing
It is another important economic activity of the fishermen population living in about 59 fishery villages and hamlets on coastline stretching to a length of 132 kms covering 11 coastal mandals. About 13,000 fishermen families to takeout their livelihood from marine, Inland and brackish water fishing besides catching fish living around Thandava and Raiwada reservoirs. There is 127935.65 Tons of fish produced during 2017-18 with value of 193741.24 lakhs.
3.5.9 Geology and Mineral Resources
The district has mineral deposits of Bauxite Apatite (Rock Phosphate) Calcite, Crystaline limestone confined to tribal tracts. Bauxite deposits at Sapparla, Jerrila and Gudem of G.K.Veedhi Mandal are considered to be the largest in the country. Bauxite deposits are also identified at Galikonda, Katuki, Chittemgodndi of Araku group deposits, Katamrajukonda of Gurthedu sub-group of deposits. Phosphate Apatite is available in Kasipatnam village of Ananthagiri mandal. Ruby Mica is another mineral available in the district essential for electrical and electronic industries. The mineral occurs in the form of Phologopite and is confined to Borra tract.
Quartz is found mostly in Bheemunipatnam, Padmanabham, Devarapalli, K.Kotapadu and Ananthagiri mandals. Vermiculate found near Kasipatnam of Ananthagiri mandal. Clay deposits near Malivalasa of Araku mandal are identified. Lime shell useful for manufacture of chemical grade lime is also available in the district. Red and Yellow ochre deposits are also identified in Araku and Ananthagiri mandals.
3.5.10 Geomorphology
The northern half of the district is mainly occupied by the structural hills and valleys, which is part of the Eastern Ghats. The hill range trends parallel to coast. The average altitude of hills is over 900 m amsl. The hills are densely forested. By virtue of their topography, these hilly terrains largely form run off areas and are not suitable for ground water development. The hard rock terrain exposed in the Tandava-Varaha- Sarada-Gosthani river basins constitute the vast denudational Pedi plains, exhibiting the gradational phase of denudational- residual - inselberg – pediment areas. Pediment is well developed around the khondalite outcrops, whereas in the charnockite outcrops, it is not extensively developed. The pediment area accelerates surface run off with moderate to less infiltration along the jointed and weathered zone. The Tandava, Varaha, Sarada and Gosthani rivers and their tributaries have contributed to the formation of extensive flood plain areas. There is not much surface drainage in the plains because of the high infiltration and permeable characteristics of the sediments. The district has a coastline of about 132 km. The coastal plain is a feature of the marine deposition, which is very extensive, wide and even extends to several kilometres inland. The coastline is broken by a number of bold headlands, which protect the land against constant erosion by the sea. Geomorphology Map of Vishakhapatnam district is shown in Figure 3-5. Project area falls in denudational landforms, fluvial landforms and coastal landforms.
Obtaining Environmental Clearance and CFE for Nakkapalli Industrial Park C1181301 Final EIA/EMP Report RP005 rev. A
Chapter 3 Description of Environment Page 3-9
(Source: District Survey Report Visakhapatnam District, APSAC, ITE & C Department, Govt. of Andhra Pradesh, 2018)
Figure 3-5: Geomorphology Map of Visakhapatnam district
3.5.11 Irrigation Resources
The district is served with both surface and ground water irrigation sources. Medium and minor irrigation projects exist in the district. The important medium irrigation projects are Thandava, Konam, Kalyanapulova and Raiwada reservoirs. The other reservoirs are Ravanapalli and Gambheeramgedda. The total net area irrigated is 1,17,142 ha by means of all sources of irrigation available in the district. The net area irrigated through canals and tanks is 78,500 ha, and other source is 22,964 ha. The net area irrigated through dug wells and bore/tube wells is 14,678 ha11. Figure 3-6 shows the geomorphology map of the study area and Figure 3-7 shows the lineament map of the study area.
11 Ground Water Brochure, Visakhapatnam District, Andhra Pradesh, 2013
Project Site
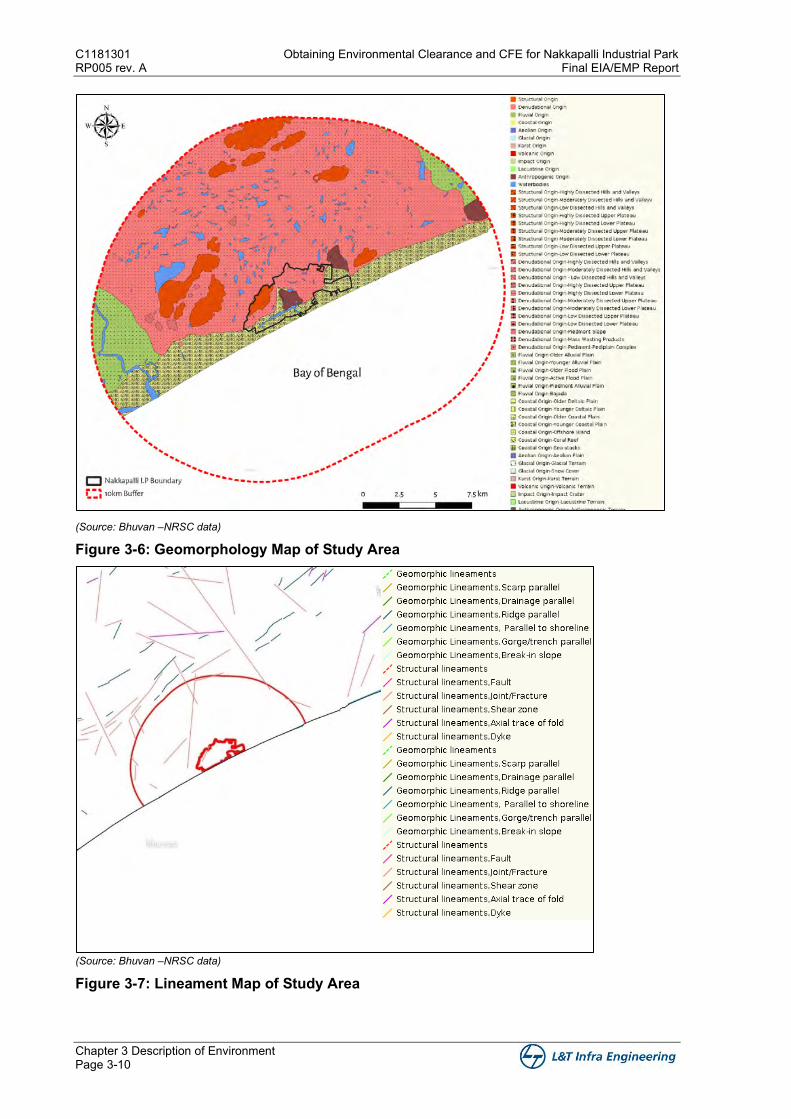
C1181301 Obtaining Environmental Clearance and CFE for Nakkapalli Industrial Park RP005 rev. A Final EIA/EMP Report
Chapter 3 Description of Environment Page 3-10
(Source: Bhuvan –NRSC data)
Figure 3-6: Geomorphology Map of Study Area
(Source: Bhuvan –NRSC data)
Figure 3-7: Lineament Map of Study Area
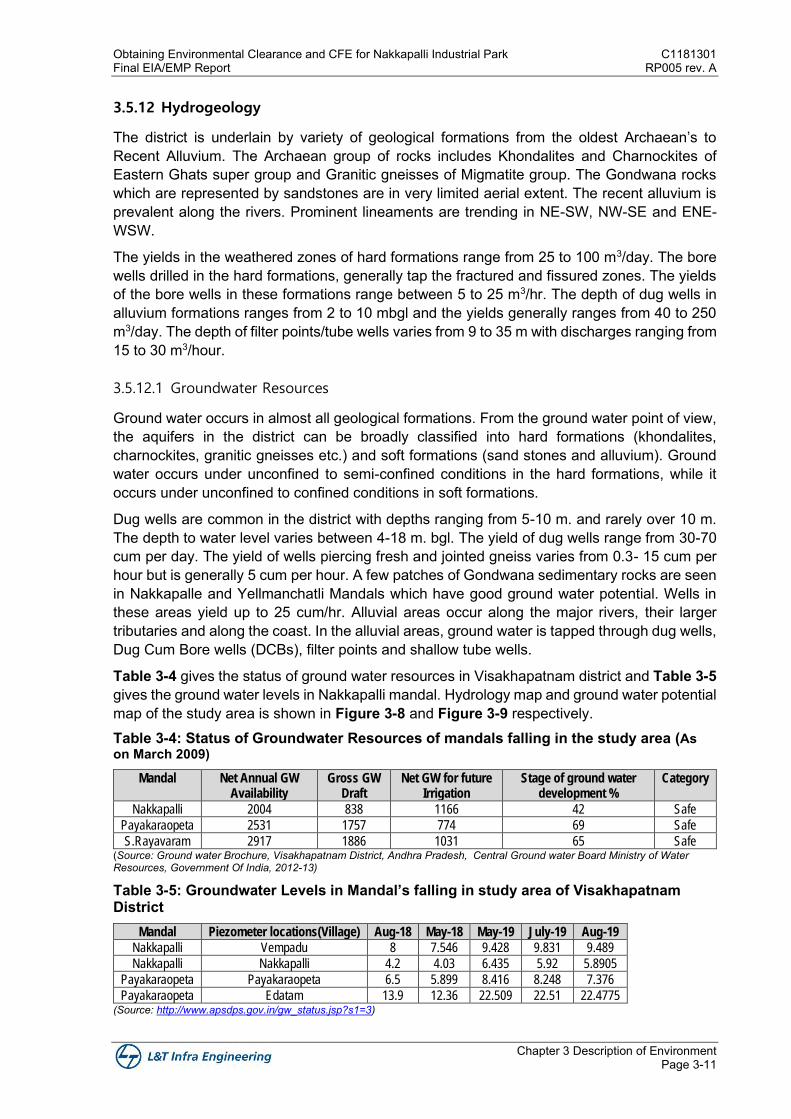
Obtaining Environmental Clearance and CFE for Nakkapalli Industrial Park C1181301 Final EIA/EMP Report RP005 rev. A
Chapter 3 Description of Environment Page 3-11
3.5.12 Hydrogeology
The district is underlain by variety of geological formations from the oldest Archaean’s to Recent Alluvium. The Archaean group of rocks includes Khondalites and Charnockites of Eastern Ghats super group and Granitic gneisses of Migmatite group. The Gondwana rocks which are represented by sandstones are in very limited aerial extent. The recent alluvium is prevalent along the rivers. Prominent lineaments are trending in NE-SW, NW-SE and ENE-WSW.
The yields in the weathered zones of hard formations range from 25 to 100 m3/day. The bore wells drilled in the hard formations, generally tap the fractured and fissured zones. The yields of the bore wells in these formations range between 5 to 25 m3/hr. The depth of dug wells in alluvium formations ranges from 2 to 10 mbgl and the yields generally ranges from 40 to 250 m3/day. The depth of filter points/tube wells varies from 9 to 35 m with discharges ranging from 15 to 30 m3/hour.
3.5.12.1 Groundwater Resources
Ground water occurs in almost all geological formations. From the ground water point of view, the aquifers in the district can be broadly classified into hard formations (khondalites, charnockites, granitic gneisses etc.) and soft formations (sand stones and alluvium). Ground water occurs under unconfined to semi-confined conditions in the hard formations, while it occurs under unconfined to confined conditions in soft formations.
Dug wells are common in the district with depths ranging from 5-10 m. and rarely over 10 m. The depth to water level varies between 4-18 m. bgl. The yield of dug wells range from 30-70 cum per day. The yield of wells piercing fresh and jointed gneiss varies from 0.3- 15 cum per hour but is generally 5 cum per hour. A few patches of Gondwana sedimentary rocks are seen in Nakkapalle and Yellmanchatli Mandals which have good ground water potential. Wells in these areas yield up to 25 cum/hr. Alluvial areas occur along the major rivers, their larger tributaries and along the coast. In the alluvial areas, ground water is tapped through dug wells, Dug Cum Bore wells (DCBs), filter points and shallow tube wells.
Table 3-4 gives the status of ground water resources in Visakhapatnam district and Table 3-5 gives the ground water levels in Nakkapalli mandal. Hydrology map and ground water potential map of the study area is shown in Figure 3-8 and Figure 3-9 respectively. Table 3-4: Status of Groundwater Resources of mandals falling in the study area (As on March 2009)
Mandal Net Annual GW Availability
Gross GW Draft
Net GW for future Irrigation
Stage of ground water development %
Category
Nakkapalli 2004 838 1166 42 Safe
Payakaraopeta 2531 1757 774 69 Safe
S.Rayavaram 2917 1886 1031 65 Safe (Source: Ground water Brochure, Visakhapatnam District, Andhra Pradesh, Central Ground water Board Ministry of Water Resources, Government Of India, 2012-13)
Table 3-5: Groundwater Levels in Mandal’s falling in study area of Visakhapatnam District
Mandal Piezometer locations(Village) Aug-18 May-18 May-19 July-19 Aug-19
Nakkapalli Vempadu 8 7.546 9.428 9.831 9.489
Nakkapalli Nakkapalli 4.2 4.03 6.435 5.92 5.8905
Payakaraopeta Payakaraopeta 6.5 5.899 8.416 8.248 7.376
Payakaraopeta Edatam 13.9 12.36 22.509 22.51 22.4775 (Source: http://www.apsdps.gov.in/gw_status.jsp?s1=3)
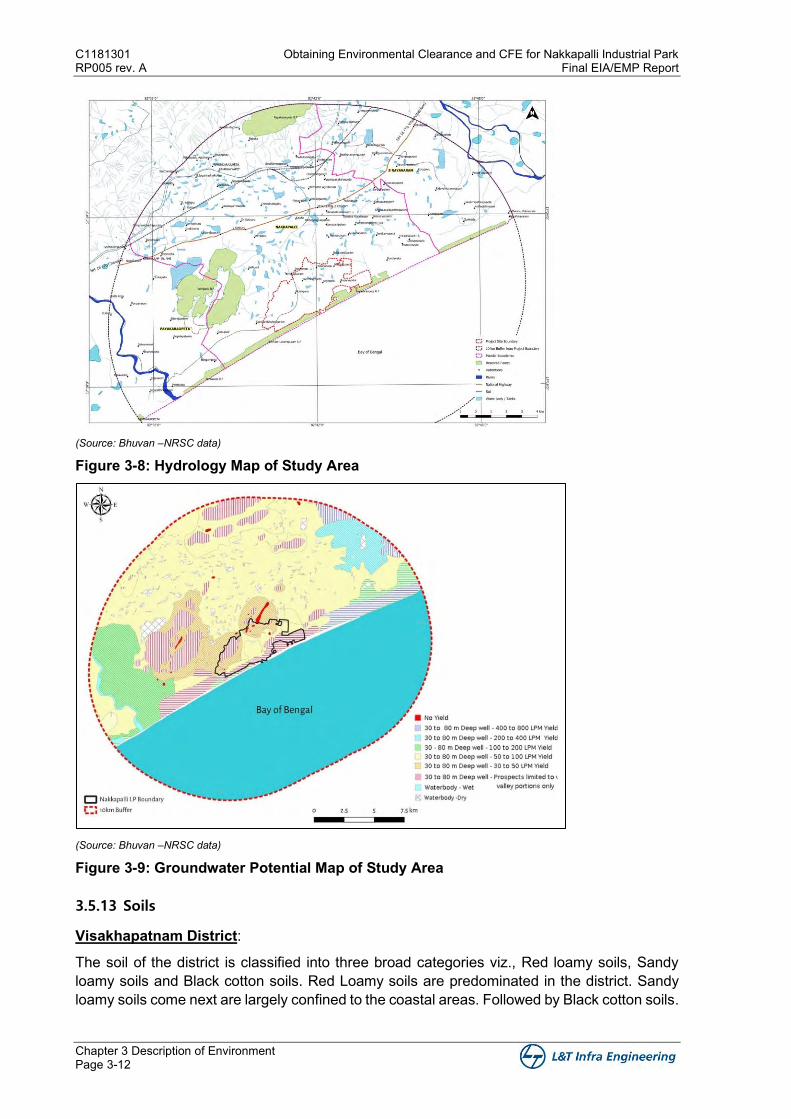
C1181301 Obtaining Environmental Clearance and CFE for Nakkapalli Industrial Park RP005 rev. A Final EIA/EMP Report
Chapter 3 Description of Environment Page 3-12
(Source: Bhuvan –NRSC data)
Figure 3-8: Hydrology Map of Study Area
(Source: Bhuvan –NRSC data)
Figure 3-9: Groundwater Potential Map of Study Area
3.5.13 Soils
Visakhapatnam District:
The soil of the district is classified into three broad categories viz., Red loamy soils, Sandy loamy soils and Black cotton soils. Red Loamy soils are predominated in the district. Sandy loamy soils come next are largely confined to the coastal areas. Followed by Black cotton soils.
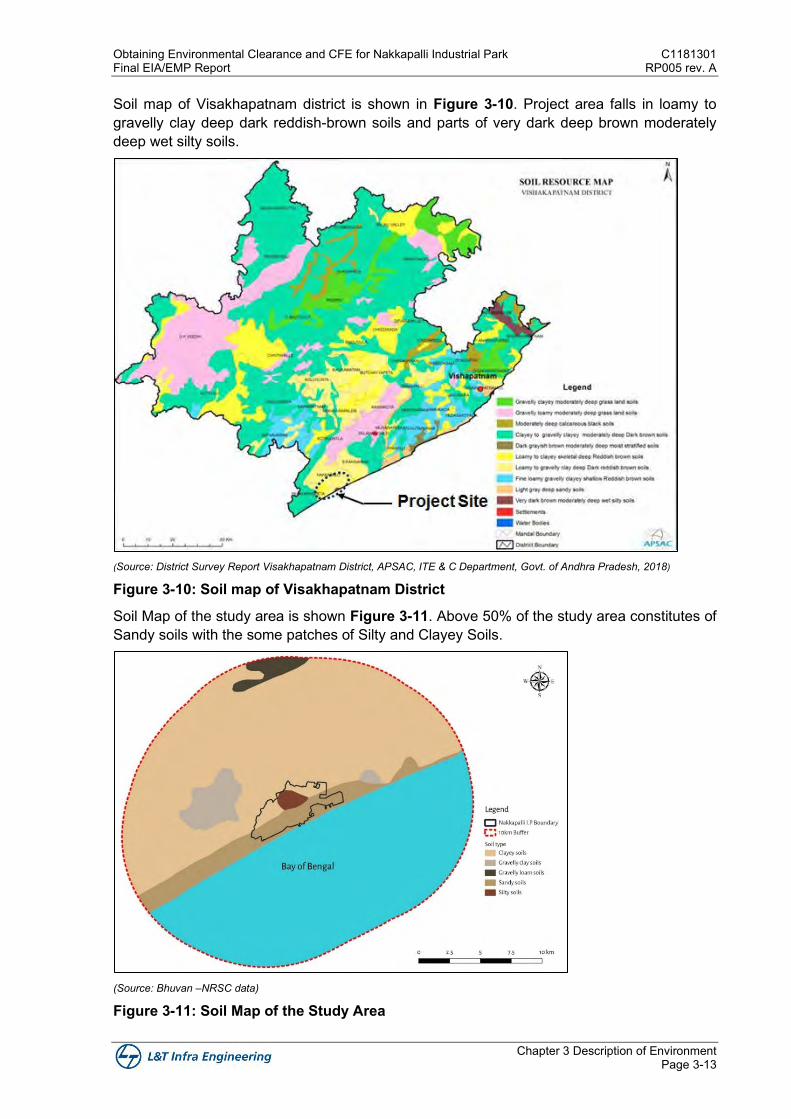
Obtaining Environmental Clearance and CFE for Nakkapalli Industrial Park C1181301 Final EIA/EMP Report RP005 rev. A
Chapter 3 Description of Environment Page 3-13
Soil map of Visakhapatnam district is shown in Figure 3-10. Project area falls in loamy to gravelly clay deep dark reddish-brown soils and parts of very dark deep brown moderately deep wet silty soils.
(Source: District Survey Report Visakhapatnam District, APSAC, ITE & C Department, Govt. of Andhra Pradesh, 2018)
Figure 3-10: Soil map of Visakhapatnam District
Soil Map of the study area is shown Figure 3-11. Above 50% of the study area constitutes of Sandy soils with the some patches of Silty and Clayey Soils.
(Source: Bhuvan –NRSC data)
Figure 3-11: Soil Map of the Study Area
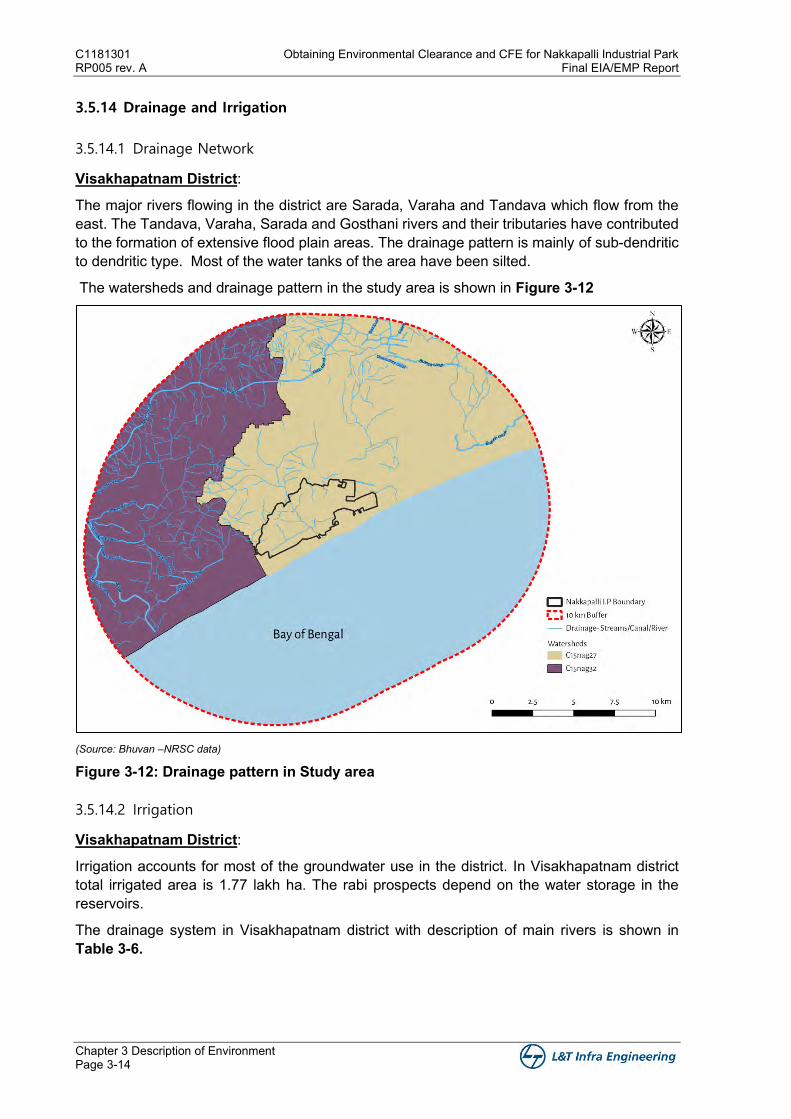
C1181301 Obtaining Environmental Clearance and CFE for Nakkapalli Industrial Park RP005 rev. A Final EIA/EMP Report
Chapter 3 Description of Environment Page 3-14
3.5.14 Drainage and Irrigation
3.5.14.1 Drainage Network
Visakhapatnam District:
The major rivers flowing in the district are Sarada, Varaha and Tandava which flow from the east. The Tandava, Varaha, Sarada and Gosthani rivers and their tributaries have contributed to the formation of extensive flood plain areas. The drainage pattern is mainly of sub-dendritic to dendritic type. Most of the water tanks of the area have been silted.
The watersheds and drainage pattern in the study area is shown in Figure 3-12
(Source: Bhuvan –NRSC data)
Figure 3-12: Drainage pattern in Study area
3.5.14.2 Irrigation
Visakhapatnam District:
Irrigation accounts for most of the groundwater use in the district. In Visakhapatnam district total irrigated area is 1.77 lakh ha. The rabi prospects depend on the water storage in the reservoirs.
The drainage system in Visakhapatnam district with description of main rivers is shown in Table 3-6.
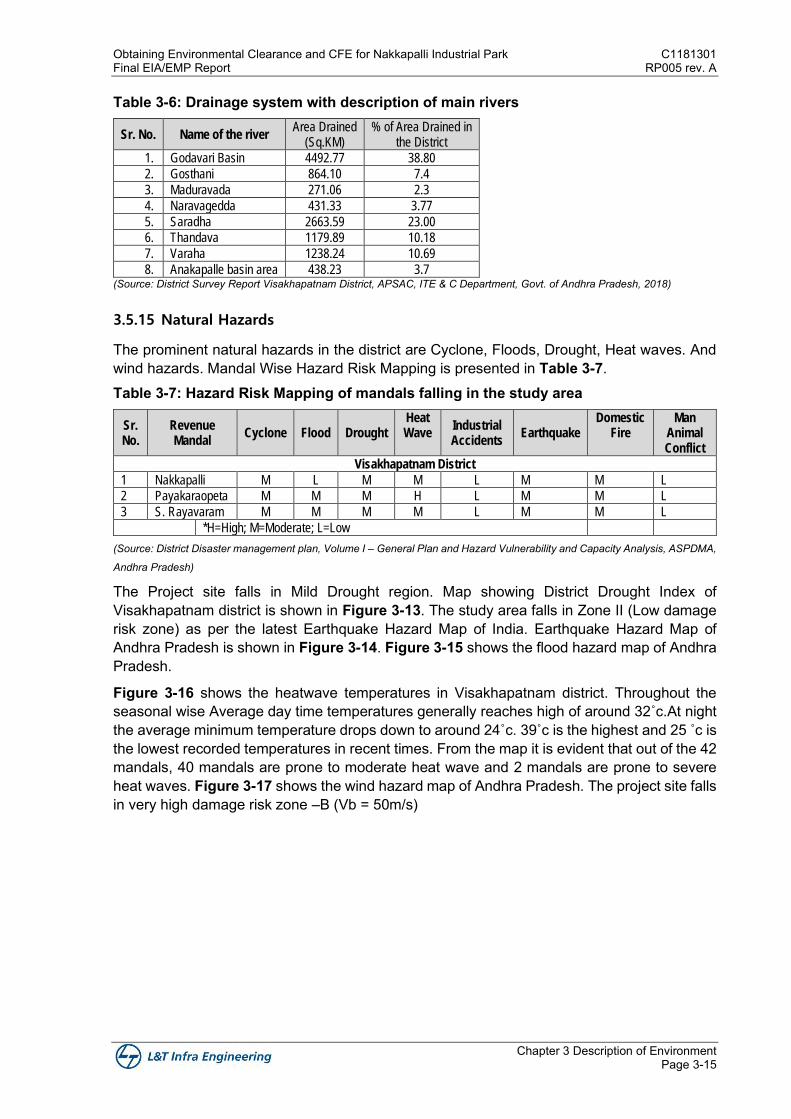
Obtaining Environmental Clearance and CFE for Nakkapalli Industrial Park C1181301 Final EIA/EMP Report RP005 rev. A
Chapter 3 Description of Environment Page 3-15
Table 3-6: Drainage system with description of main rivers
Sr. No. Name of the river Area Drained
(Sq.KM) % of Area Drained in
the District
1. Godavari Basin 4492.77 38.80
2. Gosthani 864.10 7.4
3. Maduravada 271.06 2.3
4. Naravagedda 431.33 3.77
5. Saradha 2663.59 23.00
6. Thandava 1179.89 10.18
7. Varaha 1238.24 10.69
8. Anakapalle basin area 438.23 3.7 (Source: District Survey Report Visakhapatnam District, APSAC, ITE & C Department, Govt. of Andhra Pradesh, 2018)
3.5.15 Natural Hazards
The prominent natural hazards in the district are Cyclone, Floods, Drought, Heat waves. And wind hazards. Mandal Wise Hazard Risk Mapping is presented in Table 3-7. Table 3-7: Hazard Risk Mapping of mandals falling in the study area
Sr. No.
Revenue Mandal
Cyclone Flood Drought Heat Wave
Industrial Accidents
Earthquake Domestic
Fire Man
Animal Conflict
Visakhapatnam District
1 Nakkapalli M L M M L M M L
2 Payakaraopeta M M M H L M M L
3 S. Rayavaram M M M M L M M L
*H=High; M=Moderate; L=Low
(Source: District Disaster management plan, Volume I – General Plan and Hazard Vulnerability and Capacity Analysis, ASPDMA,
Andhra Pradesh)
The Project site falls in Mild Drought region. Map showing District Drought Index of Visakhapatnam district is shown in Figure 3-13. The study area falls in Zone II (Low damage risk zone) as per the latest Earthquake Hazard Map of India. Earthquake Hazard Map of Andhra Pradesh is shown in Figure 3-14. Figure 3-15 shows the flood hazard map of Andhra Pradesh.
Figure 3-16 shows the heatwave temperatures in Visakhapatnam district. Throughout the seasonal wise Average day time temperatures generally reaches high of around 32˚c.At night the average minimum temperature drops down to around 24˚c. 39˚c is the highest and 25 ˚c is the lowest recorded temperatures in recent times. From the map it is evident that out of the 42 mandals, 40 mandals are prone to moderate heat wave and 2 mandals are prone to severe heat waves. Figure 3-17 shows the wind hazard map of Andhra Pradesh. The project site falls in very high damage risk zone –B (Vb = 50m/s)
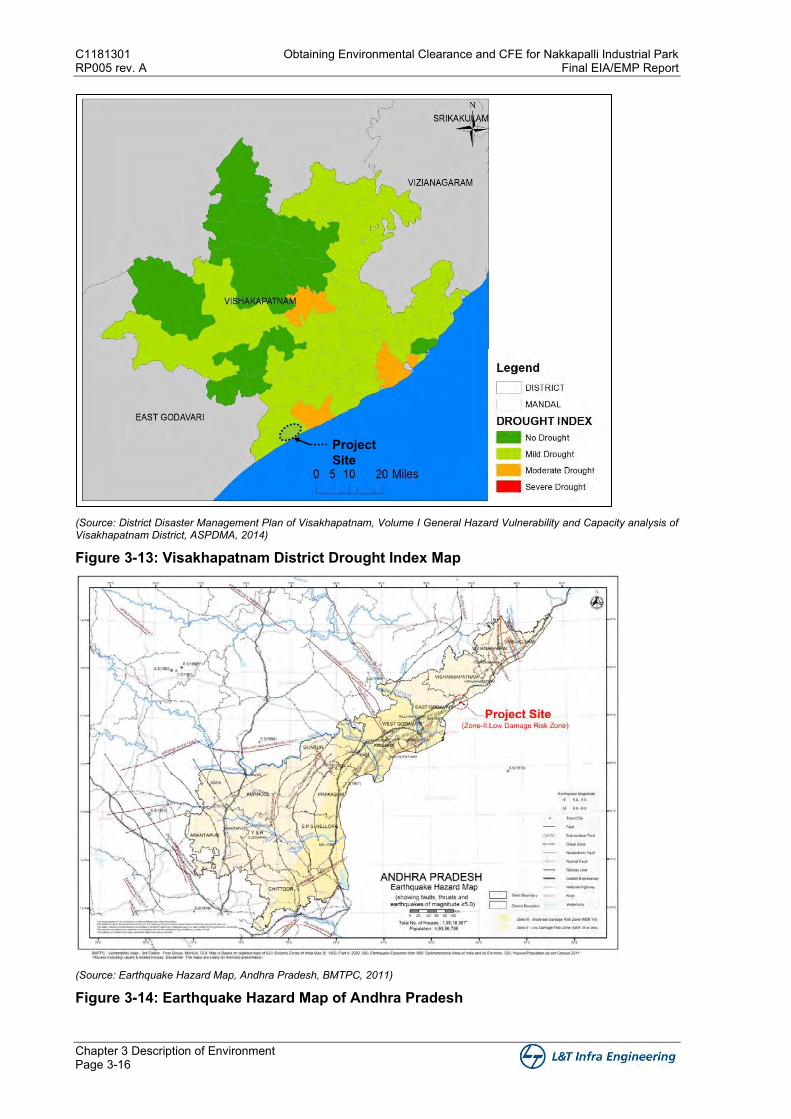
C1181301 Obtaining Environmental Clearance and CFE for Nakkapalli Industrial Park RP005 rev. A Final EIA/EMP Report
Chapter 3 Description of Environment Page 3-16
(Source: District Disaster Management Plan of Visakhapatnam, Volume I General Hazard Vulnerability and Capacity analysis of Visakhapatnam District, ASPDMA, 2014)
Figure 3-13: Visakhapatnam District Drought Index Map
(Source: Earthquake Hazard Map, Andhra Pradesh, BMTPC, 2011)
Figure 3-14: Earthquake Hazard Map of Andhra Pradesh
Project Site
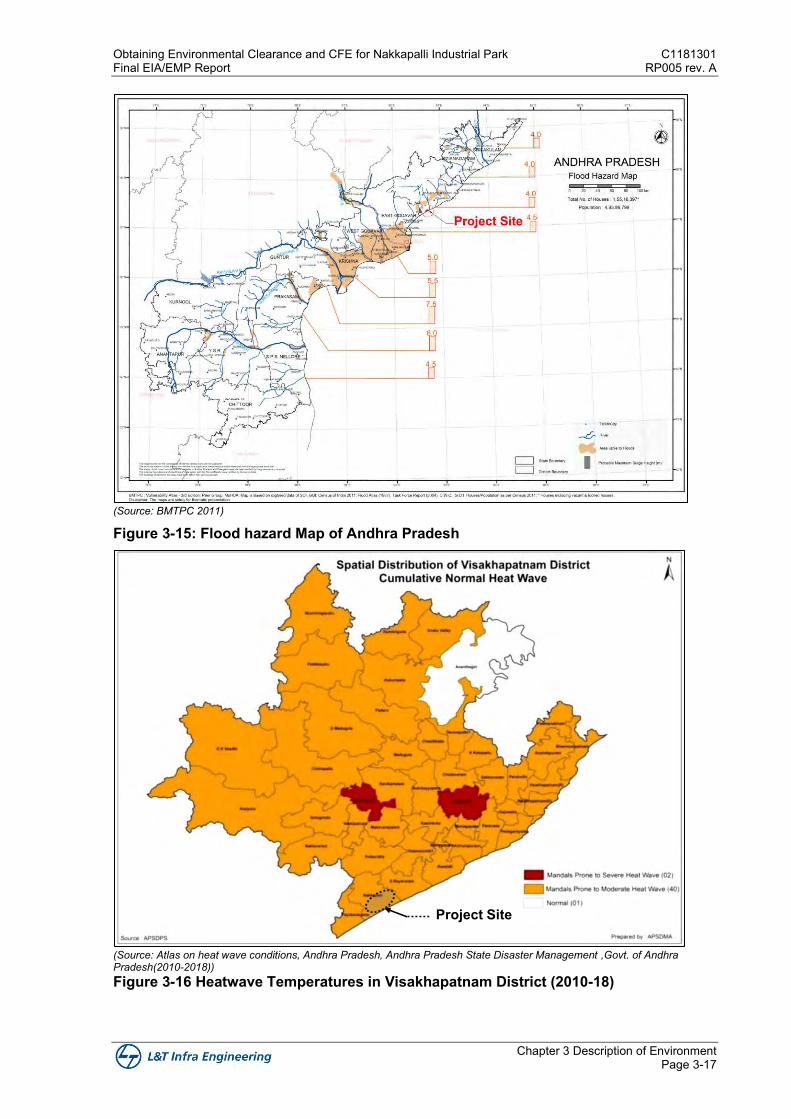
Obtaining Environmental Clearance and CFE for Nakkapalli Industrial Park C1181301 Final EIA/EMP Report RP005 rev. A
Chapter 3 Description of Environment Page 3-17
(Source: BMTPC 2011)
Figure 3-15: Flood hazard Map of Andhra Pradesh
(Source: Atlas on heat wave conditions, Andhra Pradesh, Andhra Pradesh State Disaster Management ,Govt. of Andhra Pradesh(2010-2018)) Figure 3-16 Heatwave Temperatures in Visakhapatnam District (2010-18)
Project Site
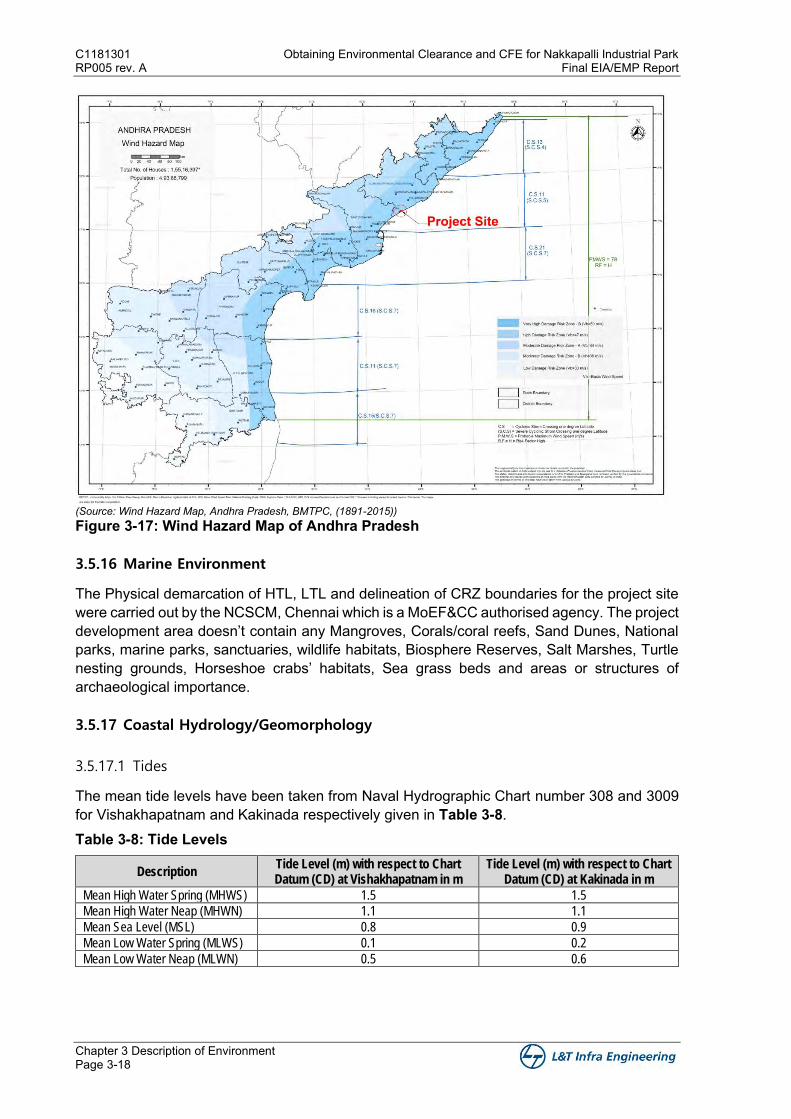
C1181301 Obtaining Environmental Clearance and CFE for Nakkapalli Industrial Park RP005 rev. A Final EIA/EMP Report
Chapter 3 Description of Environment Page 3-18
(Source: Wind Hazard Map, Andhra Pradesh, BMTPC, (1891-2015)) Figure 3-17: Wind Hazard Map of Andhra Pradesh
3.5.16 Marine Environment
The Physical demarcation of HTL, LTL and delineation of CRZ boundaries for the project site were carried out by the NCSCM, Chennai which is a MoEF&CC authorised agency. The project development area doesn’t contain any Mangroves, Corals/coral reefs, Sand Dunes, National parks, marine parks, sanctuaries, wildlife habitats, Biosphere Reserves, Salt Marshes, Turtle nesting grounds, Horseshoe crabs’ habitats, Sea grass beds and areas or structures of archaeological importance.
3.5.17 Coastal Hydrology/Geomorphology
3.5.17.1 Tides
The mean tide levels have been taken from Naval Hydrographic Chart number 308 and 3009 for Vishakhapatnam and Kakinada respectively given in Table 3-8. Table 3-8: Tide Levels
Description Tide Level (m) with respect to Chart Datum (CD) at Vishakhapatnam in m
Tide Level (m) with respect to Chart Datum (CD) at Kakinada in m
Mean High Water Spring (MHWS) 1.5 1.5
Mean High Water Neap (MHWN) 1.1 1.1
Mean Sea Level (MSL) 0.8 0.9
Mean Low Water Spring (MLWS) 0.1 0.2
Mean Low Water Neap (MLWN) 0.5 0.6
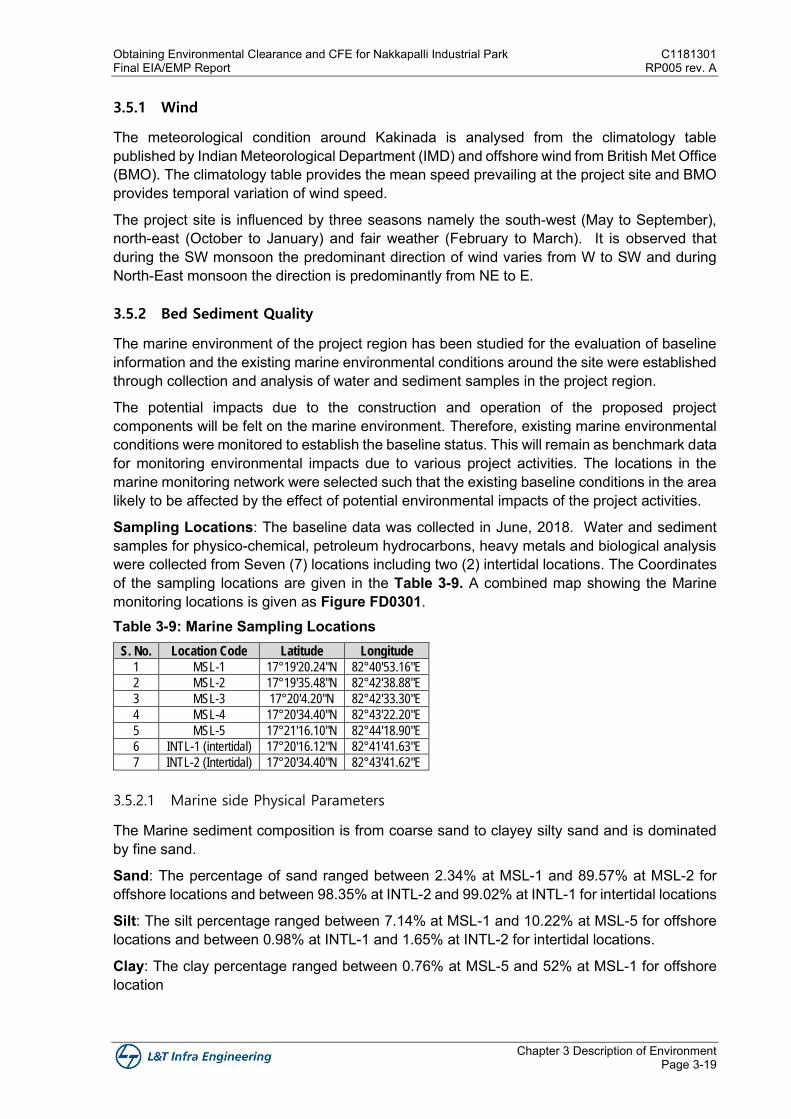
Obtaining Environmental Clearance and CFE for Nakkapalli Industrial Park C1181301 Final EIA/EMP Report RP005 rev. A
Chapter 3 Description of Environment Page 3-19
3.5.1 Wind
The meteorological condition around Kakinada is analysed from the climatology table published by Indian Meteorological Department (IMD) and offshore wind from British Met Office (BMO). The climatology table provides the mean speed prevailing at the project site and BMO provides temporal variation of wind speed.
The project site is influenced by three seasons namely the south-west (May to September), north-east (October to January) and fair weather (February to March). It is observed that during the SW monsoon the predominant direction of wind varies from W to SW and during North-East monsoon the direction is predominantly from NE to E.
3.5.2 Bed Sediment Quality
The marine environment of the project region has been studied for the evaluation of baseline information and the existing marine environmental conditions around the site were established through collection and analysis of water and sediment samples in the project region.
The potential impacts due to the construction and operation of the proposed project components will be felt on the marine environment. Therefore, existing marine environmental conditions were monitored to establish the baseline status. This will remain as benchmark data for monitoring environmental impacts due to various project activities. The locations in the marine monitoring network were selected such that the existing baseline conditions in the area likely to be affected by the effect of potential environmental impacts of the project activities.
Sampling Locations: The baseline data was collected in June, 2018. Water and sediment samples for physico-chemical, petroleum hydrocarbons, heavy metals and biological analysis were collected from Seven (7) locations including two (2) intertidal locations. The Coordinates of the sampling locations are given in the Table 3-9. A combined map showing the Marine monitoring locations is given as Figure FD0301. Table 3-9: Marine Sampling Locations
S. No. Location Code Latitude Longitude
1 MSL-1 17°19'20.24"N 82°40'53.16"E
2 MSL-2 17°19'35.48"N 82°42'38.88"E
3 MSL-3 17°20'4.20"N 82°42'33.30"E
4 MSL-4 17°20'34.40"N 82°43'22.20"E
5 MSL-5 17°21'16.10"N 82°44'18.90"E
6 INTL-1 (intertidal) 17°20'16.12"N 82°41'41.63"E
7 INTL-2 (Intertidal) 17°20'34.40"N 82°43'41.62"E
3.5.2.1 Marine side Physical Parameters
The Marine sediment composition is from coarse sand to clayey silty sand and is dominated by fine sand.
Sand: The percentage of sand ranged between 2.34% at MSL-1 and 89.57% at MSL-2 for offshore locations and between 98.35% at INTL-2 and 99.02% at INTL-1 for intertidal locations
Silt: The silt percentage ranged between 7.14% at MSL-1 and 10.22% at MSL-5 for offshore locations and between 0.98% at INTL-1 and 1.65% at INTL-2 for intertidal locations.
Clay: The clay percentage ranged between 0.76% at MSL-5 and 52% at MSL-1 for offshore location
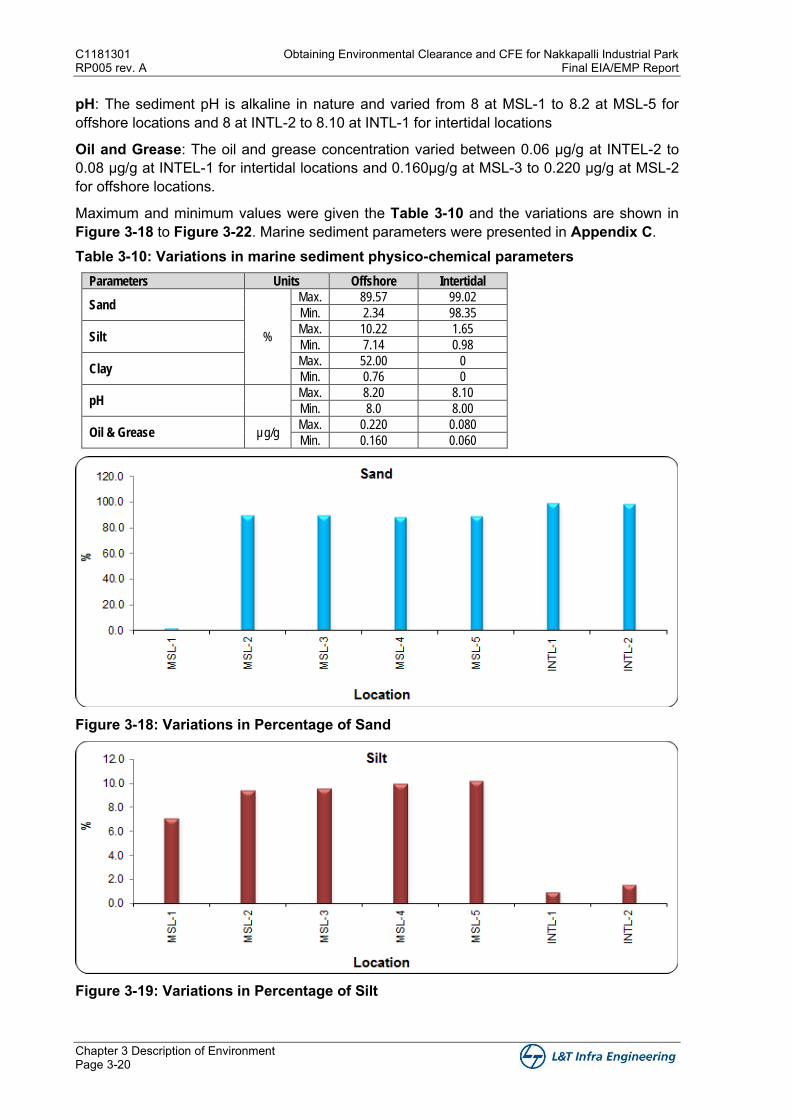
C1181301 Obtaining Environmental Clearance and CFE for Nakkapalli Industrial Park RP005 rev. A Final EIA/EMP Report
Chapter 3 Description of Environment Page 3-20
pH: The sediment pH is alkaline in nature and varied from 8 at MSL-1 to 8.2 at MSL-5 for offshore locations and 8 at INTL-2 to 8.10 at INTL-1 for intertidal locations
Oil and Grease: The oil and grease concentration varied between 0.06 μg/g at INTEL-2 to 0.08 μg/g at INTEL-1 for intertidal locations and 0.160μg/g at MSL-3 to 0.220 μg/g at MSL-2 for offshore locations.
Maximum and minimum values were given the Table 3-10 and the variations are shown in Figure 3-18 to Figure 3-22. Marine sediment parameters were presented in Appendix C. Table 3-10: Variations in marine sediment physico-chemical parameters
Parameters Units Offshore Intertidal
Sand
%
Max. 89.57 99.02
Min. 2.34 98.35
Silt Max. 10.22 1.65
Min. 7.14 0.98
Clay Max. 52.00 0
Min. 0.76 0
pH Max. 8.20 8.10
Min. 8.0 8.00
Oil & Grease µg/g Max. 0.220 0.080
Min. 0.160 0.060
Figure 3-18: Variations in Percentage of Sand
Figure 3-19: Variations in Percentage of Silt
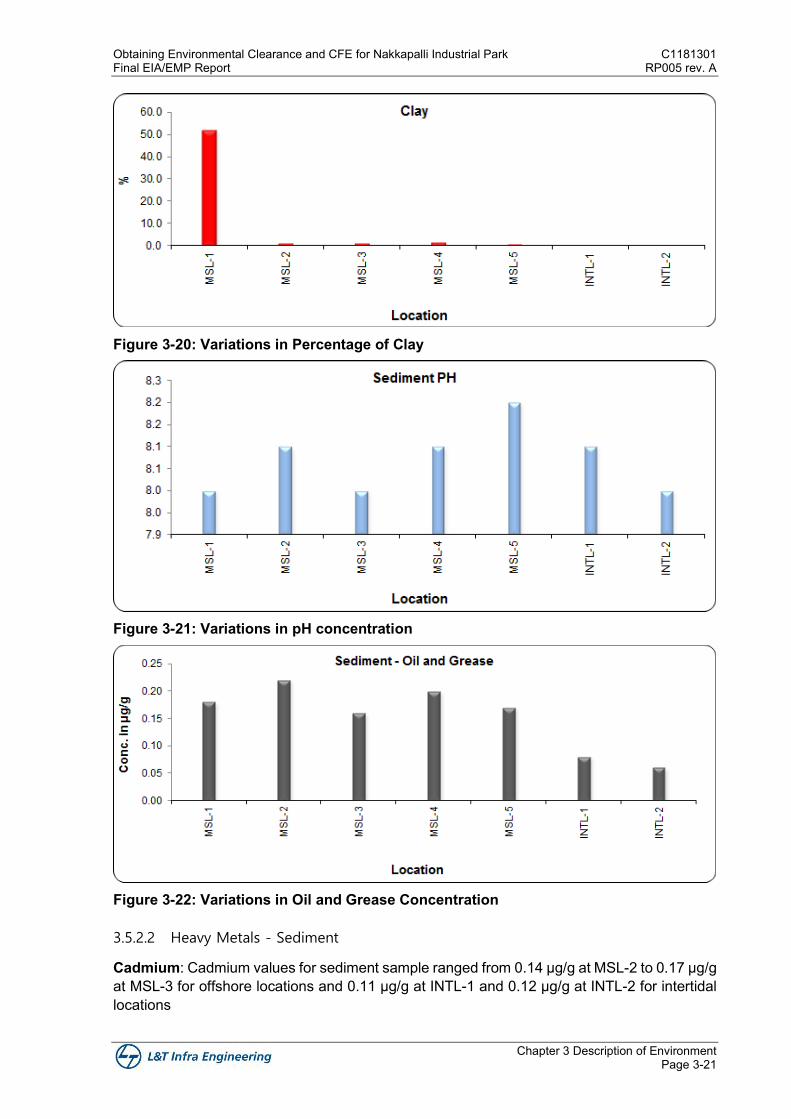
Obtaining Environmental Clearance and CFE for Nakkapalli Industrial Park C1181301 Final EIA/EMP Report RP005 rev. A
Chapter 3 Description of Environment Page 3-21
Figure 3-20: Variations in Percentage of Clay
Figure 3-21: Variations in pH concentration
Figure 3-22: Variations in Oil and Grease Concentration
3.5.2.2 Heavy Metals - Sediment
Cadmium: Cadmium values for sediment sample ranged from 0.14 µg/g at MSL-2 to 0.17 µg/g at MSL-3 for offshore locations and 0.11 µg/g at INTL-1 and 0.12 µg/g at INTL-2 for intertidal locations
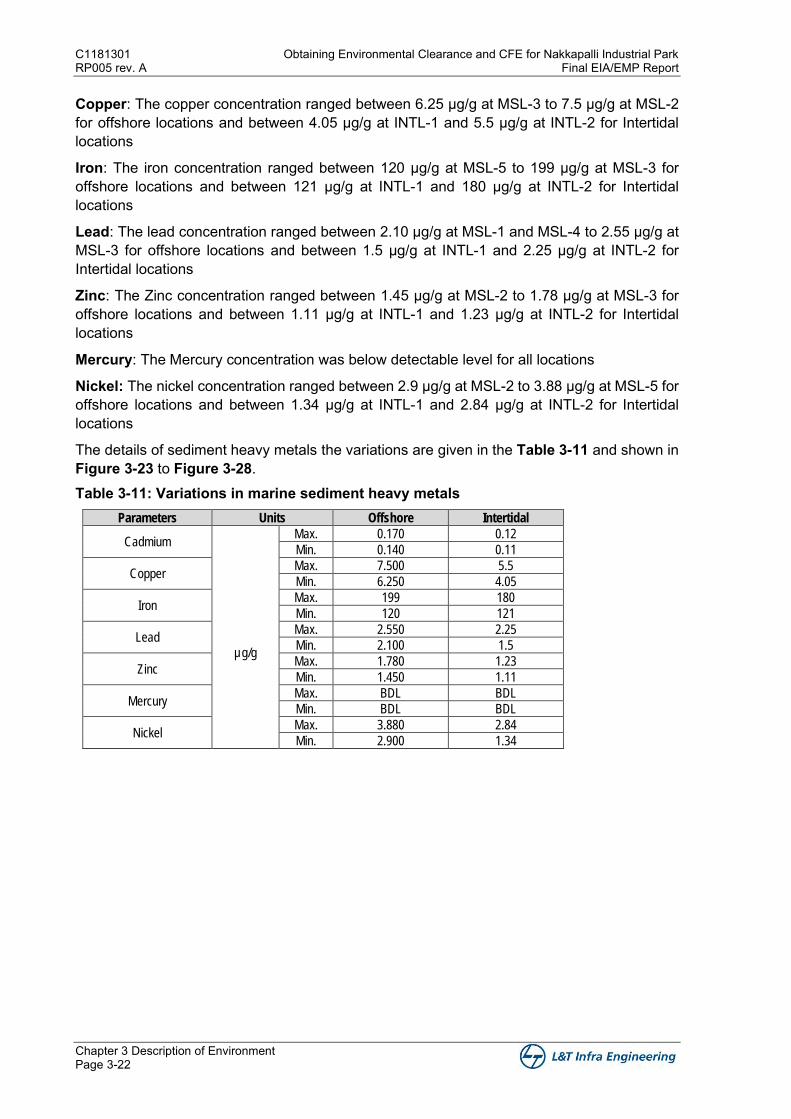
C1181301 Obtaining Environmental Clearance and CFE for Nakkapalli Industrial Park RP005 rev. A Final EIA/EMP Report
Chapter 3 Description of Environment Page 3-22
Copper: The copper concentration ranged between 6.25 µg/g at MSL-3 to 7.5 µg/g at MSL-2 for offshore locations and between 4.05 µg/g at INTL-1 and 5.5 µg/g at INTL-2 for Intertidal locations
Iron: The iron concentration ranged between 120 µg/g at MSL-5 to 199 µg/g at MSL-3 for offshore locations and between 121 µg/g at INTL-1 and 180 µg/g at INTL-2 for Intertidal locations
Lead: The lead concentration ranged between 2.10 µg/g at MSL-1 and MSL-4 to 2.55 µg/g at MSL-3 for offshore locations and between 1.5 µg/g at INTL-1 and 2.25 µg/g at INTL-2 for Intertidal locations
Zinc: The Zinc concentration ranged between 1.45 µg/g at MSL-2 to 1.78 µg/g at MSL-3 for offshore locations and between 1.11 µg/g at INTL-1 and 1.23 µg/g at INTL-2 for Intertidal locations
Mercury: The Mercury concentration was below detectable level for all locations
Nickel: The nickel concentration ranged between 2.9 µg/g at MSL-2 to 3.88 µg/g at MSL-5 for offshore locations and between 1.34 µg/g at INTL-1 and 2.84 µg/g at INTL-2 for Intertidal locations
The details of sediment heavy metals the variations are given in the Table 3-11 and shown in Figure 3-23 to Figure 3-28. Table 3-11: Variations in marine sediment heavy metals
Parameters Units Offshore Intertidal
Cadmium
µg/g
Max. 0.170 0.12
Min. 0.140 0.11
Copper Max. 7.500 5.5
Min. 6.250 4.05
Iron Max. 199 180
Min. 120 121
Lead Max. 2.550 2.25
Min. 2.100 1.5
Zinc Max. 1.780 1.23
Min. 1.450 1.11
Mercury Max. BDL BDL
Min. BDL BDL
Nickel Max. 3.880 2.84
Min. 2.900 1.34
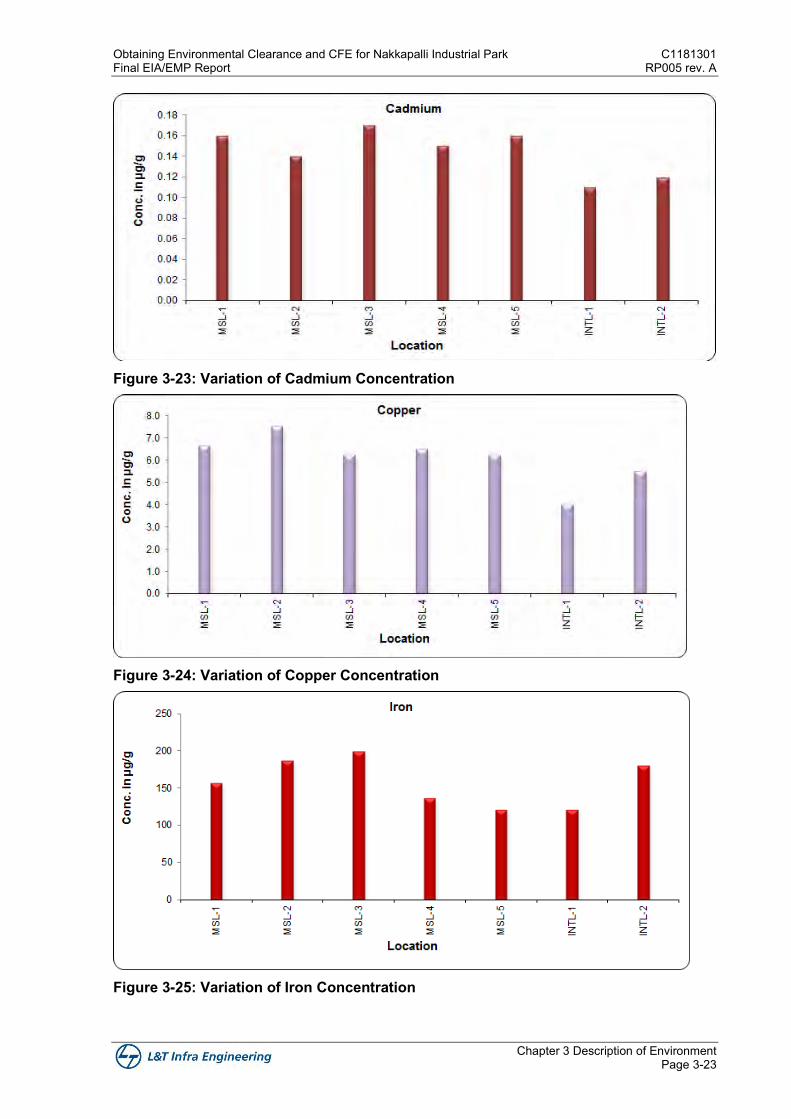
Obtaining Environmental Clearance and CFE for Nakkapalli Industrial Park C1181301 Final EIA/EMP Report RP005 rev. A
Chapter 3 Description of Environment Page 3-23
Figure 3-23: Variation of Cadmium Concentration
Figure 3-24: Variation of Copper Concentration
Figure 3-25: Variation of Iron Concentration
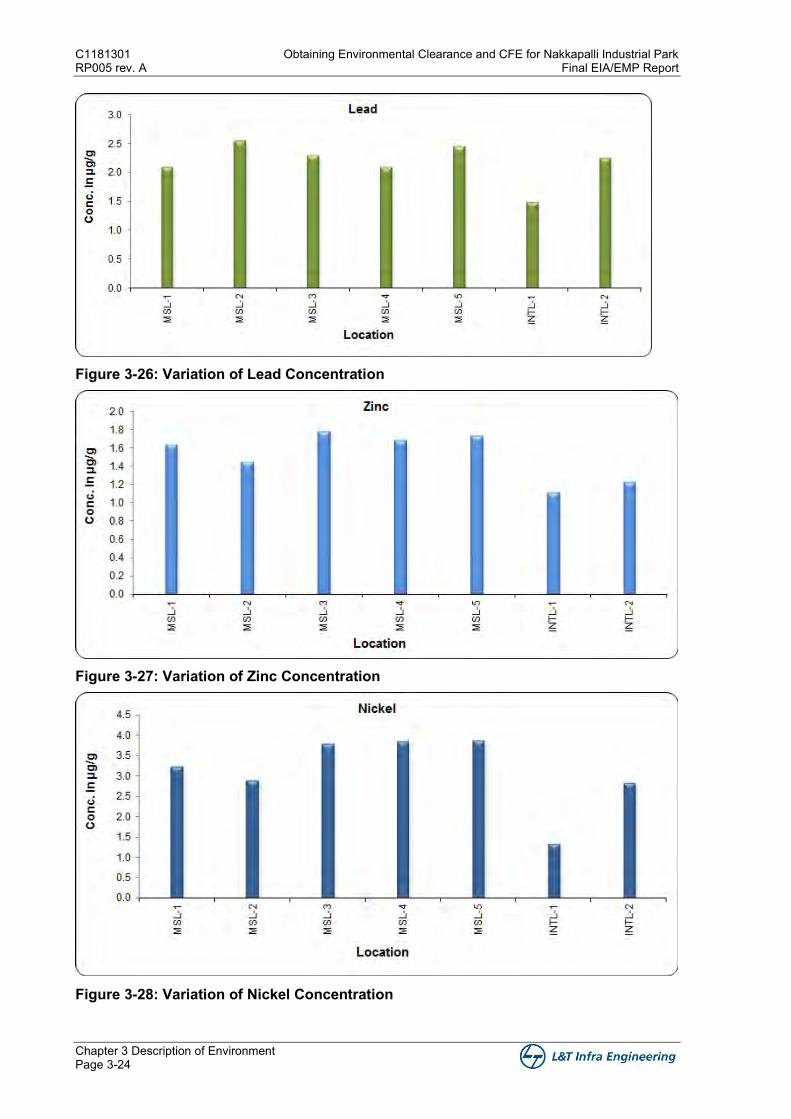
C1181301 Obtaining Environmental Clearance and CFE for Nakkapalli Industrial Park RP005 rev. A Final EIA/EMP Report
Chapter 3 Description of Environment Page 3-24
Figure 3-26: Variation of Lead Concentration
Figure 3-27: Variation of Zinc Concentration
Figure 3-28: Variation of Nickel Concentration
Obtaining Environmental Clearance and CFE for Nakkapalli Industrial Park C1181301 Final EIA/EMP Report RP005 rev. A
Chapter 3 Description of Environment Page 3-25
3.5.2.3 Microbial Population
The indicator and pathogenic bacteria isolated from sediment samples collected from the marine monitoring locations are described and the details are given below.
Coliform: The coliforms varied between 16 CFU/g and 17 CFU/g. The least value was recorded at INTL-2 and the maximum at INTL-1.
Escherichia coli (EC): The E. coli population varied between 11 CFU/g and 13 CFU/g The least value was recorded at INTL-1 and the maximum at INTL-2.
THB: The Faecal Coliform population ranged between 71 x103 at MSL-3 to 95 x 103 at MSL-4 for offshore locations and from 46 x 103 CFU/g at INTL-1 and 50x103 CFU/g at INTL-2 for intertidal locations.
Vibrio sp. (VS): The Vibrio sp population ranged between 20 x 102 CFU/g at MSL-5 to 31 x 102 CFU/g at MSL-4 for offshore locations and from 18 x 102 CFU/g at INTL-1 and 20 x 102
CFU/g at INTL-2 for intertidal locations.
The variations in sediment microbial populations are given in the Table 3-12. Table 3-12: Seasonal Variations in sediment microbial populations (CFU/g)
S. No
Microbial Indicator Intertidal Offshore
Minimum Maximum Minimum Maximum
1 Coliforms (CFU/g) 16 17 Nil Nil
2 Escherichia coli (ECLO) (CFU/g) 11 13 Nil Nil
3 TBH (CFU/g) 46x103 50x103 71x103 90x103
4 Vibrio sp (CFU/g) 18 x102 20 x102 20x102 31x102
3.5.2.4 Benthos
Macro benthos: Overall macro benthos was, represented by Crustaceans and Polychaetes. Around 14 species of macro benthos was recorded. Minimum Density for offshore locations (914 Nos/m2) was observed at MSL-5 and the Maximum density (992 Nos/m2) at MSL-3 and for intertidal locations 963 Nos/m2 to 987 Nos/m2 at INTL-1 and INTL-2 respectively.
Meiofauna: The meiofauna density was ranged between 315 nos/10 cm2 at MSL-3 and 497 nos/10 cm2 at MSL-1 for offshore locations and 211 nos/10 cm2 at INTL-1 to 253 nos/10 cm2 at INTL-2 for intertidal locations.
The variation in macrobenthic and meiofauna populations are given in the Table 3-13 and graphically shown in Figure 3-29 and Figure 3-30. Table 3-13: Seasonal Variations in Benthic Density
Parameters Units Value
Macrobenthos
No/m2
Max. 992
Min. 914
Intertidal Macrobenthos Max. 987
Min. 963
Meiofauna
No./10cm2
Max. 497
Min. 315
Intertidal Meiofauna Max. 253
Min. 211
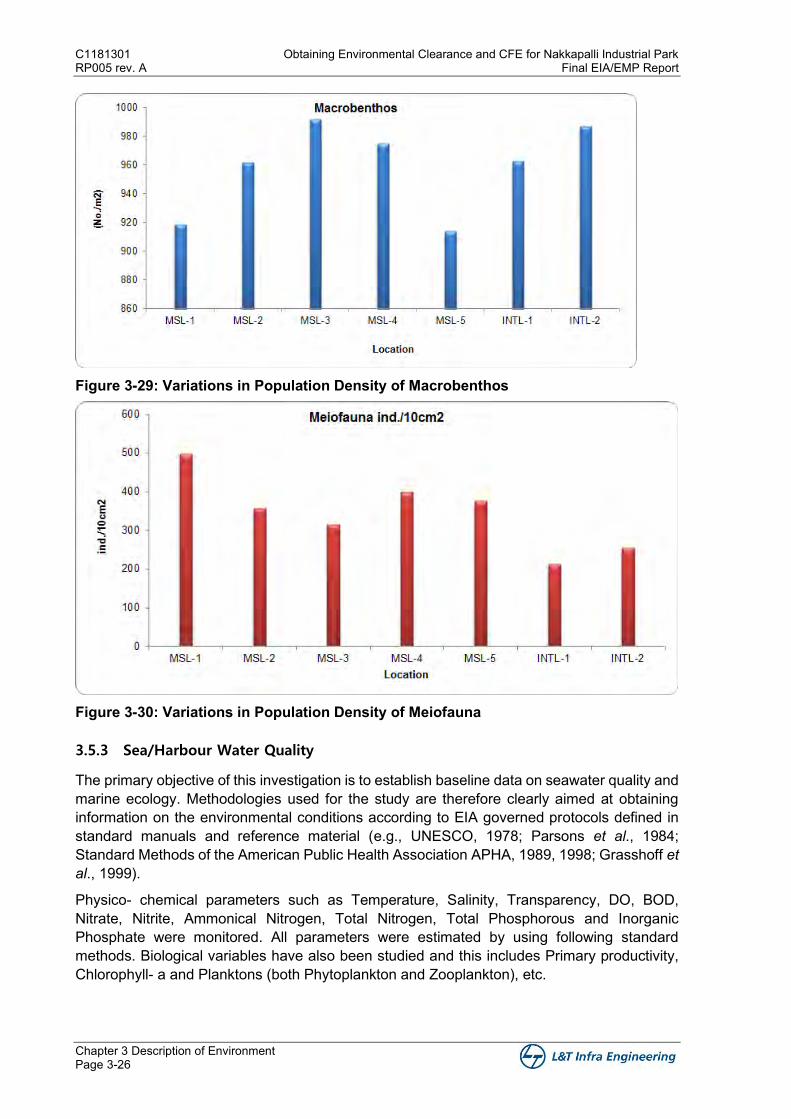
C1181301 Obtaining Environmental Clearance and CFE for Nakkapalli Industrial Park RP005 rev. A Final EIA/EMP Report
Chapter 3 Description of Environment Page 3-26
Figure 3-29: Variations in Population Density of Macrobenthos
Figure 3-30: Variations in Population Density of Meiofauna
3.5.3 Sea/Harbour Water Quality
The primary objective of this investigation is to establish baseline data on seawater quality and marine ecology. Methodologies used for the study are therefore clearly aimed at obtaining information on the environmental conditions according to EIA governed protocols defined in standard manuals and reference material (e.g., UNESCO, 1978; Parsons et al., 1984; Standard Methods of the American Public Health Association APHA, 1989, 1998; Grasshoff et al., 1999).
Physico- chemical parameters such as Temperature, Salinity, Transparency, DO, BOD, Nitrate, Nitrite, Ammonical Nitrogen, Total Nitrogen, Total Phosphorous and Inorganic Phosphate were monitored. All parameters were estimated by using following standard methods. Biological variables have also been studied and this includes Primary productivity, Chlorophyll- a and Planktons (both Phytoplankton and Zooplankton), etc.
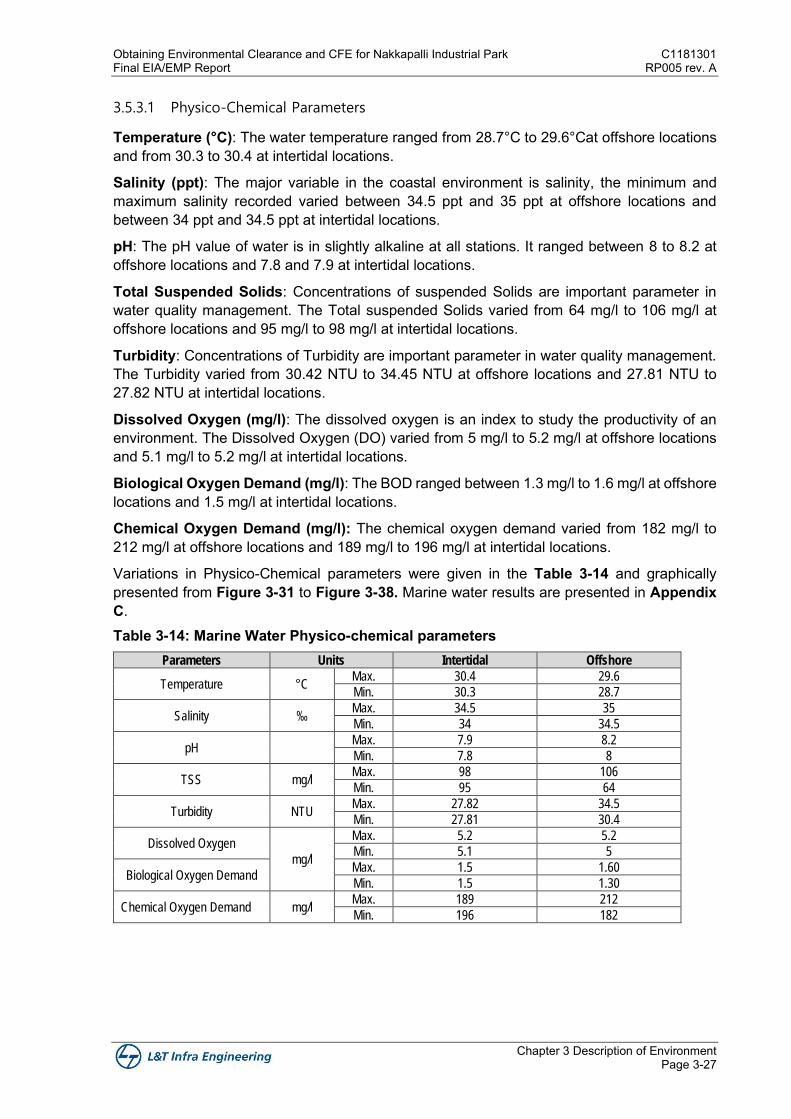
Obtaining Environmental Clearance and CFE for Nakkapalli Industrial Park C1181301 Final EIA/EMP Report RP005 rev. A
Chapter 3 Description of Environment Page 3-27
3.5.3.1 Physico-Chemical Parameters
Temperature (°C): The water temperature ranged from 28.7°C to 29.6°Cat offshore locations and from 30.3 to 30.4 at intertidal locations.
Salinity (ppt): The major variable in the coastal environment is salinity, the minimum and maximum salinity recorded varied between 34.5 ppt and 35 ppt at offshore locations and between 34 ppt and 34.5 ppt at intertidal locations.
pH: The pH value of water is in slightly alkaline at all stations. It ranged between 8 to 8.2 at offshore locations and 7.8 and 7.9 at intertidal locations.
Total Suspended Solids: Concentrations of suspended Solids are important parameter in water quality management. The Total suspended Solids varied from 64 mg/l to 106 mg/l at offshore locations and 95 mg/l to 98 mg/l at intertidal locations.
Turbidity: Concentrations of Turbidity are important parameter in water quality management. The Turbidity varied from 30.42 NTU to 34.45 NTU at offshore locations and 27.81 NTU to 27.82 NTU at intertidal locations.
Dissolved Oxygen (mg/l): The dissolved oxygen is an index to study the productivity of an environment. The Dissolved Oxygen (DO) varied from 5 mg/l to 5.2 mg/l at offshore locations and 5.1 mg/l to 5.2 mg/l at intertidal locations.
Biological Oxygen Demand (mg/l): The BOD ranged between 1.3 mg/l to 1.6 mg/l at offshore locations and 1.5 mg/l at intertidal locations.
Chemical Oxygen Demand (mg/l): The chemical oxygen demand varied from 182 mg/l to 212 mg/l at offshore locations and 189 mg/l to 196 mg/l at intertidal locations.
Variations in Physico-Chemical parameters were given in the Table 3-14 and graphically presented from Figure 3-31 to Figure 3-38. Marine water results are presented in Appendix C. Table 3-14: Marine Water Physico-chemical parameters
Parameters Units Intertidal Offshore
Temperature °C Max. 30.4 29.6
Min. 30.3 28.7
Salinity ‰ Max. 34.5 35
Min. 34 34.5
pH Max. 7.9 8.2
Min. 7.8 8
TSS mg/l Max. 98 106
Min. 95 64
Turbidity NTU Max. 27.82 34.5
Min. 27.81 30.4
Dissolved Oxygen
mg/l
Max. 5.2 5.2
Min. 5.1 5
Biological Oxygen Demand Max. 1.5 1.60
Min. 1.5 1.30
Chemical Oxygen Demand mg/l Max. 189 212
Min. 196 182
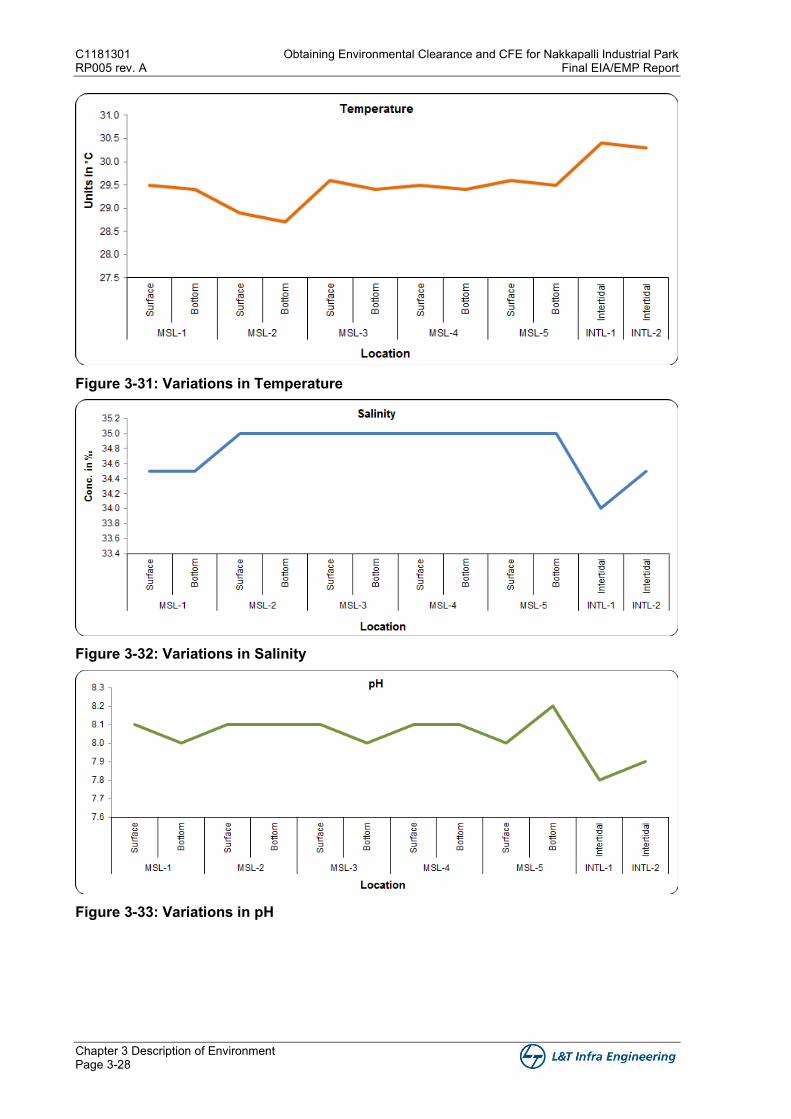
C1181301 Obtaining Environmental Clearance and CFE for Nakkapalli Industrial Park RP005 rev. A Final EIA/EMP Report
Chapter 3 Description of Environment Page 3-28
Figure 3-31: Variations in Temperature
Figure 3-32: Variations in Salinity
Figure 3-33: Variations in pH
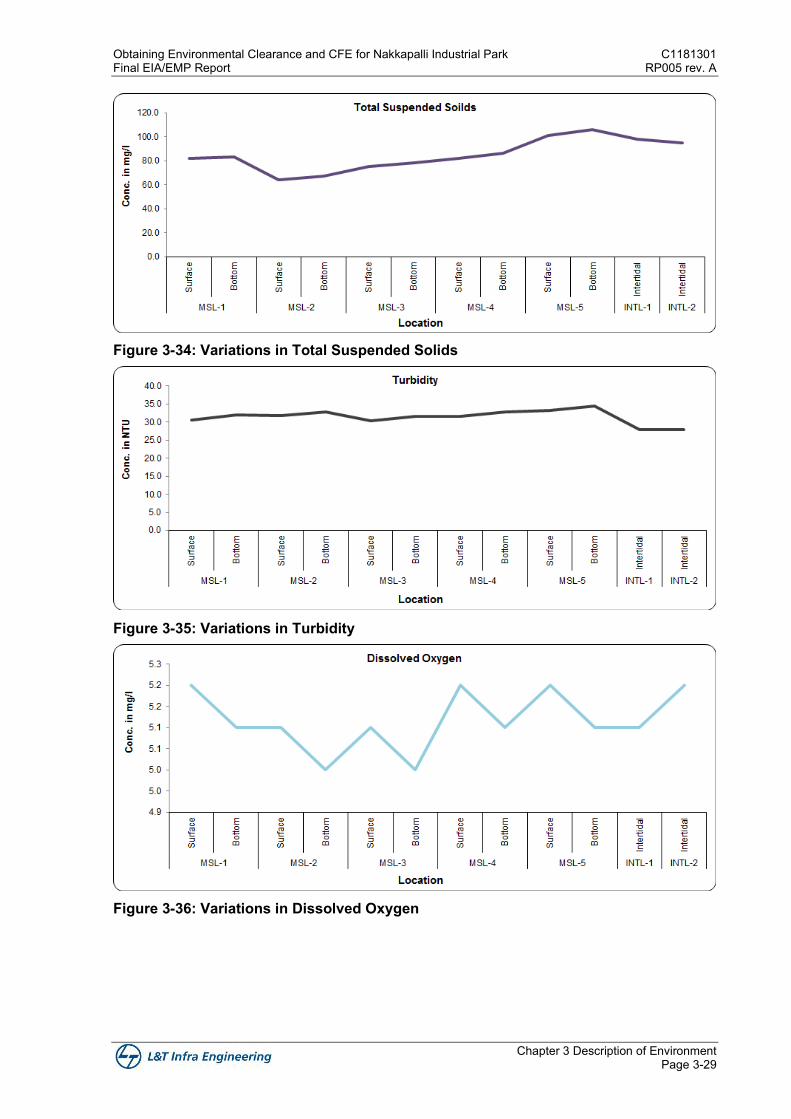
Obtaining Environmental Clearance and CFE for Nakkapalli Industrial Park C1181301 Final EIA/EMP Report RP005 rev. A
Chapter 3 Description of Environment Page 3-29
Figure 3-34: Variations in Total Suspended Solids
Figure 3-35: Variations in Turbidity
Figure 3-36: Variations in Dissolved Oxygen
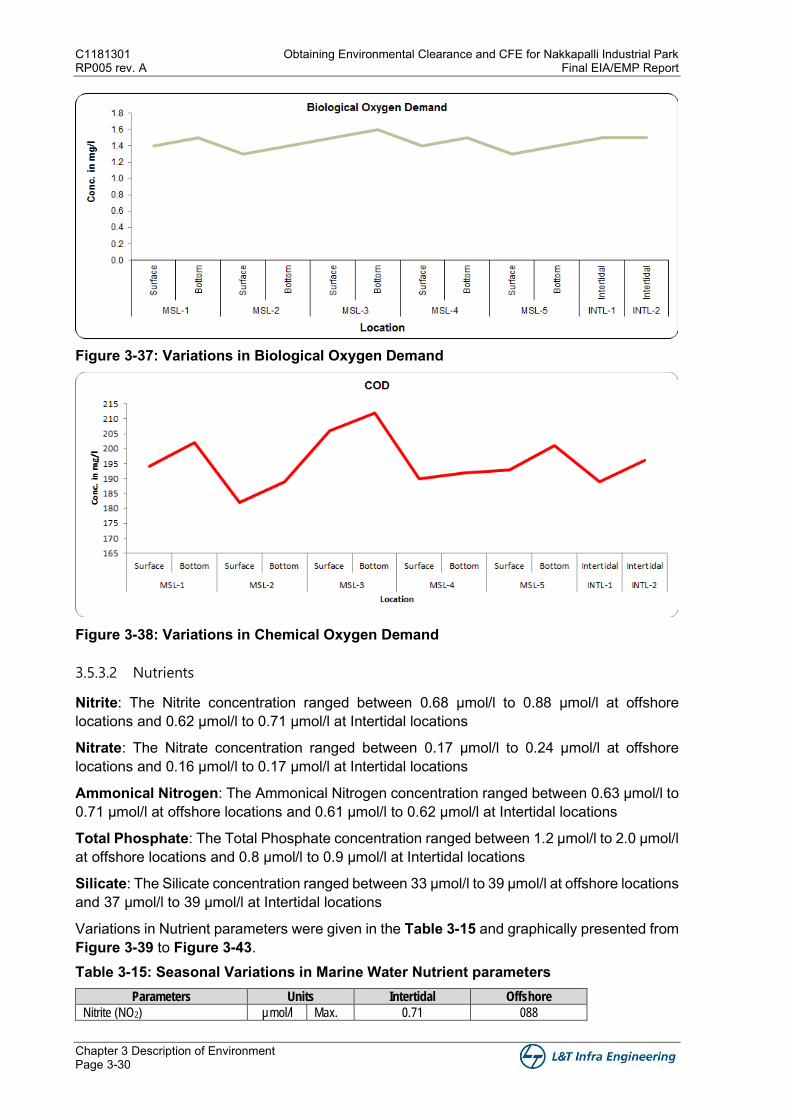
C1181301 Obtaining Environmental Clearance and CFE for Nakkapalli Industrial Park RP005 rev. A Final EIA/EMP Report
Chapter 3 Description of Environment Page 3-30
Figure 3-37: Variations in Biological Oxygen Demand
Figure 3-38: Variations in Chemical Oxygen Demand
3.5.3.2 Nutrients
Nitrite: The Nitrite concentration ranged between 0.68 µmol/l to 0.88 µmol/l at offshore locations and 0.62 µmol/l to 0.71 µmol/l at Intertidal locations
Nitrate: The Nitrate concentration ranged between 0.17 µmol/l to 0.24 µmol/l at offshore locations and 0.16 µmol/l to 0.17 µmol/l at Intertidal locations
Ammonical Nitrogen: The Ammonical Nitrogen concentration ranged between 0.63 µmol/l to 0.71 µmol/l at offshore locations and 0.61 µmol/l to 0.62 µmol/l at Intertidal locations
Total Phosphate: The Total Phosphate concentration ranged between 1.2 µmol/l to 2.0 µmol/l at offshore locations and 0.8 µmol/l to 0.9 µmol/l at Intertidal locations
Silicate: The Silicate concentration ranged between 33 µmol/l to 39 µmol/l at offshore locations and 37 µmol/l to 39 µmol/l at Intertidal locations
Variations in Nutrient parameters were given in the Table 3-15 and graphically presented from Figure 3-39 to Figure 3-43. Table 3-15: Seasonal Variations in Marine Water Nutrient parameters
Parameters Units Intertidal Offshore
Nitrite (NO2) µmol/l Max. 0.71 088
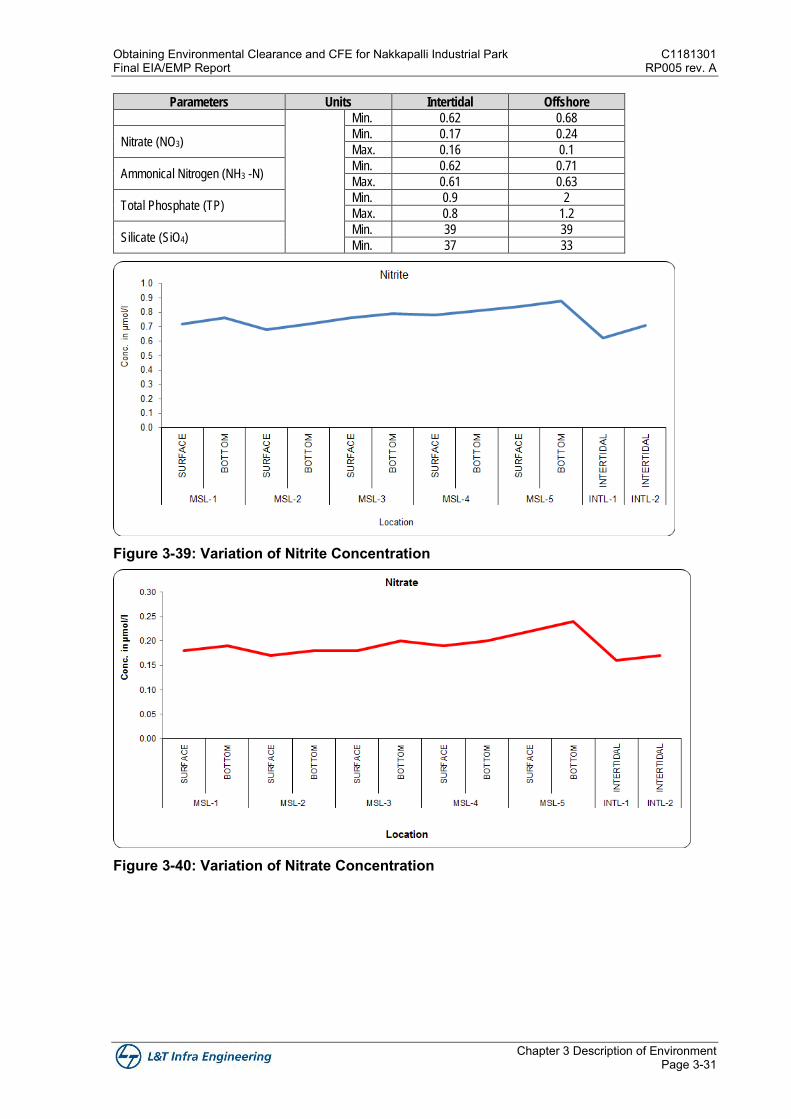
Obtaining Environmental Clearance and CFE for Nakkapalli Industrial Park C1181301 Final EIA/EMP Report RP005 rev. A
Chapter 3 Description of Environment Page 3-31
Parameters Units Intertidal Offshore
Min. 0.62 0.68
Nitrate (NO3) Min. 0.17 0.24
Max. 0.16 0.1
Ammonical Nitrogen (NH3 -N) Min. 0.62 0.71
Max. 0.61 0.63
Total Phosphate (TP) Min. 0.9 2
Max. 0.8 1.2
Silicate (SiO4) Min. 39 39
Min. 37 33
Figure 3-39: Variation of Nitrite Concentration
Figure 3-40: Variation of Nitrate Concentration
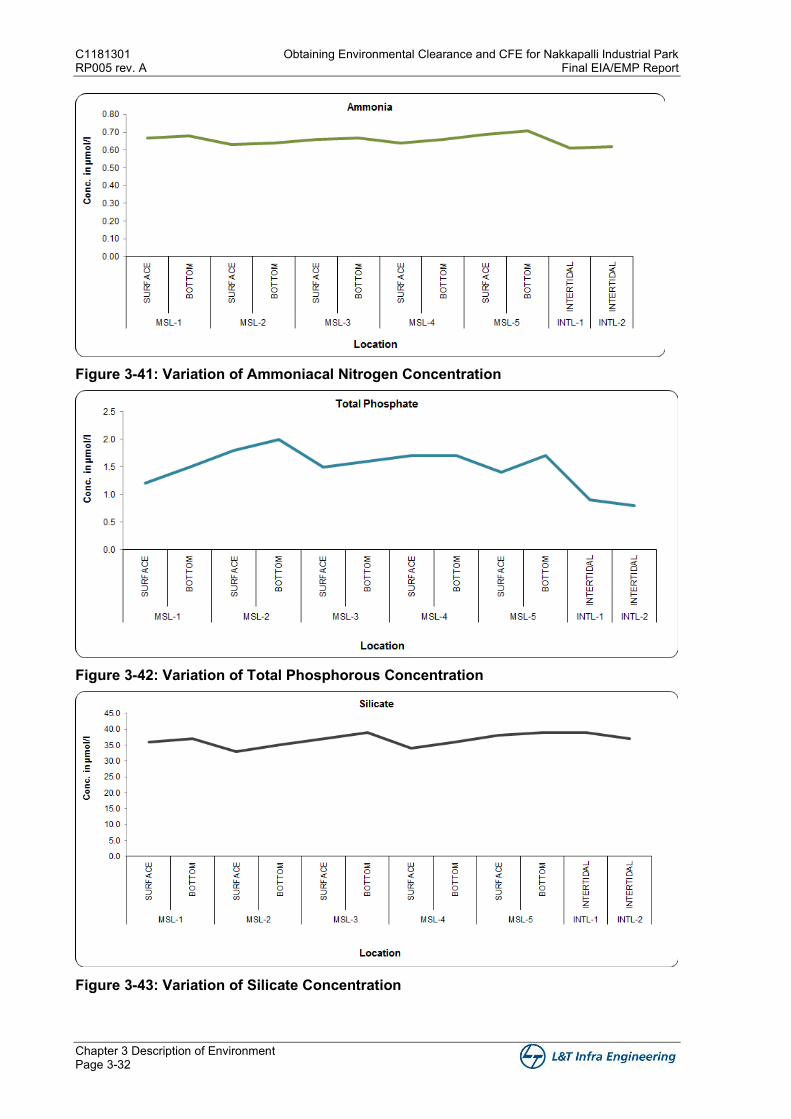
C1181301 Obtaining Environmental Clearance and CFE for Nakkapalli Industrial Park RP005 rev. A Final EIA/EMP Report
Chapter 3 Description of Environment Page 3-32
Figure 3-41: Variation of Ammoniacal Nitrogen Concentration
Figure 3-42: Variation of Total Phosphorous Concentration
Figure 3-43: Variation of Silicate Concentration
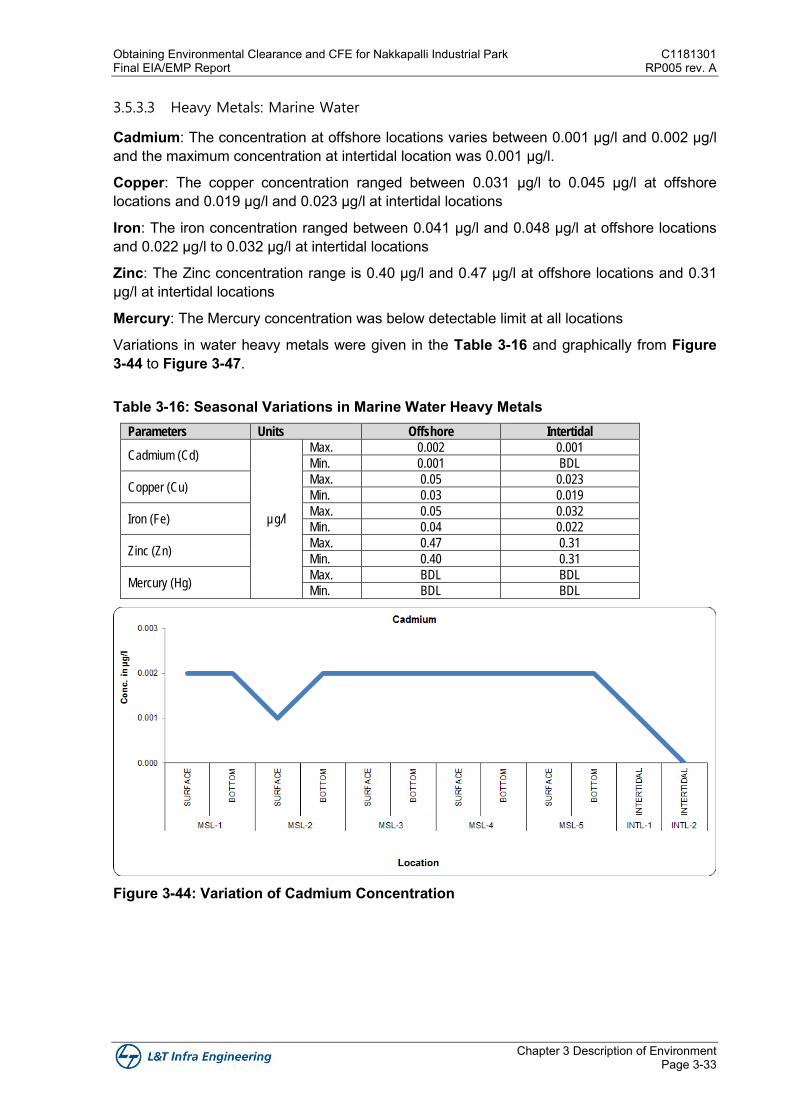
Obtaining Environmental Clearance and CFE for Nakkapalli Industrial Park C1181301 Final EIA/EMP Report RP005 rev. A
Chapter 3 Description of Environment Page 3-33
3.5.3.3 Heavy Metals: Marine Water
Cadmium: The concentration at offshore locations varies between 0.001 µg/l and 0.002 µg/l and the maximum concentration at intertidal location was 0.001 µg/l.
Copper: The copper concentration ranged between 0.031 µg/l to 0.045 µg/l at offshore locations and 0.019 µg/l and 0.023 µg/l at intertidal locations
Iron: The iron concentration ranged between 0.041 µg/l and 0.048 µg/l at offshore locations and 0.022 µg/l to 0.032 µg/l at intertidal locations
Zinc: The Zinc concentration range is 0.40 µg/l and 0.47 µg/l at offshore locations and 0.31 µg/l at intertidal locations
Mercury: The Mercury concentration was below detectable limit at all locations
Variations in water heavy metals were given in the Table 3-16 and graphically from Figure 3-44 to Figure 3-47. Table 3-16: Seasonal Variations in Marine Water Heavy Metals
Parameters Units Offshore Intertidal
Cadmium (Cd)
µg/l
Max. 0.002 0.001
Min. 0.001 BDL
Copper (Cu) Max. 0.05 0.023
Min. 0.03 0.019
Iron (Fe) Max. 0.05 0.032
Min. 0.04 0.022
Zinc (Zn) Max. 0.47 0.31
Min. 0.40 0.31
Mercury (Hg) Max. BDL BDL
Min. BDL BDL
Figure 3-44: Variation of Cadmium Concentration
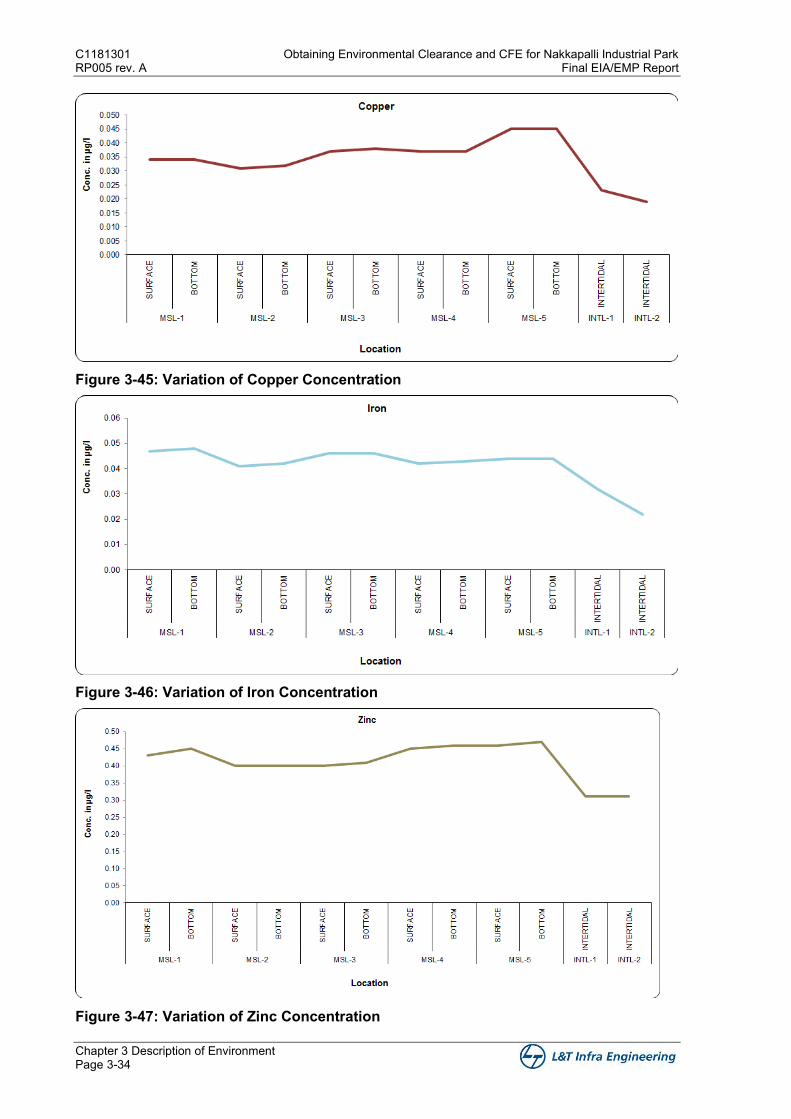
C1181301 Obtaining Environmental Clearance and CFE for Nakkapalli Industrial Park RP005 rev. A Final EIA/EMP Report
Chapter 3 Description of Environment Page 3-34
Figure 3-45: Variation of Copper Concentration
Figure 3-46: Variation of Iron Concentration
Figure 3-47: Variation of Zinc Concentration
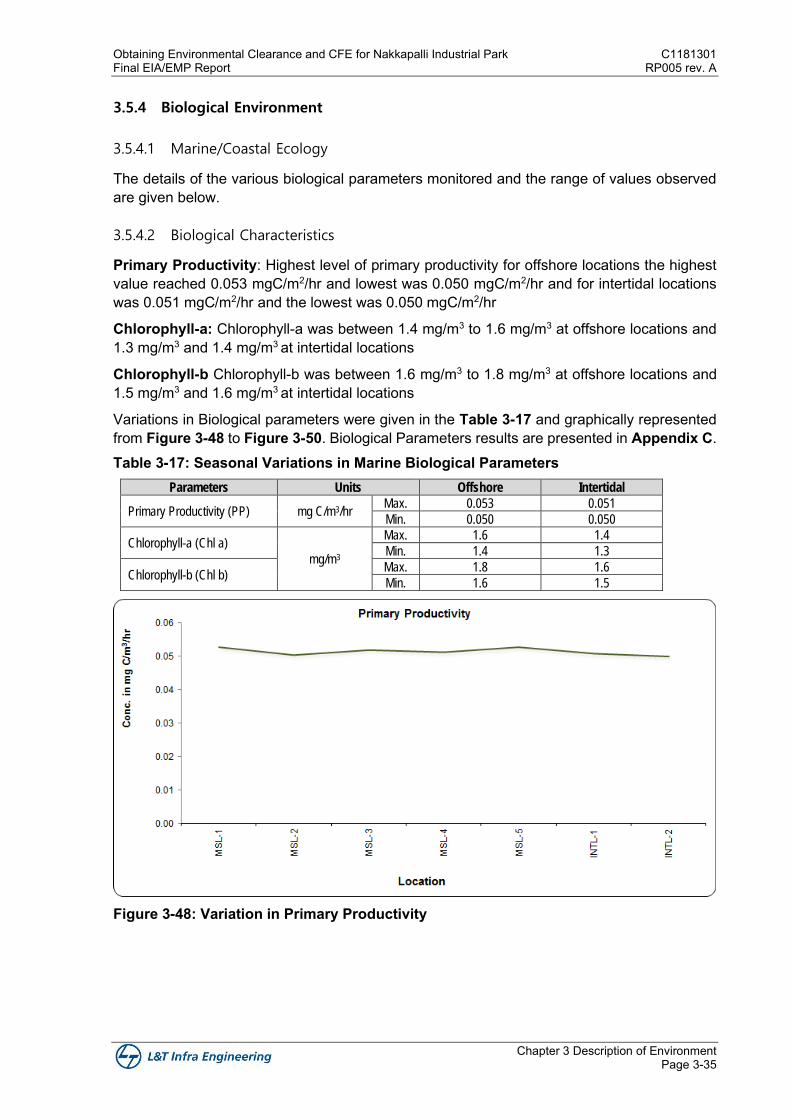
Obtaining Environmental Clearance and CFE for Nakkapalli Industrial Park C1181301 Final EIA/EMP Report RP005 rev. A
Chapter 3 Description of Environment Page 3-35
3.5.4 Biological Environment
3.5.4.1 Marine/Coastal Ecology
The details of the various biological parameters monitored and the range of values observed are given below.
3.5.4.2 Biological Characteristics
Primary Productivity: Highest level of primary productivity for offshore locations the highest value reached 0.053 mgC/m2/hr and lowest was 0.050 mgC/m2/hr and for intertidal locations was 0.051 mgC/m2/hr and the lowest was 0.050 mgC/m2/hr
Chlorophyll-a: Chlorophyll-a was between 1.4 mg/m3 to 1.6 mg/m3 at offshore locations and 1.3 mg/m3 and 1.4 mg/m3 at intertidal locations
Chlorophyll-b Chlorophyll-b was between 1.6 mg/m3 to 1.8 mg/m3 at offshore locations and 1.5 mg/m3 and 1.6 mg/m3 at intertidal locations
Variations in Biological parameters were given in the Table 3-17 and graphically represented from Figure 3-48 to Figure 3-50. Biological Parameters results are presented in Appendix C. Table 3-17: Seasonal Variations in Marine Biological Parameters
Parameters Units Offshore Intertidal
Primary Productivity (PP) mg C/m3/hr Max. 0.053 0.051
Min. 0.050 0.050
Chlorophyll-a (Chl a)
mg/m3
Max. 1.6 1.4
Min. 1.4 1.3
Chlorophyll-b (Chl b) Max. 1.8 1.6
Min. 1.6 1.5
Figure 3-48: Variation in Primary Productivity
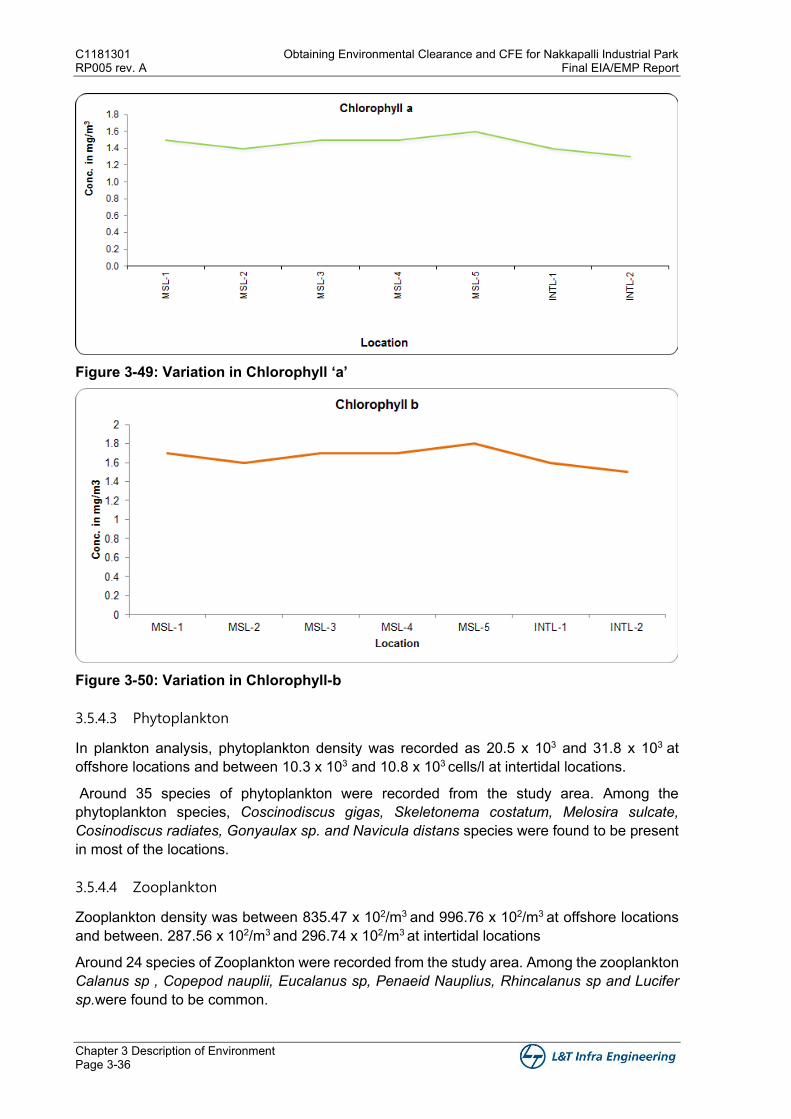
C1181301 Obtaining Environmental Clearance and CFE for Nakkapalli Industrial Park RP005 rev. A Final EIA/EMP Report
Chapter 3 Description of Environment Page 3-36
Figure 3-49: Variation in Chlorophyll ‘a’
Figure 3-50: Variation in Chlorophyll-b
3.5.4.3 Phytoplankton
In plankton analysis, phytoplankton density was recorded as 20.5 x 10³ and 31.8 x 10³ at offshore locations and between 10.3 x 10³ and 10.8 x 10³ cells/l at intertidal locations.
Around 35 species of phytoplankton were recorded from the study area. Among the phytoplankton species, Coscinodiscus gigas, Skeletonema costatum, Melosira sulcate, Cosinodiscus radiates, Gonyaulax sp. and Navicula distans species were found to be present in most of the locations.
3.5.4.4 Zooplankton
Zooplankton density was between 835.47 x 10²/m3 and 996.76 x 10²/m3 at offshore locations and between. 287.56 x 10²/m3 and 296.74 x 10²/m3 at intertidal locations
Around 24 species of Zooplankton were recorded from the study area. Among the zooplankton Calanus sp , Copepod nauplii, Eucalanus sp, Penaeid Nauplius, Rhincalanus sp and Lucifer sp.were found to be common.
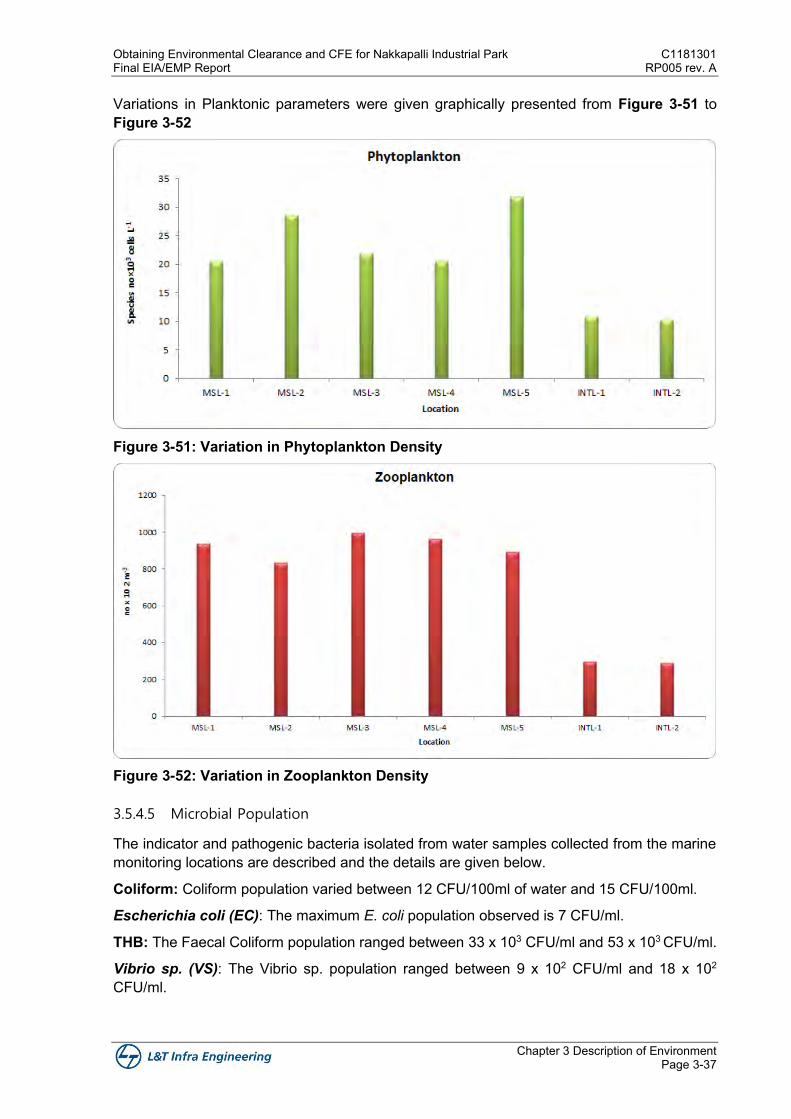
Obtaining Environmental Clearance and CFE for Nakkapalli Industrial Park C1181301 Final EIA/EMP Report RP005 rev. A
Chapter 3 Description of Environment Page 3-37
Variations in Planktonic parameters were given graphically presented from Figure 3-51 to Figure 3-52
Figure 3-51: Variation in Phytoplankton Density
Figure 3-52: Variation in Zooplankton Density
3.5.4.5 Microbial Population
The indicator and pathogenic bacteria isolated from water samples collected from the marine monitoring locations are described and the details are given below.
Coliform: Coliform population varied between 12 CFU/100ml of water and 15 CFU/100ml.
Escherichia coli (EC): The maximum E. coli population observed is 7 CFU/ml.
THB: The Faecal Coliform population ranged between 33 x 103 CFU/ml and 53 x 103 CFU/ml.
Vibrio sp. (VS): The Vibrio sp. population ranged between 9 x 10² CFU/ml and 18 x 102
CFU/ml.
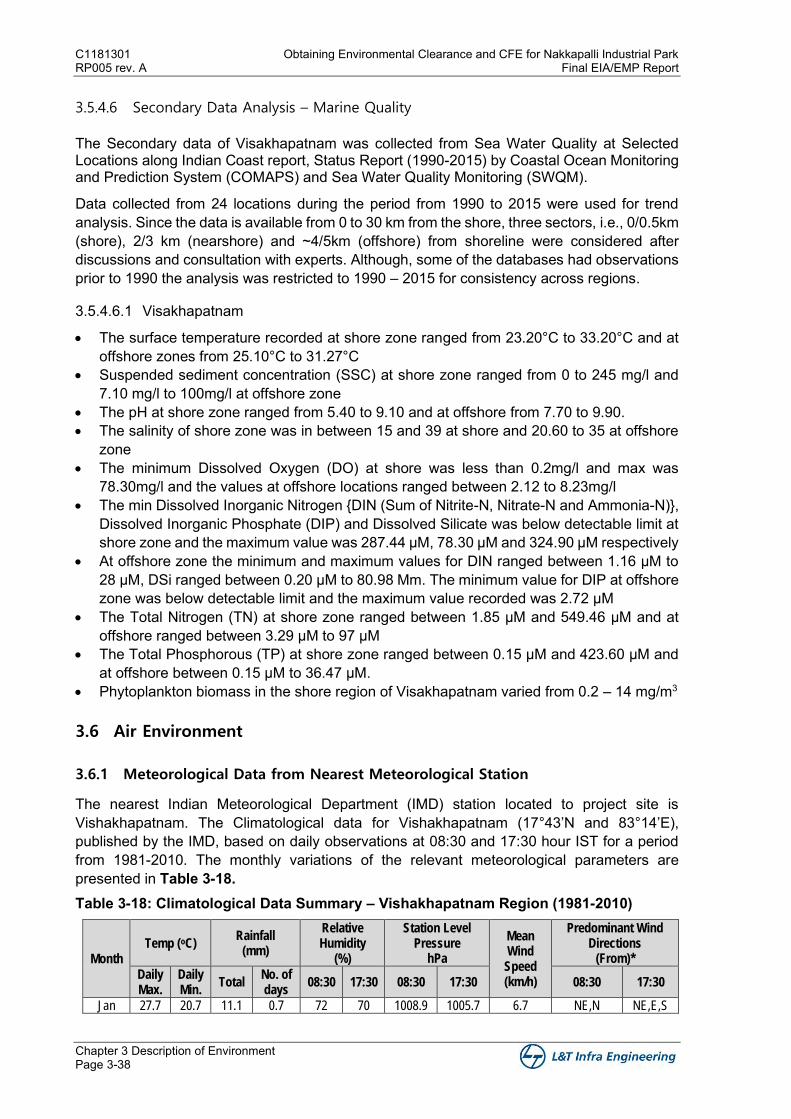
C1181301 Obtaining Environmental Clearance and CFE for Nakkapalli Industrial Park RP005 rev. A Final EIA/EMP Report
Chapter 3 Description of Environment Page 3-38
3.5.4.6 Secondary Data Analysis – Marine Quality
The Secondary data of Visakhapatnam was collected from Sea Water Quality at Selected Locations along Indian Coast report, Status Report (1990-2015) by Coastal Ocean Monitoring and Prediction System (COMAPS) and Sea Water Quality Monitoring (SWQM).
Data collected from 24 locations during the period from 1990 to 2015 were used for trend analysis. Since the data is available from 0 to 30 km from the shore, three sectors, i.e., 0/0.5km (shore), 2/3 km (nearshore) and ~4/5km (offshore) from shoreline were considered after discussions and consultation with experts. Although, some of the databases had observations prior to 1990 the analysis was restricted to 1990 – 2015 for consistency across regions.
3.5.4.6.1 Visakhapatnam
• The surface temperature recorded at shore zone ranged from 23.20°C to 33.20°C and at offshore zones from 25.10°C to 31.27°C
• Suspended sediment concentration (SSC) at shore zone ranged from 0 to 245 mg/l and 7.10 mg/l to 100mg/l at offshore zone
• The pH at shore zone ranged from 5.40 to 9.10 and at offshore from 7.70 to 9.90. • The salinity of shore zone was in between 15 and 39 at shore and 20.60 to 35 at offshore
zone • The minimum Dissolved Oxygen (DO) at shore was less than 0.2mg/l and max was
78.30mg/l and the values at offshore locations ranged between 2.12 to 8.23mg/l • The min Dissolved Inorganic Nitrogen {DIN (Sum of Nitrite-N, Nitrate-N and Ammonia-N)},
Dissolved Inorganic Phosphate (DIP) and Dissolved Silicate was below detectable limit at shore zone and the maximum value was 287.44 μM, 78.30 μM and 324.90 μM respectively
• At offshore zone the minimum and maximum values for DIN ranged between 1.16 μM to 28 μM, DSi ranged between 0.20 μM to 80.98 Μm. The minimum value for DIP at offshore zone was below detectable limit and the maximum value recorded was 2.72 μM
• The Total Nitrogen (TN) at shore zone ranged between 1.85 μM and 549.46 μM and at offshore ranged between 3.29 μM to 97 μM
• The Total Phosphorous (TP) at shore zone ranged between 0.15 μM and 423.60 μM and at offshore between 0.15 μM to 36.47 μM.
• Phytoplankton biomass in the shore region of Visakhapatnam varied from 0.2 – 14 mg/m3
3.6 Air Environment
3.6.1 Meteorological Data from Nearest Meteorological Station
The nearest Indian Meteorological Department (IMD) station located to project site is Vishakhapatnam. The Climatological data for Vishakhapatnam (17°43’N and 83°14’E), published by the IMD, based on daily observations at 08:30 and 17:30 hour IST for a period from 1981-2010. The monthly variations of the relevant meteorological parameters are presented in Table 3-18. Table 3-18: Climatological Data Summary – Vishakhapatnam Region (1981-2010)
Month Temp (oC)
Rainfall (mm)
Relative Humidity
(%)
Station Level Pressure
hPa
Mean Wind
Speed (km/h)
Predominant Wind Directions
(From)*
Daily Max.
Daily Min.
Total No. of days
08:30 17:30 08:30 17:30 08:30 17:30
Jan 27.7 20.7 11.1 0.7 72 70 1008.9 1005.7 6.7 NE,N NE,E,S
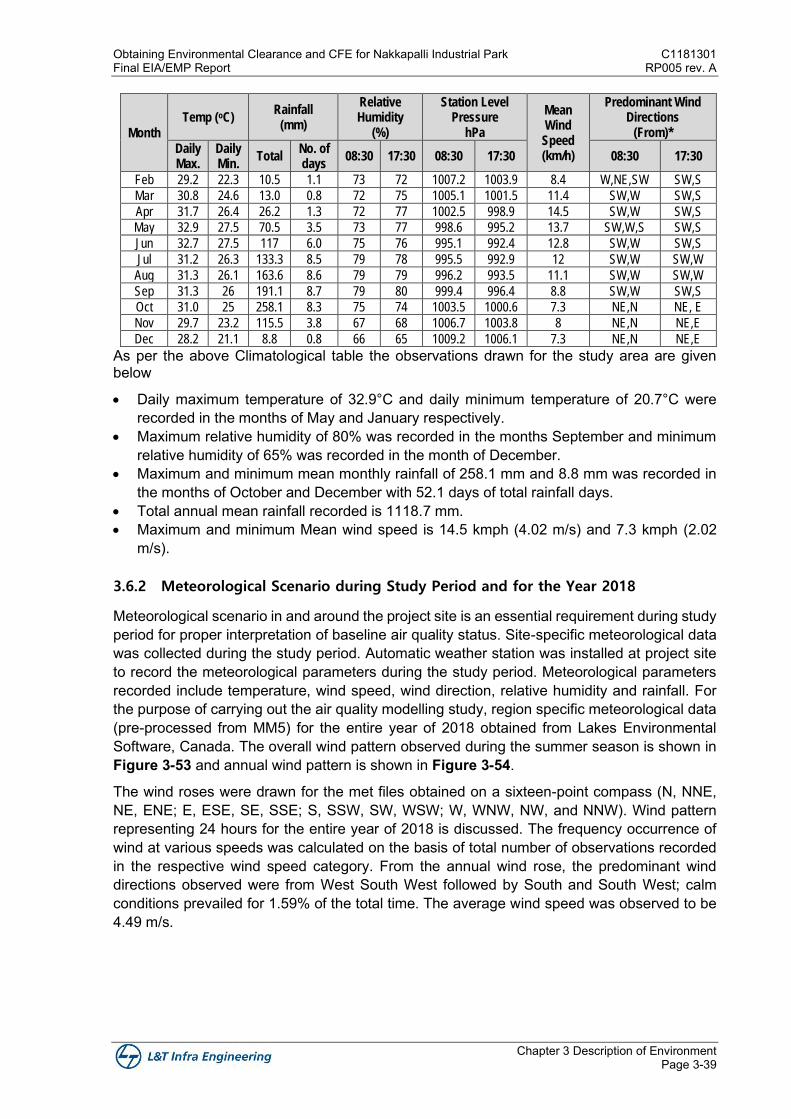
Obtaining Environmental Clearance and CFE for Nakkapalli Industrial Park C1181301 Final EIA/EMP Report RP005 rev. A
Chapter 3 Description of Environment Page 3-39
Month
Temp (oC) Rainfall
(mm)
Relative Humidity
(%)
Station Level Pressure
hPa
Mean Wind
Speed (km/h)
Predominant Wind Directions
(From)*
Daily Max.
Daily Min.
Total No. of days
08:30 17:30 08:30 17:30 08:30 17:30
Feb 29.2 22.3 10.5 1.1 73 72 1007.2 1003.9 8.4 W,NE,SW SW,S
Mar 30.8 24.6 13.0 0.8 72 75 1005.1 1001.5 11.4 SW,W SW,S
Apr 31.7 26.4 26.2 1.3 72 77 1002.5 998.9 14.5 SW,W SW,S
May 32.9 27.5 70.5 3.5 73 77 998.6 995.2 13.7 SW,W,S SW,S
Jun 32.7 27.5 117 6.0 75 76 995.1 992.4 12.8 SW,W SW,S
Jul 31.2 26.3 133.3 8.5 79 78 995.5 992.9 12 SW,W SW,W
Aug 31.3 26.1 163.6 8.6 79 79 996.2 993.5 11.1 SW,W SW,W
Sep 31.3 26 191.1 8.7 79 80 999.4 996.4 8.8 SW,W SW,S
Oct 31.0 25 258.1 8.3 75 74 1003.5 1000.6 7.3 NE,N NE, E
Nov 29.7 23.2 115.5 3.8 67 68 1006.7 1003.8 8 NE,N NE,E
Dec 28.2 21.1 8.8 0.8 66 65 1009.2 1006.1 7.3 NE,N NE,E
As per the above Climatological table the observations drawn for the study area are given below
• Daily maximum temperature of 32.9°C and daily minimum temperature of 20.7°C were recorded in the months of May and January respectively.
• Maximum relative humidity of 80% was recorded in the months September and minimum relative humidity of 65% was recorded in the month of December.
• Maximum and minimum mean monthly rainfall of 258.1 mm and 8.8 mm was recorded in the months of October and December with 52.1 days of total rainfall days.
• Total annual mean rainfall recorded is 1118.7 mm. • Maximum and minimum Mean wind speed is 14.5 kmph (4.02 m/s) and 7.3 kmph (2.02
m/s).
3.6.2 Meteorological Scenario during Study Period and for the Year 2018
Meteorological scenario in and around the project site is an essential requirement during study period for proper interpretation of baseline air quality status. Site-specific meteorological data was collected during the study period. Automatic weather station was installed at project site to record the meteorological parameters during the study period. Meteorological parameters recorded include temperature, wind speed, wind direction, relative humidity and rainfall. For the purpose of carrying out the air quality modelling study, region specific meteorological data (pre-processed from MM5) for the entire year of 2018 obtained from Lakes Environmental Software, Canada. The overall wind pattern observed during the summer season is shown in Figure 3-53 and annual wind pattern is shown in Figure 3-54.
The wind roses were drawn for the met files obtained on a sixteen-point compass (N, NNE, NE, ENE; E, ESE, SE, SSE; S, SSW, SW, WSW; W, WNW, NW, and NNW). Wind pattern representing 24 hours for the entire year of 2018 is discussed. The frequency occurrence of wind at various speeds was calculated on the basis of total number of observations recorded in the respective wind speed category. From the annual wind rose, the predominant wind directions observed were from West South West followed by South and South West; calm conditions prevailed for 1.59% of the total time. The average wind speed was observed to be 4.49 m/s.
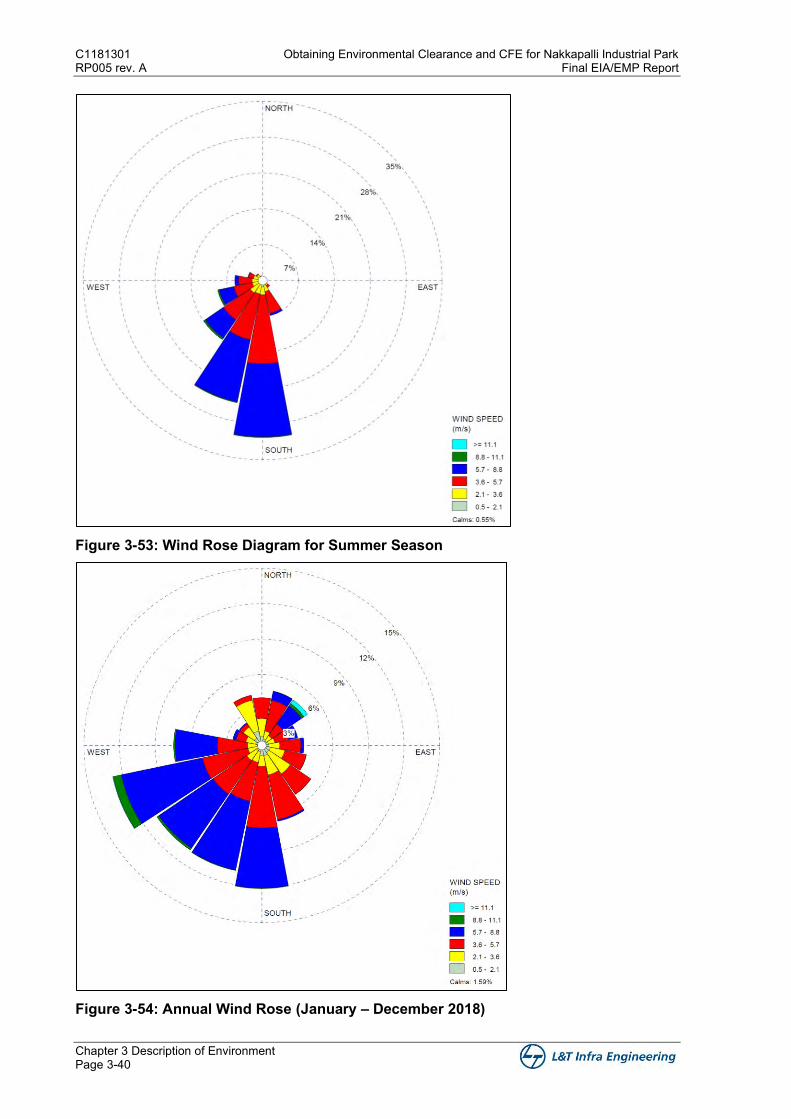
C1181301 Obtaining Environmental Clearance and CFE for Nakkapalli Industrial Park RP005 rev. A Final EIA/EMP Report
Chapter 3 Description of Environment Page 3-40
Figure 3-53: Wind Rose Diagram for Summer Season
Figure 3-54: Annual Wind Rose (January – December 2018)
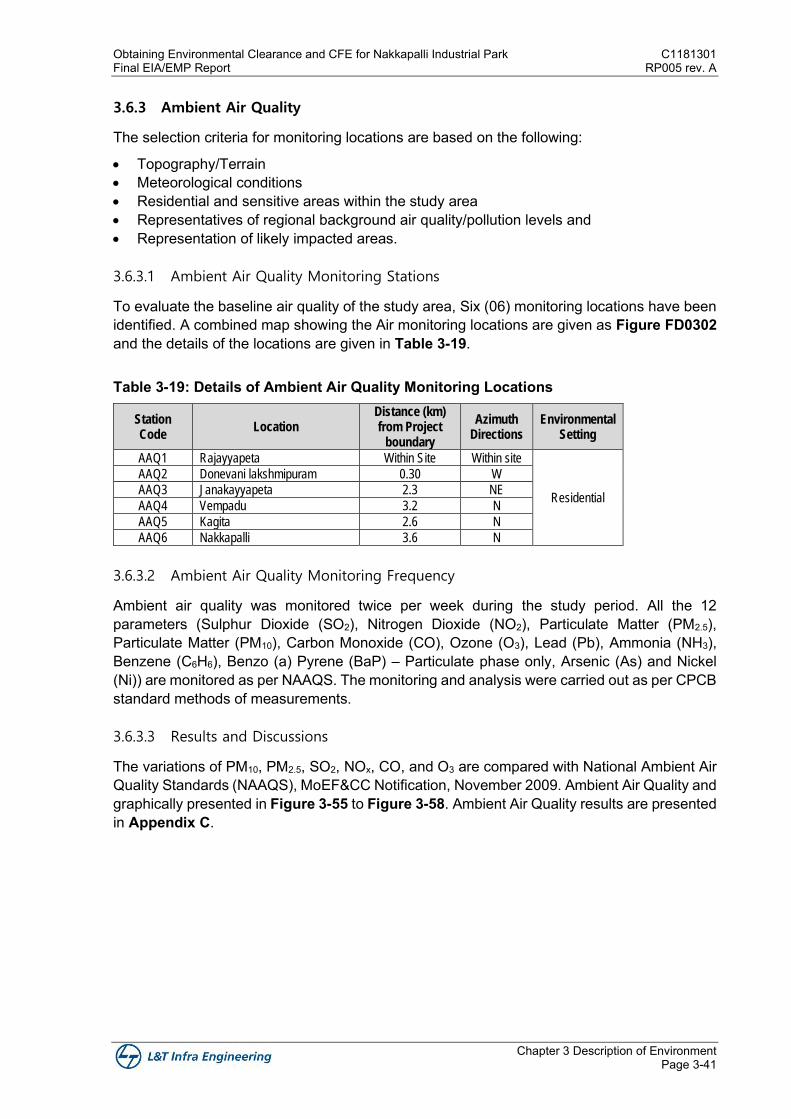
Obtaining Environmental Clearance and CFE for Nakkapalli Industrial Park C1181301 Final EIA/EMP Report RP005 rev. A
Chapter 3 Description of Environment Page 3-41
3.6.3 Ambient Air Quality
The selection criteria for monitoring locations are based on the following:
• Topography/Terrain • Meteorological conditions • Residential and sensitive areas within the study area • Representatives of regional background air quality/pollution levels and • Representation of likely impacted areas.
3.6.3.1 Ambient Air Quality Monitoring Stations
To evaluate the baseline air quality of the study area, Six (06) monitoring locations have been identified. A combined map showing the Air monitoring locations are given as Figure FD0302 and the details of the locations are given in Table 3-19. Table 3-19: Details of Ambient Air Quality Monitoring Locations
Station Code
Location Distance (km) from Project
boundary
Azimuth Directions
Environmental Setting
AAQ1 Rajayyapeta Within Site Within site
Residential
AAQ2 Donevani lakshmipuram 0.30 W
AAQ3 Janakayyapeta 2.3 NE
AAQ4 Vempadu 3.2 N
AAQ5 Kagita 2.6 N
AAQ6 Nakkapalli 3.6 N
3.6.3.2 Ambient Air Quality Monitoring Frequency
Ambient air quality was monitored twice per week during the study period. All the 12 parameters (Sulphur Dioxide (SO2), Nitrogen Dioxide (NO2), Particulate Matter (PM2.5), Particulate Matter (PM10), Carbon Monoxide (CO), Ozone (O3), Lead (Pb), Ammonia (NH3), Benzene (C6H6), Benzo (a) Pyrene (BaP) – Particulate phase only, Arsenic (As) and Nickel (Ni)) are monitored as per NAAQS. The monitoring and analysis were carried out as per CPCB standard methods of measurements.
3.6.3.3 Results and Discussions
The variations of PM10, PM2.5, SO2, NOx, CO, and O3 are compared with National Ambient Air Quality Standards (NAAQS), MoEF&CC Notification, November 2009. Ambient Air Quality and graphically presented in Figure 3-55 to Figure 3-58. Ambient Air Quality results are presented in Appendix C.
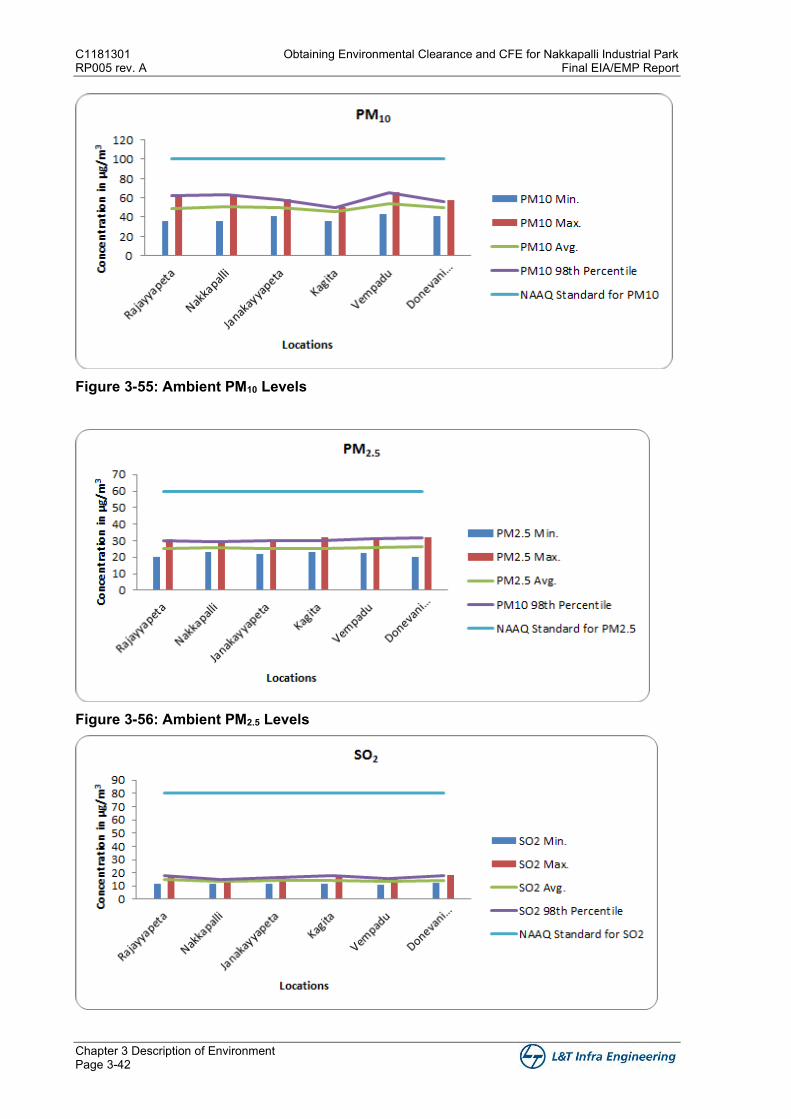
C1181301 Obtaining Environmental Clearance and CFE for Nakkapalli Industrial Park RP005 rev. A Final EIA/EMP Report
Chapter 3 Description of Environment Page 3-42
Figure 3-55: Ambient PM10 Levels
Figure 3-56: Ambient PM2.5 Levels
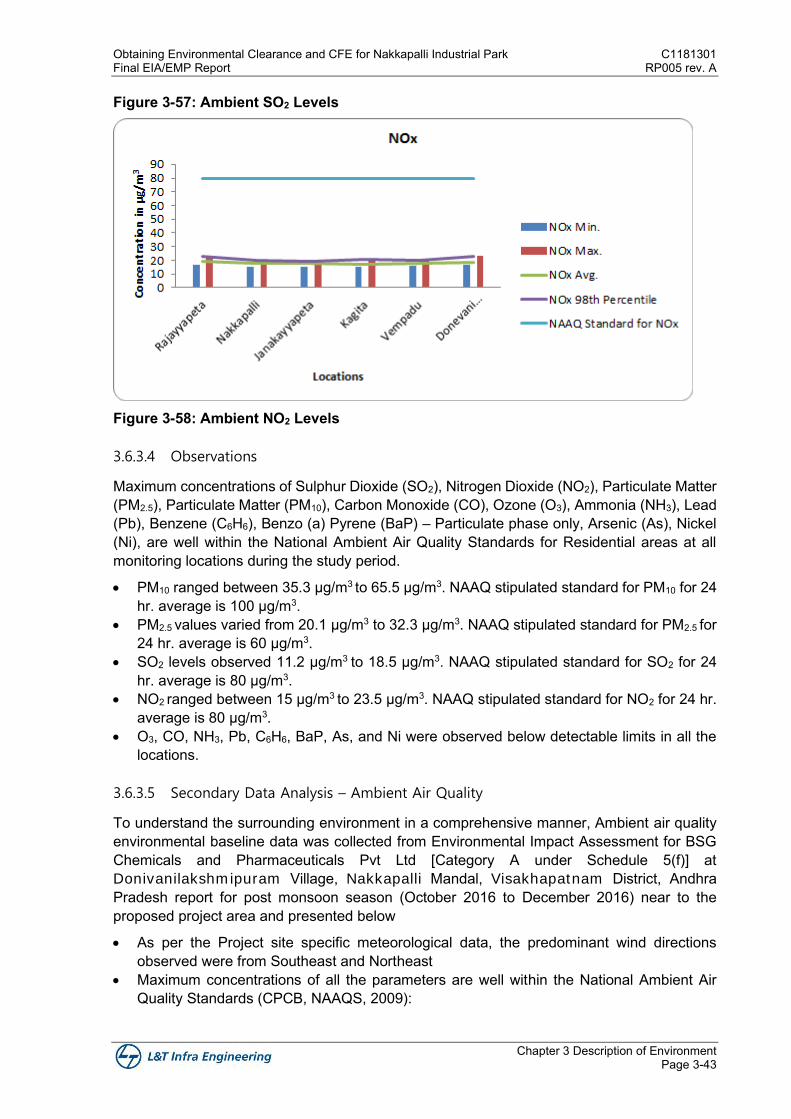
Obtaining Environmental Clearance and CFE for Nakkapalli Industrial Park C1181301 Final EIA/EMP Report RP005 rev. A
Chapter 3 Description of Environment Page 3-43
Figure 3-57: Ambient SO2 Levels
Figure 3-58: Ambient NO2 Levels
3.6.3.4 Observations
Maximum concentrations of Sulphur Dioxide (SO2), Nitrogen Dioxide (NO2), Particulate Matter (PM2.5), Particulate Matter (PM10), Carbon Monoxide (CO), Ozone (O3), Ammonia (NH3), Lead (Pb), Benzene (C6H6), Benzo (a) Pyrene (BaP) – Particulate phase only, Arsenic (As), Nickel (Ni), are well within the National Ambient Air Quality Standards for Residential areas at all monitoring locations during the study period.
• PM10 ranged between 35.3 µg/m3 to 65.5 µg/m3. NAAQ stipulated standard for PM10 for 24 hr. average is 100 µg/m3.
• PM2.5 values varied from 20.1 µg/m3 to 32.3 µg/m3. NAAQ stipulated standard for PM2.5 for 24 hr. average is 60 µg/m3.
• SO2 levels observed 11.2 µg/m3 to 18.5 µg/m3. NAAQ stipulated standard for SO2 for 24 hr. average is 80 µg/m3.
• NO2 ranged between 15 µg/m3 to 23.5 µg/m3. NAAQ stipulated standard for NO2 for 24 hr. average is 80 µg/m3.
• O3, CO, NH3, Pb, C6H6, BaP, As, and Ni were observed below detectable limits in all the locations.
3.6.3.5 Secondary Data Analysis – Ambient Air Quality
To understand the surrounding environment in a comprehensive manner, Ambient air quality environmental baseline data was collected from Environmental Impact Assessment for BSG Chemicals and Pharmaceuticals Pvt Ltd [Category A under Schedule 5(f)] at Donivanilakshmipuram Village, Nakkapalli Mandal, Visakhapatnam District, Andhra Pradesh report for post monsoon season (October 2016 to December 2016) near to the proposed project area and presented below
• As per the Project site specific meteorological data, the predominant wind directions observed were from Southeast and Northeast
• Maximum concentrations of all the parameters are well within the National Ambient Air Quality Standards (CPCB, NAAQS, 2009):
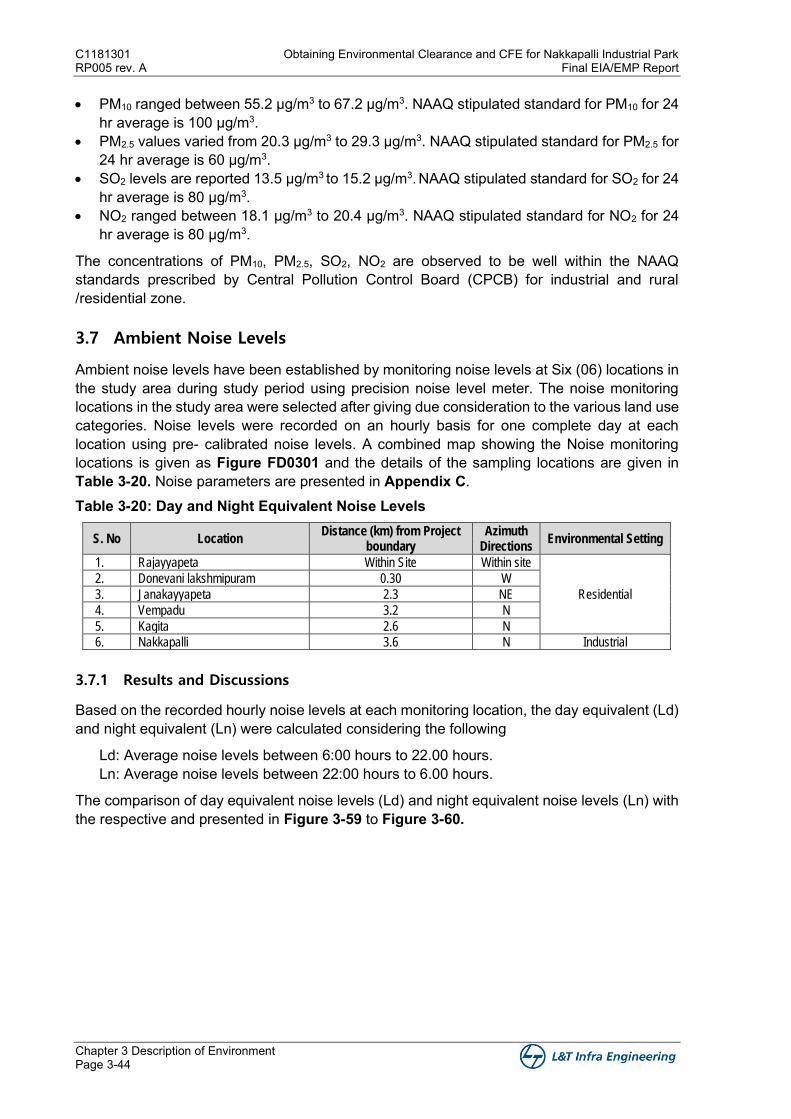
C1181301 Obtaining Environmental Clearance and CFE for Nakkapalli Industrial Park RP005 rev. A Final EIA/EMP Report
Chapter 3 Description of Environment Page 3-44
• PM10 ranged between 55.2 µg/m3 to 67.2 µg/m3. NAAQ stipulated standard for PM10 for 24 hr average is 100 µg/m3.
• PM2.5 values varied from 20.3 µg/m3 to 29.3 µg/m3. NAAQ stipulated standard for PM2.5 for 24 hr average is 60 µg/m3.
• SO2 levels are reported 13.5 µg/m3 to 15.2 µg/m3. NAAQ stipulated standard for SO2 for 24 hr average is 80 µg/m3.
• NO2 ranged between 18.1 µg/m3 to 20.4 µg/m3. NAAQ stipulated standard for NO2 for 24 hr average is 80 µg/m3.
The concentrations of PM10, PM2.5, SO2, NO2 are observed to be well within the NAAQ standards prescribed by Central Pollution Control Board (CPCB) for industrial and rural /residential zone.
3.7 Ambient Noise Levels
Ambient noise levels have been established by monitoring noise levels at Six (06) locations in the study area during study period using precision noise level meter. The noise monitoring locations in the study area were selected after giving due consideration to the various land use categories. Noise levels were recorded on an hourly basis for one complete day at each location using pre- calibrated noise levels. A combined map showing the Noise monitoring locations is given as Figure FD0301 and the details of the sampling locations are given in Table 3-20. Noise parameters are presented in Appendix C. Table 3-20: Day and Night Equivalent Noise Levels
S. No Location Distance (km) from Project
boundary Azimuth
Directions Environmental Setting
1. Rajayyapeta Within Site Within site
Residential
2. Donevani lakshmipuram 0.30 W
3. Janakayyapeta 2.3 NE
4. Vempadu 3.2 N
5. Kagita 2.6 N
6. Nakkapalli 3.6 N Industrial
3.7.1 Results and Discussions
Based on the recorded hourly noise levels at each monitoring location, the day equivalent (Ld) and night equivalent (Ln) were calculated considering the following
Ld: Average noise levels between 6:00 hours to 22.00 hours. Ln: Average noise levels between 22:00 hours to 6.00 hours.
The comparison of day equivalent noise levels (Ld) and night equivalent noise levels (Ln) with the respective and presented in Figure 3-59 to Figure 3-60.
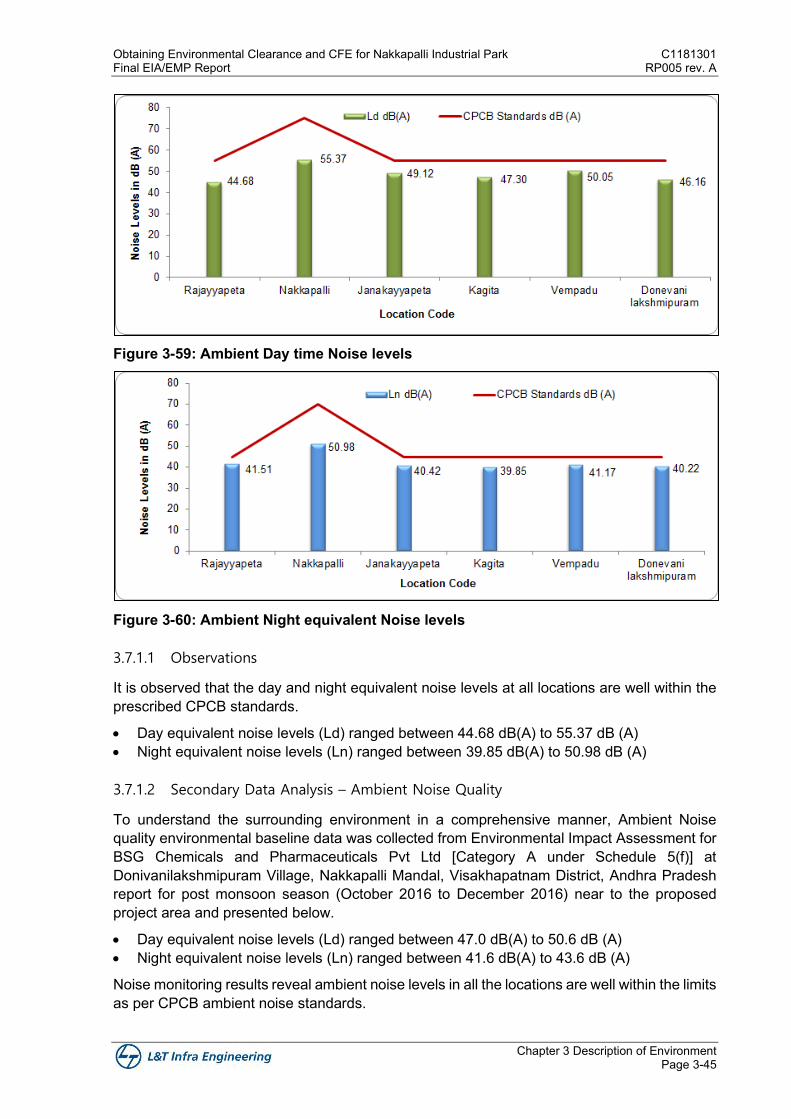
Obtaining Environmental Clearance and CFE for Nakkapalli Industrial Park C1181301 Final EIA/EMP Report RP005 rev. A
Chapter 3 Description of Environment Page 3-45
Figure 3-59: Ambient Day time Noise levels
Figure 3-60: Ambient Night equivalent Noise levels
3.7.1.1 Observations
It is observed that the day and night equivalent noise levels at all locations are well within the prescribed CPCB standards.
• Day equivalent noise levels (Ld) ranged between 44.68 dB(A) to 55.37 dB (A) • Night equivalent noise levels (Ln) ranged between 39.85 dB(A) to 50.98 dB (A)
3.7.1.2 Secondary Data Analysis – Ambient Noise Quality
To understand the surrounding environment in a comprehensive manner, Ambient Noise quality environmental baseline data was collected from Environmental Impact Assessment for BSG Chemicals and Pharmaceuticals Pvt Ltd [Category A under Schedule 5(f)] at Donivanilakshmipuram Village, Nakkapalli Mandal, Visakhapatnam District, Andhra Pradesh report for post monsoon season (October 2016 to December 2016) near to the proposed project area and presented below.
• Day equivalent noise levels (Ld) ranged between 47.0 dB(A) to 50.6 dB (A) • Night equivalent noise levels (Ln) ranged between 41.6 dB(A) to 43.6 dB (A)
Noise monitoring results reveal ambient noise levels in all the locations are well within the limits as per CPCB ambient noise standards.
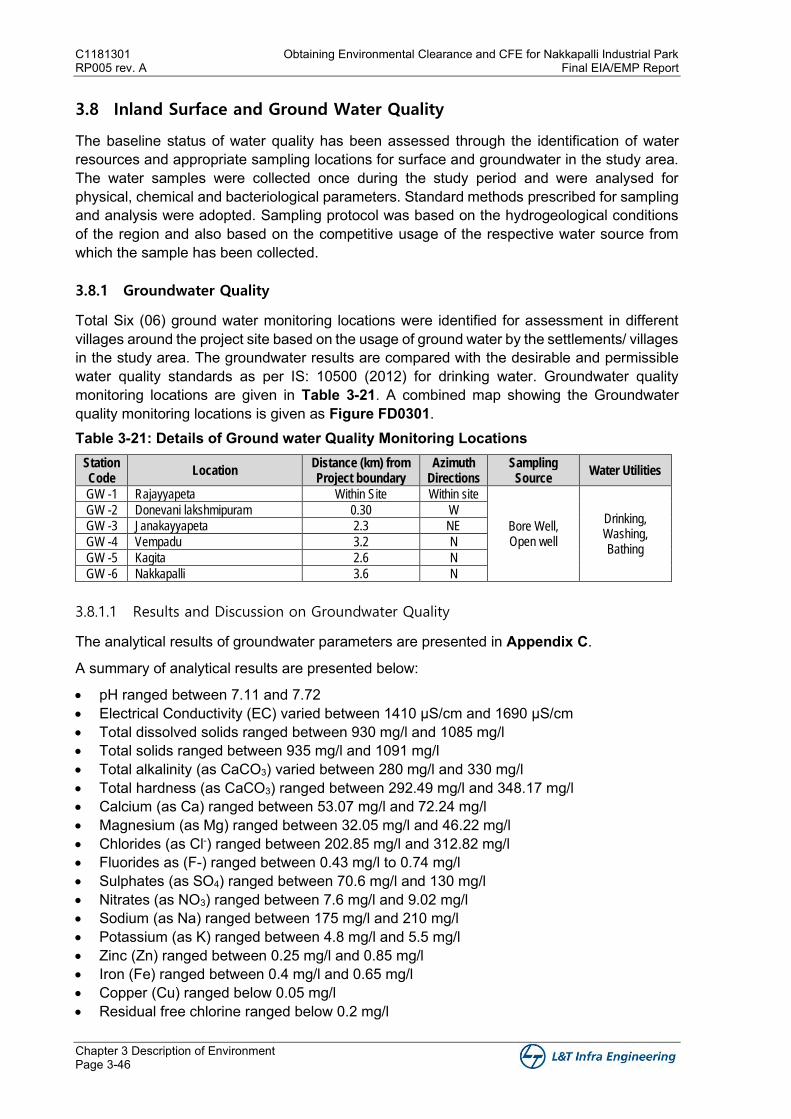
C1181301 Obtaining Environmental Clearance and CFE for Nakkapalli Industrial Park RP005 rev. A Final EIA/EMP Report
Chapter 3 Description of Environment Page 3-46
3.8 Inland Surface and Ground Water Quality
The baseline status of water quality has been assessed through the identification of water resources and appropriate sampling locations for surface and groundwater in the study area. The water samples were collected once during the study period and were analysed for physical, chemical and bacteriological parameters. Standard methods prescribed for sampling and analysis were adopted. Sampling protocol was based on the hydrogeological conditions of the region and also based on the competitive usage of the respective water source from which the sample has been collected.
3.8.1 Groundwater Quality
Total Six (06) ground water monitoring locations were identified for assessment in different villages around the project site based on the usage of ground water by the settlements/ villages in the study area. The groundwater results are compared with the desirable and permissible water quality standards as per IS: 10500 (2012) for drinking water. Groundwater quality monitoring locations are given in Table 3-21. A combined map showing the Groundwater quality monitoring locations is given as Figure FD0301. Table 3-21: Details of Ground water Quality Monitoring Locations
Station Code
Location Distance (km) from Project boundary
Azimuth Directions
Sampling Source
Water Utilities
GW -1 Rajayyapeta Within Site Within site
Bore Well, Open well
Drinking, Washing, Bathing
GW -2 Donevani lakshmipuram 0.30 W
GW -3 Janakayyapeta 2.3 NE
GW -4 Vempadu 3.2 N
GW -5 Kagita 2.6 N
GW -6 Nakkapalli 3.6 N
3.8.1.1 Results and Discussion on Groundwater Quality
The analytical results of groundwater parameters are presented in Appendix C.
A summary of analytical results are presented below:
• pH ranged between 7.11 and 7.72 • Electrical Conductivity (EC) varied between 1410 µS/cm and 1690 µS/cm • Total dissolved solids ranged between 930 mg/l and 1085 mg/l • Total solids ranged between 935 mg/l and 1091 mg/l • Total alkalinity (as CaCO3) varied between 280 mg/l and 330 mg/l • Total hardness (as CaCO3) ranged between 292.49 mg/l and 348.17 mg/l • Calcium (as Ca) ranged between 53.07 mg/l and 72.24 mg/l • Magnesium (as Mg) ranged between 32.05 mg/l and 46.22 mg/l • Chlorides (as Cl-) ranged between 202.85 mg/l and 312.82 mg/l • Fluorides as (F-) ranged between 0.43 mg/l to 0.74 mg/l • Sulphates (as SO4) ranged between 70.6 mg/l and 130 mg/l • Nitrates (as NO3) ranged between 7.6 mg/l and 9.02 mg/l • Sodium (as Na) ranged between 175 mg/l and 210 mg/l • Potassium (as K) ranged between 4.8 mg/l and 5.5 mg/l • Zinc (Zn) ranged between 0.25 mg/l and 0.85 mg/l • Iron (Fe) ranged between 0.4 mg/l and 0.65 mg/l • Copper (Cu) ranged below 0.05 mg/l • Residual free chlorine ranged below 0.2 mg/l
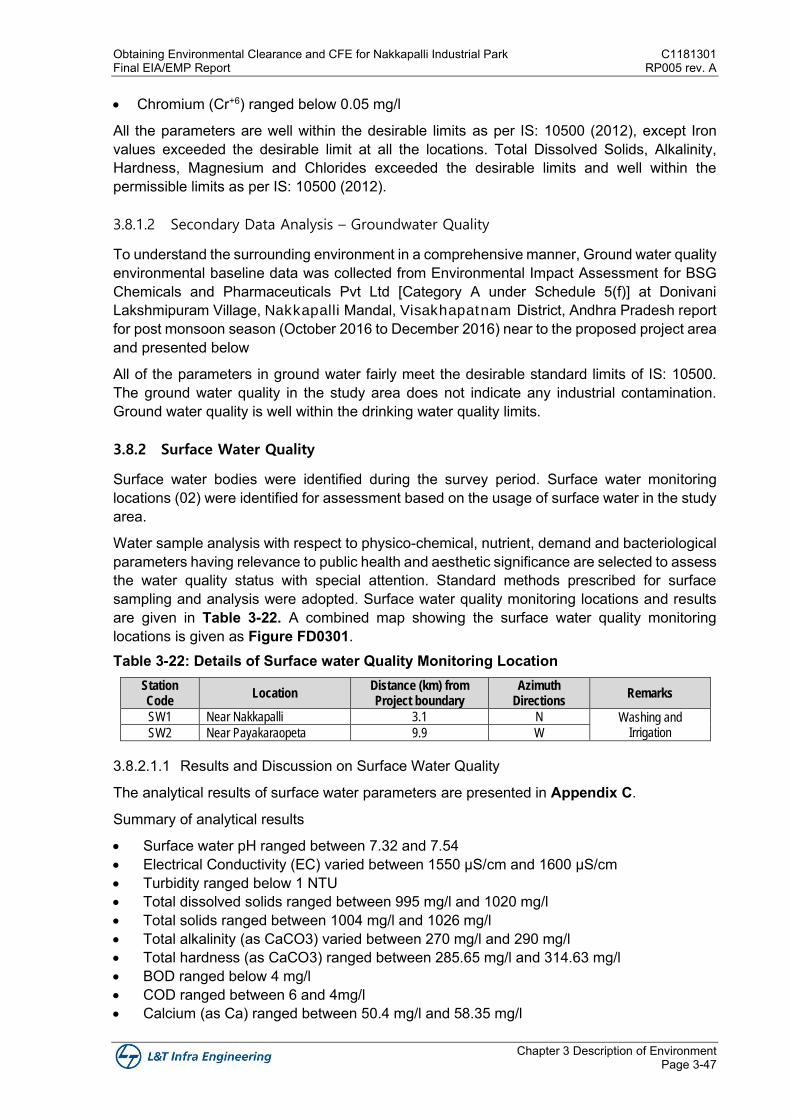
Obtaining Environmental Clearance and CFE for Nakkapalli Industrial Park C1181301 Final EIA/EMP Report RP005 rev. A
Chapter 3 Description of Environment Page 3-47
• Chromium (Cr+6) ranged below 0.05 mg/l
All the parameters are well within the desirable limits as per IS: 10500 (2012), except Iron values exceeded the desirable limit at all the locations. Total Dissolved Solids, Alkalinity, Hardness, Magnesium and Chlorides exceeded the desirable limits and well within the permissible limits as per IS: 10500 (2012).
3.8.1.2 Secondary Data Analysis – Groundwater Quality
To understand the surrounding environment in a comprehensive manner, Ground water quality environmental baseline data was collected from Environmental Impact Assessment for BSG Chemicals and Pharmaceuticals Pvt Ltd [Category A under Schedule 5(f)] at Donivani Lakshmipuram Village, Nakkapalli Mandal, Visakhapatnam District, Andhra Pradesh report for post monsoon season (October 2016 to December 2016) near to the proposed project area and presented below
All of the parameters in ground water fairly meet the desirable standard limits of IS: 10500. The ground water quality in the study area does not indicate any industrial contamination. Ground water quality is well within the drinking water quality limits.
3.8.2 Surface Water Quality
Surface water bodies were identified during the survey period. Surface water monitoring locations (02) were identified for assessment based on the usage of surface water in the study area.
Water sample analysis with respect to physico-chemical, nutrient, demand and bacteriological parameters having relevance to public health and aesthetic significance are selected to assess the water quality status with special attention. Standard methods prescribed for surface sampling and analysis were adopted. Surface water quality monitoring locations and results are given in Table 3-22. A combined map showing the surface water quality monitoring locations is given as Figure FD0301. Table 3-22: Details of Surface water Quality Monitoring Location
Station Code
Location Distance (km) from Project boundary
Azimuth Directions
Remarks
SW1 Near Nakkapalli 3.1 N Washing and Irrigation SW2 Near Payakaraopeta 9.9 W
3.8.2.1.1 Results and Discussion on Surface Water Quality
The analytical results of surface water parameters are presented in Appendix C.
Summary of analytical results
• Surface water pH ranged between 7.32 and 7.54 • Electrical Conductivity (EC) varied between 1550 µS/cm and 1600 µS/cm • Turbidity ranged below 1 NTU • Total dissolved solids ranged between 995 mg/l and 1020 mg/l • Total solids ranged between 1004 mg/l and 1026 mg/l • Total alkalinity (as CaCO3) varied between 270 mg/l and 290 mg/l • Total hardness (as CaCO3) ranged between 285.65 mg/l and 314.63 mg/l • BOD ranged below 4 mg/l • COD ranged between 6 and 4mg/l • Calcium (as Ca) ranged between 50.4 mg/l and 58.35 mg/l
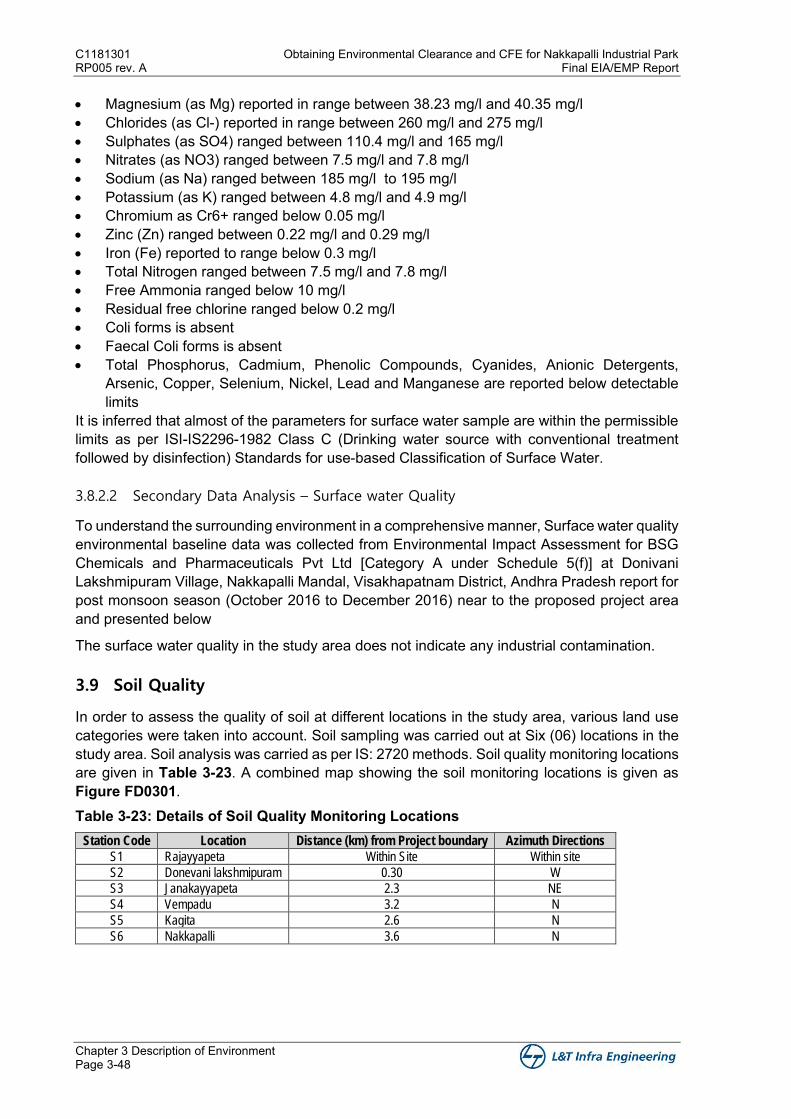
C1181301 Obtaining Environmental Clearance and CFE for Nakkapalli Industrial Park RP005 rev. A Final EIA/EMP Report
Chapter 3 Description of Environment Page 3-48
• Magnesium (as Mg) reported in range between 38.23 mg/l and 40.35 mg/l • Chlorides (as Cl-) reported in range between 260 mg/l and 275 mg/l • Sulphates (as SO4) ranged between 110.4 mg/l and 165 mg/l • Nitrates (as NO3) ranged between 7.5 mg/l and 7.8 mg/l • Sodium (as Na) ranged between 185 mg/l to 195 mg/l • Potassium (as K) ranged between 4.8 mg/l and 4.9 mg/l • Chromium as Cr6+ ranged below 0.05 mg/l • Zinc (Zn) ranged between 0.22 mg/l and 0.29 mg/l • Iron (Fe) reported to range below 0.3 mg/l • Total Nitrogen ranged between 7.5 mg/l and 7.8 mg/l • Free Ammonia ranged below 10 mg/l • Residual free chlorine ranged below 0.2 mg/l • Coli forms is absent • Faecal Coli forms is absent • Total Phosphorus, Cadmium, Phenolic Compounds, Cyanides, Anionic Detergents,
Arsenic, Copper, Selenium, Nickel, Lead and Manganese are reported below detectable limits
It is inferred that almost of the parameters for surface water sample are within the permissible limits as per ISI-IS2296-1982 Class C (Drinking water source with conventional treatment followed by disinfection) Standards for use-based Classification of Surface Water.
3.8.2.2 Secondary Data Analysis – Surface water Quality
To understand the surrounding environment in a comprehensive manner, Surface water quality environmental baseline data was collected from Environmental Impact Assessment for BSG Chemicals and Pharmaceuticals Pvt Ltd [Category A under Schedule 5(f)] at Donivani Lakshmipuram Village, Nakkapalli Mandal, Visakhapatnam District, Andhra Pradesh report for post monsoon season (October 2016 to December 2016) near to the proposed project area and presented below
The surface water quality in the study area does not indicate any industrial contamination.
3.9 Soil Quality
In order to assess the quality of soil at different locations in the study area, various land use categories were taken into account. Soil sampling was carried out at Six (06) locations in the study area. Soil analysis was carried as per IS: 2720 methods. Soil quality monitoring locations are given in Table 3-23. A combined map showing the soil monitoring locations is given as Figure FD0301. Table 3-23: Details of Soil Quality Monitoring Locations
Station Code Location Distance (km) from Project boundary Azimuth Directions
S1 Rajayyapeta Within Site Within site
S2 Donevani lakshmipuram 0.30 W
S3 Janakayyapeta 2.3 NE
S4 Vempadu 3.2 N
S5 Kagita 2.6 N
S6 Nakkapalli 3.6 N
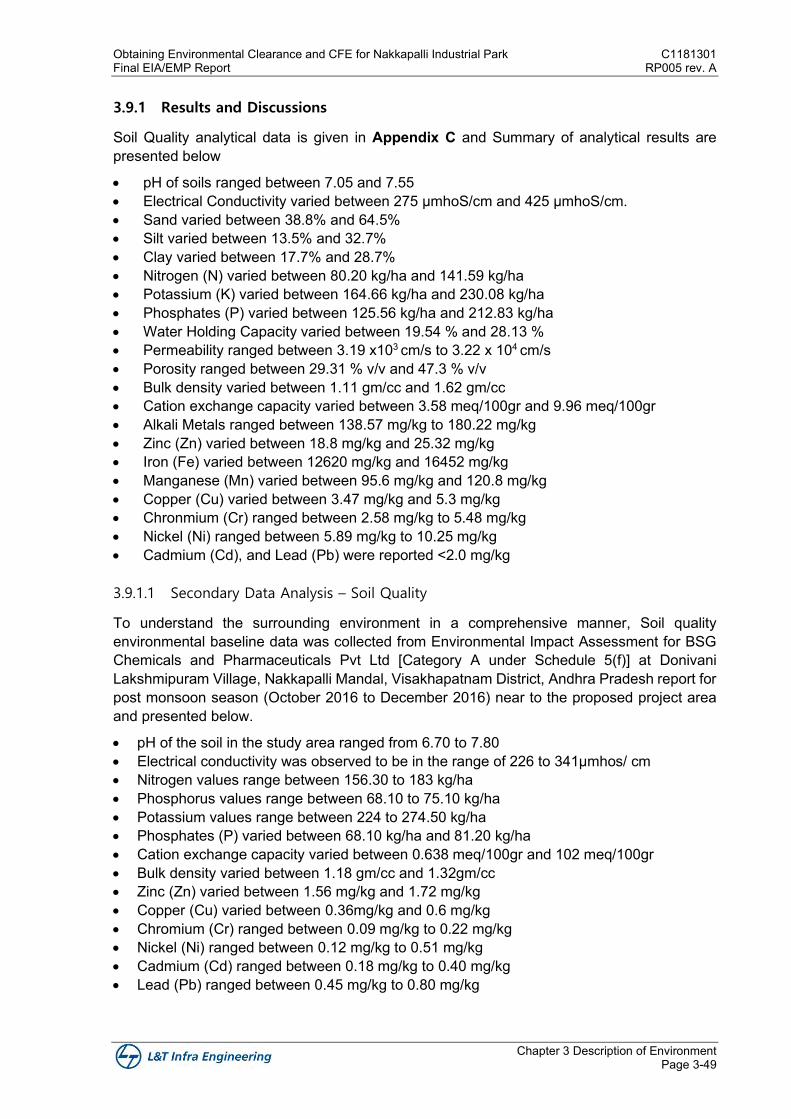
Obtaining Environmental Clearance and CFE for Nakkapalli Industrial Park C1181301 Final EIA/EMP Report RP005 rev. A
Chapter 3 Description of Environment Page 3-49
3.9.1 Results and Discussions
Soil Quality analytical data is given in Appendix C and Summary of analytical results are presented below
• pH of soils ranged between 7.05 and 7.55 • Electrical Conductivity varied between 275 μmhoS/cm and 425 µmhoS/cm. • Sand varied between 38.8% and 64.5% • Silt varied between 13.5% and 32.7% • Clay varied between 17.7% and 28.7% • Nitrogen (N) varied between 80.20 kg/ha and 141.59 kg/ha • Potassium (K) varied between 164.66 kg/ha and 230.08 kg/ha • Phosphates (P) varied between 125.56 kg/ha and 212.83 kg/ha • Water Holding Capacity varied between 19.54 % and 28.13 % • Permeability ranged between 3.19 x103 cm/s to 3.22 x 104 cm/s • Porosity ranged between 29.31 % v/v and 47.3 % v/v • Bulk density varied between 1.11 gm/cc and 1.62 gm/cc • Cation exchange capacity varied between 3.58 meq/100gr and 9.96 meq/100gr • Alkali Metals ranged between 138.57 mg/kg to 180.22 mg/kg • Zinc (Zn) varied between 18.8 mg/kg and 25.32 mg/kg • Iron (Fe) varied between 12620 mg/kg and 16452 mg/kg • Manganese (Mn) varied between 95.6 mg/kg and 120.8 mg/kg • Copper (Cu) varied between 3.47 mg/kg and 5.3 mg/kg • Chronmium (Cr) ranged between 2.58 mg/kg to 5.48 mg/kg • Nickel (Ni) ranged between 5.89 mg/kg to 10.25 mg/kg • Cadmium (Cd), and Lead (Pb) were reported <2.0 mg/kg
3.9.1.1 Secondary Data Analysis – Soil Quality
To understand the surrounding environment in a comprehensive manner, Soil quality environmental baseline data was collected from Environmental Impact Assessment for BSG Chemicals and Pharmaceuticals Pvt Ltd [Category A under Schedule 5(f)] at Donivani Lakshmipuram Village, Nakkapalli Mandal, Visakhapatnam District, Andhra Pradesh report for post monsoon season (October 2016 to December 2016) near to the proposed project area and presented below.
• pH of the soil in the study area ranged from 6.70 to 7.80 • Electrical conductivity was observed to be in the range of 226 to 341µmhos/ cm • Nitrogen values range between 156.30 to 183 kg/ha • Phosphorus values range between 68.10 to 75.10 kg/ha • Potassium values range between 224 to 274.50 kg/ha • Phosphates (P) varied between 68.10 kg/ha and 81.20 kg/ha • Cation exchange capacity varied between 0.638 meq/100gr and 102 meq/100gr • Bulk density varied between 1.18 gm/cc and 1.32gm/cc • Zinc (Zn) varied between 1.56 mg/kg and 1.72 mg/kg • Copper (Cu) varied between 0.36mg/kg and 0.6 mg/kg • Chromium (Cr) ranged between 0.09 mg/kg to 0.22 mg/kg • Nickel (Ni) ranged between 0.12 mg/kg to 0.51 mg/kg • Cadmium (Cd) ranged between 0.18 mg/kg to 0.40 mg/kg • Lead (Pb) ranged between 0.45 mg/kg to 0.80 mg/kg
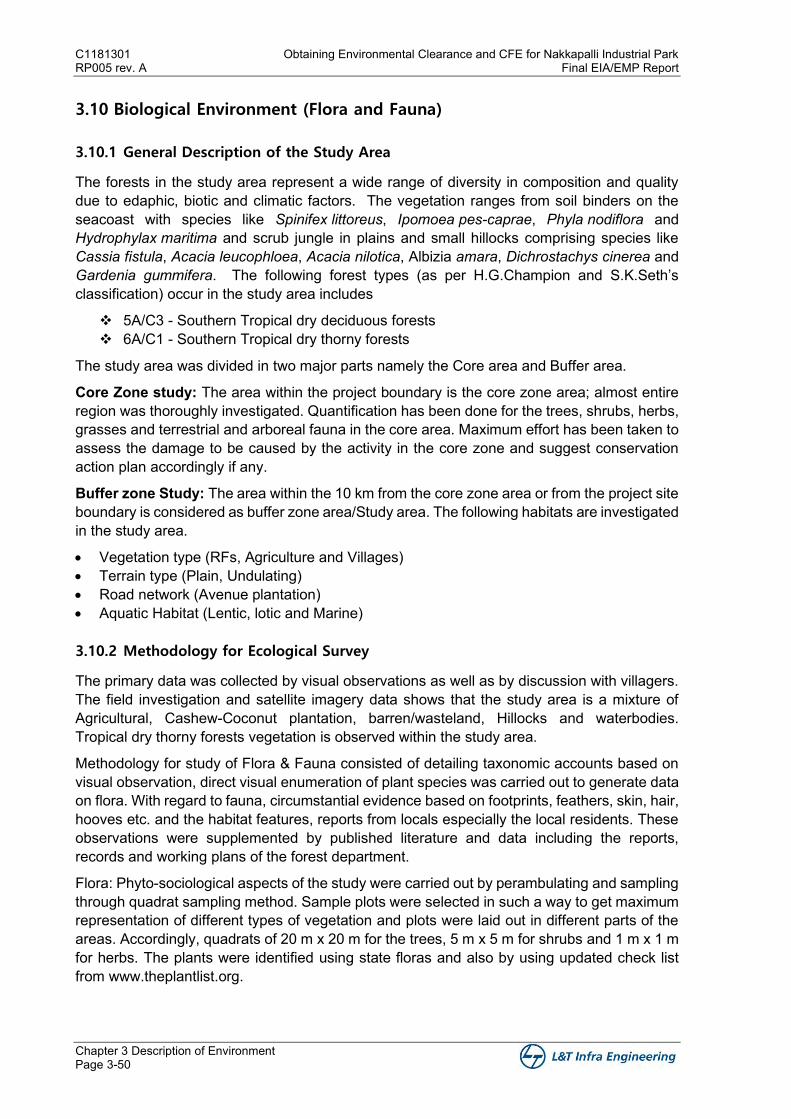
C1181301 Obtaining Environmental Clearance and CFE for Nakkapalli Industrial Park RP005 rev. A Final EIA/EMP Report
Chapter 3 Description of Environment Page 3-50
3.10 Biological Environment (Flora and Fauna)
3.10.1 General Description of the Study Area
The forests in the study area represent a wide range of diversity in composition and quality due to edaphic, biotic and climatic factors. The vegetation ranges from soil binders on the seacoast with species like Spinifex littoreus, Ipomoea pes-caprae, Phyla nodiflora and Hydrophylax maritima and scrub jungle in plains and small hillocks comprising species like Cassia fistula, Acacia leucophloea, Acacia nilotica, Albizia amara, Dichrostachys cinerea and Gardenia gummifera. The following forest types (as per H.G.Champion and S.K.Seth’s classification) occur in the study area includes
❖ 5A/C3 - Southern Tropical dry deciduous forests ❖ 6A/C1 - Southern Tropical dry thorny forests
The study area was divided in two major parts namely the Core area and Buffer area.
Core Zone study: The area within the project boundary is the core zone area; almost entire region was thoroughly investigated. Quantification has been done for the trees, shrubs, herbs, grasses and terrestrial and arboreal fauna in the core area. Maximum effort has been taken to assess the damage to be caused by the activity in the core zone and suggest conservation action plan accordingly if any.
Buffer zone Study: The area within the 10 km from the core zone area or from the project site boundary is considered as buffer zone area/Study area. The following habitats are investigated in the study area.
• Vegetation type (RFs, Agriculture and Villages) • Terrain type (Plain, Undulating) • Road network (Avenue plantation) • Aquatic Habitat (Lentic, lotic and Marine)
3.10.2 Methodology for Ecological Survey
The primary data was collected by visual observations as well as by discussion with villagers. The field investigation and satellite imagery data shows that the study area is a mixture of Agricultural, Cashew-Coconut plantation, barren/wasteland, Hillocks and waterbodies. Tropical dry thorny forests vegetation is observed within the study area.
Methodology for study of Flora & Fauna consisted of detailing taxonomic accounts based on visual observation, direct visual enumeration of plant species was carried out to generate data on flora. With regard to fauna, circumstantial evidence based on footprints, feathers, skin, hair, hooves etc. and the habitat features, reports from locals especially the local residents. These observations were supplemented by published literature and data including the reports, records and working plans of the forest department.
Flora: Phyto-sociological aspects of the study were carried out by perambulating and sampling through quadrat sampling method. Sample plots were selected in such a way to get maximum representation of different types of vegetation and plots were laid out in different parts of the areas. Accordingly, quadrats of 20 m x 20 m for the trees, 5 m x 5 m for shrubs and 1 m x 1 m for herbs. The plants were identified using state floras and also by using updated check list from www.theplantlist.org.
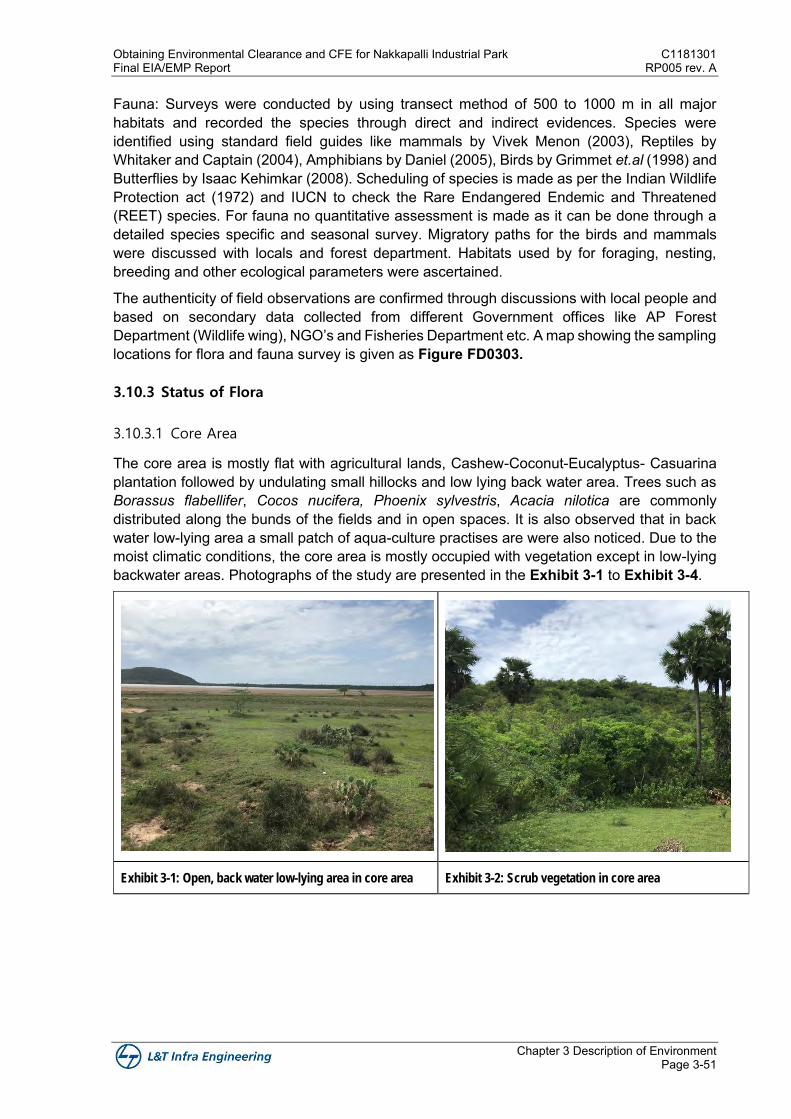
Obtaining Environmental Clearance and CFE for Nakkapalli Industrial Park C1181301 Final EIA/EMP Report RP005 rev. A
Chapter 3 Description of Environment Page 3-51
Fauna: Surveys were conducted by using transect method of 500 to 1000 m in all major habitats and recorded the species through direct and indirect evidences. Species were identified using standard field guides like mammals by Vivek Menon (2003), Reptiles by Whitaker and Captain (2004), Amphibians by Daniel (2005), Birds by Grimmet et.al (1998) and Butterflies by Isaac Kehimkar (2008). Scheduling of species is made as per the Indian Wildlife Protection act (1972) and IUCN to check the Rare Endangered Endemic and Threatened (REET) species. For fauna no quantitative assessment is made as it can be done through a detailed species specific and seasonal survey. Migratory paths for the birds and mammals were discussed with locals and forest department. Habitats used by for foraging, nesting, breeding and other ecological parameters were ascertained.
The authenticity of field observations are confirmed through discussions with local people and based on secondary data collected from different Government offices like AP Forest Department (Wildlife wing), NGO’s and Fisheries Department etc. A map showing the sampling locations for flora and fauna survey is given as Figure FD0303.
3.10.3 Status of Flora
3.10.3.1 Core Area
The core area is mostly flat with agricultural lands, Cashew-Coconut-Eucalyptus- Casuarina plantation followed by undulating small hillocks and low lying back water area. Trees such as Borassus flabellifer, Cocos nucifera, Phoenix sylvestris, Acacia nilotica are commonly distributed along the bunds of the fields and in open spaces. It is also observed that in back water low-lying area a small patch of aqua-culture practises are were also noticed. Due to the moist climatic conditions, the core area is mostly occupied with vegetation except in low-lying backwater areas. Photographs of the study are presented in the Exhibit 3-1 to Exhibit 3-4.
Exhibit 3-1: Open, back water low-lying area in core area Exhibit 3-2: Scrub vegetation in core area
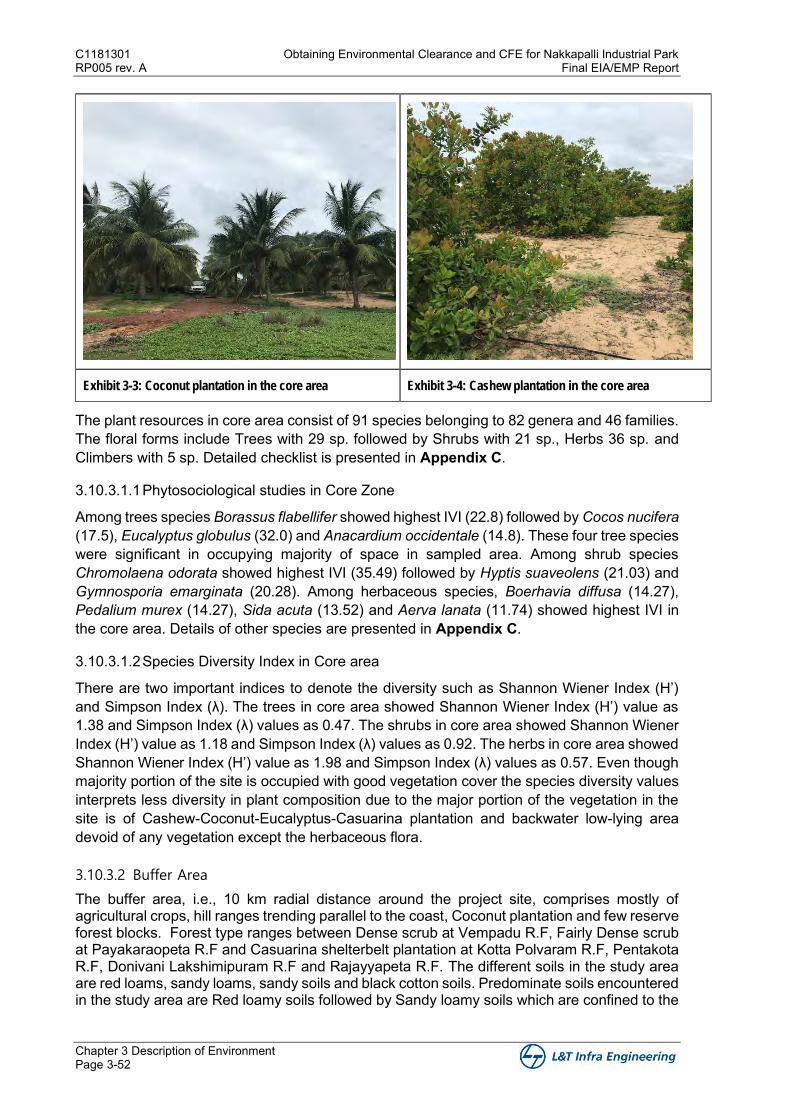
C1181301 Obtaining Environmental Clearance and CFE for Nakkapalli Industrial Park RP005 rev. A Final EIA/EMP Report
Chapter 3 Description of Environment Page 3-52
Exhibit 3-3: Coconut plantation in the core area Exhibit 3-4: Cashew plantation in the core area
The plant resources in core area consist of 91 species belonging to 82 genera and 46 families. The floral forms include Trees with 29 sp. followed by Shrubs with 21 sp., Herbs 36 sp. and Climbers with 5 sp. Detailed checklist is presented in Appendix C.
3.10.3.1.1 Phytosociological studies in Core Zone
Among trees species Borassus flabellifer showed highest IVI (22.8) followed by Cocos nucifera (17.5), Eucalyptus globulus (32.0) and Anacardium occidentale (14.8). These four tree species were significant in occupying majority of space in sampled area. Among shrub species Chromolaena odorata showed highest IVI (35.49) followed by Hyptis suaveolens (21.03) and Gymnosporia emarginata (20.28). Among herbaceous species, Boerhavia diffusa (14.27), Pedalium murex (14.27), Sida acuta (13.52) and Aerva lanata (11.74) showed highest IVI in the core area. Details of other species are presented in Appendix C.
3.10.3.1.2 Species Diversity Index in Core area
There are two important indices to denote the diversity such as Shannon Wiener Index (H’) and Simpson Index (λ). The trees in core area showed Shannon Wiener Index (H’) value as 1.38 and Simpson Index (λ) values as 0.47. The shrubs in core area showed Shannon Wiener Index (H’) value as 1.18 and Simpson Index (λ) values as 0.92. The herbs in core area showed Shannon Wiener Index (H’) value as 1.98 and Simpson Index (λ) values as 0.57. Even though majority portion of the site is occupied with good vegetation cover the species diversity values interprets less diversity in plant composition due to the major portion of the vegetation in the site is of Cashew-Coconut-Eucalyptus-Casuarina plantation and backwater low-lying area devoid of any vegetation except the herbaceous flora.
3.10.3.2 Buffer Area
The buffer area, i.e., 10 km radial distance around the project site, comprises mostly of agricultural crops, hill ranges trending parallel to the coast, Coconut plantation and few reserve forest blocks. Forest type ranges between Dense scrub at Vempadu R.F, Fairly Dense scrub at Payakaraopeta R.F and Casuarina shelterbelt plantation at Kotta Polvaram R.F, Pentakota R.F, Donivani Lakshimipuram R.F and Rajayyapeta R.F. The different soils in the study area are red loams, sandy loams, sandy soils and black cotton soils. Predominate soils encountered in the study area are Red loamy soils followed by Sandy loamy soils which are confined to the
Obtaining Environmental Clearance and CFE for Nakkapalli Industrial Park C1181301 Final EIA/EMP Report RP005 rev. A
Chapter 3 Description of Environment Page 3-53
coastal village areas and Black cotton soils occur in parts of Peddipalem, Aratlakota and Satyavaram. Habitat features of the buffer area presented in the Exhibit 3-5 to Exhibit 3-8.
The plant resources of the buffer area account about 239 plants species belonging to 216 genera and 89 families. The predominant life forms includes Trees (73 sp.), Shrubs (45 sp.), Herbs (92 sp.) followed by Climbers (17 sp.) and Hydrophytes (12 sp.). Detailed checklist of flora represented in both core and buffer are enclosed as Appendix C. Among the families Leguminosae (35 sp.) was the most specious family followed by Apocynaceae (13 sp.), Malvaceae (13sp.) & and Poaceae (13 sp.).
Exhibit 3-5: Waterbody, Hillock near Upamaka Exhibit 3-6: Rocky outcrops at Vempadu R.F
Exhibit 3-7: Dense scrub vegetation at Payakaraopeta R.F Exhibit 3-8: Costal vegetation at Pentakota R.F (Shelterbelt plantation)
3.10.3.2.1 Phytosociological studies in Buffer Zone
Among trees species Borassus flabellifer showed highest IVI (13.56) followed by Phoenix sylvestris (12.26) and Cocos nucifera (11.60) and Ficus religiosa (10.80). These four tree species were significant in occupying majority of space and resources being representing sampled area. Among shrub species Chromolaena odorata showed highest IVI (22.84) followed by Senna occidentalis (16.82) and Getonia floribunda (13.70). Among herbaceous species, Pedalium murex (12.62), Apluda mutica (12.23), Catharanthus roseus (11.29) and
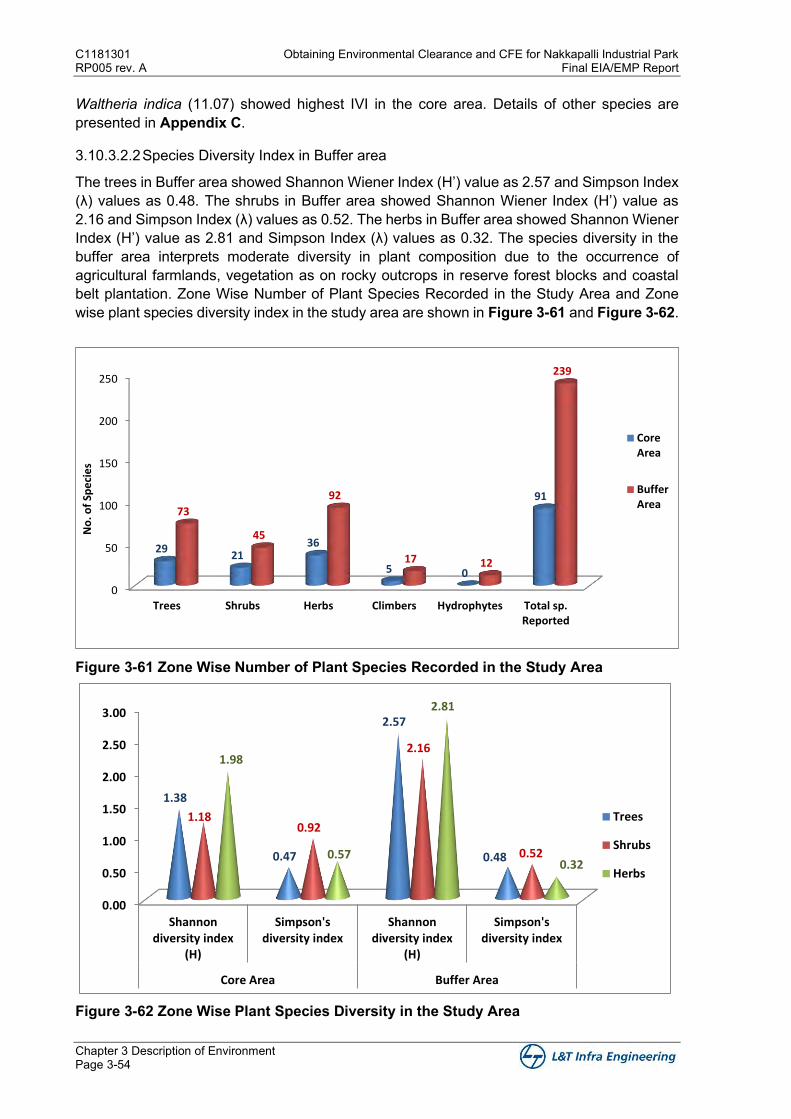
C1181301 Obtaining Environmental Clearance and CFE for Nakkapalli Industrial Park RP005 rev. A Final EIA/EMP Report
Chapter 3 Description of Environment Page 3-54
Waltheria indica (11.07) showed highest IVI in the core area. Details of other species are presented in Appendix C.
3.10.3.2.2 Species Diversity Index in Buffer area
The trees in Buffer area showed Shannon Wiener Index (H’) value as 2.57 and Simpson Index (λ) values as 0.48. The shrubs in Buffer area showed Shannon Wiener Index (H’) value as 2.16 and Simpson Index (λ) values as 0.52. The herbs in Buffer area showed Shannon Wiener Index (H’) value as 2.81 and Simpson Index (λ) values as 0.32. The species diversity in the buffer area interprets moderate diversity in plant composition due to the occurrence of agricultural farmlands, vegetation as on rocky outcrops in reserve forest blocks and coastal belt plantation. Zone Wise Number of Plant Species Recorded in the Study Area and Zone wise plant species diversity index in the study area are shown in Figure 3-61 and Figure 3-62.
Figure 3-61 Zone Wise Number of Plant Species Recorded in the Study Area
Figure 3-62 Zone Wise Plant Species Diversity in the Study Area
0
50
100
150
200
250
Trees Shrubs Herbs Climbers Hydrophytes Total sp.Reported
2921
36
5 0
9173
45
92
17 12
239
No
. of
Spe
cie
s
CoreArea
BufferArea
0.00
0.50
1.00
1.50
2.00
2.50
3.00
Shannondiversity index
(H)
Simpson'sdiversity index
Shannondiversity index
(H)
Simpson'sdiversity index
Core Area Buffer Area
1.38
0.47
2.57
0.48
1.180.92
2.16
0.52
1.98
0.57
2.81
0.32
Trees
Shrubs
Herbs
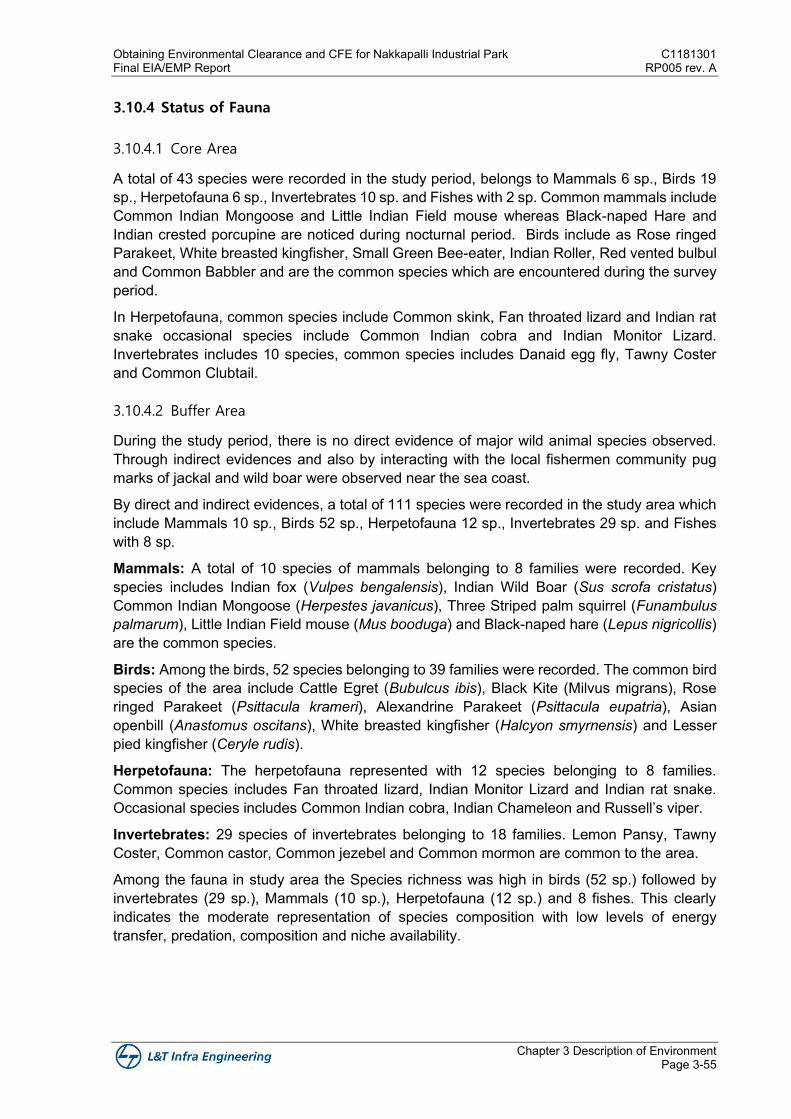
Obtaining Environmental Clearance and CFE for Nakkapalli Industrial Park C1181301 Final EIA/EMP Report RP005 rev. A
Chapter 3 Description of Environment Page 3-55
3.10.4 Status of Fauna
3.10.4.1 Core Area
A total of 43 species were recorded in the study period, belongs to Mammals 6 sp., Birds 19 sp., Herpetofauna 6 sp., Invertebrates 10 sp. and Fishes with 2 sp. Common mammals include Common Indian Mongoose and Little Indian Field mouse whereas Black-naped Hare and Indian crested porcupine are noticed during nocturnal period. Birds include as Rose ringed Parakeet, White breasted kingfisher, Small Green Bee-eater, Indian Roller, Red vented bulbul and Common Babbler and are the common species which are encountered during the survey period.
In Herpetofauna, common species include Common skink, Fan throated lizard and Indian rat snake occasional species include Common Indian cobra and Indian Monitor Lizard. Invertebrates includes 10 species, common species includes Danaid egg fly, Tawny Coster and Common Clubtail.
3.10.4.2 Buffer Area
During the study period, there is no direct evidence of major wild animal species observed. Through indirect evidences and also by interacting with the local fishermen community pug marks of jackal and wild boar were observed near the sea coast.
By direct and indirect evidences, a total of 111 species were recorded in the study area which include Mammals 10 sp., Birds 52 sp., Herpetofauna 12 sp., Invertebrates 29 sp. and Fishes with 8 sp.
Mammals: A total of 10 species of mammals belonging to 8 families were recorded. Key species includes Indian fox (Vulpes bengalensis), Indian Wild Boar (Sus scrofa cristatus) Common Indian Mongoose (Herpestes javanicus), Three Striped palm squirrel (Funambulus palmarum), Little Indian Field mouse (Mus booduga) and Black-naped hare (Lepus nigricollis) are the common species.
Birds: Among the birds, 52 species belonging to 39 families were recorded. The common bird species of the area include Cattle Egret (Bubulcus ibis), Black Kite (Milvus migrans), Rose ringed Parakeet (Psittacula krameri), Alexandrine Parakeet (Psittacula eupatria), Asian openbill (Anastomus oscitans), White breasted kingfisher (Halcyon smyrnensis) and Lesser pied kingfisher (Ceryle rudis).
Herpetofauna: The herpetofauna represented with 12 species belonging to 8 families. Common species includes Fan throated lizard, Indian Monitor Lizard and Indian rat snake. Occasional species includes Common Indian cobra, Indian Chameleon and Russell’s viper.
Invertebrates: 29 species of invertebrates belonging to 18 families. Lemon Pansy, Tawny Coster, Common castor, Common jezebel and Common mormon are common to the area.
Among the fauna in study area the Species richness was high in birds (52 sp.) followed by invertebrates (29 sp.), Mammals (10 sp.), Herpetofauna (12 sp.) and 8 fishes. This clearly indicates the moderate representation of species composition with low levels of energy transfer, predation, composition and niche availability.
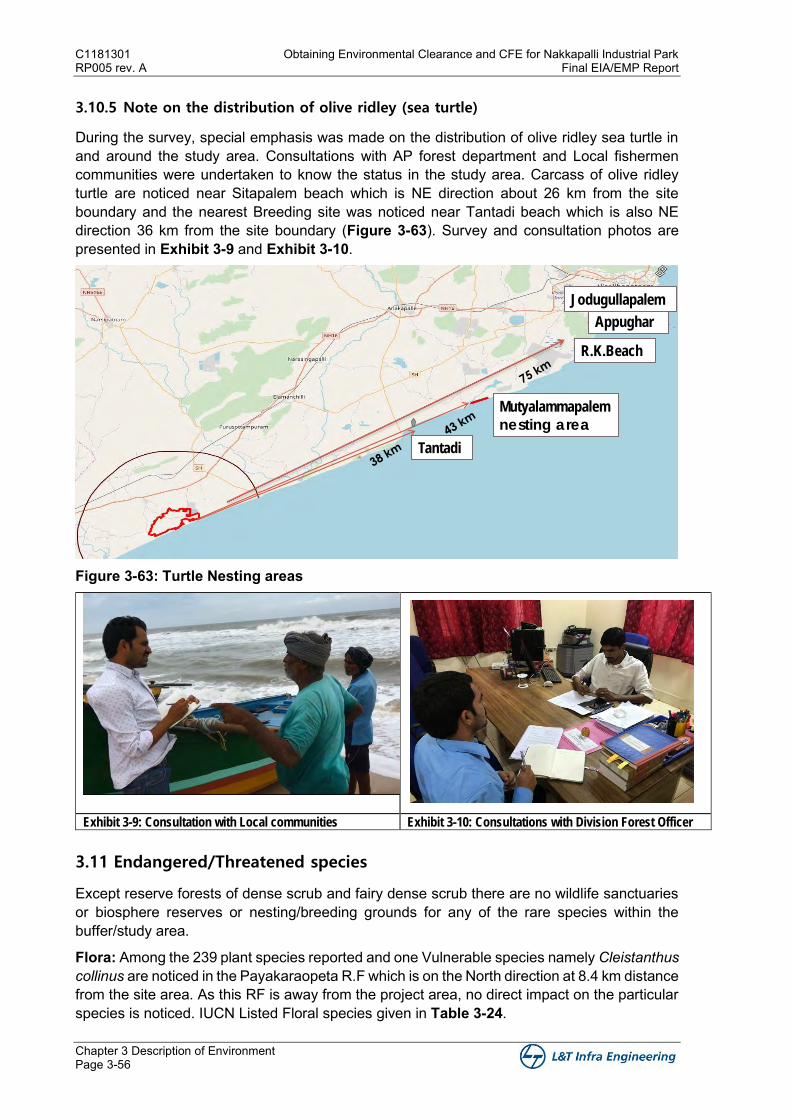
C1181301 Obtaining Environmental Clearance and CFE for Nakkapalli Industrial Park RP005 rev. A Final EIA/EMP Report
Chapter 3 Description of Environment Page 3-56
3.10.5 Note on the distribution of olive ridley (sea turtle)
During the survey, special emphasis was made on the distribution of olive ridley sea turtle in and around the study area. Consultations with AP forest department and Local fishermen communities were undertaken to know the status in the study area. Carcass of olive ridley turtle are noticed near Sitapalem beach which is NE direction about 26 km from the site boundary and the nearest Breeding site was noticed near Tantadi beach which is also NE direction 36 km from the site boundary (Figure 3-63). Survey and consultation photos are presented in Exhibit 3-9 and Exhibit 3-10.
Figure 3-63: Turtle Nesting areas
Exhibit 3-9: Consultation with Local communities Exhibit 3-10: Consultations with Division Forest Officer
3.11 Endangered/Threatened species
Except reserve forests of dense scrub and fairy dense scrub there are no wildlife sanctuaries or biosphere reserves or nesting/breeding grounds for any of the rare species within the buffer/study area.
Flora: Among the 239 plant species reported and one Vulnerable species namely Cleistanthus collinus are noticed in the Payakaraopeta R.F which is on the North direction at 8.4 km distance from the site area. As this RF is away from the project area, no direct impact on the particular species is noticed. IUCN Listed Floral species given in Table 3-24.
R.K.Beach
Appughar
Jodugullapalem
Mutyalammapalem
nesting area
Tantadi
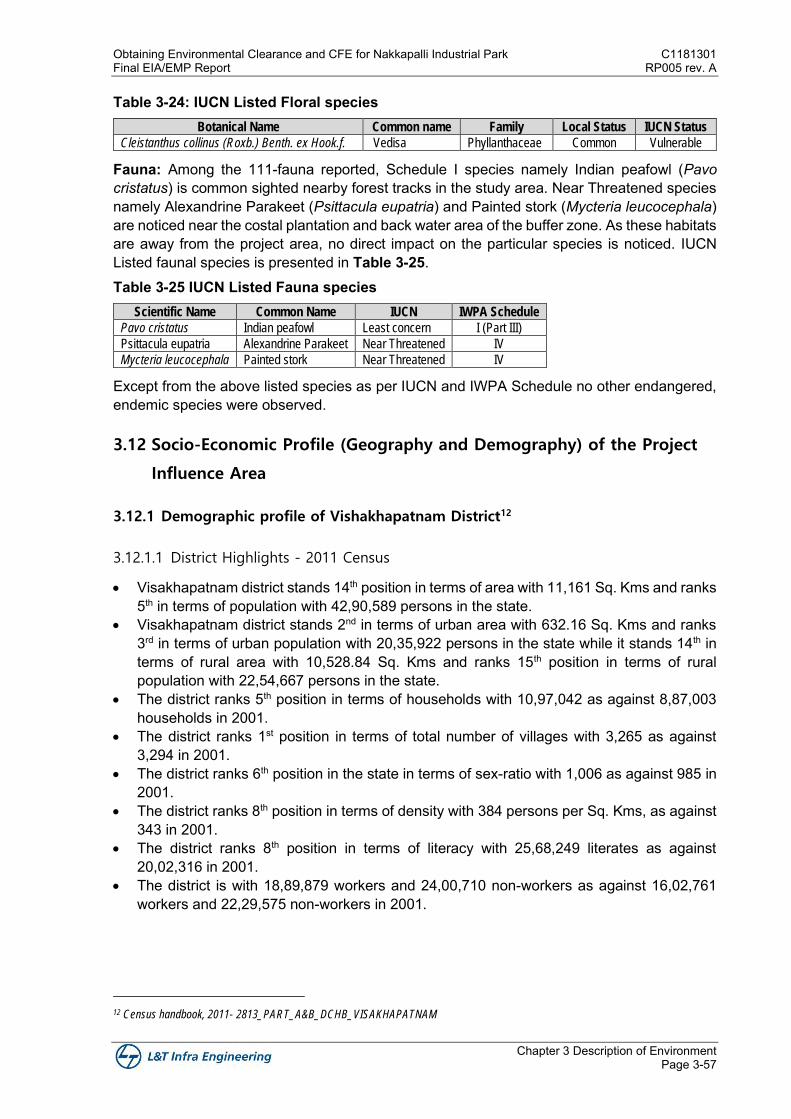
Obtaining Environmental Clearance and CFE for Nakkapalli Industrial Park C1181301 Final EIA/EMP Report RP005 rev. A
Chapter 3 Description of Environment Page 3-57
Table 3-24: IUCN Listed Floral species Botanical Name Common name Family Local Status IUCN Status
Cleistanthus collinus (Roxb.) Benth. ex Hook.f. Vedisa Phyllanthaceae Common Vulnerable
Fauna: Among the 111-fauna reported, Schedule I species namely Indian peafowl (Pavo cristatus) is common sighted nearby forest tracks in the study area. Near Threatened species namely Alexandrine Parakeet (Psittacula eupatria) and Painted stork (Mycteria leucocephala) are noticed near the costal plantation and back water area of the buffer zone. As these habitats are away from the project area, no direct impact on the particular species is noticed. IUCN Listed faunal species is presented in Table 3-25. Table 3-25 IUCN Listed Fauna species
Scientific Name Common Name IUCN IWPA Schedule
Pavo cristatus Indian peafowl Least concern I (Part III)
Psittacula eupatria Alexandrine Parakeet Near Threatened IV
Mycteria leucocephala Painted stork Near Threatened IV
Except from the above listed species as per IUCN and IWPA Schedule no other endangered, endemic species were observed.
3.12 Socio-Economic Profile (Geography and Demography) of the Project
Influence Area
3.12.1 Demographic profile of Vishakhapatnam District12
3.12.1.1 District Highlights - 2011 Census
• Visakhapatnam district stands 14th position in terms of area with 11,161 Sq. Kms and ranks 5th in terms of population with 42,90,589 persons in the state.
• Visakhapatnam district stands 2nd in terms of urban area with 632.16 Sq. Kms and ranks 3rd in terms of urban population with 20,35,922 persons in the state while it stands 14th in terms of rural area with 10,528.84 Sq. Kms and ranks 15th position in terms of rural population with 22,54,667 persons in the state.
• The district ranks 5th position in terms of households with 10,97,042 as against 8,87,003 households in 2001.
• The district ranks 1st position in terms of total number of villages with 3,265 as against 3,294 in 2001.
• The district ranks 6th position in the state in terms of sex-ratio with 1,006 as against 985 in 2001.
• The district ranks 8th position in terms of density with 384 persons per Sq. Kms, as against 343 in 2001.
• The district ranks 8th position in terms of literacy with 25,68,249 literates as against 20,02,316 in 2001.
• The district is with 18,89,879 workers and 24,00,710 non-workers as against 16,02,761 workers and 22,29,575 non-workers in 2001.
12 Census handbook, 2011- 2813_PART_A&B_DCHB_VISAKHAPATNAM
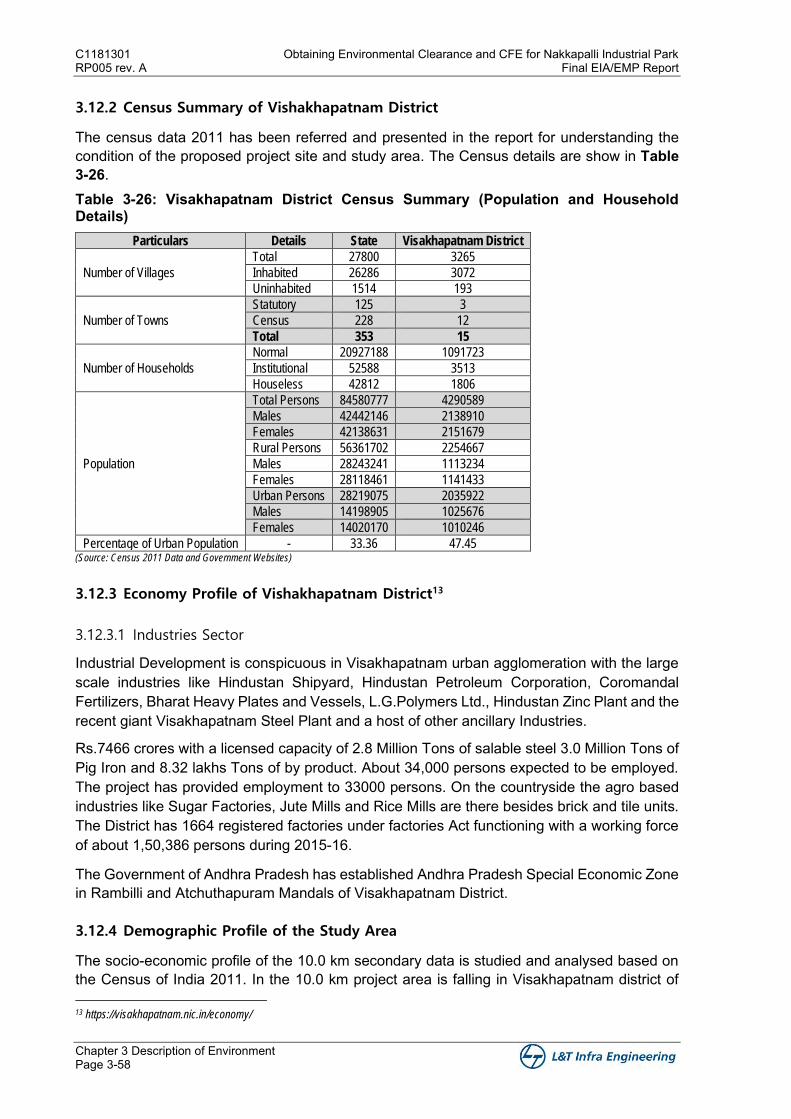
C1181301 Obtaining Environmental Clearance and CFE for Nakkapalli Industrial Park RP005 rev. A Final EIA/EMP Report
Chapter 3 Description of Environment Page 3-58
3.12.2 Census Summary of Vishakhapatnam District
The census data 2011 has been referred and presented in the report for understanding the condition of the proposed project site and study area. The Census details are show in Table 3-26. Table 3-26: Visakhapatnam District Census Summary (Population and Household Details)
Particulars Details State Visakhapatnam District
Number of Villages
Total 27800 3265
Inhabited 26286 3072
Uninhabited 1514 193
Number of Towns
Statutory 125 3
Census 228 12
Total 353 15
Number of Households
Normal 20927188 1091723
Institutional 52588 3513
Houseless 42812 1806
Population
Total Persons 84580777 4290589
Males 42442146 2138910
Females 42138631 2151679
Rural Persons 56361702 2254667
Males 28243241 1113234
Females 28118461 1141433
Urban Persons 28219075 2035922
Males 14198905 1025676
Females 14020170 1010246
Percentage of Urban Population - 33.36 47.45 (Source: Census 2011 Data and Government Websites)
3.12.3 Economy Profile of Vishakhapatnam District13
3.12.3.1 Industries Sector
Industrial Development is conspicuous in Visakhapatnam urban agglomeration with the large scale industries like Hindustan Shipyard, Hindustan Petroleum Corporation, Coromandal Fertilizers, Bharat Heavy Plates and Vessels, L.G.Polymers Ltd., Hindustan Zinc Plant and the recent giant Visakhapatnam Steel Plant and a host of other ancillary Industries.
Rs.7466 crores with a licensed capacity of 2.8 Million Tons of salable steel 3.0 Million Tons of Pig Iron and 8.32 lakhs Tons of by product. About 34,000 persons expected to be employed. The project has provided employment to 33000 persons. On the countryside the agro based industries like Sugar Factories, Jute Mills and Rice Mills are there besides brick and tile units. The District has 1664 registered factories under factories Act functioning with a working force of about 1,50,386 persons during 2015-16.
The Government of Andhra Pradesh has established Andhra Pradesh Special Economic Zone in Rambilli and Atchuthapuram Mandals of Visakhapatnam District.
3.12.4 Demographic Profile of the Study Area
The socio-economic profile of the 10.0 km secondary data is studied and analysed based on the Census of India 2011. In the 10.0 km project area is falling in Visakhapatnam district of
13 https://visakhapatnam.nic.in/economy/
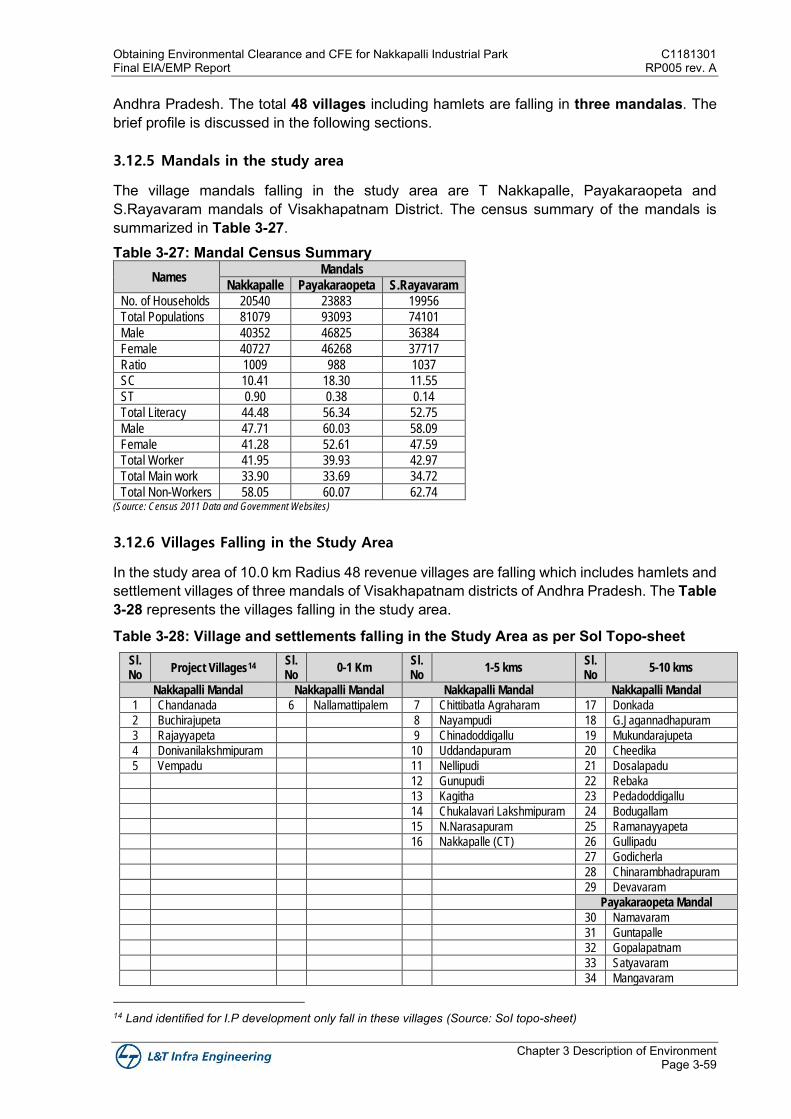
Obtaining Environmental Clearance and CFE for Nakkapalli Industrial Park C1181301 Final EIA/EMP Report RP005 rev. A
Chapter 3 Description of Environment Page 3-59
Andhra Pradesh. The total 48 villages including hamlets are falling in three mandalas. The brief profile is discussed in the following sections.
3.12.5 Mandals in the study area
The village mandals falling in the study area are T Nakkapalle, Payakaraopeta and S.Rayavaram mandals of Visakhapatnam District. The census summary of the mandals is summarized in Table 3-27. Table 3-27: Mandal Census Summary
Names Mandals
Nakkapalle Payakaraopeta S.Rayavaram
No. of Households 20540 23883 19956
Total Populations 81079 93093 74101
Male 40352 46825 36384
Female 40727 46268 37717
Ratio 1009 988 1037
SC 10.41 18.30 11.55
ST 0.90 0.38 0.14
Total Literacy 44.48 56.34 52.75
Male 47.71 60.03 58.09
Female 41.28 52.61 47.59
Total Worker 41.95 39.93 42.97
Total Main work 33.90 33.69 34.72
Total Non-Workers 58.05 60.07 62.74 (Source: Census 2011 Data and Government Websites)
3.12.6 Villages Falling in the Study Area
In the study area of 10.0 km Radius 48 revenue villages are falling which includes hamlets and settlement villages of three mandals of Visakhapatnam districts of Andhra Pradesh. The Table 3-28 represents the villages falling in the study area.
Table 3-28: Village and settlements falling in the Study Area as per SoI Topo-sheet Sl. No
Project Villages14 Sl. No
0-1 Km Sl. No
1-5 kms Sl. No
5-10 kms
Nakkapalli Mandal Nakkapalli Mandal Nakkapalli Mandal Nakkapalli Mandal
1 Chandanada 6 Nallamattipalem 7 Chittibatla Agraharam 17 Donkada
2 Buchirajupeta 8 Nayampudi 18 G.Jagannadhapuram
3 Rajayyapeta 9 Chinadoddigallu 19 Mukundarajupeta
4 Donivanilakshmipuram 10 Uddandapuram 20 Cheedika
5 Vempadu 11 Nellipudi 21 Dosalapadu 12 Gunupudi 22 Rebaka 13 Kagitha 23 Pedadoddigallu 14 Chukalavari Lakshmipuram 24 Bodugallam 15 N.Narasapuram 25 Ramanayyapeta 16 Nakkapalle (CT) 26 Gullipadu 27 Godicherla 28 Chinarambhadrapuram 29 Devavaram Payakaraopeta Mandal 30 Namavaram 31 Guntapalle 32 Gopalapatnam 33 Satyavaram 34 Mangavaram
14 Land identified for I.P development only fall in these villages (Source: SoI topo-sheet)
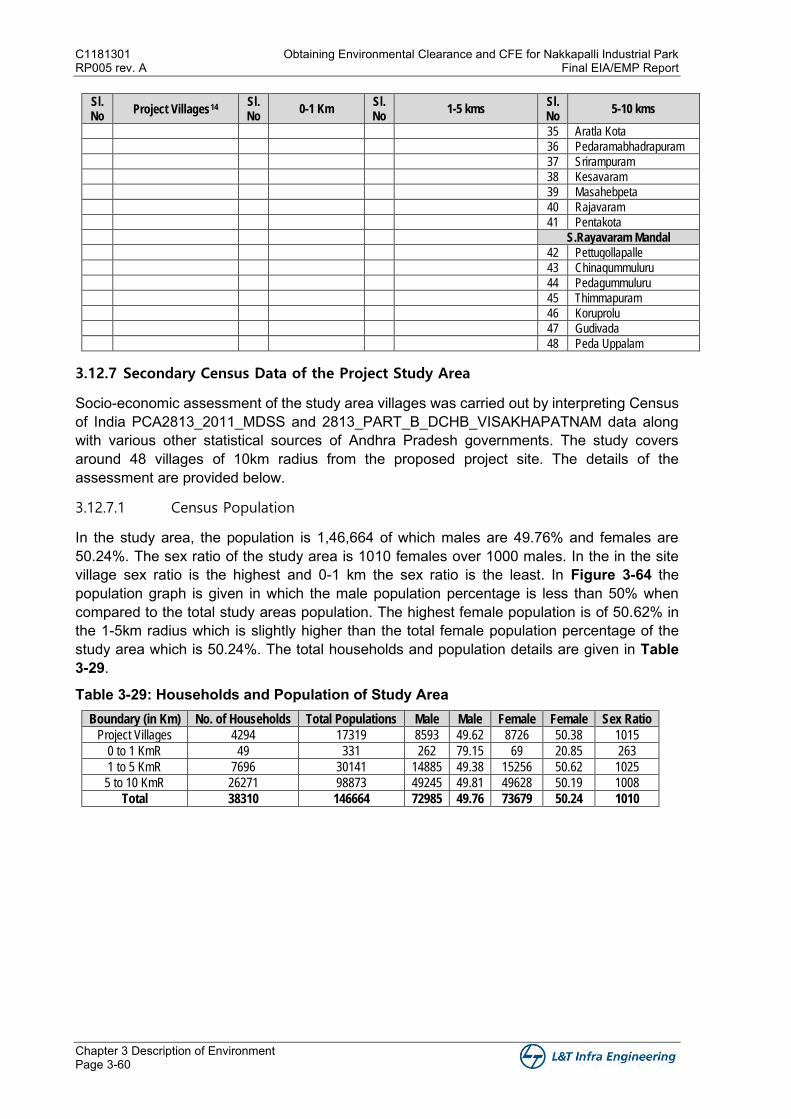
C1181301 Obtaining Environmental Clearance and CFE for Nakkapalli Industrial Park RP005 rev. A Final EIA/EMP Report
Chapter 3 Description of Environment Page 3-60
Sl. No
Project Villages14 Sl. No
0-1 Km Sl. No
1-5 kms Sl. No
5-10 kms
35 Aratla Kota 36 Pedaramabhadrapuram 37 Srirampuram 38 Kesavaram 39 Masahebpeta 40 Rajavaram 41 Pentakota S.Rayavaram Mandal 42 Pettugollapalle 43 Chinagummuluru 44 Pedagummuluru 45 Thimmapuram 46 Koruprolu 47 Gudivada 48 Peda Uppalam
3.12.7 Secondary Census Data of the Project Study Area
Socio-economic assessment of the study area villages was carried out by interpreting Census of India PCA2813_2011_MDSS and 2813_PART_B_DCHB_VISAKHAPATNAM data along with various other statistical sources of Andhra Pradesh governments. The study covers around 48 villages of 10km radius from the proposed project site. The details of the assessment are provided below.
3.12.7.1 Census Population
In the study area, the population is 1,46,664 of which males are 49.76% and females are 50.24%. The sex ratio of the study area is 1010 females over 1000 males. In the in the site village sex ratio is the highest and 0-1 km the sex ratio is the least. In Figure 3-64 the population graph is given in which the male population percentage is less than 50% when compared to the total study areas population. The highest female population is of 50.62% in the 1-5km radius which is slightly higher than the total female population percentage of the study area which is 50.24%. The total households and population details are given in Table 3-29.
Table 3-29: Households and Population of Study Area Boundary (in Km) No. of Households Total Populations Male Male Female Female Sex Ratio
Project Villages 4294 17319 8593 49.62 8726 50.38 1015
0 to 1 KmR 49 331 262 79.15 69 20.85 263
1 to 5 KmR 7696 30141 14885 49.38 15256 50.62 1025
5 to 10 KmR 26271 98873 49245 49.81 49628 50.19 1008
Total 38310 146664 72985 49.76 73679 50.24 1010
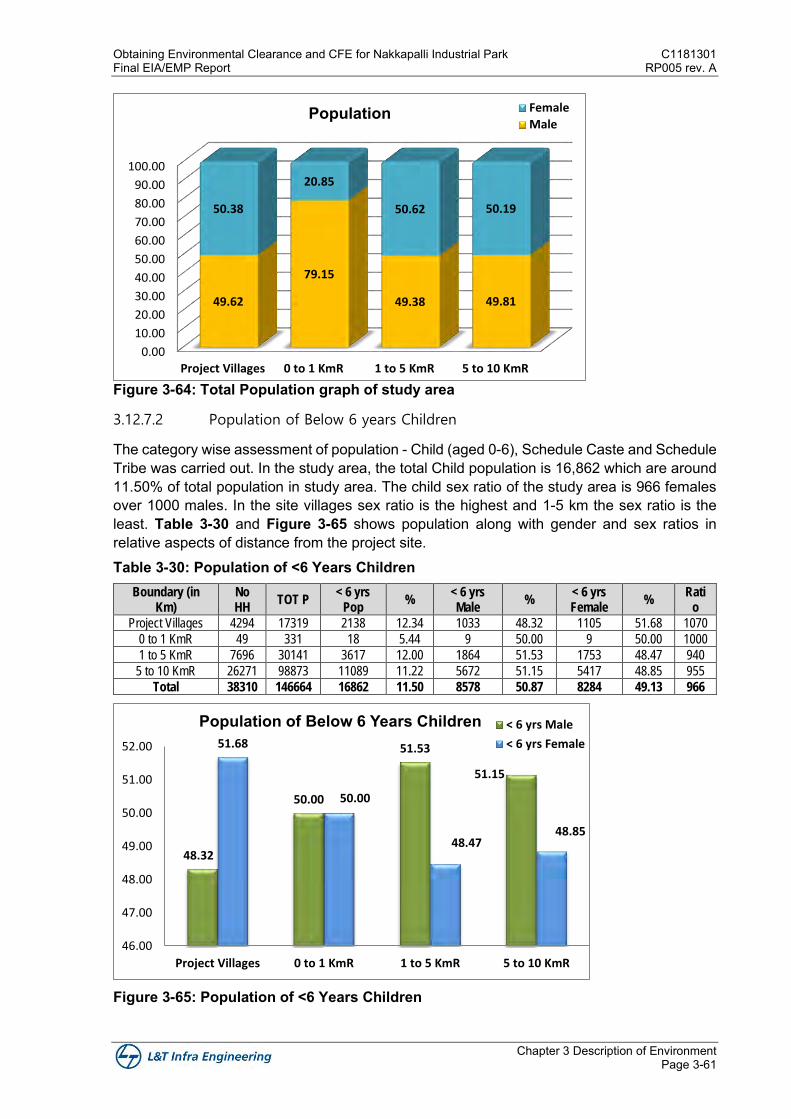
Obtaining Environmental Clearance and CFE for Nakkapalli Industrial Park C1181301 Final EIA/EMP Report RP005 rev. A
Chapter 3 Description of Environment Page 3-61
Figure 3-64: Total Population graph of study area
3.12.7.2 Population of Below 6 years Children
The category wise assessment of population - Child (aged 0-6), Schedule Caste and Schedule Tribe was carried out. In the study area, the total Child population is 16,862 which are around 11.50% of total population in study area. The child sex ratio of the study area is 966 females over 1000 males. In the site villages sex ratio is the highest and 1-5 km the sex ratio is the least. Table 3-30 and Figure 3-65 shows population along with gender and sex ratios in relative aspects of distance from the project site. Table 3-30: Population of <6 Years Children
Boundary (in Km)
No HH
TOT P < 6 yrs
Pop %
< 6 yrs Male
% < 6 yrs Female
% Rati
o
Project Villages 4294 17319 2138 12.34 1033 48.32 1105 51.68 1070
0 to 1 KmR 49 331 18 5.44 9 50.00 9 50.00 1000
1 to 5 KmR 7696 30141 3617 12.00 1864 51.53 1753 48.47 940
5 to 10 KmR 26271 98873 11089 11.22 5672 51.15 5417 48.85 955
Total 38310 146664 16862 11.50 8578 50.87 8284 49.13 966
Figure 3-65: Population of <6 Years Children
0.00
10.00
20.00
30.00
40.00
50.00
60.00
70.00
80.00
90.00
100.00
Project Villages 0 to 1 KmR 1 to 5 KmR 5 to 10 KmR
49.62
79.15
49.38 49.81
50.38
20.85
50.62 50.19
Population Female
Male
48.32
50.00
51.53
51.15
51.68
50.00
48.4748.85
46.00
47.00
48.00
49.00
50.00
51.00
52.00
Project Villages 0 to 1 KmR 1 to 5 KmR 5 to 10 KmR
Population of Below 6 Years Children < 6 yrs Male
< 6 yrs Female
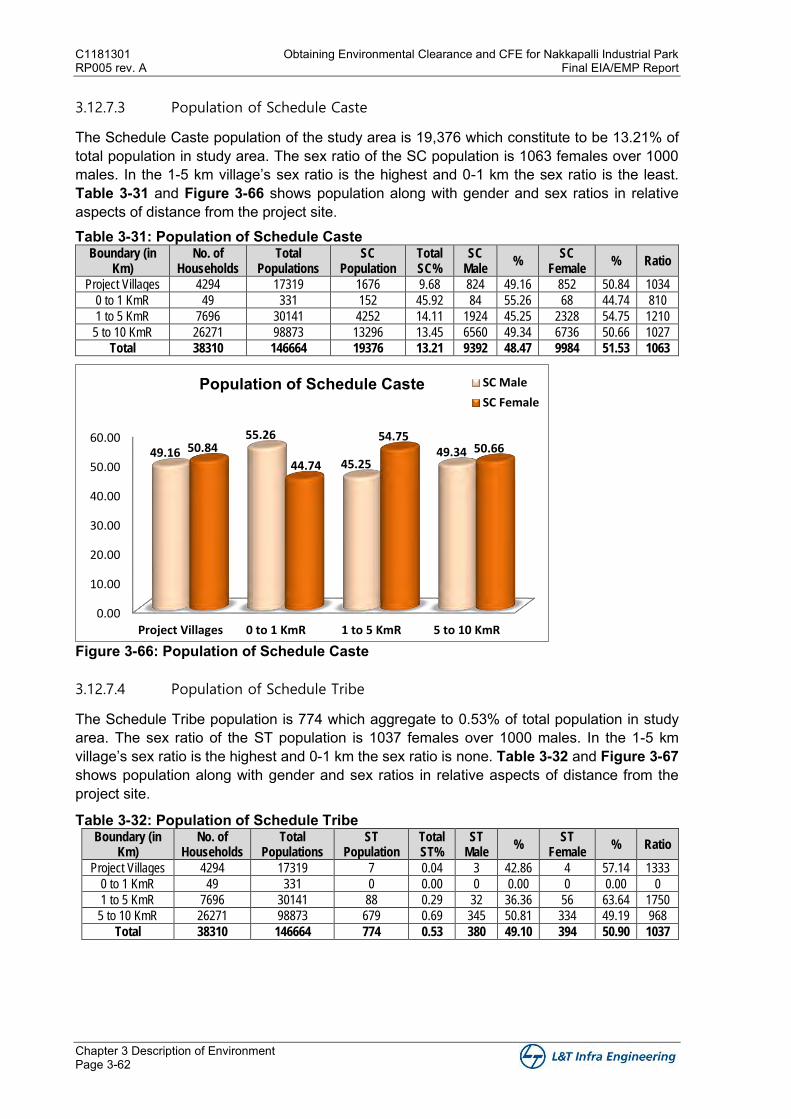
C1181301 Obtaining Environmental Clearance and CFE for Nakkapalli Industrial Park RP005 rev. A Final EIA/EMP Report
Chapter 3 Description of Environment Page 3-62
3.12.7.3 Population of Schedule Caste
The Schedule Caste population of the study area is 19,376 which constitute to be 13.21% of total population in study area. The sex ratio of the SC population is 1063 females over 1000 males. In the 1-5 km village’s sex ratio is the highest and 0-1 km the sex ratio is the least. Table 3-31 and Figure 3-66 shows population along with gender and sex ratios in relative aspects of distance from the project site. Table 3-31: Population of Schedule Caste
Boundary (in Km)
No. of Households
Total Populations
SC Population
Total SC%
SC Male
% SC
Female % Ratio
Project Villages 4294 17319 1676 9.68 824 49.16 852 50.84 1034
0 to 1 KmR 49 331 152 45.92 84 55.26 68 44.74 810
1 to 5 KmR 7696 30141 4252 14.11 1924 45.25 2328 54.75 1210
5 to 10 KmR 26271 98873 13296 13.45 6560 49.34 6736 50.66 1027
Total 38310 146664 19376 13.21 9392 48.47 9984 51.53 1063
Figure 3-66: Population of Schedule Caste
3.12.7.4 Population of Schedule Tribe
The Schedule Tribe population is 774 which aggregate to 0.53% of total population in study area. The sex ratio of the ST population is 1037 females over 1000 males. In the 1-5 km village’s sex ratio is the highest and 0-1 km the sex ratio is none. Table 3-32 and Figure 3-67 shows population along with gender and sex ratios in relative aspects of distance from the project site.
Table 3-32: Population of Schedule Tribe Boundary (in
Km) No. of
Households Total
Populations ST
Population Total ST%
ST Male
% ST
Female % Ratio
Project Villages 4294 17319 7 0.04 3 42.86 4 57.14 1333
0 to 1 KmR 49 331 0 0.00 0 0.00 0 0.00 0
1 to 5 KmR 7696 30141 88 0.29 32 36.36 56 63.64 1750
5 to 10 KmR 26271 98873 679 0.69 345 50.81 334 49.19 968
Total 38310 146664 774 0.53 380 49.10 394 50.90 1037
0.00
10.00
20.00
30.00
40.00
50.00
60.00
Project Villages 0 to 1 KmR 1 to 5 KmR 5 to 10 KmR
49.16
55.26
45.2549.3450.84
44.74
54.7550.66
Population of Schedule Caste SC Male
SC Female
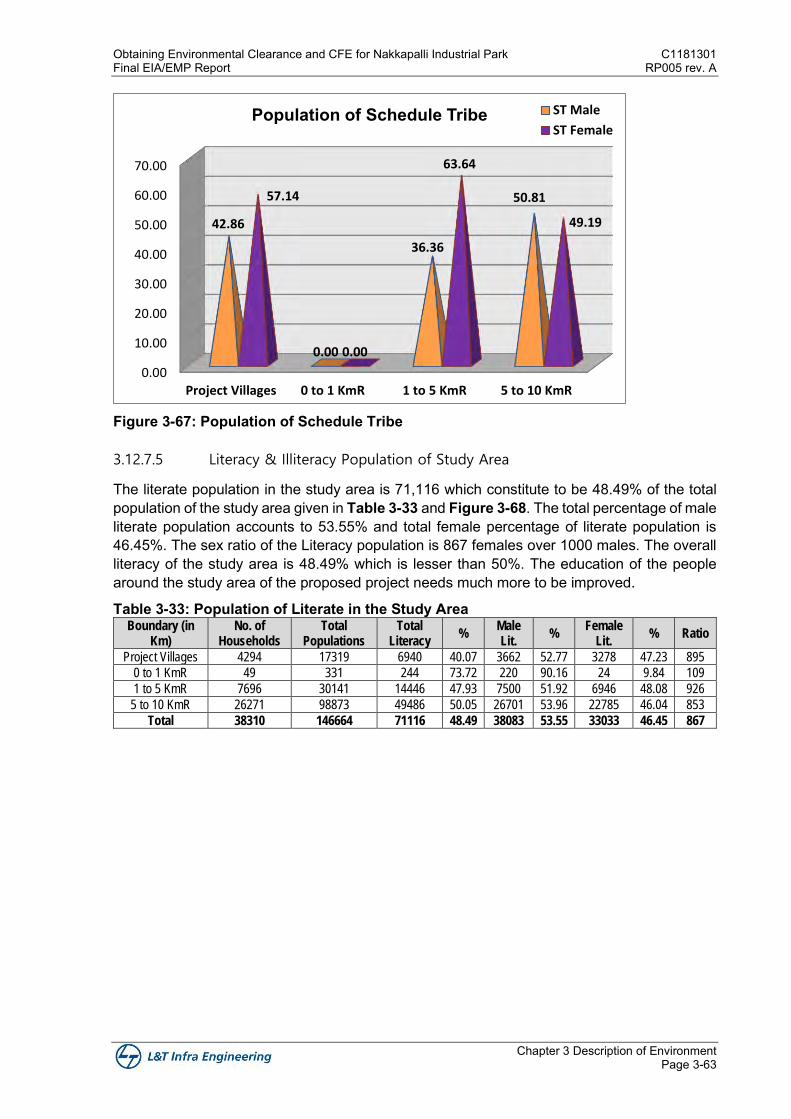
Obtaining Environmental Clearance and CFE for Nakkapalli Industrial Park C1181301 Final EIA/EMP Report RP005 rev. A
Chapter 3 Description of Environment Page 3-63
Figure 3-67: Population of Schedule Tribe
3.12.7.5 Literacy & Illiteracy Population of Study Area
The literate population in the study area is 71,116 which constitute to be 48.49% of the total population of the study area given in Table 3-33 and Figure 3-68. The total percentage of male literate population accounts to 53.55% and total female percentage of literate population is 46.45%. The sex ratio of the Literacy population is 867 females over 1000 males. The overall literacy of the study area is 48.49% which is lesser than 50%. The education of the people around the study area of the proposed project needs much more to be improved.
Table 3-33: Population of Literate in the Study Area Boundary (in
Km) No. of
Households Total
Populations Total
Literacy %
Male Lit.
% Female
Lit. % Ratio
Project Villages 4294 17319 6940 40.07 3662 52.77 3278 47.23 895
0 to 1 KmR 49 331 244 73.72 220 90.16 24 9.84 109
1 to 5 KmR 7696 30141 14446 47.93 7500 51.92 6946 48.08 926
5 to 10 KmR 26271 98873 49486 50.05 26701 53.96 22785 46.04 853
Total 38310 146664 71116 48.49 38083 53.55 33033 46.45 867
0.00
10.00
20.00
30.00
40.00
50.00
60.00
70.00
Project Villages 0 to 1 KmR 1 to 5 KmR 5 to 10 KmR
42.86
0.00
36.36
50.8157.14
0.00
63.64
49.19
Population of Schedule Tribe ST Male
ST Female
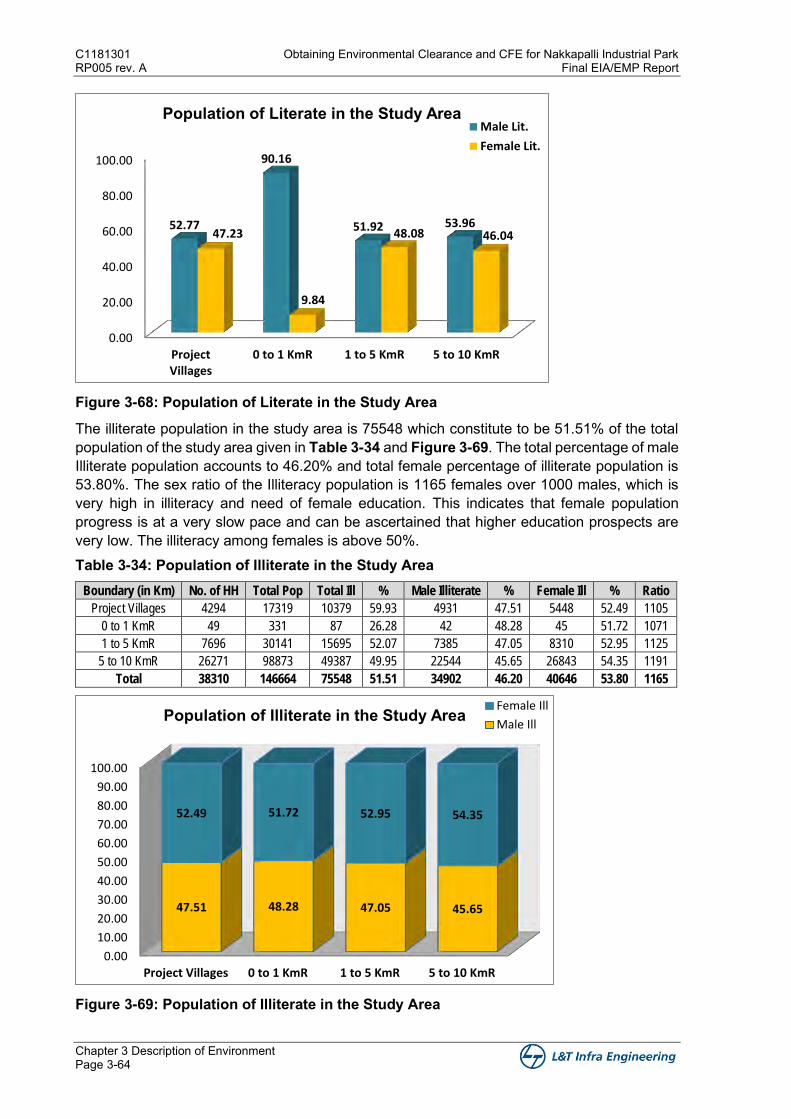
C1181301 Obtaining Environmental Clearance and CFE for Nakkapalli Industrial Park RP005 rev. A Final EIA/EMP Report
Chapter 3 Description of Environment Page 3-64
Figure 3-68: Population of Literate in the Study Area
The illiterate population in the study area is 75548 which constitute to be 51.51% of the total population of the study area given in Table 3-34 and Figure 3-69. The total percentage of male Illiterate population accounts to 46.20% and total female percentage of illiterate population is 53.80%. The sex ratio of the Illiteracy population is 1165 females over 1000 males, which is very high in illiteracy and need of female education. This indicates that female population progress is at a very slow pace and can be ascertained that higher education prospects are very low. The illiteracy among females is above 50%. Table 3-34: Population of Illiterate in the Study Area
Boundary (in Km) No. of HH Total Pop Total Ill % Male Illiterate % Female Ill % Ratio
Project Villages 4294 17319 10379 59.93 4931 47.51 5448 52.49 1105
0 to 1 KmR 49 331 87 26.28 42 48.28 45 51.72 1071
1 to 5 KmR 7696 30141 15695 52.07 7385 47.05 8310 52.95 1125
5 to 10 KmR 26271 98873 49387 49.95 22544 45.65 26843 54.35 1191
Total 38310 146664 75548 51.51 34902 46.20 40646 53.80 1165
Figure 3-69: Population of Illiterate in the Study Area
0.00
20.00
40.00
60.00
80.00
100.00
ProjectVillages
0 to 1 KmR 1 to 5 KmR 5 to 10 KmR
52.77
90.16
51.92 53.9647.23
9.84
48.08 46.04
Population of Literate in the Study Area Male Lit.
Female Lit.
0.00
10.00
20.00
30.00
40.00
50.00
60.00
70.00
80.00
90.00
100.00
Project Villages 0 to 1 KmR 1 to 5 KmR 5 to 10 KmR
47.51 48.28 47.05 45.65
52.49 51.72 52.95 54.35
Population of Illiterate in the Study Area Female Ill
Male Ill
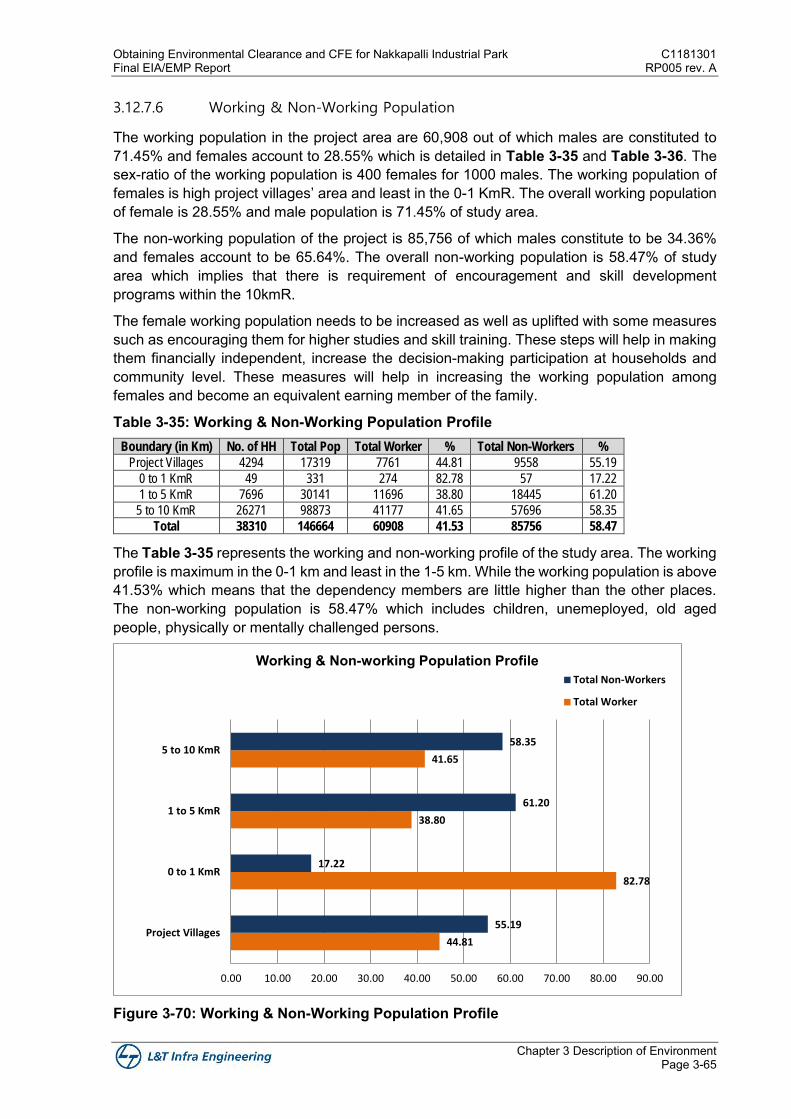
Obtaining Environmental Clearance and CFE for Nakkapalli Industrial Park C1181301 Final EIA/EMP Report RP005 rev. A
Chapter 3 Description of Environment Page 3-65
3.12.7.6 Working & Non-Working Population
The working population in the project area are 60,908 out of which males are constituted to 71.45% and females account to 28.55% which is detailed in Table 3-35 and Table 3-36. The sex-ratio of the working population is 400 females for 1000 males. The working population of females is high project villages’ area and least in the 0-1 KmR. The overall working population of female is 28.55% and male population is 71.45% of study area.
The non-working population of the project is 85,756 of which males constitute to be 34.36% and females account to be 65.64%. The overall non-working population is 58.47% of study area which implies that there is requirement of encouragement and skill development programs within the 10kmR.
The female working population needs to be increased as well as uplifted with some measures such as encouraging them for higher studies and skill training. These steps will help in making them financially independent, increase the decision-making participation at households and community level. These measures will help in increasing the working population among females and become an equivalent earning member of the family.
Table 3-35: Working & Non-Working Population Profile Boundary (in Km) No. of HH Total Pop Total Worker % Total Non-Workers %
Project Villages 4294 17319 7761 44.81 9558 55.19
0 to 1 KmR 49 331 274 82.78 57 17.22
1 to 5 KmR 7696 30141 11696 38.80 18445 61.20
5 to 10 KmR 26271 98873 41177 41.65 57696 58.35
Total 38310 146664 60908 41.53 85756 58.47
The Table 3-35 represents the working and non-working profile of the study area. The working profile is maximum in the 0-1 km and least in the 1-5 km. While the working population is above 41.53% which means that the dependency members are little higher than the other places. The non-working population is 58.47% which includes children, unemeployed, old aged people, physically or mentally challenged persons.
Figure 3-70: Working & Non-Working Population Profile
44.81
82.78
38.80
41.65
55.19
17.22
61.20
58.35
0.00 10.00 20.00 30.00 40.00 50.00 60.00 70.00 80.00 90.00
Project Villages
0 to 1 KmR
1 to 5 KmR
5 to 10 KmR
Working & Non-working Population ProfileTotal Non-Workers
Total Worker
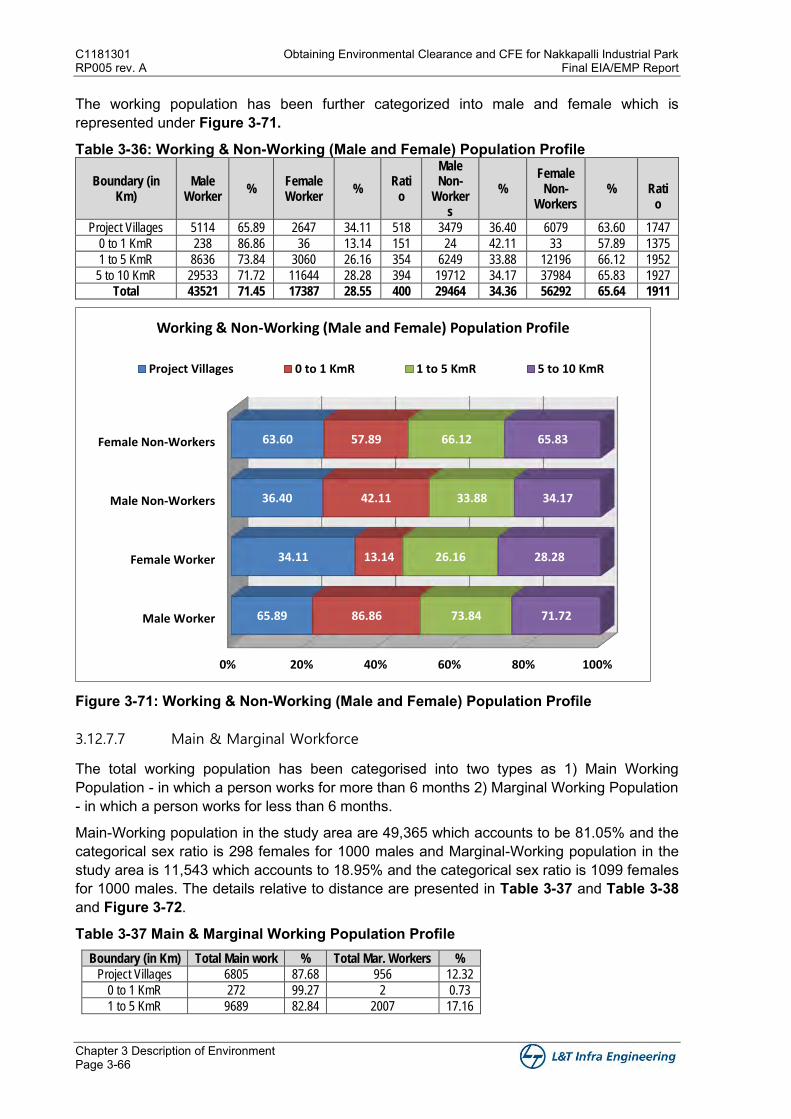
C1181301 Obtaining Environmental Clearance and CFE for Nakkapalli Industrial Park RP005 rev. A Final EIA/EMP Report
Chapter 3 Description of Environment Page 3-66
The working population has been further categorized into male and female which is represented under Figure 3-71.
Table 3-36: Working & Non-Working (Male and Female) Population Profile
Boundary (in Km)
Male Worker
% Female Worker
% Rati
o
Male Non-
Workers
% Female
Non-Workers
%
Ratio
Project Villages 5114 65.89 2647 34.11 518 3479 36.40 6079 63.60 1747
0 to 1 KmR 238 86.86 36 13.14 151 24 42.11 33 57.89 1375
1 to 5 KmR 8636 73.84 3060 26.16 354 6249 33.88 12196 66.12 1952
5 to 10 KmR 29533 71.72 11644 28.28 394 19712 34.17 37984 65.83 1927
Total 43521 71.45 17387 28.55 400 29464 34.36 56292 65.64 1911
Figure 3-71: Working & Non-Working (Male and Female) Population Profile
3.12.7.7 Main & Marginal Workforce
The total working population has been categorised into two types as 1) Main Working Population - in which a person works for more than 6 months 2) Marginal Working Population - in which a person works for less than 6 months.
Main-Working population in the study area are 49,365 which accounts to be 81.05% and the categorical sex ratio is 298 females for 1000 males and Marginal-Working population in the study area is 11,543 which accounts to 18.95% and the categorical sex ratio is 1099 females for 1000 males. The details relative to distance are presented in Table 3-37 and Table 3-38 and Figure 3-72.
Table 3-37 Main & Marginal Working Population Profile Boundary (in Km) Total Main work % Total Mar. Workers %
Project Villages 6805 87.68 956 12.32
0 to 1 KmR 272 99.27 2 0.73
1 to 5 KmR 9689 82.84 2007 17.16
0% 20% 40% 60% 80% 100%
Male Worker
Female Worker
Male Non-Workers
Female Non-Workers
65.89
34.11
36.40
63.60
86.86
13.14
42.11
57.89
73.84
26.16
33.88
66.12
71.72
28.28
34.17
65.83
Working & Non-Working (Male and Female) Population Profile
Project Villages 0 to 1 KmR 1 to 5 KmR 5 to 10 KmR
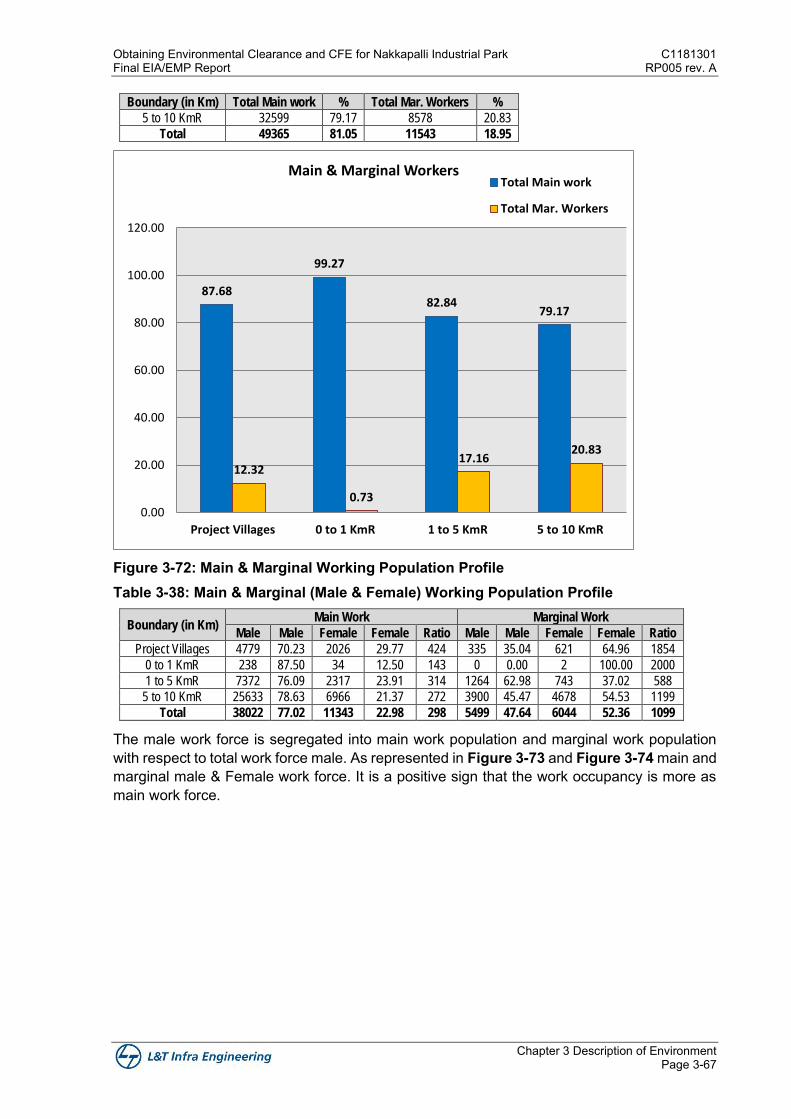
Obtaining Environmental Clearance and CFE for Nakkapalli Industrial Park C1181301 Final EIA/EMP Report RP005 rev. A
Chapter 3 Description of Environment Page 3-67
Boundary (in Km) Total Main work % Total Mar. Workers %
5 to 10 KmR 32599 79.17 8578 20.83
Total 49365 81.05 11543 18.95
Figure 3-72: Main & Marginal Working Population Profile Table 3-38: Main & Marginal (Male & Female) Working Population Profile
Boundary (in Km) Main Work Marginal Work
Male Male Female Female Ratio Male Male Female Female Ratio
Project Villages 4779 70.23 2026 29.77 424 335 35.04 621 64.96 1854
0 to 1 KmR 238 87.50 34 12.50 143 0 0.00 2 100.00 2000
1 to 5 KmR 7372 76.09 2317 23.91 314 1264 62.98 743 37.02 588
5 to 10 KmR 25633 78.63 6966 21.37 272 3900 45.47 4678 54.53 1199
Total 38022 77.02 11343 22.98 298 5499 47.64 6044 52.36 1099
The male work force is segregated into main work population and marginal work population with respect to total work force male. As represented in Figure 3-73 and Figure 3-74 main and marginal male & Female work force. It is a positive sign that the work occupancy is more as main work force.
87.68
99.27
82.8479.17
12.32
0.73
17.1620.83
0.00
20.00
40.00
60.00
80.00
100.00
120.00
Project Villages 0 to 1 KmR 1 to 5 KmR 5 to 10 KmR
Main & Marginal WorkersTotal Main work
Total Mar. Workers
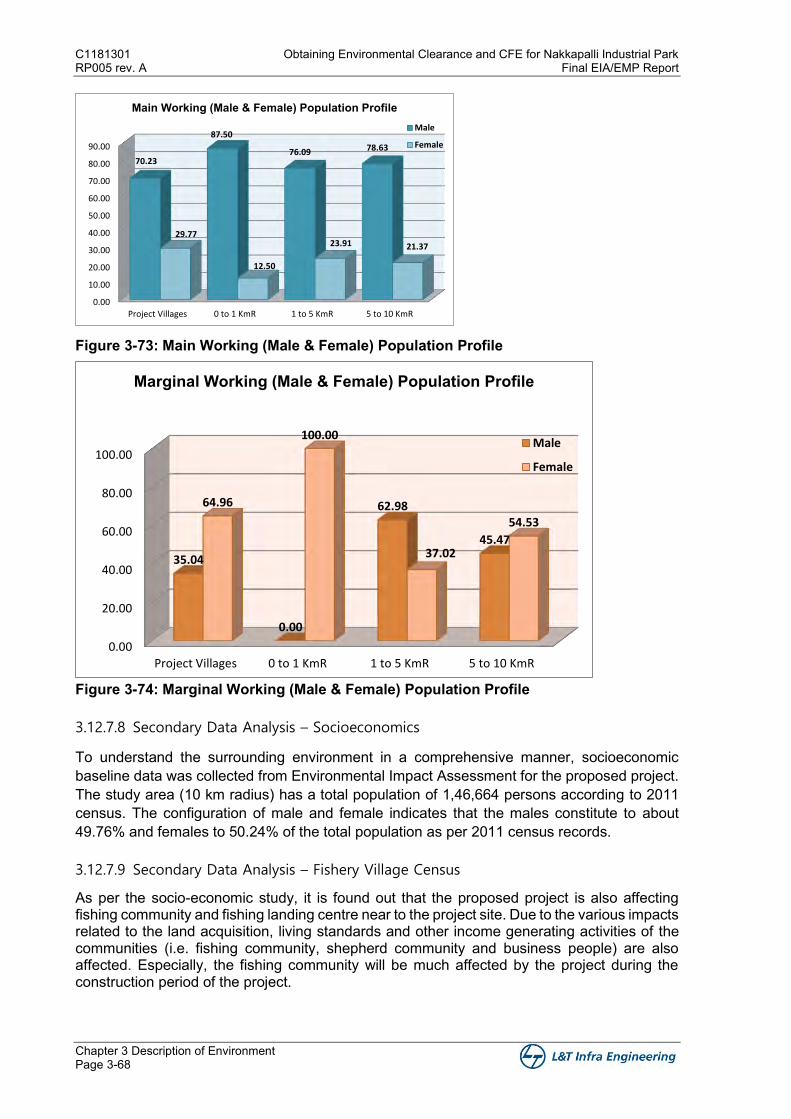
C1181301 Obtaining Environmental Clearance and CFE for Nakkapalli Industrial Park RP005 rev. A Final EIA/EMP Report
Chapter 3 Description of Environment Page 3-68
Figure 3-73: Main Working (Male & Female) Population Profile
Figure 3-74: Marginal Working (Male & Female) Population Profile
3.12.7.8 Secondary Data Analysis – Socioeconomics
To understand the surrounding environment in a comprehensive manner, socioeconomic baseline data was collected from Environmental Impact Assessment for the proposed project. The study area (10 km radius) has a total population of 1,46,664 persons according to 2011 census. The configuration of male and female indicates that the males constitute to about 49.76% and females to 50.24% of the total population as per 2011 census records.
3.12.7.9 Secondary Data Analysis – Fishery Village Census
As per the socio-economic study, it is found out that the proposed project is also affecting fishing community and fishing landing centre near to the project site. Due to the various impacts related to the land acquisition, living standards and other income generating activities of the communities (i.e. fishing community, shepherd community and business people) are also affected. Especially, the fishing community will be much affected by the project during the construction period of the project.
0.00
10.00
20.00
30.00
40.00
50.00
60.00
70.00
80.00
90.00
Project Villages 0 to 1 KmR 1 to 5 KmR 5 to 10 KmR
70.23
87.50
76.09 78.63
29.77
12.50
23.91 21.37
Main Working (Male & Female) Population ProfileMale
Female
0.00
20.00
40.00
60.00
80.00
100.00
Project Villages 0 to 1 KmR 1 to 5 KmR 5 to 10 KmR
35.04
0.00
62.98
45.47
64.96
100.00
37.02
54.53
Marginal Working (Male & Female) Population Profile
Male
Female
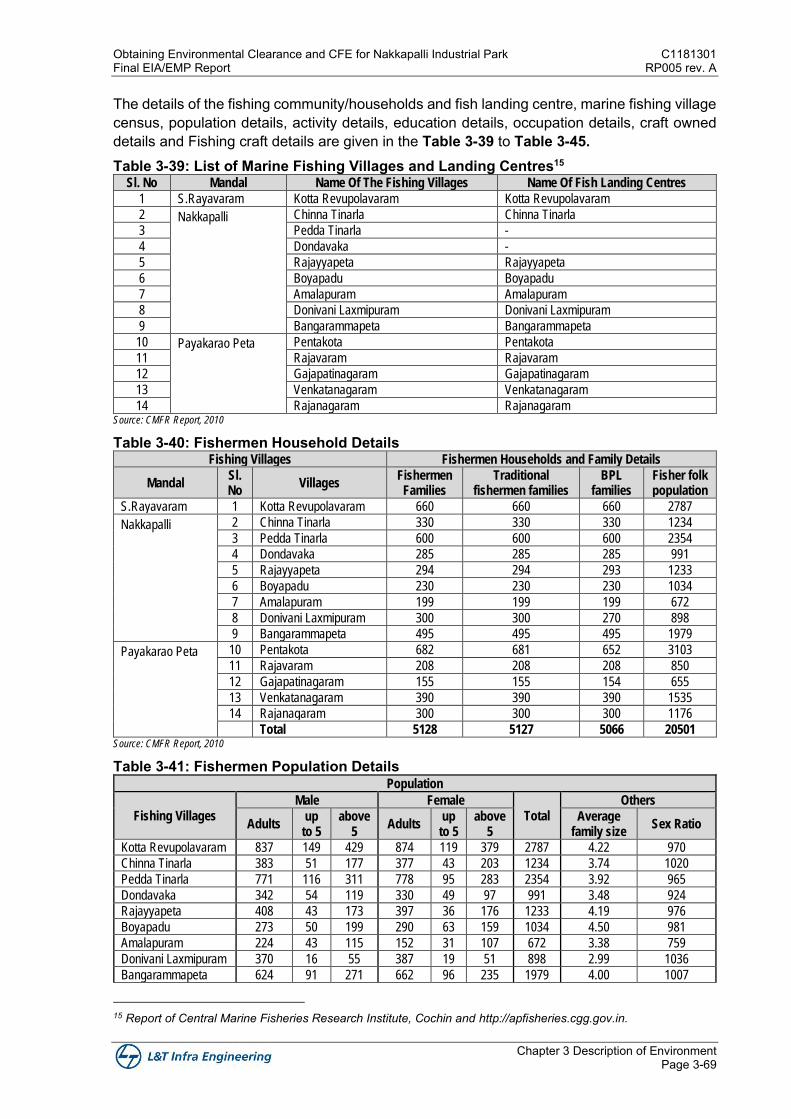
Obtaining Environmental Clearance and CFE for Nakkapalli Industrial Park C1181301 Final EIA/EMP Report RP005 rev. A
Chapter 3 Description of Environment Page 3-69
The details of the fishing community/households and fish landing centre, marine fishing village census, population details, activity details, education details, occupation details, craft owned details and Fishing craft details are given in the Table 3-39 to Table 3-45. Table 3-39: List of Marine Fishing Villages and Landing Centres15
Sl. No Mandal Name Of The Fishing Villages Name Of Fish Landing Centres
1 S.Rayavaram Kotta Revupolavaram Kotta Revupolavaram
2 Nakkapalli
Chinna Tinarla Chinna Tinarla
3 Pedda Tinarla -
4 Dondavaka -
5 Rajayyapeta Rajayyapeta
6 Boyapadu Boyapadu
7 Amalapuram Amalapuram
8 Donivani Laxmipuram Donivani Laxmipuram
9 Bangarammapeta Bangarammapeta
10 Payakarao Peta
Pentakota Pentakota
11 Rajavaram Rajavaram
12 Gajapatinagaram Gajapatinagaram
13 Venkatanagaram Venkatanagaram
14 Rajanagaram Rajanagaram Source: CMFR Report, 2010
Table 3-40: Fishermen Household Details Fishing Villages Fishermen Households and Family Details
Mandal Sl. No
Villages Fishermen Families
Traditional fishermen families
BPL families
Fisher folk population
S.Rayavaram 1 Kotta Revupolavaram 660 660 660 2787
Nakkapalli
2 Chinna Tinarla 330 330 330 1234
3 Pedda Tinarla 600 600 600 2354
4 Dondavaka 285 285 285 991
5 Rajayyapeta 294 294 293 1233
6 Boyapadu 230 230 230 1034
7 Amalapuram 199 199 199 672
8 Donivani Laxmipuram 300 300 270 898
9 Bangarammapeta 495 495 495 1979
Payakarao Peta
10 Pentakota 682 681 652 3103
11 Rajavaram 208 208 208 850
12 Gajapatinagaram 155 155 154 655
13 Venkatanagaram 390 390 390 1535
14 Rajanagaram 300 300 300 1176
Total 5128 5127 5066 20501 Source: CMFR Report, 2010
Table 3-41: Fishermen Population Details Population
Fishing Villages
Male Female
Total
Others
Adults up
to 5 above
5 Adults
up to 5
above 5
Average family size
Sex Ratio
Kotta Revupolavaram 837 149 429 874 119 379 2787 4.22 970
Chinna Tinarla 383 51 177 377 43 203 1234 3.74 1020
Pedda Tinarla 771 116 311 778 95 283 2354 3.92 965
Dondavaka 342 54 119 330 49 97 991 3.48 924
Rajayyapeta 408 43 173 397 36 176 1233 4.19 976
Boyapadu 273 50 199 290 63 159 1034 4.50 981
Amalapuram 224 43 115 152 31 107 672 3.38 759
Donivani Laxmipuram 370 16 55 387 19 51 898 2.99 1036
Bangarammapeta 624 91 271 662 96 235 1979 4.00 1007
15 Report of Central Marine Fisheries Research Institute, Cochin and http://apfisheries.cgg.gov.in.
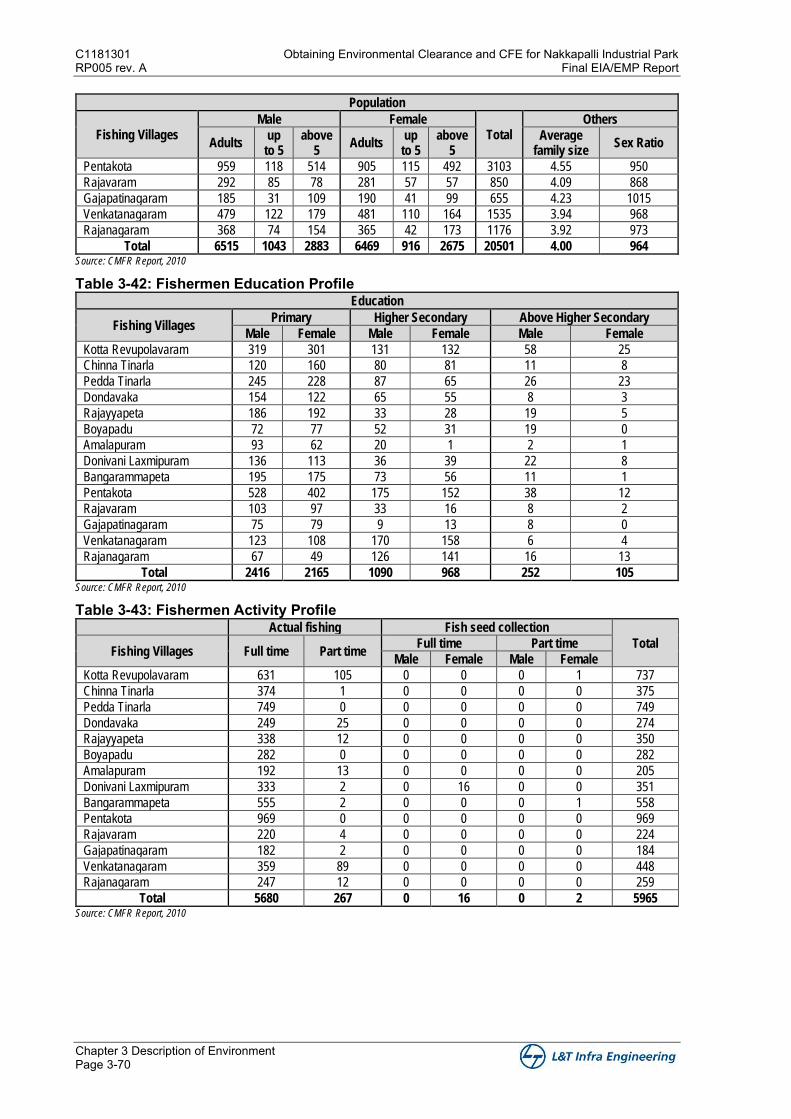
C1181301 Obtaining Environmental Clearance and CFE for Nakkapalli Industrial Park RP005 rev. A Final EIA/EMP Report
Chapter 3 Description of Environment Page 3-70
Population
Fishing Villages Male Female
Total Others
Adults up
to 5 above
5 Adults
up to 5
above 5
Average family size
Sex Ratio
Pentakota 959 118 514 905 115 492 3103 4.55 950
Rajavaram 292 85 78 281 57 57 850 4.09 868
Gajapatinagaram 185 31 109 190 41 99 655 4.23 1015
Venkatanagaram 479 122 179 481 110 164 1535 3.94 968
Rajanagaram 368 74 154 365 42 173 1176 3.92 973
Total 6515 1043 2883 6469 916 2675 20501 4.00 964 Source: CMFR Report, 2010
Table 3-42: Fishermen Education Profile Education
Fishing Villages Primary Higher Secondary Above Higher Secondary
Male Female Male Female Male Female
Kotta Revupolavaram 319 301 131 132 58 25
Chinna Tinarla 120 160 80 81 11 8
Pedda Tinarla 245 228 87 65 26 23
Dondavaka 154 122 65 55 8 3
Rajayyapeta 186 192 33 28 19 5
Boyapadu 72 77 52 31 19 0
Amalapuram 93 62 20 1 2 1
Donivani Laxmipuram 136 113 36 39 22 8
Bangarammapeta 195 175 73 56 11 1
Pentakota 528 402 175 152 38 12
Rajavaram 103 97 33 16 8 2
Gajapatinagaram 75 79 9 13 8 0
Venkatanagaram 123 108 170 158 6 4
Rajanagaram 67 49 126 141 16 13
Total 2416 2165 1090 968 252 105 Source: CMFR Report, 2010
Table 3-43: Fishermen Activity Profile Actual fishing Fish seed collection
Total Fishing Villages Full time Part time
Full time Part time
Male Female Male Female
Kotta Revupolavaram 631 105 0 0 0 1 737
Chinna Tinarla 374 1 0 0 0 0 375
Pedda Tinarla 749 0 0 0 0 0 749
Dondavaka 249 25 0 0 0 0 274
Rajayyapeta 338 12 0 0 0 0 350
Boyapadu 282 0 0 0 0 0 282
Amalapuram 192 13 0 0 0 0 205
Donivani Laxmipuram 333 2 0 16 0 0 351
Bangarammapeta 555 2 0 0 0 1 558
Pentakota 969 0 0 0 0 0 969
Rajavaram 220 4 0 0 0 0 224
Gajapatinagaram 182 2 0 0 0 0 184
Venkatanagaram 359 89 0 0 0 0 448
Rajanagaram 247 12 0 0 0 0 259
Total 5680 267 0 16 0 2 5965 Source: CMFR Report, 2010
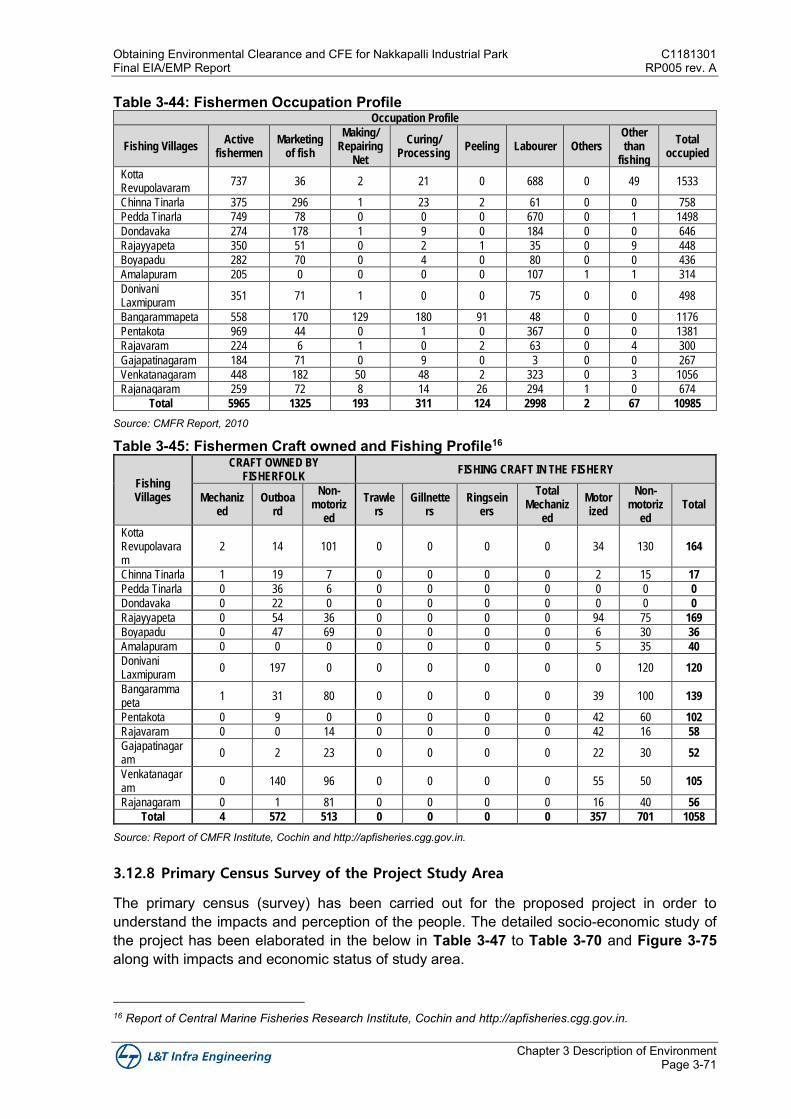
Obtaining Environmental Clearance and CFE for Nakkapalli Industrial Park C1181301 Final EIA/EMP Report RP005 rev. A
Chapter 3 Description of Environment Page 3-71
Table 3-44: Fishermen Occupation Profile Occupation Profile
Fishing Villages Active
fishermen Marketing
of fish
Making/ Repairing
Net
Curing/ Processing
Peeling Labourer Others Other than
fishing
Total occupied
Kotta Revupolavaram
737 36 2 21 0 688 0 49 1533
Chinna Tinarla 375 296 1 23 2 61 0 0 758
Pedda Tinarla 749 78 0 0 0 670 0 1 1498
Dondavaka 274 178 1 9 0 184 0 0 646
Rajayyapeta 350 51 0 2 1 35 0 9 448
Boyapadu 282 70 0 4 0 80 0 0 436
Amalapuram 205 0 0 0 0 107 1 1 314
Donivani Laxmipuram
351 71 1 0 0 75 0 0 498
Bangarammapeta 558 170 129 180 91 48 0 0 1176
Pentakota 969 44 0 1 0 367 0 0 1381
Rajavaram 224 6 1 0 2 63 0 4 300
Gajapatinagaram 184 71 0 9 0 3 0 0 267
Venkatanagaram 448 182 50 48 2 323 0 3 1056
Rajanagaram 259 72 8 14 26 294 1 0 674
Total 5965 1325 193 311 124 2998 2 67 10985
Source: CMFR Report, 2010
Table 3-45: Fishermen Craft owned and Fishing Profile16
Fishing Villages
CRAFT OWNED BY FISHERFOLK
FISHING CRAFT IN THE FISHERY
Mechanized
Outboard
Non-motoriz
ed
Trawlers
Gillnetters
Ringseiners
Total Mechaniz
ed
Motorized
Non-motoriz
ed Total
Kotta Revupolavaram
2 14 101 0 0 0 0 34 130 164
Chinna Tinarla 1 19 7 0 0 0 0 2 15 17
Pedda Tinarla 0 36 6 0 0 0 0 0 0 0
Dondavaka 0 22 0 0 0 0 0 0 0 0
Rajayyapeta 0 54 36 0 0 0 0 94 75 169
Boyapadu 0 47 69 0 0 0 0 6 30 36
Amalapuram 0 0 0 0 0 0 0 5 35 40
Donivani Laxmipuram
0 197 0 0 0 0 0 0 120 120
Bangarammapeta
1 31 80 0 0 0 0 39 100 139
Pentakota 0 9 0 0 0 0 0 42 60 102
Rajavaram 0 0 14 0 0 0 0 42 16 58
Gajapatinagaram
0 2 23 0 0 0 0 22 30 52
Venkatanagaram
0 140 96 0 0 0 0 55 50 105
Rajanagaram 0 1 81 0 0 0 0 16 40 56
Total 4 572 513 0 0 0 0 357 701 1058
Source: Report of CMFR Institute, Cochin and http://apfisheries.cgg.gov.in.
3.12.8 Primary Census Survey of the Project Study Area
The primary census (survey) has been carried out for the proposed project in order to understand the impacts and perception of the people. The detailed socio-economic study of the project has been elaborated in the below in Table 3-47 to Table 3-70 and Figure 3-75 along with impacts and economic status of study area.
16 Report of Central Marine Fisheries Research Institute, Cochin and http://apfisheries.cgg.gov.in.
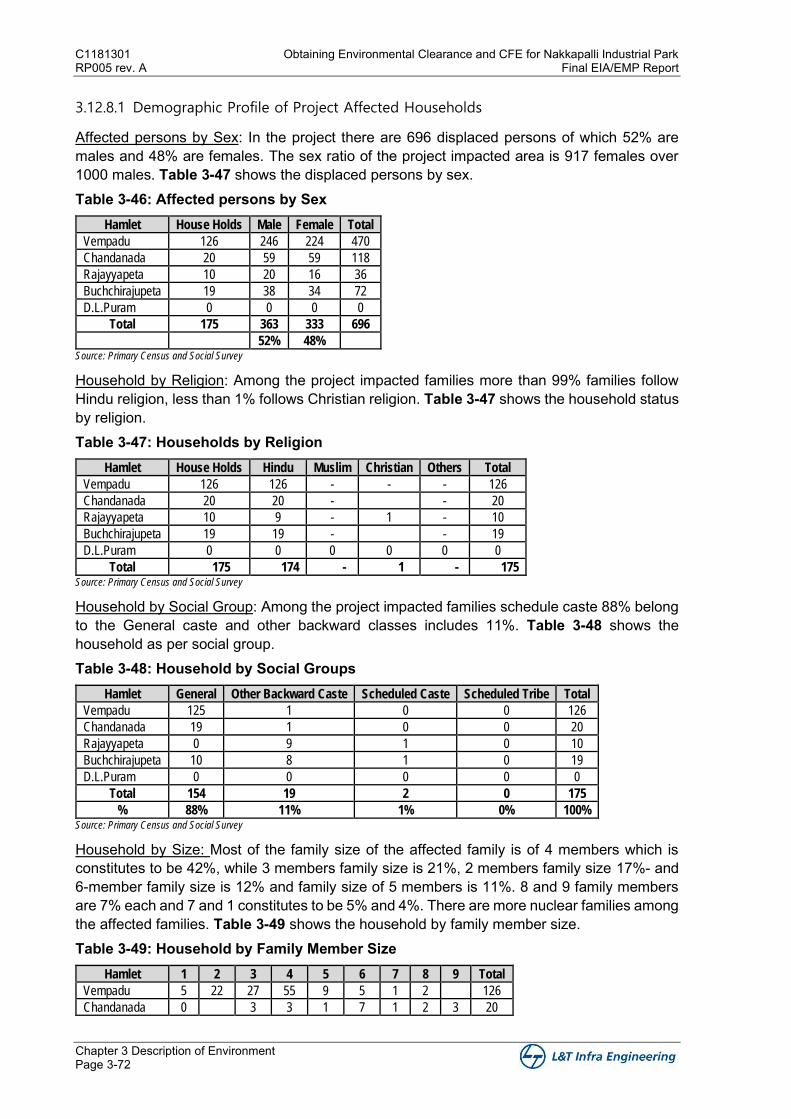
C1181301 Obtaining Environmental Clearance and CFE for Nakkapalli Industrial Park RP005 rev. A Final EIA/EMP Report
Chapter 3 Description of Environment Page 3-72
3.12.8.1 Demographic Profile of Project Affected Households
Affected persons by Sex: In the project there are 696 displaced persons of which 52% are males and 48% are females. The sex ratio of the project impacted area is 917 females over 1000 males. Table 3-47 shows the displaced persons by sex. Table 3-46: Affected persons by Sex
Hamlet House Holds Male Female Total
Vempadu 126 246 224 470
Chandanada 20 59 59 118
Rajayyapeta 10 20 16 36
Buchchirajupeta 19 38 34 72
D.L.Puram 0 0 0 0
Total 175 363 333 696 52% 48%
Source: Primary Census and Social Survey
Household by Religion: Among the project impacted families more than 99% families follow Hindu religion, less than 1% follows Christian religion. Table 3-47 shows the household status by religion. Table 3-47: Households by Religion
Hamlet House Holds Hindu Muslim Christian Others Total
Vempadu 126 126 - - - 126
Chandanada 20 20 - - 20
Rajayyapeta 10 9 - 1 - 10
Buchchirajupeta 19 19 - - 19
D.L.Puram 0 0 0 0 0 0
Total 175 174 - 1 - 175 Source: Primary Census and Social Survey
Household by Social Group: Among the project impacted families schedule caste 88% belong to the General caste and other backward classes includes 11%. Table 3-48 shows the household as per social group. Table 3-48: Household by Social Groups
Hamlet General Other Backward Caste Scheduled Caste Scheduled Tribe Total
Vempadu 125 1 0 0 126
Chandanada 19 1 0 0 20
Rajayyapeta 0 9 1 0 10
Buchchirajupeta 10 8 1 0 19
D.L.Puram 0 0 0 0 0
Total 154 19 2 0 175
% 88% 11% 1% 0% 100% Source: Primary Census and Social Survey
Household by Size: Most of the family size of the affected family is of 4 members which is constitutes to be 42%, while 3 members family size is 21%, 2 members family size 17%- and 6-member family size is 12% and family size of 5 members is 11%. 8 and 9 family members are 7% each and 7 and 1 constitutes to be 5% and 4%. There are more nuclear families among the affected families. Table 3-49 shows the household by family member size. Table 3-49: Household by Family Member Size
Hamlet 1 2 3 4 5 6 7 8 9 Total
Vempadu 5 22 27 55 9 5 1 2 126
Chandanada 0 3 3 1 7 1 2 3 20
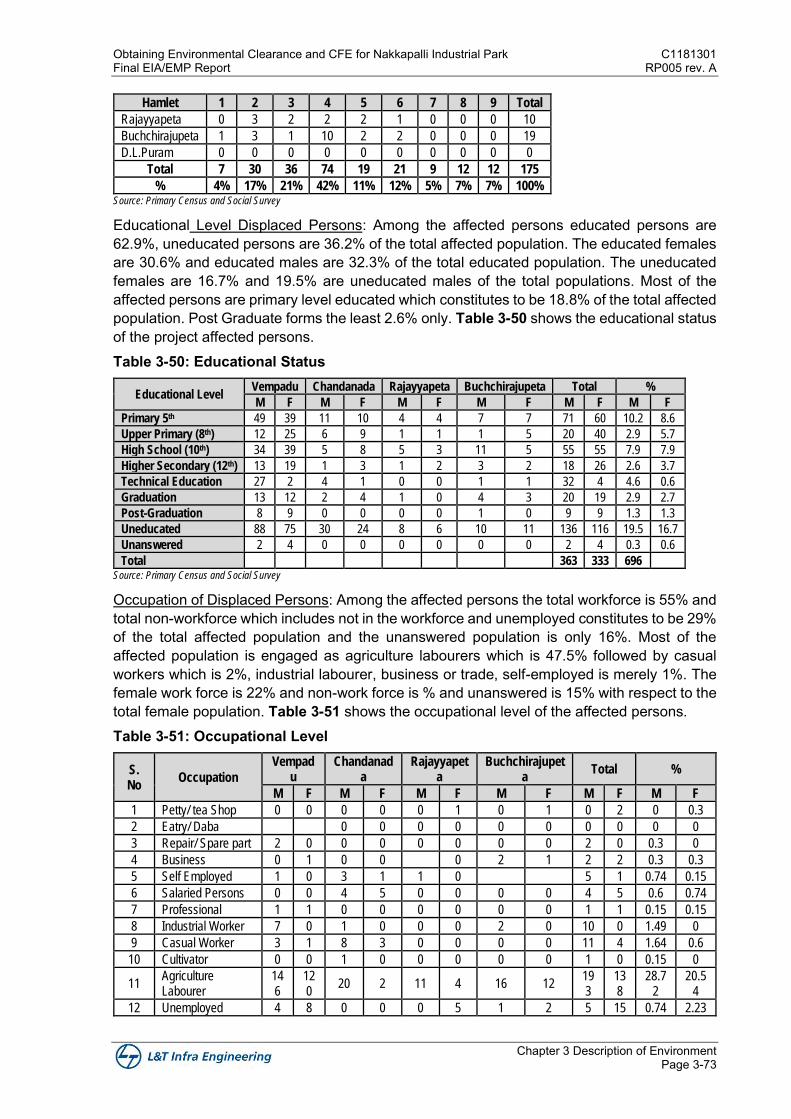
Obtaining Environmental Clearance and CFE for Nakkapalli Industrial Park C1181301 Final EIA/EMP Report RP005 rev. A
Chapter 3 Description of Environment Page 3-73
Hamlet 1 2 3 4 5 6 7 8 9 Total
Rajayyapeta 0 3 2 2 2 1 0 0 0 10
Buchchirajupeta 1 3 1 10 2 2 0 0 0 19
D.L.Puram 0 0 0 0 0 0 0 0 0 0
Total 7 30 36 74 19 21 9 12 12 175
% 4% 17% 21% 42% 11% 12% 5% 7% 7% 100% Source: Primary Census and Social Survey
Educational Level Displaced Persons: Among the affected persons educated persons are 62.9%, uneducated persons are 36.2% of the total affected population. The educated females are 30.6% and educated males are 32.3% of the total educated population. The uneducated females are 16.7% and 19.5% are uneducated males of the total populations. Most of the affected persons are primary level educated which constitutes to be 18.8% of the total affected population. Post Graduate forms the least 2.6% only. Table 3-50 shows the educational status of the project affected persons. Table 3-50: Educational Status
Educational Level Vempadu Chandanada Rajayyapeta Buchchirajupeta Total %
M F M F M F M F M F M F
Primary 5th 49 39 11 10 4 4 7 7 71 60 10.2 8.6
Upper Primary (8th) 12 25 6 9 1 1 1 5 20 40 2.9 5.7
High School (10th) 34 39 5 8 5 3 11 5 55 55 7.9 7.9
Higher Secondary (12th) 13 19 1 3 1 2 3 2 18 26 2.6 3.7
Technical Education 27 2 4 1 0 0 1 1 32 4 4.6 0.6
Graduation 13 12 2 4 1 0 4 3 20 19 2.9 2.7
Post-Graduation 8 9 0 0 0 0 1 0 9 9 1.3 1.3
Uneducated 88 75 30 24 8 6 10 11 136 116 19.5 16.7
Unanswered 2 4 0 0 0 0 0 0 2 4 0.3 0.6
Total 363 333 696
Source: Primary Census and Social Survey
Occupation of Displaced Persons: Among the affected persons the total workforce is 55% and total non-workforce which includes not in the workforce and unemployed constitutes to be 29% of the total affected population and the unanswered population is only 16%. Most of the affected population is engaged as agriculture labourers which is 47.5% followed by casual workers which is 2%, industrial labourer, business or trade, self-employed is merely 1%. The female work force is 22% and non-work force is % and unanswered is 15% with respect to the total female population. Table 3-51 shows the occupational level of the affected persons. Table 3-51: Occupational Level
S. No
Occupation
Vempadu
Chandanada
Rajayyapeta
Buchchirajupeta
Total %
M F M F M F M F M F M F
1 Petty/ tea Shop 0 0 0 0 0 1 0 1 0 2 0 0.3
2 Eatry/ Daba 0 0 0 0 0 0 0 0 0 0
3 Repair/ Spare part 2 0 0 0 0 0 0 0 2 0 0.3 0
4 Business 0 1 0 0 0 2 1 2 2 0.3 0.3
5 Self Employed 1 0 3 1 1 0 5 1 0.74 0.15
6 Salaried Persons 0 0 4 5 0 0 0 0 4 5 0.6 0.74
7 Professional 1 1 0 0 0 0 0 0 1 1 0.15 0.15
8 Industrial Worker 7 0 1 0 0 0 2 0 10 0 1.49 0
9 Casual Worker 3 1 8 3 0 0 0 0 11 4 1.64 0.6
10 Cultivator 0 0 1 0 0 0 0 0 1 0 0.15 0
11 Agriculture Labourer
146
120
20 2 11 4 16 12 193
138
28.72
20.54
12 Unemployed 4 8 0 0 0 5 1 2 5 15 0.74 2.23
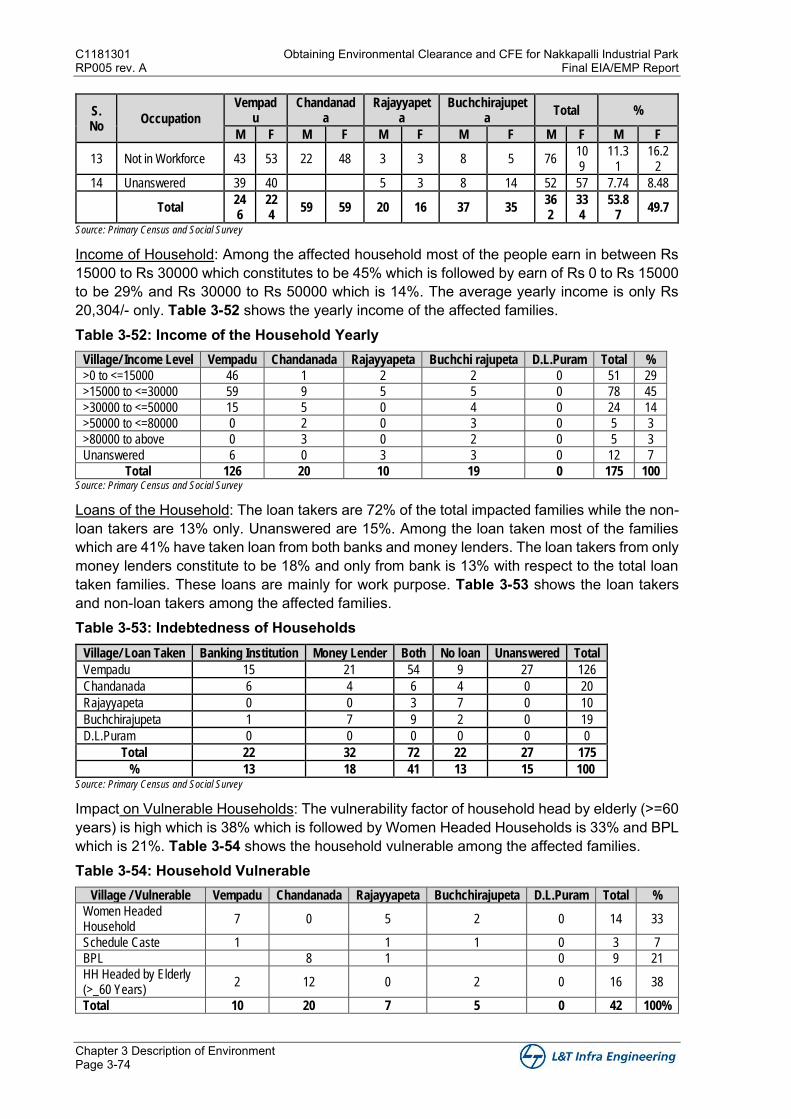
C1181301 Obtaining Environmental Clearance and CFE for Nakkapalli Industrial Park RP005 rev. A Final EIA/EMP Report
Chapter 3 Description of Environment Page 3-74
S. No
Occupation
Vempadu
Chandanada
Rajayyapeta
Buchchirajupeta
Total %
M F M F M F M F M F M F
13 Not in Workforce 43 53 22 48 3 3 8 5 76 109
11.31
16.22
14 Unanswered 39 40 5 3 8 14 52 57 7.74 8.48
Total 246
224
59 59 20 16 37 35 362
334
53.87
49.7
Source: Primary Census and Social Survey
Income of Household: Among the affected household most of the people earn in between Rs 15000 to Rs 30000 which constitutes to be 45% which is followed by earn of Rs 0 to Rs 15000 to be 29% and Rs 30000 to Rs 50000 which is 14%. The average yearly income is only Rs 20,304/- only. Table 3-52 shows the yearly income of the affected families. Table 3-52: Income of the Household Yearly
Village/ Income Level Vempadu Chandanada Rajayyapeta Buchchi rajupeta D.L.Puram Total %
>0 to <=15000 46 1 2 2 0 51 29
>15000 to <=30000 59 9 5 5 0 78 45
>30000 to <=50000 15 5 0 4 0 24 14
>50000 to <=80000 0 2 0 3 0 5 3
>80000 to above 0 3 0 2 0 5 3
Unanswered 6 0 3 3 0 12 7
Total 126 20 10 19 0 175 100 Source: Primary Census and Social Survey
Loans of the Household: The loan takers are 72% of the total impacted families while the non-loan takers are 13% only. Unanswered are 15%. Among the loan taken most of the families which are 41% have taken loan from both banks and money lenders. The loan takers from only money lenders constitute to be 18% and only from bank is 13% with respect to the total loan taken families. These loans are mainly for work purpose. Table 3-53 shows the loan takers and non-loan takers among the affected families. Table 3-53: Indebtedness of Households
Village/ Loan Taken Banking Institution Money Lender Both No loan Unanswered Total
Vempadu 15 21 54 9 27 126
Chandanada 6 4 6 4 0 20
Rajayyapeta 0 0 3 7 0 10
Buchchirajupeta 1 7 9 2 0 19
D.L.Puram 0 0 0 0 0 0
Total 22 32 72 22 27 175
% 13 18 41 13 15 100 Source: Primary Census and Social Survey
Impact on Vulnerable Households: The vulnerability factor of household head by elderly (>=60 years) is high which is 38% which is followed by Women Headed Households is 33% and BPL which is 21%. Table 3-54 shows the household vulnerable among the affected families. Table 3-54: Household Vulnerable
Village / Vulnerable Vempadu Chandanada Rajayyapeta Buchchirajupeta D.L.Puram Total %
Women Headed Household
7 0 5 2 0 14 33
Schedule Caste 1 1 1 0 3 7
BPL 8 1 0 9 21
HH Headed by Elderly (>_60 Years)
2 12 0 2 0 16 38
Total 10 20 7 5 0 42 100%
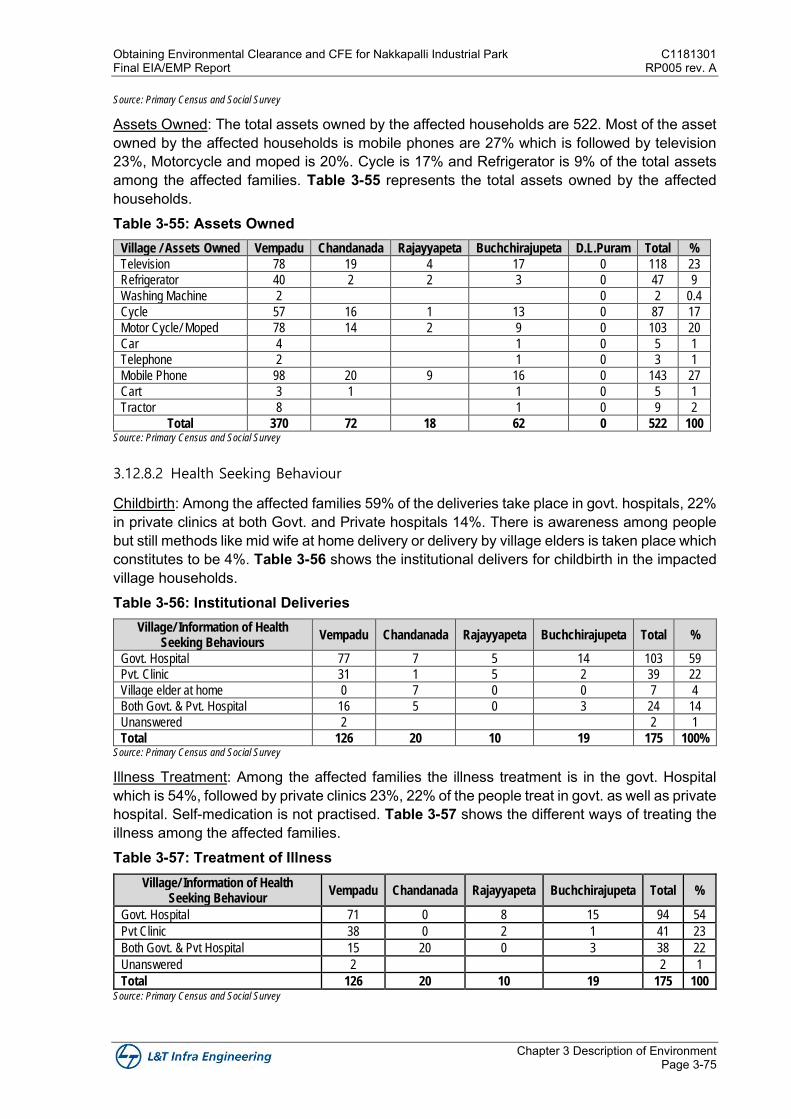
Obtaining Environmental Clearance and CFE for Nakkapalli Industrial Park C1181301 Final EIA/EMP Report RP005 rev. A
Chapter 3 Description of Environment Page 3-75
Source: Primary Census and Social Survey
Assets Owned: The total assets owned by the affected households are 522. Most of the asset owned by the affected households is mobile phones are 27% which is followed by television 23%, Motorcycle and moped is 20%. Cycle is 17% and Refrigerator is 9% of the total assets among the affected families. Table 3-55 represents the total assets owned by the affected households. Table 3-55: Assets Owned
Village / Assets Owned Vempadu Chandanada Rajayyapeta Buchchirajupeta D.L.Puram Total %
Television 78 19 4 17 0 118 23
Refrigerator 40 2 2 3 0 47 9
Washing Machine 2 0 2 0.4
Cycle 57 16 1 13 0 87 17
Motor Cycle/ Moped 78 14 2 9 0 103 20
Car 4 1 0 5 1
Telephone 2 1 0 3 1
Mobile Phone 98 20 9 16 0 143 27
Cart 3 1 1 0 5 1
Tractor 8 1 0 9 2
Total 370 72 18 62 0 522 100 Source: Primary Census and Social Survey
3.12.8.2 Health Seeking Behaviour
Childbirth: Among the affected families 59% of the deliveries take place in govt. hospitals, 22% in private clinics at both Govt. and Private hospitals 14%. There is awareness among people but still methods like mid wife at home delivery or delivery by village elders is taken place which constitutes to be 4%. Table 3-56 shows the institutional delivers for childbirth in the impacted village households. Table 3-56: Institutional Deliveries
Village/ Information of Health Seeking Behaviours
Vempadu Chandanada Rajayyapeta Buchchirajupeta Total %
Govt. Hospital 77 7 5 14 103 59
Pvt. Clinic 31 1 5 2 39 22
Village elder at home 0 7 0 0 7 4
Both Govt. & Pvt. Hospital 16 5 0 3 24 14
Unanswered 2 2 1
Total 126 20 10 19 175 100% Source: Primary Census and Social Survey
Illness Treatment: Among the affected families the illness treatment is in the govt. Hospital which is 54%, followed by private clinics 23%, 22% of the people treat in govt. as well as private hospital. Self-medication is not practised. Table 3-57 shows the different ways of treating the illness among the affected families. Table 3-57: Treatment of Illness
Village/ Information of Health Seeking Behaviour
Vempadu Chandanada Rajayyapeta Buchchirajupeta Total %
Govt. Hospital 71 0 8 15 94 54
Pvt Clinic 38 0 2 1 41 23
Both Govt. & Pvt Hospital 15 20 0 3 38 22
Unanswered 2 2 1
Total 126 20 10 19 175 100 Source: Primary Census and Social Survey
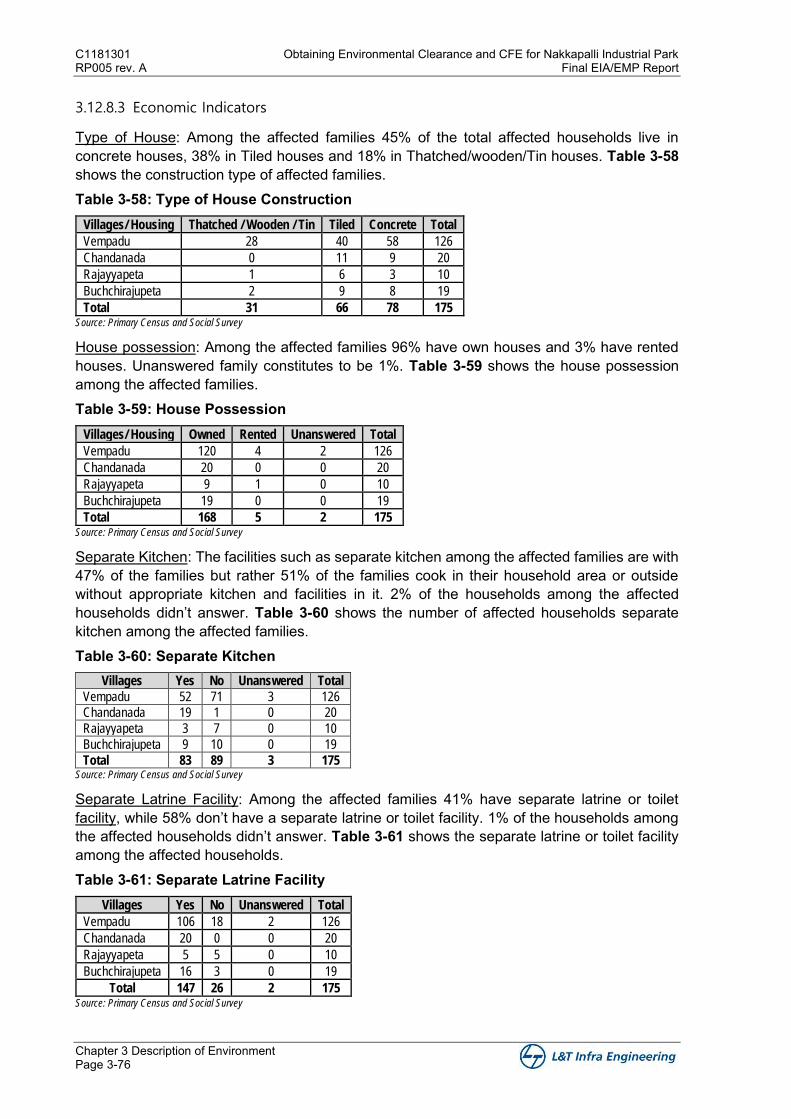
C1181301 Obtaining Environmental Clearance and CFE for Nakkapalli Industrial Park RP005 rev. A Final EIA/EMP Report
Chapter 3 Description of Environment Page 3-76
3.12.8.3 Economic Indicators
Type of House: Among the affected families 45% of the total affected households live in concrete houses, 38% in Tiled houses and 18% in Thatched/wooden/Tin houses. Table 3-58 shows the construction type of affected families. Table 3-58: Type of House Construction
Villages/ Housing Thatched / Wooden / Tin Tiled Concrete Total
Vempadu 28 40 58 126
Chandanada 0 11 9 20
Rajayyapeta 1 6 3 10
Buchchirajupeta 2 9 8 19
Total 31 66 78 175 Source: Primary Census and Social Survey
House possession: Among the affected families 96% have own houses and 3% have rented houses. Unanswered family constitutes to be 1%. Table 3-59 shows the house possession among the affected families. Table 3-59: House Possession
Villages/ Housing Owned Rented Unanswered Total
Vempadu 120 4 2 126
Chandanada 20 0 0 20
Rajayyapeta 9 1 0 10
Buchchirajupeta 19 0 0 19
Total 168 5 2 175 Source: Primary Census and Social Survey
Separate Kitchen: The facilities such as separate kitchen among the affected families are with 47% of the families but rather 51% of the families cook in their household area or outside without appropriate kitchen and facilities in it. 2% of the households among the affected households didn’t answer. Table 3-60 shows the number of affected households separate kitchen among the affected families. Table 3-60: Separate Kitchen
Villages Yes No Unanswered Total
Vempadu 52 71 3 126
Chandanada 19 1 0 20
Rajayyapeta 3 7 0 10
Buchchirajupeta 9 10 0 19
Total 83 89 3 175 Source: Primary Census and Social Survey
Separate Latrine Facility: Among the affected families 41% have separate latrine or toilet facility, while 58% don’t have a separate latrine or toilet facility. 1% of the households among the affected households didn’t answer. Table 3-61 shows the separate latrine or toilet facility among the affected households. Table 3-61: Separate Latrine Facility
Villages Yes No Unanswered Total
Vempadu 106 18 2 126
Chandanada 20 0 0 20
Rajayyapeta 5 5 0 10
Buchchirajupeta 16 3 0 19
Total 147 26 2 175 Source: Primary Census and Social Survey
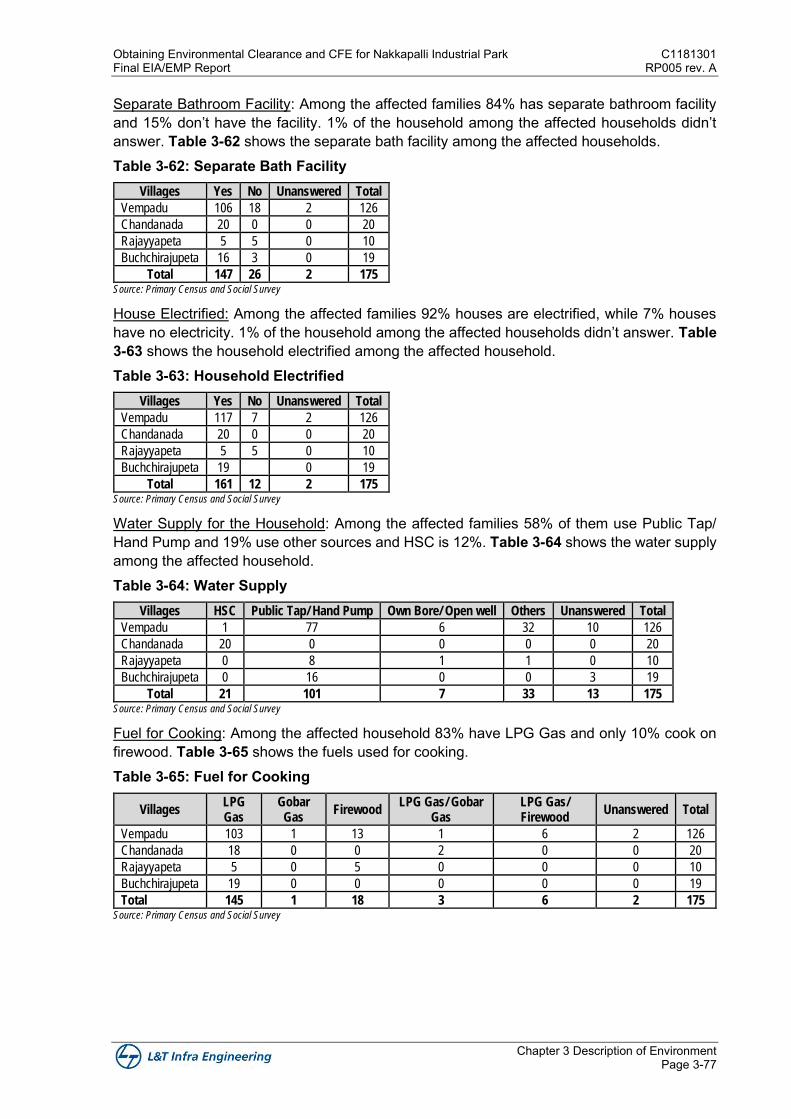
Obtaining Environmental Clearance and CFE for Nakkapalli Industrial Park C1181301 Final EIA/EMP Report RP005 rev. A
Chapter 3 Description of Environment Page 3-77
Separate Bathroom Facility: Among the affected families 84% has separate bathroom facility and 15% don’t have the facility. 1% of the household among the affected households didn’t answer. Table 3-62 shows the separate bath facility among the affected households. Table 3-62: Separate Bath Facility
Villages Yes No Unanswered Total
Vempadu 106 18 2 126
Chandanada 20 0 0 20
Rajayyapeta 5 5 0 10
Buchchirajupeta 16 3 0 19
Total 147 26 2 175 Source: Primary Census and Social Survey
House Electrified: Among the affected families 92% houses are electrified, while 7% houses have no electricity. 1% of the household among the affected households didn’t answer. Table 3-63 shows the household electrified among the affected household. Table 3-63: Household Electrified
Villages Yes No Unanswered Total
Vempadu 117 7 2 126
Chandanada 20 0 0 20
Rajayyapeta 5 5 0 10
Buchchirajupeta 19 0 19
Total 161 12 2 175 Source: Primary Census and Social Survey
Water Supply for the Household: Among the affected families 58% of them use Public Tap/ Hand Pump and 19% use other sources and HSC is 12%. Table 3-64 shows the water supply among the affected household. Table 3-64: Water Supply
Villages HSC Public Tap/ Hand Pump Own Bore/ Open well Others Unanswered Total
Vempadu 1 77 6 32 10 126
Chandanada 20 0 0 0 0 20
Rajayyapeta 0 8 1 1 0 10
Buchchirajupeta 0 16 0 0 3 19
Total 21 101 7 33 13 175 Source: Primary Census and Social Survey
Fuel for Cooking: Among the affected household 83% have LPG Gas and only 10% cook on firewood. Table 3-65 shows the fuels used for cooking. Table 3-65: Fuel for Cooking
Villages LPG Gas
Gobar Gas
Firewood LPG Gas/ Gobar
Gas LPG Gas/ Firewood
Unanswered Total
Vempadu 103 1 13 1 6 2 126
Chandanada 18 0 0 2 0 0 20
Rajayyapeta 5 0 5 0 0 0 10
Buchchirajupeta 19 0 0 0 0 0 19
Total 145 1 18 3 6 2 175 Source: Primary Census and Social Survey
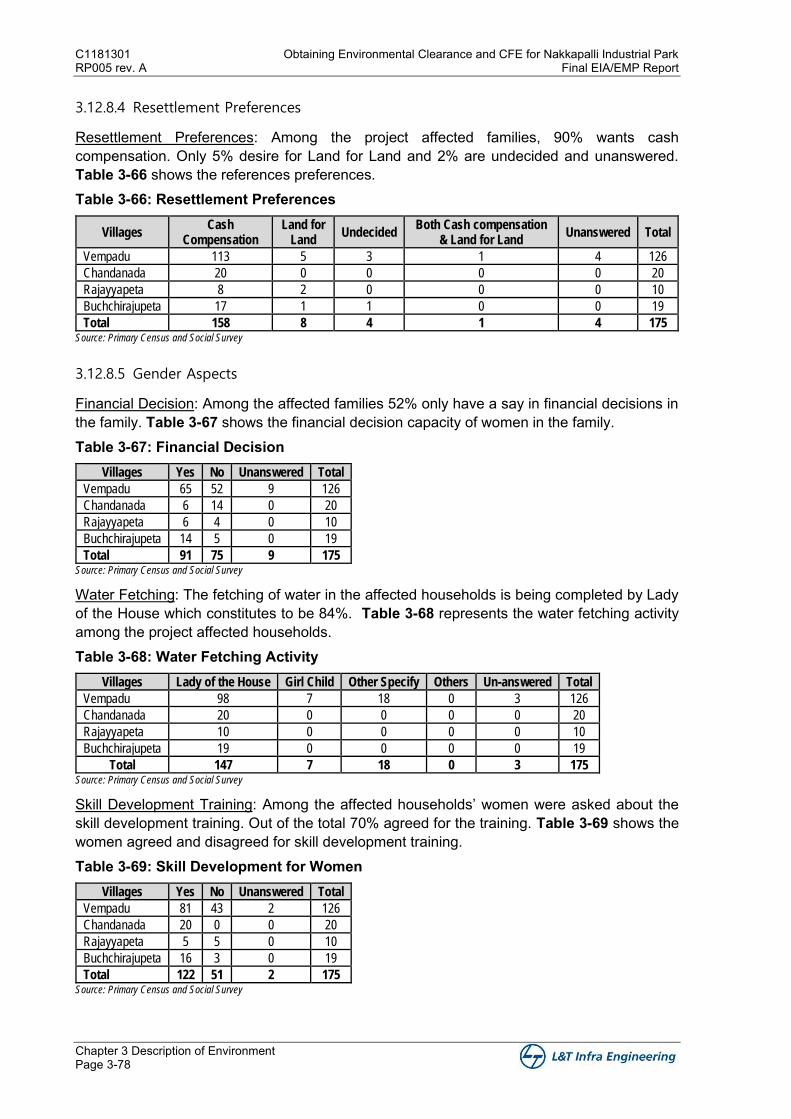
C1181301 Obtaining Environmental Clearance and CFE for Nakkapalli Industrial Park RP005 rev. A Final EIA/EMP Report
Chapter 3 Description of Environment Page 3-78
3.12.8.4 Resettlement Preferences
Resettlement Preferences: Among the project affected families, 90% wants cash compensation. Only 5% desire for Land for Land and 2% are undecided and unanswered. Table 3-66 shows the references preferences. Table 3-66: Resettlement Preferences
Villages Cash
Compensation Land for
Land Undecided
Both Cash compensation & Land for Land
Unanswered Total
Vempadu 113 5 3 1 4 126
Chandanada 20 0 0 0 0 20
Rajayyapeta 8 2 0 0 0 10
Buchchirajupeta 17 1 1 0 0 19
Total 158 8 4 1 4 175 Source: Primary Census and Social Survey
3.12.8.5 Gender Aspects
Financial Decision: Among the affected families 52% only have a say in financial decisions in the family. Table 3-67 shows the financial decision capacity of women in the family. Table 3-67: Financial Decision
Villages Yes No Unanswered Total
Vempadu 65 52 9 126
Chandanada 6 14 0 20
Rajayyapeta 6 4 0 10
Buchchirajupeta 14 5 0 19
Total 91 75 9 175 Source: Primary Census and Social Survey
Water Fetching: The fetching of water in the affected households is being completed by Lady of the House which constitutes to be 84%. Table 3-68 represents the water fetching activity among the project affected households. Table 3-68: Water Fetching Activity
Villages Lady of the House Girl Child Other Specify Others Un-answered Total
Vempadu 98 7 18 0 3 126
Chandanada 20 0 0 0 0 20
Rajayyapeta 10 0 0 0 0 10
Buchchirajupeta 19 0 0 0 0 19
Total 147 7 18 0 3 175 Source: Primary Census and Social Survey
Skill Development Training: Among the affected households’ women were asked about the skill development training. Out of the total 70% agreed for the training. Table 3-69 shows the women agreed and disagreed for skill development training. Table 3-69: Skill Development for Women
Villages Yes No Unanswered Total
Vempadu 81 43 2 126
Chandanada 20 0 0 20
Rajayyapeta 5 5 0 10
Buchchirajupeta 16 3 0 19
Total 122 51 2 175 Source: Primary Census and Social Survey
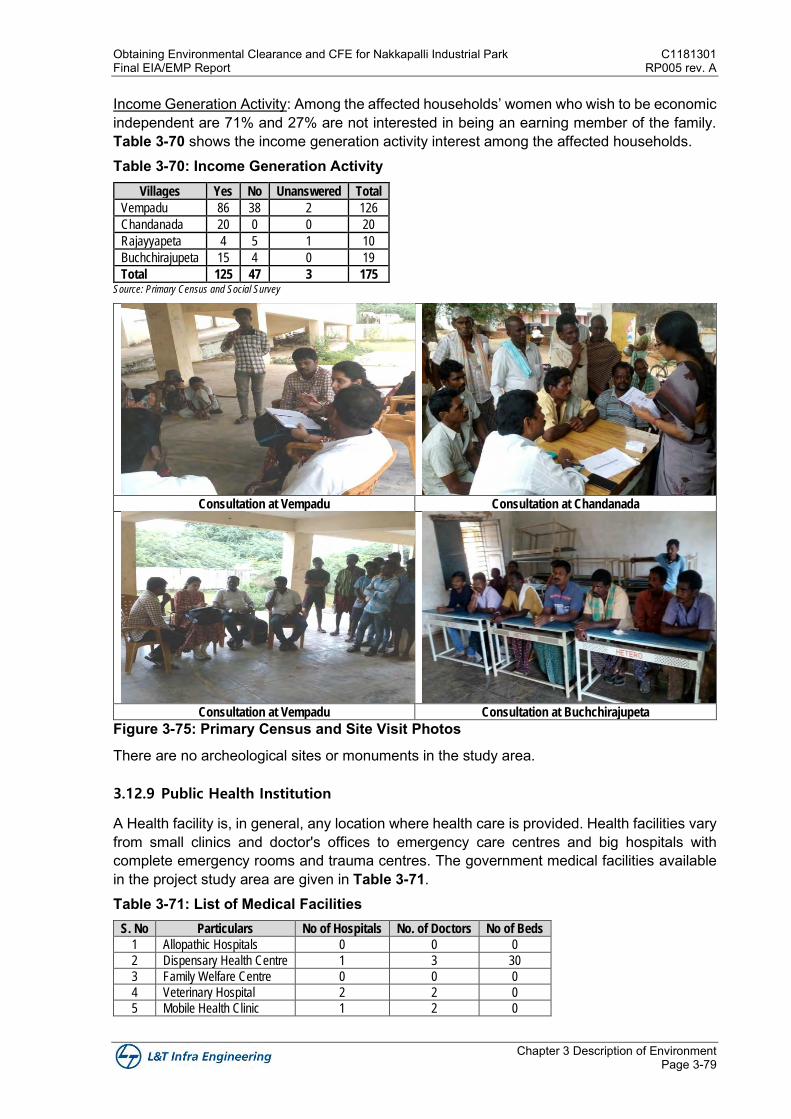
Obtaining Environmental Clearance and CFE for Nakkapalli Industrial Park C1181301 Final EIA/EMP Report RP005 rev. A
Chapter 3 Description of Environment Page 3-79
Income Generation Activity: Among the affected households’ women who wish to be economic independent are 71% and 27% are not interested in being an earning member of the family. Table 3-70 shows the income generation activity interest among the affected households. Table 3-70: Income Generation Activity
Villages Yes No Unanswered Total
Vempadu 86 38 2 126
Chandanada 20 0 0 20
Rajayyapeta 4 5 1 10
Buchchirajupeta 15 4 0 19
Total 125 47 3 175 Source: Primary Census and Social Survey
Consultation at Vempadu Consultation at Chandanada
Consultation at Vempadu Consultation at Buchchirajupeta
Figure 3-75: Primary Census and Site Visit Photos
There are no archeological sites or monuments in the study area.
3.12.9 Public Health Institution
A Health facility is, in general, any location where health care is provided. Health facilities vary from small clinics and doctor's offices to emergency care centres and big hospitals with complete emergency rooms and trauma centres. The government medical facilities available in the project study area are given in Table 3-71. Table 3-71: List of Medical Facilities
S. No Particulars No of Hospitals No. of Doctors No of Beds
1 Allopathic Hospitals 0 0 0
2 Dispensary Health Centre 1 3 30
3 Family Welfare Centre 0 0 0
4 Veterinary Hospital 2 2 0
5 Mobile Health Clinic 1 2 0

C1181301 Obtaining Environmental Clearance and CFE for Nakkapalli Industrial Park RP005 rev. A Final EIA/EMP Report
Chapter 3 Description of Environment Page 3-80
S. No Particulars No of Hospitals No. of Doctors No of Beds
6 Non-Govt. Hospitals 3 5 0
7 Medical Shops 10 0 0
3.12.10 Educational Institution
Educational Amenities: The type of different educational facilities available in the village is given in numbers. Government and private educational facilities / institutions are considered for this-purpose. The lists of educational institutes available in the project study area are given in Table 3-72. Table 3-72: List of Educational Institutes
S. No Particulars No of Schools/Colleges
1 Government Primary Schools 163
2 Government Middle Schools 59
3 Government Secondary Schools 26
4 Government Senior Secondary Schools 0
5 Private Primary Schools 11
6 Private Middle Schools 4
7 Private Secondary Schools 3
8 Private Senior Secondary Schools 4
9 Government Colleges 0
10 Private Colleges 1

Figures


Chapter 4 Anticipated Environmental
Impacts and Mitigation
Measures

Obtaining Environmental Clearance and CFE for Nakkapalli Industrial Park C1181301 Final EIA/EMP Report RP005 rev. A
Chapter 4 Anticipated Environmental Impacts and Mitigation Measures Page 4-81
Chapter 4 Anticipated Environmental Impacts and Mitigation
Measures
4.1 General
This chapter deals with the impacts on the environment due to development of Nakkapalli Industrial Park. An area of around 1578 Ha (3899 acres) has been identified considering the nature and extent of the activities associated with the project implementation and operation.
In this chapter, likely impacts of these activities on environmental attributes have been identified, assessed and presented. In order to mitigate likely environmental impacts during construction and operation phases due to proposed development suitable mitigation measures are framed and incorporated as a part of planning process. The impacts have been assessed both quantitatively and qualitatively for various environmental components and impact specific mitigation measures are proposed.
4.2 Land Environment
4.2.1 Potential Impact due to Location
4.2.1.1 Impacts due to Land Acquisition
The proposed Nakkapalli Industrial Park will be developed in an area of ~3899 acres (~1578 ha). APIIC is in the possession of 2849.83 acres out of which private land is 2001.99 acres and government land is 847.84 acres and requisition for land acquisition has been filed for remaining government land of 1049.98 acres. Compensation for land and structure are paid as per G.O 160 issued by GoAP dated November 16, 2016 and District collector orders vide File No. REV-ESECOLND(ATGL)82/2017-JA(E3)-VSKPCO/Dt:19-07-2018. As such no R&R is proposed for the settlements existing in the project boundary.
4.2.1.2 Impact due to Changes in Land Use Pattern
The site is mostly comprised of agriculture plantation; fallow; barren, uncultivable, wasteland/ scrubland; water bodies and settlements located within the site. The core area is mostly flat with agricultural lands, Cashew-Coconut-Eucalyptus- Casuarina plantation followed by low lying back water area. It is also observed that in back water low-lying area a small patch of aqua-culture practises are noticed. Due to the moist climatic conditions, the core area is mostly occupied with vegetation except in low-lying backwater areas. The land use of the existing area will be changed to industrial area which results in loss of existing vegetation. Planning for the proposed development is carried out based on the concept of zoning.
Also, it will have impact on the existing drainage pattern in the project area as well as in the adjoining area if the development is not properly planned.
4.2.1.3 Mitigation Measures
• In order to reduce the impact on the surrounding settlements, compatible activities are planned and proposed. Topographical aspects were considered for water, wastewater and
C1181301 Obtaining Environmental Clearance and CFE for Nakkapalli Industrial Park RP005 rev. A Final EIA/EMP Report
Chapter 4 Anticipated Environmental Impacts and Mitigation Measures Page 4-82
storm water management. The predominant wind direction, water bodies and settlements are considered for the concept of zoning of industries.
• The change in land use pattern shall be as per the requirement of the proposed project development plan which is for industrial use.
• The planning shall be in accordance with the standard landscape planning concepts adequate provision for green areas.
• The development shall be carried out in such a way to ensure proper drainage by providing surface drainage systems from the development parcels and connecting to storm water network
• Also, during site preparation care shall be taken to avoid disturbance to the water bodies existing in the site
4.2.2 Potential Impact due to Construction
4.2.2.1 Impact due to Site Grading/Levelling
The site is mostly flat terrain with levels varying from 0m to 126m and is found sloping towards east. During the construction phase site levelling would be required which involves site preparation work, soil and rock debris etc., achieved as cut material from the higher gradient shall be utilized to elevate the low-level areas within project premises. Excess material if required will be sourced from an approved quarry in the nearby areas or excess rock debris generated from site levelling may also be utilized in the region for other developmental activities.
The land disposal of solid wastes such as construction rubble, camp site garbage and discarded topsoil may impact soil quality. There might be a temporary phase of dumping the construction materials and wastes in the project site marring the aesthetics of the site. The landscape changes are expected with the changed land use. Apart from the localized construction impacts confined to the site, the impact is likely to be insignificant and no long term adverse impacts on topography are envisaged.
4.2.2.2 Mitigation Measures
• The earth material will be balanced as much as possible by cut and fill quantities within the individual industrial plot. Hence the reduction in transportation/conveyance of earth material to and from the site is envisaged.
• Cut and fill quantities shall be minimised by adopting appropriate engineering design of facilities based on the elevation requirements
• Proper disposal of construction waste has to be planned with temporary dump storage near to the site.
4.2.2.3 Impact on Local Infrastructure
Transportation of Construction Material: Transportation of huge quantities of construction material (quarry material, gravel, stone, aggregate, sand, bricks, cement, steel bitumen, paint bricks, etc.) during construction phase of the project results in use of public infrastructure like roads, railways, drainage, water and power supply which in turn results in extra burden on the existing infrastructure.
Construction Workers Camp: During the construction phase of the project there will be large-scale short term employment generation in the form of skilled and semi-skilled labours. It is expected to generate employment to 1200 persons in the region. The daily wage unskilled
Obtaining Environmental Clearance and CFE for Nakkapalli Industrial Park C1181301 Final EIA/EMP Report RP005 rev. A
Chapter 4 Anticipated Environmental Impacts and Mitigation Measures Page 4-83
labours employed locally will get job only for less than half of the construction period. Also, majority of the works will be sub-contracted. Temporary workers camps are planned to be set up for semi-skilled labourers in the project area during the construction period. This level of short-term employment opportunities would have a positive impact on the local economy and on regional unemployment.
4.2.2.4 Mitigation Measures
• Existing roads will be strengthened wherever necessary, to reduce the impact from transportation of construction material
• Construction material shall be sourced from nearby approved and licensed quarries • Temporary approach roads may be developed/strengthened with prior permission from
competent authority • Trucks with construction material susceptible for fugitive suspension will be covered with
tarpaulin covers during transport of construction materials • Transportation management will be adopted for movement of dumpers transporting quarry
stones and construction materials and traffic will be regulated • Vehicles deployed will confirm to emit norms of CPCB and have valid Pollution Under
Control (PUC) certificates • Very old vehicles (more than 20 years) will not be allowed for use at site • Dumpers and trucks will comply with standards for exhaust emissions and noise levels • To avoid/minimise impact/strain on the existing infrastructure, the worker camps will be
self-sufficient and would not rely on any local resource. This would help to avoid any conflict with the local population. To mitigate impacts from health hazards, sanitation facilities will be provided. Further, the worker camp siting will be planned away from habitations.
Following additional mitigation measures shall be followed:
• The camps will be adequately equipped with all the necessary facilities such as water supply, LPG supply, power supply, wastewater collection, solid waste collection and sanitation.
• The domestic wastes generated from the camps will be disposed at approved disposal sites.
• Periodic health check-ups will be undertaken for early detection and control of communicable diseases.
• Medical facilities including first aid will be available in the workers camps for injured workers.
4.2.3 Potential Impact due to Operation
4.2.3.1 Discharge on Land
The wastewater generated at Nakkapalli Industrial Park will be collected and treated in CETPs and STP. The wastewater and sewage generated in each industry will be treated up to the respective CETP inlet standards before sending to the marine outfall. Similarly, the sewage from the residential area will be sent to STP. The treated wastewater from STP will be recycled and reused within the Nakkapalli Industrial Park for maintaining the greenbelt and for non-potable water applications. It is proposed to develop marine outfall system for discharging treated wastewater of 5.27 MLD from CETPs after meeting the marine discharge standards. There will not be any significant impacts due to contamination of soil, ground and surface
C1181301 Obtaining Environmental Clearance and CFE for Nakkapalli Industrial Park RP005 rev. A Final EIA/EMP Report
Chapter 4 Anticipated Environmental Impacts and Mitigation Measures Page 4-84
waters in and around the project site as the Project is designed to follow recycle, reuse and marine discharge options.
4.2.3.1.1 Mitigation Measures
• Periodic maintenance and check of wastewater conveyance pipelines • Attempt to restore by replacing a part or putting together the torn or broken parts of the
conveyance pipeline in case of any leakage is detected. • Necessary preventive measures for spillage from pipelines, such as surface RCC channels
along the pipelines shall be adopted • Lining of all treatment unit tanks • Treated wastewater quality shall be ensured as per standards before using for greenbelt
or any other application.
4.2.3.2 Soil Contamination
Potential impacts on land environment are envisaged due to hazardous and non-hazardous wastes generated due to operation of various industries in the project area. Process waste including sludge and residues, chemical waste including toxic waste, used/waste oil, oil slurry, spent solvents, CETP sludge etc., are the source of hazardous waste. Poor management of such wastes from the operations is a potential risk of soil contamination.
4.2.3.2.1 Mitigation Measures
• Excavated soil will be stockpiled in a corner of the site in bunded area to avoid run off with storm water.
• Excavated stockpiled topsoil will be reused for horticultural/agricultural/Greenbelt purposes.
• Good housekeeping and best practices of waste handling shall be adopted to eliminate/minimise the risks of soil contamination.
• The wastes generated will be stored in temporary storage facility for a period of 90 days • The municipal waste shall be disposed to local municipality and industrial waste to nearby
Treatment, Storage and Disposal Facility (TSDF) until own TSDF is operational and also to approved/authorized vendors of Andhra Pradesh Pollution Control Board (APPCB). However, waste minimisation techniques will be adopted in order to minimise the generation of wastes.
4.3 Water Environment
4.3.1 Potential impact due to Location
4.3.1.1 Impacts on Existing Water Resources
During construction phase, the water requirement during the construction phase is 1 MLD and will be partly sourced water supply scheme of YLMC and partly from local Municipality/ panchayat.
The total one-time raw water requirement for the proposed Nakkapalli Industrial Park will be about 18.95 MLD for different purposes specifically industrial, commercial, institutional, residential, district cooling, firefighting and green area maintenance. It is proposed to treat the wastewater generated to tertiary level (discussed in subsequent section) thus enabling its reuse and recycle at the site for non-potable water demand. Considering the treated water
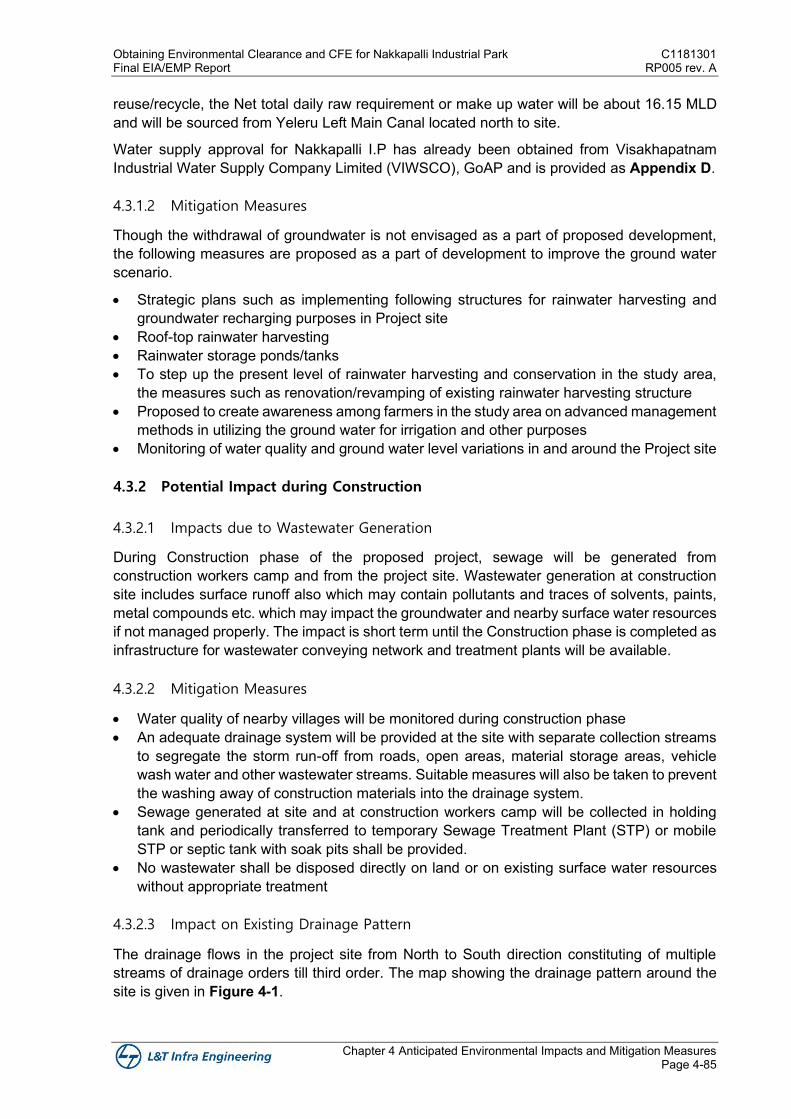
Obtaining Environmental Clearance and CFE for Nakkapalli Industrial Park C1181301 Final EIA/EMP Report RP005 rev. A
Chapter 4 Anticipated Environmental Impacts and Mitigation Measures Page 4-85
reuse/recycle, the Net total daily raw requirement or make up water will be about 16.15 MLD and will be sourced from Yeleru Left Main Canal located north to site.
Water supply approval for Nakkapalli I.P has already been obtained from Visakhapatnam Industrial Water Supply Company Limited (VIWSCO), GoAP and is provided as Appendix D.
4.3.1.2 Mitigation Measures
Though the withdrawal of groundwater is not envisaged as a part of proposed development, the following measures are proposed as a part of development to improve the ground water scenario.
• Strategic plans such as implementing following structures for rainwater harvesting and groundwater recharging purposes in Project site
• Roof-top rainwater harvesting • Rainwater storage ponds/tanks • To step up the present level of rainwater harvesting and conservation in the study area,
the measures such as renovation/revamping of existing rainwater harvesting structure • Proposed to create awareness among farmers in the study area on advanced management
methods in utilizing the ground water for irrigation and other purposes • Monitoring of water quality and ground water level variations in and around the Project site
4.3.2 Potential Impact during Construction
4.3.2.1 Impacts due to Wastewater Generation
During Construction phase of the proposed project, sewage will be generated from construction workers camp and from the project site. Wastewater generation at construction site includes surface runoff also which may contain pollutants and traces of solvents, paints, metal compounds etc. which may impact the groundwater and nearby surface water resources if not managed properly. The impact is short term until the Construction phase is completed as infrastructure for wastewater conveying network and treatment plants will be available.
4.3.2.2 Mitigation Measures
• Water quality of nearby villages will be monitored during construction phase • An adequate drainage system will be provided at the site with separate collection streams
to segregate the storm run-off from roads, open areas, material storage areas, vehicle wash water and other wastewater streams. Suitable measures will also be taken to prevent the washing away of construction materials into the drainage system.
• Sewage generated at site and at construction workers camp will be collected in holding tank and periodically transferred to temporary Sewage Treatment Plant (STP) or mobile STP or septic tank with soak pits shall be provided.
• No wastewater shall be disposed directly on land or on existing surface water resources without appropriate treatment
4.3.2.3 Impact on Existing Drainage Pattern
The drainage flows in the project site from North to South direction constituting of multiple streams of drainage orders till third order. The map showing the drainage pattern around the site is given in Figure 4-1.
C1181301 Obtaining Environmental Clearance and CFE for Nakkapalli Industrial Park RP005 rev. A Final EIA/EMP Report
Chapter 4 Anticipated Environmental Impacts and Mitigation Measures Page 4-86
Figure 4-1: Drainage pattern in the Project site
Due to the proposed Project, there will be minor change/ disturbance to the natural drainage pattern and chances of flooding is not significant in the areas abutting project site as the natural drains are originating from site. However, flooding within the site can be witnessed if any of the construction debris hinders the flow during rainy seasons.
4.3.2.4 Mitigation Measures
• Storm water drainage arrangement/network is proposed to ensure the adequate drainage system within the site.
• Grading within the project site will be planned in such a way that there shall be negligible impacts on the existing natural drainage system/pattern
• The development within the designated Park area shall be carried out in such a way to ensure proper drainage by providing surface drainage systems including storm water network, etc. and all the altered drainage in the footprint area need to be properly connected to the existing natural drainage system of the region
• To step up the present level of rainwater harvesting and conservation in the study area, the measures such as renovation/revamping of existing rainwater harvesting structure
• Monitoring of water quality and ground water level variations in and around the Project site • Other reduction methods by choosing manufacturers who follow government waste
regulations, purify their wastewater, capture and reuse solvents, and choose wise disposal methods
Obtaining Environmental Clearance and CFE for Nakkapalli Industrial Park C1181301 Final EIA/EMP Report RP005 rev. A
Chapter 4 Anticipated Environmental Impacts and Mitigation Measures Page 4-87
4.3.2.5 Storm Water Management
Storm water drainage arrangement is proposed along roadside to cater water from the road surface and adjoining land area of project site. Accordingly, each roadside drain runoff is arrived and connected to roadside drain on downstream side, forming as grid type arrangement based on the natural slope (gravity flow) which finally has to be discharged into natural lower order drain located eastern side of the project site. The surface and sub-surface drainage system is designed as per IRC guidelines. A minimum longitudinal gradient of 0.3% is maintained in such a way that it attains the minimum self-cleaning velocity of storm water drains. Closed box, Open box and trapezoidal type storm water drain are being explored along both side of the new construction road in project site.
In addition, rooftop runoff will be collected and used to negate the dependency on externally sourced water during Monsoon. Altogether a hybrid storm management system integrating LID (low impact development) and conventional drain system is planned for the Project. The proposed storm water drainage network is given as Figure FD0401.
4.3.3 Potential Impact during Operation
4.3.3.1 Impact due to Wastewater Generation
The source of wastewater generation from Nakkapalli I.P is as follows:
• Industrial process wastewater/effluent • Cooling water blow down • Domestic wastewater/sewage • Equipment cleaning and Floor washings, etc.
The details of wastewater quantities to be generated are discussed in Section 2.5.2.
The facilities in the industrial sectors proposed in the I.P can be considered of a series of unit process such as Melting and die casting, Chemical treatment, Cutting, Shearing, Forming, Welding and soldering, Heat treatment, Forging, Dressing/grinding, Machining, Non-destructive testing, Surface preparation and surface coating etc.
The types of industries are Pharmaceuticals involving chemical processes, Engineering and fabrication units (dry process without any heat treatment / metal surface finishing operations / painting); Ferrous and Non - ferrous metal extraction involving different furnaces through melting, refining, re-processing, casting and alloy making; Forging of ferrous and non- ferrous metals (using oil and gas fired furnaces); Industry or processes involving foundry operations; Rolling mill (oil or coal fired) and cold rolling mill; Spray painting, paint baking, paint shipping; Steel and steel products using various furnaces like blast furnace /open hearth furnace/induction furnace/arc furnace/submerged arc furnace /basic oxygen furnace /hot rolling reheated furnace; Rolling mill (gas fired) and cold rolling mill; Industry or process involving metal surface treatment or process such as pickling/ electroplating/paint stripping/ heat treatment using cyanide bath/ phosphating or finishing and anodizing / enamellings/ galvanizing; Electric and electronic item assembling (completely dry process).
Also, sewage will be generated from the sanitary and domestic blocks at the industrial units of the clusters, mixed use & residential and common facilities such as amenities & utilities.
The untreated wastewater if discharged into nearby surface waters may affect the surface water and/or if disposed off on land without treatment may pollute the ground and surface water. Various mitigation measures are proposed to be adopted to minimise the impact if any
C1181301 Obtaining Environmental Clearance and CFE for Nakkapalli Industrial Park RP005 rev. A Final EIA/EMP Report
Chapter 4 Anticipated Environmental Impacts and Mitigation Measures Page 4-88
on the water environment due to the wastewater/runoff generation during the operation phase of the project.
4.3.3.2 Mitigation Measures/Wastewater Management
• The wastewater generated at Nakkapalli Industrial Park will be collected and treated in CETPs and STP. The wastewater shall be received at the CETPs and their pathways of treatment have been arrived at, based on the nature of the characteristics of the wastewater. It is proposed to develop two CETPs of 5.27 MLD capacity on modular basis under wastewater treatment system considering inflows from different industrial clusters in the park. Details of treatment schemes are discussed in Chapter 2. The proposed treatment systems will cater to most of the proposed industry needs in Nakkapalli Industrial Park and flexible to accommodate all types of effluent anticipated to be generated.
• Minimise the consumption of water used in the process and equipment cleaning to the extent possible
• Ensure untreated wastewater is not discharged in to the surrounding water bodies/drains.
4.4 Marine Environment (Costal Hydrology/Bottom Contamination,
Sea/Harbour Water Quality)
4.4.1 Potential Impact due to Location
4.4.1.1 Littoral Drift/Sediment Transport
The shoreline/coastline changes such as erosion/accretion is usually expected due to the development of marine structures such as breakwaters, groynes, Jetties, wharf etc. In proposed I.P development, there is no proposal for construction of marine structures other than marine outfall which will be submerged under seabed. Hence, no impacts are anticipated on sediment transport.
4.4.2 Potential Impact during Construction
4.4.2.1 Impact due to Construction of Marine Outfall System
In all submarine constructions, there are two principal zones of construction activity each requiring a different technique, namely, in-shore/surf zone and the offshore zone. The construction of submarine pipelines through the surf zone will cause temporary disturbance to the seabed along the alignment. Actually, the exposed portions of the pipelines can become a new habitat for marine organisms.
4.4.2.2 Mitigation Measures
Construction within the surf zone requires that the pipe be placed in a trench excavated to a depth sufficient to provide protection of the completed pipeline during periods of heavy seas. In sandy surf conditions the pipe must be buried to a depth below the minimum profile level, which can be expected, and/or provided with other means to maintain stability. Where the sea bottom is rock, the pipe may be placed in an excavated trench, backfilled and provided with a concrete protective cover.
Obtaining Environmental Clearance and CFE for Nakkapalli Industrial Park C1181301 Final EIA/EMP Report RP005 rev. A
Chapter 4 Anticipated Environmental Impacts and Mitigation Measures Page 4-89
At a certain depth in the sea, it is no longer necessary to bury the pipeline. Beyond this point it is only required that the seabed be able to support the limited pipe load and that the seabed be sufficiently even, without ledges or ridges.
Construction of outfall structures will be carried out in such a manner, which will have minimum impact on existing marine ecology. It shall be ensured that there will be minimum ecological disturbance. Mangroves are not reported along the enroute of pipeline corridor of marine outfall. Adoption of good construction management practices such as construction activity will be confined within the project site, selection of trenching equipment etc., to minimize the impacts on surrounding ecology to the bare minimal level.
4.4.2.3 Impact on Marine Water Quality
Marine water quality will be impacted due to trenching of seabed for construction of sub seabed pipelines. Direct impact of these activities on marine water quality would be increased turbidity due to suspended sediment and will be predominant during trenching. The accidental spillage of construction material may also affect the marine water quality.
Turbidity due to trenching operation varies with depth and lateral distance from the trenching location. During trenching, transport of sediment depends on velocity and fine material concentration. Very fine cohesive material will remain in suspension for a long time and is independent of hydrodynamic conditions. Due to above factors, there will be an increase in turbidity due to suspended sediment in water column. Thus, it can be inferred that trenching can cause a short-term and localised impact on marine water quality.
Apart from turbidity, the marine water quality may be affected due to aqueous discharge (oily wastes, sanitary wastes, etc.) from the trenching equipments, barges and workboats involved in the construction activities.
4.4.2.4 Impact on Marine Ecology
Turbulence – Changes in Dissolved Oxygen (DO) Levels: During trenching, oxygen demanding compounds, nutrients and sediments from the seabed enter into water column. Since concentrations of oxygen-demanding compounds are normally much higher in pore water than in water column it will cause a drop in oxygen concentration. Nutrients may stimulate primary production when light and temperatures are sufficient and may cause eutrophication problems when released in favourable conditions. DO levels in bottom sediments, which are usually low would increase during trenching activity. Changes in DO levels and noise are likely to result in localised and short-term impacts on marine ecology.
Removal of Benthic Communities associated with Bottom Sediments: Trenching would result in removal of benthic communities associated with bottom sediments. During trenching sessile forms are removed along with sediments and mobile species tend to move away and are likely to increase species diversity in areas adjoining the site. Further, it is observed that due to movement of mobile species and transfer of nutrients during trenching activity, there will be an increase in species diversity and density in areas adjoining the trenching site
Smothering Effect Due to Settling of Sediment: Settlement of the suspended sediments can result in the smothering or blanketing of sub-tidal communities and/or adjacent intertidal communities. Presently, the marine biota in Indian Coast is already subjected to considerable changes in turbidity due to large-scale littoral movement, which is a recurring regular natural phenomenon. Therefore, it would be able to withstand localised turbidity induced during the trenching.
C1181301 Obtaining Environmental Clearance and CFE for Nakkapalli Industrial Park RP005 rev. A Final EIA/EMP Report
Chapter 4 Anticipated Environmental Impacts and Mitigation Measures Page 4-90
4.4.2.5 Changes in Seabed Profile
Generally, construction of marine structures may alter the seabed profile. In the proposed development, marine outfall (sub seabed pipeline) which requires trenching in seabed, lowering of pipeline and backfilling are likely to change the seabed in terms of disturbance to the strata and localised sediment dispersion. The dispersed sediment tends to increase the turbidity of the seawater resulting in an impact on the food chain of the marine biota.
4.4.2.6 Mitigation Measures
• No discharge from the equipments or work boats shall be allowed into marine waters. • The construction activity will be confined within the project site and the impact will cease
upon completion of construction • To mitigate impacts on marine ecology, measures such as selection of trenching
equipment, environmental monitoring and regulating activities based on monitoring results will be adopted
• A post construction/implementation survey of the sub seabed pipeline is suggested in the Environmental Management Plan to mitigate the impacts. During the survey, stretches that may become unstable due to adverse weather conditions will be stabilized along with restoration of the altered seabed profile if any, which are unlikely
• A schedule for various construction activities shall be prepared and list of DO(s) and DO NOT(s) shall be circulated among the people involved in construction activities
• It is proposed to check turbidity levels with baseline turbidity levels as a reference during construction
• Less intrusive trenching techniques shall be adopted to minimise turbidity • It will be ensured that suitable trenching equipment is deployed to minimise the suspension
of fine sediments at the site • Trenching activity will be regulated during rough sea conditions • It will be ensured that barges/workboats have slop tanks for collection of liquid / solid waste
generated on board. Discharge of wastes into sea will be prohibited. • Spill control measures will be adopted while fuelling trenching equipments, barges,
workboats, etc. • Environmental Monitoring Programme comprising of monitoring of marine water quality,
sediment quality and ecology will be initiated one week prior to commencement of construction/trenching activity and will be carried out throughout construction period As far as possible, best available construction technology shall be adopted during construction to minimize the waste of construction material and reduce the impact on marine environment.
4.4.3 Potential Impact during Operation
4.4.3.1 Impact due to Treated Wastewater Discharges
A marine outfall system is proposed for CETPs treated discharge. The total marine outfall discharge quantity is around 5.27 MLD. In response to Lr.No.526/APPCB/CFE/RO- VSP/HO/2021 dated 25/06/2021 from APPCB regarding submission of clarifications on NOC for marine outfall of Nakkapalli Industrial Park. Following model studies are re-conducted for location at 1.5 km at -12 m depth.
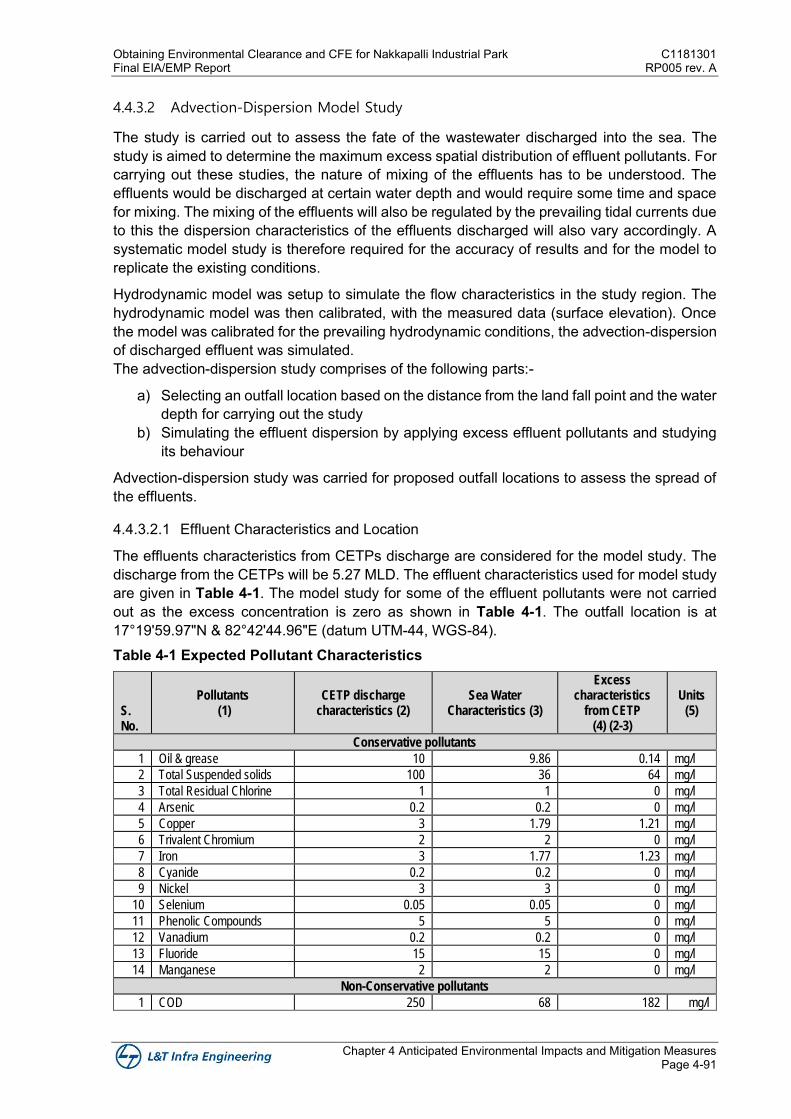
Obtaining Environmental Clearance and CFE for Nakkapalli Industrial Park C1181301 Final EIA/EMP Report RP005 rev. A
Chapter 4 Anticipated Environmental Impacts and Mitigation Measures Page 4-91
4.4.3.2 Advection-Dispersion Model Study
The study is carried out to assess the fate of the wastewater discharged into the sea. The study is aimed to determine the maximum excess spatial distribution of effluent pollutants. For carrying out these studies, the nature of mixing of the effluents has to be understood. The effluents would be discharged at certain water depth and would require some time and space for mixing. The mixing of the effluents will also be regulated by the prevailing tidal currents due to this the dispersion characteristics of the effluents discharged will also vary accordingly. A systematic model study is therefore required for the accuracy of results and for the model to replicate the existing conditions.
Hydrodynamic model was setup to simulate the flow characteristics in the study region. The hydrodynamic model was then calibrated, with the measured data (surface elevation). Once the model was calibrated for the prevailing hydrodynamic conditions, the advection-dispersion of discharged effluent was simulated. The advection-dispersion study comprises of the following parts:-
a) Selecting an outfall location based on the distance from the land fall point and the water depth for carrying out the study
b) Simulating the effluent dispersion by applying excess effluent pollutants and studying its behaviour
Advection-dispersion study was carried for proposed outfall locations to assess the spread of the effluents.
4.4.3.2.1 Effluent Characteristics and Location
The effluents characteristics from CETPs discharge are considered for the model study. The discharge from the CETPs will be 5.27 MLD. The effluent characteristics used for model study are given in Table 4-1. The model study for some of the effluent pollutants were not carried out as the excess concentration is zero as shown in Table 4-1. The outfall location is at 17°19'59.97"N & 82°42'44.96"E (datum UTM-44, WGS-84). Table 4-1 Expected Pollutant Characteristics
S. No.
Pollutants (1)
CETP discharge characteristics (2)
Sea Water Characteristics (3)
Excess characteristics
from CETP (4) (2-3)
Units (5)
Conservative pollutants
1 Oil & grease 10 9.86 0.14 mg/l
2 Total Suspended solids 100 36 64 mg/l
3 Total Residual Chlorine 1 1 0 mg/l
4 Arsenic 0.2 0.2 0 mg/l
5 Copper 3 1.79 1.21 mg/l
6 Trivalent Chromium 2 2 0 mg/l
7 Iron 3 1.77 1.23 mg/l
8 Cyanide 0.2 0.2 0 mg/l
9 Nickel 3 3 0 mg/l
10 Selenium 0.05 0.05 0 mg/l
11 Phenolic Compounds 5 5 0 mg/l
12 Vanadium 0.2 0.2 0 mg/l
13 Fluoride 15 15 0 mg/l
14 Manganese 2 2 0 mg/l
Non-Conservative pollutants
1 COD 250 68 182 mg/l
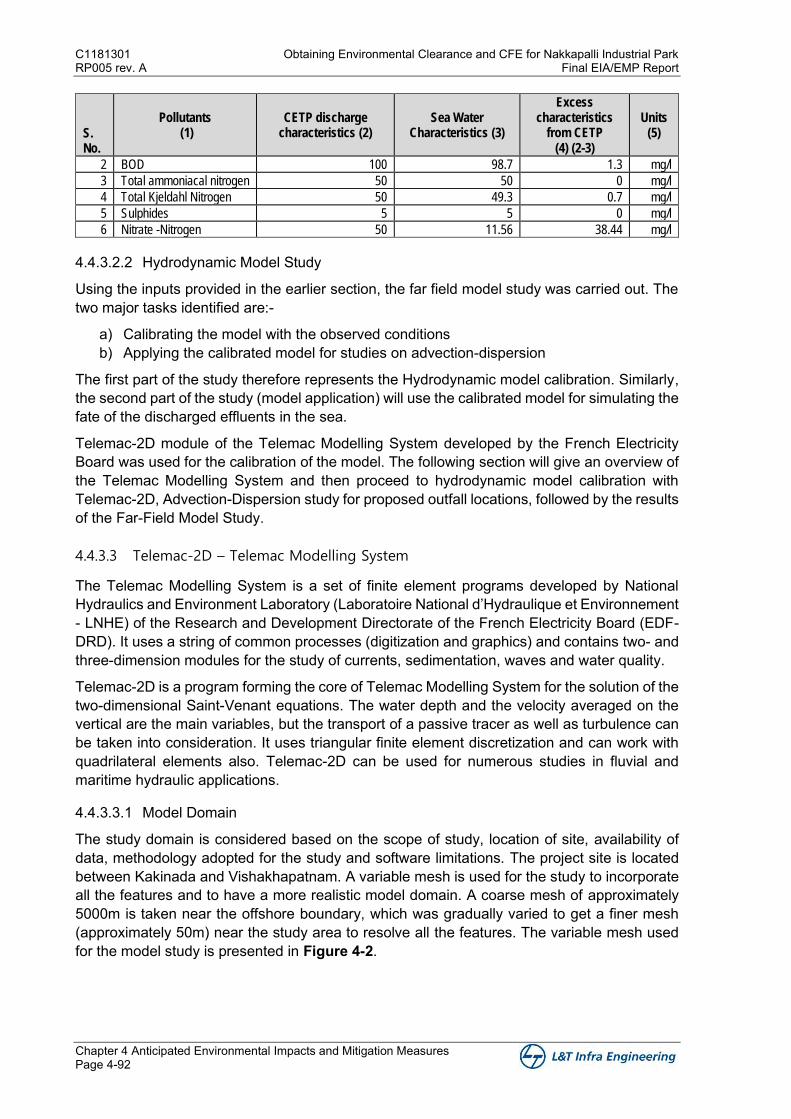
C1181301 Obtaining Environmental Clearance and CFE for Nakkapalli Industrial Park RP005 rev. A Final EIA/EMP Report
Chapter 4 Anticipated Environmental Impacts and Mitigation Measures Page 4-92
S. No.
Pollutants (1)
CETP discharge characteristics (2)
Sea Water Characteristics (3)
Excess characteristics
from CETP (4) (2-3)
Units (5)
2 BOD 100 98.7 1.3 mg/l
3 Total ammoniacal nitrogen 50 50 0 mg/l
4 Total Kjeldahl Nitrogen 50 49.3 0.7 mg/l
5 Sulphides 5 5 0 mg/l
6 Nitrate -Nitrogen 50 11.56 38.44 mg/l
4.4.3.2.2 Hydrodynamic Model Study
Using the inputs provided in the earlier section, the far field model study was carried out. The two major tasks identified are:-
a) Calibrating the model with the observed conditions b) Applying the calibrated model for studies on advection-dispersion
The first part of the study therefore represents the Hydrodynamic model calibration. Similarly, the second part of the study (model application) will use the calibrated model for simulating the fate of the discharged effluents in the sea.
Telemac-2D module of the Telemac Modelling System developed by the French Electricity Board was used for the calibration of the model. The following section will give an overview of the Telemac Modelling System and then proceed to hydrodynamic model calibration with Telemac-2D, Advection-Dispersion study for proposed outfall locations, followed by the results of the Far-Field Model Study.
4.4.3.3 Telemac-2D – Telemac Modelling System
The Telemac Modelling System is a set of finite element programs developed by National Hydraulics and Environment Laboratory (Laboratoire National d’Hydraulique et Environnement - LNHE) of the Research and Development Directorate of the French Electricity Board (EDF-DRD). It uses a string of common processes (digitization and graphics) and contains two- and three-dimension modules for the study of currents, sedimentation, waves and water quality.
Telemac-2D is a program forming the core of Telemac Modelling System for the solution of the two-dimensional Saint-Venant equations. The water depth and the velocity averaged on the vertical are the main variables, but the transport of a passive tracer as well as turbulence can be taken into consideration. It uses triangular finite element discretization and can work with quadrilateral elements also. Telemac-2D can be used for numerous studies in fluvial and maritime hydraulic applications.
4.4.3.3.1 Model Domain
The study domain is considered based on the scope of study, location of site, availability of data, methodology adopted for the study and software limitations. The project site is located between Kakinada and Vishakhapatnam. A variable mesh is used for the study to incorporate all the features and to have a more realistic model domain. A coarse mesh of approximately 5000m is taken near the offshore boundary, which was gradually varied to get a finer mesh (approximately 50m) near the study area to resolve all the features. The variable mesh used for the model study is presented in Figure 4-2.
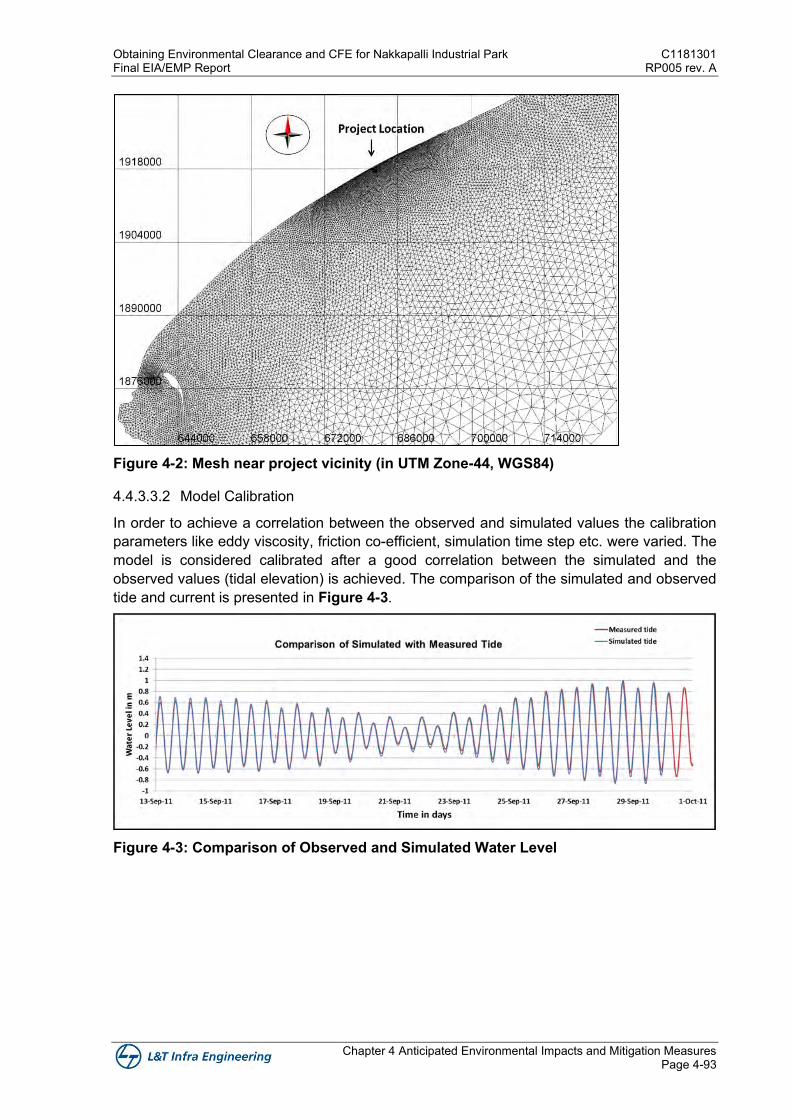
Obtaining Environmental Clearance and CFE for Nakkapalli Industrial Park C1181301 Final EIA/EMP Report RP005 rev. A
Chapter 4 Anticipated Environmental Impacts and Mitigation Measures Page 4-93
Figure 4-2: Mesh near project vicinity (in UTM Zone-44, WGS84)
4.4.3.3.2 Model Calibration
In order to achieve a correlation between the observed and simulated values the calibration parameters like eddy viscosity, friction co-efficient, simulation time step etc. were varied. The model is considered calibrated after a good correlation between the simulated and the observed values (tidal elevation) is achieved. The comparison of the simulated and observed tide and current is presented in Figure 4-3.
Figure 4-3: Comparison of Observed and Simulated Water Level
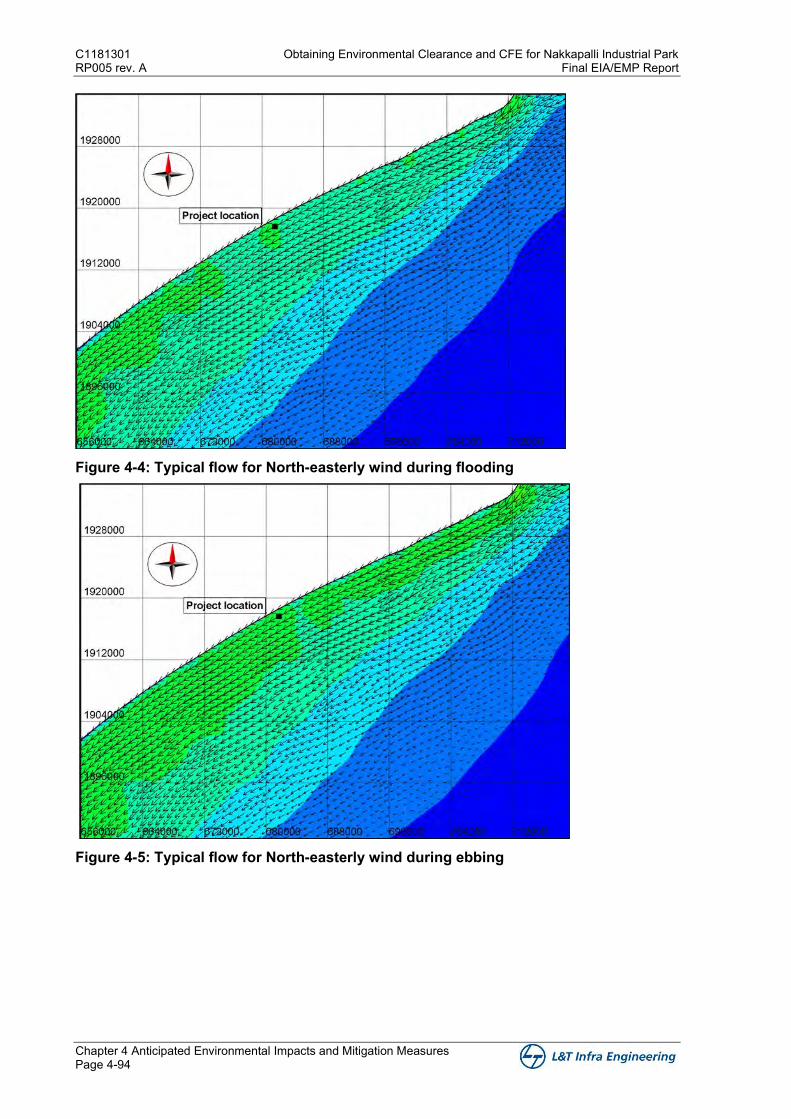
C1181301 Obtaining Environmental Clearance and CFE for Nakkapalli Industrial Park RP005 rev. A Final EIA/EMP Report
Chapter 4 Anticipated Environmental Impacts and Mitigation Measures Page 4-94
Figure 4-4: Typical flow for North-easterly wind during flooding
Figure 4-5: Typical flow for North-easterly wind during ebbing
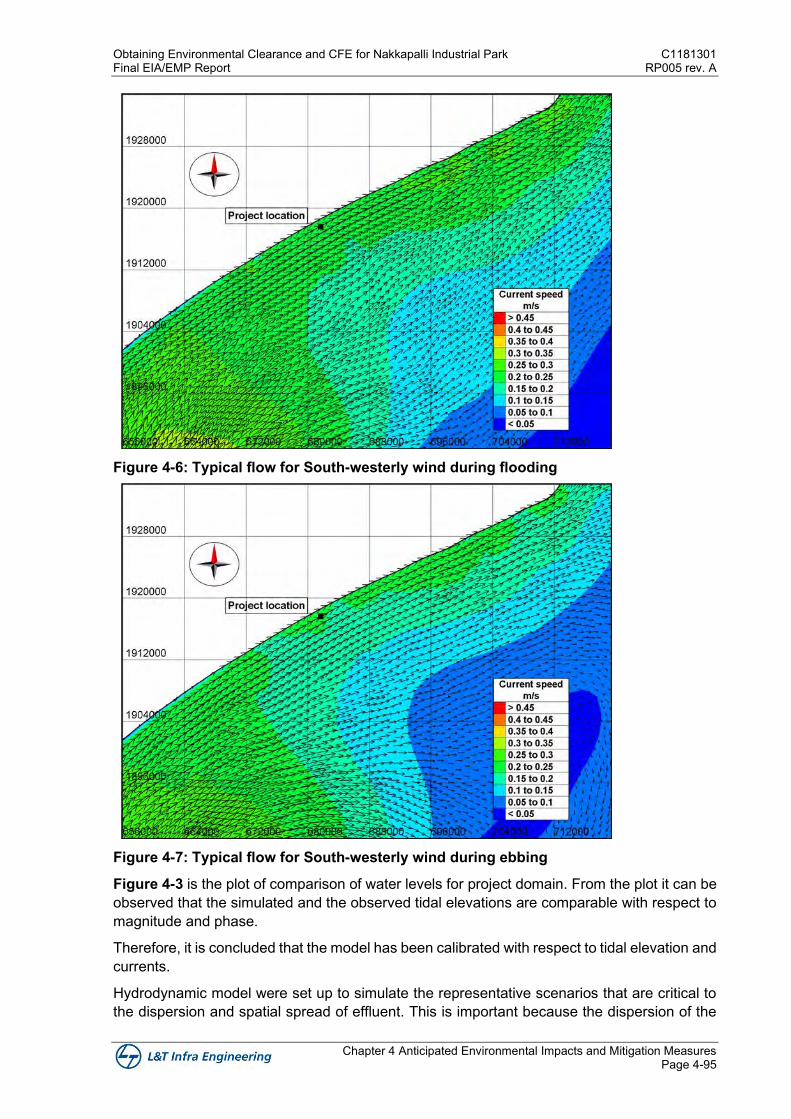
Obtaining Environmental Clearance and CFE for Nakkapalli Industrial Park C1181301 Final EIA/EMP Report RP005 rev. A
Chapter 4 Anticipated Environmental Impacts and Mitigation Measures Page 4-95
Figure 4-6: Typical flow for South-westerly wind during flooding
Figure 4-7: Typical flow for South-westerly wind during ebbing
Figure 4-3 is the plot of comparison of water levels for project domain. From the plot it can be observed that the simulated and the observed tidal elevations are comparable with respect to magnitude and phase.
Therefore, it is concluded that the model has been calibrated with respect to tidal elevation and currents.
Hydrodynamic model were set up to simulate the representative scenarios that are critical to the dispersion and spatial spread of effluent. This is important because the dispersion of the
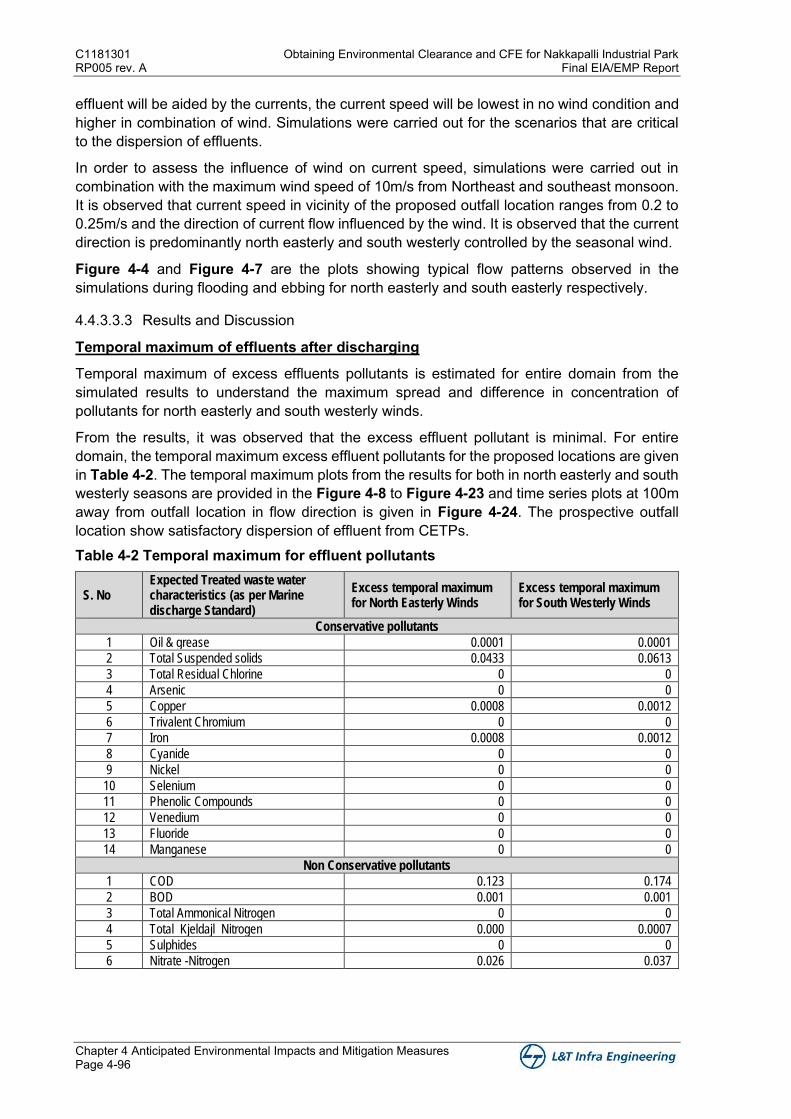
C1181301 Obtaining Environmental Clearance and CFE for Nakkapalli Industrial Park RP005 rev. A Final EIA/EMP Report
Chapter 4 Anticipated Environmental Impacts and Mitigation Measures Page 4-96
effluent will be aided by the currents, the current speed will be lowest in no wind condition and higher in combination of wind. Simulations were carried out for the scenarios that are critical to the dispersion of effluents.
In order to assess the influence of wind on current speed, simulations were carried out in combination with the maximum wind speed of 10m/s from Northeast and southeast monsoon. It is observed that current speed in vicinity of the proposed outfall location ranges from 0.2 to 0.25m/s and the direction of current flow influenced by the wind. It is observed that the current direction is predominantly north easterly and south westerly controlled by the seasonal wind.
Figure 4-4 and Figure 4-7 are the plots showing typical flow patterns observed in the simulations during flooding and ebbing for north easterly and south easterly respectively.
4.4.3.3.3 Results and Discussion
Temporal maximum of effluents after discharging
Temporal maximum of excess effluents pollutants is estimated for entire domain from the simulated results to understand the maximum spread and difference in concentration of pollutants for north easterly and south westerly winds.
From the results, it was observed that the excess effluent pollutant is minimal. For entire domain, the temporal maximum excess effluent pollutants for the proposed locations are given in Table 4-2. The temporal maximum plots from the results for both in north easterly and south westerly seasons are provided in the Figure 4-8 to Figure 4-23 and time series plots at 100m away from outfall location in flow direction is given in Figure 4-24. The prospective outfall location show satisfactory dispersion of effluent from CETPs. Table 4-2 Temporal maximum for effluent pollutants
S. No Expected Treated waste water characteristics (as per Marine discharge Standard)
Excess temporal maximum for North Easterly Winds
Excess temporal maximum for South Westerly Winds
Conservative pollutants
1 Oil & grease 0.0001 0.0001
2 Total Suspended solids 0.0433 0.0613
3 Total Residual Chlorine 0 0
4 Arsenic 0 0
5 Copper 0.0008 0.0012
6 Trivalent Chromium 0 0
7 Iron 0.0008 0.0012
8 Cyanide 0 0
9 Nickel 0 0
10 Selenium 0 0
11 Phenolic Compounds 0 0
12 Venedium 0 0
13 Fluoride 0 0
14 Manganese 0 0
Non Conservative pollutants
1 COD 0.123 0.174
2 BOD 0.001 0.001
3 Total Ammonical Nitrogen 0 0
4 Total Kjeldajl Nitrogen 0.000 0.0007
5 Sulphides 0 0
6 Nitrate -Nitrogen 0.026 0.037
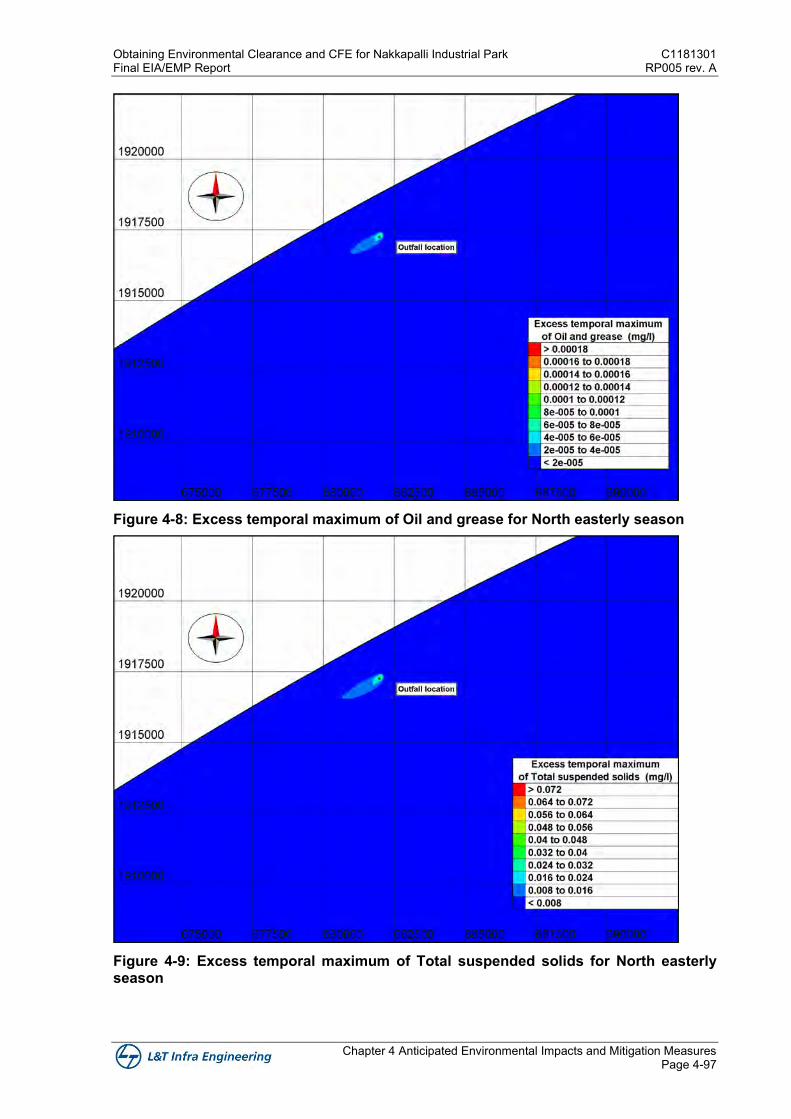
Obtaining Environmental Clearance and CFE for Nakkapalli Industrial Park C1181301 Final EIA/EMP Report RP005 rev. A
Chapter 4 Anticipated Environmental Impacts and Mitigation Measures Page 4-97
Figure 4-8: Excess temporal maximum of Oil and grease for North easterly season
Figure 4-9: Excess temporal maximum of Total suspended solids for North easterly season
C1181301 Obtaining Environmental Clearance and CFE for Nakkapalli Industrial Park RP005 rev. A Final EIA/EMP Report
Chapter 4 Anticipated Environmental Impacts and Mitigation Measures Page 4-98
Figure 4-10: Excess temporal maximum of Copper for North easterly season
Figure 4-11: Excess temporal maximum of Iron for North easterly season
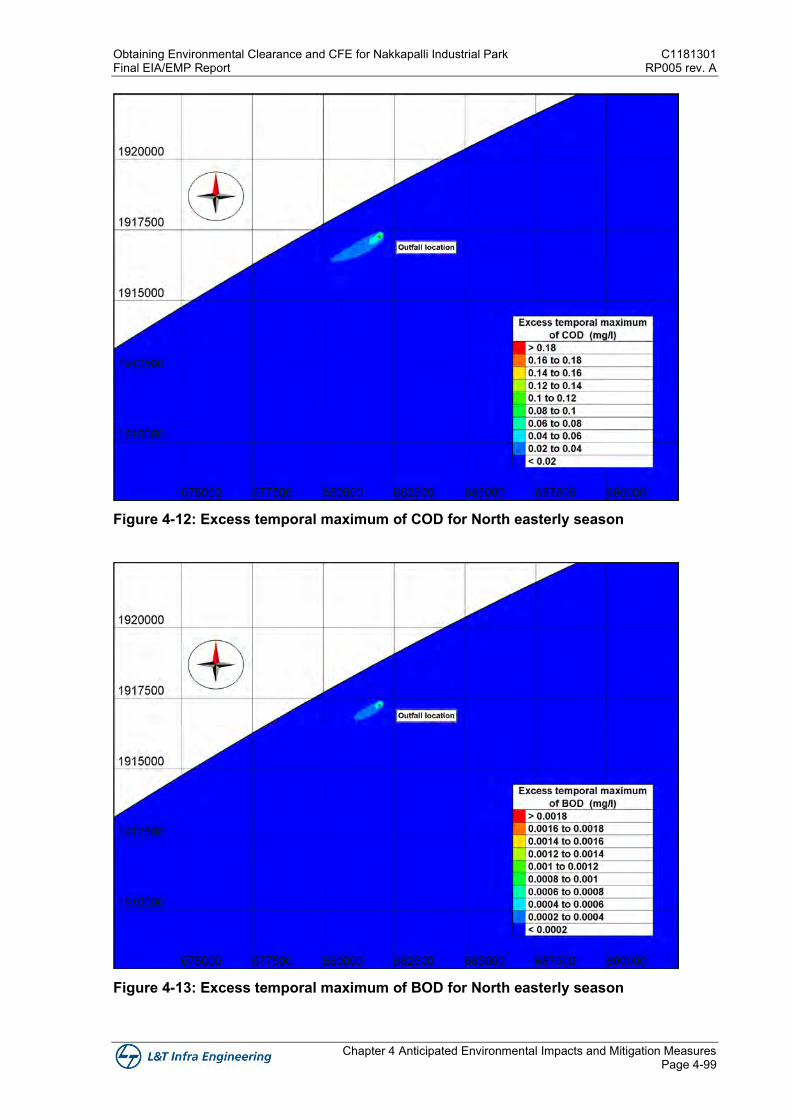
Obtaining Environmental Clearance and CFE for Nakkapalli Industrial Park C1181301 Final EIA/EMP Report RP005 rev. A
Chapter 4 Anticipated Environmental Impacts and Mitigation Measures Page 4-99
Figure 4-12: Excess temporal maximum of COD for North easterly season
Figure 4-13: Excess temporal maximum of BOD for North easterly season
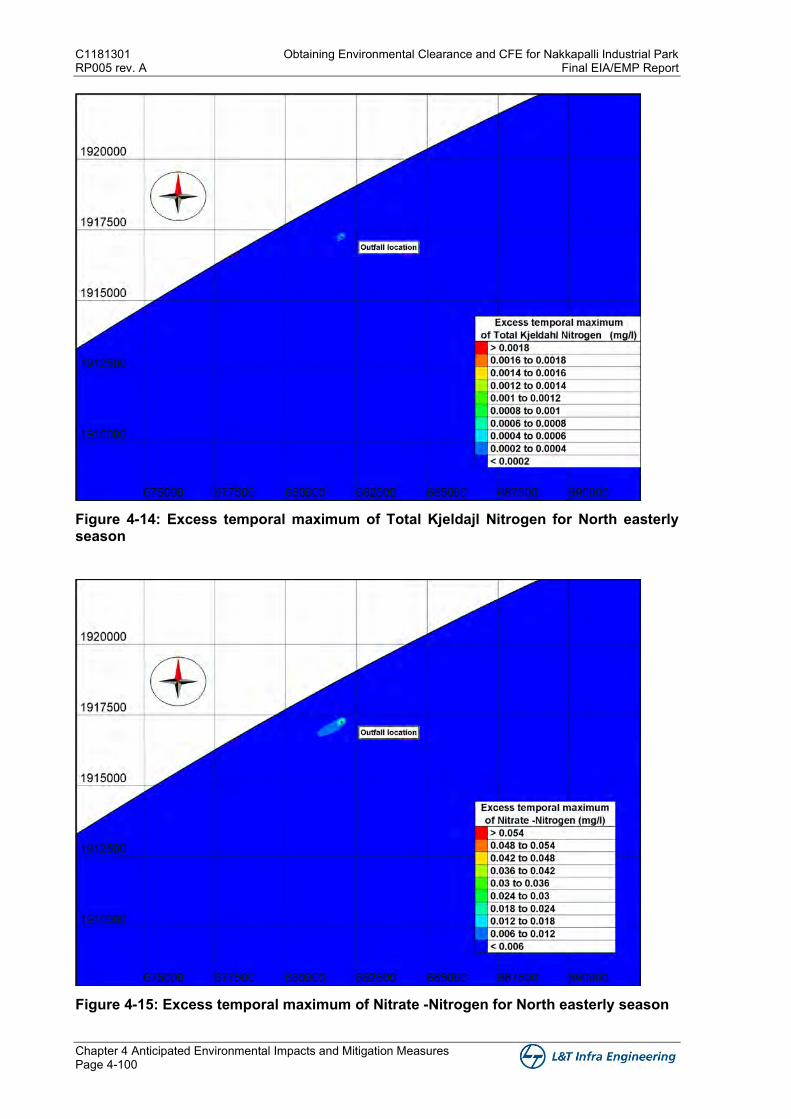
C1181301 Obtaining Environmental Clearance and CFE for Nakkapalli Industrial Park RP005 rev. A Final EIA/EMP Report
Chapter 4 Anticipated Environmental Impacts and Mitigation Measures Page 4-100
Figure 4-14: Excess temporal maximum of Total Kjeldajl Nitrogen for North easterly season
Figure 4-15: Excess temporal maximum of Nitrate -Nitrogen for North easterly season
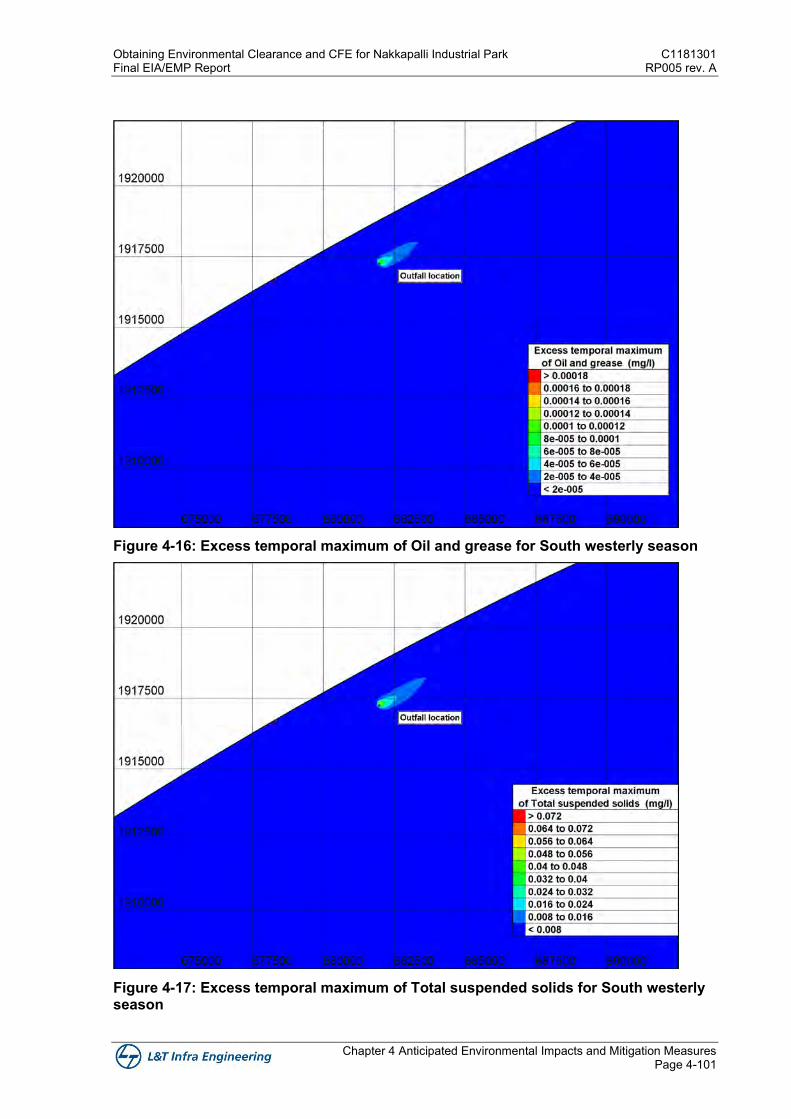
Obtaining Environmental Clearance and CFE for Nakkapalli Industrial Park C1181301 Final EIA/EMP Report RP005 rev. A
Chapter 4 Anticipated Environmental Impacts and Mitigation Measures Page 4-101
Figure 4-16: Excess temporal maximum of Oil and grease for South westerly season
Figure 4-17: Excess temporal maximum of Total suspended solids for South westerly season
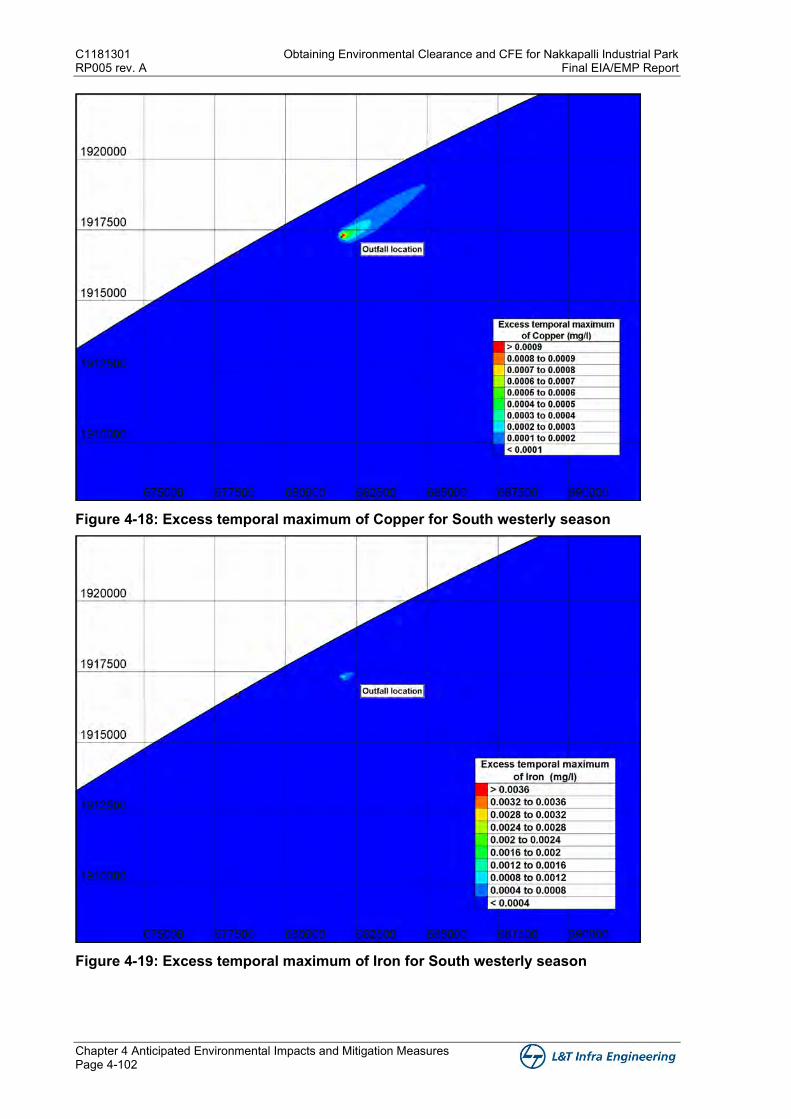
C1181301 Obtaining Environmental Clearance and CFE for Nakkapalli Industrial Park RP005 rev. A Final EIA/EMP Report
Chapter 4 Anticipated Environmental Impacts and Mitigation Measures Page 4-102
Figure 4-18: Excess temporal maximum of Copper for South westerly season
Figure 4-19: Excess temporal maximum of Iron for South westerly season
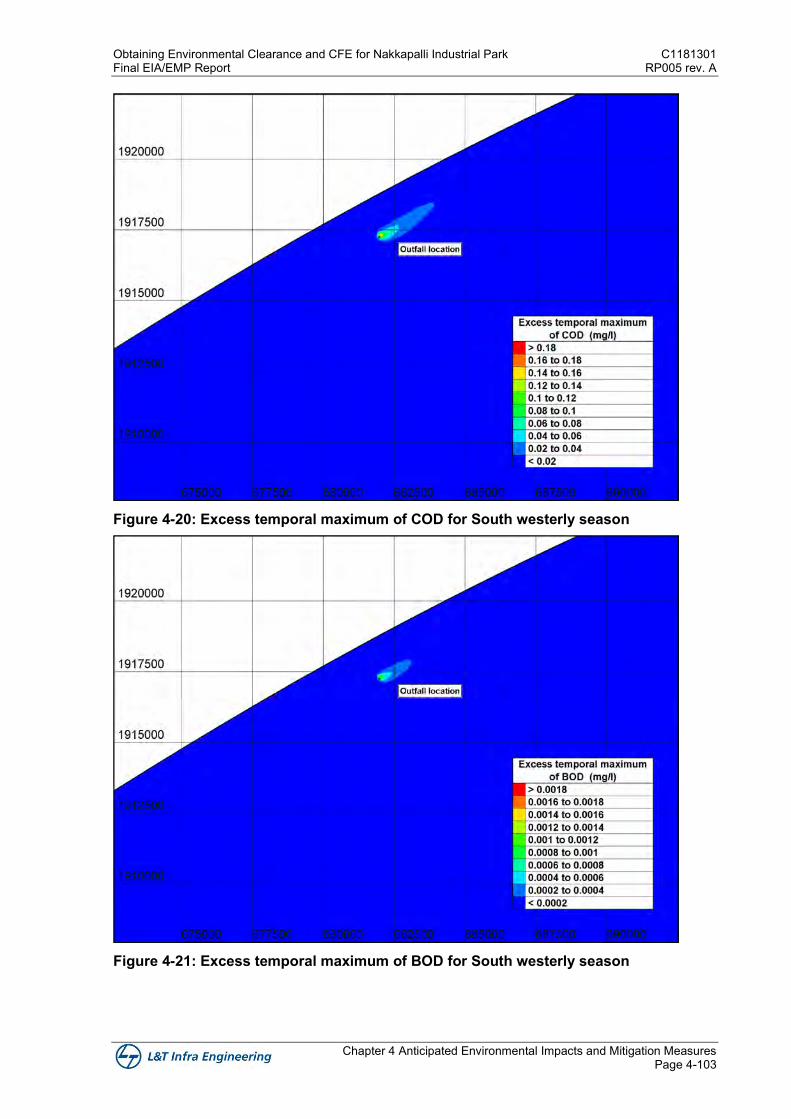
Obtaining Environmental Clearance and CFE for Nakkapalli Industrial Park C1181301 Final EIA/EMP Report RP005 rev. A
Chapter 4 Anticipated Environmental Impacts and Mitigation Measures Page 4-103
Figure 4-20: Excess temporal maximum of COD for South westerly season
Figure 4-21: Excess temporal maximum of BOD for South westerly season
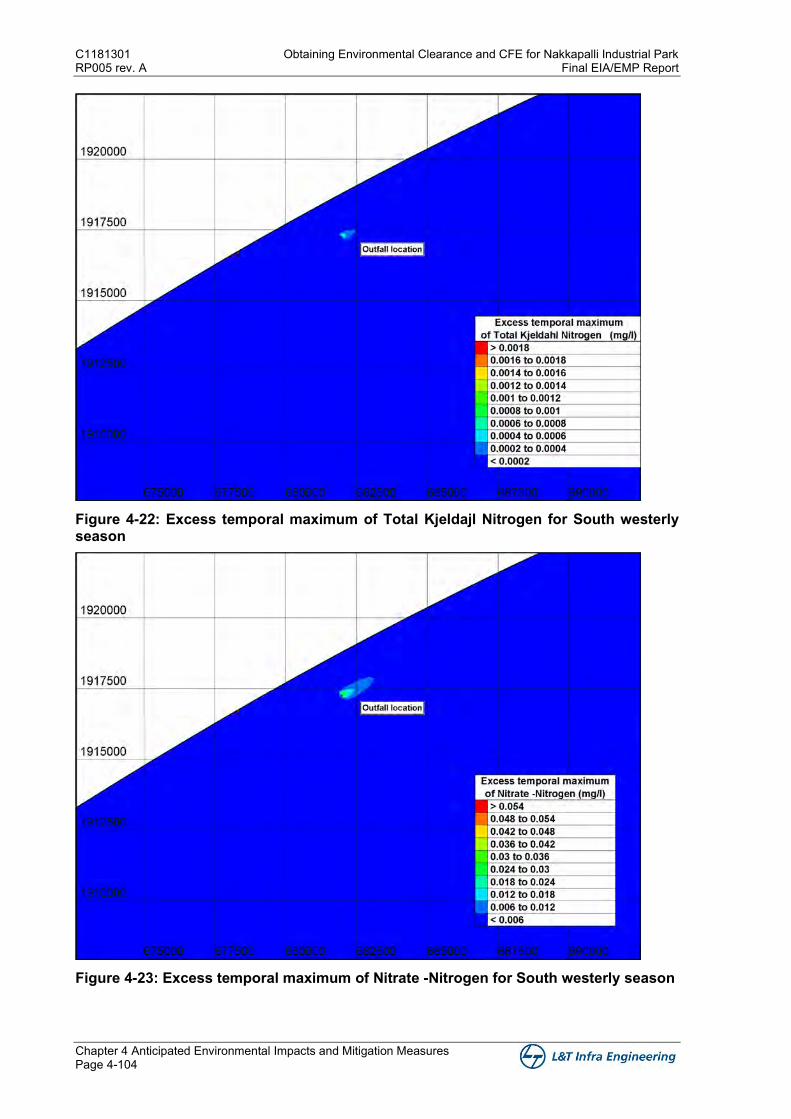
C1181301 Obtaining Environmental Clearance and CFE for Nakkapalli Industrial Park RP005 rev. A Final EIA/EMP Report
Chapter 4 Anticipated Environmental Impacts and Mitigation Measures Page 4-104
Figure 4-22: Excess temporal maximum of Total Kjeldajl Nitrogen for South westerly season
Figure 4-23: Excess temporal maximum of Nitrate -Nitrogen for South westerly season
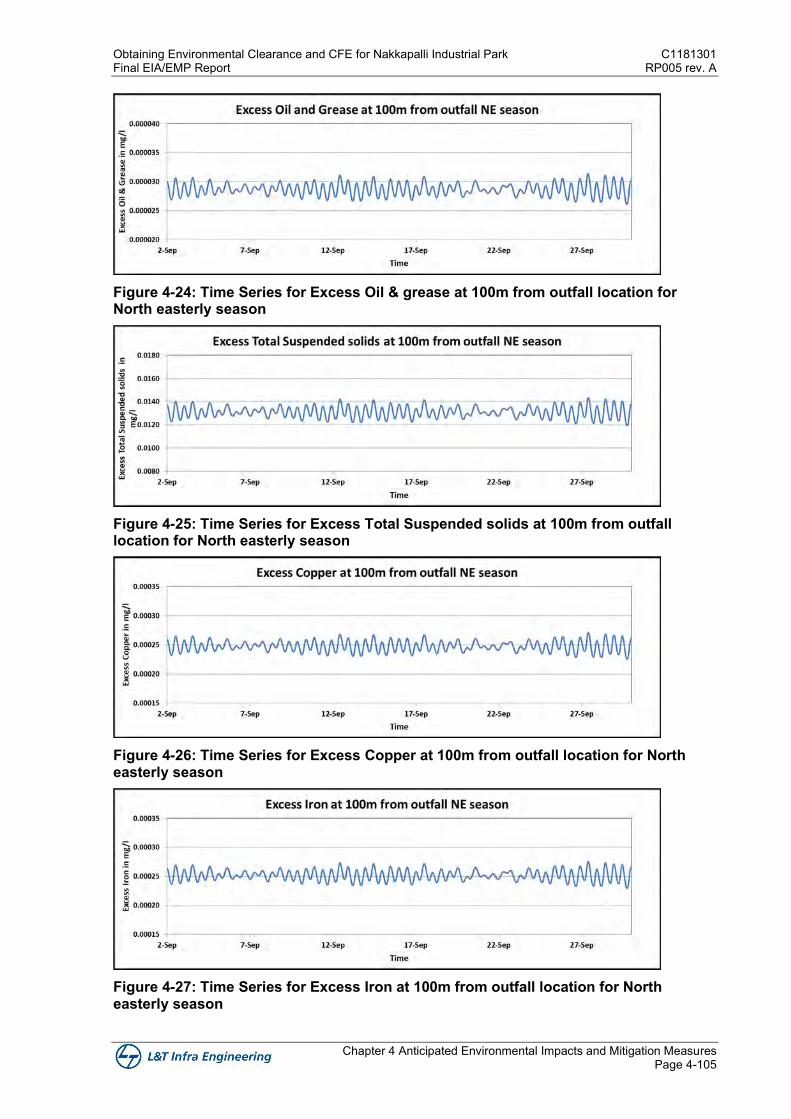
Obtaining Environmental Clearance and CFE for Nakkapalli Industrial Park C1181301 Final EIA/EMP Report RP005 rev. A
Chapter 4 Anticipated Environmental Impacts and Mitigation Measures Page 4-105
Figure 4-24: Time Series for Excess Oil & grease at 100m from outfall location for North easterly season
Figure 4-25: Time Series for Excess Total Suspended solids at 100m from outfall location for North easterly season
Figure 4-26: Time Series for Excess Copper at 100m from outfall location for North easterly season
Figure 4-27: Time Series for Excess Iron at 100m from outfall location for North easterly season
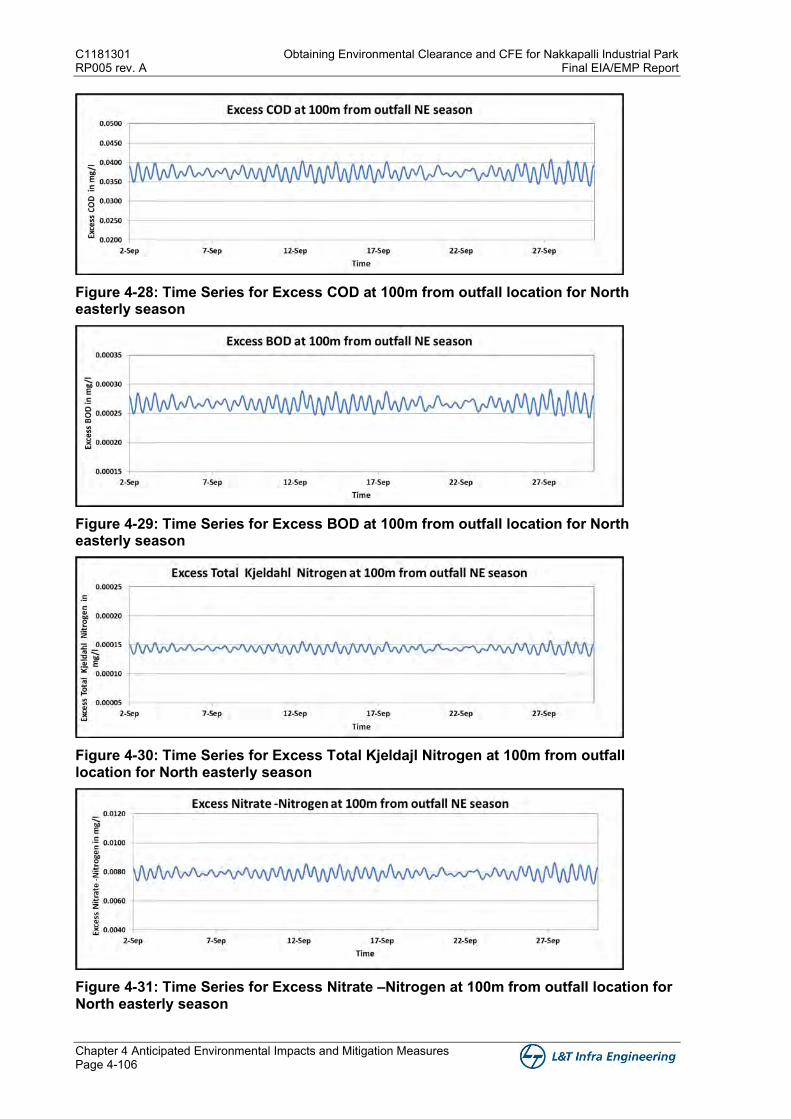
C1181301 Obtaining Environmental Clearance and CFE for Nakkapalli Industrial Park RP005 rev. A Final EIA/EMP Report
Chapter 4 Anticipated Environmental Impacts and Mitigation Measures Page 4-106
Figure 4-28: Time Series for Excess COD at 100m from outfall location for North easterly season
Figure 4-29: Time Series for Excess BOD at 100m from outfall location for North easterly season
Figure 4-30: Time Series for Excess Total Kjeldajl Nitrogen at 100m from outfall location for North easterly season
Figure 4-31: Time Series for Excess Nitrate –Nitrogen at 100m from outfall location for North easterly season
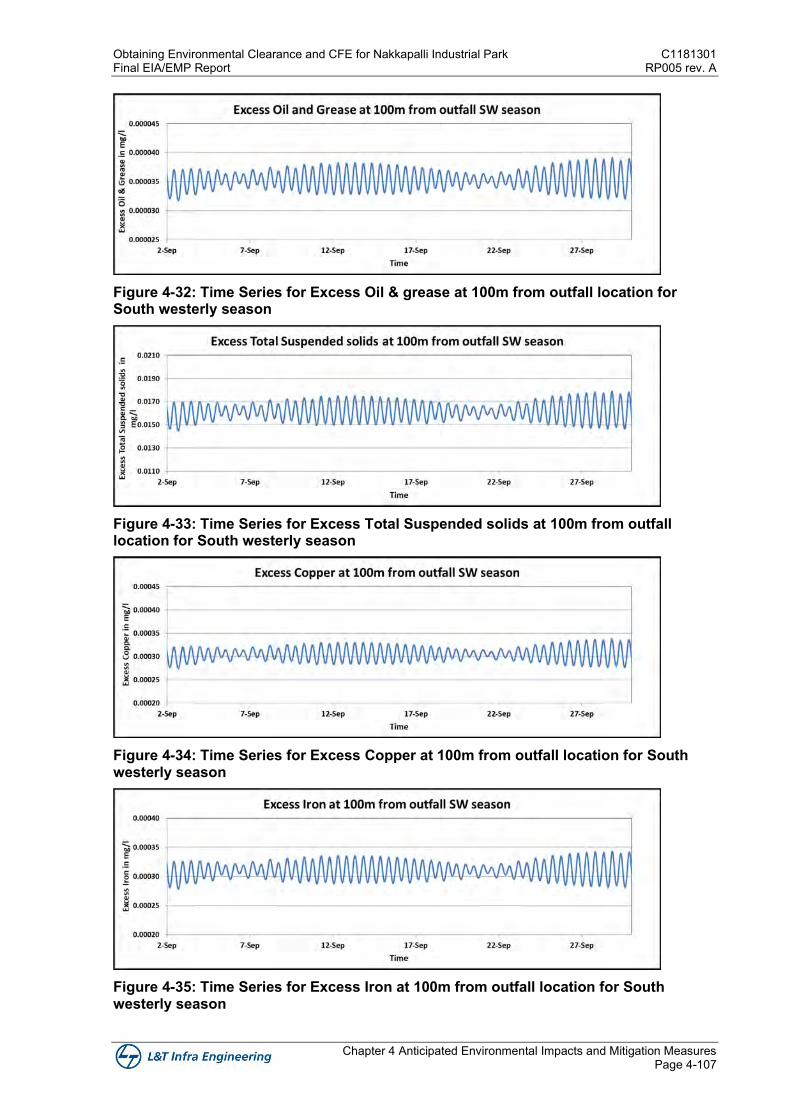
Obtaining Environmental Clearance and CFE for Nakkapalli Industrial Park C1181301 Final EIA/EMP Report RP005 rev. A
Chapter 4 Anticipated Environmental Impacts and Mitigation Measures Page 4-107
Figure 4-32: Time Series for Excess Oil & grease at 100m from outfall location for South westerly season
Figure 4-33: Time Series for Excess Total Suspended solids at 100m from outfall location for South westerly season
Figure 4-34: Time Series for Excess Copper at 100m from outfall location for South westerly season
Figure 4-35: Time Series for Excess Iron at 100m from outfall location for South westerly season
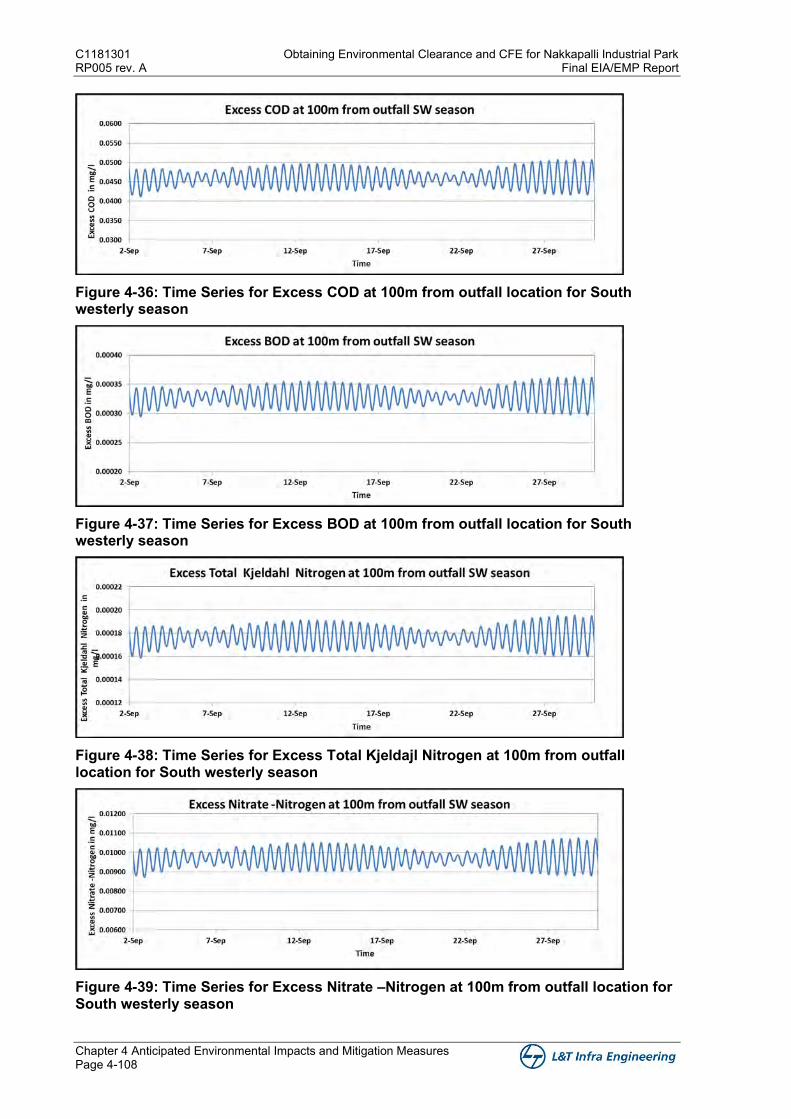
C1181301 Obtaining Environmental Clearance and CFE for Nakkapalli Industrial Park RP005 rev. A Final EIA/EMP Report
Chapter 4 Anticipated Environmental Impacts and Mitigation Measures Page 4-108
Figure 4-36: Time Series for Excess COD at 100m from outfall location for South westerly season
Figure 4-37: Time Series for Excess BOD at 100m from outfall location for South westerly season
Figure 4-38: Time Series for Excess Total Kjeldajl Nitrogen at 100m from outfall location for South westerly season
Figure 4-39: Time Series for Excess Nitrate –Nitrogen at 100m from outfall location for South westerly season
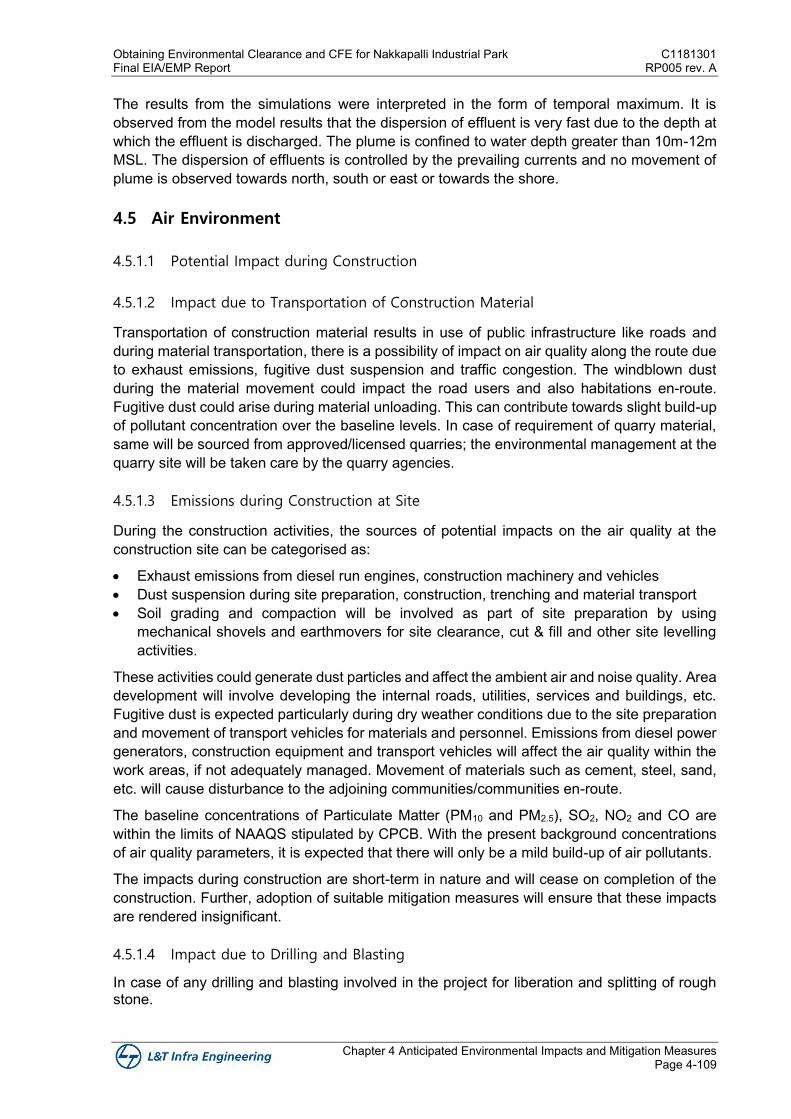
Obtaining Environmental Clearance and CFE for Nakkapalli Industrial Park C1181301 Final EIA/EMP Report RP005 rev. A
Chapter 4 Anticipated Environmental Impacts and Mitigation Measures Page 4-109
The results from the simulations were interpreted in the form of temporal maximum. It is observed from the model results that the dispersion of effluent is very fast due to the depth at which the effluent is discharged. The plume is confined to water depth greater than 10m-12m MSL. The dispersion of effluents is controlled by the prevailing currents and no movement of plume is observed towards north, south or east or towards the shore.
4.5 Air Environment
4.5.1.1 Potential Impact during Construction
4.5.1.2 Impact due to Transportation of Construction Material
Transportation of construction material results in use of public infrastructure like roads and during material transportation, there is a possibility of impact on air quality along the route due to exhaust emissions, fugitive dust suspension and traffic congestion. The windblown dust during the material movement could impact the road users and also habitations en-route. Fugitive dust could arise during material unloading. This can contribute towards slight build-up of pollutant concentration over the baseline levels. In case of requirement of quarry material, same will be sourced from approved/licensed quarries; the environmental management at the quarry site will be taken care by the quarry agencies.
4.5.1.3 Emissions during Construction at Site
During the construction activities, the sources of potential impacts on the air quality at the construction site can be categorised as:
• Exhaust emissions from diesel run engines, construction machinery and vehicles • Dust suspension during site preparation, construction, trenching and material transport • Soil grading and compaction will be involved as part of site preparation by using
mechanical shovels and earthmovers for site clearance, cut & fill and other site levelling activities.
These activities could generate dust particles and affect the ambient air and noise quality. Area development will involve developing the internal roads, utilities, services and buildings, etc. Fugitive dust is expected particularly during dry weather conditions due to the site preparation and movement of transport vehicles for materials and personnel. Emissions from diesel power generators, construction equipment and transport vehicles will affect the air quality within the work areas, if not adequately managed. Movement of materials such as cement, steel, sand, etc. will cause disturbance to the adjoining communities/communities en-route.
The baseline concentrations of Particulate Matter (PM10 and PM2.5), SO2, NO2 and CO are within the limits of NAAQS stipulated by CPCB. With the present background concentrations of air quality parameters, it is expected that there will only be a mild build-up of air pollutants.
The impacts during construction are short-term in nature and will cease on completion of the construction. Further, adoption of suitable mitigation measures will ensure that these impacts are rendered insignificant.
4.5.1.4 Impact due to Drilling and Blasting
In case of any drilling and blasting involved in the project for liberation and splitting of rough stone.
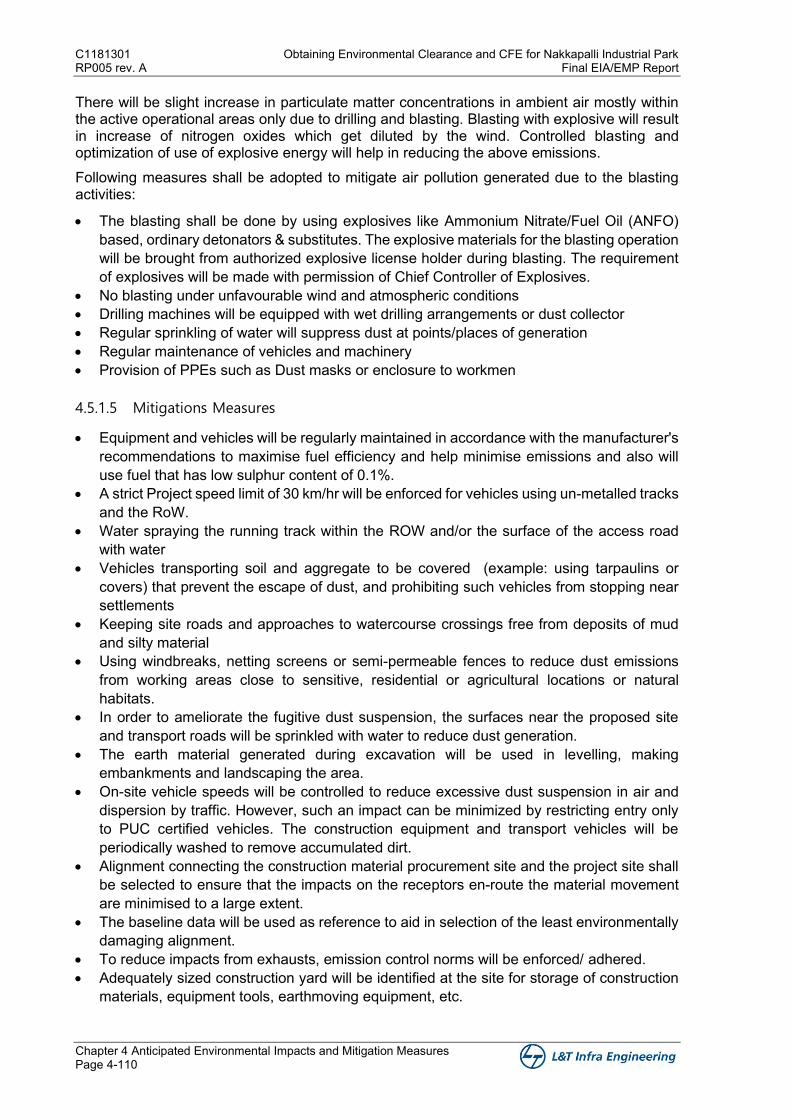
C1181301 Obtaining Environmental Clearance and CFE for Nakkapalli Industrial Park RP005 rev. A Final EIA/EMP Report
Chapter 4 Anticipated Environmental Impacts and Mitigation Measures Page 4-110
There will be slight increase in particulate matter concentrations in ambient air mostly within the active operational areas only due to drilling and blasting. Blasting with explosive will result in increase of nitrogen oxides which get diluted by the wind. Controlled blasting and optimization of use of explosive energy will help in reducing the above emissions. Following measures shall be adopted to mitigate air pollution generated due to the blasting activities:
• The blasting shall be done by using explosives like Ammonium Nitrate/Fuel Oil (ANFO) based, ordinary detonators & substitutes. The explosive materials for the blasting operation will be brought from authorized explosive license holder during blasting. The requirement of explosives will be made with permission of Chief Controller of Explosives.
• No blasting under unfavourable wind and atmospheric conditions • Drilling machines will be equipped with wet drilling arrangements or dust collector • Regular sprinkling of water will suppress dust at points/places of generation • Regular maintenance of vehicles and machinery • Provision of PPEs such as Dust masks or enclosure to workmen
4.5.1.5 Mitigations Measures
• Equipment and vehicles will be regularly maintained in accordance with the manufacturer's recommendations to maximise fuel efficiency and help minimise emissions and also will use fuel that has low sulphur content of 0.1%.
• A strict Project speed limit of 30 km/hr will be enforced for vehicles using un-metalled tracks and the RoW.
• Water spraying the running track within the ROW and/or the surface of the access road with water
• Vehicles transporting soil and aggregate to be covered (example: using tarpaulins or covers) that prevent the escape of dust, and prohibiting such vehicles from stopping near settlements
• Keeping site roads and approaches to watercourse crossings free from deposits of mud and silty material
• Using windbreaks, netting screens or semi-permeable fences to reduce dust emissions from working areas close to sensitive, residential or agricultural locations or natural habitats.
• In order to ameliorate the fugitive dust suspension, the surfaces near the proposed site and transport roads will be sprinkled with water to reduce dust generation.
• The earth material generated during excavation will be used in levelling, making embankments and landscaping the area.
• On-site vehicle speeds will be controlled to reduce excessive dust suspension in air and dispersion by traffic. However, such an impact can be minimized by restricting entry only to PUC certified vehicles. The construction equipment and transport vehicles will be periodically washed to remove accumulated dirt.
• Alignment connecting the construction material procurement site and the project site shall be selected to ensure that the impacts on the receptors en-route the material movement are minimised to a large extent.
• The baseline data will be used as reference to aid in selection of the least environmentally damaging alignment.
• To reduce impacts from exhausts, emission control norms will be enforced/ adhered. • Adequately sized construction yard will be identified at the site for storage of construction
materials, equipment tools, earthmoving equipment, etc.
Obtaining Environmental Clearance and CFE for Nakkapalli Industrial Park C1181301 Final EIA/EMP Report RP005 rev. A
Chapter 4 Anticipated Environmental Impacts and Mitigation Measures Page 4-111
• Fuel tanks adequately designed to minimize fugitive emissions and welding gas cylinders will be stored in a secluded area within project site.
• Welding personnel will be properly trained and will wear necessary Personal Protection Equipment
4.5.2 Potential Impact due to Operation
The impact on air environment due to the operation of Nakkapalli IP has been predicted based on air quality modelling studies. The AAQ model studies were carried out covering the following:
• Point sources of the Member industries’ Plots proposed in Nakkapalli IP • • DG sets of the member industrial plots as well as common areas like commercial plots,
utilities and amenities, residential etc. • Line sources i.e., increased vehicular activity due to normal and generated traffic on NH16,
existing road connecting to NH16 and Greenfield road from project site being developed by APRDC.
4.5.2.1 Sources of Emission considered for Air Quality Modelling
Following sources of emission are identified as a part of proposed development of Nakkapalli IP and considered in the air quality modelling study.
4.5.2.1.1 Nakkapalli IP’s Point Sources
As per the recommended Terms of Reference (ToR), following are the industrial activities/sectors proposed as a part of development within distances of 50m-250m, 250-500m and beyond 500m from settlements:
Industries proposed within 50m-250m from settlement (Orange,
Green and White category)
Industries proposed within 250m-500m from settlement (Red
category)
Industries proposed within Beyond 500m from settlement (Red
category)
• Industrial and consumer Electronics
• Auto components
• Aero space and defence R&D
• MSME (Leather Products such as Sports goods excluding tanning and hide processing Plastic products for Packaging automobile, consumer durables healthcare by injection, low Moulding, Extrusion, Timber/Wood Products such as Furniture, Sports goods, Wood Flooring)
• Engineering (light and heavy engineering)
• Building Materials industry/Non-Metallic minerals (processed minerals, Clay building products bricks, AAC Blocks, Kerbs Stones)
• Food and Agro Processing industry
• Automobile manufacturing
• Aerospace and defense
• Pharmaceuticals
• Chemical
• Petrochemical
• Tiles, Ceramics and refractories glass and glassware, graphite, marbles
In zone of 50 to 250 m from settlements, Green & White category industries of the other than sectors mentioned above such as Engineering (cold rolling, dry mechanical process, fabrication without heat treatment etc., ), Textile and Apparel (power looms, hand loom, spinning and weaving etc.,), Building Materials (cutting, sizing and polishing of marble stones etc.,) and Food Processing (Bakery, Confectionary, candy, flour/rice mill etc., ) is also considered. The zoning plan based on the above categorization of distance from settlement used for Air Quality Modelling is presented as Figure 4-40.
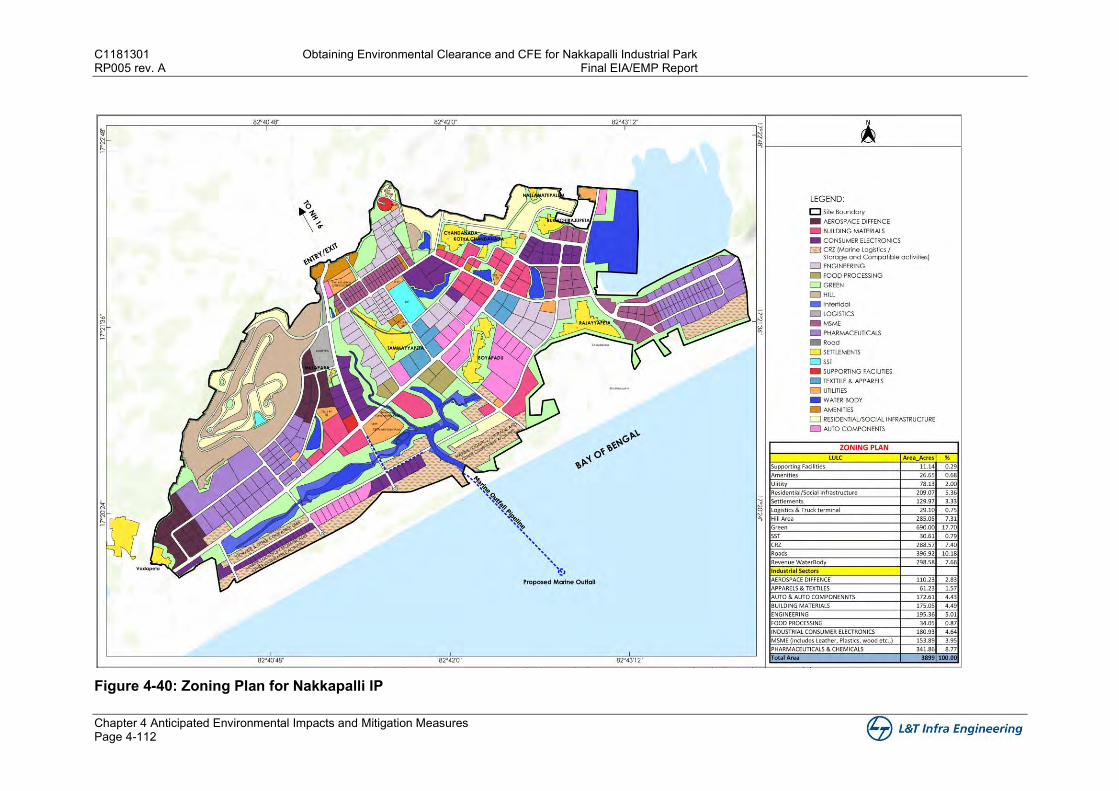
C1181301 Obtaining Environmental Clearance and CFE for Nakkapalli Industrial Park RP005 rev. A Final EIA/EMP Report
Chapter 4 Anticipated Environmental Impacts and Mitigation Measures Page 4-112
Figure 4-40: Zoning Plan for Nakkapalli IP
Obtaining Environmental Clearance and CFE for Nakkapalli Industrial Park C1181301 Final EIA/EMP Report RP005 rev. A
Chapter 4 Anticipated Environmental Impacts and Mitigation Measures Page 4-113
The following assumptions were made while estimating process emissions from proposed individual/member units of Nakkapalli IP:
• The Master Plan of Nakkapalli IP consists of industrial plots of varying dimensions to accommodate small scale, Medium and major industries for different sectors. In general most of the small & medium scale industries will have minimal emissions compare to Major Industries. Considering the same as well as to minimise the number of small/medium scale industries emission sources, small and medium sized plots were combined and represented as a single emission source for Air Quality modelling purpose based on zoning and type of industries.
• Emissions of individual industrial units of the above proposed sectors were estimated based on its products by referring similar type of industry’s emission with Air Pollution Control (APC) Measures, the land area occupied by them through available secondary data and Consultant’s experience. Emissions estimated from the similar type of industrial units are transferred in terms of Emission per acre and used for emission estimations of the proposed plots as given in the Master Plan.
• The reference existing operating industries are using coal or Husk as fuel for the boilers in their plants.
• Emissions are anticipated from orange category, red category and pharma, chemical, petrochemical etc., industries.
Some of the anticipated types of industries/activities or focus products for the proposed industrial categories along with the sources of emissions are presented below.
4.5.2.2 Orange Category (50m-250m from settlement)
Most of the industries related to Microelectronics, Automobile Ancillary and Aero & Defence Strategic will fall under Focus Engineering Industrial Sector. The facilities in this kind of industrial sector can be considered of a series of unit process such as Melting and die casting, Cutting, Shearing, Forming, Welding and soldering, Heat treatment, Forging, Dressing/grinding, Machining, Non-destructive testing, Surface preparation and surface coating etc.
The types of industries are Engineering and fabrication units (dry process without any heat treatment / metal surface finishing operations / painting); Ferrous and Non - ferrous metal extraction involving different furnaces through melting, refining, re-processing, casting and alloy making; Forging of ferrous and non-ferrous metals (using oil and gas fired furnaces); Industry or processes involving foundry operations; Rolling mill (oil or coal fired) and cold rolling mill; Spray painting, paint baking, paint shipping; Steel and steel products using various furnaces like blast furnace /open hearth furnace/induction furnace/arc furnace/submerged arc furnace /basic oxygen furnace /hot rolling reheated furnace; Rolling mill (gas fired) and cold rolling mill; Industry or process involving metal surface treatment or process such as pickling/ electroplating/paint stripping/ heat treatment using cyanide bath/ phosphating or finishing and anodizing / enamellings/ galvanizing; Electric and electronic item assembling (completely dry process).
4.5.2.2.1 MSME
Leather: The greenhouse gases most likely to be released during the shoes’ assembly are CO2, CH4, NO2, whose releases are related to energy consumption and fossil combustion. The footwear industry may contribute to the formation of troposphere O3 by the use of organic
C1181301 Obtaining Environmental Clearance and CFE for Nakkapalli Industrial Park RP005 rev. A Final EIA/EMP Report
Chapter 4 Anticipated Environmental Impacts and Mitigation Measures Page 4-114
solvent-based products (mainly adhesives). These products lead to the release of Volatile Organic Compounds (VOCs), which are subject to form the troposphere O3.
Plastics: The polymer is generally used to manufacture various plastic products. Polymers account for around 70% of petrochemicals. The major by-products of polymers are Polystyrene, PVC, Polypropylene, LDPE/ LLDPE, and HDPE. Polypropylene is a very lightweight polymer and that is the main reason why it is used as a substitute for various other polymers. Low-density polyethylene (LDPE) and linear low-density polyethylene (LLDPE) are also widely used polymers.
Emissions from plastic products manufacturing may be generally classified as follows
• Volatile organic compound (VOC) and hazardous air pollutant (HAP) emissions resulting from the volatilization of free monomer or solvent in the primary polymer blend during processing;
• VOC and HAP emissions that result from secondary process materials, such as blowing agents, additives, and lubricants (mould release compounds);
• VOC, HAP, and particulate matter (PM) emissions that result from by-products formed by chemical reactions or formed during heating of resins; and
• PM emissions generated during raw material handling and finishing operations.
Wood: Emissions start with the felling of the tree and the petroleum-fuel-powered equipment used to harvest and transport logs to the mill. Slash burning, where still practiced, emits PM. Dust can be produced as the wood is sawn, cut, or broken down into products or when pneumatic conveyance is used. VOCs may also be released while the wood is green, for example in chip piles or on conveyors.
Processes in which wood is heated result in more significant emissions. The energy for these processes often comes from wood-fired boilers that can produce CO, CO2, NOx, and PM. Mills that have either installed or switched to gas-fired boilers reduce the total emissions from their facility. Dryers are an important source of VOC emissions because compounds present in the wood are given off with the water. Most notable in softwoods are α and β-pinene. The high temperatures that destroy VOCs in RTOs cause NOx emissions. NOx compounds have the potential to increase ozone levels.
Materials used to glue, coat, and finish wood may also contribute to the emissions from a facility. The most well-known example is formaldehyde from the pressing of panels containing urea or phenol-formaldehyde resins.
For Orange category of industries, emissions are estimated by considering the 90% of similar type of Red category industry’s emissions.
For example, if a Red category automobile industry is emitting 100 g/s of PM10 in 10 acres of land, then Orange category of automobile industry is estimated to produce 90 g/s of PM10 in 10 acres of land.
The estimated emission details from process point sources from the Orange category of industries are given in Table 4-3. Table 4-3: Orange category Point Sources Emission Details
Stack ID
Stack Height
(m)
Stack Velocity
(m/s)
Stack Dia. (m)
Exit Temp K
Unit Area Acres
Type of Industry
PM10 PM2.5 SO2 NO2
O1 30 9.50 0.6 387.40 22.23 Aerospace and
Defense 0.0694 0.0278 0.0204 0.0438
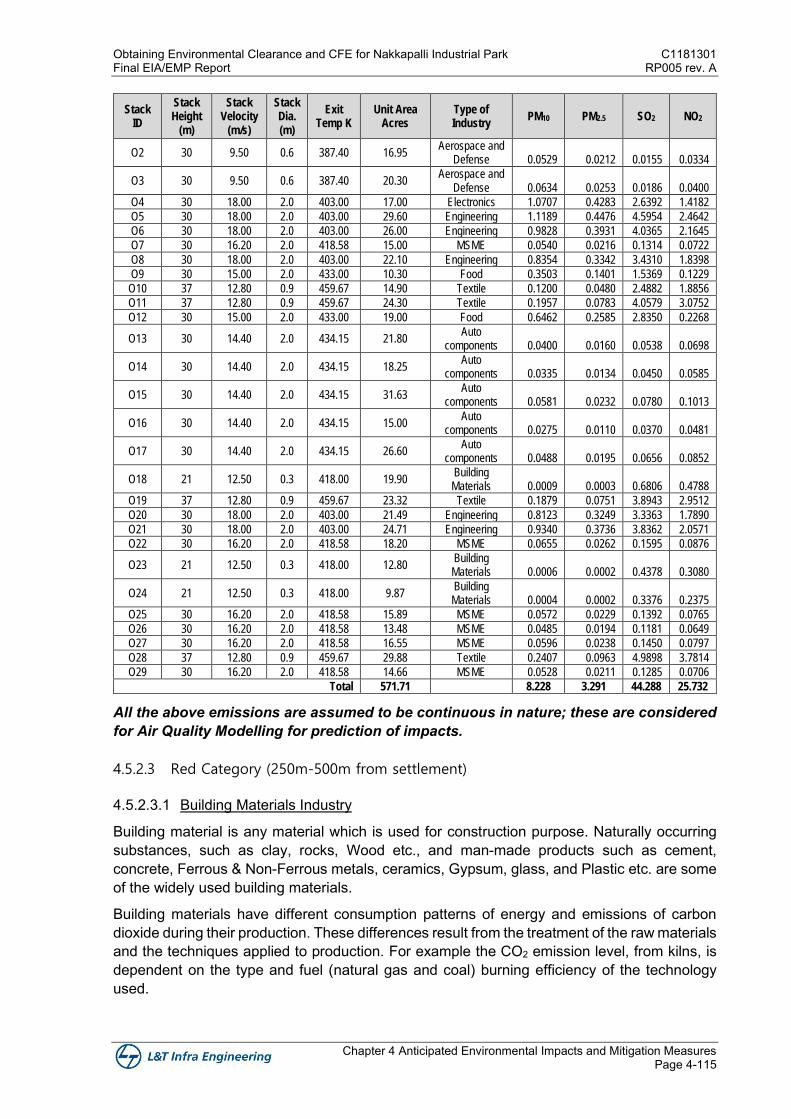
Obtaining Environmental Clearance and CFE for Nakkapalli Industrial Park C1181301 Final EIA/EMP Report RP005 rev. A
Chapter 4 Anticipated Environmental Impacts and Mitigation Measures Page 4-115
Stack ID
Stack Height
(m)
Stack Velocity
(m/s)
Stack Dia. (m)
Exit Temp K
Unit Area Acres
Type of Industry
PM10 PM2.5 SO2 NO2
O2 30 9.50 0.6 387.40 16.95 Aerospace and
Defense 0.0529 0.0212 0.0155 0.0334
O3 30 9.50 0.6 387.40 20.30 Aerospace and
Defense 0.0634 0.0253 0.0186 0.0400
O4 30 18.00 2.0 403.00 17.00 Electronics 1.0707 0.4283 2.6392 1.4182
O5 30 18.00 2.0 403.00 29.60 Engineering 1.1189 0.4476 4.5954 2.4642
O6 30 18.00 2.0 403.00 26.00 Engineering 0.9828 0.3931 4.0365 2.1645
O7 30 16.20 2.0 418.58 15.00 MSME 0.0540 0.0216 0.1314 0.0722
O8 30 18.00 2.0 403.00 22.10 Engineering 0.8354 0.3342 3.4310 1.8398
O9 30 15.00 2.0 433.00 10.30 Food 0.3503 0.1401 1.5369 0.1229
O10 37 12.80 0.9 459.67 14.90 Textile 0.1200 0.0480 2.4882 1.8856
O11 37 12.80 0.9 459.67 24.30 Textile 0.1957 0.0783 4.0579 3.0752
O12 30 15.00 2.0 433.00 19.00 Food 0.6462 0.2585 2.8350 0.2268
O13 30 14.40 2.0 434.15 21.80 Auto
components 0.0400 0.0160 0.0538 0.0698
O14 30 14.40 2.0 434.15 18.25 Auto
components 0.0335 0.0134 0.0450 0.0585
O15 30 14.40 2.0 434.15 31.63 Auto
components 0.0581 0.0232 0.0780 0.1013
O16 30 14.40 2.0 434.15 15.00 Auto
components 0.0275 0.0110 0.0370 0.0481
O17 30 14.40 2.0 434.15 26.60 Auto
components 0.0488 0.0195 0.0656 0.0852
O18 21 12.50 0.3 418.00 19.90 Building Materials 0.0009 0.0003 0.6806 0.4788
O19 37 12.80 0.9 459.67 23.32 Textile 0.1879 0.0751 3.8943 2.9512
O20 30 18.00 2.0 403.00 21.49 Engineering 0.8123 0.3249 3.3363 1.7890
O21 30 18.00 2.0 403.00 24.71 Engineering 0.9340 0.3736 3.8362 2.0571
O22 30 16.20 2.0 418.58 18.20 MSME 0.0655 0.0262 0.1595 0.0876
O23 21 12.50 0.3 418.00 12.80 Building Materials 0.0006 0.0002 0.4378 0.3080
O24 21 12.50 0.3 418.00 9.87 Building Materials 0.0004 0.0002 0.3376 0.2375
O25 30 16.20 2.0 418.58 15.89 MSME 0.0572 0.0229 0.1392 0.0765
O26 30 16.20 2.0 418.58 13.48 MSME 0.0485 0.0194 0.1181 0.0649
O27 30 16.20 2.0 418.58 16.55 MSME 0.0596 0.0238 0.1450 0.0797
O28 37 12.80 0.9 459.67 29.88 Textile 0.2407 0.0963 4.9898 3.7814
O29 30 16.20 2.0 418.58 14.66 MSME 0.0528 0.0211 0.1285 0.0706
Total 571.71 8.228 3.291 44.288 25.732
All the above emissions are assumed to be continuous in nature; these are considered for Air Quality Modelling for prediction of impacts.
4.5.2.3 Red Category (250m-500m from settlement)
4.5.2.3.1 Building Materials Industry
Building material is any material which is used for construction purpose. Naturally occurring substances, such as clay, rocks, Wood etc., and man-made products such as cement, concrete, Ferrous & Non-Ferrous metals, ceramics, Gypsum, glass, and Plastic etc. are some of the widely used building materials.
Building materials have different consumption patterns of energy and emissions of carbon dioxide during their production. These differences result from the treatment of the raw materials and the techniques applied to production. For example the CO2 emission level, from kilns, is dependent on the type and fuel (natural gas and coal) burning efficiency of the technology used.
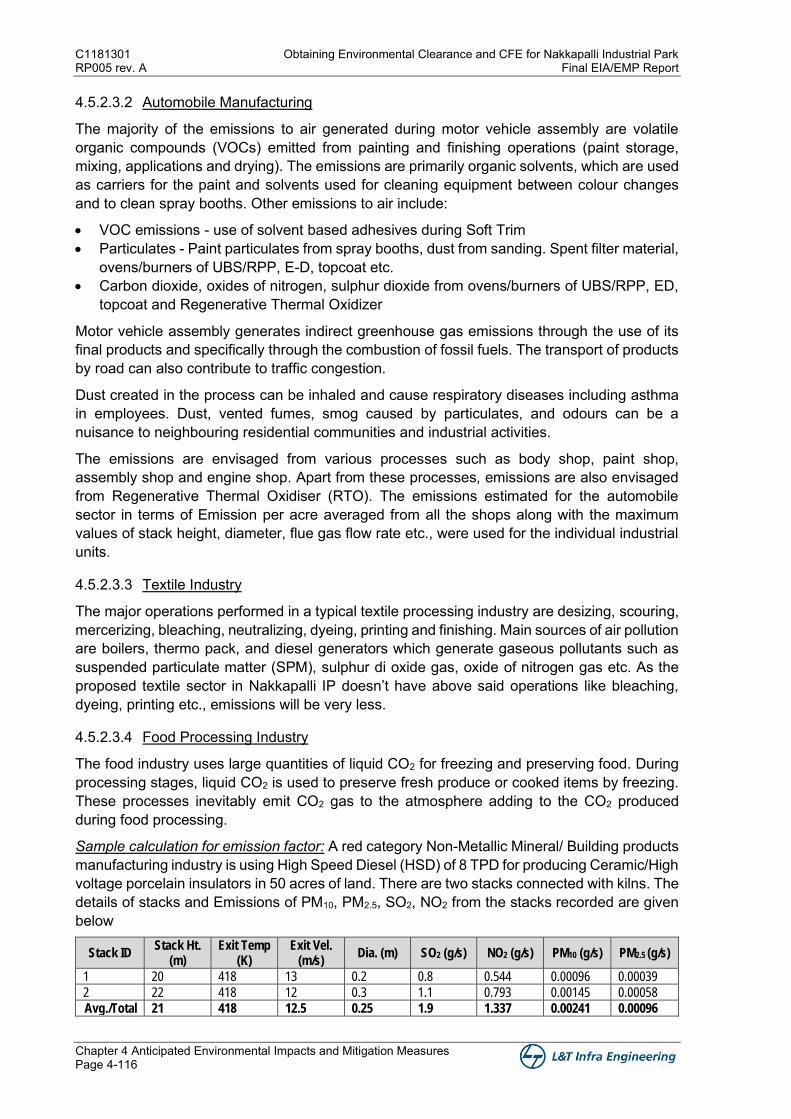
C1181301 Obtaining Environmental Clearance and CFE for Nakkapalli Industrial Park RP005 rev. A Final EIA/EMP Report
Chapter 4 Anticipated Environmental Impacts and Mitigation Measures Page 4-116
4.5.2.3.2 Automobile Manufacturing
The majority of the emissions to air generated during motor vehicle assembly are volatile organic compounds (VOCs) emitted from painting and finishing operations (paint storage, mixing, applications and drying). The emissions are primarily organic solvents, which are used as carriers for the paint and solvents used for cleaning equipment between colour changes and to clean spray booths. Other emissions to air include:
• VOC emissions - use of solvent based adhesives during Soft Trim • Particulates - Paint particulates from spray booths, dust from sanding. Spent filter material,
ovens/burners of UBS/RPP, E-D, topcoat etc. • Carbon dioxide, oxides of nitrogen, sulphur dioxide from ovens/burners of UBS/RPP, ED,
topcoat and Regenerative Thermal Oxidizer
Motor vehicle assembly generates indirect greenhouse gas emissions through the use of its final products and specifically through the combustion of fossil fuels. The transport of products by road can also contribute to traffic congestion.
Dust created in the process can be inhaled and cause respiratory diseases including asthma in employees. Dust, vented fumes, smog caused by particulates, and odours can be a nuisance to neighbouring residential communities and industrial activities.
The emissions are envisaged from various processes such as body shop, paint shop, assembly shop and engine shop. Apart from these processes, emissions are also envisaged from Regenerative Thermal Oxidiser (RTO). The emissions estimated for the automobile sector in terms of Emission per acre averaged from all the shops along with the maximum values of stack height, diameter, flue gas flow rate etc., were used for the individual industrial units.
4.5.2.3.3 Textile Industry
The major operations performed in a typical textile processing industry are desizing, scouring, mercerizing, bleaching, neutralizing, dyeing, printing and finishing. Main sources of air pollution are boilers, thermo pack, and diesel generators which generate gaseous pollutants such as suspended particulate matter (SPM), sulphur di oxide gas, oxide of nitrogen gas etc. As the proposed textile sector in Nakkapalli IP doesn’t have above said operations like bleaching, dyeing, printing etc., emissions will be very less.
4.5.2.3.4 Food Processing Industry
The food industry uses large quantities of liquid CO2 for freezing and preserving food. During processing stages, liquid CO2 is used to preserve fresh produce or cooked items by freezing. These processes inevitably emit CO2 gas to the atmosphere adding to the CO2 produced during food processing.
Sample calculation for emission factor: A red category Non-Metallic Mineral/ Building products manufacturing industry is using High Speed Diesel (HSD) of 8 TPD for producing Ceramic/High voltage porcelain insulators in 50 acres of land. There are two stacks connected with kilns. The details of stacks and Emissions of PM10, PM2.5, SO2, NO2 from the stacks recorded are given below
Stack ID Stack Ht.
(m) Exit Temp
(K) Exit Vel.
(m/s) Dia. (m) SO2 (g/s) NO2 (g/s) PM10 (g/s) PM2.5 (g/s)
1 20 418 13 0.2 0.8 0.544 0.00096 0.00039
2 22 418 12 0.3 1.1 0.793 0.00145 0.00058
Avg./Total 21 418 12.5 0.25 1.9 1.337 0.00241 0.00096
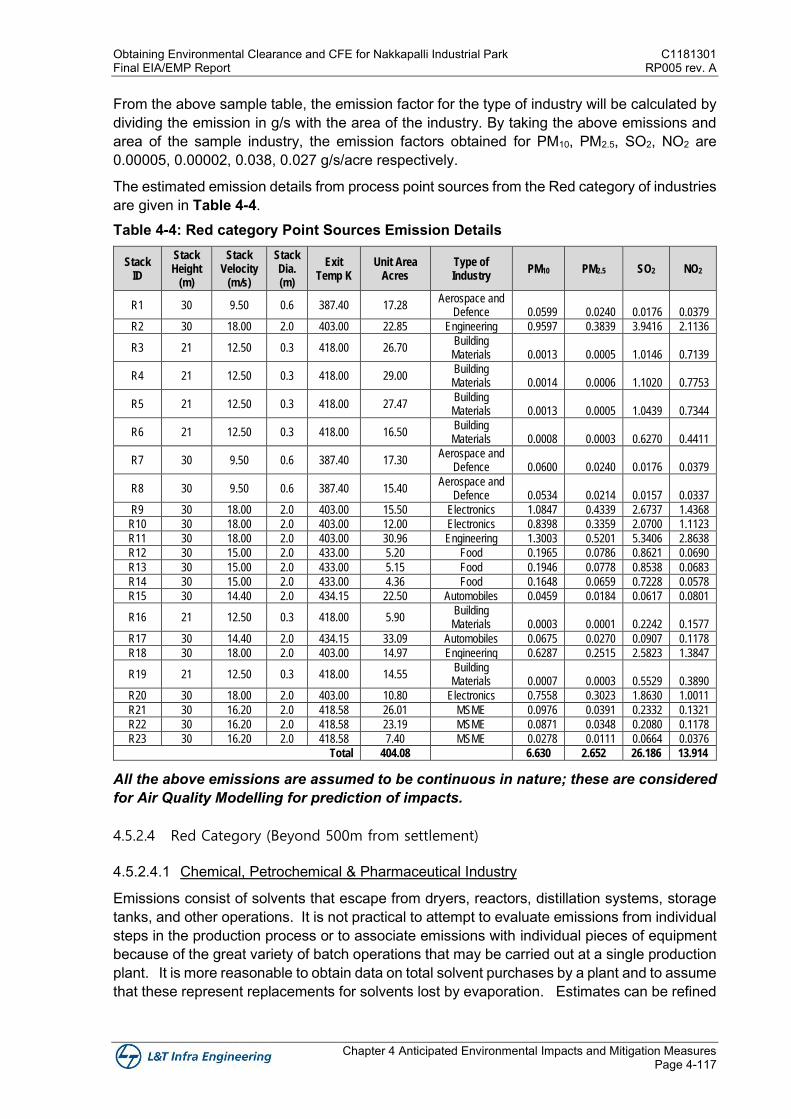
Obtaining Environmental Clearance and CFE for Nakkapalli Industrial Park C1181301 Final EIA/EMP Report RP005 rev. A
Chapter 4 Anticipated Environmental Impacts and Mitigation Measures Page 4-117
From the above sample table, the emission factor for the type of industry will be calculated by dividing the emission in g/s with the area of the industry. By taking the above emissions and area of the sample industry, the emission factors obtained for PM10, PM2.5, SO2, NO2 are 0.00005, 0.00002, 0.038, 0.027 g/s/acre respectively.
The estimated emission details from process point sources from the Red category of industries are given in Table 4-4. Table 4-4: Red category Point Sources Emission Details
Stack ID
Stack Height
(m)
Stack Velocity
(m/s)
Stack Dia. (m)
Exit Temp K
Unit Area Acres
Type of Industry
PM10 PM2.5 SO2 NO2
R1 30 9.50 0.6 387.40 17.28 Aerospace and
Defence 0.0599 0.0240 0.0176 0.0379
R2 30 18.00 2.0 403.00 22.85 Engineering 0.9597 0.3839 3.9416 2.1136
R3 21 12.50 0.3 418.00 26.70 Building Materials 0.0013 0.0005 1.0146 0.7139
R4 21 12.50 0.3 418.00 29.00 Building Materials 0.0014 0.0006 1.1020 0.7753
R5 21 12.50 0.3 418.00 27.47 Building Materials 0.0013 0.0005 1.0439 0.7344
R6 21 12.50 0.3 418.00 16.50 Building Materials 0.0008 0.0003 0.6270 0.4411
R7 30 9.50 0.6 387.40 17.30 Aerospace and
Defence 0.0600 0.0240 0.0176 0.0379
R8 30 9.50 0.6 387.40 15.40 Aerospace and
Defence 0.0534 0.0214 0.0157 0.0337
R9 30 18.00 2.0 403.00 15.50 Electronics 1.0847 0.4339 2.6737 1.4368
R10 30 18.00 2.0 403.00 12.00 Electronics 0.8398 0.3359 2.0700 1.1123
R11 30 18.00 2.0 403.00 30.96 Engineering 1.3003 0.5201 5.3406 2.8638
R12 30 15.00 2.0 433.00 5.20 Food 0.1965 0.0786 0.8621 0.0690
R13 30 15.00 2.0 433.00 5.15 Food 0.1946 0.0778 0.8538 0.0683
R14 30 15.00 2.0 433.00 4.36 Food 0.1648 0.0659 0.7228 0.0578
R15 30 14.40 2.0 434.15 22.50 Automobiles 0.0459 0.0184 0.0617 0.0801
R16 21 12.50 0.3 418.00 5.90 Building Materials 0.0003 0.0001 0.2242 0.1577
R17 30 14.40 2.0 434.15 33.09 Automobiles 0.0675 0.0270 0.0907 0.1178
R18 30 18.00 2.0 403.00 14.97 Engineering 0.6287 0.2515 2.5823 1.3847
R19 21 12.50 0.3 418.00 14.55 Building Materials 0.0007 0.0003 0.5529 0.3890
R20 30 18.00 2.0 403.00 10.80 Electronics 0.7558 0.3023 1.8630 1.0011
R21 30 16.20 2.0 418.58 26.01 MSME 0.0976 0.0391 0.2332 0.1321
R22 30 16.20 2.0 418.58 23.19 MSME 0.0871 0.0348 0.2080 0.1178
R23 30 16.20 2.0 418.58 7.40 MSME 0.0278 0.0111 0.0664 0.0376
Total 404.08 6.630 2.652 26.186 13.914
All the above emissions are assumed to be continuous in nature; these are considered for Air Quality Modelling for prediction of impacts.
4.5.2.4 Red Category (Beyond 500m from settlement)
4.5.2.4.1 Chemical, Petrochemical & Pharmaceutical Industry
Emissions consist of solvents that escape from dryers, reactors, distillation systems, storage tanks, and other operations. It is not practical to attempt to evaluate emissions from individual steps in the production process or to associate emissions with individual pieces of equipment because of the great variety of batch operations that may be carried out at a single production plant. It is more reasonable to obtain data on total solvent purchases by a plant and to assume that these represent replacements for solvents lost by evaporation. Estimates can be refined
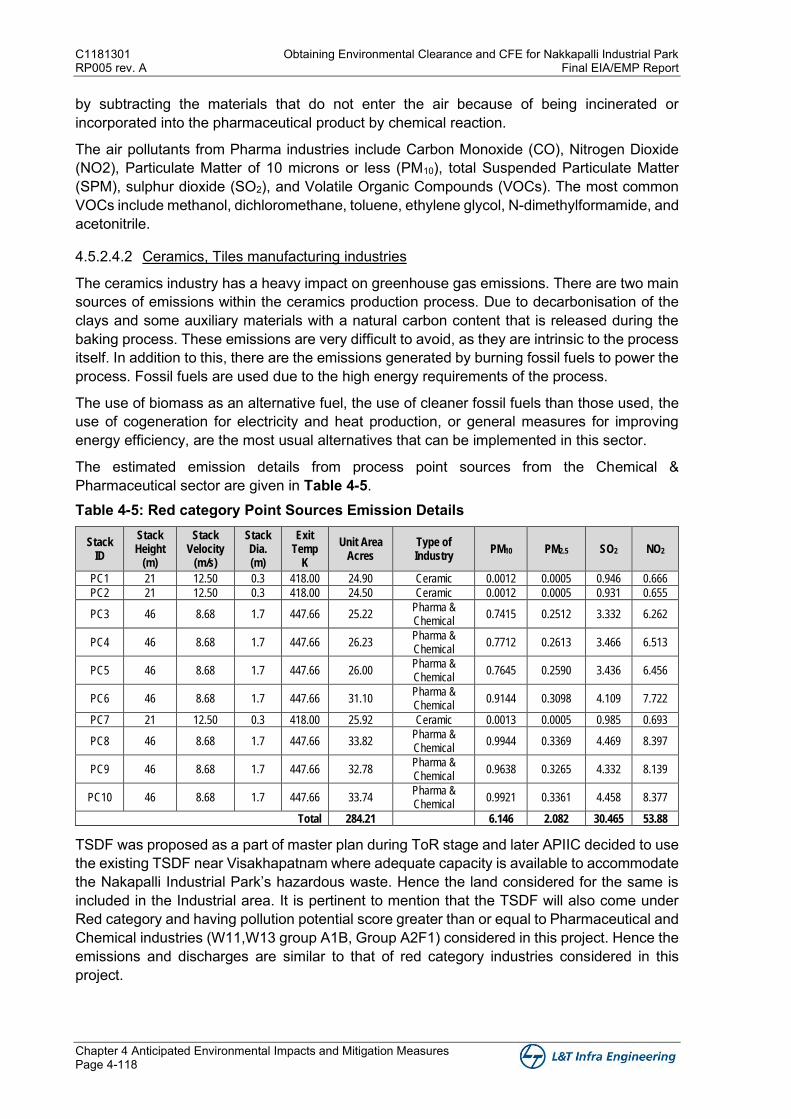
C1181301 Obtaining Environmental Clearance and CFE for Nakkapalli Industrial Park RP005 rev. A Final EIA/EMP Report
Chapter 4 Anticipated Environmental Impacts and Mitigation Measures Page 4-118
by subtracting the materials that do not enter the air because of being incinerated or incorporated into the pharmaceutical product by chemical reaction.
The air pollutants from Pharma industries include Carbon Monoxide (CO), Nitrogen Dioxide (NO2), Particulate Matter of 10 microns or less (PM10), total Suspended Particulate Matter (SPM), sulphur dioxide (SO2), and Volatile Organic Compounds (VOCs). The most common VOCs include methanol, dichloromethane, toluene, ethylene glycol, N-dimethylformamide, and acetonitrile.
4.5.2.4.2 Ceramics, Tiles manufacturing industries
The ceramics industry has a heavy impact on greenhouse gas emissions. There are two main sources of emissions within the ceramics production process. Due to decarbonisation of the clays and some auxiliary materials with a natural carbon content that is released during the baking process. These emissions are very difficult to avoid, as they are intrinsic to the process itself. In addition to this, there are the emissions generated by burning fossil fuels to power the process. Fossil fuels are used due to the high energy requirements of the process.
The use of biomass as an alternative fuel, the use of cleaner fossil fuels than those used, the use of cogeneration for electricity and heat production, or general measures for improving energy efficiency, are the most usual alternatives that can be implemented in this sector.
The estimated emission details from process point sources from the Chemical & Pharmaceutical sector are given in Table 4-5. Table 4-5: Red category Point Sources Emission Details
Stack ID
Stack Height
(m)
Stack Velocity
(m/s)
Stack Dia. (m)
Exit Temp
K
Unit Area Acres
Type of Industry
PM10 PM2.5 SO2 NO2
PC1 21 12.50 0.3 418.00 24.90 Ceramic 0.0012 0.0005 0.946 0.666
PC2 21 12.50 0.3 418.00 24.50 Ceramic 0.0012 0.0005 0.931 0.655
PC3 46 8.68 1.7 447.66 25.22 Pharma & Chemical
0.7415 0.2512 3.332 6.262
PC4 46 8.68 1.7 447.66 26.23 Pharma & Chemical
0.7712 0.2613 3.466 6.513
PC5 46 8.68 1.7 447.66 26.00 Pharma & Chemical
0.7645 0.2590 3.436 6.456
PC6 46 8.68 1.7 447.66 31.10 Pharma & Chemical
0.9144 0.3098 4.109 7.722
PC7 21 12.50 0.3 418.00 25.92 Ceramic 0.0013 0.0005 0.985 0.693
PC8 46 8.68 1.7 447.66 33.82 Pharma & Chemical
0.9944 0.3369 4.469 8.397
PC9 46 8.68 1.7 447.66 32.78 Pharma & Chemical
0.9638 0.3265 4.332 8.139
PC10 46 8.68 1.7 447.66 33.74 Pharma & Chemical
0.9921 0.3361 4.458 8.377
Total 284.21 6.146 2.082 30.465 53.88
TSDF was proposed as a part of master plan during ToR stage and later APIIC decided to use the existing TSDF near Visakhapatnam where adequate capacity is available to accommodate the Nakapalli Industrial Park’s hazardous waste. Hence the land considered for the same is included in the Industrial area. It is pertinent to mention that the TSDF will also come under Red category and having pollution potential score greater than or equal to Pharmaceutical and Chemical industries (W11,W13 group A1B, Group A2F1) considered in this project. Hence the emissions and discharges are similar to that of red category industries considered in this project.
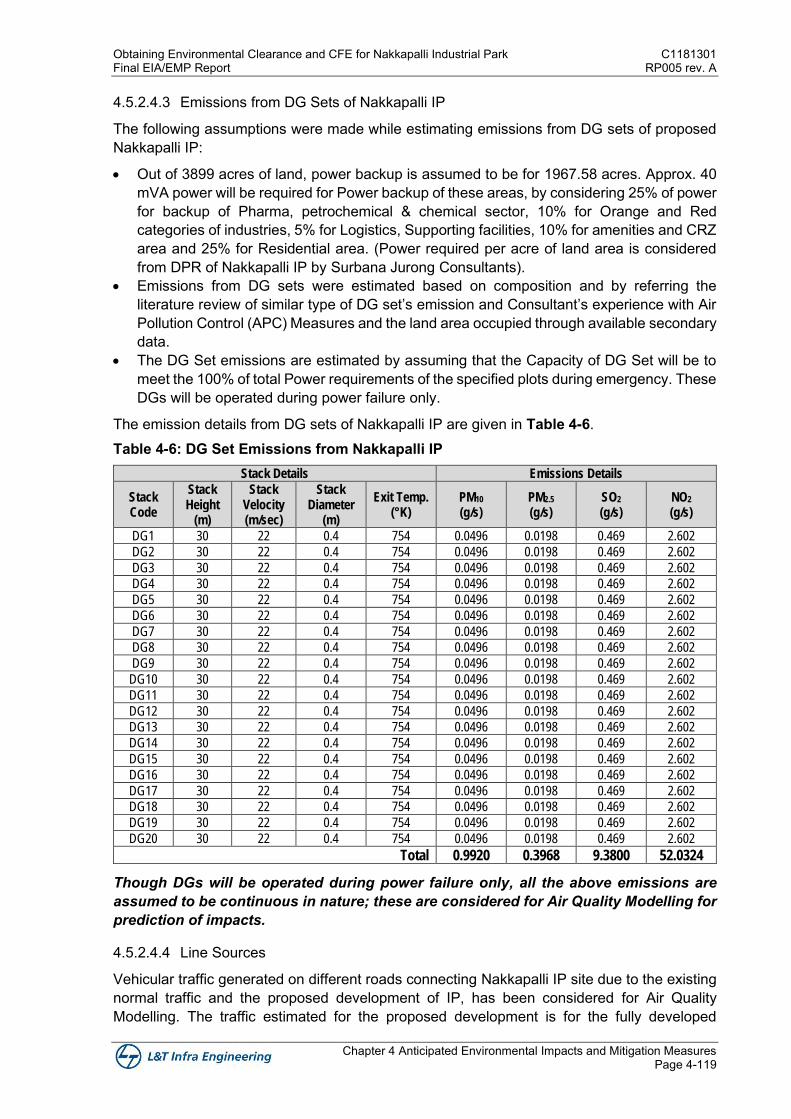
Obtaining Environmental Clearance and CFE for Nakkapalli Industrial Park C1181301 Final EIA/EMP Report RP005 rev. A
Chapter 4 Anticipated Environmental Impacts and Mitigation Measures Page 4-119
4.5.2.4.3 Emissions from DG Sets of Nakkapalli IP
The following assumptions were made while estimating emissions from DG sets of proposed Nakkapalli IP:
• Out of 3899 acres of land, power backup is assumed to be for 1967.58 acres. Approx. 40 mVA power will be required for Power backup of these areas, by considering 25% of power for backup of Pharma, petrochemical & chemical sector, 10% for Orange and Red categories of industries, 5% for Logistics, Supporting facilities, 10% for amenities and CRZ area and 25% for Residential area. (Power required per acre of land area is considered from DPR of Nakkapalli IP by Surbana Jurong Consultants).
• Emissions from DG sets were estimated based on composition and by referring the literature review of similar type of DG set’s emission and Consultant’s experience with Air Pollution Control (APC) Measures and the land area occupied through available secondary data.
• The DG Set emissions are estimated by assuming that the Capacity of DG Set will be to meet the 100% of total Power requirements of the specified plots during emergency. These DGs will be operated during power failure only.
The emission details from DG sets of Nakkapalli IP are given in Table 4-6. Table 4-6: DG Set Emissions from Nakkapalli IP
Stack Details Emissions Details
Stack Code
Stack Height
(m)
Stack Velocity (m/sec)
Stack Diameter
(m)
Exit Temp. (°K)
PM10 (g/s)
PM2.5
(g/s) SO2 (g/s)
NO2 (g/s)
DG1 30 22 0.4 754 0.0496 0.0198 0.469 2.602
DG2 30 22 0.4 754 0.0496 0.0198 0.469 2.602
DG3 30 22 0.4 754 0.0496 0.0198 0.469 2.602
DG4 30 22 0.4 754 0.0496 0.0198 0.469 2.602
DG5 30 22 0.4 754 0.0496 0.0198 0.469 2.602
DG6 30 22 0.4 754 0.0496 0.0198 0.469 2.602
DG7 30 22 0.4 754 0.0496 0.0198 0.469 2.602
DG8 30 22 0.4 754 0.0496 0.0198 0.469 2.602
DG9 30 22 0.4 754 0.0496 0.0198 0.469 2.602
DG10 30 22 0.4 754 0.0496 0.0198 0.469 2.602
DG11 30 22 0.4 754 0.0496 0.0198 0.469 2.602
DG12 30 22 0.4 754 0.0496 0.0198 0.469 2.602
DG13 30 22 0.4 754 0.0496 0.0198 0.469 2.602
DG14 30 22 0.4 754 0.0496 0.0198 0.469 2.602
DG15 30 22 0.4 754 0.0496 0.0198 0.469 2.602
DG16 30 22 0.4 754 0.0496 0.0198 0.469 2.602
DG17 30 22 0.4 754 0.0496 0.0198 0.469 2.602
DG18 30 22 0.4 754 0.0496 0.0198 0.469 2.602
DG19 30 22 0.4 754 0.0496 0.0198 0.469 2.602
DG20 30 22 0.4 754 0.0496 0.0198 0.469 2.602
Total 0.9920 0.3968 9.3800 52.0324
Though DGs will be operated during power failure only, all the above emissions are assumed to be continuous in nature; these are considered for Air Quality Modelling for prediction of impacts.
4.5.2.4.4 Line Sources
Vehicular traffic generated on different roads connecting Nakkapalli IP site due to the existing normal traffic and the proposed development of IP, has been considered for Air Quality Modelling. The traffic estimated for the proposed development is for the fully developed
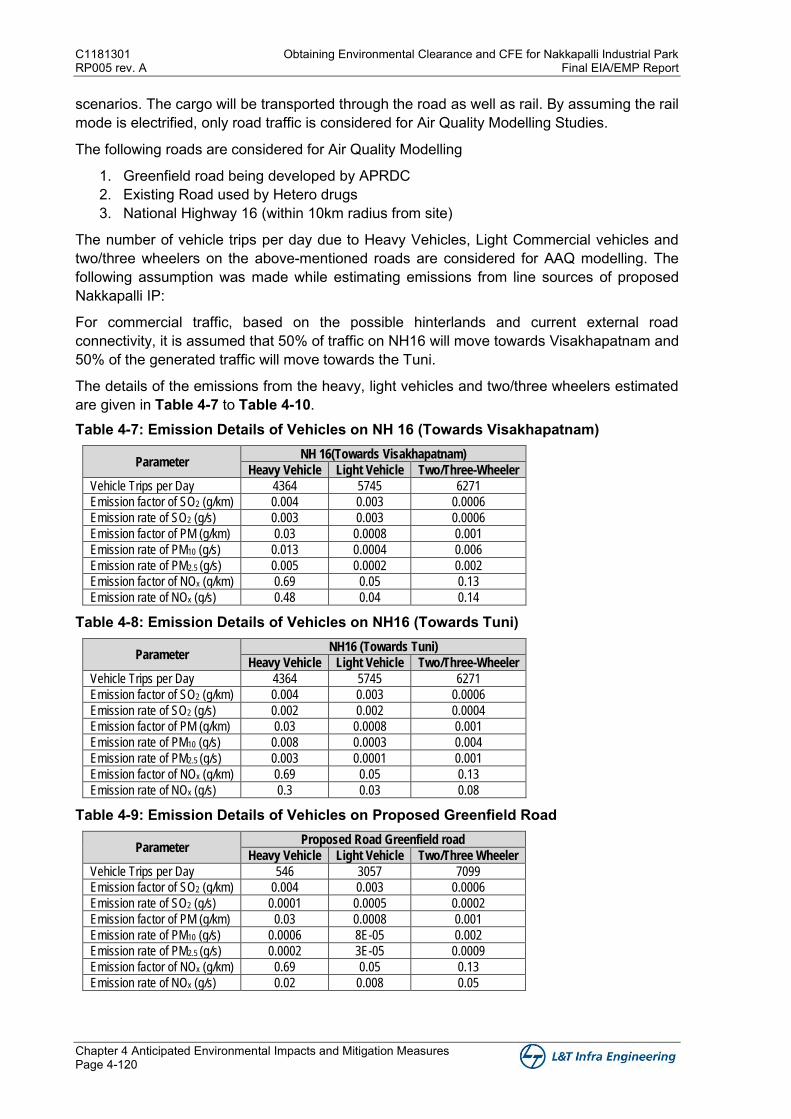
C1181301 Obtaining Environmental Clearance and CFE for Nakkapalli Industrial Park RP005 rev. A Final EIA/EMP Report
Chapter 4 Anticipated Environmental Impacts and Mitigation Measures Page 4-120
scenarios. The cargo will be transported through the road as well as rail. By assuming the rail mode is electrified, only road traffic is considered for Air Quality Modelling Studies.
The following roads are considered for Air Quality Modelling
1. Greenfield road being developed by APRDC 2. Existing Road used by Hetero drugs 3. National Highway 16 (within 10km radius from site)
The number of vehicle trips per day due to Heavy Vehicles, Light Commercial vehicles and two/three wheelers on the above-mentioned roads are considered for AAQ modelling. The following assumption was made while estimating emissions from line sources of proposed Nakkapalli IP:
For commercial traffic, based on the possible hinterlands and current external road connectivity, it is assumed that 50% of traffic on NH16 will move towards Visakhapatnam and 50% of the generated traffic will move towards the Tuni.
The details of the emissions from the heavy, light vehicles and two/three wheelers estimated are given in Table 4-7 to Table 4-10. Table 4-7: Emission Details of Vehicles on NH 16 (Towards Visakhapatnam)
Parameter NH 16(Towards Visakhapatnam)
Heavy Vehicle Light Vehicle Two/Three-Wheeler
Vehicle Trips per Day 4364 5745 6271
Emission factor of SO2 (g/km) 0.004 0.003 0.0006
Emission rate of SO2 (g/s) 0.003 0.003 0.0006
Emission factor of PM (g/km) 0.03 0.0008 0.001
Emission rate of PM10 (g/s) 0.013 0.0004 0.006
Emission rate of PM2.5 (g/s) 0.005 0.0002 0.002
Emission factor of NOx (g/km) 0.69 0.05 0.13
Emission rate of NOx (g/s) 0.48 0.04 0.14
Table 4-8: Emission Details of Vehicles on NH16 (Towards Tuni)
Parameter NH16 (Towards Tuni)
Heavy Vehicle Light Vehicle Two/Three-Wheeler
Vehicle Trips per Day 4364 5745 6271
Emission factor of SO2 (g/km) 0.004 0.003 0.0006
Emission rate of SO2 (g/s) 0.002 0.002 0.0004
Emission factor of PM (g/km) 0.03 0.0008 0.001
Emission rate of PM10 (g/s) 0.008 0.0003 0.004
Emission rate of PM2.5 (g/s) 0.003 0.0001 0.001
Emission factor of NOx (g/km) 0.69 0.05 0.13
Emission rate of NOx (g/s) 0.3 0.03 0.08
Table 4-9: Emission Details of Vehicles on Proposed Greenfield Road
Parameter Proposed Road Greenfield road
Heavy Vehicle Light Vehicle Two/Three Wheeler
Vehicle Trips per Day 546 3057 7099
Emission factor of SO2 (g/km) 0.004 0.003 0.0006
Emission rate of SO2 (g/s) 0.0001 0.0005 0.0002
Emission factor of PM (g/km) 0.03 0.0008 0.001
Emission rate of PM10 (g/s) 0.0006 8E-05 0.002
Emission rate of PM2.5 (g/s) 0.0002 3E-05 0.0009
Emission factor of NOx (g/km) 0.69 0.05 0.13
Emission rate of NOx (g/s) 0.02 0.008 0.05
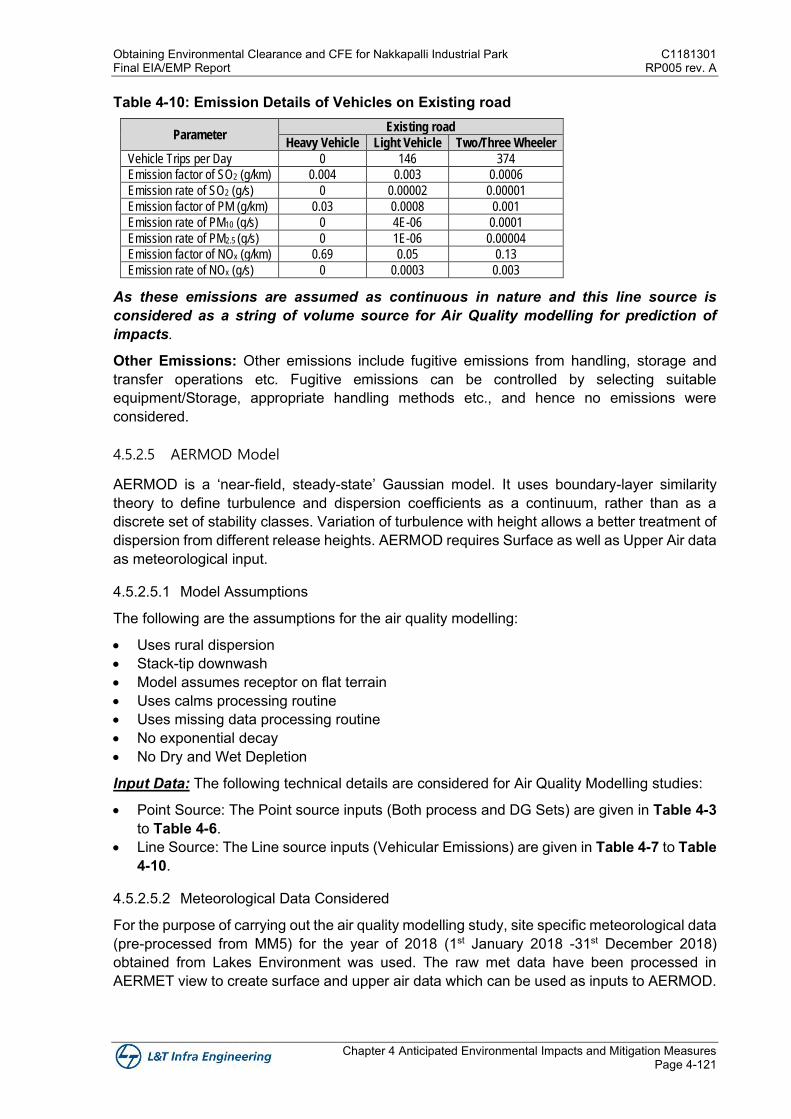
Obtaining Environmental Clearance and CFE for Nakkapalli Industrial Park C1181301 Final EIA/EMP Report RP005 rev. A
Chapter 4 Anticipated Environmental Impacts and Mitigation Measures Page 4-121
Table 4-10: Emission Details of Vehicles on Existing road
Parameter Existing road
Heavy Vehicle Light Vehicle Two/Three Wheeler
Vehicle Trips per Day 0 146 374
Emission factor of SO2 (g/km) 0.004 0.003 0.0006
Emission rate of SO2 (g/s) 0 0.00002 0.00001
Emission factor of PM (g/km) 0.03 0.0008 0.001
Emission rate of PM10 (g/s) 0 4E-06 0.0001
Emission rate of PM2.5 (g/s) 0 1E-06 0.00004
Emission factor of NOx (g/km) 0.69 0.05 0.13
Emission rate of NOx (g/s) 0 0.0003 0.003
As these emissions are assumed as continuous in nature and this line source is considered as a string of volume source for Air Quality modelling for prediction of impacts.
Other Emissions: Other emissions include fugitive emissions from handling, storage and transfer operations etc. Fugitive emissions can be controlled by selecting suitable equipment/Storage, appropriate handling methods etc., and hence no emissions were considered.
4.5.2.5 AERMOD Model
AERMOD is a ‘near-field, steady-state’ Gaussian model. It uses boundary-layer similarity theory to define turbulence and dispersion coefficients as a continuum, rather than as a discrete set of stability classes. Variation of turbulence with height allows a better treatment of dispersion from different release heights. AERMOD requires Surface as well as Upper Air data as meteorological input.
4.5.2.5.1 Model Assumptions
The following are the assumptions for the air quality modelling:
• Uses rural dispersion • Stack-tip downwash • Model assumes receptor on flat terrain • Uses calms processing routine • Uses missing data processing routine • No exponential decay • No Dry and Wet Depletion
Input Data: The following technical details are considered for Air Quality Modelling studies:
• Point Source: The Point source inputs (Both process and DG Sets) are given in Table 4-3 to Table 4-6.
• Line Source: The Line source inputs (Vehicular Emissions) are given in Table 4-7 to Table 4-10.
4.5.2.5.2 Meteorological Data Considered
For the purpose of carrying out the air quality modelling study, site specific meteorological data (pre-processed from MM5) for the year of 2018 (1st January 2018 -31st December 2018) obtained from Lakes Environment was used. The raw met data have been processed in AERMET view to create surface and upper air data which can be used as inputs to AERMOD.
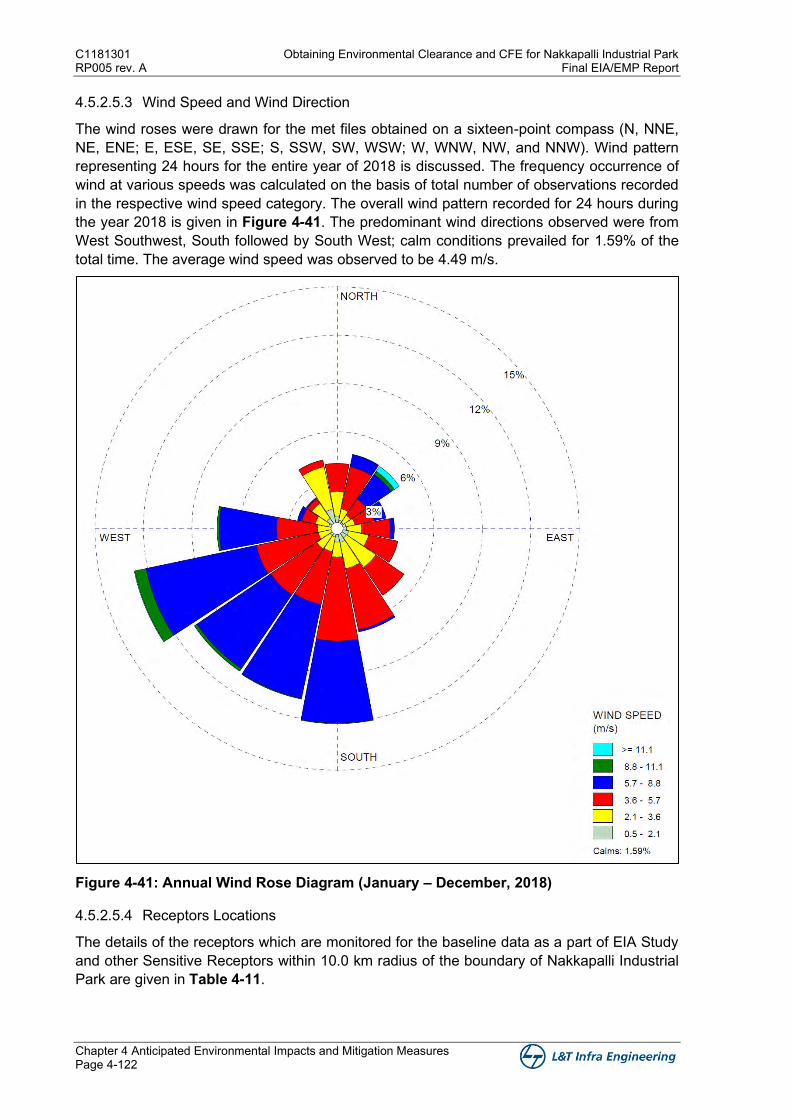
C1181301 Obtaining Environmental Clearance and CFE for Nakkapalli Industrial Park RP005 rev. A Final EIA/EMP Report
Chapter 4 Anticipated Environmental Impacts and Mitigation Measures Page 4-122
4.5.2.5.3 Wind Speed and Wind Direction
The wind roses were drawn for the met files obtained on a sixteen-point compass (N, NNE, NE, ENE; E, ESE, SE, SSE; S, SSW, SW, WSW; W, WNW, NW, and NNW). Wind pattern representing 24 hours for the entire year of 2018 is discussed. The frequency occurrence of wind at various speeds was calculated on the basis of total number of observations recorded in the respective wind speed category. The overall wind pattern recorded for 24 hours during the year 2018 is given in Figure 4-41. The predominant wind directions observed were from West Southwest, South followed by South West; calm conditions prevailed for 1.59% of the total time. The average wind speed was observed to be 4.49 m/s.
Figure 4-41: Annual Wind Rose Diagram (January – December, 2018)
4.5.2.5.4 Receptors Locations
The details of the receptors which are monitored for the baseline data as a part of EIA Study and other Sensitive Receptors within 10.0 km radius of the boundary of Nakkapalli Industrial Park are given in Table 4-11.
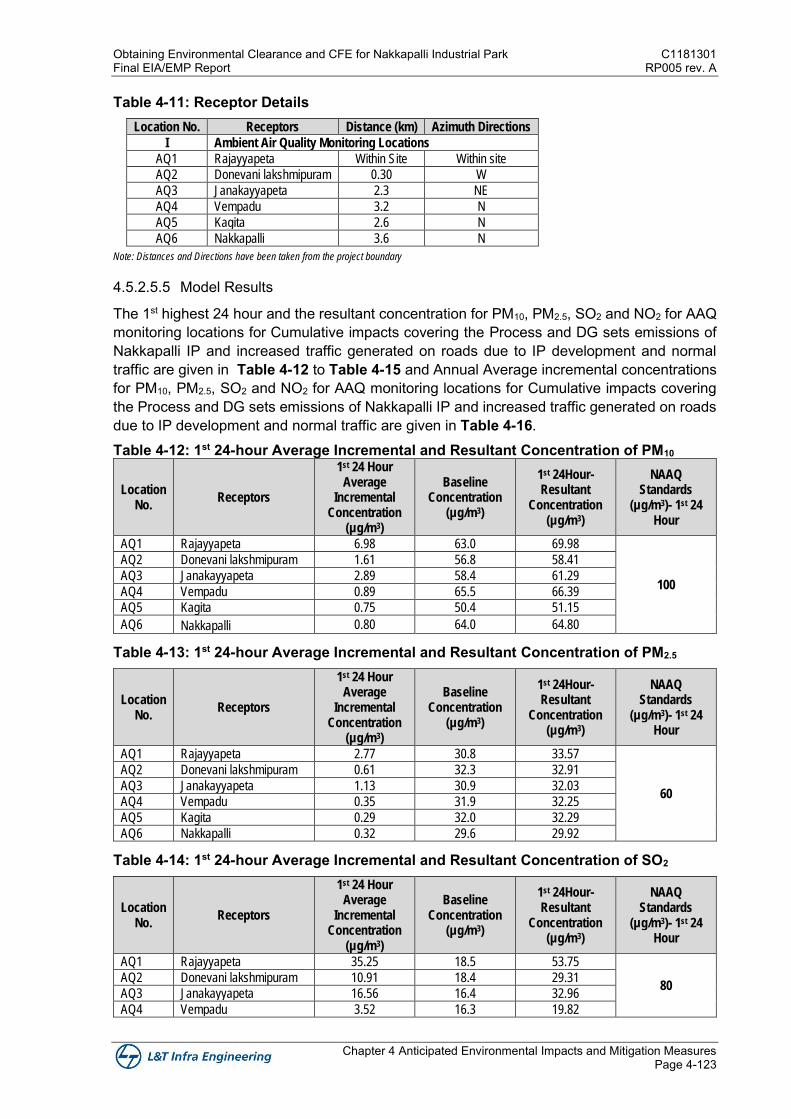
Obtaining Environmental Clearance and CFE for Nakkapalli Industrial Park C1181301 Final EIA/EMP Report RP005 rev. A
Chapter 4 Anticipated Environmental Impacts and Mitigation Measures Page 4-123
Table 4-11: Receptor Details Location No. Receptors Distance (km) Azimuth Directions
I Ambient Air Quality Monitoring Locations
AQ1 Rajayyapeta Within Site Within site
AQ2 Donevani lakshmipuram 0.30 W
AQ3 Janakayyapeta 2.3 NE
AQ4 Vempadu 3.2 N
AQ5 Kagita 2.6 N
AQ6 Nakkapalli 3.6 N
Note: Distances and Directions have been taken from the project boundary
4.5.2.5.5 Model Results
The 1st highest 24 hour and the resultant concentration for PM10, PM2.5, SO2 and NO2 for AAQ monitoring locations for Cumulative impacts covering the Process and DG sets emissions of Nakkapalli IP and increased traffic generated on roads due to IP development and normal traffic are given in Table 4-12 to Table 4-15 and Annual Average incremental concentrations for PM10, PM2.5, SO2 and NO2 for AAQ monitoring locations for Cumulative impacts covering the Process and DG sets emissions of Nakkapalli IP and increased traffic generated on roads due to IP development and normal traffic are given in Table 4-16. Table 4-12: 1st 24-hour Average Incremental and Resultant Concentration of PM10
Location No.
Receptors
1st 24 Hour Average
Incremental Concentration
(µg/m3)
Baseline Concentration
(µg/m3)
1st 24Hour-Resultant
Concentration (µg/m3)
NAAQ Standards
(µg/m3)- 1st 24 Hour
AQ1 Rajayyapeta 6.98 63.0 69.98
100
AQ2 Donevani lakshmipuram 1.61 56.8 58.41
AQ3 Janakayyapeta 2.89 58.4 61.29
AQ4 Vempadu 0.89 65.5 66.39
AQ5 Kagita 0.75 50.4 51.15
AQ6 Nakkapalli 0.80 64.0 64.80
Table 4-13: 1st 24-hour Average Incremental and Resultant Concentration of PM2.5
Location No.
Receptors
1st 24 Hour Average
Incremental Concentration
(µg/m3)
Baseline Concentration
(µg/m3)
1st 24Hour-Resultant
Concentration (µg/m3)
NAAQ Standards
(µg/m3)- 1st 24 Hour
AQ1 Rajayyapeta 2.77 30.8 33.57
60
AQ2 Donevani lakshmipuram 0.61 32.3 32.91
AQ3 Janakayyapeta 1.13 30.9 32.03
AQ4 Vempadu 0.35 31.9 32.25
AQ5 Kagita 0.29 32.0 32.29
AQ6 Nakkapalli 0.32 29.6 29.92
Table 4-14: 1st 24-hour Average Incremental and Resultant Concentration of SO2
Location No.
Receptors
1st 24 Hour Average
Incremental Concentration
(µg/m3)
Baseline Concentration
(µg/m3)
1st 24Hour-Resultant
Concentration (µg/m3)
NAAQ Standards
(µg/m3)- 1st 24 Hour
AQ1 Rajayyapeta 35.25 18.5 53.75
80 AQ2 Donevani lakshmipuram 10.91 18.4 29.31
AQ3 Janakayyapeta 16.56 16.4 32.96
AQ4 Vempadu 3.52 16.3 19.82
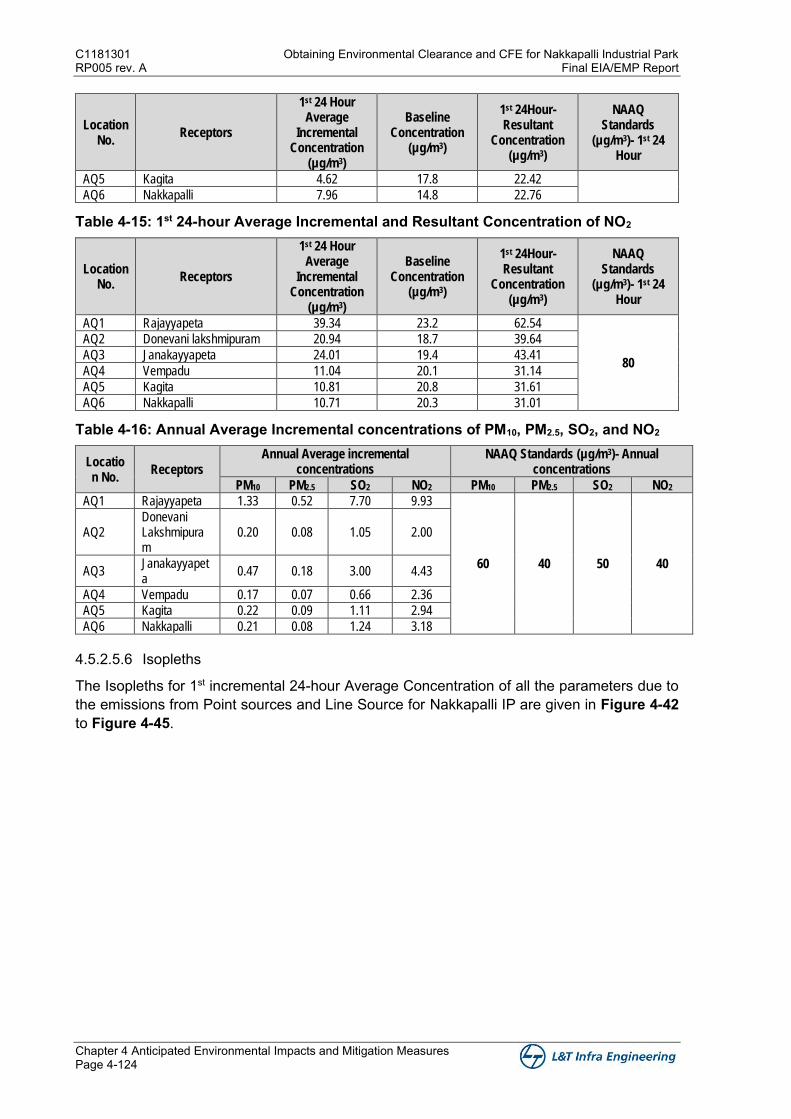
C1181301 Obtaining Environmental Clearance and CFE for Nakkapalli Industrial Park RP005 rev. A Final EIA/EMP Report
Chapter 4 Anticipated Environmental Impacts and Mitigation Measures Page 4-124
Location No.
Receptors
1st 24 Hour Average
Incremental Concentration
(µg/m3)
Baseline Concentration
(µg/m3)
1st 24Hour-Resultant
Concentration (µg/m3)
NAAQ Standards
(µg/m3)- 1st 24 Hour
AQ5 Kagita 4.62 17.8 22.42
AQ6 Nakkapalli 7.96 14.8 22.76
Table 4-15: 1st 24-hour Average Incremental and Resultant Concentration of NO2
Location No.
Receptors
1st 24 Hour Average
Incremental Concentration
(µg/m3)
Baseline Concentration
(µg/m3)
1st 24Hour-Resultant
Concentration (µg/m3)
NAAQ Standards
(µg/m3)- 1st 24 Hour
AQ1 Rajayyapeta 39.34 23.2 62.54
80
AQ2 Donevani lakshmipuram 20.94 18.7 39.64
AQ3 Janakayyapeta 24.01 19.4 43.41
AQ4 Vempadu 11.04 20.1 31.14
AQ5 Kagita 10.81 20.8 31.61
AQ6 Nakkapalli 10.71 20.3 31.01
Table 4-16: Annual Average Incremental concentrations of PM10, PM2.5, SO2, and NO2
Location No.
Receptors
Annual Average incremental concentrations
NAAQ Standards (µg/m3)- Annual concentrations
PM10 PM2.5 SO2 NO2 PM10 PM2.5 SO2 NO2
AQ1 Rajayyapeta 1.33 0.52 7.70 9.93
60 40 50 40
AQ2 Donevani Lakshmipuram
0.20 0.08 1.05 2.00
AQ3 Janakayyapeta
0.47 0.18 3.00 4.43
AQ4 Vempadu 0.17 0.07 0.66 2.36
AQ5 Kagita 0.22 0.09 1.11 2.94
AQ6 Nakkapalli 0.21 0.08 1.24 3.18
4.5.2.5.6 Isopleths
The Isopleths for 1st incremental 24-hour Average Concentration of all the parameters due to the emissions from Point sources and Line Source for Nakkapalli IP are given in Figure 4-42 to Figure 4-45.
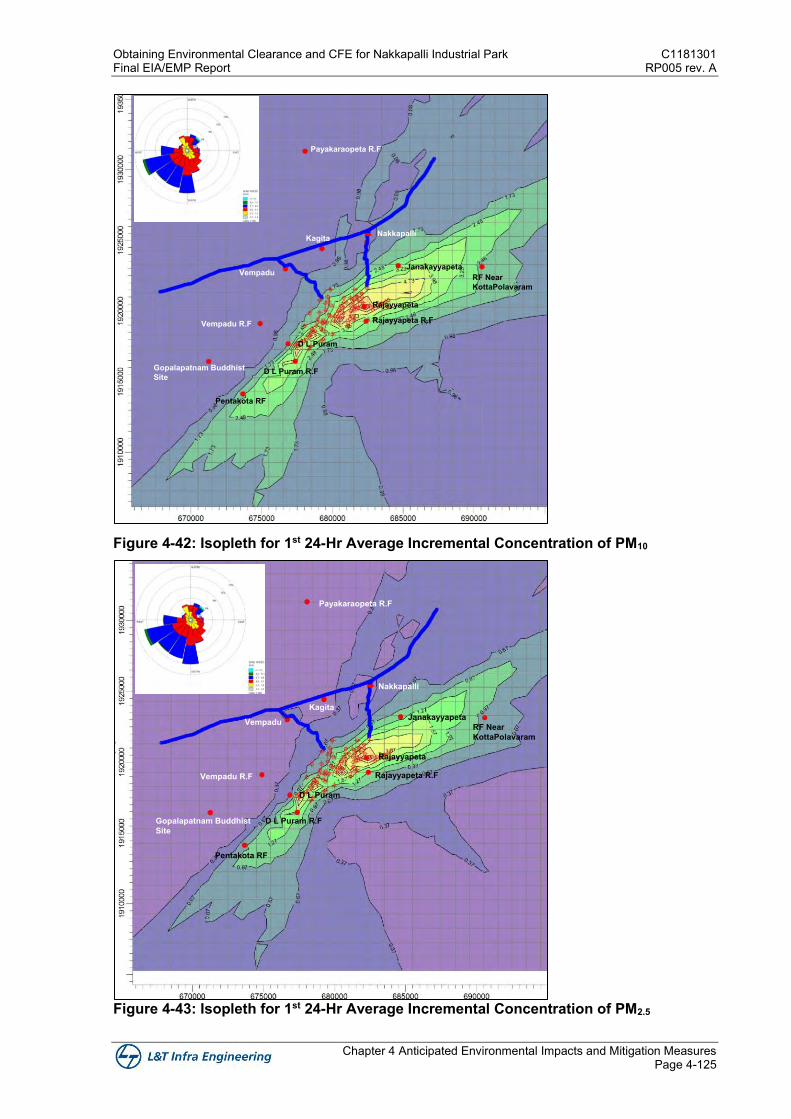
Obtaining Environmental Clearance and CFE for Nakkapalli Industrial Park C1181301 Final EIA/EMP Report RP005 rev. A
Chapter 4 Anticipated Environmental Impacts and Mitigation Measures Page 4-125
Figure 4-42: Isopleth for 1st 24-Hr Average Incremental Concentration of PM10
Figure 4-43: Isopleth for 1st 24-Hr Average Incremental Concentration of PM2.5
Payakaraopeta R.F
NakkapalliKagita
Vempadu
Vempadu R.F
Gopalapatnam Buddhist Site
Pentakota RF
D L Puram R.F
D L Puram
Rajayyapeta R.F
Rajayyapeta
JanakayyapetaRF Near KottaPolavaram
Payakaraopeta R.F
Nakkapalli
Kagita
Vempadu
Vempadu R.F
Gopalapatnam Buddhist Site
Pentakota RF
D L Puram R.F
D L Puram
Rajayyapeta R.F
Rajayyapeta
JanakayyapetaRF Near KottaPolavaram
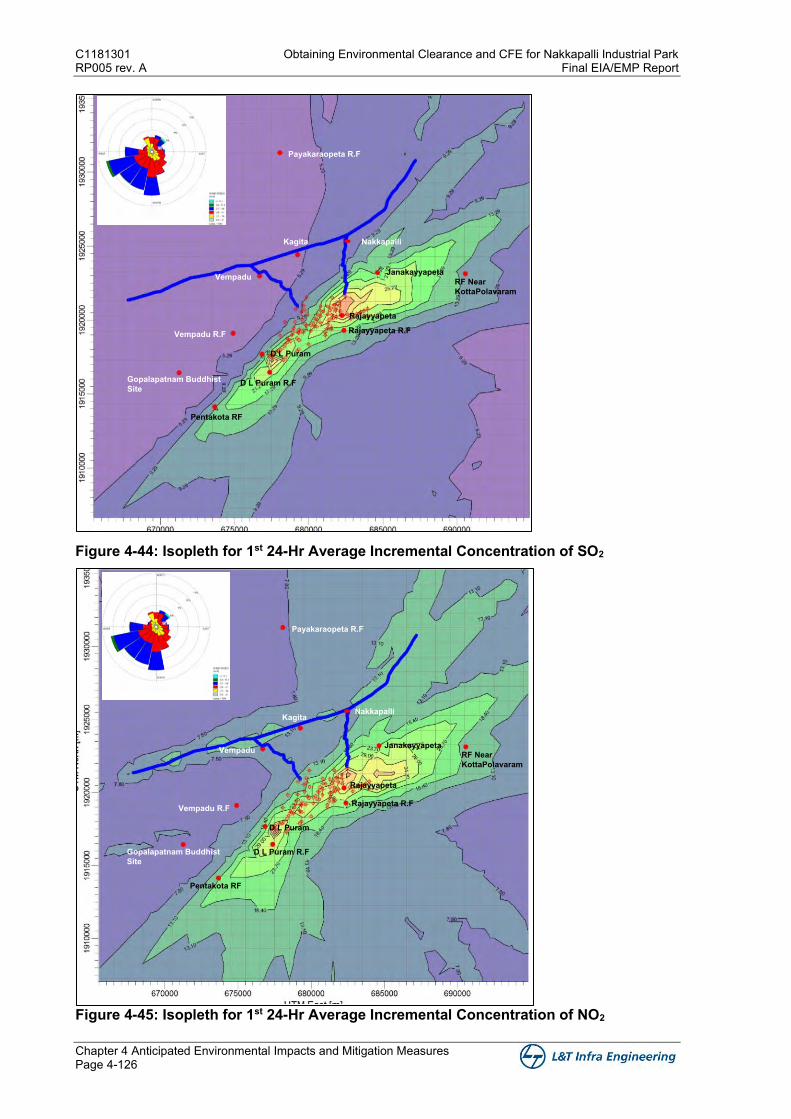
C1181301 Obtaining Environmental Clearance and CFE for Nakkapalli Industrial Park RP005 rev. A Final EIA/EMP Report
Chapter 4 Anticipated Environmental Impacts and Mitigation Measures Page 4-126
Figure 4-44: Isopleth for 1st 24-Hr Average Incremental Concentration of SO2
Figure 4-45: Isopleth for 1st 24-Hr Average Incremental Concentration of NO2
Payakaraopeta R.F
NakkapalliKagita
Vempadu
Vempadu R.F
Gopalapatnam Buddhist Site
Pentakota RF
D L Puram R.F
D L Puram
Rajayyapeta R.F
Rajayyapeta
JanakayyapetaRF Near KottaPolavaram
Payakaraopeta R.F
NakkapalliKagita
Vempadu
Vempadu R.F
Gopalapatnam Buddhist Site
Pentakota RF
D L Puram R.F
D L Puram
Rajayyapeta R.F
Rajayyapeta
JanakayyapetaRF Near KottaPolavaram
Obtaining Environmental Clearance and CFE for Nakkapalli Industrial Park C1181301 Final EIA/EMP Report RP005 rev. A
Chapter 4 Anticipated Environmental Impacts and Mitigation Measures Page 4-127
4.5.2.5.7 Observations at Receptors
The 1st highest 24-hour average resultant concentrations of PM10, PM2.5, SO2 and NO2 for AAQ monitoring receptors locations are found to be well within the National Ambient Air Quality Standards (NAAQS), 2009 for the entire scenarios considered.
4.5.2.5.8 Mitigation Measures
• Stack gas scrubbing, carbon adsorption (for toxic organics), and baghouses (for particulate matter removal) are applicable and effective technologies for minimizing the release of significant pollutants to air. In some cases, biological filters are also used to reduce emissions of organics. Combustion is used for the destruction of toxic organics.
• Ambient air quality monitoring will be carried out regularly at selected locations in the predicted maximum impact zone in order to check and compare the predicted concentrations with the measured concentrations.
• Provision of avenue plantation along the roads and greenbelt development along the layout boundary
• Provisions of adequate green buffers between facilities and utilities/common areas • All the vehicles and other equipment will be periodically checked to ensure compliance to
the emission standards • Nakkapalli IP can reduce its carbon footprint by ensuring energy consumption kept at the
minimum operating level
4.6 Noise Environment
Generally, the activities which tend to impact the air environment also equally impact the noise levels.
4.6.1 Potential Impact during Construction
Construction activities increase ambient noise levels. There would be impact on noise levels due to the following:
• Vehicles transporting construction material • Handling of construction material • Diesel run engines of construction machinery • Welding and cutting operation of metal • Pile driving activities during construction of heavy structure
Noise is an inherent part of construction activity and response of species / communities would be either attracted or diverted away from the region. Noise generated from diesel engines etc. could result in movement of mobile faunal species away from area of operation.
Noise generated from construction activities will be predominantly confined within the project site area and will impact construction workers at site. Impacts due to these activities would be short-term in nature and localised.
4.6.1.1 Mitigation Measures
The following mitigation measures will be followed to minimise the noise generation and the associated impacts.
• Exercise of route selection as well as measures such as traffic regulation, timings of transportation, etc. will be followed to avoid congested built up areas.
C1181301 Obtaining Environmental Clearance and CFE for Nakkapalli Industrial Park RP005 rev. A Final EIA/EMP Report
Chapter 4 Anticipated Environmental Impacts and Mitigation Measures Page 4-128
• During construction, noise levels will be maintained below threshold levels stipulated by Central Pollution Control Board (CPCB) by selecting appropriate equipment, machinery and using enclosures. Procurement of machinery/construction equipment will be done in accordance with specifications conforming to source noise levels less than 75 dB (A).
• Only well-maintained construction equipment; which meets the regulatory standards for source noise levels, will be used. Any equipment producing high noise, wherever possible, will be oriented so that the noise is directed away from sensitive receptors.
• Noise attenuation will be practised for noisy equipment by employing suitable techniques such as acoustic controls, insulation and vibration dampers. The attenuation devices will be properly maintained throughout the construction period.
• High noise generating activities such as blasting, piling and drilling will not be scheduled during night-time to minimise noise impacts.
• Time bound noisy construction activities will be carried out; so as to avoid concurrent effect from the construction site.
• Personnel exposed to noise levels beyond threshold limits will be provided with protective gears such as earplugs, muffs, etc. especially construction personnel involved in pile driving operations. Rotation of personnel will also be adopted.
• Temporary noise barriers will be used to break the propagation of sound from the construction site.
• Periodic maintenance of the equipment to be used in the developmental works will be carried out. Worn out parts will be replaced, and rotating parts will be lubricated to minimise noise emissions.
• Ambient noise levels will be monitored at regular intervals during construction phase of the project.
• All haul roads (for truck transport and other vehicles) within the boundary and outside will be sealed and maintained properly to avoid excessive noise levels from Engine acceleration and deceleration.
• Drivers need to be captioned or trained to avoid frequent horning unless otherwise it is required and educated for Silent zones and off hours between midnight and 6 am.
• Poorly trained drivers who have the habit of horning at frequent intervals even if not required, even in front of Silence zones and even in sleeping hours in the midnight will not be employed.
• Adequate PPE for noise mitigation need to be used for labours that are exposed to high noise.
The following control measures will be adopted to keep the ambient noise levels well below the limits during drilling and blasting, if any
• Drilling will be carried out with sharp drill bits which help in reducing noise. • Secondary blasting will be totally avoided, and Hydraulic rock breaker/jack hammer drills
will be used for breaking boulders. • Controlled blasting with proper spacing, burden, stemming and optimum charge/delay will
be maintained • The blasting shall be carried out during favourable atmospheric condition and between
12.00 Noon to 2.00 PM when there is less human activity. • Proper maintenance, oiling and greasing of machines at regular intervals will be done to
reduce generation of noise • Provision of sound insulated chambers for the workers deployed on machines producing
higher levels of noise. • Personal Protective Equipment (PPE)
Obtaining Environmental Clearance and CFE for Nakkapalli Industrial Park C1181301 Final EIA/EMP Report RP005 rev. A
Chapter 4 Anticipated Environmental Impacts and Mitigation Measures Page 4-129
4.6.1.2 Impact due to Vibration
During the construction activities, vibrations may be envisaged. The vibrations could be result of activities like excavation, piling, blasting movement of heavy equipment, etc.
Ground vibration in the area is anticipated due to drilling and blasting. Another impact due to blasting activities is fly rocks. These may fall on the nearby areas and may cause injury to construction workers or persons.
4.6.1.3 Vibration- Mitigation Measures
• The machinery equipped with latest vibration-reduction technology shall minimise the vibrations
• The effects of vibrations will be minimised by ensuring construction works take place during daytime and weekdays
Proper quantity of explosive, suitable stemming materials and appropriate delay system will be adopted to avoid overcharging and for safe blasting.
• Proper blast design will be made to control ground vibration and fly rocks. • Adequate safe distance from blasting will be maintained. • The charge per delay will be minimized and preferably more number of delays will be used
per blast • During blasting, other activities in the immediate vicinity will be temporarily stopped • Drilling parameters like burden, depth, diameter and spacing will be properly designed to
give proper blast • Blasting will be carried out only to loosen the strata, thereby reducing the quantity of
explosives used per blast.
4.6.2 Potential Impact during Operation
During the operation phase, noise might be generated due to industrial activities involved in raw material/product handling and transportation and same will be felt upon work personnel and nearby settlements. Impacts are evaluated qualitatively taking into consideration the noise generating sources together with environmental conditions and the receptors in the project influence area.
Major sources of noise generation in the proposed IP are the manufacturing units during operational phase and are classified into two categories:
• Stationary sources due to operation of heavy-duty machinery at the project site like Boilers, Compressors, Pumps, Hydraulic systems, various industrial operations etc.
• Mobile sources corresponding to mainly vehicular traffic for staff mobilization, materials/product transportation in and out of project site, etc.
Vibrations are expected to be generated by various activities associated with the proposed units during operational phase. The impact of vibrations beyond the site would be negligible during normal operation phase. However, the impacts on workers engaged in the industrial area would be considerable due to occupational exposure.
4.6.2.1 Mitigation Measures
The major noise generating equipment will be enclosed in an acoustic enclosure designed for an insertion loss of 25 dB (A) and silencers to other equipment etc.
C1181301 Obtaining Environmental Clearance and CFE for Nakkapalli Industrial Park RP005 rev. A Final EIA/EMP Report
Chapter 4 Anticipated Environmental Impacts and Mitigation Measures Page 4-130
• Major noise generating equipment will be designed with 85 dB (A) ensuring cumulative noise at 1.0 m remains at 85 dB (A).
• The occupational noise exposure to the workers in the form of eight hourly time weighted average will be maintained well within the prescribed Occupational Safety and Health Administration (OSHA) standard limits.
• Acoustic silencers will be provided in equipment wherever necessary. • Acoustic design with soundproof glass panelling will be provided for critical operator cabins
/ control rooms of individual modules as well as central control facilities. • Use of personal protective devices such as earmuffs, ear plugs, etc. will be strictly enforced
for the workers engaged in high noise areas. • Periodic maintenance of the equipment to be used in the developmental works will be
carried out. Worn out parts will be replaced, and rotating parts will be lubricated to minimise noise emissions.
• Implementation of greenbelt for noise attenuation will be undertaken shrub plantation; landscaping with horticulture; and Tree plantation at vehicle parking areas and along approach roads.
• Ambient noise levels will be monitored at regular intervals during operational phase of the project.
• Low vibration generating machines/equipment will be selected to meet international standards and foundations will be so designed to minimise vibrations and secured properly
• Vibration generating sources and their platforms should be maintained properly to minimize vibrations and related impacts.
• Various standards pertaining to vibrations are formulated by statutory bodies like Bureau of Indian Standards (BIS), which is being practiced would be continued to mitigate the workers’ health effects due to vibrations.
• Vibration dampers shall be provided around the source of generation • Transportation Management Plan will be prepared and the transportation of construction
materials will be planned in line with the same
4.7 Solid Waste Management
4.7.1 Potential Impact due to Construction
4.7.1.1 Impact due to Solid Waste Generation
Solid waste is likely to be generated in significant amount during the construction phase of the development. Appropriate measures therefore need to be taken to cater for the adequate disposal of such solid wastes. Improper solid waste disposal may also lead to skin diseases. Moreover, solid waste will attract vermins, rats and deteriorate the general aspect of the site and its surroundings. Organic wastes will comprise mainly of domestic refuse like food and garden debris such as fallen leaves. During the construction phase, the inorganic waste likely to be generated will include:
• Concrete rubbles and blocks • Cement sheets • Wooden and metallic beams • Paper, plastic, cartons
• Blocks, rocks, boulders • Broken tiles, glass debris • Metal debris, cans and tins • Wood, straw and timber remains
Organic waste generated during the construction stage will be minimal and shall include leaves, branches, food consumed by workers on site.
Obtaining Environmental Clearance and CFE for Nakkapalli Industrial Park C1181301 Final EIA/EMP Report RP005 rev. A
Chapter 4 Anticipated Environmental Impacts and Mitigation Measures Page 4-131
Poor construction procedures that generate excessive wastes increase construction costs and results in disposal of otherwise valuable resources. The solid waste generated during construction phase may impact soil quality, water quality and public health if not regulated properly. Appropriate measures therefore need to be taken to cater for the adequate disposal of solid wastes generated during construction phase of the project.
4.7.1.2 Mitigation Measures
• Construction waste shall be collected and segregated between concreted, soil and others • Construction waste shall not be mixed with other waste (such as solid waste) and is stored
and disposed separately • No littering or deposition of Construction waste so as to prevent obstruction to the traffic or
the public or drains • Construction waste will be re-used within Project site for filling of low lying areas. Other
wastes which can be re-cycled will be sold. Recyclable wastes will be disposed through approved APPCB vendors.
• Excavated soil will be stockpiled in a corner of the site in bounded area to avoid run off with storm water.
• Excavated stockpiled top soil will be reused for horticultural/ agricultural purposes • General refuse generated on-site will be collected in waste skips and separated from
construction waste. • A local authorised waste handler will be employed to remove general refuse from the site,
separately from construction waste and municipal wastes, on regular basis to minimise odour, pest and litter impacts.
• The burning of refuse at construction sites will be prohibited. Appropriate fence should be used to prevent propagation of the debris via strong winds
4.7.1.3 Hazardous Material Management
• Hazardous materials such as lubricants, paints, compressed gases, and varnishes etc., will be stored as per the prescribed/approved safety norms.
• Hazardous wastes will be disposed through approved APPCB vendors. • Hazardous materials will be stored as per prescribed safety norms in locations with
restricted entry and with fire-fighting facilities. • Medical facilities including first aid will be available for attending injured workers
4.7.2 Potential Impact during Operation
4.7.2.1 Impact due to Solid Waste Generation
During operation phase of Nakkapalli Industrial Park it is likely to generate various types of solid waste which can be broadly categorized as Municipal Waste, Hazardous Wastes and Non-hazardous Wastes. Further the generated solid waste generated may include Biodegradable, Recyclable, Reusable and inert compounds from municipal and non-industrial occupants and industrial occupants. Apart from those listed, E-waste from both domestic and industrial segments is also expected to be generated in the park area.
If the solid waste generated is not properly managed and disposed in unauthorised manner, it will impact the air quality, soil quality and groundwater quality.
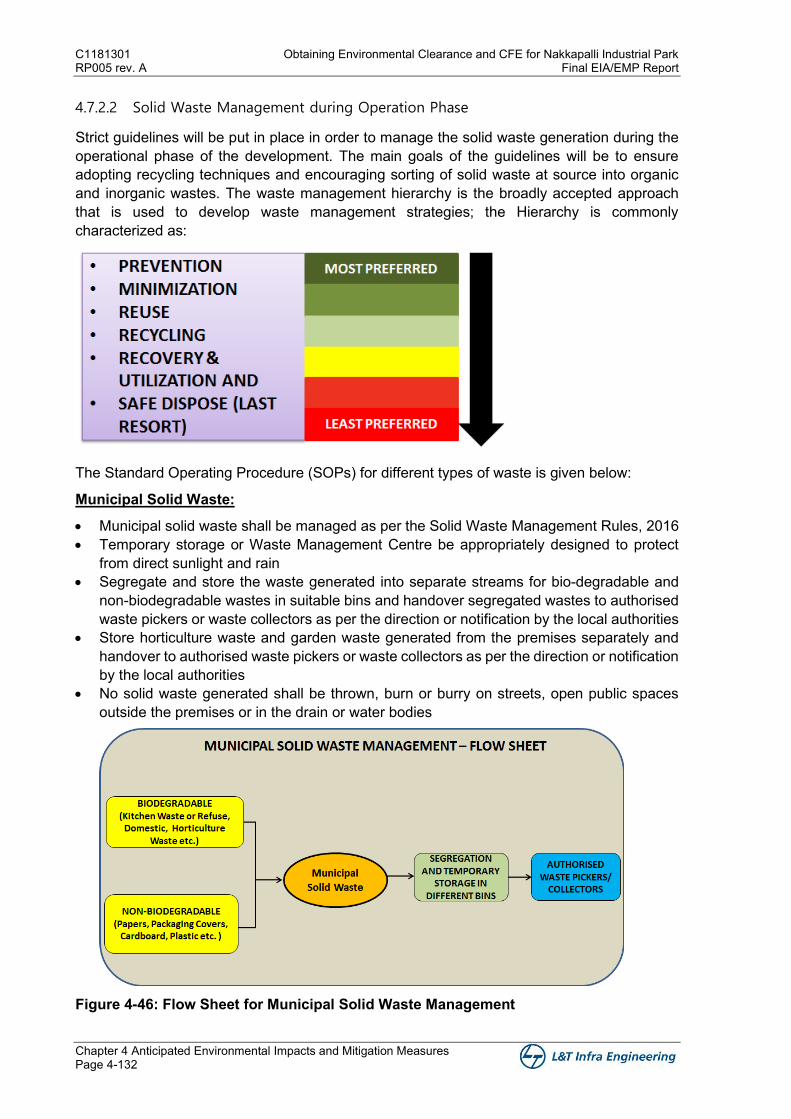
C1181301 Obtaining Environmental Clearance and CFE for Nakkapalli Industrial Park RP005 rev. A Final EIA/EMP Report
Chapter 4 Anticipated Environmental Impacts and Mitigation Measures Page 4-132
4.7.2.2 Solid Waste Management during Operation Phase
Strict guidelines will be put in place in order to manage the solid waste generation during the operational phase of the development. The main goals of the guidelines will be to ensure adopting recycling techniques and encouraging sorting of solid waste at source into organic and inorganic wastes. The waste management hierarchy is the broadly accepted approach that is used to develop waste management strategies; the Hierarchy is commonly characterized as:
The Standard Operating Procedure (SOPs) for different types of waste is given below:
Municipal Solid Waste:
• Municipal solid waste shall be managed as per the Solid Waste Management Rules, 2016 • Temporary storage or Waste Management Centre be appropriately designed to protect
from direct sunlight and rain • Segregate and store the waste generated into separate streams for bio-degradable and
non-biodegradable wastes in suitable bins and handover segregated wastes to authorised waste pickers or waste collectors as per the direction or notification by the local authorities
• Store horticulture waste and garden waste generated from the premises separately and handover to authorised waste pickers or waste collectors as per the direction or notification by the local authorities
• No solid waste generated shall be thrown, burn or burry on streets, open public spaces outside the premises or in the drain or water bodies
Figure 4-46: Flow Sheet for Municipal Solid Waste Management
Obtaining Environmental Clearance and CFE for Nakkapalli Industrial Park C1181301 Final EIA/EMP Report RP005 rev. A
Chapter 4 Anticipated Environmental Impacts and Mitigation Measures Page 4-133
Plastic Waste
• Minimize generation of plastic waste and segregate plastic waste at source in accordance with the Plastic Waste (Management and Handling) Rules, 2016 and Solid Waste Management Rules, 2016
• Not to litter the plastic waste and ensure segregated storage of waste at source and handover segregated waste to authorised waste pickers or waste collectors as per the direction or notification by the local authorities
Batteries Waste
Storage:
Even used batteries can have some electric energy remaining. A short-circuit could cause a fire; the battery could fall over and crack resulting in an electrolyte leak; or an open flame could ignite the gas remaining inside the storage battery and cause an explosion. To prevent these incidents, batteries should be stored where they cannot be tampered with and care should be taken to prevent their falling.
Particularly when the batteries are stacked, do not place the batteries or the pallet directly on the items sticking out of the top of the batteries such as the terminals, vent plugs and catalyst plugs to protect the batteries from short-circuit and damage. To prevent soil contamination, the floor should be waterproof construction and the batteries should be protected from the rain. If storage batteries are already broken and are expected to leak electrolyte, they should be stored in a container to prevent the electrolyte from escaping.
Information regarding the handling in case of accidents:
All personnel must be informed in advance about what to do in the event that electrolyte gets in the eyes or on the skin or spills on the road or on a vehicle (have neutralising agents on hand etc.)
Used batteries will be collected, stored and transported to authorised recyclers to ensure that used batteries are disposed in a proper manner.
Hazardous and Other Waste
• Temporary storage facility shall be provided within the Premises • Storage period of not more than 90 days and records of the same shall be maintained • Necessary measures in the Temporary Storage Areas: • Storage area shall be designed to withstand the load of material stocked and any damage
from the material spillage. • Storage area shall be provided with flameproof electrical fittings and it will be strictly
adhered to. • Automatic smoke, heat detection system shall be provided in the sheds. Adequate
firefighting systems shall be provided for the storage area, along with the areas in the facility.
• Loading and unloading of wastes in storage sheds will only be done under the supervision of the well trained and experienced staff.
• Fire break of at least 4 meter between two blocks of stacked drums shall be provided in the storage shed. One block of drum should not exceed 300 MT of waste.
• Minimum of 1 meter clear space shall be left between two adjacent rows of pallets in pair for inspection.
• The storage and handling shall have at least two routes to escape in the event of any fire in the area.
C1181301 Obtaining Environmental Clearance and CFE for Nakkapalli Industrial Park RP005 rev. A Final EIA/EMP Report
Chapter 4 Anticipated Environmental Impacts and Mitigation Measures Page 4-134
• Doors and approaches of the storage area shall be of suitable sizes for entry of fork lift and firefighting equipment
• The exhaust of the vehicles- used for the purpose of handling, lifting and transportation within the facility such as forklifts or trucks, will be fitted with the approved type of spark arrester
• In order to have appropriate measures to prevent percolation of spills, leaks etc. to the soil and ground water, the storage area will be provided with concrete floor or steel sheet depending on the characteristics of waste handled and the floor must be structurally sound and chemically compatible with wastes
• Measures will be taken to prevent entry of runoff into the storage area. The Storage area shall be designed in such a way that the floor level is at least 150 mm above the maximum flood level
• The storage area floor will be provided with secondary containment such as proper slopes as well as collection pit so as to collect wash water and the leakages/spills etc.
• All the storage yards will be provided with proper peripheral drainage system connected with the sump so as to collect any accidental spills in roads or within the storage yards as well as accidental flow due to fire fighting.
• Necessary measures for the Storage Drums /Containers: • The container shall be made or lined with the suitable material, which will not react with, or
in other words compatible with the hazardous wastes proposed to be stored. • The stacking of drums in the storage area shall be restricted to three high on pallets
(wooden frames). Necessary precautionary measures will be taken so as to avoid stack collapse. However, for waste having flash point less than 65.50 C, the drums will not be stacked more than one height
• No drums shall be opened in the storage sheds for sampling etc. and such activity will be done in designated places outside the storage areas
• Drums containing wastes stored in the storage area will be labelled properly indicating mainly type, quantity, characteristics, source and date of storing etc.
• Transportation to the TSDF Site - The loading of collection vehicles shall take place in either of the following ways:
• Waste stored in large-capacity tanks are either drained or pumped into collection vehicles • Waste stored in sealed drums or sealed containers are loaded by hand or by mechanical
equipment onto trucks • Loading and unloading operation to ensure no waste spill • In case of accidental spill all transport vehicles will be equipped with suitable materials or
equipment to contain, manage and remove accidental spillages
The process flow sheet for the management of Industrial Hazardous and Non-hazardous waste management is shown in Figure 4-47.
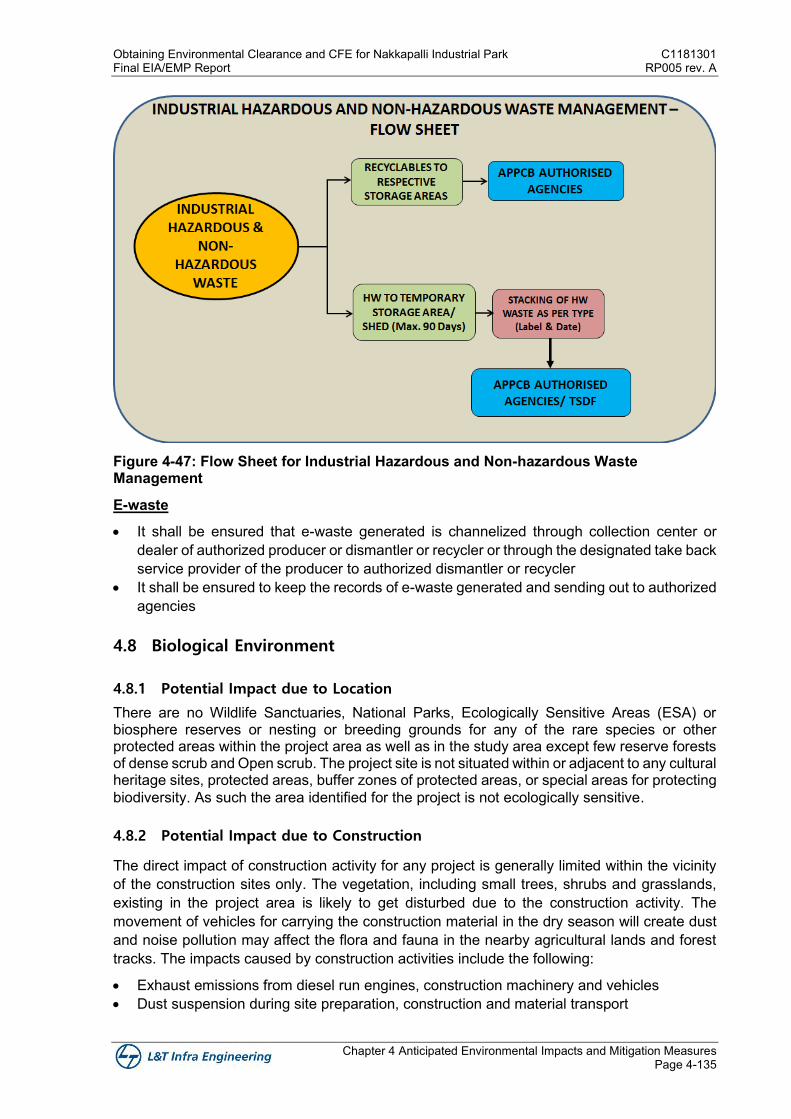
Obtaining Environmental Clearance and CFE for Nakkapalli Industrial Park C1181301 Final EIA/EMP Report RP005 rev. A
Chapter 4 Anticipated Environmental Impacts and Mitigation Measures Page 4-135
Figure 4-47: Flow Sheet for Industrial Hazardous and Non-hazardous Waste Management
E-waste
• It shall be ensured that e-waste generated is channelized through collection center or dealer of authorized producer or dismantler or recycler or through the designated take back service provider of the producer to authorized dismantler or recycler
• It shall be ensured to keep the records of e-waste generated and sending out to authorized agencies
4.8 Biological Environment
4.8.1 Potential Impact due to Location
There are no Wildlife Sanctuaries, National Parks, Ecologically Sensitive Areas (ESA) or biosphere reserves or nesting or breeding grounds for any of the rare species or other protected areas within the project area as well as in the study area except few reserve forests of dense scrub and Open scrub. The project site is not situated within or adjacent to any cultural heritage sites, protected areas, buffer zones of protected areas, or special areas for protecting biodiversity. As such the area identified for the project is not ecologically sensitive.
4.8.2 Potential Impact due to Construction
The direct impact of construction activity for any project is generally limited within the vicinity of the construction sites only. The vegetation, including small trees, shrubs and grasslands, existing in the project area is likely to get disturbed due to the construction activity. The movement of vehicles for carrying the construction material in the dry season will create dust and noise pollution may affect the flora and fauna in the nearby agricultural lands and forest tracks. The impacts caused by construction activities include the following:
• Exhaust emissions from diesel run engines, construction machinery and vehicles • Dust suspension during site preparation, construction and material transport
C1181301 Obtaining Environmental Clearance and CFE for Nakkapalli Industrial Park RP005 rev. A Final EIA/EMP Report
Chapter 4 Anticipated Environmental Impacts and Mitigation Measures Page 4-136
• Noise caused by vehicles transporting construction material • Noise caused by handling of construction materials • Noise and Exhaust emissions from diesel run engines of construction machinery
During construction the transport of construction material will cause dust emission, emission of exhaust gases from vehicles such as CO2, CO and NOx. The fugitive dust may coat the leaves of plants and trees. Fauna that occur in the project area and surroundings may be disturbed by the sound of vehicles, construction and construction equipment.
4.8.2.1 Mitigation Measures
Preservation of top fertile soil of 20 cm width is to be done which can be used in future green belt development plan to the extent possible. Tree species of evergreen, dust suppression, wind break, noise attenuation in Green belt development is effective in controlling the microclimate and act as heat sink of the core zone/project site.
Spraying of water during handling of construction materials like sand and gravel will minimise dust emission. Properly maintained vehicles will produce reduced noxious emission. And the temporary labour camps must have proper sanitation facilities. The impacts caused by construction to fauna are temporary and not long term and most (if not all) the observed and documented flora and fauna of the project area will adapt to these impacts.
4.8.2.2 Impacts on Flora
The field investigation and satellite imagery data show, that the study area is a mixture of agricultural and scrubland. The core area is mostly flat with agricultural lands, Cashew-Coconut-Eucalyptus- Casuarina plantation followed by undulating small hillocks and low lying back water area. Trees such as Borassus flabellifer, Cocos nucifera, Phoenix sylvestris, Acacia nilotica are commonly distributed along the bunds of the fields and in open spaces. It is also observed that in back water low-lying area a small patch of aqua-culture practises are were also noticed.
The proposed project construction activities may involve removal or thinning of some vegetation. Under the Greenbelt development plan suitable species of herbs and trees will be used for plantations based on “Guidelines for Developing Greenbelt” published by Central Pollution Control Board (CPCB) by involving local forest department or local community people. Tree species of evergreen, dust suppression, wind break, noise attenuation in Green belt development will be effective in controlling the microclimate and act as heat sink of the core zone.
Since few patches of forest areas are located in the buffer area, it will be taken utmost precautions not to degrade these areas by constructing temporary roads, dumping materials, solid wastes, garbage or any other form of material into the surrounding grasslands. Project activities may not have any significant impacts on the vegetation of the surrounding forest tracks. Threatened species such as Cleistanthus collinus noticed in the Payakaraopet Reserve Forest which is on the north direction at 8.0 km distance from the site area. No direct impact is envisaged due to proposed project.
4.8.2.3 Impacts on Fauna
The large-scale construction activities in the proposed core area and related roads and transmission lines would involve movement of vehicle and people, digging of soil, material loading, and erection of towers and stringing of conductors, etc.
Obtaining Environmental Clearance and CFE for Nakkapalli Industrial Park C1181301 Final EIA/EMP Report RP005 rev. A
Chapter 4 Anticipated Environmental Impacts and Mitigation Measures Page 4-137
During the survey, a total of 111 species were recorded in the buffer area which include Mammals 10 sp., Birds 52 sp., Herpetofauna 12 sp., Invertebrates 29 sp. and Fishes with 8 sp. Key species includes Indian fox (Vulpes bengalensis), Indian Wild Boar (Sus scrofa cristatus) Common Indian Mongoose (Herpestes javanicus), Three Striped palm squirrel (Funambulus palmarum), Little Indian Field mouse (Mus booduga) and Black-naped hare (Lepus nigricollis) are the common species. The common bird species of the area include Cattle Egret (Bubulcus ibis), Black Kite (Milvus migrans), Rose ringed Parakeet (Psittacula krameri), Alexandrine Parakeet (Psittacula eupatria), Asian openbill (Anastomus oscitans), White breasted kingfisher (Halcyon smyrnensis) and Lesser pied kingfisher (Ceryle rudis). Power lines are often known to be the main reason for bird collision and death. The bird collision incidences are normally species specific and vary seasonally. It is therefore recommended that power lines shall be laid carefully. It is suggested that maximum precautions should be taken during construction phase and as well as during operational phases.
Indian peafowl (Pavo cristatus) is common sighted nearby forest tracks in the study area. Near Threatened species namely Alexandrine Parakeet (Psittacula eupatria) and Painted stork (Mycteria leucocephala) are noticed near the costal plantation and back water area of buffer zone. No direct impact is envisaged due to proposed project.
Following are the measures proposed to minimize the impact on Flora and Fauna in the study area.
4.8.2.4 Mitigation measures
• Underground cables are proposed for power supply in the proposed I.P which will reduce the impact of bird collision
• Do not cause any direct or indirect disturbances to forest plantation and water bodies located in study area
• Discharge of waste/wastewater without treatment into the water bodies during the construction and operation would not be allowed
• Awareness will be given to workers about the importance and conservation of terrestrial ecology and biodiversity
• Strong regulations controlling timing and traffic volume need to be built in the roads through reserve forest
• Speed reduction is must to reduce wild animal mortality which can be achieved through imposing speed limits and speed breaks.
• No use of horns within roads passing through protected areas • Establishment of forest check posts by the forest department at entry and exit points • The dust pollution must be reduced by sprinkling of water on the roads used for vehicular
movement for construction activity. • On the periphery of the reserve forest native plantation shall be raised to improve the green
cover and act as barrier to reduce the impact of sound pollution. Native perennial shrubs and soil binders such as perennial grasses shall be planted.
The project area and the adjoining areas shares similar habitat and thus clearing of ground will not eliminate habitat of any species permanently. Ecological restoration is about a broad set of activities (enhancing, repairing, or reconstructing degraded ecosystems and optimizing biodiversity returns). In essence, the restoration of the habitat loss due to the present project activity is based on ecosystem reconstruction at the project site. In this view, it is proposed to plant the native trees and undertake development of green belt in the project area at all possible places. This will also enhance the native faunal population.
C1181301 Obtaining Environmental Clearance and CFE for Nakkapalli Industrial Park RP005 rev. A Final EIA/EMP Report
Chapter 4 Anticipated Environmental Impacts and Mitigation Measures Page 4-138
4.8.3 Potential Impact due to Operation
During the Operation phase, activities like emissions, handling hazardous chemicals, noise and vibrations from industries, waste/wastewater generation may tend to alter the microclimatic changes. Movement of vehicles may cause the fauna to flee because of the noise. In addition to the above, dust from vehicles may be respired by the fauna, if not handled properly.
4.8.3.1 Mitigation Measures
It is proposed that all the vehicles in handling the goods will conform to Pollution Under Control (PUC) norms and vehicles will be driven on paved surface throughout the access road.
The activities associated with the proposed activity will have very less impacts on terrestrial flora and fauna of the core area and buffer zone area.

Figures

Chapter 5
Analysis of Alternatives

Obtaining Environmental Clearance and CFE for Nakkapalli Industrial Park C1181301 Final EIA/EMP Report RP005 rev. A
Chapter 5 Analysis of Alternatives Page 5-1
Chapter 5 Analysis of Alternatives
Government of Andhra Pradesh (GoAP) has proposed to develop Vizag – Chennai Industrial Corridor (VCIC) with the financial assistance of Asian Development Bank (ADB). VCIC is a key segment of the East Coast Economic Corridor and also India’s first coastal economic corridor. VCIC is aimed at fulfilling the objectives of the Government of India, Make in India Policy which aimed to promote manufacturing activities.
Visakhapatnam, one of the key districts coming within the immediate influence of VCIC has all the potential to become an industrial hub. Government of Andhra Pradesh (GoAP) has embarked on major initiative of positioning Visakhapatnam District as the central hub for various sunrise sectors in an endeavour to attract investments from National and International Players across the globe.
APIIC has identified land parcel in Visakhapatnam node at Nakkapalli. About 1578 Ha (3899 acres) of land was identified at Butchirajupeta, D.L. Puram, Vempadu, Chandanada, Rajayyapeta villages in Nakkapalli Mandal, of Visakhapatnam District for development of industrial park.
5.1 Criteria for Site Selection
The site proposed for the development of Nakkapalli IP has been earmarked based on the major dynamic factors such as the following:
• Availability of land • Suitability of land in terms of topographical and geological aspects. • Land shall be free from habitation, forest land, least agricultural activity and
archaeological/historical monuments • No or Minimum Rehabilitation and Resettlement (R&R) • Scope for future development • Suitability for phased and integrated development • Proximity and accessibility to state/National highway/railway line • Sustainability and viability of such a development with minimal environmental impacts • Evaluation in accordance with project objectives and compliance with country laws, policies
and legal requirements
Some of the important features of the Site making it suitable for Industrial Park are presented • Strategically located near to four states Andhra Pradesh, Telangana, Chhattisgarh and
Odisha. • The site is located around 60 km from City of Visakhapatnam with well-endowed Social
and educational infrastructure. • The site has good access to logistic facilities. The site is well connected to the Road
network in the region from Chennai - Kolkata National Highway 16 which is at a distance of ~2.9 km on North of the site.
• The nearest Railway station to the project site is at Gullipadu located at 7.2 km towards NW.
• Visakhapatnam Airport is located at a distance of 64 km towards NE. The Airport has direct flight connectivity to international destinations such as Kuala Lumpur, Singapore, Colombo, Dubai, National destinations such as Bangalore, Kolkata, Delhi, Hyderabad, Mumbai, Port Blair, Jagdalpur, Tirupati, Vijayawada, Ahmedabad, Bhubaneswar, Chennai, & Coimbatore.
C1181301 Obtaining Environmental Clearance and CFE for Nakkapalli Industrial Park RP005 rev. A Final EIA/EMP Report
Chapter 5 Analysis of Alternatives Page 5-2
• Gangavaram Port is located at distance of 60 km NE. • Water and Power supply can be assured for the proposed IP will be met from the Yeleru
Left Main Canal (YLMC) in line with the existing industrial water supply policy of the state. APSPDCL is responsible for undertaking distribution of Power in Visakhapatnam District.
The site meets the requirement of all critical factors that are important for success of development of Industrial Park in the state and could be a pre-eminent location.
Chapter 6
Environmental Monitoring
Programme

Obtaining Environmental Clearance and CFE for Nakkapalli Industrial Park C1181301 Final EIA/EMP Report RP005 rev. A
Chapter 6 Environmental Monitoring Programme Page 6-1
Chapter 6 Environmental Monitoring Programme
In this chapter, environmental monitoring programme for the proposed Master Plan of Nakkapalli Industrial Park is discussed. Environmental Monitoring Programme is an important component during environmental management of the project. The institutional mechanism to implement the planned mitigation and monitoring measures during all stages of the project is discussed in Chapter 9. The project management especially the Environmental Management Cell (EMC) (described in Chapter 9) should always go for a rational approach with regards to environmental monitoring. This includes judicious decision making in consultation with institutional stakeholders such as Andhra Pradesh Pollution Control Board (APPCB) or reputed environmental consultants for appropriate changes in the monitoring strategy, i.e., changes in the sampling frequency, sampling location, monitoring parameters and any new/additional requirements.
Following are the main objectives of the environmental monitoring program:
• Provides information for documentation of monitoring of mitigation measures and impacts • To act as a tool for the statutory authorities for unanticipated adverse impacts or sudden
changes in the environmental condition due to the proposed project • Provides information that could be used for evaluating the effectiveness of implemented
mitigation measures • Provides information that could be used to verify predicted impacts and thus validate
impact prediction techniques • Effectiveness of the mitigation measures being followed during construction and
operational phases can be assessed and the measures can be revised, made more stringent and reinforced based on the monitoring results
• Provides guidance to comply with relevant environmental rules/regulations • Environmental Monitoring can also serve a basic component of a periodic environmental
regulatory auditing program for the proposed project • Serves as a tool to monitor and modify the mitigation measures and implementation
arrangements, if any
The environmental monitoring programme for construction as well as operation phases shall be implemented by project proponent. Besides the monitoring, compliances to all Environmental Clearance and CRZ conditions and permits from APPCB/MoEF&CC shall be monitored and reported periodically. The likely significant impacts and mitigation measures will also be monitored.
The environmental attributes to be monitored during construction and operational phases of master plan of the project, sampling locations and frequency of monitoring, applicable standards, etc. are presented in Table 6-1.
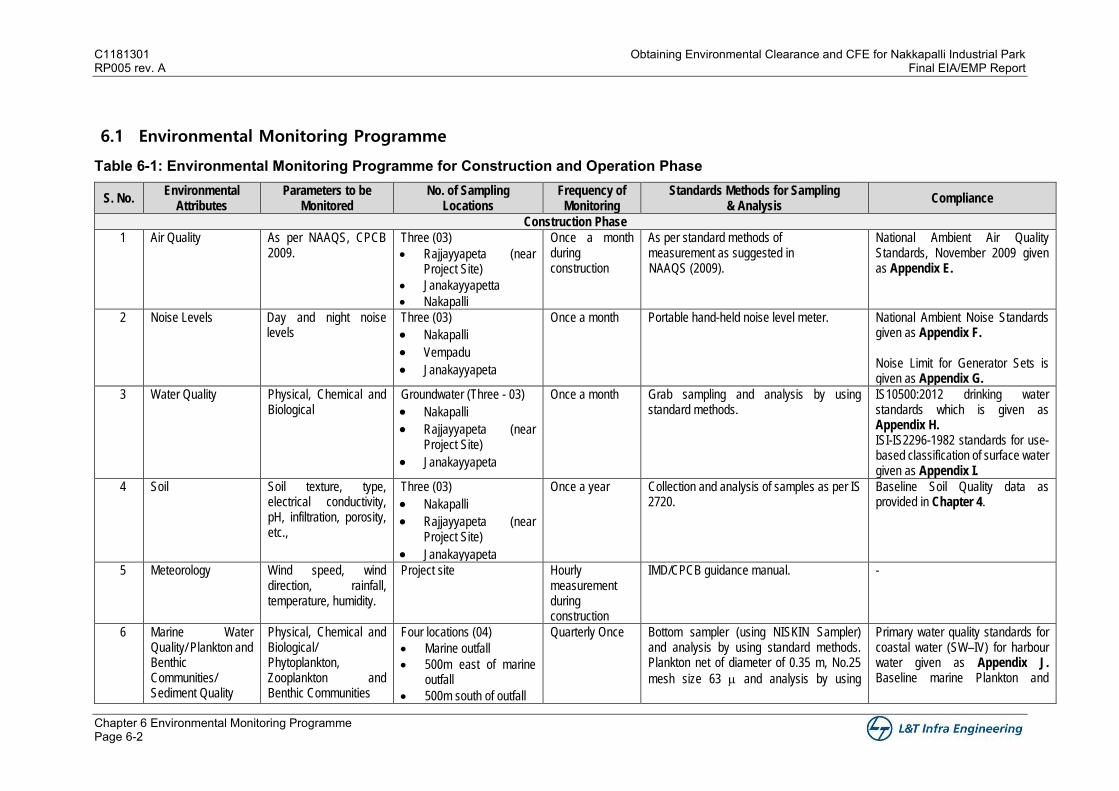
C1181301 Obtaining Environmental Clearance and CFE for Nakkapalli Industrial Park RP005 rev. A Final EIA/EMP Report
Chapter 6 Environmental Monitoring Programme Page 6-2
6.1 Environmental Monitoring Programme
Table 6-1: Environmental Monitoring Programme for Construction and Operation Phase
S. No. Environmental
Attributes Parameters to be
Monitored No. of Sampling
Locations Frequency of
Monitoring Standards Methods for Sampling
& Analysis Compliance
Construction Phase
1 Air Quality As per NAAQS, CPCB 2009.
Three (03)
• Rajjayyapeta (near Project Site)
• Janakayyapetta
• Nakapalli
Once a month during construction
As per standard methods of measurement as suggested in NAAQS (2009).
National Ambient Air Quality Standards, November 2009 given as Appendix E.
2 Noise Levels Day and night noise levels
Three (03)
• Nakapalli • Vempadu • Janakayyapeta
Once a month
Portable hand-held noise level meter. National Ambient Noise Standards given as Appendix F. Noise Limit for Generator Sets is given as Appendix G.
3 Water Quality Physical, Chemical and Biological
Groundwater (Three - 03)
• Nakapalli • Rajjayyapeta (near
Project Site) • Janakayyapeta
Once a month Grab sampling and analysis by using standard methods.
IS10500:2012 drinking water standards which is given as Appendix H. ISI-IS2296-1982 standards for use-based classification of surface water given as Appendix I.
4 Soil Soil texture, type, electrical conductivity, pH, infiltration, porosity, etc.,
Three (03)
• Nakapalli • Rajjayyapeta (near
Project Site) • Janakayyapeta
Once a year Collection and analysis of samples as per IS 2720.
Baseline Soil Quality data as provided in Chapter 4.
5 Meteorology Wind speed, wind direction, rainfall, temperature, humidity.
Project site Hourly measurement during construction
IMD/CPCB guidance manual. -
6 Marine Water Quality/ Plankton and Benthic Communities/ Sediment Quality
Physical, Chemical and Biological/ Phytoplankton, Zooplankton and Benthic Communities
Four locations (04)
• Marine outfall
• 500m east of marine outfall
• 500m south of outfall
Quarterly Once
Bottom sampler (using NISKIN Sampler) and analysis by using standard methods. Plankton net of diameter of 0.35 m, No.25
mesh size 63 and analysis by using
Primary water quality standards for coastal water (SW–IV) for harbour water given as Appendix J. Baseline marine Plankton and
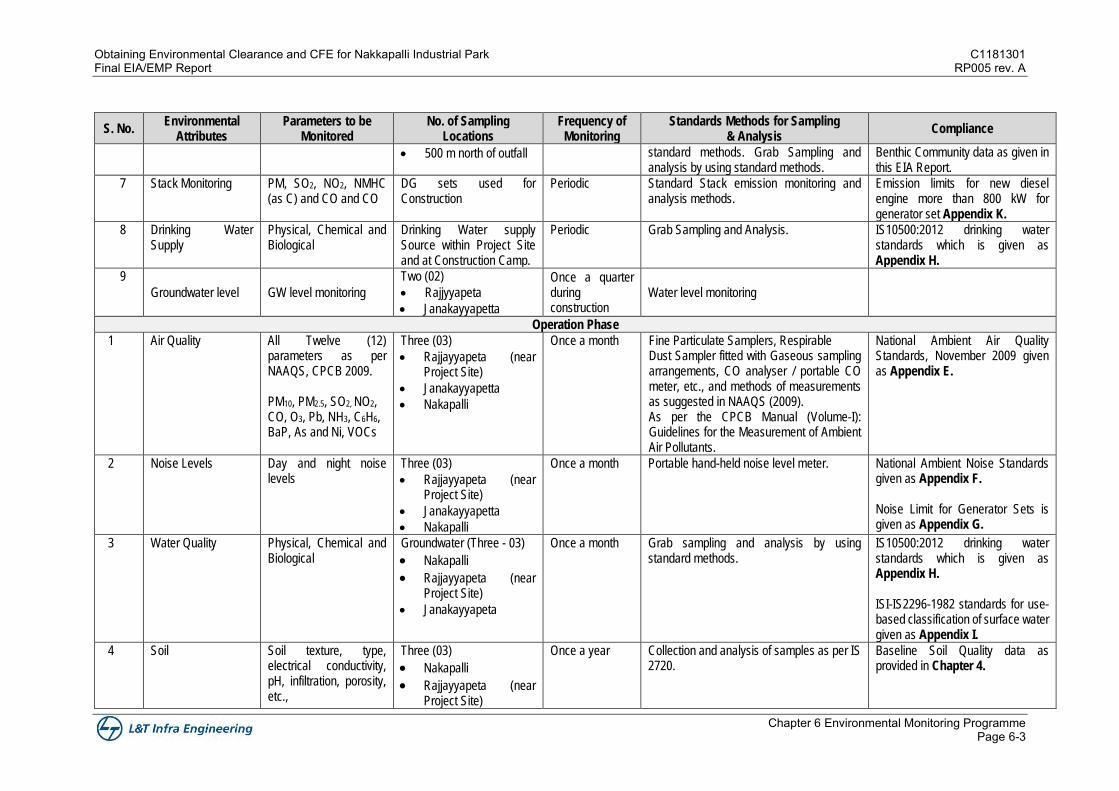
Obtaining Environmental Clearance and CFE for Nakkapalli Industrial Park C1181301 Final EIA/EMP Report RP005 rev. A
Chapter 6 Environmental Monitoring Programme Page 6-3
S. No. Environmental
Attributes Parameters to be
Monitored No. of Sampling
Locations Frequency of
Monitoring Standards Methods for Sampling
& Analysis Compliance
• 500 m north of outfall standard methods. Grab Sampling and analysis by using standard methods.
Benthic Community data as given in this EIA Report.
7 Stack Monitoring PM, SO2, NO2, NMHC (as C) and CO and CO
DG sets used for Construction
Periodic Standard Stack emission monitoring and analysis methods.
Emission limits for new diesel engine more than 800 kW for generator set Appendix K.
8 Drinking Water Supply
Physical, Chemical and Biological
Drinking Water supply Source within Project Site and at Construction Camp.
Periodic Grab Sampling and Analysis. IS10500:2012 drinking water standards which is given as Appendix H.
9
Groundwater level GW level monitoring
Two (02)
• Rajjyyapeta
• Janakayyapetta
Once a quarter during construction
Water level monitoring
Operation Phase
1 Air Quality All Twelve (12) parameters as per NAAQS, CPCB 2009. PM10, PM2.5, SO2, NO2, CO, O3, Pb, NH3, C6H6, BaP, As and Ni, VOCs
Three (03)
• Rajjayyapeta (near Project Site)
• Janakayyapetta
• Nakapalli
Once a month Fine Particulate Samplers, Respirable Dust Sampler fitted with Gaseous sampling arrangements, CO analyser / portable CO meter, etc., and methods of measurements as suggested in NAAQS (2009). As per the CPCB Manual (Volume-I): Guidelines for the Measurement of Ambient Air Pollutants.
National Ambient Air Quality Standards, November 2009 given as Appendix E.
2 Noise Levels Day and night noise levels
Three (03)
• Rajjayyapeta (near Project Site)
• Janakayyapetta
• Nakapalli
Once a month Portable hand-held noise level meter. National Ambient Noise Standards given as Appendix F. Noise Limit for Generator Sets is given as Appendix G.
3 Water Quality Physical, Chemical and Biological
Groundwater (Three - 03)
• Nakapalli • Rajjayyapeta (near
Project Site) • Janakayyapeta
Once a month Grab sampling and analysis by using standard methods.
IS10500:2012 drinking water standards which is given as Appendix H. ISI-IS2296-1982 standards for use-based classification of surface water given as Appendix I.
4 Soil Soil texture, type, electrical conductivity, pH, infiltration, porosity, etc.,
Three (03)
• Nakapalli • Rajjayyapeta (near
Project Site)
Once a year Collection and analysis of samples as per IS 2720.
Baseline Soil Quality data as provided in Chapter 4.
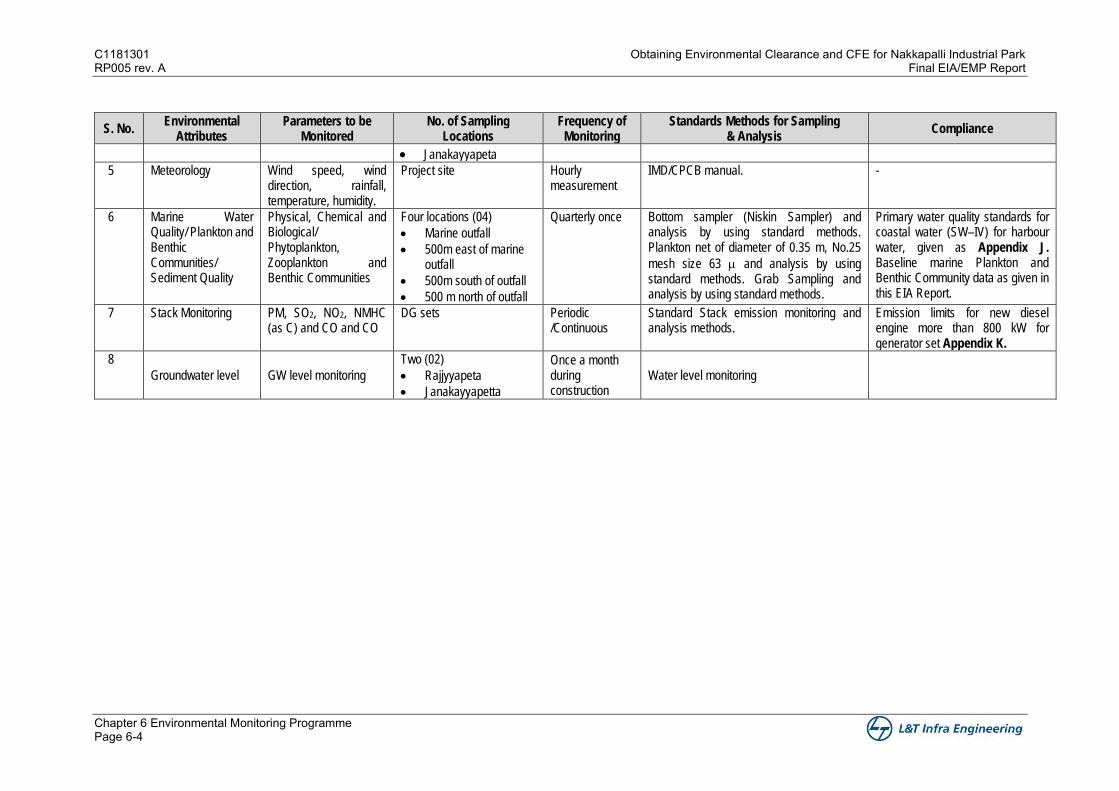
C1181301 Obtaining Environmental Clearance and CFE for Nakkapalli Industrial Park RP005 rev. A Final EIA/EMP Report
Chapter 6 Environmental Monitoring Programme Page 6-4
S. No. Environmental
Attributes Parameters to be
Monitored No. of Sampling
Locations Frequency of
Monitoring Standards Methods for Sampling
& Analysis Compliance
• Janakayyapeta 5 Meteorology Wind speed, wind
direction, rainfall, temperature, humidity.
Project site Hourly measurement
IMD/CPCB manual. -
6 Marine Water Quality/ Plankton and Benthic Communities/ Sediment Quality
Physical, Chemical and Biological/ Phytoplankton, Zooplankton and Benthic Communities
Four locations (04)
• Marine outfall
• 500m east of marine outfall
• 500m south of outfall
• 500 m north of outfall
Quarterly once Bottom sampler (Niskin Sampler) and analysis by using standard methods. Plankton net of diameter of 0.35 m, No.25
mesh size 63 and analysis by using standard methods. Grab Sampling and analysis by using standard methods.
Primary water quality standards for coastal water (SW–IV) for harbour water, given as Appendix J. Baseline marine Plankton and Benthic Community data as given in this EIA Report.
7 Stack Monitoring PM, SO2, NO2, NMHC (as C) and CO and CO
DG sets Periodic /Continuous
Standard Stack emission monitoring and analysis methods.
Emission limits for new diesel engine more than 800 kW for generator set Appendix K.
8
Groundwater level GW level monitoring
Two (02)
• Rajjyyapeta
• Janakayyapetta
Once a month during construction
Water level monitoring
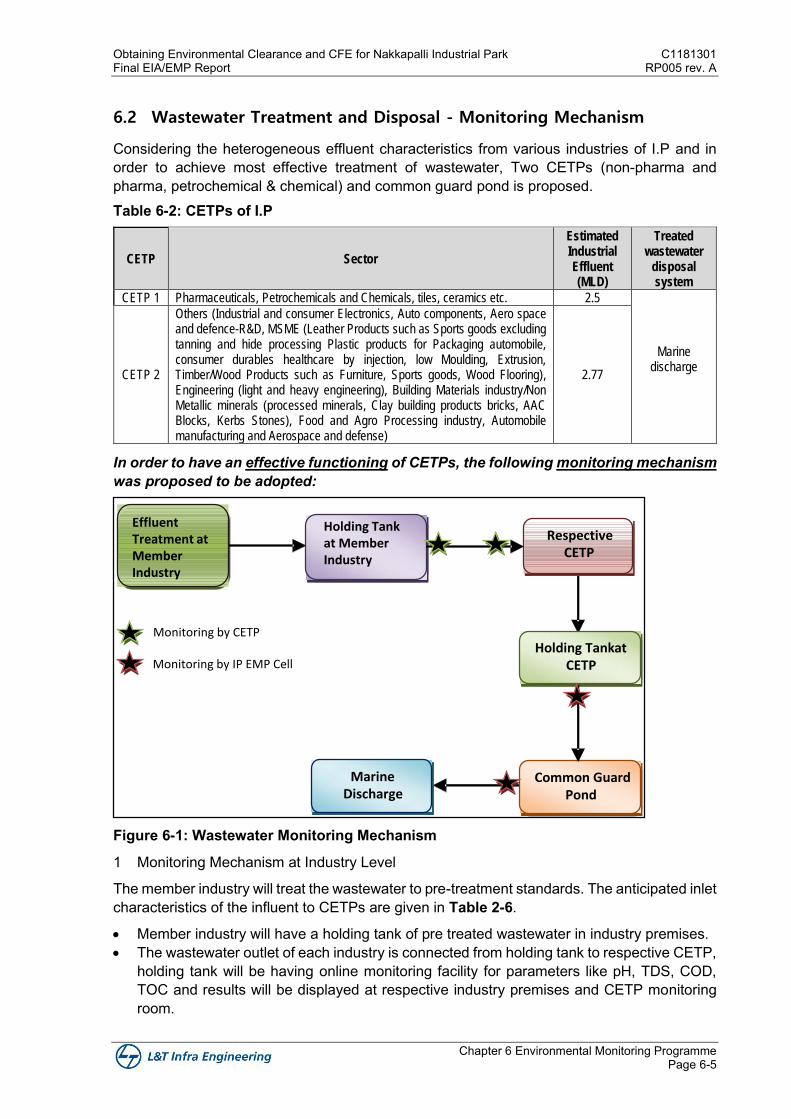
Obtaining Environmental Clearance and CFE for Nakkapalli Industrial Park C1181301 Final EIA/EMP Report RP005 rev. A
Chapter 6 Environmental Monitoring Programme Page 6-5
6.2 Wastewater Treatment and Disposal - Monitoring Mechanism
Considering the heterogeneous effluent characteristics from various industries of I.P and in order to achieve most effective treatment of wastewater, Two CETPs (non-pharma and pharma, petrochemical & chemical) and common guard pond is proposed. Table 6-2: CETPs of I.P
CETP Sector
Estimated Industrial Effluent (MLD)
Treated wastewater
disposal system
CETP 1 Pharmaceuticals, Petrochemicals and Chemicals, tiles, ceramics etc. 2.5
Marine discharge
CETP 2
Others (Industrial and consumer Electronics, Auto components, Aero space and defence-R&D, MSME (Leather Products such as Sports goods excluding tanning and hide processing Plastic products for Packaging automobile, consumer durables healthcare by injection, low Moulding, Extrusion, Timber/Wood Products such as Furniture, Sports goods, Wood Flooring), Engineering (light and heavy engineering), Building Materials industry/Non Metallic minerals (processed minerals, Clay building products bricks, AAC Blocks, Kerbs Stones), Food and Agro Processing industry, Automobile manufacturing and Aerospace and defense)
2.77
In order to have an effective functioning of CETPs, the following monitoring mechanism was proposed to be adopted:
Figure 6-1: Wastewater Monitoring Mechanism
1 Monitoring Mechanism at Industry Level
The member industry will treat the wastewater to pre-treatment standards. The anticipated inlet characteristics of the influent to CETPs are given in Table 2-6.
• Member industry will have a holding tank of pre treated wastewater in industry premises. • The wastewater outlet of each industry is connected from holding tank to respective CETP,
holding tank will be having online monitoring facility for parameters like pH, TDS, COD, TOC and results will be displayed at respective industry premises and CETP monitoring room.
Respective CETP
Holding Tankat CETP
Common Guard Pond
Marine Discharge
Monitoring by CETP
Monitoring by IP EMP Cell
Effluent Treatment at Member Industry
Holding Tank at Member Industry
C1181301 Obtaining Environmental Clearance and CFE for Nakkapalli Industrial Park RP005 rev. A Final EIA/EMP Report
Chapter 6 Environmental Monitoring Programme Page 6-6
• The parameters such as heavy metals shall be monitored by manual sampling and results shall be recorded by respective CETP authority.
• Once the inlet effluent from industry is meeting the desired CETP inlet characteristics, valve will be opened and wastewater will be released to CETP for treatment.
• The lock and key operation of the valve will be totally controlled by respective CETP authority.
• Each industry shall maintain a log sheet of effluent quality/quantity on daily basis and same shall be maintained for future inspections by PCB and CETP authority.
• In case of non-compliance to meet the inlet characteristics of CETP found by CETP authority during the monitoring, member industry shall treat the wastewater until it meets inlet characteristics of CETP.
2 Monitoring at CETP Level
• A monitoring point at inlet of CETP is also suggested to ensure the compliance of CETP inlet characteristics.
• CETP 1 and 2 shall treat the wastewater to meet the marine discharge standards. • Holding tank will be having online monitoring facility for parameters like pH, TDS, COD,
TOC and results will be displayed at respective CETP. • The parameters such as heavy metals shall be monitored by manual sampling and results
shall be recorded by respective IP EMP cell. • If the treated wastewater is meeting the marine discharge and reuse standards, valve will
be opened and treated wastewater will be released to common guard pond proposed near CETP 1.
• The lock and key operation of the valve at CETP holding tank will be totally controlled by IP EMP Cell.
• Each CETP shall maintain a log sheet of inlet/outlet wastewater quality/quantity on daily basis and same shall be maintained for future inspections by PCB and IP EMP cell.
• In case of non-compliance to meet the marine discharge standards at CETP found by IP EMP cell during the monitoring, CETP shall treat the wastewater until it meets marine discharge standards.
3 Monitoring at Common Guard Pond Level
• Treated wastewater from CETP 1 and 2 holding tank will be directed to common guard pond
• Common guard pond shall have 5 days storage capacity. • IP EMP cell shall monitor the treated wastewater quality in common guard pond and only
if it meets the marine discharge standards, it will be let into the marine outfall system. • IP EMP cell shall maintain a log sheet of wastewater quality letting into marine discharge.
6.3 Environmental Monitoring by Member Industries
The environmental monitoring shall be carried out by each member industry as applicable within their industry premises:
• Stack monitoring • ETP inlet/outlet • Cooling tower blow down, if any • Methane and non-methane hydrocarbons
Obtaining Environmental Clearance and CFE for Nakkapalli Industrial Park C1181301 Final EIA/EMP Report RP005 rev. A
Chapter 6 Environmental Monitoring Programme Page 6-7
The member industries should not only limit the environmental monitoring as stated above, environmental monitoring programme in terms of parameters, location and frequency shall be formulated as per the stipulations laid by PCB/MoEF&CC in their respective Environmental Clearance/Consent To Establish (CTE)/Consent To Operate (CTO).
6.4 Compliance Reports
As a part of environmental monitoring programme, following compliance reports shall be submitted to APPCB and Regional Office of MoEF&CC:
• Half yearly compliance report on 1st June and 1st December of each calendar year • Environmental statement for the financial year ending 31st March to APPCB on or before
30th September every year • Annual returns in Form 4 as per Hazardous and other Waste (Management and
Transboundary movement) Rules, 2016 on or before 30th June • Format for maintaining records of hazardous and other waste in Form 3 as per Hazardous
and Other Waste (Management and Transboundary movement) Rules, 2016 • Safety data sheet for hazardous chemicals shall be maintained as per schedule 9 of
MSIHC rules, 1989 (amended 2000) • Format for maintaining notification of major accident in schedule 6 as per MSIHC rules,
1989 (amended 2000) • Half-yearly return in Form VIII as per Batteries (Management and Handling) Rules, 2001
and amendment thereof • Format for maintaining records of E waste in Form 2 as per E-Waste (Management) Rules,
2016.
A MoEF&CC and NABL accredited Laboratory will be appointed by APIIC for conducting regular monitoring of air quality, noise levels, water quality, sediment quality, biological parameters, primary conductivity, chlorophyll estimation and bacterial estimation. Monitoring during construction and operation phases will be carried out by engaging authorized agencies.
6.5 Plantation Monitoring Programme
• Development of nursery • Treatment and sowing of seeds • Survival rate of plant • Planting of seedlings
• Fencing of plantation area • Weeding and soil working • Replacement/Inter planting • Watch and ward of plantation
During operation phase periodic monitoring of plantation growth, manuring, watering, pruning, and replacement will be performed in order to properly maintain vegetation, greenbelt and green cover.
APIIC will establish a large nursery of multi species as a part of green belt development which is being continuously monitored.
6.6 On-site Mock Drills Requirements
On-site mock drills are very important as it helps employees to be aware of the safety procedures and how to react at the time of crisis. Conducting mock drills at regular intervals enhances preparedness and checks the viability of environmental/Disaster Management Plan (DMP). Mock drills are essential for the following reasons:
• Helps in revising/improving the environmental/disaster management plan
C1181301 Obtaining Environmental Clearance and CFE for Nakkapalli Industrial Park RP005 rev. A Final EIA/EMP Report
Chapter 6 Environmental Monitoring Programme Page 6-8
• Helps evaluate whether responsible officials are trained efficiently for unforeseen events • Helps in evaluating whether adequate/appropriate emergency equipment are being
maintained
To ensure efficient environmental/disaster management, project proponent shall conduct periodic on-site mock drills in case of occurrence of activities, such as:
• Fire • Power breakdown • Bomb threats
• War alerts/terrorist attacks • Natural calamities (cyclones, floods,
earthquakes)
Mock drills should also involve fire department, police, municipal authorities, hospitals and other department/agencies that are mandated to provide emergency support. Documenting the outcome of mock drills is an important aspect as this helps in revising the existing plan more efficiently.
Chapter 7
Additional Studies

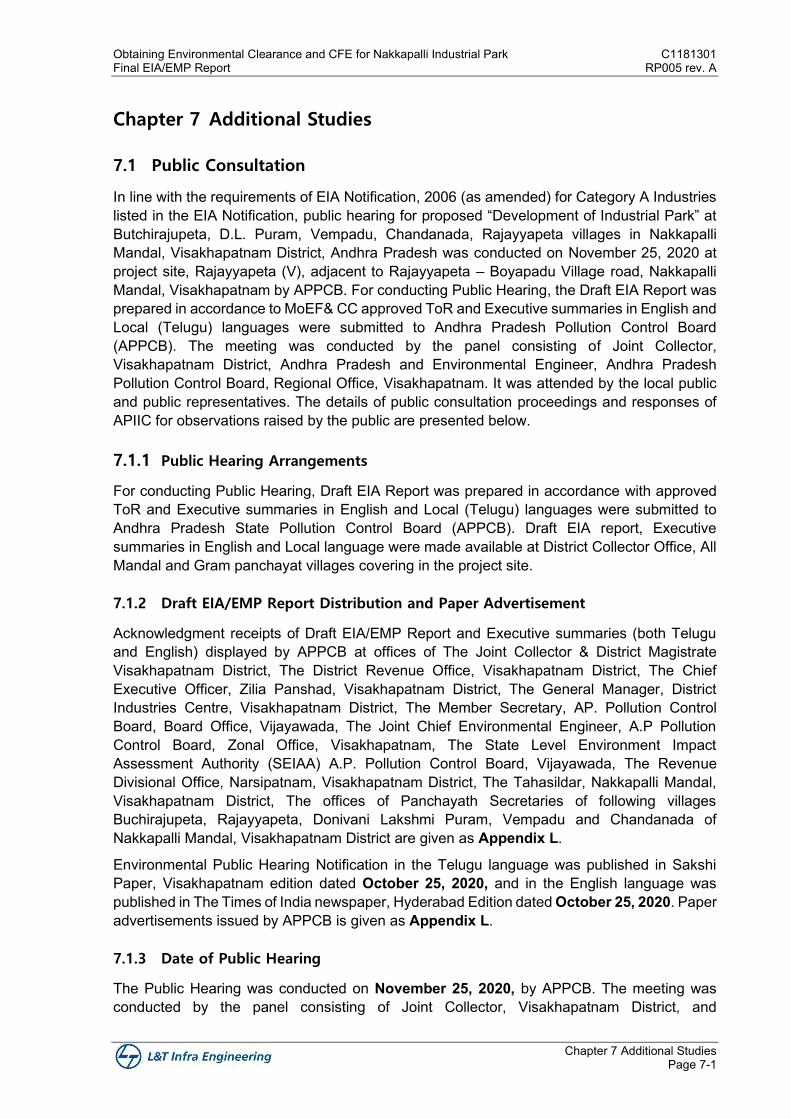
Obtaining Environmental Clearance and CFE for Nakkapalli Industrial Park C1181301 Final EIA/EMP Report RP005 rev. A
Chapter 7 Additional Studies Page 7-1
Chapter 7 Additional Studies
7.1 Public Consultation
In line with the requirements of EIA Notification, 2006 (as amended) for Category A Industries listed in the EIA Notification, public hearing for proposed “Development of Industrial Park” at Butchirajupeta, D.L. Puram, Vempadu, Chandanada, Rajayyapeta villages in Nakkapalli Mandal, Visakhapatnam District, Andhra Pradesh was conducted on November 25, 2020 at project site, Rajayyapeta (V), adjacent to Rajayyapeta – Boyapadu Village road, Nakkapalli Mandal, Visakhapatnam by APPCB. For conducting Public Hearing, the Draft EIA Report was prepared in accordance to MoEF& CC approved ToR and Executive summaries in English and Local (Telugu) languages were submitted to Andhra Pradesh Pollution Control Board (APPCB). The meeting was conducted by the panel consisting of Joint Collector, Visakhapatnam District, Andhra Pradesh and Environmental Engineer, Andhra Pradesh Pollution Control Board, Regional Office, Visakhapatnam. It was attended by the local public and public representatives. The details of public consultation proceedings and responses of APIIC for observations raised by the public are presented below.
7.1.1 Public Hearing Arrangements
For conducting Public Hearing, Draft EIA Report was prepared in accordance with approved ToR and Executive summaries in English and Local (Telugu) languages were submitted to Andhra Pradesh State Pollution Control Board (APPCB). Draft EIA report, Executive summaries in English and Local language were made available at District Collector Office, All Mandal and Gram panchayat villages covering in the project site.
7.1.2 Draft EIA/EMP Report Distribution and Paper Advertisement
Acknowledgment receipts of Draft EIA/EMP Report and Executive summaries (both Telugu and English) displayed by APPCB at offices of The Joint Collector & District Magistrate Visakhapatnam District, The District Revenue Office, Visakhapatnam District, The Chief Executive Officer, Zilia Panshad, Visakhapatnam District, The General Manager, District Industries Centre, Visakhapatnam District, The Member Secretary, AP. Pollution Control Board, Board Office, Vijayawada, The Joint Chief Environmental Engineer, A.P Pollution Control Board, Zonal Office, Visakhapatnam, The State Level Environment Impact Assessment Authority (SEIAA) A.P. Pollution Control Board, Vijayawada, The Revenue Divisional Office, Narsipatnam, Visakhapatnam District, The Tahasildar, Nakkapalli Mandal, Visakhapatnam District, The offices of Panchayath Secretaries of following villages Buchirajupeta, Rajayyapeta, Donivani Lakshmi Puram, Vempadu and Chandanada of Nakkapalli Mandal, Visakhapatnam District are given as Appendix L.
Environmental Public Hearing Notification in the Telugu language was published in Sakshi Paper, Visakhapatnam edition dated October 25, 2020, and in the English language was published in The Times of India newspaper, Hyderabad Edition dated October 25, 2020. Paper advertisements issued by APPCB is given as Appendix L.
7.1.3 Date of Public Hearing
The Public Hearing was conducted on November 25, 2020, by APPCB. The meeting was conducted by the panel consisting of Joint Collector, Visakhapatnam District, and
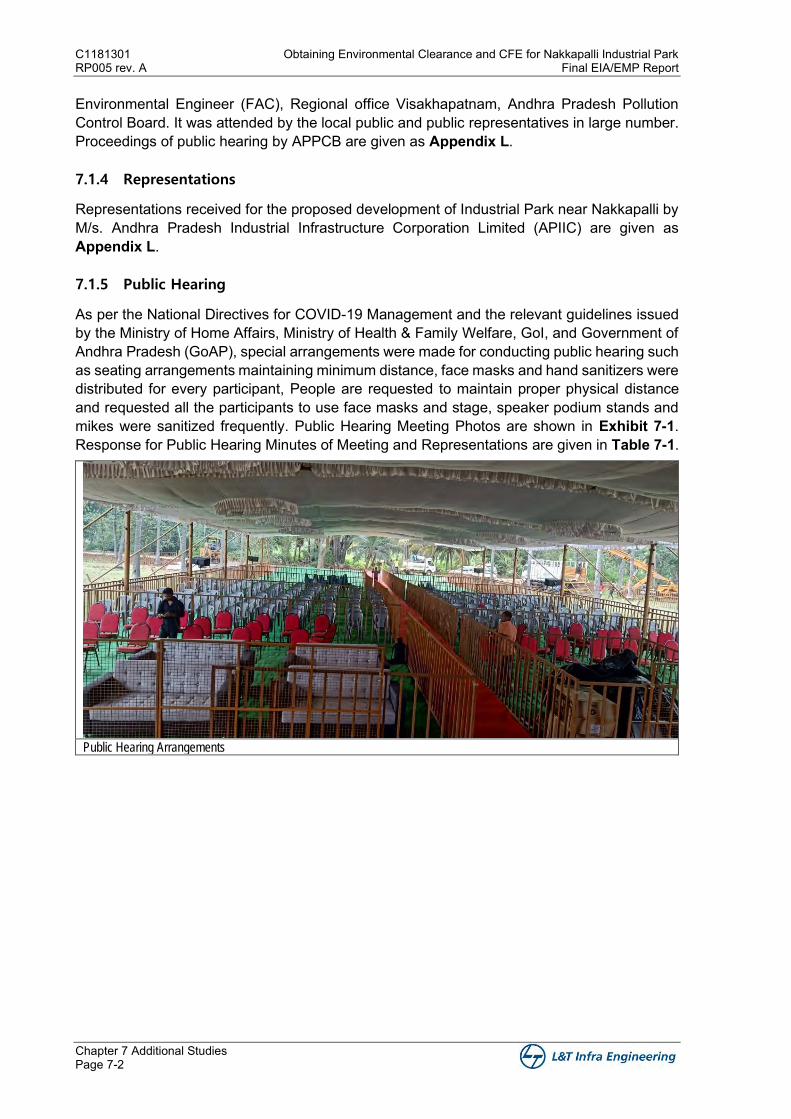
C1181301 Obtaining Environmental Clearance and CFE for Nakkapalli Industrial Park RP005 rev. A Final EIA/EMP Report
Chapter 7 Additional Studies Page 7-2
Environmental Engineer (FAC), Regional office Visakhapatnam, Andhra Pradesh Pollution Control Board. It was attended by the local public and public representatives in large number. Proceedings of public hearing by APPCB are given as Appendix L.
7.1.4 Representations
Representations received for the proposed development of Industrial Park near Nakkapalli by M/s. Andhra Pradesh Industrial Infrastructure Corporation Limited (APIIC) are given as Appendix L.
7.1.5 Public Hearing
As per the National Directives for COVID-19 Management and the relevant guidelines issued by the Ministry of Home Affairs, Ministry of Health & Family Welfare, GoI, and Government of Andhra Pradesh (GoAP), special arrangements were made for conducting public hearing such as seating arrangements maintaining minimum distance, face masks and hand sanitizers were distributed for every participant, People are requested to maintain proper physical distance and requested all the participants to use face masks and stage, speaker podium stands and mikes were sanitized frequently. Public Hearing Meeting Photos are shown in Exhibit 7-1. Response for Public Hearing Minutes of Meeting and Representations are given in Table 7-1.
Public Hearing Arrangements
Obtaining Environmental Clearance and CFE for Nakkapalli Industrial Park C1181301 Final EIA/EMP Report RP005 rev. A
Chapter 7 Additional Studies Page 7-3
Local Public/ stake holders
Participation of stakeholders in the public Hearing
Exhibit 7-1: Public Hearing Meeting Photos
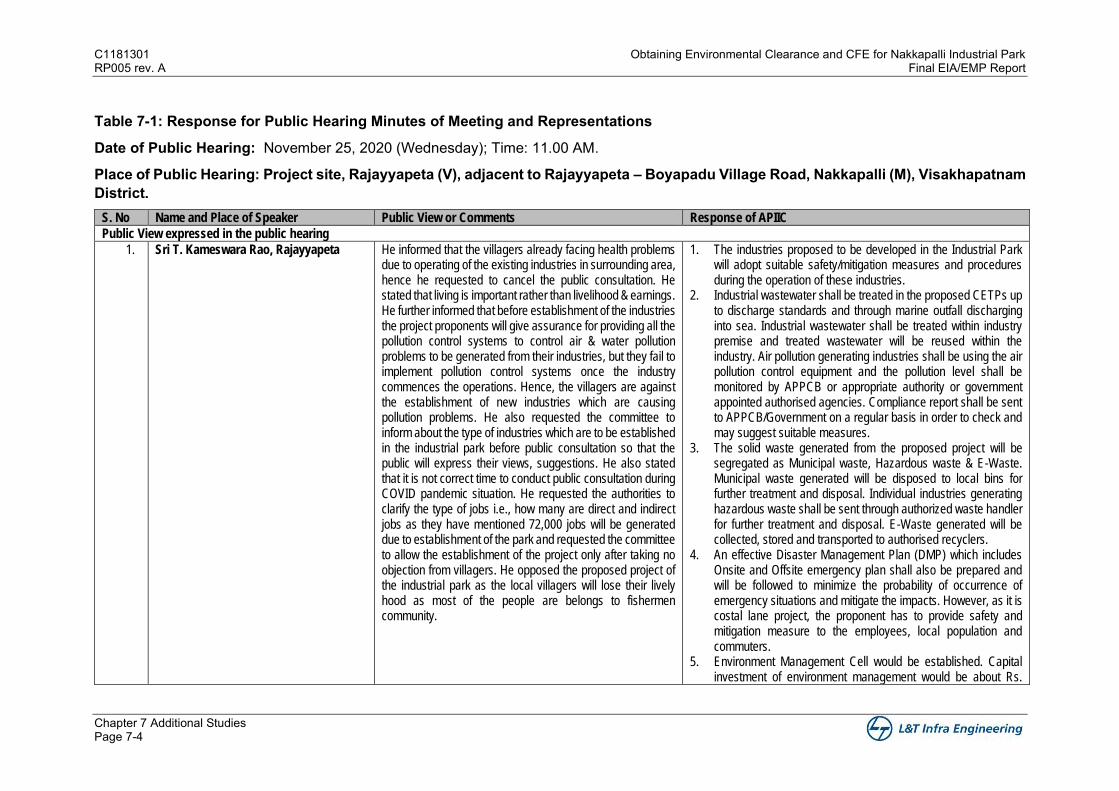
C1181301 Obtaining Environmental Clearance and CFE for Nakkapalli Industrial Park RP005 rev. A Final EIA/EMP Report
Chapter 7 Additional Studies Page 7-4
Table 7-1: Response for Public Hearing Minutes of Meeting and Representations
Date of Public Hearing: November 25, 2020 (Wednesday); Time: 11.00 AM.
Place of Public Hearing: Project site, Rajayyapeta (V), adjacent to Rajayyapeta – Boyapadu Village Road, Nakkapalli (M), Visakhapatnam District.
S. No Name and Place of Speaker Public View or Comments Response of APIIC
Public View expressed in the public hearing
1. Sri T. Kameswara Rao, Rajayyapeta He informed that the villagers already facing health problems due to operating of the existing industries in surrounding area, hence he requested to cancel the public consultation. He stated that living is important rather than livelihood & earnings. He further informed that before establishment of the industries the project proponents will give assurance for providing all the pollution control systems to control air & water pollution problems to be generated from their industries, but they fail to implement pollution control systems once the industry commences the operations. Hence, the villagers are against the establishment of new industries which are causing pollution problems. He also requested the committee to inform about the type of industries which are to be established in the industrial park before public consultation so that the public will express their views, suggestions. He also stated that it is not correct time to conduct public consultation during COVID pandemic situation. He requested the authorities to clarify the type of jobs i.e., how many are direct and indirect jobs as they have mentioned 72,000 jobs will be generated due to establishment of the park and requested the committee to allow the establishment of the project only after taking no objection from villagers. He opposed the proposed project of the industrial park as the local villagers will lose their lively hood as most of the people are belongs to fishermen community.
1. The industries proposed to be developed in the Industrial Park will adopt suitable safety/mitigation measures and procedures during the operation of these industries.
2. Industrial wastewater shall be treated in the proposed CETPs up to discharge standards and through marine outfall discharging into sea. Industrial wastewater shall be treated within industry premise and treated wastewater will be reused within the industry. Air pollution generating industries shall be using the air pollution control equipment and the pollution level shall be monitored by APPCB or appropriate authority or government appointed authorised agencies. Compliance report shall be sent to APPCB/Government on a regular basis in order to check and may suggest suitable measures.
3. The solid waste generated from the proposed project will be segregated as Municipal waste, Hazardous waste & E-Waste. Municipal waste generated will be disposed to local bins for further treatment and disposal. Individual industries generating hazardous waste shall be sent through authorized waste handler for further treatment and disposal. E-Waste generated will be collected, stored and transported to authorised recyclers.
4. An effective Disaster Management Plan (DMP) which includes Onsite and Offsite emergency plan shall also be prepared and will be followed to minimize the probability of occurrence of emergency situations and mitigate the impacts. However, as it is costal lane project, the proponent has to provide safety and mitigation measure to the employees, local population and commuters.
5. Environment Management Cell would be established. Capital investment of environment management would be about Rs.
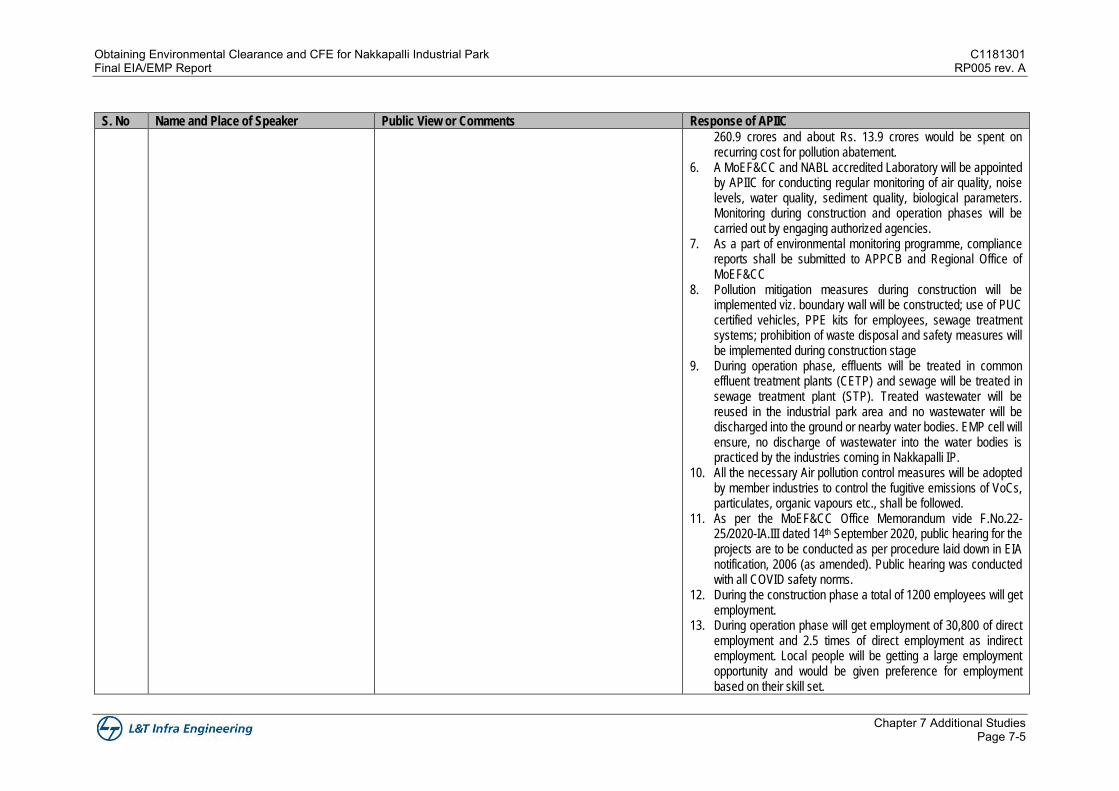
Obtaining Environmental Clearance and CFE for Nakkapalli Industrial Park C1181301 Final EIA/EMP Report RP005 rev. A
Chapter 7 Additional Studies Page 7-5
S. No Name and Place of Speaker Public View or Comments Response of APIIC
260.9 crores and about Rs. 13.9 crores would be spent on recurring cost for pollution abatement.
6. A MoEF&CC and NABL accredited Laboratory will be appointed by APIIC for conducting regular monitoring of air quality, noise levels, water quality, sediment quality, biological parameters. Monitoring during construction and operation phases will be carried out by engaging authorized agencies.
7. As a part of environmental monitoring programme, compliance reports shall be submitted to APPCB and Regional Office of MoEF&CC
8. Pollution mitigation measures during construction will be implemented viz. boundary wall will be constructed; use of PUC certified vehicles, PPE kits for employees, sewage treatment systems; prohibition of waste disposal and safety measures will be implemented during construction stage
9. During operation phase, effluents will be treated in common effluent treatment plants (CETP) and sewage will be treated in sewage treatment plant (STP). Treated wastewater will be reused in the industrial park area and no wastewater will be discharged into the ground or nearby water bodies. EMP cell will ensure, no discharge of wastewater into the water bodies is practiced by the industries coming in Nakkapalli IP.
10. All the necessary Air pollution control measures will be adopted by member industries to control the fugitive emissions of VoCs, particulates, organic vapours etc., shall be followed.
11. As per the MoEF&CC Office Memorandum vide F.No.22-25/2020-IA.III dated 14th September 2020, public hearing for the projects are to be conducted as per procedure laid down in EIA notification, 2006 (as amended). Public hearing was conducted with all COVID safety norms.
12. During the construction phase a total of 1200 employees will get employment.
13. During operation phase will get employment of 30,800 of direct employment and 2.5 times of direct employment as indirect employment. Local people will be getting a large employment opportunity and would be given preference for employment based on their skill set.
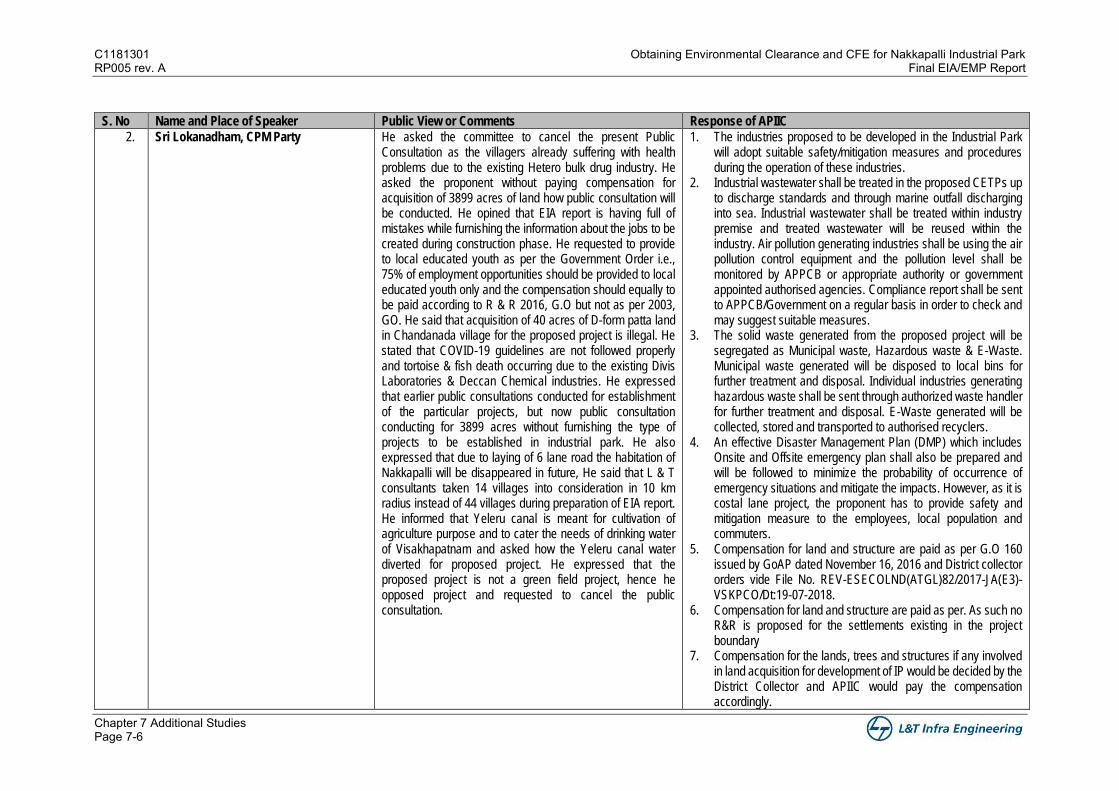
C1181301 Obtaining Environmental Clearance and CFE for Nakkapalli Industrial Park RP005 rev. A Final EIA/EMP Report
Chapter 7 Additional Studies Page 7-6
S. No Name and Place of Speaker Public View or Comments Response of APIIC
2. Sri Lokanadham, CPM Party He asked the committee to cancel the present Public Consultation as the villagers already suffering with health problems due to the existing Hetero bulk drug industry. He asked the proponent without paying compensation for acquisition of 3899 acres of land how public consultation will be conducted. He opined that EIA report is having full of mistakes while furnishing the information about the jobs to be created during construction phase. He requested to provide to local educated youth as per the Government Order i.e., 75% of employment opportunities should be provided to local educated youth only and the compensation should equally to be paid according to R & R 2016, G.O but not as per 2003, GO. He said that acquisition of 40 acres of D-form patta land in Chandanada village for the proposed project is illegal. He stated that COVID-19 guidelines are not followed properly and tortoise & fish death occurring due to the existing Divis Laboratories & Deccan Chemical industries. He expressed that earlier public consultations conducted for establishment of the particular projects, but now public consultation conducting for 3899 acres without furnishing the type of projects to be established in industrial park. He also expressed that due to laying of 6 lane road the habitation of Nakkapalli will be disappeared in future, He said that L & T consultants taken 14 villages into consideration in 10 km radius instead of 44 villages during preparation of EIA report. He informed that Yeleru canal is meant for cultivation of agriculture purpose and to cater the needs of drinking water of Visakhapatnam and asked how the Yeleru canal water diverted for proposed project. He expressed that the proposed project is not a green field project, hence he opposed project and requested to cancel the public consultation.
1. The industries proposed to be developed in the Industrial Park will adopt suitable safety/mitigation measures and procedures during the operation of these industries.
2. Industrial wastewater shall be treated in the proposed CETPs up to discharge standards and through marine outfall discharging into sea. Industrial wastewater shall be treated within industry premise and treated wastewater will be reused within the industry. Air pollution generating industries shall be using the air pollution control equipment and the pollution level shall be monitored by APPCB or appropriate authority or government appointed authorised agencies. Compliance report shall be sent to APPCB/Government on a regular basis in order to check and may suggest suitable measures.
3. The solid waste generated from the proposed project will be segregated as Municipal waste, Hazardous waste & E-Waste. Municipal waste generated will be disposed to local bins for further treatment and disposal. Individual industries generating hazardous waste shall be sent through authorized waste handler for further treatment and disposal. E-Waste generated will be collected, stored and transported to authorised recyclers.
4. An effective Disaster Management Plan (DMP) which includes Onsite and Offsite emergency plan shall also be prepared and will be followed to minimize the probability of occurrence of emergency situations and mitigate the impacts. However, as it is costal lane project, the proponent has to provide safety and mitigation measure to the employees, local population and commuters.
5. Compensation for land and structure are paid as per G.O 160 issued by GoAP dated November 16, 2016 and District collector orders vide File No. REV-ESECOLND(ATGL)82/2017-JA(E3)-VSKPCO/Dt:19-07-2018.
6. Compensation for land and structure are paid as per. As such no R&R is proposed for the settlements existing in the project boundary
7. Compensation for the lands, trees and structures if any involved in land acquisition for development of IP would be decided by the District Collector and APIIC would pay the compensation accordingly.
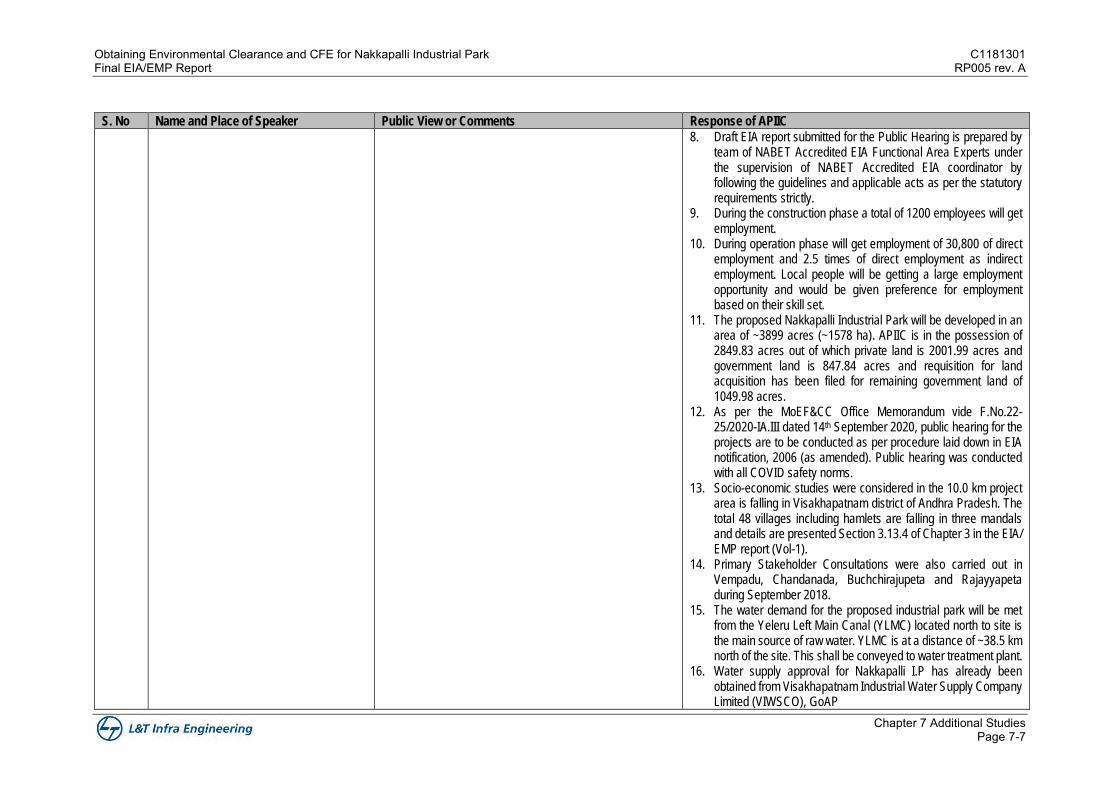
Obtaining Environmental Clearance and CFE for Nakkapalli Industrial Park C1181301 Final EIA/EMP Report RP005 rev. A
Chapter 7 Additional Studies Page 7-7
S. No Name and Place of Speaker Public View or Comments Response of APIIC
8. Draft EIA report submitted for the Public Hearing is prepared by team of NABET Accredited EIA Functional Area Experts under the supervision of NABET Accredited EIA coordinator by following the guidelines and applicable acts as per the statutory requirements strictly.
9. During the construction phase a total of 1200 employees will get employment.
10. During operation phase will get employment of 30,800 of direct employment and 2.5 times of direct employment as indirect employment. Local people will be getting a large employment opportunity and would be given preference for employment based on their skill set.
11. The proposed Nakkapalli Industrial Park will be developed in an area of ~3899 acres (~1578 ha). APIIC is in the possession of 2849.83 acres out of which private land is 2001.99 acres and government land is 847.84 acres and requisition for land acquisition has been filed for remaining government land of 1049.98 acres.
12. As per the MoEF&CC Office Memorandum vide F.No.22-25/2020-IA.III dated 14th September 2020, public hearing for the projects are to be conducted as per procedure laid down in EIA notification, 2006 (as amended). Public hearing was conducted with all COVID safety norms.
13. Socio-economic studies were considered in the 10.0 km project area is falling in Visakhapatnam district of Andhra Pradesh. The total 48 villages including hamlets are falling in three mandals and details are presented Section 3.13.4 of Chapter 3 in the EIA/ EMP report (Vol-1).
14. Primary Stakeholder Consultations were also carried out in Vempadu, Chandanada, Buchchirajupeta and Rajayyapeta during September 2018.
15. The water demand for the proposed industrial park will be met from the Yeleru Left Main Canal (YLMC) located north to site is the main source of raw water. YLMC is at a distance of ~38.5 km north of the site. This shall be conveyed to water treatment plant.
16. Water supply approval for Nakkapalli I.P has already been obtained from Visakhapatnam Industrial Water Supply Company Limited (VIWSCO), GoAP
C1181301 Obtaining Environmental Clearance and CFE for Nakkapalli Industrial Park RP005 rev. A Final EIA/EMP Report
Chapter 7 Additional Studies Page 7-8
S. No Name and Place of Speaker Public View or Comments Response of APIIC
3. Sri M. Appala Raju, District Member CPM Party
He said that Public Consultation Notification was issued 30 days before in English & Telugu papers and the EIA report was not displayed in the Panchayat Offices. He said that without proper information, how public express their grievances and how the public consultation is being conducted? He stated that without understanding the apprehensions of surrounding villagers, how the authorities are conducting the public consultation and informed that establishment of bulk drug, chemical and petroleum product industries near to habitation should be withdrawn. As per the EIA report, 2.0 Crore litres of water is required and the withdrawal of water from Yeleru canal is not possible, hence there may be chances of withdrawal of the water from bore wells leads to depletion of the groundwater. As per Environmental Experts survey, Visakhapatnam is classified under Red Zone and not to allow single polluting industry in Visakhapatnam District, then how highly polluting Pharma industries will be proposed in Visakhapatnam District. He stated that with regard to job opportunities, the existing industries in Visakhapatnam district are not providing jobs to the local people. He expressed that conducting the public consultation at a time for entire 3899acres of land which belongs to 11 villages and 5 panchayats is not correct and also expressed that details of type and no. of industries proposed, no. of job opportunities to be arised due to proposed project not mentioned clearly in the EIA report. He informed that during 2010 a notification issued regarding land acquisition, but no proper compensation distributed to the villagers, then the villagers approached the Hon’ble High Court. He stated that in 2016, the Government tried for land acquisition by paying Rs.18 Lakhs per acre and some of the farmers have given their lands and compensation should be paid to D-patta lands on par with the Jirayath lands. He informed that acquisition of land for establishment of international airport 32 lakhs compensation paid per acre in Vijayawada and why the same compensation is not paid in Nakkapalli area for D-patta lands and cultivated lands on par with the Jirayath lands. He said that compensation to be paid
1. Environmental Public Hearing Notification in the Telugu language was published in Sakshi Paper, Visakhapatnam edition dated October 25, 2020, and in the English language was published in The Times of India newspaper, Hyderabad Edition dated October 25, 2020
2. Acknowledgment receipts of Draft EIA/EMP Report and Executive summaries (both Telugu and English) displayed by APPCB at various Govt. offices and village panchayat offices are given as Appendix L.
3. Focus Sectors for Investment Envisaged in the proposed Industrial Park are Pharmaceuticals, Chemicals and Petrochemicals, Industrial and Consumer Electronics, Auto and Auto components, Aerospace and defence, Light and heavy Engineering (General purpose machinery, Casting and forging and Special purpose machinery etc.), CRZ permissible hazardous material storages, Building Materials Industry/Non-Metallic minerals, MSME (includes Leather, Plastics, wood etc.), Food and Agro Processing Industry and Textile and apparel
4. Zonation plan was prepared for Nakkaplli IP based on MoEF&CC recommendations and CPCB categorizations of industrial activities.
5. Orange, Green and White category Industries like Industrial and consumer electronics, Auto components, Aero space and defence - R&D, Aero engine components, communication devices and MSME are proposed within 50m - 250m from settlement.
6. Red category Industries such as Engineering (light and heavy engineering), Building Materials, Industry/Non - Metallic minerals (processed minerals, Clay building products, bricks, AAC Blocks, Kerbs Stones), Food and Agro Processing Industry, Automobile manufacturing, Aerospace and defence are proposed within 250m - 500m from settlement
7. Red category Industries such as Pharmaceuticals, Chemical, Petrochemical, Tiles, Ceramics and refractories, glass and glassware, graphite, marbles are proposed beyond 500m from settlement.
8. The water demand for the proposed industrial park will be met from the Yeleru Left Main Canal (YLMC) located north to site is
Obtaining Environmental Clearance and CFE for Nakkapalli Industrial Park C1181301 Final EIA/EMP Report RP005 rev. A
Chapter 7 Additional Studies Page 7-9
S. No Name and Place of Speaker Public View or Comments Response of APIIC
as per 2013 R & R G.O and expressed that regarding compensation to Trees, a G.O. 268 released in 2016 and accordingly compensation of Rs. 4000/- per tree to be paid to Coconut, Cashew & Mango trees. He said that there is disparity in payment of compensation to the houses in Nooraparra, Patìmerra, ThummaLapeta, Thambayyapeta. Karrivada, Chandanada villages and requested to return tax which is collected from the villagers during acquisition of houses. He finally requested to cancel the proposed project and not to establish coastal corridor project till implementation of R&R plan as per section 38, 2013 land Acquisition act.
the main source of raw water. YLMC is at a distance of ~38.5 km north of the site. This shall be conveyed to water treatment plant.
9. Water supply approval for Nakkapalli I.P has already been obtained from Visakhapatnam Industrial Water Supply Company Limited (VIWSCO), GoAP.
10. The withdrawal of groundwater is not envisaged as a part of proposed development. Strategic plans such as
a. Roof-top rainwater harvesting b. Rainwater storage ponds/tanks
are proposed for ground water recharging purposes in Project site. 11. Declared Visakhapatnam critically polluted cluster bowl area is
around 62 km from Nakkapalli project area. 12. During the construction phase a total of 1200 employees will get
employment. 13. During operation phase will get employment of 30,800 of direct
employment and 2.5 times of direct employment as indirect employment. Local people will be getting a large employment opportunity and would be given preference for employment based on their skill set.
14. Compensation for land and structure are paid as per G.O 160 issued by GoAP dated November 16, 2016 and District collector orders vide File No. REV-ESECOLND(ATGL)82/2017-JA(E3)-VSKPCO/Dt:19-07-2018.
15. Compensation for land and structure are paid as per G.O 160. As such no R&R is proposed for the settlements existing in the project boundary
16. Compensation for the lands, trees and structures if any involved in land acquisition for development of IP would be decided by the District Collector and APIIC would pay the compensation accordingly.
17. The proposed Nakkapalli Industrial Park will be developed in an area of ~3899 acres (~1578 ha). APIIC is in the possession of 2849.83 acres out of which private land is 2001.99 acres and government land is 847.84 acres and requisition for land acquisition has been filed for remaining government land of 1049.98 acres.
4. Sri M. Rambabu, Rajayyapeta He opposed the proposed project and informed that the Visakha — Chennai Corridor was proposed in the year 2007.
1. The proposed Nakkapalli Industrial Park will be developed in an area of ~3899 acres (~1578 ha). APIIC is in the possession of
C1181301 Obtaining Environmental Clearance and CFE for Nakkapalli Industrial Park RP005 rev. A Final EIA/EMP Report
Chapter 7 Additional Studies Page 7-10
S. No Name and Place of Speaker Public View or Comments Response of APIIC
He informed that APIIC acquired 3899 acres and APIIC visited the villages for land acquisition and informed to the villagers that project would be established after conducting public consultation in each village. He opposed public consultation and said that chemical industries in and around Rajayyapeta village releasing untreated effluents into sea through pipeline. He said that there are about 18 fishermen villages in the surrounding area, whereas due to the establishment of polluted industries the fish catch reduces. On behalf of fishermen he requested to pay 20 lakhs to 25 lakhs for 18 years old citizens and shall provide R&R cards to each family. He requested as per the Government Order, 75% of employment opportunities to be provided to local villagers. He said that the local educated youth should be provided with proper employment, government should provide boats, a super specialty hospital, residential hostel to be provided for fishermen, cold storages to be provided and mini jetty to be established in Nakkapalli. He said that not to relocate Rajayyapeta village for establishment of chemical industries. He requested to pay compensation for trees as per G.O. 268 and to cancel public consultation and not to acquire land till implementation of demands of fisherman.
2849.83 acres out of which private land is 2001.99 acres and government land is 847.84 acres and requisition for land acquisition has been filed for remaining government land of 1049.98 acres.
2. The industries proposed to be developed in the Industrial Park will adopt suitable safety/mitigation measures and procedures during the operation of these industries.
3. Industrial wastewater shall be treated in the proposed CETPs up to discharge standards and through marine outfall discharging into sea. Industrial wastewater shall be treated within industry premise and treated wastewater will be reused within the industry. Air pollution generating industries shall be using the air pollution control equipment and the pollution level shall be monitored by APPCB or appropriate authority or government appointed authorised agencies. Compliance report shall be sent to APPCB/Government on a regular basis in order to check and may suggest suitable measures.
4. The solid waste generated from the proposed project will be segregated as Municipal waste, Hazardous waste & E-Waste. Municipal waste generated will be disposed to local bins for further treatment and disposal. Individual industries generating hazardous waste shall be sent through authorized waste handler for further treatment and disposal. E-Waste generated will be collected, stored and transported to authorised recyclers.
5. An effective Disaster Management Plan (DMP) which includes Onsite and Offsite emergency plan shall also be prepared and will be followed to minimize the probability of occurrence of emergency situations and mitigate the impacts. However, as it is costal lane project, the proponent has to provide safety and mitigation measure to the employees, local population and commuters.
6. Environment Management Cell would be established. Capital investment of environment management would be about Rs. 260.9 crores and about Rs. 13.9 crores would be spent on recurring cost for pollution abatement.
7. As a part of environmental monitoring programme, compliance reports shall be submitted to APPCB and Regional Office of MoEF&CC
Obtaining Environmental Clearance and CFE for Nakkapalli Industrial Park C1181301 Final EIA/EMP Report RP005 rev. A
Chapter 7 Additional Studies Page 7-11
S. No Name and Place of Speaker Public View or Comments Response of APIIC
8. Pollution mitigation measures during construction will be implemented viz. boundary wall will be constructed; use of PUC certified vehicles, PPE kits for employees, sewage treatment systems; prohibition of waste disposal and safety measures will be implemented during construction stage
9. During operation phase, effluents will be treated in common effluent treatment plants (CETP) and sewage will be treated in sewage treatment plant (STP). Treated wastewater will be reused in the industrial park area and no wastewater will be discharged into the ground or nearby water bodies. EMP cell will ensure, no discharge of wastewater into the water bodies is practiced by the industries coming in Nakkapalli IP.
10. All the necessary Air pollution control measures will be adopted by member industries to control the fugitive emissions of VoCs, particulates, organic vapours etc., shall be followed.
11. Compensation for land and structure are paid as per G.O 160 issued by GoAP dated November 16, 2016 and District collector orders vide File No. REV-ESECOLND(ATGL)82/2017-JA(E3)-VSKPCO/Dt:19-07-2018.
12. Compensation for land and structure are paid as per G.O 160. As such no R&R is proposed for the settlements existing in the project boundary
13. Compensation for the lands, trees and structures if any involved in land acquisition for development of IP would be decided by the District Collector and APIIC would pay the compensation accordingly.
14. During the construction phase a total of 1200 employees will get employment.
15. During operation phase will get employment of 30,800 of direct employment and 2.5 times of direct employment as indirect employment. Local people will be getting a large employment opportunity and would be given preference for employment based on their skill set.
16. APIIC is proposing the CSR and CER activities and a separate budget of INR 15.41 Crores were proposed which also covers the welfare of the fishermen community.
17. Skill development training shall be considered under CSR and CER activities to meet the requirement of industries coming up
C1181301 Obtaining Environmental Clearance and CFE for Nakkapalli Industrial Park RP005 rev. A Final EIA/EMP Report
Chapter 7 Additional Studies Page 7-12
S. No Name and Place of Speaker Public View or Comments Response of APIIC
in proposed IP so that local people will be benefitted by the employment in the upcoming industries.
18. Resettlement or Rehabilitation (R&R) is not envisaged. 19. There are settlements in the project site and as the planning of
IP has been done by integrating the settlements around and zoning of industries in the industrial park.
5. Sri Ch. Narasinga Rao, Convenor, BC &SC Vyathirekha Porata Samiti
He opposed the proposed project informed that the Public Consultation to be cancelled as TOM-TOM not conducted in surrounding villages, Public Consultation Notification not circulated in the villages. He stated that 47% people are literate in the surrounding villages, the villagers not aware about the public consultation. He said that land details declared in EIA Report prepared by L&T and the report uploaded in the website are different. He said that in EIA report only Rambilli & Nakkapali Mandals mentioned without mentioning the names of the villages and not disclosed the details of the industries proposed to be established in the Industrial Park. He asked to inform at least one industry name proposed to be established in industrial park and said that earlier PCPR, GO issued in 2013 for acquisition of one lakh acre in 7 MandaIs in Visakhapatnam district & 3 Mandals in East Godavari district was cancelled as the public against the GO. He said that American company proposed to establish petro corridor project/petroleum industries with an investment of 11000 crores few years back was also not established. He raised doubt that which industry provides 30,000 direct/indirect employment opportunities and said that at present no fish in Upputeru. He informed that 20 ft height wall was constructed which is obstruction for air flow to Gangavaram village. He stated that Hetero drugs not giving jobs for villagers. He requested to establish government college in Nakkapalli and Government projects in proposed industrial Park. He said that the industries not providing jobs as per GO issued by Government and requested to implement GO. He informed that Sri. Matam Govind not received compensation for his 3.0 acres of agriculture land and informed that compensation of Rs.1500/- instead of Rs.5,800/- was paid to the villagers for one coconut tree.
1. Environmental Public Hearing Notification in the Telugu language was published in Sakshi Paper, Visakhapatnam edition dated October 25, 2020, and in the English language was published in The Times of India newspaper, Hyderabad Edition dated October 25, 2020.
2. Acknowledgment receipts of Draft EIA/EMP Report and Executive summaries (both Telugu and English) displayed by APPCB at various Govt. offices and village panchayat offices are given as Appendix L
3. Focus Sectors for Investment Envisaged in the proposed Industrial Park are Pharmaceuticals, Chemicals and Petrochemicals, Industrial and Consumer Electronics, Auto and Auto components, Aerospace and defence, Light and heavy Engineering (General purpose machinery, Casting and forging and Special purpose machinery etc.), CRZ permissible hazardous material storages, Building Materials Industry/Non-Metallic minerals, MSME (includes Leather, Plastics, wood etc.), Food and Agro Processing Industry and Textile and apparel
4. During the construction phase a total of 1200 employees will get employment.
5. During operation phase will get employment of 30,800 of direct employment and 2.5 times of direct employment as indirect employment. Local people will be getting a large employment opportunity and would be given preference for employment based on their skill set.
6. APIIC is proposing the CSR and CER activities and a separate budget of INR 15.41 Crores were proposed which also covers the welfare of the fishermen community
7. Skill development training shall be considered under CSR and CER activities to meet the requirement of industries coming up in proposed IP so that local people will be benefitted by the employment in the upcoming industries.
Obtaining Environmental Clearance and CFE for Nakkapalli Industrial Park C1181301 Final EIA/EMP Report RP005 rev. A
Chapter 7 Additional Studies Page 7-13
S. No Name and Place of Speaker Public View or Comments Response of APIIC
6. Sri Rokalla Govind, Chandnada Village He opposed the proposed project and he said that they have protested the PCPIR Corridor by filing a case in Hon’ble High court. He said that public consultation notification not displayed in villages & not conducted TOM- TOM in villages. He informed that without informing about the type & number of industries proposed to be established in the Industrial Park conducting the Public Consultation is not correct.
7. Sri G. Simbadri, National Fisherman Association, D.L. Puram
He opposed the proposed project and he informed that not given TOM-TOM and not creating awareness about the public consultation in the surrounding villages. He said that farmers will get compensation for their agriculture lands, but how fishermen get compensation as the fishermen are depending on fish catching. He said that fish catch was reduced due to pollution of existing Industries and the fishermen are migrated to other places for lively hood. He requested to give compensation properly to the villagers and also requested to construct super specialty hospital and residential hostel for fishermen. He informed that Fishermen are not against the Industries but against the establishment of chemical & polluting industries. He requested the authorities to implement the Government G.O for providing 75% of the total jobs of the proposed project to local educated youth.
8. Sri Tota Appa Rao, Upamaka, Nakkapalli He said that the villagers are not against the industries but villagers are against the establishment of chemical & polluting industries. He said that proper compensation to be paid to the surrounding villagers and preference will be given to the local villagers during recruitment. He requested to establish super specialty hospital and Degree College in Nakkapalli.
1. Focus Sectors for Investment Envisaged in the proposed Industrial Park are Pharmaceuticals, Chemicals and Petrochemicals, Industrial and Consumer Electronics, Auto and Auto components, Aerospace and defence, Light and heavy Engineering (General purpose machinery, Casting and forging and Special purpose machinery etc.), CRZ permissible hazardous material storages, Building Materials Industry/Non-Metallic minerals, MSME (includes Leather, Plastics, wood etc.), Food and Agro Processing Industry and Textile and apparel
2. Zonation plan was prepared for Nakkaplli IP based on MoEF&CC recommendations and CPCB categorizations of industrial activities.
3. Orange, Green and White category Industries like Industrial and consumer electronics, Auto components, Aero space and defence - R&D, Aero engine components, communication
C1181301 Obtaining Environmental Clearance and CFE for Nakkapalli Industrial Park RP005 rev. A Final EIA/EMP Report
Chapter 7 Additional Studies Page 7-14
S. No Name and Place of Speaker Public View or Comments Response of APIIC
devices and MSME etc., are proposed within 50m - 250m from settlement.
4. Red category Industries such as Engineering (light and heavy engineering), Building Materials, Industry/Non - Metallic minerals (processed minerals, Clay building products, bricks, AAC Blocks, Kerbs Stones), Food and Agro Processing Industry, Automobile manufacturing, Aerospace and defence etc., are proposed within 250m - 500m from settlement.
5. Red category Industries such as Pharmaceuticals, Chemical, Petrochemical, Tiles, Ceramics and refractories, glass and glassware, graphite, marbles are proposed beyond 500m from settlement.
6. Compensation for land and structure are paid as per G.O 160 issued by GoAP dated November 16, 2016 and District collector orders vide File No. REV-ESECOLND(ATGL)82/2017-JA(E3)-VSKPCO/Dt:19-07-2018.
7. Compensation for land and structure are paid as per G.O 160. As such no R&R is proposed for the settlements existing in the project boundary
8. Compensation for the lands, trees and structures if any involved in land acquisition for development of IP would be decided by the District Collector and APIIC would pay the compensation accordingly.
9. During the construction phase a total of 1200 employees will get employment.
10. During operation phase will get employment of 30,800 of direct employment and 2.5 times of direct employment as indirect employment. Local people will be getting a large employment opportunity and would be given preference for employment based on their skill set.
11. APIIC is proposing the CSR and CER activities and a separate budget of INR 15.41 Crores were proposed which also covers the welfare of the fishermen community
9. Sri S. Govind, Amalapuram He said that the Government has not paid adequate compensation and also not fulfilled earlier commitments to the villagers. He informed that most of the villagers/farmers are not received the compensation so far.
1. Compensation for land and structure are paid as per G.O 160 issued by GoAP dated November 16, 2016 and District collector orders vide File No. REV-ESECOLND(ATGL)82/2017-JA(E3)-VSKPCO/Dt:19-07-2018.
Obtaining Environmental Clearance and CFE for Nakkapalli Industrial Park C1181301 Final EIA/EMP Report RP005 rev. A
Chapter 7 Additional Studies Page 7-15
S. No Name and Place of Speaker Public View or Comments Response of APIIC
2. Compensation for land and structure are paid as per G.O 160. As such no R&R is proposed for the settlements existing in the project boundary
3. Compensation for the lands, trees and structures if any involved in land acquisition for development of IP would be decided by the District Collector and APIIC would pay the compensation accordingly.
10. Sri Adida Satyanarayana, D.L Puram He opposed the proposed project and Informed that the villagers in Payakaraopeta and Nakkapalli are illiterates and there is no proper communication about the Public Consultation. He requested to pay proper compensation, package and job opportunities to the villagers/ famers in Chandanada & DL Puram.
1. Environmental Public Hearing Notification in the Telugu language was published in Sakshi Paper, Visakhapatnam edition dated October 25, 2020, and in the English language was published in The Times of India newspaper, Hyderabad Edition dated October 25, 2020.
2. Acknowledgment receipts of Draft EIA/EMP Report and Executive summaries (both Telugu and English) displayed by APPCB at various Govt. offices and village panchayat offices are given as Appendix L
3. Compensation for land and structure are paid as per G.O 160 issued by GoAP dated November 16, 2016 and District collector orders vide File No. REV-ESECOLND(ATGL)82/2017-JA(E3)-VSKPCO/Dt:19-07-2018.
4. Compensation for land and structure are paid as per G.O 160. As such no R&R is proposed for the settlements existing in the project boundary
5. Compensation for the lands, trees and structures if any involved in land acquisition for development of IP would be decided by the District Collector and APIIC would pay the compensation accordingly.
6. During the construction phase a total of 1200 employees will get employment.
7. During operation phase will get employment of 30,800 of direct employment and 2.5 times of direct employment as indirect employment. Local people will be getting a large employment opportunity and would be given preference for employment based on their skill set.
11. Sri G. Nayana Babu, President, AP State Farmers Association
He opposed the proposed project and he requested to cancel the Public Consultation. He informed that proper compensation to be paid to the villagers/fishermen & Taddy workers. He requested not to establish Chemical and polluting
1. Compensation for land and structure are paid as per G.O 160. As such no R&R is proposed for the settlements existing in the project boundary
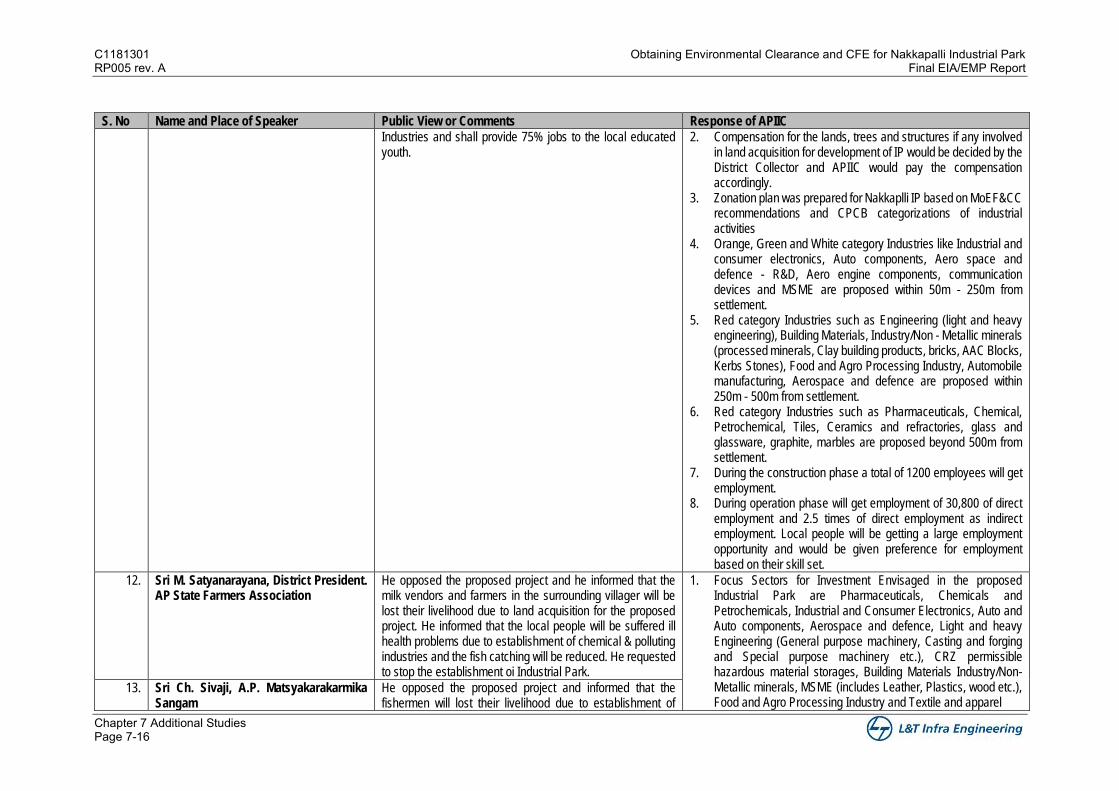
C1181301 Obtaining Environmental Clearance and CFE for Nakkapalli Industrial Park RP005 rev. A Final EIA/EMP Report
Chapter 7 Additional Studies Page 7-16
S. No Name and Place of Speaker Public View or Comments Response of APIIC
Industries and shall provide 75% jobs to the local educated youth.
2. Compensation for the lands, trees and structures if any involved in land acquisition for development of IP would be decided by the District Collector and APIIC would pay the compensation accordingly.
3. Zonation plan was prepared for Nakkaplli IP based on MoEF&CC recommendations and CPCB categorizations of industrial activities
4. Orange, Green and White category Industries like Industrial and consumer electronics, Auto components, Aero space and defence - R&D, Aero engine components, communication devices and MSME are proposed within 50m - 250m from settlement.
5. Red category Industries such as Engineering (light and heavy engineering), Building Materials, Industry/Non - Metallic minerals (processed minerals, Clay building products, bricks, AAC Blocks, Kerbs Stones), Food and Agro Processing Industry, Automobile manufacturing, Aerospace and defence are proposed within 250m - 500m from settlement.
6. Red category Industries such as Pharmaceuticals, Chemical, Petrochemical, Tiles, Ceramics and refractories, glass and glassware, graphite, marbles are proposed beyond 500m from settlement.
7. During the construction phase a total of 1200 employees will get employment.
8. During operation phase will get employment of 30,800 of direct employment and 2.5 times of direct employment as indirect employment. Local people will be getting a large employment opportunity and would be given preference for employment based on their skill set.
12. Sri M. Satyanarayana, District President. AP State Farmers Association
He opposed the proposed project and he informed that the milk vendors and farmers in the surrounding villager will be lost their livelihood due to land acquisition for the proposed project. He informed that the local people will be suffered ill health problems due to establishment of chemical & polluting industries and the fish catching will be reduced. He requested to stop the establishment oi Industrial Park.
1. Focus Sectors for Investment Envisaged in the proposed Industrial Park are Pharmaceuticals, Chemicals and Petrochemicals, Industrial and Consumer Electronics, Auto and Auto components, Aerospace and defence, Light and heavy Engineering (General purpose machinery, Casting and forging and Special purpose machinery etc.), CRZ permissible hazardous material storages, Building Materials Industry/Non-Metallic minerals, MSME (includes Leather, Plastics, wood etc.), Food and Agro Processing Industry and Textile and apparel
13. Sri Ch. Sivaji, A.P. Matsyakarakarmika Sangam
He opposed the proposed project and informed that the fishermen will lost their livelihood due to establishment of
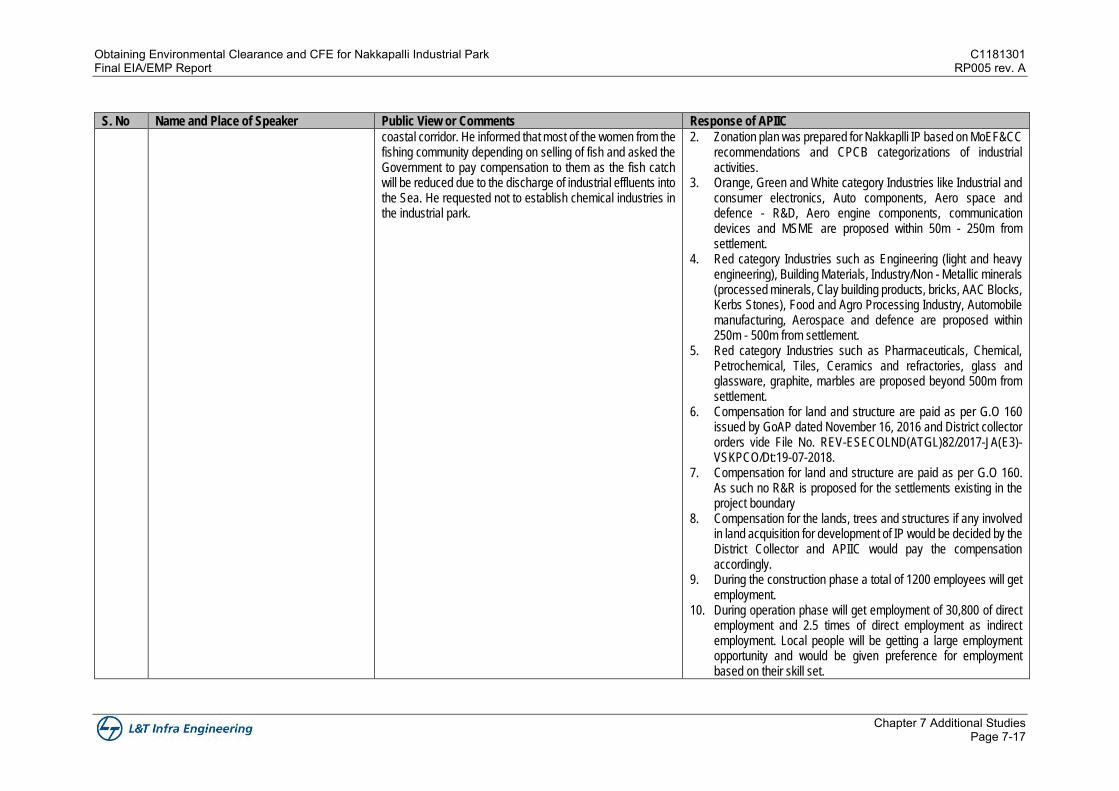
Obtaining Environmental Clearance and CFE for Nakkapalli Industrial Park C1181301 Final EIA/EMP Report RP005 rev. A
Chapter 7 Additional Studies Page 7-17
S. No Name and Place of Speaker Public View or Comments Response of APIIC
coastal corridor. He informed that most of the women from the fishing community depending on selling of fish and asked the Government to pay compensation to them as the fish catch will be reduced due to the discharge of industrial effluents into the Sea. He requested not to establish chemical industries in the industrial park.
2. Zonation plan was prepared for Nakkaplli IP based on MoEF&CC recommendations and CPCB categorizations of industrial activities.
3. Orange, Green and White category Industries like Industrial and consumer electronics, Auto components, Aero space and defence - R&D, Aero engine components, communication devices and MSME are proposed within 50m - 250m from settlement.
4. Red category Industries such as Engineering (light and heavy engineering), Building Materials, Industry/Non - Metallic minerals (processed minerals, Clay building products, bricks, AAC Blocks, Kerbs Stones), Food and Agro Processing Industry, Automobile manufacturing, Aerospace and defence are proposed within 250m - 500m from settlement.
5. Red category Industries such as Pharmaceuticals, Chemical, Petrochemical, Tiles, Ceramics and refractories, glass and glassware, graphite, marbles are proposed beyond 500m from settlement.
6. Compensation for land and structure are paid as per G.O 160 issued by GoAP dated November 16, 2016 and District collector orders vide File No. REV-ESECOLND(ATGL)82/2017-JA(E3)-VSKPCO/Dt:19-07-2018.
7. Compensation for land and structure are paid as per G.O 160. As such no R&R is proposed for the settlements existing in the project boundary
8. Compensation for the lands, trees and structures if any involved in land acquisition for development of IP would be decided by the District Collector and APIIC would pay the compensation accordingly.
9. During the construction phase a total of 1200 employees will get employment.
10. During operation phase will get employment of 30,800 of direct employment and 2.5 times of direct employment as indirect employment. Local people will be getting a large employment opportunity and would be given preference for employment based on their skill set.
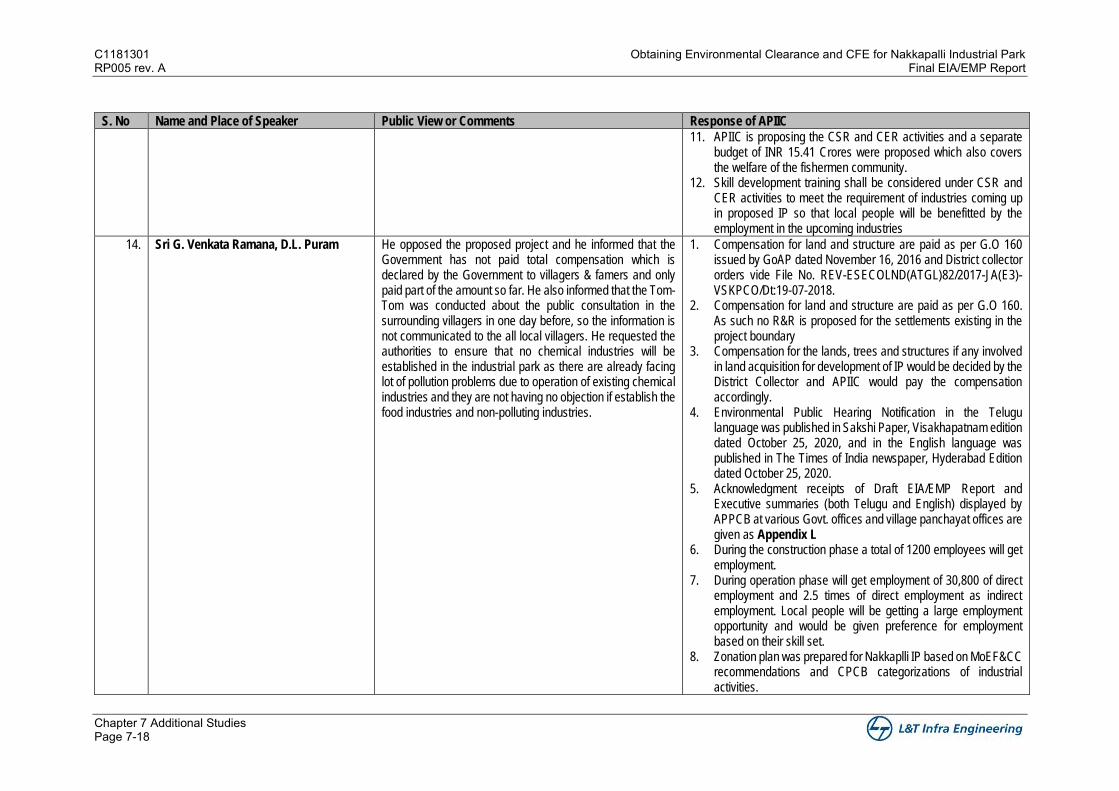
C1181301 Obtaining Environmental Clearance and CFE for Nakkapalli Industrial Park RP005 rev. A Final EIA/EMP Report
Chapter 7 Additional Studies Page 7-18
S. No Name and Place of Speaker Public View or Comments Response of APIIC
11. APIIC is proposing the CSR and CER activities and a separate budget of INR 15.41 Crores were proposed which also covers the welfare of the fishermen community.
12. Skill development training shall be considered under CSR and CER activities to meet the requirement of industries coming up in proposed IP so that local people will be benefitted by the employment in the upcoming industries
14. Sri G. Venkata Ramana, D.L. Puram He opposed the proposed project and he informed that the Government has not paid total compensation which is declared by the Government to villagers & famers and only paid part of the amount so far. He also informed that the Tom-Tom was conducted about the public consultation in the surrounding villagers in one day before, so the information is not communicated to the all local villagers. He requested the authorities to ensure that no chemical industries will be established in the industrial park as there are already facing lot of pollution problems due to operation of existing chemical industries and they are not having no objection if establish the food industries and non-polluting industries.
1. Compensation for land and structure are paid as per G.O 160 issued by GoAP dated November 16, 2016 and District collector orders vide File No. REV-ESECOLND(ATGL)82/2017-JA(E3)-VSKPCO/Dt:19-07-2018.
2. Compensation for land and structure are paid as per G.O 160. As such no R&R is proposed for the settlements existing in the project boundary
3. Compensation for the lands, trees and structures if any involved in land acquisition for development of IP would be decided by the District Collector and APIIC would pay the compensation accordingly.
4. Environmental Public Hearing Notification in the Telugu language was published in Sakshi Paper, Visakhapatnam edition dated October 25, 2020, and in the English language was published in The Times of India newspaper, Hyderabad Edition dated October 25, 2020.
5. Acknowledgment receipts of Draft EIA/EMP Report and Executive summaries (both Telugu and English) displayed by APPCB at various Govt. offices and village panchayat offices are given as Appendix L
6. During the construction phase a total of 1200 employees will get employment.
7. During operation phase will get employment of 30,800 of direct employment and 2.5 times of direct employment as indirect employment. Local people will be getting a large employment opportunity and would be given preference for employment based on their skill set.
8. Zonation plan was prepared for Nakkaplli IP based on MoEF&CC recommendations and CPCB categorizations of industrial activities.
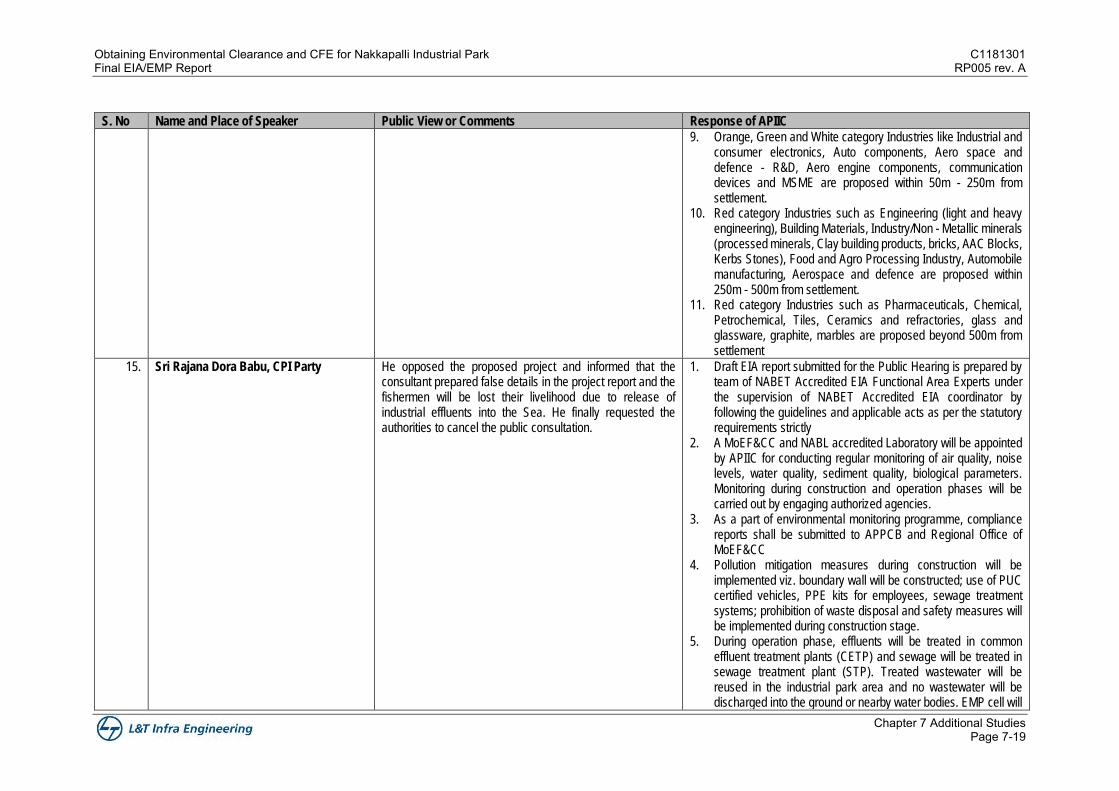
Obtaining Environmental Clearance and CFE for Nakkapalli Industrial Park C1181301 Final EIA/EMP Report RP005 rev. A
Chapter 7 Additional Studies Page 7-19
S. No Name and Place of Speaker Public View or Comments Response of APIIC
9. Orange, Green and White category Industries like Industrial and consumer electronics, Auto components, Aero space and defence - R&D, Aero engine components, communication devices and MSME are proposed within 50m - 250m from settlement.
10. Red category Industries such as Engineering (light and heavy engineering), Building Materials, Industry/Non - Metallic minerals (processed minerals, Clay building products, bricks, AAC Blocks, Kerbs Stones), Food and Agro Processing Industry, Automobile manufacturing, Aerospace and defence are proposed within 250m - 500m from settlement.
11. Red category Industries such as Pharmaceuticals, Chemical, Petrochemical, Tiles, Ceramics and refractories, glass and glassware, graphite, marbles are proposed beyond 500m from settlement
15. Sri Rajana Dora Babu, CPI Party He opposed the proposed project and informed that the consultant prepared false details in the project report and the fishermen will be lost their livelihood due to release of industrial effluents into the Sea. He finally requested the authorities to cancel the public consultation.
1. Draft EIA report submitted for the Public Hearing is prepared by team of NABET Accredited EIA Functional Area Experts under the supervision of NABET Accredited EIA coordinator by following the guidelines and applicable acts as per the statutory requirements strictly
2. A MoEF&CC and NABL accredited Laboratory will be appointed by APIIC for conducting regular monitoring of air quality, noise levels, water quality, sediment quality, biological parameters. Monitoring during construction and operation phases will be carried out by engaging authorized agencies.
3. As a part of environmental monitoring programme, compliance reports shall be submitted to APPCB and Regional Office of MoEF&CC
4. Pollution mitigation measures during construction will be implemented viz. boundary wall will be constructed; use of PUC certified vehicles, PPE kits for employees, sewage treatment systems; prohibition of waste disposal and safety measures will be implemented during construction stage.
5. During operation phase, effluents will be treated in common effluent treatment plants (CETP) and sewage will be treated in sewage treatment plant (STP). Treated wastewater will be reused in the industrial park area and no wastewater will be discharged into the ground or nearby water bodies. EMP cell will
C1181301 Obtaining Environmental Clearance and CFE for Nakkapalli Industrial Park RP005 rev. A Final EIA/EMP Report
Chapter 7 Additional Studies Page 7-20
S. No Name and Place of Speaker Public View or Comments Response of APIIC
ensure, no discharge of wastewater into the water bodies is practiced by the industries coming in Nakkapalli IP.
6. All the necessary Air pollution control measures will be adopted by member industries to control the fugitive emissions of VoCs, particulates, organic vapours etc., shall be followed.
7. During the construction phase a total of 1200 employees will get employment.
8. During operation phase will get employment of 30,800 of direct employment and 2.5 times of direct employment as indirect employment. Local people will be getting a large employment opportunity and would be given preference for employment based on their skill set
16. Sri Mosa Appala Raju, President, Central Fishermen Society
He opposed the proposed project and informed that the villagers are facing pollution problems due to the existing industries. He said that fishermen are not against the industrial development. He opined that proposed industrial park to be established in the non-agricultural lands instead of agriculture lands and the proposed Industrial park to be established only after payment of compensation to the villagers. He also requested to provide job opportunities to the local fishermen.
1. The Present Land use of the site is mostly comprised of agriculture- plantation, scrubland, crop land and settlements are located within the site.
2. Compensation for land and structure are paid as per G.O 160 issued by GoAP dated November 16, 2016 and District collector orders vide File No. REV-ESECOLND(ATGL)82/2017-JA(E3)-VSKPCO/Dt:19-07-2018.
3. Compensation for land and structure are paid as per G.O 160. As such no R&R is proposed for the settlements existing in the project boundary
4. Compensation for the lands, trees and structures if any involved in land acquisition for development of IP would be decided by the District Collector and APIIC would pay the compensation accordingly.
5. During the construction phase a total of 1200 employees will get employment
6. During operation phase will get employment of 30,800 of direct employment and 2.5 times of direct employment as indirect employment. Local people will be getting a large employment opportunity and would be given preference for employment based on their skill set.
17. Sri Avatharam Raju, DL Puram He opined that due to establishment of chemical industries, health issues will be arises and the fish catch also reduce. He informed that earlier the fish is available within 2 Km from the shore but now fishermen are going to more than 20 Km for catching fish. He appealed to establish the industries in non-agriculture lands and not to spoil the agriculture lands. He further opined that due to establishment of the industrial park the villagers are not getting any financial benefit and only industrial managements will be benefited.
18. Sri G Govind R/o Boyapadu He said that APIIC acquired land from villagers of Chandanada, Boyapadu, Buchayyapeta, DL puram in Nakkapalli Mandal and asked the authorities whether the
1. Resettlement or Rehabilitation (R&R) is not envisaged. 2. There are settlements in the project site and as the planning of
IP has been done by integrating the settlements around and zoning of industries in the industrial park
Obtaining Environmental Clearance and CFE for Nakkapalli Industrial Park C1181301 Final EIA/EMP Report RP005 rev. A
Chapter 7 Additional Studies Page 7-21
S. No Name and Place of Speaker Public View or Comments Response of APIIC
Boyapadu village will be rehabilitated or not, if rehabilitates where it will be relocated.
19. Sri T. Kodanda Rao, Rajayyapeta He opposed the proposed project and informed that the fishermen will be the main looser due to establishment of chemical factories as the fish catch will be reduced due to discharge of the industrial effluents into sea. He informed that the surroundings villagers are having about 620 to 650 fishing boats of Rajayyapeta, Chinateernala, Pedateernala, Dondavaka, D.L. Puram and Bangarayyapeta of Nakkapalli Mandal. He requested to pay proper compensation to the fishermen. He said that the authorities should declare the type of industries & no. of industries are to be established in the industrial corridor. He finally said that not to establish bulk drug type of industries in this area.
1. The industries proposed to be developed in the Industrial Park will adopt suitable safety/mitigation measures and procedures during the operation of these industries.
2. Industrial wastewater shall be treated in the proposed CETPs up to discharge standards and through marine outfall discharging into sea. Industrial wastewater shall be treated within industry premise and treated wastewater will be reused within the industry. Air pollution generating industries shall be using the air pollution control equipment and the pollution level shall be monitored by APPCB or appropriate authority or government appointed authorised agencies. Compliance report shall be sent to APPCB/Government on a regular basis in order to check and may suggest suitable measures.
3. The solid waste generated from the proposed project will be segregated as Municipal waste, Hazardous waste & E-Waste. Municipal waste generated will be disposed to local bins for further treatment and disposal. Individual industries generating hazardous waste shall be sent through authorized waste handler for further treatment and disposal. E-Waste generated will be collected, stored and transported to authorised recyclers.
4. An effective Disaster Management Plan (DMP) which includes Onsite and Offsite emergency plan will be followed to minimize the probability of occurrence of emergency situations and mitigate the impacts.
5. Environment Management Cell would be established. Capital investment of environment management would be about Rs. 260.9 crores and about Rs. 13.9 crores would be spent on recurring cost for pollution abatement.
6. A MoEF&CC and NABL accredited Laboratory will be appointed by APIIC for conducting regular monitoring of air quality, noise levels, water quality, sediment quality, biological parameters. Monitoring during construction and operation phases will be carried out by engaging authorized agencies.
7. As a part of environmental monitoring programme, compliance reports shall be submitted to APPCB and Regional Office of MoEF&CC
C1181301 Obtaining Environmental Clearance and CFE for Nakkapalli Industrial Park RP005 rev. A Final EIA/EMP Report
Chapter 7 Additional Studies Page 7-22
S. No Name and Place of Speaker Public View or Comments Response of APIIC
8. Pollution mitigation measures during construction will be implemented viz. boundary wall will be constructed; use of PUC certified vehicles, PPE kits for employees, sewage treatment systems; prohibition of waste disposal and safety measures will be implemented during construction stage
9. During operation phase, effluents will be treated in common effluent treatment plants (CETP) and sewage will be treated in sewage treatment plant (STP). Treated wastewater will be reused in the industrial park area and no wastewater will be discharged into the ground or nearby water bodies. EMP cell will ensure, no discharge of wastewater into the water bodies is practiced by the industries coming in Nakkapalli IP.
10. Compensation for land and structure are paid as per G.O 160 issued by GoAP dated November 16, 2016 and District collector orders vide File No. REV-ESECOLND(ATGL)82/2017-JA(E3)-VSKPCO/Dt:19-07-2018.
11. Compensation for land and structure are paid as per G.O 160. As such no R&R is proposed for the settlements existing in the project boundary
12. Compensation for the lands, trees and structures if any involved in land acquisition for development of IP would be decided by the District Collector and APIIC would pay the compensation accordingly.
13. During the construction phase a total of 1200 employees will get employment.
14. During operation phase will get employment of 30,800 of direct employment and 2.5 times of direct employment as indirect employment. Local people will be getting a large employment opportunity and would be given preference for employment based on their skill set
15. APIIC is proposing the CSR and CER activities and a separate budget of INR 15.41 Crores were proposed which also covers the welfare of the fishermen community.
16. Skill development training shall be considered under CSR and CER activities to meet the requirement of industries coming up in proposed IP so that local people will be benefitted by the employment in the upcoming industries
Obtaining Environmental Clearance and CFE for Nakkapalli Industrial Park C1181301 Final EIA/EMP Report RP005 rev. A
Chapter 7 Additional Studies Page 7-23
S. No Name and Place of Speaker Public View or Comments Response of APIIC
20. Sri R. Srinivasa Rao, Amalapuram He said that compensation amount is deposited as one time settlement to the farmers and they are not aware how much compensation to be paid for houses, lands and coconut trees.
1. As per G.O 160 issued by GoAP dated November 16, 2016 and District collector orders vide File No. REV-ESECOLND(ATGL)82/2017-JA(E3)-VSKPCO/Dt:19-07-2018.
2. Compensation for land and structure are paid as per G.O 160. As such no R&R is proposed for the settlements existing in the project boundary
3. Compensation for the lands, trees and structures if any involved in land acquisition for development of IP would be decided by the District Collector and APIIC would pay the compensation accordingly
21. Sri G. Narasinga Rao, Amalapuram He said that compensation amount to be settled properly as early as possible.
22. Sri Appa Rao, BJP He said that if public supports or oppose the proposed Industrial park, the project will be implemented by the authorities and he requested to pay compensation to the fisherman properly.
23. Sri K Venkatesh, Nakkapalli He opposed the proposed project and informed that without declaring category & no. of industries in the industrial park and without paying of compensation, conducting of public consultation is not correct. He said that public is not aware about whether APIIC establishing non-polluting industries or polluting industries and also the villagers are not getting communication in time regarding the pubic consultation. He said that villagers are against the establishment of chemical industries but not for industrial development and jobs to be provided for local educated youth and establishment of skill development centres. He requested to cancel the public consultation.
1. Focus Sectors for Investment Envisaged in the proposed Industrial Park are Pharmaceuticals, Chemicals and Petrochemicals, Industrial and Consumer Electronics, Auto and Auto components, Aerospace and defence, Light and heavy Engineering (General purpose machinery, Casting and forging and Special purpose machinery etc.), CRZ permissible hazardous material storages, Building Materials Industry/Non-Metallic minerals, MSME (includes Leather, Plastics, wood etc.), Food and Agro Processing Industry and Textile and apparel
2. Zonation plan was prepared for Nakkaplli IP based on MoEF&CC recommendations and CPCB categorizations of industrial activities.
3. Orange, Green and White category Industries like Industrial and consumer electronics, Auto components, Aero space and defence - R&D, Aero engine components, communication devices and MSME are proposed within 50m - 250m from settlement
4. Red category Industries such as Engineering (light and heavy engineering), Building Materials, Industry/Non - Metallic minerals (processed minerals, Clay building products, bricks, AAC Blocks, Kerbs Stones), Food and Agro Processing Industry, Automobile manufacturing, Aerospace and defence are proposed within 250m - 500m from settlement.
5. Red category Industries such as Pharmaceuticals, Chemical, Petrochemical, Tiles, Ceramics and refractories, glass and glassware, graphite, marbles are proposed beyond 500m from settlement.
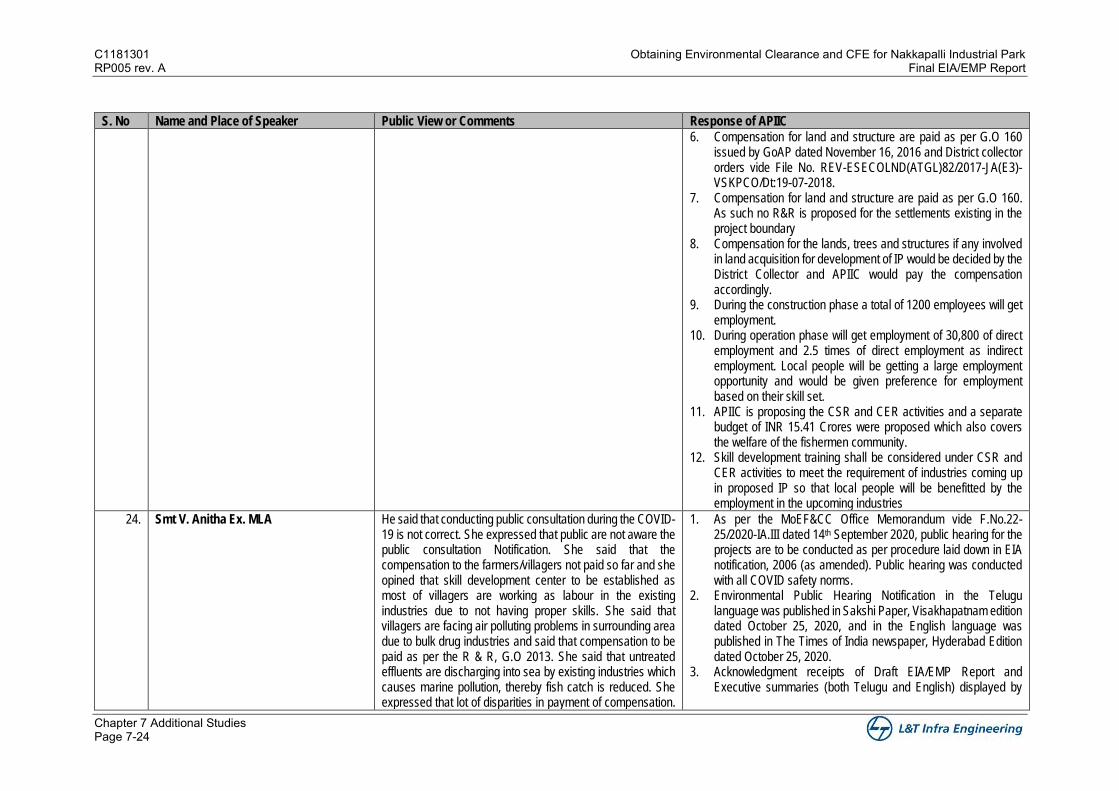
C1181301 Obtaining Environmental Clearance and CFE for Nakkapalli Industrial Park RP005 rev. A Final EIA/EMP Report
Chapter 7 Additional Studies Page 7-24
S. No Name and Place of Speaker Public View or Comments Response of APIIC
6. Compensation for land and structure are paid as per G.O 160 issued by GoAP dated November 16, 2016 and District collector orders vide File No. REV-ESECOLND(ATGL)82/2017-JA(E3)-VSKPCO/Dt:19-07-2018.
7. Compensation for land and structure are paid as per G.O 160. As such no R&R is proposed for the settlements existing in the project boundary
8. Compensation for the lands, trees and structures if any involved in land acquisition for development of IP would be decided by the District Collector and APIIC would pay the compensation accordingly.
9. During the construction phase a total of 1200 employees will get employment.
10. During operation phase will get employment of 30,800 of direct employment and 2.5 times of direct employment as indirect employment. Local people will be getting a large employment opportunity and would be given preference for employment based on their skill set.
11. APIIC is proposing the CSR and CER activities and a separate budget of INR 15.41 Crores were proposed which also covers the welfare of the fishermen community.
12. Skill development training shall be considered under CSR and CER activities to meet the requirement of industries coming up in proposed IP so that local people will be benefitted by the employment in the upcoming industries
24. Smt V. Anitha Ex. MLA He said that conducting public consultation during the COVID-19 is not correct. She expressed that public are not aware the public consultation Notification. She said that the compensation to the farmers/villagers not paid so far and she opined that skill development center to be established as most of villagers are working as labour in the existing industries due to not having proper skills. She said that villagers are facing air polluting problems in surrounding area due to bulk drug industries and said that compensation to be paid as per the R & R, G.O 2013. She said that untreated effluents are discharging into sea by existing industries which causes marine pollution, thereby fish catch is reduced. She expressed that lot of disparities in payment of compensation.
1. As per the MoEF&CC Office Memorandum vide F.No.22-25/2020-IA.III dated 14th September 2020, public hearing for the projects are to be conducted as per procedure laid down in EIA notification, 2006 (as amended). Public hearing was conducted with all COVID safety norms.
2. Environmental Public Hearing Notification in the Telugu language was published in Sakshi Paper, Visakhapatnam edition dated October 25, 2020, and in the English language was published in The Times of India newspaper, Hyderabad Edition dated October 25, 2020.
3. Acknowledgment receipts of Draft EIA/EMP Report and Executive summaries (both Telugu and English) displayed by
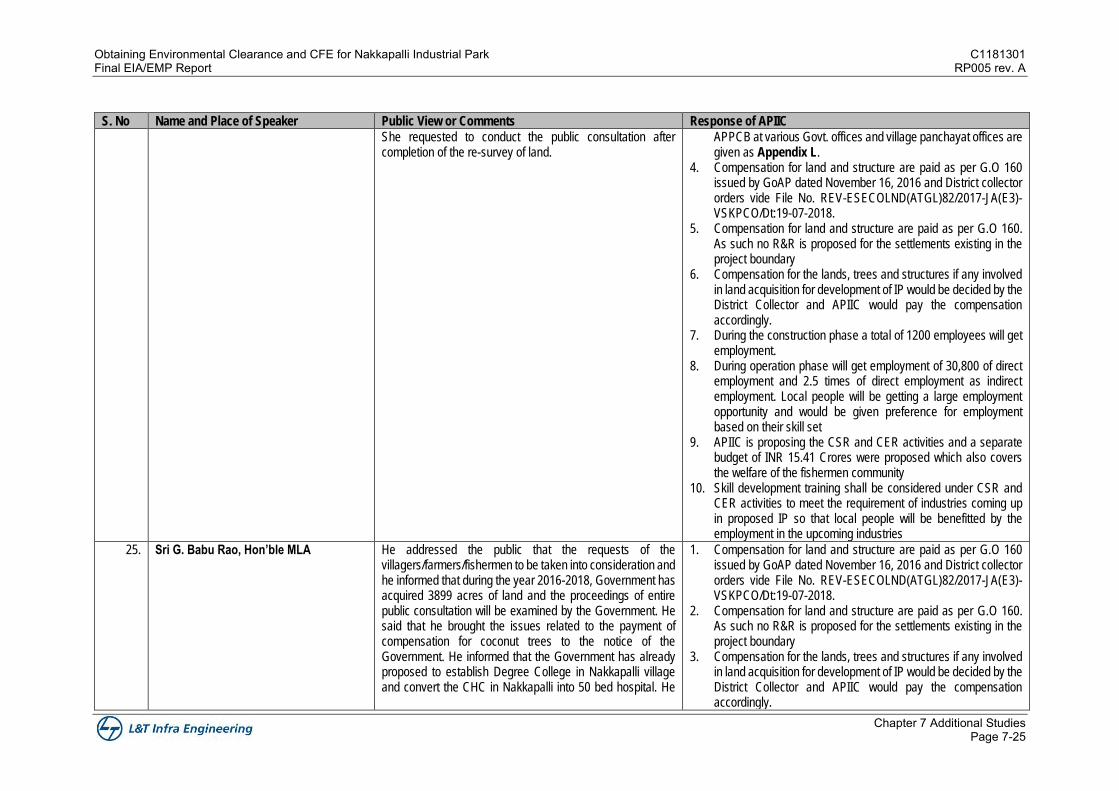
Obtaining Environmental Clearance and CFE for Nakkapalli Industrial Park C1181301 Final EIA/EMP Report RP005 rev. A
Chapter 7 Additional Studies Page 7-25
S. No Name and Place of Speaker Public View or Comments Response of APIIC
She requested to conduct the public consultation after completion of the re-survey of land.
APPCB at various Govt. offices and village panchayat offices are given as Appendix L.
4. Compensation for land and structure are paid as per G.O 160 issued by GoAP dated November 16, 2016 and District collector orders vide File No. REV-ESECOLND(ATGL)82/2017-JA(E3)-VSKPCO/Dt:19-07-2018.
5. Compensation for land and structure are paid as per G.O 160. As such no R&R is proposed for the settlements existing in the project boundary
6. Compensation for the lands, trees and structures if any involved in land acquisition for development of IP would be decided by the District Collector and APIIC would pay the compensation accordingly.
7. During the construction phase a total of 1200 employees will get employment.
8. During operation phase will get employment of 30,800 of direct employment and 2.5 times of direct employment as indirect employment. Local people will be getting a large employment opportunity and would be given preference for employment based on their skill set
9. APIIC is proposing the CSR and CER activities and a separate budget of INR 15.41 Crores were proposed which also covers the welfare of the fishermen community
10. Skill development training shall be considered under CSR and CER activities to meet the requirement of industries coming up in proposed IP so that local people will be benefitted by the employment in the upcoming industries
25. Sri G. Babu Rao, Hon’ble MLA He addressed the public that the requests of the villagers/farmers/fishermen to be taken into consideration and he informed that during the year 2016-2018, Government has acquired 3899 acres of land and the proceedings of entire public consultation will be examined by the Government. He said that he brought the issues related to the payment of compensation for coconut trees to the notice of the Government. He informed that the Government has already proposed to establish Degree College in Nakkapalli village and convert the CHC in Nakkapalli into 50 bed hospital. He
1. Compensation for land and structure are paid as per G.O 160 issued by GoAP dated November 16, 2016 and District collector orders vide File No. REV-ESECOLND(ATGL)82/2017-JA(E3)-VSKPCO/Dt:19-07-2018.
2. Compensation for land and structure are paid as per G.O 160. As such no R&R is proposed for the settlements existing in the project boundary
3. Compensation for the lands, trees and structures if any involved in land acquisition for development of IP would be decided by the District Collector and APIIC would pay the compensation accordingly.
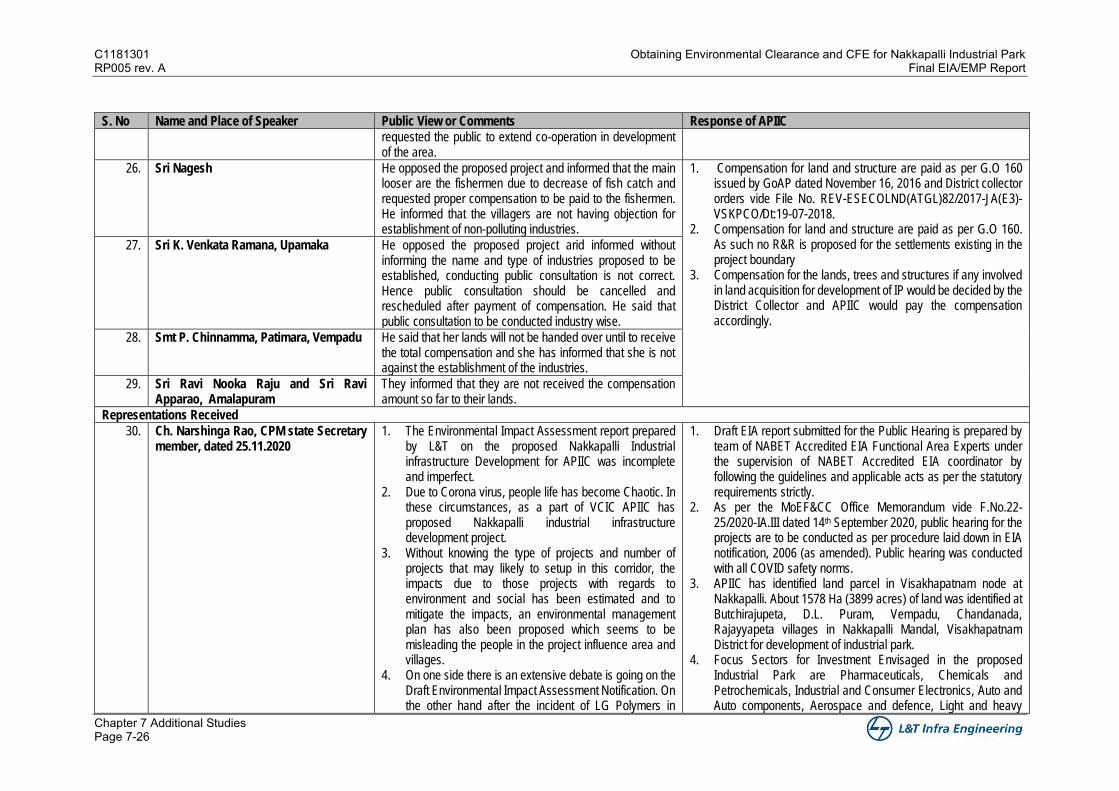
C1181301 Obtaining Environmental Clearance and CFE for Nakkapalli Industrial Park RP005 rev. A Final EIA/EMP Report
Chapter 7 Additional Studies Page 7-26
S. No Name and Place of Speaker Public View or Comments Response of APIIC
requested the public to extend co-operation in development of the area.
26. Sri Nagesh He opposed the proposed project and informed that the main looser are the fishermen due to decrease of fish catch and requested proper compensation to be paid to the fishermen. He informed that the villagers are not having objection for establishment of non-polluting industries.
1. Compensation for land and structure are paid as per G.O 160 issued by GoAP dated November 16, 2016 and District collector orders vide File No. REV-ESECOLND(ATGL)82/2017-JA(E3)-VSKPCO/Dt:19-07-2018.
2. Compensation for land and structure are paid as per G.O 160. As such no R&R is proposed for the settlements existing in the project boundary
3. Compensation for the lands, trees and structures if any involved in land acquisition for development of IP would be decided by the District Collector and APIIC would pay the compensation accordingly.
27. Sri K. Venkata Ramana, Upamaka He opposed the proposed project arid informed without informing the name and type of industries proposed to be established, conducting public consultation is not correct. Hence public consultation should be cancelled and rescheduled after payment of compensation. He said that public consultation to be conducted industry wise.
28. Smt P. Chinnamma, Patimara, Vempadu He said that her lands will not be handed over until to receive the total compensation and she has informed that she is not against the establishment of the industries.
29. Sri Ravi Nooka Raju and Sri Ravi Apparao, Amalapuram
They informed that they are not received the compensation amount so far to their lands.
Representations Received
30. Ch. Narshinga Rao, CPM state Secretary member, dated 25.11.2020
1. The Environmental Impact Assessment report prepared by L&T on the proposed Nakkapalli Industrial infrastructure Development for APIIC was incomplete and imperfect.
2. Due to Corona virus, people life has become Chaotic. In these circumstances, as a part of VCIC APIIC has proposed Nakkapalli industrial infrastructure development project.
3. Without knowing the type of projects and number of projects that may likely to setup in this corridor, the impacts due to those projects with regards to environment and social has been estimated and to mitigate the impacts, an environmental management plan has also been proposed which seems to be misleading the people in the project influence area and villages.
4. On one side there is an extensive debate is going on the Draft Environmental Impact Assessment Notification. On the other hand after the incident of LG Polymers in
1. Draft EIA report submitted for the Public Hearing is prepared by team of NABET Accredited EIA Functional Area Experts under the supervision of NABET Accredited EIA coordinator by following the guidelines and applicable acts as per the statutory requirements strictly.
2. As per the MoEF&CC Office Memorandum vide F.No.22-25/2020-IA.III dated 14th September 2020, public hearing for the projects are to be conducted as per procedure laid down in EIA notification, 2006 (as amended). Public hearing was conducted with all COVID safety norms.
3. APIIC has identified land parcel in Visakhapatnam node at Nakkapalli. About 1578 Ha (3899 acres) of land was identified at Butchirajupeta, D.L. Puram, Vempadu, Chandanada, Rajayyapeta villages in Nakkapalli Mandal, Visakhapatnam District for development of industrial park.
4. Focus Sectors for Investment Envisaged in the proposed Industrial Park are Pharmaceuticals, Chemicals and Petrochemicals, Industrial and Consumer Electronics, Auto and Auto components, Aerospace and defence, Light and heavy
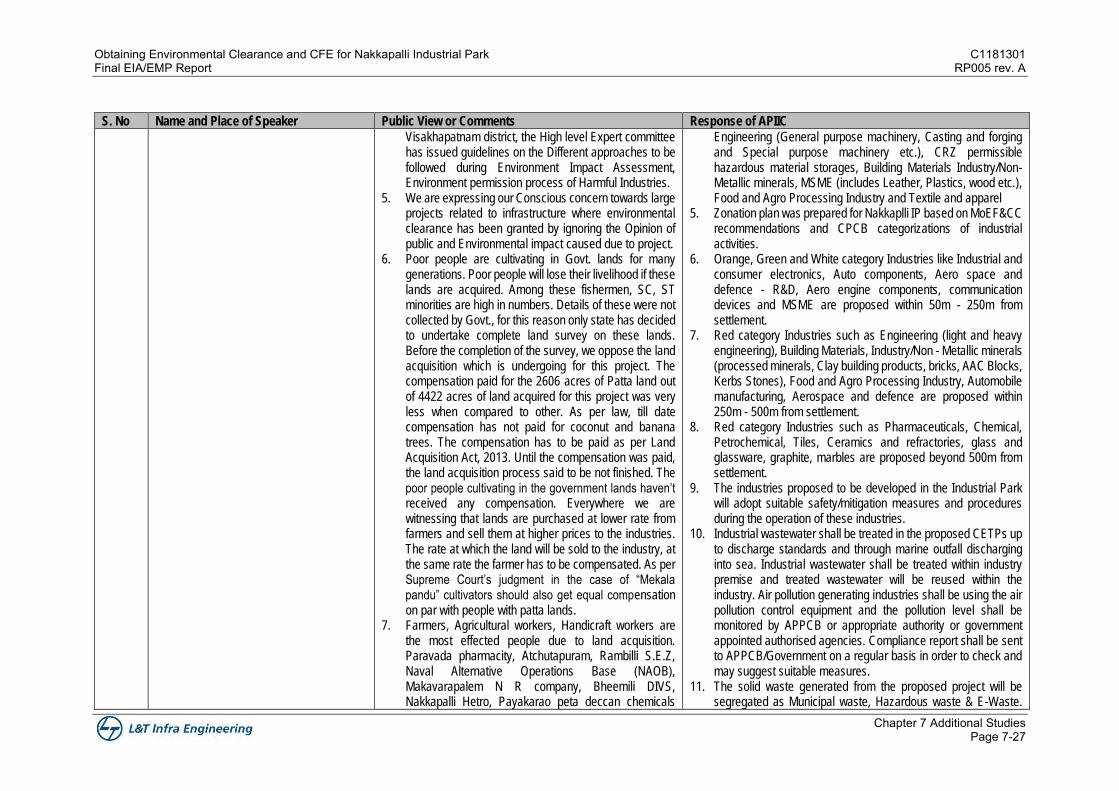
Obtaining Environmental Clearance and CFE for Nakkapalli Industrial Park C1181301 Final EIA/EMP Report RP005 rev. A
Chapter 7 Additional Studies Page 7-27
S. No Name and Place of Speaker Public View or Comments Response of APIIC
Visakhapatnam district, the High level Expert committee has issued guidelines on the Different approaches to be followed during Environment Impact Assessment, Environment permission process of Harmful Industries.
5. We are expressing our Conscious concern towards large projects related to infrastructure where environmental clearance has been granted by ignoring the Opinion of public and Environmental impact caused due to project.
6. Poor people are cultivating in Govt. lands for many generations. Poor people will lose their livelihood if these lands are acquired. Among these fishermen, SC, ST minorities are high in numbers. Details of these were not collected by Govt., for this reason only state has decided to undertake complete land survey on these lands. Before the completion of the survey, we oppose the land acquisition which is undergoing for this project. The compensation paid for the 2606 acres of Patta land out of 4422 acres of land acquired for this project was very less when compared to other. As per law, till date compensation has not paid for coconut and banana trees. The compensation has to be paid as per Land Acquisition Act, 2013. Until the compensation was paid, the land acquisition process said to be not finished. The poor people cultivating in the government lands haven’t received any compensation. Everywhere we are witnessing that lands are purchased at lower rate from farmers and sell them at higher prices to the industries. The rate at which the land will be sold to the industry, at the same rate the farmer has to be compensated. As per Supreme Court’s judgment in the case of “Mekala pandu” cultivators should also get equal compensation on par with people with patta lands.
7. Farmers, Agricultural workers, Handicraft workers are the most effected people due to land acquisition. Paravada pharmacity, Atchutapuram, Rambilli S.E.Z, Naval Alternative Operations Base (NAOB), Makavarapalem N R company, Bheemili DIVS, Nakkapalli Hetro, Payakarao peta deccan chemicals
Engineering (General purpose machinery, Casting and forging and Special purpose machinery etc.), CRZ permissible hazardous material storages, Building Materials Industry/Non-Metallic minerals, MSME (includes Leather, Plastics, wood etc.), Food and Agro Processing Industry and Textile and apparel
5. Zonation plan was prepared for Nakkaplli IP based on MoEF&CC recommendations and CPCB categorizations of industrial activities.
6. Orange, Green and White category Industries like Industrial and consumer electronics, Auto components, Aero space and defence - R&D, Aero engine components, communication devices and MSME are proposed within 50m - 250m from settlement.
7. Red category Industries such as Engineering (light and heavy engineering), Building Materials, Industry/Non - Metallic minerals (processed minerals, Clay building products, bricks, AAC Blocks, Kerbs Stones), Food and Agro Processing Industry, Automobile manufacturing, Aerospace and defence are proposed within 250m - 500m from settlement.
8. Red category Industries such as Pharmaceuticals, Chemical, Petrochemical, Tiles, Ceramics and refractories, glass and glassware, graphite, marbles are proposed beyond 500m from settlement.
9. The industries proposed to be developed in the Industrial Park will adopt suitable safety/mitigation measures and procedures during the operation of these industries.
10. Industrial wastewater shall be treated in the proposed CETPs up to discharge standards and through marine outfall discharging into sea. Industrial wastewater shall be treated within industry premise and treated wastewater will be reused within the industry. Air pollution generating industries shall be using the air pollution control equipment and the pollution level shall be monitored by APPCB or appropriate authority or government appointed authorised agencies. Compliance report shall be sent to APPCB/Government on a regular basis in order to check and may suggest suitable measures.
11. The solid waste generated from the proposed project will be segregated as Municipal waste, Hazardous waste & E-Waste.
C1181301 Obtaining Environmental Clearance and CFE for Nakkapalli Industrial Park RP005 rev. A Final EIA/EMP Report
Chapter 7 Additional Studies Page 7-28
S. No Name and Place of Speaker Public View or Comments Response of APIIC
earned high profits for which land aquistion happened in the last 20 years. But the farmers, agricultural wokers and people in different occupations belongs to these places have been migrating to kilometres together for livelihood. The management of these companies has malicious thoughts and decided not to provide employment to the local people. In the above mentioned industries, they haven’t provided even 10% employment to local people. In 2019 YSRCP governmeent has made an act to provide 75% employment to local people. But no where this act has been implemented. The acts which are not under implementation are worth for nothing. In the report prepared by L&T didn’t mentioned anything about local employment.
8. The EIA document prepared for the proposed project on the marine side has shown many environmental, social concerns which are totally falsehoods.
9. The impacts and mitigation measures are not mentioned due to the project development effecting directly on fisherman, farmers and indirectly on workers dependent on agriculture and sea, other dependent people who are living in this project influence area in the EIA document.
10. The land details given in APIIC website link: https://www.apiic.in/wp-content/uploads/2017/09/nakkapalli.pdf regarding the Nakkapalli industrial infrastructure project and details provided in EIA document were not matching.
11. As per the details in APIIC website a total of 4422 acres of land was considered for the project development. But in the EIA report, the project area is given as 3899 acres. Same organization in different documents giving a difference of 523 acres of land for same project which leads to many suspicions.
12. Hundreds of survey numbers falling in Buthcirajupeta, Vempadu, D.L Puram, Chandanada, Rajayapetta villages, in project influence area have been listed in APIIC EIA document which made local people more concerned. Without mentioning the details of land in
Municipal waste generated will be disposed to local bins for further treatment and disposal. Individual industries generating hazardous waste shall be sent through authorized waste handler for further treatment and disposal. E-Waste generated will be collected, stored and transported to authorised recyclers.
12. An effective Disaster Management Plan (DMP) which includes Onsite and Offsite emergency plan will be followed to minimize the probability of occurrence of emergency situations and mitigate the impacts.
13. Environment Management Cell would be established. Capital investment of environment management would be about Rs. 260.9 crores and about Rs. 13.9 crores would be spent on recurring cost for pollution abatement.
14. A MoEF&CC and NABL accredited Laboratory will be appointed by APIIC for conducting regular monitoring of air quality, noise levels, water quality, sediment quality, biological parameters. Monitoring during construction and operation phases will be carried out by engaging authorized agencies.
15. As a part of environmental monitoring programme, compliance reports shall be submitted to APPCB and Regional Office of MoEF&CC
16. Pollution mitigation measures during construction will be implemented viz. boundary wall will be constructed; use of PUC certified vehicles, PPE kits for employees, sewage treatment systems; prohibition of waste disposal and safety measures will be implemented during construction stage.
17. During operation phase, effluents will be treated in common effluent treatment plants (CETP) and sewage will be treated in sewage treatment plant (STP). Treated wastewater will be reused in the industrial park area and no wastewater will be discharged into the ground or nearby water bodies. EMP cell will ensure, no discharge of wastewater into the water bodies is practiced by the industries coming in Nakkapalli IP.
18. All the necessary Air pollution control measures will be adopted by member industries to control the fugitive emissions of VoCs, particulates, organic vapours etc., shall be followed
Obtaining Environmental Clearance and CFE for Nakkapalli Industrial Park C1181301 Final EIA/EMP Report RP005 rev. A
Chapter 7 Additional Studies Page 7-29
S. No Name and Place of Speaker Public View or Comments Response of APIIC
terms nature of lands, ownership, cultivator, the document has been kept a non-comprehensive information in front of people.
13. Complete survey needed to be conducted on the government lands present in the project influencing villages, the eligible persons shall be provided with patta land, justice should be provided to the people in the project influencing villages under the land acquisition, Rehabilitation and Resettlement Act, 2013. For this reason we request for the postponement of Environmental public hearing.
Environmental, Social related issues – Problems, Objections
14. In the recent times, there was a major loss of property and life due to accidents in LG Polymers organization in Visakhapatnam district. There are many miserable activities came into limelight with these accidents how industries are failing to handle the pollution accidents when occurred. By keeping this experience in view, there is a need to carefully look into the matters of safety standards and technical knowledge with transparency and Integrity in Project Environmental impact assessment report.
15. After the disaster happened in the May month of this year at LG polymers, high level committee appointed in state level and expert committee appointed by national green tribunal has made important recommendations to the government which need to be followed in future while granting Environmental clearances for establishment of Industrial Parks and Hazardous Industries.
16. APIIC establishes Hazardous petro industries like LG polymers has prepared Environment Impact Assessment in April, 2018 for Nakkapalli cluster industrial infrastructure development project and EIA & EMP studies were completed in October 2019. It shows that the EIA report is not in line with the recommendations made by experts after LG polymer disaster.
C1181301 Obtaining Environmental Clearance and CFE for Nakkapalli Industrial Park RP005 rev. A Final EIA/EMP Report
Chapter 7 Additional Studies Page 7-30
S. No Name and Place of Speaker Public View or Comments Response of APIIC
17. There is a need to review the EIA & EMP report comprehensively through experts by APIIC, based on the Important recommendations made to the government on LG polymers by high level committee appointed at state level and expert committee appointed by national green tribunal for Nakkapalli cluster industrial infrastructure development project.
18. There will be no dispute if APIIC is confined to utilities like Electricity, water supply development in Nakkapalli cluster industrial infrastructure development project as per EIA & EMP.
19. After examining the EIA & EMP report in which Project Environment, social impact assessment was evaluated, the Nature of the project looks intended towards infrastructure development but in depth the EIA & EMP report was prepared in emphasis to hazardous industries.
20. This project intended towards infrastructure development, but the infrastructure required for Pharmaceutical, Chemical, Petrochemical, Electronics, Heavy Engineering, and Food processing Industries were mentioned in the report.
21. In report, for wastewater management which includes 5.27 MLD of industrial effluent and 2.95 MLD of sewage, 2 (two) CETPs are proposed. In the proposed project area, petrochemical industries will come under risky “category A” industries. There is no clarity in the management of wastewater, whether the clearances will be obtained for entire park with all types of industries or each individual industry has to conduct EIA studies and obtain EC separately.
22. Different effluents are generated by different industries during their wastewater management. From DIVIS in Srikakulam district to Hetro drugs industry in Nakkapalli, Visakhapatnam district every industry is discharging the treated effluents through marine outfall into the sea. Effluents that are discharging from the pipeline are not under proper supervision which leads to damage in
Obtaining Environmental Clearance and CFE for Nakkapalli Industrial Park C1181301 Final EIA/EMP Report RP005 rev. A
Chapter 7 Additional Studies Page 7-31
S. No Name and Place of Speaker Public View or Comments Response of APIIC
marine biodiversity. The fishermen are more concerned as they are losing their livelihood due to loss of fish catch.
23. In this situation, two CETP’s are proposed which discharges the treated effluents through a marine outfall pipeline from the industries coming up in Nakkapalli cluster project. The characteristics of chemical effluents and collective impact and mitigation measures on fishery resources by the discharges through the pipeline into seawater are not mentioned in the report.
24. Project influence area is in sensitive seashore area, so coastal zone regulation act should be implemented. Whether the industries which are going to setup in the proposed park will get clearance from the CZMA separately or will follow the obtained environmental clearance by APIIC, there is no clarity in this issue.
So the above doubts has to be clarified by reviewing the EIA & EMP comprehensively through experts by APIIC and also based on the Important recommendations made to the government on LG polymers by high level committee and also by keeping in view of the above mentioned objections. We request you to provide complete justice to Project refugees, affected people, and efficiently work towards environmental conservation.
31. M. Appala Raju, District secretary Member, and M. Rajesh, Mandal Convener, Communist Party of India (Marxist), Vishakhapatnam District Committee, e-mail:[email protected], dated 25.11.2020
Government through APIIC has acquired lands in Rajayapetta, Buthcirajupeta, Chandanada, D.L Puram villages of Nakkapalli Mandal. On the name of VCIC corridor, to establish industries like chemical, petrochemical and pharmaceutical, environmental public hearing is being conducted on 25th November, 2020 in these lands. This programme should be cancelled immediately. Collecting Public opinion at a time for establishing chemical companies in 3899 acres of land is against law. A month ago, notification was given through paper, EIA report documents were not kept available to public and not even in panchayath offices, by not properly informing public about this project, and also by violating Democratic rights, this is not fair to conduct public hearing today.
1. Compensation for land and structure are paid as per G.O 160 issued by GoAP dated November 16, 2016 and District collector orders vide File No. REV-ESECOLND(ATGL)82/2017-JA(E3)-VSKPCO/Dt:19-07-2018.
2. Compensation for land and structure are paid as per G.O 160. As such no R&R is proposed for the settlements existing in the project boundary
3. Compensation for the lands, trees and structures if any involved in land acquisition for development of IP would be decided by the District Collector and APIIC would pay the compensation accordingly.
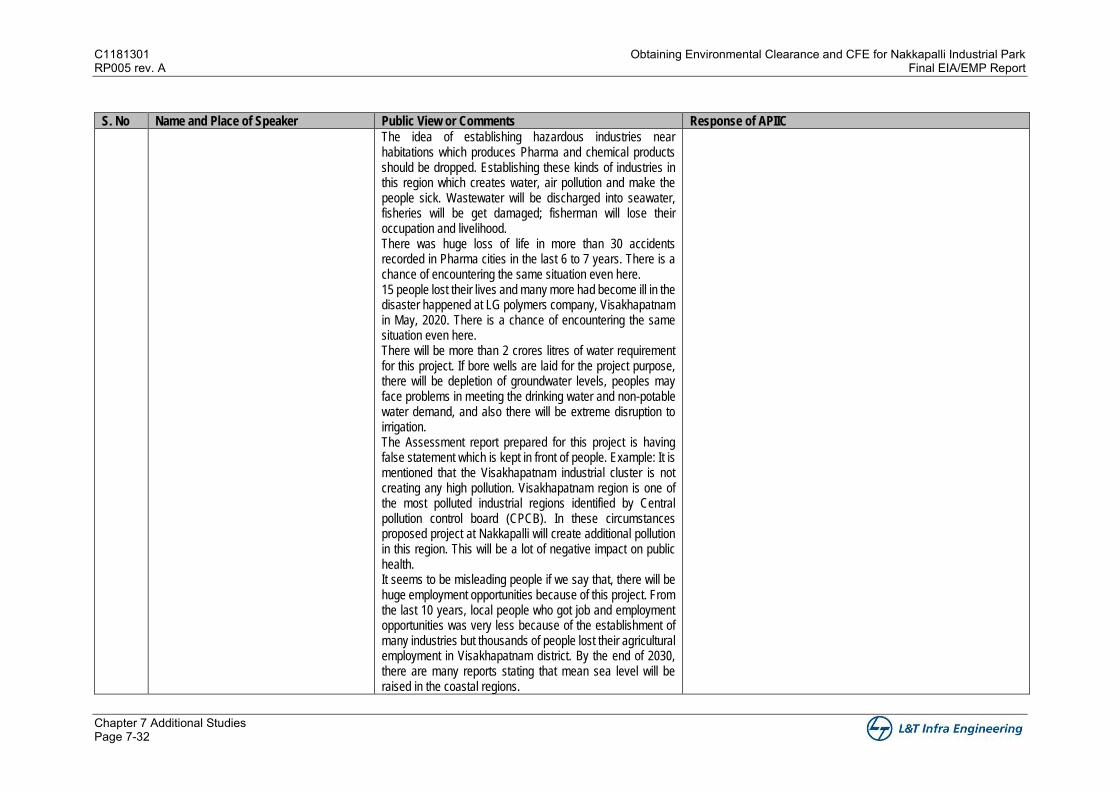
C1181301 Obtaining Environmental Clearance and CFE for Nakkapalli Industrial Park RP005 rev. A Final EIA/EMP Report
Chapter 7 Additional Studies Page 7-32
S. No Name and Place of Speaker Public View or Comments Response of APIIC
The idea of establishing hazardous industries near habitations which produces Pharma and chemical products should be dropped. Establishing these kinds of industries in this region which creates water, air pollution and make the people sick. Wastewater will be discharged into seawater, fisheries will be get damaged; fisherman will lose their occupation and livelihood. There was huge loss of life in more than 30 accidents recorded in Pharma cities in the last 6 to 7 years. There is a chance of encountering the same situation even here. 15 people lost their lives and many more had become ill in the disaster happened at LG polymers company, Visakhapatnam in May, 2020. There is a chance of encountering the same situation even here. There will be more than 2 crores litres of water requirement for this project. If bore wells are laid for the project purpose, there will be depletion of groundwater levels, peoples may face problems in meeting the drinking water and non-potable water demand, and also there will be extreme disruption to irrigation. The Assessment report prepared for this project is having false statement which is kept in front of people. Example: It is mentioned that the Visakhapatnam industrial cluster is not creating any high pollution. Visakhapatnam region is one of the most polluted industrial regions identified by Central pollution control board (CPCB). In these circumstances proposed project at Nakkapalli will create additional pollution in this region. This will be a lot of negative impact on public health. It seems to be misleading people if we say that, there will be huge employment opportunities because of this project. From the last 10 years, local people who got job and employment opportunities was very less because of the establishment of many industries but thousands of people lost their agricultural employment in Visakhapatnam district. By the end of 2030, there are many reports stating that mean sea level will be raised in the coastal regions.
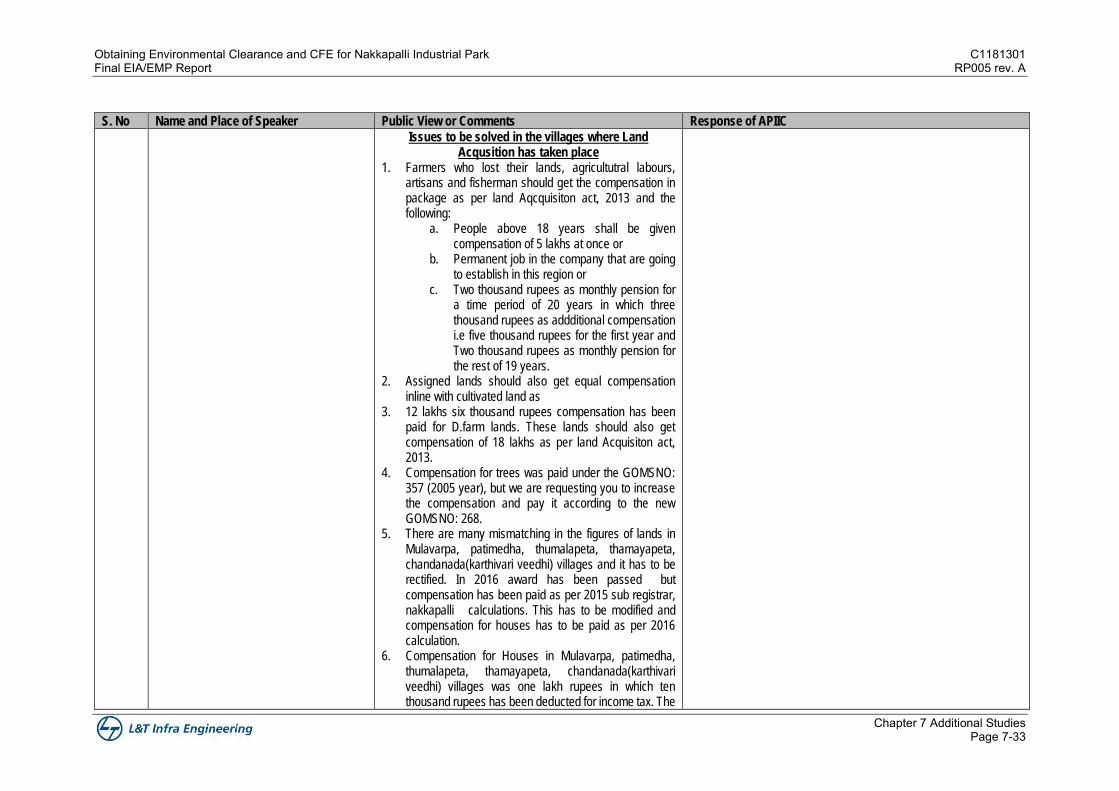
Obtaining Environmental Clearance and CFE for Nakkapalli Industrial Park C1181301 Final EIA/EMP Report RP005 rev. A
Chapter 7 Additional Studies Page 7-33
S. No Name and Place of Speaker Public View or Comments Response of APIIC
Issues to be solved in the villages where Land Acqusition has taken place
1. Farmers who lost their lands, agricultutral labours, artisans and fisherman should get the compensation in package as per land Aqcquisiton act, 2013 and the following:
a. People above 18 years shall be given compensation of 5 lakhs at once or
b. Permanent job in the company that are going to establish in this region or
c. Two thousand rupees as monthly pension for a time period of 20 years in which three thousand rupees as addditional compensation i.e five thousand rupees for the first year and Two thousand rupees as monthly pension for the rest of 19 years.
2. Assigned lands should also get equal compensation inline with cultivated land as
3. 12 lakhs six thousand rupees compensation has been paid for D.farm lands. These lands should also get compensation of 18 lakhs as per land Acquisiton act, 2013.
4. Compensation for trees was paid under the GOMSNO: 357 (2005 year), but we are requesting you to increase the compensation and pay it according to the new GOMSNO: 268.
5. There are many mismatching in the figures of lands in Mulavarpa, patimedha, thumalapeta, thamayapeta, chandanada(karthivari veedhi) villages and it has to be rectified. In 2016 award has been passed but compensation has been paid as per 2015 sub registrar, nakkapalli calculations. This has to be modified and compensation for houses has to be paid as per 2016 calculation.
6. Compensation for Houses in Mulavarpa, patimedha, thumalapeta, thamayapeta, chandanada(karthivari veedhi) villages was one lakh rupees in which ten thousand rupees has been deducted for income tax. The
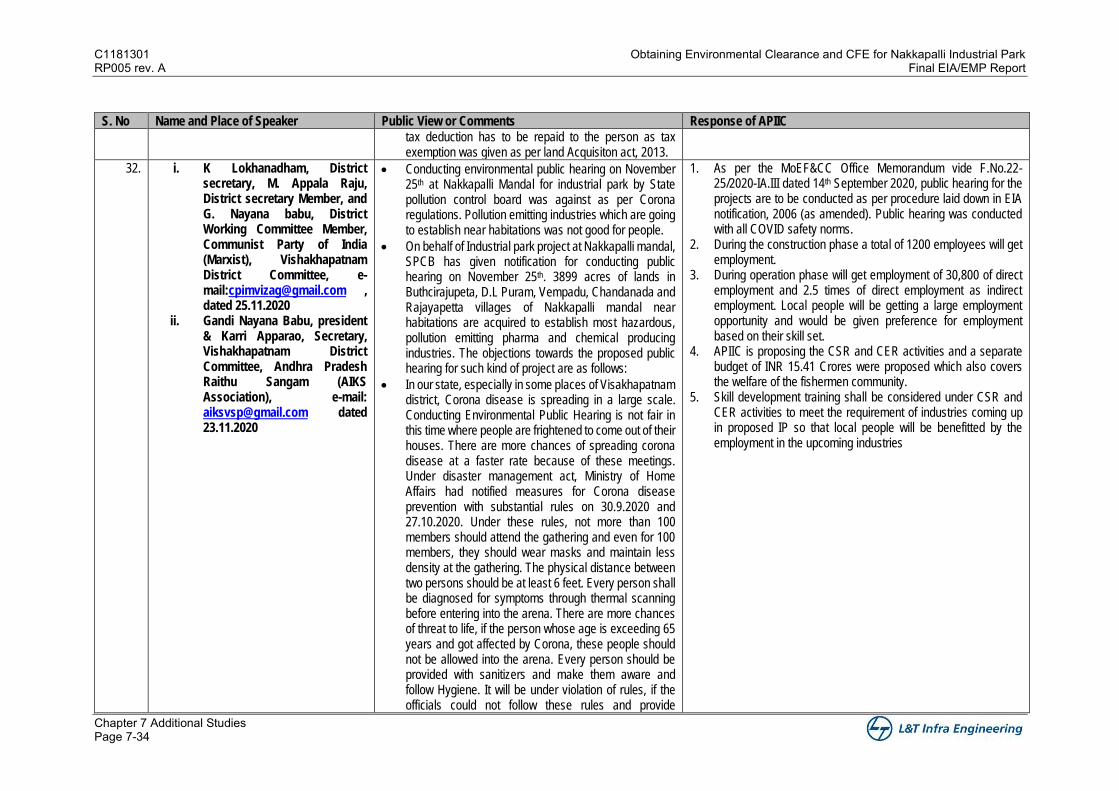
C1181301 Obtaining Environmental Clearance and CFE for Nakkapalli Industrial Park RP005 rev. A Final EIA/EMP Report
Chapter 7 Additional Studies Page 7-34
S. No Name and Place of Speaker Public View or Comments Response of APIIC
tax deduction has to be repaid to the person as tax exemption was given as per land Acquisiton act, 2013.
32. i. K Lokhanadham, District secretary, M. Appala Raju, District secretary Member, and G. Nayana babu, District Working Committee Member, Communist Party of India (Marxist), Vishakhapatnam District Committee, e-mail:[email protected] , dated 25.11.2020
ii. Gandi Nayana Babu, president & Karri Apparao, Secretary, Vishakhapatnam District Committee, Andhra Pradesh Raithu Sangam (AIKS Association), e-mail: [email protected] dated 23.11.2020
• Conducting environmental public hearing on November 25th at Nakkapalli Mandal for industrial park by State pollution control board was against as per Corona regulations. Pollution emitting industries which are going to establish near habitations was not good for people.
• On behalf of Industrial park project at Nakkapalli mandal, SPCB has given notification for conducting public hearing on November 25th. 3899 acres of lands in Buthcirajupeta, D.L Puram, Vempadu, Chandanada and Rajayapetta villages of Nakkapalli mandal near habitations are acquired to establish most hazardous, pollution emitting pharma and chemical producing industries. The objections towards the proposed public hearing for such kind of project are as follows:
• In our state, especially in some places of Visakhapatnam district, Corona disease is spreading in a large scale. Conducting Environmental Public Hearing is not fair in this time where people are frightened to come out of their houses. There are more chances of spreading corona disease at a faster rate because of these meetings. Under disaster management act, Ministry of Home Affairs had notified measures for Corona disease prevention with substantial rules on 30.9.2020 and 27.10.2020. Under these rules, not more than 100 members should attend the gathering and even for 100 members, they should wear masks and maintain less density at the gathering. The physical distance between two persons should be at least 6 feet. Every person shall be diagnosed for symptoms through thermal scanning before entering into the arena. There are more chances of threat to life, if the person whose age is exceeding 65 years and got affected by Corona, these people should not be allowed into the arena. Every person should be provided with sanitizers and make them aware and follow Hygiene. It will be under violation of rules, if the officials could not follow these rules and provide
1. As per the MoEF&CC Office Memorandum vide F.No.22-25/2020-IA.III dated 14th September 2020, public hearing for the projects are to be conducted as per procedure laid down in EIA notification, 2006 (as amended). Public hearing was conducted with all COVID safety norms.
2. During the construction phase a total of 1200 employees will get employment.
3. During operation phase will get employment of 30,800 of direct employment and 2.5 times of direct employment as indirect employment. Local people will be getting a large employment opportunity and would be given preference for employment based on their skill set.
4. APIIC is proposing the CSR and CER activities and a separate budget of INR 15.41 Crores were proposed which also covers the welfare of the fishermen community.
5. Skill development training shall be considered under CSR and CER activities to meet the requirement of industries coming up in proposed IP so that local people will be benefitted by the employment in the upcoming industries
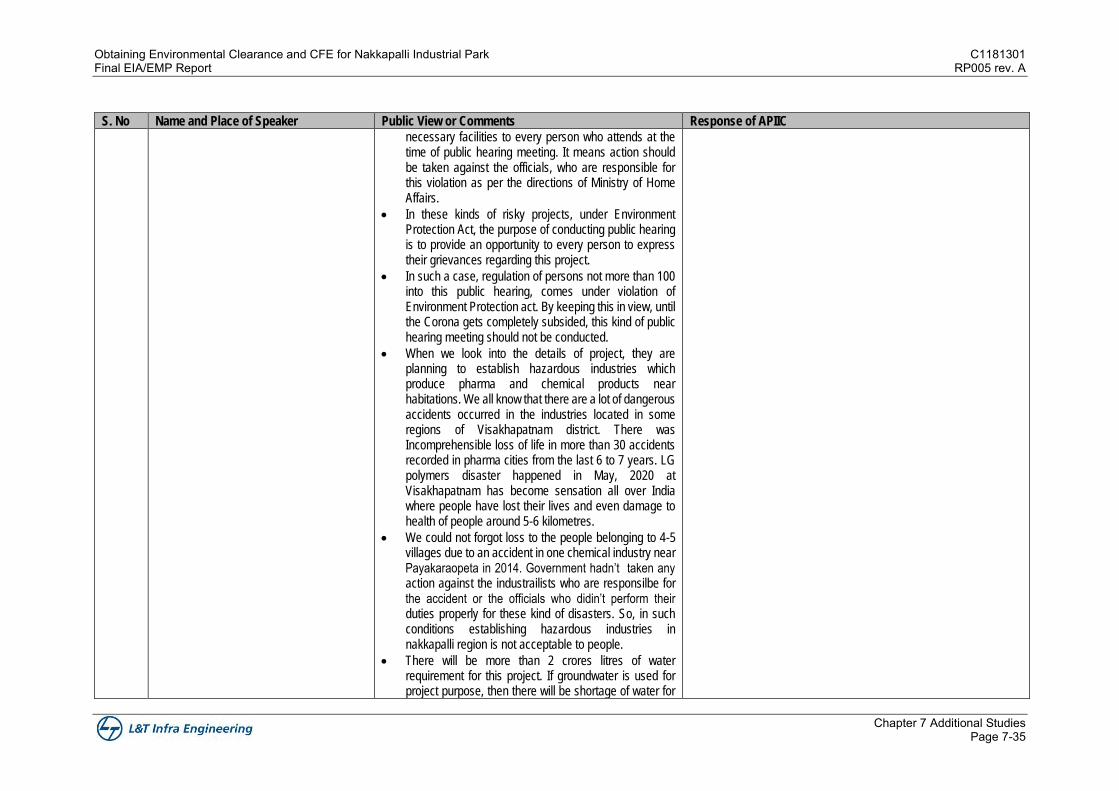
Obtaining Environmental Clearance and CFE for Nakkapalli Industrial Park C1181301 Final EIA/EMP Report RP005 rev. A
Chapter 7 Additional Studies Page 7-35
S. No Name and Place of Speaker Public View or Comments Response of APIIC
necessary facilities to every person who attends at the time of public hearing meeting. It means action should be taken against the officials, who are responsible for this violation as per the directions of Ministry of Home Affairs.
• In these kinds of risky projects, under Environment Protection Act, the purpose of conducting public hearing is to provide an opportunity to every person to express their grievances regarding this project.
• In such a case, regulation of persons not more than 100 into this public hearing, comes under violation of Environment Protection act. By keeping this in view, until the Corona gets completely subsided, this kind of public hearing meeting should not be conducted.
• When we look into the details of project, they are planning to establish hazardous industries which produce pharma and chemical products near habitations. We all know that there are a lot of dangerous accidents occurred in the industries located in some regions of Visakhapatnam district. There was Incomprehensible loss of life in more than 30 accidents recorded in pharma cities from the last 6 to 7 years. LG polymers disaster happened in May, 2020 at Visakhapatnam has become sensation all over India where people have lost their lives and even damage to health of people around 5-6 kilometres.
• We could not forgot loss to the people belonging to 4-5 villages due to an accident in one chemical industry near Payakaraopeta in 2014. Government hadn’t taken any action against the industrailists who are responsilbe for the accident or the officials who didin’t perform their duties properly for these kind of disasters. So, in such conditions establishing hazardous industries in nakkapalli region is not acceptable to people.
• There will be more than 2 crores litres of water requirement for this project. If groundwater is used for project purpose, then there will be shortage of water for
C1181301 Obtaining Environmental Clearance and CFE for Nakkapalli Industrial Park RP005 rev. A Final EIA/EMP Report
Chapter 7 Additional Studies Page 7-36
S. No Name and Place of Speaker Public View or Comments Response of APIIC
drinking water and agricultural purpose. Even after completion of Polavaram project, water resources could not be sufficient to cater the water demand for the public and the existing industries in Visakhapatnam district. Because of the above stated reasons, there are chances that water scarcity will become a worse problem, if industrial park gets established in Nakkapalli.
• The Assessment report prepared for this project was having some false statements which were kept in front of people. Example: It is mentioned that the Visakhapatnam industrial cluster is not creating any high pollution. Visakhapatnam region is one of the most polluted industrial regions identified by Central pollution control board (CPCB). In these circumstances, proposed project at Nakkapalli will create additional pollution in this region. This will be a lot of negative impact on public health. Providing this type of false information to public will be considered as violation of Environment Protection act.
• In the report which was made available in public domain has mentioned that there are no Eco-sensitive areas in the region. In 3899 acres of prposed project land, almost 6% is under CRZ area. lakes, canals are present in the project area. Even though polluting waste materials are treated, if they gets mixed with the groundwater, lakes, agricultural fields and seawater, there will be loss to people’s health and agriculture. The proof for this is pharmacity where the sea coast and lakes are affected by pollution in a largescale. It seems to be misleading people if we say that there will be huge employment opportunities because of this project. From the last 10 years, local people who got job and employment opportunities was very less because of the establishment of many industries but thousands of people lost their agricultural employment in Visakhapatnam district. Public health will be damaged due to pollution. Worse condtion has occurred when public has to be dependent on NTPC tankers for water
Obtaining Environmental Clearance and CFE for Nakkapalli Industrial Park C1181301 Final EIA/EMP Report RP005 rev. A
Chapter 7 Additional Studies Page 7-37
S. No Name and Place of Speaker Public View or Comments Response of APIIC
because of the groundwater pollution happened due to Shimadri Power project. Same conditions will also occur in Nakkapalli. If we consider the negative impacts on agriculture and public, there are chances that people will get more loss than less benefits due to this project.
• By keeping all our objections in view, CPI party/ AIKS is requesting pollution control board to not only cancelling the public hearing and also declining the idea of establishing hazardous industries in Nakkapalli mandal and Visakhapatnam region.
33. Smt V. Anitha Ex. MLA 1. Farmers who lost their lands, agricultutral labours, handicraft and fisherman should get the compensation in package as per land Aqcquisiton act, 2013 and the following:
a. People above 18 years shall get 5 lakhs compensation at once or
b. Permanent job in the company that are going to establish in this region or
c. Two thousand rupees as monthly pension for a time period of 20 years in which three thousand rupees as addditional compensation i.e five thousand rupees for the first year and Two thousand rupees as monthly pension for the rest of 19 years.
2. Assigned lands should aslo get equal compensation on par with Cultivated lands.
3. D.farm lands should aslo get equal compensation on par with Assigned lands.
4. Compensation for trees was paid under the GOMSNO: 357 (2005 year), but we are requesting you to increase the compensation and pay it according to the new GOMSNO: 268.
5. There are many mismatching in the figures of lands in Mulavarpa, Patimedha, Thumalapeta, Thamayapeta, Chandanada(Karthivari veedhi) villages and it has to be rectified. In 2016 award has been passed but compensation has been paid as per 2015 sub registrar, nakkapalli calculations. This has to be modified and
1. Compensation for land and structure are paid as per G.O 160 issued by GoAP dated November 16, 2016 and District collector orders vide File No. REV-ESECOLND(ATGL)82/2017-JA(E3)-VSKPCO/Dt:19-07-2018.
2. Compensation for land and structure are paid as per G.O 160. As such no R&R is proposed for the settlements existing in the project boundary
3. Compensation for the lands, trees and structures if any involved in land acquisition for development of IP would be decided by the District Collector and APIIC would pay the compensation accordingly.
C1181301 Obtaining Environmental Clearance and CFE for Nakkapalli Industrial Park RP005 rev. A Final EIA/EMP Report
Chapter 7 Additional Studies Page 7-38
S. No Name and Place of Speaker Public View or Comments Response of APIIC
compensation for houses has to be paid as per 2016 calculation.
6. Compensation for Houses in Mulavarpa, Patimedha, Thumalapeta, Thamayapeta, Chandanada(Karthivari veedhi) villages was one lakh rupees in which ten thousand rupees has been deducted for income tax. The tax deduction has to be repaid to the person as tax exemption was given.
34. S. Appala Raju & four others, dated 25.11.2020
Government through APIIC has acquired all lands in Boyapadu village of Nakkapalli Mandal in the name of VCIC corridor. By establishing industries like chemical, petrochemical and pharmaceutical in these lands, fishes will dye due to mixing of toxic wastewater generating from the industries with seawater. We are losing our livelihood, cannot continue fishing in most of the areas and migrating from this region. Already due to companies like Hetro pharma city, we all are losing our livelihood and falling ill because of the diseases that we have never got infected before. Once we can cure the fevers with an amount of 100 to 150 rupees, but now we have to spend around 5000 to 10000 rupees. There were people who had spent more than 1,00,000 rupees for rare diseases like Dengue fever. Many people are getting infected by diseases like cancer. The establishment of Chemical industries will make the living conditions even more pathetic. So, only after fulfilling our demands, you are supposed to conduct this meeting and we are requesting you not to make us like another Polavaram victims. Our demands are as follows: 1. We are requesting for 100% impelementation of land
Acquisition act, 2013. 2. Due to incresed prices and necessities, persons above
18 years as per Aadhar card should be given a package of INR 25,00,00 (Twenty Five lakhs rupees).
3. If husband was deseased in a family, the package should be given to the spouse.
4. R card should be provided to every educated men and women.
1. Compensation for land and structure are paid as per G.O 160 issued by GoAP dated November 16, 2016 and District collector orders vide File No. REV-ESECOLND(ATGL)82/2017-JA(E3)-VSKPCO/Dt:19-07-2018.
2. Compensation for land and structure are paid as per G.O 160. As such no R&R is proposed for the settlements existing in the project boundary
3. Compensation for the lands, trees and structures if any involved in land acquisition for development of IP would be decided by the District Collector and APIIC would pay the compensation accordingly.
4. APIIC is proposing the CSR and CER activities and a separate budget of INR 15.41 Crores were proposed which also covers the welfare of the fishermen community.
5. Skill development training shall be considered under CSR and CER activities to meet the requirement of industries coming up in proposed IP so that local people will be benefitted by the employment in the upcoming industries.
6. Storm water drains are proposed along roadside to cater water from the road surface and adjoining land area.
7. An adequate drainage system will be provided at the site with separate collection streams to segregate the storm run-off from roads, open areas, material storage areas, vehicle wash water and other wastewater streams. Suitable measures will also be taken to prevent the washing away of construction materials into the drainage system.
Obtaining Environmental Clearance and CFE for Nakkapalli Industrial Park C1181301 Final EIA/EMP Report RP005 rev. A
Chapter 7 Additional Studies Page 7-39
S. No Name and Place of Speaker Public View or Comments Response of APIIC
5. As per G.O. passed by state government of Andhra pradesh 75% of jobs should be given to local people. If any management fails to implement the government G.O., Authority to take necessary action should vest in the hands of District collector.
6. Fisherman are losing Saltwater, so for every person who completes 18 years of age should get 2 lakhs rupees as package or as the same uputeru package given to people in bangaramathalli village of N.Rayavaram mandal.
7. Boat, Fishing Net and Engine worth of 3 lakhs rupees should be provided to fisherman.
8. For women who sells dry fishes should be compensated with the same package of bangarama pallem.
9. Superspeciality hospital has to be Setted up in this region
10. Residential school has ro be provided for fisherman children.
11. Jetty need to be provided for fisherman 12. Shed need to be constructed for placing fishing nets. 13. Private cultivable lands, D form, trees should get
compensation as per new G.O. in Boyapadu village. 14. Cold storage yard and platform for dry fish should be
provided. 15. Compensation should paid for lands under Nukkalamma
temple in Boyapadu village. 16. Compensation should paid by keeping in view of present
construction industry 17. Pradhan Manthri Aavas Yojana scheme shall be
appliacble for the construction of new house which will be constructed in the 0.05 cents of land provided by you. Jetty need to be constructed for fisherman. Newly constructed jetty shall be at a distance of 200 metres from village and connecting road to National highway shall also be developed.
18. Star village status shall be provided to our village. 19. Resolution has been passed recently after requesting at
Rajayapeta village for separate panchayath to Boyapadu
C1181301 Obtaining Environmental Clearance and CFE for Nakkapalli Industrial Park RP005 rev. A Final EIA/EMP Report
Chapter 7 Additional Studies Page 7-40
S. No Name and Place of Speaker Public View or Comments Response of APIIC
village. This need to be implemented as soon as possible.
20. Ration card shall be provided to the marriaged men and women.
21. package should be provided to working labour of the Yadav commmunity who rely on Sheep breeding occuption. Goshala shall be provided for Dairy industry.
22. Care should be taken such that 74 acres of land which is under the name of society should belong to all the fisherman.
23. By taking temples into consideration in our village, all temples shall be constructed at one place in the new village and ram temple should be constructed in the centre.
24. Compact drainage network shall be constructed.
35. Kambala Ammoriya, Hon’ble Secretary and convener, Kostha theera parnthala ganga puthrula sankshema seva sangam, Chintaneerala, Nakkapalli Mandal, Visskhapatnam district, Regd. 1982/2005 dated 25.11.2020
Requested to cancel the industries will harm fishermen. 1. Fishery resources are declining as the toxic substances
are getting mixed with sea water due to the establishment of Hetro industry near Nakkapalli mandal and chemical industry near Payakaraopeta mandal. Fishermen are migrating to other districts and states as they were losing their livelihood.
2. As the Pollution control board was not monitoring the systematic control of pollution from the industries as agricultural fields, animals were severely affected by diseases and rots due to this pollution. New-born were born with ailments like jaundice, heart problems and paralysis. Poor people were suffering from kidney, liver, deadly fever and heart diseases where they are losing their life before their average lifespans.
3. We are hearing false promises like “We shall provide employment to the local Fisherman and unemployed people of your village and also develop the infrastructure facilities of your village”. In reality, they are providing employment to people of other districts and other states but not to local people.
4. While establishing these kinds of chemical industries, first conduct Gram Sabha in every village Panchayath,
Some of the important features of the Site making it suitable for Industrial Park are presented
• Strategically located near to four states Andhra Pradesh, Telangana, Chhattisgarh and Odisha.
• The site is located around 60 km from City of Visakhapatnam with well-endowed Social and educational infrastructure.
• The site has good access to logistic facilities. The site is well connected to the Road network in the region from Chennai - Kolkata National Highway 16 which is at a distance of ~2.9 km on North of the site.
• The nearest Railway station to the project site is at Gullipadu located at 7.2 km towards NW.
• Visakhapatnam Airport is located at a distance of 64 km towards NE. The Airport has direct flight connectivity to International destinations such as Kuala Lumpur, Singapore, Colombo, Dubai, National destinations such as Bangalore, Kolkata, Delhi, Hyderabad, Mumbai, Port Blair, Jagdalpur, Tirupati, Vijayawada, Ahmedabad, Bhubaneswar, Chennai, & Coimbatore.
• Gangavaram Port is located at distance of 60 km NE.
• Water and Power supply can be assured for the proposed IP will be met from the Yeleru Left Main Canal (YLMC) in line with the existing industrial water supply policy of the state. APSPDCL is
Obtaining Environmental Clearance and CFE for Nakkapalli Industrial Park C1181301 Final EIA/EMP Report RP005 rev. A
Chapter 7 Additional Studies Page 7-41
S. No Name and Place of Speaker Public View or Comments Response of APIIC
and then the resolution will be passed depending on the acceptance from the people. Only after the completion of above mentioned process, Environmental Public Hearing will be conducted, but here we feel that, we are left as orphans by the government officials.
5. By establishing these kind of chemical industries in our coastal region where the pollution generated in the industries gets mixed with sea destroying fishery resources and also plundering our livelihood. The situation is that the people have to migrate to other state and districts. Many types if aliments are occurring for people because of the pollution.
6. Are there no other districts except our coastal districts to establish these kinds of factories? Can’t you establish the industries in other districts?
7. By using dangerous Corona disease occurred in this year as a shield, conducting public hearing is just deceiving people. So our respected special officer, Visakha -Chennai corridor who came for establishing chemical industries in our costal districts, please have a thorough look into this project. Please cancel the public hearing until we conduct the grama sabha and pass a resolution towards the project at our village panchayath.
responsible for undertaking distribution of Power in Visakhapatnam District.
The site meets the requirement of all critical factors that are important for success of development of Industrial Park in the state and could be a pre-eminent location. 1. As per the MoEF&CC Office Memorandum vide F.No.22-
25/2020-IA.III dated 14th September 2020, public hearing for the projects are to be conducted as per procedure laid down in EIA notification, 2006 (as amended). Public hearing was conducted with all COVID safety norms.
36. Vasupalli Siva, National Association of Fisherman Committee, Rajayapeta, Nakkapalli Mandal, Visakhapatnam District office. Dated 25.11.2020.
Government with APIIC has acquired all lands in Rajaypeta village of Nakkapalli mandal in the name of VCIC corridor. By establishing industries like chemical, petrochemical and pharmaceutical in these lands, fishes will dye due to mixing of toxic wastewater with seawater which are generating from the industries. We will lose our livelihood, cannot continue fishing in most of the areas. The following demands should be fulfilled: 1. Chemial and phama industries should not be
established. 2. Persons above 18 years as per Aadhar card should be
given a package of INR 25,00,00 (Twenty Five lakhs rupees).
3. Mini Jetty should be developed for fisherman of Nakkapalli mandal.
1. Compensation for land and structure are paid as per G.O 160 issued by GoAP dated November 16, 2016 and District collector orders vide File No. REV-ESECOLND(ATGL)82/2017-JA(E3)-VSKPCO/Dt:19-07-2018.
2. Compensation for land and structure are paid as per G.O 160. As such no R&R is proposed for the settlements existing in the project boundary
3. Compensation for the lands, trees and structures if any involved in land acquisition for development of IP would be decided by the District Collector and APIIC would pay the compensation accordingly.
4. APIIC is proposing the CSR and CER activities and a separate budget of INR 15.41 Crores were proposed which also covers the welfare of the fishermen community.
C1181301 Obtaining Environmental Clearance and CFE for Nakkapalli Industrial Park RP005 rev. A Final EIA/EMP Report
Chapter 7 Additional Studies Page 7-42
S. No Name and Place of Speaker Public View or Comments Response of APIIC
4. R card should be provided to every fisherman. 5. Compensation should be paid to the persons whose
livelihood were dependent on 492 acres of Uputeru lake. 6. Super specallity hospital should be developed. 7. Residential school should be developed for fisherman
children of this constituency. 8. The most affected people due to establishment of
industries are fisherman; They should be given compensation in the form of package or as pension for 20 years.
9. Sheds need to be provided for safegaurding the fishing nets of the fisherman.
10. D.L.Puram (fisherman colony), Boyapadu and Rajayapeta fisherman villagees in Nakkapalli mandal should not be relocated.
11. 100 percent employment should be given to young men and women of fisherman communtiy in our Rajayapeta village.
12. Compensation for private land, D-from lansd and trees should be paid as per new GO Number: 268.
13. Minimum of three cold storage yards should be developed in our constituency.
14. rajayapeta Nukkalamma ammavari lands, sri ramula temple lands should belong to village and compensation shall be paid for those lands.
Until the above mentioned get resolved, public hearing and land acquisition shall not be conducted.
5. Skill development training shall be considered under CSR and CER activities to meet the requirement of industries coming up in proposed IP so that local people will be benefitted by the employment in the upcoming industries.
37. P. Kondala Roa, 9866859183
We, governing members of rajayapeta village sea fisherman society A-11, Nakkapalli mandal. Under the orders of visakhapatnam collector, h land has given to our society in survey No:291; land R.C.NO: 9178/91/J/dated 03.07.1994 in Rajayapeta village. In Rajayapeta village, survey No:291 A, 153.40 scents of government land was given under lease manner for prawn culture. We are culturing higly priced fishes in those lands. Recently government are acquring the lands which are given for our society in that survey number fro industrial park (Visakha - Chennai corridor). We are losing our
1. Compensation for land and structure are paid as per G.O 160 issued by GoAP dated November 16, 2016 and District collector orders vide File No. REV-ESECOLND(ATGL)82/2017-JA(E3)-VSKPCO/Dt:19-07-2018.
Obtaining Environmental Clearance and CFE for Nakkapalli Industrial Park C1181301 Final EIA/EMP Report RP005 rev. A
Chapter 7 Additional Studies Page 7-43
S. No Name and Place of Speaker Public View or Comments Response of APIIC
livelihood as the lands were being acquired by the government. Already goverenment has acquired land for Naval Dockeyard. 381.25 cents of fisherman society land in Rambilli, S.Rayavaram mandals were acuired by government and they paid a compensation to the primary members of society as same as other lands as per Memo No: 24433. We humbly request you to pay compensation for the society lands in survey No:291 as per same memo.
38. P. Kondala Roa, 9866859183
We Rajayapeta village sea fisherman society A-11, Nakkapalli mandal. Under the orders of visakhapatnam collector, land has given to our society in survey no:291; land R.C.NO: 9178/91/J/dated 03.07.1994 in Rajayapeta village. We have developed acquaculture ponds(fish) and cultivating the same and we don’t have any record for the land provided. Currently compensation is paid for lands given to our society. Hence we request district collector to provide record for our lands.
39. B. Venkatesh, President, Rajayapeta. We, governing members of Rajayapeta village sea fisherman society, Nakkapalli Mandal. Under the orders of visakhapatnam Collector, land was given to our society in survey No:291; Ac.76.99 scents of government land was given under lease manner for prawn culture through R.C.NO: 9178/91/J/dated 03.07.1994 in Rajayapeta village. We are culturing higly priced fishes in those lands. Recently government is acquiring the lands which are given to our society for industrial park (Visakha - Chennai corridor). We are losing our livelihood as the lands were being acquired by the government. Already goverenment has acquired land for Naval Dockeyard (NOAB). 381.25 cents of fisherman society land in Rambilli, S.Rayavaram mandals were acuired by government and they paid a compensation to the primary members (nearly 400 members) of society as same as other lands as per Memo No: 24433/LA/(A1) 2013/2, dated 30-9-2018 by Revenue (Land Acqusition) department. We humbly request you to pay compensation for the society lands in survey No:291 as per same memo.
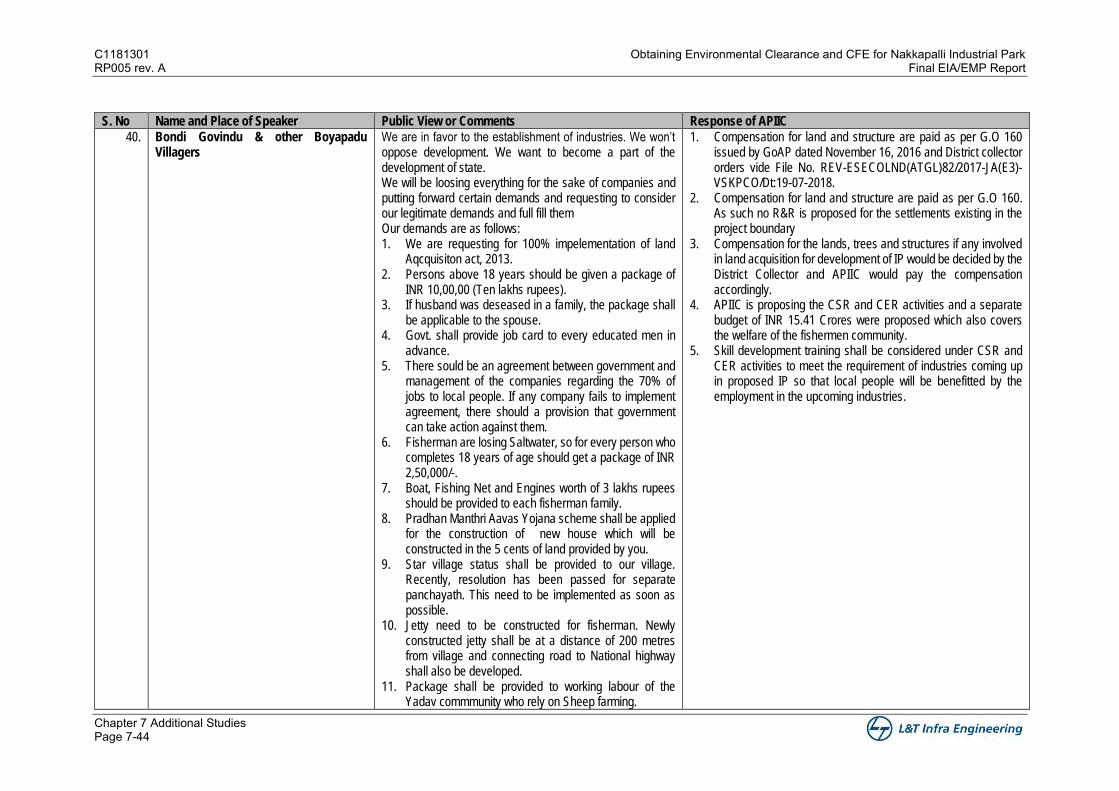
C1181301 Obtaining Environmental Clearance and CFE for Nakkapalli Industrial Park RP005 rev. A Final EIA/EMP Report
Chapter 7 Additional Studies Page 7-44
S. No Name and Place of Speaker Public View or Comments Response of APIIC
40. Bondi Govindu & other Boyapadu Villagers
We are in favor to the establishment of industries. We won’t oppose development. We want to become a part of the development of state. We will be loosing everything for the sake of companies and putting forward certain demands and requesting to consider our legitimate demands and full fill them Our demands are as follows: 1. We are requesting for 100% impelementation of land
Aqcquisiton act, 2013. 2. Persons above 18 years should be given a package of
INR 10,00,00 (Ten lakhs rupees). 3. If husband was deseased in a family, the package shall
be applicable to the spouse. 4. Govt. shall provide job card to every educated men in
advance. 5. There sould be an agreement between government and
management of the companies regarding the 70% of jobs to local people. If any company fails to implement agreement, there should a provision that government can take action against them.
6. Fisherman are losing Saltwater, so for every person who completes 18 years of age should get a package of INR 2,50,000/-.
7. Boat, Fishing Net and Engines worth of 3 lakhs rupees should be provided to each fisherman family.
8. Pradhan Manthri Aavas Yojana scheme shall be applied for the construction of new house which will be constructed in the 5 cents of land provided by you.
9. Star village status shall be provided to our village. Recently, resolution has been passed for separate panchayath. This need to be implemented as soon as possible.
10. Jetty need to be constructed for fisherman. Newly constructed jetty shall be at a distance of 200 metres from village and connecting road to National highway shall also be developed.
11. Package shall be provided to working labour of the Yadav commmunity who rely on Sheep farming.
1. Compensation for land and structure are paid as per G.O 160 issued by GoAP dated November 16, 2016 and District collector orders vide File No. REV-ESECOLND(ATGL)82/2017-JA(E3)-VSKPCO/Dt:19-07-2018.
2. Compensation for land and structure are paid as per G.O 160. As such no R&R is proposed for the settlements existing in the project boundary
3. Compensation for the lands, trees and structures if any involved in land acquisition for development of IP would be decided by the District Collector and APIIC would pay the compensation accordingly.
4. APIIC is proposing the CSR and CER activities and a separate budget of INR 15.41 Crores were proposed which also covers the welfare of the fishermen community.
5. Skill development training shall be considered under CSR and CER activities to meet the requirement of industries coming up in proposed IP so that local people will be benefitted by the employment in the upcoming industries.
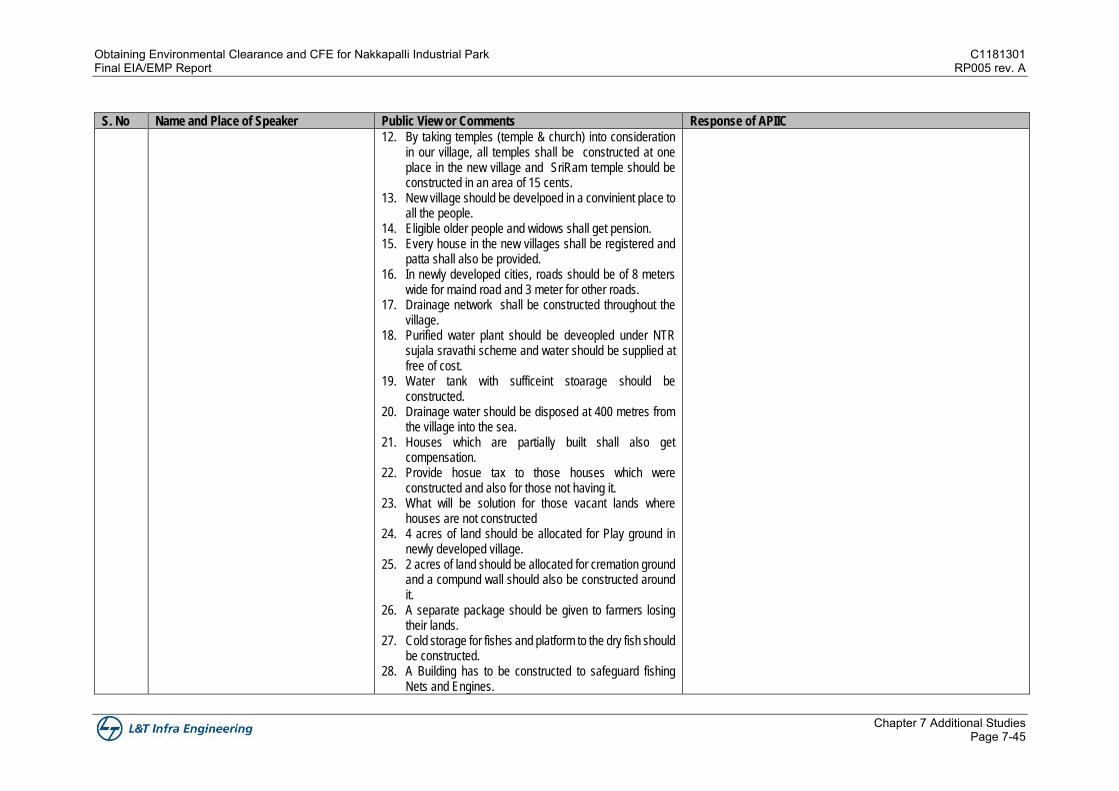
Obtaining Environmental Clearance and CFE for Nakkapalli Industrial Park C1181301 Final EIA/EMP Report RP005 rev. A
Chapter 7 Additional Studies Page 7-45
S. No Name and Place of Speaker Public View or Comments Response of APIIC
12. By taking temples (temple & church) into consideration in our village, all temples shall be constructed at one place in the new village and SriRam temple should be constructed in an area of 15 cents.
13. New village should be develpoed in a convinient place to all the people.
14. Eligible older people and widows shall get pension. 15. Every house in the new villages shall be registered and
patta shall also be provided. 16. In newly developed cities, roads should be of 8 meters
wide for maind road and 3 meter for other roads. 17. Drainage network shall be constructed throughout the
village. 18. Purified water plant should be deveopled under NTR
sujala sravathi scheme and water should be supplied at free of cost.
19. Water tank with sufficeint stoarage should be constructed.
20. Drainage water should be disposed at 400 metres from the village into the sea.
21. Houses which are partially built shall also get compensation.
22. Provide hosue tax to those houses which were constructed and also for those not having it.
23. What will be solution for those vacant lands where houses are not constructed
24. 4 acres of land should be allocated for Play ground in newly developed village.
25. 2 acres of land should be allocated for cremation ground and a compund wall should also be constructed around it.
26. A separate package should be given to farmers losing their lands.
27. Cold storage for fishes and platform to the dry fish should be constructed.
28. A Building has to be constructed to safeguard fishing Nets and Engines.
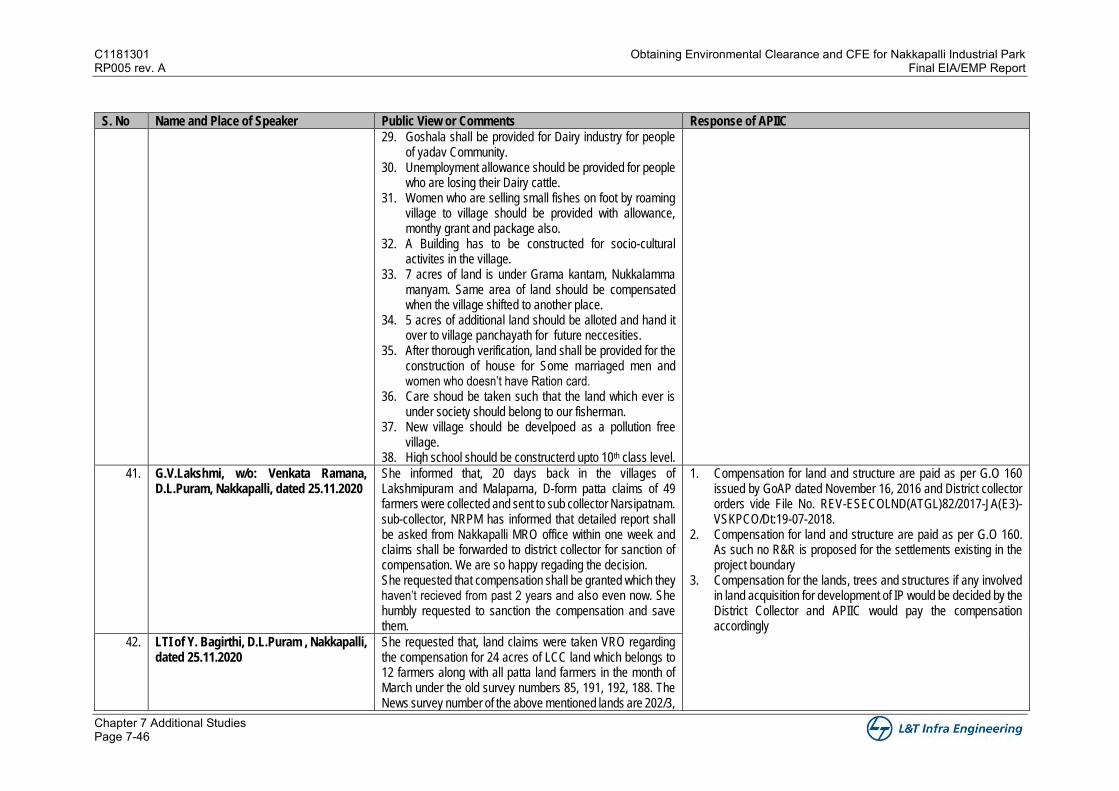
C1181301 Obtaining Environmental Clearance and CFE for Nakkapalli Industrial Park RP005 rev. A Final EIA/EMP Report
Chapter 7 Additional Studies Page 7-46
S. No Name and Place of Speaker Public View or Comments Response of APIIC
29. Goshala shall be provided for Dairy industry for people of yadav Community.
30. Unemployment allowance should be provided for people who are losing their Dairy cattle.
31. Women who are selling small fishes on foot by roaming village to village should be provided with allowance, monthy grant and package also.
32. A Building has to be constructed for socio-cultural activites in the village.
33. 7 acres of land is under Grama kantam, Nukkalamma manyam. Same area of land should be compensated when the village shifted to another place.
34. 5 acres of additional land should be alloted and hand it over to village panchayath for future neccesities.
35. After thorough verification, land shall be provided for the construction of house for Some marriaged men and women who doesn’t have Ration card.
36. Care shoud be taken such that the land which ever is under society should belong to our fisherman.
37. New village should be develpoed as a pollution free village.
38. High school should be constructerd upto 10th class level.
41. G.V.Lakshmi, w/o: Venkata Ramana, D.L.Puram, Nakkapalli, dated 25.11.2020
She informed that, 20 days back in the villages of Lakshmipuram and Malaparna, D-form patta claims of 49 farmers were collected and sent to sub collector Narsipatnam. sub-collector, NRPM has informed that detailed report shall be asked from Nakkapalli MRO office within one week and claims shall be forwarded to district collector for sanction of compensation. We are so happy regading the decision. She requested that compensation shall be granted which they haven’t recieved from past 2 years and also even now. She humbly requested to sanction the compensation and save them.
1. Compensation for land and structure are paid as per G.O 160 issued by GoAP dated November 16, 2016 and District collector orders vide File No. REV-ESECOLND(ATGL)82/2017-JA(E3)-VSKPCO/Dt:19-07-2018.
2. Compensation for land and structure are paid as per G.O 160. As such no R&R is proposed for the settlements existing in the project boundary
3. Compensation for the lands, trees and structures if any involved in land acquisition for development of IP would be decided by the District Collector and APIIC would pay the compensation accordingly
42. LTI of Y. Bagirthi, D.L.Puram , Nakkapalli, dated 25.11.2020
She requested that, land claims were taken VRO regarding the compensation for 24 acres of LCC land which belongs to 12 farmers along with all patta land farmers in the month of March under the old survey numbers 85, 191, 192, 188. The News survey number of the above mentioned lands are 202/3,
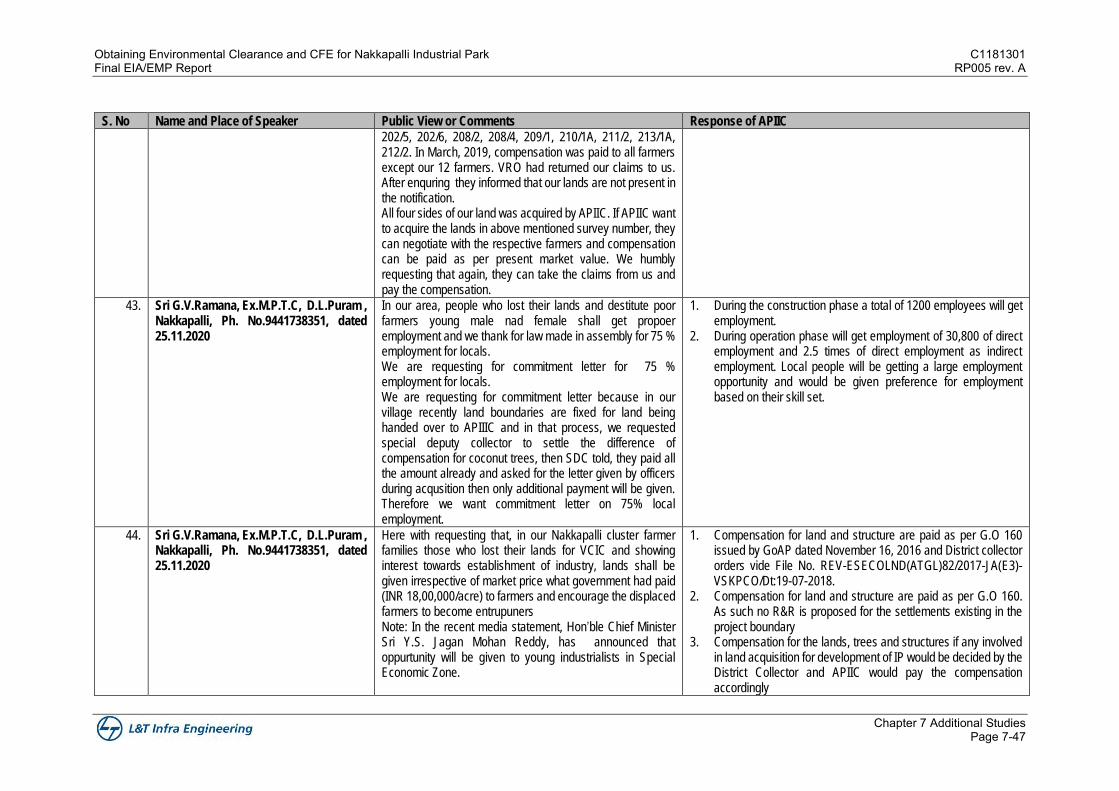
Obtaining Environmental Clearance and CFE for Nakkapalli Industrial Park C1181301 Final EIA/EMP Report RP005 rev. A
Chapter 7 Additional Studies Page 7-47
S. No Name and Place of Speaker Public View or Comments Response of APIIC
202/5, 202/6, 208/2, 208/4, 209/1, 210/1A, 211/2, 213/1A, 212/2. In March, 2019, compensation was paid to all farmers except our 12 farmers. VRO had returned our claims to us. After enquring they informed that our lands are not present in the notification. All four sides of our land was acquired by APIIC. If APIIC want to acquire the lands in above mentioned survey number, they can negotiate with the respective farmers and compensation can be paid as per present market value. We humbly requesting that again, they can take the claims from us and pay the compensation.
43. Sri G.V.Ramana, Ex.M.P.T.C, D.L.Puram , Nakkapalli, Ph. No.9441738351, dated 25.11.2020
In our area, people who lost their lands and destitute poor farmers young male nad female shall get propoer employment and we thank for law made in assembly for 75 % employment for locals. We are requesting for commitment letter for 75 % employment for locals. We are requesting for commitment letter because in our village recently land boundaries are fixed for land being handed over to APIIIC and in that process, we requested special deputy collector to settle the difference of compensation for coconut trees, then SDC told, they paid all the amount already and asked for the letter given by officers during acqusition then only additional payment will be given. Therefore we want commitment letter on 75% local employment.
1. During the construction phase a total of 1200 employees will get employment.
2. During operation phase will get employment of 30,800 of direct employment and 2.5 times of direct employment as indirect employment. Local people will be getting a large employment opportunity and would be given preference for employment based on their skill set.
44. Sri G.V.Ramana, Ex.M.P.T.C, D.L.Puram , Nakkapalli, Ph. No.9441738351, dated 25.11.2020
Here with requesting that, in our Nakkapalli cluster farmer families those who lost their lands for VCIC and showing interest towards establishment of industry, lands shall be given irrespective of market price what government had paid (INR 18,00,000/acre) to farmers and encourage the displaced farmers to become entrupuners Note: In the recent media statement, Hon’ble Chief Minister Sri Y.S. Jagan Mohan Reddy, has announced that oppurtunity will be given to young industrialists in Special Economic Zone.
1. Compensation for land and structure are paid as per G.O 160 issued by GoAP dated November 16, 2016 and District collector orders vide File No. REV-ESECOLND(ATGL)82/2017-JA(E3)-VSKPCO/Dt:19-07-2018.
2. Compensation for land and structure are paid as per G.O 160. As such no R&R is proposed for the settlements existing in the project boundary
3. Compensation for the lands, trees and structures if any involved in land acquisition for development of IP would be decided by the District Collector and APIIC would pay the compensation accordingly
C1181301 Obtaining Environmental Clearance and CFE for Nakkapalli Industrial Park RP005 rev. A Final EIA/EMP Report
Chapter 7 Additional Studies Page 7-48
S. No Name and Place of Speaker Public View or Comments Response of APIIC
45. Thota Appa Rao, Upamaka, Dated 25.11.2020
When I spoke at the venue i.e public consultation conducted on November 25th at Rajayapeta village, Nakkapalli Mandal, I opposed the establishment of pharmacetical companies, chemical companies. Informing that I am opposing todays public hearing.
1. Zonation plan was prepared for Nakkaplli IP based on MoEF&CC recommendations and CPCB categorizations of industrial activities.
2. Orange, Green and White category Industries like Industrial and consumer electronics, Auto components, Aero space and defence - R&D, Aero engine components, communication devices and MSME are proposed within 50m - 250m from settlement.
3. Red category Industries such as Engineering (light and heavy engineering), Building Materials, Industry/Non - Metallic minerals (processed minerals, Clay building products, bricks, AAC Blocks, Kerbs Stones), Food and Agro Processing Industry, Automobile manufacturing, Aerospace and defence are proposed within 250m - 500m from settlement.
4. Red category Industries such as Pharmaceuticals, Chemical, Petrochemical, Tiles, Ceramics and refractories, glass and glassware, graphite, marbles are proposed beyond 500m from settlement
46. Yedida Satyanarayan, S/O: Satya Rao, D.L.Puram , Nakkapalli, Dated 25.11.2020
We are residing in D.L puram since ageolds. We around 200 dalits are living in 15 acres of land under the survery No: 90/28. Here we produce limestone powder in limestone kilns. This issue is already brought to notice of Collector, J.C, R.D.O. We requested government to pay the compensation for those 15 acres of land and eradicate employment problem in our village by providing a special package. Dalits in nearby Chandanda and Rajayapeta villages also produce limestone powder, we are requesting you to grant fair compensation to the eligible people. Similary in D.L.Puram village, under survey No: 85, 300 members are cultivating in 200 acres of land should also get the compensation. Similary in D.L.Puram village, passbooks of 1400 dalit farmers with 28 acres of land under survey No: 85 have been taken by M.R.O.and given to back to farmers. Why it is given back? In the similar fashion, 34 farmers who are cultivating in the land, didn’t recieve the compensation as per records in D.L.Puram. please state the reason behind it.
1. Compensation for land and structure are paid as per G.O 160 issued by GoAP dated November 16, 2016 and District collector orders vide File No. REV-ESECOLND(ATGL)82/2017-JA(E3)-VSKPCO/Dt:19-07-2018.
2. Compensation for land and structure are paid as per G.O 160. As such no R&R is proposed for the settlements existing in the project boundary
3. Compensation for the lands, trees and structures if any involved in land acquisition for development of IP would be decided by the District Collector and APIIC would pay the compensation accordingly
Obtaining Environmental Clearance and CFE for Nakkapalli Industrial Park C1181301 Final EIA/EMP Report RP005 rev. A
Chapter 7 Additional Studies Page 7-49
S. No Name and Place of Speaker Public View or Comments Response of APIIC
Similarly in D.L.Puram, one dalit women having a private land of 83 cents in survey No:171/2 hadn’t received the compensation. We even informed to the APIIC, but the dalit women hadn’t received the compensation. We are requesting the officers with all due respect to solve these issues.
47. Rokalla Govindulu, S. Petakap, M. Nageswara Rao and others
APIIC had acquired lands under VCIC in Thammayapeta and Thummalapeta villages of Chandanada panchayat. We are requesting full compensation for private lands, D-form lands and cultivable lands as per land Acqustion act, 2013. In the similar way, package and full scale compensation should be provided to trees and houses. 1. As per Land Acqustion act, 2013, Persons attained 18
years shall be given a package of INR 5,00,00 (Five lakhs rupees) or two thousand rupees per month as pension for 20 years or permanent employment in the company.
2. We are requesting full compensation for D-form lands and cultiviable lands on par with private lands as per land Acqustion act, 2013
3. Compensation was not paid to some private lands in Chandanada revenue village. These are part of APIIC land acquision notification. Compensation was not paid for Survey number 41-2 - 84 cents, S. No. 85-5 - 16 cents, S. No. 76 – cents, S. No. 85-17 - 17 cents, S. No. 85-17 - 16 cents, S. No. 75-3 - 28 cents. There are a lot of mismathces in chandanada revenue village. Requested to recheck compeletely and pay the compensation.
4. Compensation for trees was paid as per the G.O. MSNO: 357 , but we are requesting you to increase the compensation and pay it according to the new MSNO: 268. Till now, some of the farmers hadn’t received the compensation. For example: Punyamanthula Lovaraju, Punyamanthula Atharsu.
5. Please pay the compensaton for the agricultural bores which are present in our lands.
6. compensation for houses has been paid as per 2015 sub registrar calculations, but the land acquistion was
C1181301 Obtaining Environmental Clearance and CFE for Nakkapalli Industrial Park RP005 rev. A Final EIA/EMP Report
Chapter 7 Additional Studies Page 7-50
S. No Name and Place of Speaker Public View or Comments Response of APIIC
happened in 2016 for this reason compensation for houses has to be paid as per 2016 sub registrar calculation.
7. Income tax has been deducted for the land and houses acquired through APIIC which is against the law requested to pay back the amount immediately.
48. G. Naga Raju, Yeripalli Nagesh, P. Kameswara Rao
Government through APIIC has acquired all lands in Rajaypeta village of Nakkapalli Mandal in the name of VCIC corridor. By establishing industries like chemical, petrochemical and pharmaceutical in these lands, we will lose our livelihood as fishery resources will dye due to mixing of toxic wastewater with seawater generated from the industries. The following demands should be fulfilled: 1. Chemial and phama industries should not be
established. 2. Male and female attained 18 years as per Aadhar card
should be given compensation of INR 25,00,00 (Twenty Five lakhs rupees).
3. R card should be provided to every household. 4. Every licensed fisherman should be provided with Sona
boat. 5. Compensation should be paid to the persons whose
livelihood were dependent on 492 acres of Uputeru lake. 6. Super specallity hospital should be establised. 7. Residential school should be developed for fisherman
children. 8. Jetty should be developed for fisherman. 9. Sheds shall be provided for storing the fishing nets of the
fisherman. 10. Our Rajayapeta village should not be relocated. 11. 100 percent employment should be given to rajayapeta
young men, women an local people of our Rajayapeta village.
12. SC, ST people should get the compensation 13. Dailts should get compensation and sheds. 14. Geetha karmikulu should also get compensation. 15. Compensation for private land, D-from lansd and trees
should be paid as per new GO Number: 268.
1. Compensation for land and structure are paid as per G.O 160 issued by GoAP dated November 16, 2016 and District collector orders vide File No. REV-ESECOLND(ATGL)82/2017-JA(E3)-VSKPCO/Dt:19-07-2018.
2. Compensation for land and structure are paid as per GO.160. As such no R&R is proposed for the settlements existing in the project boundary
3. Compensation for the lands, trees and structures if any involved in land acquisition for development of IP would be decided by the District Collector and APIIC would pay the compensation accordingly. APIIC is proposing the CSR and CER activities and a separate budget of INR 15.41 Crores were proposed which also covers the welfare of the fishermen community.
4. Skill development training shall be considered under CSR and CER activities to meet the requirement of industries coming up in proposed IP so that local people will be benefitted by the employment in the upcoming industries.
Obtaining Environmental Clearance and CFE for Nakkapalli Industrial Park C1181301 Final EIA/EMP Report RP005 rev. A
Chapter 7 Additional Studies Page 7-51
S. No Name and Place of Speaker Public View or Comments Response of APIIC
16. Cold storage facilities shall be provided. 17. Our rajayapeta Nukkalamma ammavari lands, sri ramula
temple lands should also get compensation Until the above mentioned are resolved, public hearing shall not be conducted, and lands shall not be acquired.
C1181301 Obtaining Environmental Clearance and CFE for Nakkapalli Industrial Park RP005 rev. A Final EIA/EMP Report
Chapter 7 Additional Studies Page 7-52
7.2 Risk Analysis
The proposed Nakkapalli IP will have the following sub sectors of the industries
• Industrial and consumer electronics • Automobiles & Auto components • Aerospace and defence • MSME • Engineering (Light & Heavy) • Building Materials • Food and Agro Processing • Pharmaceuticals • Chemical • Petrochemical • Tiles, Ceramics and refractories, glass, graphite and marbles
Some of the major hazards identified from the sample industries are as follows:
Automobile
The assembly of motor vehicles can potentially create a number of E&S risk issues. Most of these risks are associated with substances which are used during the manufacturing process as well as hazards arising from waste and emissions. Automobile manufacturing industry involves organic solvents and significant volatile organic compound (VOC) emissions. Hazardous chemicals and process gases may be used in the assembly process of motor vehicles
Food and Agro Processing Industry
Anhydrous ammonia is a popular refrigerant in food processing and manufacturing facilities. Especially in meat processing plants and other food processing plant it is found to be used. Despite that ubiquity, ammonia poses numerous risks to workers. Those hazards include:
• Corrosive: Ammonia can cause damage to the skin, eyes, and lungs. • Flammable: Ammonia can be lethal at concentrations of roughly 15% to 28% by volume
in air. • Explosive: If released in enclosed spaces with a source of ignition present, ammonia can
cause life-threatening explosions.
Food processing and manufacturing plants using ammonia as refrigerant must label all pipes that transport ammonia and hazard mitigation measures to be followed.
Metals
Chemicals used during metal product manufacturing, in particular during sintering, surface preparation and finishing and also contact with allergenic elements (e.g. chromium, nickel, lead, and beryllium) will cause dermal hazards. Fumes containing metals, metal oxides, organic and inorganic compounds, particulates, dust, and VOC will cause inhalation hazards.
Certain welding techniques (including all the arc, plasma, laser and electron beam welding methods) use significant energy and generate radiation that may be dangerous for the operator. Another source of radiation involves X-ray stations for continuous monitoring of product quality.
Obtaining Environmental Clearance and CFE for Nakkapalli Industrial Park C1181301 Final EIA/EMP Report RP005 rev. A
Chapter 7 Additional Studies Page 7-53
Non-metallic minerals (except glass) Cement dust is a particularly alkaline and irritant dust and might therefore be considered to pose a greater risk of respiratory tract damage than many other poorly soluble dusts (generically often referred to as “low toxicity dusts”).
Hazardous properties relating to these substances are many and varied and include flammability, combustion potential, toxicity, corrosive potential and oxidising potential. Chemicals with such properties should be labelled with the appropriate internationally recognised hazard symbol. Some chemicals may only possess a hazard potential if they have the opportunity to react with other compounds.
Inadequate control or accidental releases of hazardous substances on site or in transit may result in significant environmental impacts in relation to soil, groundwater and surface water contamination and occupational health and safety, e.g. disposal of empty drums and packaging of fuel and chemicals.
A systematic Risk Analysis will help in identification of the hazards and associated risk. This study assesses risks associated with the construction and operation of the proposed Nakkapalli IP member industries or units coming up in the Nakkapalli IP has to carry out risk analysis by considering the hazards associated with handling of different chemicals or hazardous materials which will be used as per requirement of production/manufacturing process may include the use of numerous potentially hazardous chemicals. Material specific chemical protection programs shall be developed and implemented. Worker shall be protected from exposure to process chemicals including but not limited to acids, bases, solvents and metal sludge etc. Risks associated with handling storage of paints/chemical/equipment at proposed Nakkapalli IP are considered and accordingly mitigation measures are suggested in this DMP. This study provides inputs for formulating the onsite Disaster Management Plan (DMP) at Nakkapalli IP level. The Risk Analysis has been broadly divided into three categories.
• Hazard Identification • Failure Frequency • Risk Reducing Measures
7.2.1 Hazard Identification
A classical definition of hazard states “hazard is in fact the characteristic of system/ plant/ process that presents potential for an accident.” Hence, all the components of a system such as process, storage of chemicals, handling, etc., need to be thoroughly examined to assess their potential for initiating or propagating an unplanned event/ sequence of events, which can be termed as an accident.
Identification of hazards is of primary significance in the analysis, quantification and cost-effective control of accidents. Potential Hazards identified in the proposed Nakkapalli IP have been broadly classified as below:
• Hazards during Construction Phase o Mechanical Hazards o Transportation Hazards o Physical Hazards o Storage and Handling of Hazardous Materials
• Hazards during Operation Phase o Material Hazards o Mechanical Hazards o Handling, Storage and Transportation Hazards
C1181301 Obtaining Environmental Clearance and CFE for Nakkapalli Industrial Park RP005 rev. A Final EIA/EMP Report
Chapter 7 Additional Studies Page 7-54
o Plant Hazards • Hazards due to Natural Calamities
o Earthquake o Flood
7.2.1.1 Hazards during Construction Phase
Mechanical Hazards: Mechanical hazards during the construction phase arise due to the moving parts in the machinery, especially the belts and bolts of the construction equipment, which are heavy and pose a threat to the work personnel. Other hazards include falling (during working at heights), falling objects like handheld tools, etc., failure of slips and traps created for scaffolding, and due to faulting of electrical equipment.
Transportation Hazards: The planning of access/ egress to the construction site also plays a significant role in minimizing the associated hazards such as vehicles collision.
Physical Hazards: The noise and vibrations generated during the construction phase may affect the worker’s health, hinder effective communication and may jeopardise sensitive organs. In addition to noise and vibration, hot works also pose a considerable hazard to the workers.
Storage and handling of hazardous materials: During the construction period, storage of hazardous materials like fuel for the engines, lubricants, paints and other flammable materials are likely to pose a fire and explosion risk. Due care shall be taken in locating these materials away from the work place, free of any influence of temperature or sparks or fire. Proper wiring of the electrical appliances like lights, exhausts, etc., would be made to ensure that there are no live wires causing short circuits to ignite these materials.
7.2.1.2 Hazards during Operation
The proposed Nakkapalli IP will house different type of industries and hazards associated during operation phase are discussed below:
Material Hazards: During operation, various types of raw materials, products and other materials will be handled at industrial units. Industrial plants deal with materials, which are generally hazardous in nature by virtue of their intrinsic chemical properties or their operating temperatures or pressures or a combination of these. Fire, explosion, toxic release or combinations of these, are the hazards associated with industrial plants using hazardous chemicals. Some of these materials can be flammable, explosive, toxic or corrosive etc. Hazardous substances may be classified into three main classes namely, flammable substances, unstable substances and toxic substances.
• Flammable substances require interaction with air for their hazard to be released. Under certain circumstances the vapours arising from flammable substances when mixed with air may be explosive especially in confined spaces. However, if present in sufficient quantity such clouds may also explode in open air.
• Unstable substances are liquids or solids, which may decompose with such violence, so as to give rise to blast waves.
• Toxic substances are dangerous and can cause substantial damage to life when released into the atmosphere at certain concentrations.
The ratings for a large number of chemicals based on flammability, reactivity and toxicity are given in NFPA (National Fire Protection Association) Codes and Material Safety Data Sheets
Obtaining Environmental Clearance and CFE for Nakkapalli Industrial Park C1181301 Final EIA/EMP Report RP005 rev. A
Chapter 7 Additional Studies Page 7-55
MSDS). The proposed industries shall maintain the records of NFPA classification and hazards due to exposure of materials to be handled.
Mechanical and Physical Hazards: Injuries may be caused to working personnel due to the operations like cutting, lifting, and rotating machinery. Lifting and carrying heavy or awkwardly shaped objects, such as bags, can result in manual handling injuries.
Handling, Storage and Transportation Hazards: Proposed Nakkapalli IP will involve handling of various materials in the form of Solid, Liquid and Gases which are required for the operations. The individual industry may have material transport from the nearest road/rail route. The hazards related to material transport may be due to accidents of vehicles, failure in mechanical transmission components etc., The Handling hazards include:
• Insufficient knowledge on hazardous nature of chemical in use leading to inappropriate handling of the chemical.
• Failure to use appropriate control measures and Personal Protective Equipment (PPE). • Use of expired/ worn Personal Protective Equipment (PPE's). • Failure of liquid/solid or gas delivery tools. • Using of container with narrow opening for a process that evolves heat and/or gases. • Mixing of oxidizing agents with flammable / combustible substances, etc.
Storage and Handling of Chemicals: A storage and Handling of Hazardous chemical is inevitable, they carry inherent characteristic risk to the employees due to the properties of chemicals such as toxicity and flammability. Chemicals are to be handled in standard containers like MS, HDPE, GI Drums, PVC Carboys, etc. All the chemicals, if any are to be arranged and stored in accordance with their compatibility, dry, well ventilated, with flameproof electrical equipment’s and lighting. All the chemicals are to be provided with identification labels. Eye wash/Drench shower is to be provided at a strategic location for emergency purpose. Chemical Safety Data Sheets and handling procedure, First Aid measures are to be prepared and displayed for information and safety of the working personnel.
Plant/Industry Hazards: The various types of hazards in the plant/industries are as follows
• Fire Hazard: Flammable chemicals are used in the manufacturing process of the chemicals. So it is susceptible to catch fire either at the places of storage, transportation and processing if source of ignition is available. These chemical fires may cause to catastrophic effects. The sudden development of pressure ruptures the container and causes shock waves which cause the structure damage and outburst of reaction vessel. Fire is considered very dangerous if occurs in uncontrolled manner. It should be clearly understood that when a liquid is used having flash point below the normal ambient temperature, it could, in suitable circumstances, liberate a sufficient quantity of vapour to give rise to flammable mixtures with air
• Explosion Hazard: Release of energy in a rapid and uncontrolled manner gives rise to explosion. Extra care shall be taken by providing rupture disc, pressure release valve and temperature controller.
• Corrosion Hazard: Most corrosive substances will produce chemical burns, while certain chemical produce deep ulceration. Other has detailing effect on skin and may cause dermatitis. This has adverse effects on weakening the strength of material in contact.
• Electric Hazard: Electrical power is the main driving force of the industry. There is a potential hazard in electrical equipment like electric cables, motors, heaters, lights, electrical major equipment/ machinery, operations, welding, motors, and heavy lift devices, cabling, human intervention (short circuit possibility), maintenance work (due to machinery breakdown etc.), plant lighting related electrical hazards etc. there will be a fire hazard due
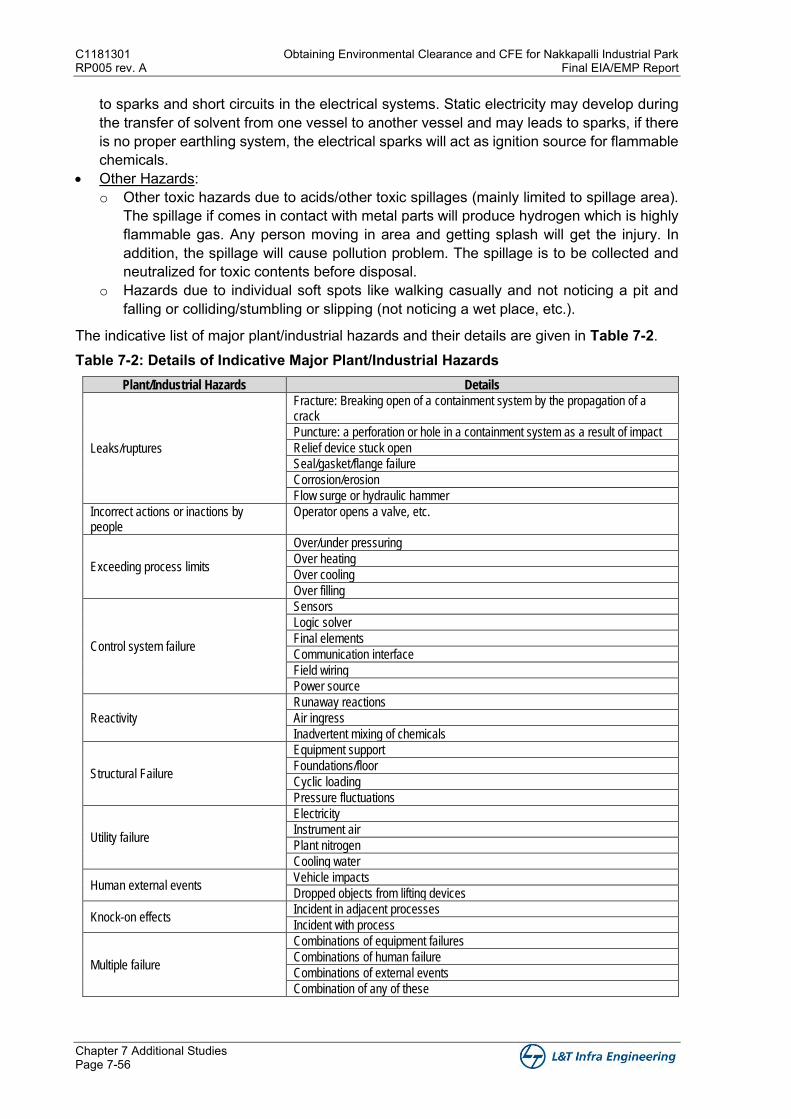
C1181301 Obtaining Environmental Clearance and CFE for Nakkapalli Industrial Park RP005 rev. A Final EIA/EMP Report
Chapter 7 Additional Studies Page 7-56
to sparks and short circuits in the electrical systems. Static electricity may develop during the transfer of solvent from one vessel to another vessel and may leads to sparks, if there is no proper earthling system, the electrical sparks will act as ignition source for flammable chemicals.
• Other Hazards: o Other toxic hazards due to acids/other toxic spillages (mainly limited to spillage area).
The spillage if comes in contact with metal parts will produce hydrogen which is highly flammable gas. Any person moving in area and getting splash will get the injury. In addition, the spillage will cause pollution problem. The spillage is to be collected and neutralized for toxic contents before disposal.
o Hazards due to individual soft spots like walking casually and not noticing a pit and falling or colliding/stumbling or slipping (not noticing a wet place, etc.).
The indicative list of major plant/industrial hazards and their details are given in Table 7-2. Table 7-2: Details of Indicative Major Plant/Industrial Hazards
Plant/Industrial Hazards Details
Leaks/ruptures
Fracture: Breaking open of a containment system by the propagation of a crack
Puncture: a perforation or hole in a containment system as a result of impact
Relief device stuck open
Seal/gasket/flange failure
Corrosion/erosion
Flow surge or hydraulic hammer
Incorrect actions or inactions by people
Operator opens a valve, etc.
Exceeding process limits
Over/under pressuring
Over heating
Over cooling
Over filling
Control system failure
Sensors
Logic solver
Final elements
Communication interface
Field wiring
Power source
Reactivity
Runaway reactions
Air ingress
Inadvertent mixing of chemicals
Structural Failure
Equipment support
Foundations/floor
Cyclic loading
Pressure fluctuations
Utility failure
Electricity
Instrument air
Plant nitrogen
Cooling water
Human external events Vehicle impacts
Dropped objects from lifting devices
Knock-on effects Incident in adjacent processes
Incident with process
Multiple failure
Combinations of equipment failures
Combinations of human failure
Combinations of external events
Combination of any of these
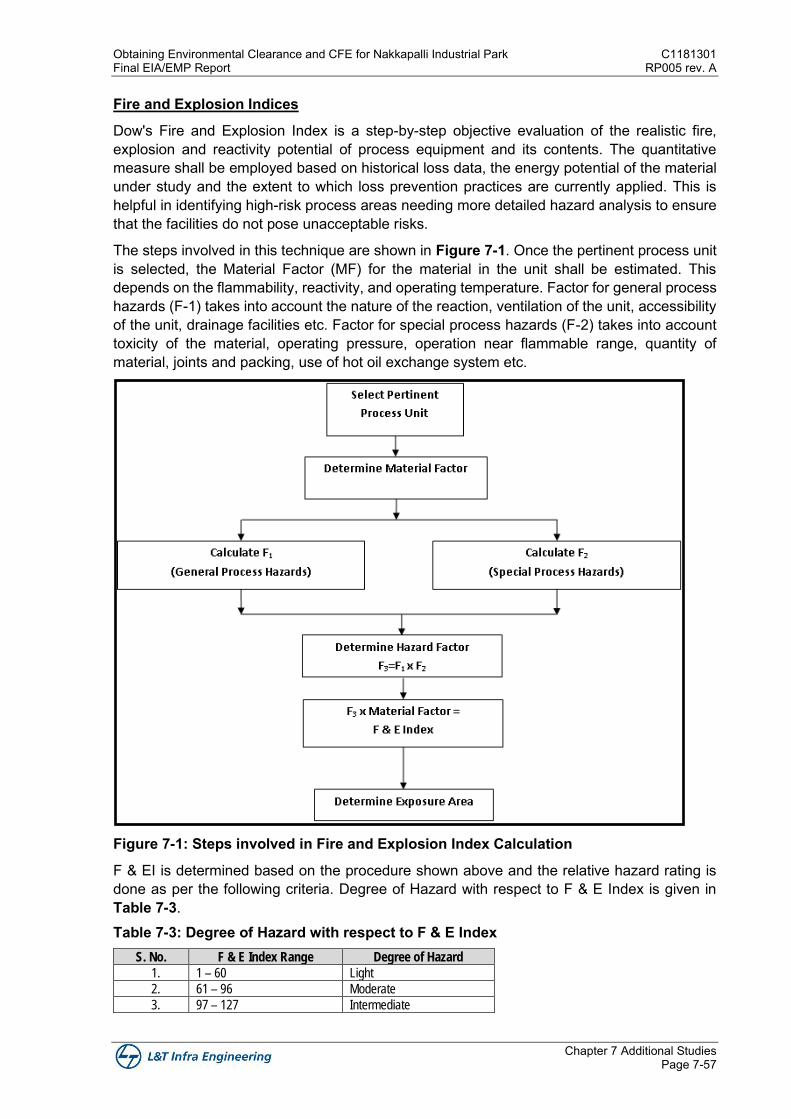
Obtaining Environmental Clearance and CFE for Nakkapalli Industrial Park C1181301 Final EIA/EMP Report RP005 rev. A
Chapter 7 Additional Studies Page 7-57
Fire and Explosion Indices
Dow's Fire and Explosion Index is a step-by-step objective evaluation of the realistic fire, explosion and reactivity potential of process equipment and its contents. The quantitative measure shall be employed based on historical loss data, the energy potential of the material under study and the extent to which loss prevention practices are currently applied. This is helpful in identifying high-risk process areas needing more detailed hazard analysis to ensure that the facilities do not pose unacceptable risks.
The steps involved in this technique are shown in Figure 7-1. Once the pertinent process unit is selected, the Material Factor (MF) for the material in the unit shall be estimated. This depends on the flammability, reactivity, and operating temperature. Factor for general process hazards (F-1) takes into account the nature of the reaction, ventilation of the unit, accessibility of the unit, drainage facilities etc. Factor for special process hazards (F-2) takes into account toxicity of the material, operating pressure, operation near flammable range, quantity of material, joints and packing, use of hot oil exchange system etc.
Figure 7-1: Steps involved in Fire and Explosion Index Calculation
F & EI is determined based on the procedure shown above and the relative hazard rating is done as per the following criteria. Degree of Hazard with respect to F & E Index is given in Table 7-3. Table 7-3: Degree of Hazard with respect to F & E Index
S. No. F & E Index Range Degree of Hazard
1. 1 – 60 Light
2. 61 – 96 Moderate
3. 97 – 127 Intermediate
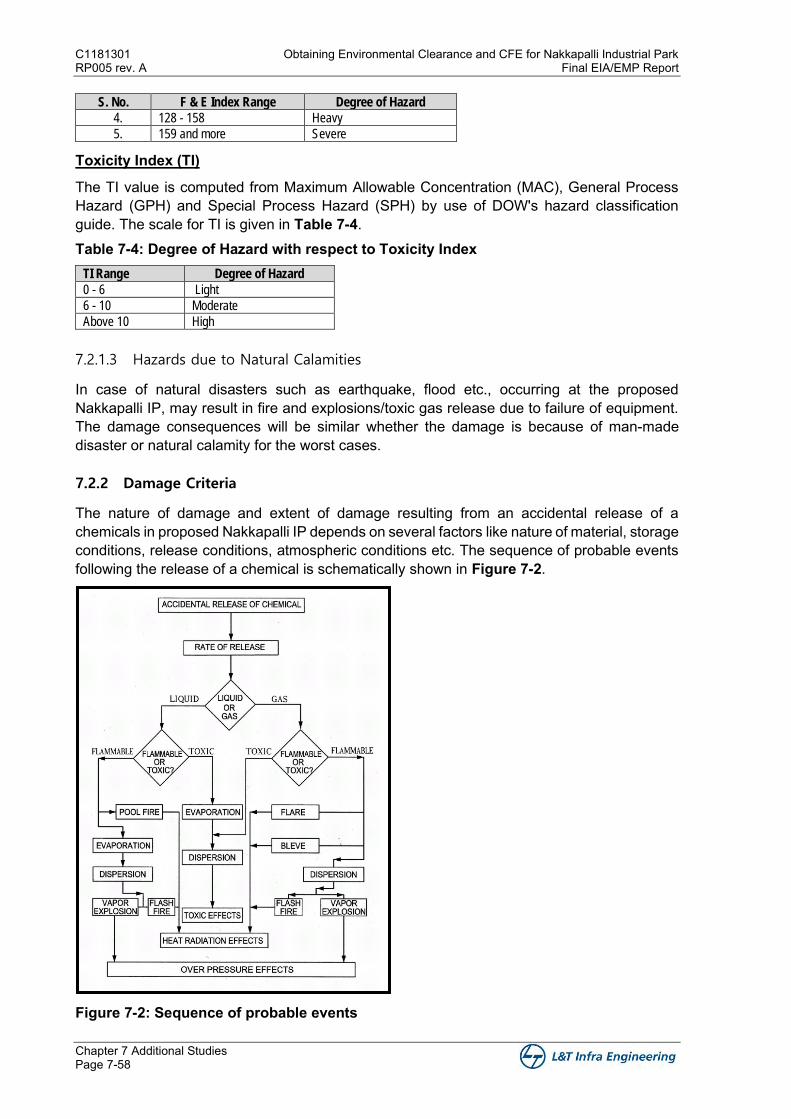
C1181301 Obtaining Environmental Clearance and CFE for Nakkapalli Industrial Park RP005 rev. A Final EIA/EMP Report
Chapter 7 Additional Studies Page 7-58
S. No. F & E Index Range Degree of Hazard
4. 128 - 158 Heavy
5. 159 and more Severe
Toxicity Index (TI)
The TI value is computed from Maximum Allowable Concentration (MAC), General Process Hazard (GPH) and Special Process Hazard (SPH) by use of DOW's hazard classification guide. The scale for TI is given in Table 7-4. Table 7-4: Degree of Hazard with respect to Toxicity Index
TI Range Degree of Hazard
0 - 6 Light
6 - 10 Moderate
Above 10 High
7.2.1.3 Hazards due to Natural Calamities
In case of natural disasters such as earthquake, flood etc., occurring at the proposed Nakkapalli IP, may result in fire and explosions/toxic gas release due to failure of equipment. The damage consequences will be similar whether the damage is because of man-made disaster or natural calamity for the worst cases.
7.2.2 Damage Criteria
The nature of damage and extent of damage resulting from an accidental release of a chemicals in proposed Nakkapalli IP depends on several factors like nature of material, storage conditions, release conditions, atmospheric conditions etc. The sequence of probable events following the release of a chemical is schematically shown in Figure 7-2.
Figure 7-2: Sequence of probable events
Obtaining Environmental Clearance and CFE for Nakkapalli Industrial Park C1181301 Final EIA/EMP Report RP005 rev. A
Chapter 7 Additional Studies Page 7-59
The accidental release of hazardous chemicals during the operation of industries in the proposed Nakkapalli IP leads to subsequent events, which actually cause the damage. The damages are caused by
• Heat radiation • Over pressure effects from explosions and • Toxic effects
These events are applicable in case of any industrial units handling flammable materials and Toxic materials.
7.2.2.1 Thermal Radiation
The damages that may be caused due to heat radiation effect are given in Table 7-5. Table 7-5: Damage due to Incident Radiation
Radiation level within the Fire (kW/m2) Degree of injury
37.5 Severe damage to unprotected plant
12.5 Initiation of secondary fires
4.0 Injury to people
1.75 Pain threshold reached after 60 seconds
0.7 Exposed skin reddens and burns on prolonged exposure
7.2.2.2 Over Pressure
When a flammable vapour cloud ignites, under certain conditions it may result in deflagration thus causing damage due to over pressure effects. The damage depends on the level of over pressure as indicated in Table 7-6. Table 7-6: Effect of Over Pressure
Over pressure Damage
0.3 bar Heavy structure damage
0.1 bar Repairable structure damage
0.03 bar Major glass damage
0.01 bar 10% glass damage
7.2.2.3 Impact of Toxic Effects
A material may be considered as toxic or poisonous, when a small quantity can cause injurious effect on an average normal adult human being. There are several ways of expressing the severity of the toxic nature of the chemicals. These are:
• TLV - Threshold Limit Value. • IDLH -Immediately dangerous to life and health • LDLO - Lethal dose low • LD50 -Median lethal dose
The Immediately Dangerous to Life and Health (IDLH) value which is a limit for personal exposure to a substance defined by the United States National Institute for Occupational Safety and Health (NIOSH), normally expressed in parts per million (ppm) can be considered as the reference concentration.
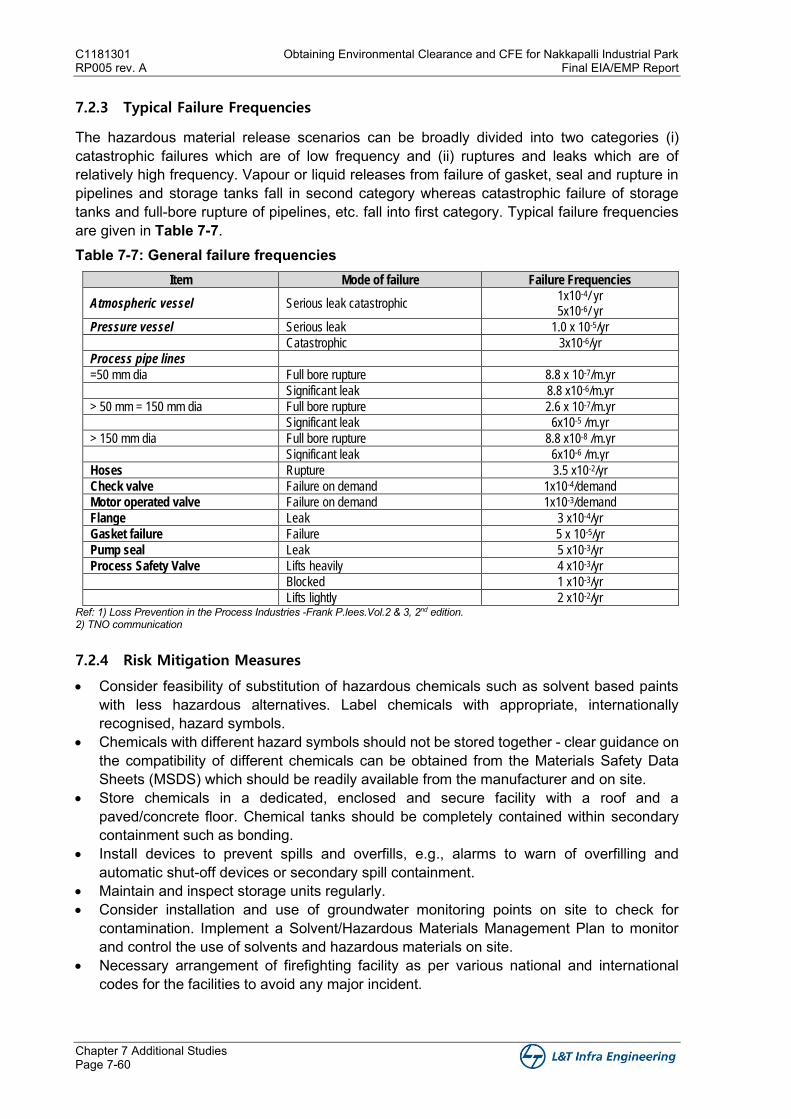
C1181301 Obtaining Environmental Clearance and CFE for Nakkapalli Industrial Park RP005 rev. A Final EIA/EMP Report
Chapter 7 Additional Studies Page 7-60
7.2.3 Typical Failure Frequencies
The hazardous material release scenarios can be broadly divided into two categories (i) catastrophic failures which are of low frequency and (ii) ruptures and leaks which are of relatively high frequency. Vapour or liquid releases from failure of gasket, seal and rupture in pipelines and storage tanks fall in second category whereas catastrophic failure of storage tanks and full-bore rupture of pipelines, etc. fall into first category. Typical failure frequencies are given in Table 7-7. Table 7-7: General failure frequencies
Item Mode of failure Failure Frequencies
Atmospheric vessel Serious leak catastrophic 1x10⁻⁴/ yr 5x10⁻⁶/ yr
Pressure vessel Serious leak 1.0 x 10⁻⁵/yr
Catastrophic 3x10⁻⁶/yr
Process pipe lines
=50 mm dia Full bore rupture 8.8 x 10⁻⁷/m.yr
Significant leak 8.8 x10⁻⁶/m.yr
> 50 mm = 150 mm dia Full bore rupture 2.6 x 10⁻⁷/m.yr
Significant leak 6x10⁻⁵ /m.yr
> 150 mm dia Full bore rupture 8.8 x10⁻⁸ /m.yr
Significant leak 6x10⁻⁶ /m.yr
Hoses Rupture 3.5 x10⁻²/yr
Check valve Failure on demand 1x10⁻⁴/demand
Motor operated valve Failure on demand 1x10⁻³/demand
Flange Leak 3 x10⁻⁴/yr
Gasket failure Failure 5 x 10⁻⁵/yr
Pump seal Leak 5 x10⁻³/yr
Process Safety Valve Lifts heavily 4 x10⁻³/yr
Blocked 1 x10⁻³/yr
Lifts lightly 2 x10⁻²/yr Ref: 1) Loss Prevention in the Process Industries -Frank P.lees.Vol.2 & 3, 2nd edition.
2) TNO communication
7.2.4 Risk Mitigation Measures
• Consider feasibility of substitution of hazardous chemicals such as solvent based paints with less hazardous alternatives. Label chemicals with appropriate, internationally recognised, hazard symbols.
• Chemicals with different hazard symbols should not be stored together - clear guidance on the compatibility of different chemicals can be obtained from the Materials Safety Data Sheets (MSDS) which should be readily available from the manufacturer and on site.
• Store chemicals in a dedicated, enclosed and secure facility with a roof and a paved/concrete floor. Chemical tanks should be completely contained within secondary containment such as bonding.
• Install devices to prevent spills and overfills, e.g., alarms to warn of overfilling and automatic shut-off devices or secondary spill containment.
• Maintain and inspect storage units regularly. • Consider installation and use of groundwater monitoring points on site to check for
contamination. Implement a Solvent/Hazardous Materials Management Plan to monitor and control the use of solvents and hazardous materials on site.
• Necessary arrangement of firefighting facility as per various national and international codes for the facilities to avoid any major incident.
Obtaining Environmental Clearance and CFE for Nakkapalli Industrial Park C1181301 Final EIA/EMP Report RP005 rev. A
Chapter 7 Additional Studies Page 7-61
• To identify the hazards present in the system, a hazard identification study such as a Hazard and Operability study (HAZOP) should be undertaken by the individual industries. All hazards identified should be examined and appropriate mitigating measures developed and implemented.
• For all the hazardous material tanks where there is a single in/outlet line, a Remotely Operated Vehicle (ROV) (or an equivalent design to allow isolation of the tank from the line in an emergency) should be provided.
• First aid equipment and manpower resources are at place to deal with emergencies, in consultation with emergency services to rescue any personnel, trapped or immobilized by an accident scenario.
• Implement and maintain appropriate safety management systems to control the managerial and organizational factors that can impact on the overall risk associated with the hazardous materials.
• Carryout regular checks/maintenance and testing of instruments, valves and flange joints as per strict schedule. Pipelines, flanges and valves require special attention to minimize the failure rate.
• Prevention of potential ignition sources such as: – Proper grounding to avoid static electricity build up and lightening hazards
(including formal procedures for the use and maintenance of grounding connections)
– Use of intrinsically safe electrical installations and non-sparking tools. – Implementing permit systems and formal procedures for conducting any hot work
during maintenance activities, including proper tank cleaning and venting. • Facilities should also be equipped with Fire Detection and suppression equipment such as
Fire tenders, all types of fire extinguishers like DCP, CO2, water CO2 foam types in adequate numbers, Fire Hydrant and monitor system as per TAC guidelines to take care of any fire hazard.
• Fire Detection/alarm system to be provided for Control Rooms, cable Galleries, Transformers area and Administrative building and these may be of ionization, optical and heat sensing type.
• All fire systems should be located in a safe area of the proposed facility • Firefighting equipment shall be provided as per applicable standards and guidelines. • Consider linking foam and fire water system. Considerations should be given to directly
inject AFFF (Aqueous Film Forming Foam) compound into the respective fire mains (at 6 percent strength), which can act as a vehicle to transport foam solution to user points on either site for mobile response foam branches / cannons.
• Facilities should be properly equipped with fire suppression equipment that meets internationally recognized technical specifications for the type and amount of flammable material stored at the facility.
• Preparation of a fire response plan supported by the necessary resources and training, including training in the use of fire suppression equipment and evacuation. Procedures may include coordination activities with local authorities or neighbouring facilities.
• Provision of fire safety training and response as part of workforce health and safety induction/training, including training the use of fire suppression equipment and evacuation, with advanced fire safety training provided to a designated firefighting team.
• It is recommended that all electrical fittings in the system should confirm to flame/explosion proof regulations.
• It is recommended to carryout regular maintenance and testing of instruments, valves and flange joints as per strict schedule. Pipelines, hoses, PSV's require special attention to minimise the failure rate.
C1181301 Obtaining Environmental Clearance and CFE for Nakkapalli Industrial Park RP005 rev. A Final EIA/EMP Report
Chapter 7 Additional Studies Page 7-62
• Pipeline should be protected against external / internal corrosion • Do’s and Don’ts shall be displayed prominently in the site near the pipelines and at all
workplaces. Regular maintenance shall be carried out under the supervision of an authorized person.
• Important telephone numbers of emergency shall be displayed prominently in bold letters in the plant site and administration building.
• Caution boards shall be displayed for all working person. – No smoking signs – No flames or pilot lights or electrical gadgets. – Emergency contact numbers.
• All electrical equipment shall be provided with proper earthling. Earthed electrode should be calibrated, periodically tested and maintained.
• Emergency lighting shall be available at all critical locations including the operator’s room to carry out safe shut down of the plant, ready identification of firefighting facilities such as fire water pumps and fire alarm stations.
• All electrical equipment shall be free from carbon dust, oil deposits, and grease. • Use of approved insulated tools, rubber mats, shockproof gloves and boots, tester, fuse
tongs, discharge rod, safety belt, hand lamp, wooden or insulated ladder and not wearing metal ring and chain is insured.
• Flame and shock detectors for fire safety shall be provided. • Danger from excess current due to overload or short circuit is prevented by providing fuses,
circuit breakers, thermal protection.
7.3 Disaster Management Plan
A disaster is a terrible situation in which suddenly, people are plunged into helplessness and suffering and, as a result, need protection, clothing, shelter, medical & social care and other necessities of life.
The Disaster Management Plan (DMP) is aimed to ensure safety of life, protection of environment, protection of installation, restoration of production and salvage operations in this same order of priorities. For effective implementation of DMP, it should be widely circulated and a personnel training is to be provided through rehearsals/drills. To tackle the consequences of a major emergency at the project location or its immediate vicinity, a DMP has to be formulated.
The objective of the DMP is to make use of the combined resources of the Nakkapalli IP and the outside services to achieve the following:
• Effective rescue and medical treatment of casualties • Safeguard other people • Minimize damage to property and the environment • Initially contain and ultimately bring the incident under control • Identify any dead • Provide for the needs of relatives • Provide authoritative information to the news media • Secure the safe rehabilitation of affected area • Preserve relevant records and equipment for the subsequent inquiry into the cause and
circumstances of the emergency
7.3.1 Causes of Disaster
Natural: Flood, Earthquakes, Lightning, Cyclonic winds
Obtaining Environmental Clearance and CFE for Nakkapalli Industrial Park C1181301 Final EIA/EMP Report RP005 rev. A
Chapter 7 Additional Studies Page 7-63
System failure, design deficiency, bad operating practice, sabotage resulting in Fire Explosion Release of toxic/ inflammable gases
DMP for proposed Nakkapalli IP shall be formulated with an integrated approach to address all individual industrial units also. The DMP shall include onsite and offsite emergency plan for individual industrial units as well as Nakkapalli IP as a whole unit. A broad framework of DMP is presented in this Chapter. The specific industrial team where the emergency has arisen would be in charge of the situation while the other teams would assist them as and when required.
7.3.2 Categorisation of Emergency
Any emergency situation has to be first categorised as an onsite emergency or an offsite emergency, the difference being that the effects of the onsite emergency are confined within the premises while those of an offsite emergency spill over beyond the Nakkapalli IP premises or even beyond the project site premises. Thus, the onsite and offsite emergency plans are detailed below:
7.3.2.1 Onsite Emergency Plan
The plan would have the following components:
• Formulation of Disaster Management Plan and Emergency Services • Organization Structure • Roles and Responsibilities of Emergency Teams • Communication • Emergency Control Centre • Alarm Systems & Assembly Points • Mutual Aid Scheme • Onsite Emergency Plan and Rehearsals • Spillage & Contingency Plan • Formulation of Disaster Management Plan for Cyclones
7.3.2.2 Offsite Emergency Plan
The components of an offsite emergency plan outlined in would include:
• Identification of location of hazardous or dangerous substances, personnel and emergency control rooms.
• Technical information such as chemical and physical properties, dangers, etc. Background information, past accidents, control techniques and effects of hazardous materials of relevance
• Identification of facilities and transport routes for toxic materials • Contact for further advice such as meteorological information, transport, temporary food
and accommodation, first aid and hospital services, water, etc. • Establishing communication links including firefighting materials, damage control and
repair items • Detailing emergency response procedures • Notification to public at large • Evacuation arrangements • Press / media handling • Addressing longer term environmental clean-up
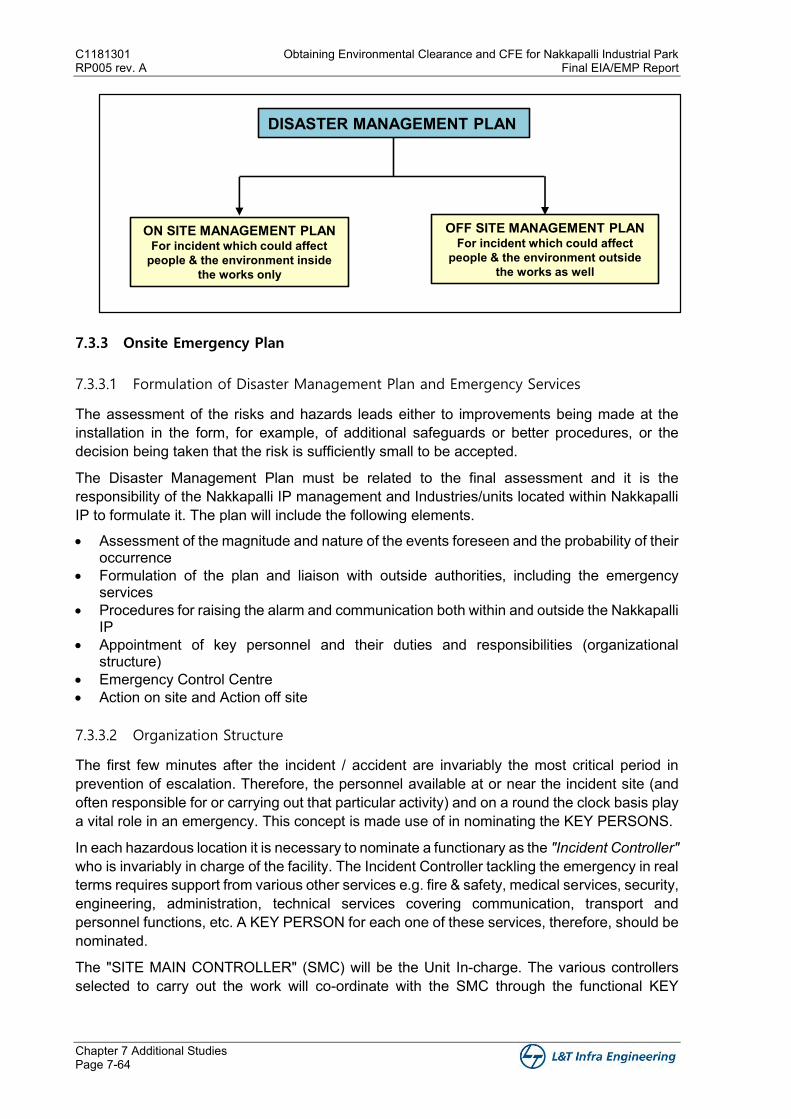
C1181301 Obtaining Environmental Clearance and CFE for Nakkapalli Industrial Park RP005 rev. A Final EIA/EMP Report
Chapter 7 Additional Studies Page 7-64
7.3.3 Onsite Emergency Plan
7.3.3.1 Formulation of Disaster Management Plan and Emergency Services
The assessment of the risks and hazards leads either to improvements being made at the installation in the form, for example, of additional safeguards or better procedures, or the decision being taken that the risk is sufficiently small to be accepted.
The Disaster Management Plan must be related to the final assessment and it is the responsibility of the Nakkapalli IP management and Industries/units located within Nakkapalli IP to formulate it. The plan will include the following elements.
• Assessment of the magnitude and nature of the events foreseen and the probability of their occurrence
• Formulation of the plan and liaison with outside authorities, including the emergency services
• Procedures for raising the alarm and communication both within and outside the Nakkapalli IP
• Appointment of key personnel and their duties and responsibilities (organizational structure)
• Emergency Control Centre • Action on site and Action off site
7.3.3.2 Organization Structure
The first few minutes after the incident / accident are invariably the most critical period in prevention of escalation. Therefore, the personnel available at or near the incident site (and often responsible for or carrying out that particular activity) and on a round the clock basis play a vital role in an emergency. This concept is made use of in nominating the KEY PERSONS.
In each hazardous location it is necessary to nominate a functionary as the "Incident Controller" who is invariably in charge of the facility. The Incident Controller tackling the emergency in real terms requires support from various other services e.g. fire & safety, medical services, security, engineering, administration, technical services covering communication, transport and personnel functions, etc. A KEY PERSON for each one of these services, therefore, should be nominated.
The "SITE MAIN CONTROLLER" (SMC) will be the Unit In-charge. The various controllers selected to carry out the work will co-ordinate with the SMC through the functional KEY
DISASTER MANAGEMENT PLAN
ON SITE MANAGEMENT PLANFor incident which could affect
people & the environment inside the works only
OFF SITE MANAGEMENT PLANFor incident which could affect
people & the environment outside the works as well
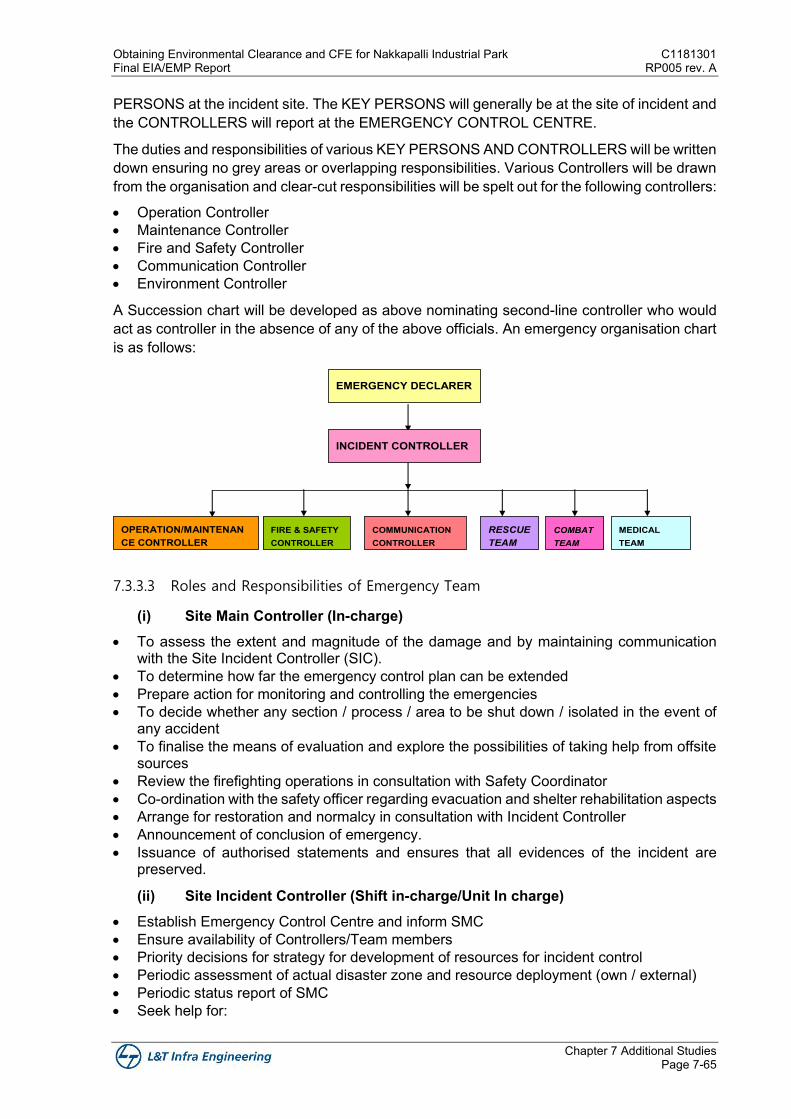
Obtaining Environmental Clearance and CFE for Nakkapalli Industrial Park C1181301 Final EIA/EMP Report RP005 rev. A
Chapter 7 Additional Studies Page 7-65
PERSONS at the incident site. The KEY PERSONS will generally be at the site of incident and the CONTROLLERS will report at the EMERGENCY CONTROL CENTRE.
The duties and responsibilities of various KEY PERSONS AND CONTROLLERS will be written down ensuring no grey areas or overlapping responsibilities. Various Controllers will be drawn from the organisation and clear-cut responsibilities will be spelt out for the following controllers:
• Operation Controller • Maintenance Controller • Fire and Safety Controller • Communication Controller • Environment Controller
A Succession chart will be developed as above nominating second-line controller who would act as controller in the absence of any of the above officials. An emergency organisation chart is as follows:
7.3.3.3 Roles and Responsibilities of Emergency Team
(i) Site Main Controller (In-charge) • To assess the extent and magnitude of the damage and by maintaining communication
with the Site Incident Controller (SIC). • To determine how far the emergency control plan can be extended • Prepare action for monitoring and controlling the emergencies • To decide whether any section / process / area to be shut down / isolated in the event of
any accident • To finalise the means of evaluation and explore the possibilities of taking help from offsite
sources • Review the firefighting operations in consultation with Safety Coordinator • Co-ordination with the safety officer regarding evacuation and shelter rehabilitation aspects • Arrange for restoration and normalcy in consultation with Incident Controller • Announcement of conclusion of emergency. • Issuance of authorised statements and ensures that all evidences of the incident are
preserved.
(ii) Site Incident Controller (Shift in-charge/Unit In charge) • Establish Emergency Control Centre and inform SMC • Ensure availability of Controllers/Team members • Priority decisions for strategy for development of resources for incident control • Periodic assessment of actual disaster zone and resource deployment (own / external) • Periodic status report of SMC • Seek help for:
EMERGENCY DECLARER
INCIDENT CONTROLLER
OPERATION/MAINTENANCE CONTROLLER
RESCUE TEAM
FIRE & SAFETY CONTROLLER
COMMUNICATION CONTROLLER
MEDICAL TEAM
COMBATTEAM
C1181301 Obtaining Environmental Clearance and CFE for Nakkapalli Industrial Park RP005 rev. A Final EIA/EMP Report
Chapter 7 Additional Studies Page 7-66
o Fire Fighting o Medical Aid o Rescue o Transport o Traffic Arrangement o Law and Order
• Inform the following authorities about the incident through zonal/sector authorities: o District Collector o Superintendent of Police o District Environmental Engineer o District Health Officer o Inspector of Factories o Neighbouring Installations
• Establish contacts with the following, through controllers: o Superintendents of nearby hospitals o Chief Fire Officer of nearby fire services o Insurance Company o Establish First Aid Centre through Safety Coordinator Establish Information Centres
7.3.3.4 Emergency Co-ordinators
Logistics Coordinator: The duties and responsibilities in the event of any emergency include:
• Report at the affected area to the SMC & SIC • Arrange to attend all maintenance jobs as instructed by SIC • Ensure that all essential services like power, water etc. are maintained without interruption • Ensure adequate manpower availability at the affected area • Reporting all the incidents to SIC • Arrange for all the tools, materials at the site of emergency
Communication Coordinator: Responsibilities include:
• Report to SMC & SIC • Removal of non-essential personnel from the emergency area in consultation with SIC • Contact with SIC and arrange for necessary facilities • Control over entry and maintain law & order and arrange for police help in consultation with
SMC • Liaison with external agencies in consultation with SMC • Co-ordination of transportation requirements for moving personnel for first aid, evacuation,
rehabilitation etc. • Maintenance of inventory systems in the Emergency Control Centre
Safety Coordinator: Responsibilities include:
• Immediate Reporting to SIC • Co-ordination with Security officer and security personnel • Ensure availability of all safety equipment at site • Co-ordination of all rescue operations • Co-ordination of availability of first aid to all injured personnel • Advice to SIC on firefighting operations • Ensure availability of necessary antidotes/medicines in case of toxic release
Obtaining Environmental Clearance and CFE for Nakkapalli Industrial Park C1181301 Final EIA/EMP Report RP005 rev. A
Chapter 7 Additional Studies Page 7-67
7.3.3.5 Communication
An essential component of any emergency preparedness programme is the communication links for gathering information needed for overall co-ordination e.g., emergency control centre with in-house as well as outside emergency services. Too much reliance on the telephone system, fixed lines/mobile phones is risky as it can soon be overloaded in an emergency situation. A computer with internet and printer facility and photocopying machine with scanner, wireless networks, fax and intercom units are recommended for higher reliability. Help line numbers will be setup for emergency related queries.
The description of the tasks and responsibilities, reporting place, etc. for each key functionary will be, as far as possible, so drafted as to reduce the communication needs between the interacting groups and permit good mutual understanding and well-co-ordinated independent actions to tackle emergency situations.
7.3.3.6 Emergency Control Centre
The emergency control centre shall be established for Nakkapalli IP and shall be equipped with the following:
• An adequate number of external telephones. If possible, one should for outgoing calls only, in order to bypass jammed switchboards during an emergency.
• An adequate number of internal telephones, Radio equipment/pager system. • A layout plan of the facility showing.
o Location of possible spillage/fire points. o Sources of safety equipment and other fire-fighting system elements. o Escape Routes.
• A nominal role of employees at the facility. • A list of KEY PERSONNEL with addresses, telephone numbers, etc. • An adequate number of personnel protective/safety equipment available on site / back up
in warehouse or with other member groups of mutual aid programme. • Locations of various firefighting arrangements at the facility.
7.3.3.7 Alarm Systems
The emergency (due to fires or spillages) should be initiated by the first person noticing it by activating the fire alarm from the nearest call-point or by contacting the fire control room immediately on the internal telephone in case of any emergency.
If in the opinion of the shift in-charge/In charge in consultation with the fire safety officer, the severity of the emergency is such that it can primarily be coped with by available own resources (aided by firefighting appliances from the fire brigade, if required) the siren code for ONSITE CRISIS will be sounded through the hooter. The siren codes for distinguishing between an ONSITE & OFFSITE CRISIS will be clearly established. The onsite/ offsite siren codes should be informed to the neighbouring population of the facility.
7.3.3.8 Mutual Aid Scheme
Assistance in terms of equipment and manpower will be taken from the neighbouring installations under a Mutual Aid Scheme / Zonal Disaster Management Plan.
C1181301 Obtaining Environmental Clearance and CFE for Nakkapalli Industrial Park RP005 rev. A Final EIA/EMP Report
Chapter 7 Additional Studies Page 7-68
7.3.3.9 Onsite Emergency Plan and Rehearsals/Mock Drills/ Training
Once the emergency programme is finalised, it should be made known to all personnel so that each one knows his or her role in the event of an emergency. The plan will be regularly tested through the rehearsals, at a regular frequency and updated accordingly.
Mock drills on the overall emergency response plan may be carried out once in 6 months to ensure continued familiarity of the Key Personnel with the emergency procedure and to check if the hardware infrastructure provided for emergency management is in good Emergency Operations centre once in every three months, to familiarize him/herself with the facilities available.
The key personnel will be required to undergo a special in – plant training programme to understand clearly their role in On-site emergency management and to develop the skills required for the purpose.
Most of the employees are to be given “Basic Fire Fighting” training, for operating portable extinguishers in an emergency. The rest of the employees including supervisory and management personnel will be required to undergo this course. Also, the emergency response team members will be required to undergo annual training including refresher courses on the following areas:
• Use of specialized protection equipment including practical drills • Emergency communication • Firefighting using equipment like fire hydrant, portable pumps, monitors etc. • Any other specialized training commensurate with the defined role • Information on the extent of spill of materials • Measures to contain spill to a limited area • Measures to remove spilled materials • Measures to dispose the spilled materials. • Mock drills will be carried out to test the effectiveness of the contingency plan
7.3.3.10 Evacuation plan for Emergency and Assembly Points
In order to manage emergencies more effectively, decision makers may benefit from having in-place evacuation plans for scenarios which are most likely to happen, even though real-time design or re-evaluation of evacuation plans may be required after the disaster strikes.
Based on the disaster scenarios, pre-warning for sudden/onset of disasters can leave enough time for evacuations prior to the event. In the case of natural disasters is the probability of their occurrence and effects is one of the influential factor. Seasonal disasters, even if sudden, pose lesser problems than non-seasonal disasters so though evacuation plans can be in place for either situation.
Building Evacuation
As soon as the pre-warning is given the first step is to evacuate the buildings. The Evacuation action plan which includes following steps to follow during a disaster,
• On the sound of an alarm, begin immediate evacuation • In case of fire, activate the nearest pull station and call Emergency • Evacuate via the nearest stairwell or grade level exit. • Go to your pre-determined Evacuation Assembly Point/Shelter Area. • If trapped by smoke, stay low, cover your mouth with wet cloth, stay near a window,
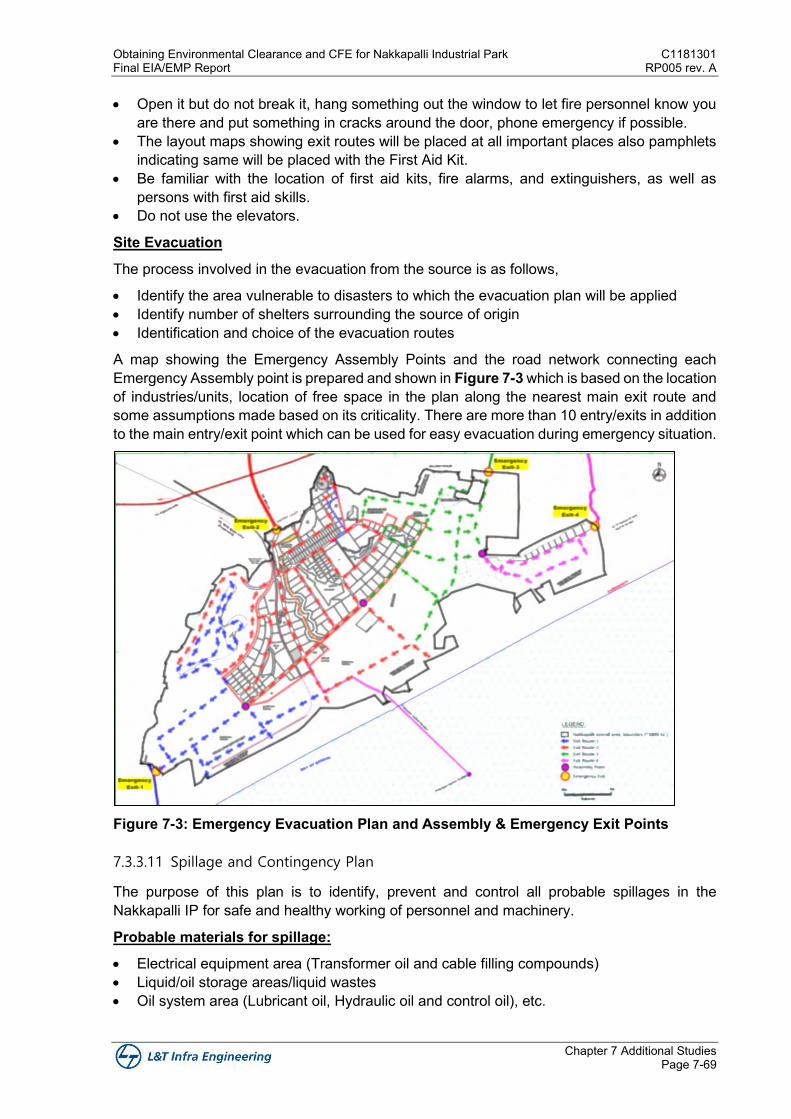
Obtaining Environmental Clearance and CFE for Nakkapalli Industrial Park C1181301 Final EIA/EMP Report RP005 rev. A
Chapter 7 Additional Studies Page 7-69
• Open it but do not break it, hang something out the window to let fire personnel know you are there and put something in cracks around the door, phone emergency if possible.
• The layout maps showing exit routes will be placed at all important places also pamphlets indicating same will be placed with the First Aid Kit.
• Be familiar with the location of first aid kits, fire alarms, and extinguishers, as well as persons with first aid skills.
• Do not use the elevators.
Site Evacuation
The process involved in the evacuation from the source is as follows,
• Identify the area vulnerable to disasters to which the evacuation plan will be applied • Identify number of shelters surrounding the source of origin • Identification and choice of the evacuation routes
A map showing the Emergency Assembly Points and the road network connecting each Emergency Assembly point is prepared and shown in Figure 7-3 which is based on the location of industries/units, location of free space in the plan along the nearest main exit route and some assumptions made based on its criticality. There are more than 10 entry/exits in addition to the main entry/exit point which can be used for easy evacuation during emergency situation.
Figure 7-3: Emergency Evacuation Plan and Assembly & Emergency Exit Points
7.3.3.11 Spillage and Contingency Plan
The purpose of this plan is to identify, prevent and control all probable spillages in the Nakkapalli IP for safe and healthy working of personnel and machinery.
Probable materials for spillage:
• Electrical equipment area (Transformer oil and cable filling compounds) • Liquid/oil storage areas/liquid wastes • Oil system area (Lubricant oil, Hydraulic oil and control oil), etc.
C1181301 Obtaining Environmental Clearance and CFE for Nakkapalli Industrial Park RP005 rev. A Final EIA/EMP Report
Chapter 7 Additional Studies Page 7-70
• Water and Wastewater treatment chemicals • Other chemical to be used in Electronic Manufacturing industry
Spillages in the plants can lead to:
• Causing loss of property • Interfaces with safe moving of personnel • Damage to equipment when left unattended • Health hazard i.e., toxic when released in air or mixes with town drain • Fire hazard
Prevention of Spillage:
Routine checks of the system have to be made to ensure that no leak or spill starts. Any minor leakage has to be reported to the concerned person (Shift In-charge, Operation & Maintenance team member). Leakage has to be arrested in the shortest possible time. Necessary arrangements have to be made to collect the leakage and to store in proper place.
In case of spillage the following measures would be adopted:
• Oil spill on the land should be properly cleaned using absorbents, cotton waste, sand, saw dust, etc.
• The collected oil is disposed to APPCB/CPCB authorized agency
7.3.4 Management Plan for Natural Hazards
Nakkapalli IP shall develop a customised Disaster Management Plan (DMP) to cope during disasters from natural calamities such as cyclones, Floods and earthquakes, etc. Proper planning can reduce the potential damage from disasters in terms of losses to human lives, assets, and environmental damage and rehabilitation costs. The proposed Nakkapalli IP is located in Visakhapatnam district, Andhra Pradesh. As per the Seismic zoning Map, project location falls in zone-II (Low Risk Zone), and also the project area does not fall under area prone to flooding.
Total annual mean rainfall recorded is 1118.7 mm, which ranges from nil rainfall in January to highest in October. October is the wettest month of the year.
7.3.4.1 Disaster Management Plan for Floods/ Cyclones
Though the study area experiences no flood and moderate cyclone damage zone with the wind velocity of 39-44 m/s, the following management plan is proposed in case of any Floods/Cyclones occurs.
Community awareness should be built up so that people respond effectively to the flooding. Persons living in the low lying parts of floodplains, areas below unsafe. Some aspects of flood planning and response are:-
• Issuing warnings at the local levels • Participating in flood fighting by organizing work parties to repair • Embankments or clear debris from drainage areas, pile sandbags • Stockpile needed materials • Facilitating agricultural recovery • Planning emergency supplies of flood and clean drinking water • To conduct trainings on search and rescue for Search and Rescue • Terms formed at District, Taluka and Village level from time to time
Obtaining Environmental Clearance and CFE for Nakkapalli Industrial Park C1181301 Final EIA/EMP Report RP005 rev. A
Chapter 7 Additional Studies Page 7-71
The rough weather operations will be controlled in three stages:
• Green Status – The operations will be carried out as planned. • Yellow Status – This is an alert stage indicating possibility of rough weather. Still operations
can be continued with all emergency precautions • Red Status – Emergency situations or rough weather; operation will be suspended.
The main components of the DMP for cyclones will include the following:
• Pre-Disaster (or Pre-Cyclone/Flood) Plan • On (or During Cyclone/Flood) Disaster Plan • Post (or After Cyclone/Flood) Disaster Plan
Pre-Cyclone/Flood Plan
Pre-Cyclone/Flood Measures: The proposed Nakkapalli IP will maintain and exchange information continuously with the local IMD authorities for continuous updates of meteorological conditions in general and emerging / predicted weather phenomenon such as cyclones and rainfall in particular. Upon issue of a cyclone/flood warning by the IMD, the management would immediately initiate the Pre-Cyclone/flood Measures.
Pre-Cyclone/Flood Exercise: On signalling of a cyclone alert, the Control Room will be manned 24 hours a day for disaster management. The ‘Weather Signals’ depending on the data available about the cyclone and it’s threat perception will be informed to all personnel. The different personnel of Nakkapalli IP would assume their roles and responsibilities as previously identified for disaster management. The standby arrangement for power supply will be checked. Pre-identified ‘Rescue Centres’ will be kept ready. A pre-alert will be issued regarding suspension of all operations in case of emergency and to await instructions regarding the same. Communication system including standby arrangement will be tested for working condition. Vehicles involved in rescue operations will be checked for working condition.
The following Flood warning messages will also be given:
• Flood Alert – Flooding is possible • Flood Warning – Flooding of homes, businesses and main roads is expected • Severe Flood Warning – Severe flooding may cause Imminent danger • All Clear – No Flood Alerts or Warnings are in force • When a flood warning message is received, an Emergency team In-charge shall alert
relevant agencies. The following advice shall be given to the Public: • Flood warning: 'GO IN, STAY IN, TUNE IN' • Stay calm • Ensure that neighbours know of the warning, and be prepared to help them • Monitor local radio • Make a flood kit: medications, warm clothing, sealed food, blankets, matches, candles,
flashlights, portable radio, spare batteries, rubber gloves, personal documents.
During Cyclone/Flood Plan: The emergency alarm siren will be raised as per the ‘Alarm System’. All personnel will be evacuated except essential operational personnel and personnel dealing with disaster management. Power supply will be disconnected, and alternative power supply will be restored in essential operational areas. Depending upon the scale of potential flooding, the following steps shall be taken:
• Care of evacuated, hurt or homeless people • Protecting of utilities • Availability of transport
C1181301 Obtaining Environmental Clearance and CFE for Nakkapalli Industrial Park RP005 rev. A Final EIA/EMP Report
Chapter 7 Additional Studies Page 7-72
• Flood alleviation e.g. clearing blocked culverts and drains • Providing emergency health advice • Providing road barriers and signs • Coordinating emergency support
Post Cyclone/Flood Plan: This would be the rescue and rehabilitation stage after passing of the cyclone/floods. The damages would be assessed, and rehabilitation work initiated to restore operations at the earliest. The records of the events during the cyclone will be maintained and reviewed for possible enhancements to the DMP.
The important Do’s and Don’ts after Flood
• There is a possibility of spread of water borne diseases after flood, and hence medical treatment should be taken immediately.
• Do not go near the riverbank even after the floodwater has receded. • Sprinkle medicines in the stagnant dirty water. • Check properly all the electric circuits or electric like motor pump etc. Check whether any
inflammable or explosive item has not entered along with the floodwater. • Switch off the main electric supply, if any damage is noticed to the electric equipment. • Sewerage system should be checked and any damage should be repaired immediately so
as to curtail spread of diseases. • Check gas leakage which can be known by smell of gas • Rescue work should be undertaken immediately after flood situation as per the instruction.
Do not follow any shortcut for rescue work.
7.3.4.2 Earthquakes
Proposed site and entire Visakhapatnam district falls under Zone-II (Low Risk Zone), the site is not highly sensitive to earthquakes. Apart from all design & structural measures following are important for management of earthquakes:
Before Earthquake:
• All employees shall be familiar with the location of first aid kits, fire alarms, and extinguishers, as well as personnel with first aid skills.
• Site evacuation plan and emergency assembly points shall be available at all locations.
During Earthquake:
• Do not panic
Inside a Building:
• Take cover immediately under a desk, table, or chair, in a corner away from windows, along a wall in a hallway, or in a structurally strong location such as a hall by a pillar.
• Watch for falling objects such as light fixtures, bookcases, cabinets, shelves, and other furniture that might slide or topple. Stay away from windows. Do not run outside.
• Do not dash for exits since they may be damaged and the building's exterior brick, tile, and decorations may be falling off.
• Do not use the elevators. • If fire breaks out, drop on the floor and crawl towards the exit
Outside a Building:
• Remain outside, preferably in a vehicle. • Stay clear of electrical wires, poles, trees, or anything that might fall.
Obtaining Environmental Clearance and CFE for Nakkapalli Industrial Park C1181301 Final EIA/EMP Report RP005 rev. A
Chapter 7 Additional Studies Page 7-73
After a MAJOR Earthquake:
• Listen to radio -TV and other media for Government Announcement • Examine walls, floors, doors, staircases and windows to make sure that the building is not
in danger of collapsing • Do not enter into the unsafe or risky houses or buildings
The site emergency controller shall:
• Check for injuries to personnel in your area. Do not attempt to move seriously injured persons unless they are in immediate danger. Render first aid assistance if required.
• Check for fires or fire hazards, spills of flammable or combustible liquids, or leaks of flammable gases. These activities must not significantly delay departure from the building or put the Evacuation Warden in danger.
• For small isolated spills, use spill clean-up procedures as outlined in Standard Operating Procedures (SOPs). If SOP or chemical spill (if any) clean up kit is not available, then evacuate personnel and notify authorities. For larger spills, evacuate building and notify authorities.
• Turn off ignition and heat sources if properly trained and it is safe to do so. • Shut off all gas sources if trained to do so. • Exit the building, if possible, and go to the EAP to report on injuries, damages, and
potentially hazardous conditions. Take emergency/first aid kit and personal belongings. • Switch off all electric lines
7.3.4.3 Thunderstorm and Lightning strikes
Thunderstorm is invariably accompanied by lightning. A single stoke of lightning has 125,000,000 volts of electricity. That’s enough power to light a 100 watt light bulb for more than three months or enough to seriously hurt or kill someone. Knowing what steps to take in the event of an oncoming thunderstorm or lightning can save lives. Better management practices such as turnoff electric transmission, supply etc. shall be followed.
7.3.5 Fire Protection Facilities
7.3.5.1 Fire Protection Facilities
In order to provide the best facilities to fight the hazards related to fire, the following fire protection services with automated response system are conceived:
Dedicated firefighting water network Fire stations strategically located within Nakkapalli IP
In addition to this, the statutory requirements (as per Development Control Rules) for firefighting provisions within individual industrial plots to be enforced as a part of the development guidelines. As per this, each industrial unit should have storage tank + fire pumps + hydrants. Fire mitigation system consists of Fire station, firefighting facilities, fire water storage and Distribution system is proposed in Nakkapalli IP.
7.3.5.2 Fire Detection and Alarm System
Fire detection and alarm system can be provided for the entire area which will be microprocessor based Intelligent Analog Addressable type. The system will consist of central
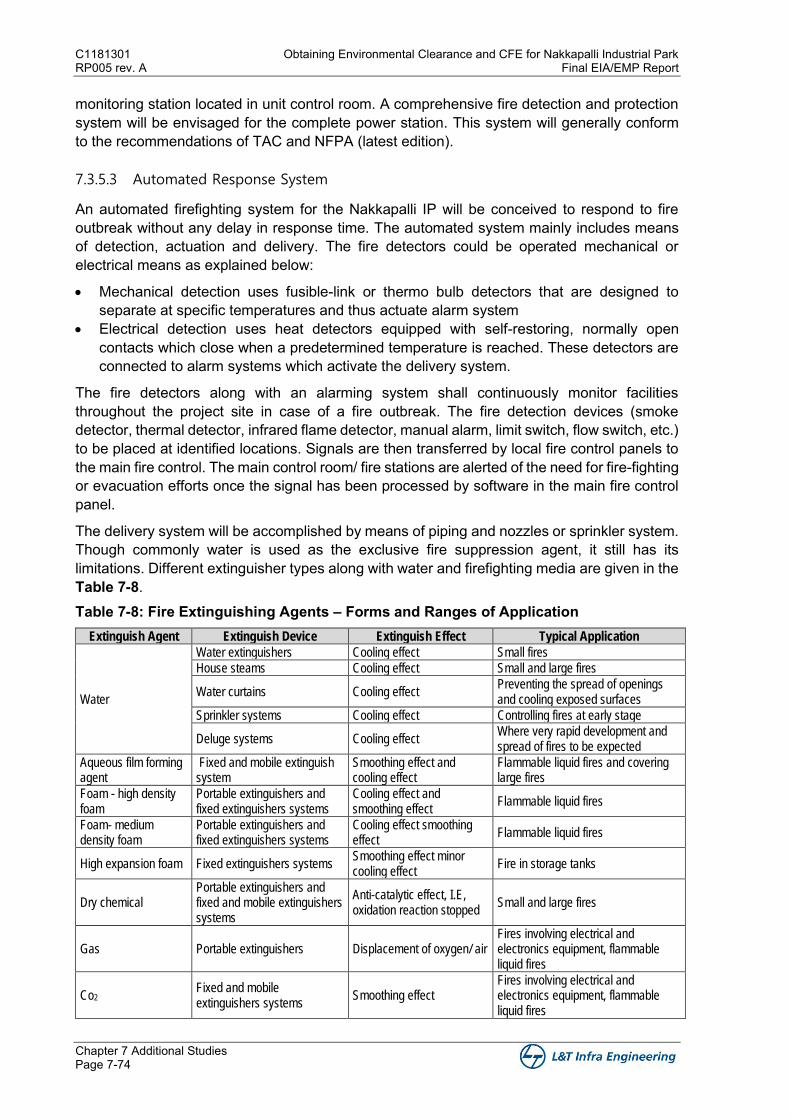
C1181301 Obtaining Environmental Clearance and CFE for Nakkapalli Industrial Park RP005 rev. A Final EIA/EMP Report
Chapter 7 Additional Studies Page 7-74
monitoring station located in unit control room. A comprehensive fire detection and protection system will be envisaged for the complete power station. This system will generally conform to the recommendations of TAC and NFPA (latest edition).
7.3.5.3 Automated Response System
An automated firefighting system for the Nakkapalli IP will be conceived to respond to fire outbreak without any delay in response time. The automated system mainly includes means of detection, actuation and delivery. The fire detectors could be operated mechanical or electrical means as explained below:
• Mechanical detection uses fusible-link or thermo bulb detectors that are designed to separate at specific temperatures and thus actuate alarm system
• Electrical detection uses heat detectors equipped with self-restoring, normally open contacts which close when a predetermined temperature is reached. These detectors are connected to alarm systems which activate the delivery system.
The fire detectors along with an alarming system shall continuously monitor facilities throughout the project site in case of a fire outbreak. The fire detection devices (smoke detector, thermal detector, infrared flame detector, manual alarm, limit switch, flow switch, etc.) to be placed at identified locations. Signals are then transferred by local fire control panels to the main fire control. The main control room/ fire stations are alerted of the need for fire-fighting or evacuation efforts once the signal has been processed by software in the main fire control panel.
The delivery system will be accomplished by means of piping and nozzles or sprinkler system. Though commonly water is used as the exclusive fire suppression agent, it still has its limitations. Different extinguisher types along with water and firefighting media are given in the Table 7-8. Table 7-8: Fire Extinguishing Agents – Forms and Ranges of Application
Extinguish Agent Extinguish Device Extinguish Effect Typical Application
Water
Water extinguishers Cooling effect Small fires
House steams Cooling effect Small and large fires
Water curtains Cooling effect Preventing the spread of openings and cooling exposed surfaces
Sprinkler systems Cooling effect Controlling fires at early stage
Deluge systems Cooling effect Where very rapid development and spread of fires to be expected
Aqueous film forming agent
Fixed and mobile extinguish system
Smoothing effect and cooling effect
Flammable liquid fires and covering large fires
Foam - high density foam
Portable extinguishers and fixed extinguishers systems
Cooling effect and smoothing effect
Flammable liquid fires
Foam- medium density foam
Portable extinguishers and fixed extinguishers systems
Cooling effect smoothing effect
Flammable liquid fires
High expansion foam Fixed extinguishers systems Smoothing effect minor cooling effect
Fire in storage tanks
Dry chemical Portable extinguishers and fixed and mobile extinguishers systems
Anti-catalytic effect, I.E, oxidation reaction stopped
Small and large fires
Gas Portable extinguishers Displacement of oxygen/ air Fires involving electrical and electronics equipment, flammable liquid fires
Co2 Fixed and mobile extinguishers systems
Smoothing effect Fires involving electrical and electronics equipment, flammable liquid fires
Obtaining Environmental Clearance and CFE for Nakkapalli Industrial Park C1181301 Final EIA/EMP Report RP005 rev. A
Chapter 7 Additional Studies Page 7-75
Extinguish Agent Extinguish Device Extinguish Effect Typical Application
Halons Portable fixed and mobile extinguishers systems
Anti-catalytic effect Fires involving electrical and electronics equipment, flammable liquid fires
Vaporizing liquids Portable extinguishers and fixed and mobile extinguishers systems
Cooling and smoothing Small to large fires
Wet chemical agents Portable extinguishers, fixed & mobile extinguishers systems
Cooling and smoothing Small to large fires
7.3.6 Offsite Emergency Plan
Under the Environmental Protection Act, the responsibility of preparation of Off-Site Emergency plan lies with the State Government. The Collector/Deputy Collector is ordinary nominated by State Government to plan Off-Site Emergency Plan. The District Collector or his nominated representative would be the team leader of planning team, who shall conduct the planning task in a systematic manner.
The members of planning team for off-site emergencies are Collector/Deputy Collector, District Authorities in charge of Fire Services and police and members drawn from Medical Services, Factory Inspectorate, Pollution Control Board, Industries and Transport. In addition to these members, there are Co-opted Members also from district authorities concerned, civil defence, publicity department, Municipal Corporation, and non-official such as elected representative (MPs, MLAs, voluntary organization, non- governmental organizations, etc.).
Offsite emergency plan for proposed Nakkapalli IP shall be prepared based on consultation with district authorities, district Disaster Management Plan. Off-site emergency plan would follow the on-site emergency plan. When the consequences of an emergency situation go beyond the proposed Nakkapalli IP boundaries, it becomes an off-site emergency. Off-site emergency is essentially the responsibility of the public administration. However, the Nakkapalli IP management will provide the public administration with the technical information relating to the nature, quantum and probable consequences on the neighbouring population.
The components of an offsite emergency plan would include:
• Identification of locations of hazardous or dangerous substances, personnel and emergency control rooms.
• Technical information such as chemical and physical properties, dangers etc. Background information, past accidents, control techniques and effects of hazardous materials of relevance.
• Identification of facilities and transport routes for toxic materials if any. • Contact for further advice such as meteorological information, transport, temporary food
and accommodation, first aid and hospital services, water, etc. • Establishing communication links including firefighting materials, damage control and
repair items. • Detailing emergency response procedures. • Notification to public at large. • Evacuation arrangements. • Press/media handling. • Addressing longer term environmental clean up
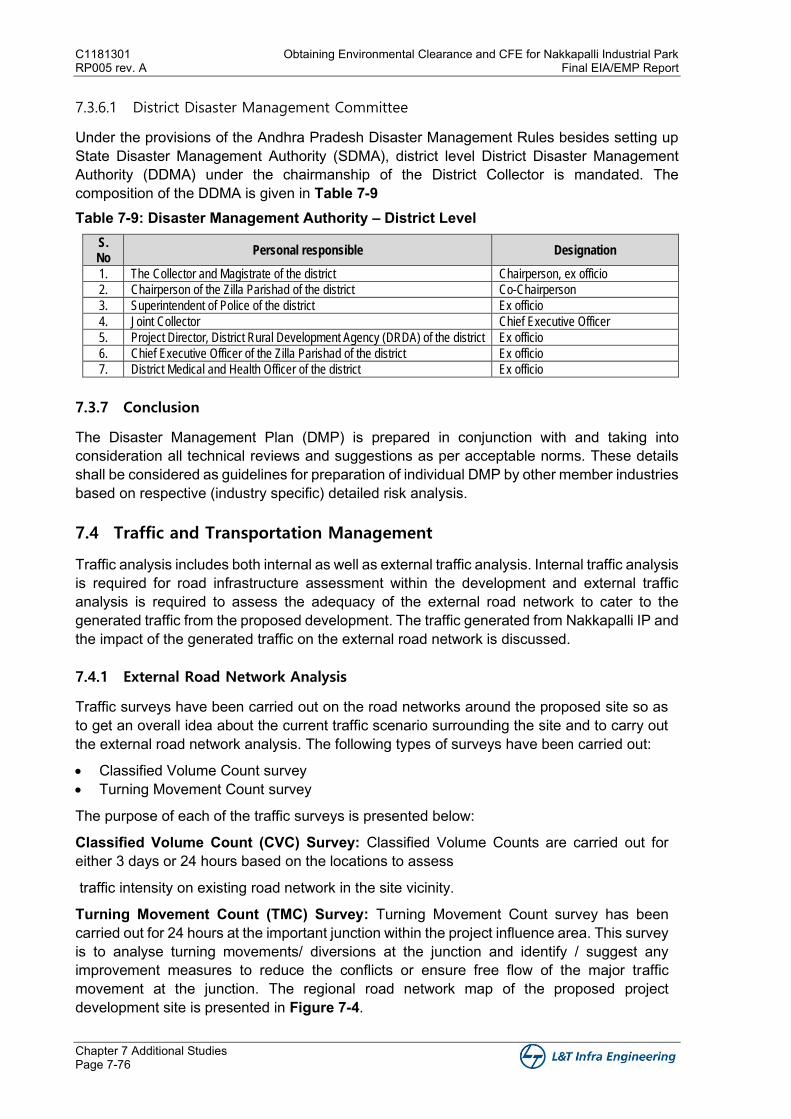
C1181301 Obtaining Environmental Clearance and CFE for Nakkapalli Industrial Park RP005 rev. A Final EIA/EMP Report
Chapter 7 Additional Studies Page 7-76
7.3.6.1 District Disaster Management Committee
Under the provisions of the Andhra Pradesh Disaster Management Rules besides setting up State Disaster Management Authority (SDMA), district level District Disaster Management Authority (DDMA) under the chairmanship of the District Collector is mandated. The composition of the DDMA is given in Table 7-9 Table 7-9: Disaster Management Authority – District Level
S. No
Personal responsible Designation
1. The Collector and Magistrate of the district Chairperson, ex officio
2. Chairperson of the Zilla Parishad of the district Co-Chairperson
3. Superintendent of Police of the district Ex officio
4. Joint Collector Chief Executive Officer
5. Project Director, District Rural Development Agency (DRDA) of the district Ex officio
6. Chief Executive Officer of the Zilla Parishad of the district Ex officio
7. District Medical and Health Officer of the district Ex officio
7.3.7 Conclusion
The Disaster Management Plan (DMP) is prepared in conjunction with and taking into consideration all technical reviews and suggestions as per acceptable norms. These details shall be considered as guidelines for preparation of individual DMP by other member industries based on respective (industry specific) detailed risk analysis.
7.4 Traffic and Transportation Management
Traffic analysis includes both internal as well as external traffic analysis. Internal traffic analysis is required for road infrastructure assessment within the development and external traffic analysis is required to assess the adequacy of the external road network to cater to the generated traffic from the proposed development. The traffic generated from Nakkapalli IP and the impact of the generated traffic on the external road network is discussed.
7.4.1 External Road Network Analysis
Traffic surveys have been carried out on the road networks around the proposed site so as to get an overall idea about the current traffic scenario surrounding the site and to carry out the external road network analysis. The following types of surveys have been carried out:
• Classified Volume Count survey • Turning Movement Count survey
The purpose of each of the traffic surveys is presented below:
Classified Volume Count (CVC) Survey: Classified Volume Counts are carried out for either 3 days or 24 hours based on the locations to assess
traffic intensity on existing road network in the site vicinity.
Turning Movement Count (TMC) Survey: Turning Movement Count survey has been carried out for 24 hours at the important junction within the project influence area. This survey is to analyse turning movements/ diversions at the junction and identify / suggest any improvement measures to reduce the conflicts or ensure free flow of the major traffic movement at the junction. The regional road network map of the proposed project development site is presented in Figure 7-4.
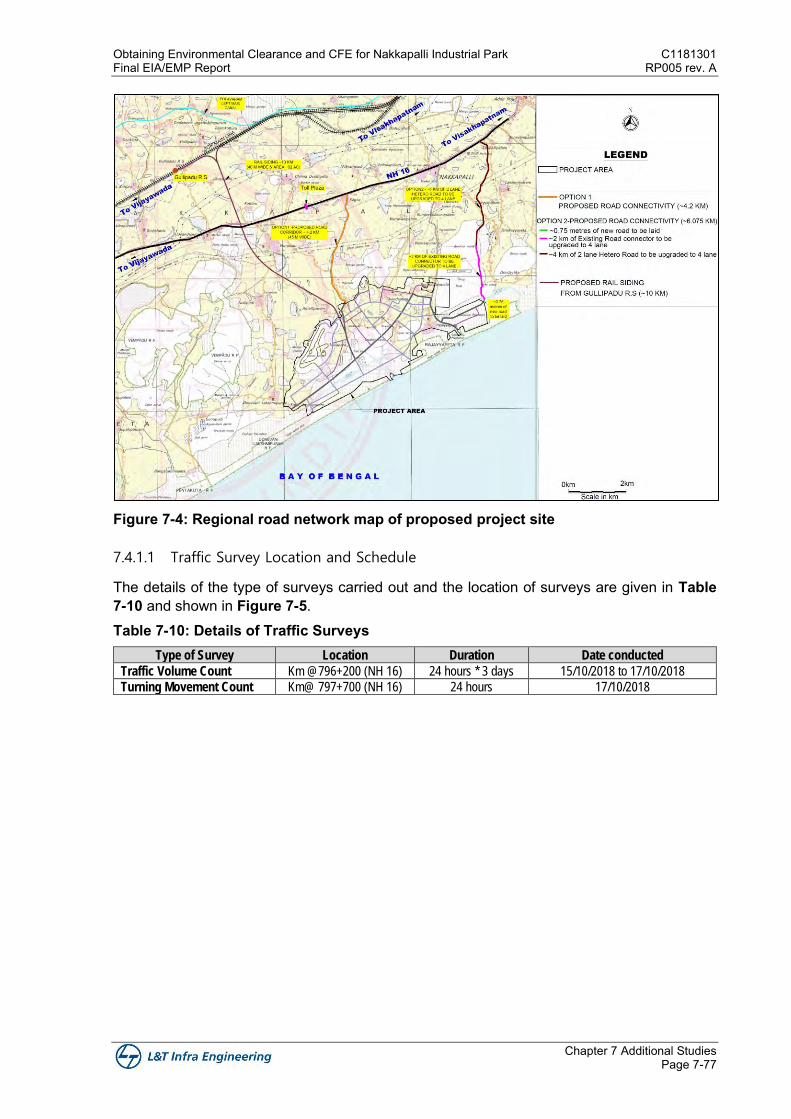
Obtaining Environmental Clearance and CFE for Nakkapalli Industrial Park C1181301 Final EIA/EMP Report RP005 rev. A
Chapter 7 Additional Studies Page 7-77
Figure 7-4: Regional road network map of proposed project site
7.4.1.1 Traffic Survey Location and Schedule
The details of the type of surveys carried out and the location of surveys are given in Table 7-10 and shown in Figure 7-5. Table 7-10: Details of Traffic Surveys
Type of Survey Location Duration Date conducted
Traffic Volume Count Km @796+200 (NH 16) 24 hours * 3 days 15/10/2018 to 17/10/2018
Turning Movement Count Km@ 797+700 (NH 16) 24 hours 17/10/2018
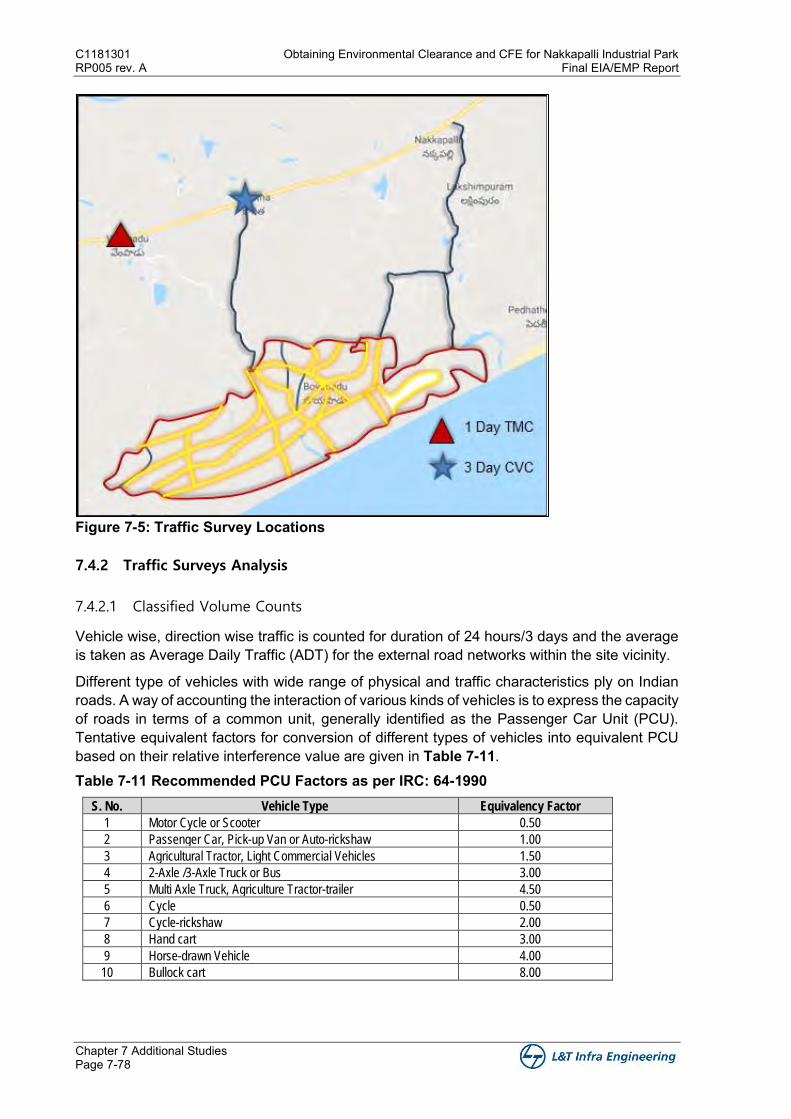
C1181301 Obtaining Environmental Clearance and CFE for Nakkapalli Industrial Park RP005 rev. A Final EIA/EMP Report
Chapter 7 Additional Studies Page 7-78
Figure 7-5: Traffic Survey Locations
7.4.2 Traffic Surveys Analysis
7.4.2.1 Classified Volume Counts
Vehicle wise, direction wise traffic is counted for duration of 24 hours/3 days and the average is taken as Average Daily Traffic (ADT) for the external road networks within the site vicinity.
Different type of vehicles with wide range of physical and traffic characteristics ply on Indian roads. A way of accounting the interaction of various kinds of vehicles is to express the capacity of roads in terms of a common unit, generally identified as the Passenger Car Unit (PCU). Tentative equivalent factors for conversion of different types of vehicles into equivalent PCU based on their relative interference value are given in Table 7-11. Table 7-11 Recommended PCU Factors as per IRC: 64-1990
S. No. Vehicle Type Equivalency Factor
1 Motor Cycle or Scooter 0.50
2 Passenger Car, Pick-up Van or Auto-rickshaw 1.00
3 Agricultural Tractor, Light Commercial Vehicles 1.50
4 2-Axle /3-Axle Truck or Bus 3.00
5 Multi Axle Truck, Agriculture Tractor-trailer 4.50
6 Cycle 0.50
7 Cycle-rickshaw 2.00
8 Hand cart 3.00
9 Horse-drawn Vehicle 4.00
10 Bullock cart 8.00
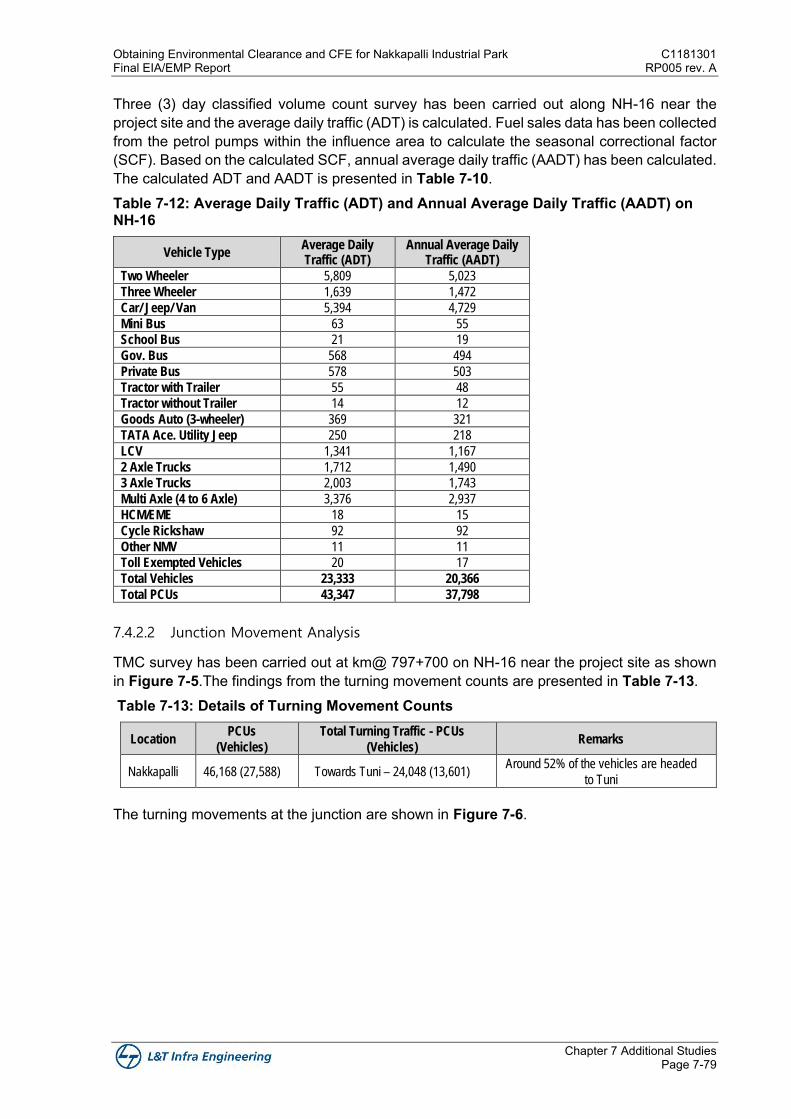
Obtaining Environmental Clearance and CFE for Nakkapalli Industrial Park C1181301 Final EIA/EMP Report RP005 rev. A
Chapter 7 Additional Studies Page 7-79
Three (3) day classified volume count survey has been carried out along NH-16 near the project site and the average daily traffic (ADT) is calculated. Fuel sales data has been collected from the petrol pumps within the influence area to calculate the seasonal correctional factor (SCF). Based on the calculated SCF, annual average daily traffic (AADT) has been calculated. The calculated ADT and AADT is presented in Table 7-10. Table 7-12: Average Daily Traffic (ADT) and Annual Average Daily Traffic (AADT) on NH-16
Vehicle Type Average Daily Traffic (ADT)
Annual Average Daily Traffic (AADT)
Two Wheeler 5,809 5,023
Three Wheeler 1,639 1,472
Car/ Jeep/ Van 5,394 4,729
Mini Bus 63 55
School Bus 21 19
Gov. Bus 568 494
Private Bus 578 503
Tractor with Trailer 55 48
Tractor without Trailer 14 12
Goods Auto (3-wheeler) 369 321
TATA Ace. Utility Jeep 250 218
LCV 1,341 1,167
2 Axle Trucks 1,712 1,490
3 Axle Trucks 2,003 1,743
Multi Axle (4 to 6 Axle) 3,376 2,937
HCM/EME 18 15
Cycle Rickshaw 92 92
Other NMV 11 11
Toll Exempted Vehicles 20 17
Total Vehicles 23,333 20,366
Total PCUs 43,347 37,798
7.4.2.2 Junction Movement Analysis
TMC survey has been carried out at km@ 797+700 on NH-16 near the project site as shown in Figure 7-5.The findings from the turning movement counts are presented in Table 7-13. Table 7-13: Details of Turning Movement Counts
Location PCUs
(Vehicles)
Total Turning Traffic - PCUs
(Vehicles) Remarks
Nakkapalli 46,168 (27,588) Towards Tuni – 24,048 (13,601) Around 52% of the vehicles are headed
to Tuni
The turning movements at the junction are shown in Figure 7-6.
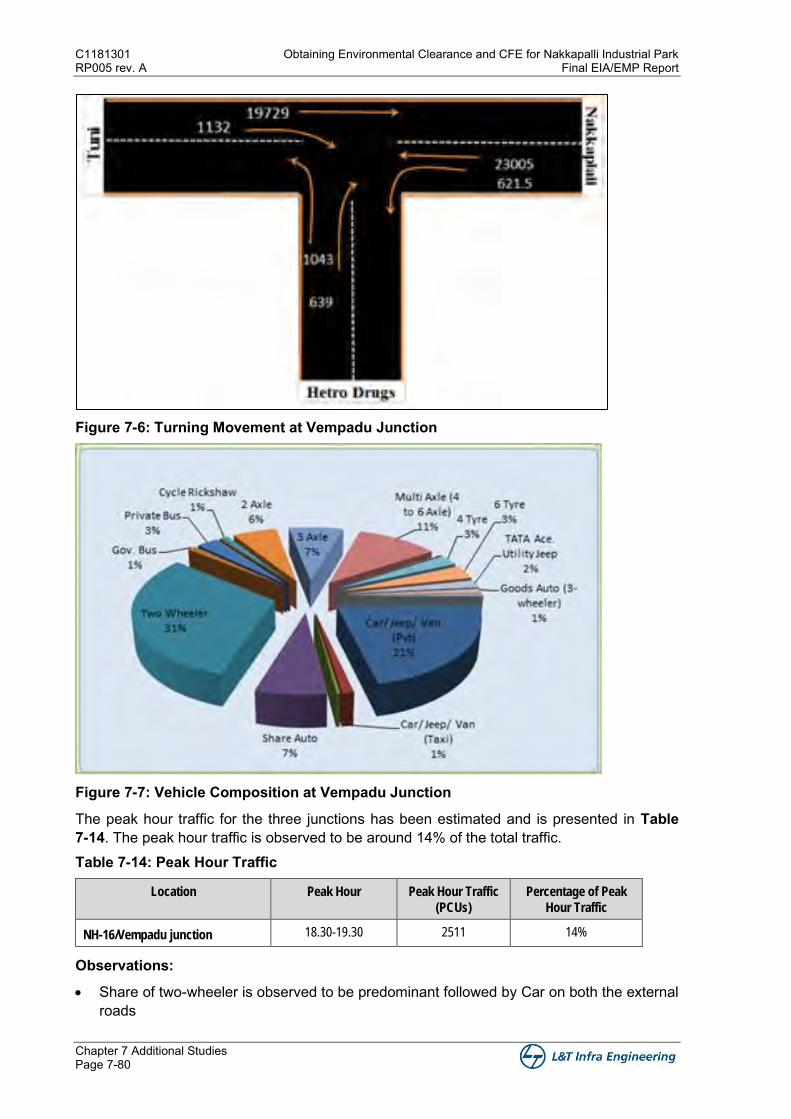
C1181301 Obtaining Environmental Clearance and CFE for Nakkapalli Industrial Park RP005 rev. A Final EIA/EMP Report
Chapter 7 Additional Studies Page 7-80
Figure 7-6: Turning Movement at Vempadu Junction
Figure 7-7: Vehicle Composition at Vempadu Junction
The peak hour traffic for the three junctions has been estimated and is presented in Table 7-14. The peak hour traffic is observed to be around 14% of the total traffic. Table 7-14: Peak Hour Traffic
Location Peak Hour Peak Hour Traffic
(PCUs)
Percentage of Peak
Hour Traffic
NH-16/Vempadu junction 18.30-19.30 2511 14%
Observations:
• Share of two-wheeler is observed to be predominant followed by Car on both the external roads
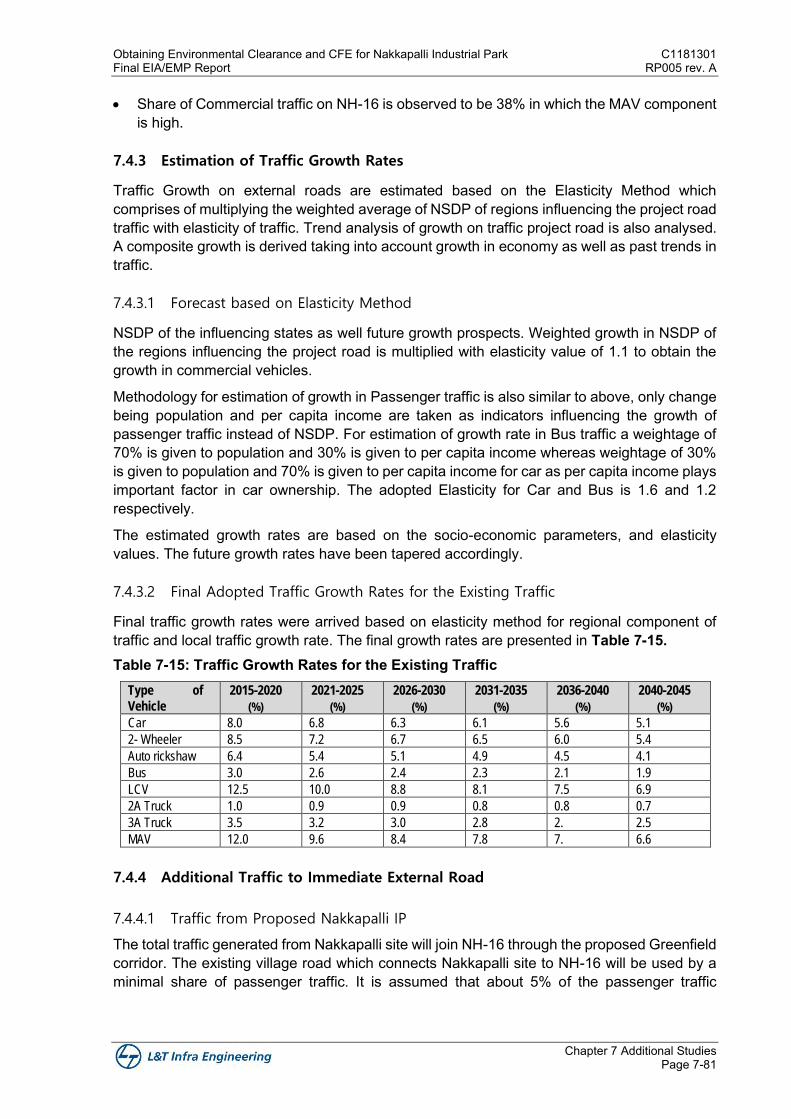
Obtaining Environmental Clearance and CFE for Nakkapalli Industrial Park C1181301 Final EIA/EMP Report RP005 rev. A
Chapter 7 Additional Studies Page 7-81
• Share of Commercial traffic on NH-16 is observed to be 38% in which the MAV component is high.
7.4.3 Estimation of Traffic Growth Rates
Traffic Growth on external roads are estimated based on the Elasticity Method which comprises of multiplying the weighted average of NSDP of regions influencing the project road traffic with elasticity of traffic. Trend analysis of growth on traffic project road is also analysed. A composite growth is derived taking into account growth in economy as well as past trends in traffic.
7.4.3.1 Forecast based on Elasticity Method
NSDP of the influencing states as well future growth prospects. Weighted growth in NSDP of the regions influencing the project road is multiplied with elasticity value of 1.1 to obtain the growth in commercial vehicles.
Methodology for estimation of growth in Passenger traffic is also similar to above, only change being population and per capita income are taken as indicators influencing the growth of passenger traffic instead of NSDP. For estimation of growth rate in Bus traffic a weightage of 70% is given to population and 30% is given to per capita income whereas weightage of 30% is given to population and 70% is given to per capita income for car as per capita income plays important factor in car ownership. The adopted Elasticity for Car and Bus is 1.6 and 1.2 respectively.
The estimated growth rates are based on the socio-economic parameters, and elasticity values. The future growth rates have been tapered accordingly.
7.4.3.2 Final Adopted Traffic Growth Rates for the Existing Traffic
Final traffic growth rates were arrived based on elasticity method for regional component of traffic and local traffic growth rate. The final growth rates are presented in Table 7-15. Table 7-15: Traffic Growth Rates for the Existing Traffic
Type of
Vehicle
2015-2020
(%)
2021-2025
(%)
2026-2030
(%)
2031-2035
(%)
2036-2040
(%)
2040-2045
(%)
Car 8.0 6.8 6.3 6.1 5.6 5.1
2- Wheeler 8.5 7.2 6.7 6.5 6.0 5.4
Auto rickshaw 6.4 5.4 5.1 4.9 4.5 4.1
Bus 3.0 2.6 2.4 2.3 2.1 1.9
LCV 12.5 10.0 8.8 8.1 7.5 6.9
2A Truck 1.0 0.9 0.9 0.8 0.8 0.7
3A Truck 3.5 3.2 3.0 2.8 2. 2.5
MAV 12.0 9.6 8.4 7.8 7. 6.6
7.4.4 Additional Traffic to Immediate External Road
7.4.4.1 Traffic from Proposed Nakkapalli IP
The total traffic generated from Nakkapalli site will join NH-16 through the proposed Greenfield corridor. The existing village road which connects Nakkapalli site to NH-16 will be used by a minimal share of passenger traffic. It is assumed that about 5% of the passenger traffic
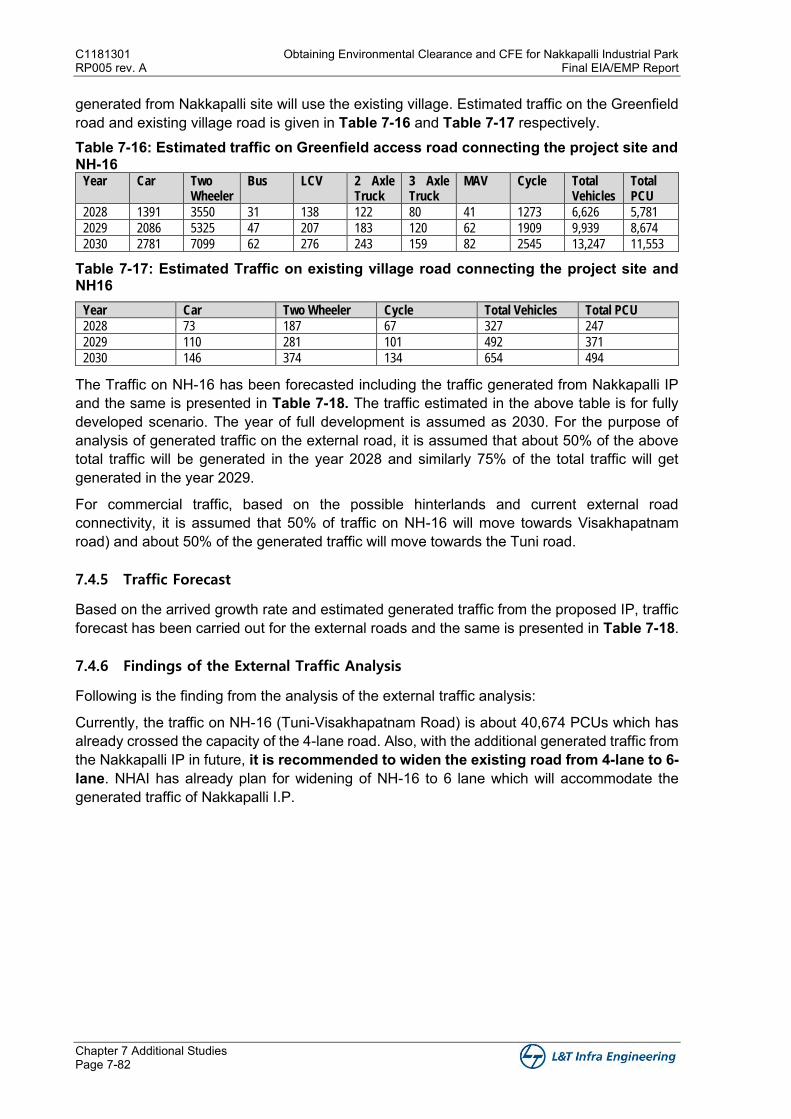
C1181301 Obtaining Environmental Clearance and CFE for Nakkapalli Industrial Park RP005 rev. A Final EIA/EMP Report
Chapter 7 Additional Studies Page 7-82
generated from Nakkapalli site will use the existing village. Estimated traffic on the Greenfield road and existing village road is given in Table 7-16 and Table 7-17 respectively. Table 7-16: Estimated traffic on Greenfield access road connecting the project site and NH-16
Year Car Two Wheeler
Bus LCV 2 Axle Truck
3 Axle Truck
MAV Cycle Total Vehicles
Total PCU
2028 1391 3550 31 138 122 80 41 1273 6,626 5,781
2029 2086 5325 47 207 183 120 62 1909 9,939 8,674
2030 2781 7099 62 276 243 159 82 2545 13,247 11,553
Table 7-17: Estimated Traffic on existing village road connecting the project site and NH16
Year Car Two Wheeler Cycle Total Vehicles Total PCU
2028 73 187 67 327 247
2029 110 281 101 492 371
2030 146 374 134 654 494
The Traffic on NH-16 has been forecasted including the traffic generated from Nakkapalli IP and the same is presented in Table 7-18. The traffic estimated in the above table is for fully developed scenario. The year of full development is assumed as 2030. For the purpose of analysis of generated traffic on the external road, it is assumed that about 50% of the above total traffic will be generated in the year 2028 and similarly 75% of the total traffic will get generated in the year 2029.
For commercial traffic, based on the possible hinterlands and current external road connectivity, it is assumed that 50% of traffic on NH-16 will move towards Visakhapatnam road) and about 50% of the generated traffic will move towards the Tuni road.
7.4.5 Traffic Forecast
Based on the arrived growth rate and estimated generated traffic from the proposed IP, traffic forecast has been carried out for the external roads and the same is presented in Table 7-18.
7.4.6 Findings of the External Traffic Analysis
Following is the finding from the analysis of the external traffic analysis:
Currently, the traffic on NH-16 (Tuni-Visakhapatnam Road) is about 40,674 PCUs which has already crossed the capacity of the 4-lane road. Also, with the additional generated traffic from the Nakkapalli IP in future, it is recommended to widen the existing road from 4-lane to 6-lane. NHAI has already plan for widening of NH-16 to 6 lane which will accommodate the generated traffic of Nakkapalli I.P.
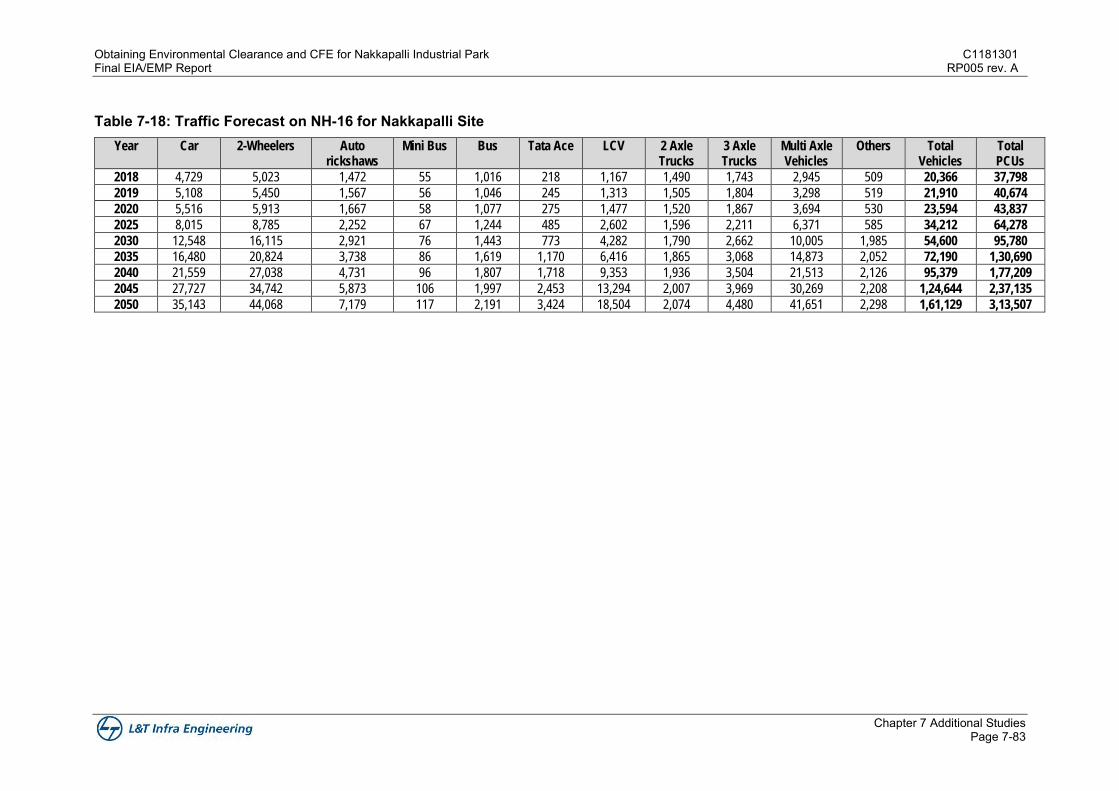
Obtaining Environmental Clearance and CFE for Nakkapalli Industrial Park C1181301 Final EIA/EMP Report RP005 rev. A
Chapter 7 Additional Studies Page 7-83
Table 7-18: Traffic Forecast on NH-16 for Nakkapalli Site Year Car 2-Wheelers Auto
rickshaws Mini Bus Bus Tata Ace LCV 2 Axle
Trucks 3 Axle Trucks
Multi Axle Vehicles
Others Total Vehicles
Total PCUs
2018 4,729 5,023 1,472 55 1,016 218 1,167 1,490 1,743 2,945 509 20,366 37,798
2019 5,108 5,450 1,567 56 1,046 245 1,313 1,505 1,804 3,298 519 21,910 40,674
2020 5,516 5,913 1,667 58 1,077 275 1,477 1,520 1,867 3,694 530 23,594 43,837
2025 8,015 8,785 2,252 67 1,244 485 2,602 1,596 2,211 6,371 585 34,212 64,278
2030 12,548 16,115 2,921 76 1,443 773 4,282 1,790 2,662 10,005 1,985 54,600 95,780
2035 16,480 20,824 3,738 86 1,619 1,170 6,416 1,865 3,068 14,873 2,052 72,190 1,30,690
2040 21,559 27,038 4,731 96 1,807 1,718 9,353 1,936 3,504 21,513 2,126 95,379 1,77,209
2045 27,727 34,742 5,873 106 1,997 2,453 13,294 2,007 3,969 30,269 2,208 1,24,644 2,37,135
2050 35,143 44,068 7,179 117 2,191 3,424 18,504 2,074 4,480 41,651 2,298 1,61,129 3,13,507
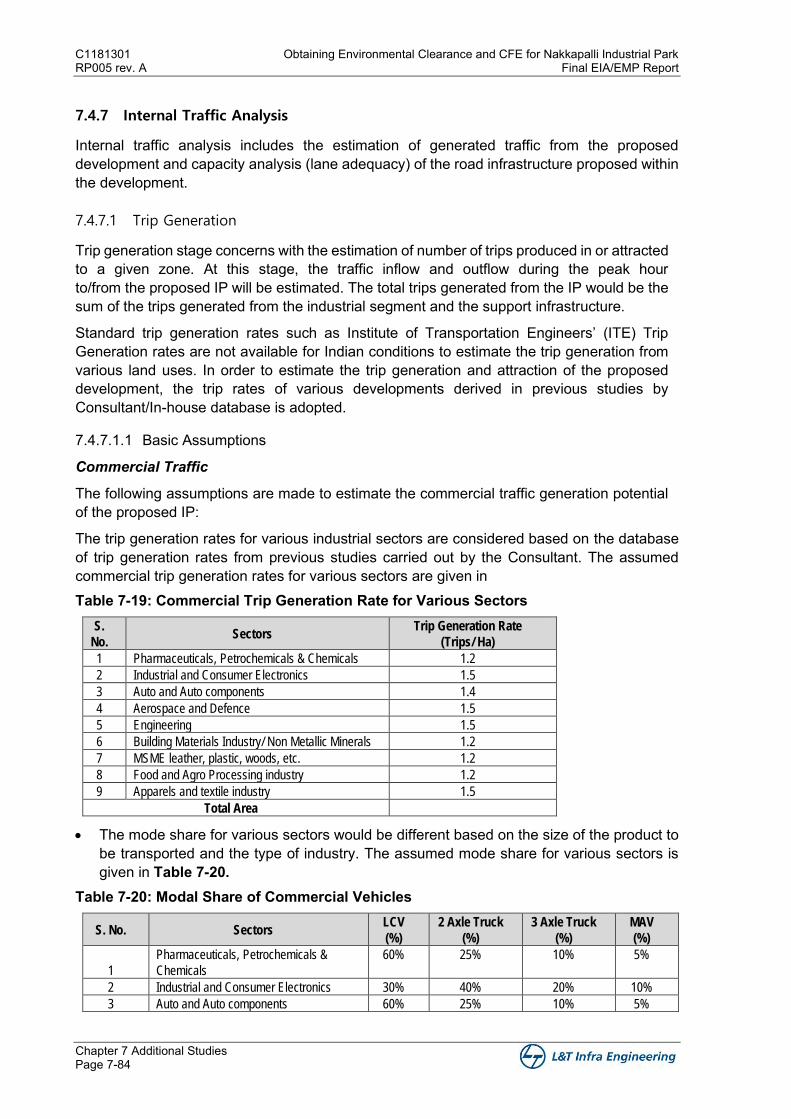
C1181301 Obtaining Environmental Clearance and CFE for Nakkapalli Industrial Park RP005 rev. A Final EIA/EMP Report
Chapter 7 Additional Studies Page 7-84
7.4.7 Internal Traffic Analysis
Internal traffic analysis includes the estimation of generated traffic from the proposed development and capacity analysis (lane adequacy) of the road infrastructure proposed within the development.
7.4.7.1 Trip Generation
Trip generation stage concerns with the estimation of number of trips produced in or attracted to a given zone. At this stage, the traffic inflow and outflow during the peak hour to/from the proposed IP will be estimated. The total trips generated from the IP would be the sum of the trips generated from the industrial segment and the support infrastructure.
Standard trip generation rates such as Institute of Transportation Engineers’ (ITE) Trip Generation rates are not available for Indian conditions to estimate the trip generation from various land uses. In order to estimate the trip generation and attraction of the proposed development, the trip rates of various developments derived in previous studies by Consultant/In-house database is adopted.
7.4.7.1.1 Basic Assumptions
Commercial Traffic
The following assumptions are made to estimate the commercial traffic generation potential of the proposed IP:
The trip generation rates for various industrial sectors are considered based on the database of trip generation rates from previous studies carried out by the Consultant. The assumed commercial trip generation rates for various sectors are given in Table 7-19: Commercial Trip Generation Rate for Various Sectors
S.
No. Sectors
Trip Generation Rate
(Trips/ Ha)
1 Pharmaceuticals, Petrochemicals & Chemicals 1.2
2 Industrial and Consumer Electronics 1.5
3 Auto and Auto components 1.4
4 Aerospace and Defence 1.5
5 Engineering 1.5
6 Building Materials Industry/ Non Metallic Minerals 1.2
7 MSME leather, plastic, woods, etc. 1.2
8 Food and Agro Processing industry 1.2
9 Apparels and textile industry 1.5
Total Area
• The mode share for various sectors would be different based on the size of the product to be transported and the type of industry. The assumed mode share for various sectors is given in Table 7-20.
Table 7-20: Modal Share of Commercial Vehicles
S. No. Sectors LCV
(%)
2 Axle Truck
(%)
3 Axle Truck
(%)
MAV
(%)
1
Pharmaceuticals, Petrochemicals &
Chemicals
60% 25% 10% 5%
2 Industrial and Consumer Electronics 30% 40% 20% 10%
3 Auto and Auto components 60% 25% 10% 5%
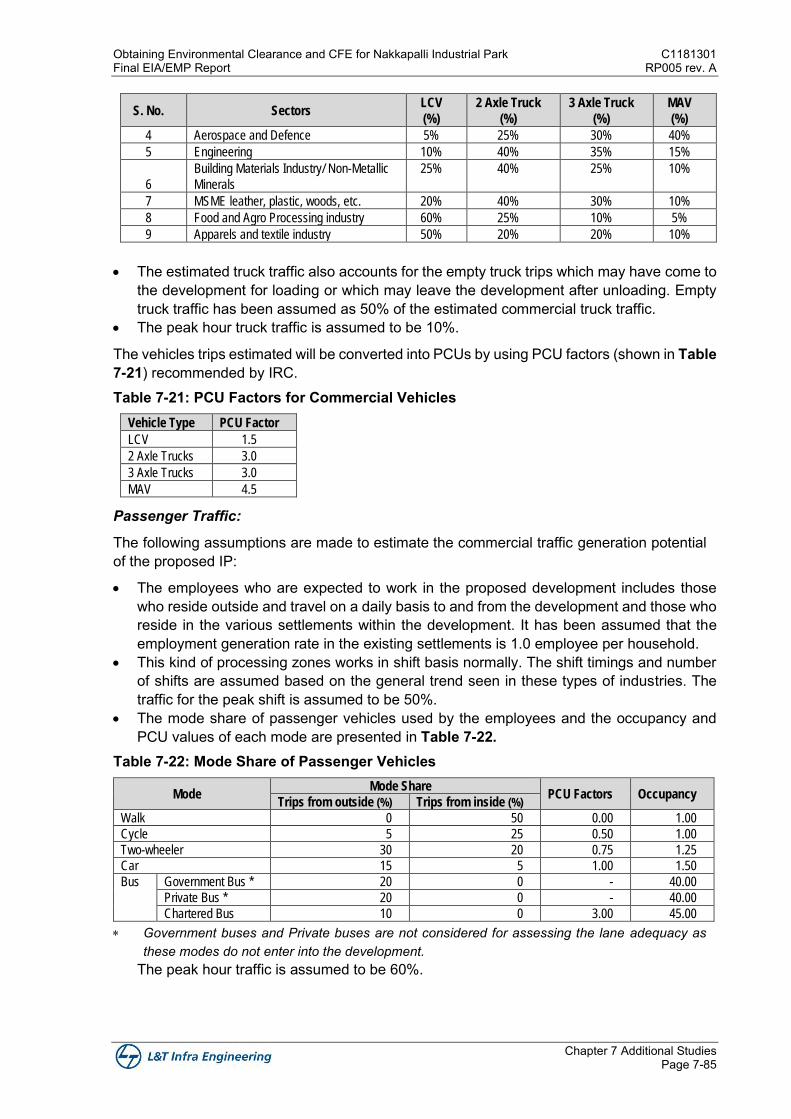
Obtaining Environmental Clearance and CFE for Nakkapalli Industrial Park C1181301 Final EIA/EMP Report RP005 rev. A
Chapter 7 Additional Studies Page 7-85
S. No. Sectors LCV
(%)
2 Axle Truck
(%)
3 Axle Truck
(%)
MAV
(%)
4 Aerospace and Defence 5% 25% 30% 40%
5 Engineering 10% 40% 35% 15%
6
Building Materials Industry/ Non-Metallic
Minerals
25% 40% 25% 10%
7 MSME leather, plastic, woods, etc. 20% 40% 30% 10%
8 Food and Agro Processing industry 60% 25% 10% 5%
9 Apparels and textile industry 50% 20% 20% 10%
• The estimated truck traffic also accounts for the empty truck trips which may have come to
the development for loading or which may leave the development after unloading. Empty truck traffic has been assumed as 50% of the estimated commercial truck traffic.
• The peak hour truck traffic is assumed to be 10%.
The vehicles trips estimated will be converted into PCUs by using PCU factors (shown in Table 7-21) recommended by IRC. Table 7-21: PCU Factors for Commercial Vehicles
Vehicle Type PCU Factor
LCV 1.5
2 Axle Trucks 3.0
3 Axle Trucks 3.0
MAV 4.5
Passenger Traffic:
The following assumptions are made to estimate the commercial traffic generation potential of the proposed IP:
• The employees who are expected to work in the proposed development includes those who reside outside and travel on a daily basis to and from the development and those who reside in the various settlements within the development. It has been assumed that the employment generation rate in the existing settlements is 1.0 employee per household.
• This kind of processing zones works in shift basis normally. The shift timings and number of shifts are assumed based on the general trend seen in these types of industries. The traffic for the peak shift is assumed to be 50%.
• The mode share of passenger vehicles used by the employees and the occupancy and PCU values of each mode are presented in Table 7-22.
Table 7-22: Mode Share of Passenger Vehicles
Mode Mode Share
PCU Factors Occupancy Trips from outside (%) Trips from inside (%)
Walk 0 50 0.00 1.00
Cycle 5 25 0.50 1.00
Two-wheeler 30 20 0.75 1.25
Car 15 5 1.00 1.50
Bus Government Bus * 20 0 - 40.00
Private Bus * 20 0 - 40.00
Chartered Bus 10 0 3.00 45.00
Government buses and Private buses are not considered for assessing the lane adequacy as these modes do not enter into the development.
The peak hour traffic is assumed to be 60%.
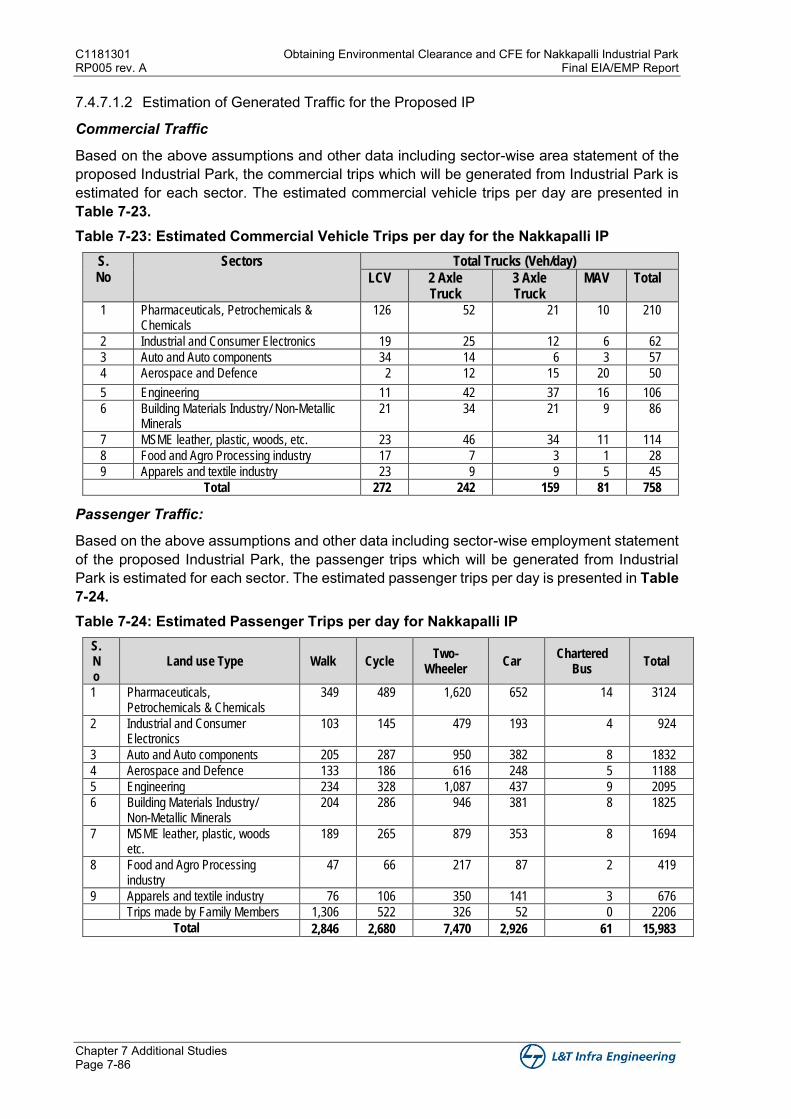
C1181301 Obtaining Environmental Clearance and CFE for Nakkapalli Industrial Park RP005 rev. A Final EIA/EMP Report
Chapter 7 Additional Studies Page 7-86
7.4.7.1.2 Estimation of Generated Traffic for the Proposed IP
Commercial Traffic
Based on the above assumptions and other data including sector-wise area statement of the proposed Industrial Park, the commercial trips which will be generated from Industrial Park is estimated for each sector. The estimated commercial vehicle trips per day are presented in Table 7-23. Table 7-23: Estimated Commercial Vehicle Trips per day for the Nakkapalli IP
S. No
Sectors Total Trucks (Veh/day)
LCV 2 Axle Truck
3 Axle Truck
MAV Total
1 Pharmaceuticals, Petrochemicals & Chemicals
126 52 21 10 210
2 Industrial and Consumer Electronics 19 25 12 6 62
3 Auto and Auto components 34 14 6 3 57
4 Aerospace and Defence 2 12 15 20 50
5 Engineering 11 42 37 16 106
6 Building Materials Industry/ Non-Metallic Minerals
21 34 21 9 86
7 MSME leather, plastic, woods, etc. 23 46 34 11 114
8 Food and Agro Processing industry 17 7 3 1 28
9 Apparels and textile industry 23 9 9 5 45
Total 272 242 159 81 758
Passenger Traffic:
Based on the above assumptions and other data including sector-wise employment statement of the proposed Industrial Park, the passenger trips which will be generated from Industrial Park is estimated for each sector. The estimated passenger trips per day is presented in Table 7-24. Table 7-24: Estimated Passenger Trips per day for Nakkapalli IP
S. No
Land use Type Walk Cycle Two-
Wheeler Car
Chartered Bus
Total
1 Pharmaceuticals, Petrochemicals & Chemicals
349 489 1,620 652 14 3124
2 Industrial and Consumer Electronics
103 145 479 193 4 924
3 Auto and Auto components 205 287 950 382 8 1832
4 Aerospace and Defence 133 186 616 248 5 1188
5 Engineering 234 328 1,087 437 9 2095
6 Building Materials Industry/ Non-Metallic Minerals
204 286 946 381 8 1825
7 MSME leather, plastic, woods etc.
189 265 879 353 8 1694
8 Food and Agro Processing industry
47 66 217 87 2 419
9 Apparels and textile industry 76 106 350 141 3 676
Trips made by Family Members 1,306 522 326 52 0 2206
Total 2,846 2,680 7,470 2,926 61 15,983
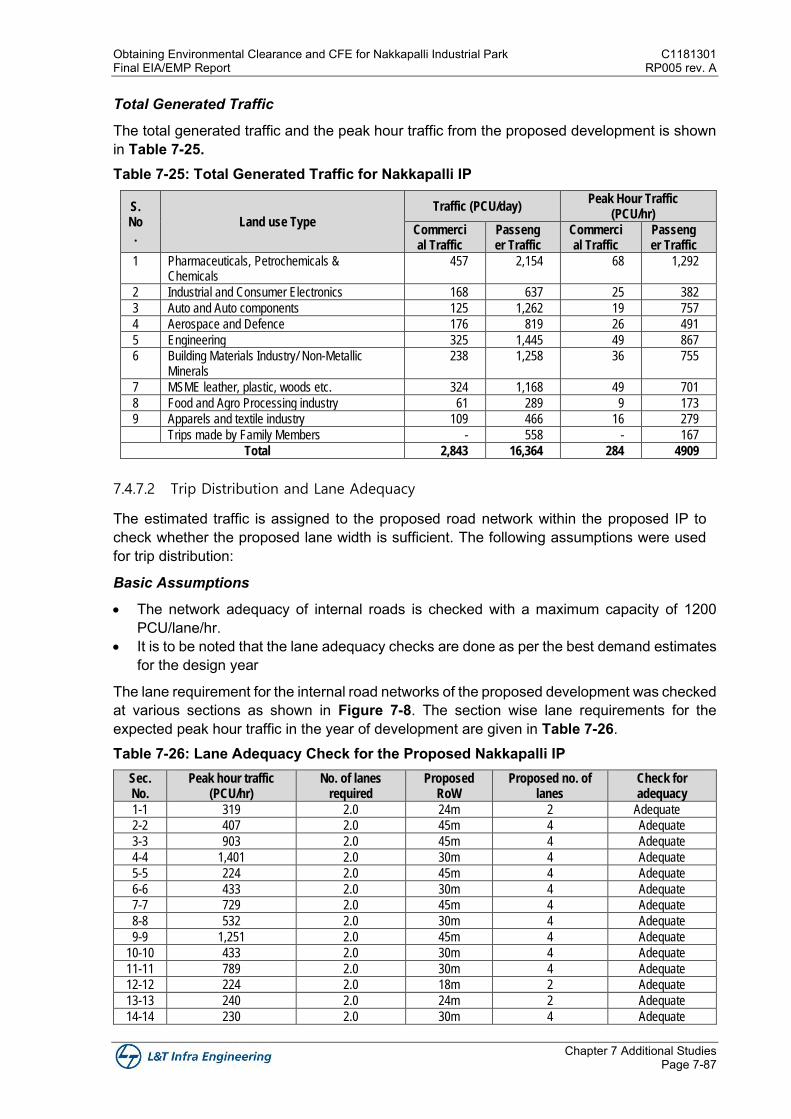
Obtaining Environmental Clearance and CFE for Nakkapalli Industrial Park C1181301 Final EIA/EMP Report RP005 rev. A
Chapter 7 Additional Studies Page 7-87
Total Generated Traffic
The total generated traffic and the peak hour traffic from the proposed development is shown in Table 7-25. Table 7-25: Total Generated Traffic for Nakkapalli IP
S. No.
Land use Type
Traffic (PCU/day) Peak Hour Traffic
(PCU/hr)
Commercial Traffic
Passenger Traffic
Commercial Traffic
Passenger Traffic
1 Pharmaceuticals, Petrochemicals & Chemicals
457 2,154 68 1,292
2 Industrial and Consumer Electronics 168 637 25 382
3 Auto and Auto components 125 1,262 19 757
4 Aerospace and Defence 176 819 26 491
5 Engineering 325 1,445 49 867
6 Building Materials Industry/ Non-Metallic Minerals
238 1,258 36 755
7 MSME leather, plastic, woods etc. 324 1,168 49 701
8 Food and Agro Processing industry 61 289 9 173
9 Apparels and textile industry 109 466 16 279
Trips made by Family Members - 558 - 167
Total 2,843 16,364 284 4909
7.4.7.2 Trip Distribution and Lane Adequacy
The estimated traffic is assigned to the proposed road network within the proposed IP to check whether the proposed lane width is sufficient. The following assumptions were used for trip distribution:
Basic Assumptions
• The network adequacy of internal roads is checked with a maximum capacity of 1200 PCU/lane/hr.
• It is to be noted that the lane adequacy checks are done as per the best demand estimates for the design year
The lane requirement for the internal road networks of the proposed development was checked at various sections as shown in Figure 7-8. The section wise lane requirements for the expected peak hour traffic in the year of development are given in Table 7-26. Table 7-26: Lane Adequacy Check for the Proposed Nakkapalli IP
Sec. No.
Peak hour traffic (PCU/hr)
No. of lanes required
Proposed RoW
Proposed no. of lanes
Check for adequacy
1-1 319 2.0 24m 2 Adequate
2-2 407 2.0 45m 4 Adequate
3-3 903 2.0 45m 4 Adequate
4-4 1,401 2.0 30m 4 Adequate
5-5 224 2.0 45m 4 Adequate
6-6 433 2.0 30m 4 Adequate
7-7 729 2.0 45m 4 Adequate
8-8 532 2.0 30m 4 Adequate
9-9 1,251 2.0 45m 4 Adequate
10-10 433 2.0 30m 4 Adequate
11-11 789 2.0 30m 4 Adequate
12-12 224 2.0 18m 2 Adequate
13-13 240 2.0 24m 2 Adequate
14-14 230 2.0 30m 4 Adequate
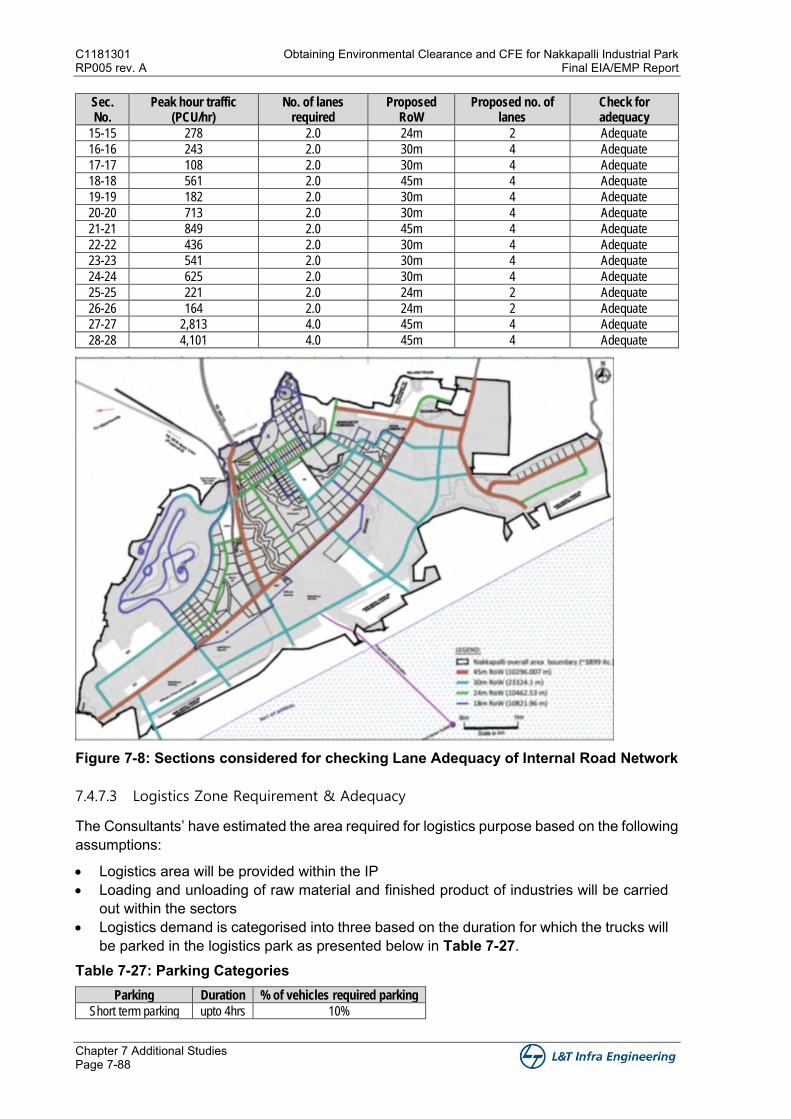
C1181301 Obtaining Environmental Clearance and CFE for Nakkapalli Industrial Park RP005 rev. A Final EIA/EMP Report
Chapter 7 Additional Studies Page 7-88
Sec. No.
Peak hour traffic (PCU/hr)
No. of lanes required
Proposed RoW
Proposed no. of lanes
Check for adequacy
15-15 278 2.0 24m 2 Adequate
16-16 243 2.0 30m 4 Adequate
17-17 108 2.0 30m 4 Adequate
18-18 561 2.0 45m 4 Adequate
19-19 182 2.0 30m 4 Adequate
20-20 713 2.0 30m 4 Adequate
21-21 849 2.0 45m 4 Adequate
22-22 436 2.0 30m 4 Adequate
23-23 541 2.0 30m 4 Adequate
24-24 625 2.0 30m 4 Adequate
25-25 221 2.0 24m 2 Adequate
26-26 164 2.0 24m 2 Adequate
27-27 2,813 4.0 45m 4 Adequate
28-28 4,101 4.0 45m 4 Adequate
Figure 7-8: Sections considered for checking Lane Adequacy of Internal Road Network
7.4.7.3 Logistics Zone Requirement & Adequacy
The Consultants’ have estimated the area required for logistics purpose based on the following assumptions:
• Logistics area will be provided within the IP • Loading and unloading of raw material and finished product of industries will be carried
out within the sectors • Logistics demand is categorised into three based on the duration for which the trucks will
be parked in the logistics park as presented below in Table 7-27. Table 7-27: Parking Categories
Parking Duration % of vehicles required parking
Short term parking upto 4hrs 10%
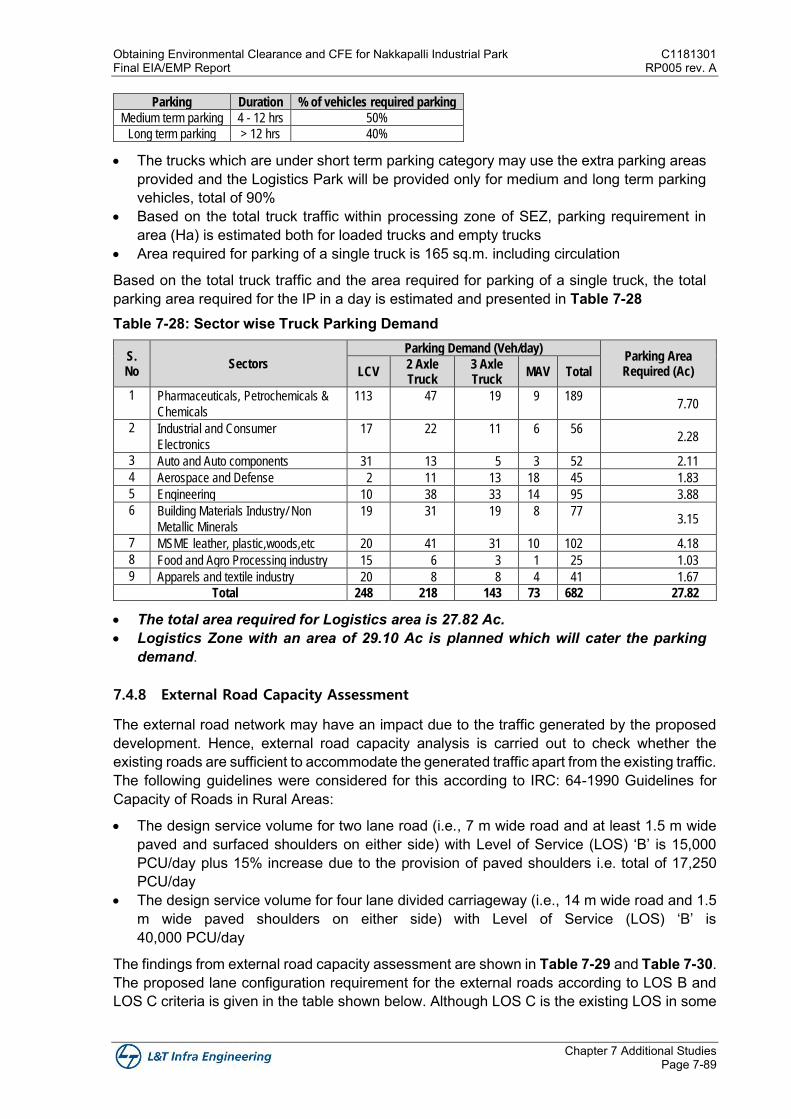
Obtaining Environmental Clearance and CFE for Nakkapalli Industrial Park C1181301 Final EIA/EMP Report RP005 rev. A
Chapter 7 Additional Studies Page 7-89
Parking Duration % of vehicles required parking
Medium term parking 4 - 12 hrs 50%
Long term parking > 12 hrs 40%
• The trucks which are under short term parking category may use the extra parking areas provided and the Logistics Park will be provided only for medium and long term parking vehicles, total of 90%
• Based on the total truck traffic within processing zone of SEZ, parking requirement in area (Ha) is estimated both for loaded trucks and empty trucks
• Area required for parking of a single truck is 165 sq.m. including circulation
Based on the total truck traffic and the area required for parking of a single truck, the total parking area required for the IP in a day is estimated and presented in Table 7-28 Table 7-28: Sector wise Truck Parking Demand
S. No
Sectors
Parking Demand (Veh/day) Parking Area Required (Ac) LCV
2 Axle Truck
3 Axle Truck
MAV Total
1 Pharmaceuticals, Petrochemicals &
Chemicals
113 47 19 9 189 7.70
2 Industrial and Consumer
Electronics
17 22 11 6 56 2.28
3 Auto and Auto components 31 13 5 3 52 2.11
4 Aerospace and Defense 2 11 13 18 45 1.83
5 Engineering 10 38 33 14 95 3.88
6 Building Materials Industry/ Non
Metallic Minerals
19 31 19 8 77 3.15
7 MSME leather, plastic,woods,etc 20 41 31 10 102 4.18
8 Food and Agro Processing industry 15 6 3 1 25 1.03
9 Apparels and textile industry 20 8 8 4 41 1.67
Total 248 218 143 73 682 27.82
• The total area required for Logistics area is 27.82 Ac. • Logistics Zone with an area of 29.10 Ac is planned which will cater the parking
demand.
7.4.8 External Road Capacity Assessment
The external road network may have an impact due to the traffic generated by the proposed development. Hence, external road capacity analysis is carried out to check whether the existing roads are sufficient to accommodate the generated traffic apart from the existing traffic. The following guidelines were considered for this according to IRC: 64-1990 Guidelines for Capacity of Roads in Rural Areas:
• The design service volume for two lane road (i.e., 7 m wide road and at least 1.5 m wide paved and surfaced shoulders on either side) with Level of Service (LOS) ‘B’ is 15,000 PCU/day plus 15% increase due to the provision of paved shoulders i.e. total of 17,250 PCU/day
• The design service volume for four lane divided carriageway (i.e., 14 m wide road and 1.5 m wide paved shoulders on either side) with Level of Service (LOS) ‘B’ is 40,000 PCU/day
The findings from external road capacity assessment are shown in Table 7-29 and Table 7-30. The proposed lane configuration requirement for the external roads according to LOS B and LOS C criteria is given in the table shown below. Although LOS C is the existing LOS in some
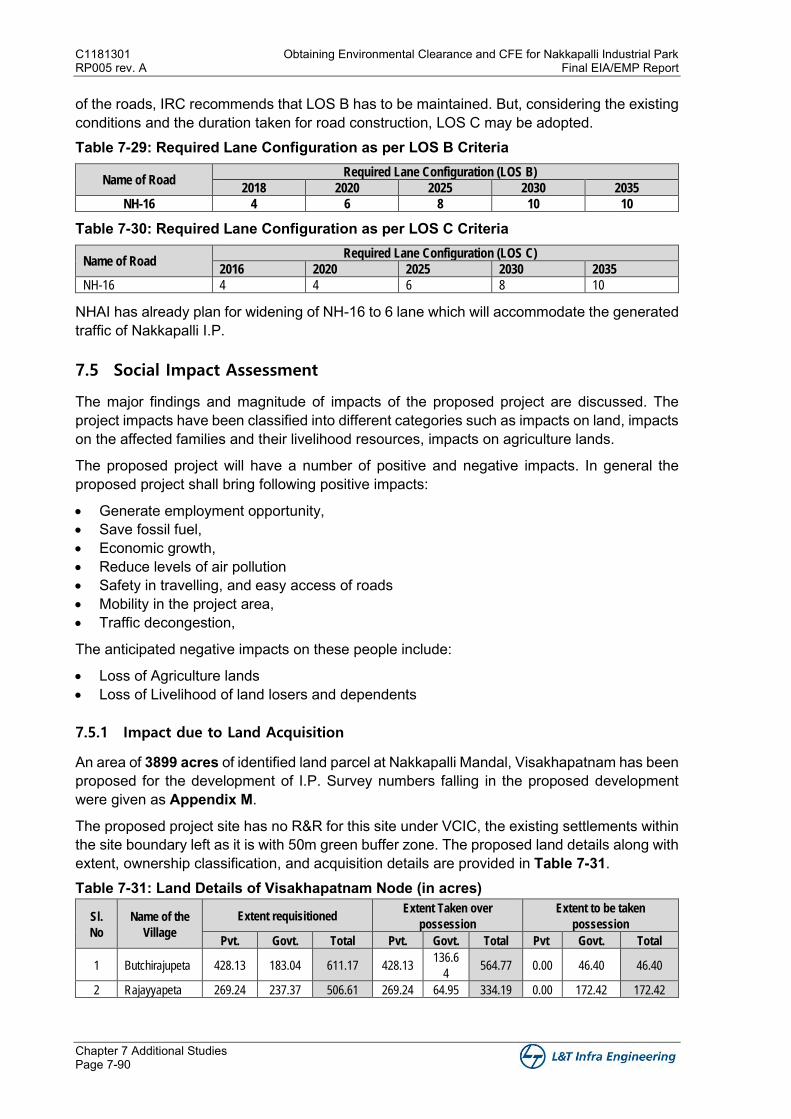
C1181301 Obtaining Environmental Clearance and CFE for Nakkapalli Industrial Park RP005 rev. A Final EIA/EMP Report
Chapter 7 Additional Studies Page 7-90
of the roads, IRC recommends that LOS B has to be maintained. But, considering the existing conditions and the duration taken for road construction, LOS C may be adopted. Table 7-29: Required Lane Configuration as per LOS B Criteria
Name of Road Required Lane Configuration (LOS B)
2018 2020 2025 2030 2035
NH-16 4 6 8 10 10
Table 7-30: Required Lane Configuration as per LOS C Criteria
Name of Road Required Lane Configuration (LOS C)
2016 2020 2025 2030 2035
NH-16 4 4 6 8 10
NHAI has already plan for widening of NH-16 to 6 lane which will accommodate the generated traffic of Nakkapalli I.P.
7.5 Social Impact Assessment
The major findings and magnitude of impacts of the proposed project are discussed. The project impacts have been classified into different categories such as impacts on land, impacts on the affected families and their livelihood resources, impacts on agriculture lands.
The proposed project will have a number of positive and negative impacts. In general the proposed project shall bring following positive impacts:
• Generate employment opportunity, • Save fossil fuel, • Economic growth, • Reduce levels of air pollution • Safety in travelling, and easy access of roads • Mobility in the project area, • Traffic decongestion,
The anticipated negative impacts on these people include:
• Loss of Agriculture lands • Loss of Livelihood of land losers and dependents
7.5.1 Impact due to Land Acquisition
An area of 3899 acres of identified land parcel at Nakkapalli Mandal, Visakhapatnam has been proposed for the development of I.P. Survey numbers falling in the proposed development were given as Appendix M.
The proposed project site has no R&R for this site under VCIC, the existing settlements within the site boundary left as it is with 50m green buffer zone. The proposed land details along with extent, ownership classification, and acquisition details are provided in Table 7-31. Table 7-31: Land Details of Visakhapatnam Node (in acres)
Sl.
No
Name of the
Village
Extent requisitioned Extent Taken over
possession
Extent to be taken
possession
Pvt. Govt. Total Pvt. Govt. Total Pvt Govt. Total
1 Butchirajupeta 428.13 183.04 611.17 428.13 136.6
4 564.77 0.00 46.40 46.40
2 Rajayyapeta 269.24 237.37 506.61 269.24 64.95 334.19 0.00 172.42 172.42
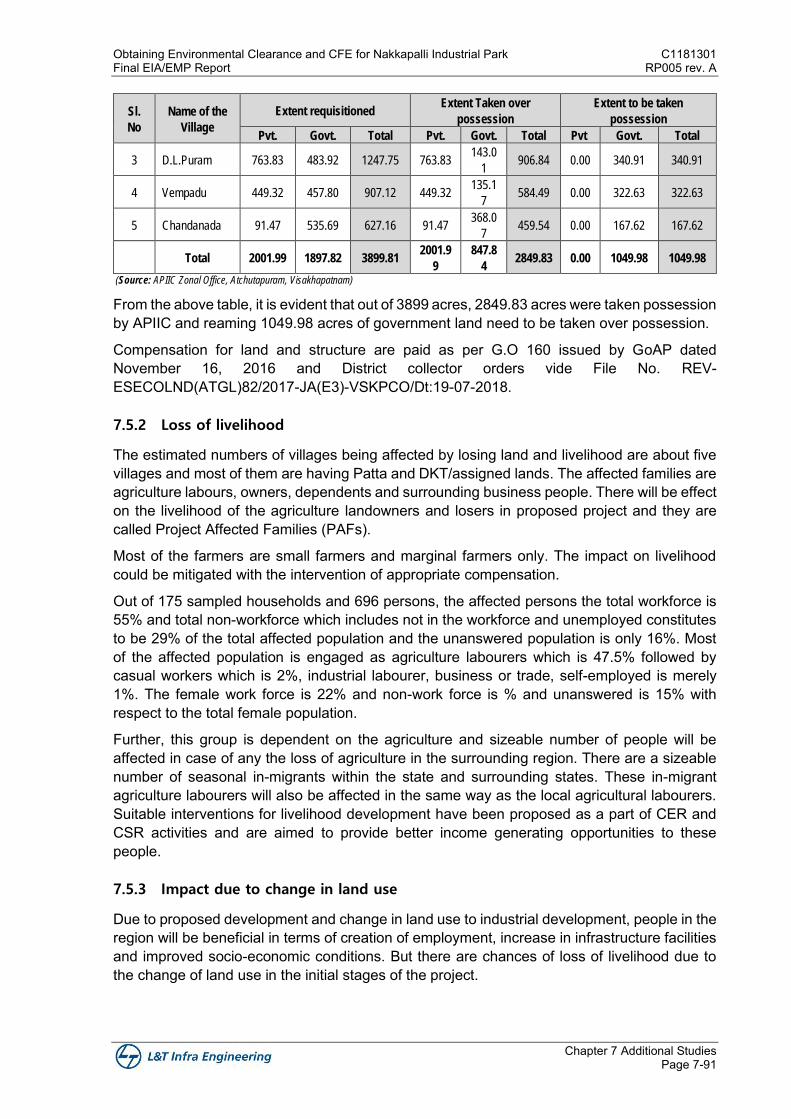
Obtaining Environmental Clearance and CFE for Nakkapalli Industrial Park C1181301 Final EIA/EMP Report RP005 rev. A
Chapter 7 Additional Studies Page 7-91
Sl.
No
Name of the
Village
Extent requisitioned Extent Taken over
possession
Extent to be taken
possession
Pvt. Govt. Total Pvt. Govt. Total Pvt Govt. Total
3 D.L.Puram 763.83 483.92 1247.75 763.83 143.0
1 906.84 0.00 340.91 340.91
4 Vempadu 449.32 457.80 907.12 449.32 135.1
7 584.49 0.00 322.63 322.63
5 Chandanada 91.47 535.69 627.16 91.47 368.0
7 459.54 0.00 167.62 167.62
Total 2001.99 1897.82 3899.81 2001.9
9
847.8
4 2849.83 0.00 1049.98 1049.98
(Source: APIIC Zonal Office, Atchutapuram, Visakhapatnam)
From the above table, it is evident that out of 3899 acres, 2849.83 acres were taken possession by APIIC and reaming 1049.98 acres of government land need to be taken over possession.
Compensation for land and structure are paid as per G.O 160 issued by GoAP dated November 16, 2016 and District collector orders vide File No. REV-ESECOLND(ATGL)82/2017-JA(E3)-VSKPCO/Dt:19-07-2018.
7.5.2 Loss of livelihood
The estimated numbers of villages being affected by losing land and livelihood are about five villages and most of them are having Patta and DKT/assigned lands. The affected families are agriculture labours, owners, dependents and surrounding business people. There will be effect on the livelihood of the agriculture landowners and losers in proposed project and they are called Project Affected Families (PAFs).
Most of the farmers are small farmers and marginal farmers only. The impact on livelihood could be mitigated with the intervention of appropriate compensation.
Out of 175 sampled households and 696 persons, the affected persons the total workforce is 55% and total non-workforce which includes not in the workforce and unemployed constitutes to be 29% of the total affected population and the unanswered population is only 16%. Most of the affected population is engaged as agriculture labourers which is 47.5% followed by casual workers which is 2%, industrial labourer, business or trade, self-employed is merely 1%. The female work force is 22% and non-work force is % and unanswered is 15% with respect to the total female population.
Further, this group is dependent on the agriculture and sizeable number of people will be affected in case of any the loss of agriculture in the surrounding region. There are a sizeable number of seasonal in-migrants within the state and surrounding states. These in-migrant agriculture labourers will also be affected in the same way as the local agricultural labourers. Suitable interventions for livelihood development have been proposed as a part of CER and CSR activities and are aimed to provide better income generating opportunities to these people.
7.5.3 Impact due to change in land use
Due to proposed development and change in land use to industrial development, people in the region will be beneficial in terms of creation of employment, increase in infrastructure facilities and improved socio-economic conditions. But there are chances of loss of livelihood due to the change of land use in the initial stages of the project.
C1181301 Obtaining Environmental Clearance and CFE for Nakkapalli Industrial Park RP005 rev. A Final EIA/EMP Report
Chapter 7 Additional Studies Page 7-92
7.5.4 Impact on Nearby Settlements
The impact on nearby settlements during construction phase will be due to air/dust pollution and the noise generating activities. However, the activities are limited to the construction phase and will cease upon completion of the construction. Hence, this impact is considered to be negligible and therefore can be classified as insignificant. Dust suppression measures such as sprinkling of water and suitable enclosures around the high noise generating areas within construction area will be provided. Mobile STPs/soak pits are proposed for domestic effluents.
Traffic level will be monitored and may construct roads or expand the existing roads in order to reduce upcoming traffic and etc. the proper mitigation measures has to be taken in order to control the trafficking.
Ambient noise levels will be monitored at regular intervals. Noise generating equipment will be provided with suitable enclosures such that cumulative noise will be within the permissible limits. Operation of vehicles shall be carried out only during non-peak hours and Speed limits shall be restricted and will be within the limits. Noise and pollution generated from construction activities will be predominantly confined within the project site. Impacts due to these activities would be short-term in nature and localised.
7.5.5 Construction Workers Camp
Construction phase requires large work force. To ensure that there is no strain on the existing infrastructure, worker camps will be self-sufficient and would not relay on local resource. This would also ensure that there will be no conflict with the local population. Further the worker camp will be located well within the project boundary. The basic infrastructure facilities like water supply, sanitation, power supply etc., will be provided in the workers camp. And it is also suggested that the proponent may requested to take locals for work and may provide employment.
7.5.6 Employment Potential
The total employment generation due to the proposed project can be primarily divided into two categories, direct employment and indirect employment. During the construction phase a total of 1200 employees will get employment. This include Skilled (Engineers and other officials), semiskilled and unskilled labour. The local employment could be higher for unskilled labour due to the availability of this category at local level. And it is suggested to take the educated and uneducated locals for employment in the proposed project. The unskilled labours can be given skill development training in order to fill the unemployment around the study and project area.
It is likely to generate direct employment of 30,800 and 2.5 times of direct employment as indirect employment during operation phase. The employment potential is very strong as it will shift the focus from primary sector. It will be helpful in generation of skill development.
7.5.7 Impact on Fisheries/Fishing Activity
Development of outfall facility may change habitats physical and chemical parameters such as water temperature and suspended sediment concentration. Alterations to physical characteristics of the coastal ecosystems may affect biological parameters, such as the composition, distribution, abundance of shellfish and submerged aquatic vegetation and impact aquatic food webs.
Obtaining Environmental Clearance and CFE for Nakkapalli Industrial Park C1181301 Final EIA/EMP Report RP005 rev. A
Chapter 7 Additional Studies Page 7-93
There are sub-habitats in marine realm and accordingly fish composition may vary and their different life stages have strong relationship with the habitats. Differences in temperature and habitat modification may alter the species composition. This is equally valid for non-fish organisms/invertebrates on which food chain of fishes largely dependent.
The impact of fishermen community and their livelihoods from fishing depends on the impact on resources and possible access limitation. The efforts were made to assess the impacts on the fishermen due to treated wastewater discharge facility. The proposed project integrates adequate improved mitigation measures in the project design to mitigate the impacts due to marine outfall.
The mathematical model study indicates that the dispersion of effluent is very fast due to the depth at which the effluent is discharged. The plume is confined to water depth greater than 12m MSL. The dispersion of effluents is controlled by the prevailing currents and no movement of plume is observed towards north or south or towards the shore. It is recommended that monitoring of fish larvae and plankton availability, distribution and movement pattern near outfall location to be monitored.
Signboards will be displayed at operational activities in order to make fishermen aware of the on-going activities. Necessary marker buoys shall be installed along the alignment of the outfall pipeline. Interactions shall be initiated with the fishing community about the marker buoys indicating the areas of operation so that they may avoid those areas during the construction and operation.
7.5.8 Public Health and Safety
The industries proposed to be developed in the Industrial Park will adopt suitable safety/mitigation measures and procedures during the operation of these industries.
Industrial wastewater shall be treated in the proposed CETPs up to discharge standards and through marine outfall discharging into sea. Industrial wastewater shall be treated within industry premise and treated wastewater will be reused within the industry. Air pollution generating industries shall be using the air pollution control equipment and the pollution level shall be monitored by APPCB or appropriate authority or government appointed authorised agencies. Compliance report shall be sent to APPCB/Government on a regular basis in order to check and may suggest suitable measures. No objection Certificate from Andhra Pradesh pollution Control Board (APPCB) were obtained for marine outfall for treated wastewater from proposed CETP is given as Appendix N.
The solid waste generated from the proposed project will be segregated as Municipal waste, Hazardous waste & E-Waste. Municipal waste generated will be disposed to local bins for further treatment and disposal. Individual industries generating hazardous waste shall be sent through authorized waste handler for further treatment and disposal. E-Waste generated will be collected, stored and transported to authorised recyclers.
An effective Disaster Management Plan (DMP) which includes Onsite and Offsite emergency plan shall also be prepared and will be followed to minimize the probability of occurrence of emergency situations and mitigate the impacts. However, as it is costal lane project, the proponent has to provide safety and mitigation measure to the employees, local population and commuters.
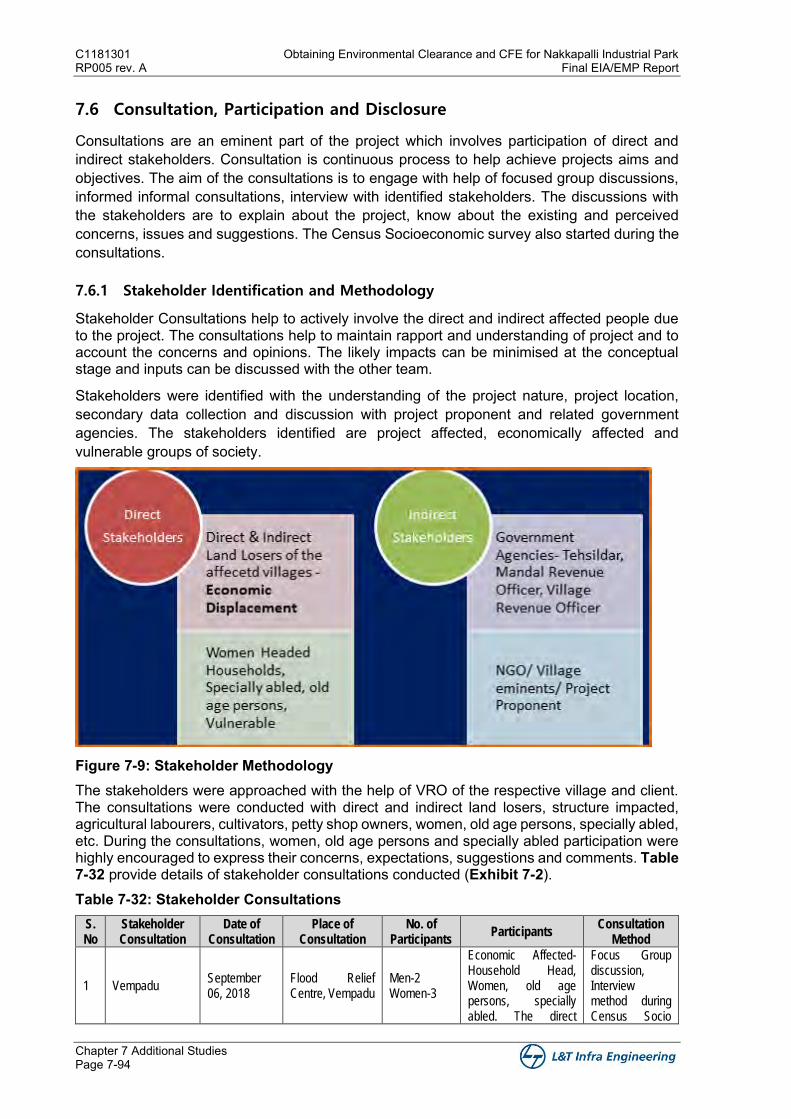
C1181301 Obtaining Environmental Clearance and CFE for Nakkapalli Industrial Park RP005 rev. A Final EIA/EMP Report
Chapter 7 Additional Studies Page 7-94
7.6 Consultation, Participation and Disclosure
Consultations are an eminent part of the project which involves participation of direct and indirect stakeholders. Consultation is continuous process to help achieve projects aims and objectives. The aim of the consultations is to engage with help of focused group discussions, informed informal consultations, interview with identified stakeholders. The discussions with the stakeholders are to explain about the project, know about the existing and perceived concerns, issues and suggestions. The Census Socioeconomic survey also started during the consultations.
7.6.1 Stakeholder Identification and Methodology
Stakeholder Consultations help to actively involve the direct and indirect affected people due to the project. The consultations help to maintain rapport and understanding of project and to account the concerns and opinions. The likely impacts can be minimised at the conceptual stage and inputs can be discussed with the other team.
Stakeholders were identified with the understanding of the project nature, project location, secondary data collection and discussion with project proponent and related government agencies. The stakeholders identified are project affected, economically affected and vulnerable groups of society.
Figure 7-9: Stakeholder Methodology The stakeholders were approached with the help of VRO of the respective village and client. The consultations were conducted with direct and indirect land losers, structure impacted, agricultural labourers, cultivators, petty shop owners, women, old age persons, specially abled, etc. During the consultations, women, old age persons and specially abled participation were highly encouraged to express their concerns, expectations, suggestions and comments. Table 7-32 provide details of stakeholder consultations conducted (Exhibit 7-2). Table 7-32: Stakeholder Consultations
S. No
Stakeholder Consultation
Date of Consultation
Place of Consultation
No. of Participants
Participants Consultation
Method
1 Vempadu September 06, 2018
Flood Relief Centre, Vempadu
Men-2 Women-3
Economic Affected- Household Head, Women, old age persons, specially abled. The direct
Focus Group discussion, Interview method during Census Socio
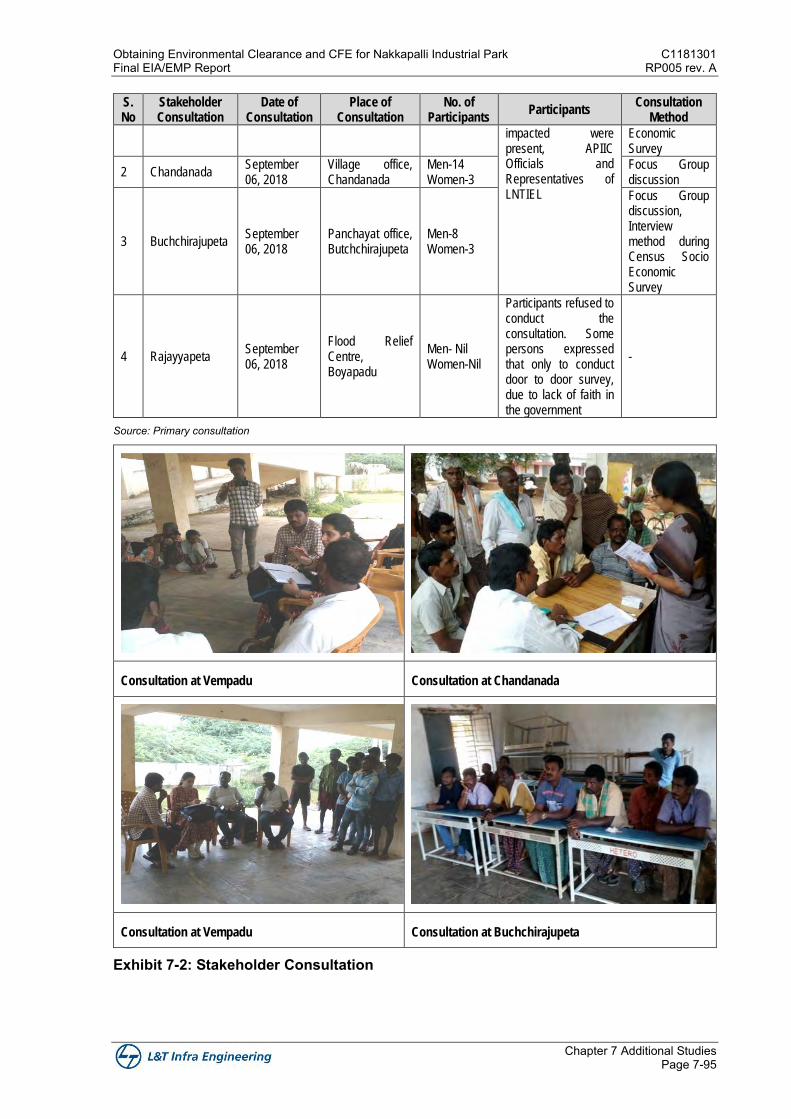
Obtaining Environmental Clearance and CFE for Nakkapalli Industrial Park C1181301 Final EIA/EMP Report RP005 rev. A
Chapter 7 Additional Studies Page 7-95
S. No
Stakeholder Consultation
Date of Consultation
Place of Consultation
No. of Participants
Participants Consultation
Method
impacted were present, APIIC Officials and Representatives of LNTIEL
Economic Survey
2 Chandanada September 06, 2018
Village office, Chandanada
Men-14 Women-3
Focus Group discussion
3 Buchchirajupeta September 06, 2018
Panchayat office, Butchchirajupeta
Men-8 Women-3
Focus Group discussion, Interview method during Census Socio Economic Survey
4 Rajayyapeta September 06, 2018
Flood Relief Centre, Boyapadu
Men- Nil Women-Nil
Participants refused to conduct the consultation. Some persons expressed that only to conduct door to door survey, due to lack of faith in the government
-
Source: Primary consultation
Consultation at Vempadu Consultation at Chandanada
Consultation at Vempadu Consultation at Buchchirajupeta
Exhibit 7-2: Stakeholder Consultation
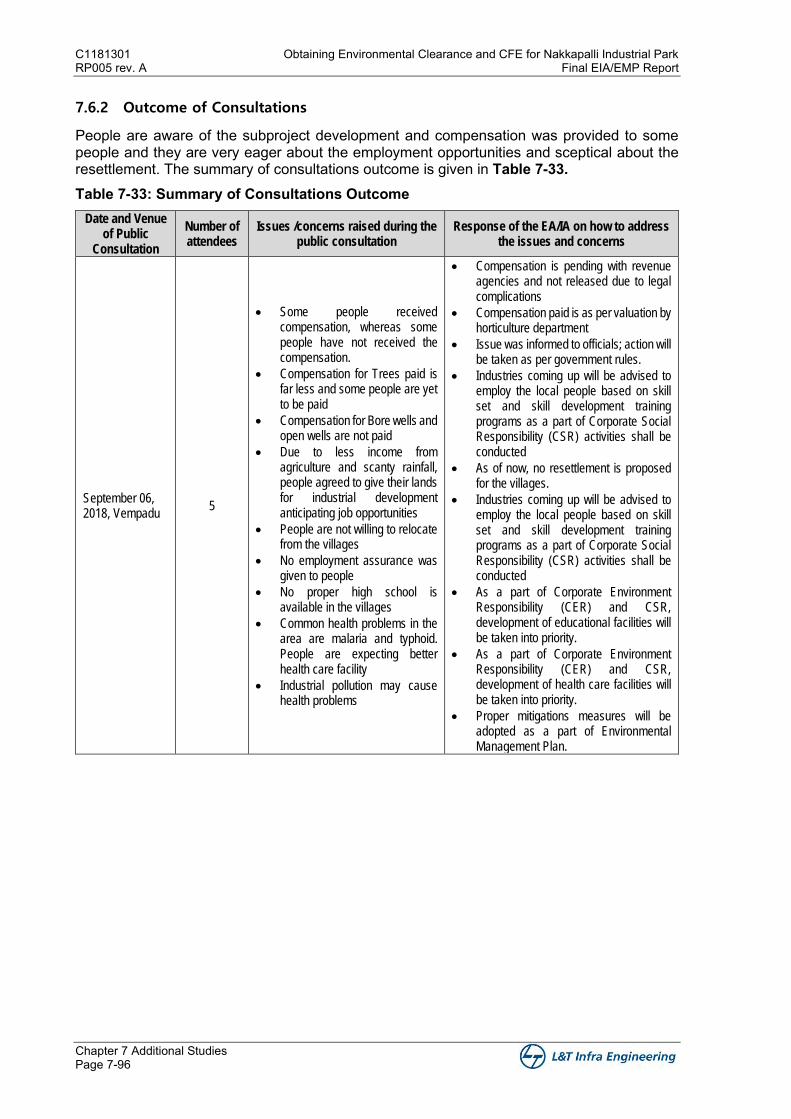
C1181301 Obtaining Environmental Clearance and CFE for Nakkapalli Industrial Park RP005 rev. A Final EIA/EMP Report
Chapter 7 Additional Studies Page 7-96
7.6.2 Outcome of Consultations
People are aware of the subproject development and compensation was provided to some people and they are very eager about the employment opportunities and sceptical about the resettlement. The summary of consultations outcome is given in Table 7-33. Table 7-33: Summary of Consultations Outcome
Date and Venue of Public
Consultation
Number of attendees
Issues /concerns raised during the public consultation
Response of the EA/IA on how to address the issues and concerns
September 06, 2018, Vempadu
5
• Some people received compensation, whereas some people have not received the compensation.
• Compensation for Trees paid is far less and some people are yet to be paid
• Compensation for Bore wells and open wells are not paid
• Due to less income from agriculture and scanty rainfall, people agreed to give their lands for industrial development anticipating job opportunities
• People are not willing to relocate from the villages
• No employment assurance was given to people
• No proper high school is available in the villages
• Common health problems in the area are malaria and typhoid. People are expecting better health care facility
• Industrial pollution may cause health problems
• Compensation is pending with revenue agencies and not released due to legal complications
• Compensation paid is as per valuation by horticulture department
• Issue was informed to officials; action will be taken as per government rules.
• Industries coming up will be advised to employ the local people based on skill set and skill development training programs as a part of Corporate Social Responsibility (CSR) activities shall be conducted
• As of now, no resettlement is proposed for the villages.
• Industries coming up will be advised to employ the local people based on skill set and skill development training programs as a part of Corporate Social Responsibility (CSR) activities shall be conducted
• As a part of Corporate Environment Responsibility (CER) and CSR, development of educational facilities will be taken into priority.
• As a part of Corporate Environment Responsibility (CER) and CSR, development of health care facilities will be taken into priority.
• Proper mitigations measures will be adopted as a part of Environmental Management Plan.

Chapter 8
Project Benefits

Obtaining Environmental Clearance and CFE for Nakkapalli Industrial Park C1181301 Final EIA/EMP Report RP005 rev. A
Chapter 8 Project Benefits Page 8-1
Chapter 8 Project Benefits
8.1 Infrastructure Facilities
There will be probable increase in the infrastructure resources due to the project in the region by the way of additional/improved transport, communication, health facilities and other basic facilities being created. Creation of new infrastructure or up gradation of the existing infrastructure is likely to create a boost to the local economy and enhance the quality of life of the people living in the project region.
8.1.1 Physical and Social Infrastructure
The demand on the infrastructure facilities in the surrounding villages due to the proposed project and the influx of migrants can create a lot of pressure on existing infrastructure such as Water and Sewerage, Solid Waste Management System and Social infrastructures such as Education Facilities, Health Facilities, etc.
In order to meet the additional strain on existing infrastructure, residential area and amenities are proposed in IP premises which will cater to the needs of employees of the industries such as schools, food courts, canteens, restaurants, banks/ATMs, postal services, convenience shops, fuel station, health care facilities, commercial activities and recreational/entertainment facilities. etc. The proposed fire stations shall serve the region and other nearby settlements/villages/towns. Dedicated water supply and SST is proposed for the I.P and hence strain on existing water sources is minimised.
8.2 Induced Development
8.2.1 National Overview
As per the second advance estimates (2nd AE) of national income released by Central Statistics Office, the growth of GDP at constant (2011-12) market prices for the year.
India has one of the fastest growing service sectors in the world with an annual growth rate above 9% during the last 11-year period from 2001 to 2012, Gross Value Added (GVA) at current prices for the services sector is estimated at 96.54 lakh crore INR in 2020-21. The services sector accounts for 53.89% of total India's GVA of 179.15 lakh crore Indian rupees.
The Central Statistics Office (CSO) has estimated the GDP growth to be 6.8% in 2018-19 as compared to 7.2% in 2017-18. The GDP growth in 2016-17 was 8.2%. In 2018-19, the agriculture and industry sectors are expected to grow at 2.9% and 6.9% respectively, while the service sector is estimated to grow at 7.5%17.
Agriculture and food management: Growth of agriculture sector has been fluctuating; it increased from -0.2% in 2014-15 to 6.3% in 2016-17, and then declined to 2.9% in 2018-19. Gross fixed capital formation in agriculture has decreased from 17.7% in 2013-14 to 15.2% in 2017-18. The contribution of agriculture to the GVA has decreased from 15% in 2015-16 to 14.4% in 2018-19. The decline was mainly due to decrease in share of GVA of crops from 9.2% in 2015-16 to 8.7% in 2017-18.
17 https://www.prsindia.org/sites/default/files/parliament_or_policy_pdfs/Economic%20Survey%202018-19%20Summary-%20To%20Upload.pdf
C1181301 Obtaining Environmental Clearance and CFE for Nakkapalli Industrial Park RP005 rev. A Final EIA/EMP Report
Chapter 8 Project Benefits Page 8-2
Industrial growth: The overall industrial sector growth was 6.9% as per the estimate of national income for 2018-19. This was higher than the industrial growth in 2017-18 at 5.9%. The manufacturing sector experienced a growth of 6.9% during 2018-19. The contribution of industry to the GVA was 29.6% in 2018-19.
Infrastructure: The infrastructure sector has become the biggest focus area for the Government of India. India plans to spend US$ 1.4 trillion on infrastructure during 2019-23 to have a sustainable development of the country. The Government has suggested investment of Rs. 5,000,000 crore (US$ 750 billion) for railways infrastructure from 2018-30.. As per the current trend, India can raise around USD 3.9 trillion. There is an earnest need to build the progression of private capital into framework. Private interest in framework basically comes as PPPs. However, the sector has been facing challenges due to lack of dispute resolution.
Demographic trends and employment: The annual population growth rate is set to decline from 1.1% in 2011-21 to 0.5% in 2031-41. Given changing age composition, India’s working-age population (people between 15 and 64 years of age) has grown larger than the dependant population. This bulge in the working-age population is going to last till 2055, or 37 years from its beginning. This will have implications for the required job creation in the economy. Further, life expectancy for men and women is expected to increase in India. Therefore, increasing the retirement age could be considered to keep the pension system viable.
Employment: During 2017-18, the unemployment rate was at 6.1%. Formal employment (number of subscribers to the major social security schemes such as Employees Provident Fund Scheme, and National Pension Scheme) increased from 4.9 lakh in February 2018 to 8.2 lakh in March 2019.18
The growth rate in exports is at its fast pace. Large scale development within the country will enhance the national economy. It will generate business opportunities at the national level and enhance new prospects.
8.2.2 Regional & Local Overview
There are 19 operational special economic zones in the state. The magnitude of progress of the state can be analysed with its GSDP ₹152.53 lakh crore (US$130 billion)19, GSDP Growth 10.4% (2017-18). GSDP sector wise share is Agriculture 18%, Industry 17.8% and Services (65%). The proposed project is expected to generate economic prospects in the state and surrounding areas. The increased economic growth will lead to investment from other states as well as globally. It will help in enhancing the state’s name on the national as well as global level.
The proposed Industrial Park is expected to bring several benefits in the region as well lead to the development of the country. Some of the expected benefits are:
• Benefits may be realized in terms of upcoming industries and its allied ancillary units Generation of varied direct and indirect employment catering to the available skilled and unskilled manpower in the surrounding region
• Provision of skill development activities to the employable youth in the region, thereby generating opportunities for fruitful income
• Newer Income generation resources • Increase in trade activities
18 https://www.prsindia.org/sites/default/files/parliament_or_policy_pdfs/Economic%20Survey%202018-19%20Summary-%20To%20Upload.pdf 19 Source: PRS Legislative Research. Retrieved 19 March 2018
Obtaining Environmental Clearance and CFE for Nakkapalli Industrial Park C1181301 Final EIA/EMP Report RP005 rev. A
Chapter 8 Project Benefits Page 8-3
• Increase in Foreign Direct Investment • Technology transfer • State of the art infrastructure for working • Manpower to increase from low productive activities to high productive activities • Regional business to be diversified • Shifting activities from unorganized to organized sector • Sustainable development • Enhanced local consumption • Increase in living standards • Increase in savings and increased purchasing power
8.3 Economic Impact of the Industrial Park
The Economic impact for the Industrial Park in terms of output, investments, employment and exports will be experienced in 25 years after the complete industrial plotted land is absorbed and all the industrial units commence production, is about Rs. 1 lakh Crores.
8.4 Generation of Employment
The upcoming industrial park is expected to bring ample of employment opportunities and business options. It is expected that once the industrial park will be fully operation it will bring direct employment of 30,800 and 2.5 times of direct employment as indirect employment. The employment opportunities will be in highly skilled to unskilled labour category. Many business opportunities such as transport, courier, petty shops, residential and commercial requirements shops etc. will be required. Many opportunities could be explored in the region.
8.5 Enhanced Local Infrastructure
The proposed project will enhance the local infrastructure of the region. The road network is proposed to be increased, communication facilities such as telecommunication, internet, networking to be upgraded. There will be increase in the infrastructure resources due to the project in the region such as additional/improved transport and other basic facilities being created. The proposed project thus will cater to the growing demand-supply gap further acting as catalyst to industrialization and urbanization of the region. Implementation of the project thus is expected to benefit the region.
8.6 Enhanced Social Infrastructure
The proposed project aims at overall development of the area. The social infrastructure of the area will be enhanced by state-of-the-art facilities of educational institute, health care facility, hospitality, residential areas and many more. The development may lead to many newer residential areas, educational institutes, health facilities to be established around. The potential for development will increase manifolds.
8.7 Training Facility
The locals will be given training for different types of employment options as per the training suggested. The locals are literate, but many are not qualified for the skilled jobs and illiterate people will be provided with training. The training increases the possibility for acquiring the job opportunity.
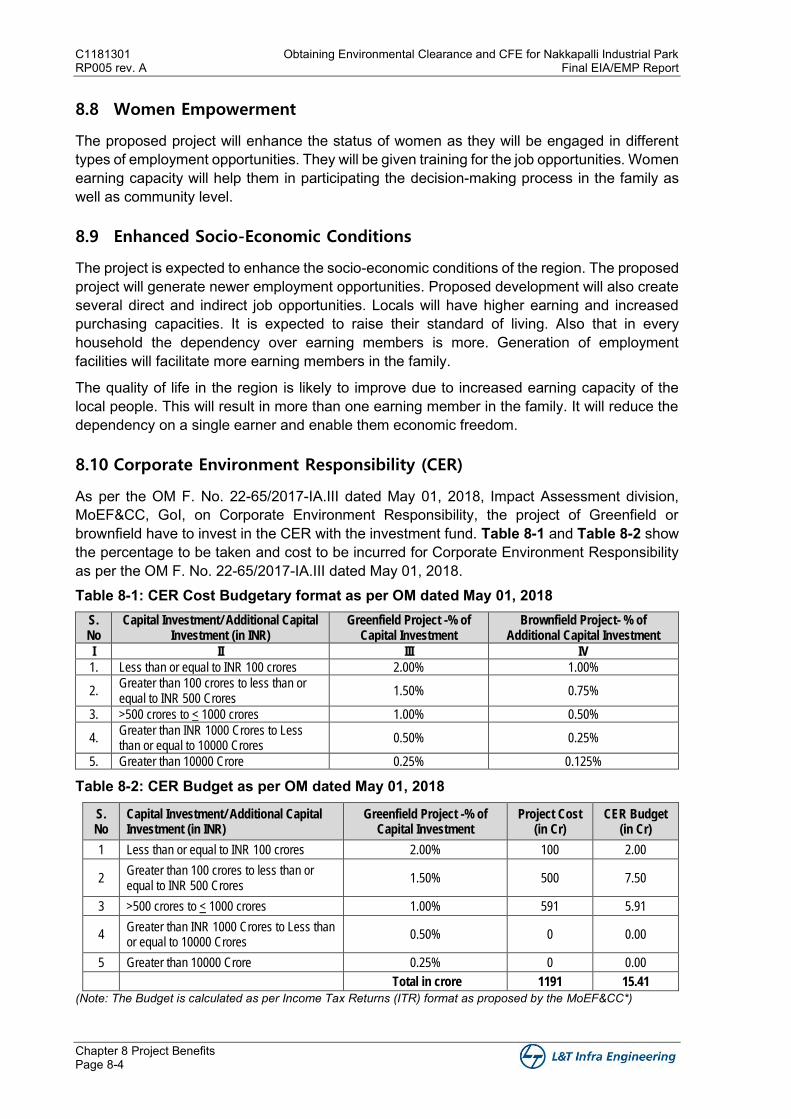
C1181301 Obtaining Environmental Clearance and CFE for Nakkapalli Industrial Park RP005 rev. A Final EIA/EMP Report
Chapter 8 Project Benefits Page 8-4
8.8 Women Empowerment
The proposed project will enhance the status of women as they will be engaged in different types of employment opportunities. They will be given training for the job opportunities. Women earning capacity will help them in participating the decision-making process in the family as well as community level.
8.9 Enhanced Socio-Economic Conditions
The project is expected to enhance the socio-economic conditions of the region. The proposed project will generate newer employment opportunities. Proposed development will also create several direct and indirect job opportunities. Locals will have higher earning and increased purchasing capacities. It is expected to raise their standard of living. Also that in every household the dependency over earning members is more. Generation of employment facilities will facilitate more earning members in the family.
The quality of life in the region is likely to improve due to increased earning capacity of the local people. This will result in more than one earning member in the family. It will reduce the dependency on a single earner and enable them economic freedom.
8.10 Corporate Environment Responsibility (CER)
As per the OM F. No. 22-65/2017-IA.III dated May 01, 2018, Impact Assessment division, MoEF&CC, GoI, on Corporate Environment Responsibility, the project of Greenfield or brownfield have to invest in the CER with the investment fund. Table 8-1 and Table 8-2 show the percentage to be taken and cost to be incurred for Corporate Environment Responsibility as per the OM F. No. 22-65/2017-IA.III dated May 01, 2018. Table 8-1: CER Cost Budgetary format as per OM dated May 01, 2018
S. No
Capital Investment/ Additional Capital Investment (in INR)
Greenfield Project -% of Capital Investment
Brownfield Project- % of Additional Capital Investment
I II III IV
1. Less than or equal to INR 100 crores 2.00% 1.00%
2. Greater than 100 crores to less than or equal to INR 500 Crores
1.50% 0.75%
3. >500 crores to < 1000 crores 1.00% 0.50%
4. Greater than INR 1000 Crores to Less than or equal to 10000 Crores
0.50% 0.25%
5. Greater than 10000 Crore 0.25% 0.125%
Table 8-2: CER Budget as per OM dated May 01, 2018
S. No
Capital Investment/ Additional Capital Investment (in INR)
Greenfield Project -% of Capital Investment
Project Cost (in Cr)
CER Budget (in Cr)
1 Less than or equal to INR 100 crores 2.00% 100 2.00
2 Greater than 100 crores to less than or equal to INR 500 Crores
1.50% 500 7.50
3 >500 crores to < 1000 crores 1.00% 591 5.91
4 Greater than INR 1000 Crores to Less than or equal to 10000 Crores
0.50% 0 0.00
5 Greater than 10000 Crore 0.25% 0 0.00 Total in crore 1191 15.41
(Note: The Budget is calculated as per Income Tax Returns (ITR) format as proposed by the MoEF&CC*)
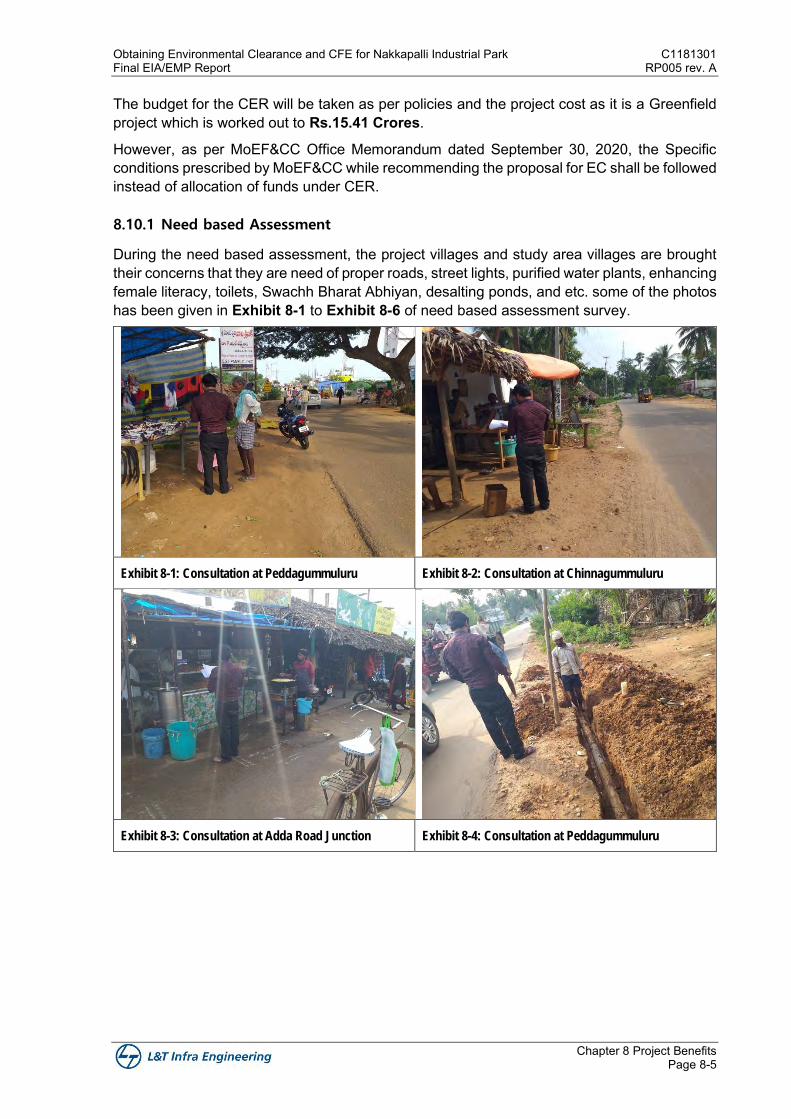
Obtaining Environmental Clearance and CFE for Nakkapalli Industrial Park C1181301 Final EIA/EMP Report RP005 rev. A
Chapter 8 Project Benefits Page 8-5
The budget for the CER will be taken as per policies and the project cost as it is a Greenfield project which is worked out to Rs.15.41 Crores.
However, as per MoEF&CC Office Memorandum dated September 30, 2020, the Specific conditions prescribed by MoEF&CC while recommending the proposal for EC shall be followed instead of allocation of funds under CER.
8.10.1 Need based Assessment
During the need based assessment, the project villages and study area villages are brought their concerns that they are need of proper roads, street lights, purified water plants, enhancing female literacy, toilets, Swachh Bharat Abhiyan, desalting ponds, and etc. some of the photos has been given in Exhibit 8-1 to Exhibit 8-6 of need based assessment survey.
Exhibit 8-1: Consultation at Peddagummuluru Exhibit 8-2: Consultation at Chinnagummuluru
Exhibit 8-3: Consultation at Adda Road Junction Exhibit 8-4: Consultation at Peddagummuluru
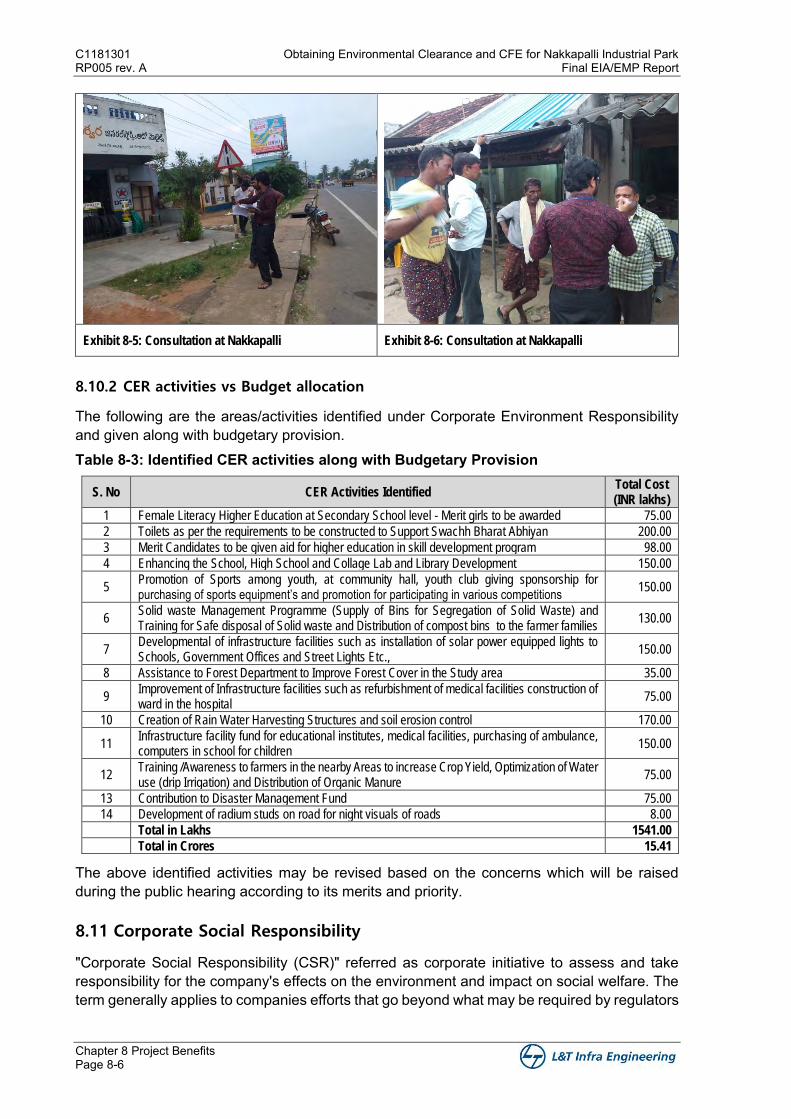
C1181301 Obtaining Environmental Clearance and CFE for Nakkapalli Industrial Park RP005 rev. A Final EIA/EMP Report
Chapter 8 Project Benefits Page 8-6
Exhibit 8-5: Consultation at Nakkapalli Exhibit 8-6: Consultation at Nakkapalli
8.10.2 CER activities vs Budget allocation
The following are the areas/activities identified under Corporate Environment Responsibility and given along with budgetary provision. Table 8-3: Identified CER activities along with Budgetary Provision
S. No CER Activities Identified Total Cost (INR lakhs)
1 Female Literacy Higher Education at Secondary School level - Merit girls to be awarded 75.00
2 Toilets as per the requirements to be constructed to Support Swachh Bharat Abhiyan 200.00
3 Merit Candidates to be given aid for higher education in skill development program 98.00
4 Enhancing the School, High School and Collage Lab and Library Development 150.00
5 Promotion of Sports among youth, at community hall, youth club giving sponsorship for purchasing of sports equipment’s and promotion for participating in various competitions
150.00
6 Solid waste Management Programme (Supply of Bins for Segregation of Solid Waste) and Training for Safe disposal of Solid waste and Distribution of compost bins to the farmer families
130.00
7 Developmental of infrastructure facilities such as installation of solar power equipped lights to Schools, Government Offices and Street Lights Etc.,
150.00
8 Assistance to Forest Department to Improve Forest Cover in the Study area 35.00
9 Improvement of Infrastructure facilities such as refurbishment of medical facilities construction of ward in the hospital
75.00
10 Creation of Rain Water Harvesting Structures and soil erosion control 170.00
11 Infrastructure facility fund for educational institutes, medical facilities, purchasing of ambulance, computers in school for children
150.00
12 Training /Awareness to farmers in the nearby Areas to increase Crop Yield, Optimization of Water use (drip Irrigation) and Distribution of Organic Manure
75.00
13 Contribution to Disaster Management Fund 75.00
14 Development of radium studs on road for night visuals of roads 8.00 Total in Lakhs 1541.00 Total in Crores 15.41
The above identified activities may be revised based on the concerns which will be raised during the public hearing according to its merits and priority.
8.11 Corporate Social Responsibility
"Corporate Social Responsibility (CSR)" referred as corporate initiative to assess and take responsibility for the company's effects on the environment and impact on social welfare. The term generally applies to companies efforts that go beyond what may be required by regulators
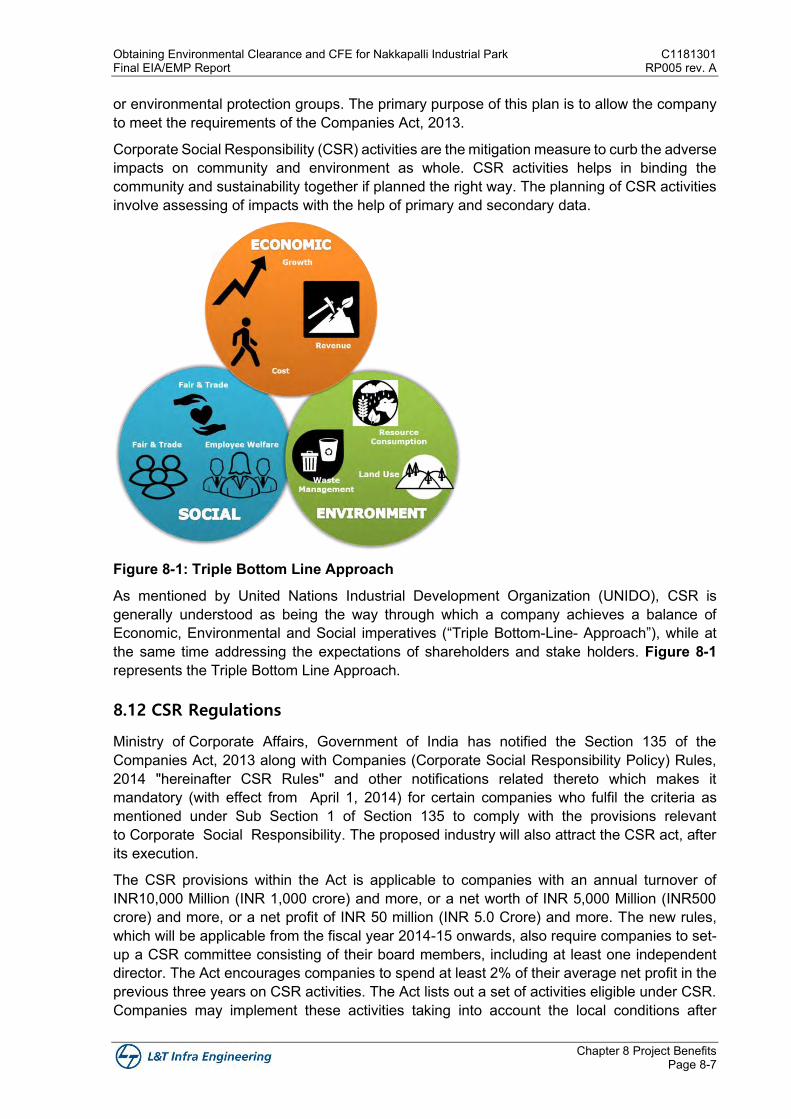
Obtaining Environmental Clearance and CFE for Nakkapalli Industrial Park C1181301 Final EIA/EMP Report RP005 rev. A
Chapter 8 Project Benefits Page 8-7
or environmental protection groups. The primary purpose of this plan is to allow the company to meet the requirements of the Companies Act, 2013.
Corporate Social Responsibility (CSR) activities are the mitigation measure to curb the adverse impacts on community and environment as whole. CSR activities helps in binding the community and sustainability together if planned the right way. The planning of CSR activities involve assessing of impacts with the help of primary and secondary data.
Figure 8-1: Triple Bottom Line Approach
As mentioned by United Nations Industrial Development Organization (UNIDO), CSR is generally understood as being the way through which a company achieves a balance of Economic, Environmental and Social imperatives (“Triple Bottom-Line- Approach”), while at the same time addressing the expectations of shareholders and stake holders. Figure 8-1 represents the Triple Bottom Line Approach.
8.12 CSR Regulations
Ministry of Corporate Affairs, Government of India has notified the Section 135 of the Companies Act, 2013 along with Companies (Corporate Social Responsibility Policy) Rules, 2014 "hereinafter CSR Rules" and other notifications related thereto which makes it mandatory (with effect from April 1, 2014) for certain companies who fulfil the criteria as mentioned under Sub Section 1 of Section 135 to comply with the provisions relevant to Corporate Social Responsibility. The proposed industry will also attract the CSR act, after its execution.
The CSR provisions within the Act is applicable to companies with an annual turnover of INR10,000 Million (INR 1,000 crore) and more, or a net worth of INR 5,000 Million (INR500 crore) and more, or a net profit of INR 50 million (INR 5.0 Crore) and more. The new rules, which will be applicable from the fiscal year 2014-15 onwards, also require companies to set-up a CSR committee consisting of their board members, including at least one independent director. The Act encourages companies to spend at least 2% of their average net profit in the previous three years on CSR activities. The Act lists out a set of activities eligible under CSR. Companies may implement these activities taking into account the local conditions after
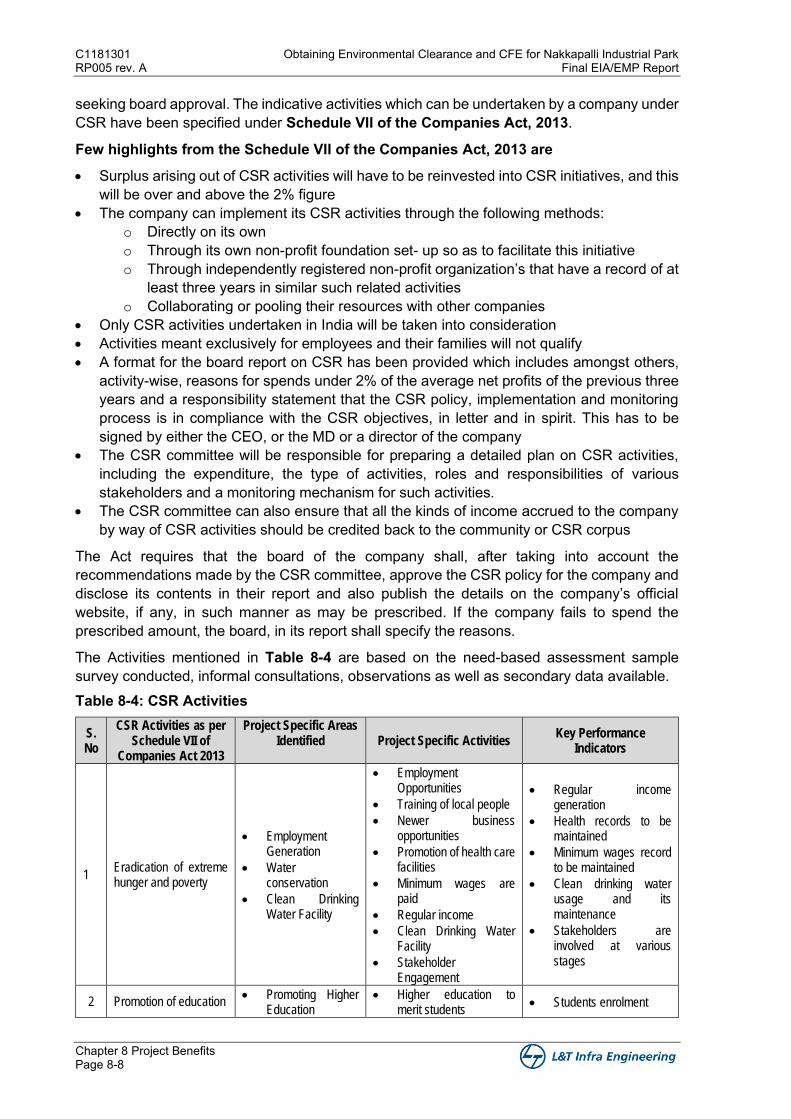
C1181301 Obtaining Environmental Clearance and CFE for Nakkapalli Industrial Park RP005 rev. A Final EIA/EMP Report
Chapter 8 Project Benefits Page 8-8
seeking board approval. The indicative activities which can be undertaken by a company under CSR have been specified under Schedule VII of the Companies Act, 2013.
Few highlights from the Schedule VII of the Companies Act, 2013 are
• Surplus arising out of CSR activities will have to be reinvested into CSR initiatives, and this will be over and above the 2% figure
• The company can implement its CSR activities through the following methods: o Directly on its own o Through its own non-profit foundation set- up so as to facilitate this initiative o Through independently registered non-profit organization’s that have a record of at
least three years in similar such related activities o Collaborating or pooling their resources with other companies
• Only CSR activities undertaken in India will be taken into consideration • Activities meant exclusively for employees and their families will not qualify • A format for the board report on CSR has been provided which includes amongst others,
activity-wise, reasons for spends under 2% of the average net profits of the previous three years and a responsibility statement that the CSR policy, implementation and monitoring process is in compliance with the CSR objectives, in letter and in spirit. This has to be signed by either the CEO, or the MD or a director of the company
• The CSR committee will be responsible for preparing a detailed plan on CSR activities, including the expenditure, the type of activities, roles and responsibilities of various stakeholders and a monitoring mechanism for such activities.
• The CSR committee can also ensure that all the kinds of income accrued to the company by way of CSR activities should be credited back to the community or CSR corpus
The Act requires that the board of the company shall, after taking into account the recommendations made by the CSR committee, approve the CSR policy for the company and disclose its contents in their report and also publish the details on the company’s official website, if any, in such manner as may be prescribed. If the company fails to spend the prescribed amount, the board, in its report shall specify the reasons.
The Activities mentioned in Table 8-4 are based on the need-based assessment sample survey conducted, informal consultations, observations as well as secondary data available. Table 8-4: CSR Activities
S. No
CSR Activities as per Schedule VII of
Companies Act 2013
Project Specific Areas Identified
Project Specific Activities
Key Performance Indicators
1 Eradication of extreme hunger and poverty
• Employment Generation
• Water conservation
• Clean Drinking Water Facility
• Employment Opportunities
• Training of local people
• Newer business opportunities
• Promotion of health care facilities
• Minimum wages are paid
• Regular income
• Clean Drinking Water Facility
• Stakeholder Engagement
• Regular income generation
• Health records to be maintained
• Minimum wages record to be maintained
• Clean drinking water usage and its maintenance
• Stakeholders are involved at various stages
2 Promotion of education • Promoting Higher
Education • Higher education to
merit students • Students enrolment
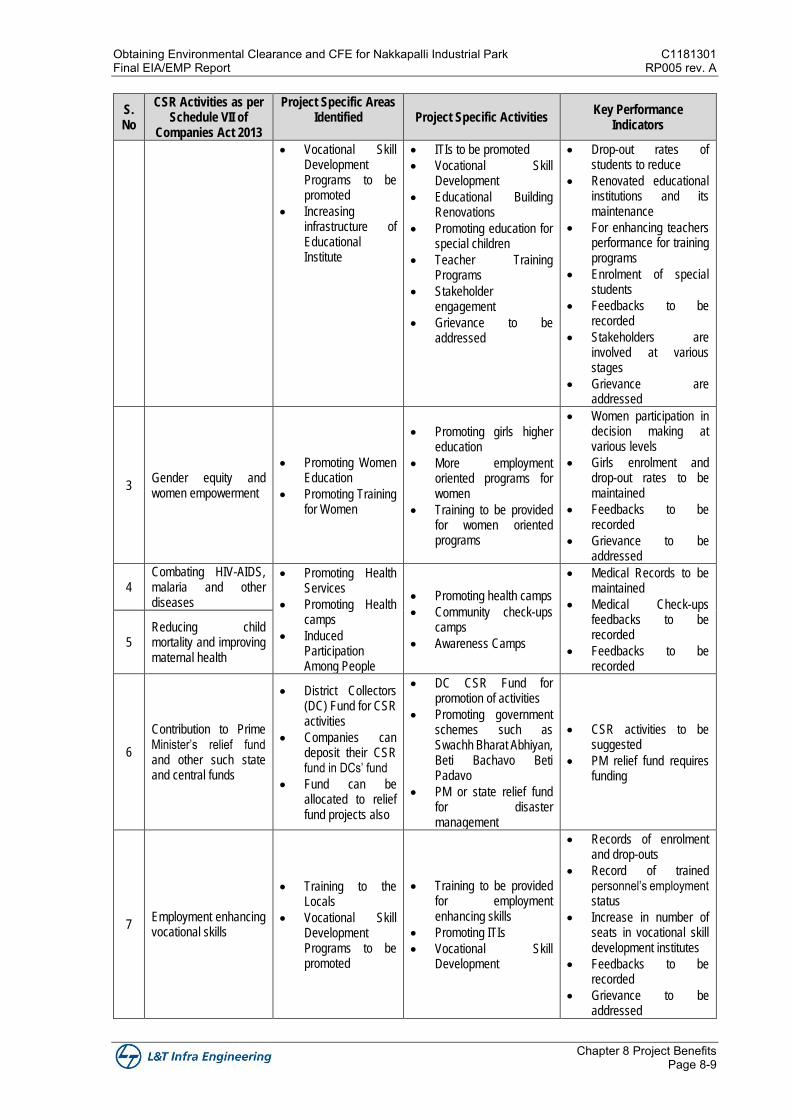
Obtaining Environmental Clearance and CFE for Nakkapalli Industrial Park C1181301 Final EIA/EMP Report RP005 rev. A
Chapter 8 Project Benefits Page 8-9
S. No
CSR Activities as per Schedule VII of
Companies Act 2013
Project Specific Areas Identified
Project Specific Activities
Key Performance Indicators
• Vocational Skill Development Programs to be promoted
• Increasing infrastructure of Educational Institute
• ITIs to be promoted
• Vocational Skill Development
• Educational Building Renovations
• Promoting education for special children
• Teacher Training Programs
• Stakeholder engagement
• Grievance to be addressed
• Drop-out rates of students to reduce
• Renovated educational institutions and its maintenance
• For enhancing teachers performance for training programs
• Enrolment of special students
• Feedbacks to be recorded
• Stakeholders are involved at various stages
• Grievance are addressed
3 Gender equity and women empowerment
• Promoting Women Education
• Promoting Training for Women
• Promoting girls higher education
• More employment oriented programs for women
• Training to be provided for women oriented programs
• Women participation in decision making at various levels
• Girls enrolment and drop-out rates to be maintained
• Feedbacks to be recorded
• Grievance to be addressed
4 Combating HIV-AIDS, malaria and other diseases
• Promoting Health Services
• Promoting Health camps
• Induced Participation Among People
• Promoting health camps
• Community check-ups camps
• Awareness Camps
• Medical Records to be maintained
• Medical Check-ups feedbacks to be recorded
• Feedbacks to be recorded
5 Reducing child mortality and improving maternal health
6
Contribution to Prime Minister’s relief fund and other such state and central funds
• District Collectors (DC) Fund for CSR activities
• Companies can deposit their CSR fund in DCs’ fund
• Fund can be allocated to relief fund projects also
• DC CSR Fund for promotion of activities
• Promoting government schemes such as Swachh Bharat Abhiyan, Beti Bachavo Beti Padavo
• PM or state relief fund for disaster management
• CSR activities to be suggested
• PM relief fund requires funding
7 Employment enhancing vocational skills
• Training to the Locals
• Vocational Skill Development Programs to be promoted
• Training to be provided for employment enhancing skills
• Promoting ITIs
• Vocational Skill Development
• Records of enrolment and drop-outs
• Record of trained personnel’s employment status
• Increase in number of seats in vocational skill development institutes
• Feedbacks to be recorded
• Grievance to be addressed
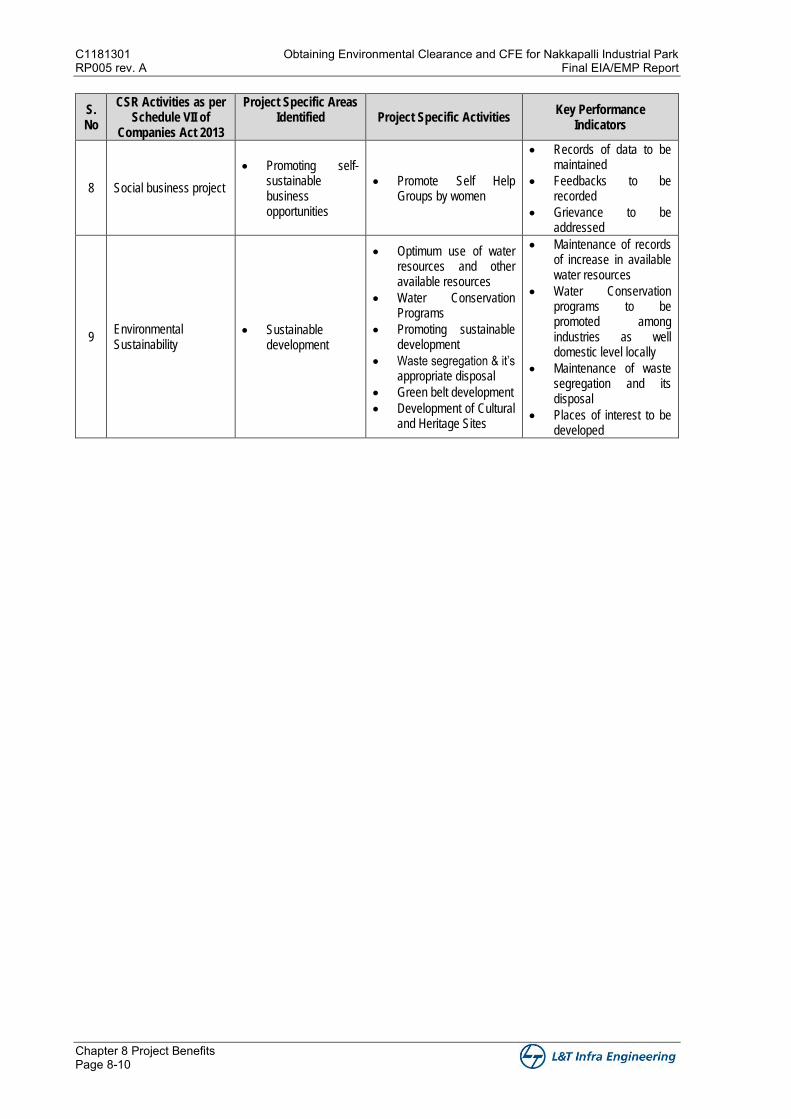
C1181301 Obtaining Environmental Clearance and CFE for Nakkapalli Industrial Park RP005 rev. A Final EIA/EMP Report
Chapter 8 Project Benefits Page 8-10
S. No
CSR Activities as per Schedule VII of
Companies Act 2013
Project Specific Areas Identified
Project Specific Activities
Key Performance Indicators
8 Social business project
• Promoting self-sustainable business opportunities
• Promote Self Help Groups by women
• Records of data to be maintained
• Feedbacks to be recorded
• Grievance to be addressed
9 Environmental Sustainability
• Sustainable development
• Optimum use of water resources and other available resources
• Water Conservation Programs
• Promoting sustainable development
• Waste segregation & it’s appropriate disposal
• Green belt development
• Development of Cultural and Heritage Sites
• Maintenance of records of increase in available water resources
• Water Conservation programs to be promoted among industries as well domestic level locally
• Maintenance of waste segregation and its disposal
• Places of interest to be developed
Chapter 9 Environmental Management
Plan (EMP)

Obtaining Environmental Clearance and CFE for Nakkapalli Industrial Park C1181301 Final EIA/EMP Report RP005 rev. A
Chapter 9 Environment Management Plan Page 9-1
Chapter 9 Environment Management Plan
The main objectives of Environmental Management are to:
• Identify key environmental issues envisaged to be encountered during construction and operation phases of the project
• Provide guidelines for appropriate mitigation measures • Establish systems and procedures for implementing mitigation measures • Ensure that the mitigation measures are being implemented • Monitor the effectiveness of mitigation measures • Take necessary prompt action when unforeseen impacts occur
The anticipated environmental impacts and mitigation measures for each likely impact on the prevailing environment have been discussed in detail at the respective sections in Chapter 4. The Environmental Monitoring Programme for implementation of proposed mitigation
measures have been discussed in Chapter 6. Following specific environmental management plan/measures are discussed:
• Summary of project activities, associated impacts and mitigation measures • Administrative and Technical Setup for Environmental Management • Institutional arrangements/framework for environment management • Greenbelt development • Rainwater harvesting • Solar power harnessing • Occupational health and safety • Budgetary estimates during construction and operation phases
9.1 Components of EMP
9.1.1 Summary of Impacts and Mitigation Measures
Various project activities, associated impacts and mitigation measures are summarised in Table 9-1.
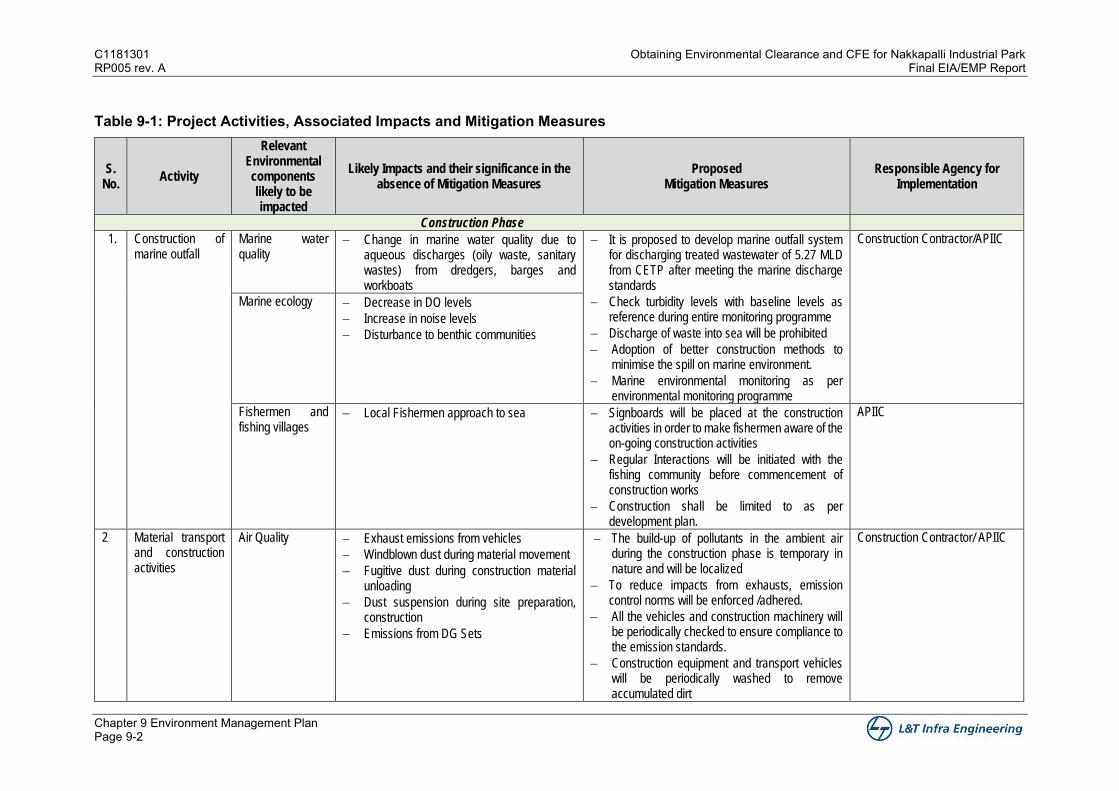
C1181301 Obtaining Environmental Clearance and CFE for Nakkapalli Industrial Park RP005 rev. A Final EIA/EMP Report
Chapter 9 Environment Management Plan Page 9-2
Table 9-1: Project Activities, Associated Impacts and Mitigation Measures
S. No.
Activity
Relevant Environmental components likely to be impacted
Likely Impacts and their significance in the absence of Mitigation Measures
Proposed Mitigation Measures
Responsible Agency for Implementation
Construction Phase
1. Construction of marine outfall
Marine water quality
− Change in marine water quality due to aqueous discharges (oily waste, sanitary wastes) from dredgers, barges and workboats
− It is proposed to develop marine outfall system for discharging treated wastewater of 5.27 MLD from CETP after meeting the marine discharge standards
− Check turbidity levels with baseline levels as reference during entire monitoring programme
− Discharge of waste into sea will be prohibited
− Adoption of better construction methods to minimise the spill on marine environment.
− Marine environmental monitoring as per environmental monitoring programme
Construction Contractor/APIIC
Marine ecology − Decrease in DO levels
− Increase in noise levels
− Disturbance to benthic communities
Fishermen and fishing villages
− Local Fishermen approach to sea
− Signboards will be placed at the construction activities in order to make fishermen aware of the on-going construction activities
− Regular Interactions will be initiated with the fishing community before commencement of construction works
− Construction shall be limited to as per development plan.
APIIC
2 Material transport and construction activities
Air Quality − Exhaust emissions from vehicles
− Windblown dust during material movement
− Fugitive dust during construction material unloading
− Dust suspension during site preparation, construction
− Emissions from DG Sets
− The build-up of pollutants in the ambient air during the construction phase is temporary in nature and will be localized
− To reduce impacts from exhausts, emission control norms will be enforced /adhered.
− All the vehicles and construction machinery will be periodically checked to ensure compliance to the emission standards.
− Construction equipment and transport vehicles will be periodically washed to remove accumulated dirt
Construction Contractor/ APIIC
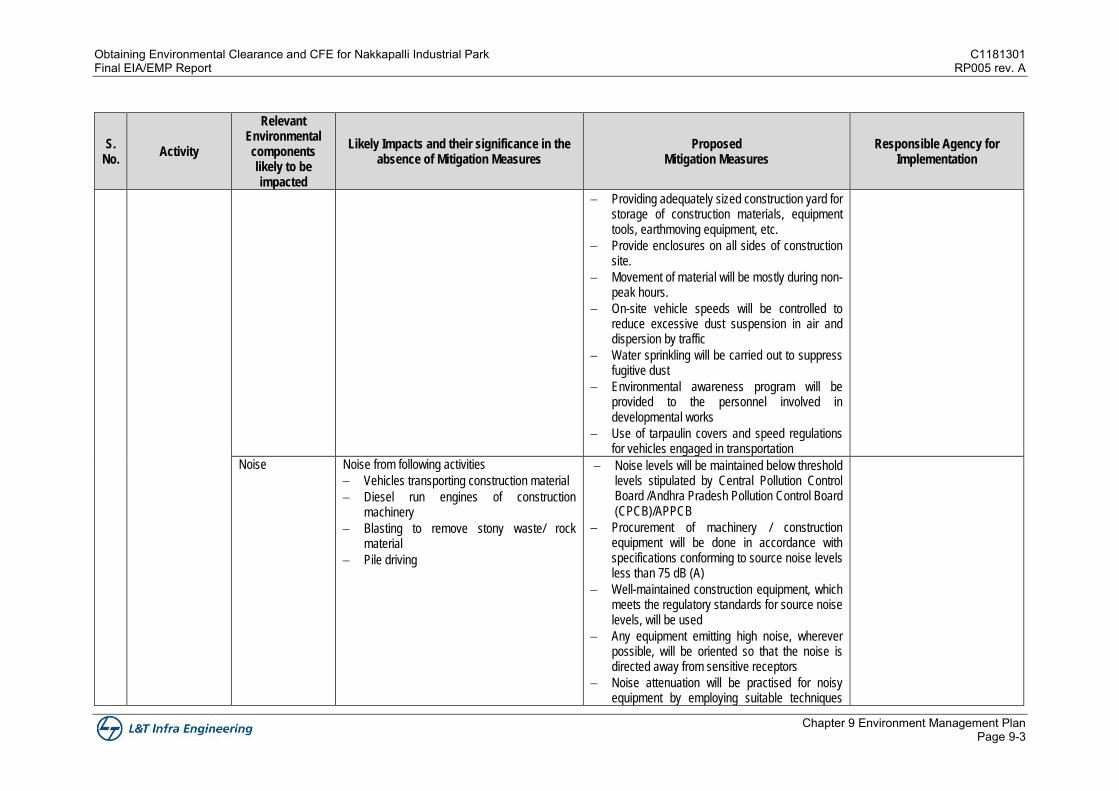
Obtaining Environmental Clearance and CFE for Nakkapalli Industrial Park C1181301 Final EIA/EMP Report RP005 rev. A
Chapter 9 Environment Management Plan Page 9-3
S. No.
Activity
Relevant Environmental components likely to be impacted
Likely Impacts and their significance in the absence of Mitigation Measures
Proposed Mitigation Measures
Responsible Agency for Implementation
− Providing adequately sized construction yard for storage of construction materials, equipment tools, earthmoving equipment, etc.
− Provide enclosures on all sides of construction site.
− Movement of material will be mostly during non-peak hours.
− On-site vehicle speeds will be controlled to reduce excessive dust suspension in air and dispersion by traffic
− Water sprinkling will be carried out to suppress fugitive dust
− Environmental awareness program will be provided to the personnel involved in developmental works
− Use of tarpaulin covers and speed regulations for vehicles engaged in transportation
Noise Noise from following activities
− Vehicles transporting construction material
− Diesel run engines of construction machinery
− Blasting to remove stony waste/ rock material
− Pile driving
− Noise levels will be maintained below threshold levels stipulated by Central Pollution Control Board /Andhra Pradesh Pollution Control Board (CPCB)/APPCB
− Procurement of machinery / construction equipment will be done in accordance with specifications conforming to source noise levels less than 75 dB (A)
− Well-maintained construction equipment, which meets the regulatory standards for source noise levels, will be used
− Any equipment emitting high noise, wherever possible, will be oriented so that the noise is directed away from sensitive receptors
− Noise attenuation will be practised for noisy equipment by employing suitable techniques
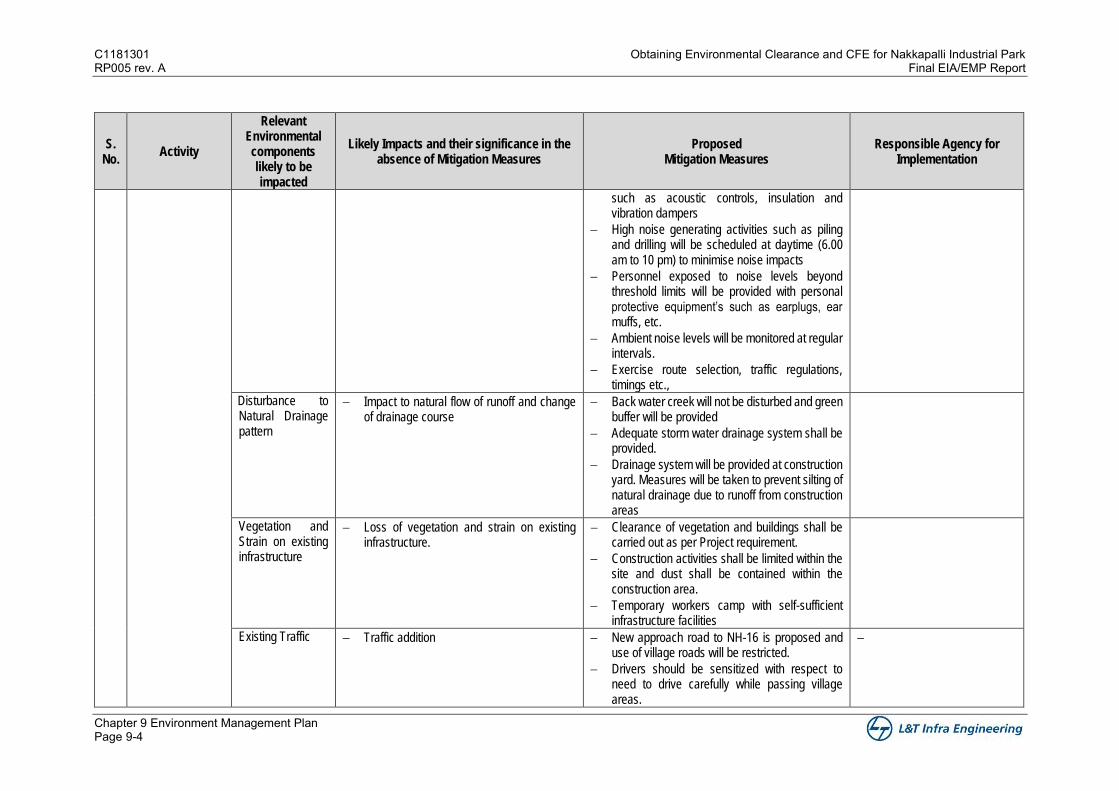
C1181301 Obtaining Environmental Clearance and CFE for Nakkapalli Industrial Park RP005 rev. A Final EIA/EMP Report
Chapter 9 Environment Management Plan Page 9-4
S. No.
Activity
Relevant Environmental components likely to be impacted
Likely Impacts and their significance in the absence of Mitigation Measures
Proposed Mitigation Measures
Responsible Agency for Implementation
such as acoustic controls, insulation and vibration dampers
− High noise generating activities such as piling and drilling will be scheduled at daytime (6.00 am to 10 pm) to minimise noise impacts
− Personnel exposed to noise levels beyond threshold limits will be provided with personal protective equipment’s such as earplugs, ear muffs, etc.
− Ambient noise levels will be monitored at regular intervals.
− Exercise route selection, traffic regulations, timings etc.,
Disturbance to Natural Drainage pattern
− Impact to natural flow of runoff and change of drainage course
− Back water creek will not be disturbed and green buffer will be provided
− Adequate storm water drainage system shall be provided.
− Drainage system will be provided at construction yard. Measures will be taken to prevent silting of natural drainage due to runoff from construction areas
Vegetation and Strain on existing infrastructure
− Loss of vegetation and strain on existing infrastructure.
− Clearance of vegetation and buildings shall be carried out as per Project requirement.
− Construction activities shall be limited within the site and dust shall be contained within the construction area.
− Temporary workers camp with self-sufficient infrastructure facilities
Existing Traffic − Traffic addition − New approach road to NH-16 is proposed and use of village roads will be restricted.
− Drivers should be sensitized with respect to need to drive carefully while passing village areas.
−
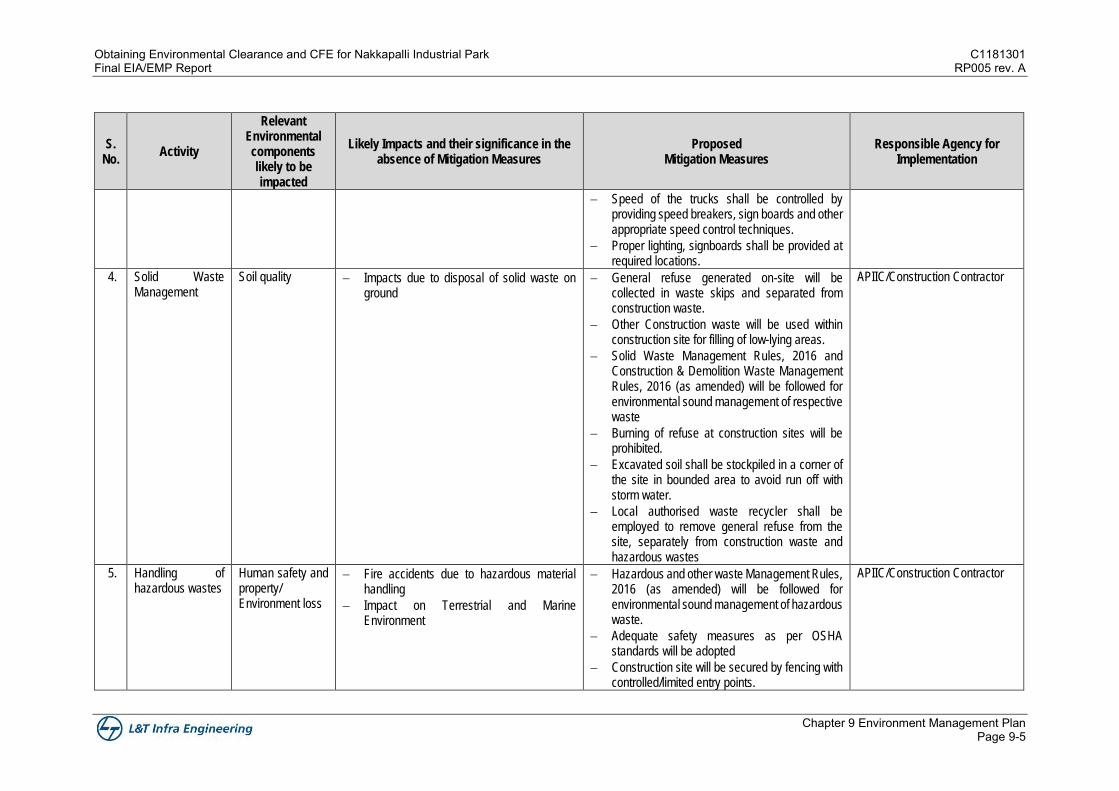
Obtaining Environmental Clearance and CFE for Nakkapalli Industrial Park C1181301 Final EIA/EMP Report RP005 rev. A
Chapter 9 Environment Management Plan Page 9-5
S. No.
Activity
Relevant Environmental components likely to be impacted
Likely Impacts and their significance in the absence of Mitigation Measures
Proposed Mitigation Measures
Responsible Agency for Implementation
− Speed of the trucks shall be controlled by providing speed breakers, sign boards and other appropriate speed control techniques.
− Proper lighting, signboards shall be provided at required locations.
4. Solid Waste Management
Soil quality − Impacts due to disposal of solid waste on ground
− General refuse generated on-site will be collected in waste skips and separated from construction waste.
− Other Construction waste will be used within construction site for filling of low-lying areas.
− Solid Waste Management Rules, 2016 and Construction & Demolition Waste Management Rules, 2016 (as amended) will be followed for environmental sound management of respective waste
− Burning of refuse at construction sites will be prohibited.
− Excavated soil shall be stockpiled in a corner of the site in bounded area to avoid run off with storm water.
− Local authorised waste recycler shall be employed to remove general refuse from the site, separately from construction waste and hazardous wastes
APIIC/Construction Contractor
5. Handling of hazardous wastes
Human safety and property/ Environment loss
− Fire accidents due to hazardous material handling
− Impact on Terrestrial and Marine Environment
− Hazardous and other waste Management Rules, 2016 (as amended) will be followed for environmental sound management of hazardous waste.
− Adequate safety measures as per OSHA standards will be adopted
− Construction site will be secured by fencing with controlled/limited entry points.
APIIC/Construction Contractor
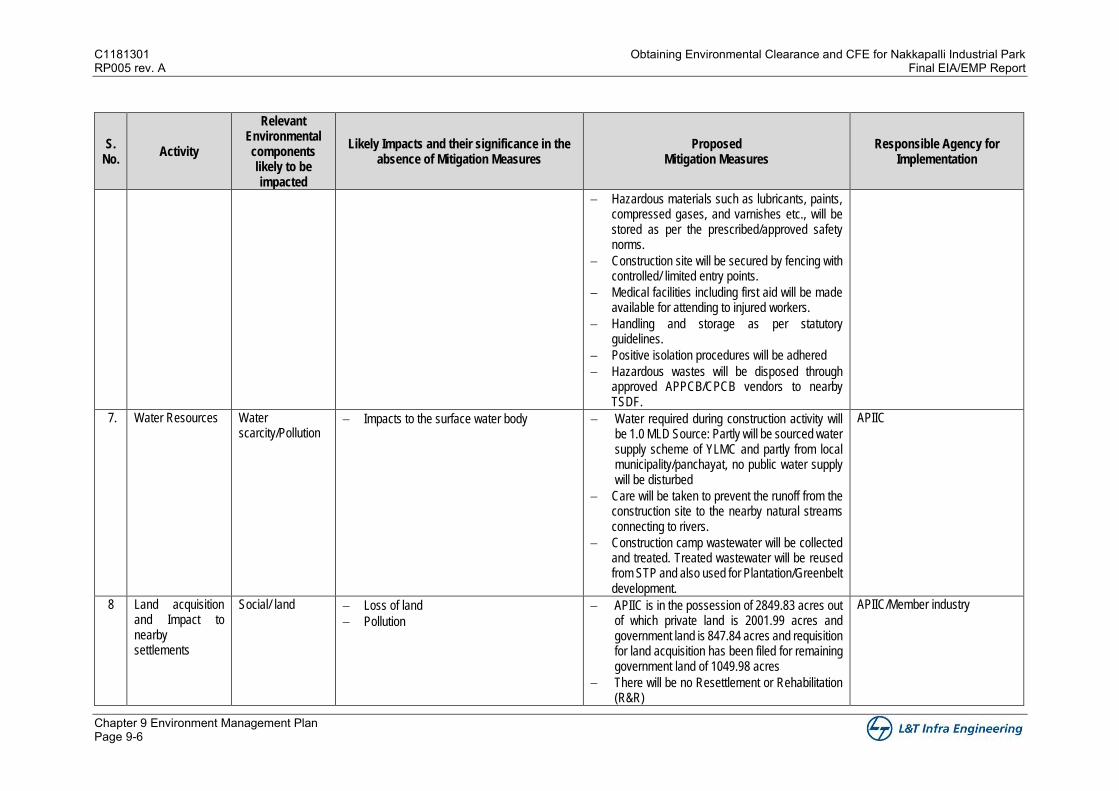
C1181301 Obtaining Environmental Clearance and CFE for Nakkapalli Industrial Park RP005 rev. A Final EIA/EMP Report
Chapter 9 Environment Management Plan Page 9-6
S. No.
Activity
Relevant Environmental components likely to be impacted
Likely Impacts and their significance in the absence of Mitigation Measures
Proposed Mitigation Measures
Responsible Agency for Implementation
− Hazardous materials such as lubricants, paints, compressed gases, and varnishes etc., will be stored as per the prescribed/approved safety norms.
− Construction site will be secured by fencing with controlled/ limited entry points.
− Medical facilities including first aid will be made available for attending to injured workers.
− Handling and storage as per statutory guidelines.
− Positive isolation procedures will be adhered
− Hazardous wastes will be disposed through approved APPCB/CPCB vendors to nearby TSDF.
7. Water Resources Water scarcity/Pollution
− Impacts to the surface water body − Water required during construction activity will be 1.0 MLD Source: Partly will be sourced water supply scheme of YLMC and partly from local municipality/panchayat, no public water supply will be disturbed
− Care will be taken to prevent the runoff from the construction site to the nearby natural streams connecting to rivers.
− Construction camp wastewater will be collected and treated. Treated wastewater will be reused from STP and also used for Plantation/Greenbelt development.
APIIC
8 Land acquisition and Impact to nearby settlements
Social/ land − Loss of land
− Pollution
− APIIC is in the possession of 2849.83 acres out of which private land is 2001.99 acres and government land is 847.84 acres and requisition for land acquisition has been filed for remaining government land of 1049.98 acres
− There will be no Resettlement or Rehabilitation (R&R)
APIIC/Member industry
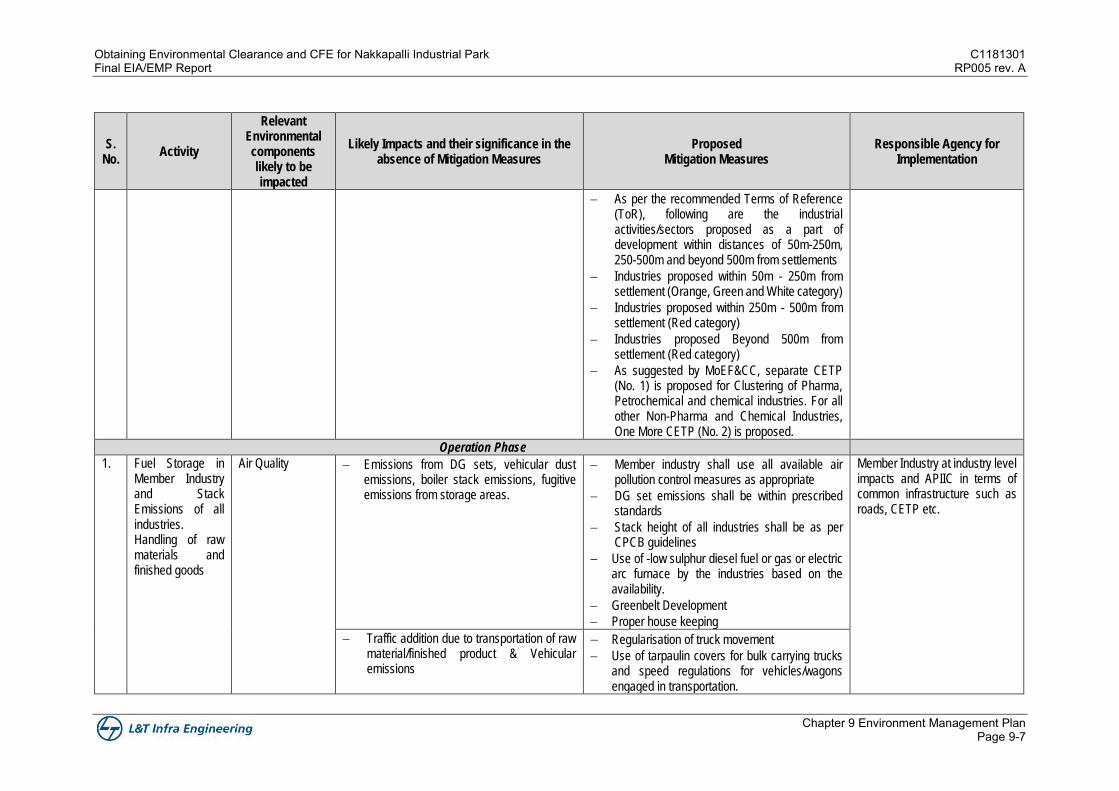
Obtaining Environmental Clearance and CFE for Nakkapalli Industrial Park C1181301 Final EIA/EMP Report RP005 rev. A
Chapter 9 Environment Management Plan Page 9-7
S. No.
Activity
Relevant Environmental components likely to be impacted
Likely Impacts and their significance in the absence of Mitigation Measures
Proposed Mitigation Measures
Responsible Agency for Implementation
− As per the recommended Terms of Reference (ToR), following are the industrial activities/sectors proposed as a part of development within distances of 50m-250m, 250-500m and beyond 500m from settlements
− Industries proposed within 50m - 250m from settlement (Orange, Green and White category)
− Industries proposed within 250m - 500m from settlement (Red category)
− Industries proposed Beyond 500m from settlement (Red category)
− As suggested by MoEF&CC, separate CETP (No. 1) is proposed for Clustering of Pharma, Petrochemical and chemical industries. For all other Non-Pharma and Chemical Industries, One More CETP (No. 2) is proposed.
Operation Phase
1. Fuel Storage in Member Industry and Stack Emissions of all industries. Handling of raw materials and finished goods
Air Quality − Emissions from DG sets, vehicular dust emissions, boiler stack emissions, fugitive emissions from storage areas.
− Member industry shall use all available air pollution control measures as appropriate
− DG set emissions shall be within prescribed standards
− Stack height of all industries shall be as per CPCB guidelines
− Use of -low sulphur diesel fuel or gas or electric arc furnace by the industries based on the availability.
− Greenbelt Development
− Proper house keeping
Member Industry at industry level impacts and APIIC in terms of common infrastructure such as roads, CETP etc.
− Traffic addition due to transportation of raw material/finished product & Vehicular emissions
− Regularisation of truck movement − Use of tarpaulin covers for bulk carrying trucks
and speed regulations for vehicles/wagons engaged in transportation.
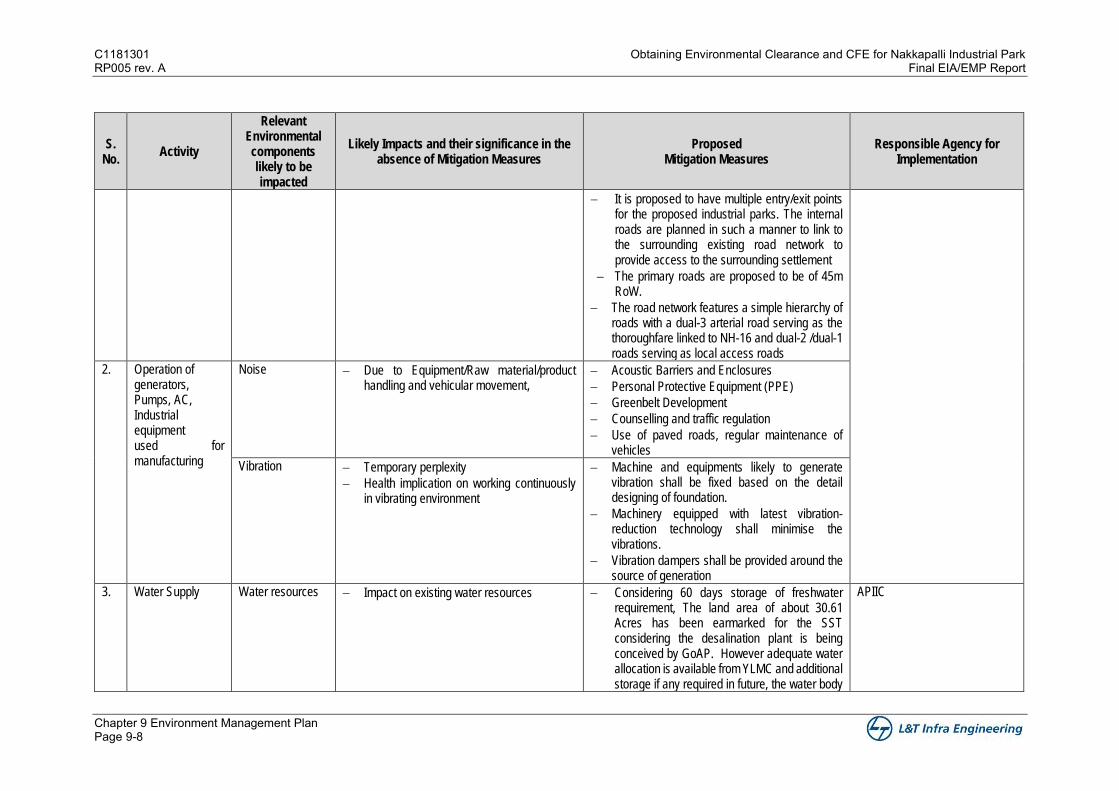
C1181301 Obtaining Environmental Clearance and CFE for Nakkapalli Industrial Park RP005 rev. A Final EIA/EMP Report
Chapter 9 Environment Management Plan Page 9-8
S. No.
Activity
Relevant Environmental components likely to be impacted
Likely Impacts and their significance in the absence of Mitigation Measures
Proposed Mitigation Measures
Responsible Agency for Implementation
− It is proposed to have multiple entry/exit points for the proposed industrial parks. The internal roads are planned in such a manner to link to the surrounding existing road network to provide access to the surrounding settlement
− The primary roads are proposed to be of 45m RoW.
− The road network features a simple hierarchy of roads with a dual-3 arterial road serving as the thoroughfare linked to NH-16 and dual-2 /dual-1 roads serving as local access roads
2. Operation of generators, Pumps, AC, Industrial equipment used for manufacturing
Noise − Due to Equipment/Raw material/product handling and vehicular movement,
− Acoustic Barriers and Enclosures
− Personal Protective Equipment (PPE)
− Greenbelt Development
− Counselling and traffic regulation
− Use of paved roads, regular maintenance of vehicles
Vibration − Temporary perplexity
− Health implication on working continuously in vibrating environment
− Machine and equipments likely to generate vibration shall be fixed based on the detail designing of foundation.
− Machinery equipped with latest vibration-reduction technology shall minimise the vibrations.
− Vibration dampers shall be provided around the source of generation
3. Water Supply Water resources − Impact on existing water resources − Considering 60 days storage of freshwater requirement, The land area of about 30.61 Acres has been earmarked for the SST considering the desalination plant is being conceived by GoAP. However adequate water allocation is available from YLMC and additional storage if any required in future, the water body
APIIC
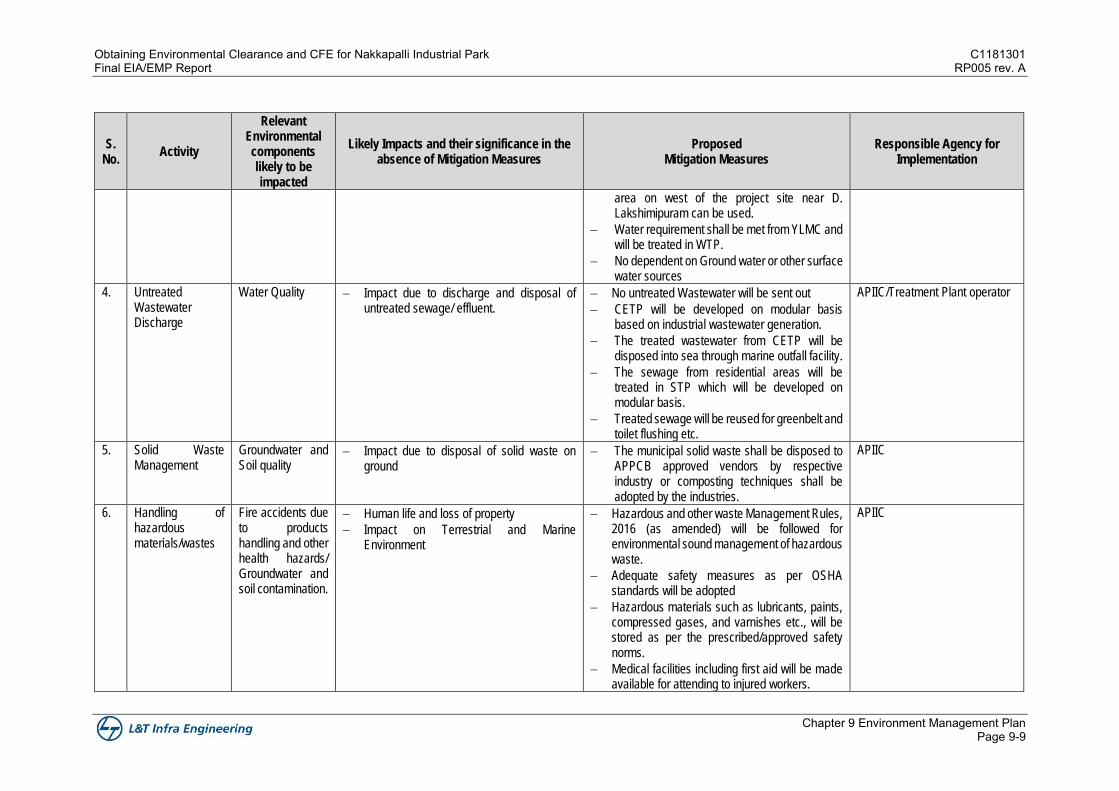
Obtaining Environmental Clearance and CFE for Nakkapalli Industrial Park C1181301 Final EIA/EMP Report RP005 rev. A
Chapter 9 Environment Management Plan Page 9-9
S. No.
Activity
Relevant Environmental components likely to be impacted
Likely Impacts and their significance in the absence of Mitigation Measures
Proposed Mitigation Measures
Responsible Agency for Implementation
area on west of the project site near D. Lakshimipuram can be used.
− Water requirement shall be met from YLMC and will be treated in WTP.
− No dependent on Ground water or other surface water sources
4. Untreated Wastewater Discharge
Water Quality − Impact due to discharge and disposal of untreated sewage/ effluent.
− No untreated Wastewater will be sent out
− CETP will be developed on modular basis based on industrial wastewater generation.
− The treated wastewater from CETP will be disposed into sea through marine outfall facility.
− The sewage from residential areas will be treated in STP which will be developed on modular basis.
− Treated sewage will be reused for greenbelt and toilet flushing etc.
APIIC/Treatment Plant operator
5. Solid Waste Management
Groundwater and Soil quality
− Impact due to disposal of solid waste on ground
− The municipal solid waste shall be disposed to APPCB approved vendors by respective industry or composting techniques shall be adopted by the industries.
APIIC
6. Handling of hazardous materials/wastes
Fire accidents due to products handling and other health hazards/ Groundwater and soil contamination.
− Human life and loss of property
− Impact on Terrestrial and Marine Environment
− Hazardous and other waste Management Rules, 2016 (as amended) will be followed for environmental sound management of hazardous waste.
− Adequate safety measures as per OSHA standards will be adopted
− Hazardous materials such as lubricants, paints, compressed gases, and varnishes etc., will be stored as per the prescribed/approved safety norms.
− Medical facilities including first aid will be made available for attending to injured workers.
APIIC
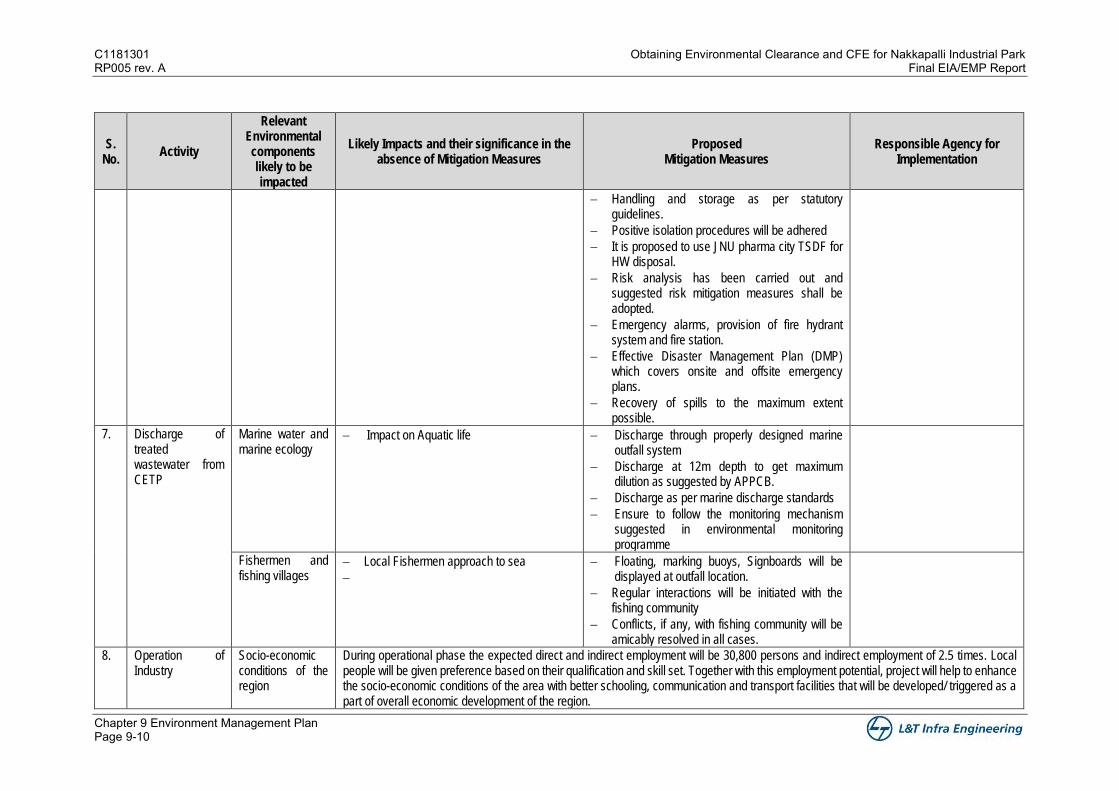
C1181301 Obtaining Environmental Clearance and CFE for Nakkapalli Industrial Park RP005 rev. A Final EIA/EMP Report
Chapter 9 Environment Management Plan Page 9-10
S. No.
Activity
Relevant Environmental components likely to be impacted
Likely Impacts and their significance in the absence of Mitigation Measures
Proposed Mitigation Measures
Responsible Agency for Implementation
− Handling and storage as per statutory guidelines.
− Positive isolation procedures will be adhered
− It is proposed to use JNU pharma city TSDF for HW disposal.
− Risk analysis has been carried out and suggested risk mitigation measures shall be adopted.
− Emergency alarms, provision of fire hydrant system and fire station.
− Effective Disaster Management Plan (DMP) which covers onsite and offsite emergency plans.
− Recovery of spills to the maximum extent possible.
7. Discharge of treated wastewater from CETP
Marine water and marine ecology
− Impact on Aquatic life − Discharge through properly designed marine outfall system
− Discharge at 12m depth to get maximum dilution as suggested by APPCB.
− Discharge as per marine discharge standards
− Ensure to follow the monitoring mechanism suggested in environmental monitoring programme
Fishermen and fishing villages
− Local Fishermen approach to sea
−
− Floating, marking buoys, Signboards will be displayed at outfall location.
− Regular interactions will be initiated with the fishing community
− Conflicts, if any, with fishing community will be amicably resolved in all cases.
8. Operation of Industry
Socio-economic conditions of the region
During operational phase the expected direct and indirect employment will be 30,800 persons and indirect employment of 2.5 times. Local people will be given preference based on their qualification and skill set. Together with this employment potential, project will help to enhance the socio-economic conditions of the area with better schooling, communication and transport facilities that will be developed/ triggered as a part of overall economic development of the region.
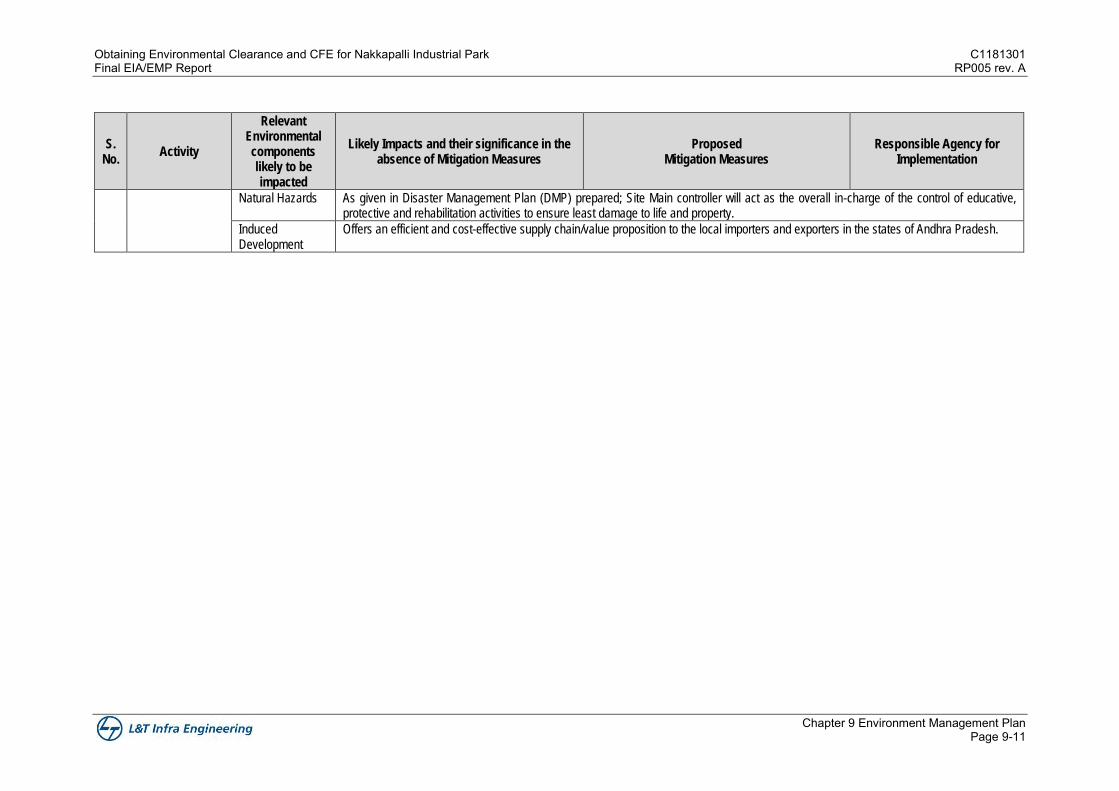
Obtaining Environmental Clearance and CFE for Nakkapalli Industrial Park C1181301 Final EIA/EMP Report RP005 rev. A
Chapter 9 Environment Management Plan Page 9-11
S. No.
Activity
Relevant Environmental components likely to be impacted
Likely Impacts and their significance in the absence of Mitigation Measures
Proposed Mitigation Measures
Responsible Agency for Implementation
Natural Hazards As given in Disaster Management Plan (DMP) prepared; Site Main controller will act as the overall in-charge of the control of educative, protective and rehabilitation activities to ensure least damage to life and property.
Induced Development
Offers an efficient and cost-effective supply chain/value proposition to the local importers and exporters in the states of Andhra Pradesh.
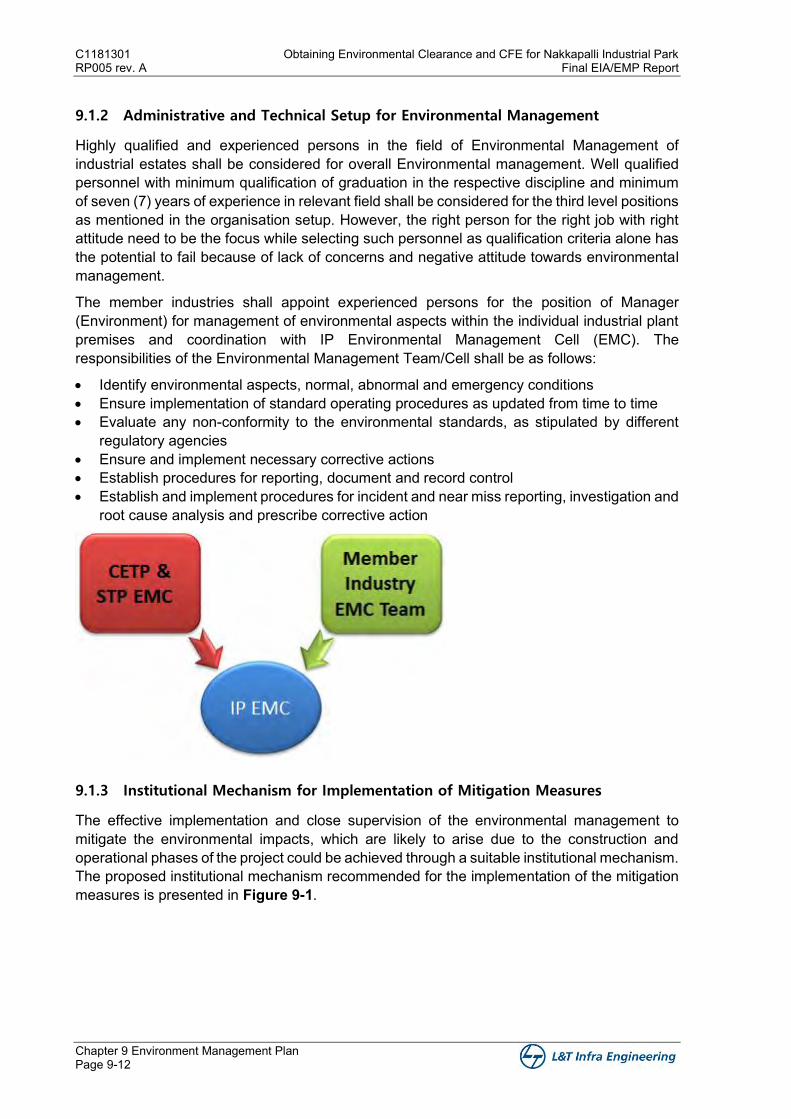
C1181301 Obtaining Environmental Clearance and CFE for Nakkapalli Industrial Park RP005 rev. A Final EIA/EMP Report
Chapter 9 Environment Management Plan Page 9-12
9.1.2 Administrative and Technical Setup for Environmental Management
Highly qualified and experienced persons in the field of Environmental Management of industrial estates shall be considered for overall Environmental management. Well qualified personnel with minimum qualification of graduation in the respective discipline and minimum of seven (7) years of experience in relevant field shall be considered for the third level positions as mentioned in the organisation setup. However, the right person for the right job with right attitude need to be the focus while selecting such personnel as qualification criteria alone has the potential to fail because of lack of concerns and negative attitude towards environmental management.
The member industries shall appoint experienced persons for the position of Manager (Environment) for management of environmental aspects within the individual industrial plant premises and coordination with IP Environmental Management Cell (EMC). The responsibilities of the Environmental Management Team/Cell shall be as follows:
• Identify environmental aspects, normal, abnormal and emergency conditions • Ensure implementation of standard operating procedures as updated from time to time • Evaluate any non-conformity to the environmental standards, as stipulated by different
regulatory agencies • Ensure and implement necessary corrective actions • Establish procedures for reporting, document and record control • Establish and implement procedures for incident and near miss reporting, investigation and
root cause analysis and prescribe corrective action
9.1.3 Institutional Mechanism for Implementation of Mitigation Measures
The effective implementation and close supervision of the environmental management to mitigate the environmental impacts, which are likely to arise due to the construction and operational phases of the project could be achieved through a suitable institutional mechanism. The proposed institutional mechanism recommended for the implementation of the mitigation measures is presented in Figure 9-1.
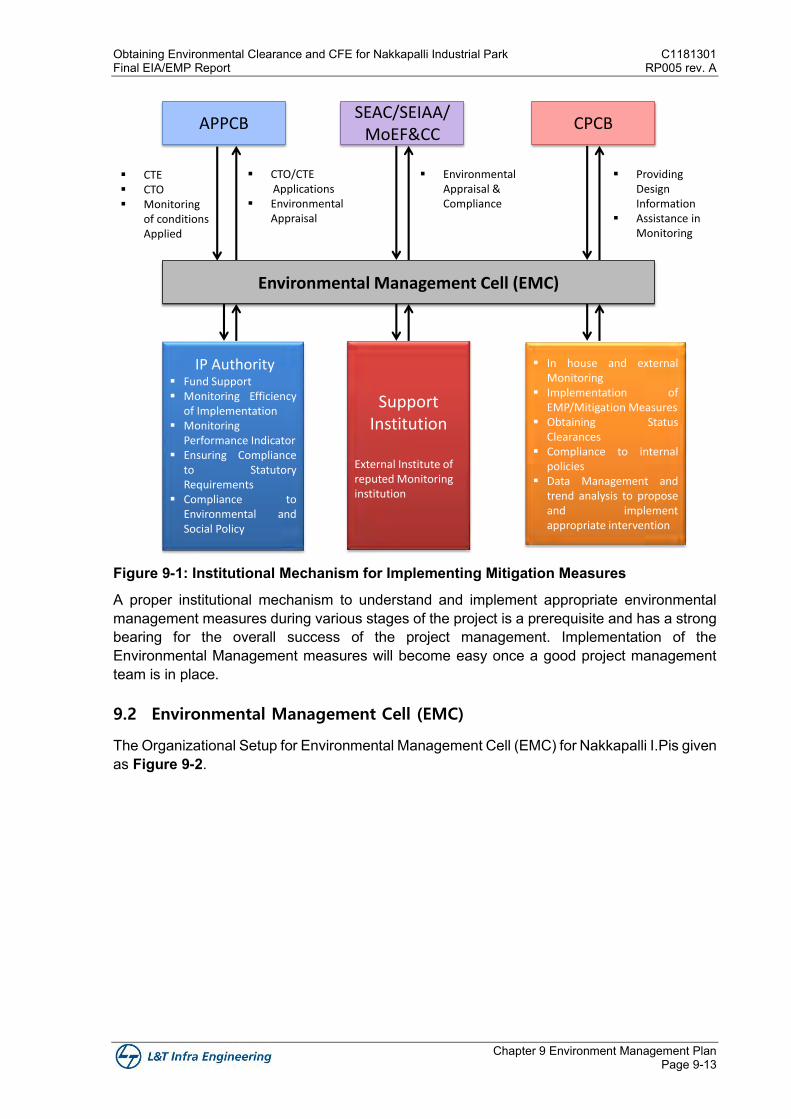
Obtaining Environmental Clearance and CFE for Nakkapalli Industrial Park C1181301 Final EIA/EMP Report RP005 rev. A
Chapter 9 Environment Management Plan Page 9-13
Figure 9-1: Institutional Mechanism for Implementing Mitigation Measures
A proper institutional mechanism to understand and implement appropriate environmental management measures during various stages of the project is a prerequisite and has a strong bearing for the overall success of the project management. Implementation of the Environmental Management measures will become easy once a good project management team is in place.
9.2 Environmental Management Cell (EMC)
The Organizational Setup for Environmental Management Cell (EMC) for Nakkapalli I.Pis given as Figure 9-2.
APPCBSEAC/SEIAA/
MoEF&CCCPCB
IP Authority▪ Fund Support▪ Monitoring Efficiency
of Implementation▪ Monitoring
Performance Indicator▪ Ensuring Compliance
to StatutoryRequirements
▪ Compliance toEnvironmental andSocial Policy
Support Institution
External Institute of reputed Monitoring institution
▪ In house and externalMonitoring
▪ Implementation ofEMP/Mitigation Measures
▪ Obtaining StatusClearances
▪ Compliance to internalpolicies
▪ Data Management andtrend analysis to proposeand implementappropriate intervention
Environmental Management Cell (EMC)
▪ CTE▪ CTO▪ Monitoring
of conditions Applied
▪ CTO/CTEApplications
▪ Environmental Appraisal
▪ Environmental Appraisal & Compliance
▪ Providing Design Information
▪ Assistance in Monitoring
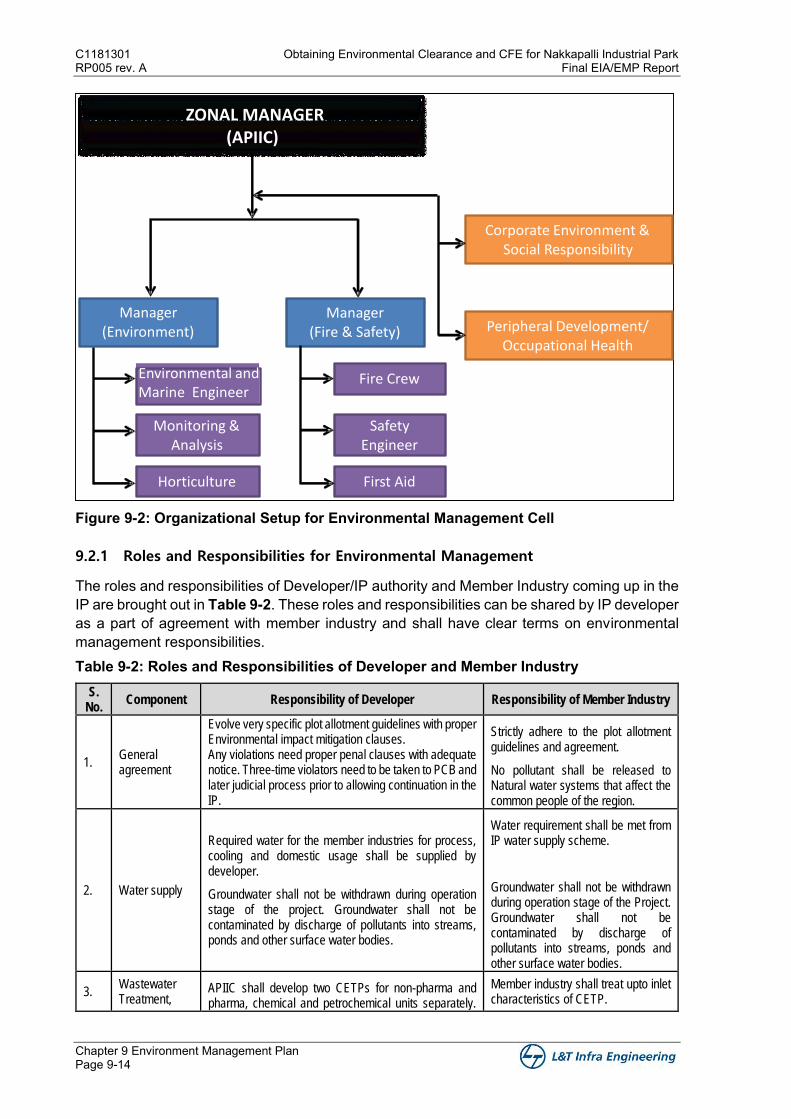
C1181301 Obtaining Environmental Clearance and CFE for Nakkapalli Industrial Park RP005 rev. A Final EIA/EMP Report
Chapter 9 Environment Management Plan Page 9-14
Figure 9-2: Organizational Setup for Environmental Management Cell
9.2.1 Roles and Responsibilities for Environmental Management
The roles and responsibilities of Developer/IP authority and Member Industry coming up in the IP are brought out in Table 9-2. These roles and responsibilities can be shared by IP developer as a part of agreement with member industry and shall have clear terms on environmental management responsibilities. Table 9-2: Roles and Responsibilities of Developer and Member Industry
S. No.
Component Responsibility of Developer Responsibility of Member Industry
1. General agreement
Evolve very specific plot allotment guidelines with proper Environmental impact mitigation clauses. Any violations need proper penal clauses with adequate notice. Three-time violators need to be taken to PCB and later judicial process prior to allowing continuation in the IP.
Strictly adhere to the plot allotment guidelines and agreement.
No pollutant shall be released to Natural water systems that affect the common people of the region.
2. Water supply
Required water for the member industries for process, cooling and domestic usage shall be supplied by developer.
Groundwater shall not be withdrawn during operation stage of the project. Groundwater shall not be contaminated by discharge of pollutants into streams, ponds and other surface water bodies.
Water requirement shall be met from IP water supply scheme.
Groundwater shall not be withdrawn during operation stage of the Project. Groundwater shall not be contaminated by discharge of pollutants into streams, ponds and other surface water bodies.
3. Wastewater Treatment,
APIIC shall develop two CETPs for non-pharma and pharma, chemical and petrochemical units separately.
Member industry shall treat upto inlet characteristics of CETP.
ZONAL MANAGER (APIIC)
Manager (Environment)
Manager (Fire & Safety)
Environmental and Marine Engineer
Corporate Environment & Social Responsibility
Fire Crew
Monitoring & Analysis
Safety Engineer
Horticulture First Aid
Peripheral Development/Occupational Health
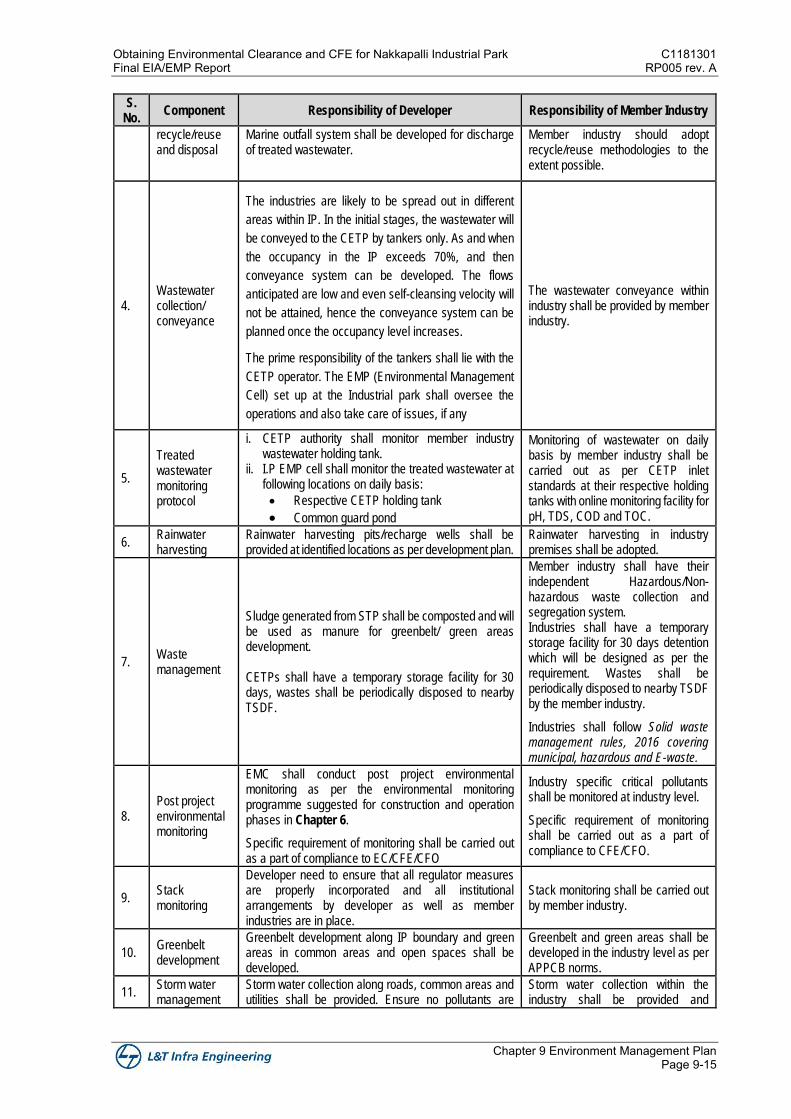
Obtaining Environmental Clearance and CFE for Nakkapalli Industrial Park C1181301 Final EIA/EMP Report RP005 rev. A
Chapter 9 Environment Management Plan Page 9-15
S. No.
Component Responsibility of Developer Responsibility of Member Industry
recycle/reuse and disposal
Marine outfall system shall be developed for discharge of treated wastewater.
Member industry should adopt recycle/reuse methodologies to the extent possible.
4. Wastewater collection/ conveyance
The industries are likely to be spread out in different
areas within IP. In the initial stages, the wastewater will
be conveyed to the CETP by tankers only. As and when
the occupancy in the IP exceeds 70%, and then
conveyance system can be developed. The flows
anticipated are low and even self-cleansing velocity will
not be attained, hence the conveyance system can be
planned once the occupancy level increases.
The prime responsibility of the tankers shall lie with the
CETP operator. The EMP (Environmental Management
Cell) set up at the Industrial park shall oversee the
operations and also take care of issues, if any
The wastewater conveyance within industry shall be provided by member industry.
5.
Treated wastewater monitoring protocol
i. CETP authority shall monitor member industry wastewater holding tank.
ii. I.P EMP cell shall monitor the treated wastewater at following locations on daily basis:
• Respective CETP holding tank
• Common guard pond
Monitoring of wastewater on daily basis by member industry shall be carried out as per CETP inlet standards at their respective holding tanks with online monitoring facility for pH, TDS, COD and TOC.
6. Rainwater harvesting
Rainwater harvesting pits/recharge wells shall be provided at identified locations as per development plan.
Rainwater harvesting in industry premises shall be adopted.
7. Waste management
Sludge generated from STP shall be composted and will be used as manure for greenbelt/ green areas development. CETPs shall have a temporary storage facility for 30 days, wastes shall be periodically disposed to nearby TSDF.
Member industry shall have their independent Hazardous/Non-hazardous waste collection and segregation system. Industries shall have a temporary storage facility for 30 days detention which will be designed as per the requirement. Wastes shall be periodically disposed to nearby TSDF by the member industry.
Industries shall follow Solid waste management rules, 2016 covering municipal, hazardous and E-waste.
8. Post project environmental monitoring
EMC shall conduct post project environmental monitoring as per the environmental monitoring programme suggested for construction and operation phases in Chapter 6.
Specific requirement of monitoring shall be carried out as a part of compliance to EC/CFE/CFO
Industry specific critical pollutants shall be monitored at industry level.
Specific requirement of monitoring shall be carried out as a part of compliance to CFE/CFO.
9. Stack monitoring
Developer need to ensure that all regulator measures are properly incorporated and all institutional arrangements by developer as well as member industries are in place.
Stack monitoring shall be carried out by member industry.
10. Greenbelt development
Greenbelt development along IP boundary and green areas in common areas and open spaces shall be developed.
Greenbelt and green areas shall be developed in the industry level as per APPCB norms.
11. Storm water management
Storm water collection along roads, common areas and utilities shall be provided. Ensure no pollutants are
Storm water collection within the industry shall be provided and
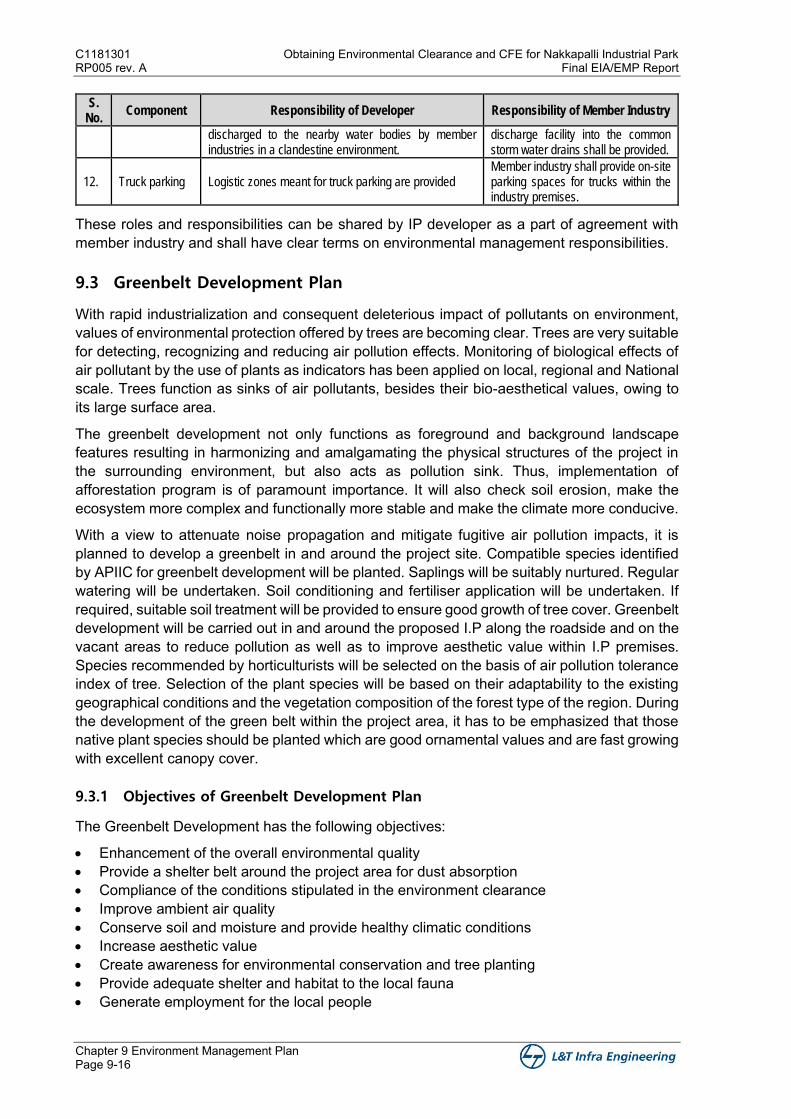
C1181301 Obtaining Environmental Clearance and CFE for Nakkapalli Industrial Park RP005 rev. A Final EIA/EMP Report
Chapter 9 Environment Management Plan Page 9-16
S. No.
Component Responsibility of Developer Responsibility of Member Industry
discharged to the nearby water bodies by member industries in a clandestine environment.
discharge facility into the common storm water drains shall be provided.
12. Truck parking Logistic zones meant for truck parking are provided Member industry shall provide on-site parking spaces for trucks within the industry premises.
These roles and responsibilities can be shared by IP developer as a part of agreement with member industry and shall have clear terms on environmental management responsibilities.
9.3 Greenbelt Development Plan
With rapid industrialization and consequent deleterious impact of pollutants on environment, values of environmental protection offered by trees are becoming clear. Trees are very suitable for detecting, recognizing and reducing air pollution effects. Monitoring of biological effects of air pollutant by the use of plants as indicators has been applied on local, regional and National scale. Trees function as sinks of air pollutants, besides their bio-aesthetical values, owing to its large surface area.
The greenbelt development not only functions as foreground and background landscape features resulting in harmonizing and amalgamating the physical structures of the project in the surrounding environment, but also acts as pollution sink. Thus, implementation of afforestation program is of paramount importance. It will also check soil erosion, make the ecosystem more complex and functionally more stable and make the climate more conducive.
With a view to attenuate noise propagation and mitigate fugitive air pollution impacts, it is planned to develop a greenbelt in and around the project site. Compatible species identified by APIIC for greenbelt development will be planted. Saplings will be suitably nurtured. Regular watering will be undertaken. Soil conditioning and fertiliser application will be undertaken. If required, suitable soil treatment will be provided to ensure good growth of tree cover. Greenbelt development will be carried out in and around the proposed I.P along the roadside and on the vacant areas to reduce pollution as well as to improve aesthetic value within I.P premises. Species recommended by horticulturists will be selected on the basis of air pollution tolerance index of tree. Selection of the plant species will be based on their adaptability to the existing geographical conditions and the vegetation composition of the forest type of the region. During the development of the green belt within the project area, it has to be emphasized that those native plant species should be planted which are good ornamental values and are fast growing with excellent canopy cover.
9.3.1 Objectives of Greenbelt Development Plan
The Greenbelt Development has the following objectives:
• Enhancement of the overall environmental quality • Provide a shelter belt around the project area for dust absorption • Compliance of the conditions stipulated in the environment clearance • Improve ambient air quality • Conserve soil and moisture and provide healthy climatic conditions • Increase aesthetic value • Create awareness for environmental conservation and tree planting • Provide adequate shelter and habitat to the local fauna • Generate employment for the local people

Obtaining Environmental Clearance and CFE for Nakkapalli Industrial Park C1181301 Final EIA/EMP Report RP005 rev. A
Chapter 9 Environment Management Plan Page 9-17
• Protect human health and prevent pollution
9.3.2 Greenbelt Development - Master Plan
In the proposed Industrial Park, an area of 690 acres is allotted as green area, which covers around 17.7% of total area Adequate green peripheral buffers (15m) are provided all along the project boundary. Adequate green buffer (50m) is provided near settlements, water bodies (as per norms), etc. landscaped green spaces will be provided & will serve as lung space for the industrial park. There is a backwater/stream flowing within the site and a buffer of 100 m or width of the creek as per CRZ regulation is proposed and green areas will be developed in the buffer area. Major part of the stream is less than 100m width. As the stream width reduces, buffer equal to the width of the stream is proposed. The map showing green areas and water bodies are shown in Figure FD0203.
Based on the availability of area, Greenbelt is normally desirable in 3 tiers i.e., Trees, Shrubs and Small bushes. These 3 tier plantation comprises of native species as lower tier, bushes and shrubs as middle tier and trees as upper tier with an objective to establish biodiversity and food chain; and to improve the local climate regime.
Combination of various species is sought while selecting trees for green belt / vegetation cover. The green belt will be planted close to the source or to the area to be protected to optimize the attenuation within physical limitations.
Locally growing varieties with fast growth rate and ability to flourish even in poor quality soils will be selected for plantation.
9.3.2.1 Cost estimations for Greenbelt Development
An area of 690 ac. (279.23 ha) is earmarked for green areas and greenbelt development apart from green belt within the Industrial Plots and other areas. Approximately 4,65,000 numbers of trees are proposed to be planted in Nakkapalli IP. The survival of the plantation shall be monitored frequently and survival rate of the plantation during operational phase shall not be less than 80%.
A capital cost of INR 62.13 million (6.13 Crores) shall be earmarked for this purpose and INR of 3.11 million (0.31 Crores) shall be allocated for recurring expenses per annum towards green belt development and maintenance. The capital and recurring cost will be spent over a period of time based on the industrial development plan at project site. The lay out plan of the green plant and green areas in project site is depicted in Figure FD0203. In addition to this, all other industrial units shall develop green areas within their premises as per the prevailing Andhra Pradesh Pollution Control Board (APPCB) provisions.
9.3.2.2 Species for Plantation
The species proposed will have broad leaves. Trees will be selected based on the type of pollutants, their intensity, location, easy availability and suitability to the local climate like coastal adoptability. They have different morphological, physiological and bio-chemical mechanism / character like branching habits, leaf habits, leaf arrangement, size, shape, surface (smooth / hairy), presence or absence of trichomoes, stomatal conductivity proline content, ascorbic acid content, cationic peroxides and sulphite oxidize activities etc. to trap or reduce the pollutants. Species to be selected will fulfil the following specific requirement of the area “
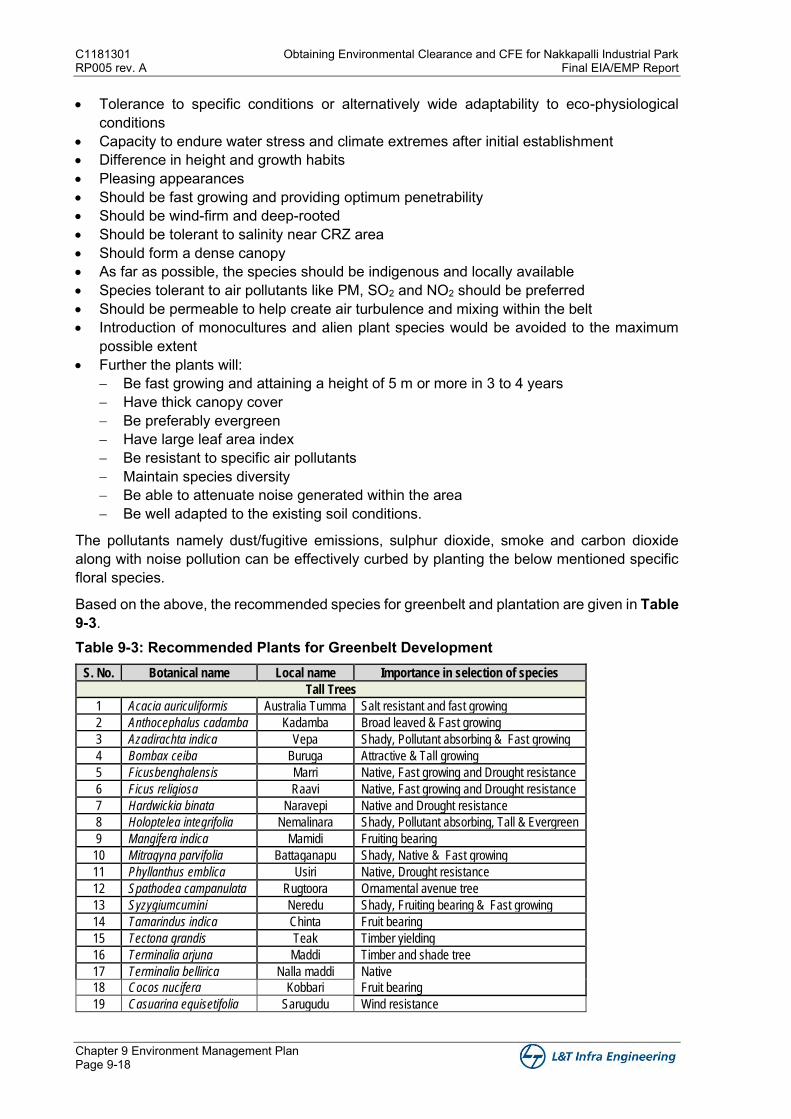
C1181301 Obtaining Environmental Clearance and CFE for Nakkapalli Industrial Park RP005 rev. A Final EIA/EMP Report
Chapter 9 Environment Management Plan Page 9-18
• Tolerance to specific conditions or alternatively wide adaptability to eco-physiological conditions
• Capacity to endure water stress and climate extremes after initial establishment • Difference in height and growth habits • Pleasing appearances • Should be fast growing and providing optimum penetrability • Should be wind-firm and deep-rooted • Should be tolerant to salinity near CRZ area • Should form a dense canopy • As far as possible, the species should be indigenous and locally available • Species tolerant to air pollutants like PM, SO2 and NO2 should be preferred • Should be permeable to help create air turbulence and mixing within the belt • Introduction of monocultures and alien plant species would be avoided to the maximum
possible extent • Further the plants will:
− Be fast growing and attaining a height of 5 m or more in 3 to 4 years − Have thick canopy cover − Be preferably evergreen − Have large leaf area index − Be resistant to specific air pollutants − Maintain species diversity − Be able to attenuate noise generated within the area − Be well adapted to the existing soil conditions.
The pollutants namely dust/fugitive emissions, sulphur dioxide, smoke and carbon dioxide along with noise pollution can be effectively curbed by planting the below mentioned specific floral species.
Based on the above, the recommended species for greenbelt and plantation are given in Table 9-3. Table 9-3: Recommended Plants for Greenbelt Development
S. No. Botanical name Local name Importance in selection of species
Tall Trees
1 Acacia auriculiformis Australia Tumma Salt resistant and fast growing
2 Anthocephalus cadamba Kadamba Broad leaved & Fast growing
3 Azadirachta indica Vepa Shady, Pollutant absorbing & Fast growing
4 Bombax ceiba Buruga Attractive & Tall growing
5 Ficusbenghalensis Marri Native, Fast growing and Drought resistance
6 Ficus religiosa Raavi Native, Fast growing and Drought resistance
7 Hardwickia binata Naravepi Native and Drought resistance
8 Holoptelea integrifolia Nemalinara Shady, Pollutant absorbing, Tall & Evergreen
9 Mangifera indica Mamidi Fruiting bearing
10 Mitragyna parvifolia Battaganapu Shady, Native & Fast growing
11 Phyllanthus emblica Usiri Native, Drought resistance
12 Spathodea campanulata Rugtoora Ornamental avenue tree
13 Syzygiumcumini Neredu Shady, Fruiting bearing & Fast growing
14 Tamarindus indica Chinta Fruit bearing
15 Tectona grandis Teak Timber yielding
16 Terminalia arjuna Maddi Timber and shade tree
17 Terminalia bellirica Nalla maddi Native
18 Cocos nucifera Kobbari Fruit bearing
19 Casuarina equisetifolia Sarugudu Wind resistance
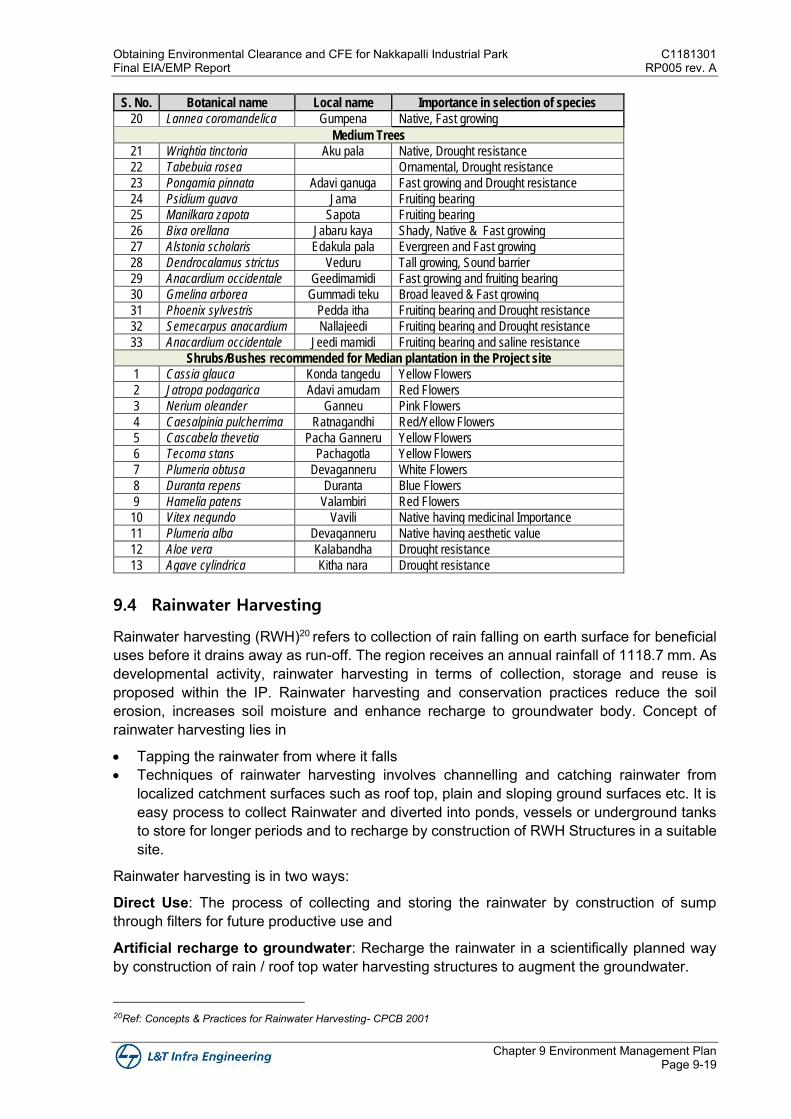
Obtaining Environmental Clearance and CFE for Nakkapalli Industrial Park C1181301 Final EIA/EMP Report RP005 rev. A
Chapter 9 Environment Management Plan Page 9-19
S. No. Botanical name Local name Importance in selection of species
20 Lannea coromandelica Gumpena Native, Fast growing
Medium Trees
21 Wrightia tinctoria Aku pala Native, Drought resistance
22 Tabebuia rosea Ornamental, Drought resistance
23 Pongamia pinnata Adavi ganuga Fast growing and Drought resistance
24 Psidium guava Jama Fruiting bearing
25 Manilkara zapota Sapota Fruiting bearing
26 Bixa orellana Jabaru kaya Shady, Native & Fast growing
27 Alstonia scholaris Edakula pala Evergreen and Fast growing
28 Dendrocalamus strictus Veduru Tall growing, Sound barrier
29 Anacardium occidentale Geedimamidi Fast growing and fruiting bearing
30 Gmelina arborea Gummadi teku Broad leaved & Fast growing
31 Phoenix sylvestris Pedda itha Fruiting bearing and Drought resistance
32 Semecarpus anacardium Nallajeedi Fruiting bearing and Drought resistance
33 Anacardium occidentale Jeedi mamidi Fruiting bearing and saline resistance
Shrubs/Bushes recommended for Median plantation in the Project site
1 Cassia glauca Konda tangedu Yellow Flowers
2 Jatropa podagarica Adavi amudam Red Flowers
3 Nerium oleander Ganneu Pink Flowers
4 Caesalpinia pulcherrima Ratnagandhi Red/Yellow Flowers
5 Cascabela thevetia Pacha Ganneru Yellow Flowers
6 Tecoma stans Pachagotla Yellow Flowers
7 Plumeria obtusa Devaganneru White Flowers
8 Duranta repens Duranta Blue Flowers
9 Hamelia patens Valambiri Red Flowers
10 Vitex negundo Vavili Native having medicinal Importance
11 Plumeria alba Devaganneru Native having aesthetic value
12 Aloe vera Kalabandha Drought resistance
13 Agave cylindrica Kitha nara Drought resistance
9.4 Rainwater Harvesting
Rainwater harvesting (RWH)20 refers to collection of rain falling on earth surface for beneficial uses before it drains away as run-off. The region receives an annual rainfall of 1118.7 mm. As developmental activity, rainwater harvesting in terms of collection, storage and reuse is proposed within the IP. Rainwater harvesting and conservation practices reduce the soil erosion, increases soil moisture and enhance recharge to groundwater body. Concept of rainwater harvesting lies in
• Tapping the rainwater from where it falls • Techniques of rainwater harvesting involves channelling and catching rainwater from
localized catchment surfaces such as roof top, plain and sloping ground surfaces etc. It is easy process to collect Rainwater and diverted into ponds, vessels or underground tanks to store for longer periods and to recharge by construction of RWH Structures in a suitable site.
Rainwater harvesting is in two ways:
Direct Use: The process of collecting and storing the rainwater by construction of sump through filters for future productive use and
Artificial recharge to groundwater: Recharge the rainwater in a scientifically planned way by construction of rain / roof top water harvesting structures to augment the groundwater.
20Ref: Concepts & Practices for Rainwater Harvesting- CPCB 2001
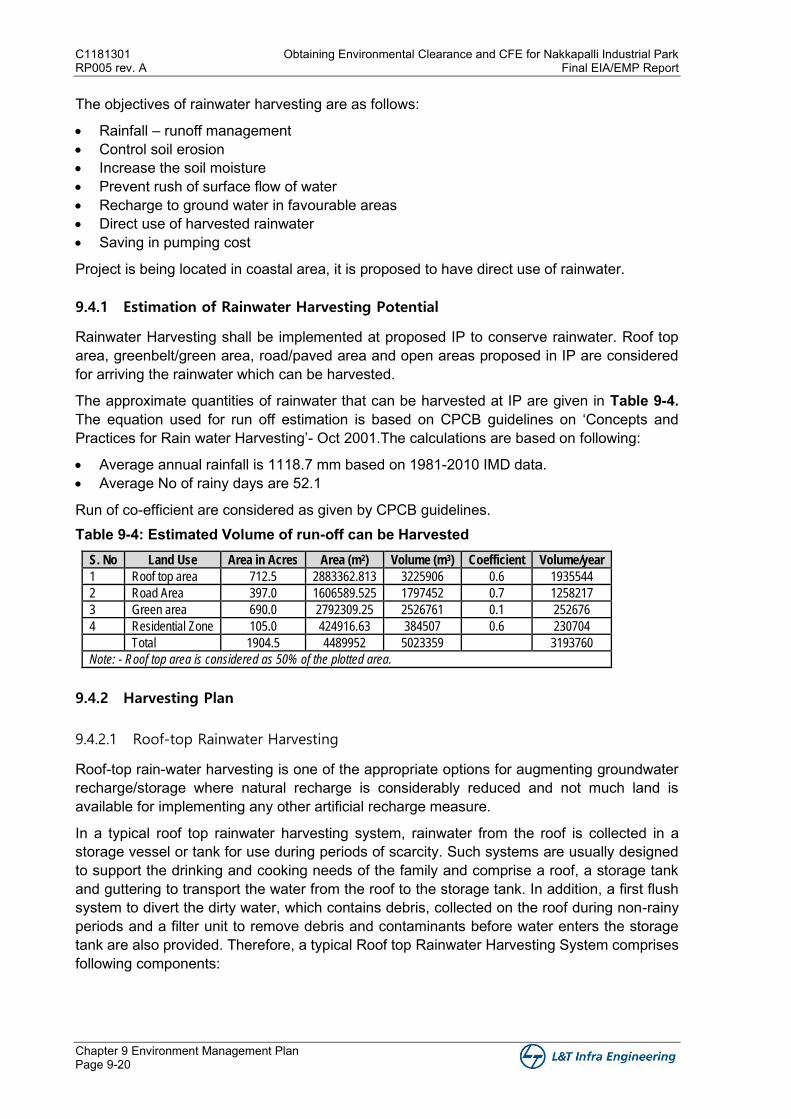
C1181301 Obtaining Environmental Clearance and CFE for Nakkapalli Industrial Park RP005 rev. A Final EIA/EMP Report
Chapter 9 Environment Management Plan Page 9-20
The objectives of rainwater harvesting are as follows:
• Rainfall – runoff management • Control soil erosion • Increase the soil moisture • Prevent rush of surface flow of water • Recharge to ground water in favourable areas • Direct use of harvested rainwater • Saving in pumping cost
Project is being located in coastal area, it is proposed to have direct use of rainwater.
9.4.1 Estimation of Rainwater Harvesting Potential
Rainwater Harvesting shall be implemented at proposed IP to conserve rainwater. Roof top area, greenbelt/green area, road/paved area and open areas proposed in IP are considered for arriving the rainwater which can be harvested.
The approximate quantities of rainwater that can be harvested at IP are given in Table 9-4. The equation used for run off estimation is based on CPCB guidelines on ‘Concepts and Practices for Rain water Harvesting’- Oct 2001.The calculations are based on following:
• Average annual rainfall is 1118.7 mm based on 1981-2010 IMD data. • Average No of rainy days are 52.1
Run of co-efficient are considered as given by CPCB guidelines. Table 9-4: Estimated Volume of run-off can be Harvested
S. No Land Use Area in Acres Area (m2) Volume (m3) Coefficient Volume/year
1 Roof top area 712.5 2883362.813 3225906 0.6 1935544
2 Road Area 397.0 1606589.525 1797452 0.7 1258217
3 Green area 690.0 2792309.25 2526761 0.1 252676
4 Residential Zone 105.0 424916.63 384507 0.6 230704
Total 1904.5 4489952 5023359 3193760
Note: - Roof top area is considered as 50% of the plotted area.
9.4.2 Harvesting Plan
9.4.2.1 Roof-top Rainwater Harvesting
Roof-top rain-water harvesting is one of the appropriate options for augmenting groundwater recharge/storage where natural recharge is considerably reduced and not much land is available for implementing any other artificial recharge measure.
In a typical roof top rainwater harvesting system, rainwater from the roof is collected in a storage vessel or tank for use during periods of scarcity. Such systems are usually designed to support the drinking and cooking needs of the family and comprise a roof, a storage tank and guttering to transport the water from the roof to the storage tank. In addition, a first flush system to divert the dirty water, which contains debris, collected on the roof during non-rainy periods and a filter unit to remove debris and contaminants before water enters the storage tank are also provided. Therefore, a typical Roof top Rainwater Harvesting System comprises following components:
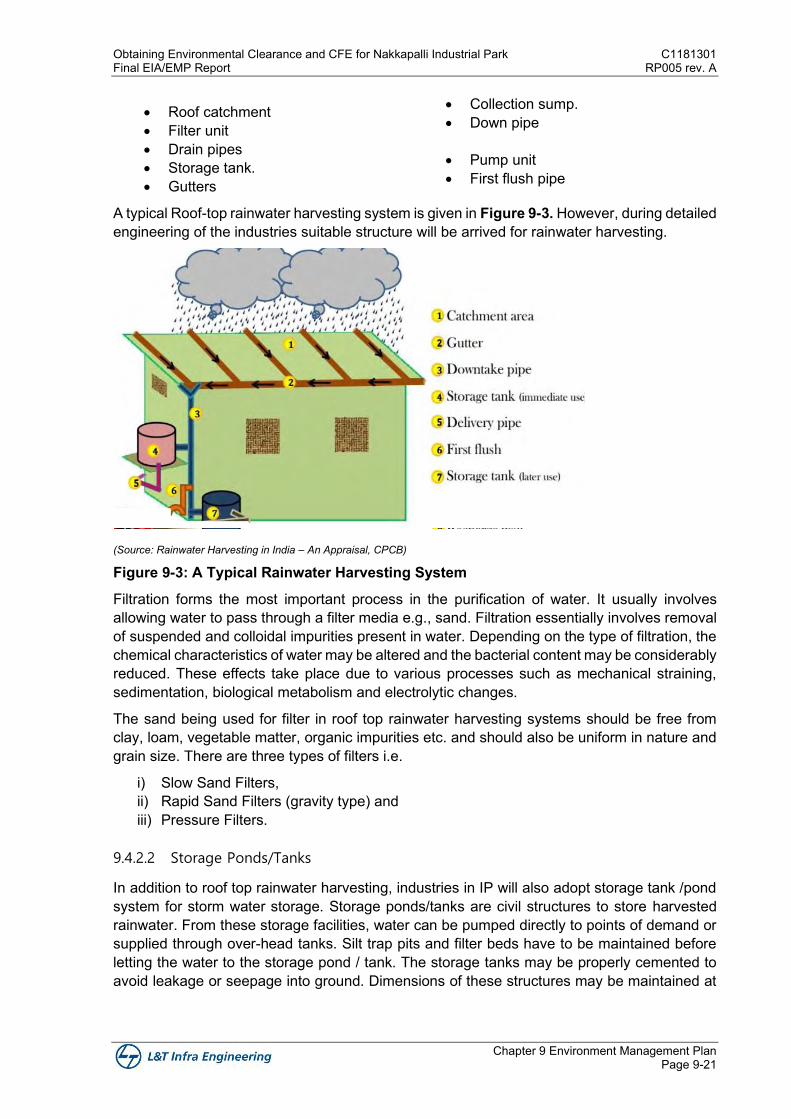
Obtaining Environmental Clearance and CFE for Nakkapalli Industrial Park C1181301 Final EIA/EMP Report RP005 rev. A
Chapter 9 Environment Management Plan Page 9-21
• Roof catchment • Filter unit • Drain pipes • Storage tank. • Gutters
• Collection sump. • Down pipe
• Pump unit • First flush pipe
A typical Roof-top rainwater harvesting system is given in Figure 9-3. However, during detailed engineering of the industries suitable structure will be arrived for rainwater harvesting.
(Source: Rainwater Harvesting in India – An Appraisal, CPCB)
Figure 9-3: A Typical Rainwater Harvesting System
Filtration forms the most important process in the purification of water. It usually involves allowing water to pass through a filter media e.g., sand. Filtration essentially involves removal of suspended and colloidal impurities present in water. Depending on the type of filtration, the chemical characteristics of water may be altered and the bacterial content may be considerably reduced. These effects take place due to various processes such as mechanical straining, sedimentation, biological metabolism and electrolytic changes.
The sand being used for filter in roof top rainwater harvesting systems should be free from clay, loam, vegetable matter, organic impurities etc. and should also be uniform in nature and grain size. There are three types of filters i.e.
i) Slow Sand Filters, ii) Rapid Sand Filters (gravity type) and iii) Pressure Filters.
9.4.2.2 Storage Ponds/Tanks
In addition to roof top rainwater harvesting, industries in IP will also adopt storage tank /pond system for storm water storage. Storage ponds/tanks are civil structures to store harvested rainwater. From these storage facilities, water can be pumped directly to points of demand or supplied through over-head tanks. Silt trap pits and filter beds have to be maintained before letting the water to the storage pond / tank. The storage tanks may be properly cemented to avoid leakage or seepage into ground. Dimensions of these structures may be maintained at
C1181301 Obtaining Environmental Clearance and CFE for Nakkapalli Industrial Park RP005 rev. A Final EIA/EMP Report
Chapter 9 Environment Management Plan Page 9-22
20 m x 10 m x 2 m. A model of the storage pond / tank is shown in Exhibit 9-1 for storing harvested rainwater.
(Source: Google)
Exhibit 9-1: A Model Storage Pond/Tank
9.4.3 Monitoring wells for Impact Assessment
Monitoring of the groundwater regime is done by establishing a network of observation wells tapping the shallow and deeper aquifer systems separately.
The phreatic aquifer can be monitored by measuring groundwater levels in the open dug wells or dedicated shallow water table wells. The existing dug wells may also be selected for monitoring. Piezometric surface in the deeper aquifer may have to be monitored by installing dedicated piezometers. Piezometer is a small diameter (38 mm) tube with a 2 to 3 m perforated pipe at the bottom lowered in a borehole (100 to 150 mm) drilled down into the confined aquifer. The perforated portion of the tube has to be positioned against the bottom of the confined aquifer with clean sorted gravel shrouded between the tube and the borehole surface. Rest of the borehole may be filled with unsorted gravel or clay.
The observation wells/piezometers are to be monitored at least four times in a year, i.e., in the months of January, May, August and November. Data collected from these wells, provide more meaningful record / database and clarity in the changes in the ground water regime in the Project area.
Digital water level recorders, which collect water level information automatically ranging in time from 1 hour to 1 month, provide accurate and valuable data for groundwater management. The recorder is an electronic device which is installed within the water column of the observation well. The device collects the groundwater level data at the desired interval of time and stores the digital data on board which can be retrieved through data retrieval systems or handheld computers and can be downloaded directly into office computers for further analysis. Groundwater chemical quality monitoring also can be done through these devices with appropriate add-on probes.
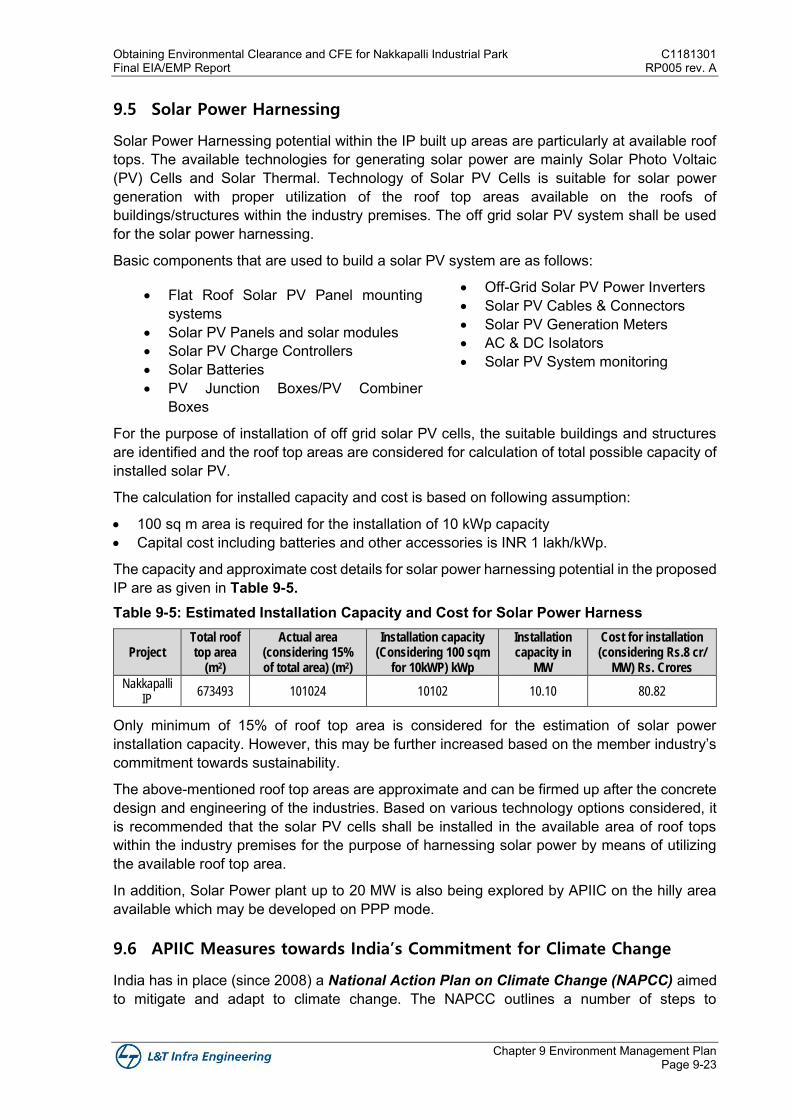
Obtaining Environmental Clearance and CFE for Nakkapalli Industrial Park C1181301 Final EIA/EMP Report RP005 rev. A
Chapter 9 Environment Management Plan Page 9-23
9.5 Solar Power Harnessing
Solar Power Harnessing potential within the IP built up areas are particularly at available roof tops. The available technologies for generating solar power are mainly Solar Photo Voltaic (PV) Cells and Solar Thermal. Technology of Solar PV Cells is suitable for solar power generation with proper utilization of the roof top areas available on the roofs of buildings/structures within the industry premises. The off grid solar PV system shall be used for the solar power harnessing.
Basic components that are used to build a solar PV system are as follows:
• Flat Roof Solar PV Panel mounting systems
• Solar PV Panels and solar modules • Solar PV Charge Controllers • Solar Batteries • PV Junction Boxes/PV Combiner
Boxes
• Off-Grid Solar PV Power Inverters • Solar PV Cables & Connectors • Solar PV Generation Meters • AC & DC Isolators • Solar PV System monitoring
For the purpose of installation of off grid solar PV cells, the suitable buildings and structures are identified and the roof top areas are considered for calculation of total possible capacity of installed solar PV.
The calculation for installed capacity and cost is based on following assumption:
• 100 sq m area is required for the installation of 10 kWp capacity • Capital cost including batteries and other accessories is INR 1 lakh/kWp.
The capacity and approximate cost details for solar power harnessing potential in the proposed IP are as given in Table 9-5. Table 9-5: Estimated Installation Capacity and Cost for Solar Power Harness
Project Total roof top area
(m2)
Actual area (considering 15% of total area) (m2)
Installation capacity (Considering 100 sqm
for 10kWP) kWp
Installation capacity in
MW
Cost for installation (considering Rs.8 cr/
MW) Rs. Crores
Nakkapalli IP
673493 101024 10102 10.10 80.82
Only minimum of 15% of roof top area is considered for the estimation of solar power installation capacity. However, this may be further increased based on the member industry’s commitment towards sustainability.
The above-mentioned roof top areas are approximate and can be firmed up after the concrete design and engineering of the industries. Based on various technology options considered, it is recommended that the solar PV cells shall be installed in the available area of roof tops within the industry premises for the purpose of harnessing solar power by means of utilizing the available roof top area.
In addition, Solar Power plant up to 20 MW is also being explored by APIIC on the hilly area available which may be developed on PPP mode.
9.6 APIIC Measures towards India’s Commitment for Climate Change
India has in place (since 2008) a National Action Plan on Climate Change (NAPCC) aimed to mitigate and adapt to climate change. The NAPCC outlines a number of steps to
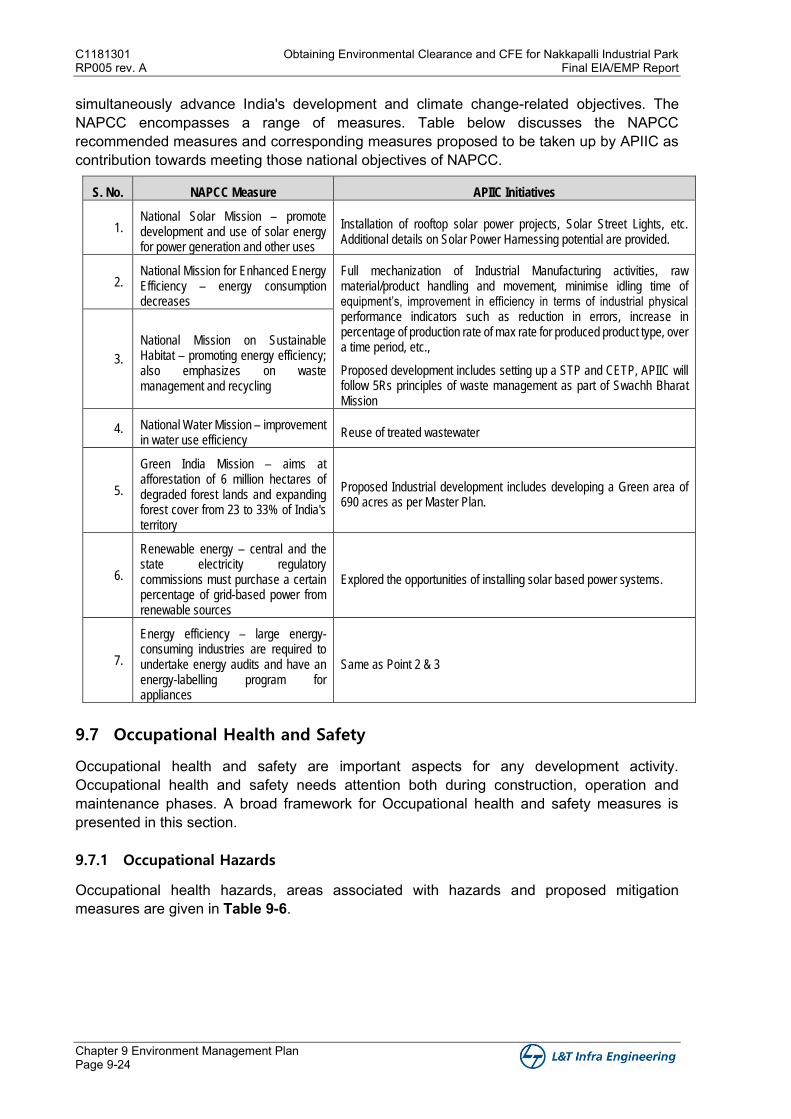
C1181301 Obtaining Environmental Clearance and CFE for Nakkapalli Industrial Park RP005 rev. A Final EIA/EMP Report
Chapter 9 Environment Management Plan Page 9-24
simultaneously advance India's development and climate change-related objectives. The NAPCC encompasses a range of measures. Table below discusses the NAPCC recommended measures and corresponding measures proposed to be taken up by APIIC as contribution towards meeting those national objectives of NAPCC.
S. No. NAPCC Measure APIIC Initiatives
1. National Solar Mission – promote development and use of solar energy for power generation and other uses
Installation of rooftop solar power projects, Solar Street Lights, etc. Additional details on Solar Power Harnessing potential are provided.
2. National Mission for Enhanced Energy Efficiency – energy consumption decreases
Full mechanization of Industrial Manufacturing activities, raw material/product handling and movement, minimise idling time of equipment’s, improvement in efficiency in terms of industrial physical performance indicators such as reduction in errors, increase in percentage of production rate of max rate for produced product type, over a time period, etc.,
Proposed development includes setting up a STP and CETP, APIIC will follow 5Rs principles of waste management as part of Swachh Bharat Mission
3.
National Mission on Sustainable Habitat – promoting energy efficiency; also emphasizes on waste management and recycling
4. National Water Mission – improvement in water use efficiency
Reuse of treated wastewater
5.
Green India Mission – aims at afforestation of 6 million hectares of degraded forest lands and expanding forest cover from 23 to 33% of India's territory
Proposed Industrial development includes developing a Green area of 690 acres as per Master Plan.
6.
Renewable energy – central and the state electricity regulatory commissions must purchase a certain percentage of grid-based power from renewable sources
Explored the opportunities of installing solar based power systems.
7.
Energy efficiency – large energy-consuming industries are required to undertake energy audits and have an energy-labelling program for appliances
Same as Point 2 & 3
9.7 Occupational Health and Safety
Occupational health and safety are important aspects for any development activity. Occupational health and safety needs attention both during construction, operation and maintenance phases. A broad framework for Occupational health and safety measures is presented in this section.
9.7.1 Occupational Hazards
Occupational health hazards, areas associated with hazards and proposed mitigation measures are given in Table 9-6.
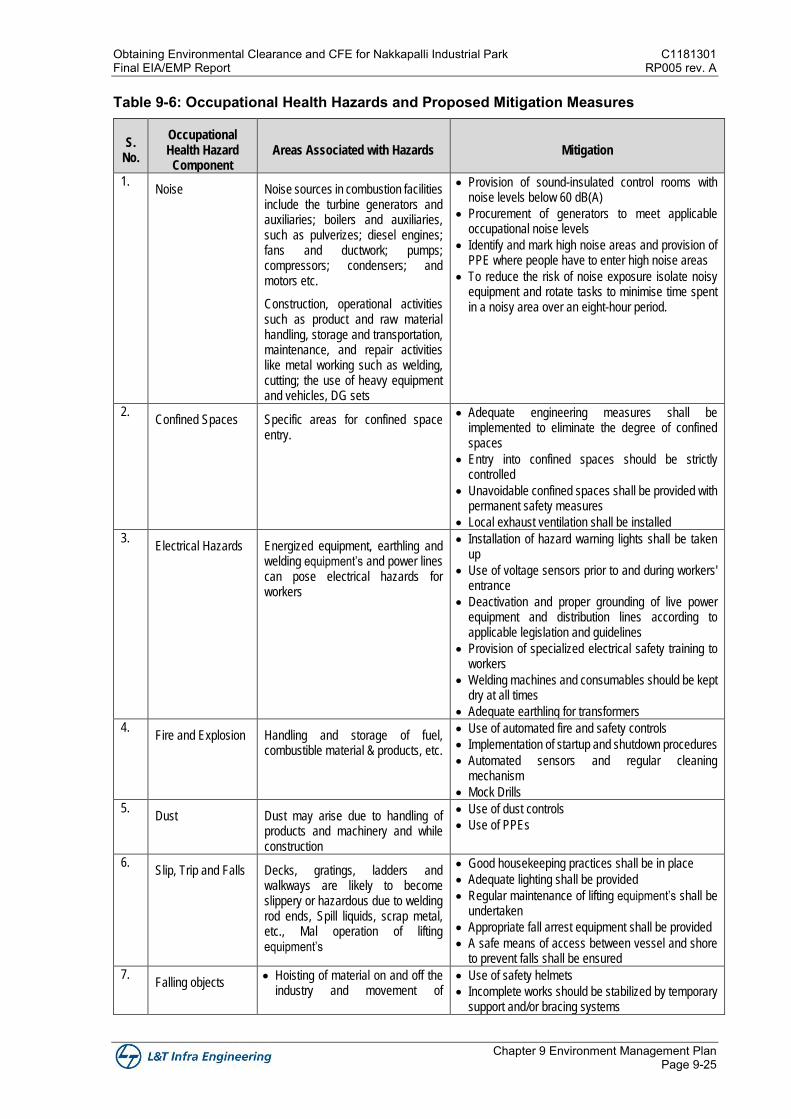
Obtaining Environmental Clearance and CFE for Nakkapalli Industrial Park C1181301 Final EIA/EMP Report RP005 rev. A
Chapter 9 Environment Management Plan Page 9-25
Table 9-6: Occupational Health Hazards and Proposed Mitigation Measures
S. No.
Occupational Health Hazard
Component Areas Associated with Hazards Mitigation
1. Noise Noise sources in combustion facilities
include the turbine generators and auxiliaries; boilers and auxiliaries, such as pulverizes; diesel engines; fans and ductwork; pumps; compressors; condensers; and motors etc.
Construction, operational activities such as product and raw material handling, storage and transportation, maintenance, and repair activities like metal working such as welding, cutting; the use of heavy equipment and vehicles, DG sets
• Provision of sound-insulated control rooms with noise levels below 60 dB(A)
• Procurement of generators to meet applicable occupational noise levels
• Identify and mark high noise areas and provision of PPE where people have to enter high noise areas
• To reduce the risk of noise exposure isolate noisy equipment and rotate tasks to minimise time spent in a noisy area over an eight-hour period.
2. Confined Spaces Specific areas for confined space
entry.
• Adequate engineering measures shall be implemented to eliminate the degree of confined spaces
• Entry into confined spaces should be strictly controlled
• Unavoidable confined spaces shall be provided with permanent safety measures
• Local exhaust ventilation shall be installed
3. Electrical Hazards Energized equipment, earthling and
welding equipment’s and power lines can pose electrical hazards for workers
• Installation of hazard warning lights shall be taken up
• Use of voltage sensors prior to and during workers' entrance
• Deactivation and proper grounding of live power equipment and distribution lines according to applicable legislation and guidelines
• Provision of specialized electrical safety training to workers
• Welding machines and consumables should be kept dry at all times
• Adequate earthling for transformers
4. Fire and Explosion Handling and storage of fuel,
combustible material & products, etc.
• Use of automated fire and safety controls
• Implementation of startup and shutdown procedures
• Automated sensors and regular cleaning mechanism
• Mock Drills
5. Dust Dust may arise due to handling of
products and machinery and while construction
• Use of dust controls
• Use of PPEs
6. Slip, Trip and Falls Decks, gratings, ladders and
walkways are likely to become slippery or hazardous due to welding rod ends, Spill liquids, scrap metal, etc., Mal operation of lifting equipment’s
• Good housekeeping practices shall be in place
• Adequate lighting shall be provided
• Regular maintenance of lifting equipment’s shall be undertaken
• Appropriate fall arrest equipment shall be provided
• A safe means of access between vessel and shore to prevent falls shall be ensured
7. Falling objects
• Hoisting of material on and off the industry and movement of
• Use of safety helmets
• Incomplete works should be stabilized by temporary support and/or bracing systems
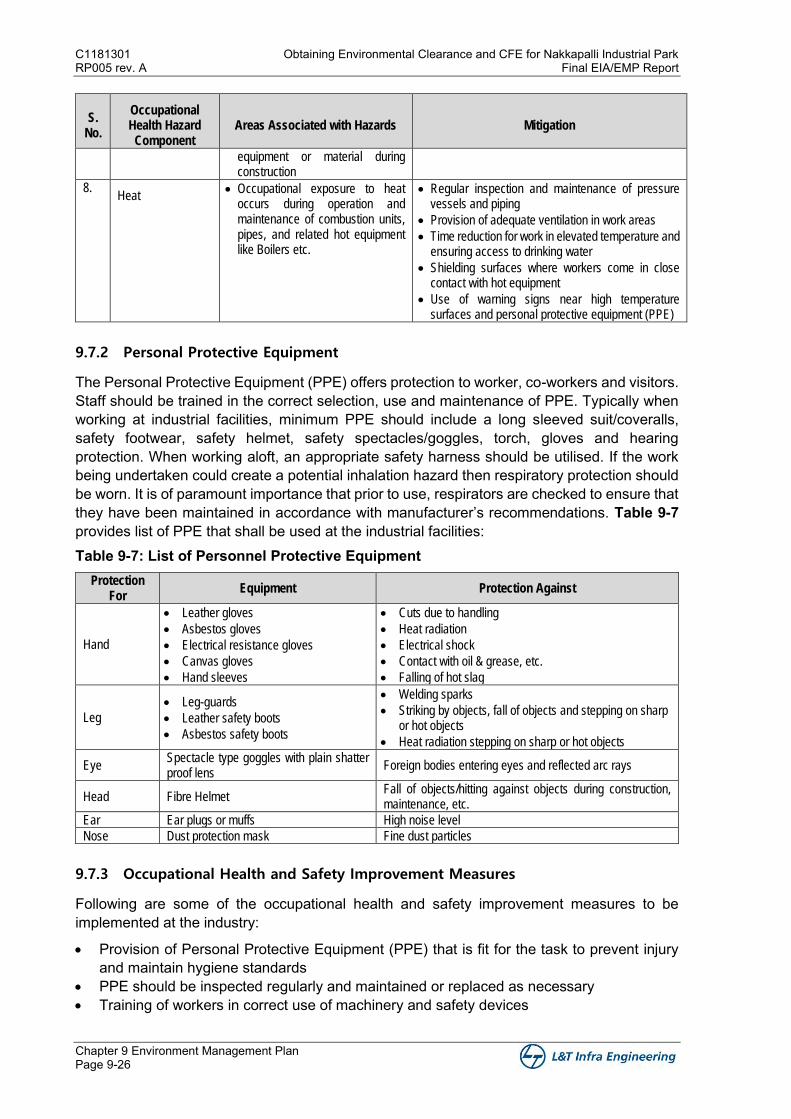
C1181301 Obtaining Environmental Clearance and CFE for Nakkapalli Industrial Park RP005 rev. A Final EIA/EMP Report
Chapter 9 Environment Management Plan Page 9-26
S. No.
Occupational Health Hazard
Component Areas Associated with Hazards Mitigation
equipment or material during construction
8. Heat
• Occupational exposure to heat occurs during operation and maintenance of combustion units, pipes, and related hot equipment like Boilers etc.
• Regular inspection and maintenance of pressure vessels and piping
• Provision of adequate ventilation in work areas
• Time reduction for work in elevated temperature and ensuring access to drinking water
• Shielding surfaces where workers come in close contact with hot equipment
• Use of warning signs near high temperature surfaces and personal protective equipment (PPE)
9.7.2 Personal Protective Equipment
The Personal Protective Equipment (PPE) offers protection to worker, co-workers and visitors. Staff should be trained in the correct selection, use and maintenance of PPE. Typically when working at industrial facilities, minimum PPE should include a long sleeved suit/coveralls, safety footwear, safety helmet, safety spectacles/goggles, torch, gloves and hearing protection. When working aloft, an appropriate safety harness should be utilised. If the work being undertaken could create a potential inhalation hazard then respiratory protection should be worn. It is of paramount importance that prior to use, respirators are checked to ensure that they have been maintained in accordance with manufacturer’s recommendations. Table 9-7 provides list of PPE that shall be used at the industrial facilities: Table 9-7: List of Personnel Protective Equipment
Protection For
Equipment Protection Against
Hand
• Leather gloves
• Asbestos gloves
• Electrical resistance gloves
• Canvas gloves
• Hand sleeves
• Cuts due to handling
• Heat radiation
• Electrical shock
• Contact with oil & grease, etc.
• Falling of hot slag
Leg
• Leg-guards
• Leather safety boots
• Asbestos safety boots
• Welding sparks
• Striking by objects, fall of objects and stepping on sharp or hot objects
• Heat radiation stepping on sharp or hot objects
Eye Spectacle type goggles with plain shatter proof lens
Foreign bodies entering eyes and reflected arc rays
Head Fibre Helmet Fall of objects/hitting against objects during construction, maintenance, etc.
Ear Ear plugs or muffs High noise level
Nose Dust protection mask Fine dust particles
9.7.3 Occupational Health and Safety Improvement Measures
Following are some of the occupational health and safety improvement measures to be implemented at the industry:
• Provision of Personal Protective Equipment (PPE) that is fit for the task to prevent injury and maintain hygiene standards
• PPE should be inspected regularly and maintained or replaced as necessary • Training of workers in correct use of machinery and safety devices
Obtaining Environmental Clearance and CFE for Nakkapalli Industrial Park C1181301 Final EIA/EMP Report RP005 rev. A
Chapter 9 Environment Management Plan Page 9-27
• Installation of mechanical lifting aids where possible and rotate work tasks to reduce repetitive activities
• Separation of people from moving equipment • Installation of walkways to separate people from vehicles or moving parts to reduce risk of
collision
9.7.4 Health Monitoring
APIIC will establish an occupational health service centre within the Industrial park premises to promote and maintain physical, mental and social well-being of the employees. The member industry will also be equipped to detect and prevent occupational/work related diseases and shall offer effective emergency and injury care. The centre will develop health education training packages including use of PPE for all employees and impart training accordingly. Occupational Health Service shall arrange to provide adequate number of First Aid Boxes with approved contents on the shop floor. Ambulance will also be provided to meet any emergency situations.
The records of health check-up of all employees will be maintained. The occurrence of occupational health hazards and diseases will also be maintained. The records may be reviewed at regular intervals to check the effectiveness of various measures implemented. Based on the review, action plan to improve the effectiveness of occupational health and safety measures shall be prepared.
9.7.5 Safety
Overall safety of men and material is an important aspect of project performance. APIIC shall implement separate safety measures applicable to the infrastructure development and the Safety Engineer shall be engaged to coordinate the safety aspects with member industries. All applicable National Safety standards shall be implemented by APIIC to provide safe working environment.
9.7.5.1 Safety Circle
In order to fully develop the capabilities of the employees in identification of hazardous processes and improving safety and health, safety circles would be constituted in each member industry. The circle shall consist of 5-6 employees from that area. The circle shall normally meet for about an hour every week.
9.7.5.2 Safety Training
Safety training shall be provided by the Safety Engineer on a regular basis at member industry. In addition to regular employees, contract employees/labours shall also be provided safety training.
9.8 Budgetary Estimates
9.8.1 Budgetary Estimate for Environmental Management
The budgetary estimate (Capital Cost) for Environmental Management is INR ~ 2609 million (~ 260.9 Crores) and the annual recurring cost is INR 139 million (13.9 Crores). The breakup of cost is given in Table 9-8 and Table 9-9.
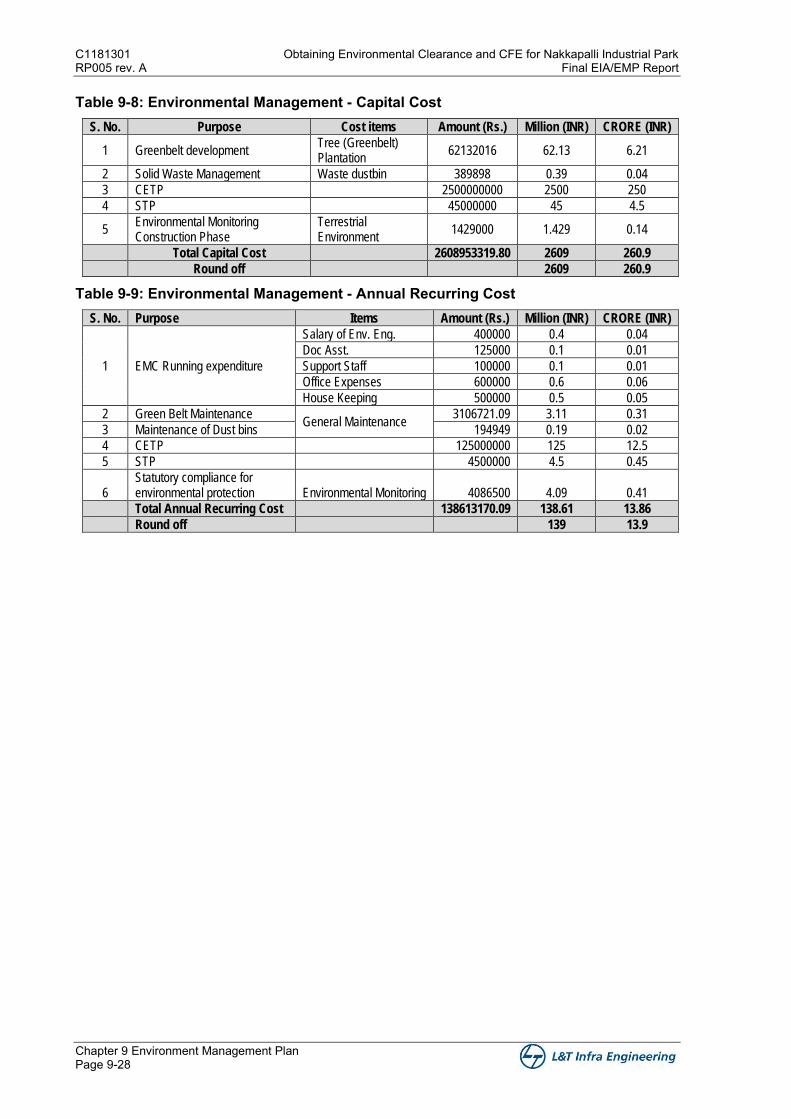
C1181301 Obtaining Environmental Clearance and CFE for Nakkapalli Industrial Park RP005 rev. A Final EIA/EMP Report
Chapter 9 Environment Management Plan Page 9-28
Table 9-8: Environmental Management - Capital Cost S. No. Purpose Cost items Amount (Rs.) Million (INR) CRORE (INR)
1 Greenbelt development Tree (Greenbelt) Plantation
62132016 62.13 6.21
2 Solid Waste Management Waste dustbin 389898 0.39 0.04
3 CETP 2500000000 2500 250
4 STP 45000000 45 4.5
5 Environmental Monitoring Construction Phase
Terrestrial Environment
1429000 1.429 0.14
Total Capital Cost 2608953319.80 2609 260.9 Round off 2609 260.9
Table 9-9: Environmental Management - Annual Recurring Cost S. No. Purpose Items Amount (Rs.) Million (INR) CRORE (INR)
1 EMC Running expenditure
Salary of Env. Eng. 400000 0.4 0.04
Doc Asst. 125000 0.1 0.01
Support Staff 100000 0.1 0.01
Office Expenses 600000 0.6 0.06
House Keeping 500000 0.5 0.05
2 Green Belt Maintenance General Maintenance
3106721.09 3.11 0.31
3 Maintenance of Dust bins 194949 0.19 0.02
4 CETP 125000000 125 12.5
5 STP 4500000 4.5 0.45
6 Statutory compliance for environmental protection Environmental Monitoring 4086500 4.09 0.41
Total Annual Recurring Cost 138613170.09 138.61 13.86
Round off 139 13.9
Chapter 10
Summary and Conclusion

Obtaining Environmental Clearance and CFE for Nakkapalli Industrial Park C1181301 Final EIA/EMP Report RP005 rev. A
Chapter 10 Summary and Conclusion Page 10-1
Chapter 10 Summary and Conclusion
10.1 Introduction
Andhra Pradesh Industrial Infrastructure Corporation Limited (APIIC) is government undertaking organization responsible for development of industrial infrastructure in the state of Andhra Pradesh. The Visakhapatnam district is known as the central hub for industry and education in the state of Andhra Pradesh. APIIC proposed to promote the industrialisation at Nakkapalli Mandal.
As part of the mandate, APIIC propose to develop Industrial Park in Nakkapalli mandal, Visakhapatnam District in an area of 3899 acres (1578 Ha).The site is located at a distance of about 260 km from state capital, Amaravathi towards north and 60 km south of Visakhapatnam, district headquarters.APIIC intends to provide world class eco system for manufacturing industries and proposes to establish infrastructure facilities for the proposed industrial Park.
The infrastructure development being proposed includes water supply, water distribution, internal roads, storm water drains, electrical distribution network, internal street lighting, wastewater and waste management facilities, other utilities such as technical and support buildings, housing along with allied facilities. Apart from industrial area there will be technical infrastructure facilities, amenities & utilities, township and logistics facilities.
APIIC is in the possession of 2849.83 acres out of which private land is 2001.99 acres and government land is 847.84 acres and requisition for land acquisition has been filed for remaining government land of 1049.98 acres.
10.1.1 Project Location
The Project site is falling in Butchirajupeta, D L Puram, Vempadu, Chandanada, Rajayyapeta villages in Nakkapalli Mandal of Visakhapatnam district in Andhra Pradesh.
10.1.2 Need and Justification of Project Development
As per the existing industrial scenario and investor interests expressed through MoUs in Visakhapatnam, the following are key industrial sectors that emerge as top contributors in Visakhapatnam district.
1. Chemicals and Petrochemicals 2. Pharmaceuticals 3. Food Processing 4. Textile and Apparel 5. Engineering Industries 6. Electronics 7. Aerospace 8. Defence 9. Non-metallic minerals 10. MSME 11. Auto and Auto components
In addition, new industries which may be attracted to the industrial park were identified by assessing the focus sectors of the Government of Andhra Pradesh and Government of India, globally emerging industries, technology-driven hi-tech industries, and industries that were
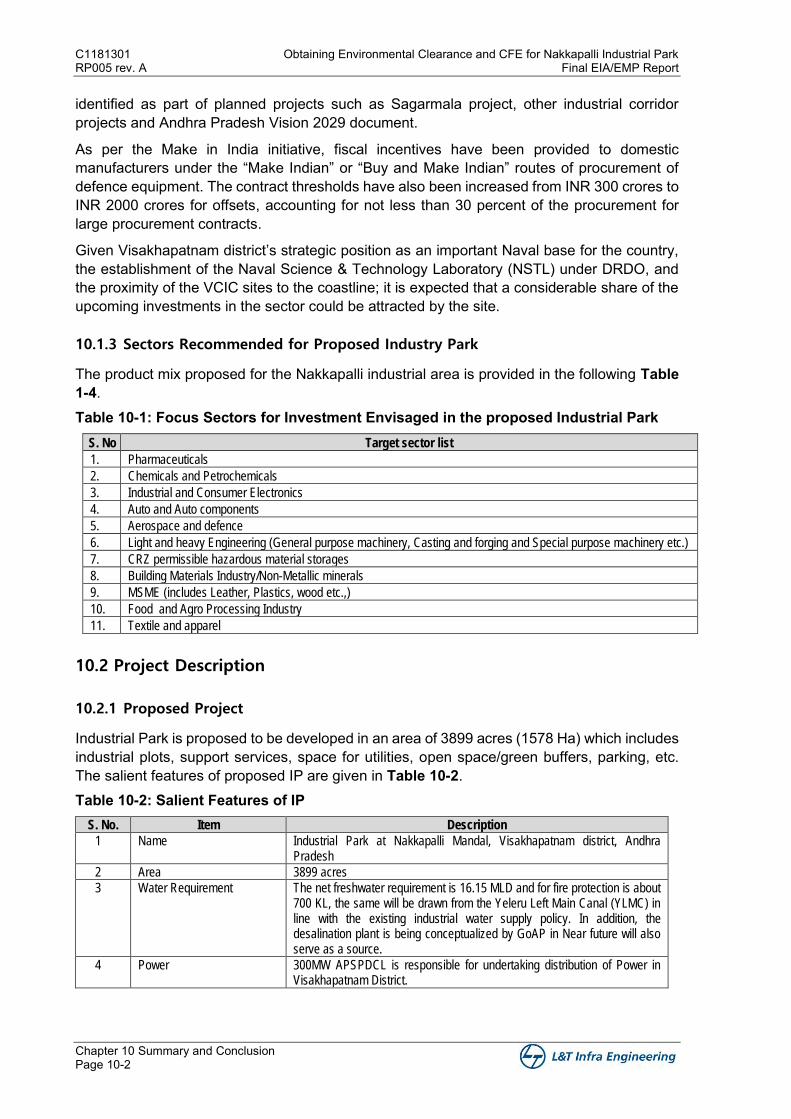
C1181301 Obtaining Environmental Clearance and CFE for Nakkapalli Industrial Park RP005 rev. A Final EIA/EMP Report
Chapter 10 Summary and Conclusion Page 10-2
identified as part of planned projects such as Sagarmala project, other industrial corridor projects and Andhra Pradesh Vision 2029 document.
As per the Make in India initiative, fiscal incentives have been provided to domestic manufacturers under the “Make Indian” or “Buy and Make Indian” routes of procurement of defence equipment. The contract thresholds have also been increased from INR 300 crores to INR 2000 crores for offsets, accounting for not less than 30 percent of the procurement for large procurement contracts.
Given Visakhapatnam district’s strategic position as an important Naval base for the country, the establishment of the Naval Science & Technology Laboratory (NSTL) under DRDO, and the proximity of the VCIC sites to the coastline; it is expected that a considerable share of the upcoming investments in the sector could be attracted by the site.
10.1.3 Sectors Recommended for Proposed Industry Park
The product mix proposed for the Nakkapalli industrial area is provided in the following Table 1-4. Table 10-1: Focus Sectors for Investment Envisaged in the proposed Industrial Park
S. No Target sector list
1. Pharmaceuticals
2. Chemicals and Petrochemicals
3. Industrial and Consumer Electronics
4. Auto and Auto components
5. Aerospace and defence
6. Light and heavy Engineering (General purpose machinery, Casting and forging and Special purpose machinery etc.)
7. CRZ permissible hazardous material storages
8. Building Materials Industry/Non-Metallic minerals
9. MSME (includes Leather, Plastics, wood etc.,)
10. Food and Agro Processing Industry
11. Textile and apparel
10.2 Project Description
10.2.1 Proposed Project
Industrial Park is proposed to be developed in an area of 3899 acres (1578 Ha) which includes industrial plots, support services, space for utilities, open space/green buffers, parking, etc. The salient features of proposed IP are given in Table 10-2. Table 10-2: Salient Features of IP
S. No. Item Description
1 Name Industrial Park at Nakkapalli Mandal, Visakhapatnam district, Andhra Pradesh
2 Area 3899 acres
3 Water Requirement The net freshwater requirement is 16.15 MLD and for fire protection is about 700 KL, the same will be drawn from the Yeleru Left Main Canal (YLMC) in line with the existing industrial water supply policy. In addition, the desalination plant is being conceptualized by GoAP in Near future will also serve as a source.
4 Power 300MW APSPDCL is responsible for undertaking distribution of Power in Visakhapatnam District.
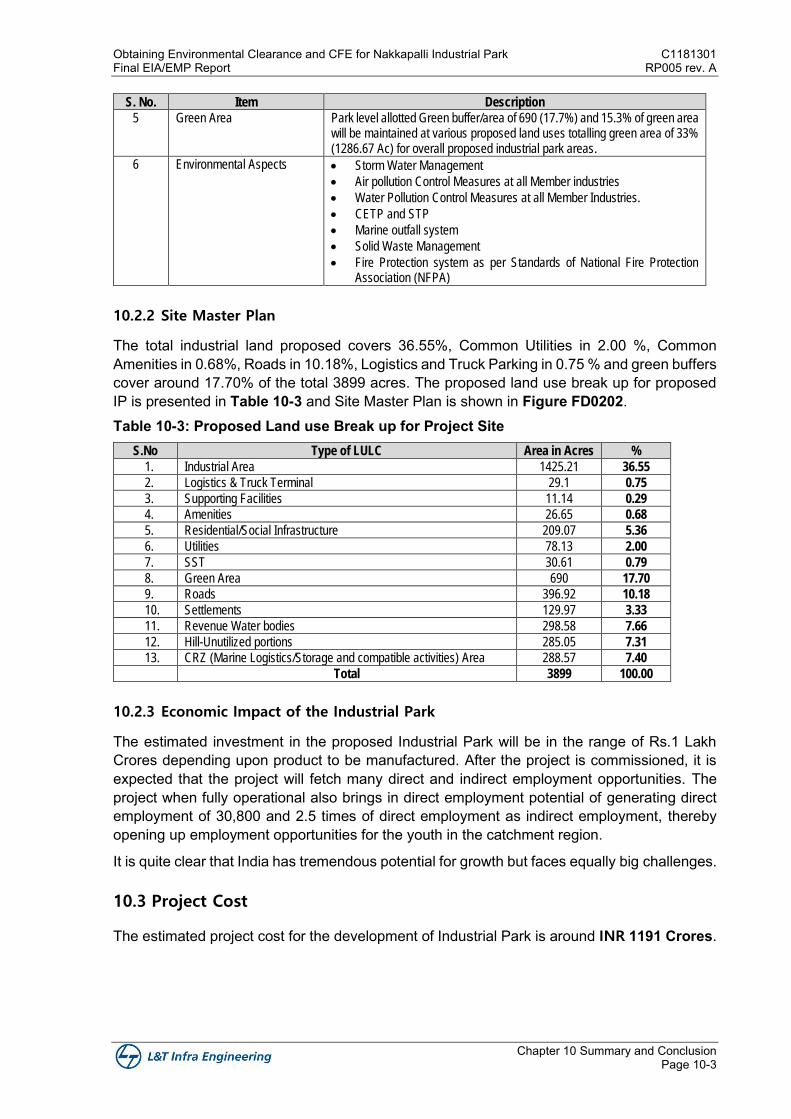
Obtaining Environmental Clearance and CFE for Nakkapalli Industrial Park C1181301 Final EIA/EMP Report RP005 rev. A
Chapter 10 Summary and Conclusion Page 10-3
S. No. Item Description
5 Green Area Park level allotted Green buffer/area of 690 (17.7%) and 15.3% of green area will be maintained at various proposed land uses totalling green area of 33% (1286.67 Ac) for overall proposed industrial park areas.
6 Environmental Aspects • Storm Water Management
• Air pollution Control Measures at all Member industries
• Water Pollution Control Measures at all Member Industries.
• CETP and STP
• Marine outfall system
• Solid Waste Management
• Fire Protection system as per Standards of National Fire Protection Association (NFPA)
10.2.2 Site Master Plan
The total industrial land proposed covers 36.55%, Common Utilities in 2.00 %, Common Amenities in 0.68%, Roads in 10.18%, Logistics and Truck Parking in 0.75 % and green buffers cover around 17.70% of the total 3899 acres. The proposed land use break up for proposed IP is presented in Table 10-3 and Site Master Plan is shown in Figure FD0202. Table 10-3: Proposed Land use Break up for Project Site
S.No Type of LULC Area in Acres %
1. Industrial Area 1425.21 36.55
2. Logistics & Truck Terminal 29.1 0.75
3. Supporting Facilities 11.14 0.29
4. Amenities 26.65 0.68
5. Residential/Social Infrastructure 209.07 5.36
6. Utilities 78.13 2.00
7. SST 30.61 0.79
8. Green Area 690 17.70
9. Roads 396.92 10.18
10. Settlements 129.97 3.33
11. Revenue Water bodies 298.58 7.66
12. Hill-Unutilized portions 285.05 7.31
13. CRZ (Marine Logistics/Storage and compatible activities) Area 288.57 7.40
Total 3899 100.00
10.2.3 Economic Impact of the Industrial Park
The estimated investment in the proposed Industrial Park will be in the range of Rs.1 Lakh Crores depending upon product to be manufactured. After the project is commissioned, it is expected that the project will fetch many direct and indirect employment opportunities. The project when fully operational also brings in direct employment potential of generating direct employment of 30,800 and 2.5 times of direct employment as indirect employment, thereby opening up employment opportunities for the youth in the catchment region.
It is quite clear that India has tremendous potential for growth but faces equally big challenges.
10.3 Project Cost
The estimated project cost for the development of Industrial Park is around INR 1191 Crores.
C1181301 Obtaining Environmental Clearance and CFE for Nakkapalli Industrial Park RP005 rev. A Final EIA/EMP Report
Chapter 10 Summary and Conclusion Page 10-4
10.4 Description of Environment
Project Influence Area (PIA)/Study Area: An area covering 10 km radius from IP boundary has been earmarked as study area for baseline environmental surveys.
Study Period: The baseline environmental surveys were carried out during summer season, 2018.
10.4.1 Environment
• The site is mostly comprised of agriculture, plantation; fallow; barren, uncultivable, wasteland/scrubland; water bodies and settlements located within the site.
• Generally, the existing terrain of the entire project site is relatively flat and gentle. Existing ground elevation is ranging from 0m to 126 m.
• Proposed IP site falls under Seismic Zone II (Least Active Zone) as per IS 1893 (Part I) as per Flood-Hazard map of AP.
• As per the Project site specific meteorological data, the predominant wind directions observed were from South West followed by North East;
• Air quality:
Maximum concentrations of Sulphur Dioxide (SO2), Nitrogen Dioxide (NO2), Particulate Matter (PM2.5), Particulate Matter (PM10), Carbon Monoxide (CO), Ozone (O3), Ammonia (NH3), Lead (Pb), Benzene (C6H6), Benzo (a) Pyrene (BaP) – Particulate phase only, Arsenic (As), Nickel (Ni), are well within the National Ambient Air Quality Standards for Residential areas at all monitoring locations during the study period.
• PM10 ranged between 35.3 µg/m3 to 65.5 µg/m3. NAAQ stipulated standard for PM10 for 24 hr. average is 100 µg/m3.
• PM2.5 values varied from 20.1 µg/m3 to 32.3 µg/m3. NAAQ stipulated standard for PM2.5 for 24 hr. average is 60 µg/m3.
• SO2 levels observed 11.2 µg/m3to18.5 µg/m3. NAAQ stipulated standard for SO2 for 24 hr. average is 80 µg/m3.
• NO2 ranged between 15 µg/m3 to 23.5 µg/m3. NAAQ stipulated standard for NO2 for 24 hr. average is 80 µg/m3.
• O3, CO, NH3, Pb, C6H6, BaP, As, and Ni were observed below detectable limits in all the locations.
• Noise quality:
It is observed that the day and night equivalent noise levels at all locations are well within the prescribed CPCB standards.
• Day equivalent noise levels (Ld) ranged between 44.68 dB(A) to 55.37 dB (A) • Night equivalent noise levels (Ln) ranged between 39.85 dB(A) to 50.98 dB (A)
Water quality:
• All the parameters of groundwater samples except iron are within the permissible limits specified for drinking water quality standards as per IS: 10500 (2012). Total Dissolved Solids, Alkalinity, Hardness, Magnesium and Chlorides are above the desirable limits but within the permissible limits in all the locations.
• It is inferred that almost of the parameters for surface water sample are within the permissible limits as per ISI-IS2296-1982 Class C (Drinking water source with conventional treatment followed by disinfection) Standards for use-based Classification of Surface Water
Obtaining Environmental Clearance and CFE for Nakkapalli Industrial Park C1181301 Final EIA/EMP Report RP005 rev. A
Chapter 10 Summary and Conclusion Page 10-5
• Soil types are Sandy Clay loam and the soil samples are slightly alkaline in nature. • None of the plant species recorded either from the core area or Project influence area
belongs to the Rare/Endangered/Endemic/Threatened category.
There are no forests or wildlife sanctuaries or biosphere reserves or nesting or breeding grounds for any of the rare species or other protected areas within the core area. Reserve forests of dense scrub and fairy dense scrub are located within the buffer/study area.
10.5 Marine Environment
The baseline data was collected in June, 2018. Water and sediment samples for physico-chemical, petroleum hydrocarbons, heavy metals and biological analysis were collected from Seven (7) locations including two (2) intertidal locations.
Sediment Quality
• Sand ranged between 2.34% and 89.57% • Silt ranged between 7.14% and 10.22% • Clay ranged between 0.76% and 52% • pH is alkaline in nature and varied from 8 to 8.2 • Oil and Grease concentration varied between 0.06 μg/g to 0.08 μg/g • Cadmium values ranged from 0.14 µg/g to 0.17 µg/g • Copper ranged between 6.25 µg/g to 7.5 µg/g • Iron ranged between 120 µg/g to 199 µg/g • Lead ranged between 2.10 µg/g to 2.55 µg/g • Zinc ranged between 1.45 µg/g to 1.78 µg/g • Mercury concentration was below detectable level for all locations • Nickel ranged between 2.9 µg/g to 3.88 µg/g • Coliform population varied between 16 CFU/g and 17 CFU/g • E. coli population varied between 11 CFU/g and 13 CFU/g • Faecal Coliform population ranged between 71 x103 to 95 x 103 • Vibrio sp. population ranged between 20 x 102 CFU/g to 31 x 102 CFU/g • Macro benthos Maximum density is 992 Nos/m2 and Minimum Density is 914 Nos/m2 • Meiofauna density was ranged between 315 nos/10 cm2 and 497 nos/10 cm2
Water Quality
• Water temperature ranged from 28.7°C to 29.6°C • Minimum and Maximum Salinity recorded varied between 34.5 ppt and 35 ppt • pH ranged between 8 to 8.2 • Total suspended Solids varied from 64 mg/l to 106 mg/l • Turbidity varied from 30.42 NTU to 34.45 NTU • Dissolved Oxygen (DO) varied from 5 mg/l to 5.2 mg/l • BOD ranged between 1.3 mg/l to 1.6 mg/l • Chemical Oxygen Demand varied from 182 mg/l to 212 mg/l • Nitrite concentration ranged between 0.68 µmol/l to 0.88 µmol/l • Nitrate concentration ranged between 0.17 µmol/l to 0.24 µmol/l • Ammonical Nitrogen concentration ranged between 0.63 µmol/l to 0.71 µmol/l • Total Phosphate concentration ranged between 1.2 µmol/l to 2.0 µmol/l • Silicate concentration ranged between 33 µmol/l to 39 µmol/l • Cadmium varies between 0.001 µg/l and 0.002 µg/l • Copper concentration ranged between 0.031 µg/l to 0.045 µg/l • Iron concentration ranged between 0.041 µg/l and 0.048 µg/l
C1181301 Obtaining Environmental Clearance and CFE for Nakkapalli Industrial Park RP005 rev. A Final EIA/EMP Report
Chapter 10 Summary and Conclusion Page 10-6
• Zinc concentration range is 0.40 µg/l and 0.47 µg/l • Phytoplankton density was recorded as 20.5 x 10³ and 31.8 x 10³ • Zooplankton density was between 835.47 x 10²/m3 and 996.76 x 10²/m3 • Coliform population varied between 12 CFU/100ml of water and 15 CFU/100ml. • The maximum E. coli population observed is 7 CFU/ml. • Faecal Coliform population ranged between 33 x 103 CFU/ml and 53 x 103 CFU/ml. • Vibrio sp. population ranged between 9 x 10² CFU/ml and 18 x 102 CFU/ml.
10.5.1 Socio-economic Conditions
• The village mandals falling in the study area are Nakkapalle, Payakaraopeta and S.Rayavaram
• In the study area of 10.0 km covers 48 villages including hamlets in the 3 mandals. • In the study area, the population is 1,46,664 of which males are 49.76% and females are
50.24%. The sex ratio of the study area is 1008 females over 1000 males • The literate population in the study area is 71,116 which constitute to be 46.94% of the
total population of the study area • The working population in the project area are 60908 out of which males are constituted to
71.45% and females account to 28.55% • The study area of 10.0 km radius from project site covers 14 fishing villages • Traditional fishermen families are 5127 with Fisher folk population of 20501.
10.5.2 Archaeological Places
There are no archeological sites or monuments in the study area, rather the Visakhapatnam district has certain notified places in the state website.
10.6 Anticipated Environmental Impacts with Mitigation Measures
Anticipated impacts on the environmental and social attributes, which are likely to arise due to construction and operation of proposed project have been identified, predicted and evaluated and are presented.
• The IP is proposed to be developed in an area of 3899 acres. APIIC is in the possession of 2849.83 acres as on date
• There is a backwater/stream flowing within the site and a buffer of 100 m or width of the creek as per CRZ regulation is proposed and green areas will be developed in the buffer area. Major part of the stream is less than 100m width. As the stream width reduces, buffer equal to the width of the stream is proposed.
• The site will be developed to provide a gradient for collection of rainwater and diverting of the same into rain water harvesting pits.
• Construction camps will be provided with self-sufficient infrastructure to minimise impact/strain on the existing infrastructure.
• Industries will have their own treatment plants for effluent and sewage with reuse/recycle facility and a common effluent treatment facility also will be provided
• A part of the treated wastewater will be used for maintaining the greenbelt within the industries and the balance will be reused at the units as non-potable water for various applications.
• The fresh water will be sourced from the industrial water supply scheme for APIIC from Yeleru Left Main Canal (YLMC) which is located at ~38.5 km from the project site.
Obtaining Environmental Clearance and CFE for Nakkapalli Industrial Park C1181301 Final EIA/EMP Report RP005 rev. A
Chapter 10 Summary and Conclusion Page 10-7
• Though the proposed development will not draw Ground water during its operation stage, rainwater harvesting system is suggested.
• All the necessary Air pollution control measures will be adopted by member industries to control the fugitive emissions of VoCs, particulates, organic vapours etc., shall be followed.
• The impact on air environment due to the stack emissions from paint shop, vehicular emissions, DG sets was carried out. The 1st highest 24 Hour average and Annual Average resultant concentrations of NOX, PM10, PM2.5 and SO2 at all receptor locations are found to be well within the National Ambient Air Quality Standards (NAAQS), 2009.
• The solid waste generated during construction phase may impact soil quality, water quality and public health if not regulated properly. Construction waste will be re-used within plant site for filling of low-lying areas. Other wastes which can be re-cycled will be sold and hazardous waste shall be stored as per prescribed safety norms and disposed through approved APPCB vendors. Also, strict guidelines will be put in place in order to manage the solid waste generation during the operational phase of the development.
10.7 Environmental Monitoring Programme
Environmental monitoring programme has been formulated and the same will be implemented. The effective implementation and close supervision of the environmental management to mitigate the environmental impacts, which are likely to arise due to the construction and operation phases of the project could be achieved through a suitable institutional mechanism.
10.8 Additional studies
10.8.1 Public Consultation
In line with the requirements of EIA Notification, 2006 (as amended) for Category A Industries listed in the EIA Notification, public hearing for proposed “Development of Industrial Park” at Butchirajupeta, D.L. Puram, Vempadu, Chandanada, Rajayyapeta villages in Nakkapalli Mandal, Visakhapatnam District, Andhra Pradesh was conducted on November 25, 2020 by APPCB. For conducting Public Hearing, the Draft EIA Report was prepared in accordance to MoEF& CC approved ToR and Executive summaries in English and Local (Telugu) languages were submitted to Andhra Pradesh Pollution Control Board (APPCB). The meeting was conducted by the panel consisting of Joint Collector, Visakhapatnam District, Andhra Pradesh and Environmental Engineer, Andhra Pradesh Pollution Control Board, Regional Office, Visakhapatnam. It was attended by the local public and public representatives.
10.8.2 Risk Analysis
Preliminary Risk analysis study was carried out to assess risks associated with the construction and operation of the proposed IP. Member industries or units coming up in the I.P has to carry out risk analysis by considering the hazards associated with handling of chemicals based on nature of process and inventory. A systematic risk analysis will help in identification of the hazards and associated risk. The risk assessment thus carried out also provides inputs for formulating the onsite Disaster Management Plan (DMP).
10.8.3 Disaster Management Plan
The Disaster Management Plan (DMP) is aimed to ensure safety of life, protection of environment, protection of installation, restoration of production and salvage operations in this
C1181301 Obtaining Environmental Clearance and CFE for Nakkapalli Industrial Park RP005 rev. A Final EIA/EMP Report
Chapter 10 Summary and Conclusion Page 10-8
same order of priorities. For effective implementation of DMP, it should be widely circulated, and a personnel training is to be provided through rehearsals/drills. To tackle the consequences of a major emergency inside the industry or immediate vicinity of the industry, a DMP has to be formulated.
A framework for DMP was prepared to minimise damages in the event of a disaster. An On-Site Emergency Preparedness Plan and Off-Site Emergency Preparedness Plan were broadly prepared to deal with emergencies and prevent disasters.
An institutional framework with clear assignment of roles and responsibilities was broadly prepared with which location of Emergency Control Centre and Assembly Points will be identified. Communication system and alarm systems for effective communication in the event of a disaster are broadly identified. DMP for natural hazards such as cyclones was broadly prepared. Mutual aid scheme, composition of District Level Emergency Committee and aspects relating to community involvement for dealing with off-site disasters were broadly prepared.
10.8.4 Traffic and Transportation Management Plan
The traffic survey and forecast carried out for Nakkapalli IP to understand the current traffic pattern and forecast projected in future. Currently, the traffic on NH-16 (Tuni-Visakhapatnam Road) is about 40,674 PCUs which has already crossed the capacity of the 4-lane road. Also, with the additional generated traffic from the Nakkapalli IP in future, it is recommended to widen the existing road from 4-lane to 6-lane.
10.8.5 Social Impact Assessment
This assessment is specifically addressing the potential impacts which will be generated as a result of proposed development.
• About 2849.83 acres of land is under possession of APIIC. No R&R is envisaged. • The impact on nearby settlements during construction phase will be due to air pollution and
the noise generating activities. However, the activities are limited to the construction phase and will cease upon completion of the construction. Necessary mitigation measures are proposed to be adopted.
• Construction of IP requires large work force. To ensure that there is no strain on the existing infrastructure, worker camps will be self-sufficient and would not relay on local resource.
• During the operation phase the Industrial Park is likely to generate direct employment of 30,800 and 2.5 times of direct employment as indirect employment.
• The local employment could be higher for unskilled labour due to the availability of this category at local level
• There will be improvement in living standards. General welfare will improve in the area as per capita income will go up in the post project period.
10.9 Project Benefits
The development of the IP at Nakkapalli is being envisaged by APIIC taking into consideration the overall development of Industries in the state. Similar such initiatives are undertaken across the state. The Nation, the State and the region will have impetuous benefits from such development, such as:
• Skill development and Training to the local population • Localizing the global/domestic value chain
Obtaining Environmental Clearance and CFE for Nakkapalli Industrial Park C1181301 Final EIA/EMP Report RP005 rev. A
Chapter 10 Summary and Conclusion Page 10-9
• Technology transfer • Foreign Direct Investment • Improved working condition • Shifting of manpower resources from low productivity to high productive activities • Augmentation of existing clusters • Diversifying the local industrial base • Shifting activities from unorganized to organized sector • Convergence of population and thereby enhanced local consumption and spending • Project development will also attract hotel business, banking sector, small eateries,
construction, transport and other supply services • Better quality of educational and medical facilities to the local people • Improved Local Infrastructure • Improved socio-economic conditions
o Health facilities o Education Facilities o Employment Opportunities
• Increase in Per Capita Income • Revenue Generation
10.10 Corporate Environment Responsibility (CER)
As a responsible company towards the conservation, restoration and redevelopment of ecosystem and environmental conditions in the vicinity of the IP, APIIC shall implement the Corporate Environmental Responsibility (CER) activities. CER budget worked out are Rs.15.41 Crores.
The following are the areas/activities identified under Corporate Environment Responsibility and given along with budgetary provision
• Female Literacy Higher Education at Secondary School level - Merit girls to be awarded • Toilets as per the requirements to be constructed to Support Swachh Bharat Abhiyan • Merit Candidates to be given aid for higher education in skill development program • Enhancing the Scholl, High School and Collage Lab and Library Development • Promotion of Sports among youth, at community hall, youth club giving sponsorship for
purchasing of sports equipment’s and promotion for participating in various competitions • Solid waste Management Programme (Supply of Bins for Segregation of Solid Waste) and
Training for Safe disposal of Solid waste and Distribution of compost bins to the farmer families
• Developmental of infrastructure facilities such as installation of solar power equipped lights to Schools, Government Offices and Street Lights Etc.,
• Assistance to Forest Department to Improve Forest Cover in the Study area • Improvement of Infrastructure facilities such as refurbishment of medical facilities
construction of ward in the hospital • Desalting of Village Tanks/Cheruvu/lake and Creation of Rainwater Harvesting Structures
and soil erosion control • Infrastructure facility fund for educational institutes, medical facilities, purchasing of
ambulance, computers in school for children • Training /Awareness to farmers in the nearby Areas to increase Crop Yield, Optimization
of Water use (drip Irrigation) and Distribution of Organic Manure • Contribution to Disaster Management Fund includes assistance to Formers during Drought • Development of radium studs on road for night visuals of roads
C1181301 Obtaining Environmental Clearance and CFE for Nakkapalli Industrial Park RP005 rev. A Final EIA/EMP Report
Chapter 10 Summary and Conclusion Page 10-10
However, as per MoEF&CC Office Memorandum dated September 30, 2020, the Specific conditions prescribed by MoEF&CC while recommending the proposal for EC shall be followed instead of allocation of funds under CER.
10.11 Environment Management Plan
The main objectives of Environmental Management are to:
• Identify environmental aspects, normal, abnormal and emergency conditions • Ensure implementation of standard operating procedures as updated from time to time • Evaluate any non-conformity to the environmental standards, as stipulated by different
regulatory agencies • Ensure and implement necessary corrective actions • Establish procedures for reporting, document and record control • Establish and implement procedures for incident and near miss reporting, investigation and
root cause analysis and prescribe corrective action
Based on the above objectives in mind, the following specific environmental management plan/measures are provided
• Administrative and Technical Setup for Environmental Management • Greenbelt development • Rainwater harvesting • Occupational health and safety: Occupational health & safety needs attention both during
construction, erection, operation and maintenance phases. • Institutional arrangements/framework for environmental management.
The effective implementation and close supervision of the environmental management through a suitable institutional mechanism. The proposed institutional mechanism recommended for the implementation of the mitigation measures is presented in EIA report.
10.12 Budgetary Estimate for Environmental Management
The budgetary estimate (Capital Cost) for Environmental Management is INR 2609 Million (260.9 Crores) and the annual recurring cost is INR 139 Million (13.9 Crores).
10.13 Conclusion
In order to meet the growing needs of the industrial sector, it is necessary to identify new sites for industrial development that includes industries like pharma, chemical, textile, automobile etc. On the basis of the market analysis, area strengths and likely investment proposals in pipeline, it has been proposed to have an industrial park at Nakkapalli. Proposed development will not envisage any resettlement and rehabilitation.
Typically, any developmental projects also trigger a set of environmental and social impacts. These environmental and social impacts (proposed development will not envisage any resettlement) due to infrastructure development projects occur in different forms. An Environmental Impact Assessment has been carried out to study the potential environmental and social impacts due to the proposed IP. Potential environmental and social impacts due to the proposed development on attributes like air quality, noise, water quality, soil, flora, socio-economic, etc. have been assessed as part of this EIA study. Appropriate mitigation measures to help minimize/avoid impacts from the development have been recommended. The
Obtaining Environmental Clearance and CFE for Nakkapalli Industrial Park C1181301 Final EIA/EMP Report RP005 rev. A
Chapter 10 Summary and Conclusion Page 10-11
measures include avoidance measures, mitigation measures and environmental enhancement measures.
The proposed IP will be developed for attracting the major investors and strategically located. The vision is to develop the IP with integrated well-planned infrastructure and an efficient management structure which shall ensure continual global competitiveness. The proposed IP shall emerge as a benchmark in the State and the Country both in terms of market relevance and in terms of environmental sustainability.


Chapter 11
Disclosure of Consultants

Obtaining Environmental Clearance and CFE for Nakkapalli Industrial Park C1181301 Final EIA/EMP Report RP005 rev. A
Chapter 11 Disclosure of Consultants Engaged Page 11-1
Chapter 11 Disclosure of Consultants Engaged
APIIC has taken up the task of development of Industrial hubs and as part of their mandate they are promoting sector specific Industrial Parks. APIIC has identified a parcel of land at Nakkapalli in Visakhapatnam district of Andhra Pradesh in an area of 3,899 acres.
APIIC have appointed L&T Infrastructure Engineering Limited (LNTIEL), to carry out the EIA Study for the proposed development of Industrial Park at Nakkapalli.
11.1 Brief Profile of L&T Infrastructure Engineering Limited
L&T Infrastructure Engineering Ltd., a subsidiary of Larsen & Toubro Limited is a leading multi-disciplinary Indian Consultancy firm. LNTIEL has made a distinctive mark by creating new standards in providing sustainable solutions. Today, LNTIEL is distinguished from others not limited to its lineage but its relentless quest for quality - a unique tradition of placing client’s needs above all.
LNTIEL offers a diverse array of talents together with practical experience. We assure our clients a professional approach by innovation and evolving optimal solutions. At LNTIEL, we recognise that human resources are the key to organisational success. LNTIEL’s expertise ranges across a broad spectrum of sectors with special forte in Infrastructure Projects and Industrial Parks/SEZs. LNTIEL has expertise in carrying out Techno-Economic Feasibility Studies, Preparation of Master Plans & Detailed Project Reports and Bid Process Management. LNTIEL is rendering the following services for Specialised Industrial Clusters/SEZs/Industrial Parks/Investment Regions: • Environmental and Social Impact Assessment including assistance to Client in obtaining
necessary clearances/approvals from various statutory authorities: State PCB’s, State CZMA, MoEF&CC (GoI)
• Field surveys (Terrestrial & Marine Environments) and investigations • Numerical modelling especially for the marine projects • Project formulation/conceptualisation & configuration • Market study and demand assessment • Master planning, Urban planning, Environmental planning and Tourism planning • Infrastructure design and engineering • Block cost estimation • Economic and financial analysis • Bid Process Management • Assistance in domestic and international marketing including road shows/investors
conference (or meet) for marketing the project. • Assistance to Client in achieving technical and financial closures
Strengths of LNTIEL
LNTIEL has a well-equipped Corporate Office at Chennai. LNTIEL’s staffs is replete with a wide range of professionals – Urban Planners, Engineers, Designers, Environmental and Social Specialists, Financial Analysts, Project Structuring, Marketing and Privatisation Experts, Construction Supervision Managers – covering a wide spectrum of services. The skills of the Experts are continuously aligned to suit the changing Client requirements. LNTIEL has strategic tie-ups with Associates for specialized services. Services of an eminent group of Expert Consultants are also available to LNTIEL. Our clients value the highly motivated and
C1181301 Obtaining Environmental Clearance and CFE for Nakkapalli Industrial Park RP005 rev. A Final EIA/EMP Report
Chapter 11 Disclosure of Consultants Engaged Page 11-2
dedicated team of professionals who assure them international quality service through focused and optimal solutions.
LNTIEL provides a stimulating working environment. We have assembled a team of skilled, creative and dynamic professionals who strive to translate the organisational ethos into reality. To enhance the efficiency of the personnel and enable them to be updated with the latest developments in technology, we organise comprehensive technical training programmes and organisational development programmes at regular intervals. A creative work environment, motivated staff, structured training, latest methodologies and tools, continuous adherence to quality, adoption of best ethical standards and a keen client orientation are the factors that spur on LNTIEL‘s journey into the future. Our driving philosophy is ‘Client First’. We work towards complete satisfaction of our clients by adopting good work practices and meeting their requirements through timely delivery of appropriate solutions. Further for achieving this objective, we have acquired state-of-the-art IT facilities and software to ensure quality in all spheres of our activity.
LNTIEL has modern fully computerized offices with latest computational and communication facilities. A large number of high-end computers are available and are connected by a network. Further, Internet connectivity enables fast exchange of information with the clients, as well as within the offices and the parent companies. These facilities help us to provide our clients high quality services within the shortest possible time. LNTIEL has more than three hundred regular employees at four offices forming a leading consulting group with extensive operations at Chennai, Hyderabad, Delhi and Mumbai.
Quality Policy of LNTIEL
LNTIEL is committed to achieve and sustain excellence in consultancy services to customers world-wide through an in-house Quality Management System that conforms to ISO 9001:2015. The commitment stated above will be fulfilled by:
• Working towards complete satisfaction of LNTIEL’s customers by adopting good work practices and meeting their requirements through timely delivery of appropriate solutions.
• Striving to achieve continual improvement of quality management system through periodic review of quality policy, processes and quality objectives.
• Striving to maintain well-qualified and motivated staff by empowering them and providing a stimulating work environment.
• Adhering to the best ethical standards for business behaviour by respecting the rules of law governing LNTIEL’s business and presenting a well-audited financial statement every year.
• Impelling employees at all levels in achieving the objectives of the organisation and ensuring that all employees are aware of and act within the policy framework of LNTIEL.
• Propagating our quality policy and procedures to our sub-consultants and associates and ensuring adherence to the relevant components of the quality system.
QCI-NABET - EIA Accreditation
National Accreditation Board for Education & Training (NABET) is a constituent board of the Quality Council of India (QCI). QCI, NABET has accredited LNTIEL for carrying out EIA studies in the following Ten (10) sectors:
S. No. Sector
1 Industrial Estates/Parks/Complexes/Areas, Export Processing Zone (EPZs), Special Economic Zones (SEZs), Biotech Parks and Leather Complexes
2 Ports, Harbours, Break Waters and Dredging
3 Highways
Obtaining Environmental Clearance and CFE for Nakkapalli Industrial Park C1181301 Final EIA/EMP Report RP005 rev. A
Chapter 11 Disclosure of Consultants Engaged Page 11-3
S. No. Sector
4 Airports
5 Thermal Power Plants
6 River Valley Projects
7 Common Effluent Treatment Plants (CETPs)
8 Common Municipal Solid Waste Management Facility (CMSWMF)
9 Building and Construction Project
10 Townships and Area Development Projects
NABET Certificate was given as Attachment 1. Further details may be seen on the following URL: www.lntiel.com
11.2 Other Consultants Engaged
11.2.1 Kiwi Labs
Nature of Consultancy Services Rendered: Terrestrial Baseline Environmental Surveys M/s. KIWI was set up in the year 2013. The agency is offering consultancy services in generation of baseline terrestrial environmental data for the detailed EIA studies. The organization has attained the recognition from the MoEF&CC, GoI (vide letter Q.15018/27/2013-CPW), dated 10.09.2014). KIWI Labs is also an NABL Certified agency (ISO/IEC 17025:2005) in the field of chemical testing. It is also certified by ISO 9001:2008 & OHSAS 18001:2007. NABL Certificate was given as Attachment 2. Further details on the agency may be seen on the following URL: www.kiwisecolabs.com.
11.2.2 CCMR
Nature of Consultancy Services Rendered: Marine Baseline Environmental Surveys
The agency Centre for Coastal and Marine Research offer services in Marine Baseline Environmental Monitoring, Monitoring of Water environment, Soil, Ecological/ Biological parameters like fauna, plankton, benthos, fisheries, mangroves and microbial parameters etc., for the detailed EIA and other studies.
11.2.3 HTL/LTL, CRZ Demarcation Surveys
Nature of Consultancy Services Rendered: Demarcation of HTL\LTL and CRZ Area The National Centre for Sustainable Coastal Management (NCSCM), under Ministry of Environment, Forest and Climate Change, Government of India promotes integrated and sustainable management of coastal and marine areas in India and advice the Union and States/ Union Territory Governments and other associated stakeholders on policy, and scientific matters relating to Integrated Coastal Management (ICZM).They offer services like Shoreline change assessment & coastal vulnerability assessment, Coastal and marine environmental monitoring, Mapping of coastal land use land cover, Numerical modeling of near-coastal processes, Preparation of Coastal Zone Management Plan (CZMP), Post-project monitoring for specific project sites, Tourism Carrying capacity of islands and coastal areas, Beach carrying capacity, Coastal Regulation Zone maps at state and local levels, Capacity building in Integrated Coastal Zone Management (ICZM), Preparation of Conservation Management Plan, Sale of data Products, Decision Support System for Coastal Management. Further details on this center may be seen on the following URL: http://ncscm.res.in/

Attachments
Attachment 1: NABET Certificate of L&T
Infrastructure Engineering
Limited
Attachment 2: NABL Certificate of Kiwis
Laboratories

Appendices
Appendix A
Approved Additional ToR and Standard ToR Letter issued by
MoEF&CC
Appendix B
Compliance to Additional and
Standard ToR
Appendix C
Baseline Monitoring Results
Appendix D Letter from Water Resources
Department, GoAP
Appendix E National Ambient Air Quality
Standards
Appendix F National Ambient Noise
Standards

Appendix G
Noise Limit for Generator Sets
Appendix H Drinking Water Specifications -
IS 10500:2012
Appendix I Designated Best Use
Classification of Inland Surface Water of National Rivers
Conservation Directorate,
MoEF&CC for Surface Water
Appendix J Primary Water Quality
Standards for Coastal Water
(SW-IV)
Appendix K
Emission Limits for New Diesel Engines (upto and more than
800 KW) for Generator Sets

Appendix L
Draft EIA/EMP Report Distribution, Public Hearing
Notification, Proceedings and
Representations Received
Appendix M Industrial Park Survey Numbers
Appendix N NoC for Marine outfall from
APPCB
Appendix O APCZMA Recommendation
Letter

Annexures
Annexure A: 1:4000 CRZ Demarcation Map
by NCSCM
Annexure B: Compliance to CAG recommendations
Annexure C: Details of Construction
Materials Required and its
Source

L&T INFRASTRUCTURE ENGINEERING LIMITED
1-10-39 to 44, 6C, 6th Floor, Gumidelli Towers, Begumpet Airport Road, Begumpet, Hyderabad – 500 016
Ph: 91 -040 – 40354444
Related Documents