Rain as an Indicator of Turbidity Along Urban Seattle Waterfront Hannah Snow December 2014 CEE 272 (TheSunbBreak.com, 2013)

Final Coastal Presentation
Jul 30, 2015
Welcome message from author
This document is posted to help you gain knowledge. Please leave a comment to let me know what you think about it! Share it to your friends and learn new things together.
Transcript

Rain as an Indicator of Turbidity Along Urban
Seattle Waterfront
Hannah Snow December 2014
CEE 272
(TheSunbBreak.com, 2013)

Urban Runoff
• Paved surfaces more runoff (drains & overland)• Stormwater runoff carries• Sediment• Hydrocarbons (Hoffman et al., 1984)• Metals (Davis et al., 2001)• Other industrial pollutants
• Stormwater runoff cause toxicity in marine organisms (Schiff et al., 2003)
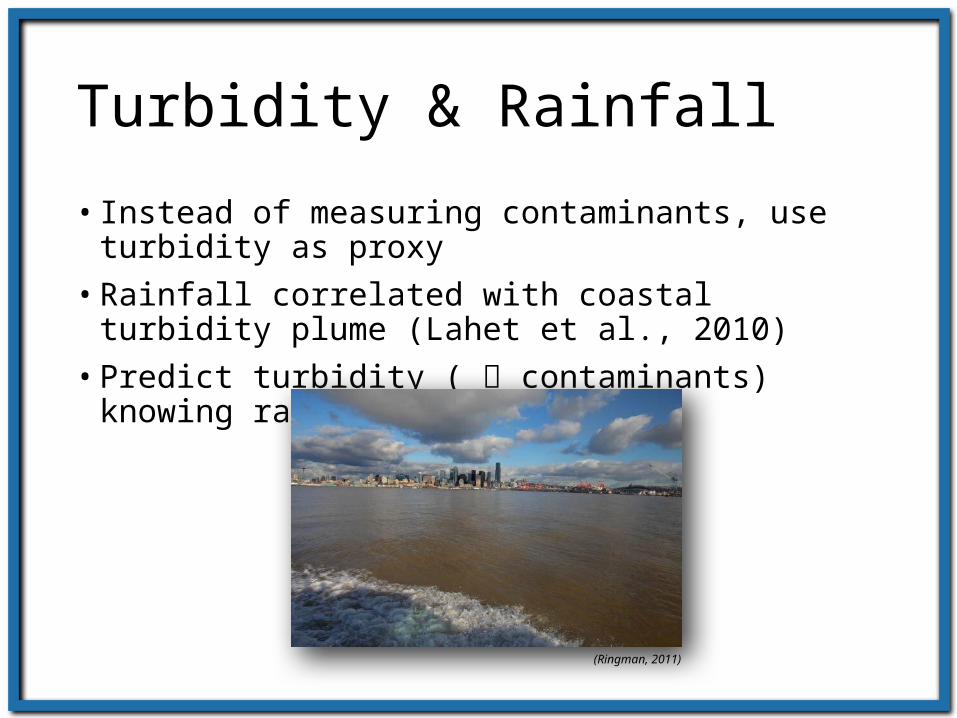
Turbidity & Rainfall
• Instead of measuring contaminants, use turbidity as proxy
• Rainfall correlated with coastal turbidity plume (Lahet et al., 2010)
• Predict turbidity ( contaminants) knowing rainfall?
(Ringman, 2011)
Hypothesis
Cross-covariance with rainfall and turbidity will have a positive correlation at 0-3 days time lag.
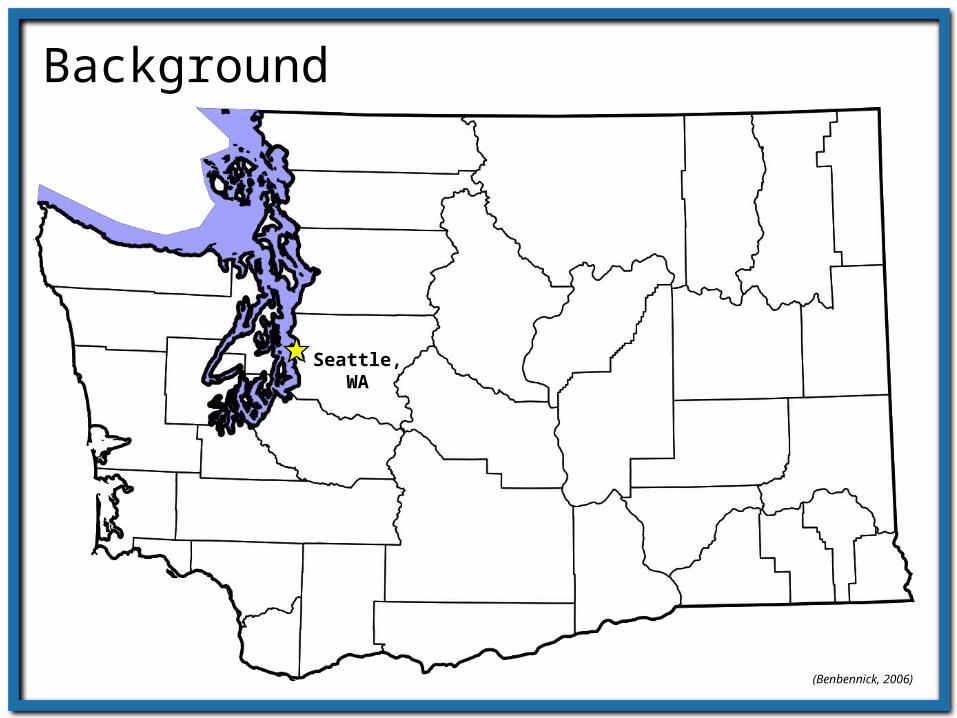
Seattle, WA
(Benbennick, 2006)
Background
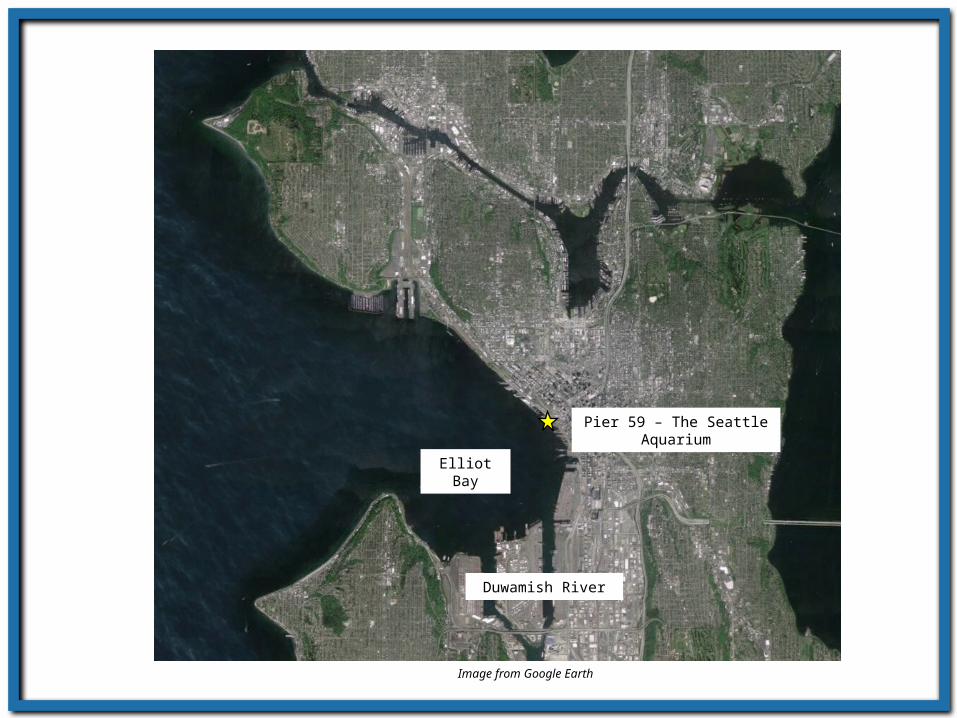
Pier 59 – The Seattle Aquarium
Elliot Bay
Duwamish River
Image from Google Earth
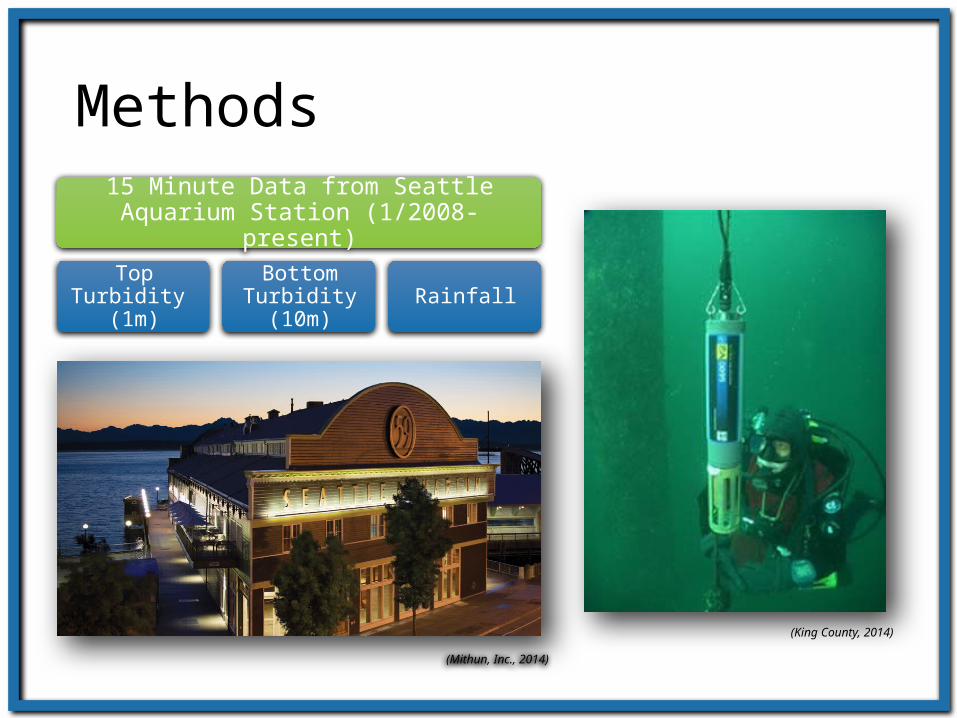
15 Minute Data from Seattle Aquarium Station (1/2008-present)
Top Turbidity (1m)
Bottom Turbidity
(10m)Rainfall
(Mithun, Inc., 2014)
(King County, 2014)
Methods
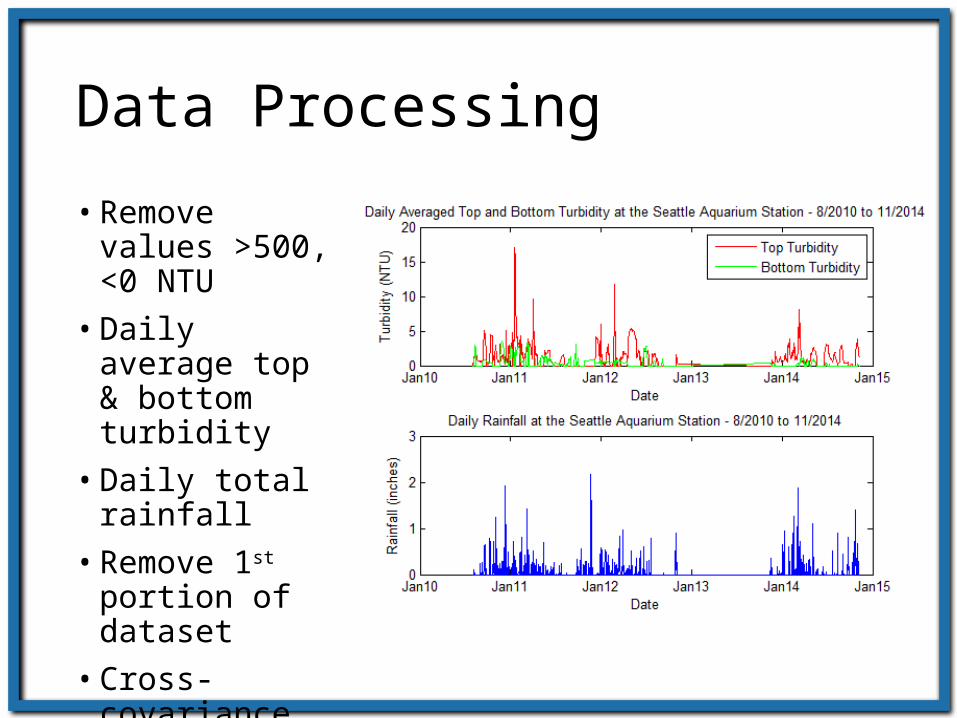
Data Processing
• Remove values >500, <0 NTU
• Daily average top & bottom turbidity
• Daily total rainfall
• Remove 1st portion of dataset
• Cross-covariance analysis

Cross-Covariance: Rainfall & Top Turbidity
• 4 significant time lags, -1 year, 3 days,~25 days, ~40 days
• Positive cross-covariance• Scatter
Cross-covariance between rainfall and top turbidity from 8/2010 to 11/2014. Red line indicates significant correlation with 99% CI.
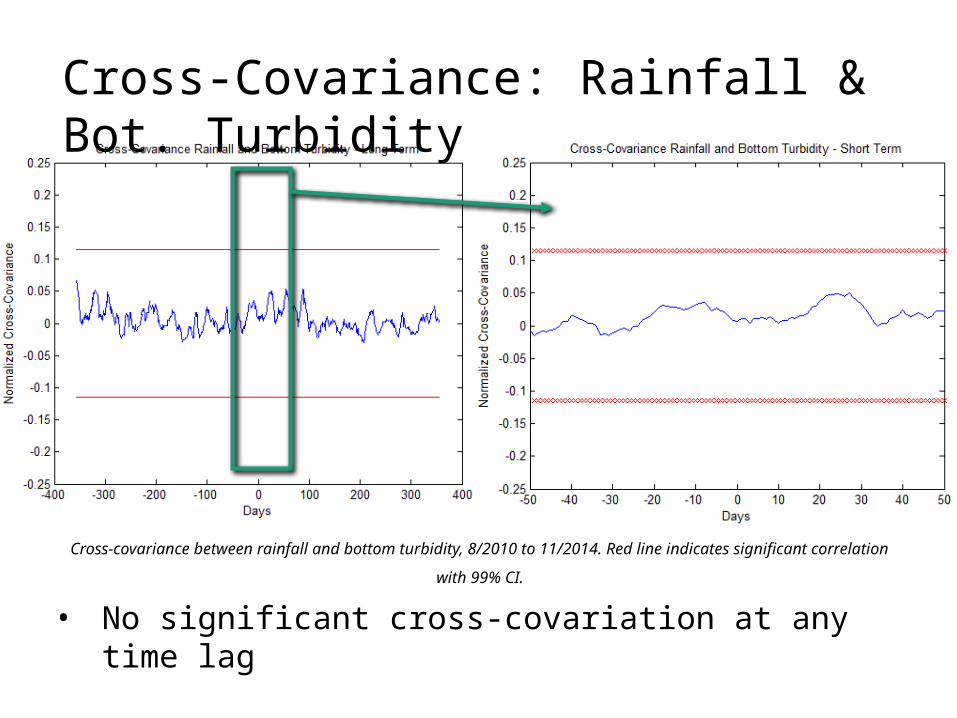
Cross-covariance between rainfall and bottom turbidity, 8/2010 to 11/2014. Red line indicates significant correlation with 99% CI.
• No significant cross-covariation at any time lag
Cross-Covariance: Rainfall & Bot. Turbidity
Discussion
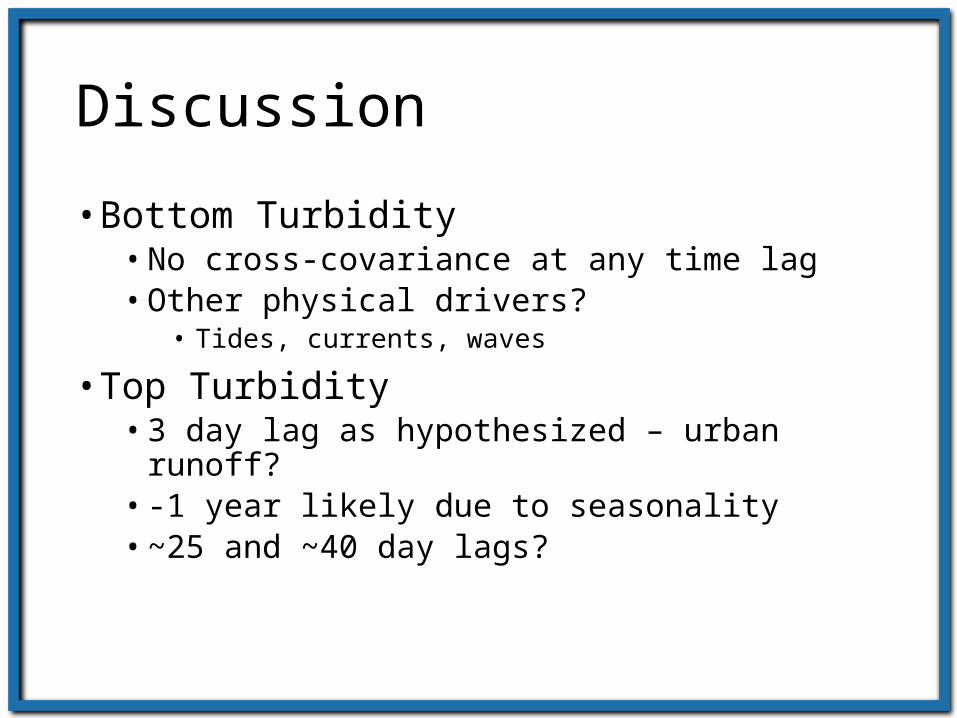
• Bottom Turbidity• No cross-covariance at any time lag• Other physical drivers?
• Tides, currents, waves
• Top Turbidity• 3 day lag as hypothesized – urban runoff?• -1 year likely due to seasonality • ~25 and ~40 day lags?
Where is the Runoff Originating?• Urban runoff contributes different
sediment concentrations and contaminant types than runoff from undeveloped land• Sampling station influenced by
Duwamish River
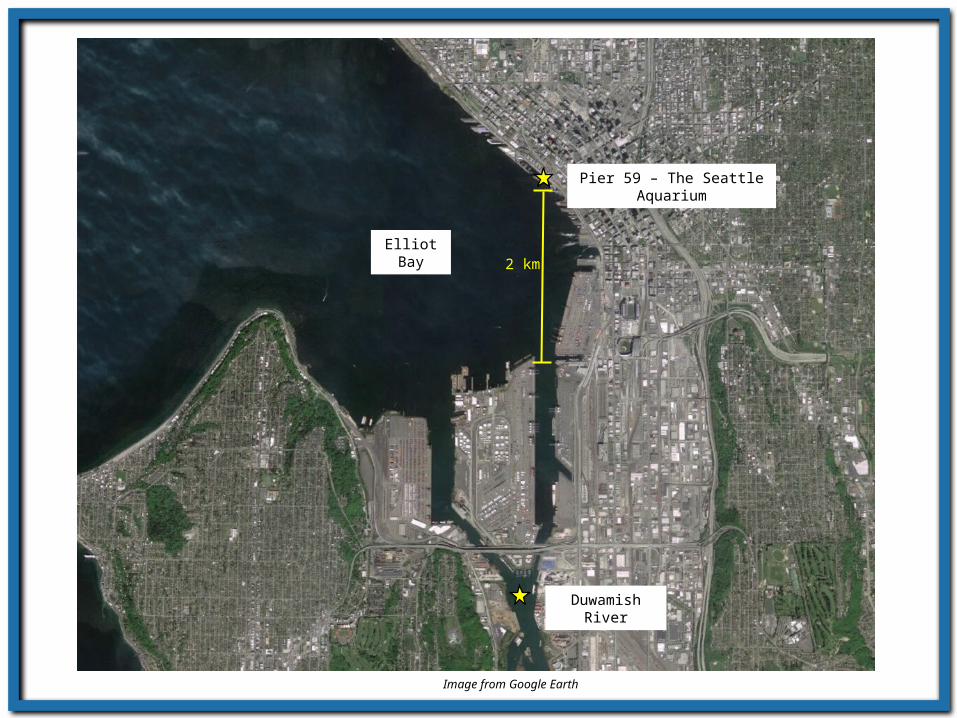
Pier 59 – The Seattle Aquarium
Duwamish River
2 kmElliot Bay
Image from Google Earth

• Hydraulic responses different time lags• 3 days – urban
overland• ~25 days, ~40 days –
Duwamish River catchment
• Source tracking of suspending sediment?
• Topic for future research
(Mabel, 2007)
(Brown, 2010)

Rainfall Patterns
• Rainfall events span multiple days
• Covariance for individual daily total rainfall
• Not representative of physical processes
• Future research
Jan Feb Mar Apr May Jun Jul Aug Sep Oct Nov Dec
1816
17
14
109
56
9
13
1819
Days of Rainfall per Month - Seattle, WA
Days o
f R
ain
fall p
er
Month
(City of Seattle, 2014)
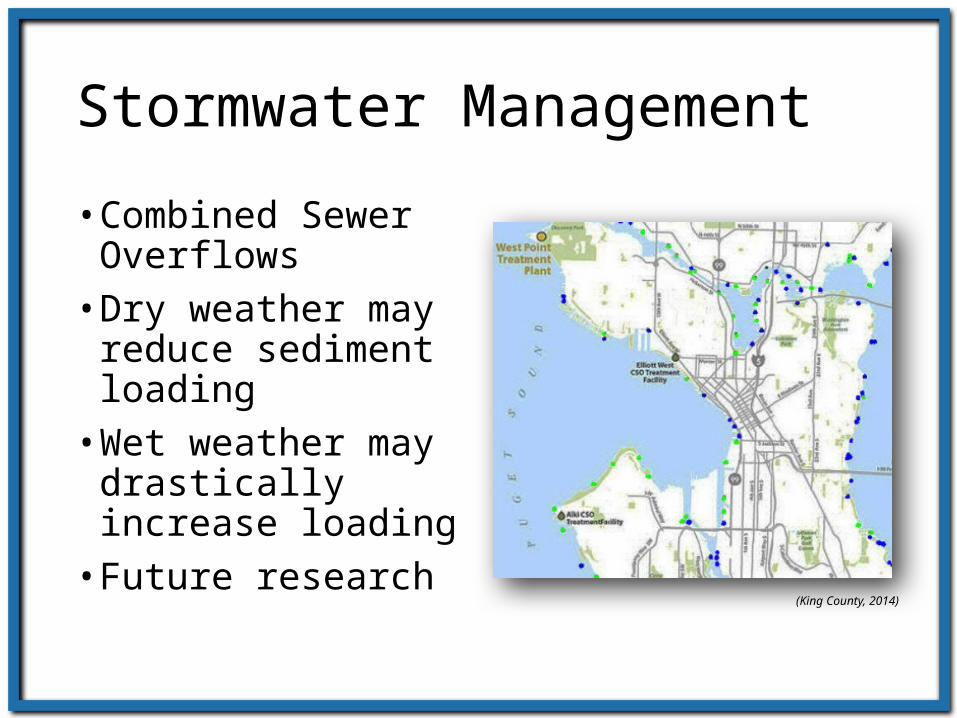
Stormwater Management
• Combined Sewer Overflows• Dry weather may
reduce sediment loading• Wet weather may
drastically increase loading• Future research
(King County, 2014)
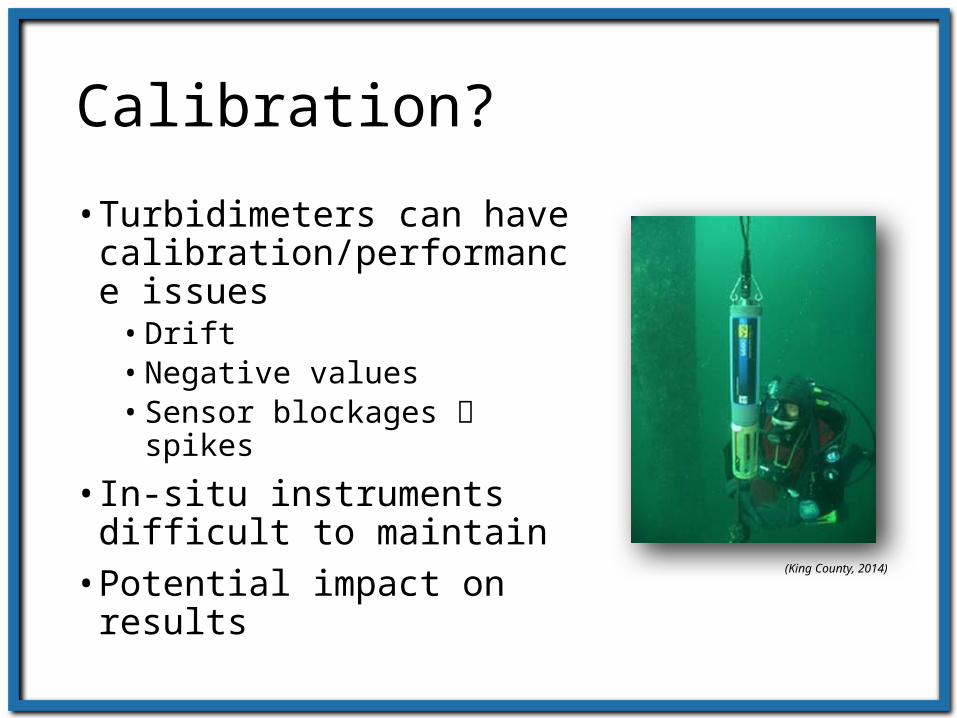
Calibration?
• Turbidimeters can have calibration/performance issues• Drift• Negative values• Sensor blockages spikes
• In-situ instruments difficult to maintain• Potential impact on
results(King County, 2014)
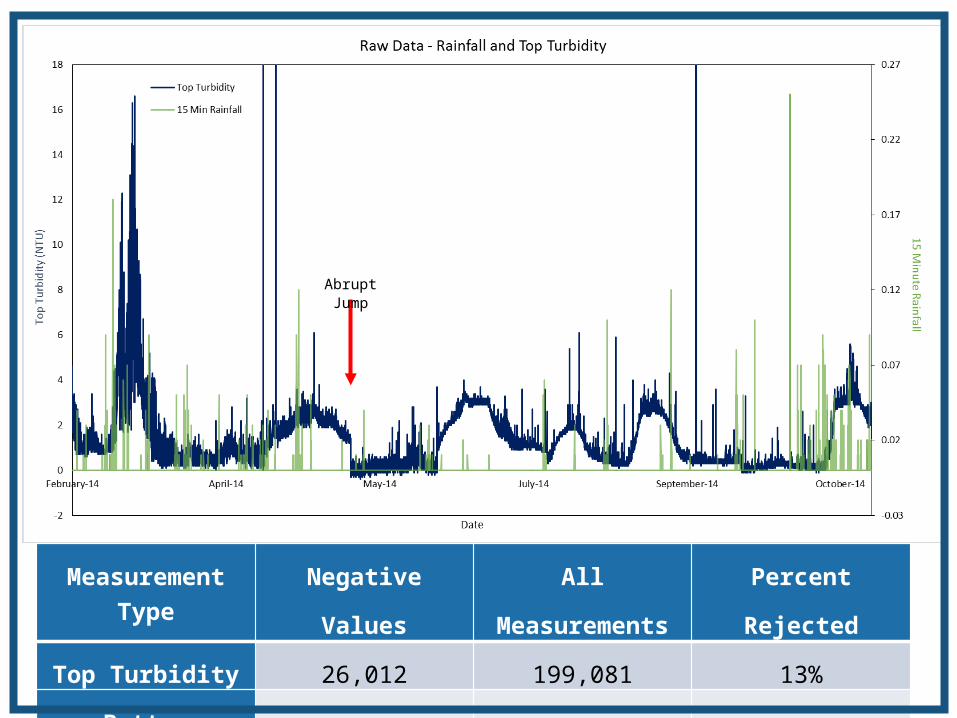
Abrupt Jump
Measurement Type
Negative
Values
All
Measurements
Percent
Rejected
Top Turbidity 26,012 199,081 13%
Bottom
Turbidity38,912 199,081 20%
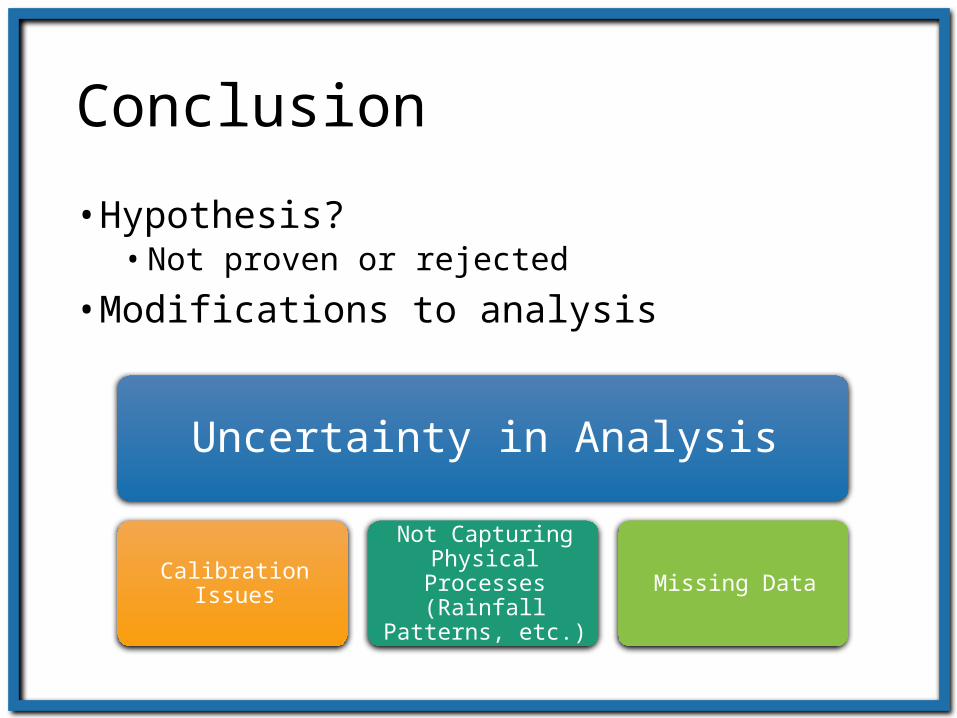
Uncertainty in Analysis
Calibration Issues
Not Capturing Physical
Processes (Rainfall Patterns,
etc.)
Missing Data
Conclusion
• Hypothesis?• Not proven or rejected
• Modifications to analysis

Top Turbidity in Elliot
Bay
Overland Urban Runoff
River FlowsStormwater Discharge
& CSO
Other Contributor
s to Turbidity (algae, etc.)
Conclusion
• Complex relationship with inputs • More research
needed • Turbidity
generation location• Bottom turbidity
mechanisms• Impact of CSO
Bottom Turbidity in Elliot
Bay?

Thank You!Questions?
References• Benbennick, D. An Outline Map of Washington with County Boundaries. Wikimedia Commons. 2006. http
://commons.wikimedia.org/wiki/File:Map_of_Washington_counties,_blank.svg• Brown, P. Image of the Duwamish River. IvestigateWest. 2010. <http
://crosscut.com/2010/12/07/environment/20426/Duwamish-River-Should-cleanup-make-fish-safe-eat-r/ >• Chelton, D. Commentary: Short-term Climatic Variability in the Northeast Pacific Ocean. Oregon State University Press: Corvalis,
OR, 1984, 87-99.• Czuba, J., Magirl, C., Czuba, C., Grossman, E., Curran, C., Gendaszek, A., Dinicola, R. Sediment Load from Major Rivers into Puget
Sound and its Adjacent Waters. United States Geological Survey, 2011, Fact Sheet 2011-3083. • Davis, A., Mohammad, S., Ni, S. Loading Estimates of Lead, Copper, Cadmium, and Zinc in Urban Runoff from Specific Sources.
Chemosphere, 2001, 44, 997-1009.• Elliot Bay Waterfront Recontamination Study. Washington State Department of Ecology, 1995, Panel Publication 9, Ecology
Publication 95-335.• Goransson, G., Larson, M., Bendz, D. Variation in Turbidity with Precipiration and Flow in a Regulated River System – River Gota
Alv, SW Sweden. Hydrology and Earth System Science, 2013, 17, 2529-2542. • Hoffman, E., Mills, Latimer, J., Quinn, J. Annual Input of Petroleum Hydrocarbons to the Coastal Environment via Urban Runoff.
Can. J. Fish. Aquat. Sci., 1983, 4Q(Suppl. 2): 41-53.• Image of Seattle Waterfront. 2013. <http://thesunbreak.com/wp-content/uploads/2013/04/IMGP2905.jpg >• King County Marine Moorings. King County, WA, 2014. < https://green2.kingcounty.gov/marine-buoy/default.aspx> • Combined Sewer Overflow Status. King County, WA, 2014.< http://
www.kingcounty.gov/environment/wastewater/CSOstatus/Overview.aspx >• Lahet, F., Stramskim D. MODIS imagery of turbid plumes in San Diego coastal waters during rainstorm events. Remote Sensing of
Environment, 2010, 114, 332–344.• Mabel, J. The Green River at Tukwila.. Wikimedia Commons. 2007. <http
://en.wikipedia.org/wiki/Duwamish_River#mediaviewer/File:Tukwila_-_Duwamish_River_-_01.jpg >• Seattle Aquarium. Mithun, Inc. 2014.< http://mithun.com/projects/project_detail/seattle_aquarium/ >• Urban Waters Initiative, 2007, Sediment Quality in Elliot Bay. Washington State Department of Ecology, 2009, Publication 09-03-
014.• Seattle Monthly Averages and Records. The City of Seattle, 2014. <
http://www.seattle.gov/living-in-seattle/environment/weather/averages-and-records> • Schiff, K., Bay, S. Impacts of Stormwater Discharges on the Nearshore Benthic Environment of Santa Monica Bay. Marine
Environmental Research, 2003, 56, 225-243.• Ringman, S. Runoff turns Elliot Bay into murky stew. The Seattle Times. 2011. <http://
seattletimes.com/html/localnews/2013981790_elliottbay20m.html >
http://crosscut.com/2010/12/07/environment/20426/Duwamish-River-Should-cleanup-make-fish-safe-eat-r/
http://crosscut.com/2010/12/07/environment/20426/Duwamish-River-Should-cleanup-make-fish-safe-eat-r/
Related Documents