1 Real Time Monitoring of Railway Traffic Using F Sensors A SEMINAR REPORT ON Real-Time monitoring of railway traffic using fiber bragg grating sensors In the partial fulfillment of Master Technology in Electronics Technology Under the Faculty of Technology By Mr patil Avinash A Under the guidance of Prof. .U.A.PATIL International School of Engineering & Technology Shivaji University M. Tech (Electronics) |

Welcome message from author
This document is posted to help you gain knowledge. Please leave a comment to let me know what you think about it! Share it to your friends and learn new things together.
Transcript
1
Real Time Monitoring of Railway Traffic Using F Sensors
A
SEMINAR REPORT
ON
Real-Time monitoring of railway traffic using fiber bragg
grating sensors
In the partial fulfillment of
Master Technology in Electronics Technology
Under the Faculty of Technology By
Mr patil Avinash A
Under the guidance of
Prof. .U.A.PATIL
International School of Engineering & Technology
Shivaji university, Kolhapur
|
1
Real Time Monitoring of Railway Traffic Using F Sensors
2012-2013
DEPARTMENT OF ELECTRONICS TEHNOLOGY
SHIVAJI UNIVERSITY, KOLHAPUR
CERTIFICATEThis is to certify that, Mr. Khot Akshaykumar Surykant, the student of M.Tech (Electronics Technology) have satisfactorily completed her seminar work entitled
Real-Time monitoring of railwaytraffic using fiber bragg grating sensors
During the year 2012-2013 to our satisfaction & submitted the seminar report in the partial fulfillment of the requirement for the award of the degree of MASTER OF TECHNOLOGY in ELECTRONICS TECHNOLOGY prescribed by International School of Engineering & Technology, Shivaji university, Kolhapur. Maharashtra state under the curriculum of master’s degree course, as a record of student own work carried out by her under our supervision & guidance.
Prof. Dr. U.L.BOMBLE Prof. P. C. Bhaskar
Seminar Guide Head Department of Electronics Technology,
Shivaji University, Kolhapur.
|
1
Real Time Monitoring of Railway Traffic Using F Sensors
ACKNOWLEDGMENT
Gracious help & guidance from various sources contribute
towards successful completion of this seminar work. I have great pleasure to
express my deep sense of gratitude to my guide and Head of Department of
Electronics technology, Shivaji university, Kolhapur, Prof.Dr.U.L.Bombale, for
his expert valuable guidance, inspiration and motivation. In spite of his busy
schedule, he has kind enough to give me time to discussion. I am very much
thankful to him for fruitful discussions.
I am also thankful to all the staff members (department of
electronic technology,ShivajiUniversity, Kolhapur and those who have contributed
a lot and encouraged throughout in my seminar work completion.
I wish to acknowledge and thank to my family and friends
without which I could not have completed this work .I wish to thank everyone who
directly or indirectly helped me in completing my work.
Mr. Akshay .S. khot
ABSTRACT
|
1
Real Time Monitoring of Railway Traffic Using F Sensors
In this work, we present field tests concerning the application of fiber Bragg grating (FBG)
sensors for the monitoring of railway traffic. The test campaigns are performed on the Spanish
high-speed line Madrid–Barcelona, with different types of trains we located the FBG sensors in
the rail track at 70 km from Madrid in the country side, where the trains primarily are tested
during commercial operation with maximum speeds between 250–300 km/h. The FBG sensor
interrogation system used allows the simultaneous monitoring of four FBG sensors at 8000
samples/s. The different position of the FBG sensors in relation with the rail can be used for
different purposes such as train identification, axle counting, speed and acceleration detection,
wheel imperfections monitoring, and dynamic load calculation.
INDEX
|
1
Real Time Monitoring of Railway Traffic Using F Sensors
Sr.No Topic Page No
1 Introduction
2 Need for sensing in Railway industry
3 What is Fiber Bragg grating
4 Description of instrument sector
5 Result and Discussion
6 Axel counters and train identification
7 Train speed and acceleration
8 Dynamic load monitoring
9 Wheel imperfection detecting
10 Conclusion
11 References
INTRODUCTION
|
1
Real Time Monitoring of Railway Traffic Using F Sensors
Over the last few decades, rail transport has become one of the most effective means
of transporting passengers and goods. According to recent statistics, the number of passengers
will be doubled within ten years, while the volume of goods transported by railway will be
tripled thus, it is expected that the axle load will strongly increase in the next years, and the trains
will operate at faster speeds. This fact puts major pressure on the infrastructures and therefore
innovative maintaining and inspection techniques are required. The system which is fully
operational and in present service use is providing invaluable and timely information about
stresses experienced during service, both static and dynamic, under different operational
conditions. The sensors also provide information on the loading and traffic status of the
passenger cars; temperature-induced stresses and deformations on rails and carriages;
temperatures in and around axles and wheel brakes; dynamic axle vibrations due to corrosion and
bearing wear; and other parameters relevant to railroad health monitoring.
At the heart of this technology is the optical fiber itself – a hair-thin cylindrical filament
made of glass that is able to guide light through itself by confining it within regions having
different optical indices of refraction. Ever since, optical fiber technology has been the subject of
considerable research and development. For measurements, optical fibers eventually found
numerous applications in areas, as different as pharmacy and structural health monitoring. In
principle, a fiber optic sensor contains an optical element, whose material properties are changed
by the measured parameter. Light is influenced in its intensity, phase or polarity. Consequently, a
characteristic spectrum results from the measured value. Many physical and chemical parameters
can be determined by this. Temperature, pressure and strain can be measured as wells as
humidity and appearance of gases. FBG sensing is a so-called intrinsic technique, i.e. the fiber
properties are changed by external effects and hence, the fiber itself is the senor. Temperature or
strain has a direct impact on the glass fiber, as the properties of light travelling through the fiber
will be altered locally
In principle, a fiber optic sensor contains an optical element, whose material properties
are changed by the measured parameter. Light is influenced in its intensity, phase or polarity.
|
1
Real Time Monitoring of Railway Traffic Using F Sensors
Consequently, a characteristic spectrum results from the measured value. Many physical and
chemical parameters can be determined by this. Temperature, pressure and strain can be
measured as wells as humidity and appearance of gases. FBG sensing is a so-called intrinsic
technique, i.e. the fiber properties are changed by external effects and hence, the fiber itself is the
senor. Temperature or strain has a direct impact on the glass fiber, as the properties of light
travelling through the fiber will be altered locally
|
1
Real Time Monitoring of Railway Traffic Using F Sensors
Need for sensing in railway industry :
The ever increasing need for improved safety, reliability and efficiency is
among the most important aspects of the railway industry worldwide. On-board
computers and train condition monitoring systems, as well as wireless data transmission
are some of the tools than can fulfill such need. A smart condition monitoring system
would allow real-time and continuous monitoring of the structural and operational
conditions of trains as well as monitoring of the structural health of rail tracks and the
location, speed and weight of passing trains of the entire rail systems. Ultimately, the
inclusion of train location, speed restrictions, and train and track conditions to an
‘intelligent system’ will herald a safer railway industry with reduced maintenance costs,
optimized performance and capacity. Therefore, the need of a smart condition monitoring
system is imminent as indicated by the increase in railway and underground
accidents/incidences around the world. Railway monitoring requires extensive sensor
networks (1,000s of sensors) for measuring strain, vibration, temperature, acceleration,
etc. This would be difficult and cost-prohibitive to implement using conventional sensors.
Fiber optic sensors, on the other hand, offer many advantages over electrical sensors.
These include immunity to EMI, long life-time (>20 years), and massive multiplexing
capability - hundreds of sensing points along a single strand of optical fiber with length
up to 100 km!
What is Fiber Bragg Grating :
|
1
Real Time Monitoring of Railway Traffic Using F Sensors
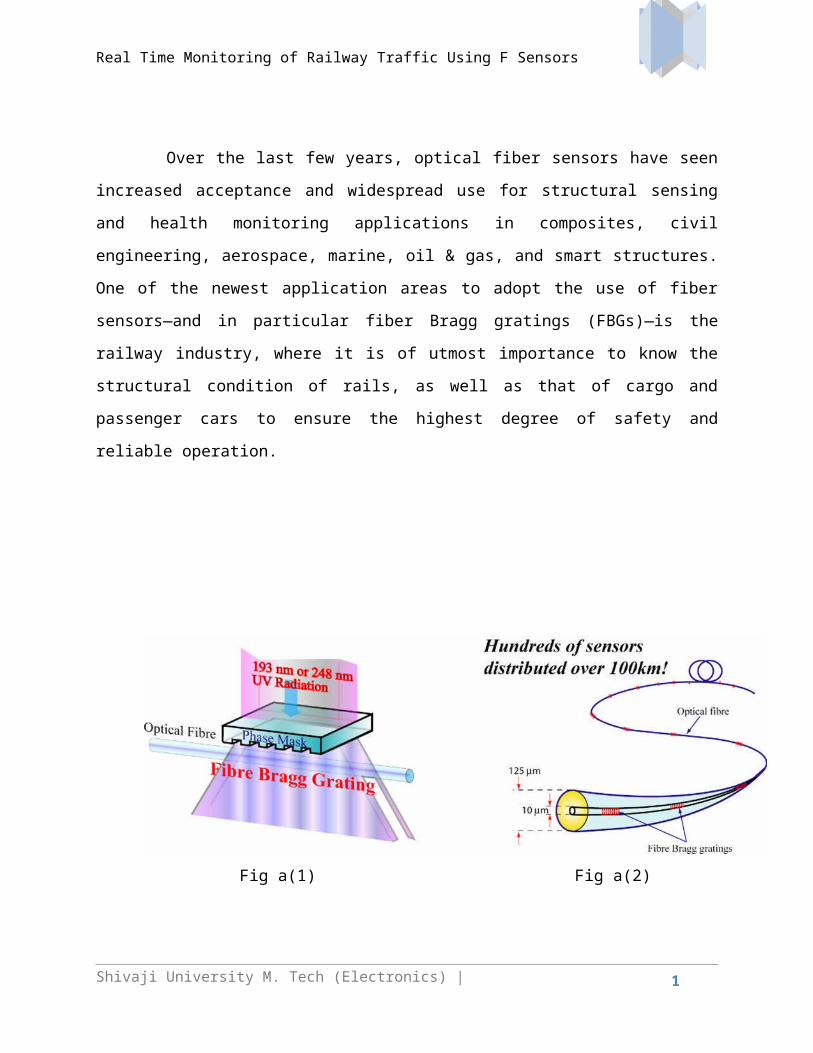
Over the last few years, optical fiber sensors have seen increased acceptance and
widespread use for structural sensing and health monitoring applications in composites, civil
engineering, aerospace, marine, oil & gas, and smart structures. One of the newest application
areas to adopt the use of fiber sensors—and in particular fiber Bragg gratings (FBGs)—is the
railway industry, where it is of utmost importance to know the structural condition of rails, as
well as that of cargo and passenger cars to ensure the highest degree of safety and reliable
operation.
Fig a(1) Fig a(2)
|
1
Real Time Monitoring of Railway Traffic Using F Sensors
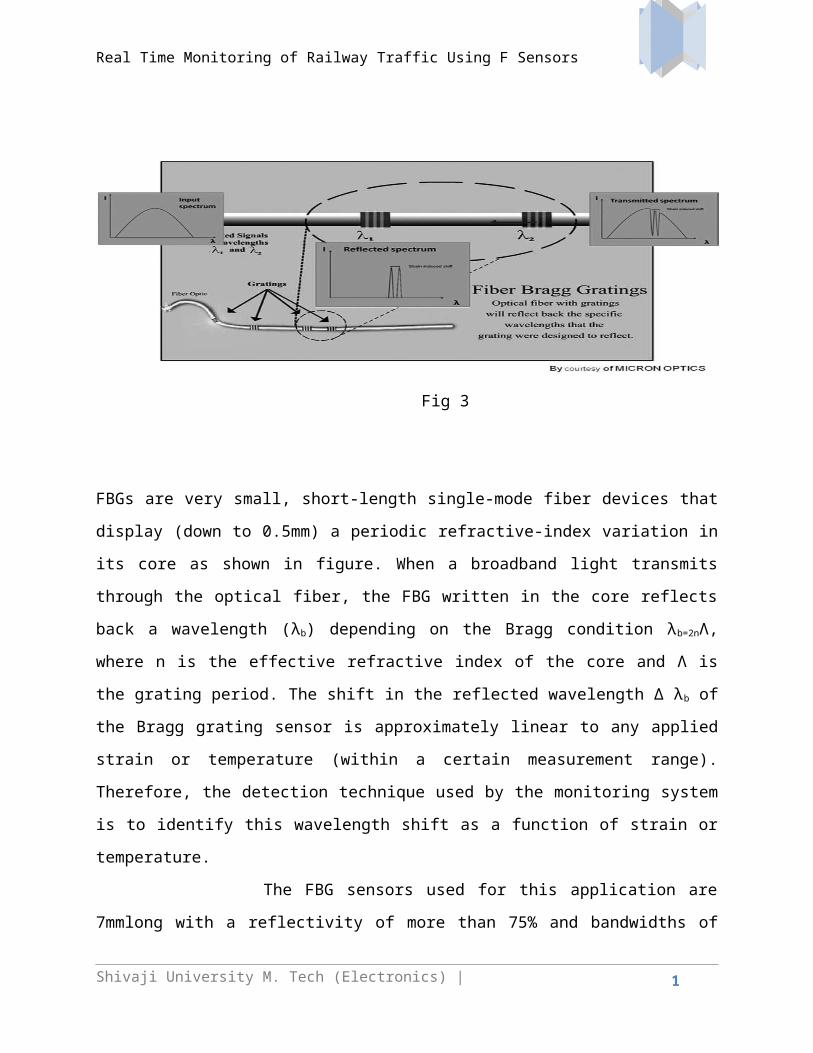
Fig 3
FBGs are very small, short-length single-mode fiber devices that display (down to 0.5mm) a
periodic refractive-index variation in its core as shown in figure. When a broadband light
transmits through the optical fiber, the FBG written in the core reflects back a wavelength (λ b)
depending on the Bragg condition λb=2nɅ, where n is the effective refractive index of the core and
Ʌ is the grating period. The shift in the reflected wavelength ∆ λb of the Bragg grating sensor is
approximately linear to any applied strain or temperature (within a certain measurement range).
Therefore, the detection technique used by the monitoring system is to identify this wavelength
shift as a function of strain or temperature.
The FBG sensors used for this application are 7mmlong with a reflectivity of more than
75% and bandwidths of 0.2 nm. Previous laboratory experiments proved that the FBGs used
show a strain sensitivity of 1.2 pm/µε(maximum strain admitted) and a temperature sensitivity of
10pm/ C. A other unusual characteristics of the FBGs used is that the reflection spectrum has a
Gaussian peak profile with a side lobe suppression >10db
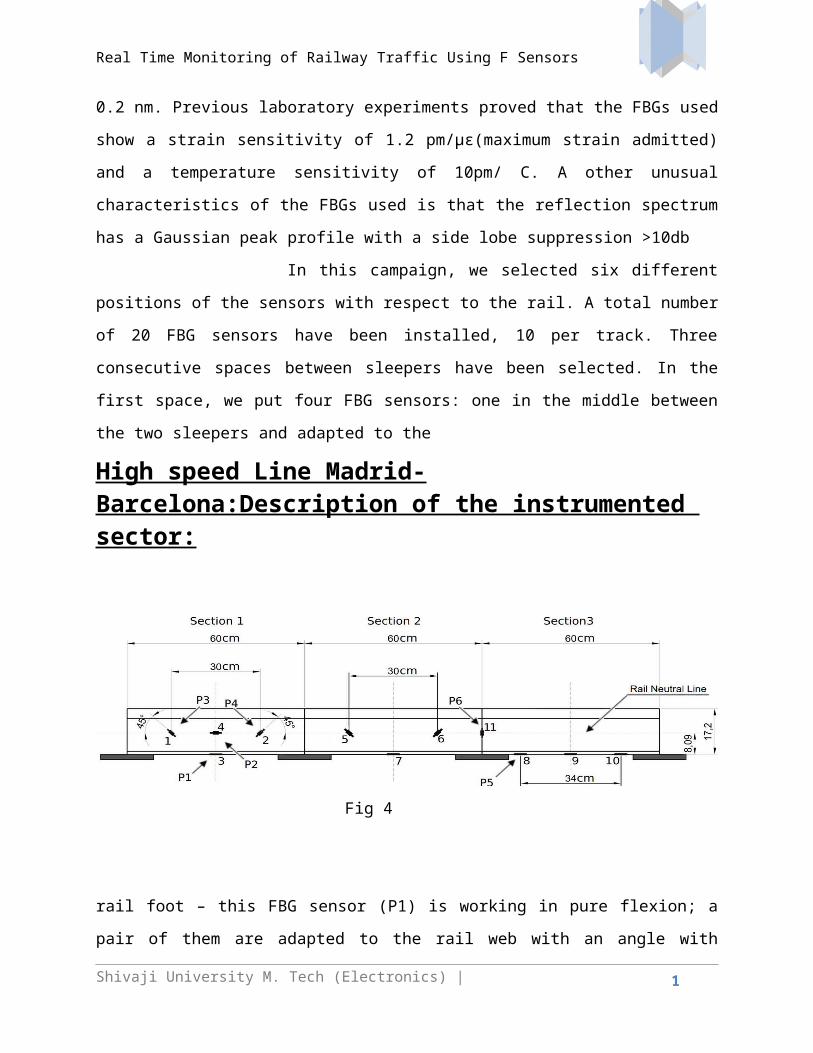
In this campaign, we selected six different positions of the sensors with respect to the
rail. A total number of 20 FBG sensors have been installed, 10 per track. Three consecutive
spaces between sleepers have been selected. In the first space, we put four FBG sensors: one in
the middle between the two sleepers and adapted to the
|
1
Real Time Monitoring of Railway Traffic Using F Sensors
High speed Line Madrid-Barcelona:Description of the instrumented sector:
Fig 4
rail foot – this FBG sensor (P1) is working in pure flexion; a pair of them are adapted to the rail
web with an angle with respect to the rail neutral line of 450 these two FBG sensors (P3 andP4)
are working in shear – and the last one (P2) is placed just on the rail neutral line in order to check
temperature changes in the rail. In the second section between sleepers, we use the same sensor
structure without the temperature FBG and the third section has a vertical sensor just in the
center of the sleeper(P6)and three flexion sensors placed at different distances between the
sleepers (among them, P5). The FBG sensors are directly pasted with an epoxy resin on the rail
tracks. Prior to installation, the surface of the rail was polished to remove any oxide rests and
ensuring that it was not get too irregular. The surface was cleaned with a tissue and alcohol. All
the installation of the sensors was performed in the time period in which the current commercial
service is stopped and when the usual maintenance operations allow it (from 1:00 to 4:00 AM).
The typical temperature of the rail in this time period was between -50C and+100 C. The
temperature and the roughness of the surface did not allow using cyanocrilate or similar glues.
As a good alternative, we used a fast-curing epoxy (5 min) withstanding 240 kg/cm . Thirty
minutes after installation, the FBG sensors were covered and protected with silicone and power
tape. . The installed FBG sensors have been running one year without losses in their performance
|
1
Real Time Monitoring of Railway Traffic Using F Sensors
even after heavy snows, extremely hot summer days and conventional operations of maintenance
in the track.
The interrogation unit used in the experimental campaigns is based on the Bragg scope
technology which combines a high-power broadband optical source with a thin-film optical edge
filter. The edge filter allows translating the wavelength variations into optical intensity
variations, which can be easily recorded at high-speed by means of a data acquisition card. Two
edge filters (with positive and negative slopes) are used per Bragg wavelength, so as to ensure
that the setup is self-referenced. The whole system allows a dynamic measurement of the Bragg
wavelength at sampling frequencies beyond1 kHz. By using add/drop wavelength-division
multiplexing, it also allows the measurement of four sensors connected in series, operating
within predefined wavelength bands. The central wavelengths of the bands used in our
experiment are: 1541.49, 1547.86, 1554.28 and 1560.75 nm. The optical interrogation unit is
connected to a PXI architecture system, so it is possible to increase the number of electrical and
optical switching modules in the extra slots of the rack. For the electrical acquisition, NI-
PXI6040 data acquisition cards are used. A special software application running under Lab View
(National Instruments) was developed specifically for controlling the source and detector system
and for acquiring and saving the data from each sensor. This software allows reading and storing
the data in wavelength variation of the four sensors up to a sampling frequency of 8000
samples/s in each of the four sensors. The data processing is made by a PC that records the train
footprint traces and converts them to relative deformation units (µε ). The PC and the
interrogation unit were placed in the technical building around 40 m away from the tracks. In
opposition to conventional electrical sensors, the virtually transparent behavior of optical fibers
allows to have the interrogation unit very far from the measured points without any degradation
on the measurement performance.
The FBG sensors were connected by optical cables to an optical fiber backbone that runs
below tracks to the auxiliary office In this office a PC and the demodulation unit read the
sensors, store the data and display the train footprints. The passage of the trains displayed and
stored with this PC can also be observed with any other computer in real time through
conventional wireless communication technology. In order to trigger the measurements, we do
not use any extra electrical or optical signal. Our system permanently takes measurements and
the storage is activated whenever a train event is detected. Only the traces which present train
|
1
Real Time Monitoring of Railway Traffic Using F Sensors
passing are stored. This way we can avoid the installation of additional presence sensors and
solve the problem of synchronization
RESULT AND DISCUSSION:
Samples of the traces detected by the sensors in positions P1, P3, P4, P5, and P6 . The
trace recorded with P2 has no relevant mechanical response under the train passage (as expected,
since it is placed in the neutral line of the rail). This is a good choice then to detect the ambient
temperature changes. These changes are nevertheless significant in time scales much longer than
the train passage, so the information given by this sensor is not strictly necessary for the
adequate determination of strain in the rail.
Each individual wheel passing through the FBG sensor is clearly identifiable. The
minimum induced strain due to a wheel passing on the track is more than 140 pm – peak to peak-
and the noise in the determination of the Bragg wavelength is less than 10 pm, giving a SNR
better than 12 dB (1.2 pm means 1µε ). These FBG sensor traces show a high immunity to
electromagnetic fields. No noise coming from the catenary can be seen, in comparison with the
one appearing in conventional strain gauges in . The analysis of these traces can lead to very
interesting applications in the railway domain, and in particular for high-speed systems. In the
following, we identify and validate several of them.
|
1
Real Time Monitoring of Railway Traffic Using F Sensors
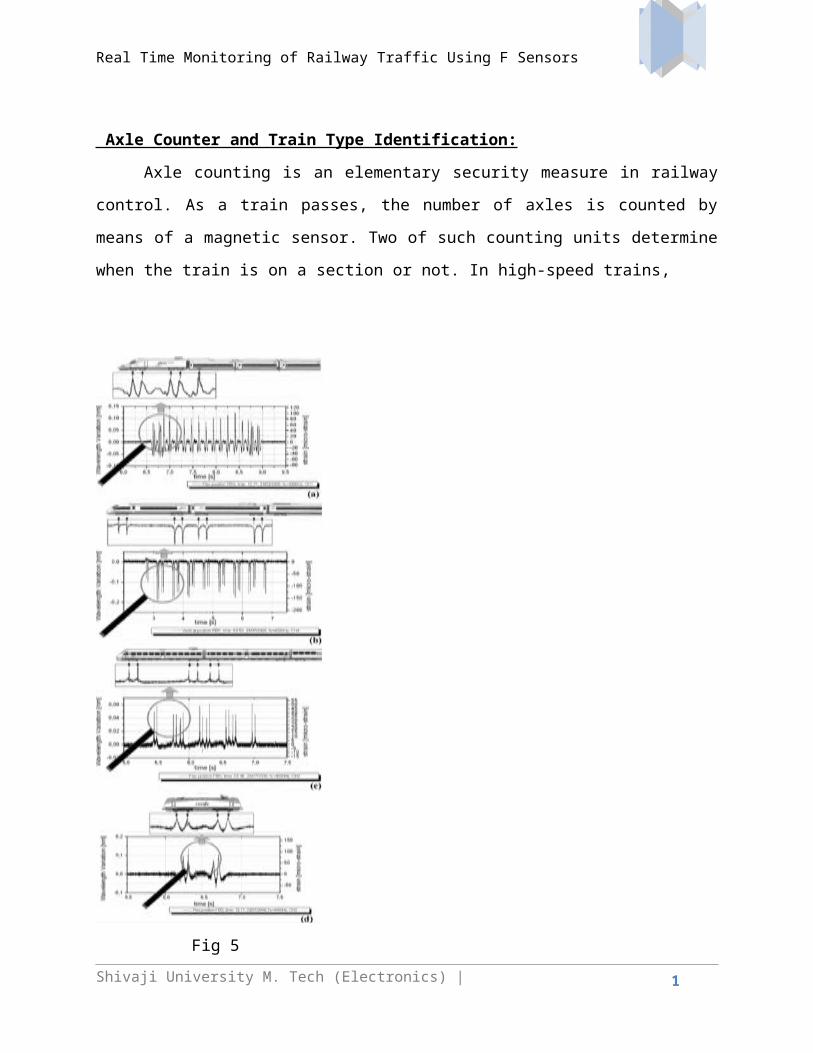
Axle Counter and Train Type Identification:
Axle counting is an elementary security measure in railway control. As a train passes, the
number of axles is counted by means of a magnetic sensor. Two of such counting units
determine when the train is on a section or not. In high-speed trains,
Fig 5
|
1
Real Time Monitoring of Railway Traffic Using F Sensors
magnetic brakes are used in the train vehicles. These are composed of large metal pieces
mounted on the bogie of the vehicle, just a few centimeters above the track. Conventional axle
counters can sometimes detect these as another axle, leading to false alarms. A way to avoid
these false alarms would be to use optical axle counters.
Axle counting using the FBG sensing system shown above is obtained by counting the
number the wavelength of the optical signal reflected by the FBG. By comparing the number of
axles counted and the characteristics of the trains (Table I shows the principal differences
between trains), we can also use this system to identify the type of train circulating in the
network. We have employed the FBG sensing system as a regular axle counter and have never
observed any miscount so far (operation over more than one year without faults). Fig. shows
some examples of axle counting and train type identification using different sensors and different
trains. In Fig. (a), we identified a S102 train (21 axles, 4 axles in the tractor head, 13 axles in 12
wagons, and 4 axles in the back tractor) using sensor P1. In Fig. (b), we use the sensor P4 to
identify a train type S103 (this train has distributed traction in 32 axles, 4 axles in each wagon up
to a total of 8 wagons). In Fig. (c), we use a sensor in position P5 that identifies a S120 train (the
traction is distributed in 16 axles, four axles per wagon). Finally, in Fig.(d), we use a sensor in
position P1 that identifies a maintenance locomotive running at 70 km/h.
Train Speed and Acceleration:
After having identified the train and given that the distances between the wheels are
known for each specific kind of train, the train speed can be simply computed by using the trace
obtained with just one FBG sensor, independently of its position in the rail. The average speed of
the trains is calculated from the total distance between the first and last axle divided by the time
spent between both detections. The instantaneous speed is obtained similarly using the first and
the last axle but in the same wagons, so comparing the first car speed and last car speed, we
calculate the acceleration. Table II shows some of the results obtained. The uncertainty has been
calculated using the time resolution of the acquisition system, the calibration uncertainty, and
mechanical tolerances. An interesting result can be seen in Table II for the S-102 train. The
average speed recorded is lower than the speed measured for the first and last wagon. This is
because the train enters the instrumented sector decelerating but leaves the sector accelerating
|
1
Real Time Monitoring of Railway Traffic Using F Sensors
(the train is rather long, 200 meters as shown in Table I). Thus, the average speed in the sector is
smaller than the speeds recorded for the first and last wagon when they enter and leave the
instrumented sector, respectively. A detailed inspection of the speeds of all the wagons passing
over the instrumented sector confirms this behavior. Concerning the acceleration, in this case it
should be interpreted as a “net” acceleration (the net acceleration of the train from the time in
which it enters the instrumented sector and the time in which it leaves it).
TYPICAL VALUES OF THE AVERAGE AND INSTANTANEOUS SPEED OF THE DIFFERENT TRAINS AND THEIR UNCERTAINTY
Table 1
|
Train type S103 S102 S120
Average speed 300.59
6
205.607 206.121
Uncertainty(%) 0.007% 0.007% 0.012%
Speed of first wagon(Km/h) 300.70
5
208.662 204.771
Speed of last wagaon(Km/h) 300.70
6
207.774 206.784
Uncertainty(%) 1.10% 0.09% 0.07%
Acceleration 0 - +
1
Real Time Monitoring of Railway Traffic Using F Sensors
Dynamic Load Monitoring:
The dynamic load is an important parameter for railway infrastructure managers because
excessive load in the vehicles cause degradation both in the vehicles and in the infrastructure.
We have studied the dynamic load of a train passing at regular speed (between 200 and 300
km/h). In order to monitor dynamic load, we use the sensors in P3 and P4 positions. These two
sensors are located in the rail web with an angle of 450 with respect to the neutral line of the rail,
and therefore they are intended to measure shear strain. The wavelength shift measured with
these sensors is converted to strain (the conversion constant for our FBG sensors is 1.2µε ). With
the shear strain measured from these two sensors, one can derive the dynamic load using
mechanical laws.
The dynamic load (Q) is calculated with the well known equation of the elasticity theory
using the difference of the two strain traces (P3 and P4) expressed in µ€ through the
Qxz = 2€xzGb Iy/Sy
where is the vertical load in the centre of the rail section between sleepers, is the differential
strain measured by substracting the strain traces of P3 and P4, is the tangential elasticity module,
is the width of the section in the rail neutral line, the inertial momentum of the section, and is the
static momentum of the lower part of the rail
|
1
Real Time Monitoring of Railway Traffic Using F Sensors
Fig 6
Wheel Imperfection Detecting:
In high-speed railways, wear in the train wheels due to strong braking is frequent. The
most evident consequence of this wear is the appearance of abnormal abrasions in the wheel
thread called “flats.” Flat spots in the wheel cause strong impacts in the normally smooth power
flow from the wheels to the rails. For this reason, wheel flats are a major source of problems in
railway systems since they cause strong degradation both in the vehicles and in the
infrastructure. Furthermore, they bring noise and discomfort to passengers and they may even
cause derailments in extreme cases. The strongest and clearly visible defect in a wheel is the
“plane,” a specific point of a wheel without roundness. The energy generated by a plane is strong
and periodical and can be simply identified in the dynamic load trace. The repetition frequency is
related to the train speed and the diameter of the wheel through the equation
fp [Hz]= Vtrain[ m
s]
πD [m ]
These periodical impacts are visible when the defective wheel is near the sensor but if the defect
is very evident, they can also be visible relatively far from the defective wheel (through the
vibrations induced in the rail).
|
1
Real Time Monitoring of Railway Traffic Using F Sensors
Fig 7
Conclusion
In conclusion, we have shown that fiber optic sensing technology is adequate for railway security
monitoring systems The health of the rail, like the wheel, can influence the deformation of the
rail following the passage of the train and therefore they can both be diagnosed by analyzing and
comparing the strain information measured by the FBG sensors along the time. We have
demonstrated the possibility to use these sensors placed in different positions in the rail and track
to know: temperature of rail, train speed and acceleration, axle counter and train type
identification, dynamic load estimation, and wheel defects This is undoubtedly very useful for
defining further works and seeking for improvements on both effectiveness and reliability of
defect detection
|
1
Real Time Monitoring of Railway Traffic Using F Sensors
REFERENCES:
• Massimo Leonardo Filograno, Pedro Corredera Guillen, Alberto Rodriguez-
Barrios, Sonia Martin-Lopez, Miguel Rodriguez-Plaza, Alvaro Andres-
Alguacil, and Miguel Gonzalez-herraez, “Real-Time Monitoring of Railway
Traffic Using Fiber Bragg Grating sensors ,January 2012
• Fidanboylu, K.a, * , and Efendioglu, H. S. Fatih University, Istanbul, Turkey
FIBER OPTIC SENSORS AND THEIR APPLICATIONS May 13-5, 2009
• Dr kevin s.c kuang The inside story of FBG sensor
[Online],Available:http:/ScienceDirect.com=sensors and autuators
[Online],Available:http:/www.wikpedia.com
• Frontmatter - Fiber Optic Sensors - Wiley Online Library
|
1
Real Time Monitoring of Railway Traffic Using F Sensors
• Kowloon-Canton Railway Corporation (KCRC)KCRC House, Sha Tin,
Hong Kong SAR
|
Related Documents