CITY OF SAN DIEGO CLIMATE ACTION PLAN FINAL APPENDICES

Welcome message from author
This document is posted to help you gain knowledge. Please leave a comment to let me know what you think about it! Share it to your friends and learn new things together.
Transcript

CITY OF SAN DIEGO
CLIMATE ACTION PLAN
FINAL
APPENDICES

CITY OF SAN DIEGO
CLIMATE ACTION PLAN
FINAL
APPENDIX A
METHODS FOR ESTIMATING GREENHOUSE GAS REDUCTIONS
City of San Diego Climate Action Plan FINAL
APPENDICES A-1
APPENDIX A.1
METHODS FOR ESTIMATING GREENHOUSE GAS REDUCTIONS
Appendix B provides information about the data, methods, and sources used to estimate the greenhouse
gas reductions associated with the implementation measures included in the City of San Diego Climate
Action Plan (CAP). The Energy Policy Initiatives Center (EPIC) estimated emissions reduction values for the
federal, state, regional, and city‐based actions selected by the City of San Diego.
There are five main strategies in the CAP:
• Energy and Water Efficient Buildings;
• Clean and Renewable Energy; Bicycling,
• Walking, Transit & Land Use;
• Zero Waste Management;
• Climate Resiliency.
The first section below provides common assumptions used across multiple measures, the following
sections address the implementation measures at the state/federal level, regional level, and local actions
included within each of the five main strategies.
GREENHOUSE GAS REDUCTIONS SUMMARY
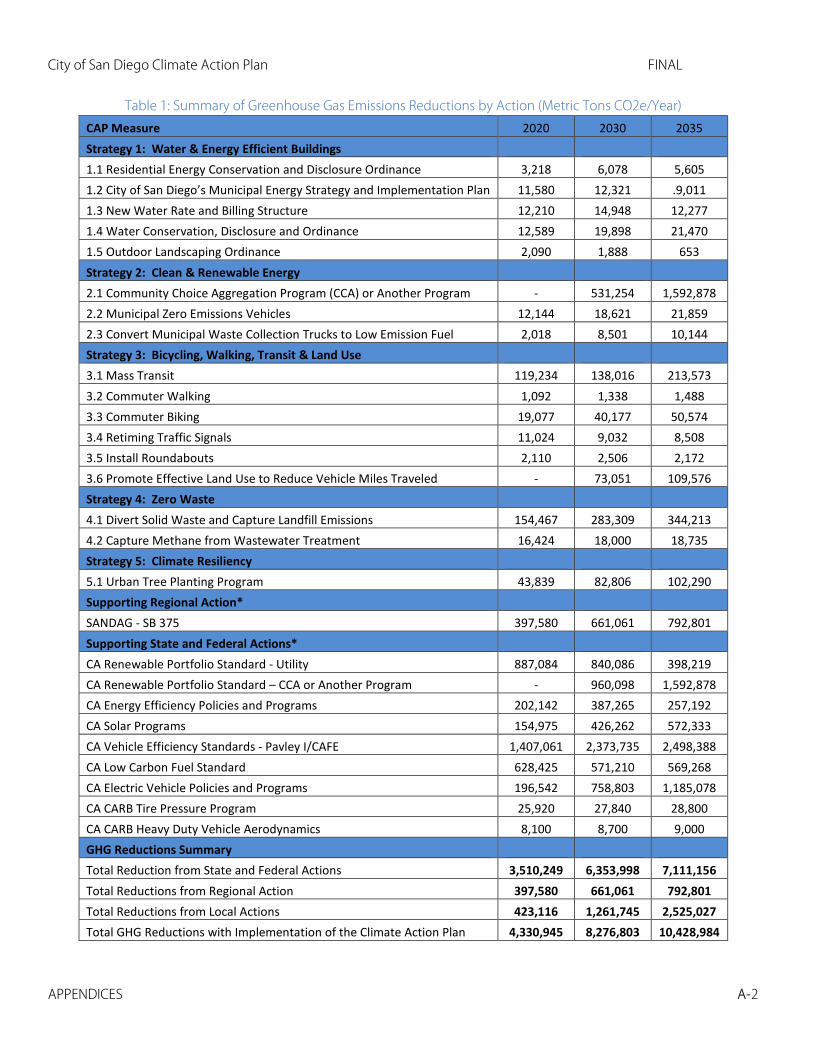
Table 1 provides a summary of the CAP measures and their contribution to the overall reduction.
City of San Diego Climate Action Plan FINAL
APPENDICES A-2
Table 1: Summary of Greenhouse Gas Emissions Reductions by Action (Metric Tons CO2e/Year) CAP Measure 2020 2030 2035 Strategy 1: Water & Energy Efficient Buildings 1.1 Residential Energy Conservation and Disclosure Ordinance 3,218 6,078 5,605 1.2 City of San Diego’s Municipal Energy Strategy and Implementation Plan 11,580 12,321 .9,011 1.3 New Water Rate and Billing Structure 12,210 14,948 12,277 1.4 Water Conservation, Disclosure and Ordinance 12,589 19,898 21,470 1.5 Outdoor Landscaping Ordinance 2,090 1,888 653 Strategy 2: Clean & Renewable Energy 2.1 Community Choice Aggregation Program (CCA) or Another Program - 531,254 1,592,878 2.2 Municipal Zero Emissions Vehicles 12,144 18,621 21,859 2.3 Convert Municipal Waste Collection Trucks to Low Emission Fuel 2,018 8,501 10,144 Strategy 3: Bicycling, Walking, Transit & Land Use 3.1 Mass Transit 119,234 138,016 213,573 3.2 Commuter Walking 1,092 1,338 1,488 3.3 Commuter Biking 19,077 40,177 50,574 3.4 Retiming Traffic Signals 11,024 9,032 8,508 3.5 Install Roundabouts 2,110 2,506 2,172 3.6 Promote Effective Land Use to Reduce Vehicle Miles Traveled - 73,051 109,576 Strategy 4: Zero Waste 4.1 Divert Solid Waste and Capture Landfill Emissions 154,467 283,309 344,213 4.2 Capture Methane from Wastewater Treatment 16,424 18,000 18,735 Strategy 5: Climate Resiliency 5.1 Urban Tree Planting Program 43,839 82,806 102,290 Supporting Regional Action* SANDAG - SB 375 397,580 661,061 792,801 Supporting State and Federal Actions* CA Renewable Portfolio Standard - Utility 887,084 840,086 398,219 CA Renewable Portfolio Standard – CCA or Another Program - 960,098 1,592,878 CA Energy Efficiency Policies and Programs 202,142 387,265 257,192 CA Solar Programs 154,975 426,262 572,333 CA Vehicle Efficiency Standards - Pavley I/CAFE 1,407,061 2,373,735 2,498,388 CA Low Carbon Fuel Standard 628,425 571,210 569,268 CA Electric Vehicle Policies and Programs 196,542 758,803 1,185,078 CA CARB Tire Pressure Program 25,920 27,840 28,800 CA CARB Heavy Duty Vehicle Aerodynamics 8,100 8,700 9,000 GHG Reductions Summary Total Reduction from State and Federal Actions 3,510,249 6,353,998 7,111,156 Total Reductions from Regional Action 397,580 661,061 792,801 Total Reductions from Local Actions 423,116 1,261,745 2,525,027 Total GHG Reductions with Implementation of the Climate Action Plan 4,330,945 8,276,803 10,428,984

City of San Diego Climate Action Plan FINAL
APPENDICES A-3
COMMON ASSUMPTIONS AND SOURCES
A set of common assumptions and sources was used to calculate emissions reductions for many of the
mitigation measures included in the CAP. The following section provides assumptions that were applied
to measures related to electricity, natural gas, and transportation. Other measures have specific methods
and data that are provided later in the document. Common Background Data Table 2 presents a summary of common data used to estimate both overall GHG emissions and the
reduction estimates for each specific action.
Table 2: Common Data Sources for City of San Diego Climate Action Plan Data Category 2010 2020 2035 Population1 1,359,578 1,542,324 1,759,271 Vehicle Miles Traveled2 13,745,004,004 15,114,486,656 18,255,806,585 Number of Vehicles3 956,789 1,068,787 1,288,272 Net Energy for Load (GWh)4 9,505 10,220 12,061 Gross Generation (GWh)5 9,580 10,826 13,910 Natural Gas Use (Million Therms)6 396 397 430 Single Family Units7 280,455 286,261 277,679 Multi-Family Units8 233,383 286,675 374,215 Water Consumption (Gallons)9 74,933,119,424 85,005,187,260 96,962,221,165 Commercial Building Area (Million Square Feet)10 291 328 398
1 Series 12 Population Forecast, San Diego Association of Governments (SANDAG). Available at http://datawarehouse.sandag.org/. 2 California Air Resources Board Emissions Factor Model (EMFAC2011). Available at http://www.arb.ca.gov/msei/modeling.htm. 3 EMFAC2011. 4 Kavalec, Chris, Nicholas Fugate, Bryan Alcorn, Mark Ciminelli, Asish Gautam, Kate Sullivan, and Malachi Weng‐Gutierrez, 2013. California Energy Demand 2014‐2024 Final Forecast, Volume 1: Statewide Electricity Demand, End‐User Natural Gas Demand, and Energy Efficiency. California Energy Commission, Electricity Supply Analysis. Division. Publication Number: CEC‐200‐2013‐004‐SF‐VI. Values beyond 2024 are extrapolated. 5 Gross generation is the sum of net energy for load (GWh), additional electricity load in the City of San Diego from CA Electric Vehicle Policies and Program (includes transmission and distribution losses), and electricity generation from CA Solar Programs (does not include transmission and distribution losses). 6 Kavalec et al. 2013. 7 San Diego Association of Governments (SANDAG), Forecast Housing Data. Available at http://datawarehouse.sandag.org/. 8 SANDAG Forecast Housing Data 9 Urban Water Management Plan 2010 (Table 3-10). Available at http://www.sandiego.gov/water/pdf/uwmp2010.pdf. 10 Collier International, email on 6 February 2014 and Kavalec et al. 2013.

City of San Diego Climate Action Plan FINAL
APPENDICES A-4
Electric and Natural Gas Related Measures The following assumptions were used in calculating greenhouse gas reductions for measures related to
electric and natural gas usage, including those in the Energy and Water Efficient Buildings and Clean and
Renewable Energy Resources strategies, and those in the Federal and State Actions.
Greenhouse Gas Emissions Factor for Electricity
The greenhouse gas emissions factor for electricity is the amount of greenhouse gases in each unit of
electricity supplied to City of San Diego consumers. This value is used in several ways throughout the
CAP, including to determine the emissions associated with electricity production for the overall emissions
inventory and to estimate the effect of measures in the CAP to reduce energy. To estimate the electricity
emissions factor, measured in pounds CO2e per megawatt‐hour (lbs CO2e/MWh), we include electricity
supplied from three categories of supply: the utility (SDG&E), a Community Choice Aggregation program
or another program (Action 2.1), and net-metered solar and shared solar (CA Solar Programs). Each
category of supply has its own renewable content , which affects the overall emissions factor. The
following sections describe the method used to determine the emissions intensity for the three
categories of supply and to develop a weighted average of all three. This methodology applies to the
2010 baseline emissions factor as well as to calculations for each year within the CAP time horizon. As the
percentage of renewable energy increases due to policy changes, the percentage of non-renewable
supply decreases, thus the overall average emissions factor of the electricity supply decreases over the
CAP time horizon.
SDG&E (Utility) Supplied Electricity
The emissions factor for electricity supplied by SDG&E takes into consideration several sources of supply,
including the emissions from power plants owned by SDG&E and from power purchased by SDG&E. For
SDG&E-owned power plants, we used actual fuel consumption and electricity production data.11 Next, we
calculated the emissions from power purchased by SDG&E from other suppliers. We multiplied the total
11 Federal Energy Regulatory Commission (FERC) Form 1, information available at http://www.ferc.gov/docs-filing/forms/form-1/viewer-instruct.asp, and SDG&E (email January 22, 2014).

City of San Diego Climate Action Plan FINAL
APPENDICES A-5
electric energy purchased (from FERC Form 1) by the emissions factor12 for the appropriate power plant.
This yielded a total emissions value for each plant. A similar approach is used for the quantity of supply for
which the source is unspecified. In this case, we use an emissions factor provided by the California Air
Resources Board.13The sum of the emissions values in pounds (lbs) for all plants (SDG&E-owned and those
selling to SDG&E) and unspecified sources divided by the sum of the electricity purchased (MWh) for all
plants yields an average emissions rate for all SDG&E supplied electricity. We assumed that direct access
providers, which are those suppliers other than SDG&E that account for about 18% of total electricity use
in the City of San Diego, have the same emissions rate as SDG&E.14
Community Choice Aggregation or Another Program
The City of San Diego CAP includes a goal to achieve a 100% renewable electricity supply in the City.15
The CAP includes the formation of a Community Choice Aggregation (CCA) or another program (Action
2.1) to help achieve this goal. Under a CCA or another program, the City of San Diego would enable the
alternative supply of electricity to a subset of overall electricity customers within the City. A CCA
essentially is an alternative supplier of electric energy that would use the existing SDG&E distribution and
transmission system to supply the electricity. We assume that 80% of eligible customers participate in a
CCA or another program in 2035. We also assume that the electricity supply from a CCA or another
program is 100% renewable in 2035 through a combination of renewable energy contracts and purchase
12 U.S. Environmental Protection Agency Emissions & Generation Resource Integrated Database (eGRID), Ninth edition with year 2010 data (Version 1.0). Available at http://www.epa.gov/cleanenergy/energy-resources/egrid/. 13 California Air Resources Board Regulation for Mandatory Reporting of Greenhouse Gas Emissions Section 95111(b)(1). Included as 0.428 metric tons of CO2e/MWh. Conversion to pounds yields 943.6 lbs CO2e/MWH. 14 SDG&E, Electricity and Natural Gas Consumption by Customer Class for City of San Diego. 2010-2012 15 We assume for purposes of estimating the greenhouse gas impacts of 100% renewable supply that this target applies to all the electricity supplied to all customers within the City of San Diego boundary, including that supplied by behind-the-meter technologies such as rooftop solar. Given the assumptions included in the CAP for those categories, 91% of electricity supply would be renewable by 2035. This level of renewable supply still allows the City to achieve the target reduction 10,223,523 Metric Tons CO2e/Year by 2035, which puts the City on pace to achieve the 2050 greenhouse gas reduction targets. The remaining 9% could be offset through the additional purchase of renewable energy credits or other means to be identified. As the CAP is reviewed and updated annually in 2020 and beyond, the renewable electricity supply will be reviewed to determine how the City is progressing in meeting the 100% renewable energy goal by 2035.
City of San Diego Climate Action Plan FINAL
APPENDICES A-6
of renewable energy credits (see Action 2.1 for more detail). Currently, Marin Clean Energy has a 75%
participation rate and has a default renewable content in its supply of of 50%.16 Sonoma County has 87%
participation rates in the first phase of implementation but expects to level off at 80%-85% participation
of eligible customers.17 Governor Jerry Brown recently signed legislation (SB 350) to increase the
renewable electricity supply target to of 50% by 2030.18
We use the quantity of renewable energy supplied by a CCA or another program to adjust the baseline
emissions factor of 736 lbs CO2e/MWh from SDG&E supplied electricity. There is no effect from a CCA or
another program until after 2020 because the CCA or another program is not implemented until after
that date. By 2035 a CCA or another program would significantly affect the emissions factor of electricity
with 100% renewable energy supply.
The Renewable Portfolio Standard (RPS) requires all California’s electric service providers, including CCA or
another program, to procure 50% of electricity sales from renewable sources by 2035. Therefore we
attribute 50% of the total emissions reductions from achieving a 100% renewable supply (through the
CCA or another program) to the RPS and the remaining to local action.19
16 Marin Energy Authority, 2013. Integrated Resource Plan Annual Update. Available at http://marincleanenergy.org/sites/default/files/key-documents/Integrated_Resource_Plan_2013_Update.pdf. See also: Understanding MCE’s GHG Emissions Factors – Calendar Year 2012. Available at http://marincleanenergy.org/sites/default/files/key-documents/Att.%20A%20-%20Understanding%20MCE%20GHG's%20Emission%20Factor_2012_3%2021%202014.pdf. 17 Sonoma Clean Power. 2014-2018 Resource Plan Draft, Version V0.4. Available at https://sonomacleanpower.org/wp-content/uploads/2014/08/SCP-Resource-Plan-Draft-v0.4-clean.pdf. 18 Senate Bills 350 – Clean Energy and Pollution Reduction Act of 2015. Available at https://leginfo.legislature.ca.gov/faces/billNavClient.xhtml?bill_id=201520160SB350.. 19Note that because SB 350 was not in force when the CAP was finalized in 2014, the emissions reductions attributable to this target were not specifically identified. Since the assumed levels of renewable energy supply in the CAP are already higher than this value, there is no change in total emissions reduced. Future updates to the CAP can reallocate the total emissions reduction from the Renewable Portfolio Standard to account for this change.

City of San Diego Climate Action Plan FINAL
APPENDICES A-7
CA Solar Programs (Net-Metered and Shared Solar20)
We consider solar as part of the overall supply of electricity for the City of San Diego rather than a
demand reduction for the utility. For purposes of estimating emissions reductions in the CAP, we assume
net-metered and shared solar is 100% renewable and has no associated greenhouse gas emissions.
Energy produced by solar programs is also used to adjust the overall emissions factor for electricity. As
more solar is installed it has a greater influence on the overall emissions factor, which declines as a result.
It is important to note that considering solar as a supply that serves a part of the overall energy demand
of the City of San Diego allows for proper allocation of emissions reductions to solar. If solar is considered
a demand reduction in a scenario of 100% renewable supply, then any type of solar would show no
emissions reductions benefits.
Weighted Average Emissions Factor for Electricity
To develop the overall 2010 baseline emissions factor for electricity of 730 lbs CO2e/MWh, we used a
weighted average of all three supply categories described above: utility, CCA or another program, and
solar programs. The 2010 baseline emissions factor was weighted by the percentage of gross generation
supplied by each category and the percentage of renewable content in each category. In 2010, the only
renewables contributions are from SDG&E and the net-metered portion of Solar Programs because no
CCA or another program or shared solar were in existence. Using the methodology described in Utility
(SDG&E) Supplied Electricity above the 2010 baseline emissions factor for electricity supplied by SDG&E is
736 lbs CO2e/MWh. This emissions factor includes the effects of the existing 10% renewable content in
the electricity supplied by SDG&E in that year (2010). The 2010 SDG&E supply baseline of 736 lbs CO2e
/MWh was adjusted down to 730 lbs CO2e /MWh due to a small contribution of net-metered solar
photovoltaics.21
20 Net-metered solar are photovoltaics systems on the customer’s premise that are interconnected to the electric distribution system. Shared solar are larger systems installed on the distribution system that provide energy to customers who opt into programs to supply all or a portion of electricity from these systems. Both categories of solar are described more in the Federal and State Actions Section below. 21 Kavalec et al. 2013.
City of San Diego Climate Action Plan FINAL
APPENDICES A-8
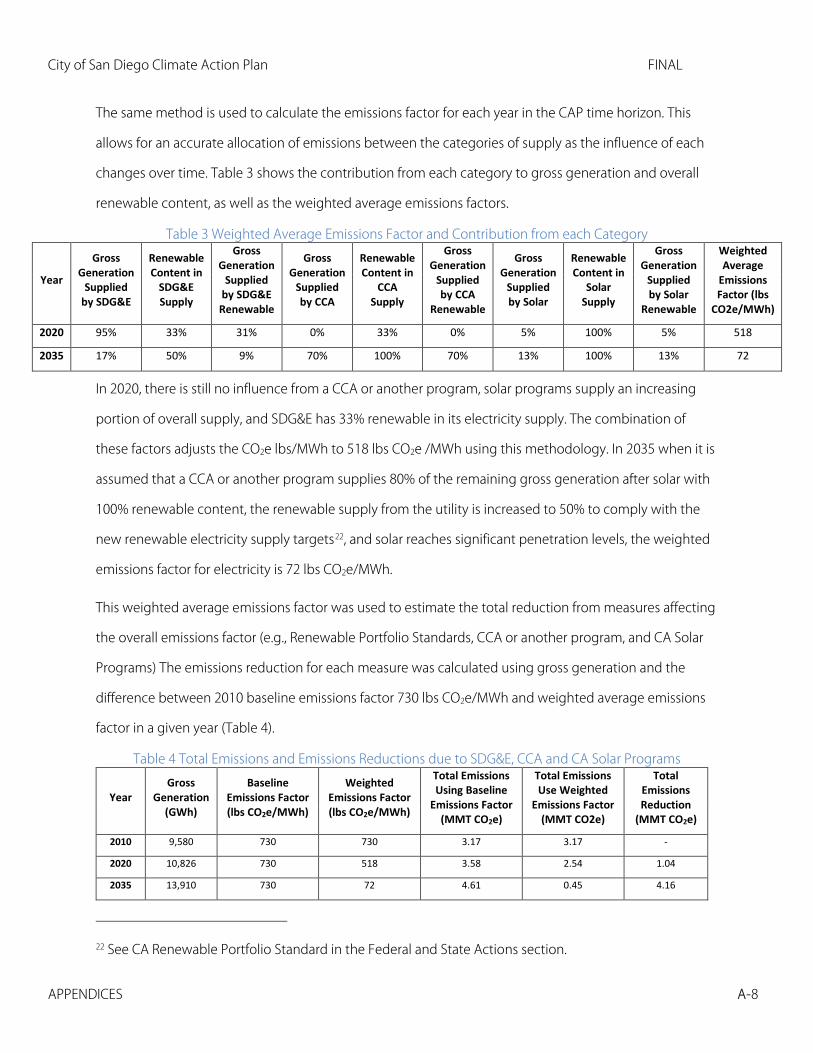
The same method is used to calculate the emissions factor for each year in the CAP time horizon. This
allows for an accurate allocation of emissions between the categories of supply as the influence of each
changes over time. Table 3 shows the contribution from each category to gross generation and overall
renewable content, as well as the weighted average emissions factors.
Table 3 Weighted Average Emissions Factor and Contribution from each Category
Year
Gross Generation
Supplied by SDG&E
Renewable Content in
SDG&E Supply
Gross Generation
Supplied by SDG&E
Renewable
Gross Generation
Supplied by CCA
Renewable Content in
CCA Supply
Gross Generation
Supplied by CCA
Renewable
Gross Generation
Supplied by Solar
Renewable Content in
Solar Supply
Gross Generation
Supplied by Solar
Renewable
Weighted Average
Emissions Factor (lbs
CO2e/MWh)
2020 95% 33% 31% 0% 33% 0% 5% 100% 5% 518
2035 17% 50% 9% 70% 100% 70% 13% 100% 13% 72
In 2020, there is still no influence from a CCA or another program, solar programs supply an increasing
portion of overall supply, and SDG&E has 33% renewable in its electricity supply. The combination of
these factors adjusts the CO2e lbs/MWh to 518 lbs CO2e /MWh using this methodology. In 2035 when it is
assumed that a CCA or another program supplies 80% of the remaining gross generation after solar with
100% renewable content, the renewable supply from the utility is increased to 50% to comply with the
new renewable electricity supply targets22, and solar reaches significant penetration levels, the weighted
emissions factor for electricity is 72 lbs CO2e/MWh.
This weighted average emissions factor was used to estimate the total reduction from measures affecting
the overall emissions factor (e.g., Renewable Portfolio Standards, CCA or another program, and CA Solar
Programs) The emissions reduction for each measure was calculated using gross generation and the
difference between 2010 baseline emissions factor 730 lbs CO2e/MWh and weighted average emissions
factor in a given year (Table 4).
Table 4 Total Emissions and Emissions Reductions due to SDG&E, CCA and CA Solar Programs
Year Gross
Generation (GWh)
Baseline Emissions Factor (lbs CO2e/MWh)
Weighted Emissions Factor (lbs CO2e/MWh)
Total Emissions Using Baseline
Emissions Factor (MMT CO2e)
Total Emissions Use Weighted
Emissions Factor (MMT CO2e)
Total Emissions Reduction
(MMT CO2e)
2010 9,580 730 730 3.17 3.17 -
2020 10,826 730 518 3.58 2.54 1.04
2035 13,910 730 72 4.61 0.45 4.16
22 See CA Renewable Portfolio Standard in the Federal and State Actions section.

City of San Diego Climate Action Plan FINAL
APPENDICES A-9
A method similar to that used to adjust the overall emissions factor for electricity was used to allocate the
total emissions from changes in clean energy supply to the three categories described above. We allocate
the total emissions reduction to each category using the percentage of the renewable content in gross
generation from each category of total renewable content. These percentages are presented in Table 5.
For example, in 2020 a total of 37% of gross generation was provided by renewable supply: 31% from
SDG&E, 0% from CCA, and 5% from CA Solar Programs. Of the total gross generation provided by
renewable supply, SDG&E provided 85% in 2020. To estimate the contribution of SDG&E attaining the
Renewable Portfolio Standard targets of 33% renewable supply by 2020, we multiplied the total
emissions reduction from Table 4 above of 1.04 MMT CO2e by the total contribution to the overall
percent renewable (85%) to yield 0.89 MMT CO2e. .
Table 5 Emission Reduction from SDG&E, CCA and Solar Program
Category
2020 2035
% of Gross Generation Supplied by Renewable
% Renewable from Each
Category/Total
Emission Reduction
(MMT CO2e)
% of Gross Generation Supplied by Renewable
Renewable from Each
Category/Total
Emission Reduction
(MMT CO2 e)
SDG&E 31% 85% 0.89 9% 10% 0.40
CCA or another program
0% 0% 0.00 70% 77% 3.19
CA Solar Program
s 5% 15% 0.15 13% 14% 0.57
Total 37% 100% 1.04 91% 100% 4.16
Relationship between GHG Emissions Rate and CAP Measures
The electricity emissions rate is an important factor in determining the emissions reductions that result
from measures and actions in the CAP. Importantly, there is a relationship between the emissions rate
and the amount of greenhouse gas reductions expected from CAP measures. For example, as the
percentage of electricity provided by renewable sources increases, the electricity emissions factor
decreases. Consequently, each reduction in electricity use or efficiency improvements would yield a

City of San Diego Climate Action Plan FINAL
APPENDICES A-10
smaller greenhouse gas reduction. On the other hand, as the total amount of electricity is reduced by
efficiency, the total amount of renewable energy needed and the emissions reductions from increasing
renewable energy supply declines.
Transmission and Distribution Losses
Electricity losses due to transmission and distribution are added to electricity consumed in order to
account for the total quantity of electricity generated to serve energy demands and to ensure that all
greenhouse gas emissions generated to serve total consumption are captured. If a specific quantity of
end-use electricity is reduced due to efficiency measures, it is necessary to add transmission losses to
account for the total emissions associated with that end use consumption because such actions offset
the energy at the customer meter and the additional losses that would be incurred to deliver the
electricity. A loss factor of 6.8% is used based on the 2014-2024 California Energy Commission’s Energy
Demand Forecast.23
Natural Gas
For all measures involving natural gas, we used an emissions factor of 0.0054 metric tons of CO2e per
therm.24 This represents emissions from natural gas from carbon-dioxide, methane, and nitrous oxide.
Transportation Related Measures The following assumptions were used in calculating greenhouse gas reductions for measures related to
transportation, including those in the Biking, Walking and Transit strategy.
23 Kavalec et al. 2013. 24 California Air Resources Board 2012 Greenhouse Gas Inventory documentation. Available at http://www.arb.ca.gov/cc/inventory/doc/doc_index.php.

City of San Diego Climate Action Plan FINAL
APPENDICES A-11
Vehicle Miles Traveled (VMT)
EPIC used vehicle miles traveled (VMT) values for 2010, 2020 and 2035 from the California Air Resources
Board’s (CARB) Emissions Factor Model (EMFAC) 2011 model. Regional results were scaled to the City of
San Diego on the basis of historical VMT ratios available from SANDAG.25
Greenhouse Gas Emissions Factor for Transportation
The greenhouse gas emissions factor for vehicle miles traveled is the amount of greenhouse gas
emissions associated with a mile driven. This value, expressed in grams of carbon dioxide equivalent per
VMT (CO2e/VMT), is used in several ways throughout the CAP, including to determine the emissions
associated with on-road transportation for the overall emissions inventory and to estimate the emissions
impact of measures in the CAP that affect both the rate of emissions (e.g., vehicle efficiency standards)
and vehicle miles traveled (e.g., bike and walk policies).
The 2010 baseline emissions factor used in the CAP is based on regional results from the California Air
Resources Board EMFAC 2011 model. EMFAC 2011 is used by regional transportation planning agencies
in California to estimate air pollutants, including carbon emissions, from all on-road vehicles on all roads.
EMFAC 2011 combines tested vehicle emission rate data with regional vehicle activity to provide greater
accuracy for regional emissions. The EMFAC 2011 model also provides emission reductions from Pavley I
and the Low Carbon Fuel Standard but it does not provide reductions expected from SB375 targets, and
includes a de minimis level of miles driven by electric vehicles (EV) or other alternative fuel vehicles.
Effects of the new CAFE standards that will apply to vehicles produced from 2017 to 2025 were also
incorporated with the results from EMFAC 2011 to account for their effect on emissions.
Weighted Average Emissions Factor for Vehicle Miles Traveled
As with electricity, to properly account for the interdependencies of CAP actions in the transportation
sector, EPIC developed a weighted emissions factor for VMT. Using the methodology described below,
25 Total Daily Vehicle Miles of Travel (by City). Available at http://www.sandag.org/resources/demographics_and_other_data/transportation/adtv/index.asp.
City of San Diego Climate Action Plan FINAL
APPENDICES A-12
the 2010 baseline value is 499 grams CO2e per mile. The 2020 value is 360 grams CO2e per mile and for
2035 it is 278 grams CO2e per mile.
We developed an emissions rate that is weighted according to the relative shares of each action affecting
the emissions rate. Accordingly, EPIC identified the actions that affect the fleet-wide emissions rate: CAFE
standards, the Low Carbon Fuel Standard (LCFS), and California electric vehicle policies and programs.
Next EPIC determined the percentage reduction in emissions rate that each action has upon vehicles of
the appropriate fuel type. For example, CAFE standards result in about a 30% reduction in the emissions
rate as compared to the business-as-usual forecast. Electric vehicles resulting from state policies and
programs offset gasoline VMT, and thus result in a 100% reduction in the emissions rate as compared to
the business-as-usual forecast.
Next, EPIC identified the percentage of VMT associated with each action. Starting with the total VMT as
stated in Table 2 we allocated miles driven by electric vehicles resulting from state policies and programs
(Pavley I/CAFE standards and the LCFS). In this way, all miles are allocated among the three categories,
similar to allocating the gross generation into three categories in the previous electricity measures
section. Electric vehicles resulting from state policies and programs apply to 13% of the total VMT by this
time.
Therefore the weighted emissions factor, when used to determine the greenhouse gas effects of an
action that reduces VMT (or gasoline consumption) will allocate emissions reductions proportionately.
This relation can also be used to determine the total greenhouse gas reductions resulting from the
combination of the CAFE standards, LCFS, and California electric vehicles policies and programs. This is
done in each year in the CAP time frame by multiplying the difference between the BAU emissions factor
and the weighted emissions factor by the VMT amount avoided by a measure.
Finally, this combined greenhouse gas reduction can be apportioned to each of the three categories
(CAFE, LCFS, and California electric vehicles policies and programs) according to their relative impact
upon the weighted emissions rate. The relative impact of each action is a function of the product of the
fractional reduction in the emissions rate for the relative fuel type and the fraction of the total VMT
affected by the action.
City of San Diego Climate Action Plan FINAL
APPENDICES A-13
Weighted Average Emissions Factor per Vehicle
A similar methodology as described above for the emissions factor for miles driven was used to
determine the weighted average emissions factor for emissions per vehicle – a separate value from
emissions per mile. These emissions occur when a fuel combustion vehicle is started and after the
ignition is stopped. As the number of electric vehicles increases, this emissions factor is reduced because
there are no emissions from an electric vehicle during the start and stop phases of use. Also, as vehicles
become more fuel efficienct due to CAFE standards and fuel becomes less carbon intense due to the
Low-Carbon Fuel Standard, the emissions per vehicle decreases. The baseline 2010 emissions factor for
based on EMFAC2011 is 597 grams/vehicle/day decreasing to 467 grams CO2e/vehicle/day in 2020 and
401 grams CO2e/vehicle/day in 2035.
The CO2e/vehicle/day emissions factor is used in combination with the CO2e/mile factor to calculate the
emissions reduction from measures.
Relationship between GHG Emissions Rate and CAP Measures
Because vehicle efficiency improves over time due to Pavley I, the CAFE standards, the LCFS, increased
use of electric vehicles, the greenhouse gas intensity per mile decreases. Consequently, measures that
reduce VMT offset a proportionally smaller greenhouse gas reduction over time.
Rounding of Values in Tables and Figures
Within the tables, charts, and figures found throughout the Appendices, rounding of values is often
required. Conventional rounding is used throughout the document, meaning values are rounded to the
nearest integer of a higher order of magnitude. Within the actual calculations however, values are not
rounded at intermediary steps to avoid introducing unnecessary error. As a result of rounding, some
totals may not equal the values summed.
City of San Diego Climate Action Plan FINAL
APPENDICES A-14
CITY OF SAN DIEGO CAP MEASURES
The following presents calculated emissions reduction values for a series of city‐based actions leading to
GHG emissions reductions from the five main strategies of the CAP: Energy and Water Efficient Buildings;
Clean and Renewable Energy; Biking, Walking & Transit; Zero Waste Management; and, Climate Resiliency.
Strategy 1: Energy & Water Efficient Buildings Electricity consumption accounts for about 25% of citywide greenhouse gas emissions, while natural gas
accounts for about 17%. Because approximately 80% of electricity use and 90% of natural gas use is
associated with buildings, many of the measures included in the City of San Diego CAP target building
energy use. There is also a strong connection between water use and energy use. Energy is required to
transport, treat, heat, and cool water locally, as well as to produce electricity and transportation fuels.
Overall, about 25% of California’s combined electric and natural gas consumption is associated with
water.26 While a significant amount is used to move water around the state, the vast majority of energy is
used to heat water, typically in residential units and businesses. Therefore, reducing use of water will
positively impact both water and energy use resources.
The City of San Diego CAP includes 5 actions (Actions 1.1 to 1.5) to reduce emissions from energy and
water use. The following provides information about the data and methods used to calculate the related
energy and greenhouse gas emissions reductions.
Goal: Reduce Residential Energy Consumption
Action 1.1 Residential Energy Conservation and Disclosure Ordinance
For the Residential Energy Conservation and Disclosure Ordinance, we assumed that residential units
being sold or remodeled would be required to disclose energy use. Additionally, we assumed that rented
units would not be captured by this policy as renters may have no incentive to improve efficiency since
there is no ownership interest in the property and the building owner may have no incentive since the
26 Energy Policy Initiatives Center estimate based on data from the California Energy Commission.
City of San Diego Climate Action Plan FINAL
APPENDICES A-15
renter typically pays the energy costs. To calculate reductions from this measure, we first estimated the
number of residential units affected by using the rate of remodels and additions and the rate of sales of
residential units. According to the City of San Diego Development Services Department27, approximately
0.5% of the existing stock of residential units in the City conducts a remodel or addition in an average
year. According to the San Diego Association of Realtors, about 3% of the existing stock of residential
units was sold in 2012‐13 in the County of San Diego. 28 We assumed that the rate was the same for
residential units in the City of San Diego. To account for the fact that rented units would not be captured
by this policy, we assumed that 48% of residential units – applied equally to multi- and single-family units
– were owner occupied, according to the U.S. Census Bureau.29 To eliminate the possibility of double
counting, we reduced the total quantity of owner-occupied units by the amount that already was
affected by the policy. As a result, approximately 20% of single‐family and multi‐family owner-
occupied units would be affected by this local disclosure policy by 2020 and approximately 50% of
single-family and multi-family owner-occupied units in 2035. We then multiplied this value by the
number of single and multi-family units in the City to determine the total number of units disclosing
energy use. Of those disclosing energy use, we assumed that 12% implemented efficiency activities and,
therefore, multiplied the number of units disclosing energy use by 12% to determine the number of units
implementing efficiency activities.30
To estimate the total energy and emissions reductions associated with this policy, we assumed that each
participating unit reduced energy use by 15%31 below the average residential energy consumption
value.32 We then calculated average residential electric and natural gas consumption per unit by dividing
total consumption by the total number of units (single and multi-family). We then determined the
reduction in electric and natural gas consumption per unit by multiplying the resulting values by 15%.
27 Communication with City of San Diego Development Services, email on 19 December 2013. 28 San Diego County Association of Realtors, 2013. Comparative Sales of Existing Homes in San Diego County. 29 U.S. Census Bureau. Available at http://www.census.gov/. 30 Climate Leadership Academy Network, 2010. Case Study: Austin, Texas, Using Energy Disclosure to Promote Retrofitting. Available at https://stuff.mit.edu/afs/athena/dept/cron/project/urban-sustainability/Energy%20Efficiency_Brendan%20McEwen/Cities/Austin/austin_energy_disclosure.pdf. 31 Based on data from the Energy Upgrade California program in SDG&E service territory. 32 Kavalec et al. 2013.

City of San Diego Climate Action Plan FINAL
APPENDICES A-16
The values were multiplied by total number of residential units implementing efficiency activities and
respective emissions factors, and then summed for each year to determine GHG reductions from the
action for 2020 and 2035. Because this measure is dependent on a number of residential housing units
per year, the greenhouse gas reduction is based on a 2015 start date. Also as the electric emissions factor
declines over time, as the electricity supply comprises more and more renewable sources, the
greenhouse gas reductions from efficiency decline accordingly. Energy reductions associated with natural
gas are not affected by this trend. Table 6 summarizes key assumptions and results.
Table 6 Key Assumptions and Results Residential Energy Conservation and Disclosure Ordinance
Year
Total Owner
Occupied Single Family Units33
Total Owner
Occupied Multi
Family Units34
Percent of Units Sold
Annually35
Percent of SF Units
Remodeled Annually36
Percent of MF Units
Remodeled Annually37
Total Percent of SF &
MF Units Disclosing
Energy Use
Total Units
Disclosing Energy
use
Percentage of Units that
Implemented Efficiency
Activities38
Total Units Implementing
Efficiency Activities
2020 137,405 137,604 3.0% 0.5% 0.5% 20% 52,699 12% 6,324
2035 133,286 179,623 3.0% 0.5% 0.5% 50% 149,492 12% 17,939
33 SANDAG Forecast Housing Data 34 SANDAG Forecast Housing Data 35 San Diego County Association of Realtors 2013. 36 Communication with City of San Diego Development Services, email on 19 December 2013. 37 Communication with City of San Diego Development Services, email on 19 December 2013. 38 Climate Leadership Academy Network 2010.
Year
Average Residential
Electric Consumption
per Unit
Electricity Reduction per Unit
Electricity Reductions
Average Residential Natural Gas
Consumption per Unit
Natural Gas Reduction per Unit
Natural Gas Reductions
GHG Reductions
from Action 1.1
(kWh/yr) (kWh/yr) (GWh) (Therms/yr) (Therms/yr) (MM Therms) (MT CO2e)
2020 7,101 1,065 6.7 319 48 0.3 3,218
2035 8,460 1,269 22.8 334 50 0.9 5,605

City of San Diego Climate Action Plan FINAL
APPENDICES A-17
Goal: Reduce Municipal Energy Consumption
Action 1.2 City of San Diego’s Municipal Energy Strategy and Implementation Plan
To estimate the emissions reductions associated with this local action, we assume that the City adopts a
policy to reduce overall energy use by 15% in 2020 and an additional 25% in 2035.39 We also assume City
energy consumption will increase at a rate of 1.5% annually from 2010 levels, consistent with internal
forecasting methods.40 Additionally, the reduction was applied equally to electricity and natural gas
consumption.
To calculate GHG reductions from energy reductions in 2020 and 2035, electricity and natural gas
consumption from City operations41 was multiplied by the respective energy reduction (15% for 2020 and
25% for 2035). Those reductions were multiplied by the emissions factors for electricity and natural gas,
respectively, and summed to determine total GHG reductions.42
Also as the electric emissions factor declines over time, as the electricity supply comprises more and more
renewable sources, the greenhouse gas reductions from efficiency decline accordingly. Energy reductions
associated with natural gas are not affected by this trend. Table 7 summarizes the key assumptions and
results.
Table 7: Key Assumptions and Results for Municipal Energy Strategy and Implementation Plan
Year Overall Energy Reductions43
Electricity Reductions
Natural Gas Reductions GHG Reductions
(GWh) (MM Therms) (MT CO2e) 2020 15% 36 0.6 11,580
2035 25% 75 1.2 9,011
39 Goldman et al. 2005. 40 Communication with City of San Diego Department of Environmental Services, conversation 17 February 2015. 41 Municipal energy consumption provided by the City of San Diego. 42 “Common Assumptions and Sources” Section, this document. 43 Goldman et al. 2005.
City of San Diego Climate Action Plan FINAL
APPENDICES A-18
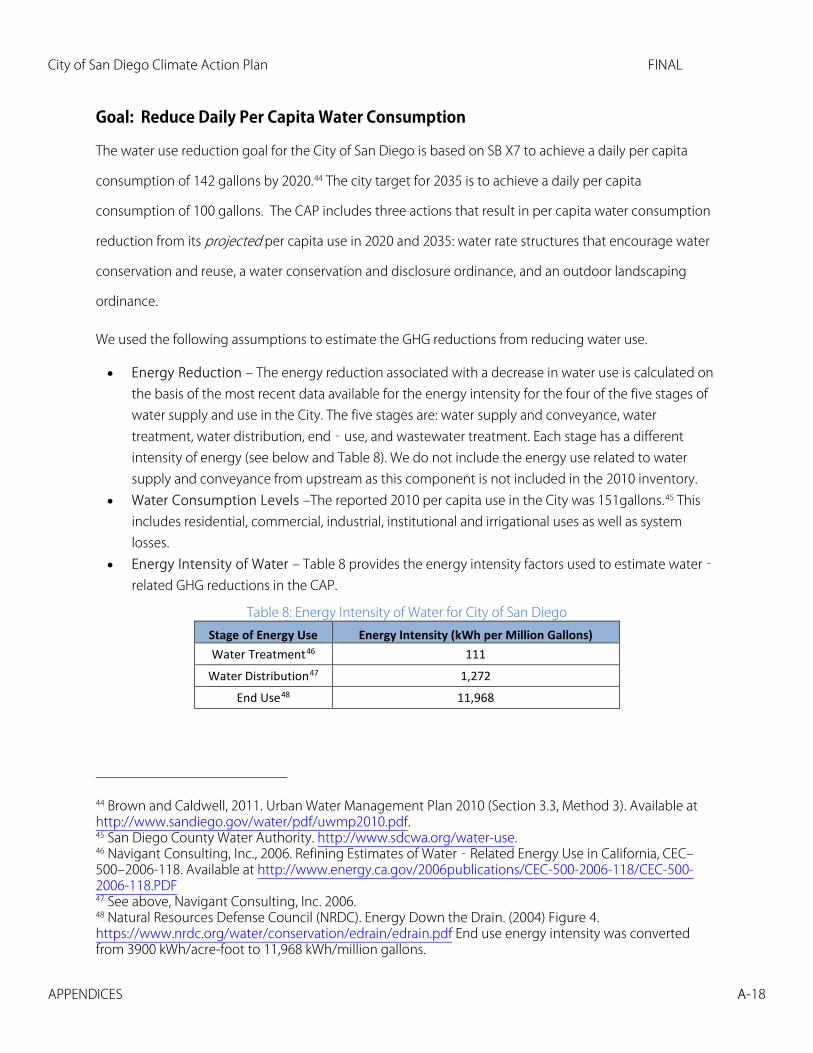
Goal: Reduce Daily Per Capita Water Consumption
The water use reduction goal for the City of San Diego is based on SB X7 to achieve a daily per capita
consumption of 142 gallons by 2020.44 The city target for 2035 is to achieve a daily per capita
consumption of 100 gallons. The CAP includes three actions that result in per capita water consumption
reduction from its projected per capita use in 2020 and 2035: water rate structures that encourage water
conservation and reuse, a water conservation and disclosure ordinance, and an outdoor landscaping
ordinance.
We used the following assumptions to estimate the GHG reductions from reducing water use.
• Energy Reduction – The energy reduction associated with a decrease in water use is calculated on the basis of the most recent data available for the energy intensity for the four of the five stages of water supply and use in the City. The five stages are: water supply and conveyance, water treatment, water distribution, end‐use, and wastewater treatment. Each stage has a different intensity of energy (see below and Table 8). We do not include the energy use related to water supply and conveyance from upstream as this component is not included in the 2010 inventory.
• Water Consumption Levels –The reported 2010 per capita use in the City was 151gallons.45 This includes residential, commercial, industrial, institutional and irrigational uses as well as system losses.
• Energy Intensity of Water – Table 8 provides the energy intensity factors used to estimate water‐related GHG reductions in the CAP.
Table 8: Energy Intensity of Water for City of San Diego Stage of Energy Use Energy Intensity (kWh per Million Gallons) Water Treatment46 111
Water Distribution47 1,272
End Use48 11,968
44 Brown and Caldwell, 2011. Urban Water Management Plan 2010 (Section 3.3, Method 3). Available at http://www.sandiego.gov/water/pdf/uwmp2010.pdf. 45 San Diego County Water Authority. http://www.sdcwa.org/water-use. 46 Navigant Consulting, Inc., 2006. Refining Estimates of Water‐Related Energy Use in California, CEC–500–2006-118. Available at http://www.energy.ca.gov/2006publications/CEC-500-2006-118/CEC-500-2006-118.PDF 47 See above, Navigant Consulting, Inc. 2006. 48 Natural Resources Defense Council (NRDC). Energy Down the Drain. (2004) Figure 4. https://www.nrdc.org/water/conservation/edrain/edrain.pdf End use energy intensity was converted from 3900 kWh/acre-foot to 11,968 kWh/million gallons.
City of San Diego Climate Action Plan FINAL
APPENDICES A-19
• Greenhouse Gas Emissions Factor for Electricity –The greenhouse gas emissions factor for electricity used to move water varies depending on the actions included in the CAP. The 2010 weighted GHG intensity value is 730 lbs CO2e/MWh.49
49 Refer to Weighted Average Emissions Factor for Electricity section in this document.

City of San Diego Climate Action Plan FINAL
APPENDICES A-20
Action 1.3 New Water Rate and Billing Structure
Proposition 218 authorizes rate increases that could be passed on to customers contingent upon City
Attorney review followed by Council adoption.50 Based on a proposal by City of San Diego Public Utilities
Department, there was an increase in water rates of 7.25% in 2014 compared with 2012 and an additional
7.5% increase in 2015 compared to 2012.51 We assume an additional rate increase of 15% by year 2020,
25% increase by year 2030, and 30% increase by year 2035, which is lower than the historical rate increase
of 7.6% annually from 2007-201352. The elasticity of water use due to rates was set at -0.2 based on a 2009
CEC study of residential water use in California.53 This means that a 7.5% increase in water rates would
result in a 1.5% reduction in usage. The elasticity was kept constant at -0.2 through 2035.
Rate increases are assumed to reduce electricity use associated with water distribution, treatment, and a
portion (20%) of the end-use energy use.54 Natural gas constitutes the majority of end use energy use and
accounts for about of about 80% of total end-use energy consumption.
To determine the GHG emissions reductions from a potential new water rate billing structure we first
developed a BAU water consumption projection through 2035 using the total BAU per capita
consumption and population forecasts. Next, the water use reduction for a given year was determined
taking the consumption in the previous year and deducting the product of the rate increases, the water
price elasticity, and the previous year’s consumption. Next, the water use reduction was converted into
(1) electricity reduction using the water treatment energy intensity (111 kWh/Million Gallons)55, the water
50 Proposition 218 Notice. Available at http://docs.sandiego.gov/councilcomm_agendas_attach/2013/NRC_130731_5b.pdf. 51 Proposition 218 Notice. 52 City of San Diego Water Branch of Public Utilities. Rate Increases. Available at http://www.sandiego.gov/water/rates/increases/. (Note: These documents show that rates have increased by more than 7% per year over the last 7 years. Therefore, an annual increase of 15% over the next 15 years appears conservative and reasonable.) 53 Dale, Larry, Fujita, Sydney K., Lavin Vasquez, Felpie, Moezzi, Mithra, Hanemann, Michael, Lutzenhiser, Loren, 2009. Price Impact of the Demand for Water and Energy in California Residences. California Climate Change Center. Available at http://eetd.lbl.gov/sites/all/files/price_impact_on_the_demand_for_water_and_energy_in_califoria_residences_cec-500-2009-032-f.pdf. 54 EPIC’s calculations based on electricity use for water end uses available from Natural Resources Defense Council (NRDC). Energy Down the Drain. (2004) Figure 4.and natural gas data from CEC http://www.energy.ca.gov/2005publications/CEC-700-2005-011/CEC-700-2005-011-SF.PDF Table 1-6. 55 Navigant Consulting, Inc. 2006.

City of San Diego Climate Action Plan FINAL
APPENDICES A-21
distribution energy intensity (1,272 kWh/Million Gallons)56, and the end use energy intensity (11,968
kWh/Million Gallons)57, and (2) natural gas reductions using the million therms conversion factor. Finally,
the energy reductions are used to determine the emissions reductions using the greenhouse gas
emission factors for electricity and natural gas.
Also the electric emissions factor declines over time. As the electricity supply comprises more and more
renewable sources, the greenhouse gas reductions from efficiency decline accordingly. Energy reductions
associated with natural gas are not affected by this trend. Table 9 summarizes the key assumptions and
results.
Table 9: Key Assumptions and Results for Updated Water Rate and Billing Structure
Year
Total BAU Water
Consumption58
Cumulative Increase in
Water Rates by Target Year59
Reduction in Daily Per
Capita Water Consumption Due to Water Rate Structure
Daily Per Capita Water
Use after New Rate and
Billing Structure
Target Daily per
Capita Water
Use
GHG Reductions
from Water Rate
Structure (Gallons/Year) (%) (Gallons) (Gallons) (Gallons) (MT CO2e)
2020 85,005,187,260 15% 4.4 146.6 141 12,210
2035 96,962,221,165 30% 8.7 142.3 100 12,277
56 Navigant Consulting, Inc. 2006. 57 Natural Resources Defense Council (NRDC). Energy Down the Drain. (2004) Figure 4. https://www.nrdc.org/water/conservation/edrain/edrain.pdf End use energy intensity was converted from 3900 kWh/acre-foot to 11,968 kWh/million gallons. 58 Brown and Caldwell, 2011. Urban Water Management Plan 2010 (Table 3-10). Available at http://www.sandiego.gov/water/pdf/uwmp2010.pdf. 59 Proposition 218 Notice.
City of San Diego Climate Action Plan FINAL
APPENDICES A-22
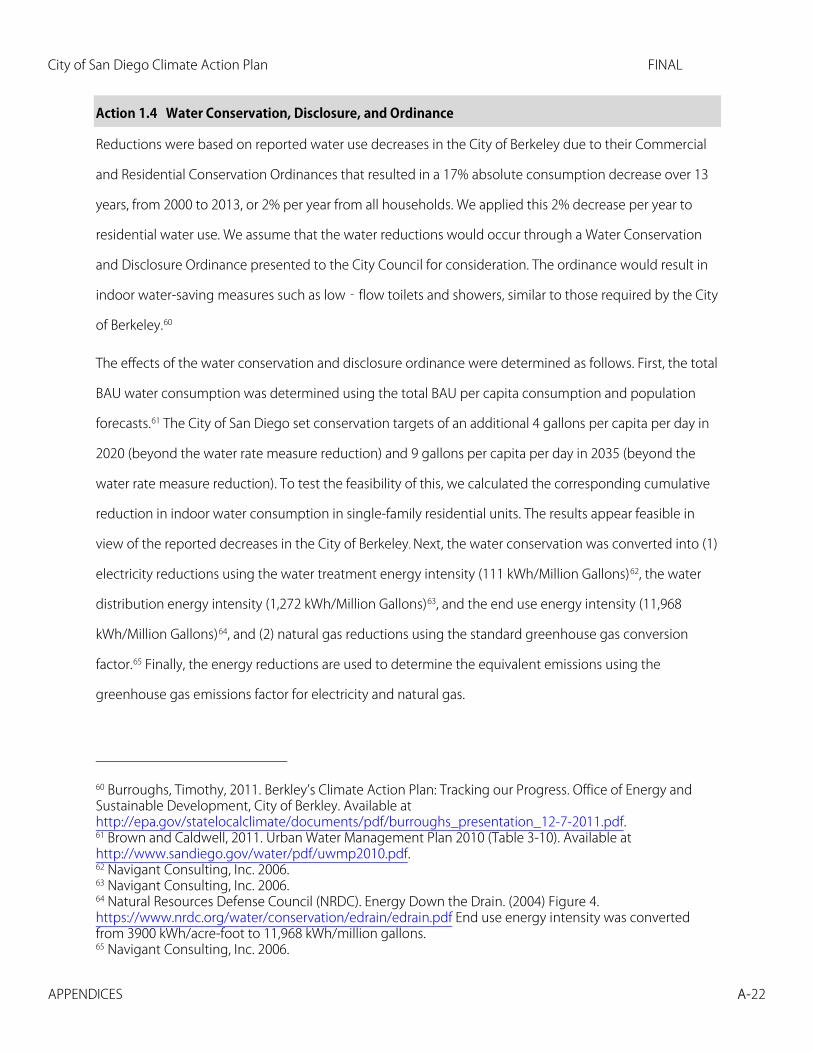
Action 1.4 Water Conservation, Disclosure, and Ordinance
Reductions were based on reported water use decreases in the City of Berkeley due to their Commercial
and Residential Conservation Ordinances that resulted in a 17% absolute consumption decrease over 13
years, from 2000 to 2013, or 2% per year from all households. We applied this 2% decrease per year to
residential water use. We assume that the water reductions would occur through a Water Conservation
and Disclosure Ordinance presented to the City Council for consideration. The ordinance would result in
indoor water-saving measures such as low‐flow toilets and showers, similar to those required by the City
of Berkeley.60
The effects of the water conservation and disclosure ordinance were determined as follows. First, the total
BAU water consumption was determined using the total BAU per capita consumption and population
forecasts.61 The City of San Diego set conservation targets of an additional 4 gallons per capita per day in
2020 (beyond the water rate measure reduction) and 9 gallons per capita per day in 2035 (beyond the
water rate measure reduction). To test the feasibility of this, we calculated the corresponding cumulative
reduction in indoor water consumption in single-family residential units. The results appear feasible in
view of the reported decreases in the City of Berkeley. Next, the water conservation was converted into (1)
electricity reductions using the water treatment energy intensity (111 kWh/Million Gallons)62, the water
distribution energy intensity (1,272 kWh/Million Gallons)63, and the end use energy intensity (11,968
kWh/Million Gallons)64, and (2) natural gas reductions using the standard greenhouse gas conversion
factor.65 Finally, the energy reductions are used to determine the equivalent emissions using the
greenhouse gas emissions factor for electricity and natural gas.
60 Burroughs, Timothy, 2011. Berkley’s Climate Action Plan: Tracking our Progress. Office of Energy and Sustainable Development, City of Berkley. Available at http://epa.gov/statelocalclimate/documents/pdf/burroughs_presentation_12-7-2011.pdf. 61 Brown and Caldwell, 2011. Urban Water Management Plan 2010 (Table 3-10). Available at http://www.sandiego.gov/water/pdf/uwmp2010.pdf. 62 Navigant Consulting, Inc. 2006. 63 Navigant Consulting, Inc. 2006. 64 Natural Resources Defense Council (NRDC). Energy Down the Drain. (2004) Figure 4. https://www.nrdc.org/water/conservation/edrain/edrain.pdf End use energy intensity was converted from 3900 kWh/acre-foot to 11,968 kWh/million gallons. 65 Navigant Consulting, Inc. 2006.

City of San Diego Climate Action Plan FINAL
APPENDICES A-23
Because this measure is dependent on a number of residential housing units per year, the greenhouse
gas reduction is based on a 2015 start date. Also, as the electric emissions factor declines over time, as the
electricity supply comprises more and more renewable sources, the greenhouse gas reductions from
efficiency decline accordingly. Energy reductions associated with natural gas are not affected by this
trend. Table 10 summarizes key assumptions and results for this measure.
Table 10: Key Assumptions and Results from Water Conservation and Disclosure Ordinance
Year
Daily per Capita Reduction in Indoor Water Consumption in
Residential Single Family Homes due to Point of Sale Disclosure
Measure (Gallons)
Daily per Capita Water Use After Point of Sale
Disclosure Measure + Rate Measure (Gallons)
Target Daily per Capita Water Use (Gallons)
GHG Reductions
from Disclosure Ordinance (MT CO2e)
2020 4 143 141 12,589
2035 9 133 100 21,470

City of San Diego Climate Action Plan FINAL
APPENDICES A-24
Action 1.5 Outdoor Landscaping Ordinance
This action is designed to address outdoor water use only, and reductions are based on a study by the
Irvine Ranch Water District that found a reduction potential of over 43 gallons per household per day.66
We assumed this rate is valid for the City of San Diego given similarity in climate, and it was applied to
outdoor water use to determine possible water use reductions. Outdoor water use constitutes the
majority, or about 58%67 of total water use in San Diego. The water reductions were converted to
electricity reductions, and therefore GHG emissions. When calculating energy reductions from this action,
only electricity reductions from distribution and treatment were included since outdoor water is not
subject to wastewater treatment and there is no natural gas reductions associated with outdoor water
use.
To determine the effects of an outdoor landscaping ordinance, we developed a BAU projection for water
consumption using the total BAU per capita consumption and population forecasts.68 The City of San
Diego set outdoor water conservation targets of 3 gallons per capita per day in 2020 (beyond the above
two water measures) and 5 gallons per capita per day in 2035 (beyond the above two water reduction
measures). The corresponding reduction in outdoor water consumption is well within the range of the
results of the Irvine Ranch Water District findings. Since there is no end use electricity or natural gas
associated with outdoor water use, the total greenhouse gas reductions were determined using only the
water treatment energy intensity (111 kWh/Million Gallons)69 and the water distribution energy intensity
(1,272 kWh/Million Gallons).70 The quantity of energy reductions was multiplied by the emissions factor
for electricity in that year.
Because electric emissions factor declines over time, as the electricity supply comprises more and more
renewable sources, the greenhouse gas reductions from efficiency decline accordingly. Energy reductions
66 ConSol, 2010. Water Use in the California Residential Home. California Homebuilding Foundation. Available at http://www.cbia.org/go/cbia/?LinkServID=E242764F-88F9-4438-9992948EF86E49EA. 67 Brown and Caldwell, 2011. Urban Water Management Plan 2010 (Table 3-10). Available at http://www.sandiego.gov/water/pdf/uwmp2010.pdf. 68 Brown and Caldwell, 2011. Urban Water Management Plan 2010 (Table 3-10 & 3-12). Available at http://www.sandiego.gov/water/pdf/uwmp2010.pdf. 69 Navigant Consulting, Inc. 2006. Available at http://www.energy.ca.gov/2006publications/CEC-500-2006-118/CEC-500-2006-118.PDF. 70 Navigant 2006.
City of San Diego Climate Action Plan FINAL
APPENDICES A-25
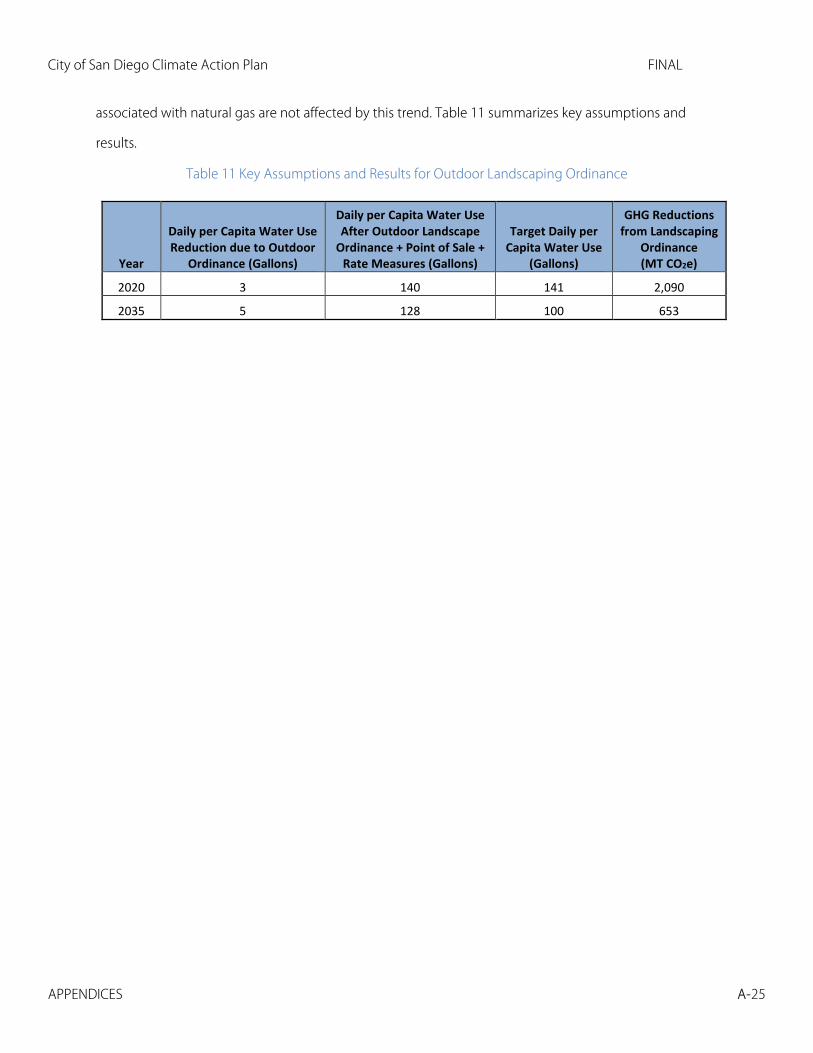
associated with natural gas are not affected by this trend. Table 11 summarizes key assumptions and
results.
Table 11 Key Assumptions and Results for Outdoor Landscaping Ordinance
Year
Daily per Capita Water Use Reduction due to Outdoor
Ordinance (Gallons)
Daily per Capita Water Use After Outdoor Landscape
Ordinance + Point of Sale + Rate Measures (Gallons)
Target Daily per Capita Water Use
(Gallons)
GHG Reductions from Landscaping
Ordinance (MT CO2e)
2020 3 140 141 2,090
2035 5 128 100 653

City of San Diego Climate Action Plan FINAL
APPENDICES A-26
Strategy 2: Clean and Renewable Energy The City of San Diego is committed to a goal of supplying 100% of electricity needs in the City by
renewable sources by 2035.
Goal: 100% Renewable Energy Supply to the City by 2035
Action 2.1 Community Choice Aggregation Program or Another Program
As described in the Greenhouse Gas Emissions Factor for Electricity section above, several categories of
supply contribute to the goal of reaching 100% renewable electricity supply by 2035, including the
renewable electricity supply by the utility (SDG&E), CA Solar Programs (net energy metered solar and
shared solar), and a community choice aggregation (CCA) program or another program. Given the
assumptions included in the CAP for those categories, 91% of electricity supply would be renewable by
2035. This level of renewable supply still allows the City to achieve the target reduction 10,223,523 Metric
Tons CO2e/Year by 2035, which puts the City on pace to achieve the 2050 greenhouse gas reduction
targets. The remaining 9% could be offset through the additional purchase of renewable energy credits
or other means to be identified. As the CAP is reviewed and updated annually in 2020 and beyond, the
renewable electricity supply will be reviewed to determine how the City is progressing in meeting the
100% renewable energy goal by 2035.
To estimate the effect of policies due to a CCA or another program, it is necessary to account for the
interaction among the categories of supply. The percentage of electricity and renewable content
attributed by CA Solar Programs, CCA or another program, and the investor-owned utility supplier are
given in Table 3. As mentioned above in the Greenhouse Gas Emissions Factor for Electricity section, we
assume that 80% of eligible customers participate in a CCA or another program and therefore 80% of the
total remaining electricity is supplied by the CCA or another program. Currently, Marin Clean Energy has
75% participation and has a renewable content of 50%.71 Sonoma County has 87% participation rates in
71 Marin Energy Authority, 2013. Integrated Resource Plan Annual Update. Available at http://marincleanenergy.org/sites/default/files/key-documents/Integrated_Resource_Plan_2013_Update.pdf. See also: Understanding MCE’s GHG Emissions Factors – Calendar Year 2012. Available at http://marincleanenergy.org/sites/default/files/key-

City of San Diego Climate Action Plan FINAL
APPENDICES A-27
the first phase of implementation but expects to level off at 80%-85% participation of eligible
costumers.72
To estimate the greenhouse gas reductions from Action 2.1, we assume that all the electricity provided by
a CCA or another program is 100% renewable in 2035 through a combination of renewable supply and
purchase of renewable energy credits; however, it is reasonable to assume that the electricity supply to
customers of a CCA or another program would comprise 75% renewable content. The remaining
emissions would be offset with renewable energy credits. As described above, Governor Jerry Brown
recently signed legislation to increase the renewable portfolio standard supply targets to 50% renewable
electricity by 2030.73 Table 12 below shows the role of each category of supply toward the goal of
reaching the 100% renewable electricity target by 2035.
Table 12: Contribution of Electricity Supply Categories to 100% Renewable Target
Category Percentage of Total
Electricity Supply in 2035
Percentage of Supply from Renewables in
2035
Percentage of TOTAL supply from Renewables
in 2035
Utility 17% 50% 9%
CA Solar Programs 13% 100% 13%
CCA or Another Program 70% 100% 70%
Total 100% N/A 91%
documents/Att.%20A%20-%20Understanding%20MCE%20GHG's%20Emission%20Factor_2012_3%2021%202014.pdf. 72 Sonoma Clean Power. 2014-2018 Resource Plan Draft, Version V0.4. Available at https://sonomacleanpower.org/wp-content/uploads/2014/08/SCP-Resource-Plan-Draft-v0.4-clean.pdf. 73 Senate Bills 350 – Clean Energy and Pollution Reduction Act of 2015. Available at https://leginfo.legislature.ca.gov/faces/billNavClient.xhtml?bill_id=201520160SB350. Note that because SB 350 was not in force when the CAP was finalized in 2014, the emissions reductions attributable to this target were not specifically identified. Since the assumed levels of renewable energy supply in the CAP are already higher than this value, there is no change in total emissions reduced. Future updates to the Cap can reallocate the total emissions reduction from the Renewable Portfolio Standard to account for this change. .
City of San Diego Climate Action Plan FINAL
APPENDICES A-28
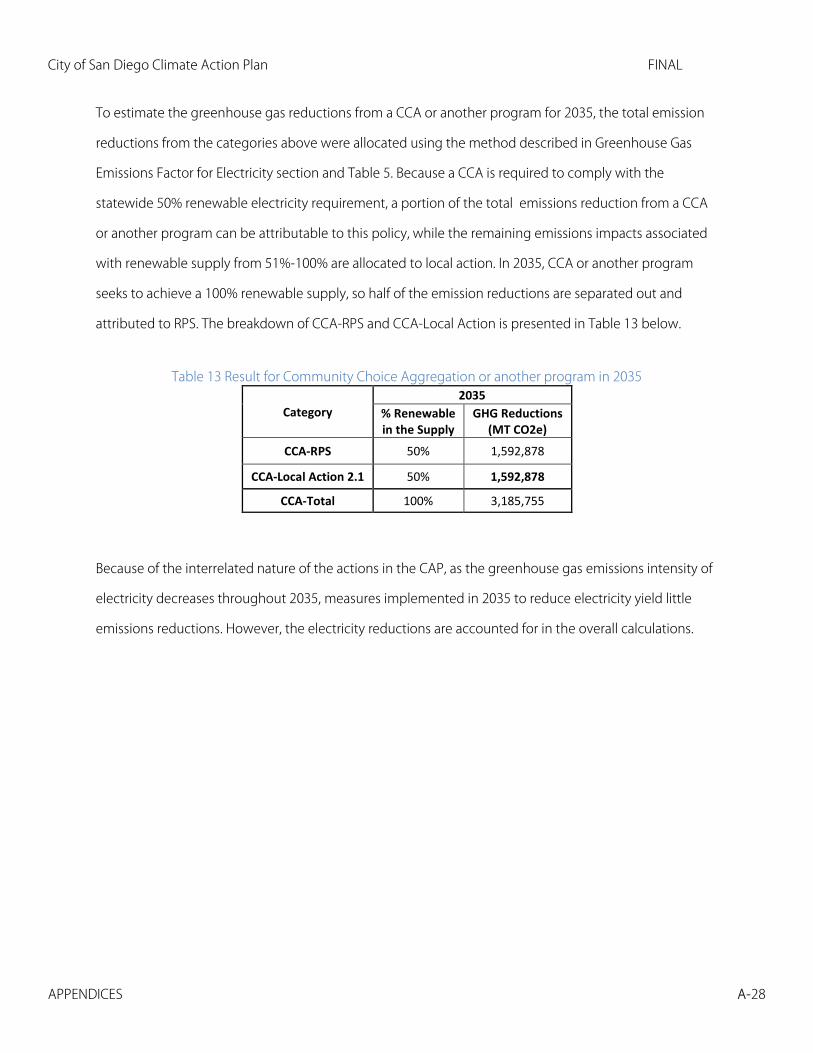
To estimate the greenhouse gas reductions from a CCA or another program for 2035, the total emission
reductions from the categories above were allocated using the method described in Greenhouse Gas
Emissions Factor for Electricity section and Table 5. Because a CCA is required to comply with the
statewide 50% renewable electricity requirement, a portion of the total emissions reduction from a CCA
or another program can be attributable to this policy, while the remaining emissions impacts associated
with renewable supply from 51%-100% are allocated to local action. In 2035, CCA or another program
seeks to achieve a 100% renewable supply, so half of the emission reductions are separated out and
attributed to RPS. The breakdown of CCA-RPS and CCA-Local Action is presented in Table 13 below.
Table 13 Result for Community Choice Aggregation or another program in 2035
Category 2035
% Renewable in the Supply
GHG Reductions (MT CO2e)
CCA-RPS 50% 1,592,878
CCA-Local Action 2.1 50% 1,592,878
CCA-Total 100% 3,185,755
Because of the interrelated nature of the actions in the CAP, as the greenhouse gas emissions intensity of
electricity decreases throughout 2035, measures implemented in 2035 to reduce electricity yield little
emissions reductions. However, the electricity reductions are accounted for in the overall calculations.

City of San Diego Climate Action Plan FINAL
APPENDICES A-29
Goal: Increase Municipal Zero Emissions Vehicles
Action 2.2 Municipal Zero Emissions Vehicles
The City of San Diego maintains a fleet of more than 1,000 vehicles for municipal operations.74
Converting the municipal passenger vehicle fleet gradually to EVs will reduce gasoline use, thereby
reducing GHG emissions. The City of San Diego provided current municipal fleet gasoline consumption
data. We assumed that there would be no changes in 2020 and 2035 to this gasoline demand for its
municipal passenger vehicle fleet. The City’s goals are to convert 50% of gasoline fleet to EV’s by 2020 and
90% of gasoline the gasoline fleet to EV’s by 2035. If the City of San Diego amends AR 90.73 to
incorporate the fleet conversion goals, then the target greenhouse gas reductions for this action can be
met.
To determine the effects of converting the municipal fleet to EV’s we followed these steps. First, we
determined the amount of greenhouse gas emissions produced by combusting the gasoline used by the
municipal fleet. Next, we multiplied this value by the fleet conversion targets. This results in the total
emissions offset if the city achieves its conversion targets. Table 14 summarizes key assumptions and
results.
Table 14 Key Assumptions and Results for Municipal Fleet Conversion to Zero Emissions Vehicles
Year
Gasoline Consumption75
CO2e per Gallon of Gas76
GHG From Gasoline
Use Gasoline Fleet VMT
Converted to EVs GHG Reduced Due to EV Conversion
(Gallons) (Pounds) (MT CO2e) (%) (MT CO2e)
2020 2,598,220 20.62 24,288 50% 12,144
2035 2,598,220 20.62 24,288 90% 21,859
Goal: Convert Municipal Waste Collection Trucks to Natural Gas
74 Municipal Fleet Fuel Consumption provided by the City of San Diego. 75 Municipal Fleet Fuel Consumption provided by the City of San Diego. 76 United State Energy Information Administration. How much carbon dioxide is produced by burning gasoline and diesel fuel? Available at http://www.eia.gov/tools/faqs/faq.cfm?id=307&t=11.

City of San Diego Climate Action Plan FINAL
APPENDICES A-30
Action 2.3 Convert Municipal Waste Collection Trucks to Low Emission Fuel
The City of San Diego seeks to reduce emissions associated with hauling municipal solid waste by
converting from diesel fuel use to compressed natural gas. The conversion leads to a net reduction in
GHGs despite an increase in emissions due to natural gas consumption. It was assumed that the energy
needs of the City Collection Services fleet would remain the same through 2035.
To determine the effects of converting the municipal waste fleet to low emissions fuels, we did the
following. First, we multiplied the total fleet diesel fuel use77 by the fleet conversion targets78 in order to
determine the diesel fuel reduction amount. Next we multiplied the diesel fuel reduction by the CO2 per
pound value for diesel fuel79 to obtain the business-as-usual waste fleet emissions. Next, we offset the
emissions reduction by the increased natural gas emissions. The result is the net reductions in
greenhouse gas emissions as a result of converting the waste fleet to natural gas. Table 15 summarizes
key assumptions and results.
Table 15 Key Assumptions and Results for Municipal Waste Collection Truck Conversion to Low Emission Fuel
Year
Annual Diesel
Fuel Use by Waste
Fleet Before
Conversion80
Total Diesel Fuel Emissions
Before Conversio
n
% of Fleet Converted to NG81
Diesel Fuel
Reduction
CO2 per pound
for Diesel82
Emissions Reductions Due to Diesel Fuel
Offsets
Total Annual Emissions Associated with Fleet
NG Consumptio
n Net GHG Reduced
(Gallons) (MT CO2e) (%) (Gallons) (MT CO2e) (MT CO2e) (MT CO2e)
2020 1,000,000 10,151 20% 200,000 22.4 2,020 1.4 2,018
2035 1,000,000 10,151 100% 1,000,000 22.4 10,151 7.2 10,144
77 Personal communication with the City of San Diego, November 2010. 78 City of San Diego. Conversion of the waste collection fleet will commence in 2018 with the goal to achieve complete conversion by 2035. 79 Annual Energy Outlook 2012, DOE/EIA-0383 June 2012, page 37. (Note: We assumed that the energy content of diesel remains constant in 2020 and 2035 at 129,500 British Thermal Units (BTU) per gallon of diesel.) 80 Personal communication with the City of San Diego, November 2010. 81 City of San Diego. Conversion of the waste collection fleet will commence in 2018 with the goal to achieve complete conversion by 2035. 82 Annual Energy Outlook 2012, DOE/EIA-0383 June 2012, page 37. (Note: We assumed that the energy content of diesel remains constant in 2020 and 2035 at 129,500 British Thermal Units (BTU) per gallon of diesel.)
City of San Diego Climate Action Plan FINAL
APPENDICES A-31
Strategy 3: Bicycling, Walking, Transit & Land Use The transportation sector accounts for over 50% of all GHG emissions within the City of San Diego. The
CAP includes eight transportation actions. The effects of regional action under SB 375 (i.e., telecommute,
carpool, vanpool, buspool, bottleneck Relief, HOV/HOT lanes) were calculated in the Regional Action
Section below. As explained in the that Section, GHG emissions reductions from mass transit, bicycle and
walking were separated from that calculation since stakeholders were interested in assessing local
impacts of measures related to mass transit, walking and biking. The amount of GHG reductions depends
on the percentage mode share of commuters by transit, walking and bicycle. The following measures are
restricted to GHG reductions from only commuter mode shares, which will nonetheless have co‐
benefits for all users of alternative transportation. The GHG reduction amount is based on the projected
number of employed persons in Transit Priority Areas (TPAs). The projected employment numbers for
these areas were modeled by SANDAG for the City.
Goal: Increase Use of Mass Transit
Action 3.1 Mass Transit
According to the American Community Survey83, about 4% of city commuters used mass transit in 2010.
Under the current Regional Transportation Plan (RTP) 205084, SANDAG expects this value to increase to
about 7.8% in 2020 and about 10.1% in 2035 by increasing transit frequency, providing incentives, and
adding new routes. Based on current transit mode share in TPAs85, the City planners and transportation
engineers we consulted anticipate that by prioritizing these areas for transit improvements, it will be
possible to achieve 12% commuter transit (peak period) mode share in 2020 and 25% commuter transit
83 American Community Survey Briefs 2008 and 2009 (Table 2), for San Diego-Carlsbad-San Marcos area. 84 SANDAG RTP 2050. 85 City of San Diego Planning Department. Pedestrian Mobility Plan. Available at http://www.sandiego.gov/planning/programs/transportation/mobility/pedestrian.shtml, Appendix D for current pedestrian mode shares. The Bicycle Master Plan is available at http://www.sandiego.gov/planning/programs/transportation/mobility/bicycleplan.shtml. Current bicycle mode shares are derived from Tables 5.12 and include college commuters.
City of San Diego Climate Action Plan FINAL
APPENDICES A-32
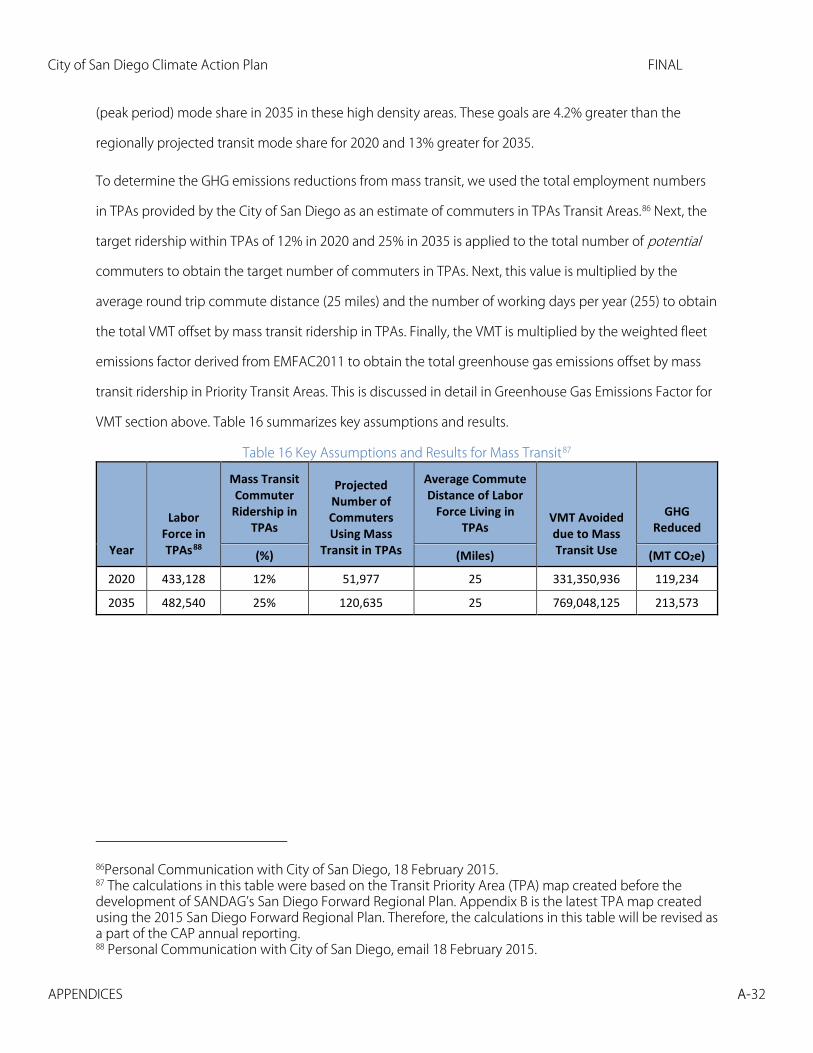
(peak period) mode share in 2035 in these high density areas. These goals are 4.2% greater than the
regionally projected transit mode share for 2020 and 13% greater for 2035.
To determine the GHG emissions reductions from mass transit, we used the total employment numbers
in TPAs provided by the City of San Diego as an estimate of commuters in TPAs Transit Areas.86 Next, the
target ridership within TPAs of 12% in 2020 and 25% in 2035 is applied to the total number of potential
commuters to obtain the target number of commuters in TPAs. Next, this value is multiplied by the
average round trip commute distance (25 miles) and the number of working days per year (255) to obtain
the total VMT offset by mass transit ridership in TPAs. Finally, the VMT is multiplied by the weighted fleet
emissions factor derived from EMFAC2011 to obtain the total greenhouse gas emissions offset by mass
transit ridership in Priority Transit Areas. This is discussed in detail in Greenhouse Gas Emissions Factor for
VMT section above. Table 16 summarizes key assumptions and results.
Table 16 Key Assumptions and Results for Mass Transit87
Year
Labor Force in TPAs88
Mass Transit Commuter
Ridership in TPAs
Projected Number of Commuters Using Mass
Transit in TPAs
Average Commute Distance of Labor
Force Living in TPAs
VMT Avoided due to Mass Transit Use
GHG Reduced
(%) (Miles) (MT CO2e)
2020 433,128 12% 51,977 25 331,350,936 119,234
2035 482,540 25% 120,635 25 769,048,125 213,573
86Personal Communication with City of San Diego, 18 February 2015. 87 The calculations in this table were based on the Transit Priority Area (TPA) map created before the development of SANDAG’s San Diego Forward Regional Plan. Appendix B is the latest TPA map created using the 2015 San Diego Forward Regional Plan. Therefore, the calculations in this table will be revised as a part of the CAP annual reporting. 88 Personal Communication with City of San Diego, email 18 February 2015.

City of San Diego Climate Action Plan FINAL
APPENDICES A-33
Goal: Increase Commuter Walking Opportunities
Action 3.2 Commuter Walking
The City of San Diego Pedestrian Master Plan of 2006 provides estimates for walking mode share in all the
Community Planning Areas of the City.89 We assume an increase in pedestrian commuter mode share
from 3.5% for the whole city in 2006 (assumed for 2010, same as 2006) to 4.1% in 2020 and 6.5% in 2035
in Transit Priority Areas. It is assumed that commuter walking will lead to an avoidance of 0.6790 miles per
day per commuter in 2020 and 2035.
The effects of increased commuter walking opportunities were determined as follows. The City of San
Diego provided the total employment numbers in TPAs as an estimate of commuters in TPAs Transit
Areas.91 Next, the mode share targets are applied to determine the projected number of walking
commuters. Finally, this value is multiplied by the round-trip commute distance and the number of
working days per year to obtain the total VMT offset by commuter walking. Finally, the VMT is multiplied
by the weighted fleet emissions factor derived from EMFAC2011 to obtain the total greenhouse gas
emissions offset by mass transit ridership in Priority Transit Areas. Table 17 summarizes key assumptions.
Table 17 Key Assumptions and Results for Commuter Walking92
Year Labor Force in TPAs93
Mode Share Goals in TPAs
Projected Number of Commuters
Commuting by Walking
Round-trip Commute Distance
VMT Avoided Due to
Pedestrian Commuters
GHG Reduced
(%) (Miles) (Miles) (MT CO2e)
2020 433,128 4.1% 17,759 0.67 3,034,070 1,092
2035 482,540 6.5% 31,365 0.67 5,358,727 1,488
89 City of San Diego Planning Department. Pedestrian Mobility Plan. Available at http://www.sandiego.gov/planning/programs/transportation/mobility/pedestrian.shtml, Appendix D for current pedestrian mode shares. 90 Personal communication with SANDAG, email 9 January 2015. 91 Personal Communication with City of San Diego, email 18 February 2015. 92 The calculations in this table were based on the Transit Priority Area (TPA) map created before the development of SANDAG’s San Diego Forward Regional Plan. Appendix B is the latest TPA map created using the 2015 San Diego Forward Regional Plan. Therefore, the calculations in this table will be revised as a part of the CAP annual reporting. 93 Personal Communication with City of San Diego, email 18 February 2015.
City of San Diego Climate Action Plan FINAL
APPENDICES A-34
Goal: Increase Commuter Bicycling Opportunities
Action 3.3 Commuter Bicycling
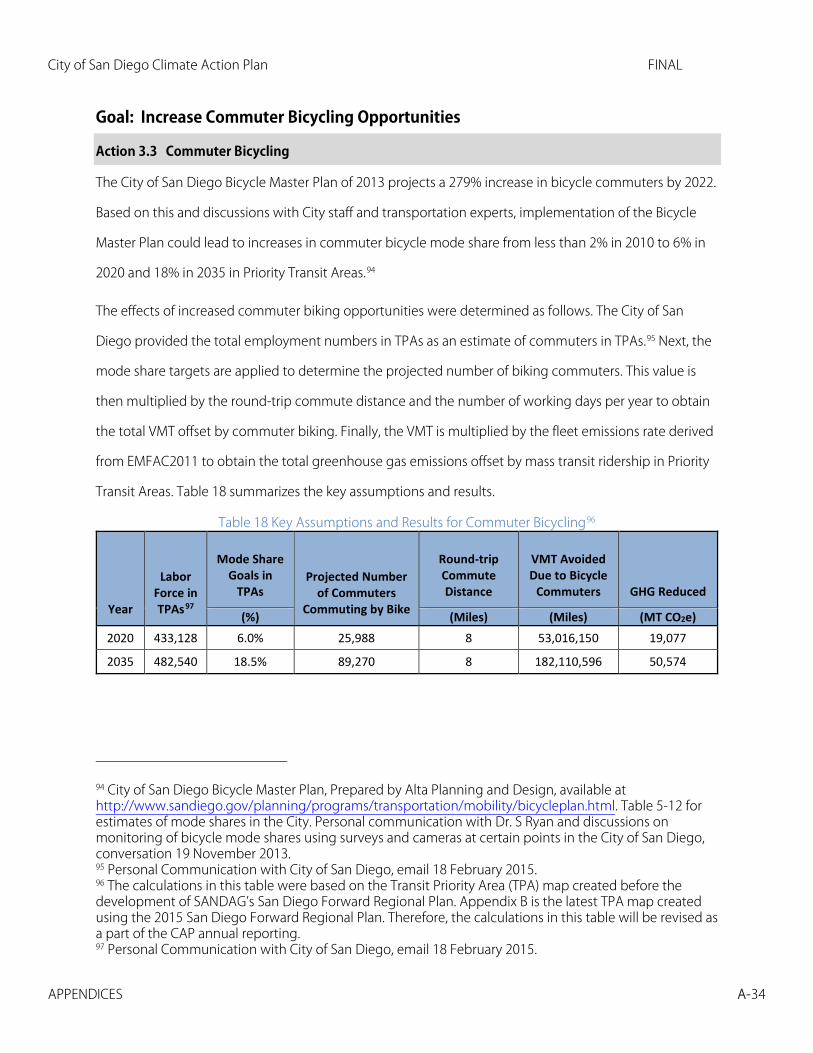
The City of San Diego Bicycle Master Plan of 2013 projects a 279% increase in bicycle commuters by 2022.
Based on this and discussions with City staff and transportation experts, implementation of the Bicycle
Master Plan could lead to increases in commuter bicycle mode share from less than 2% in 2010 to 6% in
2020 and 18% in 2035 in Priority Transit Areas.94
The effects of increased commuter biking opportunities were determined as follows. The City of San
Diego provided the total employment numbers in TPAs as an estimate of commuters in TPAs.95 Next, the
mode share targets are applied to determine the projected number of biking commuters. This value is
then multiplied by the round-trip commute distance and the number of working days per year to obtain
the total VMT offset by commuter biking. Finally, the VMT is multiplied by the fleet emissions rate derived
from EMFAC2011 to obtain the total greenhouse gas emissions offset by mass transit ridership in Priority
Transit Areas. Table 18 summarizes the key assumptions and results.
Table 18 Key Assumptions and Results for Commuter Bicycling96
Year
Labor Force in TPAs97
Mode Share Goals in
TPAs Projected Number
of Commuters Commuting by Bike
Round-trip Commute Distance
VMT Avoided Due to Bicycle
Commuters GHG Reduced
(%) (Miles) (Miles) (MT CO2e) 2020 433,128 6.0% 25,988 8 53,016,150 19,077
2035 482,540 18.5% 89,270 8 182,110,596 50,574
94 City of San Diego Bicycle Master Plan, Prepared by Alta Planning and Design, available at http://www.sandiego.gov/planning/programs/transportation/mobility/bicycleplan.html. Table 5-12 for estimates of mode shares in the City. Personal communication with Dr. S Ryan and discussions on monitoring of bicycle mode shares using surveys and cameras at certain points in the City of San Diego, conversation 19 November 2013. 95 Personal Communication with City of San Diego, email 18 February 2015. 96 The calculations in this table were based on the Transit Priority Area (TPA) map created before the development of SANDAG’s San Diego Forward Regional Plan. Appendix B is the latest TPA map created using the 2015 San Diego Forward Regional Plan. Therefore, the calculations in this table will be revised as a part of the CAP annual reporting. 97 Personal Communication with City of San Diego, email 18 February 2015.

City of San Diego Climate Action Plan FINAL
APPENDICES A-35
Goal: Reduce Vehicle Fuel Consumption
While the following transportation actions are not directly within a transit, bicycle or walking strategy,
local actions to reduce vehicle fuel consumption in ways that do not reduce VMT are kept within the
main strategy in order to have all local transportation actions within one overarching transportation
strategy.
Action 3.4 Retiming Traffic Signals
Interconnecting previously uncoordinated signals in a centralized manner instead of independent
unconnected lights has been shown to provide significant reductions in delays, congestion and, thus,
emissions.98 In 2001, SANDAG reported that, of the then existing 1430 signals, 486 traffic signals had been
retimed since 1998 with plans to re-time 320 more in the City of San Diego in an unspecified time frame.
However, discussions with City traffic engineers indicated that it is reasonable to retime 200 traffic signals,
which equates to 40 traffic signals per year, in the City by 2020.99
To calculate emissions reductions from retiming traffic signals, the amount of fuel reduction per
intersection was estimated based on studies conducted by the insurance industry100 and a SANDAG study
in traffic signal optimization.101 Energy reductions per intersection were multiplied by the number of
retimed traffic signals and then divided by average miles per gallon for the San Diego County private
fleet102 to determine reduced VMT. Reduced VMT was then multiplied by the CO2e/mile to determine
GHG reduced. Table 19 summarizes key assumptions and results.
98 Rowe, Edwin, 1991. The Los Angeles Automated Traffic Surveillance and Control System. Available at http://ieeexplore.ieee.org/stamp/stamp.jsp?tp=&arnumber=69967. 99 Communication with City of San Diego, email 24 August 2014. 100 Bergh, Casey, Retting, Richard A., and Myers, Edward, 2005. The Cost of Missed Opportunities to Improve Traffic Flow and Safety at Urban Intersections. Insurance Institute for Highway Safety. Available at www.iihs.org 101 SANDAG study on Traffic Signal Optimization Program, April 1994, page 4-17, Appendix C Exhibit 5.2. 102 EMFAC 2011.
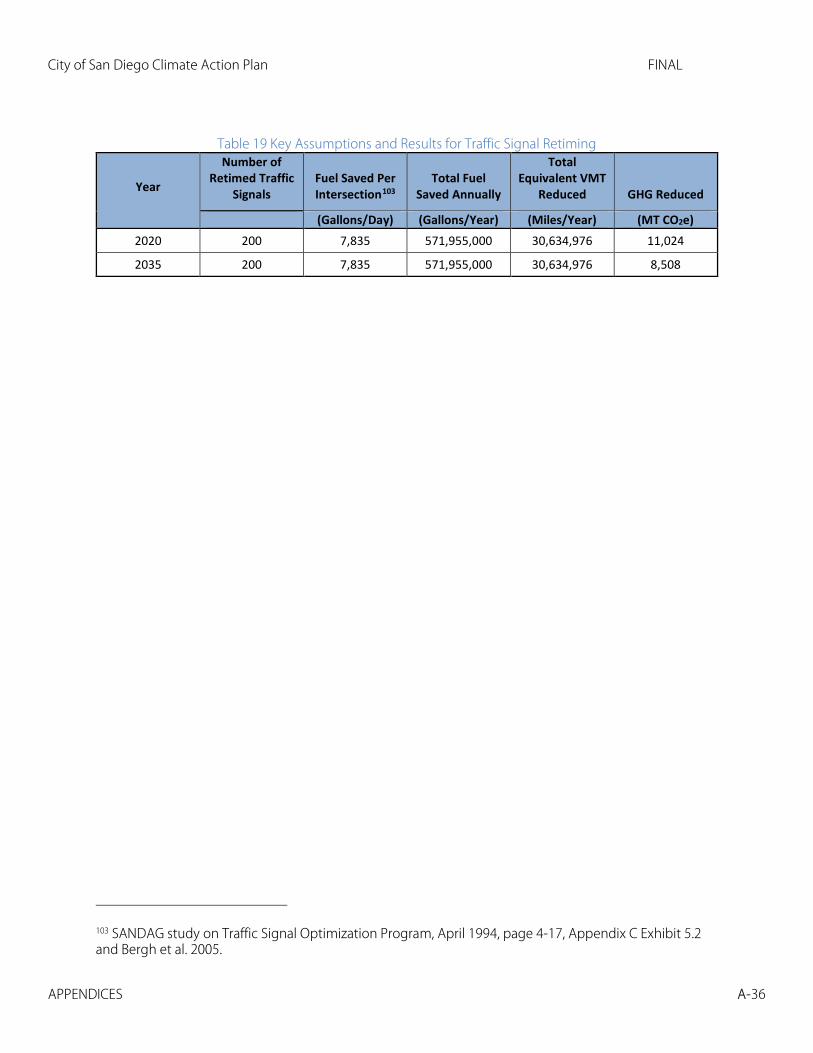
City of San Diego Climate Action Plan FINAL
APPENDICES A-36
Table 19 Key Assumptions and Results for Traffic Signal Retiming
Year
Number of Retimed Traffic
Signals Fuel Saved Per Intersection103
Total Fuel Saved Annually
Total Equivalent VMT
Reduced GHG Reduced
(Gallons/Day) (Gallons/Year) (Miles/Year) (MT CO2e) 2020 200 7,835 571,955,000 30,634,976 11,024
2035 200 7,835 571,955,000 30,634,976 8,508
103 SANDAG study on Traffic Signal Optimization Program, April 1994, page 4-17, Appendix C Exhibit 5.2 and Bergh et al. 2005.

City of San Diego Climate Action Plan FINAL
APPENDICES A-37
Action 3.5 Install Roundabouts
Roundabouts can have a traffic flow smoothing effect leading to reduced fuel use by passenger vehicles.
Discussions with City traffic engineers indicated that it is feasible to identify and install roundabouts in
place of 15 intersections by 2020.104 This value was held constant to 2035. Based on a case study by
Andras Varhelyi105, we assumed that 20,000 gallons of gasoline fuel would be saved per intersection by
improving traffic flow. The amount of fuel reduced per intersection was multiplied by the number of
installed roundabouts and then divided by average miles per gallon for the San Diego County private
fleet to determine reduced VMT. The effective reduced VMT was then multiplied by the weighted
emissions factor to determine GHG reduced. Table 20 summarizes key assumptions and results.
Table 20 Key Assumptions and Results for Installation of Roundabouts
Year
Number of Roundabouts
Installed Fuel Saved Per Intersection106
Total Fuel Saved Annually
Total Equivalent VMT
Reduced GHG Reduced
(Gallons/Day) (Gallons/Year) (Miles/Year) (MT CO2e)
2020 15 20,000 109,500,000 5,865,024 2,110
2035 20 20,000 146,000,000 7,820,032 2,172
104 Communication with City of San Diego, email 24 August 2014. 105 Varhelyi, Andras, 2002. The effects of small roundabouts on emissions and fuel consumption: a case study, Transportation Research Part D,65‐71. See also: City of San Diego Manager’s Report, Feb 4, 2004, Report No. 04-028 for discussions of cost of Traffic Management Plan for the Bird Rock area of La Jolla. 106 Varhelyi, Andras 2002.
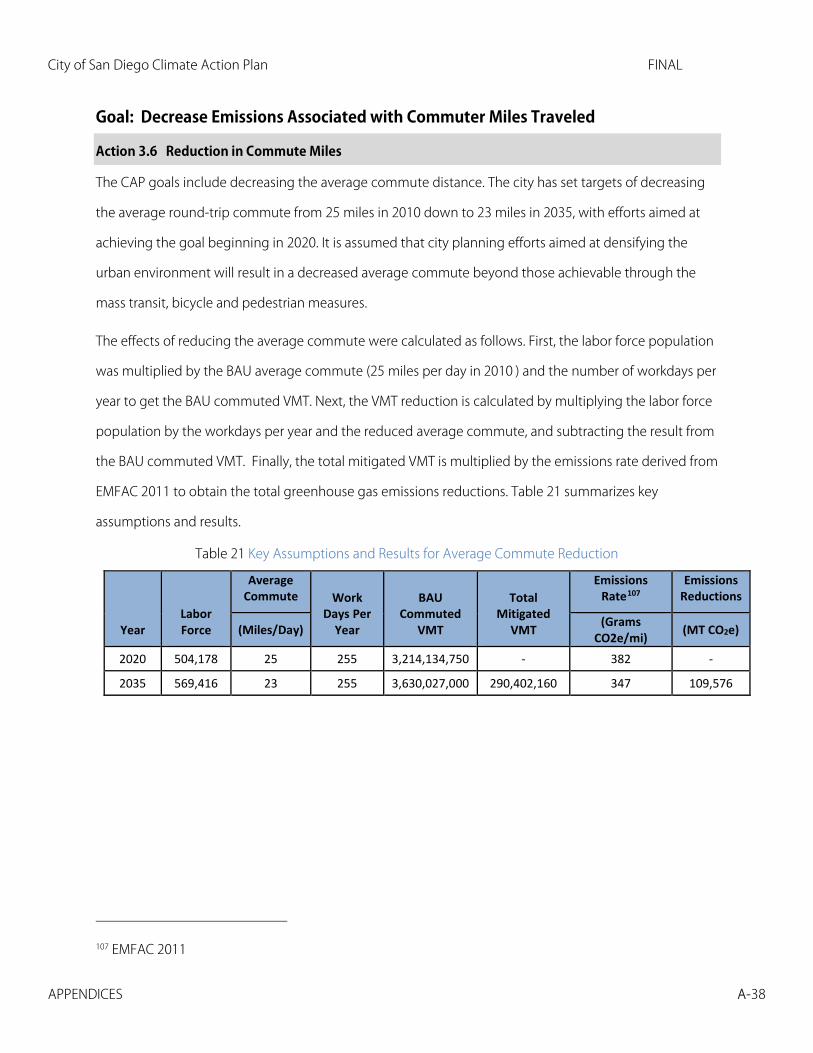
City of San Diego Climate Action Plan FINAL
APPENDICES A-38
Goal: Decrease Emissions Associated with Commuter Miles Traveled
Action 3.6 Reduction in Commute Miles
The CAP goals include decreasing the average commute distance. The city has set targets of decreasing
the average round-trip commute from 25 miles in 2010 down to 23 miles in 2035, with efforts aimed at
achieving the goal beginning in 2020. It is assumed that city planning efforts aimed at densifying the
urban environment will result in a decreased average commute beyond those achievable through the
mass transit, bicycle and pedestrian measures.
The effects of reducing the average commute were calculated as follows. First, the labor force population
was multiplied by the BAU average commute (25 miles per day in 2010 ) and the number of workdays per
year to get the BAU commuted VMT. Next, the VMT reduction is calculated by multiplying the labor force
population by the workdays per year and the reduced average commute, and subtracting the result from
the BAU commuted VMT. Finally, the total mitigated VMT is multiplied by the emissions rate derived from
EMFAC 2011 to obtain the total greenhouse gas emissions reductions. Table 21 summarizes key
assumptions and results.
Table 21 Key Assumptions and Results for Average Commute Reduction
Year Labor Force
Average Commute Work
Days Per Year
BAU Commuted
VMT
Total Mitigated
VMT
Emissions Rate107
Emissions Reductions
(Miles/Day) (Grams CO2e/mi) (MT CO2e)
2020 504,178 25 255 3,214,134,750 - 382 -
2035 569,416 23 255 3,630,027,000 290,402,160 347 109,576
107 EMFAC 2011

City of San Diego Climate Action Plan FINAL
APPENDICES A-39
Strategy 4: Zero Waste Solid waste and wastewater management emissions account for about 5% of all GHG emissions within
the City of San Diego. The CAP includes 2 measures to reduce emissions from waste: diverting solid waste
and capturing landfill emissions, and capturing emissions from the wastewater treatment process.
Goal: Divert Solid Waste and Capture Landfill Emissions
Action 4.1 Divert Solid Waste and Capture Landfill Emissions
The CAP goals are to increase landfill gas capture to 80% by 2020 and 90% by 2035 to be in compliance
with state landfill methane capture regulations.108 The CAP goal for waste diversion is to reach zero waste
disposed (90% diversion) by 2040. Under AB 341, the State of California required jurisdictions to achieve a
50% diversion rate by 2000. AB 341 was amended in 2011 to read that it is state policy to achieve at least
75% diversion by 2020. The San Diego City Council approved the objectives of a Zero Waste Initiative in
2013 with the goal of reaching zero waste disposed in landfills in 2040. To achieve this goal, it was
assumed that 75% diversion would be reached by 2020 and 90% by 2035. We calculated BAU emissions
and emissions reductions from this measure using method SW.4 from the U.S. Community Protocol for
solid waste.109 The method uses disposed waste in a given year, the characterization of waste, and
emissions factors from the U.S. EPA Waste Reduction Model (WARM)110 to estimate emissions from the
disposal of solid waste by the City of San Diego. Because a recent waste characterization study was not
available for the City of San Diego, it was assumed that the City’s characterization is the same as that
reported in a 2008 statewide study for California.111 Solid waste disposal data for the City of San Diego
108 California Air Resources Board (CARB), 2009. Final Regulation Order: Methane Emissions from Municipal Solid Waste Landfills. Available at http://www.arb.ca.gov/regact/2009/landfills09/landfillfinalfro.pdf. 109 ICLEI, 2013. U.S. Community Protocol for Accounting and Reporting of Greenhouse Gas Emissions. Available at http://www.icleiusa.org/tools/ghg-protocol/community-protocol. 110 U.S. EPA. Waste Reduction Model (WARM). Available at http://epa.gov/epawaste/conserve/tools/warm/index.html 111 California Department of Resources Recycling and Recovery (CalRecycle). California 2008 Statewide Waste Characterization Study. Available at http://www.calrecycle.ca.gov/publications/Documents/General/2009023.pdf.
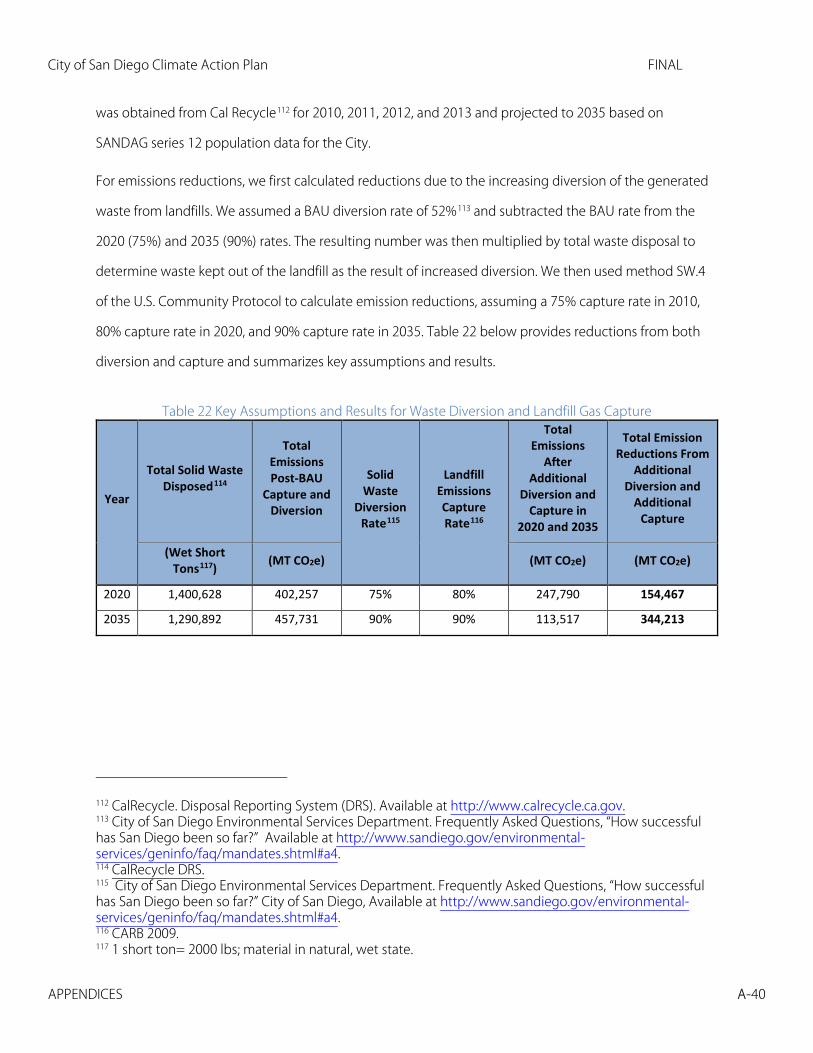
City of San Diego Climate Action Plan FINAL
APPENDICES A-40
was obtained from Cal Recycle112 for 2010, 2011, 2012, and 2013 and projected to 2035 based on
SANDAG series 12 population data for the City.
For emissions reductions, we first calculated reductions due to the increasing diversion of the generated
waste from landfills. We assumed a BAU diversion rate of 52%113 and subtracted the BAU rate from the
2020 (75%) and 2035 (90%) rates. The resulting number was then multiplied by total waste disposal to
determine waste kept out of the landfill as the result of increased diversion. We then used method SW.4
of the U.S. Community Protocol to calculate emission reductions, assuming a 75% capture rate in 2010,
80% capture rate in 2020, and 90% capture rate in 2035. Table 22 below provides reductions from both
diversion and capture and summarizes key assumptions and results.
Table 22 Key Assumptions and Results for Waste Diversion and Landfill Gas Capture
Year
Total Solid Waste Disposed114
Total Emissions Post-BAU
Capture and Diversion
Solid Waste
Diversion Rate115
Landfill Emissions Capture Rate116
Total Emissions
After Additional
Diversion and Capture in
2020 and 2035
Total Emission Reductions From
Additional Diversion and
Additional Capture
(Wet Short Tons117) (MT CO2e) (MT CO2e) (MT CO2e)
2020 1,400,628 402,257 75% 80% 247,790 154,467
2035 1,290,892 457,731 90% 90% 113,517 344,213
112 CalRecycle. Disposal Reporting System (DRS). Available at http://www.calrecycle.ca.gov. 113 City of San Diego Environmental Services Department. Frequently Asked Questions, “How successful has San Diego been so far?” Available at http://www.sandiego.gov/environmental-services/geninfo/faq/mandates.shtml#a4. 114 CalRecycle DRS. 115 City of San Diego Environmental Services Department. Frequently Asked Questions, “How successful has San Diego been so far?” City of San Diego, Available at http://www.sandiego.gov/environmental-services/geninfo/faq/mandates.shtml#a4. 116 CARB 2009. 117 1 short ton= 2000 lbs; material in natural, wet state.

City of San Diego Climate Action Plan FINAL
APPENDICES A-41
Goal: Capture Methane from Wastewater Treatment
Action 4.2 Capture Methane from Wastewater Treatment
The goal of the CAP is to achieve a 98% methane capture rate for wastewater treatment by 2035. The City
of San Diego staff provided baseline and projected GHG emissions from wastewater management, and
the capture rate in 2010 was reported to be 71%.118 As such, the GHG emission reductions arise from a
27% difference in capture rate, compared to the 2010 baseline.
To calculate baseline emissions from wastewater, we used GHG data from Point Loma Wastewater
Treatment Plant, as reported to CARB in 2010.119 Annual emissions were divided by gallons of wastewater
processed at the plant in that year120 to estimate a typical CO2e/gallon of wastewater processed in the
City of San Diego. In order to obtain an estimate for total gallons of wastewater produced by the City of
San Diego, we then multiplied per capita water use by a wastewater fraction derived from the ICLEI
Community Protocol121 and then by the City’s population.122 Finally, we multiplied the total gallons of
wastewater produced by our estimate of typical CO2e/gallon of wastewater processed to calculate total
GHG emissions from wastewater treatment for the City of San Diego.
For years in between 2010 and 2020, capture rates were interpolated linearly. GHG reductions from an
increased capture rate were calculated by taking the difference between the baseline capture rate (71%)
and the increased capture rate for a given year, then multiplying that value by BAU emissions for
wastewater in that year. Table 23 summarizes key assumptions and results.
118 A capture rate of about 71% was calculated by EPIC and confirmed by the City of San Diego. 119 Emissions from Point Loma Wastewater Treatment Plant from Report to CARB in 2010. 120 The City of San Diego Wastewater, 2010. Point Loma Wastewater Treatment Plant Annual Report (2010)- Section 3 Plant Operations. Available at http://www.sandiego.gov/mwwd/pdf/2012/reports/ploperations.pdf. 121 http://www.icleiusa.org/tools/ghg-protocol/community-protocol. 122 SANDAG Series 12.

City of San Diego Climate Action Plan FINAL
APPENDICES A-42
Table 23 Key Assumptions and Results for Wastewater Emissions Capture
Year
BAU Wastewater Capture Rate123
BAU Wastewater Emissions
Target Wastewater Capture Rate
Post-Target Capture Wastewater Emissions
GHG Reduced
(MT CO2e) (MT CO2e) (MT CO2e) 2020 71% 9,125 98% 1,217 16,424 2035 71% 10,408 98% 1,388 18,735
123 A capture rate of about 71% was calculated by EPIC and confirmed by the City.

City of San Diego Climate Action Plan FINAL
APPENDICES A-43
Strategy 5: Climate Resiliency Increasing urban tree cover contributes to the capture and storage (sequestration) of carbon, as growing
plants take up CO2.
Goal: Increase Urban Tree Coverage
Action 5.1 Urban Tree Planting Program
The goal of this action is to achieve 15% urban canopy cover by 2020 and 35% urban canopy cover by
2035, achievable with the City of San Diego’s Urban Forest Management Plan.124 This action targets
Community Planning Areas (CPAs) and assumes an increase of hardwood tree cover as the type of urban
tree
The current urban tree coverage is estimated to be 6.4%,125 which is equivalent to about 12,000 acres of
tree coverage in the City. There is a great diversity of trees per acre in the CPAs. The greatest number of
trees per acre, 3.99, is found in Greater Golden Hill, while the lowest number of trees per acre is found in
Tierrasanta, 0.5. Total developed area in the City of San Diego was estimated to be about 187,500 acres,
based on GIS analysis.
To determine acres of tree cover for 2020 and 2035, the difference in percentage of urban tree canopy
cover compared to BAU for 2020 and 2035 were multiplied by total developed area. GHG removal from
these trees was then calculated using a CO2e absorption rate per acre obtained from a study for the
California Energy Commission (CEC).126 Based on this study, typical hardwood trees absorb about 1.56
tons CO2 per acre. Table 24 summarizes key assumptions and results.
124 The City of San Diego Community Forest Advisory Board, 2013. Urban Forest Management Plan: background and current conditions. Available at http://sdapa.org/go/wp-content/uploads/2013/10/CitySD_UFMPlan_2013-02-12.pdf. 125 The City of San Diego Community Forest Advisory Board 2013. 126 Brown, S., T. Pearson, A. Dushku, J. Kadyzewski, and Y. Qi, 2004. Baseline Greenhouse Gas Emissions and Removals for Forest, Range, and Agricultural Lands in California. Winrock International, for the California Energy Commission, PIER Energy-Related Environmental Research. 500-04-069F. See also: Energy Policy Initiatives Center, 2008. An Analysis of Regional Emissions and Strategies to Achieve AB 32 Targets: Agriculture, Forestry and Land Use Report. Available at http://catcher.sandiego.edu/items/epic/GHG-Agriculture1.pdf .
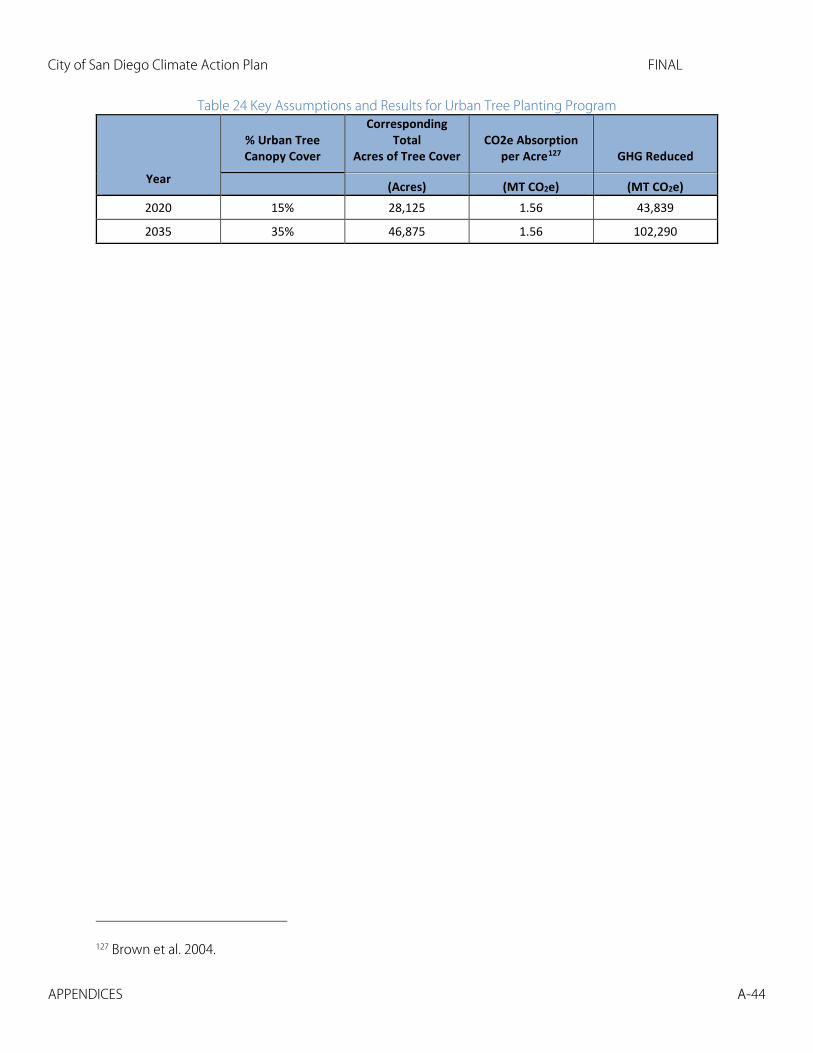
City of San Diego Climate Action Plan FINAL
APPENDICES A-44
Table 24 Key Assumptions and Results for Urban Tree Planting Program
Year
% Urban Tree Canopy Cover
Corresponding Total
Acres of Tree Cover CO2e Absorption
per Acre127 GHG Reduced
(Acres) (MT CO2e) (MT CO2e) 2020 15% 28,125 1.56 43,839
2035 35% 46,875 1.56 102,290
127 Brown et al. 2004.

City of San Diego Climate Action Plan FINAL
APPENDICES A-45
REGIONAL ACTIONS
The following action provides a summary of transportation actions that are implemented at the regional
level by the San Diego Association of Governments (SANDAG).
SANDAG- SB 375 Based on targets established under California’s Senate Bill 375 (SB 375) 128, the region is required to reduce
per capita GHG emissions from personal miles driven (passenger cars and light-duty trucks) by 7% in 2020
and 13% in 2035 compared with the value in 2005.129 SANDAG indicates how these reductions are to be
achieved in the Sustainable Community Strategy of its Regional Transportation Plan 2050. The SB 375
measures include incentives for telecommute and carpools, subsidies for vanpools and buspools, safe
routes to schools to encourage walking to school, bottleneck relief projects such as increase in miles of
freeway lanes to reduce fuel inefficient congestion, increase in miles of high occupancy vehicle lanes and
freeway tolls, increase in the price of parking, bicycle lane increases and pedestrian zone improvements,
smart growth and population density increases, and mass transit use increases.130
SB 375 requires that our region achieve a per capita CO2 reduction of 7% from passenger vehicles and
light duty trucks in 2020 compared with the baseline year 2005 and a 13% per capita GHG reduction in
2035. To calculate the effects of SB 375, we determined the total VMT in the region driven by vehicles
subject to SB 375 using the EMFAC2011 model.131 Next, using emissions rates also derived from
EMFAC2011, we determined the CO2 per capita for the region. Using the 2005 baseline per capita value
(4.98 MT CO2 per capita per year), we determined the per capita reduction that would correspond to the
reduction targets set by SB 375. To better clarify emission reduction sources that the city may have some
jurisdiction over, we identified emissions reductions resulting from mass transit, bicycle mode share, and
128 Senate Bill No. 375. Available at http://www.leginfo.ca.gov/pub/07-08/bill/sen/sb_0351-0400/sb_375_bill_20080930_chaptered.html. 129 San Diego Association of Governments (SANDAG). Regional Transportation Plan (RTP) 2050, Chapter 3: Sustainable Communities Strategy. Available at http://www.sandag.org/index.asp?projectid=349&fuseaction=projects.detail. 130 San Diego Association of Governments Board. Meeting on July 9, 2010, Item 3, SB 375 Implementation. Available at http://www.sandag.org/index.asp?committeeid=31&fuseaction=committees.detail–mSched. 131 EMFAC 2011.
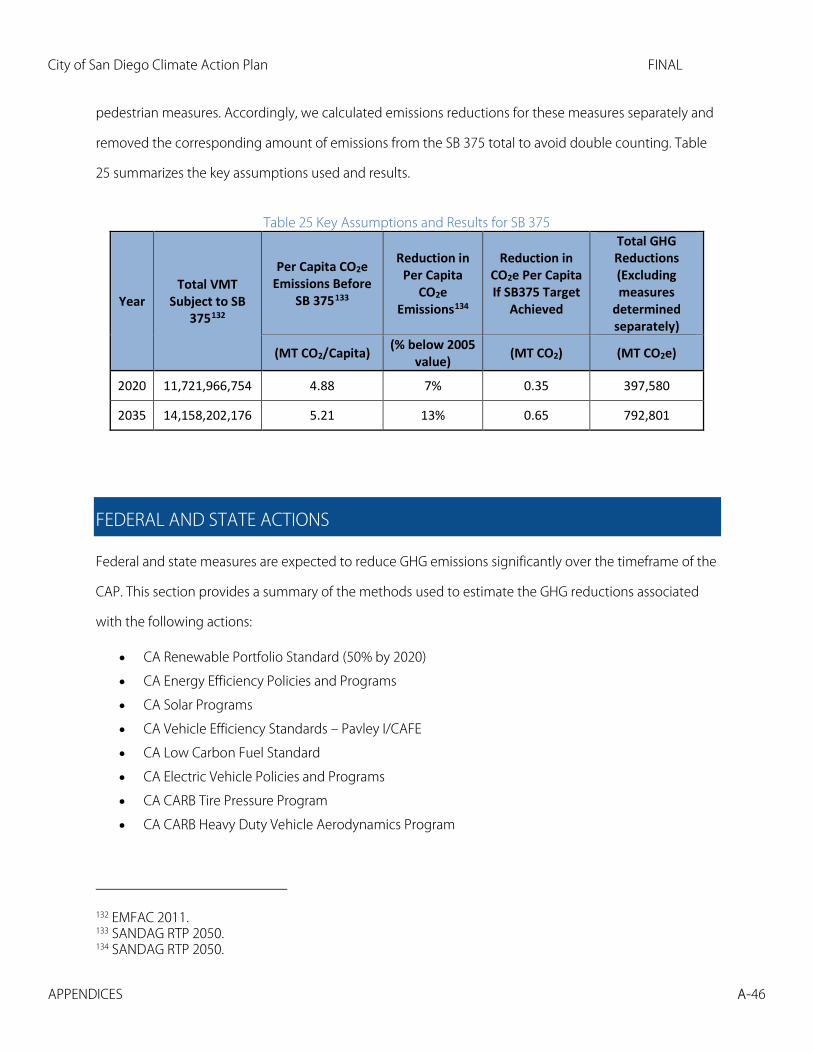
City of San Diego Climate Action Plan FINAL
APPENDICES A-46
pedestrian measures. Accordingly, we calculated emissions reductions for these measures separately and
removed the corresponding amount of emissions from the SB 375 total to avoid double counting. Table
25 summarizes the key assumptions used and results.
Table 25 Key Assumptions and Results for SB 375
Year Total VMT
Subject to SB 375132
Per Capita CO2e Emissions Before
SB 375133
Reduction in Per Capita
CO2e Emissions134
Reduction in CO2e Per Capita If SB375 Target
Achieved
Total GHG Reductions (Excluding measures
determined separately)
(MT CO2/Capita) (% below 2005 value) (MT CO2) (MT CO2e)
2020 11,721,966,754 4.88 7% 0.35 397,580
2035 14,158,202,176 5.21 13% 0.65 792,801
FEDERAL AND STATE ACTIONS
Federal and state measures are expected to reduce GHG emissions significantly over the timeframe of the
CAP. This section provides a summary of the methods used to estimate the GHG reductions associated
with the following actions:
• CA Renewable Portfolio Standard (50% by 2020) • CA Energy Efficiency Policies and Programs • CA Solar Programs • CA Vehicle Efficiency Standards – Pavley I/CAFE • CA Low Carbon Fuel Standard • CA Electric Vehicle Policies and Programs • CA CARB Tire Pressure Program • CA CARB Heavy Duty Vehicle Aerodynamics Program
132 EMFAC 2011. 133 SANDAG RTP 2050. 134 SANDAG RTP 2050.

City of San Diego Climate Action Plan FINAL
APPENDICES A-47
CA Renewable Portfolio Standard (50% by 2020) Signed into law in 2011, the Renewable Portfolio Standard (RPS) requires California’s electric service
providers to procure 33% of electricity sales from renewable sources by 2020.135 In 2015 Governor Brown
signed into law SB 350, which increases renewable electricity targets to 50% by 2030.136 We base our
estimates of these state policies on the 33% renewables RPS requirements being achieved by 2020, the
new proposed state target of 50% renewables being reached by 2030. Further explanation of this is
provided below.
The CAP has a long-term goal of 100% renewable supply by 2035. In order to meet this goal, it is
necessary to consider all categories of supply together to determine, how much of the total supply is
attributed to each category of supply. A particular supply’s level of activity in one category directly affects
the energy supplied by other categories and the weighted emissions factor for electricity. And because
the RPS is based on total sales by all electricity supply providers including the utility and a CCA or another
program, the total emissions reductions from these policies is affected by the level of solar photovoltaics
from the combination of net metered and shared solar systems. As the level of solar supply increases, the
amount of electricity that applies by utility or CCA or another program decreases.
CA Renewable Portfolio Standard - Utility Supplied Electricity
The greenhouse gas emissions reductions form utility (SDG&E) supplied electricity, is calculated based on
its contribution to gross generation and its renewable content. We assume that renewable sources emit
no greenhouse gases. Our greenhouse gas reduction estimates are based on SDG&E and other suppliers
reaching the 33% RPS target by 2020 and the newly adopted 50% renewable target by 2030. Between
2030 and 2035, we hold the renewable content constant at 50%.
To calculate the greenhouse gas emissions reductions from the utility RPS requirement for 2020 and
2035, the total emission reductions from utility, CCA or another program and solar programs were
135 Senate Bill No. 2. Available at http://www.leginfo.ca.gov/pub/11-12/bill/sen/sb_0001-0050/sbx1_2_bill_20110412_chaptered.pdf. 136 136Senate Bills 350 – Clean Energy and Pollution Reduction Act of 2015. Available at https://leginfo.legislature.ca.gov/faces/billNavClient.xhtml?bill_id=201520160SB350..
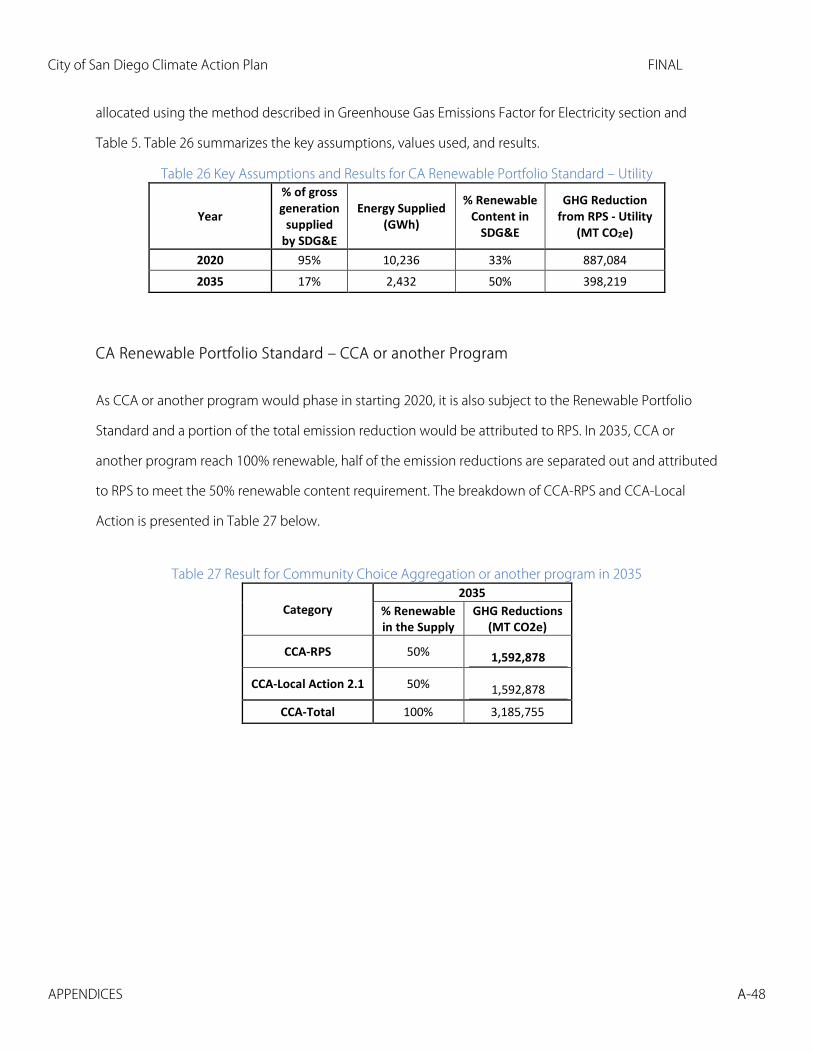
City of San Diego Climate Action Plan FINAL
APPENDICES A-48
allocated using the method described in Greenhouse Gas Emissions Factor for Electricity section and
Table 5. Table 26 summarizes the key assumptions, values used, and results.
Table 26 Key Assumptions and Results for CA Renewable Portfolio Standard – Utility
Year
% of gross generation
supplied by SDG&E
Energy Supplied (GWh)
% Renewable Content in
SDG&E
GHG Reduction from RPS - Utility
(MT CO2e)
2020 95% 10,236 33% 887,084
2035 17% 2,432 50% 398,219
CA Renewable Portfolio Standard – CCA or another Program
As CCA or another program would phase in starting 2020, it is also subject to the Renewable Portfolio
Standard and a portion of the total emission reduction would be attributed to RPS. In 2035, CCA or
another program reach 100% renewable, half of the emission reductions are separated out and attributed
to RPS to meet the 50% renewable content requirement. The breakdown of CCA-RPS and CCA-Local
Action is presented in Table 27 below.
Table 27 Result for Community Choice Aggregation or another program in 2035
Category 2035
% Renewable in the Supply
GHG Reductions (MT CO2e)
CCA-RPS 50% 1,592,878
CCA-Local Action 2.1 50% 1,592,878
CCA-Total 100% 3,185,755

City of San Diego Climate Action Plan FINAL
APPENDICES A-49
California Energy Efficiency Policies and Programs The California Public Utilities Commission (CPUC) developed the Strategic Energy Efficiency Plan with
detailed goals and targets for improvement in energy use among all sectors of the economy in
California.137 California has numerous policies to help realize the long-term strategic goals in the Plan and
to encourage energy efficiency, including standards for new buildings and appliances, programs
administered by investor-owned utilities under the auspices of the CPUC, and specific requirements for
commercial buildings to disclose energy use as required by AB 1103. For purposes of estimating the
greenhouse gas emissions reductions associated with these state energy efficiency policies and
programs, it is necessary to identify which aspects of efficiency are already accounted for in the California
Energy Commission forecast. As provided in Appendix B.2 in more detail, the CEC forecast includes
building standards through 2013 and energy efficiency programs through the 2013-14 cycle.
Below we provide information about the greenhouse gas reduction estimates that could result from
statewide utility efficiency programs and commercial building energy disclosure (AB1103). To avoid
double counting and because it is likely that many of the other energy reductions in the CAP will be
associated with utility efficiency programs, the emission reductions from commercial building energy
disclosure program were calculated but considered part of utility efficiency program. As such we
subtracted the emission reductions from Local Action 1.1 (Residential Energy Conservation and
Disclosure Ordinance) and Local Action 1.2 (Municipal Energy Strategy and Implementation Plan) from
the emission reductions from Utility Efficiency Program to avoid double counting.
Utility Efficiency Programs
Under the auspices of the CPUC, investor-owned utilities like SDG&E administer energy efficiency
programs funded through ratepayer fees. To determine the greenhouse gas emission reductions
associated with these efficiency programs, we estimated the amount of energy that would be reduced by
137 Engage 360, 2011. California Energy Efficiency Strategic Plan. Available at http://www.cpuc.ca.gov/NR/rdonlyres/A54B59C2-D571-440D-9477-3363726F573A/0/CAEnergyEfficiencyStrategicPlan_Jan2011.pdf.
City of San Diego Climate Action Plan FINAL
APPENDICES A-50
such programs. On October 16, 2014 the CPUC adopted Decision 14-10-046 in Rulemaking 13-11-005138,
which among other things, established electric and natural gas reduction targets for the investor-owned
utilities in California for 2015. The goals included in this decision were based on an energy saving goals
study conducted by Navigant.139 The study broke overall energy efficiency goals into two categories: (1)
programs and (2) codes and standards (other than appliance and building standards). It estimated annual
energy reduction potential for both electricity and natural gas for the years 2015-2024. Electric and
natural gas values were provided for each category. The final 2015 energy reduction target for SDG&E
included in CPUC Decision 14-10-046 was slightly lower than the values in the Navigant study. To account
for this difference, we adjusted the study values for 2015-2024 by the ratio of those in the Decision with
those in the Navigant study. We then projected the energy reduction targets to 2035 using the best-fit
curve. To allocate the appropriate amount to the City of San Diego we used scaling factors for electricity
and natural gas. For electricity, the scaling factor (0.44) was derived by comparing the electricity
consumption in the City of San Diego140 to the total net energy for load for the SDG&E service..141 For
natural gas, the scaling factor (0.46) was derived by comparing the natural gas consumption in the City of
San Diego142 to the total natural gas consumption in the San Diego region.143
Next it is necessary to convert the expected level of energy savings to the equivalent greenhouse gas
emissions. To do this we multiplied the cumulative electric savings by the weighted greenhouse gas
emissions rate of electricity for that year. For natural gas we multiplied the cumulate natural gas savings
by the emissions factor for natural gas. Note that the quantity of electricity savings declines in the last 10
years of the time horizon because the emissions factor for electricity declines as more renewable energy
is provided. As noted above, to avoid double counting, we subtracted the emissions reductions
138 Decision Establishing Energy Efficiency Savings Goals and Approving 2015 Energy Efficiency Programs and Budgets, 2014. Available at http://docs.cpuc.ca.gov/PublishedDocs/Published/G000/M129/K228/129228024.pdf. 139Navigant Consulting, 2013. California Energy Efficiency and Potential Goals Study. Prepared for the California Public Utilities Commission. Available at http://www.cpuc.ca.gov/nr/rdonlyres/29adacc9-0f6d-43b3-b7aa-c25d0e1f8a3c/0/2013californiaenergyefficiencypotentialandgoalsstudynovember262013.pdf. 140 SDG&E, Electricity and natural gas consumption in City of San Diego, 2010-2012 141 Kavalec et al. 2013 142 SDG&E, Electricity and natural gas consumption in City of San Diego, 2010-2012 143 SDG&E, Natural gas consumption in San Diego region. 2010.

City of San Diego Climate Action Plan FINAL
APPENDICES A-51
associated with other local efficiency measures in the CAP (Action 1.1 and 1.2) from the total reductions
from Statewide Energy Efficiency Policies and Programs. Table 28 summarizes assumptions used and
results for this measure.
Table 28 Key Assumptions and Results for Utility Energy Efficiency Programs
Year
Cumulative Electric Savings (GWh)
Cumulative Natural Gas
Savings (Million Therms)
Electric GHG Emissions Rate
(lbs CO2e/MWh)
Electric Emissions
Reductions (MT CO2e/Year)
Natural Gas Emissions
Reductions (MT CO2e/Year)
GHG Reduced from Utility Energy Efficiency Program
(MT CO2e/Year)
GHG Reduced from Utility Energy Efficiency Program
exclude local action 1.1
(MT CO2e/Year)
2020 638 9 518 168,747 48,194 216,941 202,142
2035 2270 36 72 73,616 198,192 271,808 257,192
AB 1103: Commercial Building Energy Disclosure
In October 2007 California Governor Schwarzenegger signed into law Assembly Bill No. 1103 (AB 1103).144
AB 1103 requires commercial building owners to disclose energy use to allow prospective tenants,
purchasers, and lenders to compare energy use in affected commercial buildings. To calculate reductions
from this action, we first estimated the total amount of square footage that would be affected by this
policy. Based on property sales data for the City of San Diego145, we assumed that 4.3% of commercial
building space is sold each year. To eliminate the possibility of double counting, once building space is
affected by the policy it is removed from the building population. As such, about 23% of total commercial
square footage would be affected by AB 1103 disclosure requirement and about 52% would be affected
by 2035. These percentages were multiplied by total area of real estate for the given year to determine
the total area disclosing energy use. The greenhouse gas reduction for this policy is based on 12% of the
building area that discloses energy use implementing efficiency activities as a result of disclosure and,
144 Assembly Bill No. 1103. Available at http://leginfo.legislature.ca.gov/faces/billNavClient.xhtml?bill_id=200720080AB1103. 145 Personal communication with Collier International, email on 6 February 2014.

City of San Diego Climate Action Plan FINAL
APPENDICES A-52
therefore, multiplied total area disclosing energy use by 12% to determine total area implementing
efficiency activities.146
To estimate the energy reductions from this policy, we used findings from a Lawrence Berkeley National
Laboratory (LBNL) study147 that found a median total energy reduction of about of 15 kBTU/ft2, or 18% of
the average commercial energy consumption of about 82 kBTU/ft2 in 2010. Based on this value, we
assumed a slightly more conservative 15% reduction in commercial building energy consumption per
square foot for 2020 and 2035. We calculated average electric and natural gas consumption per square
foot by dividing total consumption by total square footage.148 We then multiplied the resulting values by
the 15% energy reduction to determine electricity and natural gas consumption reduced per square foot.
These values were multiplied by total area assumed to be implementing efficiency activities and
respective emissions factors, then summed for each year to determine GHG reductions from the action in
2020 and 2035. Because this measure is dependent on commercial square footage per year, the
greenhouse gas emissions reductions are based on a 2015 start date.
Because the electric emissions factor declines over time, as the electricity supply comprises more and
more renewable sources, the greenhouse gas emissions reductions from efficiency decline accordingly.
Energy reductions associated with natural gas are not affected by this trend. Table 29 below summarizes
key assumptions and results.
146 Climate Leadership Academy Network, 2010. Case Study: Austin, Texas, Using Energy Disclosure to Promote Retrofitting. Available at https://stuff.mit.edu/afs/athena/dept/cron/project/urban-sustainability/Energy%20Efficiency_Brendan%20McEwen/Cities/Austin/austin_energy_disclosure.pdf. 147 Goldman, C., N. Hopper, J. Osborn, and T. Singer, 2005. Review of U.S. ESCO Industry Market Trends: An Empirical Analysis of Project Data. LBNL-‐52320. Available at http://eetd.lbl.gov/ea/emp/reports/52320.pdf. 148 Personal communication with Collier International, email on 6 February 2014 and Kavalec et al. 2013.

City of San Diego Climate Action Plan FINAL
APPENDICES A-53
Table 29 Key Assumptions and Results for AB 1103 Commercial Energy Disclosure Requirement
Year
Total Area of Commercial Real
Estate149 Percentage of
Total Area Sold
Annually150
Total Percentage
of Area Disclosing
Energy Use
Total Area Disclosing Energy
Use % of Area That Implemented
Efficiency Activities151
Total Area Implementing
Efficiency Activities
(Million Sq Ft) (Million Sq Ft) (Million Sq Ft)
2020 328 4.3% 23% 76 12% 9
2035 398 4.3% 52% 205 12% 25
Year
Energy Reduction
Average Commercial Electricity
Consumption Electricity Reduction
Average Commercial Natural Gas
Consumption Natural Gas Reduction
GHG Reductions from AB 1103
(per Sq Ft) (kWh/Sq Ft/Year)
(kWh/Sq Ft/Year)
(Therms/Sq Ft /Year)
(Therms/Sq Ft/Year) (MT CO2e)
2020 15% 14.7 2 0.3 0.04 6,850
2035 15% 14.4 2 0.3 0.05 8,342
California Solar Policies and Programs California has a suite of policies and programs for solar photovoltaics. We consider two types of solar
photovoltaic systems here: those that are located on the customer premises, interconnected to the
electric utility, and that participate in net energy metering (net energy metered solar); and community, or
shared solar where customers purchase electricity from a designated solar project not located on their
premises. The sections below describe the method used to estimate the greenhouse gas emissions
reductions for each.
Net Energy Metered Systems
Programs and policies that encourage customer-sited distributed solar photovoltaics, include the
California Solar Initiative (and previously the Emerging Renewables Program), New Solar Homes
149 Personal communication with Collier International, email on 6 February 2014, and Kavalec et al. 2013. 150 Personal communication with Collier International, email on 6 February 2014. 151 Climate Leadership Academy Network, 2010. Case Study: Austin, Texas, Using Energy Disclosure to Promote Retrofitting. Available at https://stuff.mit.edu/afs/athena/dept/cron/project/urban-sustainability/Energy%20Efficiency_Brendan%20McEwen/Cities/Austin/austin_energy_disclosure.pdf.

City of San Diego Climate Action Plan FINAL
APPENDICES A-54
Partnership, and Net Metering. California’s current residential rate structure, which is an inclining block
structure that charges a higher marginal rate as consumption increases, also encourages customers to
install solar photovoltaics at their premises. In addition to state measures, a federal tax credit and
accelerated depreciation also provide financial incentive for this technology. To estimate the capacity
(MW) of net energy metered solar systems that would be installed in 2020 and 2035, and thus the
resulting greenhouse gas emissions reductions, we projected actual installation data provided by SDG&E
to the CPUC and data included in the CEC Staff Energy Forecast. The values used in the CAP are 311 MW
in 2020 and 973 MW for 2035.
Shared Solar Program
In addition to the programs mentioned above, California law also provides for shared solar. The Green
Tariff Shared Renewables program (SB 43) allows up to 59 MW of solar to be installed in SDG&E territory
under a pilot that lasts until Jan 1, 2019.152 Utilities are required to retire renewable energy credits under
the program and cannot count the energy toward the RPS. For purposes of estimating GHG emissions
reductions from this program, we assume that all electricity produced through the Shared Solar Program
is additional to the RPS. Therefore, there is no double counting and any reductions under the program
would be additive with those resulting from the RPS or other supply policy. Assuming all of the allowed
capacity is installed by 2019 and that 44% of the capacity is located in the City of San Diego153, it would
result in about 25 MW of capacity not presently counted toward the RPS or the net energy metered
projects described above.
Total greenhouse gas emissions reductions due to state solar programs were calculated as follows. Total
projected installed capacity (net energy metered plus shared solar)154 for a given year was multiplied by a
152 State of California Public Utilities Commission, 2014. Decision Approving Green Tariff Shared Renewables Program for San Diego Gas and Electric Company, Pacific Gas and Electric Company, and Southern California Edison Company Pursuant to Senate Bill 43. Available at http://docs.cpuc.ca.gov/PublishedDocs/Efile/G000/M143/K989/143989599.PDF. 153 44% is the percentage of total electricity use in SDG&E’s service territory that is consumed in the City of San Diego. 154 Personal Communication with California Energy Commission, email 22 October 2013 and San Diego Gas & Electric Advice Letter filings in Compliance with Decision 14-03-041 to report Progress Towards the Net Energy Metering Transition Trigger Level.

City of San Diego Climate Action Plan FINAL
APPENDICES A-55
capacity factor of 20%155 and the total number of hours in a year (8,760) to determine the total amount of
electricity produced by the installed capacity. To estimate emissions reductions for solar programs, a
portion of the total emission reductions from utility, CCA or another program and solar programs were
allocated to solar programs, using the method described in Greenhouse Gas Emissions Factor for
Electricity section and Table 5. Table 30 summarizes key assumptions used and results.
Table 30 Key Assumptions and Results for CA Solar Policies and Programs
Year Total Installed Capacity (Net Metered+Shared)
(MW)
Energy Supplied
(GWh)
% of gross generation supplied by
SDG&E
% Renewable Content in
SDG&E
GHG Reduction from Solar Program
(MT CO2e)
2020 337 590 5% 100% 154,975
2035 998 1748 13% 100% 572,333
California Vehicle Efficiency Standards – Pavley I/CAFE California’s AB 1493 (2002, Pavley I) required manufacturers to achieve tailpipe emissions standards for
greenhouse gases. In May 2009, the federal Corporate Average Fuel Economy (CAFE) Standards were
adjusted to conform to California’s Pavley I. California then amended AB 1493 (Pavley I) to conform to the
federal CAFE standard from 2012 to 2016, on condition that it receives a waiver to set its own vehicle
standards after 2016 and enforce its standards for model years 2009 to 2011. CAFE mandates the sales-
weighted average fuel economy in miles per gallon (mpg) for passenger cars and light-duty trucks in a
manufacturer’s fleet. New passenger vehicles must meet a sales weighted average of 39 mpg and light
duty trucks must meet a value of 30 mpg, resulting in a fleet average 34.5 mpg. If achieved solely by fuel
economy, this corresponds to tailpipe CO2e emissions of 250 grams per mile (g/mi) in 2016 from those
vehicles.
To estimate the greenhouse gas reductions from Pavley I/CAFE, we used EMFAC2011 to provide (1) total
regional VMT, (2) total regional vehicle population, and (3) two different emissions rates. The two
emissions rates output by EMFAC2011 are (1) a fleet-wide CO2 per mile driven, and (2) a fleet-wide CO2
per vehicle per day. Consideration of both emission rates is required to obtain the most accurate
155 Personal Communication with California Energy Commission, email 22 October 2013. The capacity factor is the percentage of hours in the year that solar is producing electricity.

City of San Diego Climate Action Plan FINAL
APPENDICES A-56
greenhouse gas emissions from the transportation sector. CO2 is converted to CO2e by multiplying with a
factor of 1.05 to account for other typical GHGs from vehicle tailpipe emissions (CH4 and N2O).
Additionally, EMFAC2011 can output emissions rates either including or excluding the effects of Pavley I
and Low Carbon Fuel Standard (LCFS). EMFAC 2011 also provides multipliers to separate out the effects
of Pavley and LCFS, which helped to develop the weighted emission factor and allocated emissions to
each of the VMT measures considered.
As indicated in the Emissions Factor for Transportation section above, it is necessary to consider all the
measures that affect VMT. This also applies to estimating GHG emissions from the Pavley I/CAFE measure.
To estimate the GHG emissions reductions from Pavley I and CAFE, we used the total VMT in City of San
Diego and weighted average emissions factor for VMT. The result yielded the total emissions related to
VMT measures. This value was allocated to Pavley I/CAFE, Low Carbon Fuel Standard, and electric vehicles
using the same weighting factor used to develop the weighted emissions factor for VMT, namely the
combination of miles affected and the percentage reduction in carbon intensity of a mile driven. Table 31
summarizes key assumptions used and results.
Table 31 Key Assumptions and Results for California Vehicle Efficiency Standards- Pavley I/CAFE
Year
BAU Fleet CO2e
Emissions Per VMT156
BAU Fleet CO2e
Emissions Per Vehicle157
Percent Reduction in CO2e/
mile from Pavley/
CAFE
Percent Reduction in CO2e/ vehicle/ day from Pavley/
CAFE Total VMT in City of San Diego158
Total Number of Vehicles in City of San
Diego159
Percent of VMT
Driven by Gasoline/
Diesel Vehicles
Percent of Gasoline/
Diesel Vehicles in
Vehicle Population
Total GHG Reductions
(Grams/ Mile)
(Grams/Veh/Day) (MT CO2e)
2020 508 643 19% 18% 15,114,486,656 1,068,787 97% 98% 1,407,061
2035 511 657 31% 31% 18,255,806,585 1,288,272 86% 88% 2,498,388
California Low Carbon Fuel Standard California’s Low Carbon Fuel Standard (LCFS) requires that a regulated party (e.g., supplier of
transportation fuel, including importers) reduce the carbon intensity of its transportation fuel (gasoline
156 EMFAC 2011. 157 EMFAC 2011. 158 EMFAC 2011. 159 EMFAC 2011.

City of San Diego Climate Action Plan FINAL
APPENDICES A-57
and diesel) by 10% by 2020.160 To estimate the greenhouse gas emissions reductions associated with this
state measure, we assume that the LCFS leads to a 10% reduction in carbon intensity by 2020, and that
value was held constant between 2020 and 2035. Electricity suppliers are considered regulated parties
only if they elect to provide credit to fuel distributors. At this time, there are no monitoring reports on the
status of use of electricity credits for the LCFS to indicate the magnitude of carbon intensity reduction
that electric vehicles will play in 2020. Therefore, for our purposes here, miles driven by electric vehicles
are not considered a part of this standard. A separate measure estimates the effects of electric vehicles.
The CAP also assumes no new low carbon fuel mandates in 2020.
Table 32 Key Assumptions and Results for Low‐Carbon Fuel Standard (LCFS)
Year
BAU Fleet CO2e
Emissions Per
VMT161
BAU Fleet CO2e
Emissions Per
Vehicle162
Percent Reduction
in CO2e/mile from LCFS
Percent Reduction in CO2e/ vehicle/ day from
LCFS
Total VMT in City of San
Diego163
Total Number of Vehicles in City of San
Diego164
Percent of VMT Driven
by Gasoline/Diesel
Vehicles
Percentage of
Gasoline/ Diesel
Vehicles in Vehicle
Population
Total GHG Reductions
(Grams/Mile)
(Grams/Veh/Day) (MT CO2e)
2020 508 643 8% 8% 15,114,486,656 1,068,787 97% 98% 628,425
2035 511 657 7% 7% 18,255,806,585 1,288,272 86% 88% 569,268
The method to calculate the effects of the LCFS are similar to that of the Pavley I/CAFE measure described
above. First, EMFAC2011 was used to derive emissions rates that include the effects of Pavley I/CAFE and
LCFS. EMFAC’s technical documentation provides the multipliers used to determine the effects of LCFS in
a given year. Using these multipliers and the reduced emissions rates, we determined what reductions
are due to LCFS in terms of CO2/VMT and CO2/vehicle/day. This was used to help develop the weighted
emissions factor for VMT. With the weighted factor, it is possible to estimate the total emissions from
miles driven. This total was allocated to the three measures affecting the emissions factor, Low-Carbon
Fuel Standard, Pavley I/CAFE, and electric vehicles.
160 California Air Resources Board, 2015. Low Carbon Fuel Standard Program. Available at http://www.arb.ca.gov/fuels/lcfs/lcfs.htm. 161 EMFAC 2011. 162 EMFAC 2011. 163 EMFAC 2011. 164 EMFAC 2011.

City of San Diego Climate Action Plan FINAL
APPENDICES A-58
California Electric Vehicle Policies and Programs On March 23, 2012, California Governor Jerry Brown adopted Executive Order B162012 which, among
other things, sets a statewide target of 1.5 million zero emissions vehicles by 2025.165 In addition,
California has adopted a number of policies to encourage adoption of electric vehicles, including the
Clean Vehicle Rebate Project, which provides cash incentives to offset a portion of the cost of a qualified
vehicle.166
To estimate the number of electric vehicles that could be expected during the time horizon of the CAP,
we converted the estimated energy requirements of electric vehicles included in the California Energy
Commission Energy Forecast to the expected number of vehicles.167 Since the forecast only extends to
2024, we projected electric energy use for electric vehicles from 2025 to 2035 using a best-fit curve. This
value was scaled to the City of San Diego using a scaling factor of 0.44, which represents the ratio of
electric consumption in the City of San Diego168 to the total SDG&E service territory169 and also the
approximate ratio of vehicles in the City of San Diego and the region as a whole.170 This energy value was
converted to miles using a factor of 0.3 kWh per mile.171 In turn, total miles were converted to the number
of vehicles using a factor of 15,000 miles per year.172
To validate our results, we scaled the targets in the Governor’s Executive Order to compare our results to
those from the method described above. The Executive Order sets a target of 1 million emissions-free
vehicles by 2020 and 1.5 million by 2025. Also, the Governor seeks to have “virtually all personal
transportation in the State…based on zero-emission vehicles.” To be conservative, we assumed that 80%
165 Office of Edmund G. Brown Jr., 2012. Governor Brown Offers $120 Million Settlement to Fund Electric Car Charging Stations Across California. Available at http://gov.ca.gov/news.php?id=17463. 166 Center for Sustainable Energy. Clean Vehicle Rebate Project. Available at https://energycenter.org/clean-vehicle-rebate-project. 167 Kavalec et al. 2013. 168 SDG&E, Consumption by Customer Class for City of San Diego, 2010-2012. 169 Kavalec et al. 2013 170 EMFAC 2011. 171 United States Department of Energy. Available at http://www.fueleconomy.gov/feg/PowerSearch.do?action=noform&path=1&year1=1984&year2=2016&vtype=Electric. 172 United States Department of Energy. Gasoline Vehicles: Learn more about the New Label. Available at http://www.fueleconomy.gov/feg/label/learn-more-gasoline-label.shtml#details-in-fine-print.

City of San Diego Climate Action Plan FINAL
APPENDICES A-59
of all vehicles would be zero emissions in 2050. To scale statewide values we used the ratio of the vehicle
population in the City of San Diego and that of the state as a whole.173 The results of scaling the
Governor’s vehicle targets to City of San Diego matched closely the value derived by starting with the
projected energy requirements for electric vehicles in the CEC forecast through most of the time horizon
of the CAP but began to diverge closer to 2035 with the estimate of vehicles using the Governor’s targets
slightly higher than the estimate using projected energy use. To be conservative, we chose to use the
slightly lower value derived from the energy projection.
To estimate the greenhouse gas reductions from electric vehicles, we used the same method described
for Pavley I/CAFE and the Low-Carbon Fuel Standard. This yielded total emissions associated with VMT.
We then allocated these emissions using the same weighting factors used to determine the weighted
emissions factor. Table 33 summarizes key assumptions used and results.
Table 33 Key Assumptions and Results for California Electric Vehicles Policies and Programs
Year
BAU Fleet CO2e
Emissions Per
VMT174
BAU Fleet CO2e
Emissions Per
Vehicle175
Percent Reduction
in CO2e/mile
from Electric Vehicles
Percent Reduction in CO2e/
vehicle/day from
Electric Vehicles
Projected VMT from
Electric Vehicles176
Projected Population of Electric Vehicles177
Percent of VMT Driven
by Electric Vehicles
Percentage of Electric Vehicles in
Vehicle Population
Total GHG Reductions
(Grams/Mile)
(Grams/Veh/Day) (MT CO2e)
2020 508 643 100% 100% 388,014,324 25,868 3% 2% 196,542
2035 511 657 100% 100% 2,373,376,573 158,225 14% 12% 1,185,078
CARB Tire Pressure Regulation The California Air Resources Board (CARB) Tire Pressure Regulation178 that went into effect in September
2010 leads to improved fuel efficiency and thus reduces GHG emissions. In its Status of the Updated
Scoping Plan 2010179, CARB estimated that this requirement, which applies to all vehicles less than 10,000
173 EMFAC 2011. 174 EMFAC 2011. 175 EMFAC 2011. 176 EPIC estimate based on Kovalik et al, 2014 177 EPIC estimate based on Kovalik et al 2014. 178 Regulation To Reduce Greenhouse Gases from Vehicles Operating with Under Inflated Tires: Section 95550, sc10, c10, div 3, title 17, California Code of Regulations, Subarticle 8. 179 California Air Resources Board, 2008. Status of Scoping Plan Measures, pg. 4, Available at http://www.arb.ca.gov/cc/scopingplan/status_of_scoping_plan_measures.pdf.
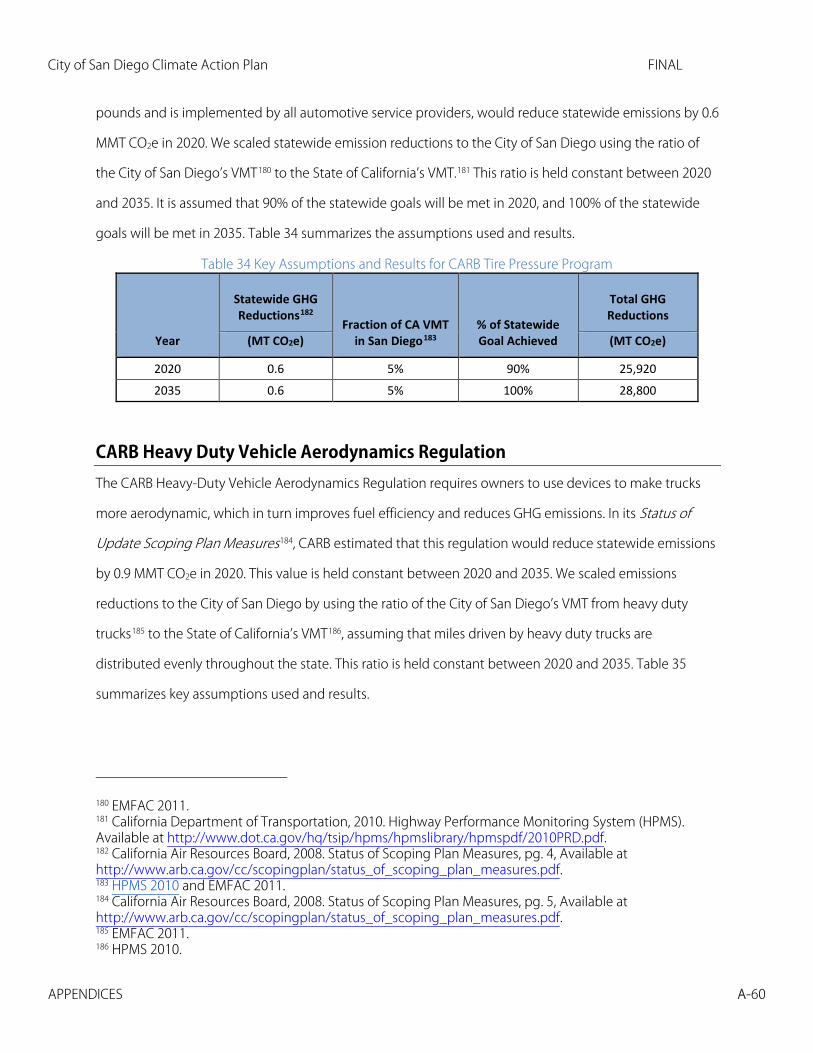
City of San Diego Climate Action Plan FINAL
APPENDICES A-60
pounds and is implemented by all automotive service providers, would reduce statewide emissions by 0.6
MMT CO2e in 2020. We scaled statewide emission reductions to the City of San Diego using the ratio of
the City of San Diego’s VMT180 to the State of California’s VMT.181 This ratio is held constant between 2020
and 2035. It is assumed that 90% of the statewide goals will be met in 2020, and 100% of the statewide
goals will be met in 2035. Table 34 summarizes the assumptions used and results.
Table 34 Key Assumptions and Results for CARB Tire Pressure Program
Year
Statewide GHG Reductions182
Fraction of CA VMT in San Diego183
% of Statewide Goal Achieved
Total GHG Reductions
(MT CO2e) (MT CO2e)
2020 0.6 5% 90% 25,920
2035 0.6 5% 100% 28,800
CARB Heavy Duty Vehicle Aerodynamics Regulation The CARB Heavy-Duty Vehicle Aerodynamics Regulation requires owners to use devices to make trucks
more aerodynamic, which in turn improves fuel efficiency and reduces GHG emissions. In its Status of
Update Scoping Plan Measures184, CARB estimated that this regulation would reduce statewide emissions
by 0.9 MMT CO2e in 2020. This value is held constant between 2020 and 2035. We scaled emissions
reductions to the City of San Diego by using the ratio of the City of San Diego’s VMT from heavy duty
trucks185 to the State of California’s VMT186, assuming that miles driven by heavy duty trucks are
distributed evenly throughout the state. This ratio is held constant between 2020 and 2035. Table 35
summarizes key assumptions used and results.
180 EMFAC 2011. 181 California Department of Transportation, 2010. Highway Performance Monitoring System (HPMS). Available at http://www.dot.ca.gov/hq/tsip/hpms/hpmslibrary/hpmspdf/2010PRD.pdf. 182 California Air Resources Board, 2008. Status of Scoping Plan Measures, pg. 4, Available at http://www.arb.ca.gov/cc/scopingplan/status_of_scoping_plan_measures.pdf. 183 HPMS 2010 and EMFAC 2011. 184 California Air Resources Board, 2008. Status of Scoping Plan Measures, pg. 5, Available at http://www.arb.ca.gov/cc/scopingplan/status_of_scoping_plan_measures.pdf. 185 EMFAC 2011. 186 HPMS 2010.
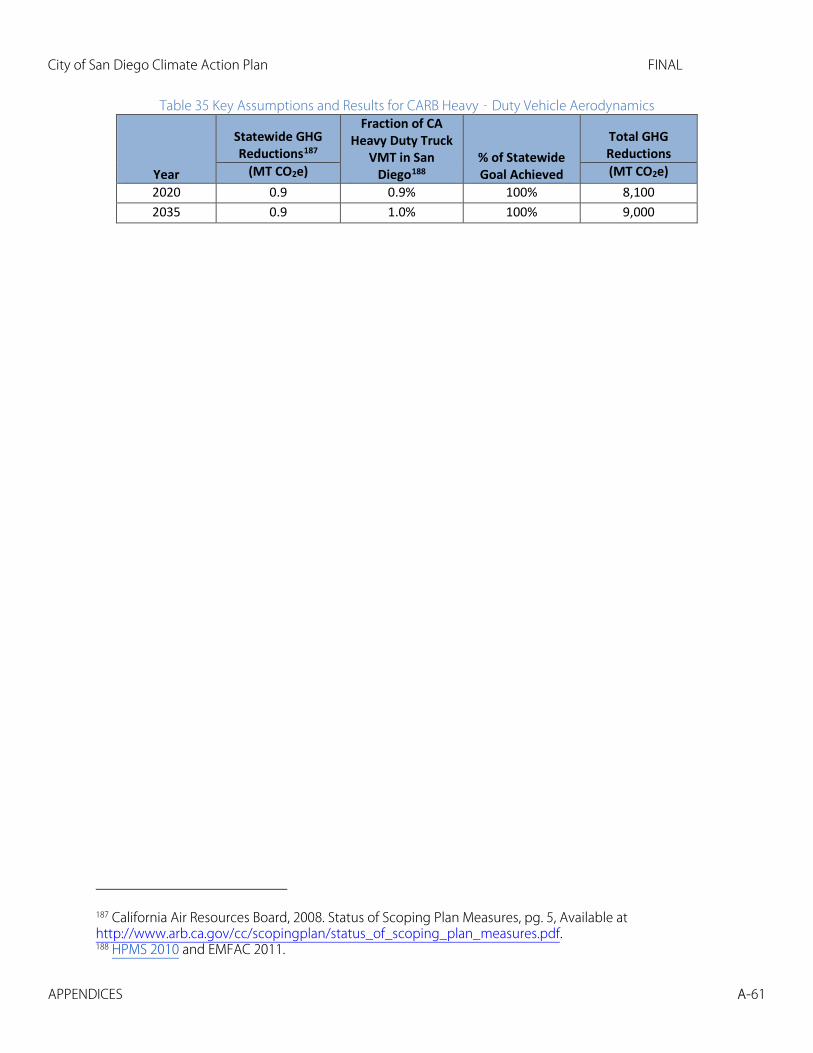
City of San Diego Climate Action Plan FINAL
APPENDICES A-61
Table 35 Key Assumptions and Results for CARB Heavy‐Duty Vehicle Aerodynamics
Year
Statewide GHG Reductions187
Fraction of CA Heavy Duty Truck
VMT in San Diego188
% of Statewide Goal Achieved
Total GHG Reductions
(MT CO2e) (MT CO2e) 2020 0.9 0.9% 100% 8,100 2035 0.9 1.0% 100% 9,000
187 California Air Resources Board, 2008. Status of Scoping Plan Measures, pg. 5, Available at http://www.arb.ca.gov/cc/scopingplan/status_of_scoping_plan_measures.pdf. 188 HPMS 2010 and EMFAC 2011.

City of San Diego Climate Action Plan FINAL
APPENDICES A-62
APPENDIX A.2
BASELINE AND EMISSIONS PROJECTION METHODS EPIC estimated greenhouse gas emissions for the 2010 baseline value and a business‐as-usual
projection for the City of San Diego to estimate the level of emissions in 2020 and 2035 if no action were
taken. The projection assumes that no new policies affecting GHG emissions are adopted after 2010 and
that there is no further activity on existing policies. This estimate becomes the level of emissions from
which emissions from all CAP implementation measures are subtracted to determine if CAP targets are
reached. There are a number of assumptions that are used to estimate future projections. The methods
used to estimate GHG emissions for 2010 are consistent with the U.S. Community Protocol for
Accounting and Reporting of Greenhouse Gas Emissions. The following sections provide information on
the methodology used to project emissions and the assumptions included in those calculations.
On Road Transportation EMFAC 2011189 was used to obtain regional VMT and GHG emissions for 2010, 2020 and 2035. This data
was scaled to City VMT and GHGs, using a City to statewide population ratio. EMFAC 2011 was also used
to calculate a regional CO2e/VMT, which was assumed to represent CO2e/VMT for the City. The BAU
projection for on-road transportation does not include emissions reductions due to the Pavley I/CAFE fuel
economy standards or the Low Carbon Fuel Standard, or the miles driven by electric vehicles.
Electricity To estimate the GHG emissions from electricity use in 2010, we multiplied net energy for load data for the
City of San Diego provided by San Diego Gas and Electric (SDG&E)190 by the SDG&E electricity emissions
189 EMFAC 2011. 190 SDG&E, Electric consumption in San Diego region, 2010.
City of San Diego Climate Action Plan FINAL
APPENDICES A-63
factor in 2010, 736 lbs CO2e/MWh, described in Appendix B.1. For years after 2010, the 2010 SDG&E
emissions factor was kept fixed.
To project emissions from electricity use, we used California Energy Commission (CEC) forecasts191 for the
San Diego Gas and Electric (SDG&E) service territory through 2024 (and projected to 2035 using the best
fit curve) to develop an average ratio between City of San Diego total consumption and SDG&E
consumption for years 2009-2012. This ratio (44%) was multiplied by the CEC forecast through 2024 and
extended to 2035 to get an estimate of the City of San Diego consumption levels. The emissions associate
with water sector, including water treatment and distribution, were deducted from the electricity sector
to avoid double counting.
CEC Forecast Assumptions
The following provides a list of programs and policies that are included in the CEC’s electricity forecast192
Renewable Portfolio Standard – 11.9% of retail electricity sales in 2010
• GHG Intensity of electricity 736 lbs/MWh
• Assumes direct access providers have the same GHG intensity
Utility Energy Efficiency Programs – electric reductions from 2013‐14 program cycle
Residential Sector
• 1975 HCD Building Standards 1992 Federal Appliance Standards
• 1978 Title 24 Residential Building Standards
• 2002 Refrigerator Standards
• 1983 Title 24 Residential Building Standards
• 2005 Title 24 Residential Building Standards
• 1991 Title 24 Residential Building Standards
• AB 1109 Lighting (Through Title 20)
191 California Energy Demand Forecast 2014-2024. Available at http://www.energy.ca.gov/2013publications/CEC-200-2013-004/CEC-200-2013-004-V1-CMF.pdf. 192 Kavalec et al. 2013, Table 21: Committed Building Codes and Appliance Standards Incorporated in CED 2013 Revised.

City of San Diego Climate Action Plan FINAL
APPENDICES A-64
• 2010 Title 24 Residential Building Standards
• 1976‐82 Title 20 Appliance Standards
• 1988 Federal Appliance Standards
• 2011 Television Standards
• 2011 Battery Charger Standards
• 1990 Federal Appliance Standards
• 2013 Title 24 Residential Building Standards
Commercial Sector
• 1978 Title 24 Nonresidential Building Standards
• 2001 Title 24 Non‐Residential Building Standards
• 1978 Title 20 Equipment Standards 2004 Title 20 Equipment Standards
• 1984 Title 24 Non-Residential Building Standards
• 2005 Title 24 Non-Residential Building Standards
• 1984 Title 20 Non-Res. Equipment Standards
• 2010 Title 24 Non-Residential Building Standards
• 1985-‐88 Title 24 Non-Residential Building
• AB 1109 Lighting (Through Title 20)
• Standards 2011 Television Standards
• 1992 Title 24 Non-Residential Building 2011 Battery Charger Standards
• 1998 Title 24 Non-Residential Building Standards
• 2013 Title 24 Non-Residential Building Standards
Natural Gas
To estimate the GHG emissions from natural gas use in 2010, we used consumption data for the City of
San Diego provided by SDG&E.193 To project emissions from electricity use, we used California Energy
Commission (CEC) forecasts194 for the San Diego Gas and Electric (SDG&E) service territory through 2024
193 San Diego Gas and Electric. 194 California Energy Demand Forecast 2014-2024.

City of San Diego Climate Action Plan FINAL
APPENDICES A-65
(best fit curve projections to 2035) to develop an average ratio between City of San Diego total
consumption and SDG&E consumption for years 2009-2012. This ratio value was multiplied by the CEC
forecast through 2035 to get an estimate of the City of San Diego consumption levels. Note that the gas
data used to calculate their inventory includes gas used for electric generation using cogeneration,
therefore the ratio of City-provided consumption levels is higher than the ratio (about 75%) without
natural gas for cogeneration (about 45%).
To estimate emissions from projected consumption levels were multiplied by a conversion factor of
0.0053052 MT CO2e/therm of natural gas.
Solid Waste and Wastewater
Solid waste emissions were estimated using method SW.4 from the U.S. Community Protocol for
Accounting and Reporting of Greenhouse Gas Emissions.195 This method uses disposed waste in a given
year (2010 for the baseline)196, the characterization of waste, and emissions factors from the U.S. EPA
Waste Reduction Model (WARM).197 Because a recent waste characterization study was not available for
the City of San Diego or the region, we assumed that the City’s characterization was the same as that of
California as a whole.198 Further, we assumed a methane capture rate of 75%.199
To calculate baseline emissions from wastewater, we used GHG data from Point Loma Wastewater
Treatment Plant, as reported to CARB in 2010.200 Annual emissions were divided by gallons of wastewater
processed at the plant in that year201 to estimate a typical CO2e/gallon of wastewater processed in the
City of San Diego. In order to obtain an estimate for total gallons of wastewater produced by the City of
195 ICLEI 2013. 196 CalRecycle DRS. 197 U.S. EPA Waste Reduction Model (WARM). 198 California Department of Resources Recycling and Recovery (CalRecycle). California 2008 Statewide Waste Characterization Study. Available at http://www.calrecycle.ca.gov/publications/Documents/General/2009023.pdf. 199 ICLEI 2013. 200 Emissions from Point Loma Wastewater Treatment Plant from, Report to CARB in 2010. 201 The City of San Diego Wastewater, 2010. Point Loma Wastewater Treatment Plant Annual Report (2010), Section 3 Plant Operations. Available at https://www.sandiego.gov/mwwd/pdf/2012/reports/ploperations.pdf.

City of San Diego Climate Action Plan FINAL
APPENDICES A-66
San Diego, we then multiplied per capita water use by a wastewater fraction derived from the ICLEI
Community Protocol202 and then by the City’s population.203 Finally, we multiplied the total gallons of
wastewater produced by our estimate of typical CO2e/gallon of wastewater processed to calculate total
GHG emissions from wastewater treatment for the City of San Diego. We assumed a BAU wastewater
capture rate of 71%.204
Water
To estimate the total water consumption in the City of San Diego, the per capital water consumption
reported in 2010, 151 gallons/person/day, was kept fixed and multiplied by the City population for
baseline year 2010 and all years until 2035205. The energy intensities associated with upstream water
supply and conveyance, water treatment and local water distribution (Appendix B.1, Table 5) were used
to convert water consumption to total electricity used for water. For emissions from water in baseline year
2010, total electricity used for water was multiplied by the SDG&E electricity emissions factor in 2010, 736
lbs CO2e/MWh, described in Appendix B.1. To project the BAU emissions from water consumption for
years after 2010, the 2010 SDG&E emissions factor was kept fixed and used to convert total electricity
used to emissions.
202 ICLEI 2013. 203 SANDAG Series 12. 204 A capture rate of about 71% was calculated by EPIC and confirmed by the City of San Diego. 205 SANDAG Series 12.
City of San Diego Climate Action Plan FINAL
APPENDICES A-67
APPENDIX A.3
GLOSSARY TERMS AND ACRONYMS Adaptation: This is the response to the climate changes that are occurring because of the excessive
human-induced GHGs that have been collecting in the atmosphere for the past 100 years. While GHG
reduction strategies are similar for most areas of the United States, the way that a community chooses to
adapt to a changing climate is very specific for each region.
Baseline: The baseline serves as a reference point to assess changes in greenhouse gas emission from
year to year. For purposes of calculating the baseline emissions, local governments generally estimate
emissions from government operations and sources within the community. This Climate Action Plan
(CAP) uses 2010 emissions as the baseline.
Business-As-Usual (BAU): The BAU projection starts with the baseline year, a regulatory snapshot of the
world at that time, and projects emissions into the future based on expected changes to population and
economic activity.
Carbon Dioxide (CO2): This is the reference as against which other greenhouse gases are measured
and therefore has a Global Warming Potential of 1. It is naturally occurring and is also a primary by-
product from combustion of fossil fuels and other industrial and agricultural processes.
Carbon Dioxide Equivalent (CO2e): This is a common unit for normalizing greenhouse gases with
different levels of heat trapping potential. For carbon dioxide itself, emissions in tons of CO2 and tons of
CO2eare the same, whereas for nitrous oxide and methane, stronger greenhouse gases, one ton of
emissions is equal to 310 tons and 21 tons of CO2e respectively.
Carbon Sequestration: Carbon sequestration is the capture and long-term storage of atmospheric
carbon dioxide through biological, chemical, or physical processes.
City of San Diego Climate Action Plan FINAL
APPENDICES A-68
Chlorofluorocarbons (CFCs): A family of inert, nontoxic, and easily liquefied chemicals used in
refrigeration, air conditioning, packaging, insulation, or as solvents and aerosol propellants. Because CFCs
are not destroyed in the lower atmosphere, they drift into the upper atmosphere, where their chlorine
components destroy the ozone layer.
The California Environmental Quality Act (CEQA): This was a California statute passed in 1970, shortly
after the United States federal government passed the National Environmental Policy Act (NEPA), to
institute a statewide policy of environmental protection. CEQA does not directly regulate land uses, but
instead requires state and local agencies within California to follow a protocol of analysis and public
disclosure of environmental impacts of proposed projects and adopt all feasible measures to mitigate
those significant impacts.
Climate: This is typically defined as the “average weather,” or more rigorously, as the statistical
description in terms of the average and variability of weather over a period of time ranging from months
to thousands of years. These variables are most often temperature, precipitation, and wind. Climate can
also refer to the global climate system.
Climate Action Plan: A description of the measures and actions that an organization will take to reduce
greenhouse gas emissions and achieve an emissions reduction target. Most plans include a description of
existing and future year emissions; a reduction target; a set of measures, including performance standards
that will collectively achieve the target; and a mechanism to monitor the plan.
Climate Change: Climate change refers to any significant change in measures of climate (such as
temperature, precipitation, or wind) lasting for an extended period (decades or longer). Climate change
results from: 1) natural factors, such as changes in the sun’s intensity or slow changes in the Earth’s orbit
around the sun; 2) natural processes within the climate system (e.g. changes in ocean circulation); and 3)
human activities that change the atmosphere’s composition (e.g. through burning fossil fuels) and the
land surface (e.g. deforestation, reforestation, urbanization, desertification, etc.).
Co-Benefit: Multiple, ancillary benefits of a policy, program or intervention. Many measures designed to
reduce greenhouse gas emissions have other benefits such as energy and cost savings.
City of San Diego Climate Action Plan FINAL
APPENDICES A-69
Corporate Average Fuel Economy (CAFE): The CAFE standards were originally established by Congress
for new automobiles, and later for light trucks, in Title V of the Motor Vehicle Information and Cost
Savings Act. Under CAFE, automobile manufacturers are required by law to produce vehicles with
composite sales-weighted fuel efficiency, which cannot be lower than the CAFE standards in a given year.
Standardized tests are used to rate the fuel economy of new vehicles.
Energy Efficiency: This refers to the use of less energy, usually in the form of electricity, for the same
function. Energy efficiency is often achieved by technology forcing regulations to reduce energy use in
new appliances, such as televisions and lighting.
Energy Conservation: This is a typical practice using what you have more efficiently, such as shutting off
the light or only using the dishwasher when it is full.
Emissions: The release of a substance (usually a gas when referring to the subject of climate change) into
the atmosphere.
Emissions Factor: A set of coefficients used to convert data from electricity, natural gas, fuel and waste to
calculate GHG emissions. These emission factors are the ratio of emissions of a particular pollutant (e.g.,
carbon dioxide) to the quantity of the fuel used (e.g., kilograms of coal). For example, when burned, 1 ton
of coal = 2.071 tons of CO2.
Forecast Year: Any future year in which predictions are made about emissions levels based on growth
multipliers applied to the base year.
Global Warming: Global warming is an average increase in the temperature of the atmosphere near the
Earth’s surface and in the troposphere, which can contribute to changes in global climate patterns. Global
warming can occur from a variety of causes, both natural and human induced. In common usage, “global
warming” often refers to the warming that can occur as a result of increased emissions of greenhouse
gases.

City of San Diego Climate Action Plan FINAL
APPENDICES A-70
Global-warming Potential (GWP): This is a relative measure of how much heat a greenhouse gas traps in
the atmosphere. It compares the amount of heat trapped by a certain mass of the gas in question to the
amount of heat trapped by a similar mass of carbon dioxide. A GWP is calculated over a specific time
interval, commonly 20, 100 or 500 years. GWP is expressed as a factor of carbon dioxide (whose GWP is
standardized to 1). For example, the 20 year GWP of methane is 72, which means that if the same mass of
methane and carbon dioxide were introduced into the atmosphere, that methane will trap 72 times more
heat than the carbon dioxide over the next 20 years.
Greenhouse Effect: The build-up of heat in the atmosphere (troposphere) near the Earth’s surface due to
infrared radiation from the sun being absorbed by water vapor, carbon dioxide, ozone, and several other
gases. This heat is then re-radiated back toward the Earth’s surface. As atmospheric concentrations of
these greenhouse gases rise, the average temperature of the lower atmosphere gradually increases.
Greenhouse Gas: Any gas that absorbs infrared radiation in the atmosphere. Greenhouse gases include,
but are not limited to, water vapor, carbon dioxide (CO2), methane (CH2), nitrous oxide (N2O),
chlorofluorocarbons (CFCs), hydrochlorofluorocarbons (HCFCs), ozone (O3), hydrofluorocarbons (HFCs),
perfluorocarbons (PFCs), and sulfur hexafluoride (SF6).
Green Streets: Urban transportation right-of-ways integrated with green techniques. Green streets
provide a source control for a main contributor of stormwater runoff and pollutant load. In addition,
green infrastructure approaches complement street facility upgrades, street aesthetic improvements, and
urban tree canopy efforts that also make use of the right-of-way and allow it to achieve multiple goals
and benefits. (EPA 2008)
Greywater: Untreated wastewater that has not been contaminated by any toilet discharge or by any
infectious, contaminated, or unhealthy bodily wastes, and does not present a threat from contamination
by unhealthful processing, manufacturing, or operating wastes. Greywater includes but is not limited to
wastewater from bathtubs, showers, bathroom washbasins, clothes washing machines, and laundry tubs,
but does not include wastewater from kitchen sinks, dishwashers, or toilets.
Heating, Ventilation, and Air Conditioning (HVAC): These are mechanical systems that control the
ambient environment (temperature, humidity, air flow and air filtering) of a building.
City of San Diego Climate Action Plan FINAL
APPENDICES A-71
Hydrofluorocarbons (HFCs): Man-made compounds containing hydrogen, fluorine, and carbon that
were developed as an alternative to ozone-depleting substances for industrial, commercial, and
consumer products. HFCs do not have the potential to destroy stratospheric ozone, but they are still
powerful greenhouse gases.
Intergovernmental Panel on Climate Change (IPCC): The IPCC was established jointly by the
United Nations Environment Program and the World Meteorological Organization in 1988. The purpose
of the IPCC is to assess information in the scientific and technical literature related to all significant
components of the issue of climate change. The IPCC draws upon hundreds of the world’s expert
scientists as authors and thousands as expert reviewers. Leading experts on climate change and
environmental, social, and economic sciences from some 60 nations have helped the IPCC to prepare
periodic assessments of the scientific underpinnings for understanding global climate change and its
consequences. With its capacity for reporting on climate change, its consequences, and the viability of
adaptation and mitigation measures, the IPCC is also looked to as the official advisory body to the world’s
governments on the state of the science of the climate change issue. For example, the IPCC organized
the development of internationally accepted methods for conducting national greenhouse gas emission
inventories. The IPCC Methodologies (2nd Assessment) for GHG inventories also provide the Global
Warming Potentials for GHGs.
Methane (CH4): A hydrocarbon that is a greenhouse gas with a global warming potential most recently
estimated at 23 times that of carbon dioxide (CO22). Methane is produced through anaerobic (without
oxygen) decomposition of waste in landfills and sewage treatments, animal digestion, decomposition of
animal wastes, production and distribution of natural gas and petroleum, coal production, and
incomplete fossil fuel combustion.
Measures: Any action taken to reduce GHG emissions.
Mitigation: CEQA defines mitigation as including: "(a) avoiding the impact altogether by not taking a
certain action or parts of an action; (b) minimizing impacts by limiting the degree or magnitude of the
action and its implementation; (c) rectifying the impact by repairing, rehabilitating, or restoring the
impacted environment; (d) reducing or eliminating the impact over time by preservation and
City of San Diego Climate Action Plan FINAL
APPENDICES A-72
maintenance operations during the life of the action; and (e) Compensating for the impact by replacing
or providing substitute resources or environments. See CEQA Guidelines section 15370.
Metric Ton (MT ): Common international measurement for the quantity of greenhouse gas
emissions. A metric ton is equal to 2205 lbs. or 1.1 short tons.
Mixed-Use: In a land-use planning context, a project that has at least three of the following amenities
within a 1/4 mile radius: 1) residential development, 2) retail and/or commercial development, 3) park,
and 4) open space. Mixed-use developments encourage walking and other non-auto modes of transport
from residential to office/commercial locations. The project should minimize the need for external vehicle
trips by including services and facilities for day care, banking/ATM, restaurants, vehicle refueling, and
shopping.
Natural Gas: This is the typical fuel used in new power generating facilities in California. Underground
deposits of gases consist of 50 to 90% methane and small amounts of heavier gaseous
hydrocarbon compounds such as propane and butane.
Non-Potable Water: Water that is not suitable for drinking because it has not been treated to drinking
water standards.
Perfluorocarbons (PFCs): Potent greenhouse gases that accumulate in the atmosphere and remain
there for thousands of years. Aluminum production and semiconductor manufacture are the largest
known man-made sources of perfluorocarbons.
Potable Water: Water that meets federal drinking water standards as well as state and local water quality
standards so that it is safe for human consumption. Water treatment facilities that produce drinking
water require a state permit.
Recycled Water: Treatment of wastewater beyond secondary treatment using tertiary filtration and
chlorination. Water treated to this tertiary level is considered to be recycled water, which is suitable for
many beneficial uses including irrigation or industrial processes. Recycled water meets treatment and
reliability criteria established by Title 22, Chapter 4 of the California Code of Regulations.

City of San Diego Climate Action Plan FINAL
APPENDICES A-73
Risk: Denotes the result of the interaction of physically defined hazards with the properties of the
exposed systems - i.e., their sensitivity or social vulnerability. Risk can also be considered as the
combination of an event, its likelihood and its consequences - i.e., risk equals the probability of climate
hazard multiplied by a given system’s vulnerability.
Resiliency : When referring to natural systems, the amount of change a system can undergo
without changing state. When referring to human systems, the term “resiliency” can be considered as a
synonym of adaptive capacity. This is determined by the degree to which the social system is capable of
organizing itself to increase its capacity for learning from past disasters for better future protection and to
improve risk reduction measures.
Sector: A term used to describe emission inventory source categories for greenhouse gases based on
broad economic sectors.
Target Year: The year by which the emissions reduction target should be achieved.
Transit Oriented Development (TOD): A moderate- to high-density development located within 1/4
mile of a major transit stop, generally with a mix of residential, employment, and shopping opportunities.
TOD encourages walking, bicycling, and transit use without excluding the automobile.
Urban Heat Island Effect: The significantly higher temperatures in a metropolitan area, relative to its
surrounding rural areas, caused by waste heat generated by energy use and the modification of land by
buildings and surface materials that retain heat.
Vehicles Miles Traveled (VMT): This unit measures the aggregate mileage traveled by all vehicles in a
specific location. VMT is a key measure of street and highway use. Reducing VMT is often a major
objective in efforts to reduce vehicular congestion and achieve air quality goals.
Vulnerability: The degree to which systems affected by climate change are susceptible to and unable to
cope with adverse impacts.
Unbundled Parking: Unpriced parking is often “bundled” with building costs, which means that a certain
number of spaces are automatically included with building purchases or leases. Unbundling Parking
City of San Diego Climate Action Plan FINAL
APPENDICES A-74
means that parking is sold or rented separately. Occupants only pay for the parking spaces the actually
need.
Acronyms AB - Assembly Bill
APCD – Air Pollution Control District (County of San Diego)
CACP - Clean Air and Climate Protection Software
CAP - Climate Action Plan
CAPPA - Climate and Air Pollution Planning Assistant
CARB - California Air Resources Board
CEC - California Energy Commission
CEQA - California Environmental Quality Act
CH4 - Methane
CO2 - Carbon dioxide
CO2e - Carbon dioxide equivalent
EPA - U.S. Environmental Protection Agency
GHG - Greenhouse gas
HFC - Hydrofluorocarbons
HVAC - Heating, ventilating, and air conditioning
IPCC - Intergovernmental Panel on Climate Change
KWh - Kilowatt-hours
LCFS - Low Carbon Fuel Standard
MMT - Million metric tons
MW - Megawatt
City of San Diego Climate Action Plan FINAL
APPENDICES A-75
N2O - Nitrous oxide
PPM - Parts per million
SANDAG – San Diego Association of Governments
SB - Senate Bill
TOD - Transit oriented development
USGBC - U.S. Green Building Council
VMT - Vehicle miles traveled
City of San Diego Climate Action Plan FINAL
APPENDICES A-76
References American Lung Association 2013. State of the Air 2013. Clean Edge 2010. Pernick, R., C. Wilder, and T. Winnie 2010. Clean Tech Job Trends 2010. October. Clean Tech San Diego 2013. Annual Reports. http://www.cleantechsandiego.org/annual-report.
html. Accessed on November 15, 2103. Environmental Entrepreneurs (E2) 2013. Clean Energy Works for Us: 2013 Third Quarter Clean
Energy/Clean Transportation jobs Report. Environmental Protection Agency (EPA) 2013. Climate Impacts on Human Health.
www.epa.gov/climatechange/impacts-adaptation/health.html. Accessed on November 15, 2013. 2008..
Department of Agriculture, Forest Service (USDA) 2010. Sustaining America’s Urban Trees and Forests. General Technical Report NRS-62. June.
ICLEI (Local Governments for Sustainability) 2012. Sea Level Rise Adaptation Strategy for San Diego Bay. January.
Intergovernmental Panel on Climate Change (IPCC) 2007. Contribution of Working Group II to the Fourth Assessment Report. M.L. Parry, O.F. Canziani, J.P. Palutikof, P.J. van der Linden and C.E. Hanson, Eds. Cambridge University Press, Cambridge, UK.
Managing Wet Weather with Green Infrastructure - Municipal Handbook: Green Streets Middle Class Taskforce 2009. Green Jobs: A Pathway to a Strong Middle Class. Staff Report. Public Health Institute 2013. San Diego Community Health and Climate Pilot Project http://www. phi.org/news-events/554/public-health-institute-awa. Access November 15.
San Diego, City of 2007. Mitigation Monitoring and Reporting Program for City of San Diego General Plan Final Program EIR. Development Services Department. September 28, 2009. City of San Diego 2008 General Plan. Development Services Department. July 9. 2012. Long-Range Water Resources Plan. Public Utilities Department. April.
San Diego County Water Authority (SDCWA) 2011. 2010 Urban Water Management Plan. Water Resources Department. June.
San Diego Foundation 2007. San Diego’s Changing Climate: A Regional Wake-Up Call. San Diego Workforce Partnership (SDWP) 2011. Green Job Outlook for San Diego. June 7. Stanton, E.A., T. Comings, K. Takahashi, P. Knight, T. Vitolo, E.D. Hausman 2013. Economic Impacts of the
NRDC Carbon Standard. Background Report prepared for the Natural Resources Defense Council. Synapse Energy Economics, Inc. June 20.
Unified Port of San Diego 2013. Climate Plan. http://www.portofsandiego.org/climate-mitigation- and-adaptation-plan.html. Accessed November 15, 2013.
United States Bureau of Labor Statistics (BLS) 2013. Measuring Green Jobs. www.bls.gov/green. Accessed on November 15, 2013.

CITY OF SAN DIEGO
CLIMATE ACTION PLAN
FINAL
APPENDIX B
TRANSIT PRIORITY AREA MAP

PACIFIC OCEAN
SAN DIEGOBAY
M E X I C O
MISSIONBAY
S.D. COUNTY
POWAY
CHULA VISTA
S.D. COUNTY
SANTEE
EL CAJON
CORONADO
ENCINITAS
LA MESA
NATIONAL CITY
LEMON GROVE
IMPERIAL BEACH
SOLANA BEACH
DEL MAR
S.D. COUNTY
S.D. COUNTY
S.D. COUNTY
S.D. COUNTY
ESCONDIDO ESCONDIDO
S.D. COUNTY
S.D. COUNTY
SAN DIEGO
SAN DIEGO
SAN DIEGO
Transit Priority Areas per SB743
µLegend(!! Trolley Stations(!! Coaster Station! Major Transit Stops
High Frequency RoutesTrolley LinesCoaster Line
Transit Priority AreaPlanning AreasMunicipal Boundaries
CITY OF SAN DIEGO PLANNING DEPARTMENT
Feet0 350017503500
Documen t Path: L:\GIS\PGIS\Tran sp o rtatio n \SB 743\SB 743 TPA fo r CAP - Lo n gTerm SD FORWARD.mxd
Current as of: 3/1/2017
Long Term through 2035
In acco rdan ce with SB 743, “Tran sit p rio rity area” mean s “an area withino n e-half mile of a majo r tran sit sto p that is existin g o r p lan n ed, if thep lan n ed sto p is scheduled to b e comp leted within the p lan n in g ho rizo nin cluded in a Tran sp o rtatio n Imp ro vemen t Program ado p ted p ursuan t toSectio n 450.216 o r 450.322 of Title 23 of the Code of Federal Regulatio n s.”• Sectio n 450.216 addresses develo p men t an d co n ten t of the statewidetran sp o rtatio n imp ro vemen t p ro gram. STIPs co ver a p eriod of n o less thanfo ur years.• Sectio n 450.322 refers to develo p men t an d co n ten t of the metro p o litantran sp o rtatio n p lan . The RTP has at least a 20-year p lan n in g ho rizo n .• Majo r Tran sit Sto p , as defin ed in Sectio n 21064.3, mean s: “a siteco n tain in g an existin g rail tran sit statio n , a ferry termin al served b y either ab us o r rail tran sit service, o r the in tersectio n of tw o o r mo re majo r b usro utes with a frequen cy of service of 15 min utes o r less durin g the mo rn in gan d aftern o o n p eak commute p eriods.”
The Tran sit Prio rity Areas map is b ased o n the ado p ted SANDAG SanDiego Fo rward Regio n al Plan .
CITY OF SAN DIEGO
CLIMATE ACTION PLAN
AMENDED JULY 2016
APPENDIX C
CAP CONSISTENCY CHECKLIST


City Council Approved July 12, 2016
CLIMATE ACTION PLAN CONSISTENCY CHECKLIST INTRODUCTION
In December 2015, the City adopted a Climate Action Plan (CAP) that outlines the actions that City will undertake to achieve its proportional share of State greenhouse gas (GHG) emission reductions. The purpose of the Climate Action Plan Consistency Checklist (Checklist) is to, in conjunction with the CAP, provide a streamlined review process for proposed new development projects that are subject to discretionary review and trigger environmental review pursuant to the California Environmental Quality Act (CEQA).1 Analysis of GHG emissions and potential climate change impacts from new development is required under CEQA. The CAP is a plan for the reduction of GHG emissions in accordance with CEQA Guidelines Section 15183.5. Pursuant to CEQA Guidelines Sections 15064(h)(3), 15130(d), and 15183(b), a project’s incremental contribution to a cumulative GHG emissions effect may be determined not to be cumulatively considerable if it complies with the requirements of the CAP. This Checklist is part of the CAP and contains measures that are required to be implemented on a project-by-project basis to ensure that the specified emissions targets identified in the CAP are achieved. Implementation of these measures would ensure that new development is consistent with the CAP’s assumptions for relevant CAP strategies toward achieving the identified GHG reduction targets. Projects that are consistent with the CAP as determined through the use of this Checklist may rely on the CAP for the cumulative impacts analysis of GHG emissions. Projects that are not consistent with the CAP must prepare a comprehensive project-specific analysis of GHG emissions, including quantification of existing and projected GHG emissions and incorporation of the measures in this Checklist to the extent feasible. Cumulative GHG impacts would be significant for any project that is not consistent with the CAP. The Checklist may be updated to incorporate new GHG reduction techniques or to comply with later amendments to the CAP or local, State, or federal law. Questions pertaining to the Checklist should be directed to Development Services Department at 619-446-5000.
1 Certain projects seeking ministerial approval may be required to complete the Checklist. For example, projects in a Community Plan
Implementation Overlay Zone may be required to use the Checklist to qualify for ministerial level review. See Supplemental Development Regulations in the project’s community plan to determine applicability.

City Council Approved July 12, 2016
This page intentionally left blank

City Council Approved July 12, 2016
CAP CONSISTENCY CHECKLIST SUBMITTAL APPLICATION
The Checklist is required only for projects subject to CEQA review.2
If required, the Checklist must be included in the project submittal package. Application submittal procedures can be found in Chapter 11: Land Development Procedures of the City’s Municipal Code.
The requirements in the Checklist will be included in the project’s conditions of approval.
The applicant must provide an explanation of how the proposed project will implement the requirements described herein to the satisfaction of the Planning Department.
Application Information
Contact Information
Project No./Name:
Property Address:
Applicant Name/Co.:
Contact Phone: Contact Email:
Was a consultant retained to complete this checklist? ☐ Yes ☐ No If Yes, complete the following
Consultant Name: Contact Phone:
Company Name: Contact Email:
Project Information
1. What is the size of the project (acres)?
2. Identify all applicable proposed land uses:
☐ Residential (indicate # of single-family units):
☐ Residential (indicate # of multi-family units):
☐ Commercial (total square footage):
☐ Industrial (total square footage):
☐ Other (describe):
3. Is the project located in a Transit Priority Area? ☐ Yes ☐ No
4. Provide a brief description of the project proposed:
2 Certain projects seeking ministerial approval may be required to complete the Checklist. For example, projects in a Community Plan
Implementation Overlay Zone may be required to use the Checklist to qualify for ministerial level review. See Supplemental Development Regulations in the project’s community plan to determine applicability.

City Council Approved July 12, 2016
CAP CONSISTENCY CHECKLIST QUESTIONS
Step 1: Land Use Consistency The first step in determining CAP consistency for discretionary development projects is to assess the project’s consistency with the growth projections used in the development of the CAP. This section allows the City to determine a project’s consistency with the land use assumptions used in the CAP.
Step 1: Land Use Consistency
Checklist Item (Check the appropriate box and provide explanation and supporting documentation for your answer) Yes No
1. Is the proposed project consistent with the existing General Plan and Community Plan land use and zoning designations?;3 OR,
2. If the proposed project is not consistent with the existing land use plan and zoning designations, does
the project include a land use plan and/or zoning designation amendment that would result in an equivalent or less GHG-intensive project when compared to the existing designations?; OR,
3. If the proposed project is not consistent with the existing land use plan and zoning designations, and
includes a land use plan and/or zoning designation amendment that would result in an increase in GHG emissions when compared to the existing designations, would the project be located in a Transit Priority Area (TPA) and implement CAP Strategy 3 actions, as determined in Step 3 to the satisfaction of the Development Services Department?
☐ ☐
If “Yes,” proceed to Step 2 of the Checklist. For questions 2 and 3 above, provide estimated project emissions under both existing and proposed designation(s) for comparison. For question 3 above, complete Step 3. If “No,” in accordance with the City’s Significance Determination Thresholds, the project’s GHG impact is significant. The project must nonetheless incorporate each of the measures identified in Step 2 to mitigate cumulative GHG emissions impacts unless the decision maker finds that a measure is infeasible in accordance with CEQA Guidelines Section 15091. Proceed and complete Step 2 of the Checklist.
3 This question may also be answered in the affirmative if the project is consistent with SANDAG Series 12 growth projections, which were used to determine the CAP projections, as determined by the Planning Department.

City Council Approved July 12, 2016
Step 2: CAP Strategies Consistency The second step of the CAP consistency review is to review and evaluate a project’s consistency with the applicable strategies and actions of the CAP. Step 2 only applies to development projects that involve permits that would require a certificate of occupancy from the Building Official or projects comprised of one and two family dwellings or townhouses as defined in the California Residential Code and their accessory structures.4 All other development projects that would not require a certificate of occupancy from the Building Official shall implement Best Management Practices for construction activities as set forth in the Greenbook (for public projects).
Step 2: CAP Strategies Consistency
Checklist Item (Check the appropriate box and provide explanation for your answer) Yes No N/A
Strategy 1: Energy & Water Efficient Buildings
1. Cool/Green Roofs. • Would the project include roofing materials with a minimum 3-year aged solar
reflection and thermal emittance or solar reflection index equal to or greater than the values specified in the voluntary measures under California Green Building Standards Code (Attachment A)?; OR
• Would the project roof construction have a thermal mass over the roof membrane, including areas of vegetated (green) roofs, weighing at least 25 pounds per square foot as specified in the voluntary measures under California Green Building Standards Code?; OR
• Would the project include a combination of the above two options? Check “N/A” only if the project does not include a roof component.
☐ ☐ ☐
2. Plumbing fixtures and fittings With respect to plumbing fixtures or fittings provided as part of the project, would those low-flow fixtures/appliances be consistent with each of the following:
Residential buildings: • Kitchen faucets: maximum flow rate not to exceed 1.5 gallons per minute at 60
psi; • Standard dishwashers: 4.25 gallons per cycle; • Compact dishwashers: 3.5 gallons per cycle; and • Clothes washers: water factor of 6 gallons per cubic feet of drum capacity?
Nonresidential buildings: • Plumbing fixtures and fittings that do not exceed the maximum flow rate
specified in Table A5.303.2.3.1 (voluntary measures) of the California Green Building Standards Code (See Attachment A); and
• Appliances and fixtures for commercial applications that meet the provisions of Section A5.303.3 (voluntary measures) of the California Green Building Standards Code (See Attachment A)?
Check “N/A” only if the project does not include any plumbing fixtures or fittings.
☐ ☐ ☐
4 Actions that are not subject to Step 2 would include, for example: 1) discretionary map actions that do not propose specific development, 2) permits allowing wireless communication facilities,
3) special events permits, 4) use permits that do not result in the expansion or enlargement of a building, and 5) non-building infrastructure projects such as roads and pipelines. Because such actions would not result in new occupancy buildings from which GHG emissions reductions could be achieved, the items contained in Step 2 would not be applicable.
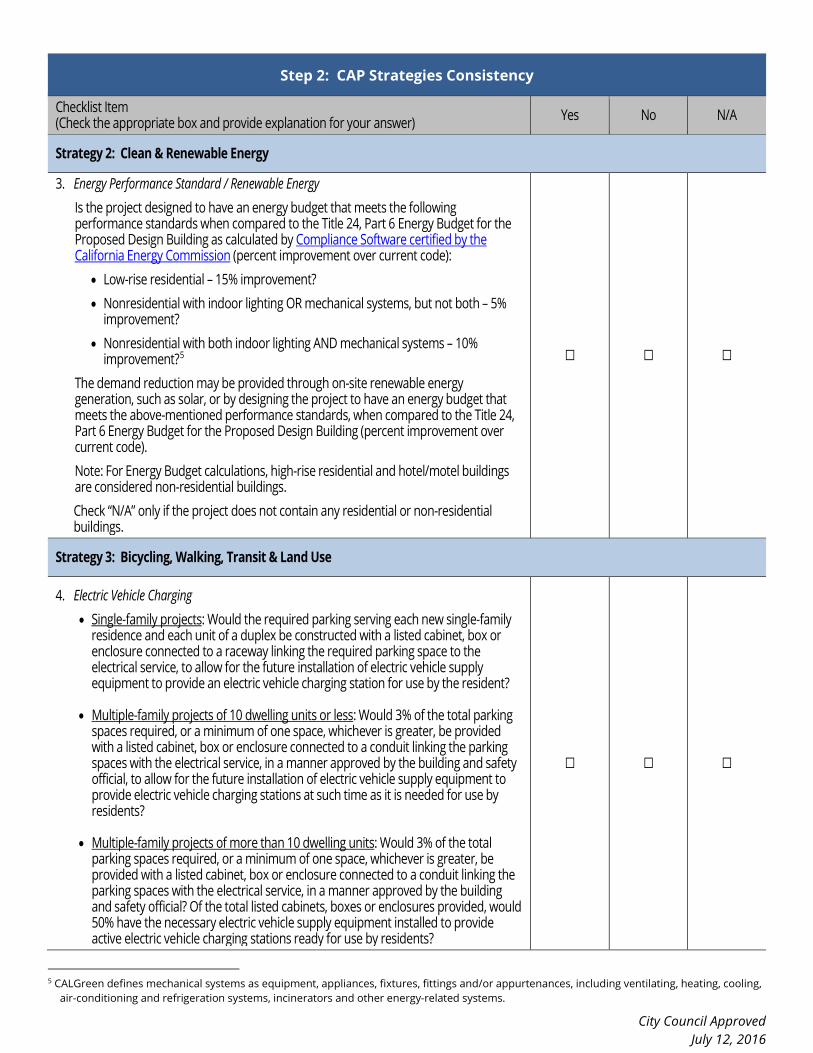
City Council Approved July 12, 2016
Step 2: CAP Strategies Consistency
Checklist Item (Check the appropriate box and provide explanation for your answer) Yes No N/A
Strategy 2: Clean & Renewable Energy
3. Energy Performance Standard / Renewable Energy Is the project designed to have an energy budget that meets the following performance standards when compared to the Title 24, Part 6 Energy Budget for the Proposed Design Building as calculated by Compliance Software certified by the California Energy Commission (percent improvement over current code):
• Low-rise residential – 15% improvement? • Nonresidential with indoor lighting OR mechanical systems, but not both – 5%
improvement? • Nonresidential with both indoor lighting AND mechanical systems – 10%
improvement?5 The demand reduction may be provided through on-site renewable energy generation, such as solar, or by designing the project to have an energy budget that meets the above-mentioned performance standards, when compared to the Title 24, Part 6 Energy Budget for the Proposed Design Building (percent improvement over current code). Note: For Energy Budget calculations, high-rise residential and hotel/motel buildings are considered non-residential buildings. Check “N/A” only if the project does not contain any residential or non-residential buildings.
☐ ☐ ☐
Strategy 3: Bicycling, Walking, Transit & Land Use
4. Electric Vehicle Charging • Single-family projects: Would the required parking serving each new single-family
residence and each unit of a duplex be constructed with a listed cabinet, box or enclosure connected to a raceway linking the required parking space to the electrical service, to allow for the future installation of electric vehicle supply equipment to provide an electric vehicle charging station for use by the resident?
• Multiple-family projects of 10 dwelling units or less: Would 3% of the total parking spaces required, or a minimum of one space, whichever is greater, be provided with a listed cabinet, box or enclosure connected to a conduit linking the parking spaces with the electrical service, in a manner approved by the building and safety official, to allow for the future installation of electric vehicle supply equipment to provide electric vehicle charging stations at such time as it is needed for use by residents?
• Multiple-family projects of more than 10 dwelling units: Would 3% of the total parking spaces required, or a minimum of one space, whichever is greater, be provided with a listed cabinet, box or enclosure connected to a conduit linking the parking spaces with the electrical service, in a manner approved by the building and safety official? Of the total listed cabinets, boxes or enclosures provided, would 50% have the necessary electric vehicle supply equipment installed to provide active electric vehicle charging stations ready for use by residents?
☐ ☐ ☐
5 CALGreen defines mechanical systems as equipment, appliances, fixtures, fittings and/or appurtenances, including ventilating, heating, cooling,
air-conditioning and refrigeration systems, incinerators and other energy-related systems.

City Council Approved July 12, 2016
Step 2: CAP Strategies Consistency
Checklist Item (Check the appropriate box and provide explanation for your answer) Yes No N/A
• Non-residential projects: If the project includes new commercial, industrial, or other uses with the building or land area, capacity, or numbers of employees listed in Attachment A, would 3% of the total parking spaces required, or a minimum of one space, whichever is greater, be provided with a listed cabinet, box or enclosure connected to a conduit linking the parking spaces with the electrical service, in a manner approved by the building and safety official? Of the total listed cabinets, boxes or enclosures provided, would 50% have the necessary electric vehicle supply equipment installed to provide active electric vehicle charging stations ready for use?
Check “N/A” only if the project is does not include new commercial, industrial, or other uses with the building or land area, capacity, or numbers of employees listed in Attachment A.
Strategy 3: Bicycling, Walking, Transit & Land Use (Complete this section if project includes non-residential or mixed uses)
5. Bicycle Parking Spaces Would the project provide more short- and long-term bicycle parking spaces than required in the City’s Municipal Code (Chapter 14, Article 2, Division 5)?6 Check “N/A” only if the project is a residential project.
☐ ☐ ☐
6. Shower facilities If the project includes nonresidential development that would accommodate over 10 tenant occupants (employees), would the project include changing/shower facilities in accordance with the voluntary measures under the California Green Building Standards Code as shown in the table below?
Number of Tenant
Occupants (Employees)
Shower/Changing Facilities Required
Two-Tier (12” X 15” X 72”) Personal Effects
Lockers Required
0-10 0 0
11-50 1 shower stall 2
51-100 1 shower stall 3
101-200 1 shower stall 4
Over 200
1 shower stall plus 1 additional shower stall for each 200 additional
tenant-occupants
1 two-tier locker plus 1 two-tier locker for each 50 additional tenant-
occupants
Check “N/A” only if the project is a residential project, or if it does not include nonresidential development that would accommodate over 10 tenant occupants (employees).
☐ ☐ ☐
6 Non-portable bicycle corrals within 600 feet of project frontage can be counted towards the project’s bicycle parking requirements.
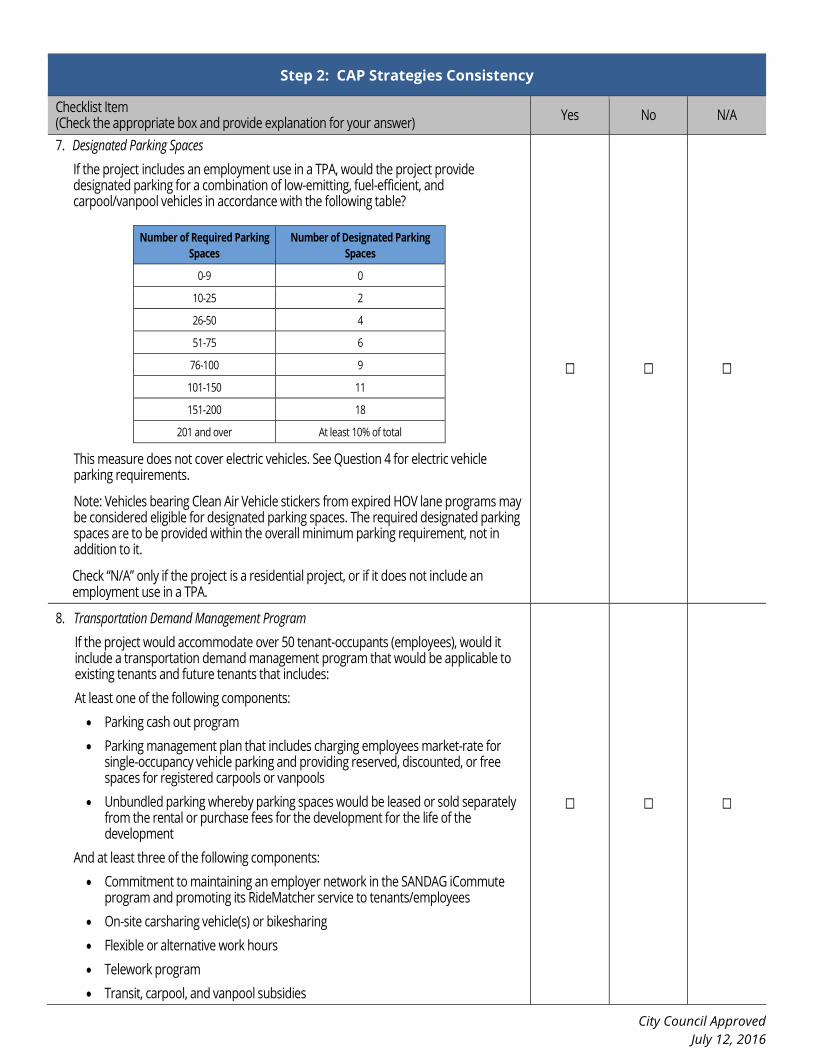
City Council Approved July 12, 2016
Step 2: CAP Strategies Consistency
Checklist Item (Check the appropriate box and provide explanation for your answer) Yes No N/A
7. Designated Parking Spaces If the project includes an employment use in a TPA, would the project provide designated parking for a combination of low-emitting, fuel-efficient, and carpool/vanpool vehicles in accordance with the following table?
Number of Required Parking
Spaces Number of Designated Parking
Spaces
0-9 0
10-25 2
26-50 4
51-75 6
76-100 9
101-150 11
151-200 18
201 and over At least 10% of total
This measure does not cover electric vehicles. See Question 4 for electric vehicle parking requirements.
Note: Vehicles bearing Clean Air Vehicle stickers from expired HOV lane programs may be considered eligible for designated parking spaces. The required designated parking spaces are to be provided within the overall minimum parking requirement, not in addition to it.
Check “N/A” only if the project is a residential project, or if it does not include an employment use in a TPA.
☐ ☐ ☐
8. Transportation Demand Management Program If the project would accommodate over 50 tenant-occupants (employees), would it include a transportation demand management program that would be applicable to existing tenants and future tenants that includes: At least one of the following components: • Parking cash out program • Parking management plan that includes charging employees market-rate for
single-occupancy vehicle parking and providing reserved, discounted, or free spaces for registered carpools or vanpools
• Unbundled parking whereby parking spaces would be leased or sold separately from the rental or purchase fees for the development for the life of the development
And at least three of the following components: • Commitment to maintaining an employer network in the SANDAG iCommute
program and promoting its RideMatcher service to tenants/employees • On-site carsharing vehicle(s) or bikesharing • Flexible or alternative work hours • Telework program • Transit, carpool, and vanpool subsidies
☐ ☐ ☐

City Council Approved July 12, 2016
Step 2: CAP Strategies Consistency
Checklist Item (Check the appropriate box and provide explanation for your answer) Yes No N/A
• Pre-tax deduction for transit or vanpool fares and bicycle commute costs • Access to services that reduce the need to drive, such as cafes, commercial
stores, banks, post offices, restaurants, gyms, or childcare, either onsite or within 1,320 feet (1/4 mile) of the structure/use?
Check “N/A” only if the project is a residential project or if it would not accommodate over 50 tenant-occupants (employees).

City Council Approved July 12, 2016
Step 3: Project CAP Conformance Evaluation (if applicable) The third step of the CAP consistency review only applies if Step 1 is answered in the affirmative under option 3. The purpose of this step is to determine whether a project that is located in a TPA but that includes a land use plan and/or zoning designation amendment that would result in an increase in GHG emissions when compared to the existing designations, is nevertheless consistent with the assumptions in the CAP because it would implement CAP Strategy 3 actions. The following questions must each be answered in the affirmative and fully explained. 1. Would the proposed project implement the General Plan’s City of Villages strategy in an identified Transit Priority Area (TPA) that will
result in an increase in the capacity for transit-supportive residential and/or employment densities? Considerations for this question:
• Does the proposed land use and zoning designation associated with the project provide capacity for transit-supportive residential densities within the TPA?
• Is the project site suitable to accommodate mixed-use village development, as defined in the General Plan, within the TPA? • Does the land use and zoning associated with the project increase the capacity for transit-supportive employment intensities within the TPA?
2. Would the proposed project implement the General Plan’s Mobility Element in Transit Priority Areas to increase the use of transit?
Considerations for this question: • Does the proposed project support/incorporate identified transit routes and stops/stations? • Does the project include transit priority measures?
3. Would the proposed project implement pedestrian improvements in Transit Priority Areas to increase walking opportunities?
Considerations for this question: • Does the proposed project circulation system provide multiple and direct pedestrian connections and accessibility to local activity centers
(such as transit stations, schools, shopping centers, and libraries)? • Does the proposed project urban design include features for walkability to promote a transit supportive environment?
4. Would the proposed project implement the City of San Diego’s Bicycle Master Plan to increase bicycling opportunities?
Considerations for this question: • Does the proposed project circulation system include bicycle improvements consistent with the Bicycle Master Plan? • Does the overall project circulation system provide a balanced, multimodal, “complete streets” approach to accommodate mobility needs of
all users? 5. Would the proposed project incorporate implementation mechanisms that support Transit Oriented Development?
Considerations for this question: • Does the proposed project include new or expanded urban public spaces such as plazas, pocket parks, or urban greens in the TPA? • Does the land use and zoning associated with the proposed project increase the potential for jobs within the TPA? • Do the zoning/implementing regulations associated with the proposed project support the efficient use of parking through mechanisms
such as: shared parking, parking districts, unbundled parking, reduced parking, paid or time-limited parking, etc.? 6. Would the proposed project implement the Urban Forest Management Plan to increase urban tree canopy coverage?
Considerations for this question: • Does the proposed project provide at least three different species for the primary, secondary and accent trees in order to accommodate
varying parkway widths? • Does the proposed project include policies or strategies for preserving existing trees? • Does the proposed project incorporate tree planting that will contribute to the City’s 20% urban canopy tree coverage goal?
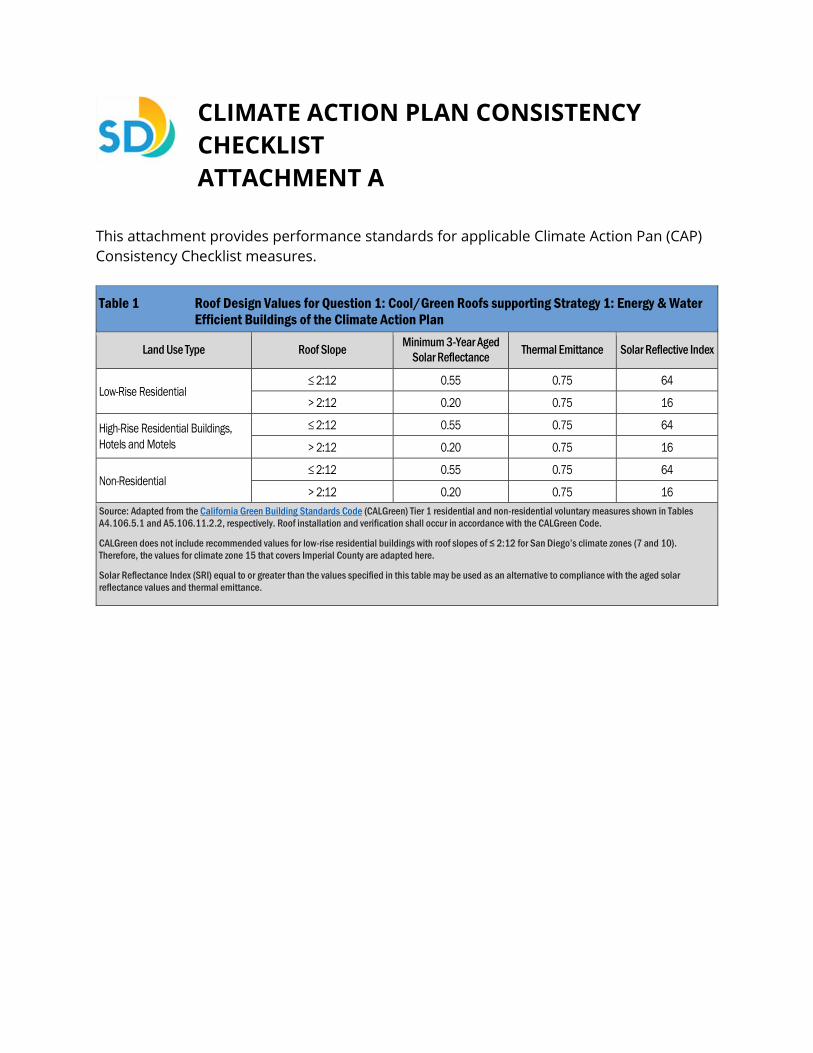
CLIMATE ACTION PLAN CONSISTENCY CHECKLIST ATTACHMENT A
This attachment provides performance standards for applicable Climate Action Pan (CAP) Consistency Checklist measures.
Table 1 Roof Design Values for Question 1: Cool/Green Roofs supporting Strategy 1: Energy & Water Efficient Buildings of the Climate Action Plan
Land Use Type Roof Slope Minimum 3-Year Aged Solar Reflectance Thermal Emittance Solar Reflective Index
Low-Rise Residential ≤ 2:12 0.55 0.75 64
> 2:12 0.20 0.75 16
High-Rise Residential Buildings, Hotels and Motels
≤ 2:12 0.55 0.75 64
> 2:12 0.20 0.75 16
Non-Residential ≤ 2:12 0.55 0.75 64
> 2:12 0.20 0.75 16 Source: Adapted from the California Green Building Standards Code (CALGreen) Tier 1 residential and non-residential voluntary measures shown in Tables A4.106.5.1 and A5.106.11.2.2, respectively. Roof installation and verification shall occur in accordance with the CALGreen Code.
CALGreen does not include recommended values for low-rise residential buildings with roof slopes of ≤ 2:12 for San Diego’s climate zones (7 and 10). Therefore, the values for climate zone 15 that covers Imperial County are adapted here.
Solar Reflectance Index (SRI) equal to or greater than the values specified in this table may be used as an alternative to compliance with the aged solar reflectance values and thermal emittance.

Table 2 Fixture Flow Rates for Non-Residential Buildings related to Question 2: Plumbing Fixtures and Fittings supporting Strategy 1: Energy & Water Efficient Buildings of the Climate Action Plan
Fixture Type Maximum Flow Rate
Showerheads 1.8 gpm @ 80 psi
Lavatory Faucets 0.35 gpm @60 psi
Kitchen Faucets 1.6 gpm @ 60 psi
Wash Fountains 1.6 [rim space(in.)/20 gpm @ 60 psi]
Metering Faucets 0.18 gallons/cycle
Metering Faucets for Wash Fountains 0.18 [rim space(in.)/20 gpm @ 60 psi]
Gravity Tank-type Water Closets 1.12 gallons/flush
Flushometer Tank Water Closets 1.12 gallons/flush
Flushometer Valve Water Closets 1.12 gallons/flush
Electromechanical Hydraulic Water Closets 1.12 gallons/flush
Urinals 0.5 gallons/flush Source: Adapted from the California Green Building Standards Code (CALGreen) Tier 1 non-residential voluntary measures shown in Tables A5.303.2.3.1 and A5.106.11.2.2, respectively. See the California Plumbing Code for definitions of each fixture type.
Where complying faucets are unavailable, aerators rated at 0.35 gpm or other means may be used to achieve reduction.
Acronyms: gpm = gallons per minute psi = pounds per square inch (unit of pressure) in. = inch
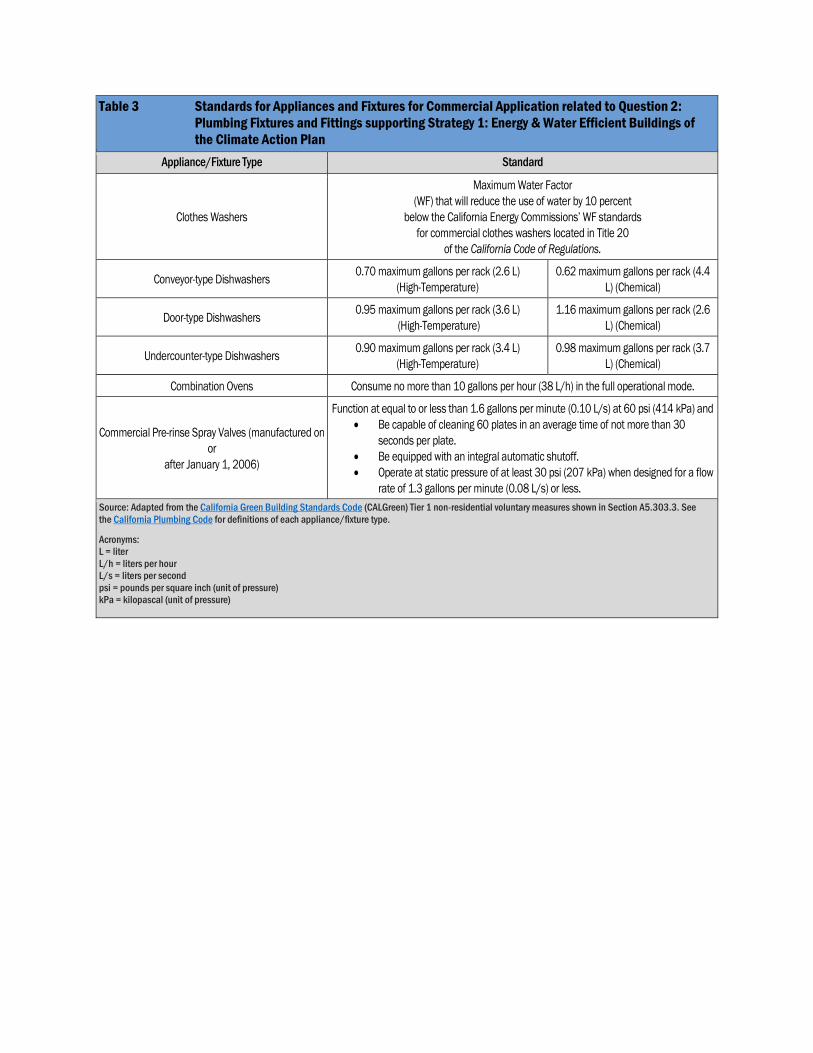
Table 3 Standards for Appliances and Fixtures for Commercial Application related to Question 2: Plumbing Fixtures and Fittings supporting Strategy 1: Energy & Water Efficient Buildings of the Climate Action Plan
Appliance/Fixture Type Standard
Clothes Washers
Maximum Water Factor (WF) that will reduce the use of water by 10 percent
below the California Energy Commissions’ WF standards for commercial clothes washers located in Title 20
of the California Code of Regulations.
Conveyor-type Dishwashers 0.70 maximum gallons per rack (2.6 L) (High-Temperature)
0.62 maximum gallons per rack (4.4 L) (Chemical)
Door-type Dishwashers 0.95 maximum gallons per rack (3.6 L) (High-Temperature)
1.16 maximum gallons per rack (2.6 L) (Chemical)
Undercounter-type Dishwashers 0.90 maximum gallons per rack (3.4 L) (High-Temperature)
0.98 maximum gallons per rack (3.7 L) (Chemical)
Combination Ovens Consume no more than 10 gallons per hour (38 L/h) in the full operational mode.
Commercial Pre-rinse Spray Valves (manufactured on or
after January 1, 2006)
Function at equal to or less than 1.6 gallons per minute (0.10 L/s) at 60 psi (414 kPa) and • Be capable of cleaning 60 plates in an average time of not more than 30
seconds per plate. • Be equipped with an integral automatic shutoff. • Operate at static pressure of at least 30 psi (207 kPa) when designed for a flow
rate of 1.3 gallons per minute (0.08 L/s) or less. Source: Adapted from the California Green Building Standards Code (CALGreen) Tier 1 non-residential voluntary measures shown in Section A5.303.3. See the California Plumbing Code for definitions of each appliance/fixture type.
Acronyms: L = liter L/h = liters per hour L/s = liters per second psi = pounds per square inch (unit of pressure) kPa = kilopascal (unit of pressure)
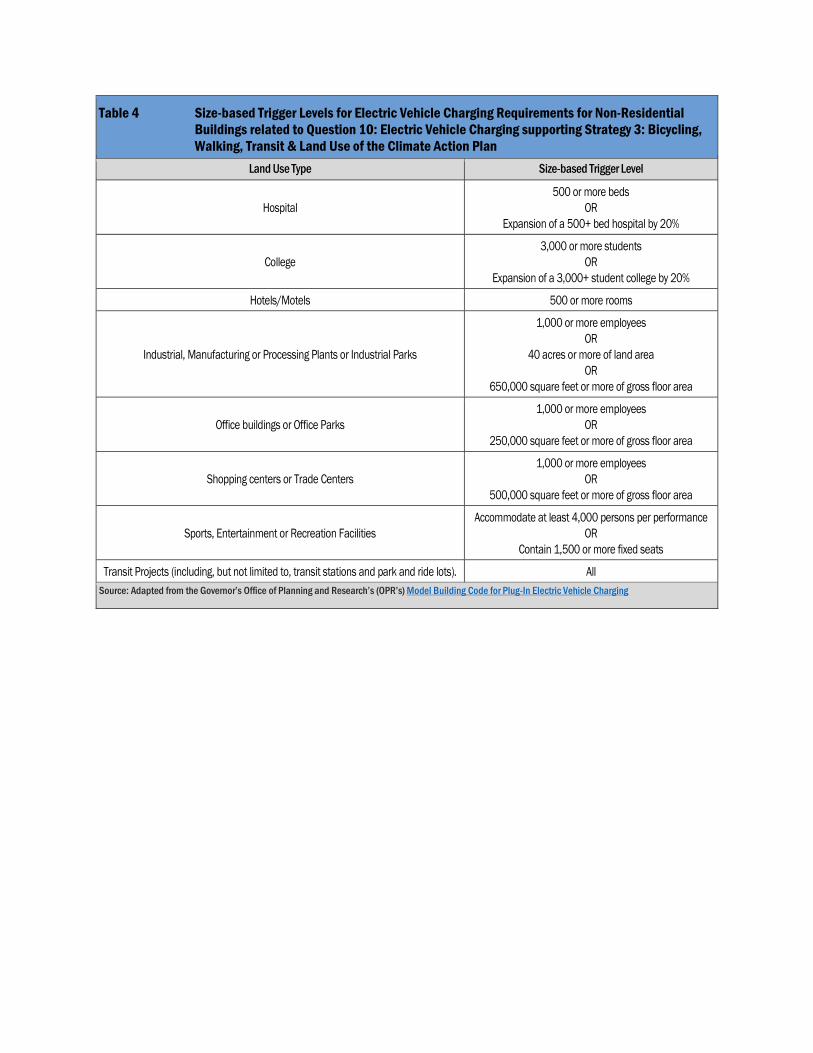
Table 4 Size-based Trigger Levels for Electric Vehicle Charging Requirements for Non-Residential Buildings related to Question 10: Electric Vehicle Charging supporting Strategy 3: Bicycling, Walking, Transit & Land Use of the Climate Action Plan
Land Use Type Size-based Trigger Level
Hospital 500 or more beds
OR Expansion of a 500+ bed hospital by 20%
College 3,000 or more students
OR Expansion of a 3,000+ student college by 20%
Hotels/Motels 500 or more rooms
Industrial, Manufacturing or Processing Plants or Industrial Parks
1,000 or more employees OR
40 acres or more of land area OR
650,000 square feet or more of gross floor area
Office buildings or Office Parks 1,000 or more employees
OR 250,000 square feet or more of gross floor area
Shopping centers or Trade Centers 1,000 or more employees
OR 500,000 square feet or more of gross floor area
Sports, Entertainment or Recreation Facilities Accommodate at least 4,000 persons per performance
OR Contain 1,500 or more fixed seats
Transit Projects (including, but not limited to, transit stations and park and ride lots). All Source: Adapted from the Governor’s Office of Planning and Research’s (OPR’s) Model Building Code for Plug-In Electric Vehicle Charging
Related Documents