Loop 360 Improvement Study LOOP 360 IMPROVEMENT STUDY November 2015

Welcome message from author
This document is posted to help you gain knowledge. Please leave a comment to let me know what you think about it! Share it to your friends and learn new things together.
Transcript

Loop 360 Improvement Study
LOOP 360 IMPROVEMENT STUDY
November 2015
Loop 360 Improvement Study
Loop 360 Study Overview
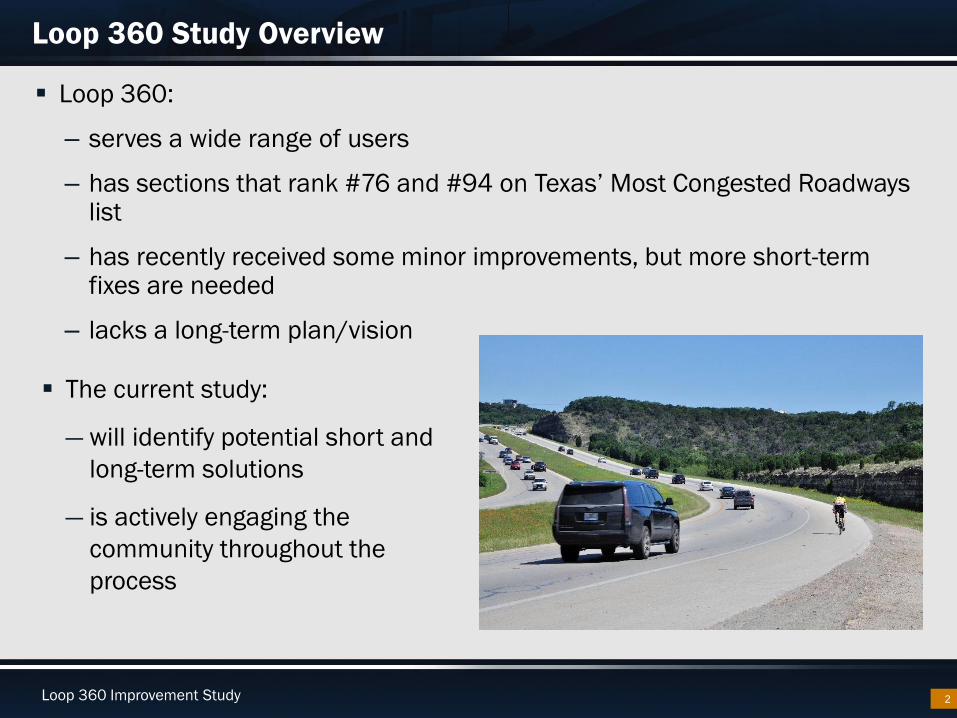
Loop 360:
– serves a wide range of users
– has sections that rank #76 and #94 on Texas’ Most Congested Roadways list
– has recently received some minor improvements, but more short-term fixes are needed
– lacks a long-term plan/vision
2
The current study:
— will identify potential short and
long-term solutions
— is actively engaging the
community throughout the
process
Loop 360 Improvement Study
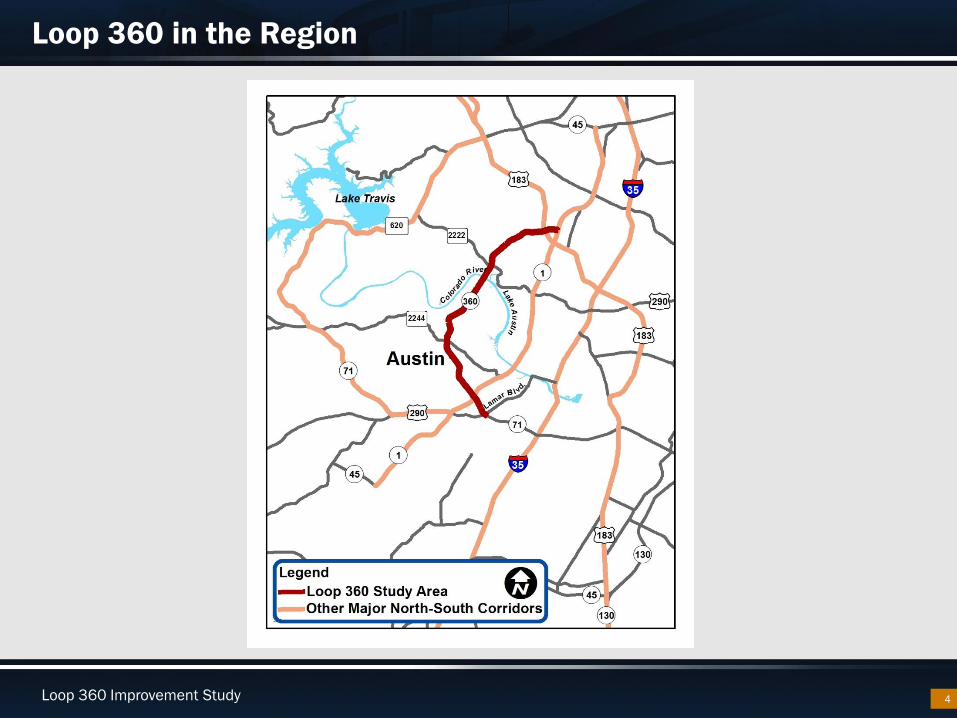
Loop 360 in the Region
4

Loop 360 Improvement Study
Loop 360 Improvement Study Process
4
Loop 360 Improvement Study
Stakeholder Engagement
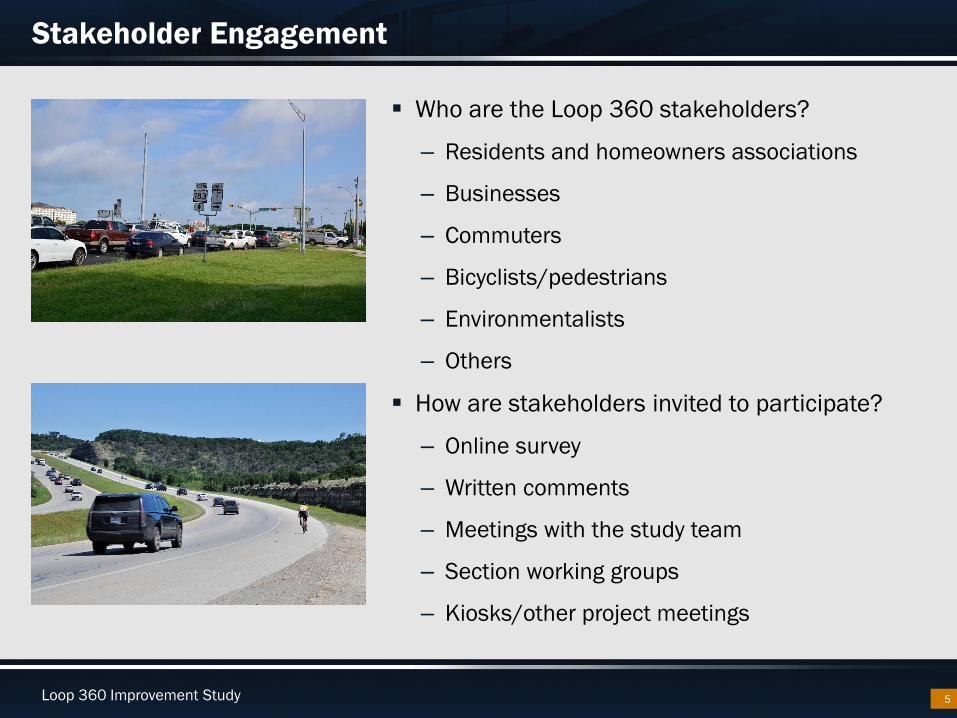
Who are the Loop 360 stakeholders?
– Residents and homeowners associations
– Businesses
– Commuters
– Bicyclists/pedestrians
– Environmentalists
– Others
How are stakeholders invited to participate?
– Online survey
– Written comments
– Meetings with the study team
– Section working groups
– Kiosks/other project meetings
5

Loop 360 Improvement Study
Who Responded to the Loop 360 Survey?
6
3,641 completed surveys from 85
unique zip codes
57% came from the five zip codes
directly surrounding the study area
(78730, 78731, 78746, 78750,
78759)
39% stated they live along the Loop
360 corridor, while 61% stated they
do not

Loop 360 Improvement Study
How Does Loop 360 Traffic Affect Survey Respondents who Live Along the Corridor?
7
0% 20% 40% 60% 80% 100%
Loop 360 traffic does not affect my neighborhood
directly
Other
Difficulty walking or biking to and from my
neighborhood
Increase in traffic violations due to traffic congestion
Difficulty crossing Loop 360 to get to schools or other
destinations
Cars cutting through neighborhoods to avoid
mainlane traffic
Longer wait time to enter/exit your community
Longer travel times along 360
How does the traffic on Loop 360 impact you?
Loop 360 Improvement Study
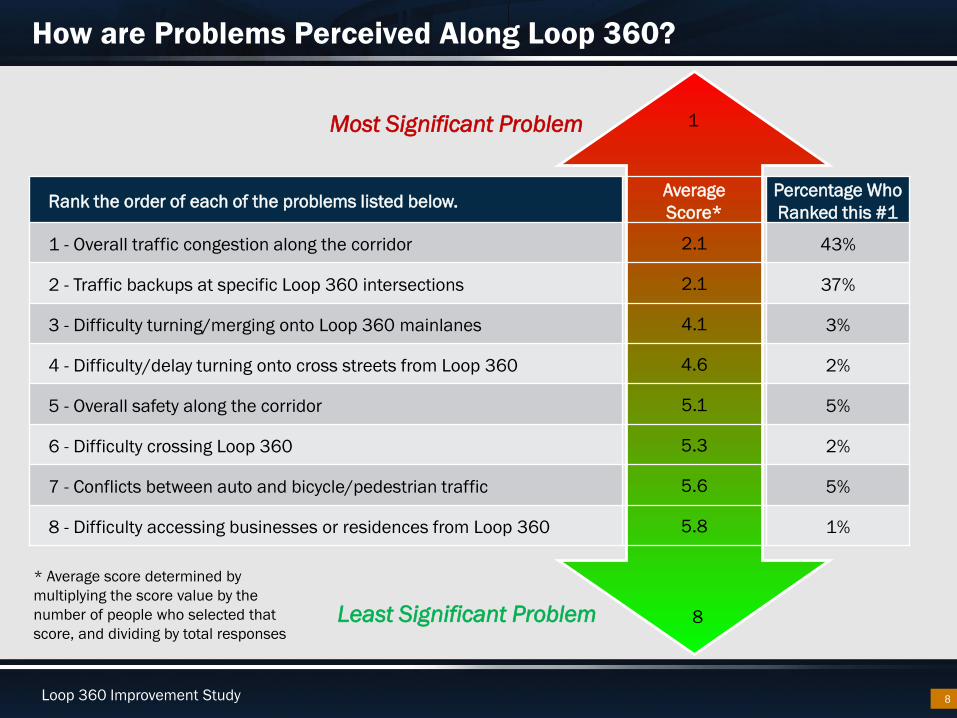
How are Problems Perceived Along Loop 360?
8
Least Significant Problem
Most Significant Problem
8
1
Rank the order of each of the problems listed below.Average
Score*
Percentage Who
Ranked this #1
1 - Overall traffic congestion along the corridor 2.1 43%
2 - Traffic backups at specific Loop 360 intersections 2.1 37%
3 - Difficulty turning/merging onto Loop 360 mainlanes 4.1 3%
4 - Difficulty/delay turning onto cross streets from Loop 360 4.6 2%
5 - Overall safety along the corridor 5.1 5%
6 - Difficulty crossing Loop 360 5.3 2%
7 - Conflicts between auto and bicycle/pedestrian traffic 5.6 5%
8 - Difficulty accessing businesses or residences from Loop 360 5.8 1%
* Average score determined by
multiplying the score value by the
number of people who selected that
score, and dividing by total responses
Loop 360 Improvement Study
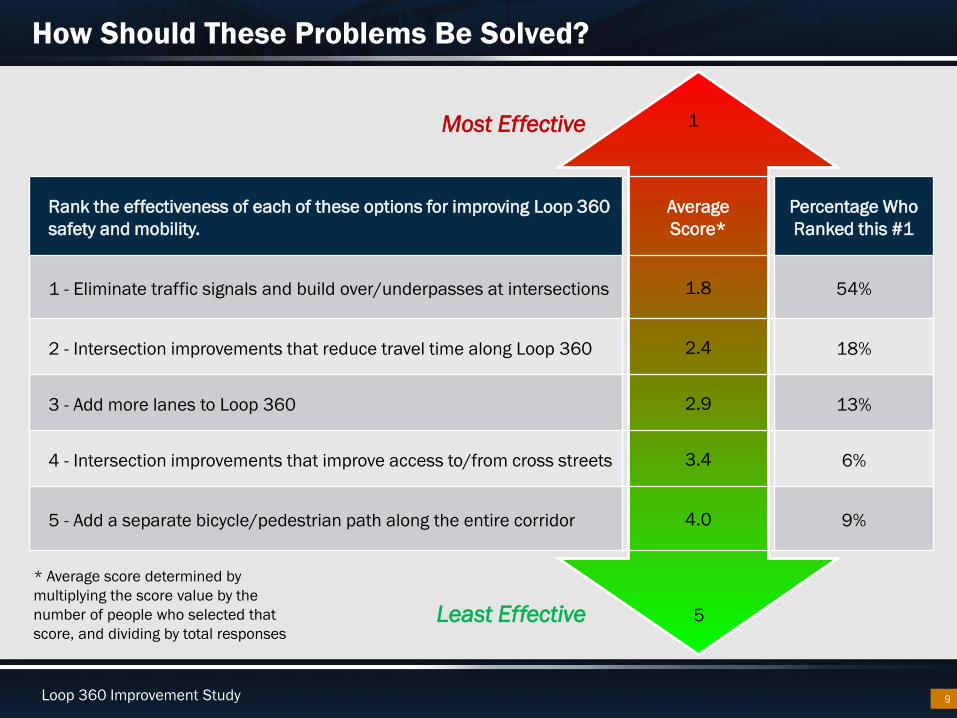
How Should These Problems Be Solved?
9
Least Effective
Most Effective
5
1
Rank the effectiveness of each of these options for improving Loop 360
safety and mobility.
Average
Score*
Percentage Who
Ranked this #1
1 - Eliminate traffic signals and build over/underpasses at intersections 1.8 54%
2 - Intersection improvements that reduce travel time along Loop 360 2.4 18%
3 - Add more lanes to Loop 360 2.9 13%
4 - Intersection improvements that improve access to/from cross streets 3.4 6%
5 - Add a separate bicycle/pedestrian path along the entire corridor 4.0 9%
* Average score determined by
multiplying the score value by the
number of people who selected that
score, and dividing by total responses

Loop 360 Improvement Study
Scenario Development
What is a scenario?
– Models/assesses the possible outcomes of
implementing a certain set of improvements
– Represents a broad range of possible improvement
options for comparison purposes only
– Is not a specific project recommendation
How were the scenarios developed?
– Data analysis of projected traffic volumes, levels of
service, travel times
– Stakeholder input
– Best practices from across the state and nation
10
Loop 360 Improvement Study
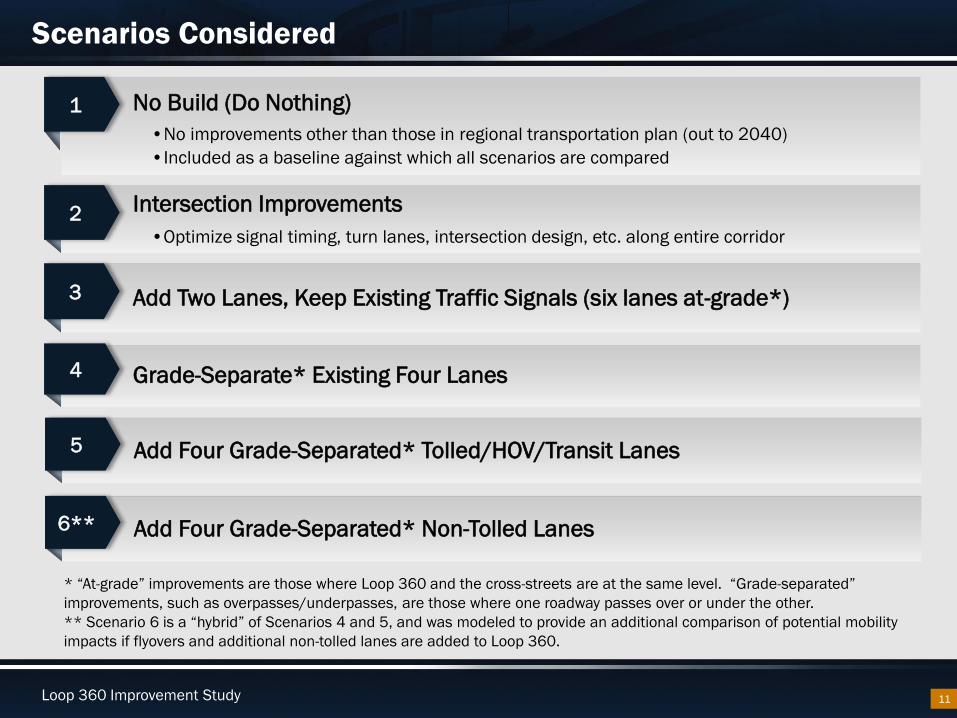
Scenarios Considered
11
Intersection Improvements
•Optimize signal timing, turn lanes, intersection design, etc. along entire corridor
2
No Build (Do Nothing)
•No improvements other than those in regional transportation plan (out to 2040)
•Included as a baseline against which all scenarios are compared
1
Add Four Grade-Separated* Tolled/HOV/Transit Lanes5
Add Two Lanes, Keep Existing Traffic Signals (six lanes at-grade*)3
Grade-Separate* Existing Four Lanes4
Add Four Grade-Separated* Non-Tolled Lanes6**
* “At-grade” improvements are those where Loop 360 and the cross-streets are at the same level. “Grade-separated”
improvements, such as overpasses/underpasses, are those where one roadway passes over or under the other.
** Scenario 6 is a “hybrid” of Scenarios 4 and 5, and was modeled to provide an additional comparison of potential mobility
impacts if flyovers and additional non-tolled lanes are added to Loop 360.
Loop 360 Improvement Study
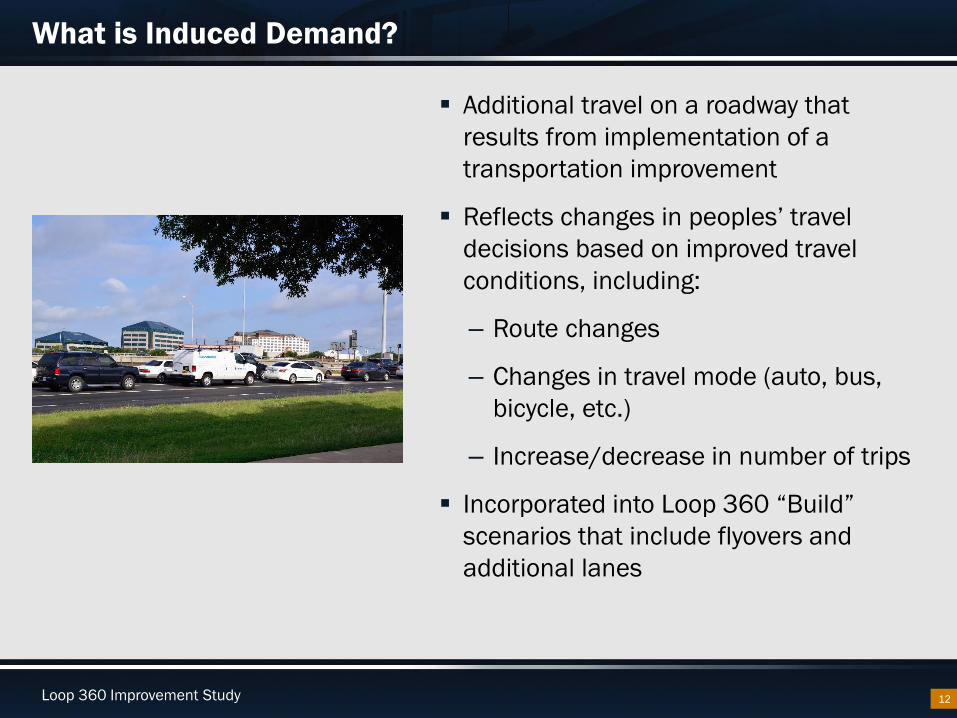
What is Induced Demand?
Additional travel on a roadway that
results from implementation of a
transportation improvement
Reflects changes in peoples’ travel
decisions based on improved travel
conditions, including:
– Route changes
– Changes in travel mode (auto, bus,
bicycle, etc.)
– Increase/decrease in number of trips
Incorporated into Loop 360 “Build”
scenarios that include flyovers and
additional lanes
12

Loop 360 Improvement Study
Scenario Assumption Summary
13
Scenario
Optimized
Traffic
Signals
Optimized
Intersections
Total At-
Grade,
Signalized
Non-Tolled
Lanes
Total Grade-
Separated
Non-Tolled
Lanes
Total Grade-
Separated
Tolled/HOV/
Transit
Lanes
Flyovers at
US 183N
and South
MoPac
Induced
Demand
from Added
Capacity
Scenario 1 – No Build 4
Scenario 2 – Intersection
Improvements 4
Scenario 3 - Add Two
Lanes, Keep Existing
Traffic Signals 6
Scenario 4 – Grade-
Separate Existing Four
Lanes* * 4
Scenario 5 - Add Four
Grade-Separated
Tolled/HOV/Transit Lanes* * 4 4
Scenario 6 - Add Four
Grade-Separated Non-
Tolled Lanes* * 4 4
* Traffic signals at the intersections of the ramps and the crossing routes at overpasses and underpasses would be optimized to the greatest extent
possible.
Loop 360 Improvement Study
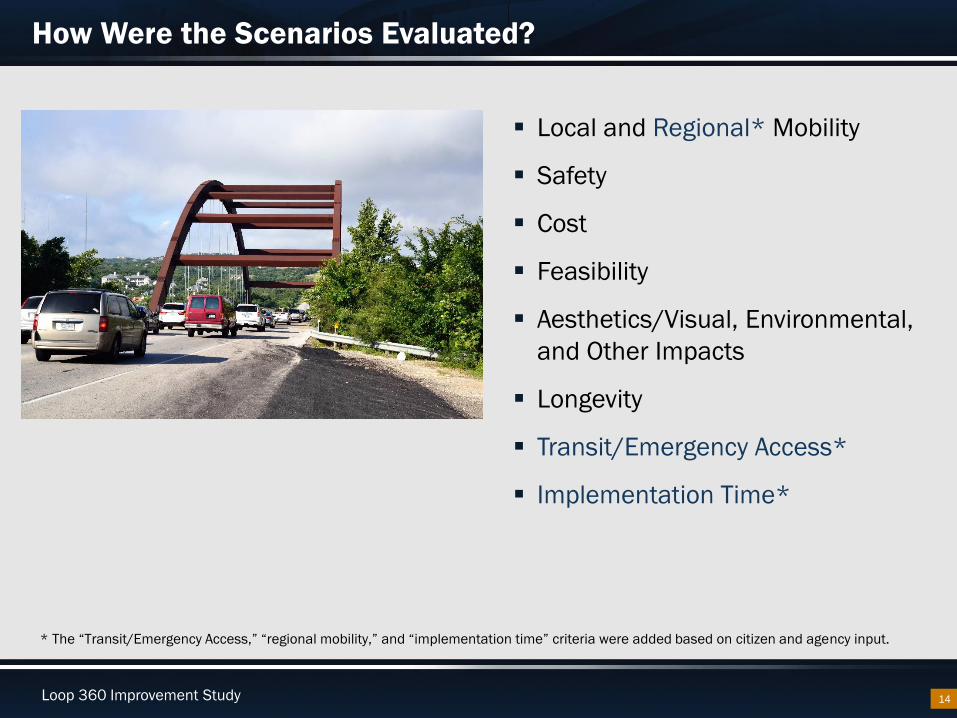
How Were the Scenarios Evaluated?
Local and Regional* Mobility
Safety
Cost
Feasibility
Aesthetics/Visual, Environmental,
and Other Impacts
Longevity
Transit/Emergency Access*
Implementation Time*
14
* The “Transit/Emergency Access,” “regional mobility,” and “implementation time” criteria were added based on citizen and agency input.
Loop 360 Improvement Study
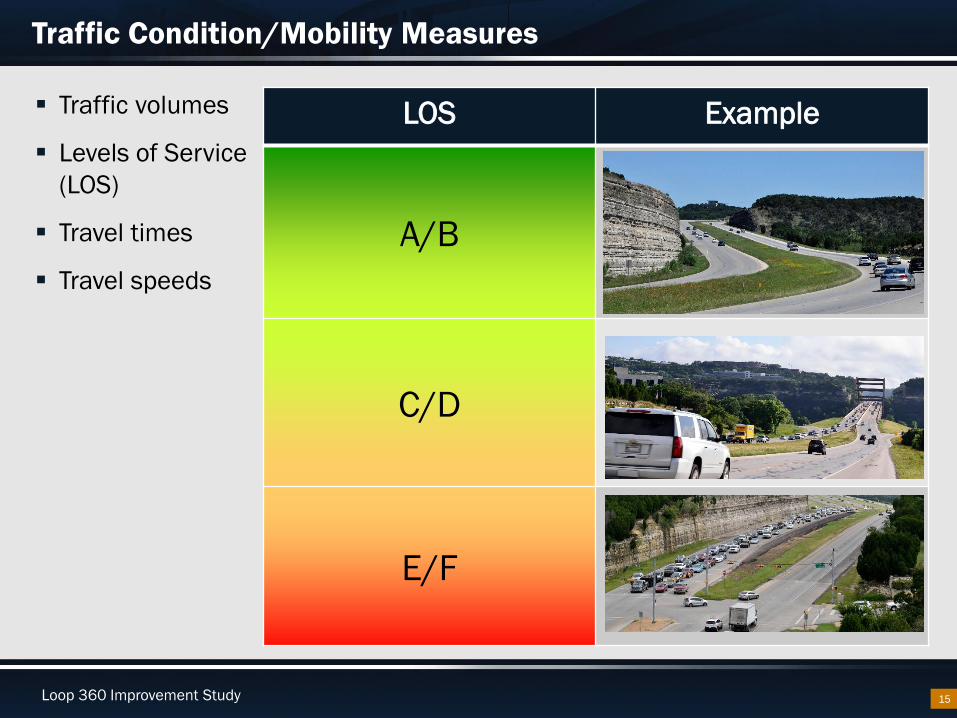
Traffic Condition/Mobility Measures
Traffic volumes
Levels of Service
(LOS)
Travel times
Travel speeds
15
LOS Example
A/B
C/D
E/F
Loop 360 Improvement Study
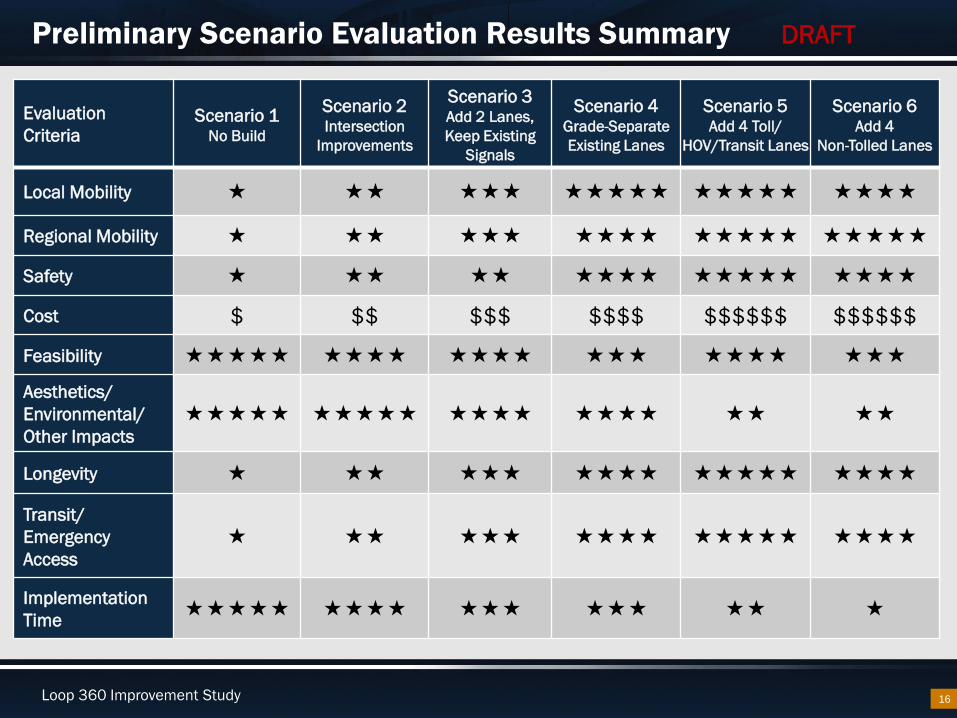
Preliminary Scenario Evaluation Results Summary
16
Evaluation
CriteriaScenario 1
No Build
Scenario 2Intersection
Improvements
Scenario 3Add 2 Lanes,
Keep Existing
Signals
Scenario 4Grade-Separate
Existing Lanes
Scenario 5Add 4 Toll/
HOV/Transit Lanes
Scenario 6Add 4
Non-Tolled Lanes
Local Mobility
Regional Mobility
Safety
Cost $ $$ $$$ $$$$ $$$$$$ $$$$$$
Feasibility
Aesthetics/
Environmental/
Other Impacts
Longevity
Transit/
Emergency
Access
Implementation
Time
DRAFT

Loop 360 Improvement Study
Next Steps
17
Develop draft study report:
November 2015 – January 2016
Release draft study report for public
review and comment:
February-March 2016
Prepare and present final study
report: May 2016
Loop 360 Improvement Study
QUESTIONS?
www.Loop360Study.com
18
Related Documents
![Autodesk Fusion 360 Security Whitepaper Final[2]help.autodesk.com.s3.amazonaws.com/sfdcarticles/kA23A000000mg9S... · Fusion 360 provides end users with the option to use multi-factor](https://static.cupdf.com/doc/110x72/5e1d6c3152f8d255a65df47f/autodesk-fusion-360-security-whitepaper-final2help-fusion-360-provides-end-users.jpg)


![Autodesk Fusion 360 Security Whitepaper Final[2]...Autodesk Fusion 360 Security Whitepaper September 2018 1 trust.autodesk.com Introduction Autodesk® Fusion 360 is the first 3D CAD,](https://static.cupdf.com/doc/110x72/5f4942ce16d09b63341d26d0/autodesk-fusion-360-security-whitepaper-final2-autodesk-fusion-360-security.jpg)