Cluster Comput DOI 10.1007/s10586-009-0096-9 Filtering intrusion detection alarms Nashat Mansour · Maya I. Chehab · Ahmad Faour Received: 8 July 2009 / Accepted: 10 July 2009 © Springer Science+Business Media, LLC 2009 Abstract A Network Intrusion Detection System (NIDS) is an alarm system for networks. NIDS monitors all network actions and generates alarms when it detects suspicious or malicious attempts. A false positive alarm is generated when the NIDS misclassifies a normal action in the network as an attack. We present a data mining technique to assist network administrators to analyze and reduce false positive alarms that are produced by a NIDS. Our data mining technique is based on a Growing Hierarchical Self-Organizing Map (GHSOM) that adjusts its architecture during an unsuper- vised training process according to the characteristics of the input alarm data. GHSOM clusters these alarms in a way that supports network administrators in making decisions about true and false alarms. Our empirical results show that our technique is effective for real-world intrusion data. Keywords Alarm filtering · Computer security · Growing hierarchical self-organizing map · Intrusion detection · Self-organizing map 1 Introduction A network intrusion detection system (NIDS) is a burglar alarm system for the network. It is designed to monitor all N. Mansour ( ) · M.I. Chehab Department of Computer Science and Mathematics, Lebanese American University, Beirut, Lebanon e-mail: [email protected] M.I. Chehab e-mail: [email protected] A. Faour Lebanese University, Beirut, Lebanon e-mail: [email protected] inbound and outbound network actions and to detect suspi- cious patterns that might indicate attempts to breach secu- rity, which is referred to as a system attack. The NIDS uses the audit data; an audit trail is a record of actions on a system that are logged to a file in chronologically sorted order. The alarms generated by a NIDS inform network administrators that their network is possibly under attack. But, NIDS might generate “false positives”, i.e., “false alarms”, and the con- fidence in the capability of a NIDS to protect the network is based on eliminating false alarms. Hence, we need more intelligent attack analysis. Several techniques have been proposed to analyze alarms and reduce false positives. Julisch and Dacier [3] handled alarms by identifying root causes and removing them. Cup- pens et al. [1] analyzed alarms by implementing functions to manage, cluster, merge and correlate alarms. Ning and Xu [10] presented techniques that automatically learn attack strategies as acyclic graphs and extract them from correlated intrusion alarms. Kruegel et al. [7] performed real-time veri- fication of attacks in which the NIDS reduces the priority of non real attacks and, thus, differentiates between false and non-relevant alarms. Rachman [12] positioned a data min- ing layer, to represent the baseline of security system de- ployment and to analyze new data against this baseline, as an analysis layer within NIDS. Moreover, a few papers re- ported using self-organizing maps (SOM) for intrusion de- tection [4, 5, 8, 14, 15]. However, Faour et al. [2] proposed Self-Organizing Maps (SOM) coupled with Bayesian net- works for alarm filtering. But, their SOM work resulted in fixed network architecture in terms of number and map units arrangement. In this work, we propose, for the first time, adapting the growing hierarchical SOM (GHSOM) approach for the problem of alarm filtering. The GHSOM is introduced as a

Welcome message from author
This document is posted to help you gain knowledge. Please leave a comment to let me know what you think about it! Share it to your friends and learn new things together.
Transcript

Cluster ComputDOI 10.1007/s10586-009-0096-9
Filtering intrusion detection alarms
Nashat Mansour · Maya I. Chehab · Ahmad Faour
Received: 8 July 2009 / Accepted: 10 July 2009© Springer Science+Business Media, LLC 2009
Abstract A Network Intrusion Detection System (NIDS) isan alarm system for networks. NIDS monitors all networkactions and generates alarms when it detects suspicious ormalicious attempts. A false positive alarm is generated whenthe NIDS misclassifies a normal action in the network as anattack. We present a data mining technique to assist networkadministrators to analyze and reduce false positive alarmsthat are produced by a NIDS. Our data mining techniqueis based on a Growing Hierarchical Self-Organizing Map(GHSOM) that adjusts its architecture during an unsuper-vised training process according to the characteristics of theinput alarm data. GHSOM clusters these alarms in a waythat supports network administrators in making decisionsabout true and false alarms. Our empirical results show thatour technique is effective for real-world intrusion data.
Keywords Alarm filtering · Computer security · Growinghierarchical self-organizing map · Intrusion detection ·Self-organizing map
1 Introduction
A network intrusion detection system (NIDS) is a burglaralarm system for the network. It is designed to monitor all
N. Mansour (�) · M.I. ChehabDepartment of Computer Science and Mathematics,Lebanese American University, Beirut, Lebanone-mail: [email protected]
M.I. Chehabe-mail: [email protected]
A. FaourLebanese University, Beirut, Lebanone-mail: [email protected]
inbound and outbound network actions and to detect suspi-cious patterns that might indicate attempts to breach secu-rity, which is referred to as a system attack. The NIDS usesthe audit data; an audit trail is a record of actions on a systemthat are logged to a file in chronologically sorted order. Thealarms generated by a NIDS inform network administratorsthat their network is possibly under attack. But, NIDS mightgenerate “false positives”, i.e., “false alarms”, and the con-fidence in the capability of a NIDS to protect the networkis based on eliminating false alarms. Hence, we need moreintelligent attack analysis.
Several techniques have been proposed to analyze alarmsand reduce false positives. Julisch and Dacier [3] handledalarms by identifying root causes and removing them. Cup-pens et al. [1] analyzed alarms by implementing functionsto manage, cluster, merge and correlate alarms. Ning andXu [10] presented techniques that automatically learn attackstrategies as acyclic graphs and extract them from correlatedintrusion alarms. Kruegel et al. [7] performed real-time veri-fication of attacks in which the NIDS reduces the priority ofnon real attacks and, thus, differentiates between false andnon-relevant alarms. Rachman [12] positioned a data min-ing layer, to represent the baseline of security system de-ployment and to analyze new data against this baseline, asan analysis layer within NIDS. Moreover, a few papers re-ported using self-organizing maps (SOM) for intrusion de-tection [4, 5, 8, 14, 15]. However, Faour et al. [2] proposedSelf-Organizing Maps (SOM) coupled with Bayesian net-works for alarm filtering. But, their SOM work resulted infixed network architecture in terms of number and map unitsarrangement.
In this work, we propose, for the first time, adaptingthe growing hierarchical SOM (GHSOM) approach for theproblem of alarm filtering. The GHSOM is introduced as a

Cluster Comput
data mining, decision support layer for network administra-tors to explore alarm patterns. GHSOM presents an unsuper-vised learning approach that does not assume prior knowl-edge of the structure of the data. We design the GHSOMelements and parameters in order to explore hidden struc-ture in the alarm data and to uncover false positive and falsenegative alarms. We empirically show, using real world datathat our proposed technique competes well with SOM. Eachhierarchical level in GHSOM reveals a further explorationto one or more data cluster available in the preceding higherlevel. The maps in GHSOM architecture grow adaptivelyto fit input data. We show that further clustering offered byGHSOM uncovers attack vectors hiding in normal clusters.That is, it reduces false negatives produced by the NIDS. Inaddition, it splits attack clusters to normal and attack clustersand thus reduces false positives.
The rest of the paper is organized as follows. Section 2provides a background on SOM and GHSOM. Section 3 ex-plains the design of GHSOM for alarm filtering. Section 4presents and discusses our empirical results. Section 5 con-cludes the paper.
2 Background on SOM and GHSOM
The self-organizing map (SOM), proposed by Kohonen [6],is an unsupervised, competitive learning algorithm that re-duces the dimensions of data by mapping high dimensionaldata onto a set of units/neurons set up in a 2-dimensionallattice. The number of units in the lattice, U , is selected bythe designer based on the number of clusters expected to bereturned, which assumes some prior knowledge. Each unitin this pattern is associated with a weight vector having asimilar dimensionality with that of the input space. The dis-tance between two units in the pattern indicates the level ofsimilarity of the data in the units. Based on this similarity,cluster structures of the data are identified.
An n-dimensional weight vector is associated with eachunit, having the same dimension of the input space. At eachstep, the Euclidean distances between a randomly selectedinput vector x and all the units weight vectors wi is cal-culated. The unit having the shortest distance to the inputvector is identified to be the best matching unit c for x. Asa result, the winner index c or best matching unit for inputvector x(t) is identified using the following condition:
‖x(t) − wc(t)‖ ≤ ‖x(t) − wi(t)‖ for i = 1,2, . . . ,U
i.e. c = mini
{‖x(t) − wi(t)‖} (1)
where t represents time and wi represents the weight vectorof the i-th unit. Thus, the input is mapped to the location ofthe best matching unit (BMU).
Next, we update the weight vectors of the units adjacentto BMU, c, and of the BMU itself. Geometrically speaking,the weight vector of each best matching unit represents acluster center. It is updated to gradually reduce the differ-ence between this BMU and the input vector x. The unitweight vectors are updated according to the expression:
wi(t + 1) = wi(t) + δ(t)[(x(t) − wi(t)]Nc(x),i
for i = c and its neighbors (2)
where δ(t) is the learning rate function; Nc(x),i is the neigh-borhood function, which is a function for reducing the dis-tance between the i-th and c-th (best matching) units on themap grid. Its value influences the number of units affectedby adaptation as well as the strength of adaptation itself. Af-ter the learning process, in which BMUs are identified andweight vectors are adapted, objects are assigned to their re-spective best matching units such that similar data items areprojected onto units close to one another.
However, when using the SOM, the network size and ar-chitecture have to be predetermined. Therefore the trainingprocess has to be repeated multiple times on different sizesof SOM to empirically find the most appropriate networkarchitecture for a given application. Another disadvantageof the fixed grid in SOM is that the projection does not in-tuitively represent hierarchical relation that may be presentin the data. To resolve both limitations of SOM, GrowingHierarchical Self-organizing map (GHSOM) has been de-veloped as a multi-layered hierarchical architecture thatadapts its structure according to the input data [13]; eachlayer consists of a number of independent SOMs. Startingwith the initial layer, layer-0, of the hierarchy, representingthe complete data set, each map is initialized with four unitsand grows in size to reveal a portion of the data at a cer-tain level of detail. Moreover, each unit in the map mightbe dynamically expanded down the hierarchy by adding anew map of four units at a subsequent (lower) layer reveal-ing a further detailed representation of data if required. Eachof these maps grows in size until it achieves an improvementin the quality of data representation. Therefore, the GHSOMis adaptive and aims to uncover the hierarchical structure inthe data in addition to allocating extra space to represent dataclearly.
The GHSOM architecture starts with a 2 × 2 map atlayer-0, having its weight vectors initialized to random val-ues and trained according to SOM training algorithm. Tocontrol the growth of the map, the mean quantization error isused as a quality measure for data representation. The meanquantization error of a unit i is calculated as follows
mqei = (1/ΠC)∑
‖wi − xj‖,for xj ∈ Ci , ΠC = |Ci |, Ci �= ∅ (3)
Cluster Comput
where wi is the weight vector of the unit i, and ΠC is thenumber of input vectors xj that are projected to unit i, andCi is the set of input vectors in unit i. However for the layer0 map, the mean quantization error mqe0 equals to
mqe0 = (1/Π)∑
‖m0 − xi‖, for xi ∈ I , Π = |I | (4)
where Π is the number of data vectors x in I, I is the inputdata set, and m0 denotes the mean of the input data.
The quantization error (MQEm) of map m is defined as
MQEm = 1/Um
∑mqei , for i ∈ U , Um = |U | (5)
where U is the subset of the map units onto which datais mapped. The growing process is continued until MQEm
reaches a certain fraction α1 of the mqeu of unit u, where u
is the corresponding parent unit in the upper layer. That is,the stopping criterion for the growth of a map m is
MQEm < α1 · mqeu (6)
where α1 controls the breadth of maps and its value rangesfrom 0 to 1. In case of the first-layer map, to stop the growth,the criterion is
MQE1 < α1 · mqe0 (7)
mqe of all units is calculated according to expression (3).If the criterion in expression (7) is not satisfied, further
data representation is required. Thus, more units should beadded to provide better data representation in larger mapspace. The unit with the highest mqe is selected to be theerror unit (e) according to
e = maxi
(∑‖wi − xj‖
),
for xj ∈ Ci ΠC = |Ci |, Ci �= ∅ (8)
where wi is the weight vector of unit i, xj is the set of inputvectors projected onto unit i, and Ci is the subset of vectorsxj . Next is selected its most dissimilar neighboring unit d
according to
d = maxi
(‖we − wj‖), wi ∈ Ne (9)
where we is the weight vector of the error unit, Ne is the setof neighboring units of e, and wi refers to the set of weightvectors of all neighboring units of e (i.e., in set Ne). A newrow or column of units is slipped in between e and d . More-over, we initialize the weight vectors of newly added unitswith the mean of their corresponding neighbors.
For the hierarchical growth, the global termination crite-rion is given by
mqei < α2 · mqe0 (10)
where α2 controls the depth of maps and its value rangesfrom 0 to 1. Every unit in the map has to be checked. Unitshaving high mqe, i.e., that do not satisfy the criterion of ex-pression (10), need to represent data in a further detailedmanner. This can be achieved by expanding the unit havinghigh mqe to form a new map at a lower layer.
3 GHSOM for alarm filtering
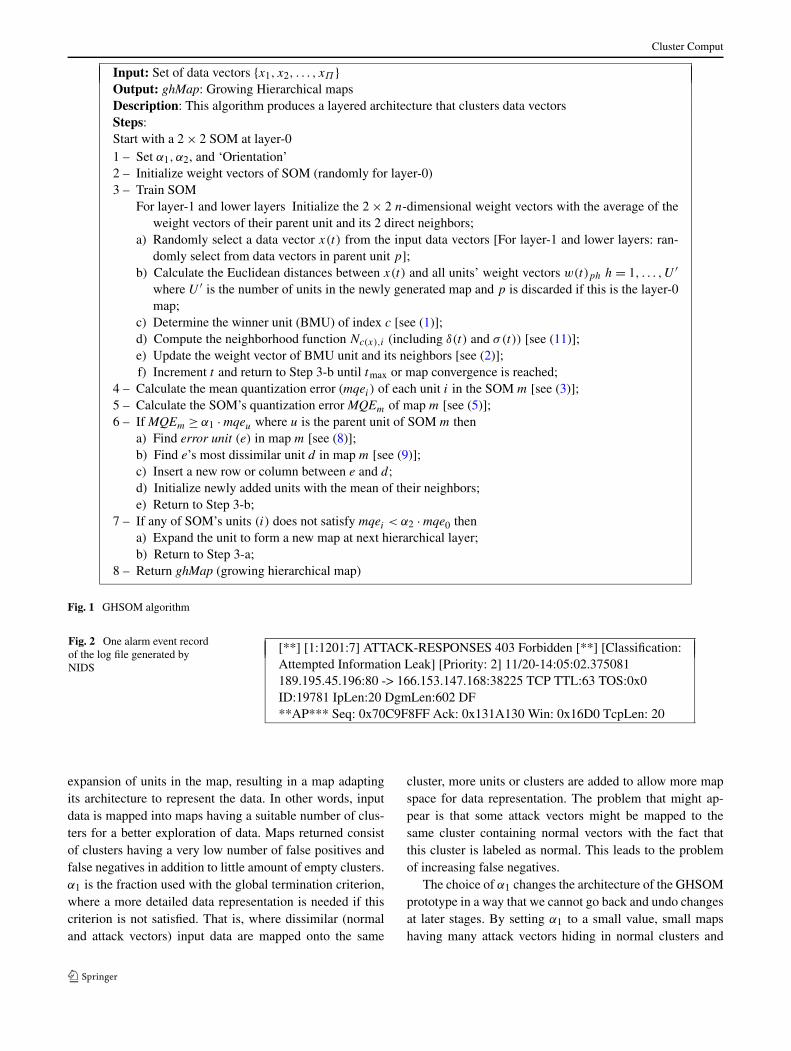
An outline of the GHSOM algorithm is given in Fig. 1 andthe following sections describe how to adapt GHSOM forthe alarm filtering problem.
3.1 Input data vectors
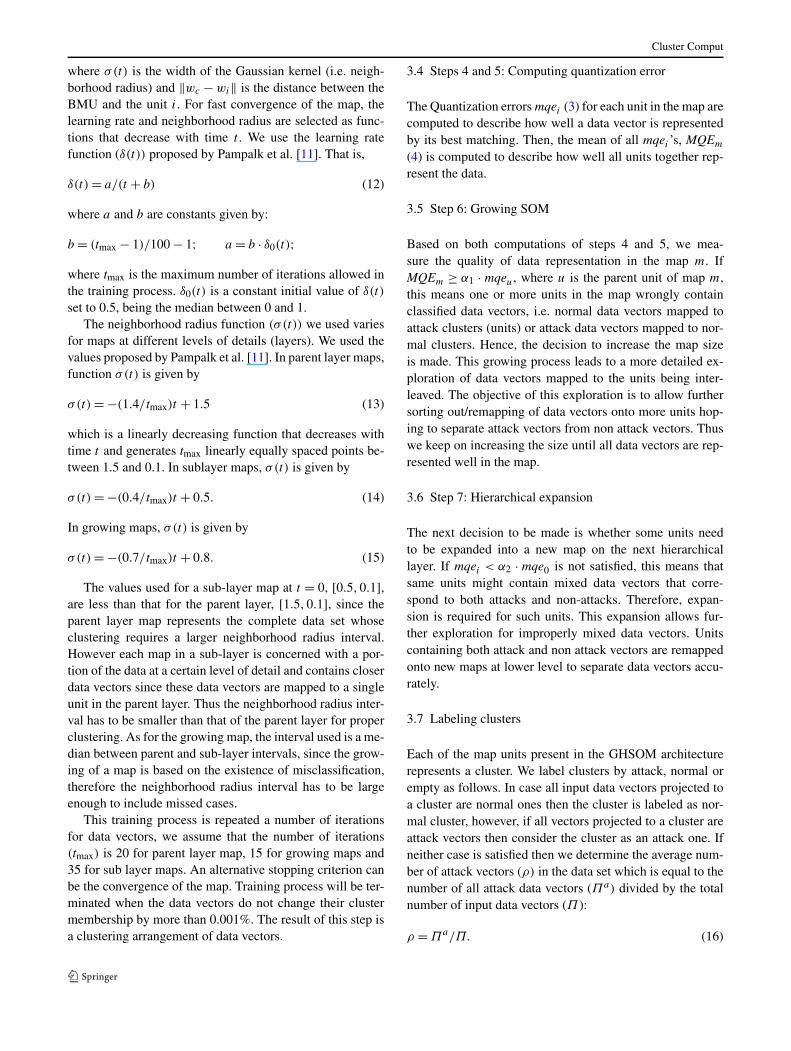
Alarm event records are retrieved from log files generatedby a network intrusion detection system. Ω records are pro-duced by many external machines (with IPext) trying to con-nect to a number of internal machines (with IPint). An ex-ample of such log files is depicted in Fig. 2 and its use isexplained in Table 1.
For a certain interval (window) of time, the number ofalarms of type i for each pair (IPint, IPext) is calculated.As a result, an aggregated alarm data vector (AADV) isrepresented as follows: [window, IPext, IPint, N1, . . . ,NX],where window represents an interval of time, IPext repre-sents the IP of external machines, IPint represents the IP ofinternal machines, and N1, . . . ,NX represents the numberof alarms of type 1, . . . ,X. Π aggregated alarm data vec-tors are derived from the Ω alarm event records such thatΠ = Πa +Πn where Πa is the number of attack alarm datavectors and Πn is the number of normal alarm data vectors.However, the window, IPext and IPint are insignificant forclassifying alarms. Hence the AADV is represented by thevector [N1, . . . ,NX], where we assume X different types ofdetected alarms, including y real attack scenarios (the otherscenarios are normal scenarios). Henceforth, we refer to theAADV as simply data vector.
The domain expert considers an attack scenario as a se-ries of alarm events proceeding within an interval of timefor each couple (IPext, IPint). For example, in our experi-mental data, scenario 1 series of alarm events is presentedin Table 1. Also the domain expert formed the scenarios forspecific (overlapping) interval of times described in Table 2.These scenarios can be associated with real attacks or nor-mal user behavior. The domain expert would identify whichscenarios belong to which category. A typical record is il-lustrated in Table 3.
3.2 Step 1: Determining α1, determining α2, andorientation parameter
Parameter α1 contributes efficiently in the decision ofadding new clusters to the produced maps. α1 controls the
Cluster Comput
Input: Set of data vectors {x1, x2, . . . , xΠ }Output: ghMap: Growing Hierarchical mapsDescription: This algorithm produces a layered architecture that clusters data vectorsSteps:Start with a 2 × 2 SOM at layer-01 – Set α1, α2, and ‘Orientation’2 – Initialize weight vectors of SOM (randomly for layer-0)3 – Train SOM
For layer-1 and lower layers Initialize the 2 × 2 n-dimensional weight vectors with the average of theweight vectors of their parent unit and its 2 direct neighbors;
a) Randomly select a data vector x(t) from the input data vectors [For layer-1 and lower layers: ran-domly select from data vectors in parent unit p];
b) Calculate the Euclidean distances between x(t) and all units’ weight vectors w(t)ph h = 1, . . . ,U ′where U ′ is the number of units in the newly generated map and p is discarded if this is the layer-0map;
c) Determine the winner unit (BMU) of index c [see (1)];d) Compute the neighborhood function Nc(x),i (including δ(t) and σ(t)) [see (11)];e) Update the weight vector of BMU unit and its neighbors [see (2)];f) Increment t and return to Step 3-b until tmax or map convergence is reached;
4 – Calculate the mean quantization error (mqei ) of each unit i in the SOM m [see (3)];5 – Calculate the SOM’s quantization error MQEm of map m [see (5)];6 – If MQEm ≥ α1 · mqeu where u is the parent unit of SOM m then
a) Find error unit (e) in map m [see (8)];b) Find e’s most dissimilar unit d in map m [see (9)];c) Insert a new row or column between e and d;d) Initialize newly added units with the mean of their neighbors;e) Return to Step 3-b;
7 – If any of SOM’s units (i) does not satisfy mqei < α2 · mqe0 thena) Expand the unit to form a new map at next hierarchical layer;b) Return to Step 3-a;
8 – Return ghMap (growing hierarchical map)
Fig. 1 GHSOM algorithm
Fig. 2 One alarm event recordof the log file generated byNIDS
[**] [1:1201:7] ATTACK-RESPONSES 403 Forbidden [**] [Classification:Attempted Information Leak] [Priority: 2] 11/20-14:05:02.375081189.195.45.196:80 -> 166.153.147.168:38225 TCP TTL:63 TOS:0x0ID:19781 IpLen:20 DgmLen:602 DF**AP*** Seq: 0x70C9F8FF Ack: 0x131A130 Win: 0x16D0 TcpLen: 20
expansion of units in the map, resulting in a map adaptingits architecture to represent the data. In other words, inputdata is mapped into maps having a suitable number of clus-ters for a better exploration of data. Maps returned consistof clusters having a very low number of false positives andfalse negatives in addition to little amount of empty clusters.α1 is the fraction used with the global termination criterion,where a more detailed data representation is needed if thiscriterion is not satisfied. That is, where dissimilar (normaland attack vectors) input data are mapped onto the same
cluster, more units or clusters are added to allow more mapspace for data representation. The problem that might ap-pear is that some attack vectors might be mapped to thesame cluster containing normal vectors with the fact thatthis cluster is labeled as normal. This leads to the problemof increasing false negatives.
The choice of α1 changes the architecture of the GHSOMprototype in a way that we cannot go back and undo changesat later stages. By setting α1 to a small value, small mapshaving many attack vectors hiding in normal clusters and

Cluster Comput
Table 1 Series of alarm events representation for Scenario 1
Scenario Measure(Alarm Type)
1 80.500(ATTACK-RESPONSES 403 Forbidden)
7.833(WEB-FRONTPAGE .... request)
5.333(WEB-IIS _mem_bin access)
4.667(WEB-IIS iissamples access)
4.500(WEB-IIS iisadmin access)
Table 2 Scenarios characteristics
Scenario Characteristic
Scenario 1 Brute Force Attack
Scenario 2 Tentative POP3 Authentication
Scenario 3 Brute Force on POP3
Scenario 4 403 Error
Scenario 5 Brute Force on FTP
Scenario 6 Web Crawler
Scenario 7 Brute Force on POP3
Scenario 8 Web Crawler
Scenario 9 Admin Brute Force
Scenario 10 SNMP attack
Scenario 11 Brute Force on FTP
Scenario 12 Web attack
Scenario 13 Web IIS attack
Scenario 14 Brute Force on POP3
Scenario 15 IIS attack on apache
Scenario 16 Mp3 file changed via FTP
Table 3 Typical record elements
Feature name (example) Description
[1:1201:7] Network Information
ATTACK-RESPONSES 403 Forbidden Alarm Type
Classification: Attempted Information Leak Alarm Classification
Priority:2 Alarm Priority
14:05:02 Time
189.195.45.196:80 IP External: Port
166.153.147.168:38225 IP Internal: Port
TCP Protocol
TTL:63 Telnet
. . . Network Information
many normal vectors hiding in attack clusters, with a deephierarchal architecture will be produced. But, large valueswill generate large maps having similar vectors clusteredinto more than one cluster and a large number of uselessempty clusters with a flat hierarchical architecture.
The second parameter of GHSOM that contributes to thedecision of hierarchically expanding resulting SOM mapsis α2. The hierarchical expansion uncovers hidden attackvectors and reduces the number of false positives. α2 con-trols the depth/shallowness of the resulting hierarchical GH-SOM. Although α1 controls the expansion of units in themap in order to reduce the number of false positives andfalse negatives, some normal clusters might still hide attackvectors and some attack clusters might hide normal vectors(increasing false positives). So α2 controls the further de-tailed clustering that might be needed for such conflictingclusters to uncover their hidden vectors. In general, α1, α2
values are chosen such that 1 > α1 α2 > 0.The orientation parameter affects the global topology of
the architecture. It determines how weight vectors of units inlower layers are computed based on the parent unit. That is,it tells which weight vectors of the units in the parent layercontribute to each of the weight vectors of the expanded unit(in the lower layer). Random initialization for model vectororientation would distort the global topology of neighboringmaps (i.e. difficulty in exploring data). Thus, the orientationshould indicate that the weight vectors representing the fourunits in a newly generated 2 by 2 SOM map move in dataspace towards the direction of the neighbors of the respec-tive parent unit by a certain fraction. For example, we ini-tialize the 4 weight vectors, w(t)ph, where h = k, . . . , k + 3(indices of 4 units in the child map) and p is the parent unitindex, with the average of the weight vectors of their parentunit and the two direct neighbors.
3.3 Steps 2 and 3: Initializing weight vectors for layer-0and training SOM
Randomly initialize weight vectors for layer-0 map withinthe range: 0–maximum number of alarms found in all datavectors. For lower sub-layers (than layer-0), weight vectorsof a unit in the SOM are initialized as follows: initial valuesare the average of their parent unit’s weight vector and theweight vectors of its neighboring units.
At layer-0, an input data vector x(t), where t is the se-quential training time, is randomly selected from the set{x1, . . . , xπ }. For lower layers, x(t) is randomly selectedfrom the set of data vectors allocated to the parent unit.
The degree of closeness of x(t) to the weight vectors ofall the units in the respective SOM is evaluated by comput-ing the Euclidean distances between them; the best match-ing weight vector defines the unit/cluster to which the alarmvector x(t) is likely to belong.
The next step is to update the weight vector of the bestmatching unit, c, using (2). The update depends on thecurrent weight, the coefficient δ(t), and the neighborhoodfunction Nc(x),i . A smooth neighborhood function is theGaussian
NC(x),i = exp(−‖wC − wi‖/2σ(t)2) (11)
Cluster Comput
where σ(t) is the width of the Gaussian kernel (i.e. neigh-borhood radius) and ‖wc − wi‖ is the distance between theBMU and the unit i. For fast convergence of the map, thelearning rate and neighborhood radius are selected as func-tions that decrease with time t . We use the learning ratefunction (δ(t)) proposed by Pampalk et al. [11]. That is,
δ(t) = a/(t + b) (12)
where a and b are constants given by:
b = (tmax − 1)/100 − 1; a = b · δ0(t);where tmax is the maximum number of iterations allowed inthe training process. δ0(t) is a constant initial value of δ(t)
set to 0.5, being the median between 0 and 1.The neighborhood radius function (σ (t)) we used varies
for maps at different levels of details (layers). We used thevalues proposed by Pampalk et al. [11]. In parent layer maps,function σ(t) is given by
σ(t) = −(1.4/tmax)t + 1.5 (13)
which is a linearly decreasing function that decreases withtime t and generates tmax linearly equally spaced points be-tween 1.5 and 0.1. In sublayer maps, σ(t) is given by
σ(t) = −(0.4/tmax)t + 0.5. (14)
In growing maps, σ(t) is given by
σ(t) = −(0.7/tmax)t + 0.8. (15)
The values used for a sub-layer map at t = 0, [0.5,0.1],are less than that for the parent layer, [1.5,0.1], since theparent layer map represents the complete data set whoseclustering requires a larger neighborhood radius interval.However each map in a sub-layer is concerned with a por-tion of the data at a certain level of detail and contains closerdata vectors since these data vectors are mapped to a singleunit in the parent layer. Thus the neighborhood radius inter-val has to be smaller than that of the parent layer for properclustering. As for the growing map, the interval used is a me-dian between parent and sub-layer intervals, since the grow-ing of a map is based on the existence of misclassification,therefore the neighborhood radius interval has to be largeenough to include missed cases.
This training process is repeated a number of iterationsfor data vectors, we assume that the number of iterations(tmax) is 20 for parent layer map, 15 for growing maps and35 for sub layer maps. An alternative stopping criterion canbe the convergence of the map. Training process will be ter-minated when the data vectors do not change their clustermembership by more than 0.001%. The result of this step isa clustering arrangement of data vectors.
3.4 Steps 4 and 5: Computing quantization error
The Quantization errors mqei (3) for each unit in the map arecomputed to describe how well a data vector is representedby its best matching. Then, the mean of all mqei ’s, MQEm
(4) is computed to describe how well all units together rep-resent the data.
3.5 Step 6: Growing SOM
Based on both computations of steps 4 and 5, we mea-sure the quality of data representation in the map m. IfMQEm ≥ α1 · mqeu, where u is the parent unit of map m,this means one or more units in the map wrongly containclassified data vectors, i.e. normal data vectors mapped toattack clusters (units) or attack data vectors mapped to nor-mal clusters. Hence, the decision to increase the map sizeis made. This growing process leads to a more detailed ex-ploration of data vectors mapped to the units being inter-leaved. The objective of this exploration is to allow furthersorting out/remapping of data vectors onto more units hop-ing to separate attack vectors from non attack vectors. Thuswe keep on increasing the size until all data vectors are rep-resented well in the map.
3.6 Step 7: Hierarchical expansion
The next decision to be made is whether some units needto be expanded into a new map on the next hierarchicallayer. If mqei < α2 · mqe0 is not satisfied, this means thatsame units might contain mixed data vectors that corre-spond to both attacks and non-attacks. Therefore, expan-sion is required for such units. This expansion allows fur-ther exploration for improperly mixed data vectors. Unitscontaining both attack and non attack vectors are remappedonto new maps at lower level to separate data vectors accu-rately.
3.7 Labeling clusters
Each of the map units present in the GHSOM architecturerepresents a cluster. We label clusters by attack, normal orempty as follows. In case all input data vectors projected toa cluster are normal ones then the cluster is labeled as nor-mal cluster, however, if all vectors projected to a cluster areattack vectors then consider the cluster as an attack one. Ifneither case is satisfied then we determine the average num-ber of attack vectors (ρ) in the data set which is equal to thenumber of all attack data vectors (Πa) divided by the totalnumber of input data vectors (Π ):
ρ = Πa/Π. (16)
Cluster Comput
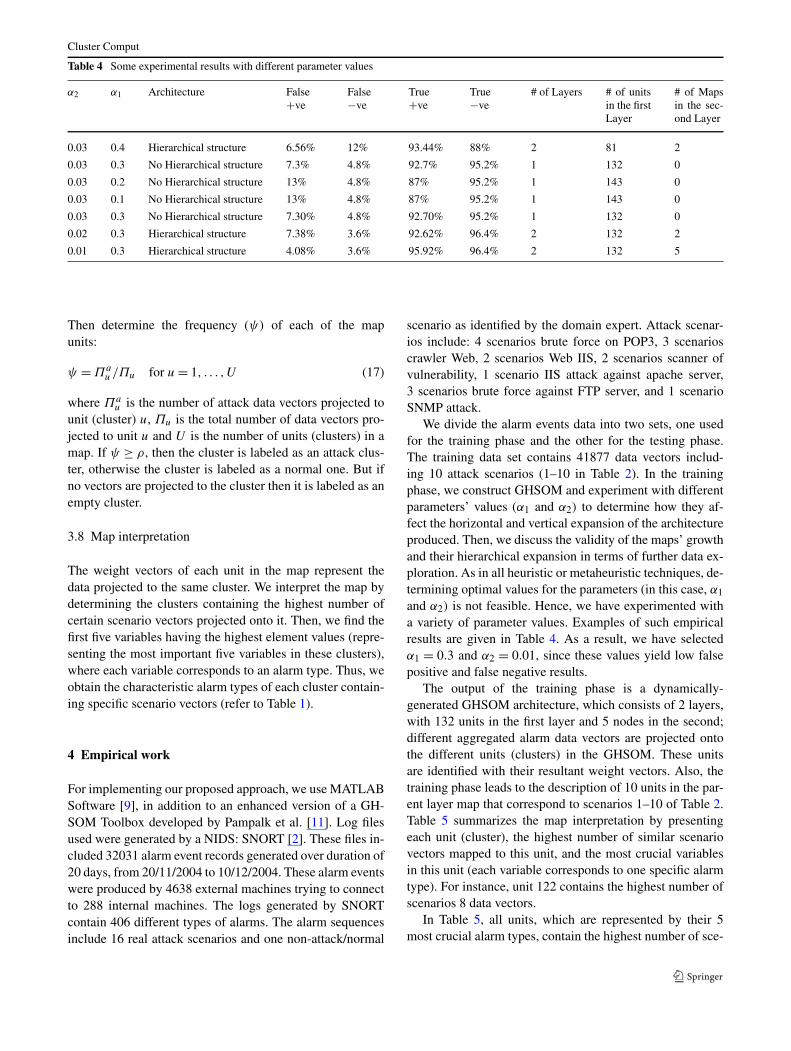
Table 4 Some experimental results with different parameter values
α2 α1 Architecture False+ve
False−ve
True+ve
True−ve
# of Layers # of unitsin the firstLayer
# of Mapsin the sec-ond Layer
0.03 0.4 Hierarchical structure 6.56% 12% 93.44% 88% 2 81 2
0.03 0.3 No Hierarchical structure 7.3% 4.8% 92.7% 95.2% 1 132 0
0.03 0.2 No Hierarchical structure 13% 4.8% 87% 95.2% 1 143 0
0.03 0.1 No Hierarchical structure 13% 4.8% 87% 95.2% 1 143 0
0.03 0.3 No Hierarchical structure 7.30% 4.8% 92.70% 95.2% 1 132 0
0.02 0.3 Hierarchical structure 7.38% 3.6% 92.62% 96.4% 2 132 2
0.01 0.3 Hierarchical structure 4.08% 3.6% 95.92% 96.4% 2 132 5
Then determine the frequency (ψ) of each of the mapunits:
ψ = Πau/Πu for u = 1, . . . ,U (17)
where Πau is the number of attack data vectors projected to
unit (cluster) u, Πu is the total number of data vectors pro-jected to unit u and U is the number of units (clusters) in amap. If ψ ≥ ρ, then the cluster is labeled as an attack clus-ter, otherwise the cluster is labeled as a normal one. But ifno vectors are projected to the cluster then it is labeled as anempty cluster.
3.8 Map interpretation
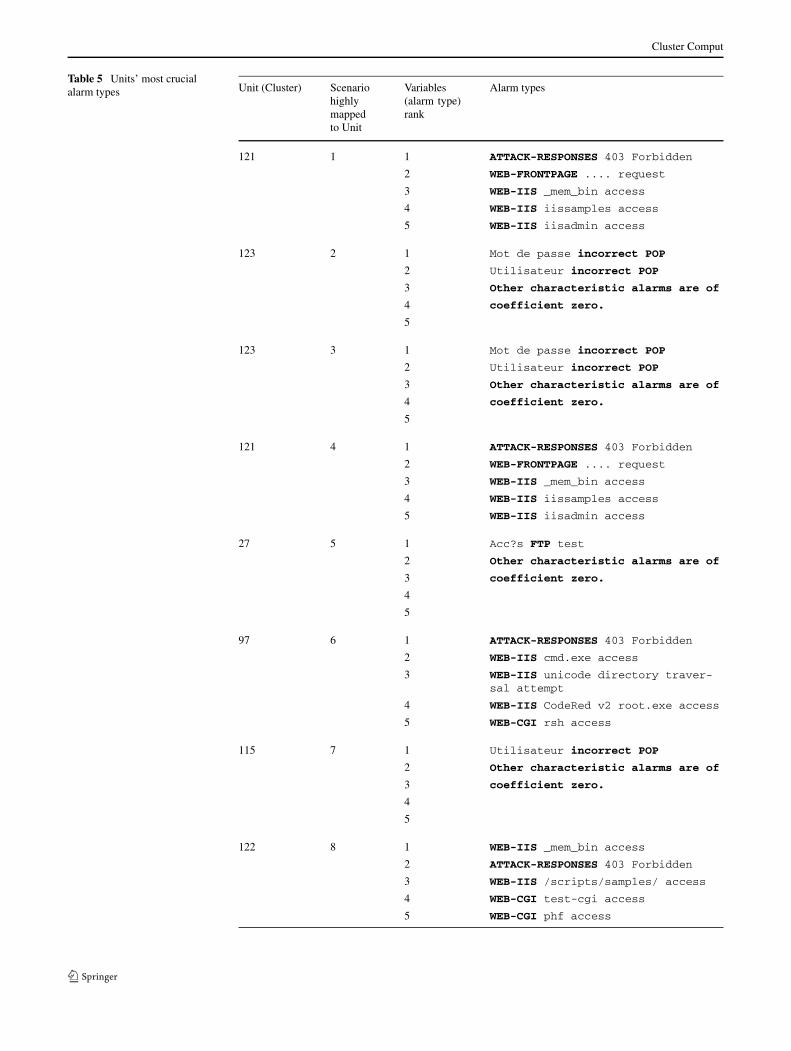
The weight vectors of each unit in the map represent thedata projected to the same cluster. We interpret the map bydetermining the clusters containing the highest number ofcertain scenario vectors projected onto it. Then, we find thefirst five variables having the highest element values (repre-senting the most important five variables in these clusters),where each variable corresponds to an alarm type. Thus, weobtain the characteristic alarm types of each cluster contain-ing specific scenario vectors (refer to Table 1).
4 Empirical work
For implementing our proposed approach, we use MATLABSoftware [9], in addition to an enhanced version of a GH-SOM Toolbox developed by Pampalk et al. [11]. Log filesused were generated by a NIDS: SNORT [2]. These files in-cluded 32031 alarm event records generated over duration of20 days, from 20/11/2004 to 10/12/2004. These alarm eventswere produced by 4638 external machines trying to connectto 288 internal machines. The logs generated by SNORTcontain 406 different types of alarms. The alarm sequencesinclude 16 real attack scenarios and one non-attack/normal
scenario as identified by the domain expert. Attack scenar-ios include: 4 scenarios brute force on POP3, 3 scenarioscrawler Web, 2 scenarios Web IIS, 2 scenarios scanner ofvulnerability, 1 scenario IIS attack against apache server,3 scenarios brute force against FTP server, and 1 scenarioSNMP attack.
We divide the alarm events data into two sets, one usedfor the training phase and the other for the testing phase.The training data set contains 41877 data vectors includ-ing 10 attack scenarios (1–10 in Table 2). In the trainingphase, we construct GHSOM and experiment with differentparameters’ values (α1 and α2) to determine how they af-fect the horizontal and vertical expansion of the architectureproduced. Then, we discuss the validity of the maps’ growthand their hierarchical expansion in terms of further data ex-ploration. As in all heuristic or metaheuristic techniques, de-termining optimal values for the parameters (in this case, α1
and α2) is not feasible. Hence, we have experimented witha variety of parameter values. Examples of such empiricalresults are given in Table 4. As a result, we have selectedα1 = 0.3 and α2 = 0.01, since these values yield low falsepositive and false negative results.
The output of the training phase is a dynamically-generated GHSOM architecture, which consists of 2 layers,with 132 units in the first layer and 5 nodes in the second;different aggregated alarm data vectors are projected ontothe different units (clusters) in the GHSOM. These unitsare identified with their resultant weight vectors. Also, thetraining phase leads to the description of 10 units in the par-ent layer map that correspond to scenarios 1–10 of Table 2.Table 5 summarizes the map interpretation by presentingeach unit (cluster), the highest number of similar scenariovectors mapped to this unit, and the most crucial variablesin this unit (each variable corresponds to one specific alarmtype). For instance, unit 122 contains the highest number ofscenarios 8 data vectors.
In Table 5, all units, which are represented by their 5most crucial alarm types, contain the highest number of sce-
Cluster Comput
Table 5 Units’ most crucialalarm types Unit (Cluster) Scenario
highlymappedto Unit
Variables(alarm type)rank
Alarm types
121 1 1 ATTACK-RESPONSES 403 Forbidden
2 WEB-FRONTPAGE .... request
3 WEB-IIS _mem_bin access
4 WEB-IIS iissamples access
5 WEB-IIS iisadmin access
123 2 1 Mot de passe incorrect POP
2 Utilisateur incorrect POP
3 Other characteristic alarms are of
4 coefficient zero.
5
123 3 1 Mot de passe incorrect POP
2 Utilisateur incorrect POP
3 Other characteristic alarms are of
4 coefficient zero.
5
121 4 1 ATTACK-RESPONSES 403 Forbidden
2 WEB-FRONTPAGE .... request
3 WEB-IIS _mem_bin access
4 WEB-IIS iissamples access
5 WEB-IIS iisadmin access
27 5 1 Acc?s FTP test
2 Other characteristic alarms are of
3 coefficient zero.
4
5
97 6 1 ATTACK-RESPONSES 403 Forbidden
2 WEB-IIS cmd.exe access
3 WEB-IIS unicode directory traver-sal attempt
4 WEB-IIS CodeRed v2 root.exe access
5 WEB-CGI rsh access
115 7 1 Utilisateur incorrect POP
2 Other characteristic alarms are of
3 coefficient zero.
4
5
122 8 1 WEB-IIS _mem_bin access
2 ATTACK-RESPONSES 403 Forbidden
3 WEB-IIS /scripts/samples/ access
4 WEB-CGI test-cgi access
5 WEB-CGI phf access

Cluster Comput
Table 5 (Continued)Unit (Cluster) Scenario
highlymappedto Unit
Variables(alarm type)rank
Alarm types
28 9 1 Acc?s FTP admin
2 Other characteristic alarms are of
3 coefficient zero.
4
5
130 10 1 SCAN Proxy Port 8080 attempt
2 SCAN SOCKS Proxy attempt
3 SNMP request tcp
4 SNMP AgentX/tcp request
5 SNMP trap tcp
Table 6 Comparison between GHSOM and SOM
Algorithm False+ve
False−ve
True+ve
True−ve
GHSOM 4.7% 4% 95.3% 96%
SOM 15% 16% 85% 84%
nario vectors from 1 to 10; according to the classificationrule described in Sect. 3.7, these units are also labeled as at-tack clusters. This also verifies the quality of mapping toand labeling of clusters. Moreover, the weight vectors ofthe units contain at least one of the scenarios mapped tothem (for instance, scenario 9 which is an “admin bruteforce” attack is mainly mapped to unit 28 whose weightvector reveals a representation of alarm type ‘Acc?s FTPadmin’).
The testing data set contains 18491 data vectors includ-ing 6 attack scenarios, 11–16 (refer to Table 2). In the test-ing phase, we show the results of GHSOM on these datavectors. Also, we validate the parameters’ values selected intraining phase and discuss results. Clusters are labeled andinterpreted as explained in Sects. 3.7 and 3.8.
Table 6 shows the results of our proposed GHSOM onthe testing data and how it compares with SOM [2]. Theseresults show an adequate sub-optimal mapping of input datavectors to the GHSOM architecture. Also, GHSOM outper-forms SOM on both results, false positives and false nega-tives. GHSOM showed a reduction in false positives to 4.7%and of false negatives to 4%.
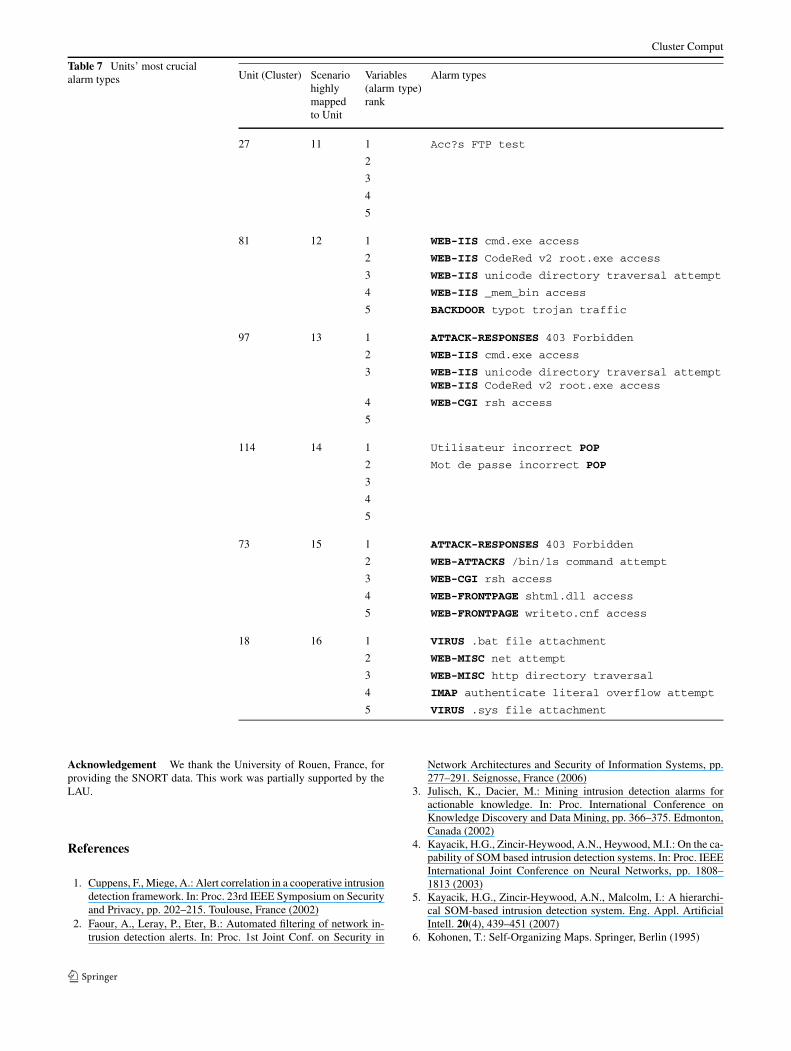
The testing results involve the description of 6 units inthe parent layer map. Table 7 summarizes the map interpre-tation; it includes unit (cluster), the highest number of simi-lar scenario vectors mapped to this unit and the most crucial
variables in this unit, as each variable corresponds to onespecific alarm type. For instance, unit 27 contains the high-est number of scenario 11 data vectors.
All the units (clusters) containing mainly scenario vec-tors from 11 to 16 are labeled as attack clusters. This verifiesthe quality of projection of data vectors onto and labeling ofclusters. Moreover the weight vectors of the units containat least one of the scenarios representation mapped to them;for instance, scenario 14 which is a “brute force on POP3”attack is mainly mapped to unit 114 whose weight vec-tor reveals a representation of alarm type ‘Utilisateurincorrect POP’ and ‘Mot de passe incorrectPOP’.
5 Conclusions
We have introduced a new decision support layer for net-work administrators to analyze and sort out alarms gener-ated by a network intrusion detection system. The layer in-troduced is a data mining layer to uncover patterns of trueattacks in the data. This data mining technique is based onapplying a growing hierarchical self-organizing map (GH-SOM) neural network model that determines the numberand arrangement of map units during unsupervised trainingprocess. GHSOM addresses limitations of the SOM and re-lieves the network administration from having to manipulatedetection rules in order to better detect attacks and reducefalse alarms.
We have empirically shown that GHSOM has the poten-tial to perform better than the rigid-structure SOM. GHSOMreduces false positives from 15% to 4.7% and false negativesfrom 16% to 4% for the real-world data used.
Cluster Comput
Table 7 Units’ most crucialalarm types Unit (Cluster) Scenario
highlymappedto Unit
Variables(alarm type)rank
Alarm types
27 11 1 Acc?s FTP test
2
3
4
5
81 12 1 WEB-IIS cmd.exe access
2 WEB-IIS CodeRed v2 root.exe access
3 WEB-IIS unicode directory traversal attempt
4 WEB-IIS _mem_bin access
5 BACKDOOR typot trojan traffic
97 13 1 ATTACK-RESPONSES 403 Forbidden
2 WEB-IIS cmd.exe access
3 WEB-IIS unicode directory traversal attemptWEB-IIS CodeRed v2 root.exe access
4 WEB-CGI rsh access
5
114 14 1 Utilisateur incorrect POP
2 Mot de passe incorrect POP
3
4
5
73 15 1 ATTACK-RESPONSES 403 Forbidden
2 WEB-ATTACKS /bin/ls command attempt
3 WEB-CGI rsh access
4 WEB-FRONTPAGE shtml.dll access
5 WEB-FRONTPAGE writeto.cnf access
18 16 1 VIRUS .bat file attachment
2 WEB-MISC net attempt
3 WEB-MISC http directory traversal
4 IMAP authenticate literal overflow attempt
5 VIRUS .sys file attachment
Acknowledgement We thank the University of Rouen, France, forproviding the SNORT data. This work was partially supported by theLAU.
References
1. Cuppens, F., Miege, A.: Alert correlation in a cooperative intrusiondetection framework. In: Proc. 23rd IEEE Symposium on Securityand Privacy, pp. 202–215. Toulouse, France (2002)
2. Faour, A., Leray, P., Eter, B.: Automated filtering of network in-trusion detection alerts. In: Proc. 1st Joint Conf. on Security in
Network Architectures and Security of Information Systems, pp.277–291. Seignosse, France (2006)
3. Julisch, K., Dacier, M.: Mining intrusion detection alarms foractionable knowledge. In: Proc. International Conference onKnowledge Discovery and Data Mining, pp. 366–375. Edmonton,Canada (2002)
4. Kayacik, H.G., Zincir-Heywood, A.N., Heywood, M.I.: On the ca-pability of SOM based intrusion detection systems. In: Proc. IEEEInternational Joint Conference on Neural Networks, pp. 1808–1813 (2003)
5. Kayacik, H.G., Zincir-Heywood, A.N., Malcolm, I.: A hierarchi-cal SOM-based intrusion detection system. Eng. Appl. ArtificialIntell. 20(4), 439–451 (2007)
6. Kohonen, T.: Self-Organizing Maps. Springer, Berlin (1995)

Cluster Comput
7. Kruegel, C., Robertson, W., Vigna, G.: Using alert verification toidentify successful intrusion attempts. Pract. Inf. Process. Com-mun. 27(4), 220–228 (2004)
8. Lichodzijewski, P., Zincir-Heywood, A.N., Heywood, M.I.: Host-based intrusion detection using self-organizing maps. In: Proc.IEEE International Joint Conference on Neural Networks, pp.1714–1719. Honolulu (2002)
9. MatLab Software: The Language of technical computing. Version6.0.0.88
10. Ning, P., Xu, D.: Learning attack strategies from intrusion alerts.In: Proc. 10th ACM Conf. on Computer and Communications Se-curity, pp. 200–209. Washington D.C. (2003)
11. Pampalk, E., Widmer, G., Chan, A.: A new approach to hierarchi-cal clustering and structuring of data with self-organizing maps.Intell. Data Analysis J. 8(2), 131–149 (2003)
12. Rachman, O.: Baseline analysis of security data. Securimine Soft-ware Inc. (2005). www.securimine.com
13. Rauber, A., Merkl, D., Dittenbach, M.: The growing hierarchi-cal self-organizing map: exploratory analysis of high-dimensionaldata. IEEE Trans. Neural Netw. 13(6), 1331–1341 (2002)
14. Xiao, Y., Han, C.: Correlating intrusion alerts into attack scenariosbased on improved evolving self-organizing maps. Int. J. Comput.Sci. Netw. Secur. 6(6), 199–203 (2006)
15. Zanero, S.: Improving self-organizing map performance for net-work intrusion detection. In: International Workshop on Cluster-ing High-Dimensional Data and its Applications. SIAM Confer-ence on Data Mining (2005)
Nashat Mansour is a Professor ofComputer Science at the LebaneseAmerican University. He receivedB.E. and M.Eng.Sc. degrees in Elec-trical Engineering from the Univer-sity of New South Wales, and M.S.in Computer Engineering and Ph.D.in Computer Science from SyracuseUniversity. His research interests in-clude application of data mining andmeta-heuristic algorithms to real-world problems, software testing,and protein structure prediction.
Maya I. Chehab is a Ph.D. Stu-dent in London South Bank Univer-sity. She received a B.S. in Com-puter Science from the LebaneseUniversity and M.S. in ComputerScience from the Lebanese Amer-ican University. Her research inter-ests include identity management,approaches to system modeling andformal specifications, threat model-ing, trust and risk management.
Ahmad Faour is an Associate Pro-fessor of Computer Sciences at theLebanese University. He receivedB.S. degree in Computer Sciencefrom the Lebanese University, andM.S. in Computer Science and Ph.D.in Computer Science from INSA,University of Rouen. His researchinterests include application of datamining and pattern recognition forthe problems of filtering of alarmsgenerated by Intrusion detectionsystems.
Related Documents